Duncansville borough, PA
Duncansville borough Overview
1,164
TOTAL POPULATION
511
MALE POPULATION
653
FEMALE POPULATION
78.25
MALES / 100 FEMALES
127.79
FEMALES / 100 MALES
45.3
MEDIAN AGE
2.9
AVG FAMILY SIZE
2.2
AVG HOUSEHOLD SIZE
$35,909
PER CAPITA INCOME
$79,583
AVG FAMILY INCOME
$60,972
AVG HOUSEHOLD INCOME
39.0%
WAGE / INCOME GAP [ % ]
61.0¢/ $1
WAGE / INCOME GAP [ $ ]
0.43
INEQUALITY / GINI INDEX
635
LABOR FORCE [ PEOPLE ]
64.0%
PERCENT IN LABOR FORCE
9.8%
UNEMPLOYMENT RATE
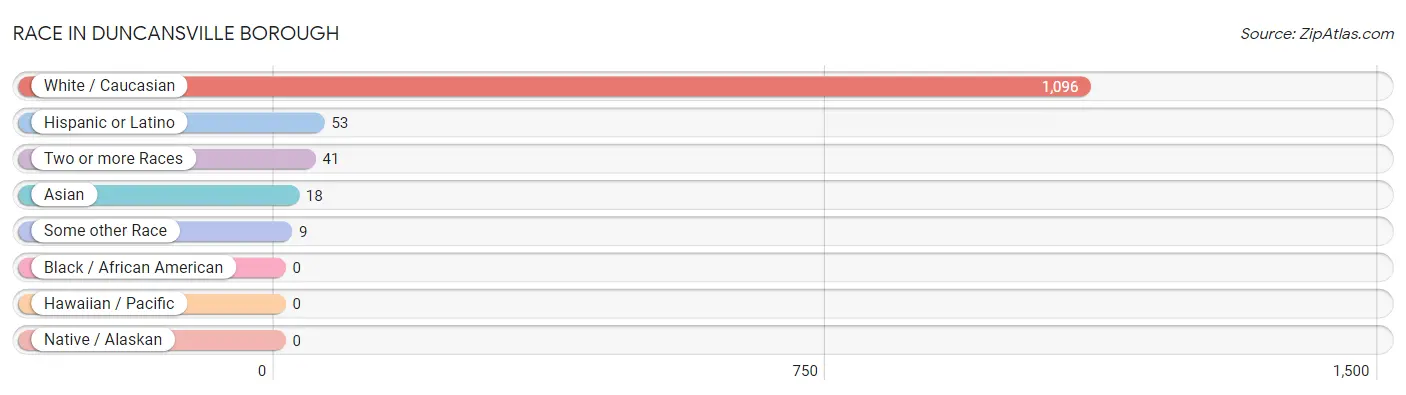
Race in Duncansville borough
The most populous races in Duncansville borough are White / Caucasian (1,096 | 94.2%), Hispanic or Latino (53 | 4.5%), and Two or more Races (41 | 3.5%).
| Race | # Population | % Population |
| Asian | 18 | 1.5% |
| Black / African American | 0 | 0.0% |
| Hawaiian / Pacific | 0 | 0.0% |
| Hispanic or Latino | 53 | 4.5% |
| Native / Alaskan | 0 | 0.0% |
| White / Caucasian | 1,096 | 94.2% |
| Two or more Races | 41 | 3.5% |
| Some other Race | 9 | 0.8% |
| Total | 1,164 | 100.0% |
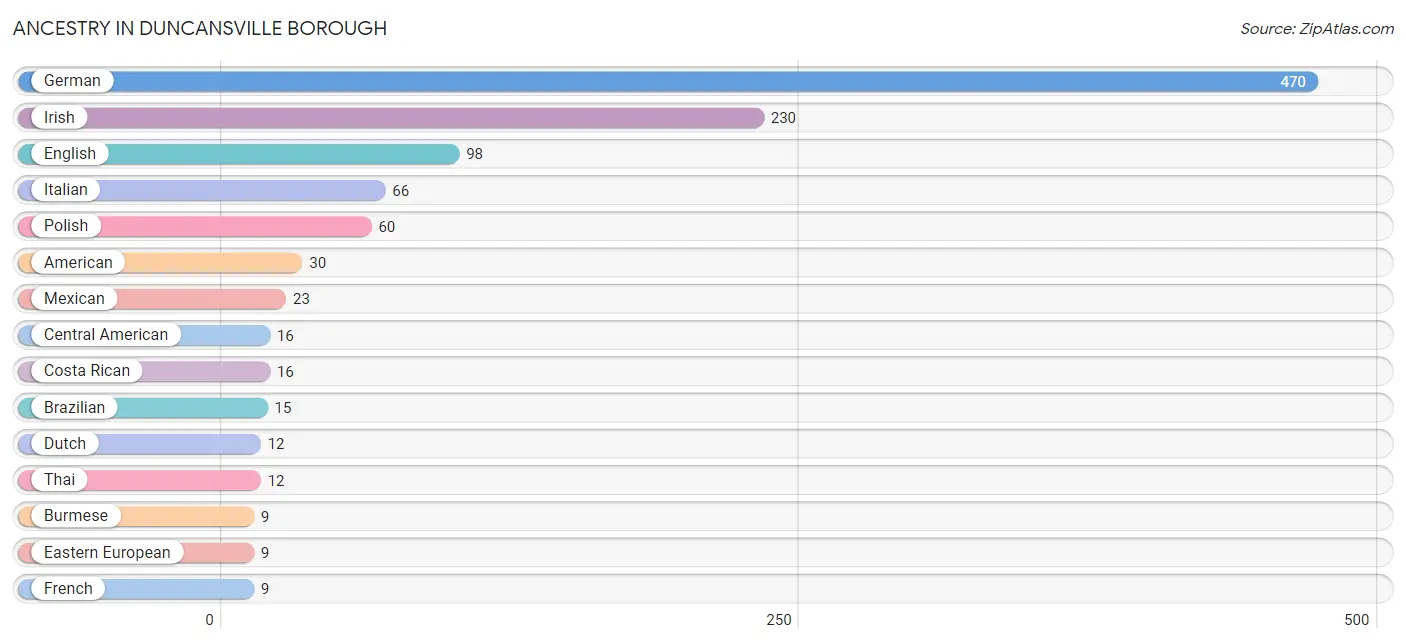
Ancestry in Duncansville borough
The most populous ancestries reported in Duncansville borough are German (470 | 40.4%), Irish (230 | 19.8%), English (98 | 8.4%), Italian (66 | 5.7%), and Polish (60 | 5.1%), together accounting for 79.4% of all Duncansville borough residents.
| Ancestry | # Population | % Population |
| American | 30 | 2.6% |
| Apache | 2 | 0.2% |
| Arab | 4 | 0.3% |
| Brazilian | 15 | 1.3% |
| British | 4 | 0.3% |
| Burmese | 9 | 0.8% |
| Central American | 16 | 1.4% |
| Colombian | 6 | 0.5% |
| Costa Rican | 16 | 1.4% |
| Cuban | 2 | 0.2% |
| Czechoslovakian | 7 | 0.6% |
| Danish | 2 | 0.2% |
| Dutch | 12 | 1.0% |
| Eastern European | 9 | 0.8% |
| English | 98 | 8.4% |
| European | 3 | 0.3% |
| French | 9 | 0.8% |
| German | 470 | 40.4% |
| Greek | 6 | 0.5% |
| Irish | 230 | 19.8% |
| Italian | 66 | 5.7% |
| Mexican | 23 | 2.0% |
| Pennsylvania German | 6 | 0.5% |
| Polish | 60 | 5.1% |
| Portuguese | 4 | 0.3% |
| Puerto Rican | 6 | 0.5% |
| Russian | 4 | 0.3% |
| Scandinavian | 5 | 0.4% |
| Scotch-Irish | 7 | 0.6% |
| Slovak | 4 | 0.3% |
| Slovene | 2 | 0.2% |
| South American | 6 | 0.5% |
| Swedish | 6 | 0.5% |
| Thai | 12 | 1.0% |
| Ukrainian | 4 | 0.3% | View All 35 Rows |
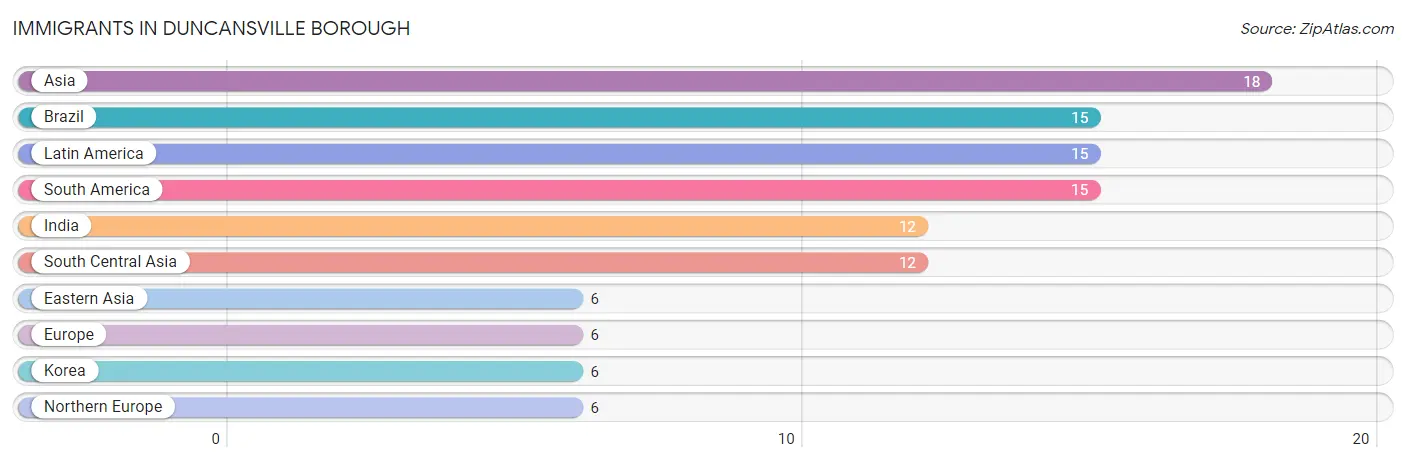
Immigrants in Duncansville borough
The most numerous immigrant groups reported in Duncansville borough came from Asia (18 | 1.5%), Brazil (15 | 1.3%), Latin America (15 | 1.3%), South America (15 | 1.3%), and India (12 | 1.0%), together accounting for 6.5% of all Duncansville borough residents.
| Immigration Origin | # Population | % Population |
| Asia | 18 | 1.5% |
| Brazil | 15 | 1.3% |
| Eastern Asia | 6 | 0.5% |
| Europe | 6 | 0.5% |
| India | 12 | 1.0% |
| Korea | 6 | 0.5% |
| Latin America | 15 | 1.3% |
| Northern Europe | 6 | 0.5% |
| South America | 15 | 1.3% |
| South Central Asia | 12 | 1.0% | View All 10 Rows |
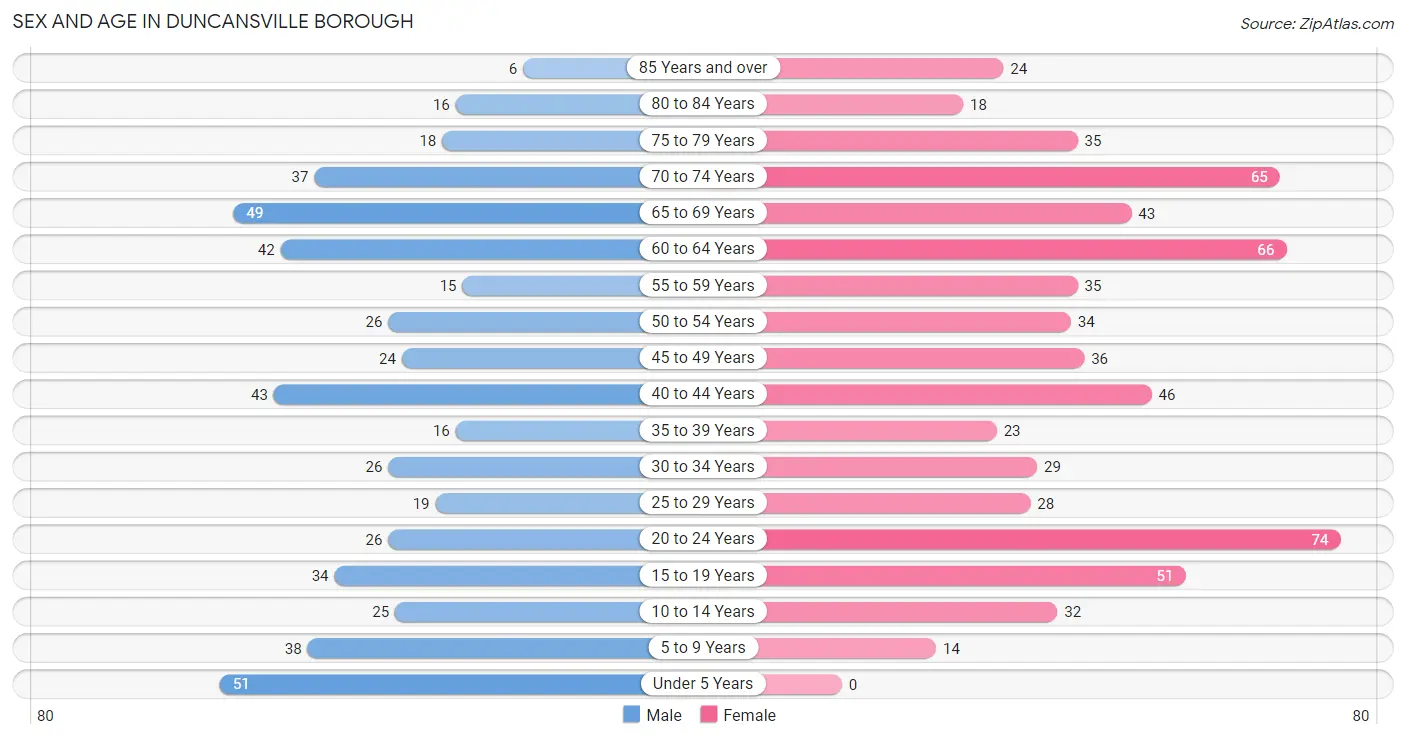
Sex and Age in Duncansville borough
Sex and Age in Duncansville borough
The most populous age groups in Duncansville borough are Under 5 Years (51 | 10.0%) for men and 20 to 24 Years (74 | 11.3%) for women.
| Age Bracket | Male | Female |
| Under 5 Years | 51 (10.0%) | 0 (0.0%) |
| 5 to 9 Years | 38 (7.4%) | 14 (2.1%) |
| 10 to 14 Years | 25 (4.9%) | 32 (4.9%) |
| 15 to 19 Years | 34 (6.7%) | 51 (7.8%) |
| 20 to 24 Years | 26 (5.1%) | 74 (11.3%) |
| 25 to 29 Years | 19 (3.7%) | 28 (4.3%) |
| 30 to 34 Years | 26 (5.1%) | 29 (4.4%) |
| 35 to 39 Years | 16 (3.1%) | 23 (3.5%) |
| 40 to 44 Years | 43 (8.4%) | 46 (7.0%) |
| 45 to 49 Years | 24 (4.7%) | 36 (5.5%) |
| 50 to 54 Years | 26 (5.1%) | 34 (5.2%) |
| 55 to 59 Years | 15 (2.9%) | 35 (5.4%) |
| 60 to 64 Years | 42 (8.2%) | 66 (10.1%) |
| 65 to 69 Years | 49 (9.6%) | 43 (6.6%) |
| 70 to 74 Years | 37 (7.2%) | 65 (10.0%) |
| 75 to 79 Years | 18 (3.5%) | 35 (5.4%) |
| 80 to 84 Years | 16 (3.1%) | 18 (2.8%) |
| 85 Years and over | 6 (1.2%) | 24 (3.7%) |
| Total | 511 (100.0%) | 653 (100.0%) |
Families and Households in Duncansville borough
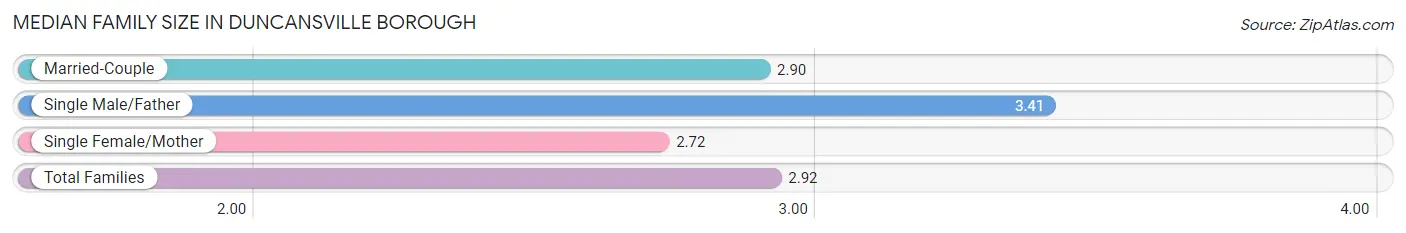
Median Family Size in Duncansville borough
The median family size in Duncansville borough is 2.92 persons per family, with single male/father families (39 | 13.0%) accounting for the largest median family size of 3.41 persons per family. On the other hand, single female/mother families (75 | 25.1%) represent the smallest median family size with 2.72 persons per family.
| Family Type | # Families | Family Size |
| Married-Couple | 185 (61.9%) | 2.90 |
| Single Male/Father | 39 (13.0%) | 3.41 |
| Single Female/Mother | 75 (25.1%) | 2.72 |
| Total Families | 299 (100.0%) | 2.92 |
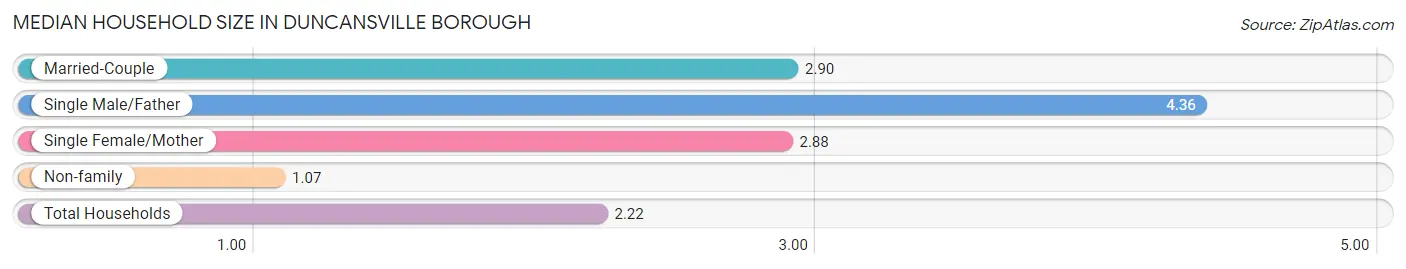
Median Household Size in Duncansville borough
The median household size in Duncansville borough is 2.22 persons per household, with single male/father households (39 | 7.4%) accounting for the largest median household size of 4.36 persons per household. non-family households (226 | 43.0%) represent the smallest median household size with 1.07 persons per household.
| Household Type | # Households | Household Size |
| Married-Couple | 185 (35.2%) | 2.90 |
| Single Male/Father | 39 (7.4%) | 4.36 |
| Single Female/Mother | 75 (14.3%) | 2.88 |
| Non-family | 226 (43.0%) | 1.07 |
| Total Households | 525 (100.0%) | 2.22 |
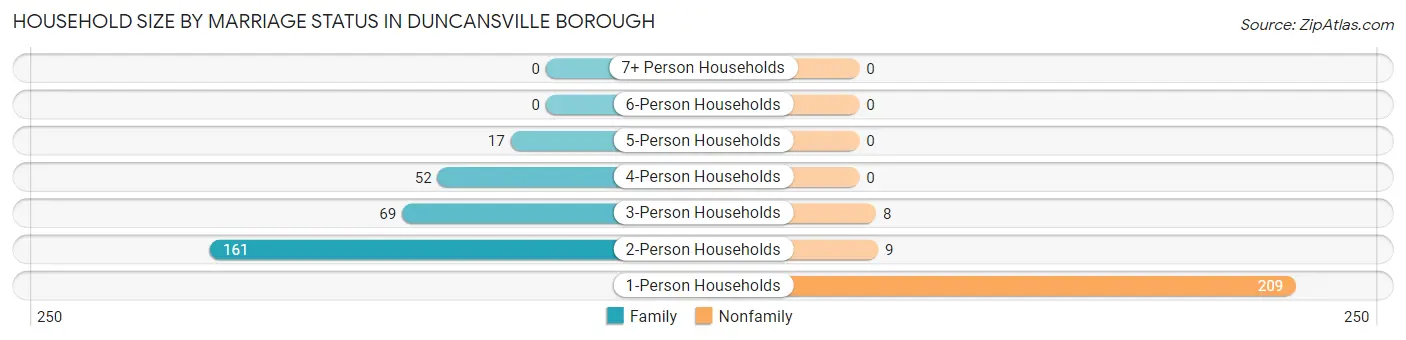
Household Size by Marriage Status in Duncansville borough
Out of a total of 525 households in Duncansville borough, 299 (57.0%) are family households, while 226 (43.0%) are nonfamily households. The most numerous type of family households are 2-person households, comprising 161, and the most common type of nonfamily households are 1-person households, comprising 209.
| Household Size | Family Households | Nonfamily Households |
| 1-Person Households | - | 209 (39.8%) |
| 2-Person Households | 161 (30.7%) | 9 (1.7%) |
| 3-Person Households | 69 (13.1%) | 8 (1.5%) |
| 4-Person Households | 52 (9.9%) | 0 (0.0%) |
| 5-Person Households | 17 (3.2%) | 0 (0.0%) |
| 6-Person Households | 0 (0.0%) | 0 (0.0%) |
| 7+ Person Households | 0 (0.0%) | 0 (0.0%) |
| Total | 299 (57.0%) | 226 (43.0%) |
Female Fertility in Duncansville borough
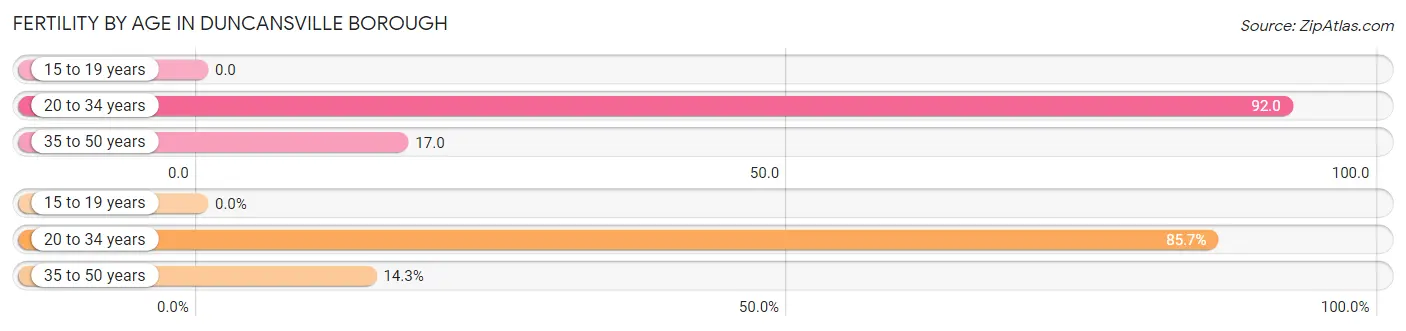
Fertility by Age in Duncansville borough
Average fertility rate in Duncansville borough is 46.0 births per 1,000 women. Women in the age bracket of 20 to 34 years have the highest fertility rate with 92.0 births per 1,000 women. Women in the age bracket of 20 to 34 years acount for 85.7% of all women with births.
| Age Bracket | Women with Births | Births / 1,000 Women |
| 15 to 19 years | 0 (0.0%) | 0.0 |
| 20 to 34 years | 12 (85.7%) | 92.0 |
| 35 to 50 years | 2 (14.3%) | 17.0 |
| Total | 14 (100.0%) | 46.0 |
Fertility by Age by Marriage Status in Duncansville borough
14.3% of women with births (14) in Duncansville borough are married. The highest percentage of unmarried women with births falls into 20 to 34 years age bracket with 100.0% of them unmarried at the time of birth, while the lowest percentage of unmarried women with births belong to 35 to 50 years age bracket with 0.0% of them unmarried.
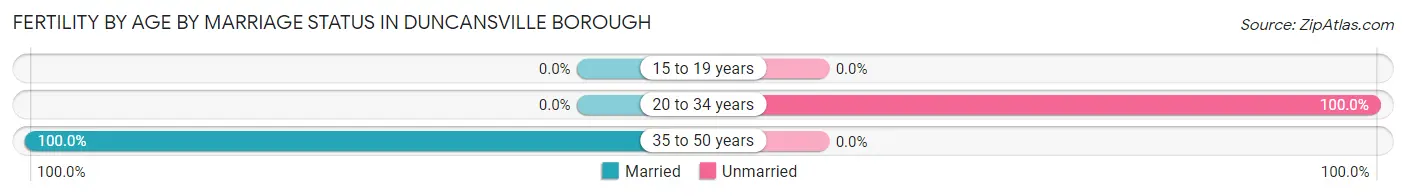
| Age Bracket | Married | Unmarried |
| 15 to 19 years | 0 (0.0%) | 0 (0.0%) |
| 20 to 34 years | 0 (0.0%) | 12 (100.0%) |
| 35 to 50 years | 2 (100.0%) | 0 (0.0%) |
| Total | 2 (14.3%) | 12 (85.7%) |
Fertility by Education in Duncansville borough
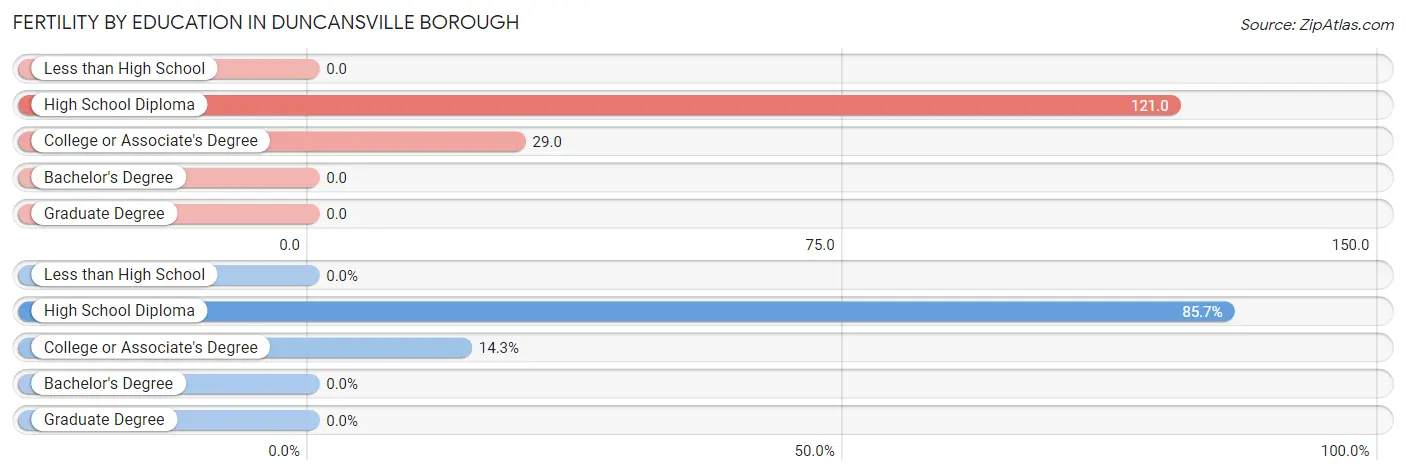
| Educational Attainment | Women with Births | Births / 1,000 Women |
| Less than High School | 0 (0.0%) | 0.0 |
| High School Diploma | 12 (85.7%) | 121.0 |
| College or Associate's Degree | 2 (14.3%) | 29.0 |
| Bachelor's Degree | 0 (0.0%) | 0.0 |
| Graduate Degree | 0 (0.0%) | 0.0 |
| Total | 14 (100.0%) | 46.0 |
Fertility by Education by Marriage Status in Duncansville borough
85.7% of women with births in Duncansville borough are unmarried. Women with the educational attainment of college or associate's degree are most likely to be married with 100.0% of them married at childbirth, while women with the educational attainment of high school diploma are least likely to be married with 100.0% of them unmarried at childbirth.
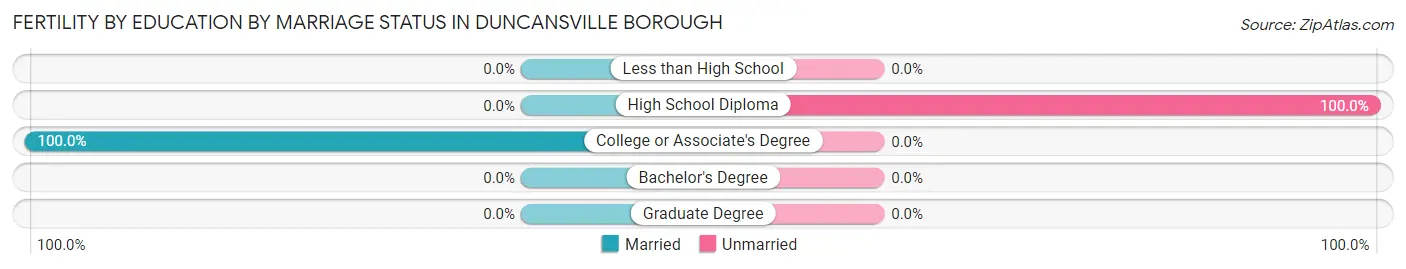
| Educational Attainment | Married | Unmarried |
| Less than High School | 0 (0.0%) | 0 (0.0%) |
| High School Diploma | 0 (0.0%) | 12 (100.0%) |
| College or Associate's Degree | 2 (100.0%) | 0 (0.0%) |
| Bachelor's Degree | 0 (0.0%) | 0 (0.0%) |
| Graduate Degree | 0 (0.0%) | 0 (0.0%) |
| Total | 2 (14.3%) | 12 (85.7%) |
Income in Duncansville borough
Income Overview in Duncansville borough
Per Capita Income in Duncansville borough is $35,909, while median incomes of families and households are $79,583 and $60,972 respectively.
| Characteristic | Number | Measure |
| Per Capita Income | 1,164 | $35,909 |
| Median Family Income | 299 | $79,583 |
| Mean Family Income | 299 | $93,366 |
| Median Household Income | 525 | $60,972 |
| Mean Household Income | 525 | $76,183 |
| Income Deficit | 299 | $0 |
| Wage / Income Gap (%) | 1,164 | 39.00% |
| Wage / Income Gap ($) | 1,164 | 61.00¢ per $1 |
| Gini / Inequality Index | 1,164 | 0.43 |
Earnings by Sex in Duncansville borough
Average Earnings in Duncansville borough are $39,015, $52,647 for men and $32,115 for women, a difference of 39.0%.
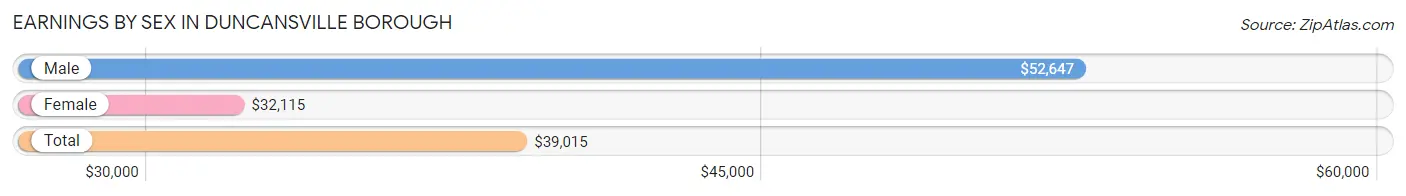
| Sex | Number | Average Earnings |
| Male | 284 (46.3%) | $52,647 |
| Female | 330 (53.7%) | $32,115 |
| Total | 614 (100.0%) | $39,015 |
Earnings by Sex by Income Bracket in Duncansville borough
The most common earnings brackets in Duncansville borough are $100,000+ for men (42 | 14.8%) and $30,000 to $34,999 for women (31 | 9.4%).
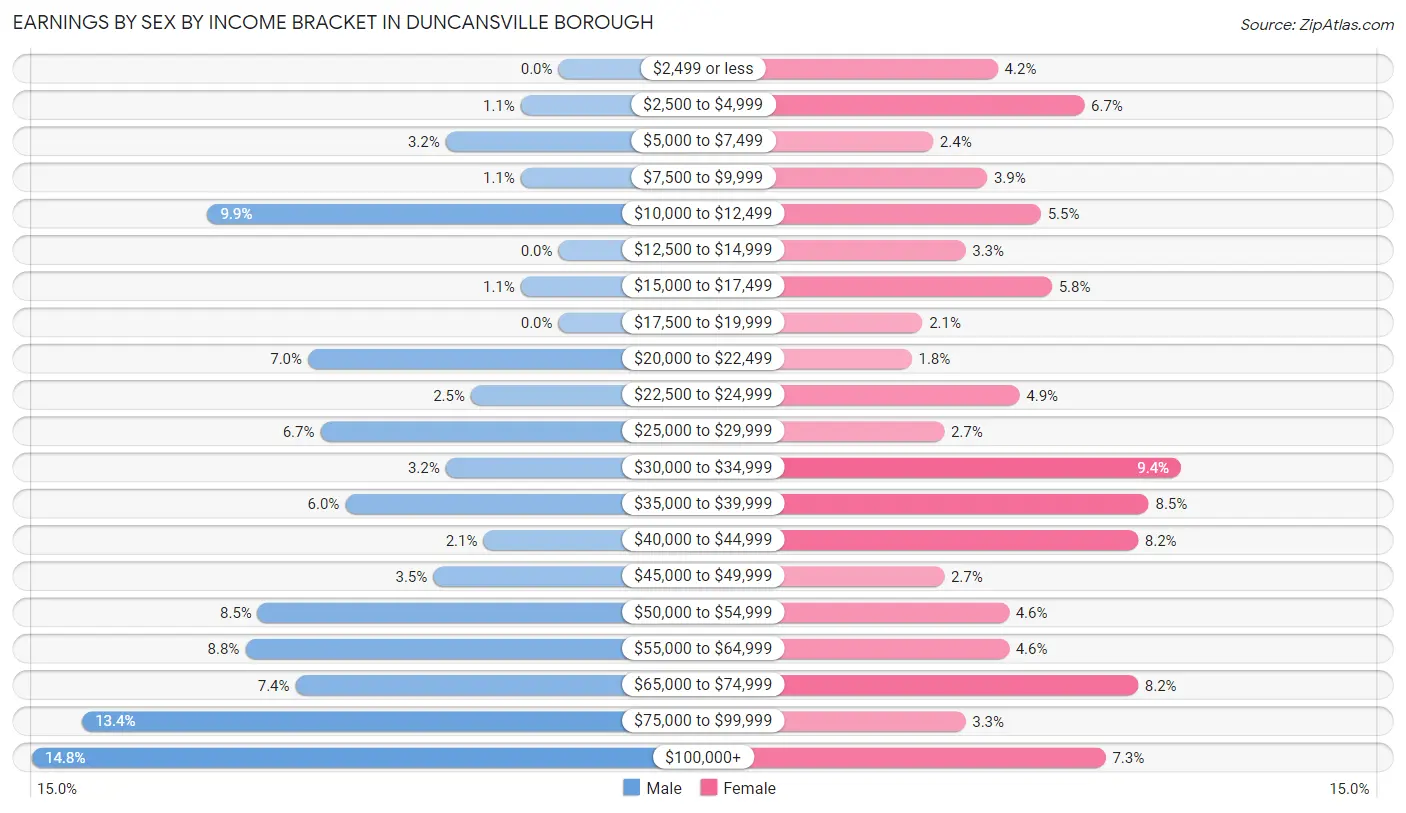
| Income | Male | Female |
| $2,499 or less | 0 (0.0%) | 14 (4.2%) |
| $2,500 to $4,999 | 3 (1.1%) | 22 (6.7%) |
| $5,000 to $7,499 | 9 (3.2%) | 8 (2.4%) |
| $7,500 to $9,999 | 3 (1.1%) | 13 (3.9%) |
| $10,000 to $12,499 | 28 (9.9%) | 18 (5.4%) |
| $12,500 to $14,999 | 0 (0.0%) | 11 (3.3%) |
| $15,000 to $17,499 | 3 (1.1%) | 19 (5.8%) |
| $17,500 to $19,999 | 0 (0.0%) | 7 (2.1%) |
| $20,000 to $22,499 | 20 (7.0%) | 6 (1.8%) |
| $22,500 to $24,999 | 7 (2.5%) | 16 (4.9%) |
| $25,000 to $29,999 | 19 (6.7%) | 9 (2.7%) |
| $30,000 to $34,999 | 9 (3.2%) | 31 (9.4%) |
| $35,000 to $39,999 | 17 (6.0%) | 28 (8.5%) |
| $40,000 to $44,999 | 6 (2.1%) | 27 (8.2%) |
| $45,000 to $49,999 | 10 (3.5%) | 9 (2.7%) |
| $50,000 to $54,999 | 24 (8.5%) | 15 (4.5%) |
| $55,000 to $64,999 | 25 (8.8%) | 15 (4.5%) |
| $65,000 to $74,999 | 21 (7.4%) | 27 (8.2%) |
| $75,000 to $99,999 | 38 (13.4%) | 11 (3.3%) |
| $100,000+ | 42 (14.8%) | 24 (7.3%) |
| Total | 284 (100.0%) | 330 (100.0%) |
Earnings by Sex by Educational Attainment in Duncansville borough
Average earnings in Duncansville borough are $55,000 for men and $37,500 for women, a difference of 31.8%. Men with an educational attainment of graduate degree enjoy the highest average annual earnings of $129,688, while those with college or associate's degree education earn the least with $44,000. Women with an educational attainment of graduate degree earn the most with the average annual earnings of $77,500, while those with less than high school education have the smallest earnings of $21,250.
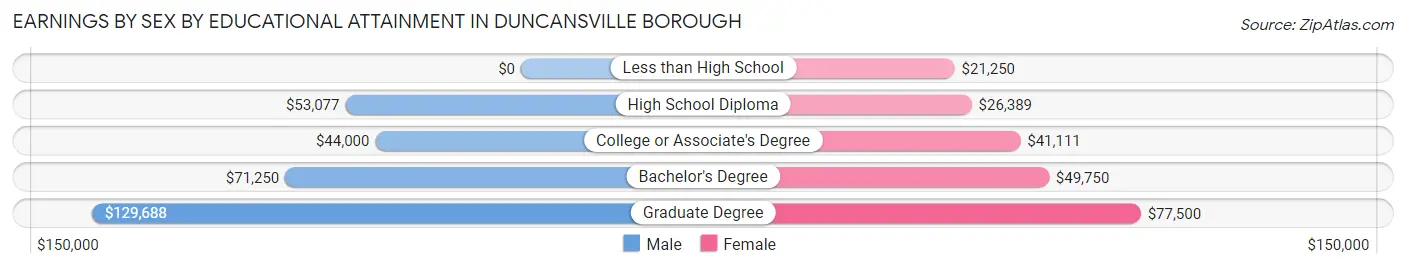
| Educational Attainment | Male Income | Female Income |
| Less than High School | - | - |
| High School Diploma | $53,077 | $26,389 |
| College or Associate's Degree | $44,000 | $41,111 |
| Bachelor's Degree | $71,250 | $49,750 |
| Graduate Degree | $129,688 | $77,500 |
| Total | $55,000 | $37,500 |
Family Income in Duncansville borough
Family Income Brackets in Duncansville borough
According to the Duncansville borough family income data, there are 67 families falling into the $75,000 to $99,999 income range, which is the most common income bracket and makes up 22.4% of all families.
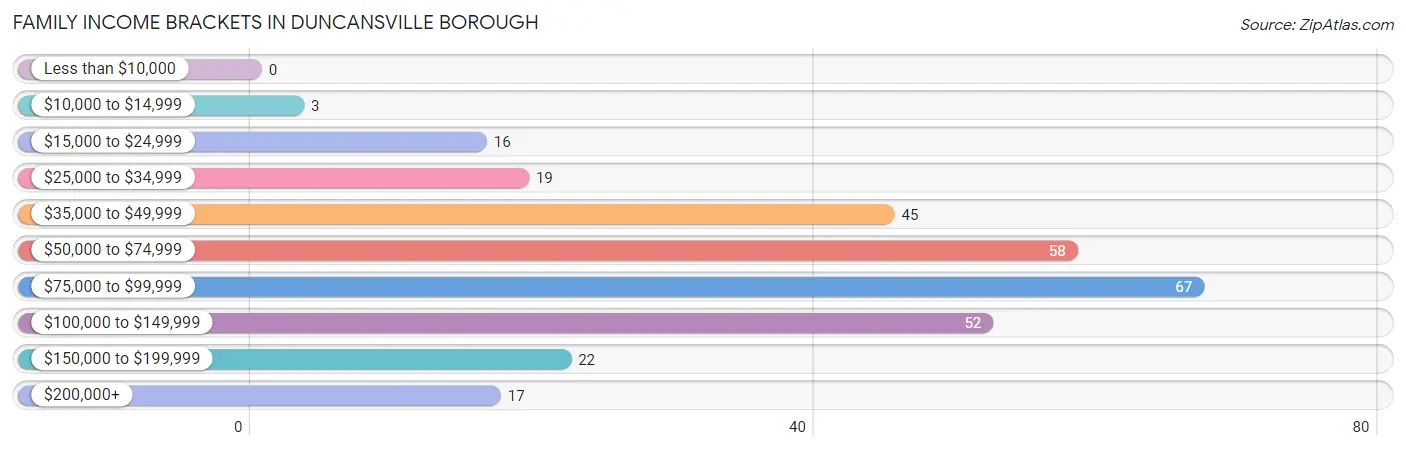
| Income Bracket | # Families | % Families |
| Less than $10,000 | 0 | 0.0% |
| $10,000 to $14,999 | 3 | 1.0% |
| $15,000 to $24,999 | 16 | 5.4% |
| $25,000 to $34,999 | 19 | 6.4% |
| $35,000 to $49,999 | 45 | 15.1% |
| $50,000 to $74,999 | 58 | 19.4% |
| $75,000 to $99,999 | 67 | 22.4% |
| $100,000 to $149,999 | 52 | 17.4% |
| $150,000 to $199,999 | 22 | 7.4% |
| $200,000+ | 17 | 5.7% |
Family Income by Famaliy Size in Duncansville borough
4-person families (32 | 10.7%) account for the highest median family income in Duncansville borough with $130,625 per family, while 2-person families (186 | 62.2%) have the highest median income of $35,625 per family member.
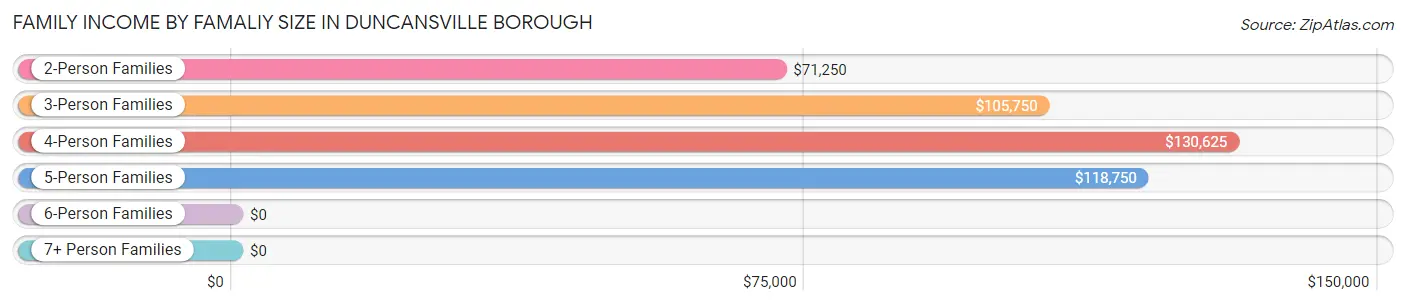
| Income Bracket | # Families | Median Income |
| 2-Person Families | 186 (62.2%) | $71,250 |
| 3-Person Families | 65 (21.7%) | $105,750 |
| 4-Person Families | 32 (10.7%) | $130,625 |
| 5-Person Families | 16 (5.3%) | $118,750 |
| 6-Person Families | 0 (0.0%) | $0 |
| 7+ Person Families | 0 (0.0%) | $0 |
| Total | 299 (100.0%) | $79,583 |
Family Income by Number of Earners in Duncansville borough
The median family income in Duncansville borough is $79,583, with families comprising 3+ earners (42) having the highest median family income of $125,000, while families with 1 earner (145) have the lowest median family income of $54,375, accounting for 14.1% and 48.5% of families, respectively.
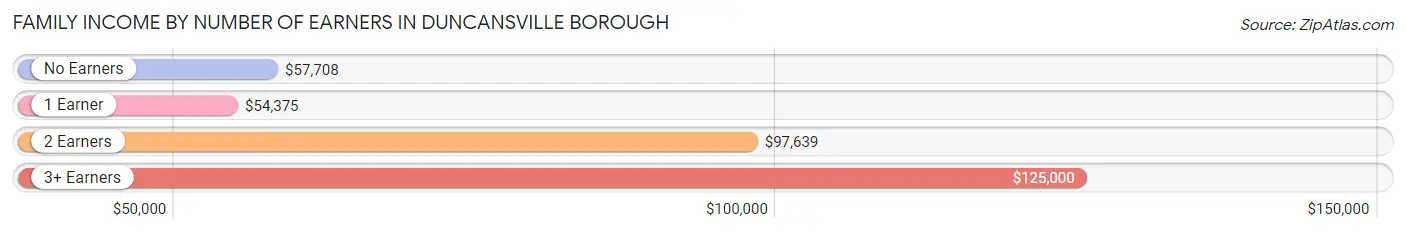
| Number of Earners | # Families | Median Income |
| No Earners | 51 (17.1%) | $57,708 |
| 1 Earner | 145 (48.5%) | $54,375 |
| 2 Earners | 61 (20.4%) | $97,639 |
| 3+ Earners | 42 (14.1%) | $125,000 |
| Total | 299 (100.0%) | $79,583 |
Household Income in Duncansville borough
Household Income Brackets in Duncansville borough
With 103 households falling in the category, the $50,000 to $74,999 income range is the most frequent in Duncansville borough, accounting for 19.6% of all households. In contrast, only 21 households (4.0%) fall into the less than $10,000 income bracket, making it the least populous group.
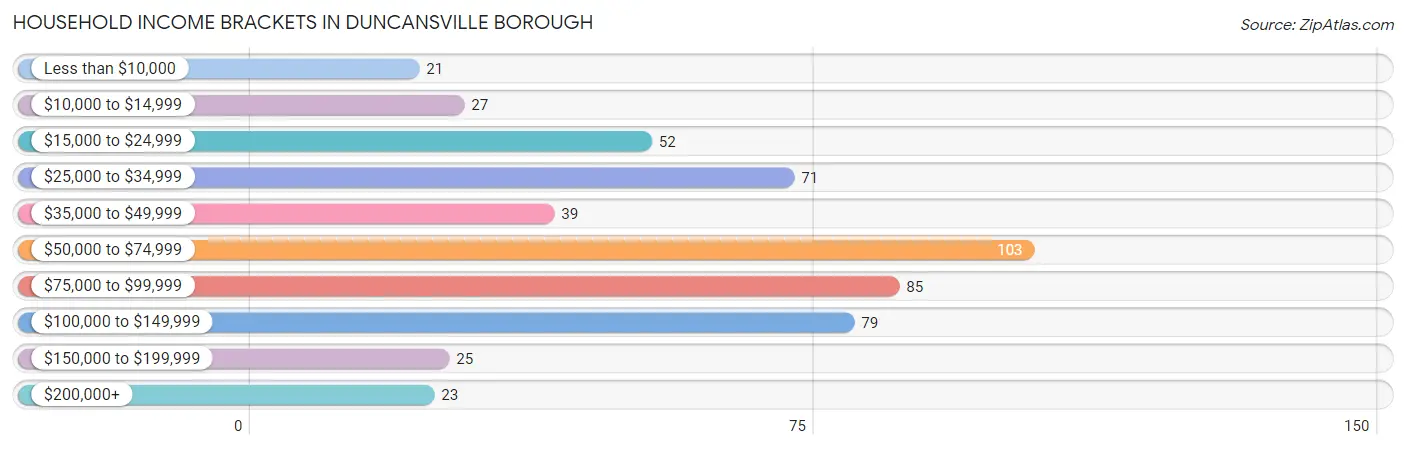
| Income Bracket | # Households | % Households |
| Less than $10,000 | 21 | 4.0% |
| $10,000 to $14,999 | 27 | 5.1% |
| $15,000 to $24,999 | 52 | 9.9% |
| $25,000 to $34,999 | 71 | 13.5% |
| $35,000 to $49,999 | 39 | 7.4% |
| $50,000 to $74,999 | 103 | 19.6% |
| $75,000 to $99,999 | 85 | 16.2% |
| $100,000 to $149,999 | 79 | 15.0% |
| $150,000 to $199,999 | 25 | 4.8% |
| $200,000+ | 23 | 4.4% |
Household Income by Householder Age in Duncansville borough
The median household income in Duncansville borough is $60,972, with the highest median household income of $81,875 found in the 45 to 64 years age bracket for the primary householder. A total of 167 households (31.8%) fall into this category. Meanwhile, the 15 to 24 years age bracket for the primary householder has the lowest median household income of $0, with 31 households (5.9%) in this group.
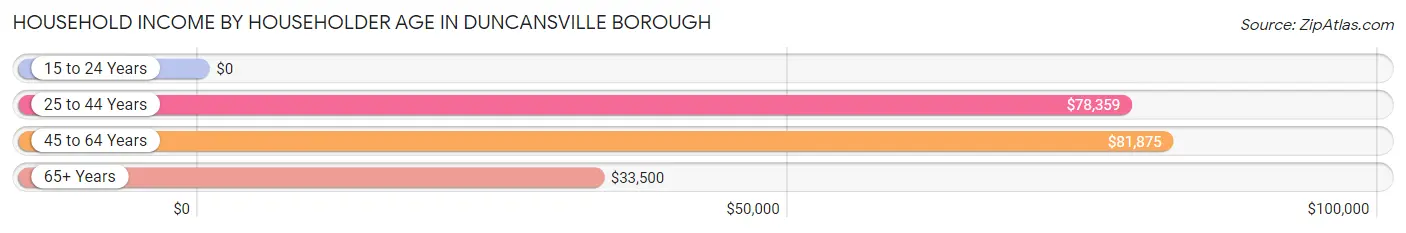
| Income Bracket | # Households | Median Income |
| 15 to 24 Years | 31 (5.9%) | $0 |
| 25 to 44 Years | 107 (20.4%) | $78,359 |
| 45 to 64 Years | 167 (31.8%) | $81,875 |
| 65+ Years | 220 (41.9%) | $33,500 |
| Total | 525 (100.0%) | $60,972 |
Poverty in Duncansville borough
Income Below Poverty by Sex and Age in Duncansville borough
With 4.2% poverty level for males and 9.0% for females among the residents of Duncansville borough, 18 to 24 year old males and 75 year old and over females are the most vulnerable to poverty, with 6 males (10.0%) and 37 females (48.0%) in their respective age groups living below the poverty level.
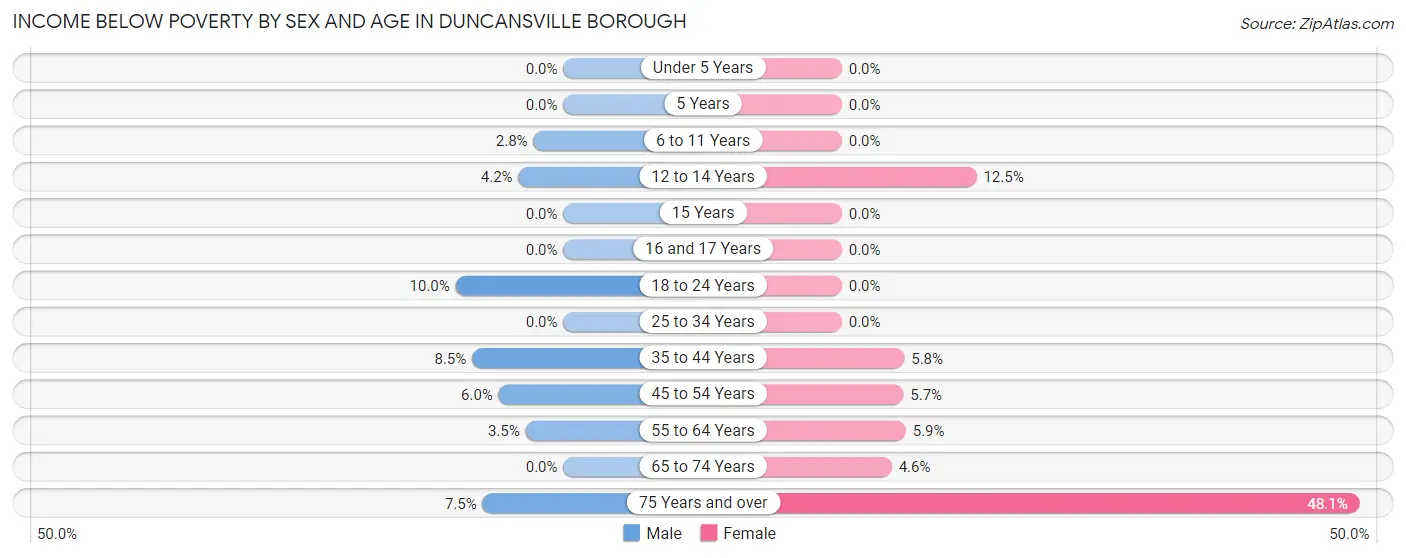
| Age Bracket | Male | Female |
| Under 5 Years | 0 (0.0%) | 0 (0.0%) |
| 5 Years | 0 (0.0%) | 0 (0.0%) |
| 6 to 11 Years | 1 (2.8%) | 0 (0.0%) |
| 12 to 14 Years | 1 (4.2%) | 3 (12.5%) |
| 15 Years | 0 (0.0%) | 0 (0.0%) |
| 16 and 17 Years | 0 (0.0%) | 0 (0.0%) |
| 18 to 24 Years | 6 (10.0%) | 0 (0.0%) |
| 25 to 34 Years | 0 (0.0%) | 0 (0.0%) |
| 35 to 44 Years | 5 (8.5%) | 4 (5.8%) |
| 45 to 54 Years | 3 (6.0%) | 4 (5.7%) |
| 55 to 64 Years | 2 (3.5%) | 6 (5.9%) |
| 65 to 74 Years | 0 (0.0%) | 5 (4.6%) |
| 75 Years and over | 3 (7.5%) | 37 (48.0%) |
| Total | 21 (4.2%) | 59 (9.0%) |
Income Above Poverty by Sex and Age in Duncansville borough
According to the poverty statistics in Duncansville borough, males aged under 5 years and females aged 6 to 11 years are the age groups that are most secure financially, with 100.0% of males and 100.0% of females in these age groups living above the poverty line.
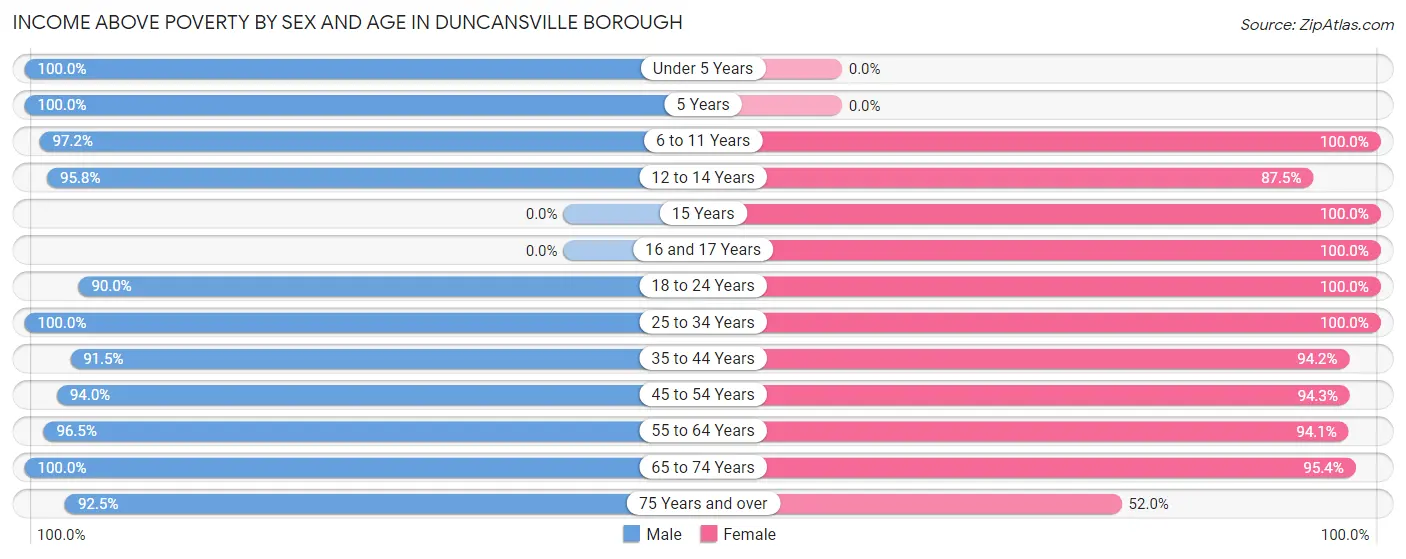
| Age Bracket | Male | Female |
| Under 5 Years | 40 (100.0%) | 0 (0.0%) |
| 5 Years | 3 (100.0%) | 0 (0.0%) |
| 6 to 11 Years | 35 (97.2%) | 22 (100.0%) |
| 12 to 14 Years | 23 (95.8%) | 21 (87.5%) |
| 15 Years | 0 (0.0%) | 12 (100.0%) |
| 16 and 17 Years | 0 (0.0%) | 31 (100.0%) |
| 18 to 24 Years | 54 (90.0%) | 82 (100.0%) |
| 25 to 34 Years | 45 (100.0%) | 57 (100.0%) |
| 35 to 44 Years | 54 (91.5%) | 65 (94.2%) |
| 45 to 54 Years | 47 (94.0%) | 66 (94.3%) |
| 55 to 64 Years | 55 (96.5%) | 95 (94.1%) |
| 65 to 74 Years | 86 (100.0%) | 103 (95.4%) |
| 75 Years and over | 37 (92.5%) | 40 (51.9%) |
| Total | 479 (95.8%) | 594 (91.0%) |
Income Below Poverty Among Married-Couple Families in Duncansville borough
The poverty statistics for married-couple families in Duncansville borough show that 1.6% or 3 of the total 185 families live below the poverty line. Families with no children have the highest poverty rate of 2.1%, comprising of 3 families. On the other hand, families with 1 or 2 children have the lowest poverty rate of 0.0%, which includes 0 families.
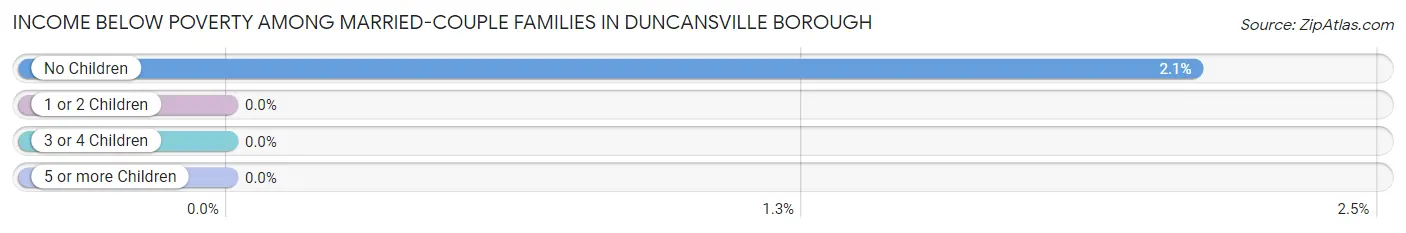
| Children | Above Poverty | Below Poverty |
| No Children | 140 (97.9%) | 3 (2.1%) |
| 1 or 2 Children | 38 (100.0%) | 0 (0.0%) |
| 3 or 4 Children | 4 (100.0%) | 0 (0.0%) |
| 5 or more Children | 0 (0.0%) | 0 (0.0%) |
| Total | 182 (98.4%) | 3 (1.6%) |
Income Below Poverty Among Single-Parent Households in Duncansville borough
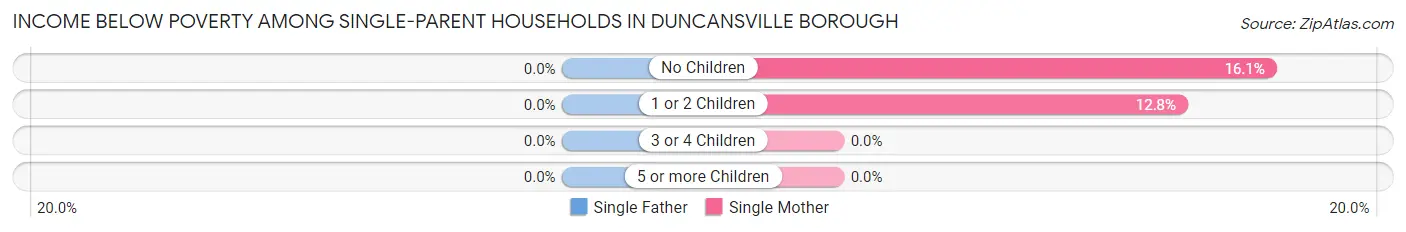
| Children | Single Father | Single Mother |
| No Children | 0 (0.0%) | 5 (16.1%) |
| 1 or 2 Children | 0 (0.0%) | 5 (12.8%) |
| 3 or 4 Children | 0 (0.0%) | 0 (0.0%) |
| 5 or more Children | 0 (0.0%) | 0 (0.0%) |
| Total | 0 (0.0%) | 10 (13.3%) |
Income Below Poverty Among Married-Couple vs Single-Parent Households in Duncansville borough
The poverty data for Duncansville borough shows that 3 of the married-couple family households (1.6%) and 10 of the single-parent households (8.8%) are living below the poverty level. Within the married-couple family households, those with no children have the highest poverty rate, with 3 households (2.1%) falling below the poverty line. Among the single-parent households, those with no children have the highest poverty rate, with 5 household (12.2%) living below poverty.
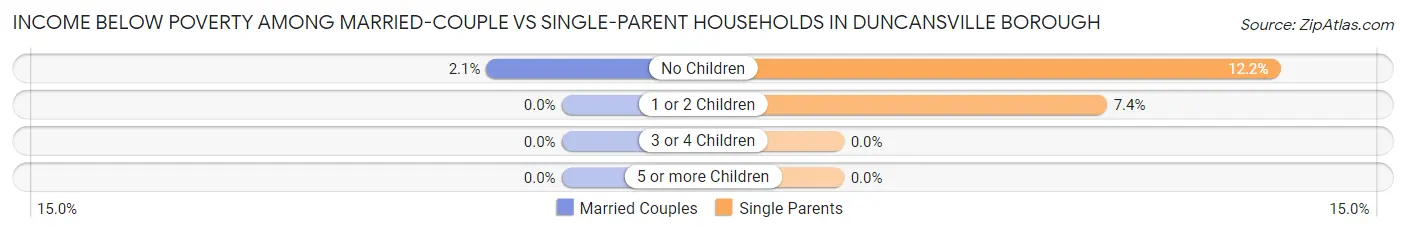
| Children | Married-Couple Families | Single-Parent Households |
| No Children | 3 (2.1%) | 5 (12.2%) |
| 1 or 2 Children | 0 (0.0%) | 5 (7.3%) |
| 3 or 4 Children | 0 (0.0%) | 0 (0.0%) |
| 5 or more Children | 0 (0.0%) | 0 (0.0%) |
| Total | 3 (1.6%) | 10 (8.8%) |
Employment Characteristics in Duncansville borough
Employment by Class of Employer in Duncansville borough
Among the 563 employed individuals in Duncansville borough, private company employees (435 | 77.3%), local government employees (32 | 5.7%), and self-employed (not incorporated) (27 | 4.8%) make up the most common classes of employment.
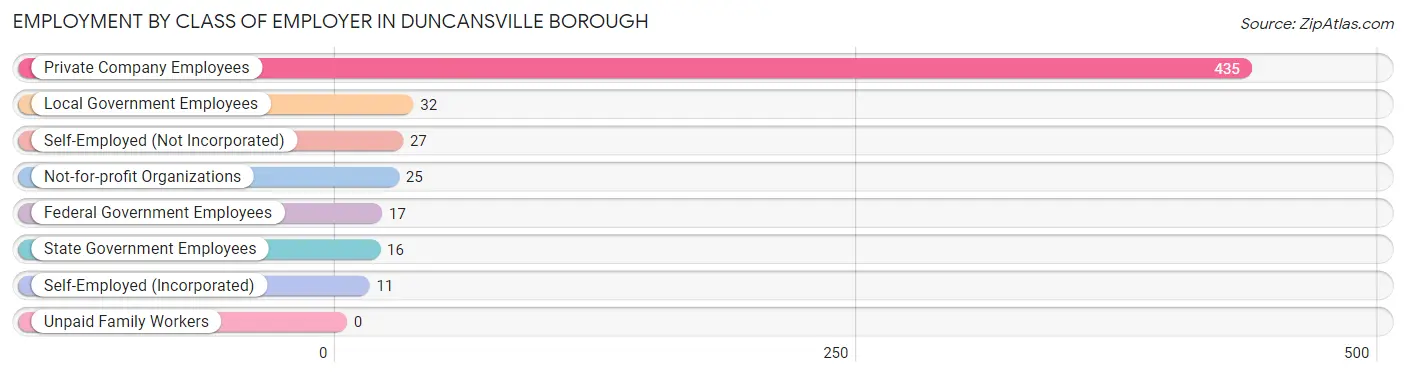
| Employer Class | # Employees | % Employees |
| Private Company Employees | 435 | 77.3% |
| Self-Employed (Incorporated) | 11 | 1.9% |
| Self-Employed (Not Incorporated) | 27 | 4.8% |
| Not-for-profit Organizations | 25 | 4.4% |
| Local Government Employees | 32 | 5.7% |
| State Government Employees | 16 | 2.8% |
| Federal Government Employees | 17 | 3.0% |
| Unpaid Family Workers | 0 | 0.0% |
| Total | 563 | 100.0% |
Employment Status by Age in Duncansville borough
According to the labor force statistics for Duncansville borough, out of the total population over 16 years of age (992), 64.0% or 635 individuals are in the labor force, with 9.8% or 62 of them unemployed. The age group with the highest labor force participation rate is 25 to 29 years, with 100.0% or 47 individuals in the labor force. Within the labor force, the 20 to 24 years age range has the highest percentage of unemployed individuals, with 33.7% or 29 of them being unemployed.
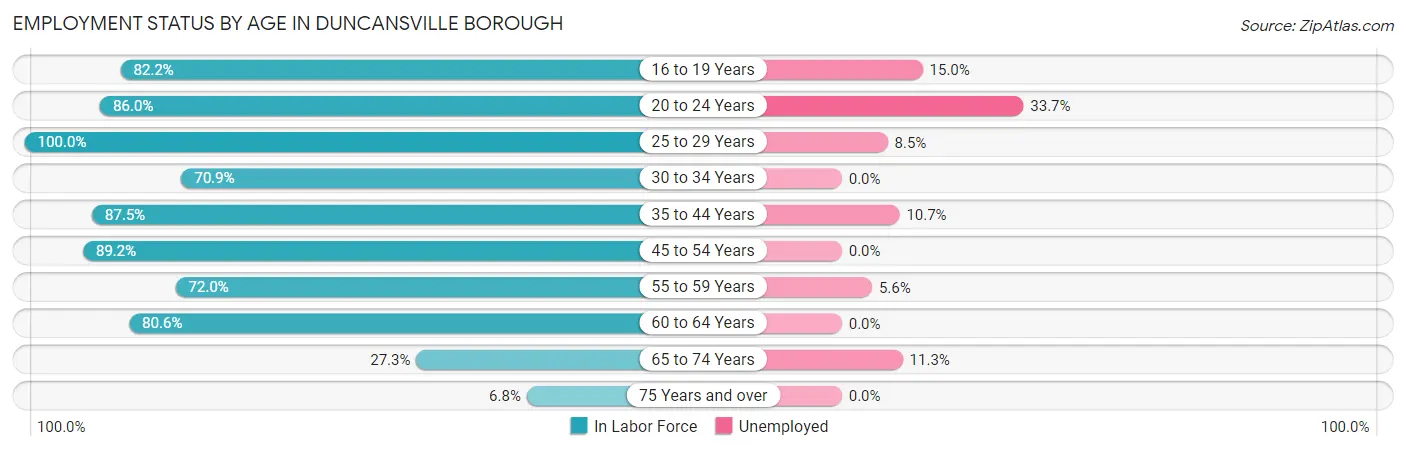
| Age Bracket | In Labor Force | Unemployed |
| 16 to 19 Years | 60 (82.2%) | 9 (15.0%) |
| 20 to 24 Years | 86 (86.0%) | 29 (33.7%) |
| 25 to 29 Years | 47 (100.0%) | 4 (8.5%) |
| 30 to 34 Years | 39 (70.9%) | 0 (0.0%) |
| 35 to 44 Years | 112 (87.5%) | 12 (10.7%) |
| 45 to 54 Years | 107 (89.2%) | 0 (0.0%) |
| 55 to 59 Years | 36 (72.0%) | 2 (5.6%) |
| 60 to 64 Years | 87 (80.6%) | 0 (0.0%) |
| 65 to 74 Years | 53 (27.3%) | 6 (11.3%) |
| 75 Years and over | 8 (6.8%) | 0 (0.0%) |
| Total | 635 (64.0%) | 62 (9.8%) |
Employment Status by Educational Attainment in Duncansville borough
According to labor force statistics for Duncansville borough, 84.3% of individuals (428) out of the total population between 25 and 64 years of age (508) are in the labor force, with 4.2% or 18 of them being unemployed. The group with the highest labor force participation rate are those with the educational attainment of bachelor's degree or higher, with 88.0% or 117 individuals in the labor force. Within the labor force, individuals with high school diploma education have the highest percentage of unemployment, with 6.8% or 14 of them being unemployed.
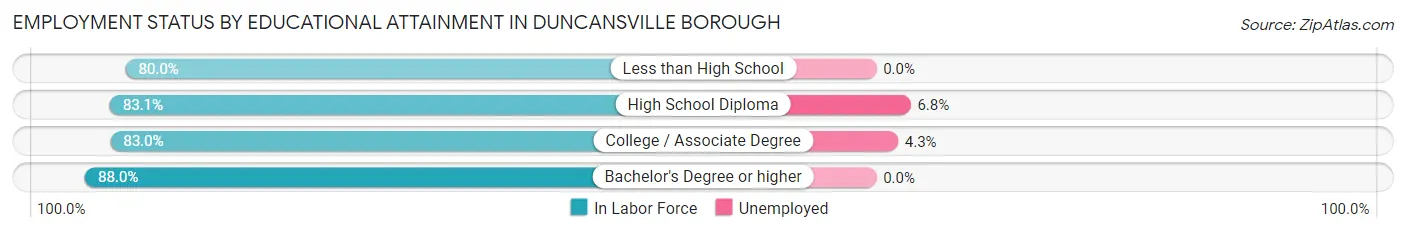
| Educational Attainment | In Labor Force | Unemployed |
| Less than High School | 12 (80.0%) | 0 (0.0%) |
| High School Diploma | 206 (83.1%) | 17 (6.8%) |
| College / Associate Degree | 93 (83.0%) | 5 (4.3%) |
| Bachelor's Degree or higher | 117 (88.0%) | 0 (0.0%) |
| Total | 428 (84.3%) | 21 (4.2%) |
Employment Occupations by Sex in Duncansville borough
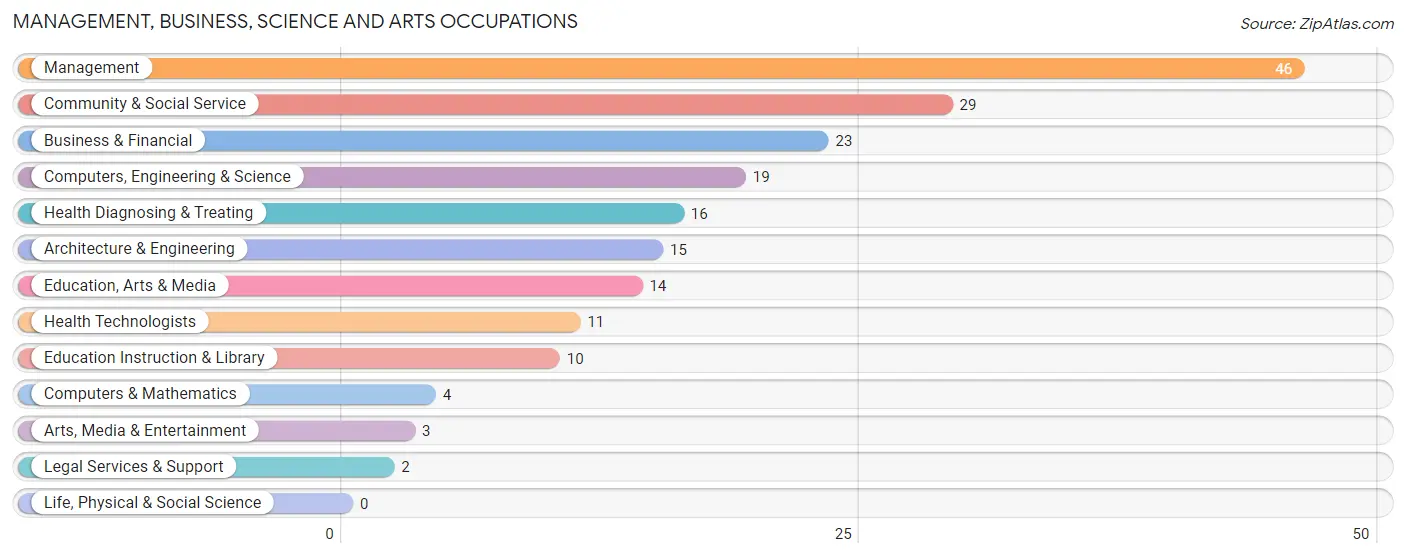
Management, Business, Science and Arts Occupations
The most common Management, Business, Science and Arts occupations in Duncansville borough are Management (46 | 8.0%), Community & Social Service (29 | 5.1%), Business & Financial (23 | 4.0%), Computers, Engineering & Science (19 | 3.3%), and Health Diagnosing & Treating (16 | 2.8%).
Management, Business, Science and Arts Occupations by Sex
Within the Management, Business, Science and Arts occupations in Duncansville borough, the most male-oriented occupations are Computers & Mathematics (100.0%), Health Technologists (72.7%), and Computers, Engineering & Science (52.6%), while the most female-oriented occupations are Education, Arts & Media (100.0%), Legal Services & Support (100.0%), and Arts, Media & Entertainment (100.0%).
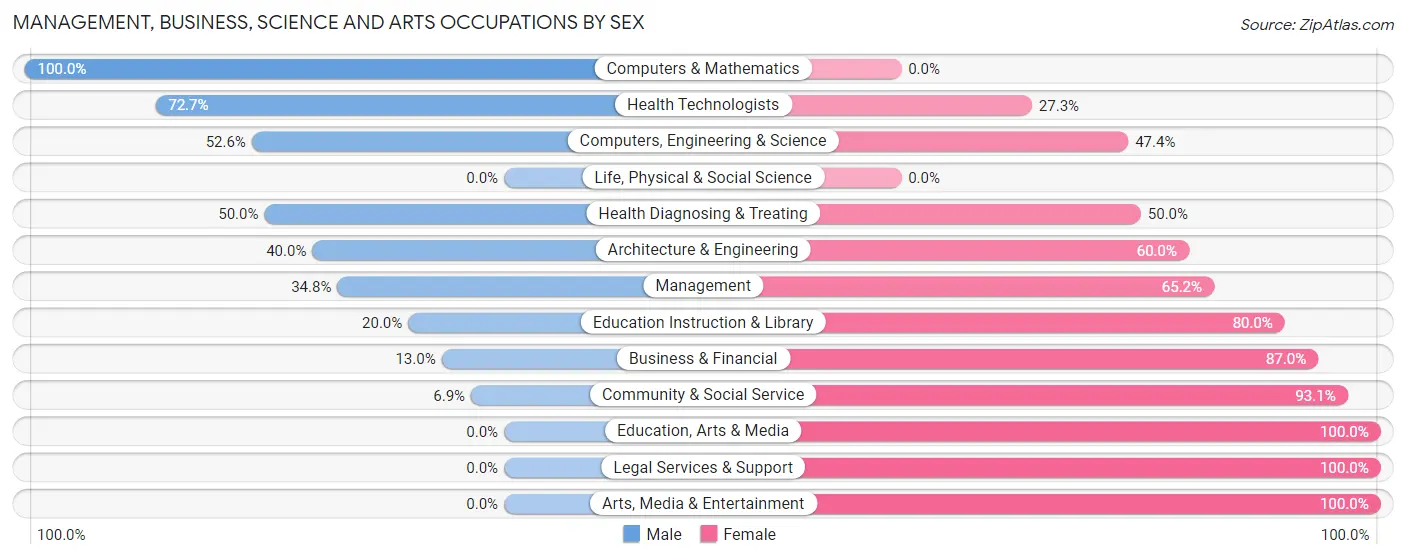
| Occupation | Male | Female |
| Management | 16 (34.8%) | 30 (65.2%) |
| Business & Financial | 3 (13.0%) | 20 (87.0%) |
| Computers, Engineering & Science | 10 (52.6%) | 9 (47.4%) |
| Computers & Mathematics | 4 (100.0%) | 0 (0.0%) |
| Architecture & Engineering | 6 (40.0%) | 9 (60.0%) |
| Life, Physical & Social Science | 0 (0.0%) | 0 (0.0%) |
| Community & Social Service | 2 (6.9%) | 27 (93.1%) |
| Education, Arts & Media | 0 (0.0%) | 14 (100.0%) |
| Legal Services & Support | 0 (0.0%) | 2 (100.0%) |
| Education Instruction & Library | 2 (20.0%) | 8 (80.0%) |
| Arts, Media & Entertainment | 0 (0.0%) | 3 (100.0%) |
| Health Diagnosing & Treating | 8 (50.0%) | 8 (50.0%) |
| Health Technologists | 8 (72.7%) | 3 (27.3%) |
| Total (Category) | 39 (29.3%) | 94 (70.7%) |
| Total (Overall) | 279 (48.7%) | 294 (51.3%) |
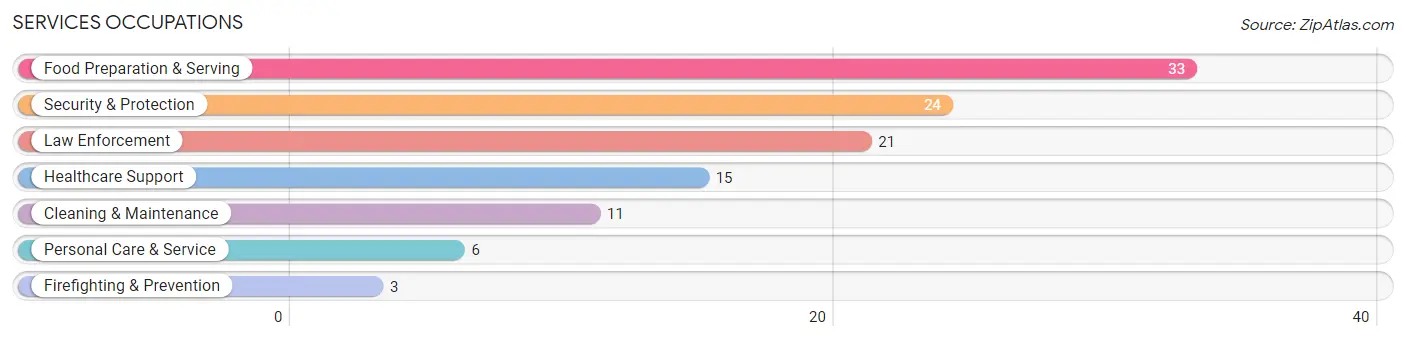
Services Occupations
The most common Services occupations in Duncansville borough are Food Preparation & Serving (33 | 5.8%), Security & Protection (24 | 4.2%), Law Enforcement (21 | 3.7%), Healthcare Support (15 | 2.6%), and Cleaning & Maintenance (11 | 1.9%).
Services Occupations by Sex
Within the Services occupations in Duncansville borough, the most male-oriented occupations are Firefighting & Prevention (100.0%), Security & Protection (83.3%), and Law Enforcement (80.9%), while the most female-oriented occupations are Personal Care & Service (100.0%), Healthcare Support (86.7%), and Food Preparation & Serving (45.5%).
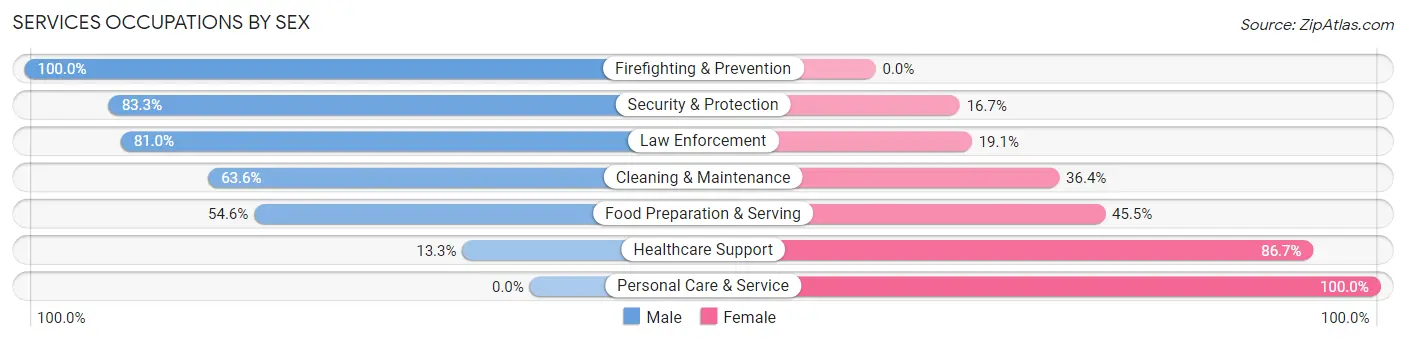
| Occupation | Male | Female |
| Healthcare Support | 2 (13.3%) | 13 (86.7%) |
| Security & Protection | 20 (83.3%) | 4 (16.7%) |
| Firefighting & Prevention | 3 (100.0%) | 0 (0.0%) |
| Law Enforcement | 17 (80.9%) | 4 (19.1%) |
| Food Preparation & Serving | 18 (54.5%) | 15 (45.5%) |
| Cleaning & Maintenance | 7 (63.6%) | 4 (36.4%) |
| Personal Care & Service | 0 (0.0%) | 6 (100.0%) |
| Total (Category) | 47 (52.8%) | 42 (47.2%) |
| Total (Overall) | 279 (48.7%) | 294 (51.3%) |
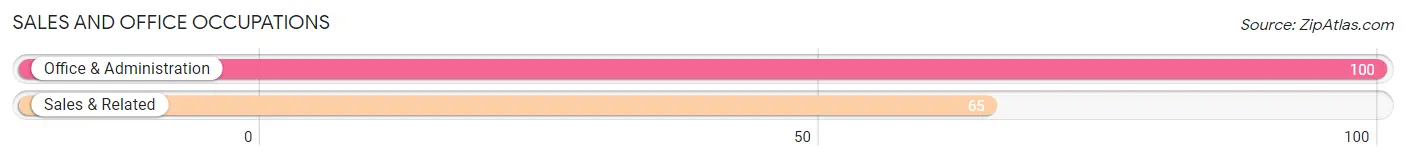
Sales and Office Occupations
The most common Sales and Office occupations in Duncansville borough are Office & Administration (100 | 17.4%), and Sales & Related (65 | 11.3%).
Sales and Office Occupations by Sex
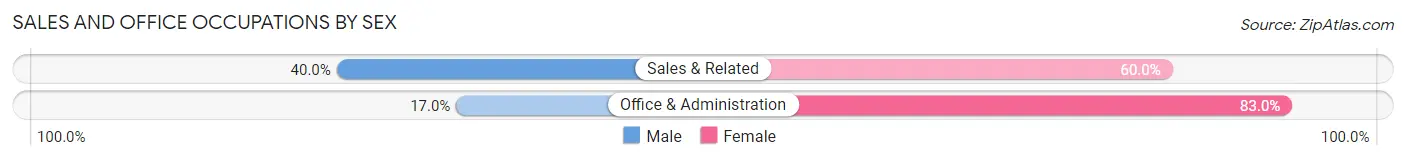
| Occupation | Male | Female |
| Sales & Related | 26 (40.0%) | 39 (60.0%) |
| Office & Administration | 17 (17.0%) | 83 (83.0%) |
| Total (Category) | 43 (26.1%) | 122 (73.9%) |
| Total (Overall) | 279 (48.7%) | 294 (51.3%) |
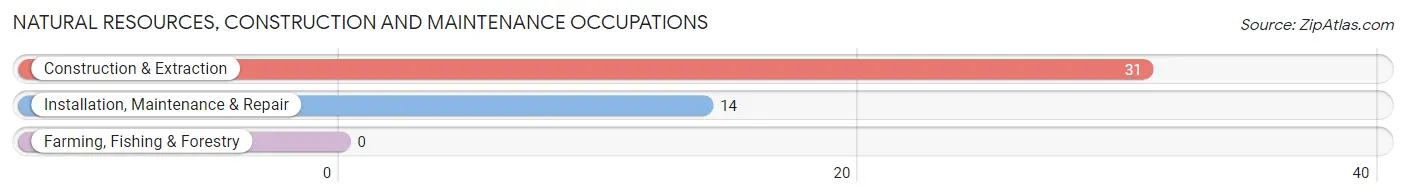
Natural Resources, Construction and Maintenance Occupations
The most common Natural Resources, Construction and Maintenance occupations in Duncansville borough are Construction & Extraction (31 | 5.4%), and Installation, Maintenance & Repair (14 | 2.4%).
Natural Resources, Construction and Maintenance Occupations by Sex
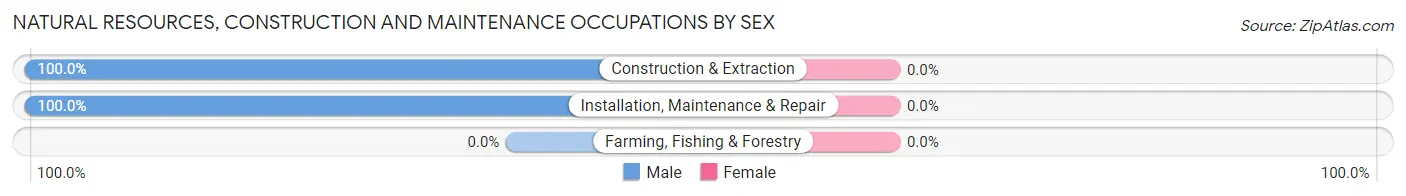
| Occupation | Male | Female |
| Farming, Fishing & Forestry | 0 (0.0%) | 0 (0.0%) |
| Construction & Extraction | 31 (100.0%) | 0 (0.0%) |
| Installation, Maintenance & Repair | 14 (100.0%) | 0 (0.0%) |
| Total (Category) | 45 (100.0%) | 0 (0.0%) |
| Total (Overall) | 279 (48.7%) | 294 (51.3%) |
Production, Transportation and Moving Occupations
The most common Production, Transportation and Moving occupations in Duncansville borough are Production (60 | 10.5%), Material Moving (54 | 9.4%), and Transportation (27 | 4.7%).
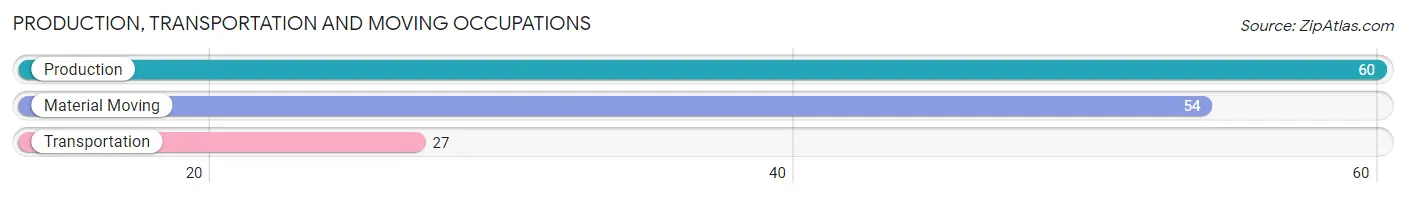
Production, Transportation and Moving Occupations by Sex
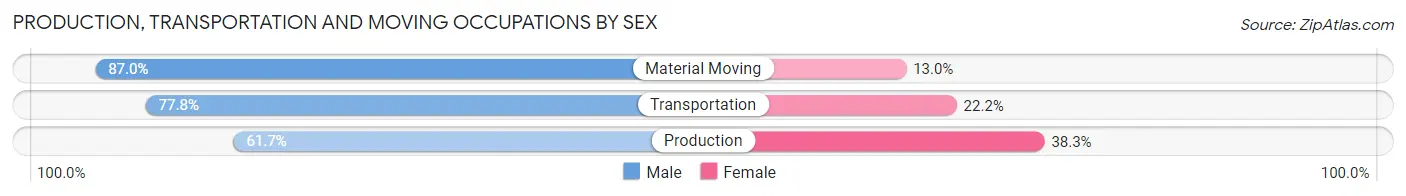
| Occupation | Male | Female |
| Production | 37 (61.7%) | 23 (38.3%) |
| Transportation | 21 (77.8%) | 6 (22.2%) |
| Material Moving | 47 (87.0%) | 7 (13.0%) |
| Total (Category) | 105 (74.5%) | 36 (25.5%) |
| Total (Overall) | 279 (48.7%) | 294 (51.3%) |
Employment Industries by Sex in Duncansville borough
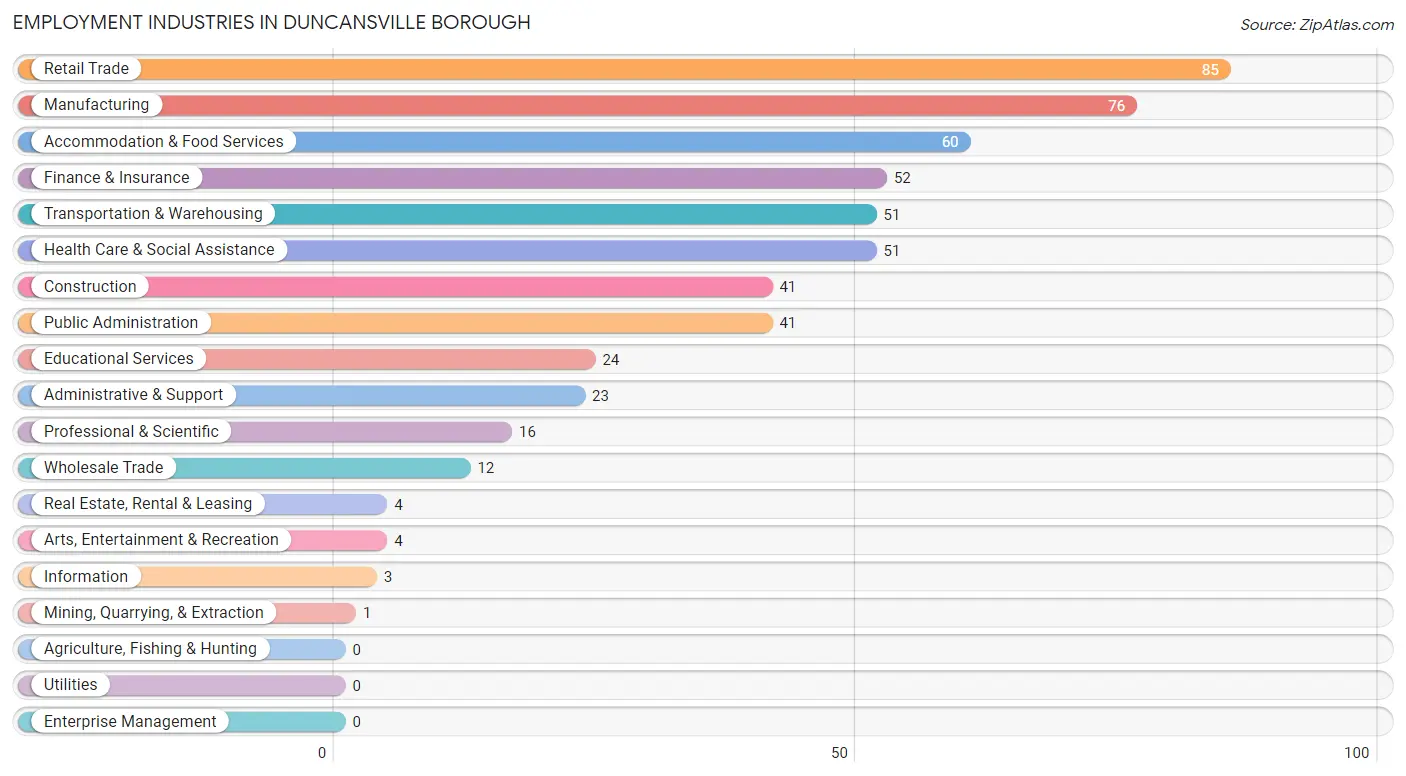
Employment Industries in Duncansville borough
The major employment industries in Duncansville borough include Retail Trade (85 | 14.8%), Manufacturing (76 | 13.3%), Accommodation & Food Services (60 | 10.5%), Finance & Insurance (52 | 9.1%), and Transportation & Warehousing (51 | 8.9%).
Employment Industries by Sex in Duncansville borough
The Duncansville borough industries that see more men than women are Mining, Quarrying, & Extraction (100.0%), Construction (100.0%), and Real Estate, Rental & Leasing (100.0%), whereas the industries that tend to have a higher number of women are Information (100.0%), Finance & Insurance (100.0%), and Arts, Entertainment & Recreation (100.0%).
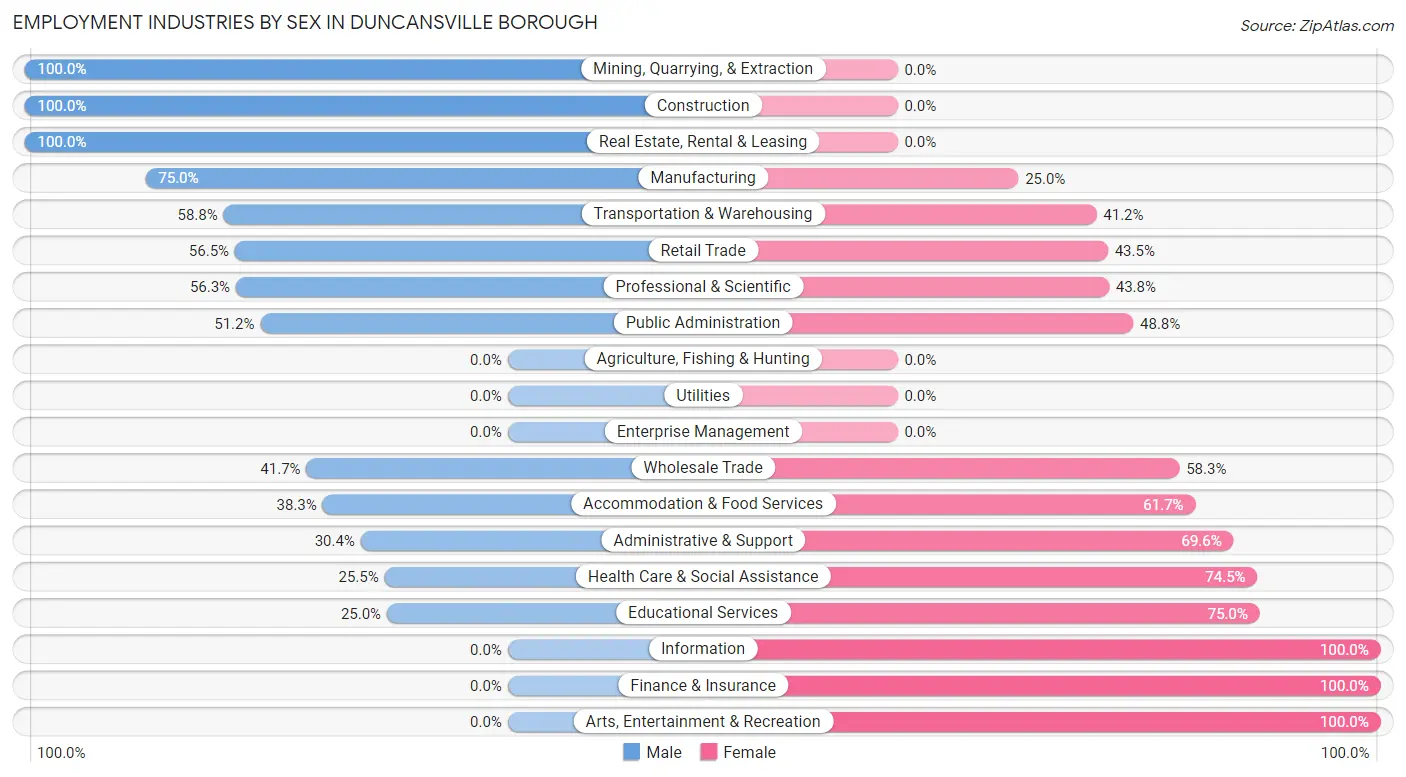
| Industry | Male | Female |
| Agriculture, Fishing & Hunting | 0 (0.0%) | 0 (0.0%) |
| Mining, Quarrying, & Extraction | 1 (100.0%) | 0 (0.0%) |
| Construction | 41 (100.0%) | 0 (0.0%) |
| Manufacturing | 57 (75.0%) | 19 (25.0%) |
| Wholesale Trade | 5 (41.7%) | 7 (58.3%) |
| Retail Trade | 48 (56.5%) | 37 (43.5%) |
| Transportation & Warehousing | 30 (58.8%) | 21 (41.2%) |
| Utilities | 0 (0.0%) | 0 (0.0%) |
| Information | 0 (0.0%) | 3 (100.0%) |
| Finance & Insurance | 0 (0.0%) | 52 (100.0%) |
| Real Estate, Rental & Leasing | 4 (100.0%) | 0 (0.0%) |
| Professional & Scientific | 9 (56.2%) | 7 (43.8%) |
| Enterprise Management | 0 (0.0%) | 0 (0.0%) |
| Administrative & Support | 7 (30.4%) | 16 (69.6%) |
| Educational Services | 6 (25.0%) | 18 (75.0%) |
| Health Care & Social Assistance | 13 (25.5%) | 38 (74.5%) |
| Arts, Entertainment & Recreation | 0 (0.0%) | 4 (100.0%) |
| Accommodation & Food Services | 23 (38.3%) | 37 (61.7%) |
| Public Administration | 21 (51.2%) | 20 (48.8%) |
| Total | 279 (48.7%) | 294 (51.3%) |
Education in Duncansville borough
School Enrollment in Duncansville borough
The most common levels of schooling among the 244 students in Duncansville borough are high school (67 | 27.5%), middle school (53 | 21.7%), and elementary school (47 | 19.3%).
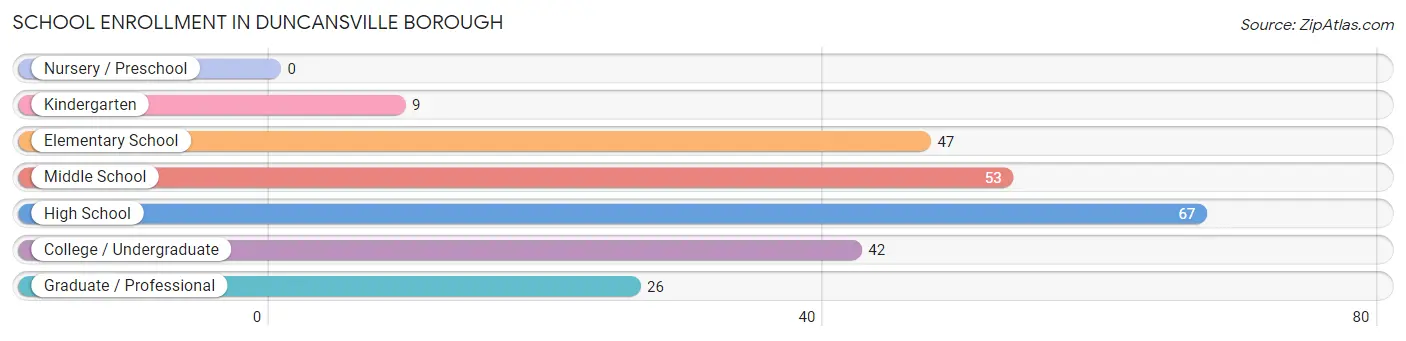
| School Level | # Students | % Students |
| Nursery / Preschool | 0 | 0.0% |
| Kindergarten | 9 | 3.7% |
| Elementary School | 47 | 19.3% |
| Middle School | 53 | 21.7% |
| High School | 67 | 27.5% |
| College / Undergraduate | 42 | 17.2% |
| Graduate / Professional | 26 | 10.7% |
| Total | 244 | 100.0% |
School Enrollment by Age by Funding Source in Duncansville borough
Out of a total of 244 students who are enrolled in schools in Duncansville borough, 22 (9.0%) attend a private institution, while the remaining 222 (91.0%) are enrolled in public schools. The age group of 20 to 24 year olds has the highest likelihood of being enrolled in private schools, with 9 (37.5% in the age bracket) enrolled. Conversely, the age group of 10 to 14 year olds has the lowest likelihood of being enrolled in a private school, with 57 (100.0% in the age bracket) attending a public institution.
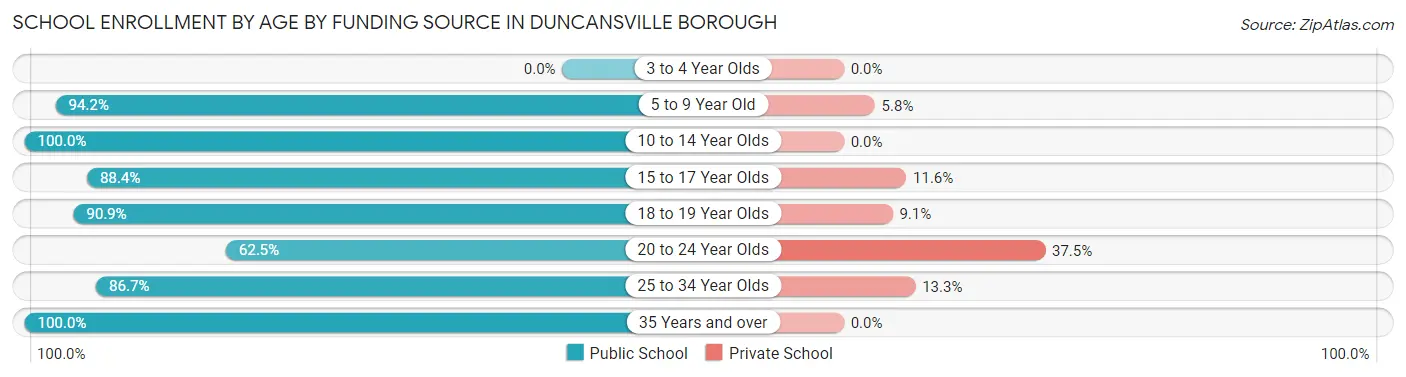
| Age Bracket | Public School | Private School |
| 3 to 4 Year Olds | 0 (0.0%) | 0 (0.0%) |
| 5 to 9 Year Old | 49 (94.2%) | 3 (5.8%) |
| 10 to 14 Year Olds | 57 (100.0%) | 0 (0.0%) |
| 15 to 17 Year Olds | 38 (88.4%) | 5 (11.6%) |
| 18 to 19 Year Olds | 30 (90.9%) | 3 (9.1%) |
| 20 to 24 Year Olds | 15 (62.5%) | 9 (37.5%) |
| 25 to 34 Year Olds | 13 (86.7%) | 2 (13.3%) |
| 35 Years and over | 20 (100.0%) | 0 (0.0%) |
| Total | 222 (91.0%) | 22 (9.0%) |
Educational Attainment by Field of Study in Duncansville borough
Business (36 | 22.0%), engineering (35 | 21.3%), education (28 | 17.1%), arts & humanities (26 | 15.9%), and science & technology (12 | 7.3%) are the most common fields of study among 164 individuals in Duncansville borough who have obtained a bachelor's degree or higher.
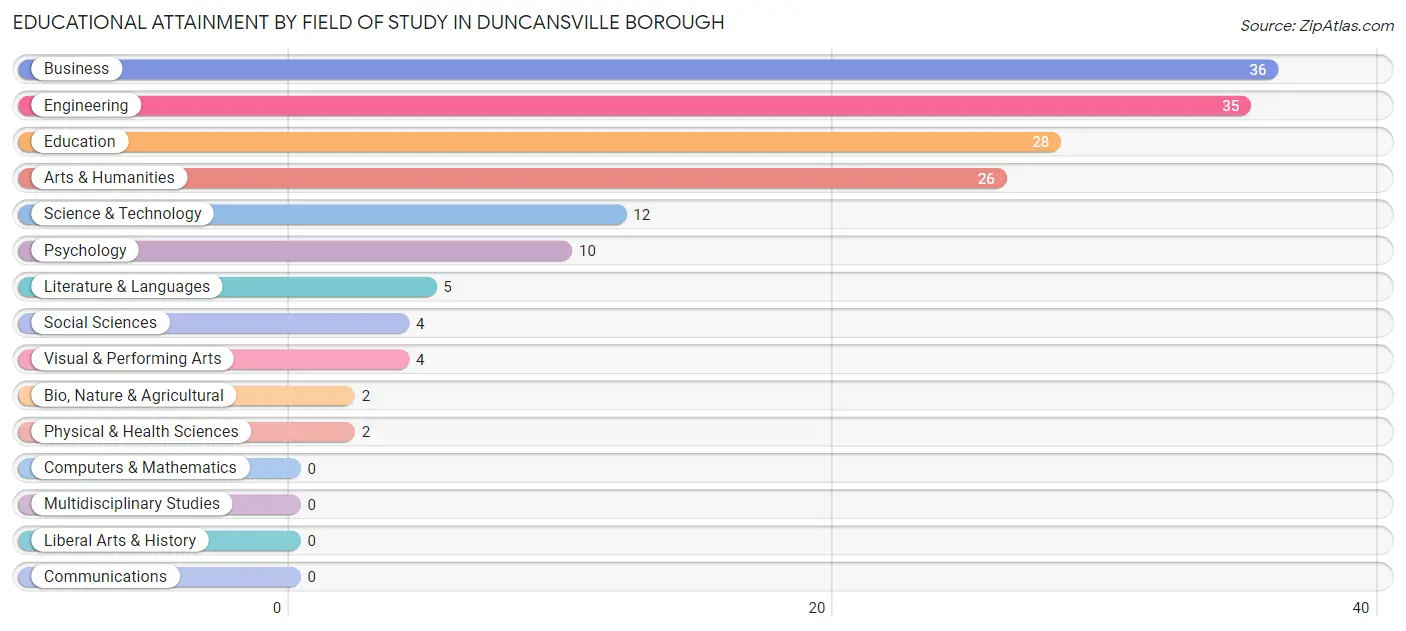
| Field of Study | # Graduates | % Graduates |
| Computers & Mathematics | 0 | 0.0% |
| Bio, Nature & Agricultural | 2 | 1.2% |
| Physical & Health Sciences | 2 | 1.2% |
| Psychology | 10 | 6.1% |
| Social Sciences | 4 | 2.4% |
| Engineering | 35 | 21.3% |
| Multidisciplinary Studies | 0 | 0.0% |
| Science & Technology | 12 | 7.3% |
| Business | 36 | 22.0% |
| Education | 28 | 17.1% |
| Literature & Languages | 5 | 3.0% |
| Liberal Arts & History | 0 | 0.0% |
| Visual & Performing Arts | 4 | 2.4% |
| Communications | 0 | 0.0% |
| Arts & Humanities | 26 | 15.9% |
| Total | 164 | 100.0% |
Transportation & Commute in Duncansville borough
Vehicle Availability by Sex in Duncansville borough
The most prevalent vehicle ownership categories in Duncansville borough are males with 3 vehicles (121, accounting for 45.0%) and females with 3 vehicles (72, making up 41.2%).
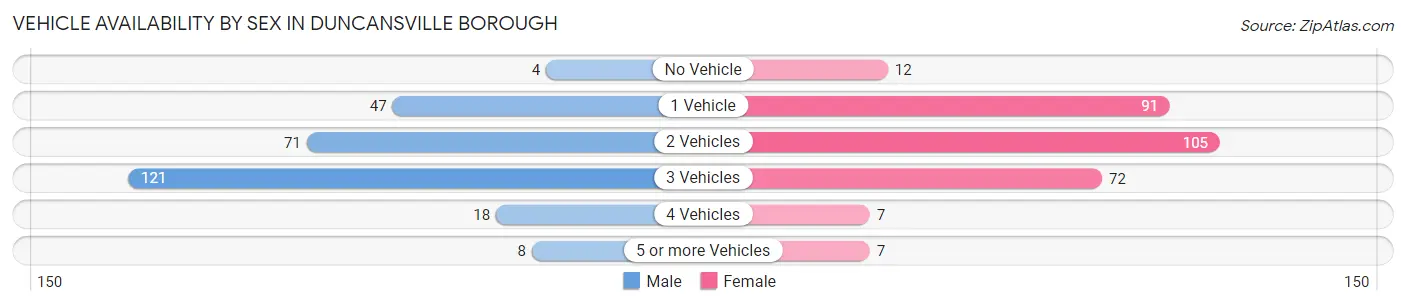
| Vehicles Available | Male | Female |
| No Vehicle | 4 (1.5%) | 12 (4.1%) |
| 1 Vehicle | 47 (17.5%) | 91 (30.9%) |
| 2 Vehicles | 71 (26.4%) | 105 (35.7%) |
| 3 Vehicles | 121 (45.0%) | 72 (24.5%) |
| 4 Vehicles | 18 (6.7%) | 7 (2.4%) |
| 5 or more Vehicles | 8 (3.0%) | 7 (2.4%) |
| Total | 269 (100.0%) | 294 (100.0%) |
Commute Time in Duncansville borough
The most frequently occuring commute durations in Duncansville borough are 10 to 14 minutes (131 commuters, 24.5%), 5 to 9 minutes (115 commuters, 21.5%), and 15 to 19 minutes (78 commuters, 14.6%).
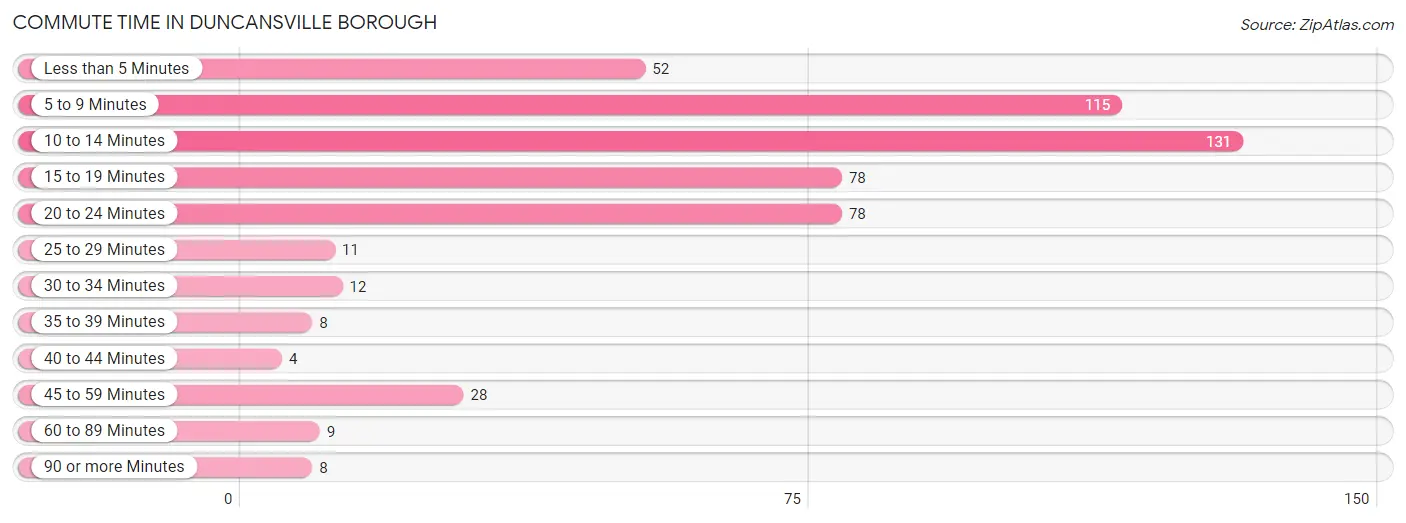
| Commute Time | # Commuters | % Commuters |
| Less than 5 Minutes | 52 | 9.7% |
| 5 to 9 Minutes | 115 | 21.5% |
| 10 to 14 Minutes | 131 | 24.5% |
| 15 to 19 Minutes | 78 | 14.6% |
| 20 to 24 Minutes | 78 | 14.6% |
| 25 to 29 Minutes | 11 | 2.1% |
| 30 to 34 Minutes | 12 | 2.2% |
| 35 to 39 Minutes | 8 | 1.5% |
| 40 to 44 Minutes | 4 | 0.7% |
| 45 to 59 Minutes | 28 | 5.2% |
| 60 to 89 Minutes | 9 | 1.7% |
| 90 or more Minutes | 8 | 1.5% |
Commute Time by Sex in Duncansville borough
The most common commute times in Duncansville borough are 10 to 14 minutes (59 commuters, 23.1%) for males and 10 to 14 minutes (72 commuters, 25.9%) for females.
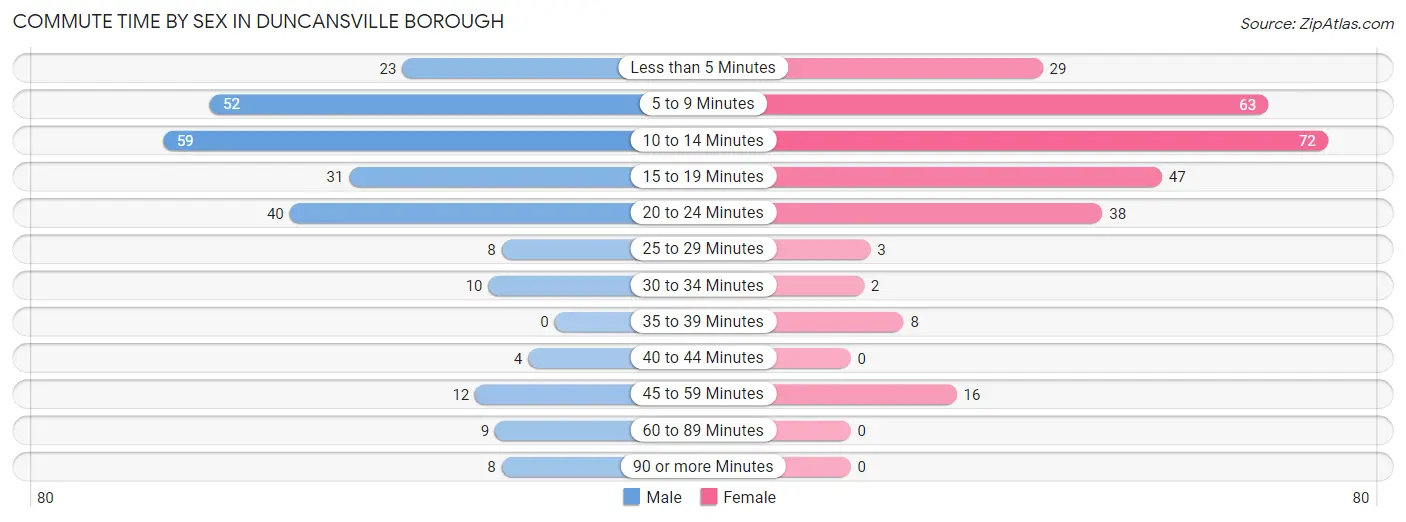
| Commute Time | Male | Female |
| Less than 5 Minutes | 23 (9.0%) | 29 (10.4%) |
| 5 to 9 Minutes | 52 (20.3%) | 63 (22.7%) |
| 10 to 14 Minutes | 59 (23.1%) | 72 (25.9%) |
| 15 to 19 Minutes | 31 (12.1%) | 47 (16.9%) |
| 20 to 24 Minutes | 40 (15.6%) | 38 (13.7%) |
| 25 to 29 Minutes | 8 (3.1%) | 3 (1.1%) |
| 30 to 34 Minutes | 10 (3.9%) | 2 (0.7%) |
| 35 to 39 Minutes | 0 (0.0%) | 8 (2.9%) |
| 40 to 44 Minutes | 4 (1.6%) | 0 (0.0%) |
| 45 to 59 Minutes | 12 (4.7%) | 16 (5.8%) |
| 60 to 89 Minutes | 9 (3.5%) | 0 (0.0%) |
| 90 or more Minutes | 8 (3.1%) | 0 (0.0%) |
Time of Departure to Work by Sex in Duncansville borough
The most frequent times of departure to work in Duncansville borough are 7:30 AM to 7:59 AM (51, 19.9%) for males and 8:30 AM to 8:59 AM (59, 21.2%) for females.
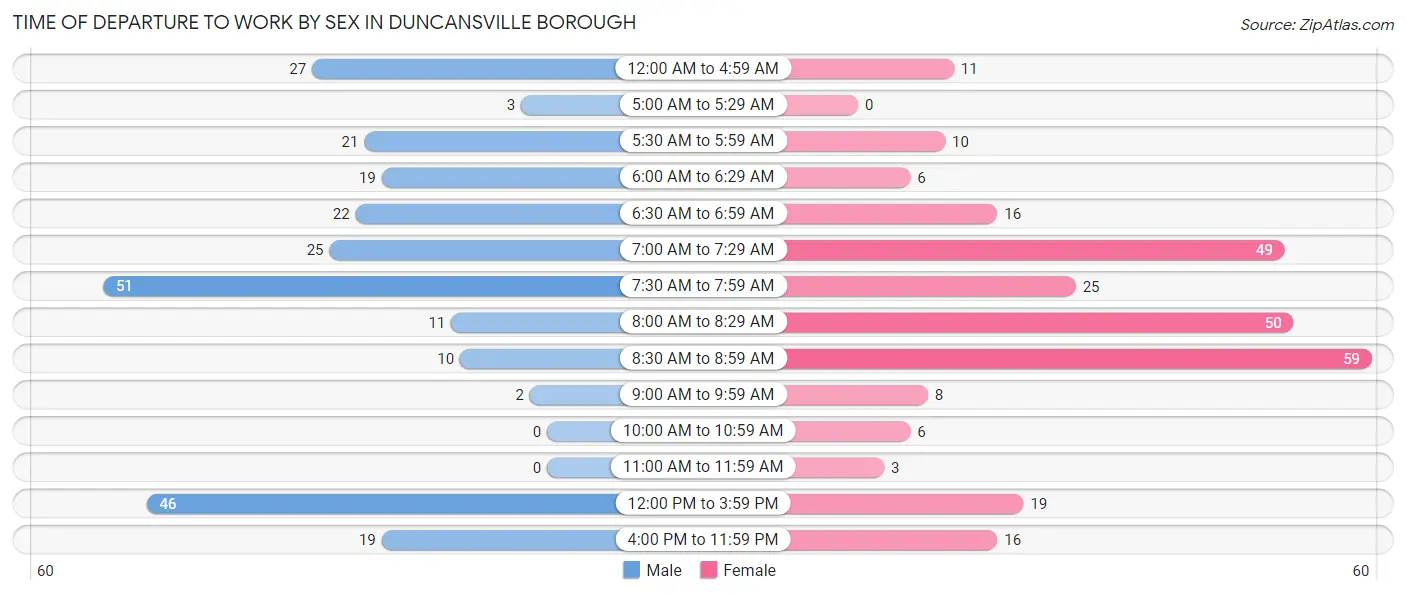
| Time of Departure | Male | Female |
| 12:00 AM to 4:59 AM | 27 (10.5%) | 11 (4.0%) |
| 5:00 AM to 5:29 AM | 3 (1.2%) | 0 (0.0%) |
| 5:30 AM to 5:59 AM | 21 (8.2%) | 10 (3.6%) |
| 6:00 AM to 6:29 AM | 19 (7.4%) | 6 (2.2%) |
| 6:30 AM to 6:59 AM | 22 (8.6%) | 16 (5.8%) |
| 7:00 AM to 7:29 AM | 25 (9.8%) | 49 (17.6%) |
| 7:30 AM to 7:59 AM | 51 (19.9%) | 25 (9.0%) |
| 8:00 AM to 8:29 AM | 11 (4.3%) | 50 (18.0%) |
| 8:30 AM to 8:59 AM | 10 (3.9%) | 59 (21.2%) |
| 9:00 AM to 9:59 AM | 2 (0.8%) | 8 (2.9%) |
| 10:00 AM to 10:59 AM | 0 (0.0%) | 6 (2.2%) |
| 11:00 AM to 11:59 AM | 0 (0.0%) | 3 (1.1%) |
| 12:00 PM to 3:59 PM | 46 (18.0%) | 19 (6.8%) |
| 4:00 PM to 11:59 PM | 19 (7.4%) | 16 (5.8%) |
| Total | 256 (100.0%) | 278 (100.0%) |
Housing Occupancy in Duncansville borough
Occupancy by Ownership in Duncansville borough
Of the total 525 dwellings in Duncansville borough, owner-occupied units account for 302 (57.5%), while renter-occupied units make up 223 (42.5%).
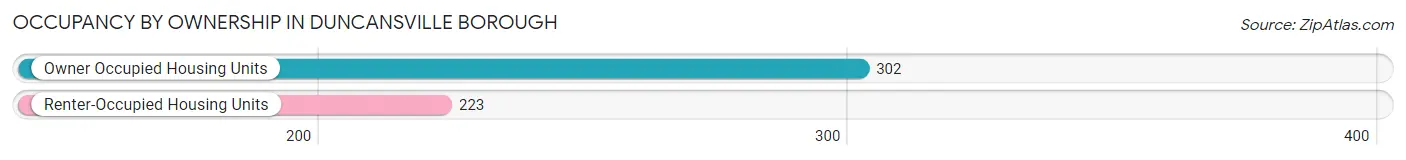
| Occupancy | # Housing Units | % Housing Units |
| Owner Occupied Housing Units | 302 | 57.5% |
| Renter-Occupied Housing Units | 223 | 42.5% |
| Total Occupied Housing Units | 525 | 100.0% |
Occupancy by Household Size in Duncansville borough
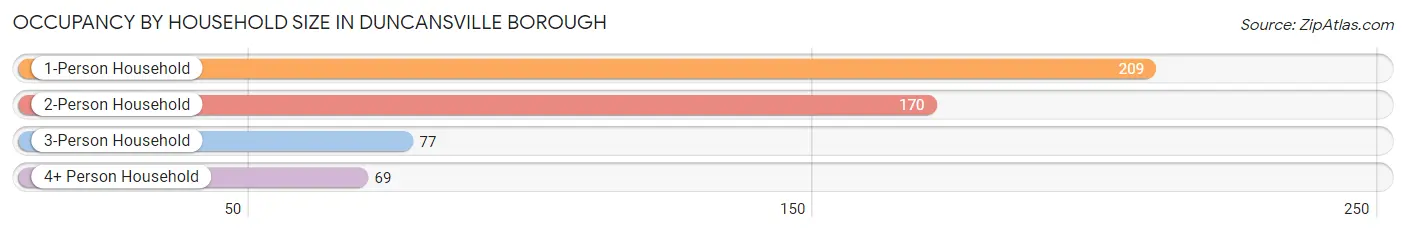
| Household Size | # Housing Units | % Housing Units |
| 1-Person Household | 209 | 39.8% |
| 2-Person Household | 170 | 32.4% |
| 3-Person Household | 77 | 14.7% |
| 4+ Person Household | 69 | 13.1% |
| Total Housing Units | 525 | 100.0% |
Occupancy by Ownership by Household Size in Duncansville borough
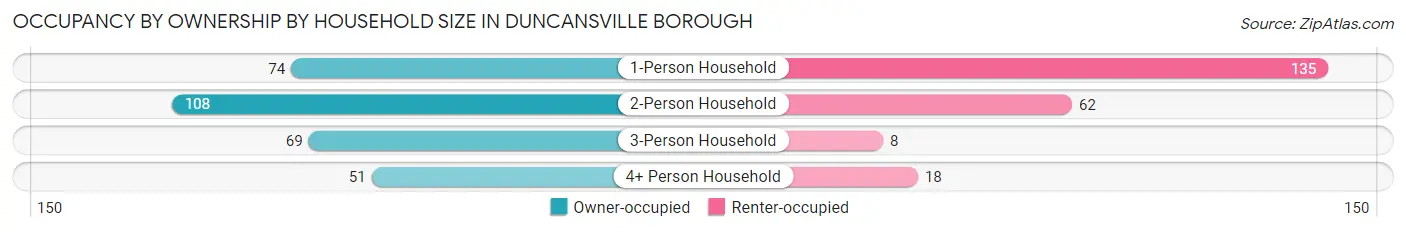
| Household Size | Owner-occupied | Renter-occupied |
| 1-Person Household | 74 (35.4%) | 135 (64.6%) |
| 2-Person Household | 108 (63.5%) | 62 (36.5%) |
| 3-Person Household | 69 (89.6%) | 8 (10.4%) |
| 4+ Person Household | 51 (73.9%) | 18 (26.1%) |
| Total Housing Units | 302 (57.5%) | 223 (42.5%) |
Occupancy by Educational Attainment in Duncansville borough
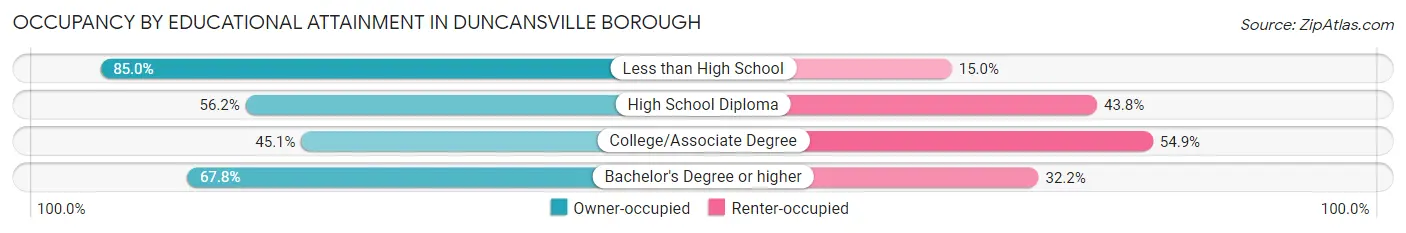
| Household Size | Owner-occupied | Renter-occupied |
| Less than High School | 17 (85.0%) | 3 (15.0%) |
| High School Diploma | 154 (56.2%) | 120 (43.8%) |
| College/Associate Degree | 51 (45.1%) | 62 (54.9%) |
| Bachelor's Degree or higher | 80 (67.8%) | 38 (32.2%) |
Occupancy by Age of Householder in Duncansville borough
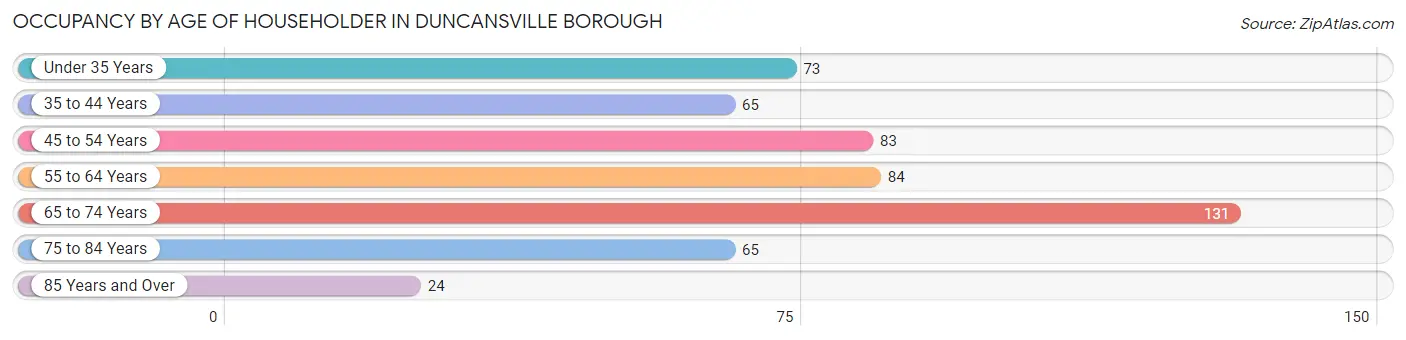
| Age Bracket | # Households | % Households |
| Under 35 Years | 73 | 13.9% |
| 35 to 44 Years | 65 | 12.4% |
| 45 to 54 Years | 83 | 15.8% |
| 55 to 64 Years | 84 | 16.0% |
| 65 to 74 Years | 131 | 24.9% |
| 75 to 84 Years | 65 | 12.4% |
| 85 Years and Over | 24 | 4.6% |
| Total | 525 | 100.0% |
Housing Finances in Duncansville borough
Median Income by Occupancy in Duncansville borough
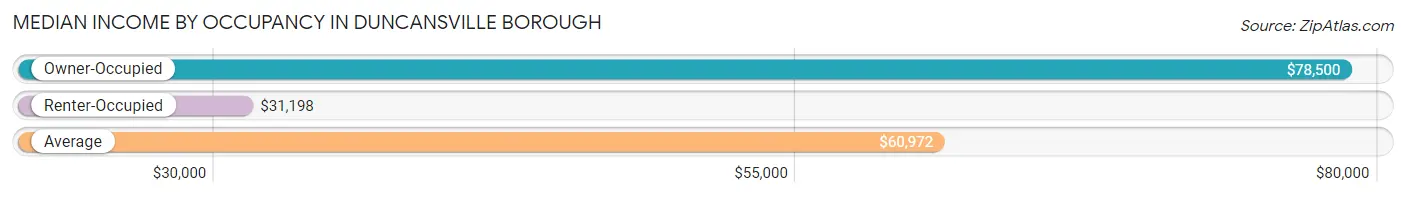
| Occupancy Type | # Households | Median Income |
| Owner-Occupied | 302 (57.5%) | $78,500 |
| Renter-Occupied | 223 (42.5%) | $31,198 |
| Average | 525 (100.0%) | $60,972 |
Occupancy by Householder Income Bracket in Duncansville borough
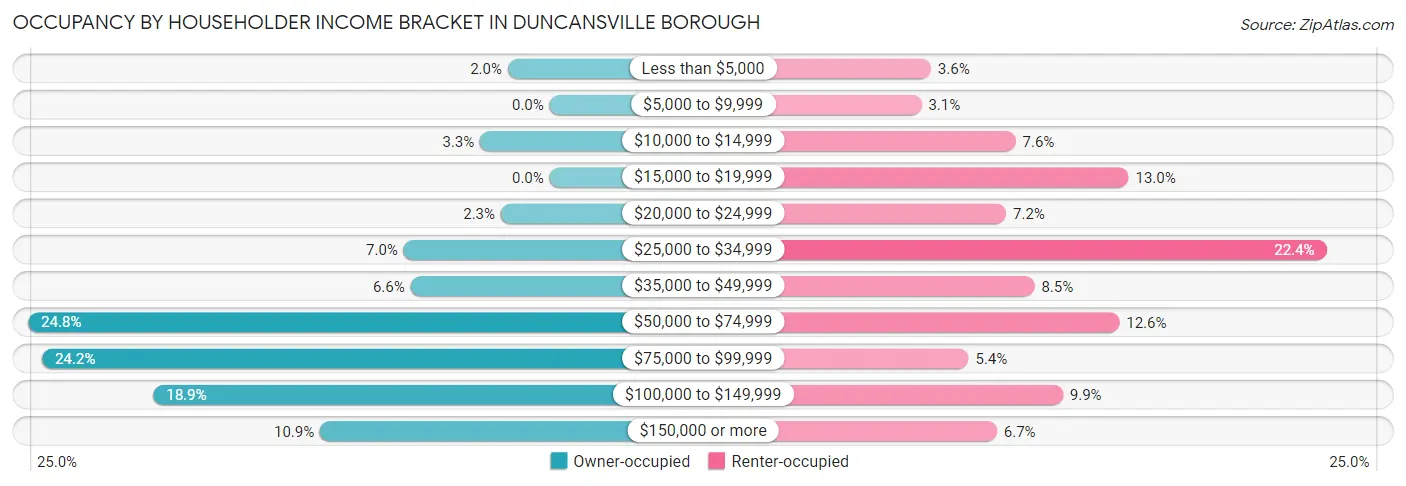
| Income Bracket | Owner-occupied | Renter-occupied |
| Less than $5,000 | 6 (2.0%) | 8 (3.6%) |
| $5,000 to $9,999 | 0 (0.0%) | 7 (3.1%) |
| $10,000 to $14,999 | 10 (3.3%) | 17 (7.6%) |
| $15,000 to $19,999 | 0 (0.0%) | 29 (13.0%) |
| $20,000 to $24,999 | 7 (2.3%) | 16 (7.2%) |
| $25,000 to $34,999 | 21 (7.0%) | 50 (22.4%) |
| $35,000 to $49,999 | 20 (6.6%) | 19 (8.5%) |
| $50,000 to $74,999 | 75 (24.8%) | 28 (12.6%) |
| $75,000 to $99,999 | 73 (24.2%) | 12 (5.4%) |
| $100,000 to $149,999 | 57 (18.9%) | 22 (9.9%) |
| $150,000 or more | 33 (10.9%) | 15 (6.7%) |
| Total | 302 (100.0%) | 223 (100.0%) |
Monthly Housing Cost Tiers in Duncansville borough
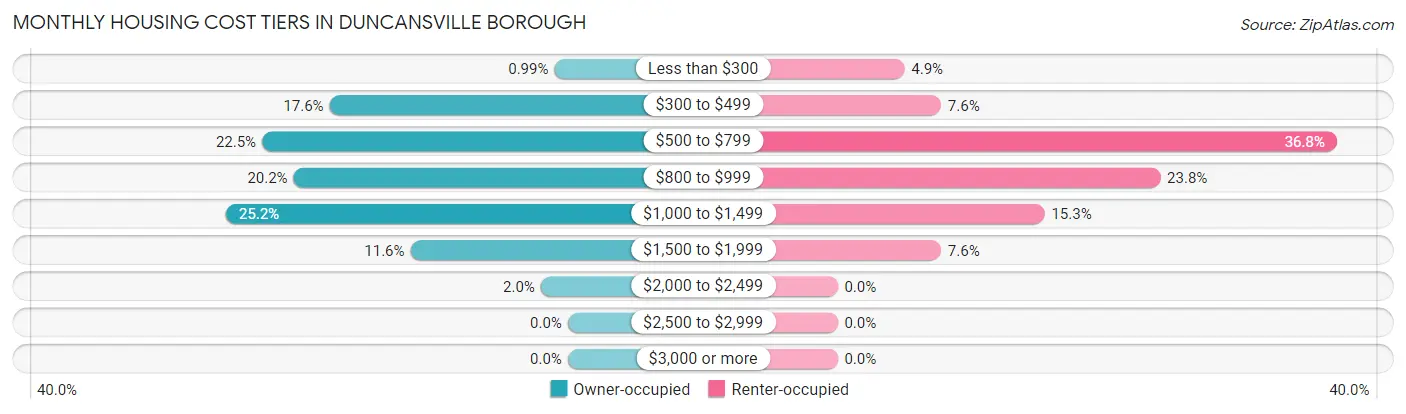
| Monthly Cost | Owner-occupied | Renter-occupied |
| Less than $300 | 3 (1.0%) | 11 (4.9%) |
| $300 to $499 | 53 (17.5%) | 17 (7.6%) |
| $500 to $799 | 68 (22.5%) | 82 (36.8%) |
| $800 to $999 | 61 (20.2%) | 53 (23.8%) |
| $1,000 to $1,499 | 76 (25.2%) | 34 (15.2%) |
| $1,500 to $1,999 | 35 (11.6%) | 17 (7.6%) |
| $2,000 to $2,499 | 6 (2.0%) | 0 (0.0%) |
| $2,500 to $2,999 | 0 (0.0%) | 0 (0.0%) |
| $3,000 or more | 0 (0.0%) | 0 (0.0%) |
| Total | 302 (100.0%) | 223 (100.0%) |
Physical Housing Characteristics in Duncansville borough
Housing Structures in Duncansville borough
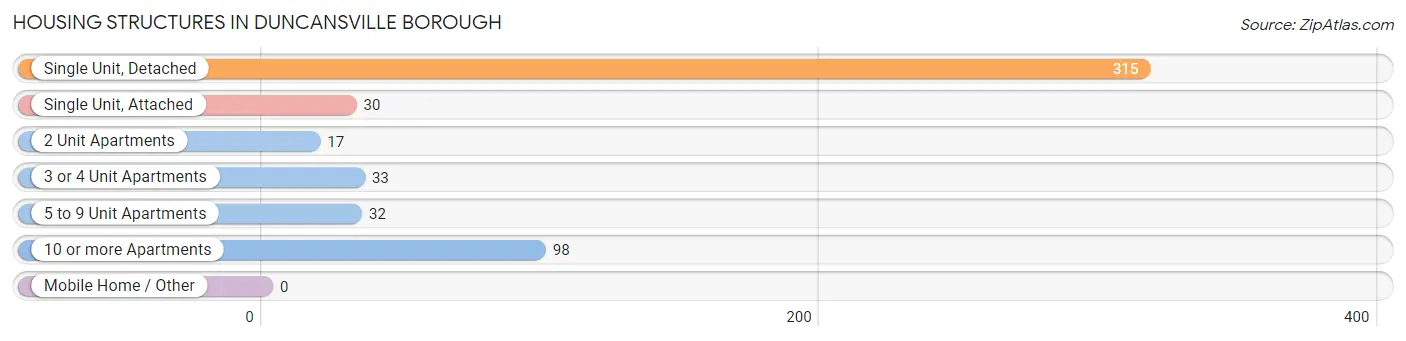
| Structure Type | # Housing Units | % Housing Units |
| Single Unit, Detached | 315 | 60.0% |
| Single Unit, Attached | 30 | 5.7% |
| 2 Unit Apartments | 17 | 3.2% |
| 3 or 4 Unit Apartments | 33 | 6.3% |
| 5 to 9 Unit Apartments | 32 | 6.1% |
| 10 or more Apartments | 98 | 18.7% |
| Mobile Home / Other | 0 | 0.0% |
| Total | 525 | 100.0% |
Housing Structures by Occupancy in Duncansville borough
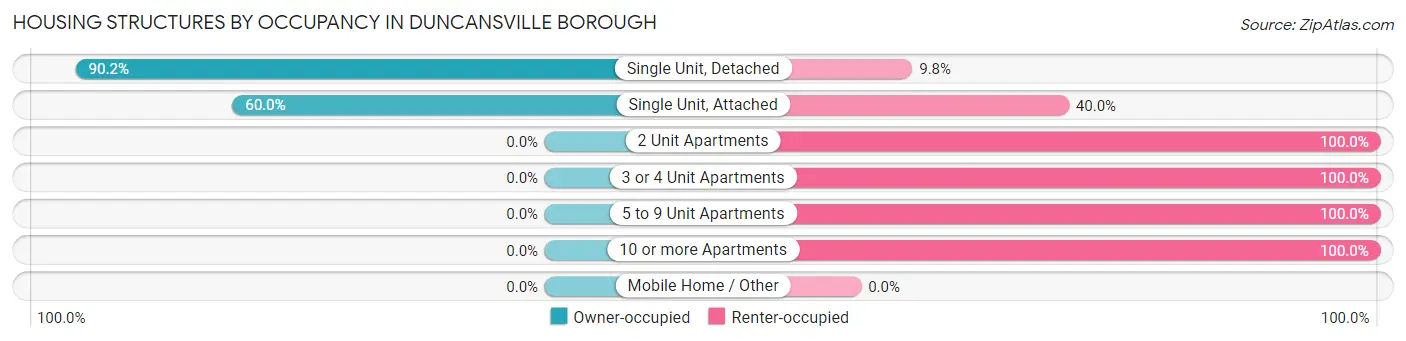
| Structure Type | Owner-occupied | Renter-occupied |
| Single Unit, Detached | 284 (90.2%) | 31 (9.8%) |
| Single Unit, Attached | 18 (60.0%) | 12 (40.0%) |
| 2 Unit Apartments | 0 (0.0%) | 17 (100.0%) |
| 3 or 4 Unit Apartments | 0 (0.0%) | 33 (100.0%) |
| 5 to 9 Unit Apartments | 0 (0.0%) | 32 (100.0%) |
| 10 or more Apartments | 0 (0.0%) | 98 (100.0%) |
| Mobile Home / Other | 0 (0.0%) | 0 (0.0%) |
| Total | 302 (57.5%) | 223 (42.5%) |
Housing Structures by Number of Rooms in Duncansville borough
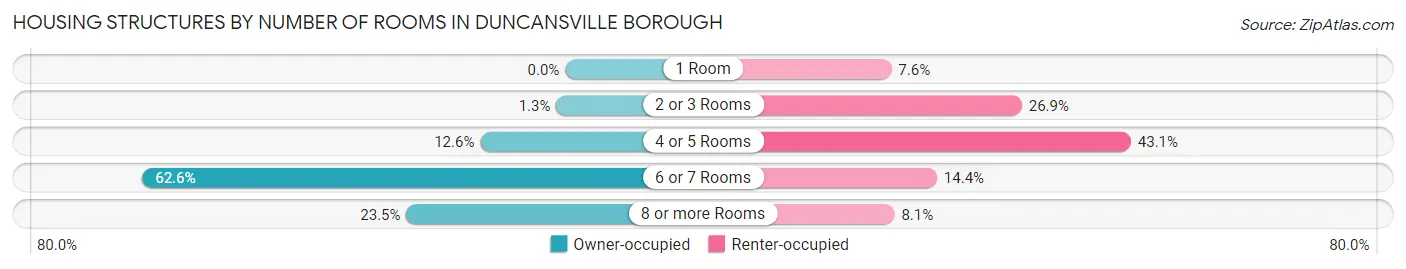
| Number of Rooms | Owner-occupied | Renter-occupied |
| 1 Room | 0 (0.0%) | 17 (7.6%) |
| 2 or 3 Rooms | 4 (1.3%) | 60 (26.9%) |
| 4 or 5 Rooms | 38 (12.6%) | 96 (43.0%) |
| 6 or 7 Rooms | 189 (62.6%) | 32 (14.3%) |
| 8 or more Rooms | 71 (23.5%) | 18 (8.1%) |
| Total | 302 (100.0%) | 223 (100.0%) |
Housing Structure by Heating Type in Duncansville borough
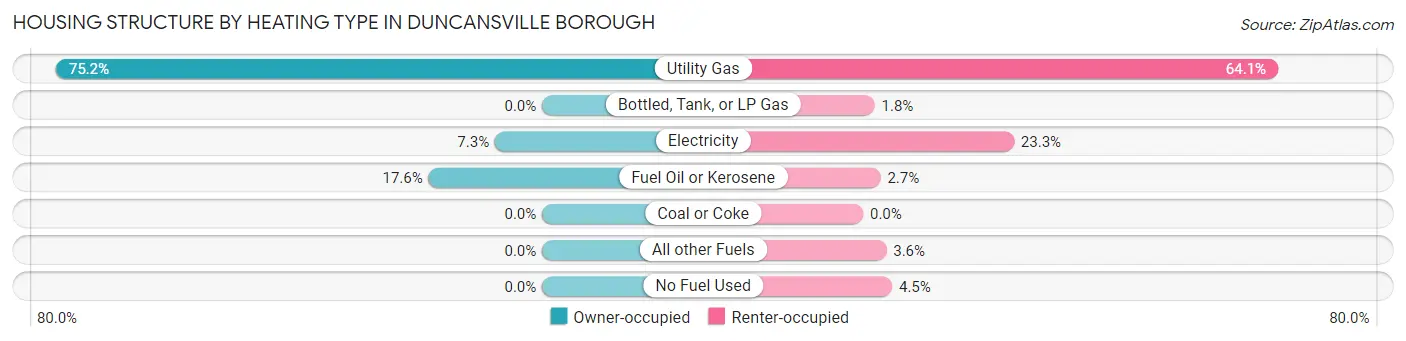
| Heating Type | Owner-occupied | Renter-occupied |
| Utility Gas | 227 (75.2%) | 143 (64.1%) |
| Bottled, Tank, or LP Gas | 0 (0.0%) | 4 (1.8%) |
| Electricity | 22 (7.3%) | 52 (23.3%) |
| Fuel Oil or Kerosene | 53 (17.5%) | 6 (2.7%) |
| Coal or Coke | 0 (0.0%) | 0 (0.0%) |
| All other Fuels | 0 (0.0%) | 8 (3.6%) |
| No Fuel Used | 0 (0.0%) | 10 (4.5%) |
| Total | 302 (100.0%) | 223 (100.0%) |
Household Vehicle Usage in Duncansville borough
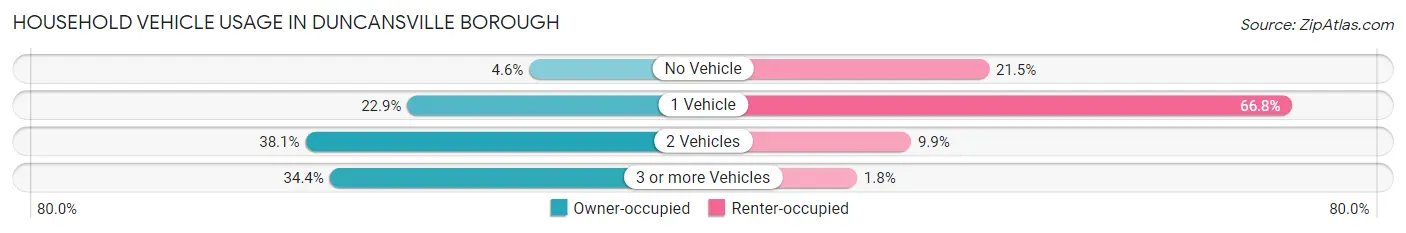
| Vehicles per Household | Owner-occupied | Renter-occupied |
| No Vehicle | 14 (4.6%) | 48 (21.5%) |
| 1 Vehicle | 69 (22.9%) | 149 (66.8%) |
| 2 Vehicles | 115 (38.1%) | 22 (9.9%) |
| 3 or more Vehicles | 104 (34.4%) | 4 (1.8%) |
| Total | 302 (100.0%) | 223 (100.0%) |
Real Estate & Mortgages in Duncansville borough
Real Estate and Mortgage Overview in Duncansville borough
| Characteristic | Without Mortgage | With Mortgage |
| Housing Units | 122 | 180 |
| Median Property Value | $134,300 | $125,000 |
| Median Household Income | $73,333 | $28 |
| Monthly Housing Costs | $515 | $0 |
| Real Estate Taxes | $1,643 | $0 |
Property Value by Mortgage Status in Duncansville borough
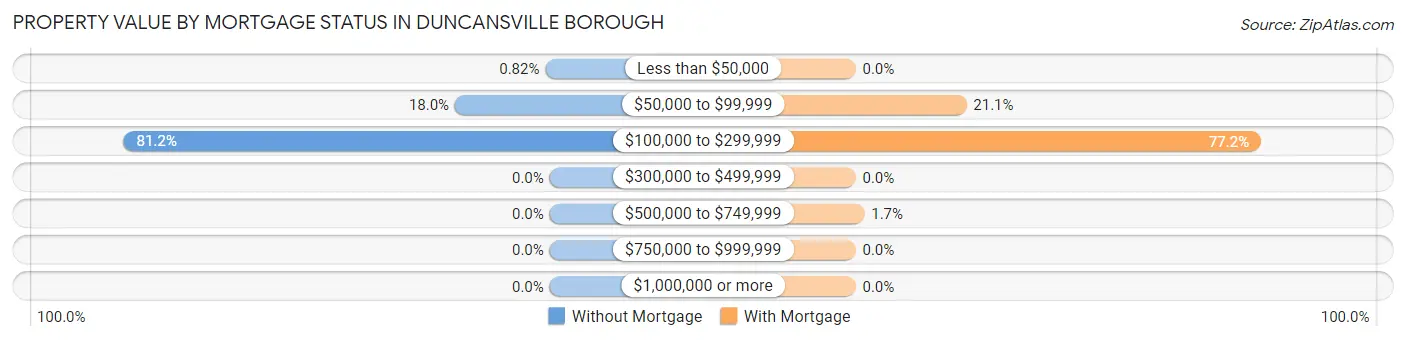
| Property Value | Without Mortgage | With Mortgage |
| Less than $50,000 | 1 (0.8%) | 0 (0.0%) |
| $50,000 to $99,999 | 22 (18.0%) | 38 (21.1%) |
| $100,000 to $299,999 | 99 (81.1%) | 139 (77.2%) |
| $300,000 to $499,999 | 0 (0.0%) | 0 (0.0%) |
| $500,000 to $749,999 | 0 (0.0%) | 3 (1.7%) |
| $750,000 to $999,999 | 0 (0.0%) | 0 (0.0%) |
| $1,000,000 or more | 0 (0.0%) | 0 (0.0%) |
| Total | 122 (100.0%) | 180 (100.0%) |
Household Income by Mortgage Status in Duncansville borough
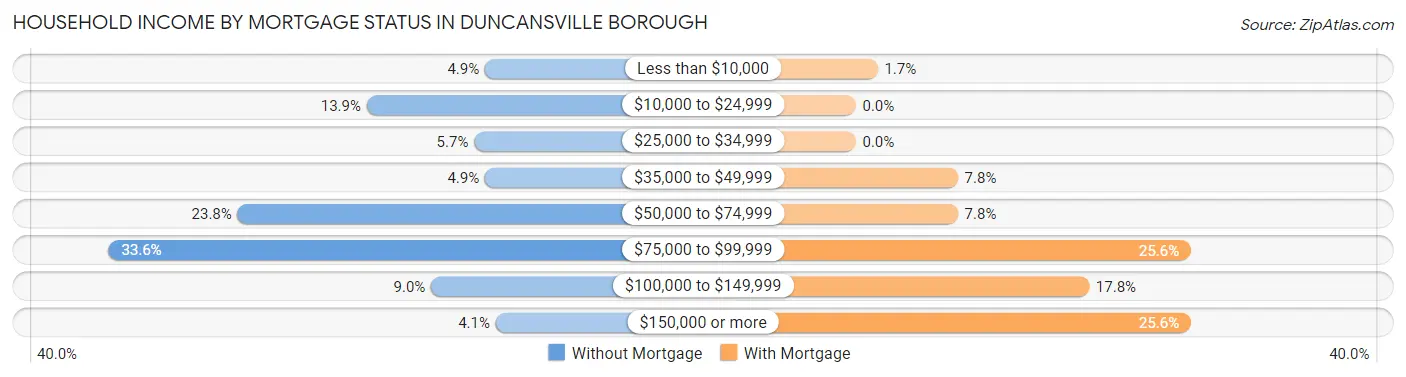
| Household Income | Without Mortgage | With Mortgage |
| Less than $10,000 | 6 (4.9%) | 3 (1.7%) |
| $10,000 to $24,999 | 17 (13.9%) | 0 (0.0%) |
| $25,000 to $34,999 | 7 (5.7%) | 0 (0.0%) |
| $35,000 to $49,999 | 6 (4.9%) | 14 (7.8%) |
| $50,000 to $74,999 | 29 (23.8%) | 14 (7.8%) |
| $75,000 to $99,999 | 41 (33.6%) | 46 (25.6%) |
| $100,000 to $149,999 | 11 (9.0%) | 32 (17.8%) |
| $150,000 or more | 5 (4.1%) | 46 (25.6%) |
| Total | 122 (100.0%) | 180 (100.0%) |
Property Value to Household Income Ratio in Duncansville borough
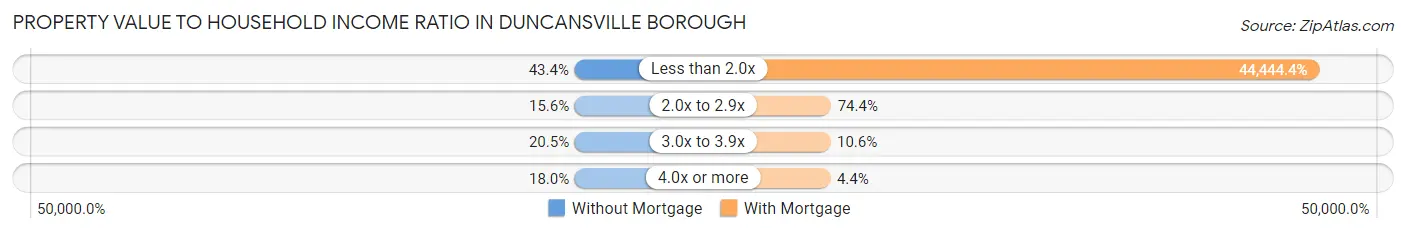
| Value-to-Income Ratio | Without Mortgage | With Mortgage |
| Less than 2.0x | 53 (43.4%) | 80,000 (44,444.4%) |
| 2.0x to 2.9x | 19 (15.6%) | 134 (74.4%) |
| 3.0x to 3.9x | 25 (20.5%) | 19 (10.6%) |
| 4.0x or more | 22 (18.0%) | 8 (4.4%) |
| Total | 122 (100.0%) | 180 (100.0%) |
Real Estate Taxes by Mortgage Status in Duncansville borough
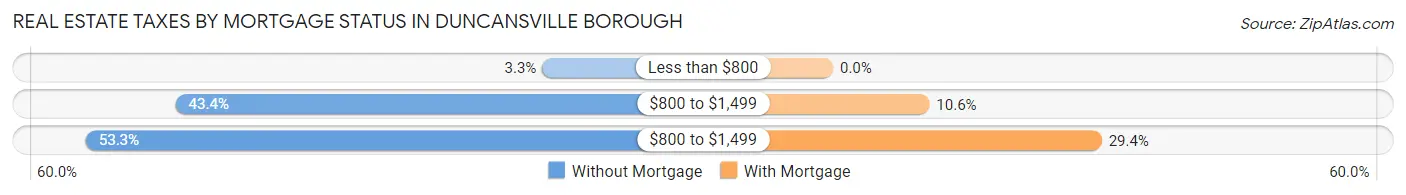
| Property Taxes | Without Mortgage | With Mortgage |
| Less than $800 | 4 (3.3%) | 0 (0.0%) |
| $800 to $1,499 | 53 (43.4%) | 19 (10.6%) |
| $800 to $1,499 | 65 (53.3%) | 53 (29.4%) |
| Total | 122 (100.0%) | 180 (100.0%) |
Health & Disability in Duncansville borough
Health Insurance Coverage by Age in Duncansville borough
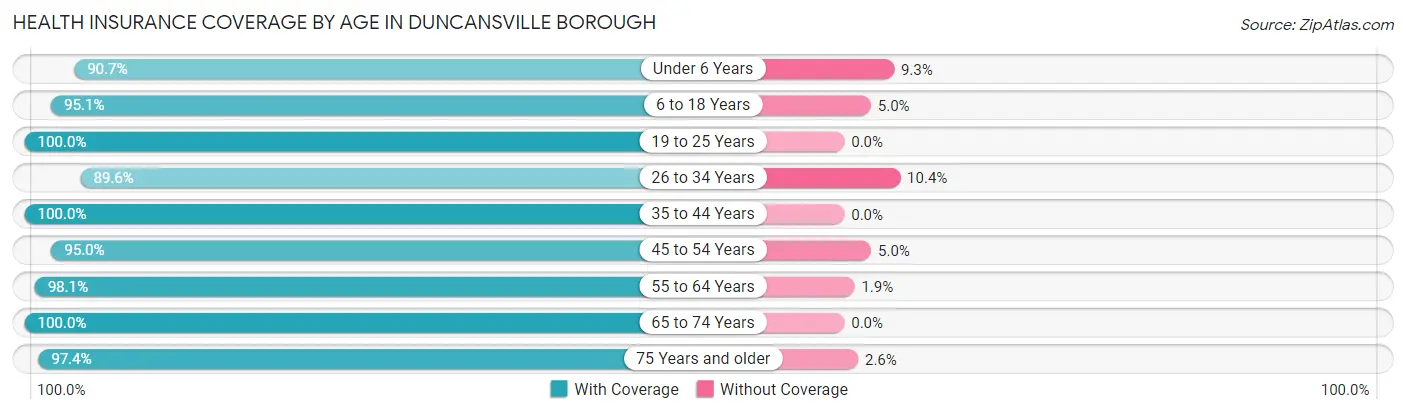
| Age Bracket | With Coverage | Without Coverage |
| Under 6 Years | 49 (90.7%) | 5 (9.3%) |
| 6 to 18 Years | 173 (95.1%) | 9 (5.0%) |
| 19 to 25 Years | 115 (100.0%) | 0 (0.0%) |
| 26 to 34 Years | 86 (89.6%) | 10 (10.4%) |
| 35 to 44 Years | 128 (100.0%) | 0 (0.0%) |
| 45 to 54 Years | 114 (95.0%) | 6 (5.0%) |
| 55 to 64 Years | 155 (98.1%) | 3 (1.9%) |
| 65 to 74 Years | 194 (100.0%) | 0 (0.0%) |
| 75 Years and older | 114 (97.4%) | 3 (2.6%) |
| Total | 1,128 (96.9%) | 36 (3.1%) |
Health Insurance Coverage by Citizenship Status in Duncansville borough
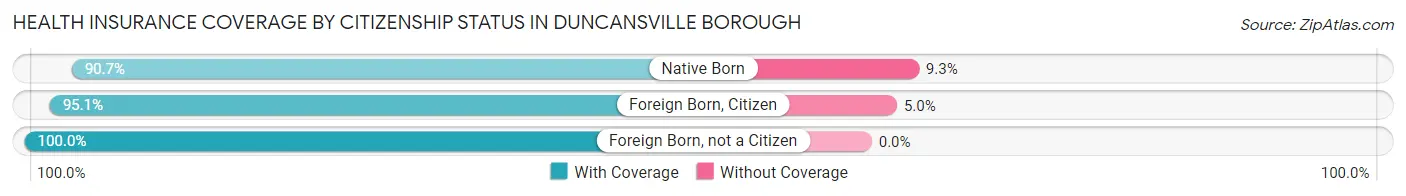
| Citizenship Status | With Coverage | Without Coverage |
| Native Born | 49 (90.7%) | 5 (9.3%) |
| Foreign Born, Citizen | 173 (95.1%) | 9 (5.0%) |
| Foreign Born, not a Citizen | 115 (100.0%) | 0 (0.0%) |
Health Insurance Coverage by Household Income in Duncansville borough
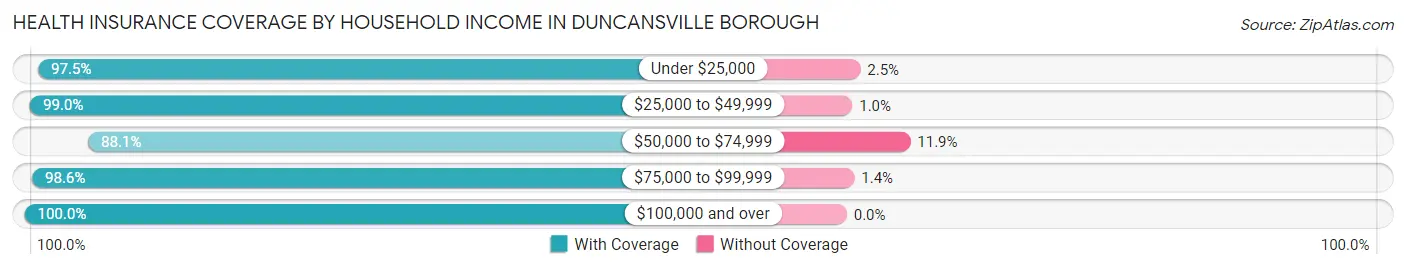
| Household Income | With Coverage | Without Coverage |
| Under $25,000 | 115 (97.5%) | 3 (2.5%) |
| $25,000 to $49,999 | 193 (99.0%) | 2 (1.0%) |
| $50,000 to $74,999 | 207 (88.1%) | 28 (11.9%) |
| $75,000 to $99,999 | 210 (98.6%) | 3 (1.4%) |
| $100,000 and over | 402 (100.0%) | 0 (0.0%) |
Public vs Private Health Insurance Coverage by Age in Duncansville borough
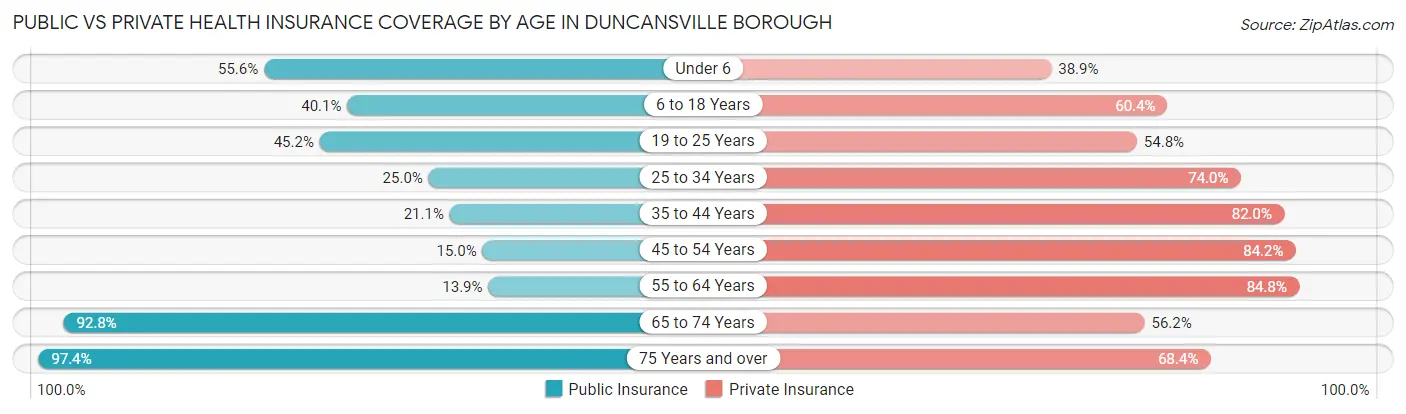
| Age Bracket | Public Insurance | Private Insurance |
| Under 6 | 30 (55.6%) | 21 (38.9%) |
| 6 to 18 Years | 73 (40.1%) | 110 (60.4%) |
| 19 to 25 Years | 52 (45.2%) | 63 (54.8%) |
| 25 to 34 Years | 24 (25.0%) | 71 (74.0%) |
| 35 to 44 Years | 27 (21.1%) | 105 (82.0%) |
| 45 to 54 Years | 18 (15.0%) | 101 (84.2%) |
| 55 to 64 Years | 22 (13.9%) | 134 (84.8%) |
| 65 to 74 Years | 180 (92.8%) | 109 (56.2%) |
| 75 Years and over | 114 (97.4%) | 80 (68.4%) |
| Total | 540 (46.4%) | 794 (68.2%) |
Disability Status by Sex by Age in Duncansville borough
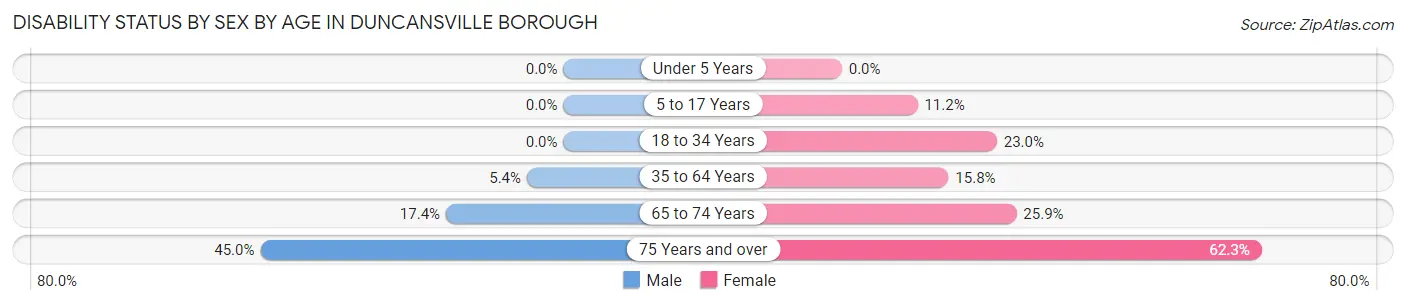
| Age Bracket | Male | Female |
| Under 5 Years | 0 (0.0%) | 0 (0.0%) |
| 5 to 17 Years | 0 (0.0%) | 10 (11.2%) |
| 18 to 34 Years | 0 (0.0%) | 32 (23.0%) |
| 35 to 64 Years | 9 (5.4%) | 38 (15.8%) |
| 65 to 74 Years | 15 (17.4%) | 28 (25.9%) |
| 75 Years and over | 18 (45.0%) | 48 (62.3%) |
Disability Class by Sex by Age in Duncansville borough
Disability Class: Hearing Difficulty
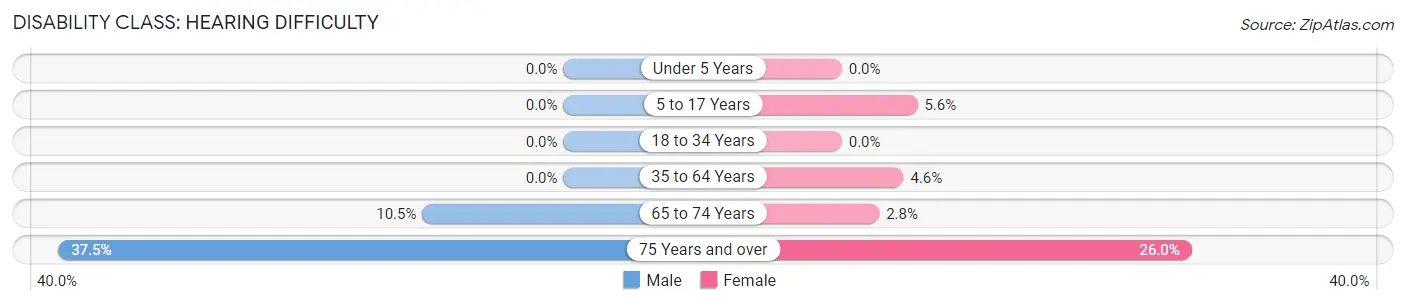
| Age Bracket | Male | Female |
| Under 5 Years | 0 (0.0%) | 0 (0.0%) |
| 5 to 17 Years | 0 (0.0%) | 5 (5.6%) |
| 18 to 34 Years | 0 (0.0%) | 0 (0.0%) |
| 35 to 64 Years | 0 (0.0%) | 11 (4.6%) |
| 65 to 74 Years | 9 (10.5%) | 3 (2.8%) |
| 75 Years and over | 15 (37.5%) | 20 (26.0%) |
Disability Class: Vision Difficulty
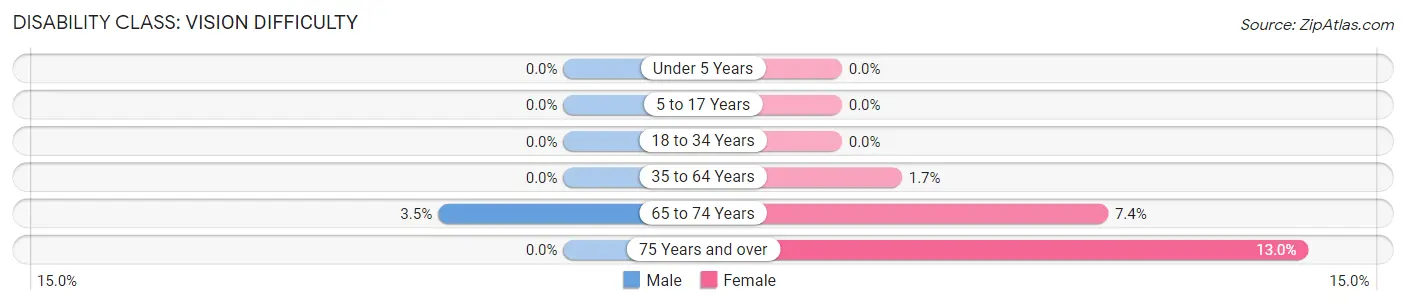
| Age Bracket | Male | Female |
| Under 5 Years | 0 (0.0%) | 0 (0.0%) |
| 5 to 17 Years | 0 (0.0%) | 0 (0.0%) |
| 18 to 34 Years | 0 (0.0%) | 0 (0.0%) |
| 35 to 64 Years | 0 (0.0%) | 4 (1.7%) |
| 65 to 74 Years | 3 (3.5%) | 8 (7.4%) |
| 75 Years and over | 0 (0.0%) | 10 (13.0%) |
Disability Class: Cognitive Difficulty
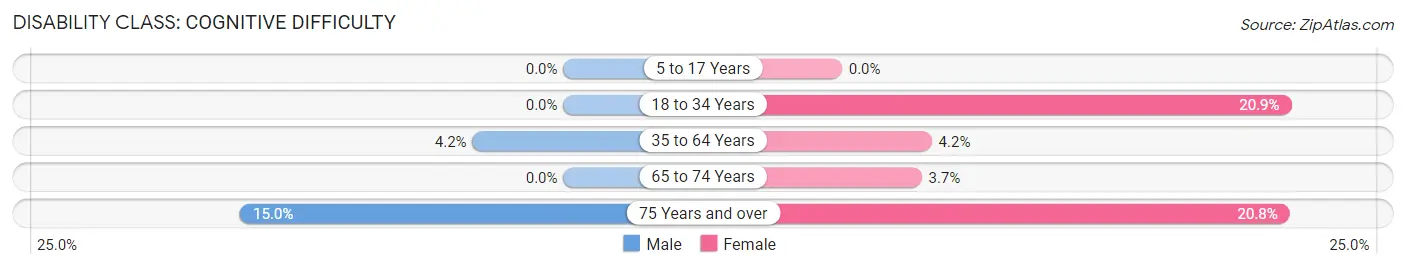
| Age Bracket | Male | Female |
| 5 to 17 Years | 0 (0.0%) | 0 (0.0%) |
| 18 to 34 Years | 0 (0.0%) | 29 (20.9%) |
| 35 to 64 Years | 7 (4.2%) | 10 (4.2%) |
| 65 to 74 Years | 0 (0.0%) | 4 (3.7%) |
| 75 Years and over | 6 (15.0%) | 16 (20.8%) |
Disability Class: Ambulatory Difficulty
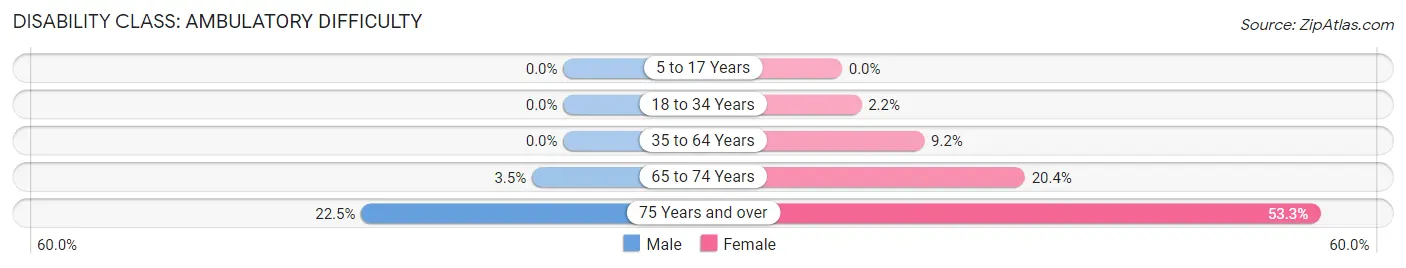
| Age Bracket | Male | Female |
| 5 to 17 Years | 0 (0.0%) | 0 (0.0%) |
| 18 to 34 Years | 0 (0.0%) | 3 (2.2%) |
| 35 to 64 Years | 0 (0.0%) | 22 (9.2%) |
| 65 to 74 Years | 3 (3.5%) | 22 (20.4%) |
| 75 Years and over | 9 (22.5%) | 41 (53.2%) |
Disability Class: Self-Care Difficulty
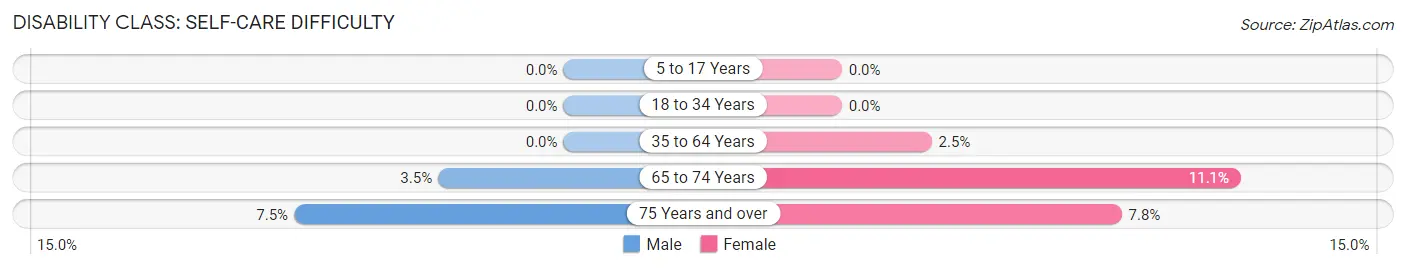
| Age Bracket | Male | Female |
| 5 to 17 Years | 0 (0.0%) | 0 (0.0%) |
| 18 to 34 Years | 0 (0.0%) | 0 (0.0%) |
| 35 to 64 Years | 0 (0.0%) | 6 (2.5%) |
| 65 to 74 Years | 3 (3.5%) | 12 (11.1%) |
| 75 Years and over | 3 (7.5%) | 6 (7.8%) |
Technology Access in Duncansville borough
Computing Device Access in Duncansville borough
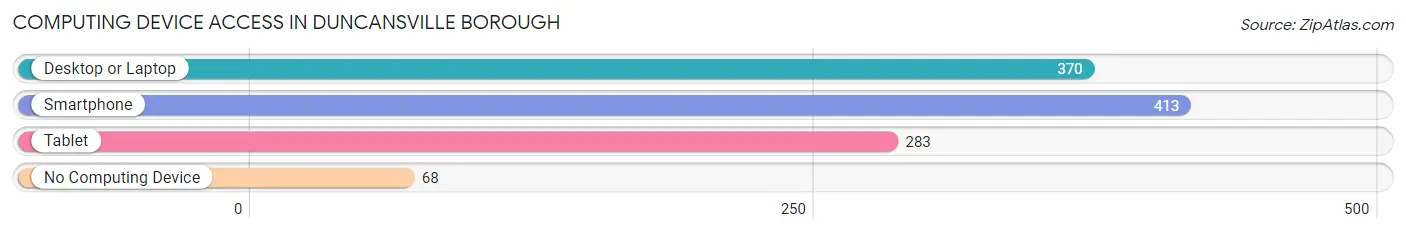
| Device Type | # Households | % Households |
| Desktop or Laptop | 370 | 70.5% |
| Smartphone | 413 | 78.7% |
| Tablet | 283 | 53.9% |
| No Computing Device | 68 | 13.0% |
| Total | 525 | 100.0% |
Internet Access in Duncansville borough
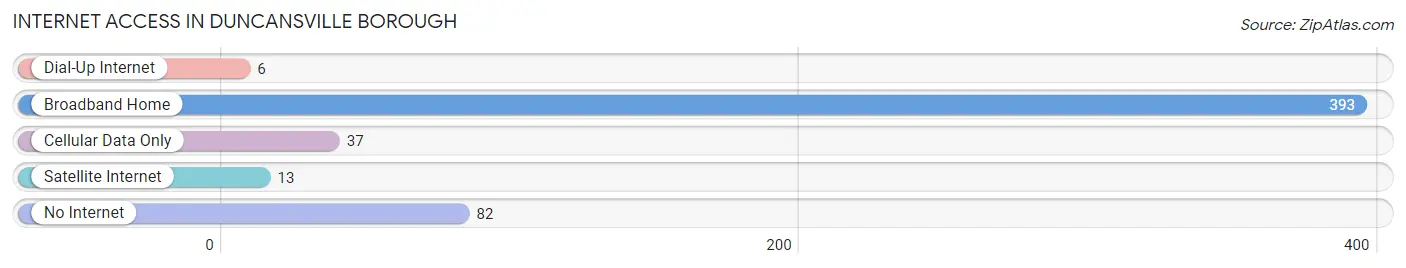
| Internet Type | # Households | % Households |
| Dial-Up Internet | 6 | 1.1% |
| Broadband Home | 393 | 74.9% |
| Cellular Data Only | 37 | 7.0% |
| Satellite Internet | 13 | 2.5% |
| No Internet | 82 | 15.6% |
| Total | 525 | 100.0% |
Duncansville borough Summary
Duncansville Borough is a small borough located in Blair County, Pennsylvania. It is situated in the Allegheny Mountains, approximately five miles east of Altoona. The borough was founded in 1876 and is named after its founder, John Duncan. As of the 2010 census, the population of Duncansville was 1,845.
History
The area that is now Duncansville was originally inhabited by the Susquehannock Indians. The first European settlers arrived in the area in the late 1700s. The first settler was John Duncan, who arrived in 1790 and established a farm. In 1876, the area was officially incorporated as a borough.
In the late 1800s, the borough began to grow and develop. The Pennsylvania Railroad opened a station in the borough in 1887, which helped to spur economic growth. The borough also became a popular tourist destination, with many visitors coming to enjoy the scenic views of the Allegheny Mountains.
In the early 1900s, Duncansville became a popular summer resort town. The borough was home to several hotels, including the Hotel Duncansville, which was built in 1906. The hotel was a popular destination for visitors from Pittsburgh and Philadelphia.
In the 1950s, the borough began to experience a decline in population. This was due to the decline of the railroad industry and the rise of the automobile. The borough also experienced a decline in tourism, as visitors began to flock to other destinations.
Geography
Duncansville is located in Blair County, Pennsylvania. It is situated in the Allegheny Mountains, approximately five miles east of Altoona. The borough is bordered by the townships of Allegheny, Frankstown, and Freedom.
The borough has a total area of 0.8 square miles, all of which is land. The terrain is mostly hilly, with some flat areas. The borough is located in a humid continental climate zone, with cold winters and hot, humid summers.
Economy
The economy of Duncansville is largely based on tourism and retail. The borough is home to several small businesses, including restaurants, shops, and hotels. The borough also has a few industrial businesses, including a manufacturing plant and a lumber mill.
The borough is also home to several large employers, including the Altoona Regional Health System, the Altoona Area School District, and the Altoona Area Public Library.
Demographics
As of the 2010 census, the population of Duncansville was 1,845. The racial makeup of the borough was 97.3% White, 0.9% African American, 0.2% Native American, 0.3% Asian, and 1.3% from other races. Hispanic or Latino of any race were 1.3% of the population.
The median household income in the borough was $41,944, and the median family income was $50,000. The per capita income was $20,945. About 8.3% of families and 10.2% of the population were below the poverty line.
Common Questions
What is the Total Population of Duncansville borough?
Total Population of Duncansville borough is 1,164.
What is the Total Male Population of Duncansville borough?
Total Male Population of Duncansville borough is 511.
What is the Total Female Population of Duncansville borough?
Total Female Population of Duncansville borough is 653.
What is the Ratio of Males per 100 Females in Duncansville borough?
There are 78.25 Males per 100 Females in Duncansville borough.
What is the Ratio of Females per 100 Males in Duncansville borough?
There are 127.79 Females per 100 Males in Duncansville borough.
What is the Median Population Age in Duncansville borough?
Median Population Age in Duncansville borough is 45.3 Years.
What is the Average Family Size in Duncansville borough
Average Family Size in Duncansville borough is 2.9 People.
What is the Average Household Size in Duncansville borough
Average Household Size in Duncansville borough is 2.2 People.
What is Per Capita Income in Duncansville borough?
Per Capita income in Duncansville borough is $35,909.
What is the Median Family Income in Duncansville borough?
Median Family Income in Duncansville borough is $79,583.
What is the Median Household income in Duncansville borough?
Median Household Income in Duncansville borough is $60,972.
What is Income or Wage Gap in Duncansville borough?
Income or Wage Gap in Duncansville borough is 39.0%.
Women in Duncansville borough earn 61.0 cents for every dollar earned by a man.
What is Inequality or Gini Index in Duncansville borough?
Inequality or Gini Index in Duncansville borough is 0.43.
How Large is the Labor Force in Duncansville borough?
There are 635 People in the Labor Forcein in Duncansville borough.
What is the Percentage of People in the Labor Force in Duncansville borough?
64.0% of People are in the Labor Force in Duncansville borough.
What is the Unemployment Rate in Duncansville borough?
Unemployment Rate in Duncansville borough is 9.8%.