Cities with the Lowest Child Poverty Level Among Boys Under the Age of 16 in Oregon
RELATED REPORTS & OPTIONS
Lowest Poverty | Boys 0-16
Oregon
Compare Cities
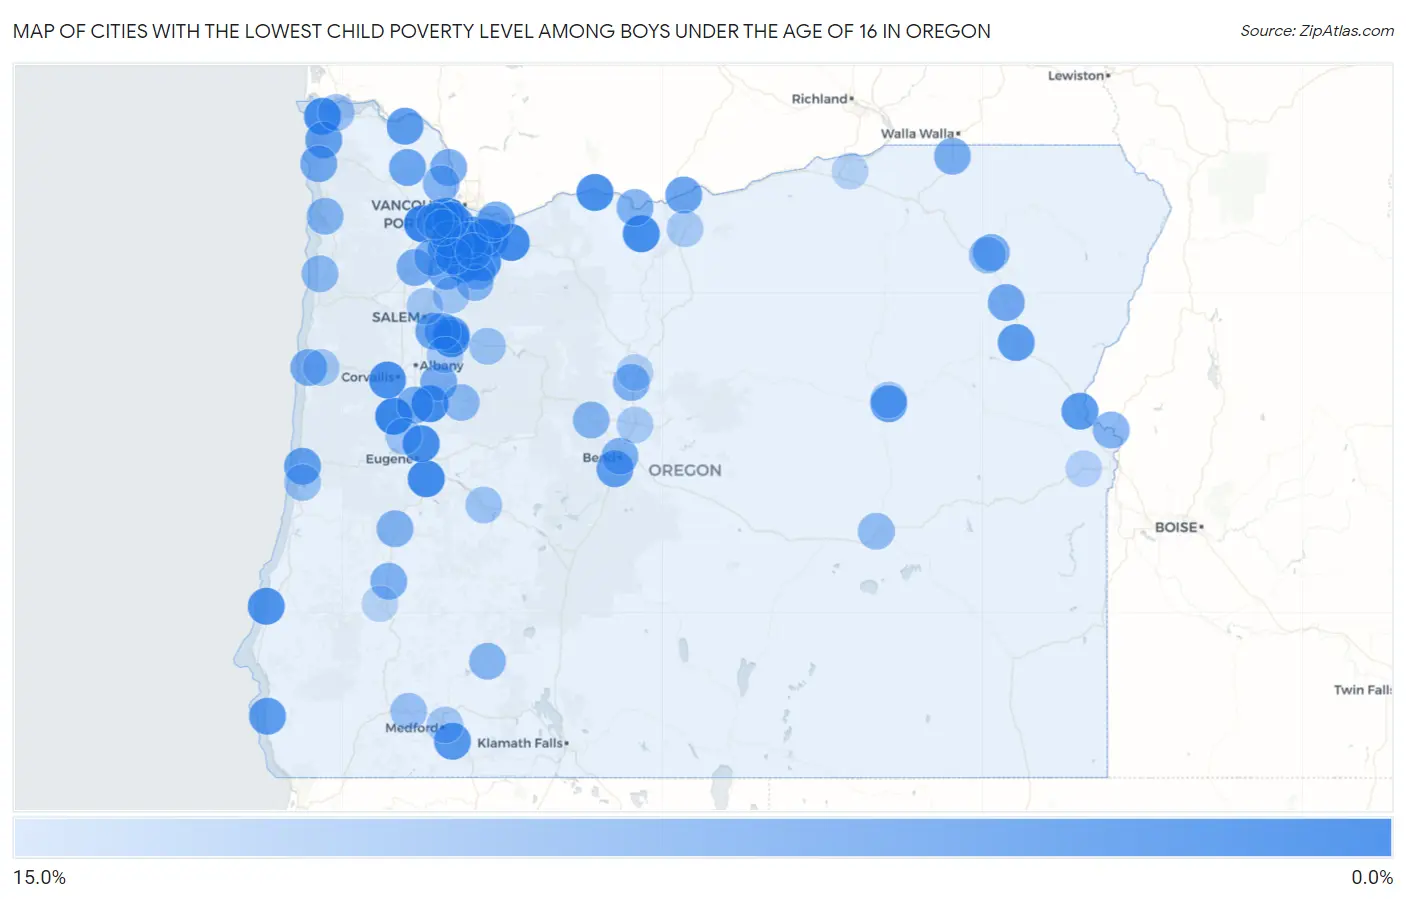
Map of Cities with the Lowest Child Poverty Level Among Boys Under the Age of 16 in Oregon
15.0%
0.0%
Cities with the Lowest Child Poverty Level Among Boys Under the Age of 16 in Oregon
| City | Child Poverty (Boys) | vs State | vs National | |
| 1. | Cornelius | 0.52% | 14.0%(-13.5)#1 | 16.9%(-16.4)#42 |
| 2. | Canby | 0.71% | 14.0%(-13.3)#2 | 16.9%(-16.2)#84 |
| 3. | Monroe | 0.72% | 14.0%(-13.3)#3 | 16.9%(-16.2)#86 |
| 4. | West Haven Sylvan | 1.1% | 14.0%(-12.9)#4 | 16.9%(-15.8)#212 |
| 5. | Damascus | 1.4% | 14.0%(-12.6)#5 | 16.9%(-15.5)#331 |
| 6. | Oatfield | 1.4% | 14.0%(-12.6)#6 | 16.9%(-15.5)#345 |
| 7. | Brownsville | 1.6% | 14.0%(-12.4)#7 | 16.9%(-15.3)#410 |
| 8. | Creswell | 1.7% | 14.0%(-12.3)#8 | 16.9%(-15.2)#480 |
| 9. | Bethany | 1.8% | 14.0%(-12.2)#9 | 16.9%(-15.1)#506 |
| 10. | Sandy | 1.8% | 14.0%(-12.2)#10 | 16.9%(-15.1)#507 |
| 11. | Dufur | 1.9% | 14.0%(-12.1)#11 | 16.9%(-15.0)#591 |
| 12. | Coburg | 2.1% | 14.0%(-11.9)#12 | 16.9%(-14.8)#697 |
| 13. | Philomath | 2.3% | 14.0%(-11.7)#13 | 16.9%(-14.6)#788 |
| 14. | Beavercreek | 2.3% | 14.0%(-11.7)#14 | 16.9%(-14.6)#818 |
| 15. | Warrenton | 2.4% | 14.0%(-11.6)#15 | 16.9%(-14.5)#858 |
| 16. | Milwaukie | 2.5% | 14.0%(-11.4)#16 | 16.9%(-14.4)#955 |
| 17. | Hood River | 2.7% | 14.0%(-11.3)#17 | 16.9%(-14.2)#1,038 |
| 18. | Stayton | 2.8% | 14.0%(-11.2)#18 | 16.9%(-14.1)#1,102 |
| 19. | Garden Home Whitford | 2.9% | 14.0%(-11.1)#19 | 16.9%(-14.0)#1,151 |
| 20. | Bandon | 3.0% | 14.0%(-11.0)#20 | 16.9%(-13.9)#1,240 |
| 21. | Lake Oswego | 3.7% | 14.0%(-10.3)#21 | 16.9%(-13.2)#1,669 |
| 22. | Talent | 4.0% | 14.0%(-9.96)#22 | 16.9%(-12.9)#1,841 |
| 23. | West Linn | 4.1% | 14.0%(-9.89)#23 | 16.9%(-12.8)#1,882 |
| 24. | Huntington | 4.2% | 14.0%(-9.83)#24 | 16.9%(-12.7)#1,905 |
| 25. | Gold Beach | 4.5% | 14.0%(-9.45)#25 | 16.9%(-12.4)#2,128 |
| 26. | Sherwood | 4.6% | 14.0%(-9.43)#26 | 16.9%(-12.3)#2,151 |
| 27. | Oak Hills | 4.6% | 14.0%(-9.39)#27 | 16.9%(-12.3)#2,168 |
| 28. | Baker City | 4.7% | 14.0%(-9.31)#28 | 16.9%(-12.2)#2,212 |
| 29. | Clatskanie | 4.7% | 14.0%(-9.25)#29 | 16.9%(-12.2)#2,239 |
| 30. | Canyon City | 5.0% | 14.0%(-9.00)#30 | 16.9%(-11.9)#2,386 |
| 31. | Sublimity | 5.0% | 14.0%(-8.97)#31 | 16.9%(-11.9)#2,416 |
| 32. | Deschutes River Woods | 5.1% | 14.0%(-8.86)#32 | 16.9%(-11.8)#2,486 |
| 33. | Florence | 5.3% | 14.0%(-8.74)#33 | 16.9%(-11.6)#2,556 |
| 34. | Gearhart | 5.5% | 14.0%(-8.54)#34 | 16.9%(-11.4)#2,689 |
| 35. | Happy Valley | 5.5% | 14.0%(-8.47)#35 | 16.9%(-11.4)#2,734 |
| 36. | Rockcreek | 5.7% | 14.0%(-8.29)#36 | 16.9%(-11.2)#2,837 |
| 37. | Turner | 5.8% | 14.0%(-8.21)#37 | 16.9%(-11.1)#2,889 |
| 38. | Rufus | 5.9% | 14.0%(-8.12)#38 | 16.9%(-11.0)#2,959 |
| 39. | Bull Mountain | 6.1% | 14.0%(-7.87)#39 | 16.9%(-10.8)#3,088 |
| 40. | Donald | 6.2% | 14.0%(-7.75)#40 | 16.9%(-10.7)#3,145 |
| 41. | Vernonia | 6.3% | 14.0%(-7.66)#41 | 16.9%(-10.6)#3,218 |
| 42. | Durham | 6.5% | 14.0%(-7.49)#42 | 16.9%(-10.4)#3,320 |
| 43. | North Powder | 6.8% | 14.0%(-7.18)#43 | 16.9%(-10.1)#3,502 |
| 44. | Cannon Beach | 7.1% | 14.0%(-6.86)#44 | 16.9%(-9.76)#3,690 |
| 45. | Troutdale | 7.2% | 14.0%(-6.79)#45 | 16.9%(-9.70)#3,736 |
| 46. | Lebanon | 7.3% | 14.0%(-6.68)#46 | 16.9%(-9.59)#3,794 |
| 47. | Lafayette | 7.5% | 14.0%(-6.54)#47 | 16.9%(-9.45)#3,869 |
| 48. | Milton Freewater | 7.5% | 14.0%(-6.47)#48 | 16.9%(-9.37)#3,906 |
| 49. | St Helens | 7.5% | 14.0%(-6.45)#49 | 16.9%(-9.36)#3,914 |
| 50. | Newport | 7.6% | 14.0%(-6.37)#50 | 16.9%(-9.28)#3,957 |
| 51. | Island City | 7.7% | 14.0%(-6.31)#51 | 16.9%(-9.21)#3,987 |
| 52. | Aumsville | 7.7% | 14.0%(-6.28)#52 | 16.9%(-9.19)#4,040 |
| 53. | Halsey | 7.7% | 14.0%(-6.26)#53 | 16.9%(-9.16)#4,045 |
| 54. | Tualatin | 8.2% | 14.0%(-5.81)#54 | 16.9%(-8.72)#4,277 |
| 55. | The Dalles | 8.3% | 14.0%(-5.72)#55 | 16.9%(-8.63)#4,319 |
| 56. | Newberg | 8.3% | 14.0%(-5.70)#56 | 16.9%(-8.61)#4,331 |
| 57. | Bend | 8.4% | 14.0%(-5.63)#57 | 16.9%(-8.53)#4,415 |
| 58. | Culver | 8.4% | 14.0%(-5.61)#58 | 16.9%(-8.51)#4,427 |
| 59. | Roseburg North | 8.4% | 14.0%(-5.57)#59 | 16.9%(-8.48)#4,446 |
| 60. | Yoncalla | 8.5% | 14.0%(-5.49)#60 | 16.9%(-8.39)#4,495 |
| 61. | Annex | 8.7% | 14.0%(-5.30)#61 | 16.9%(-8.21)#4,606 |
| 62. | Mulino | 9.0% | 14.0%(-5.01)#62 | 16.9%(-7.92)#4,757 |
| 63. | Scappoose | 9.1% | 14.0%(-4.93)#63 | 16.9%(-7.83)#4,789 |
| 64. | Sisters | 9.1% | 14.0%(-4.91)#64 | 16.9%(-7.81)#4,794 |
| 65. | Garibaldi | 9.1% | 14.0%(-4.91)#65 | 16.9%(-7.81)#4,807 |
| 66. | Prospect | 9.2% | 14.0%(-4.79)#66 | 16.9%(-7.69)#4,910 |
| 67. | Molalla | 9.3% | 14.0%(-4.75)#67 | 16.9%(-7.65)#4,938 |
| 68. | Tigard | 9.3% | 14.0%(-4.73)#68 | 16.9%(-7.64)#4,948 |
| 69. | River Road | 9.3% | 14.0%(-4.67)#69 | 16.9%(-7.58)#4,980 |
| 70. | Pacific City | 9.6% | 14.0%(-4.37)#70 | 16.9%(-7.28)#5,130 |
| 71. | Oak Grove | 9.8% | 14.0%(-4.20)#71 | 16.9%(-7.10)#5,228 |
| 72. | Sweet Home | 9.9% | 14.0%(-4.07)#72 | 16.9%(-6.97)#5,284 |
| 73. | Burns | 10.4% | 14.0%(-3.60)#73 | 16.9%(-6.51)#5,541 |
| 74. | Falcon Heights | 10.4% | 14.0%(-3.58)#74 | 16.9%(-6.49)#5,549 |
| 75. | La Grande | 10.5% | 14.0%(-3.52)#75 | 16.9%(-6.42)#5,596 |
| 76. | Rogue River | 11.0% | 14.0%(-3.04)#76 | 16.9%(-5.94)#5,843 |
| 77. | Astoria | 11.1% | 14.0%(-2.91)#77 | 16.9%(-5.81)#5,885 |
| 78. | Cedar Mill | 11.2% | 14.0%(-2.76)#78 | 16.9%(-5.67)#5,982 |
| 79. | Dunes City | 11.3% | 14.0%(-2.68)#79 | 16.9%(-5.58)#6,015 |
| 80. | Hillsboro | 11.4% | 14.0%(-2.65)#80 | 16.9%(-5.55)#6,025 |
| 81. | Junction City | 11.4% | 14.0%(-2.63)#81 | 16.9%(-5.53)#6,035 |
| 82. | Mill City | 11.4% | 14.0%(-2.61)#82 | 16.9%(-5.51)#6,044 |
| 83. | Wilsonville | 11.5% | 14.0%(-2.54)#83 | 16.9%(-5.44)#6,074 |
| 84. | Oregon City | 11.5% | 14.0%(-2.52)#84 | 16.9%(-5.43)#6,088 |
| 85. | Westfir | 11.6% | 14.0%(-2.37)#85 | 16.9%(-5.28)#6,168 |
| 86. | Mount Angel | 11.7% | 14.0%(-2.33)#86 | 16.9%(-5.24)#6,187 |
| 87. | Toledo | 12.1% | 14.0%(-1.94)#87 | 16.9%(-4.84)#6,409 |
| 88. | Keizer | 12.2% | 14.0%(-1.84)#88 | 16.9%(-4.75)#6,449 |
| 89. | Medford | 12.3% | 14.0%(-1.70)#89 | 16.9%(-4.60)#6,514 |
| 90. | John Day | 12.5% | 14.0%(-1.50)#90 | 16.9%(-4.40)#6,598 |
| 91. | Scio | 12.5% | 14.0%(-1.50)#91 | 16.9%(-4.40)#6,606 |
| 92. | Redmond | 12.7% | 14.0%(-1.34)#92 | 16.9%(-4.24)#6,713 |
| 93. | Moro | 12.7% | 14.0%(-1.27)#93 | 16.9%(-4.18)#6,736 |
| 94. | Santa Clara | 13.3% | 14.0%(-0.679)#94 | 16.9%(-3.59)#7,019 |
| 95. | Metolius | 13.7% | 14.0%(-0.299)#95 | 16.9%(-3.21)#7,229 |
| 96. | Vale | 13.9% | 14.0%(-0.088)#96 | 16.9%(-2.99)#7,340 |
| 97. | Hermiston | 14.1% | 14.0%(+0.118)#97 | 16.9%(-2.79)#7,430 |
| 98. | Winston | 14.2% | 14.0%(+0.180)#98 | 16.9%(-2.73)#7,454 |
| 99. | Gresham | 14.2% | 14.0%(+0.217)#99 | 16.9%(-2.69)#7,465 |
| 100. | Aloha | 14.3% | 14.0%(+0.285)#100 | 16.9%(-2.62)#7,477 |
Common Questions
What are the Top 10 Cities with the Lowest Child Poverty Level Among Boys Under the Age of 16 in Oregon?
Top 10 Cities with the Lowest Child Poverty Level Among Boys Under the Age of 16 in Oregon are:
#1
0.52%
#2
0.71%
#3
0.72%
#4
1.1%
#5
1.4%
#6
1.4%
#7
1.6%
#8
1.7%
#9
1.8%
#10
1.8%
What city has the Lowest Child Poverty Level Among Boys Under the Age of 16 in Oregon?
Cornelius has the Lowest Child Poverty Level Among Boys Under the Age of 16 in Oregon with 0.52%.
What is the Poverty Level Among Boys Under the Age of 16 in the State of Oregon?
Poverty Level Among Boys Under the Age of 16 in Oregon is 14.0%.
What is the Poverty Level Among Boys Under the Age of 16 in the United States?
Poverty Level Among Boys Under the Age of 16 in the United States is 16.9%.