Foxburg borough, PA
Foxburg borough Overview
289
TOTAL POPULATION
136
MALE POPULATION
153
FEMALE POPULATION
88.89
MALES / 100 FEMALES
112.50
FEMALES / 100 MALES
38.4
MEDIAN AGE
3.0
AVG FAMILY SIZE
2.5
AVG HOUSEHOLD SIZE
$28,145
PER CAPITA INCOME
$85,500
AVG FAMILY INCOME
$62,500
AVG HOUSEHOLD INCOME
0.32
INEQUALITY / GINI INDEX
99
LABOR FORCE [ PEOPLE ]
47.1%
PERCENT IN LABOR FORCE
19.2%
UNEMPLOYMENT RATE
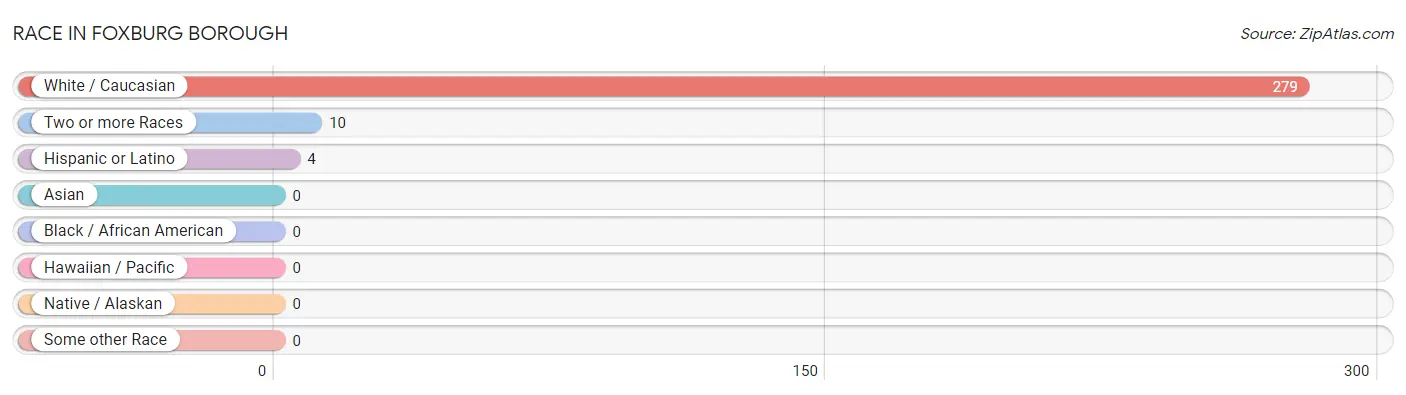
Race in Foxburg borough
The most populous races in Foxburg borough are White / Caucasian (279 | 96.5%), Two or more Races (10 | 3.5%), and Hispanic or Latino (4 | 1.4%).
| Race | # Population | % Population |
| Asian | 0 | 0.0% |
| Black / African American | 0 | 0.0% |
| Hawaiian / Pacific | 0 | 0.0% |
| Hispanic or Latino | 4 | 1.4% |
| Native / Alaskan | 0 | 0.0% |
| White / Caucasian | 279 | 96.5% |
| Two or more Races | 10 | 3.5% |
| Some other Race | 0 | 0.0% |
| Total | 289 | 100.0% |
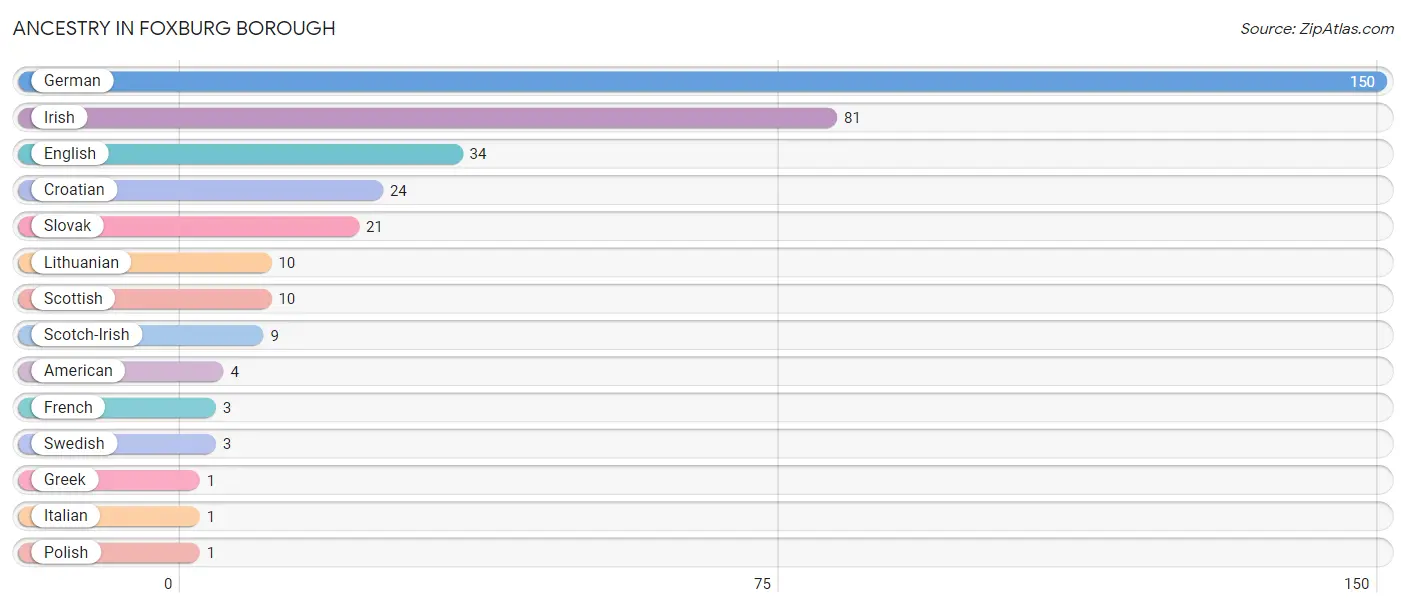
Ancestry in Foxburg borough
The most populous ancestries reported in Foxburg borough are German (150 | 51.9%), Irish (81 | 28.0%), English (34 | 11.8%), Croatian (24 | 8.3%), and Slovak (21 | 7.3%), together accounting for 107.3% of all Foxburg borough residents.
| Ancestry | # Population | % Population |
| American | 4 | 1.4% |
| Croatian | 24 | 8.3% |
| English | 34 | 11.8% |
| French | 3 | 1.0% |
| German | 150 | 51.9% |
| Greek | 1 | 0.4% |
| Irish | 81 | 28.0% |
| Italian | 1 | 0.4% |
| Lithuanian | 10 | 3.5% |
| Polish | 1 | 0.4% |
| Scotch-Irish | 9 | 3.1% |
| Scottish | 10 | 3.5% |
| Slovak | 21 | 7.3% |
| Swedish | 3 | 1.0% | View All 14 Rows |
Immigrants in Foxburg borough

| Immigration Origin | # Population | % Population | View All 0 Rows |
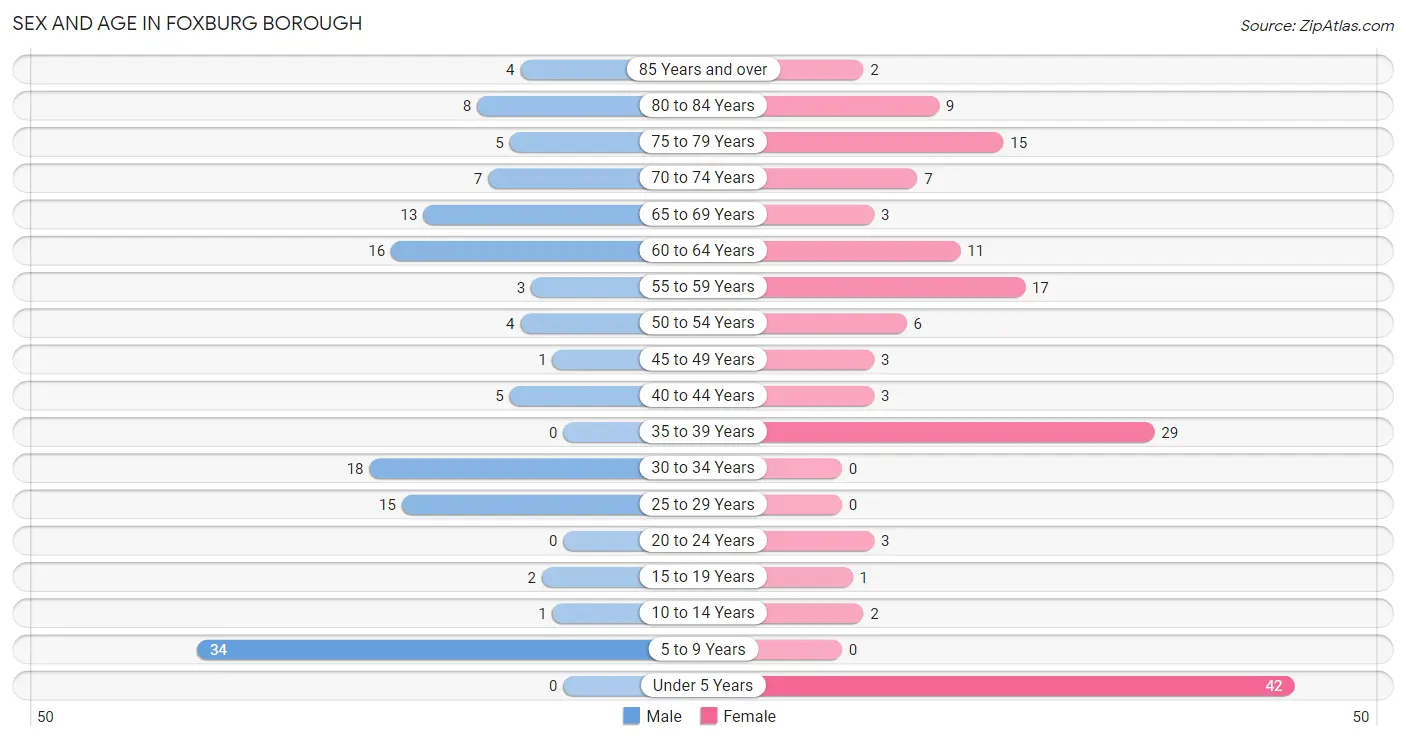
Sex and Age in Foxburg borough
Sex and Age in Foxburg borough
The most populous age groups in Foxburg borough are 5 to 9 Years (34 | 25.0%) for men and Under 5 Years (42 | 27.5%) for women.
| Age Bracket | Male | Female |
| Under 5 Years | 0 (0.0%) | 42 (27.5%) |
| 5 to 9 Years | 34 (25.0%) | 0 (0.0%) |
| 10 to 14 Years | 1 (0.7%) | 2 (1.3%) |
| 15 to 19 Years | 2 (1.5%) | 1 (0.6%) |
| 20 to 24 Years | 0 (0.0%) | 3 (2.0%) |
| 25 to 29 Years | 15 (11.0%) | 0 (0.0%) |
| 30 to 34 Years | 18 (13.2%) | 0 (0.0%) |
| 35 to 39 Years | 0 (0.0%) | 29 (19.0%) |
| 40 to 44 Years | 5 (3.7%) | 3 (2.0%) |
| 45 to 49 Years | 1 (0.7%) | 3 (2.0%) |
| 50 to 54 Years | 4 (2.9%) | 6 (3.9%) |
| 55 to 59 Years | 3 (2.2%) | 17 (11.1%) |
| 60 to 64 Years | 16 (11.8%) | 11 (7.2%) |
| 65 to 69 Years | 13 (9.6%) | 3 (2.0%) |
| 70 to 74 Years | 7 (5.1%) | 7 (4.6%) |
| 75 to 79 Years | 5 (3.7%) | 15 (9.8%) |
| 80 to 84 Years | 8 (5.9%) | 9 (5.9%) |
| 85 Years and over | 4 (2.9%) | 2 (1.3%) |
| Total | 136 (100.0%) | 153 (100.0%) |
Families and Households in Foxburg borough
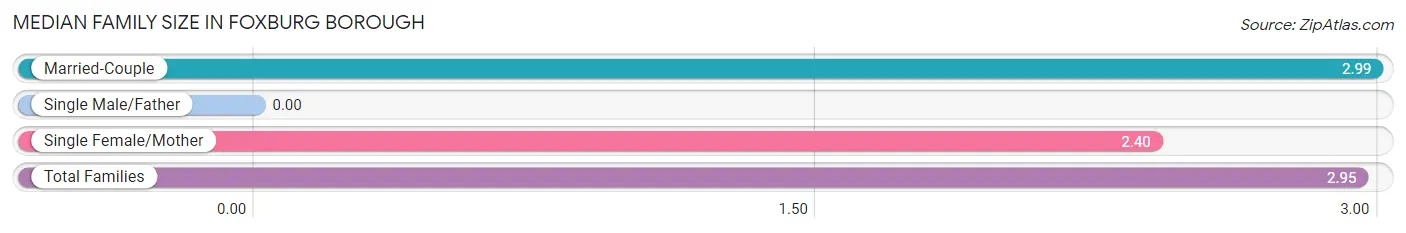
Median Family Size in Foxburg borough
| Family Type | # Families | Family Size |
| Married-Couple | 77 (93.9%) | 2.99 |
| Single Male/Father | 0 (0.0%) | - |
| Single Female/Mother | 5 (6.1%) | 2.40 |
| Total Families | 82 (100.0%) | 2.95 |
Median Household Size in Foxburg borough
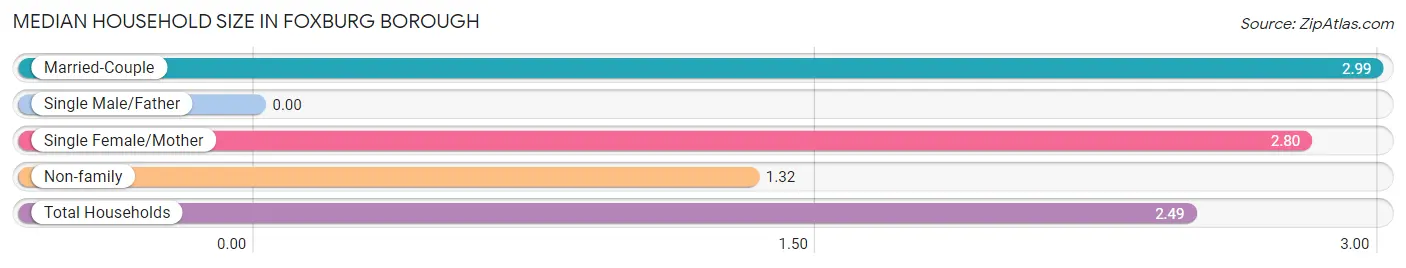
| Household Type | # Households | Household Size |
| Married-Couple | 77 (66.4%) | 2.99 |
| Single Male/Father | 0 (0.0%) | - |
| Single Female/Mother | 5 (4.3%) | 2.80 |
| Non-family | 34 (29.3%) | 1.32 |
| Total Households | 116 (100.0%) | 2.49 |
Household Size by Marriage Status in Foxburg borough
Out of a total of 116 households in Foxburg borough, 82 (70.7%) are family households, while 34 (29.3%) are nonfamily households. The most numerous type of family households are 2-person households, comprising 37, and the most common type of nonfamily households are 1-person households, comprising 22.
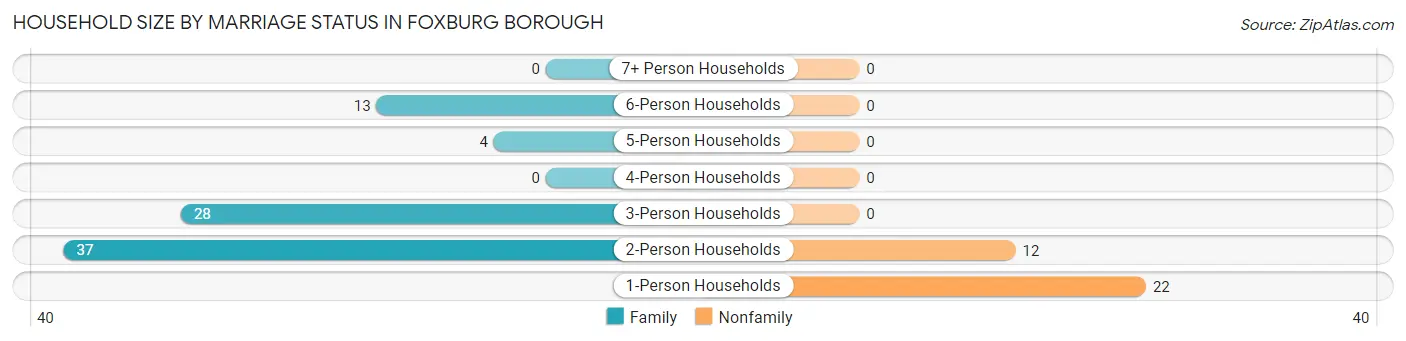
| Household Size | Family Households | Nonfamily Households |
| 1-Person Households | - | 22 (19.0%) |
| 2-Person Households | 37 (31.9%) | 12 (10.3%) |
| 3-Person Households | 28 (24.1%) | 0 (0.0%) |
| 4-Person Households | 0 (0.0%) | 0 (0.0%) |
| 5-Person Households | 4 (3.5%) | 0 (0.0%) |
| 6-Person Households | 13 (11.2%) | 0 (0.0%) |
| 7+ Person Households | 0 (0.0%) | 0 (0.0%) |
| Total | 82 (70.7%) | 34 (29.3%) |
Female Fertility in Foxburg borough
Fertility by Age in Foxburg borough
Average fertility rate in Foxburg borough is 333.0 births per 1,000 women. Women in the age bracket of 35 to 50 years have the highest fertility rate with 368.0 births per 1,000 women. Women in the age bracket of 35 to 50 years acount for 100.0% of all women with births.
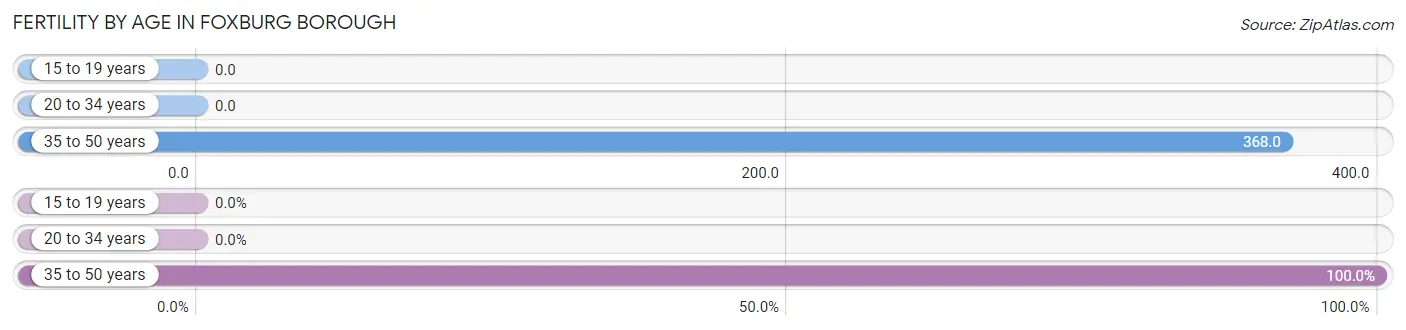
| Age Bracket | Women with Births | Births / 1,000 Women |
| 15 to 19 years | 0 (0.0%) | 0.0 |
| 20 to 34 years | 0 (0.0%) | 0.0 |
| 35 to 50 years | 14 (100.0%) | 368.0 |
| Total | 14 (100.0%) | 333.0 |
Fertility by Age by Marriage Status in Foxburg borough
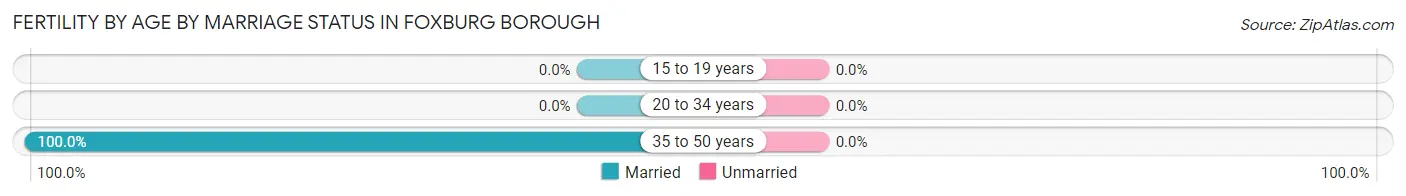
| Age Bracket | Married | Unmarried |
| 15 to 19 years | 0 (0.0%) | 0 (0.0%) |
| 20 to 34 years | 0 (0.0%) | 0 (0.0%) |
| 35 to 50 years | 14 (100.0%) | 0 (0.0%) |
| Total | 14 (100.0%) | 0 (0.0%) |
Fertility by Education in Foxburg borough
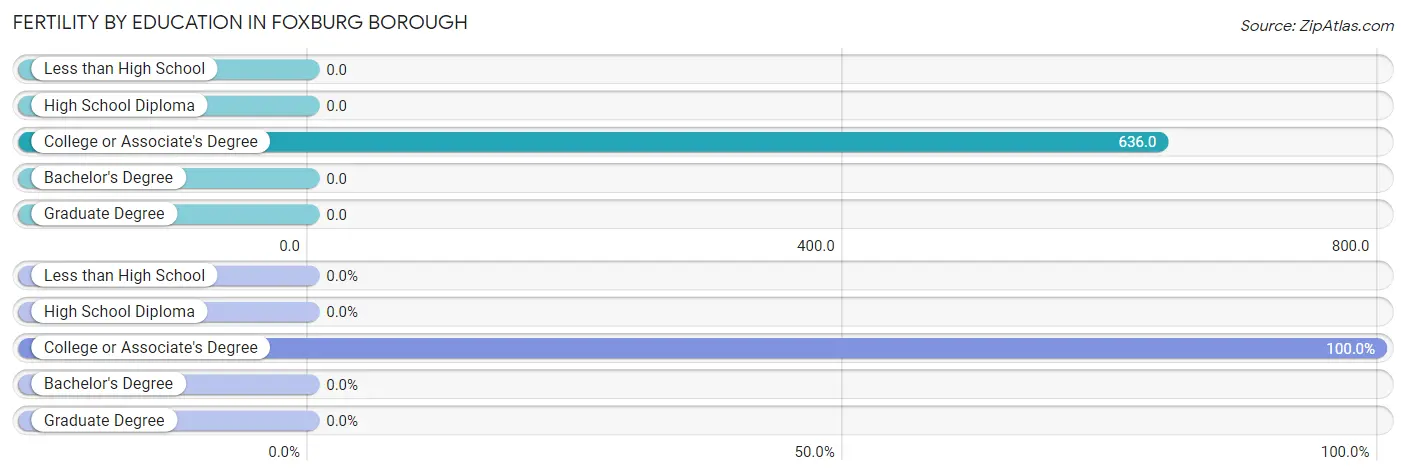
| Educational Attainment | Women with Births | Births / 1,000 Women |
| Less than High School | 0 (0.0%) | 0.0 |
| High School Diploma | 0 (0.0%) | 0.0 |
| College or Associate's Degree | 14 (100.0%) | 636.0 |
| Bachelor's Degree | 0 (0.0%) | 0.0 |
| Graduate Degree | 0 (0.0%) | 0.0 |
| Total | 14 (100.0%) | 333.0 |
Fertility by Education by Marriage Status in Foxburg borough
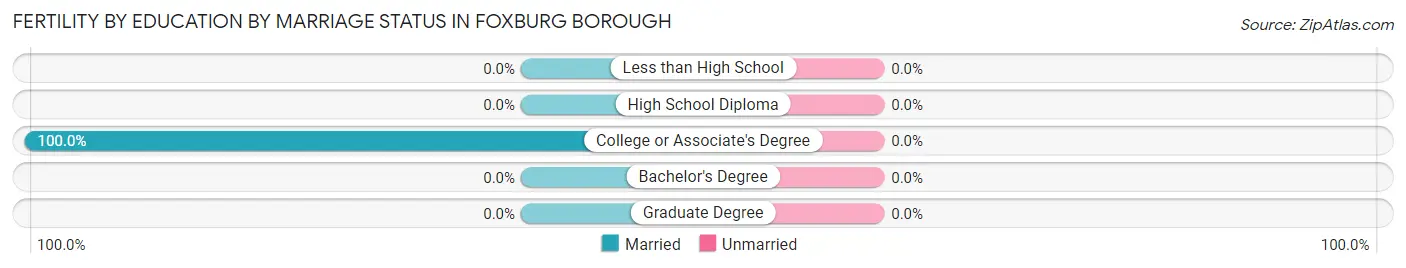
| Educational Attainment | Married | Unmarried |
| Less than High School | 0 (0.0%) | 0 (0.0%) |
| High School Diploma | 0 (0.0%) | 0 (0.0%) |
| College or Associate's Degree | 14 (100.0%) | 0 (0.0%) |
| Bachelor's Degree | 0 (0.0%) | 0 (0.0%) |
| Graduate Degree | 0 (0.0%) | 0 (0.0%) |
| Total | 14 (100.0%) | 0 (0.0%) |
Income in Foxburg borough
Income Overview in Foxburg borough
Per Capita Income in Foxburg borough is $28,145, while median incomes of families and households are $85,500 and $62,500 respectively.
| Characteristic | Number | Measure |
| Per Capita Income | 289 | $28,145 |
| Median Family Income | 82 | $85,500 |
| Mean Family Income | 82 | $84,052 |
| Median Household Income | 116 | $62,500 |
| Mean Household Income | 116 | $69,807 |
| Income Deficit | 82 | $0 |
| Wage / Income Gap (%) | 289 | 0.00% |
| Wage / Income Gap ($) | 289 | 100.00¢ per $1 |
| Gini / Inequality Index | 289 | 0.32 |
Earnings by Sex in Foxburg borough
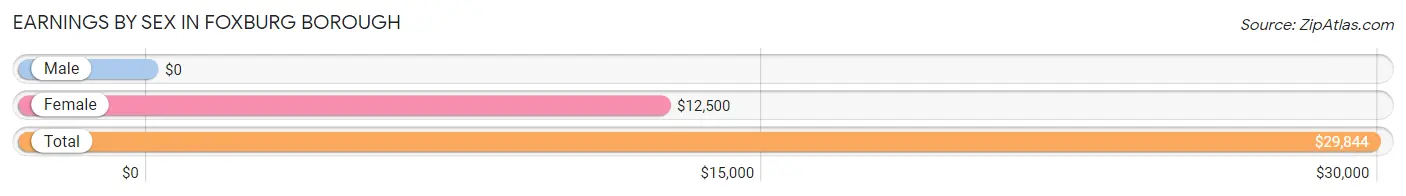
| Sex | Number | Average Earnings |
| Male | 61 (50.4%) | $0 |
| Female | 60 (49.6%) | $12,500 |
| Total | 121 (100.0%) | $29,844 |
Earnings by Sex by Income Bracket in Foxburg borough
The most common earnings brackets in Foxburg borough are $100,000+ for men (22 | 36.1%) and $10,000 to $12,499 for women (20 | 33.3%).
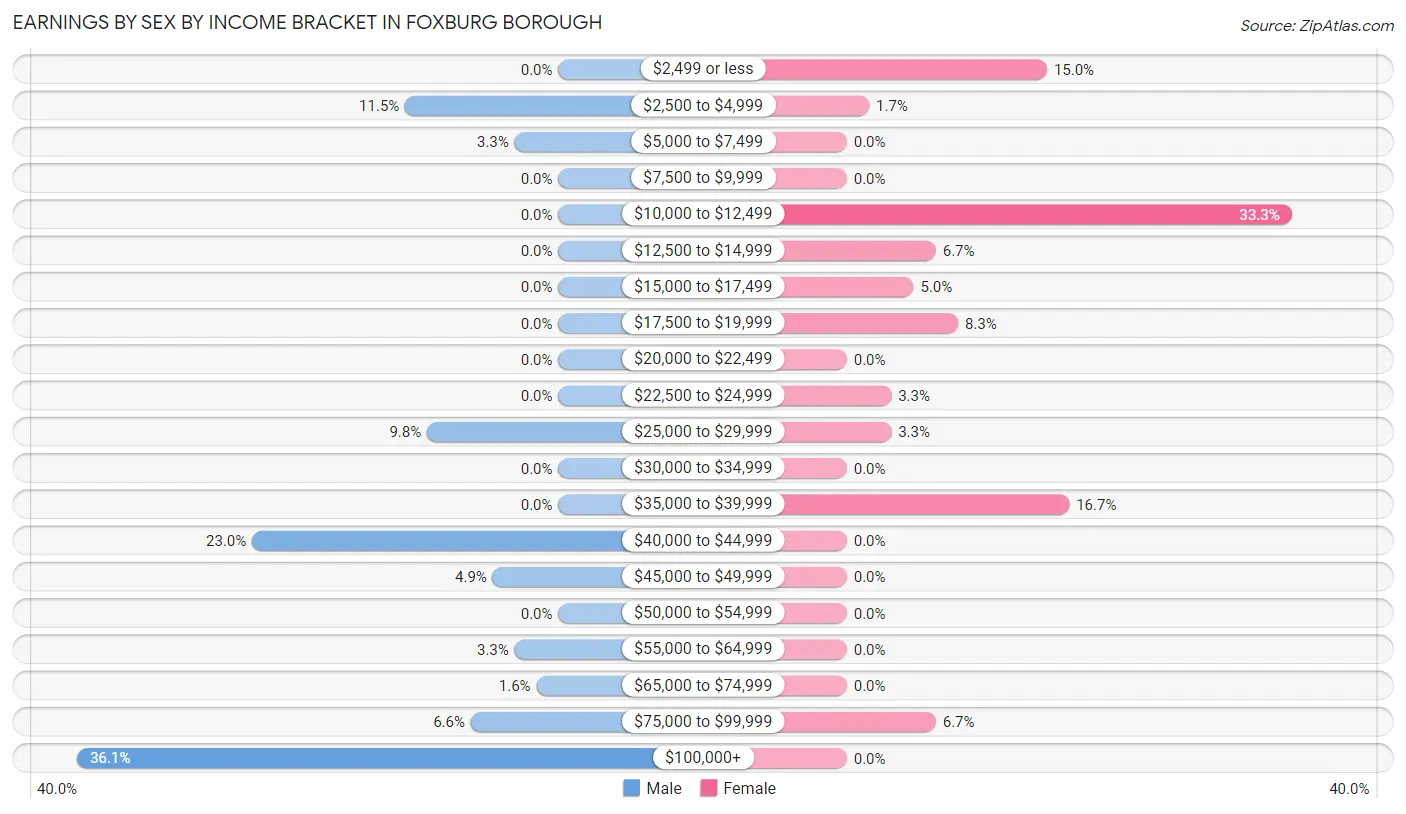
| Income | Male | Female |
| $2,499 or less | 0 (0.0%) | 9 (15.0%) |
| $2,500 to $4,999 | 7 (11.5%) | 1 (1.7%) |
| $5,000 to $7,499 | 2 (3.3%) | 0 (0.0%) |
| $7,500 to $9,999 | 0 (0.0%) | 0 (0.0%) |
| $10,000 to $12,499 | 0 (0.0%) | 20 (33.3%) |
| $12,500 to $14,999 | 0 (0.0%) | 4 (6.7%) |
| $15,000 to $17,499 | 0 (0.0%) | 3 (5.0%) |
| $17,500 to $19,999 | 0 (0.0%) | 5 (8.3%) |
| $20,000 to $22,499 | 0 (0.0%) | 0 (0.0%) |
| $22,500 to $24,999 | 0 (0.0%) | 2 (3.3%) |
| $25,000 to $29,999 | 6 (9.8%) | 2 (3.3%) |
| $30,000 to $34,999 | 0 (0.0%) | 0 (0.0%) |
| $35,000 to $39,999 | 0 (0.0%) | 10 (16.7%) |
| $40,000 to $44,999 | 14 (23.0%) | 0 (0.0%) |
| $45,000 to $49,999 | 3 (4.9%) | 0 (0.0%) |
| $50,000 to $54,999 | 0 (0.0%) | 0 (0.0%) |
| $55,000 to $64,999 | 2 (3.3%) | 0 (0.0%) |
| $65,000 to $74,999 | 1 (1.6%) | 0 (0.0%) |
| $75,000 to $99,999 | 4 (6.6%) | 4 (6.7%) |
| $100,000+ | 22 (36.1%) | 0 (0.0%) |
| Total | 61 (100.0%) | 60 (100.0%) |
Earnings by Sex by Educational Attainment in Foxburg borough
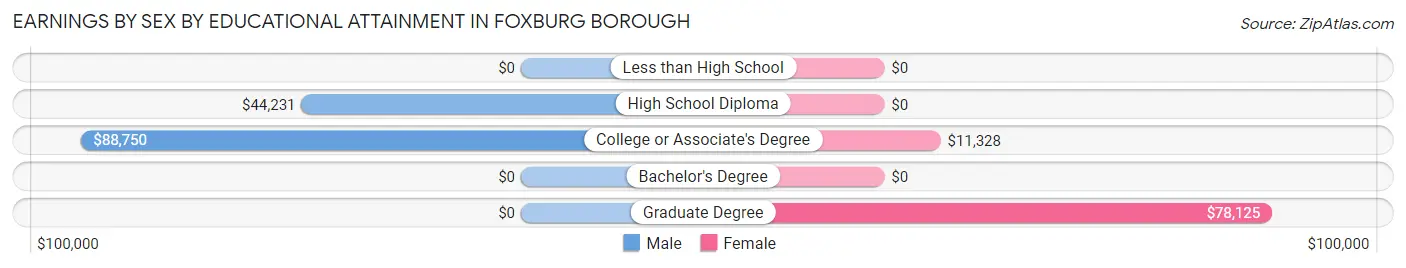
| Educational Attainment | Male Income | Female Income |
| Less than High School | - | - |
| High School Diploma | $44,231 | $0 |
| College or Associate's Degree | $88,750 | $11,328 |
| Bachelor's Degree | - | - |
| Graduate Degree | - | - |
| Total | - | - |
Family Income in Foxburg borough
Family Income Brackets in Foxburg borough
According to the Foxburg borough family income data, there are 32 families falling into the $100,000 to $149,999 income range, which is the most common income bracket and makes up 39.0% of all families.
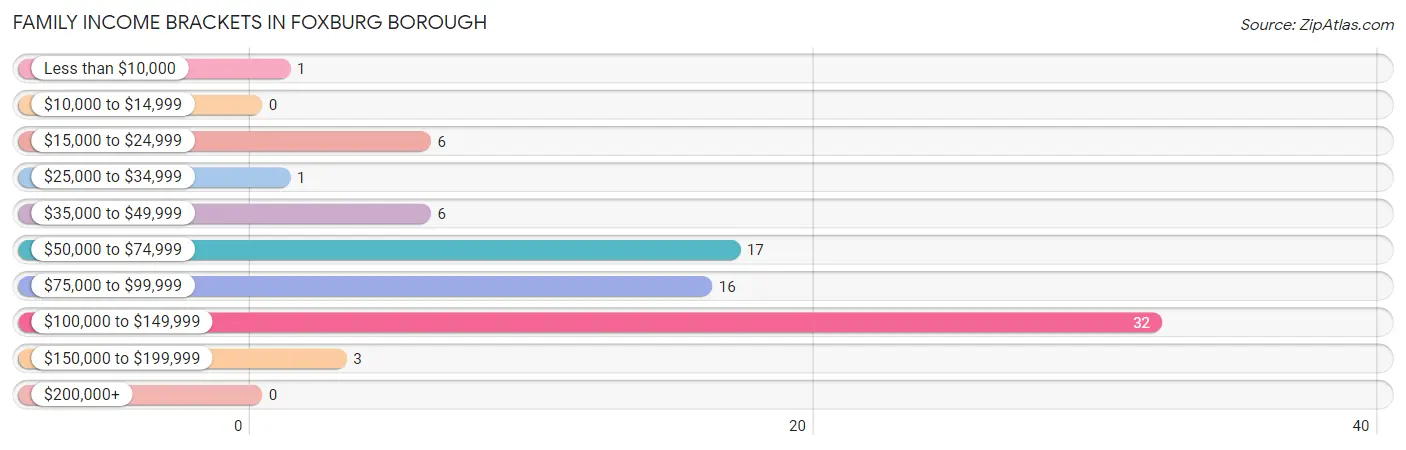
| Income Bracket | # Families | % Families |
| Less than $10,000 | 1 | 1.2% |
| $10,000 to $14,999 | 0 | 0.0% |
| $15,000 to $24,999 | 6 | 7.3% |
| $25,000 to $34,999 | 1 | 1.2% |
| $35,000 to $49,999 | 6 | 7.3% |
| $50,000 to $74,999 | 17 | 20.7% |
| $75,000 to $99,999 | 16 | 19.5% |
| $100,000 to $149,999 | 32 | 39.0% |
| $150,000 to $199,999 | 3 | 3.7% |
| $200,000+ | 0 | 0.0% |
Family Income by Famaliy Size in Foxburg borough
3-person families (27 | 32.9%) account for the highest median family income in Foxburg borough with $110,764 per family, while 2-person families (38 | 46.3%) have the highest median income of $39,792 per family member.
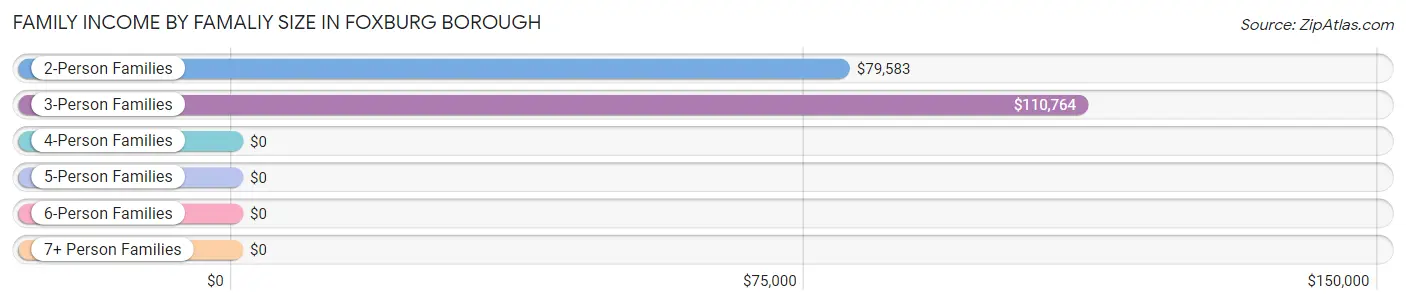
| Income Bracket | # Families | Median Income |
| 2-Person Families | 38 (46.3%) | $79,583 |
| 3-Person Families | 27 (32.9%) | $110,764 |
| 4-Person Families | 0 (0.0%) | $0 |
| 5-Person Families | 4 (4.9%) | $0 |
| 6-Person Families | 13 (15.9%) | $0 |
| 7+ Person Families | 0 (0.0%) | $0 |
| Total | 82 (100.0%) | $85,500 |
Family Income by Number of Earners in Foxburg borough
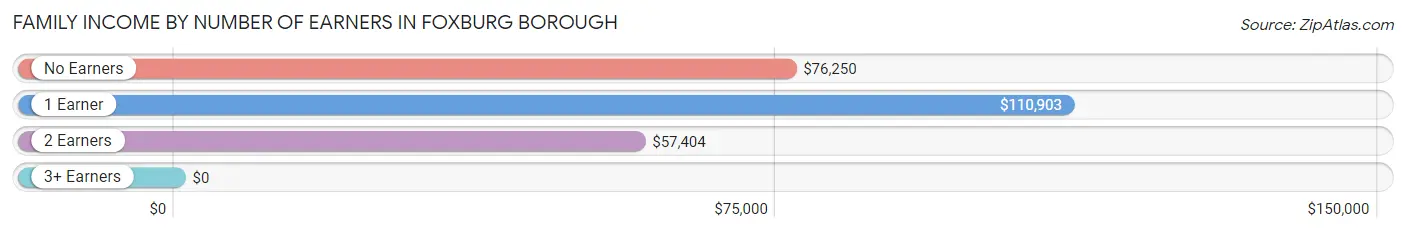
| Number of Earners | # Families | Median Income |
| No Earners | 18 (22.0%) | $76,250 |
| 1 Earner | 37 (45.1%) | $110,903 |
| 2 Earners | 25 (30.5%) | $57,404 |
| 3+ Earners | 2 (2.4%) | $0 |
| Total | 82 (100.0%) | $85,500 |
Household Income in Foxburg borough
Household Income Brackets in Foxburg borough
With 32 households falling in the category, the $100,000 to $149,999 income range is the most frequent in Foxburg borough, accounting for 27.6% of all households.
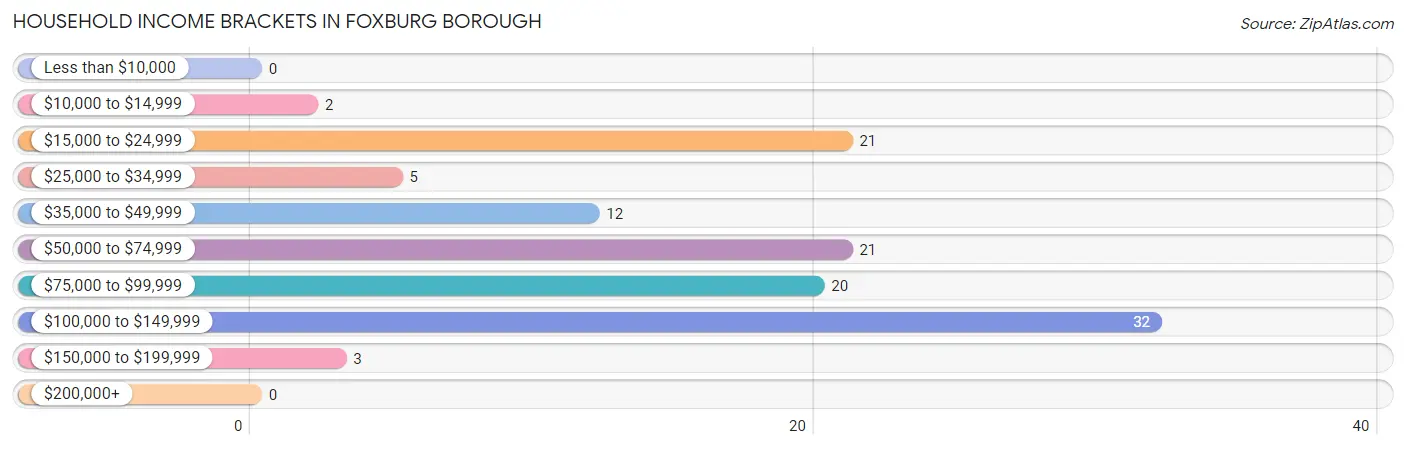
| Income Bracket | # Households | % Households |
| Less than $10,000 | 0 | 0.0% |
| $10,000 to $14,999 | 2 | 1.7% |
| $15,000 to $24,999 | 21 | 18.1% |
| $25,000 to $34,999 | 5 | 4.3% |
| $35,000 to $49,999 | 12 | 10.3% |
| $50,000 to $74,999 | 21 | 18.1% |
| $75,000 to $99,999 | 20 | 17.2% |
| $100,000 to $149,999 | 32 | 27.6% |
| $150,000 to $199,999 | 3 | 2.6% |
| $200,000+ | 0 | 0.0% |
Household Income by Householder Age in Foxburg borough
The median household income in Foxburg borough is $62,500, with the highest median household income of $110,278 found in the 25 to 44 years age bracket for the primary householder. A total of 40 households (34.5%) fall into this category.
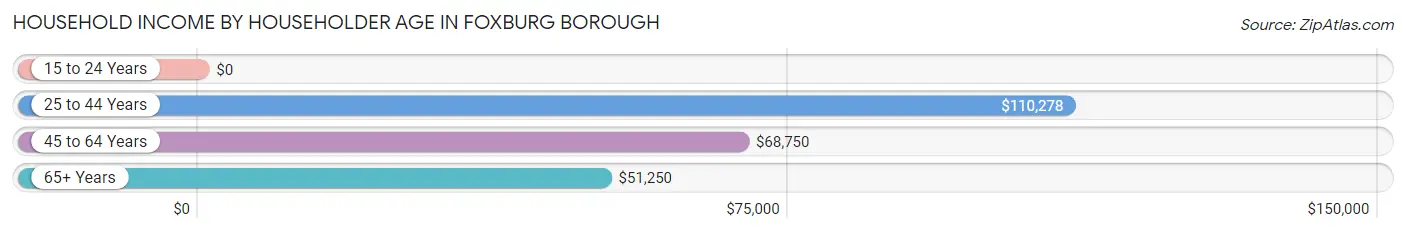
| Income Bracket | # Households | Median Income |
| 15 to 24 Years | 0 (0.0%) | $0 |
| 25 to 44 Years | 40 (34.5%) | $110,278 |
| 45 to 64 Years | 30 (25.9%) | $68,750 |
| 65+ Years | 46 (39.7%) | $51,250 |
| Total | 116 (100.0%) | $62,500 |
Poverty in Foxburg borough
Income Below Poverty by Sex and Age in Foxburg borough
With 6.6% poverty level for males and 11.1% for females among the residents of Foxburg borough, 12 to 14 year old males and 6 to 11 year old females are the most vulnerable to poverty, with 1 males (100.0%) and 2 females (100.0%) in their respective age groups living below the poverty level.
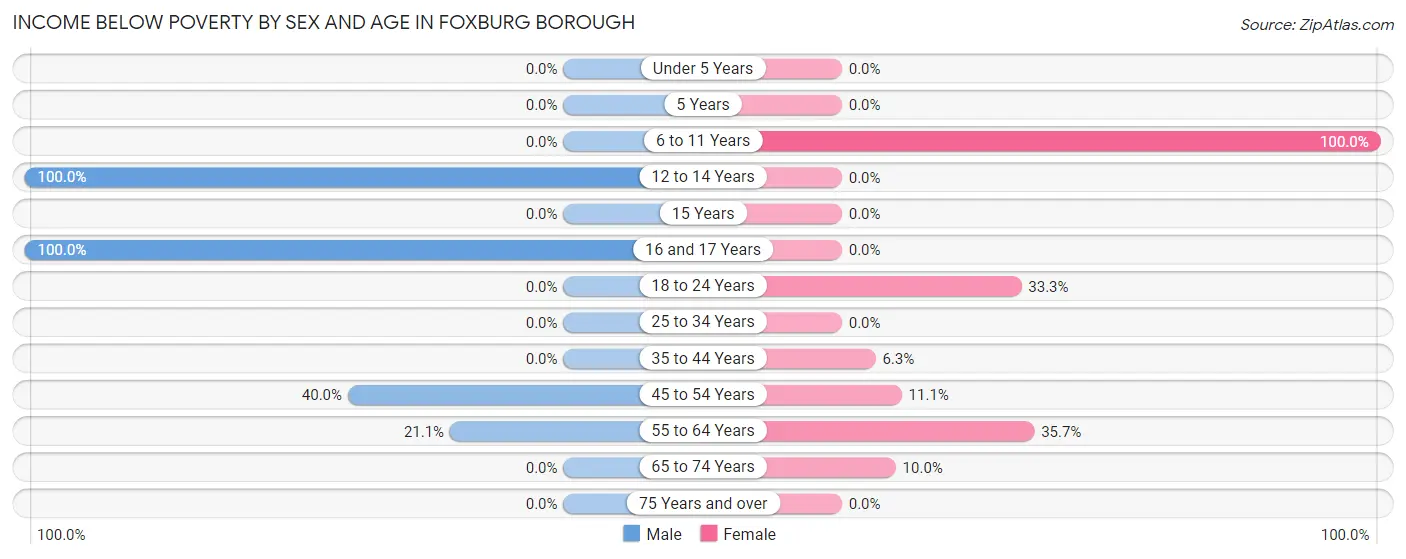
| Age Bracket | Male | Female |
| Under 5 Years | 0 (0.0%) | 0 (0.0%) |
| 5 Years | 0 (0.0%) | 0 (0.0%) |
| 6 to 11 Years | 0 (0.0%) | 2 (100.0%) |
| 12 to 14 Years | 1 (100.0%) | 0 (0.0%) |
| 15 Years | 0 (0.0%) | 0 (0.0%) |
| 16 and 17 Years | 2 (100.0%) | 0 (0.0%) |
| 18 to 24 Years | 0 (0.0%) | 1 (33.3%) |
| 25 to 34 Years | 0 (0.0%) | 0 (0.0%) |
| 35 to 44 Years | 0 (0.0%) | 2 (6.2%) |
| 45 to 54 Years | 2 (40.0%) | 1 (11.1%) |
| 55 to 64 Years | 4 (21.0%) | 10 (35.7%) |
| 65 to 74 Years | 0 (0.0%) | 1 (10.0%) |
| 75 Years and over | 0 (0.0%) | 0 (0.0%) |
| Total | 9 (6.6%) | 17 (11.1%) |
Income Above Poverty by Sex and Age in Foxburg borough
According to the poverty statistics in Foxburg borough, males aged 6 to 11 years and females aged under 5 years are the age groups that are most secure financially, with 100.0% of males and 100.0% of females in these age groups living above the poverty line.
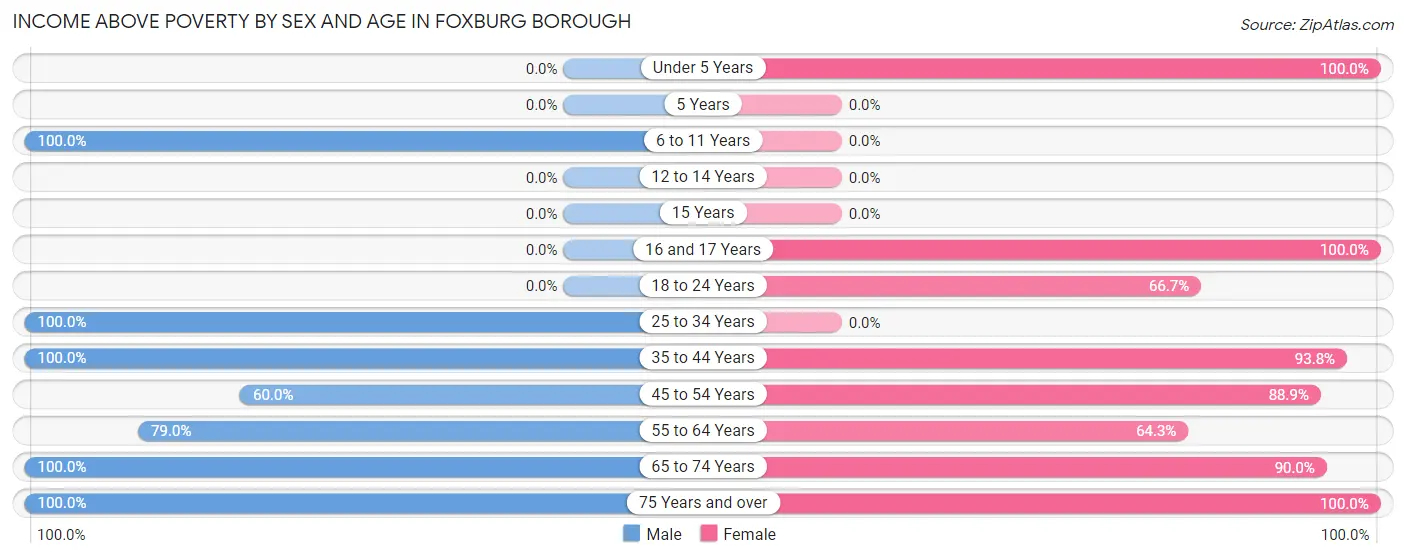
| Age Bracket | Male | Female |
| Under 5 Years | 0 (0.0%) | 42 (100.0%) |
| 5 Years | 0 (0.0%) | 0 (0.0%) |
| 6 to 11 Years | 34 (100.0%) | 0 (0.0%) |
| 12 to 14 Years | 0 (0.0%) | 0 (0.0%) |
| 15 Years | 0 (0.0%) | 0 (0.0%) |
| 16 and 17 Years | 0 (0.0%) | 1 (100.0%) |
| 18 to 24 Years | 0 (0.0%) | 2 (66.7%) |
| 25 to 34 Years | 33 (100.0%) | 0 (0.0%) |
| 35 to 44 Years | 5 (100.0%) | 30 (93.8%) |
| 45 to 54 Years | 3 (60.0%) | 8 (88.9%) |
| 55 to 64 Years | 15 (78.9%) | 18 (64.3%) |
| 65 to 74 Years | 20 (100.0%) | 9 (90.0%) |
| 75 Years and over | 17 (100.0%) | 26 (100.0%) |
| Total | 127 (93.4%) | 136 (88.9%) |
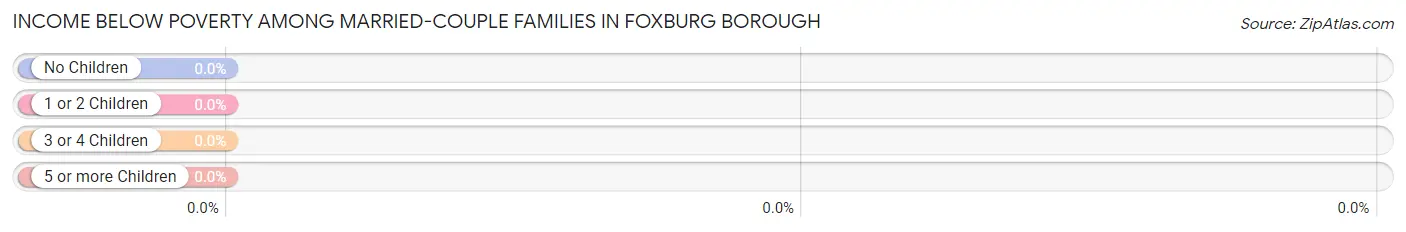
Income Below Poverty Among Married-Couple Families in Foxburg borough
| Children | Above Poverty | Below Poverty |
| No Children | 41 (100.0%) | 0 (0.0%) |
| 1 or 2 Children | 19 (100.0%) | 0 (0.0%) |
| 3 or 4 Children | 17 (100.0%) | 0 (0.0%) |
| 5 or more Children | 0 (0.0%) | 0 (0.0%) |
| Total | 77 (100.0%) | 0 (0.0%) |
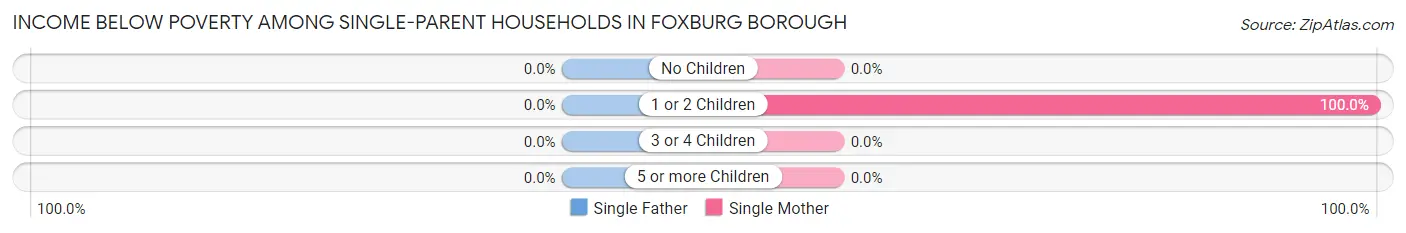
Income Below Poverty Among Single-Parent Households in Foxburg borough
| Children | Single Father | Single Mother |
| No Children | 0 (0.0%) | 0 (0.0%) |
| 1 or 2 Children | 0 (0.0%) | 3 (100.0%) |
| 3 or 4 Children | 0 (0.0%) | 0 (0.0%) |
| 5 or more Children | 0 (0.0%) | 0 (0.0%) |
| Total | 0 (0.0%) | 3 (60.0%) |
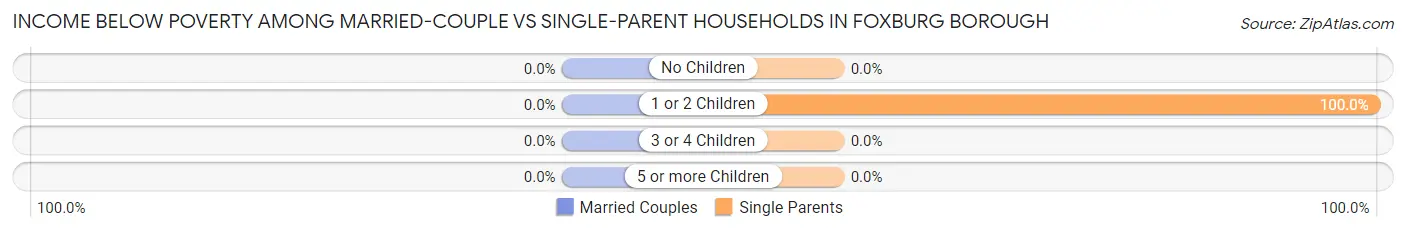
Income Below Poverty Among Married-Couple vs Single-Parent Households in Foxburg borough
| Children | Married-Couple Families | Single-Parent Households |
| No Children | 0 (0.0%) | 0 (0.0%) |
| 1 or 2 Children | 0 (0.0%) | 3 (100.0%) |
| 3 or 4 Children | 0 (0.0%) | 0 (0.0%) |
| 5 or more Children | 0 (0.0%) | 0 (0.0%) |
| Total | 0 (0.0%) | 3 (60.0%) |
Employment Characteristics in Foxburg borough
Employment by Class of Employer in Foxburg borough
Among the 80 employed individuals in Foxburg borough, private company employees (41 | 51.2%), local government employees (16 | 20.0%), and state government employees (15 | 18.8%) make up the most common classes of employment.
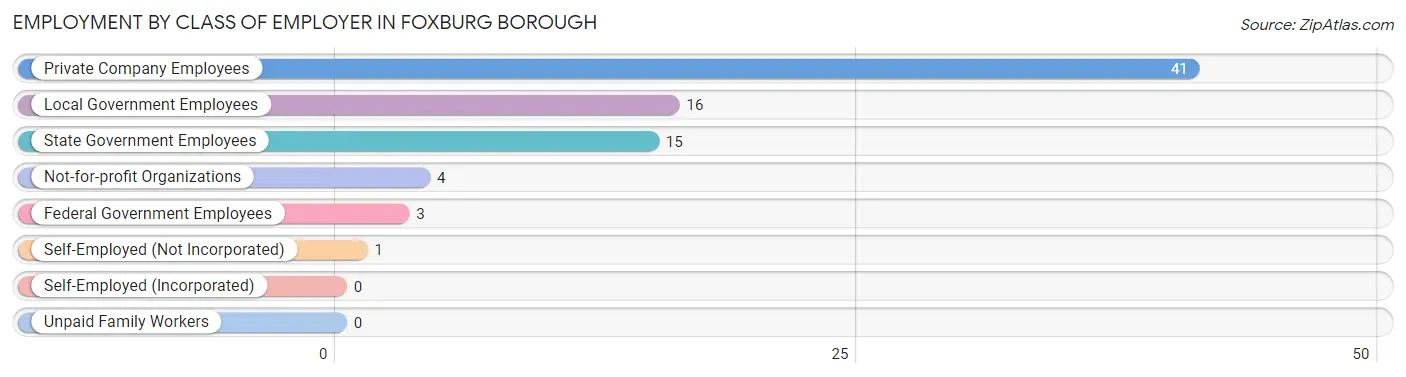
| Employer Class | # Employees | % Employees |
| Private Company Employees | 41 | 51.2% |
| Self-Employed (Incorporated) | 0 | 0.0% |
| Self-Employed (Not Incorporated) | 1 | 1.3% |
| Not-for-profit Organizations | 4 | 5.0% |
| Local Government Employees | 16 | 20.0% |
| State Government Employees | 15 | 18.8% |
| Federal Government Employees | 3 | 3.7% |
| Unpaid Family Workers | 0 | 0.0% |
| Total | 80 | 100.0% |
Employment Status by Age in Foxburg borough
According to the labor force statistics for Foxburg borough, out of the total population over 16 years of age (210), 47.1% or 99 individuals are in the labor force, with 19.2% or 19 of them unemployed. The age group with the highest labor force participation rate is 30 to 34 years, with 100.0% or 18 individuals in the labor force. Within the labor force, the 16 to 19 years age range has the highest percentage of unemployed individuals, with 100.0% or 2 of them being unemployed.
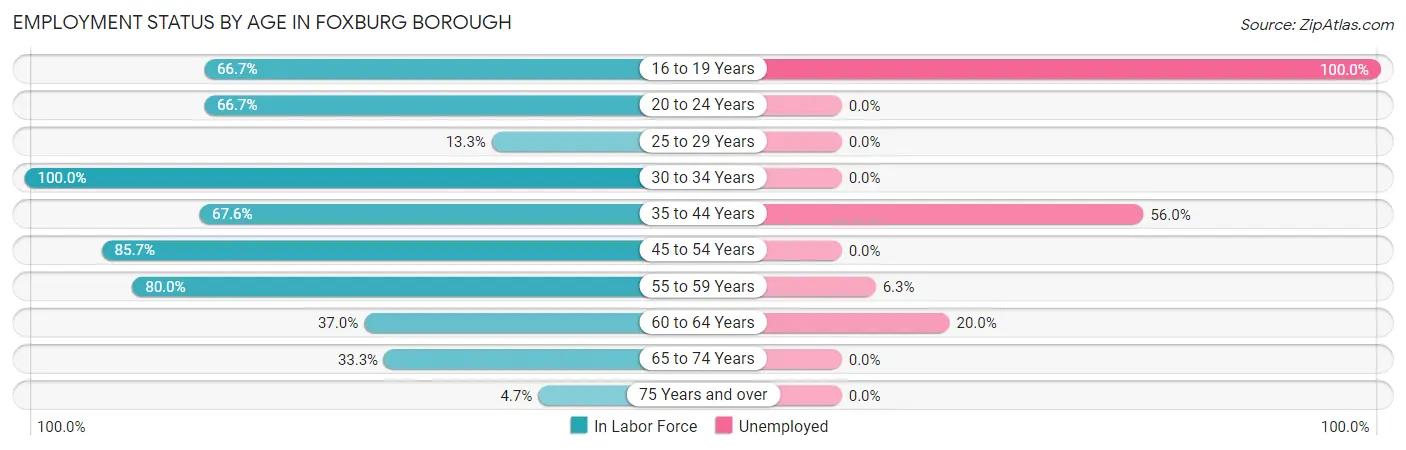
| Age Bracket | In Labor Force | Unemployed |
| 16 to 19 Years | 2 (66.7%) | 2 (100.0%) |
| 20 to 24 Years | 2 (66.7%) | 0 (0.0%) |
| 25 to 29 Years | 2 (13.3%) | 0 (0.0%) |
| 30 to 34 Years | 18 (100.0%) | 0 (0.0%) |
| 35 to 44 Years | 25 (67.6%) | 14 (56.0%) |
| 45 to 54 Years | 12 (85.7%) | 0 (0.0%) |
| 55 to 59 Years | 16 (80.0%) | 1 (6.3%) |
| 60 to 64 Years | 10 (37.0%) | 2 (20.0%) |
| 65 to 74 Years | 10 (33.3%) | 0 (0.0%) |
| 75 Years and over | 2 (4.7%) | 0 (0.0%) |
| Total | 99 (47.1%) | 19 (19.2%) |
Employment Status by Educational Attainment in Foxburg borough
According to labor force statistics for Foxburg borough, 63.4% of individuals (83) out of the total population between 25 and 64 years of age (131) are in the labor force, with 20.5% or 17 of them being unemployed. The group with the highest labor force participation rate are those with the educational attainment of college / associate degree, with 93.9% or 31 individuals in the labor force. Within the labor force, individuals with less than high school education have the highest percentage of unemployment, with 100.0% or 2 of them being unemployed.
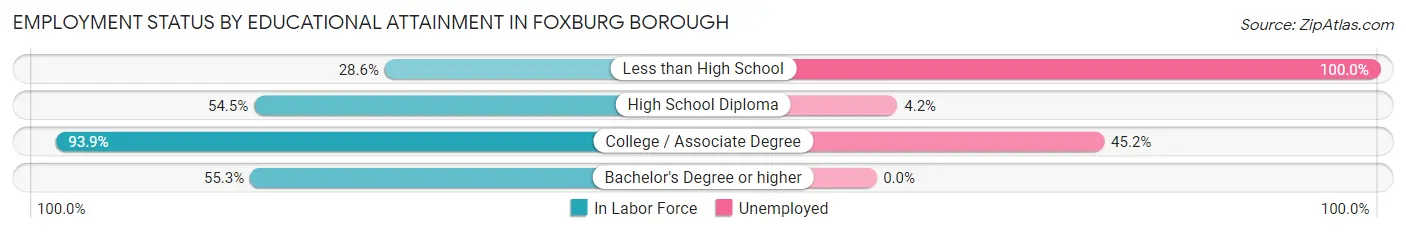
| Educational Attainment | In Labor Force | Unemployed |
| Less than High School | 2 (28.6%) | 7 (100.0%) |
| High School Diploma | 24 (54.5%) | 2 (4.2%) |
| College / Associate Degree | 31 (93.9%) | 15 (45.2%) |
| Bachelor's Degree or higher | 26 (55.3%) | 0 (0.0%) |
| Total | 83 (63.4%) | 27 (20.5%) |
Employment Occupations by Sex in Foxburg borough
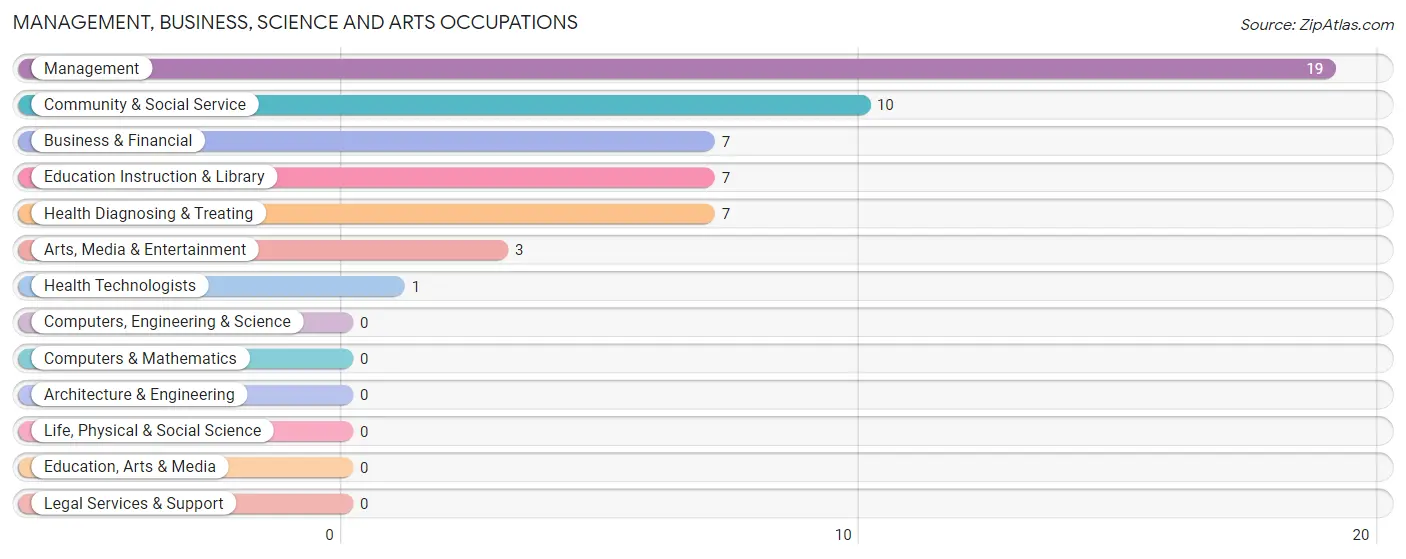
Management, Business, Science and Arts Occupations
The most common Management, Business, Science and Arts occupations in Foxburg borough are Management (19 | 23.7%), Community & Social Service (10 | 12.5%), Business & Financial (7 | 8.7%), Education Instruction & Library (7 | 8.7%), and Health Diagnosing & Treating (7 | 8.7%).
Management, Business, Science and Arts Occupations by Sex
Within the Management, Business, Science and Arts occupations in Foxburg borough, the most male-oriented occupations are Business & Financial (100.0%), Management (94.7%), and Health Diagnosing & Treating (28.6%), while the most female-oriented occupations are Arts, Media & Entertainment (100.0%), Health Technologists (100.0%), and Community & Social Service (90.0%).
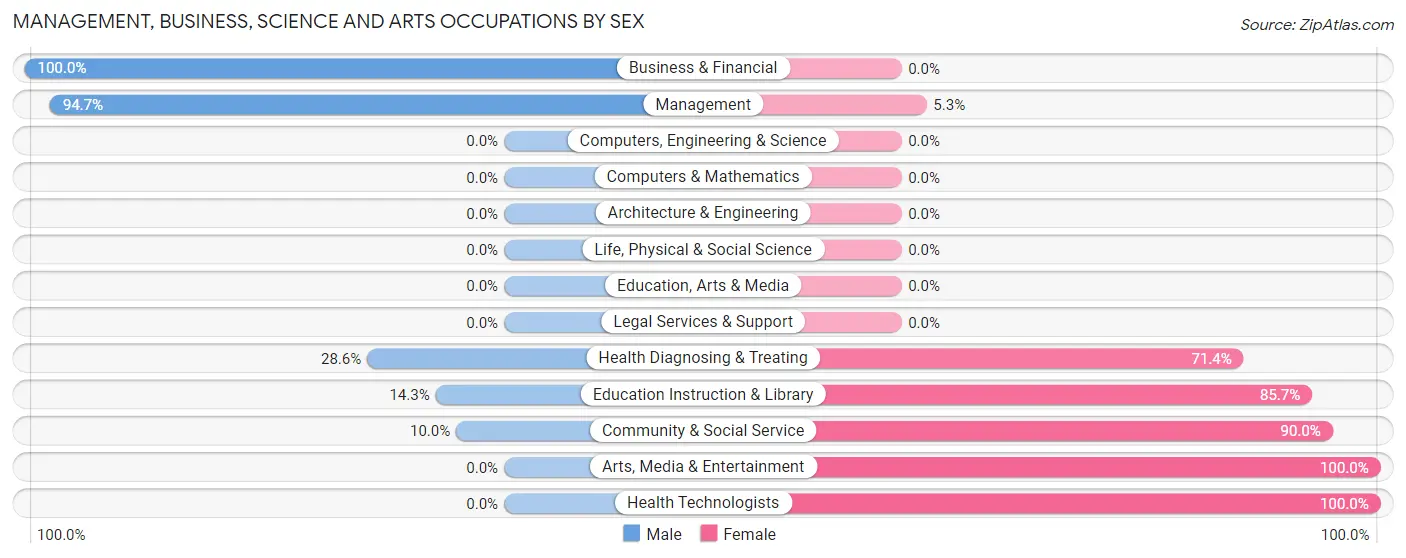
| Occupation | Male | Female |
| Management | 18 (94.7%) | 1 (5.3%) |
| Business & Financial | 7 (100.0%) | 0 (0.0%) |
| Computers, Engineering & Science | 0 (0.0%) | 0 (0.0%) |
| Computers & Mathematics | 0 (0.0%) | 0 (0.0%) |
| Architecture & Engineering | 0 (0.0%) | 0 (0.0%) |
| Life, Physical & Social Science | 0 (0.0%) | 0 (0.0%) |
| Community & Social Service | 1 (10.0%) | 9 (90.0%) |
| Education, Arts & Media | 0 (0.0%) | 0 (0.0%) |
| Legal Services & Support | 0 (0.0%) | 0 (0.0%) |
| Education Instruction & Library | 1 (14.3%) | 6 (85.7%) |
| Arts, Media & Entertainment | 0 (0.0%) | 3 (100.0%) |
| Health Diagnosing & Treating | 2 (28.6%) | 5 (71.4%) |
| Health Technologists | 0 (0.0%) | 1 (100.0%) |
| Total (Category) | 28 (65.1%) | 15 (34.9%) |
| Total (Overall) | 40 (50.0%) | 40 (50.0%) |
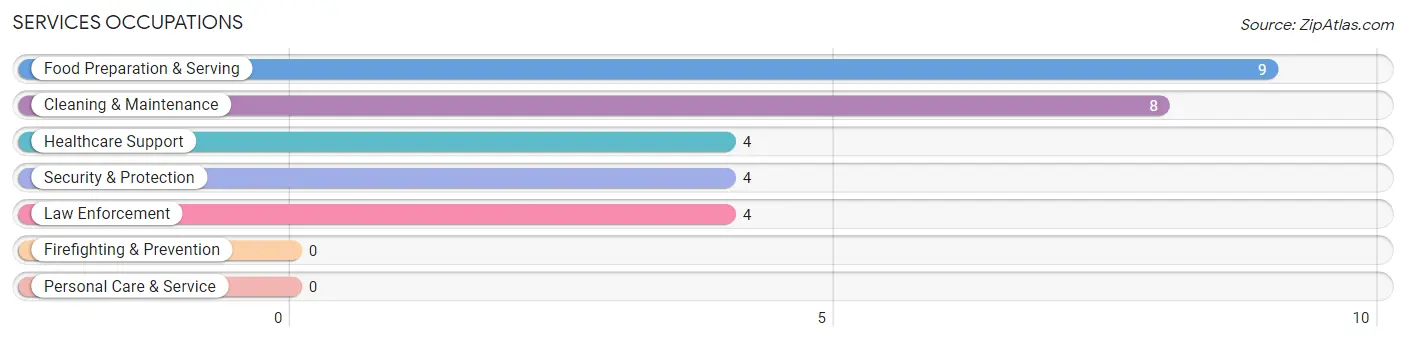
Services Occupations
The most common Services occupations in Foxburg borough are Food Preparation & Serving (9 | 11.3%), Cleaning & Maintenance (8 | 10.0%), Healthcare Support (4 | 5.0%), Security & Protection (4 | 5.0%), and Law Enforcement (4 | 5.0%).
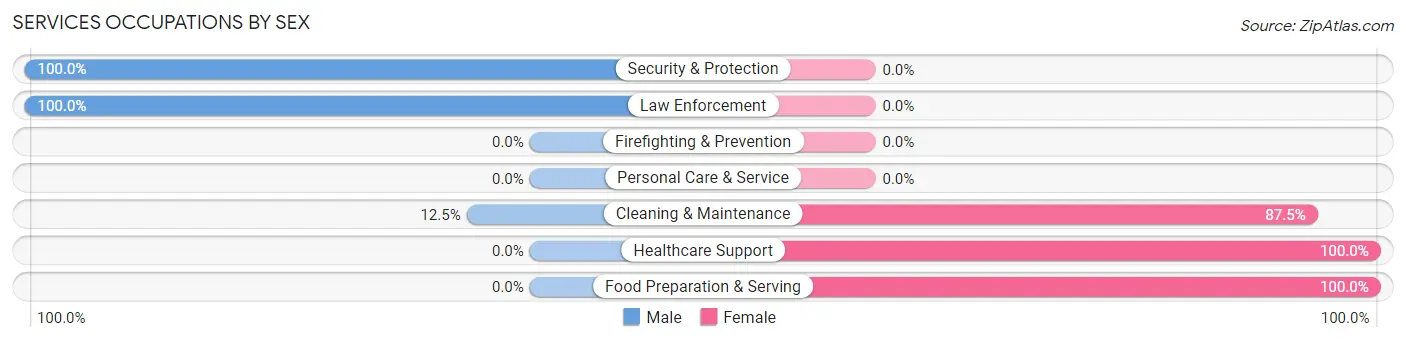
Services Occupations by Sex
Within the Services occupations in Foxburg borough, the most male-oriented occupations are Security & Protection (100.0%), Law Enforcement (100.0%), and Cleaning & Maintenance (12.5%), while the most female-oriented occupations are Healthcare Support (100.0%), Food Preparation & Serving (100.0%), and Cleaning & Maintenance (87.5%).
| Occupation | Male | Female |
| Healthcare Support | 0 (0.0%) | 4 (100.0%) |
| Security & Protection | 4 (100.0%) | 0 (0.0%) |
| Firefighting & Prevention | 0 (0.0%) | 0 (0.0%) |
| Law Enforcement | 4 (100.0%) | 0 (0.0%) |
| Food Preparation & Serving | 0 (0.0%) | 9 (100.0%) |
| Cleaning & Maintenance | 1 (12.5%) | 7 (87.5%) |
| Personal Care & Service | 0 (0.0%) | 0 (0.0%) |
| Total (Category) | 5 (20.0%) | 20 (80.0%) |
| Total (Overall) | 40 (50.0%) | 40 (50.0%) |
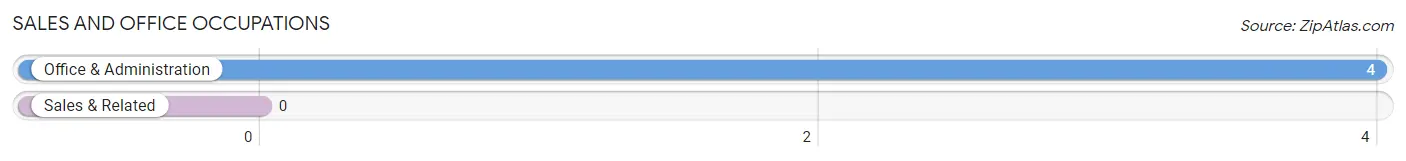
Sales and Office Occupations
The most common Sales and Office occupations in Foxburg borough are , and Office & Administration (4 | 5.0%).
Sales and Office Occupations by Sex

| Occupation | Male | Female |
| Sales & Related | 0 (0.0%) | 0 (0.0%) |
| Office & Administration | 0 (0.0%) | 4 (100.0%) |
| Total (Category) | 0 (0.0%) | 4 (100.0%) |
| Total (Overall) | 40 (50.0%) | 40 (50.0%) |
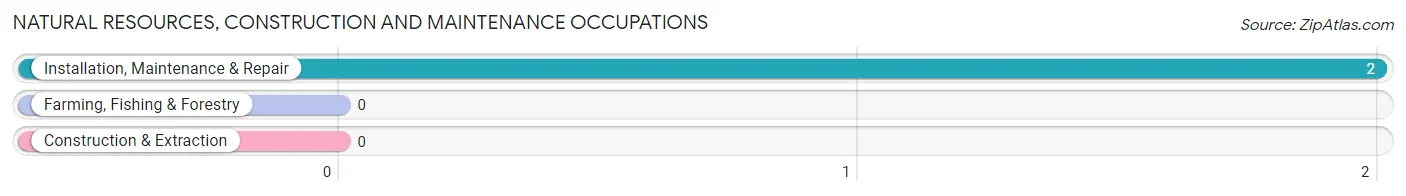
Natural Resources, Construction and Maintenance Occupations
The most common Natural Resources, Construction and Maintenance occupations in Foxburg borough are , and Installation, Maintenance & Repair (2 | 2.5%).
Natural Resources, Construction and Maintenance Occupations by Sex
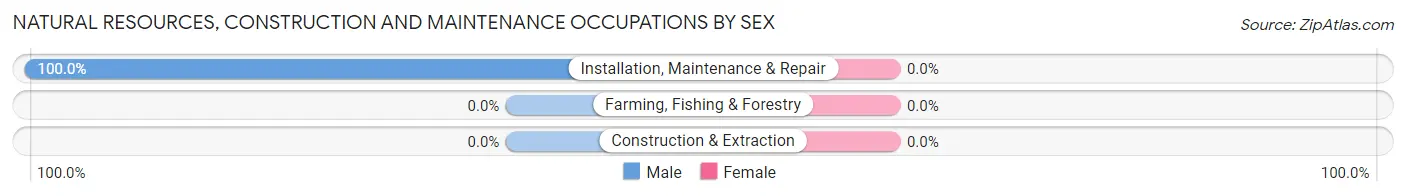
| Occupation | Male | Female |
| Farming, Fishing & Forestry | 0 (0.0%) | 0 (0.0%) |
| Construction & Extraction | 0 (0.0%) | 0 (0.0%) |
| Installation, Maintenance & Repair | 2 (100.0%) | 0 (0.0%) |
| Total (Category) | 2 (100.0%) | 0 (0.0%) |
| Total (Overall) | 40 (50.0%) | 40 (50.0%) |
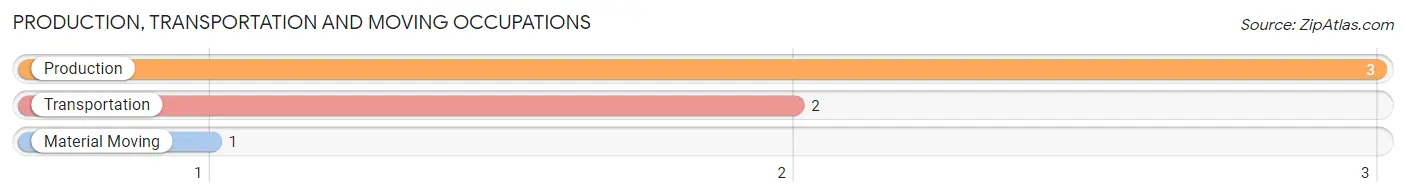
Production, Transportation and Moving Occupations
The most common Production, Transportation and Moving occupations in Foxburg borough are Production (3 | 3.7%), Transportation (2 | 2.5%), and Material Moving (1 | 1.3%).
Production, Transportation and Moving Occupations by Sex
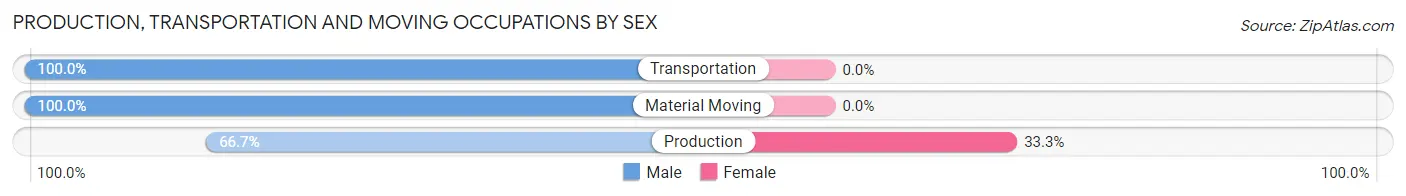
| Occupation | Male | Female |
| Production | 2 (66.7%) | 1 (33.3%) |
| Transportation | 2 (100.0%) | 0 (0.0%) |
| Material Moving | 1 (100.0%) | 0 (0.0%) |
| Total (Category) | 5 (83.3%) | 1 (16.7%) |
| Total (Overall) | 40 (50.0%) | 40 (50.0%) |
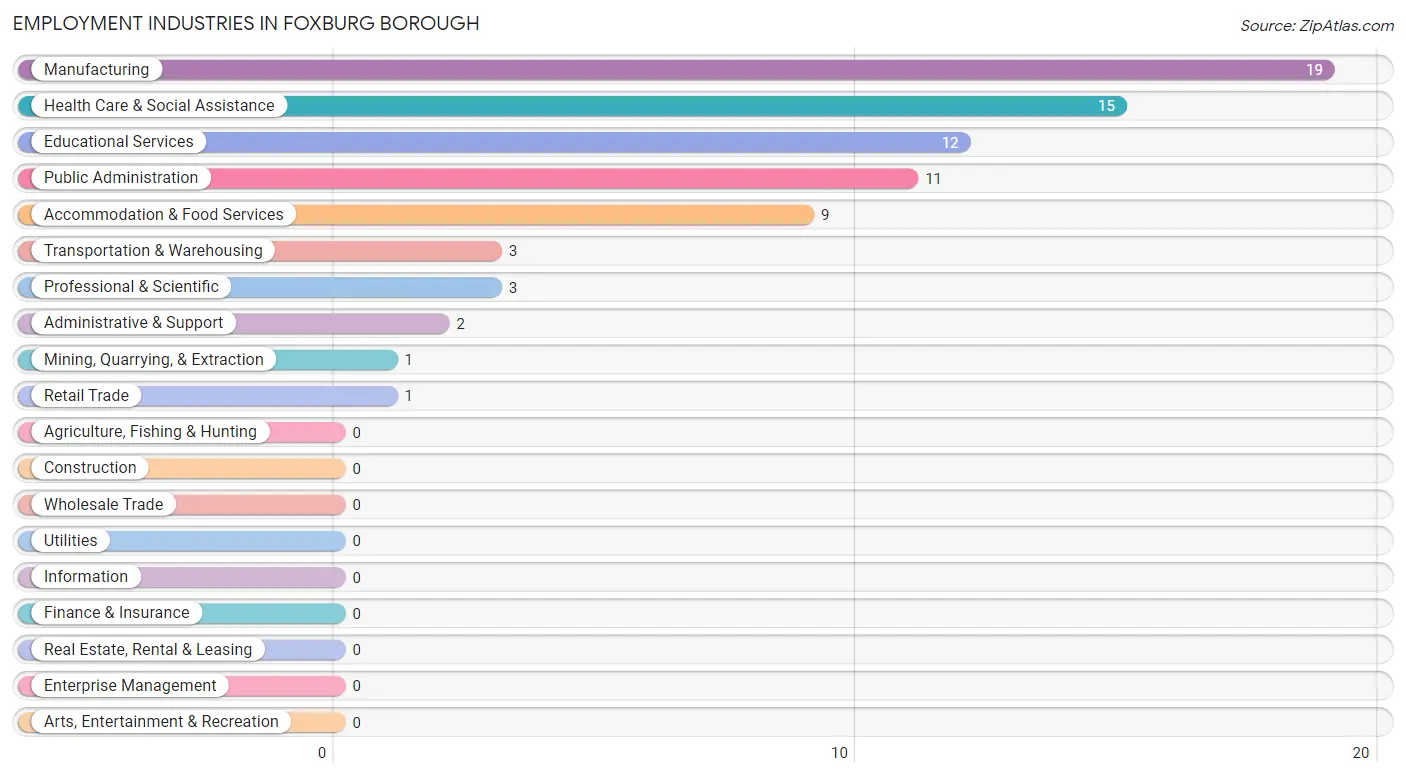
Employment Industries by Sex in Foxburg borough
Employment Industries in Foxburg borough
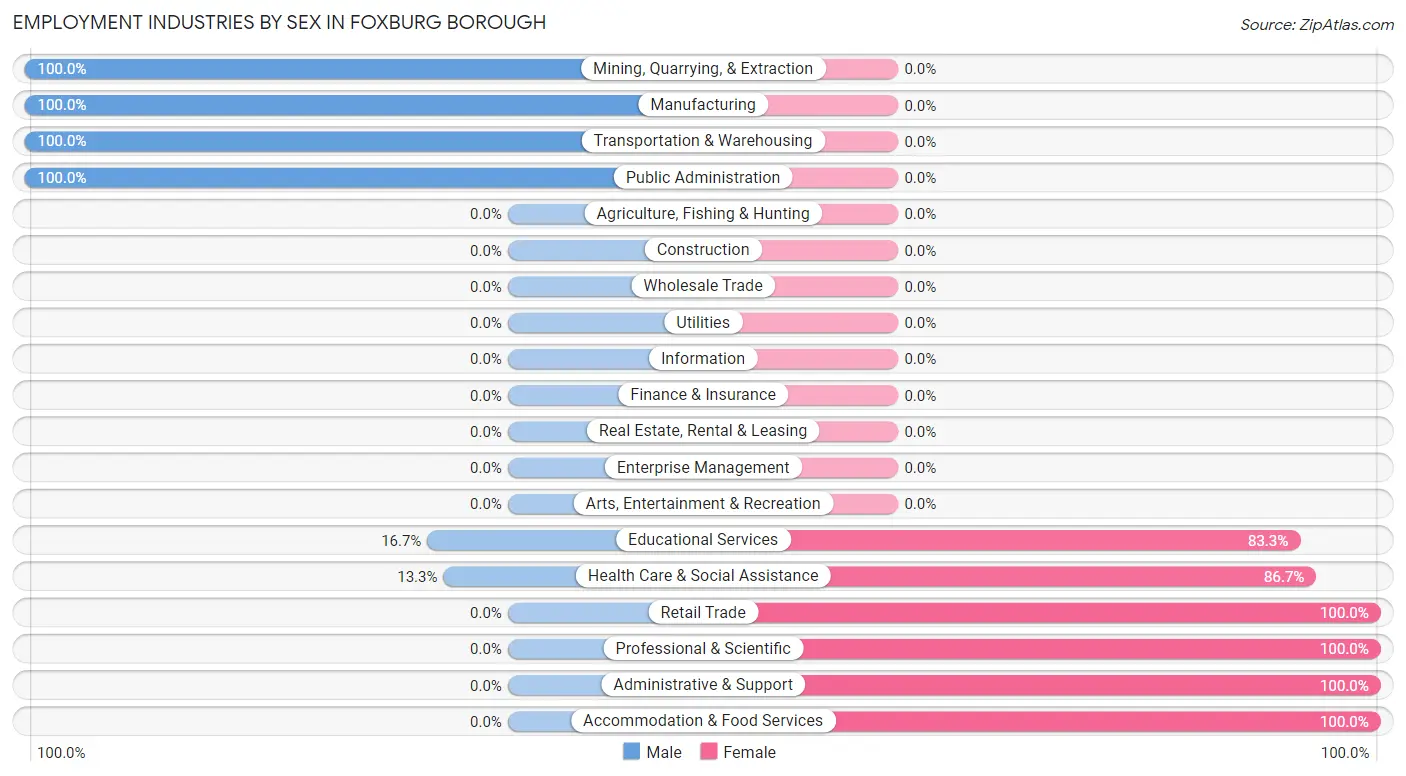
The major employment industries in Foxburg borough include Manufacturing (19 | 23.7%), Health Care & Social Assistance (15 | 18.8%), Educational Services (12 | 15.0%), Public Administration (11 | 13.8%), and Accommodation & Food Services (9 | 11.3%).
Employment Industries by Sex in Foxburg borough
The Foxburg borough industries that see more men than women are Mining, Quarrying, & Extraction (100.0%), Manufacturing (100.0%), and Transportation & Warehousing (100.0%), whereas the industries that tend to have a higher number of women are Retail Trade (100.0%), Professional & Scientific (100.0%), and Administrative & Support (100.0%).
| Industry | Male | Female |
| Agriculture, Fishing & Hunting | 0 (0.0%) | 0 (0.0%) |
| Mining, Quarrying, & Extraction | 1 (100.0%) | 0 (0.0%) |
| Construction | 0 (0.0%) | 0 (0.0%) |
| Manufacturing | 19 (100.0%) | 0 (0.0%) |
| Wholesale Trade | 0 (0.0%) | 0 (0.0%) |
| Retail Trade | 0 (0.0%) | 1 (100.0%) |
| Transportation & Warehousing | 3 (100.0%) | 0 (0.0%) |
| Utilities | 0 (0.0%) | 0 (0.0%) |
| Information | 0 (0.0%) | 0 (0.0%) |
| Finance & Insurance | 0 (0.0%) | 0 (0.0%) |
| Real Estate, Rental & Leasing | 0 (0.0%) | 0 (0.0%) |
| Professional & Scientific | 0 (0.0%) | 3 (100.0%) |
| Enterprise Management | 0 (0.0%) | 0 (0.0%) |
| Administrative & Support | 0 (0.0%) | 2 (100.0%) |
| Educational Services | 2 (16.7%) | 10 (83.3%) |
| Health Care & Social Assistance | 2 (13.3%) | 13 (86.7%) |
| Arts, Entertainment & Recreation | 0 (0.0%) | 0 (0.0%) |
| Accommodation & Food Services | 0 (0.0%) | 9 (100.0%) |
| Public Administration | 11 (100.0%) | 0 (0.0%) |
| Total | 40 (50.0%) | 40 (50.0%) |
Education in Foxburg borough
School Enrollment in Foxburg borough
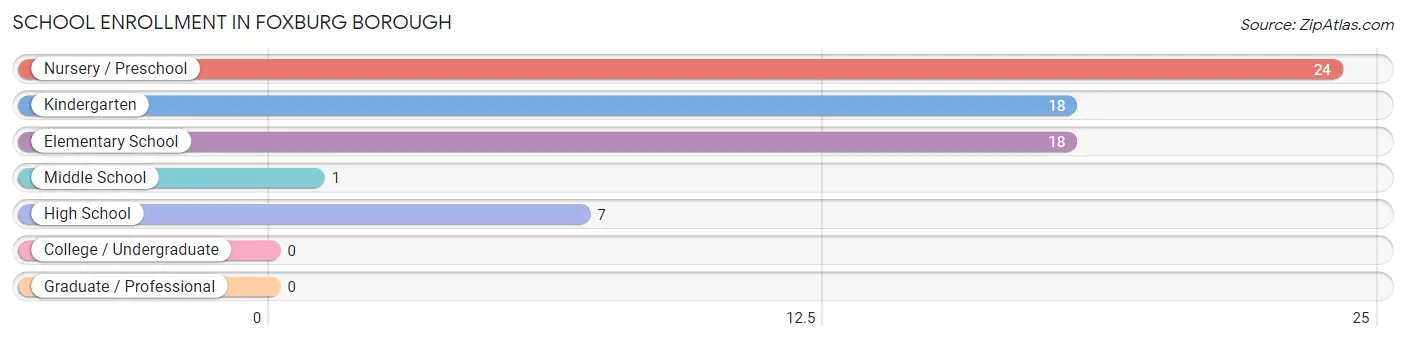
The most common levels of schooling among the 68 students in Foxburg borough are nursery / preschool (24 | 35.3%), kindergarten (18 | 26.5%), and elementary school (18 | 26.5%).
| School Level | # Students | % Students |
| Nursery / Preschool | 24 | 35.3% |
| Kindergarten | 18 | 26.5% |
| Elementary School | 18 | 26.5% |
| Middle School | 1 | 1.5% |
| High School | 7 | 10.3% |
| College / Undergraduate | 0 | 0.0% |
| Graduate / Professional | 0 | 0.0% |
| Total | 68 | 100.0% |
School Enrollment by Age by Funding Source in Foxburg borough
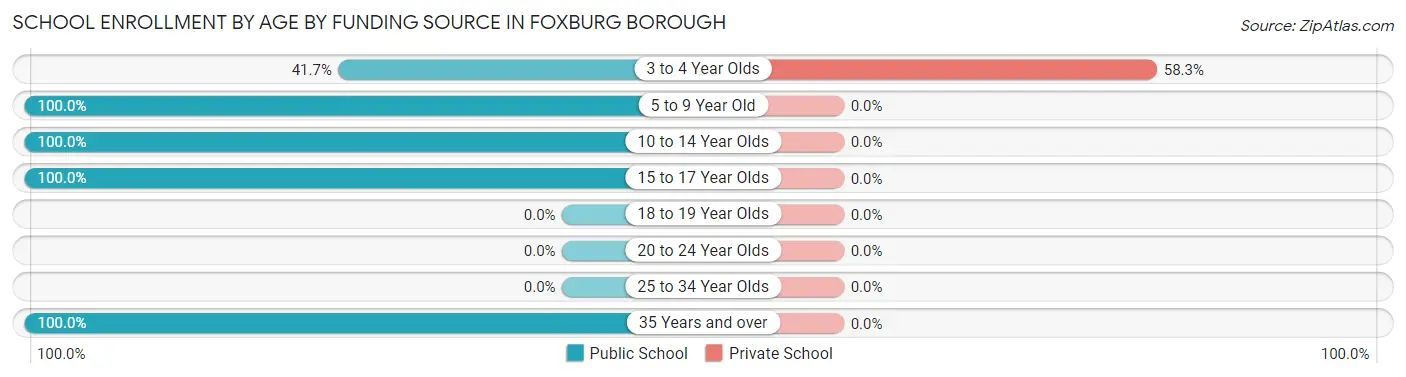
Out of a total of 68 students who are enrolled in schools in Foxburg borough, 14 (20.6%) attend a private institution, while the remaining 54 (79.4%) are enrolled in public schools. The age group of 3 to 4 year olds has the highest likelihood of being enrolled in private schools, with 14 (58.3% in the age bracket) enrolled. Conversely, the age group of 5 to 9 year old has the lowest likelihood of being enrolled in a private school, with 34 (100.0% in the age bracket) attending a public institution.
| Age Bracket | Public School | Private School |
| 3 to 4 Year Olds | 10 (41.7%) | 14 (58.3%) |
| 5 to 9 Year Old | 34 (100.0%) | 0 (0.0%) |
| 10 to 14 Year Olds | 3 (100.0%) | 0 (0.0%) |
| 15 to 17 Year Olds | 3 (100.0%) | 0 (0.0%) |
| 18 to 19 Year Olds | 0 (0.0%) | 0 (0.0%) |
| 20 to 24 Year Olds | 0 (0.0%) | 0 (0.0%) |
| 25 to 34 Year Olds | 0 (0.0%) | 0 (0.0%) |
| 35 Years and over | 4 (100.0%) | 0 (0.0%) |
| Total | 54 (79.4%) | 14 (20.6%) |
Educational Attainment by Field of Study in Foxburg borough
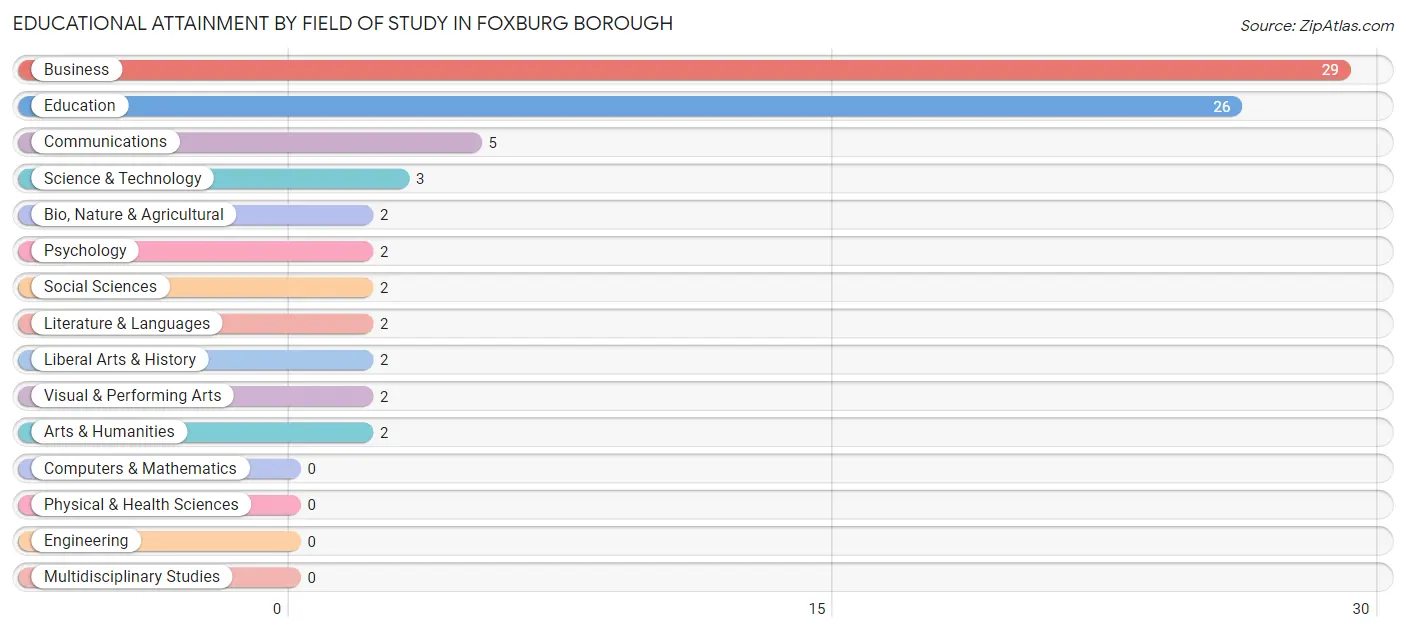
Business (29 | 37.7%), education (26 | 33.8%), communications (5 | 6.5%), science & technology (3 | 3.9%), and bio, nature & agricultural (2 | 2.6%) are the most common fields of study among 77 individuals in Foxburg borough who have obtained a bachelor's degree or higher.
| Field of Study | # Graduates | % Graduates |
| Computers & Mathematics | 0 | 0.0% |
| Bio, Nature & Agricultural | 2 | 2.6% |
| Physical & Health Sciences | 0 | 0.0% |
| Psychology | 2 | 2.6% |
| Social Sciences | 2 | 2.6% |
| Engineering | 0 | 0.0% |
| Multidisciplinary Studies | 0 | 0.0% |
| Science & Technology | 3 | 3.9% |
| Business | 29 | 37.7% |
| Education | 26 | 33.8% |
| Literature & Languages | 2 | 2.6% |
| Liberal Arts & History | 2 | 2.6% |
| Visual & Performing Arts | 2 | 2.6% |
| Communications | 5 | 6.5% |
| Arts & Humanities | 2 | 2.6% |
| Total | 77 | 100.0% |
Transportation & Commute in Foxburg borough
Vehicle Availability by Sex in Foxburg borough
The most prevalent vehicle ownership categories in Foxburg borough are males with 2 vehicles (21, accounting for 52.5%) and females with 2 vehicles (20, making up 52.5%).
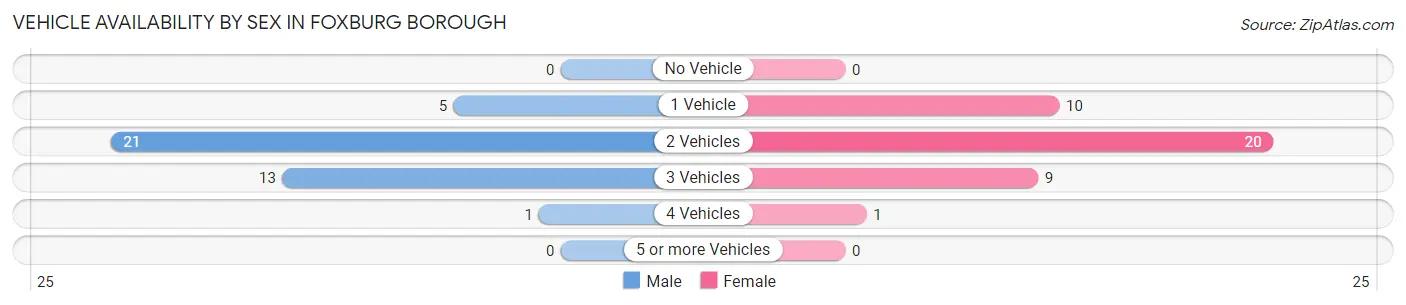
| Vehicles Available | Male | Female |
| No Vehicle | 0 (0.0%) | 0 (0.0%) |
| 1 Vehicle | 5 (12.5%) | 10 (25.0%) |
| 2 Vehicles | 21 (52.5%) | 20 (50.0%) |
| 3 Vehicles | 13 (32.5%) | 9 (22.5%) |
| 4 Vehicles | 1 (2.5%) | 1 (2.5%) |
| 5 or more Vehicles | 0 (0.0%) | 0 (0.0%) |
| Total | 40 (100.0%) | 40 (100.0%) |
Commute Time in Foxburg borough
The most frequently occuring commute durations in Foxburg borough are 45 to 59 minutes (25 commuters, 37.9%), less than 5 minutes (18 commuters, 27.3%), and 20 to 24 minutes (7 commuters, 10.6%).
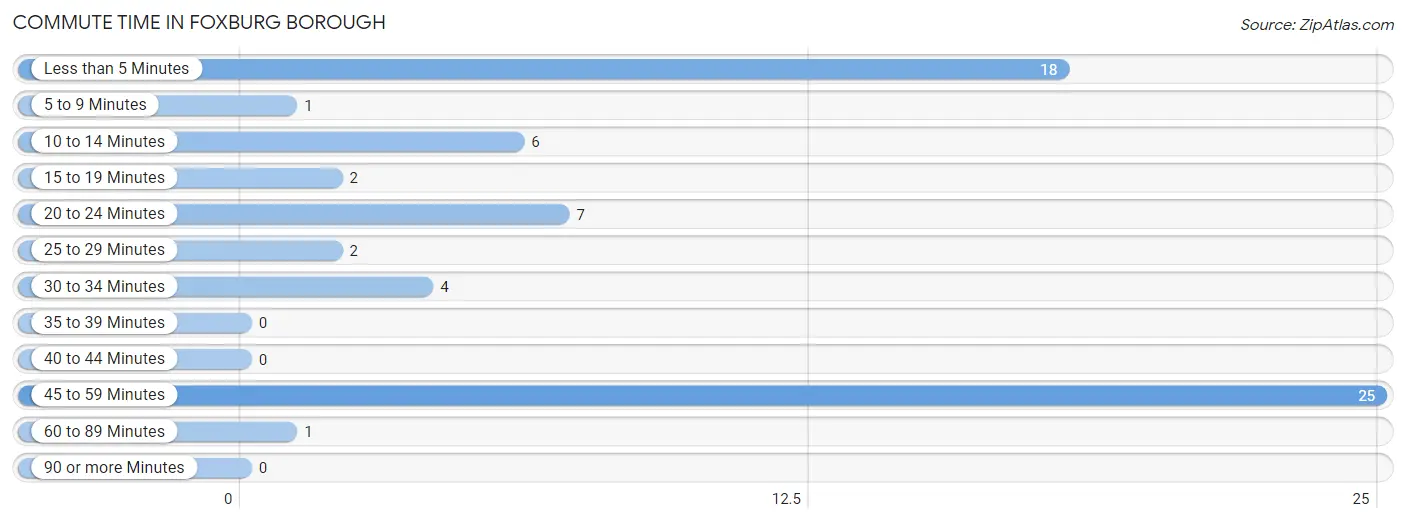
| Commute Time | # Commuters | % Commuters |
| Less than 5 Minutes | 18 | 27.3% |
| 5 to 9 Minutes | 1 | 1.5% |
| 10 to 14 Minutes | 6 | 9.1% |
| 15 to 19 Minutes | 2 | 3.0% |
| 20 to 24 Minutes | 7 | 10.6% |
| 25 to 29 Minutes | 2 | 3.0% |
| 30 to 34 Minutes | 4 | 6.1% |
| 35 to 39 Minutes | 0 | 0.0% |
| 40 to 44 Minutes | 0 | 0.0% |
| 45 to 59 Minutes | 25 | 37.9% |
| 60 to 89 Minutes | 1 | 1.5% |
| 90 or more Minutes | 0 | 0.0% |
Commute Time by Sex in Foxburg borough
The most common commute times in Foxburg borough are 45 to 59 minutes (24 commuters, 72.7%) for males and less than 5 minutes (16 commuters, 48.5%) for females.
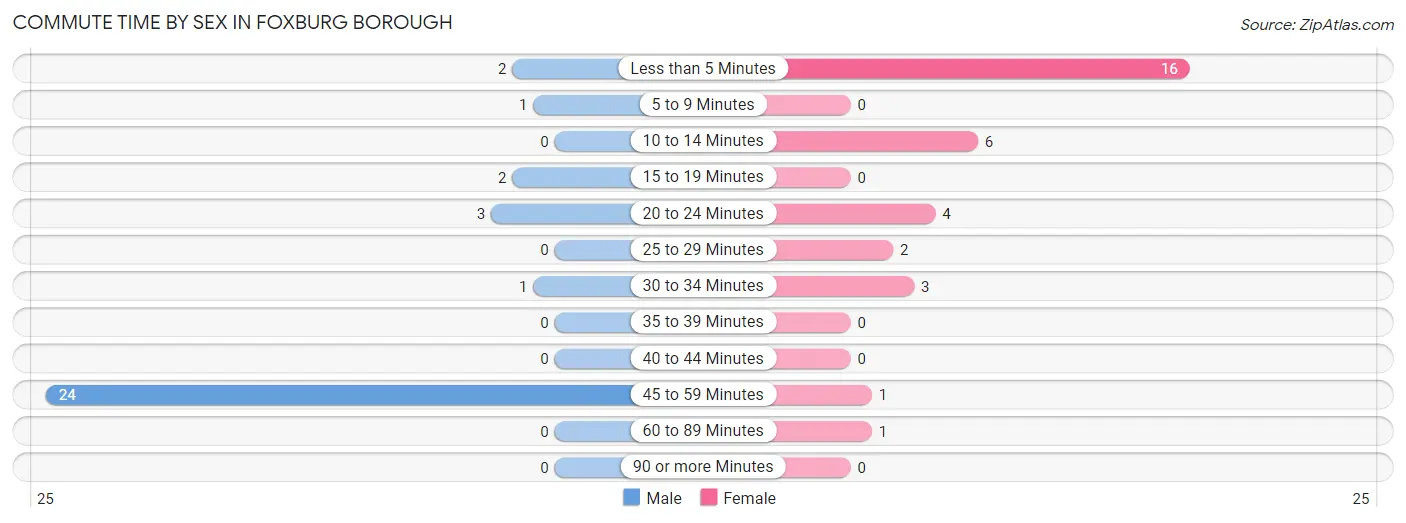
| Commute Time | Male | Female |
| Less than 5 Minutes | 2 (6.1%) | 16 (48.5%) |
| 5 to 9 Minutes | 1 (3.0%) | 0 (0.0%) |
| 10 to 14 Minutes | 0 (0.0%) | 6 (18.2%) |
| 15 to 19 Minutes | 2 (6.1%) | 0 (0.0%) |
| 20 to 24 Minutes | 3 (9.1%) | 4 (12.1%) |
| 25 to 29 Minutes | 0 (0.0%) | 2 (6.1%) |
| 30 to 34 Minutes | 1 (3.0%) | 3 (9.1%) |
| 35 to 39 Minutes | 0 (0.0%) | 0 (0.0%) |
| 40 to 44 Minutes | 0 (0.0%) | 0 (0.0%) |
| 45 to 59 Minutes | 24 (72.7%) | 1 (3.0%) |
| 60 to 89 Minutes | 0 (0.0%) | 1 (3.0%) |
| 90 or more Minutes | 0 (0.0%) | 0 (0.0%) |
Time of Departure to Work by Sex in Foxburg borough
The most frequent times of departure to work in Foxburg borough are 6:30 AM to 6:59 AM (19, 57.6%) for males and 9:00 AM to 9:59 AM (12, 36.4%) for females.
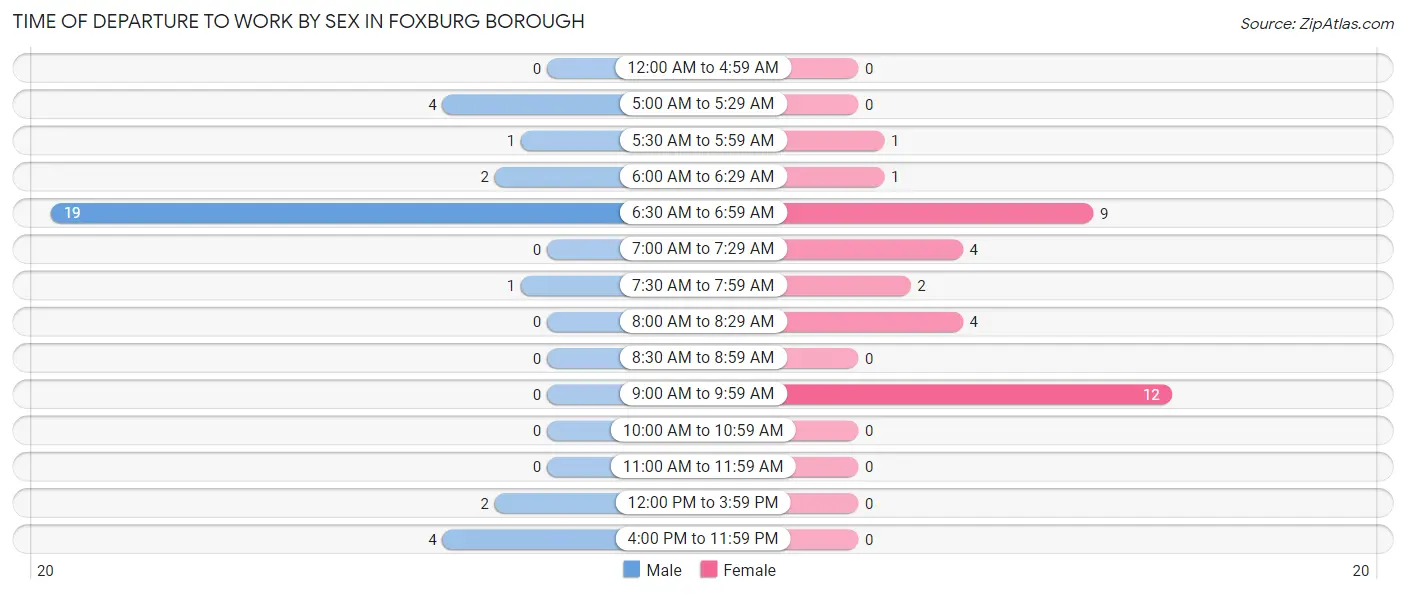
| Time of Departure | Male | Female |
| 12:00 AM to 4:59 AM | 0 (0.0%) | 0 (0.0%) |
| 5:00 AM to 5:29 AM | 4 (12.1%) | 0 (0.0%) |
| 5:30 AM to 5:59 AM | 1 (3.0%) | 1 (3.0%) |
| 6:00 AM to 6:29 AM | 2 (6.1%) | 1 (3.0%) |
| 6:30 AM to 6:59 AM | 19 (57.6%) | 9 (27.3%) |
| 7:00 AM to 7:29 AM | 0 (0.0%) | 4 (12.1%) |
| 7:30 AM to 7:59 AM | 1 (3.0%) | 2 (6.1%) |
| 8:00 AM to 8:29 AM | 0 (0.0%) | 4 (12.1%) |
| 8:30 AM to 8:59 AM | 0 (0.0%) | 0 (0.0%) |
| 9:00 AM to 9:59 AM | 0 (0.0%) | 12 (36.4%) |
| 10:00 AM to 10:59 AM | 0 (0.0%) | 0 (0.0%) |
| 11:00 AM to 11:59 AM | 0 (0.0%) | 0 (0.0%) |
| 12:00 PM to 3:59 PM | 2 (6.1%) | 0 (0.0%) |
| 4:00 PM to 11:59 PM | 4 (12.1%) | 0 (0.0%) |
| Total | 33 (100.0%) | 33 (100.0%) |
Housing Occupancy in Foxburg borough
Occupancy by Ownership in Foxburg borough
Of the total 116 dwellings in Foxburg borough, owner-occupied units account for 86 (74.1%), while renter-occupied units make up 30 (25.9%).
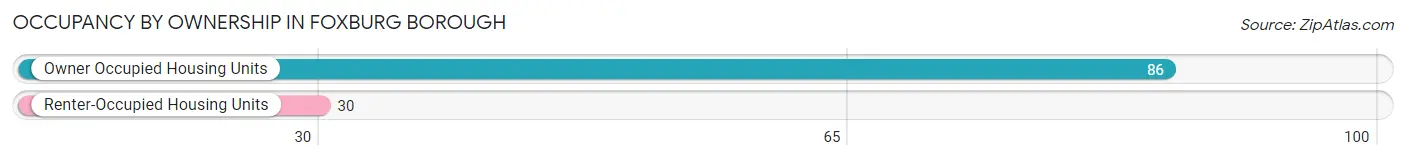
| Occupancy | # Housing Units | % Housing Units |
| Owner Occupied Housing Units | 86 | 74.1% |
| Renter-Occupied Housing Units | 30 | 25.9% |
| Total Occupied Housing Units | 116 | 100.0% |
Occupancy by Household Size in Foxburg borough
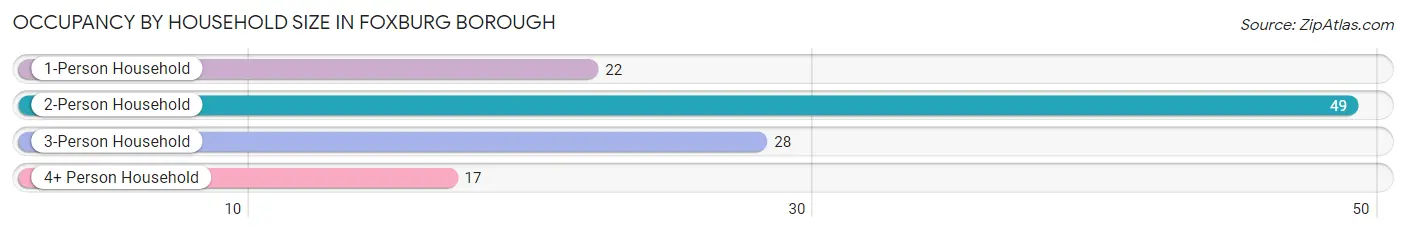
| Household Size | # Housing Units | % Housing Units |
| 1-Person Household | 22 | 19.0% |
| 2-Person Household | 49 | 42.2% |
| 3-Person Household | 28 | 24.1% |
| 4+ Person Household | 17 | 14.7% |
| Total Housing Units | 116 | 100.0% |
Occupancy by Ownership by Household Size in Foxburg borough
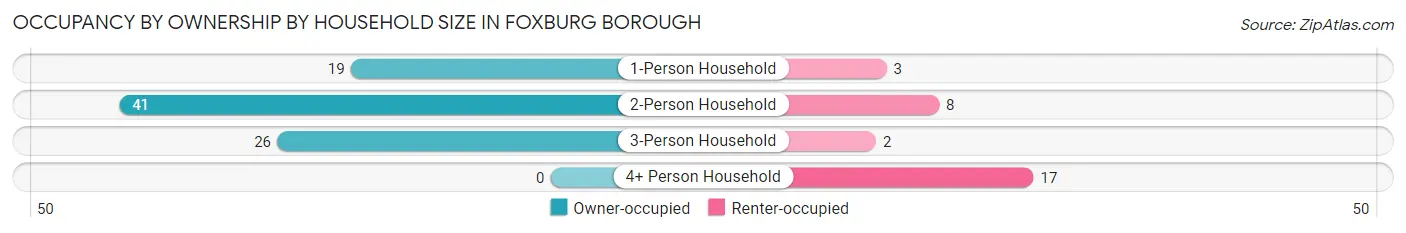
| Household Size | Owner-occupied | Renter-occupied |
| 1-Person Household | 19 (86.4%) | 3 (13.6%) |
| 2-Person Household | 41 (83.7%) | 8 (16.3%) |
| 3-Person Household | 26 (92.9%) | 2 (7.1%) |
| 4+ Person Household | 0 (0.0%) | 17 (100.0%) |
| Total Housing Units | 86 (74.1%) | 30 (25.9%) |
Occupancy by Educational Attainment in Foxburg borough
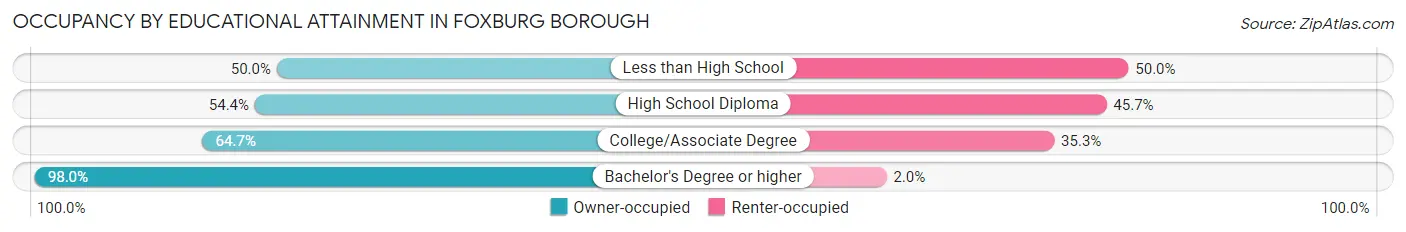
| Household Size | Owner-occupied | Renter-occupied |
| Less than High School | 2 (50.0%) | 2 (50.0%) |
| High School Diploma | 25 (54.3%) | 21 (45.7%) |
| College/Associate Degree | 11 (64.7%) | 6 (35.3%) |
| Bachelor's Degree or higher | 48 (98.0%) | 1 (2.0%) |
Occupancy by Age of Householder in Foxburg borough
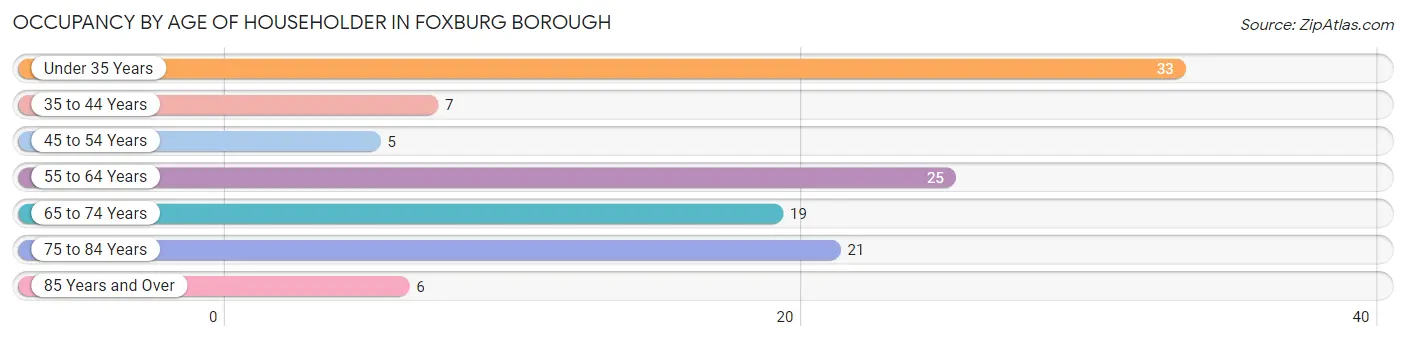
| Age Bracket | # Households | % Households |
| Under 35 Years | 33 | 28.4% |
| 35 to 44 Years | 7 | 6.0% |
| 45 to 54 Years | 5 | 4.3% |
| 55 to 64 Years | 25 | 21.5% |
| 65 to 74 Years | 19 | 16.4% |
| 75 to 84 Years | 21 | 18.1% |
| 85 Years and Over | 6 | 5.2% |
| Total | 116 | 100.0% |
Housing Finances in Foxburg borough
Median Income by Occupancy in Foxburg borough
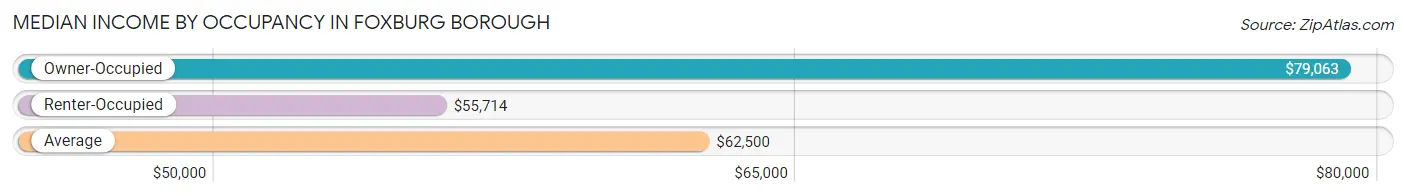
| Occupancy Type | # Households | Median Income |
| Owner-Occupied | 86 (74.1%) | $79,063 |
| Renter-Occupied | 30 (25.9%) | $55,714 |
| Average | 116 (100.0%) | $62,500 |
Occupancy by Householder Income Bracket in Foxburg borough
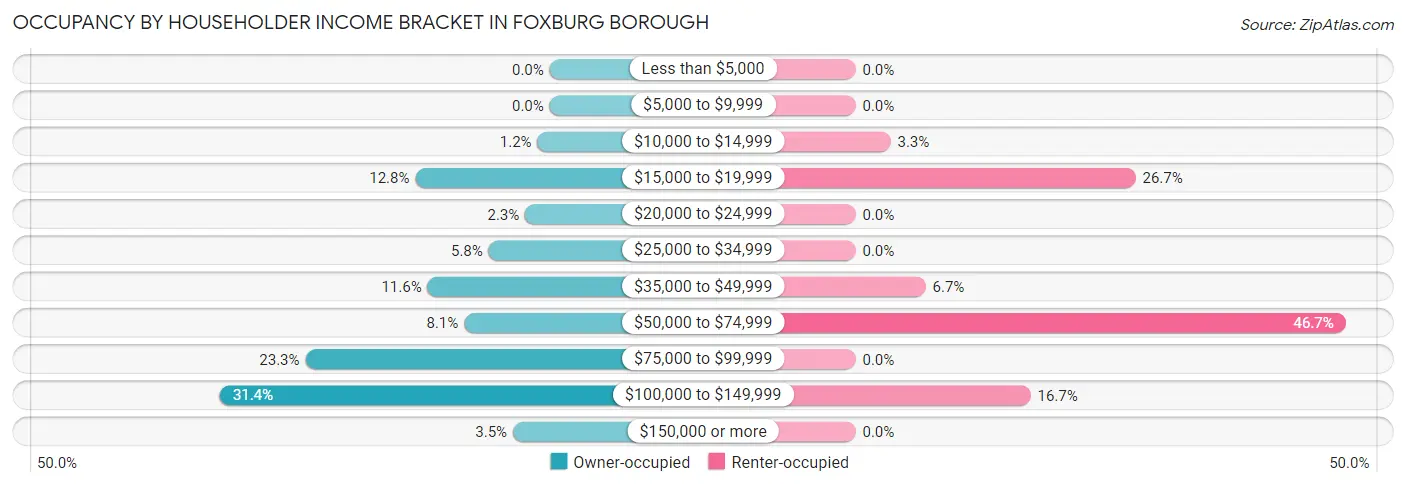
| Income Bracket | Owner-occupied | Renter-occupied |
| Less than $5,000 | 0 (0.0%) | 0 (0.0%) |
| $5,000 to $9,999 | 0 (0.0%) | 0 (0.0%) |
| $10,000 to $14,999 | 1 (1.2%) | 1 (3.3%) |
| $15,000 to $19,999 | 11 (12.8%) | 8 (26.7%) |
| $20,000 to $24,999 | 2 (2.3%) | 0 (0.0%) |
| $25,000 to $34,999 | 5 (5.8%) | 0 (0.0%) |
| $35,000 to $49,999 | 10 (11.6%) | 2 (6.7%) |
| $50,000 to $74,999 | 7 (8.1%) | 14 (46.7%) |
| $75,000 to $99,999 | 20 (23.3%) | 0 (0.0%) |
| $100,000 to $149,999 | 27 (31.4%) | 5 (16.7%) |
| $150,000 or more | 3 (3.5%) | 0 (0.0%) |
| Total | 86 (100.0%) | 30 (100.0%) |
Monthly Housing Cost Tiers in Foxburg borough
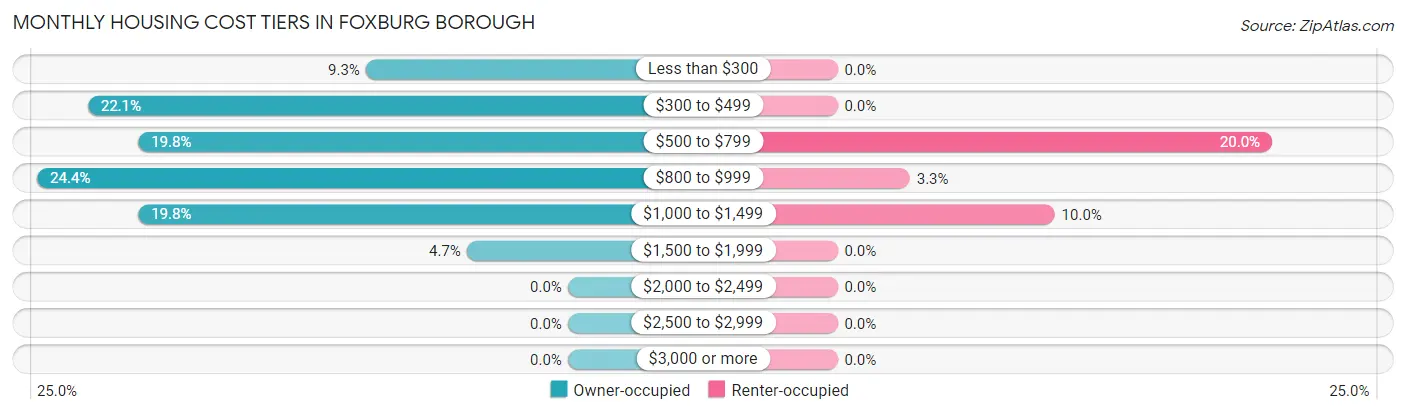
| Monthly Cost | Owner-occupied | Renter-occupied |
| Less than $300 | 8 (9.3%) | 0 (0.0%) |
| $300 to $499 | 19 (22.1%) | 0 (0.0%) |
| $500 to $799 | 17 (19.8%) | 6 (20.0%) |
| $800 to $999 | 21 (24.4%) | 1 (3.3%) |
| $1,000 to $1,499 | 17 (19.8%) | 3 (10.0%) |
| $1,500 to $1,999 | 4 (4.6%) | 0 (0.0%) |
| $2,000 to $2,499 | 0 (0.0%) | 0 (0.0%) |
| $2,500 to $2,999 | 0 (0.0%) | 0 (0.0%) |
| $3,000 or more | 0 (0.0%) | 0 (0.0%) |
| Total | 86 (100.0%) | 30 (100.0%) |
Physical Housing Characteristics in Foxburg borough
Housing Structures in Foxburg borough
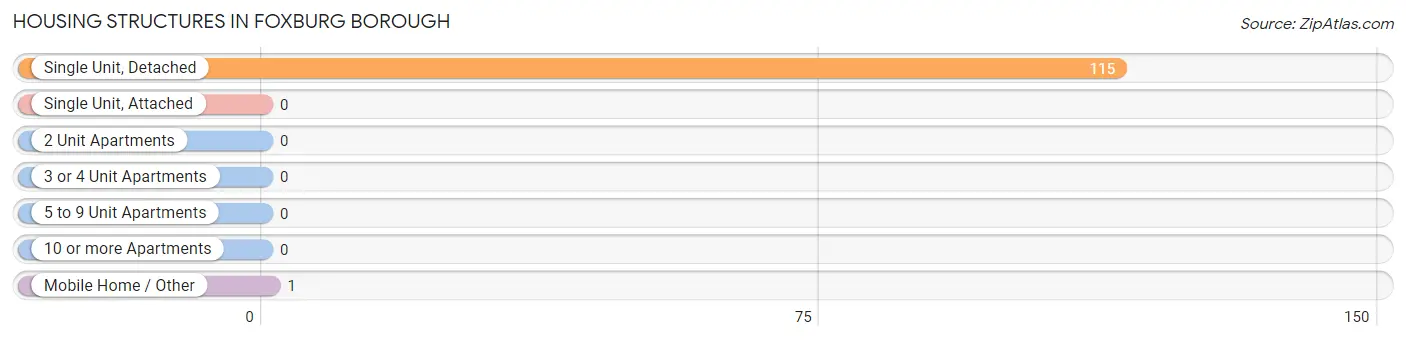
| Structure Type | # Housing Units | % Housing Units |
| Single Unit, Detached | 115 | 99.1% |
| Single Unit, Attached | 0 | 0.0% |
| 2 Unit Apartments | 0 | 0.0% |
| 3 or 4 Unit Apartments | 0 | 0.0% |
| 5 to 9 Unit Apartments | 0 | 0.0% |
| 10 or more Apartments | 0 | 0.0% |
| Mobile Home / Other | 1 | 0.9% |
| Total | 116 | 100.0% |
Housing Structures by Occupancy in Foxburg borough
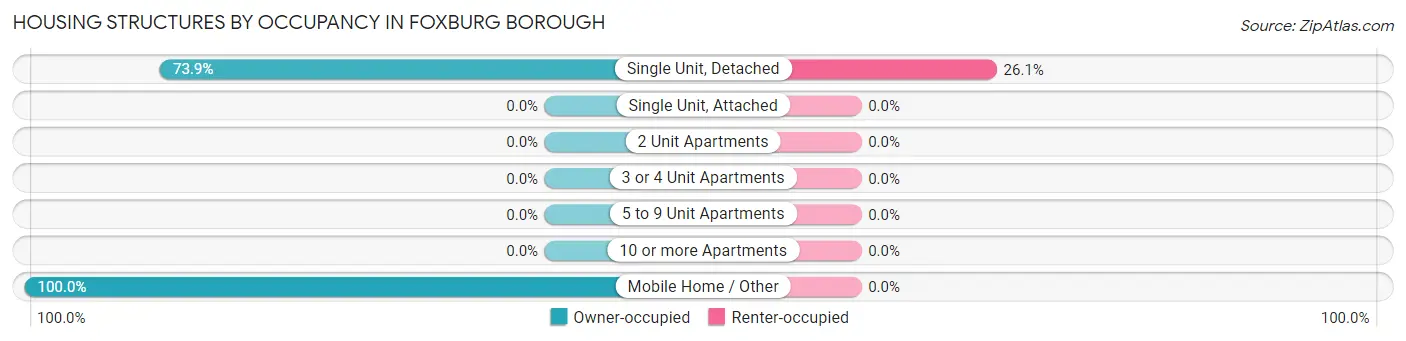
| Structure Type | Owner-occupied | Renter-occupied |
| Single Unit, Detached | 85 (73.9%) | 30 (26.1%) |
| Single Unit, Attached | 0 (0.0%) | 0 (0.0%) |
| 2 Unit Apartments | 0 (0.0%) | 0 (0.0%) |
| 3 or 4 Unit Apartments | 0 (0.0%) | 0 (0.0%) |
| 5 to 9 Unit Apartments | 0 (0.0%) | 0 (0.0%) |
| 10 or more Apartments | 0 (0.0%) | 0 (0.0%) |
| Mobile Home / Other | 1 (100.0%) | 0 (0.0%) |
| Total | 86 (74.1%) | 30 (25.9%) |
Housing Structures by Number of Rooms in Foxburg borough
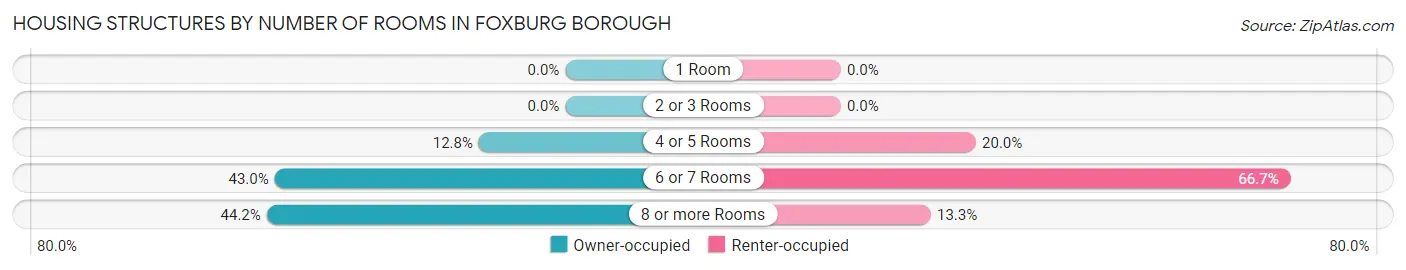
| Number of Rooms | Owner-occupied | Renter-occupied |
| 1 Room | 0 (0.0%) | 0 (0.0%) |
| 2 or 3 Rooms | 0 (0.0%) | 0 (0.0%) |
| 4 or 5 Rooms | 11 (12.8%) | 6 (20.0%) |
| 6 or 7 Rooms | 37 (43.0%) | 20 (66.7%) |
| 8 or more Rooms | 38 (44.2%) | 4 (13.3%) |
| Total | 86 (100.0%) | 30 (100.0%) |
Housing Structure by Heating Type in Foxburg borough
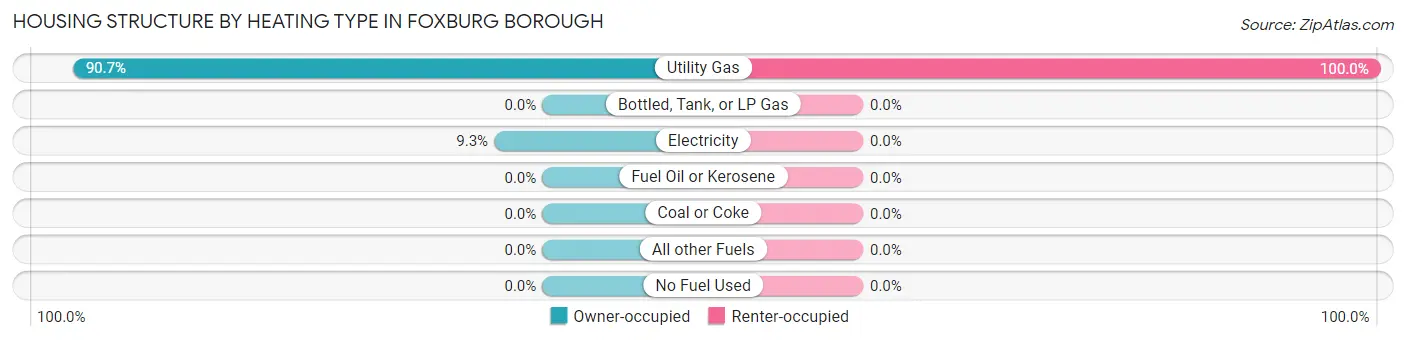
| Heating Type | Owner-occupied | Renter-occupied |
| Utility Gas | 78 (90.7%) | 30 (100.0%) |
| Bottled, Tank, or LP Gas | 0 (0.0%) | 0 (0.0%) |
| Electricity | 8 (9.3%) | 0 (0.0%) |
| Fuel Oil or Kerosene | 0 (0.0%) | 0 (0.0%) |
| Coal or Coke | 0 (0.0%) | 0 (0.0%) |
| All other Fuels | 0 (0.0%) | 0 (0.0%) |
| No Fuel Used | 0 (0.0%) | 0 (0.0%) |
| Total | 86 (100.0%) | 30 (100.0%) |
Household Vehicle Usage in Foxburg borough
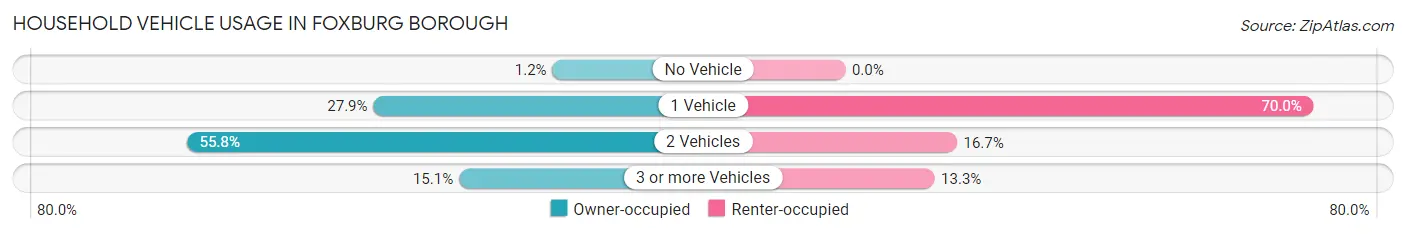
| Vehicles per Household | Owner-occupied | Renter-occupied |
| No Vehicle | 1 (1.2%) | 0 (0.0%) |
| 1 Vehicle | 24 (27.9%) | 21 (70.0%) |
| 2 Vehicles | 48 (55.8%) | 5 (16.7%) |
| 3 or more Vehicles | 13 (15.1%) | 4 (13.3%) |
| Total | 86 (100.0%) | 30 (100.0%) |
Real Estate & Mortgages in Foxburg borough
Real Estate and Mortgage Overview in Foxburg borough
| Characteristic | Without Mortgage | With Mortgage |
| Housing Units | 64 | 22 |
| Median Property Value | $137,500 | $156,300 |
| Median Household Income | $73,750 | $1 |
| Monthly Housing Costs | $556 | $0 |
| Real Estate Taxes | $1,077 | $2 |
Property Value by Mortgage Status in Foxburg borough
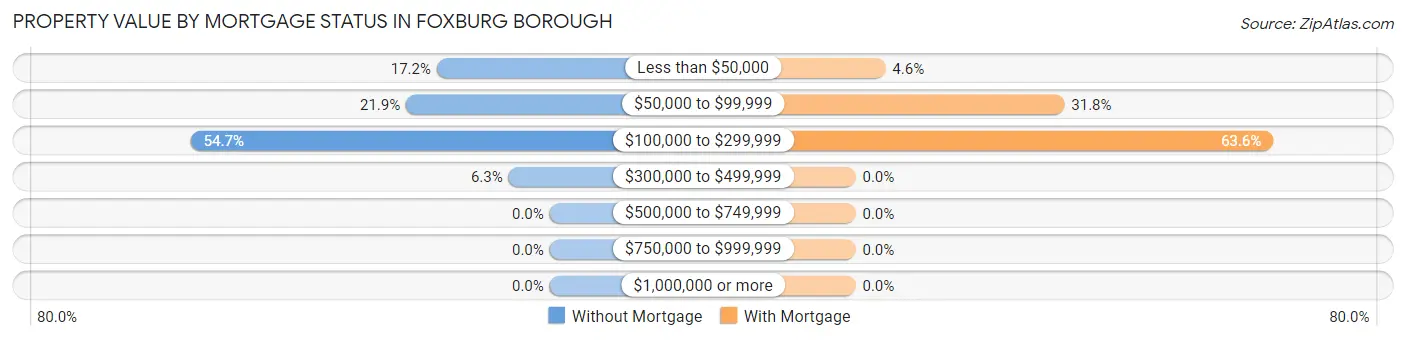
| Property Value | Without Mortgage | With Mortgage |
| Less than $50,000 | 11 (17.2%) | 1 (4.5%) |
| $50,000 to $99,999 | 14 (21.9%) | 7 (31.8%) |
| $100,000 to $299,999 | 35 (54.7%) | 14 (63.6%) |
| $300,000 to $499,999 | 4 (6.2%) | 0 (0.0%) |
| $500,000 to $749,999 | 0 (0.0%) | 0 (0.0%) |
| $750,000 to $999,999 | 0 (0.0%) | 0 (0.0%) |
| $1,000,000 or more | 0 (0.0%) | 0 (0.0%) |
| Total | 64 (100.0%) | 22 (100.0%) |
Household Income by Mortgage Status in Foxburg borough
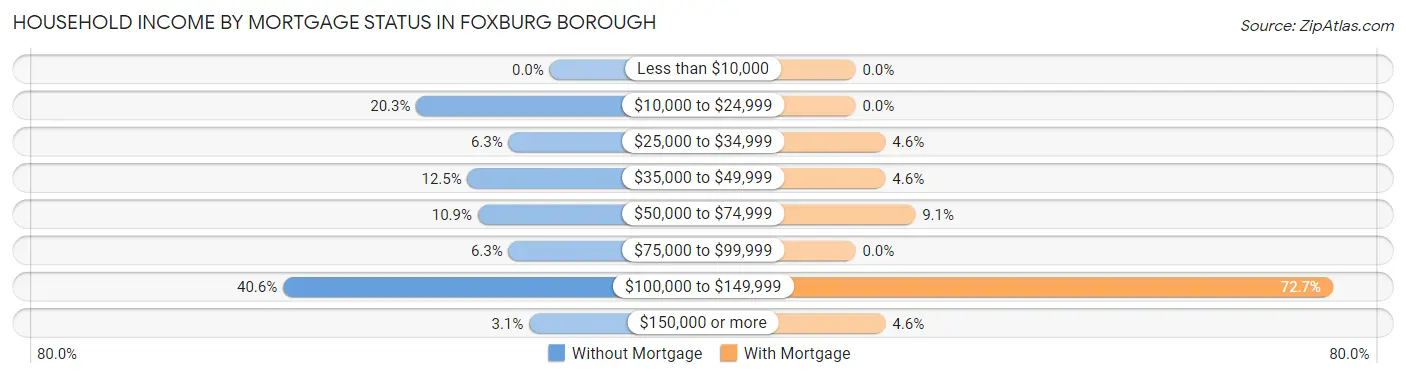
| Household Income | Without Mortgage | With Mortgage |
| Less than $10,000 | 0 (0.0%) | 0 (0.0%) |
| $10,000 to $24,999 | 13 (20.3%) | 0 (0.0%) |
| $25,000 to $34,999 | 4 (6.2%) | 1 (4.5%) |
| $35,000 to $49,999 | 8 (12.5%) | 1 (4.5%) |
| $50,000 to $74,999 | 7 (10.9%) | 2 (9.1%) |
| $75,000 to $99,999 | 4 (6.2%) | 0 (0.0%) |
| $100,000 to $149,999 | 26 (40.6%) | 16 (72.7%) |
| $150,000 or more | 2 (3.1%) | 1 (4.5%) |
| Total | 64 (100.0%) | 22 (100.0%) |
Property Value to Household Income Ratio in Foxburg borough
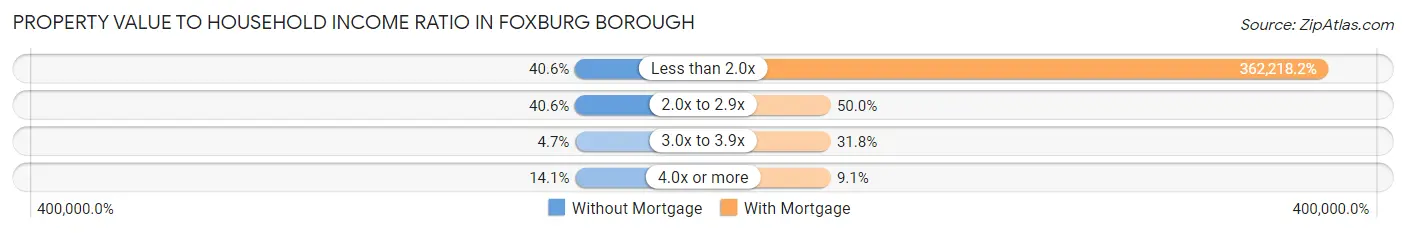
| Value-to-Income Ratio | Without Mortgage | With Mortgage |
| Less than 2.0x | 26 (40.6%) | 79,688 (362,218.2%) |
| 2.0x to 2.9x | 26 (40.6%) | 11 (50.0%) |
| 3.0x to 3.9x | 3 (4.7%) | 7 (31.8%) |
| 4.0x or more | 9 (14.1%) | 2 (9.1%) |
| Total | 64 (100.0%) | 22 (100.0%) |
Real Estate Taxes by Mortgage Status in Foxburg borough
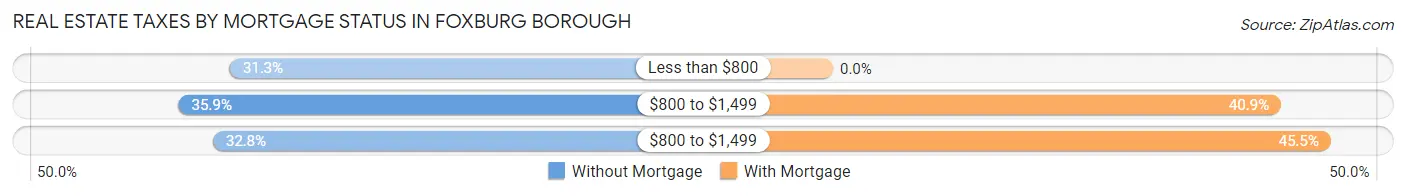
| Property Taxes | Without Mortgage | With Mortgage |
| Less than $800 | 20 (31.2%) | 0 (0.0%) |
| $800 to $1,499 | 23 (35.9%) | 9 (40.9%) |
| $800 to $1,499 | 21 (32.8%) | 10 (45.5%) |
| Total | 64 (100.0%) | 22 (100.0%) |
Health & Disability in Foxburg borough
Health Insurance Coverage by Age in Foxburg borough
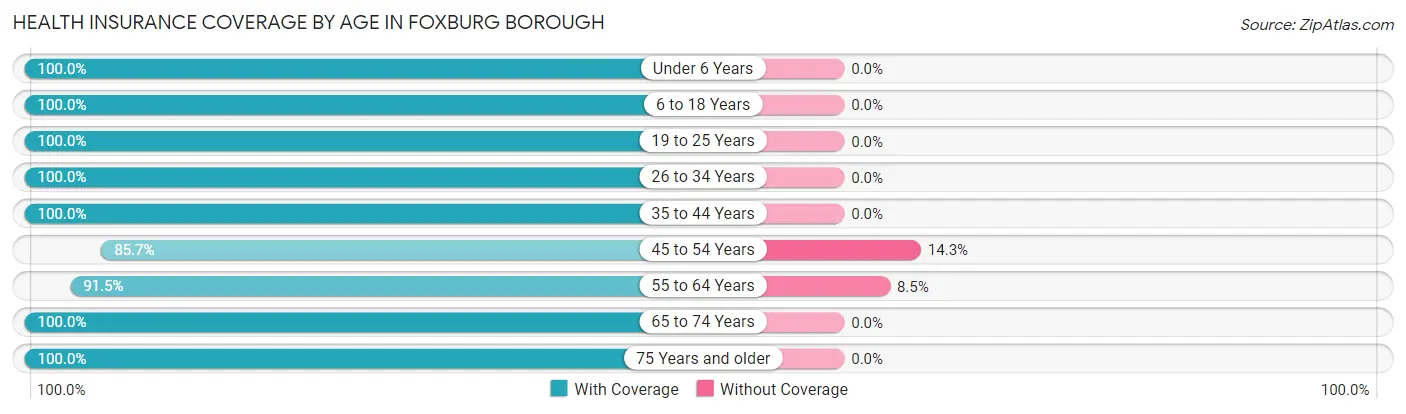
| Age Bracket | With Coverage | Without Coverage |
| Under 6 Years | 42 (100.0%) | 0 (0.0%) |
| 6 to 18 Years | 40 (100.0%) | 0 (0.0%) |
| 19 to 25 Years | 18 (100.0%) | 0 (0.0%) |
| 26 to 34 Years | 18 (100.0%) | 0 (0.0%) |
| 35 to 44 Years | 37 (100.0%) | 0 (0.0%) |
| 45 to 54 Years | 12 (85.7%) | 2 (14.3%) |
| 55 to 64 Years | 43 (91.5%) | 4 (8.5%) |
| 65 to 74 Years | 30 (100.0%) | 0 (0.0%) |
| 75 Years and older | 43 (100.0%) | 0 (0.0%) |
| Total | 283 (97.9%) | 6 (2.1%) |
Health Insurance Coverage by Citizenship Status in Foxburg borough
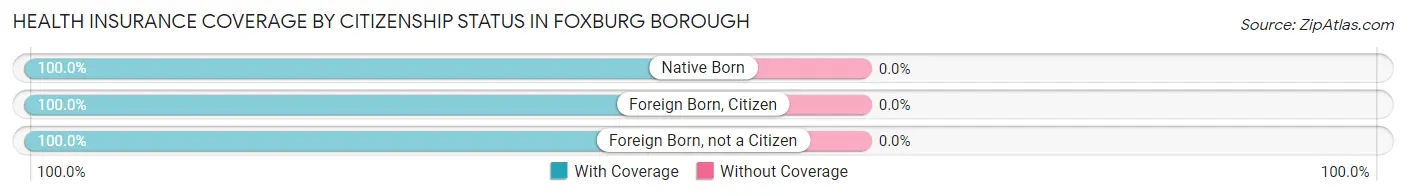
| Citizenship Status | With Coverage | Without Coverage |
| Native Born | 42 (100.0%) | 0 (0.0%) |
| Foreign Born, Citizen | 40 (100.0%) | 0 (0.0%) |
| Foreign Born, not a Citizen | 18 (100.0%) | 0 (0.0%) |
Health Insurance Coverage by Household Income in Foxburg borough
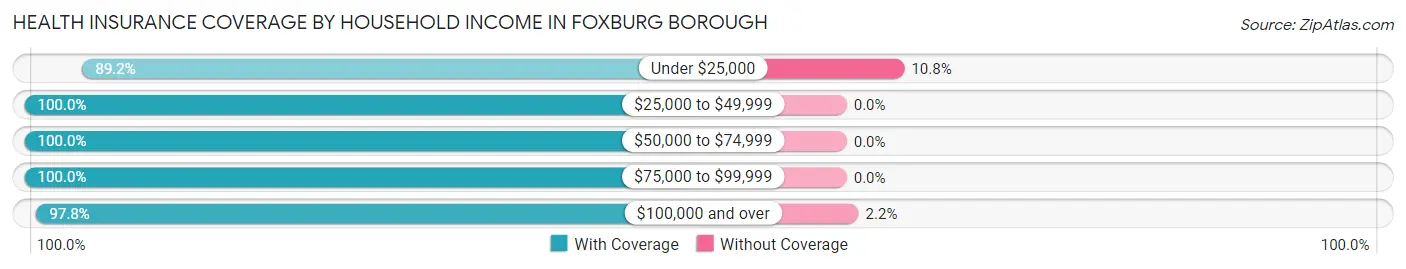
| Household Income | With Coverage | Without Coverage |
| Under $25,000 | 33 (89.2%) | 4 (10.8%) |
| $25,000 to $49,999 | 30 (100.0%) | 0 (0.0%) |
| $50,000 to $74,999 | 91 (100.0%) | 0 (0.0%) |
| $75,000 to $99,999 | 41 (100.0%) | 0 (0.0%) |
| $100,000 and over | 88 (97.8%) | 2 (2.2%) |
Public vs Private Health Insurance Coverage by Age in Foxburg borough
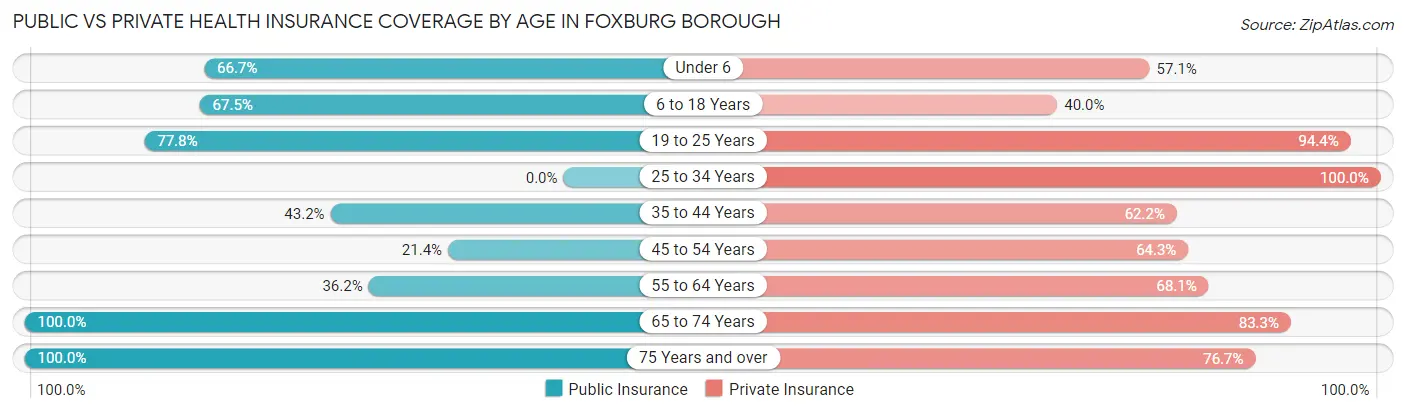
| Age Bracket | Public Insurance | Private Insurance |
| Under 6 | 28 (66.7%) | 24 (57.1%) |
| 6 to 18 Years | 27 (67.5%) | 16 (40.0%) |
| 19 to 25 Years | 14 (77.8%) | 17 (94.4%) |
| 25 to 34 Years | 0 (0.0%) | 18 (100.0%) |
| 35 to 44 Years | 16 (43.2%) | 23 (62.2%) |
| 45 to 54 Years | 3 (21.4%) | 9 (64.3%) |
| 55 to 64 Years | 17 (36.2%) | 32 (68.1%) |
| 65 to 74 Years | 30 (100.0%) | 25 (83.3%) |
| 75 Years and over | 43 (100.0%) | 33 (76.7%) |
| Total | 178 (61.6%) | 197 (68.2%) |
Disability Status by Sex by Age in Foxburg borough
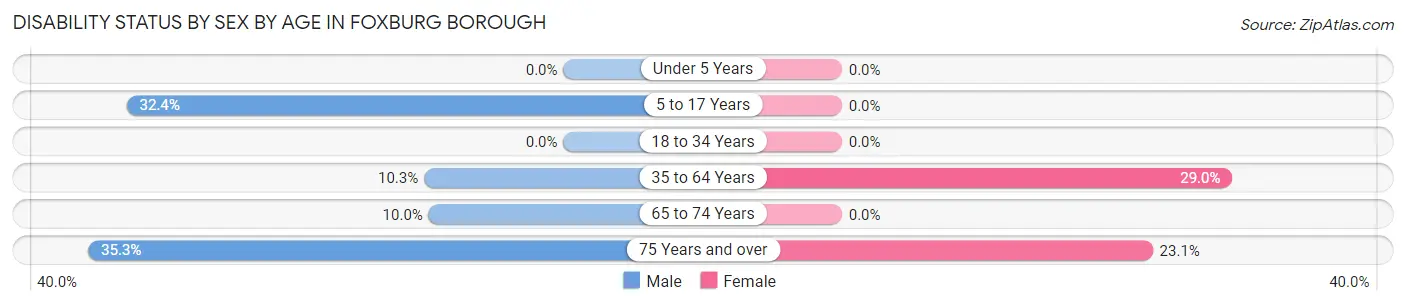
| Age Bracket | Male | Female |
| Under 5 Years | 0 (0.0%) | 0 (0.0%) |
| 5 to 17 Years | 12 (32.4%) | 0 (0.0%) |
| 18 to 34 Years | 0 (0.0%) | 0 (0.0%) |
| 35 to 64 Years | 3 (10.3%) | 20 (29.0%) |
| 65 to 74 Years | 2 (10.0%) | 0 (0.0%) |
| 75 Years and over | 6 (35.3%) | 6 (23.1%) |
Disability Class by Sex by Age in Foxburg borough
Disability Class: Hearing Difficulty
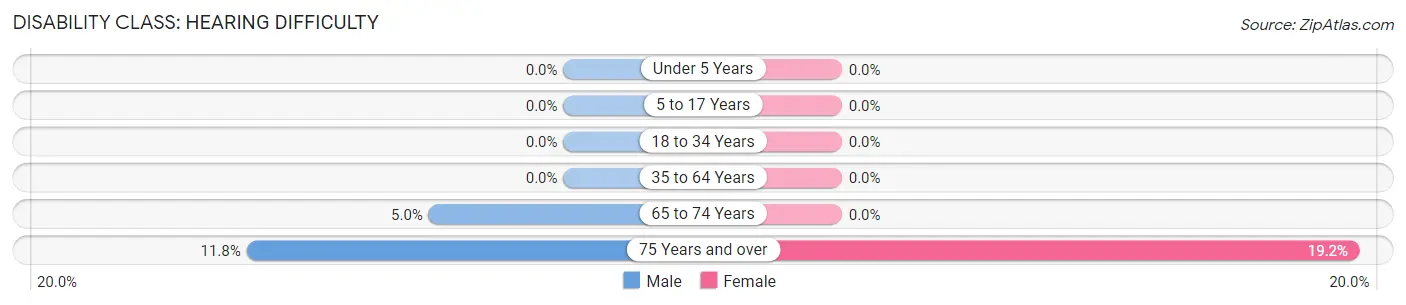
| Age Bracket | Male | Female |
| Under 5 Years | 0 (0.0%) | 0 (0.0%) |
| 5 to 17 Years | 0 (0.0%) | 0 (0.0%) |
| 18 to 34 Years | 0 (0.0%) | 0 (0.0%) |
| 35 to 64 Years | 0 (0.0%) | 0 (0.0%) |
| 65 to 74 Years | 1 (5.0%) | 0 (0.0%) |
| 75 Years and over | 2 (11.8%) | 5 (19.2%) |
Disability Class: Vision Difficulty
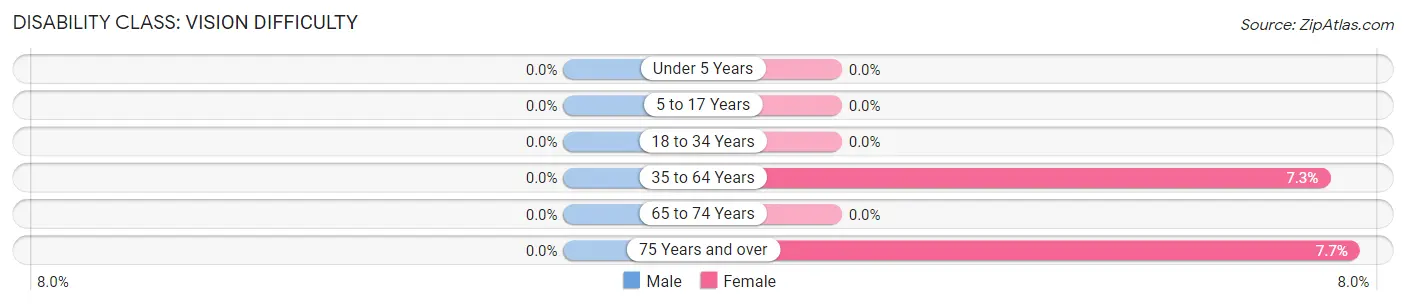
| Age Bracket | Male | Female |
| Under 5 Years | 0 (0.0%) | 0 (0.0%) |
| 5 to 17 Years | 0 (0.0%) | 0 (0.0%) |
| 18 to 34 Years | 0 (0.0%) | 0 (0.0%) |
| 35 to 64 Years | 0 (0.0%) | 5 (7.2%) |
| 65 to 74 Years | 0 (0.0%) | 0 (0.0%) |
| 75 Years and over | 0 (0.0%) | 2 (7.7%) |
Disability Class: Cognitive Difficulty
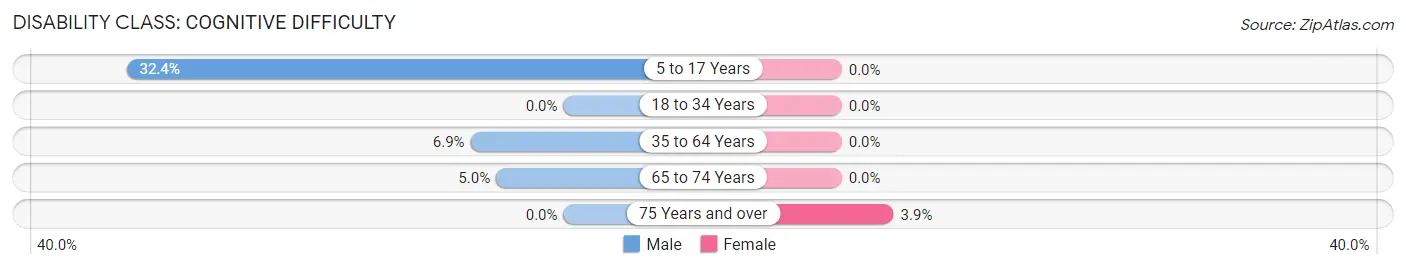
| Age Bracket | Male | Female |
| 5 to 17 Years | 12 (32.4%) | 0 (0.0%) |
| 18 to 34 Years | 0 (0.0%) | 0 (0.0%) |
| 35 to 64 Years | 2 (6.9%) | 0 (0.0%) |
| 65 to 74 Years | 1 (5.0%) | 0 (0.0%) |
| 75 Years and over | 0 (0.0%) | 1 (3.8%) |
Disability Class: Ambulatory Difficulty
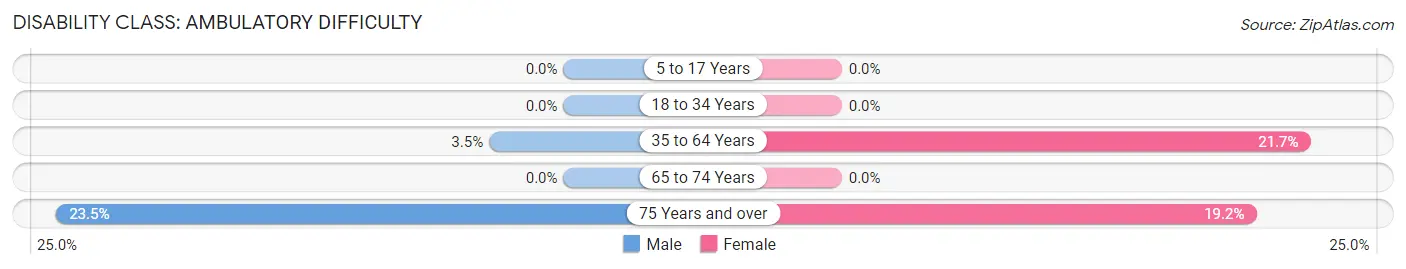
| Age Bracket | Male | Female |
| 5 to 17 Years | 0 (0.0%) | 0 (0.0%) |
| 18 to 34 Years | 0 (0.0%) | 0 (0.0%) |
| 35 to 64 Years | 1 (3.5%) | 15 (21.7%) |
| 65 to 74 Years | 0 (0.0%) | 0 (0.0%) |
| 75 Years and over | 4 (23.5%) | 5 (19.2%) |
Disability Class: Self-Care Difficulty
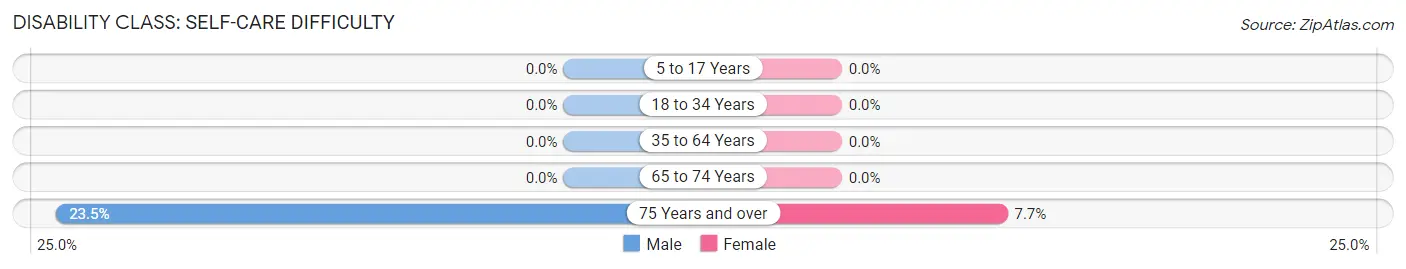
| Age Bracket | Male | Female |
| 5 to 17 Years | 0 (0.0%) | 0 (0.0%) |
| 18 to 34 Years | 0 (0.0%) | 0 (0.0%) |
| 35 to 64 Years | 0 (0.0%) | 0 (0.0%) |
| 65 to 74 Years | 0 (0.0%) | 0 (0.0%) |
| 75 Years and over | 4 (23.5%) | 2 (7.7%) |
Technology Access in Foxburg borough
Computing Device Access in Foxburg borough
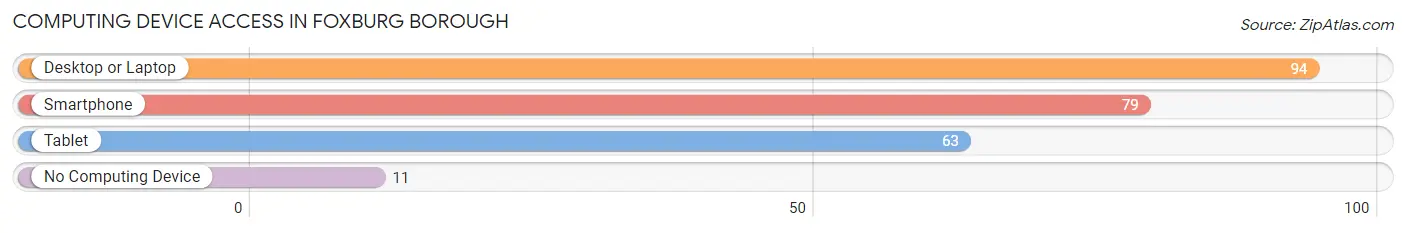
| Device Type | # Households | % Households |
| Desktop or Laptop | 94 | 81.0% |
| Smartphone | 79 | 68.1% |
| Tablet | 63 | 54.3% |
| No Computing Device | 11 | 9.5% |
| Total | 116 | 100.0% |
Internet Access in Foxburg borough
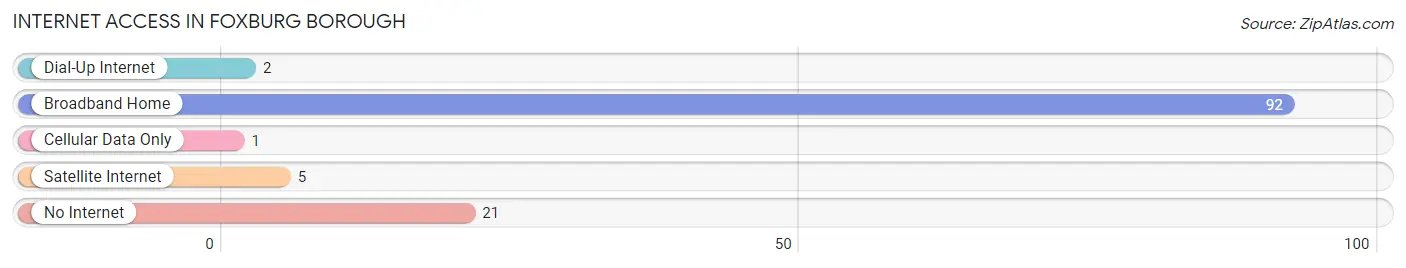
| Internet Type | # Households | % Households |
| Dial-Up Internet | 2 | 1.7% |
| Broadband Home | 92 | 79.3% |
| Cellular Data Only | 1 | 0.9% |
| Satellite Internet | 5 | 4.3% |
| No Internet | 21 | 18.1% |
| Total | 116 | 100.0% |
Foxburg borough Summary
Foxburg Borough is a small borough located in Clarion County, Pennsylvania. It is situated along the Allegheny River, approximately 40 miles northeast of Pittsburgh. The borough was founded in 1836 and is the oldest borough in Clarion County. As of the 2010 census, the population of Foxburg was just over 200 people.
History
Foxburg Borough was founded in 1836 by William Fox, a local businessman and entrepreneur. Fox had purchased a large tract of land along the Allegheny River and began to develop the area. He built a sawmill, gristmill, and a store, and the area quickly grew. In 1836, Foxburg was officially incorporated as a borough.
In the late 19th century, Foxburg became a popular destination for tourists. The area was known for its natural beauty and its many recreational activities, such as fishing, hunting, and boating. The Foxburg Country Club was established in 1895 and is the oldest golf course in continuous use in the United States.
In the early 20th century, Foxburg continued to be a popular tourist destination. The Foxburg Inn, which was built in 1891, was a popular destination for visitors. The inn was destroyed by fire in the 1950s, but the Foxburg Hotel was built in its place and continues to be a popular destination for visitors.
Geography
Foxburg Borough is located in Clarion County, Pennsylvania. It is situated along the Allegheny River, approximately 40 miles northeast of Pittsburgh. The borough covers an area of 0.6 square miles and has a population of just over 200 people.
The borough is located in a rural area and is surrounded by rolling hills and forests. The Allegheny River runs through the borough and is a popular destination for fishing, boating, and other recreational activities.
Economy
Foxburg Borough has a small, but vibrant economy. The borough is home to several small businesses, including restaurants, shops, and a winery. The Foxburg Country Club is a popular destination for golfers and is the oldest golf course in continuous use in the United States.
The borough is also home to several manufacturing companies, including a furniture manufacturer and a metal fabrication company. The borough is also home to several farms, which produce a variety of crops, including corn, soybeans, and hay.
Demographics
As of the 2010 census, the population of Foxburg Borough was just over 200 people. The racial makeup of the borough was 97.5% White, 0.5% African American, 0.5% Native American, 0.5% Asian, and 1.0% from other races.
The median household income in Foxburg Borough was $41,250, and the median family income was $50,000. The per capita income in the borough was $20,000. Approximately 8.5% of the population was below the poverty line.
Conclusion
Foxburg Borough is a small borough located in Clarion County, Pennsylvania. It is situated along the Allegheny River, approximately 40 miles northeast of Pittsburgh. The borough was founded in 1836 and is the oldest borough in Clarion County. As of the 2010 census, the population of Foxburg was just over 200 people.
Foxburg Borough has a small, but vibrant economy. The borough is home to several small businesses, including restaurants, shops, and a winery. The Foxburg Country Club is a popular destination for golfers and is the oldest golf course in continuous use in the United States. The borough is also home to several manufacturing companies and farms.
As of the 2010 census, the population of Foxburg Borough was just over 200 people. The racial makeup of the borough was 97.5% White, 0.5% African American, 0.5% Native American, 0.5% Asian, and 1.0% from other races. The median household income in Foxburg Borough was $41,250, and the median family income was $50,000. Approximately 8.5% of the population was below the poverty line.
Common Questions
What is the Total Population of Foxburg borough?
Total Population of Foxburg borough is 289.
What is the Total Male Population of Foxburg borough?
Total Male Population of Foxburg borough is 136.
What is the Total Female Population of Foxburg borough?
Total Female Population of Foxburg borough is 153.
What is the Ratio of Males per 100 Females in Foxburg borough?
There are 88.89 Males per 100 Females in Foxburg borough.
What is the Ratio of Females per 100 Males in Foxburg borough?
There are 112.50 Females per 100 Males in Foxburg borough.
What is the Median Population Age in Foxburg borough?
Median Population Age in Foxburg borough is 38.4 Years.
What is the Average Family Size in Foxburg borough
Average Family Size in Foxburg borough is 3.0 People.
What is the Average Household Size in Foxburg borough
Average Household Size in Foxburg borough is 2.5 People.
What is Per Capita Income in Foxburg borough?
Per Capita income in Foxburg borough is $28,145.
What is the Median Family Income in Foxburg borough?
Median Family Income in Foxburg borough is $85,500.
What is the Median Household income in Foxburg borough?
Median Household Income in Foxburg borough is $62,500.
What is Inequality or Gini Index in Foxburg borough?
Inequality or Gini Index in Foxburg borough is 0.32.
How Large is the Labor Force in Foxburg borough?
There are 99 People in the Labor Forcein in Foxburg borough.
What is the Percentage of People in the Labor Force in Foxburg borough?
47.1% of People are in the Labor Force in Foxburg borough.
What is the Unemployment Rate in Foxburg borough?
Unemployment Rate in Foxburg borough is 19.2%.