Burnside borough, PA
Burnside borough Overview
163
TOTAL POPULATION
84
MALE POPULATION
79
FEMALE POPULATION
106.33
MALES / 100 FEMALES
94.05
FEMALES / 100 MALES
50.6
MEDIAN AGE
2.7
AVG FAMILY SIZE
2.2
AVG HOUSEHOLD SIZE
$25,380
PER CAPITA INCOME
$48,500
AVG FAMILY INCOME
$47,500
AVG HOUSEHOLD INCOME
0.39
INEQUALITY / GINI INDEX
88
LABOR FORCE [ PEOPLE ]
60.7%
PERCENT IN LABOR FORCE
27.3%
UNEMPLOYMENT RATE
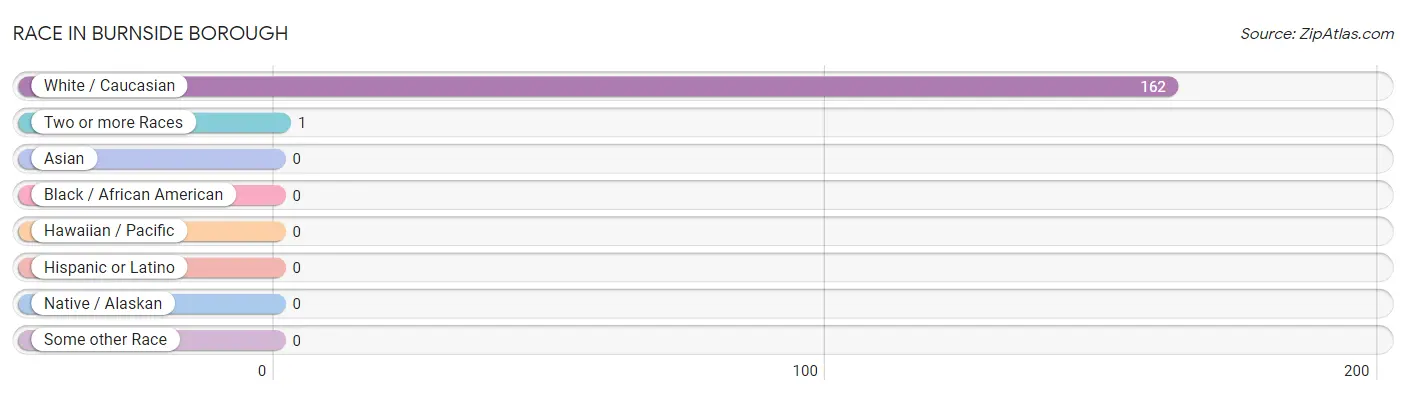
Race in Burnside borough
The most populous races in Burnside borough are White / Caucasian (162 | 99.4%), and Two or more Races (1 | 0.6%).
| Race | # Population | % Population |
| Asian | 0 | 0.0% |
| Black / African American | 0 | 0.0% |
| Hawaiian / Pacific | 0 | 0.0% |
| Hispanic or Latino | 0 | 0.0% |
| Native / Alaskan | 0 | 0.0% |
| White / Caucasian | 162 | 99.4% |
| Two or more Races | 1 | 0.6% |
| Some other Race | 0 | 0.0% |
| Total | 163 | 100.0% |
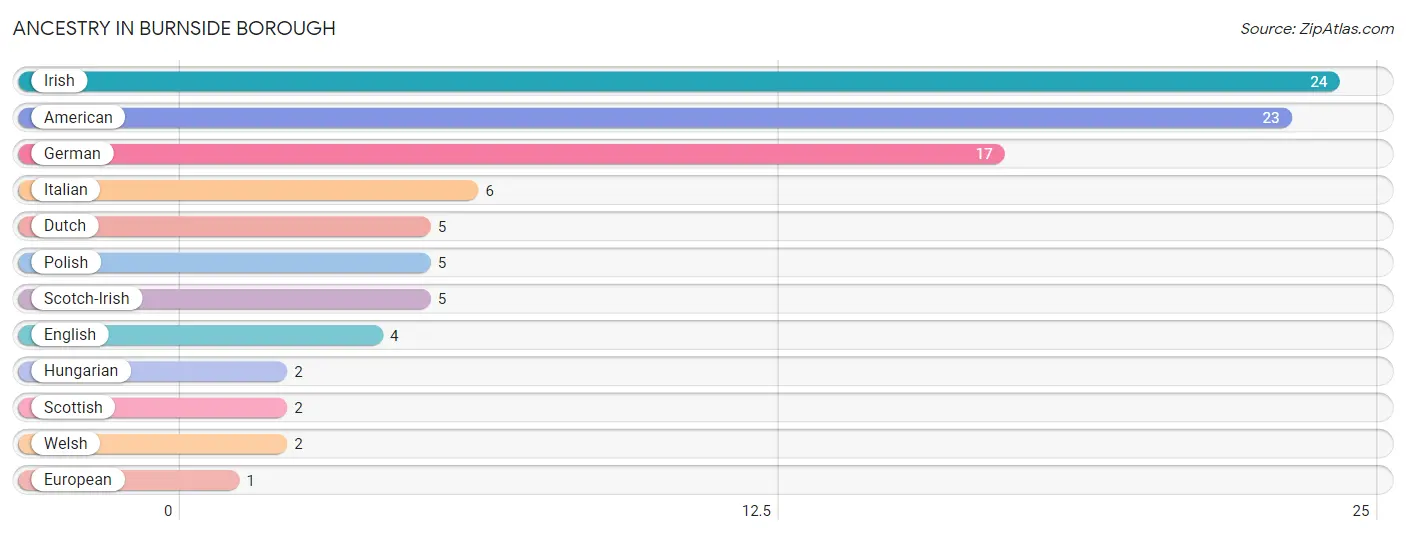
Ancestry in Burnside borough
The most populous ancestries reported in Burnside borough are Irish (24 | 14.7%), American (23 | 14.1%), German (17 | 10.4%), Italian (6 | 3.7%), and Dutch (5 | 3.1%), together accounting for 46.0% of all Burnside borough residents.
| Ancestry | # Population | % Population |
| American | 23 | 14.1% |
| Dutch | 5 | 3.1% |
| English | 4 | 2.5% |
| European | 1 | 0.6% |
| German | 17 | 10.4% |
| Hungarian | 2 | 1.2% |
| Irish | 24 | 14.7% |
| Italian | 6 | 3.7% |
| Polish | 5 | 3.1% |
| Scotch-Irish | 5 | 3.1% |
| Scottish | 2 | 1.2% |
| Welsh | 2 | 1.2% | View All 12 Rows |
Immigrants in Burnside borough

| Immigration Origin | # Population | % Population | View All 0 Rows |
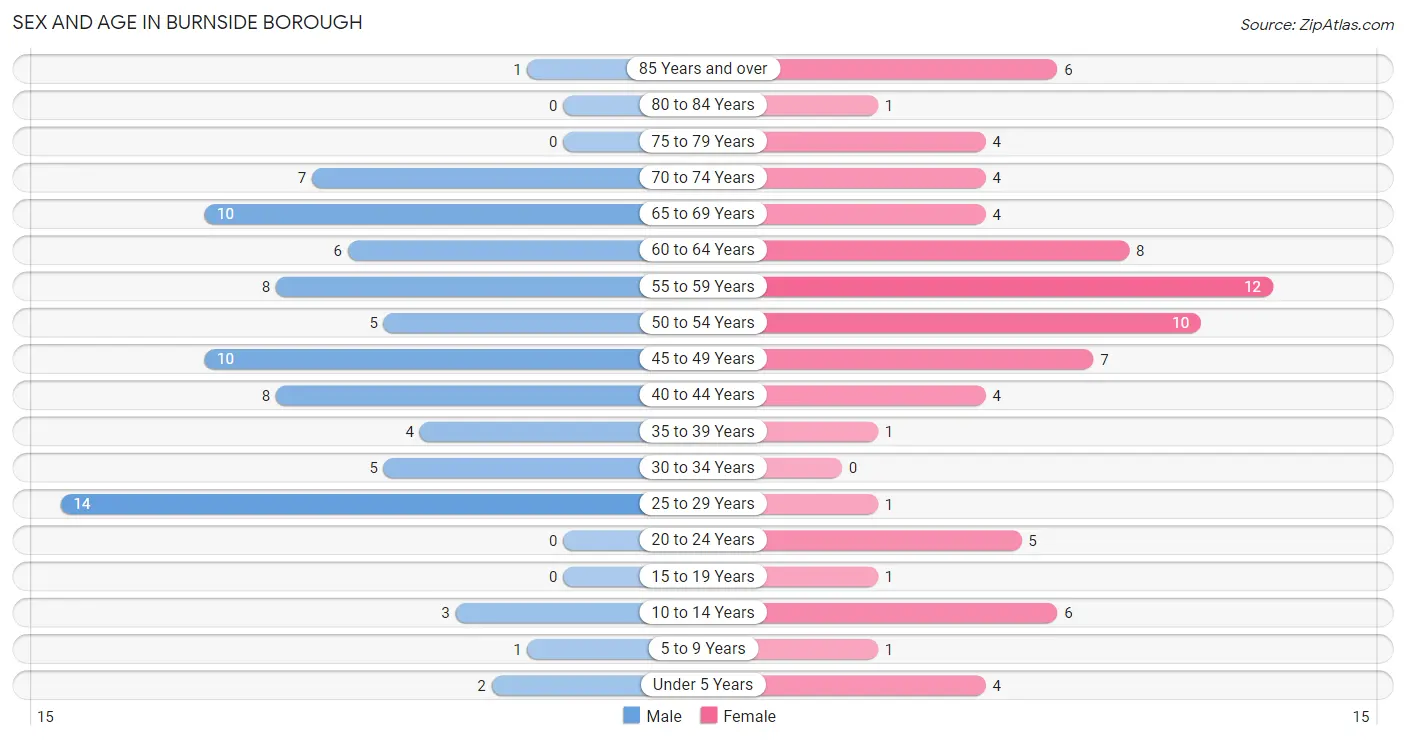
Sex and Age in Burnside borough
Sex and Age in Burnside borough
The most populous age groups in Burnside borough are 25 to 29 Years (14 | 16.7%) for men and 55 to 59 Years (12 | 15.2%) for women.
| Age Bracket | Male | Female |
| Under 5 Years | 2 (2.4%) | 4 (5.1%) |
| 5 to 9 Years | 1 (1.2%) | 1 (1.3%) |
| 10 to 14 Years | 3 (3.6%) | 6 (7.6%) |
| 15 to 19 Years | 0 (0.0%) | 1 (1.3%) |
| 20 to 24 Years | 0 (0.0%) | 5 (6.3%) |
| 25 to 29 Years | 14 (16.7%) | 1 (1.3%) |
| 30 to 34 Years | 5 (5.9%) | 0 (0.0%) |
| 35 to 39 Years | 4 (4.8%) | 1 (1.3%) |
| 40 to 44 Years | 8 (9.5%) | 4 (5.1%) |
| 45 to 49 Years | 10 (11.9%) | 7 (8.9%) |
| 50 to 54 Years | 5 (5.9%) | 10 (12.7%) |
| 55 to 59 Years | 8 (9.5%) | 12 (15.2%) |
| 60 to 64 Years | 6 (7.1%) | 8 (10.1%) |
| 65 to 69 Years | 10 (11.9%) | 4 (5.1%) |
| 70 to 74 Years | 7 (8.3%) | 4 (5.1%) |
| 75 to 79 Years | 0 (0.0%) | 4 (5.1%) |
| 80 to 84 Years | 0 (0.0%) | 1 (1.3%) |
| 85 Years and over | 1 (1.2%) | 6 (7.6%) |
| Total | 84 (100.0%) | 79 (100.0%) |
Families and Households in Burnside borough
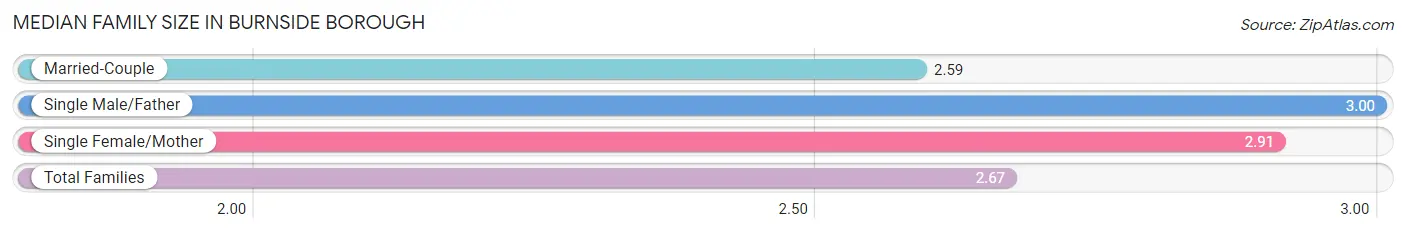
Median Family Size in Burnside borough
The median family size in Burnside borough is 2.67 persons per family, with single male/father families (1 | 2.2%) accounting for the largest median family size of 3 persons per family. On the other hand, married-couple families (34 | 73.9%) represent the smallest median family size with 2.59 persons per family.
| Family Type | # Families | Family Size |
| Married-Couple | 34 (73.9%) | 2.59 |
| Single Male/Father | 1 (2.2%) | 3.00 |
| Single Female/Mother | 11 (23.9%) | 2.91 |
| Total Families | 46 (100.0%) | 2.67 |
Median Household Size in Burnside borough
The median household size in Burnside borough is 2.18 persons per household, with single female/mother households (11 | 15.3%) accounting for the largest median household size of 3.45 persons per household. non-family households (26 | 36.1%) represent the smallest median household size with 1.08 persons per household.
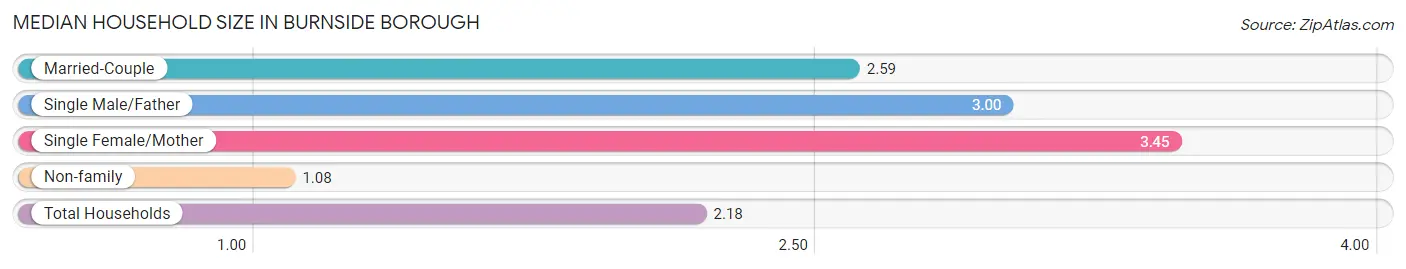
| Household Type | # Households | Household Size |
| Married-Couple | 34 (47.2%) | 2.59 |
| Single Male/Father | 1 (1.4%) | 3.00 |
| Single Female/Mother | 11 (15.3%) | 3.45 |
| Non-family | 26 (36.1%) | 1.08 |
| Total Households | 72 (100.0%) | 2.18 |
Household Size by Marriage Status in Burnside borough
Out of a total of 72 households in Burnside borough, 46 (63.9%) are family households, while 26 (36.1%) are nonfamily households. The most numerous type of family households are 2-person households, comprising 22, and the most common type of nonfamily households are 1-person households, comprising 24.
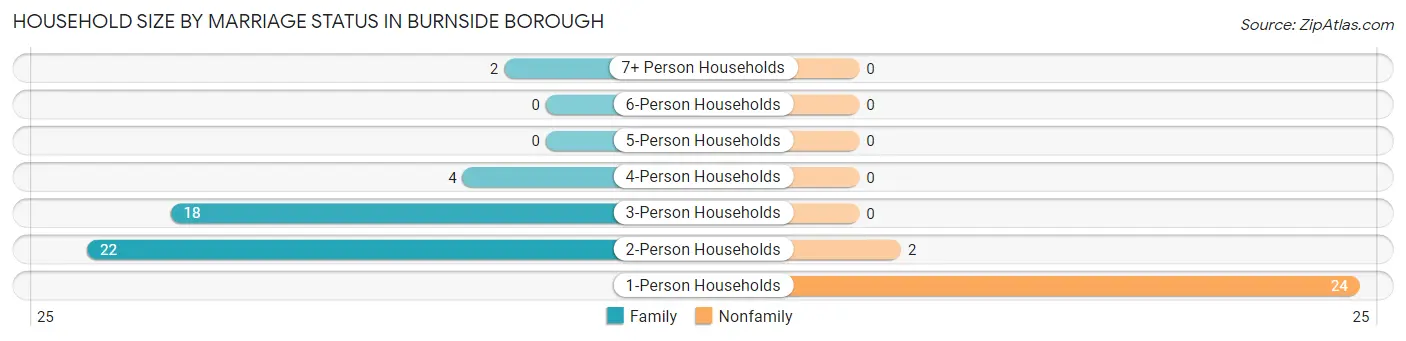
| Household Size | Family Households | Nonfamily Households |
| 1-Person Households | - | 24 (33.3%) |
| 2-Person Households | 22 (30.6%) | 2 (2.8%) |
| 3-Person Households | 18 (25.0%) | 0 (0.0%) |
| 4-Person Households | 4 (5.6%) | 0 (0.0%) |
| 5-Person Households | 0 (0.0%) | 0 (0.0%) |
| 6-Person Households | 0 (0.0%) | 0 (0.0%) |
| 7+ Person Households | 2 (2.8%) | 0 (0.0%) |
| Total | 46 (63.9%) | 26 (36.1%) |
Female Fertility in Burnside borough
Fertility by Age in Burnside borough
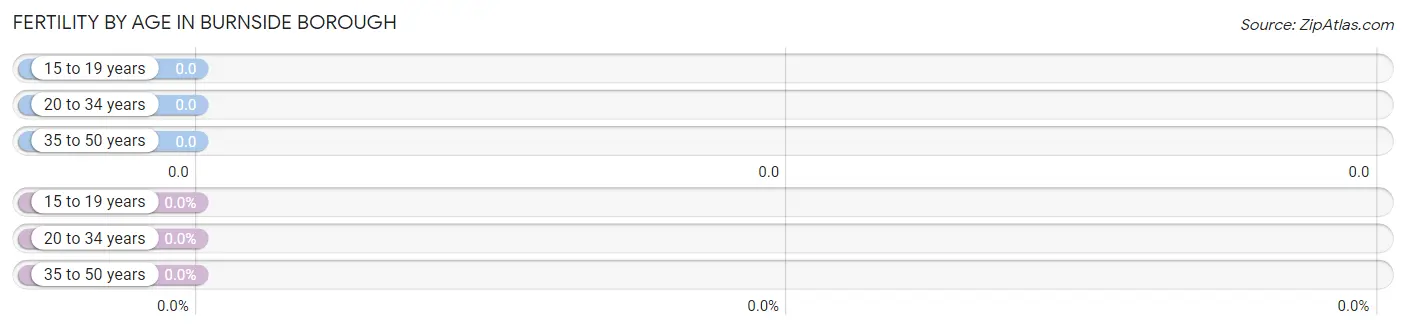
| Age Bracket | Women with Births | Births / 1,000 Women |
| 15 to 19 years | 0 (0.0%) | 0.0 |
| 20 to 34 years | 0 (0.0%) | 0.0 |
| 35 to 50 years | 0 (0.0%) | 0.0 |
| Total | 0 (0.0%) | 0.0 |
Fertility by Age by Marriage Status in Burnside borough
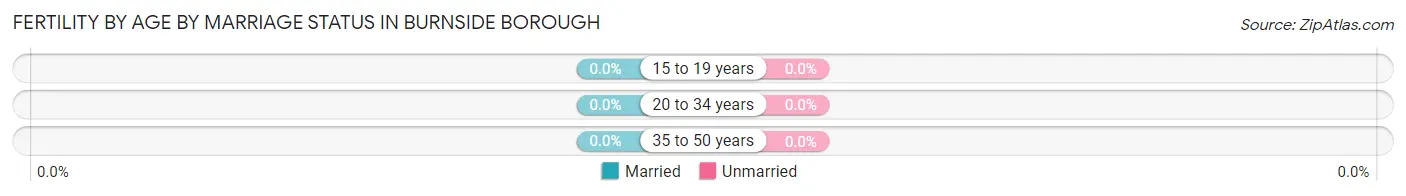
| Age Bracket | Married | Unmarried |
| 15 to 19 years | 0 (0.0%) | 0 (0.0%) |
| 20 to 34 years | 0 (0.0%) | 0 (0.0%) |
| 35 to 50 years | 0 (0.0%) | 0 (0.0%) |
| Total | 0 (0.0%) | 0 (0.0%) |
Fertility by Education in Burnside borough

| Educational Attainment | Women with Births | Births / 1,000 Women |
| Less than High School | 0 (0.0%) | 0.0 |
| High School Diploma | 0 (0.0%) | 0.0 |
| College or Associate's Degree | 0 (0.0%) | 0.0 |
| Bachelor's Degree | 0 (0.0%) | 0.0 |
| Graduate Degree | 0 (0.0%) | 0.0 |
| Total | 0 (0.0%) | 0.0 |
Fertility by Education by Marriage Status in Burnside borough
| Educational Attainment | Married | Unmarried |
| Less than High School | 0 (0.0%) | 0 (0.0%) |
| High School Diploma | 0 (0.0%) | 0 (0.0%) |
| College or Associate's Degree | 0 (0.0%) | 0 (0.0%) |
| Bachelor's Degree | 0 (0.0%) | 0 (0.0%) |
| Graduate Degree | 0 (0.0%) | 0 (0.0%) |
| Total | 0 (0.0%) | 0 (0.0%) |
Income in Burnside borough
Income Overview in Burnside borough
Per Capita Income in Burnside borough is $25,380, while median incomes of families and households are $48,500 and $47,500 respectively.
| Characteristic | Number | Measure |
| Per Capita Income | 163 | $25,380 |
| Median Family Income | 46 | $48,500 |
| Mean Family Income | 46 | $58,689 |
| Median Household Income | 72 | $47,500 |
| Mean Household Income | 72 | $55,763 |
| Income Deficit | 46 | $0 |
| Wage / Income Gap (%) | 163 | 0.00% |
| Wage / Income Gap ($) | 163 | 100.00¢ per $1 |
| Gini / Inequality Index | 163 | 0.39 |
Earnings by Sex in Burnside borough
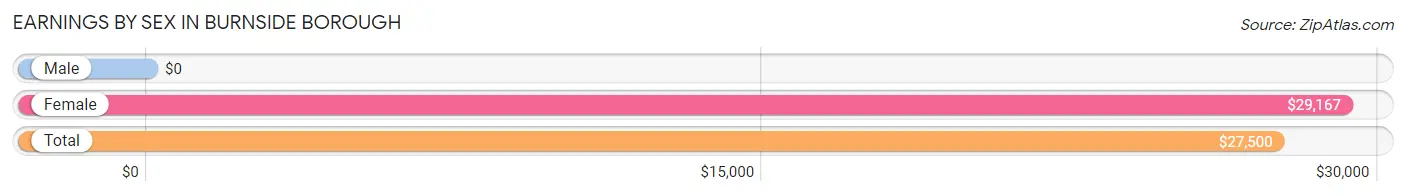
| Sex | Number | Average Earnings |
| Male | 52 (65.0%) | $0 |
| Female | 28 (35.0%) | $29,167 |
| Total | 80 (100.0%) | $27,500 |
Earnings by Sex by Income Bracket in Burnside borough
The most common earnings brackets in Burnside borough are $5,000 to $7,499 for men (12 | 23.1%) and $35,000 to $39,999 for women (9 | 32.1%).
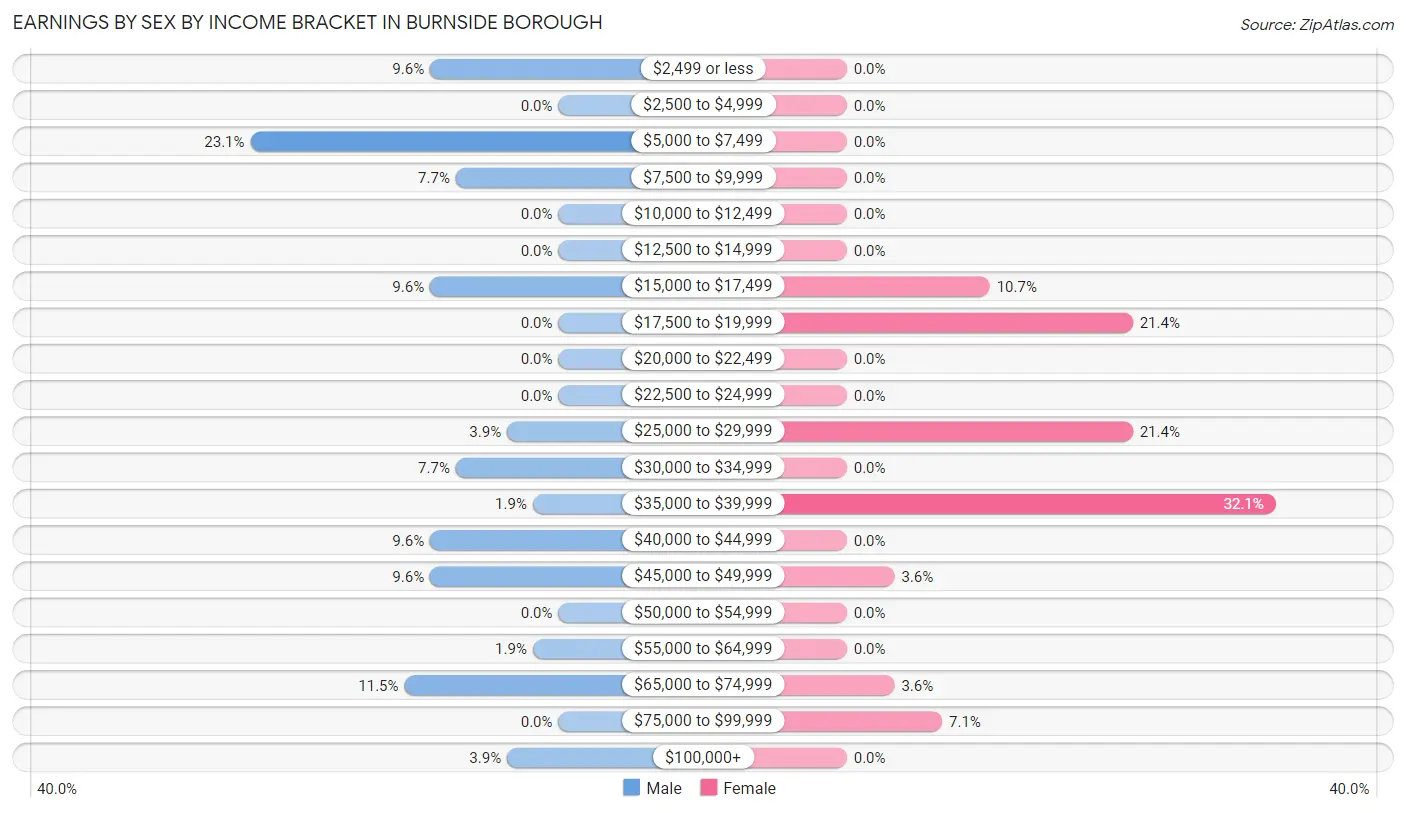
| Income | Male | Female |
| $2,499 or less | 5 (9.6%) | 0 (0.0%) |
| $2,500 to $4,999 | 0 (0.0%) | 0 (0.0%) |
| $5,000 to $7,499 | 12 (23.1%) | 0 (0.0%) |
| $7,500 to $9,999 | 4 (7.7%) | 0 (0.0%) |
| $10,000 to $12,499 | 0 (0.0%) | 0 (0.0%) |
| $12,500 to $14,999 | 0 (0.0%) | 0 (0.0%) |
| $15,000 to $17,499 | 5 (9.6%) | 3 (10.7%) |
| $17,500 to $19,999 | 0 (0.0%) | 6 (21.4%) |
| $20,000 to $22,499 | 0 (0.0%) | 0 (0.0%) |
| $22,500 to $24,999 | 0 (0.0%) | 0 (0.0%) |
| $25,000 to $29,999 | 2 (3.8%) | 6 (21.4%) |
| $30,000 to $34,999 | 4 (7.7%) | 0 (0.0%) |
| $35,000 to $39,999 | 1 (1.9%) | 9 (32.1%) |
| $40,000 to $44,999 | 5 (9.6%) | 0 (0.0%) |
| $45,000 to $49,999 | 5 (9.6%) | 1 (3.6%) |
| $50,000 to $54,999 | 0 (0.0%) | 0 (0.0%) |
| $55,000 to $64,999 | 1 (1.9%) | 0 (0.0%) |
| $65,000 to $74,999 | 6 (11.5%) | 1 (3.6%) |
| $75,000 to $99,999 | 0 (0.0%) | 2 (7.1%) |
| $100,000+ | 2 (3.8%) | 0 (0.0%) |
| Total | 52 (100.0%) | 28 (100.0%) |
Earnings by Sex by Educational Attainment in Burnside borough
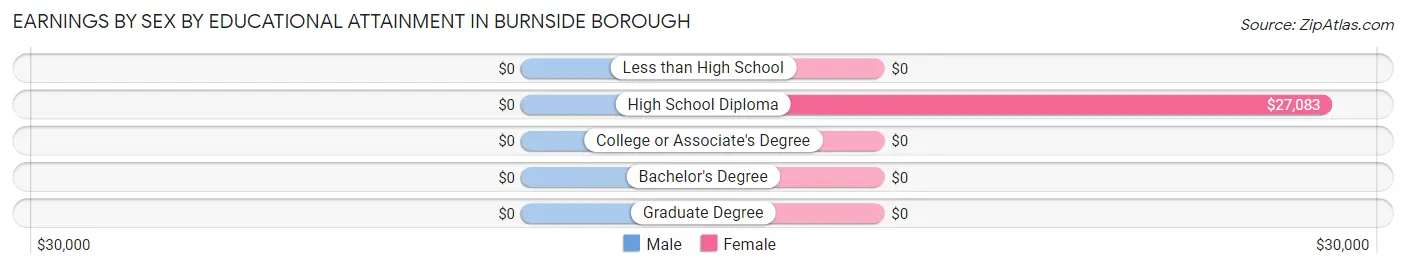
| Educational Attainment | Male Income | Female Income |
| Less than High School | - | - |
| High School Diploma | - | - |
| College or Associate's Degree | - | - |
| Bachelor's Degree | - | - |
| Graduate Degree | - | - |
| Total | - | - |
Family Income in Burnside borough
Family Income Brackets in Burnside borough
According to the Burnside borough family income data, there are 9 families falling into the $15,000 to $24,999 income range, which is the most common income bracket and makes up 19.6% of all families.
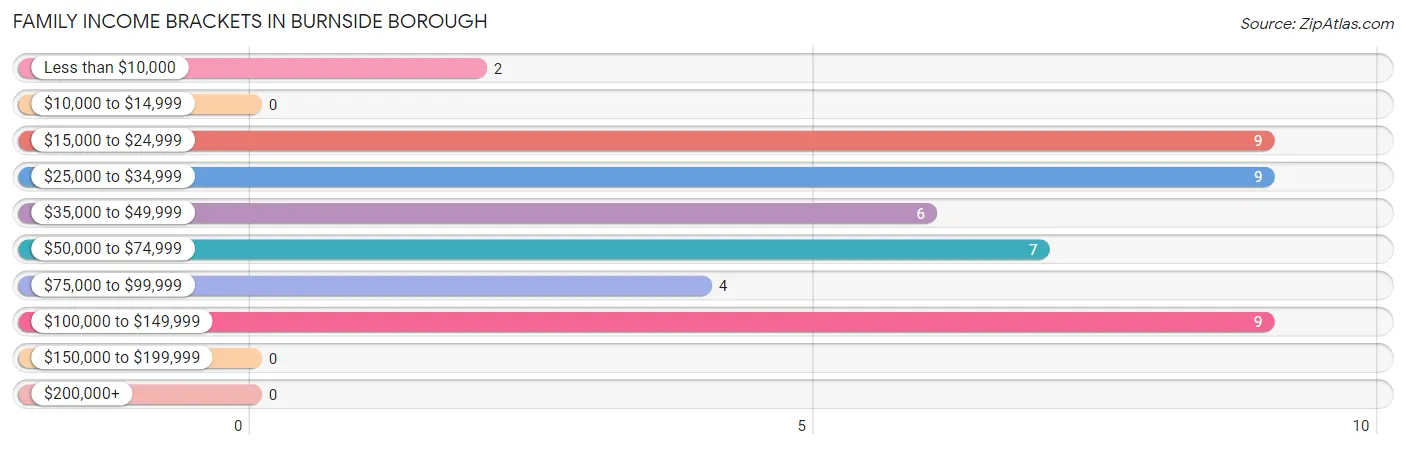
| Income Bracket | # Families | % Families |
| Less than $10,000 | 2 | 4.3% |
| $10,000 to $14,999 | 0 | 0.0% |
| $15,000 to $24,999 | 9 | 19.6% |
| $25,000 to $34,999 | 9 | 19.6% |
| $35,000 to $49,999 | 6 | 13.0% |
| $50,000 to $74,999 | 7 | 15.2% |
| $75,000 to $99,999 | 4 | 8.7% |
| $100,000 to $149,999 | 9 | 19.6% |
| $150,000 to $199,999 | 0 | 0.0% |
| $200,000+ | 0 | 0.0% |
Family Income by Famaliy Size in Burnside borough
2-person families (24 | 52.2%) account for the highest median family income in Burnside borough with $48,500 per family, while 2-person families (24 | 52.2%) have the highest median income of $24,250 per family member.
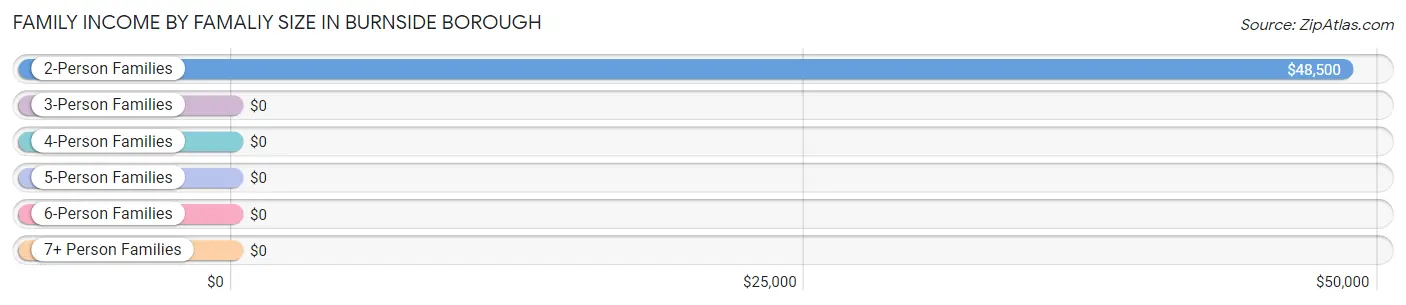
| Income Bracket | # Families | Median Income |
| 2-Person Families | 24 (52.2%) | $48,500 |
| 3-Person Families | 17 (37.0%) | $0 |
| 4-Person Families | 3 (6.5%) | $0 |
| 5-Person Families | 0 (0.0%) | $0 |
| 6-Person Families | 2 (4.3%) | $0 |
| 7+ Person Families | 0 (0.0%) | $0 |
| Total | 46 (100.0%) | $48,500 |
Family Income by Number of Earners in Burnside borough
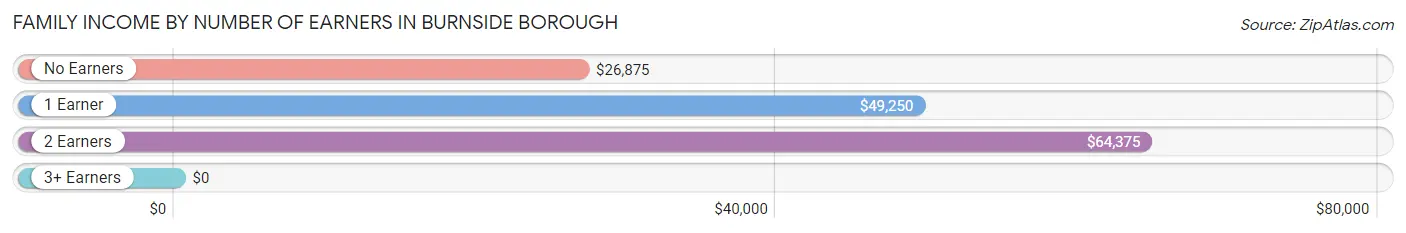
| Number of Earners | # Families | Median Income |
| No Earners | 11 (23.9%) | $26,875 |
| 1 Earner | 17 (37.0%) | $49,250 |
| 2 Earners | 13 (28.3%) | $64,375 |
| 3+ Earners | 5 (10.9%) | $0 |
| Total | 46 (100.0%) | $48,500 |
Household Income in Burnside borough
Household Income Brackets in Burnside borough
With 16 households falling in the category, the $35,000 to $49,999 income range is the most frequent in Burnside borough, accounting for 22.2% of all households.
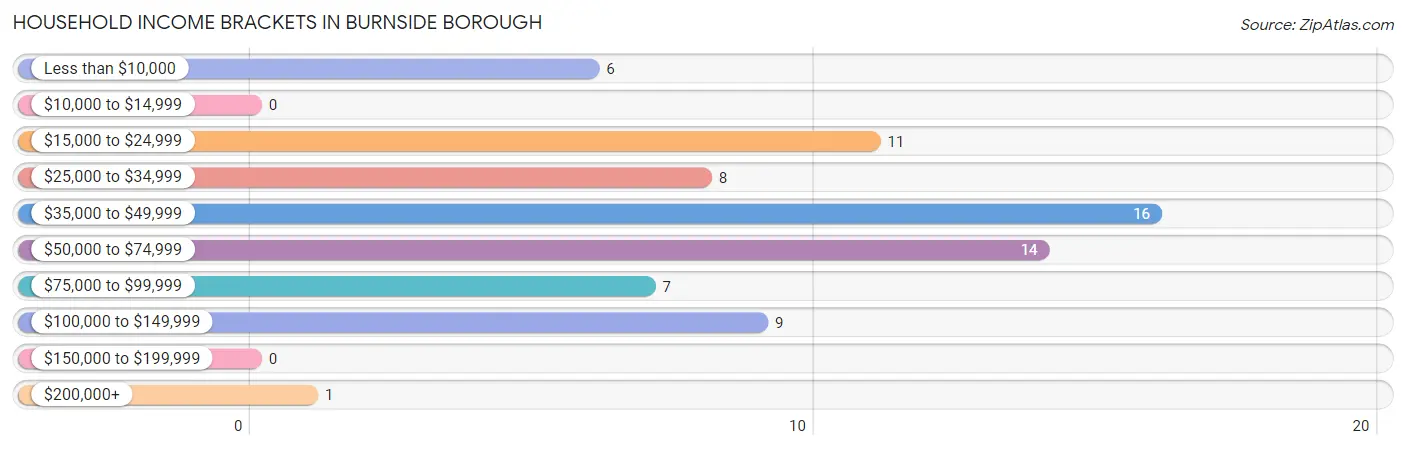
| Income Bracket | # Households | % Households |
| Less than $10,000 | 6 | 8.3% |
| $10,000 to $14,999 | 0 | 0.0% |
| $15,000 to $24,999 | 11 | 15.3% |
| $25,000 to $34,999 | 8 | 11.1% |
| $35,000 to $49,999 | 16 | 22.2% |
| $50,000 to $74,999 | 14 | 19.4% |
| $75,000 to $99,999 | 7 | 9.7% |
| $100,000 to $149,999 | 9 | 12.5% |
| $150,000 to $199,999 | 0 | 0.0% |
| $200,000+ | 1 | 1.4% |
Household Income by Householder Age in Burnside borough
The median household income in Burnside borough is $47,500, with the highest median household income of $60,833 found in the 45 to 64 years age bracket for the primary householder. A total of 34 households (47.2%) fall into this category. Meanwhile, the 15 to 24 years age bracket for the primary householder has the lowest median household income of $0, with 2 households (2.8%) in this group.
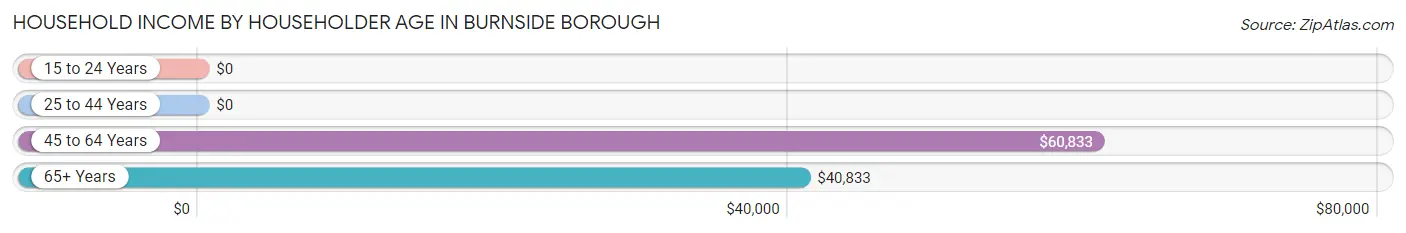
| Income Bracket | # Households | Median Income |
| 15 to 24 Years | 2 (2.8%) | $0 |
| 25 to 44 Years | 8 (11.1%) | $0 |
| 45 to 64 Years | 34 (47.2%) | $60,833 |
| 65+ Years | 28 (38.9%) | $40,833 |
| Total | 72 (100.0%) | $47,500 |
Poverty in Burnside borough
Income Below Poverty by Sex and Age in Burnside borough
With 21.4% poverty level for males and 26.6% for females among the residents of Burnside borough, 45 to 54 year old males and under 5 year old females are the most vulnerable to poverty, with 8 males (53.3%) and 4 females (100.0%) in their respective age groups living below the poverty level.
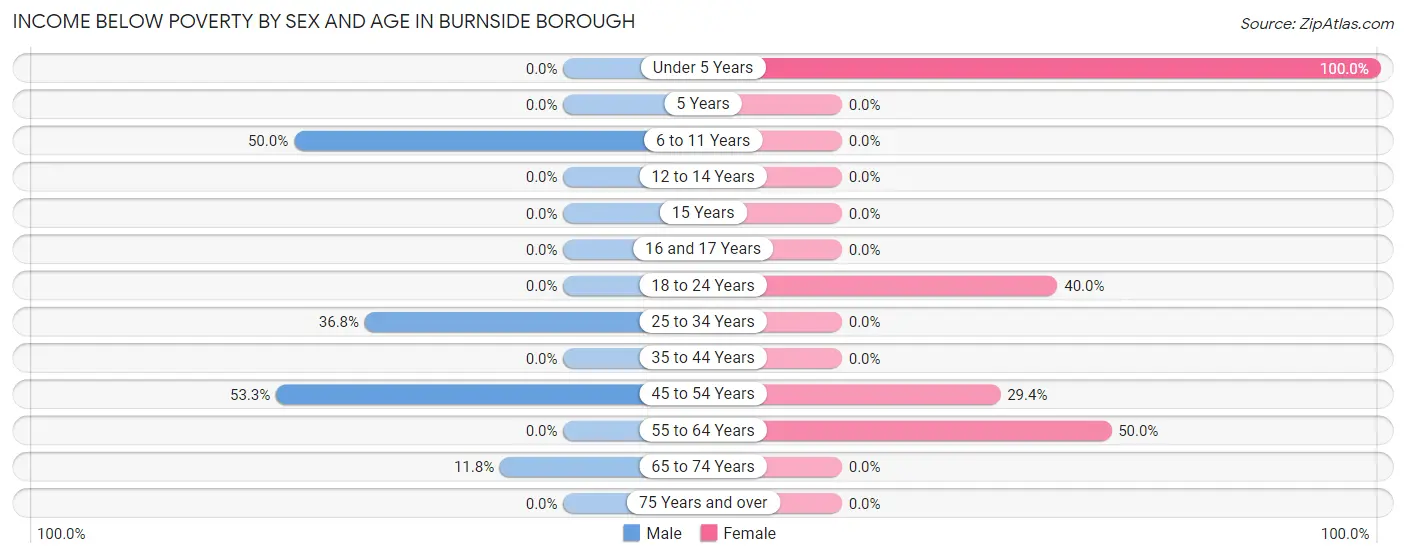
| Age Bracket | Male | Female |
| Under 5 Years | 0 (0.0%) | 4 (100.0%) |
| 5 Years | 0 (0.0%) | 0 (0.0%) |
| 6 to 11 Years | 1 (50.0%) | 0 (0.0%) |
| 12 to 14 Years | 0 (0.0%) | 0 (0.0%) |
| 15 Years | 0 (0.0%) | 0 (0.0%) |
| 16 and 17 Years | 0 (0.0%) | 0 (0.0%) |
| 18 to 24 Years | 0 (0.0%) | 2 (40.0%) |
| 25 to 34 Years | 7 (36.8%) | 0 (0.0%) |
| 35 to 44 Years | 0 (0.0%) | 0 (0.0%) |
| 45 to 54 Years | 8 (53.3%) | 5 (29.4%) |
| 55 to 64 Years | 0 (0.0%) | 10 (50.0%) |
| 65 to 74 Years | 2 (11.8%) | 0 (0.0%) |
| 75 Years and over | 0 (0.0%) | 0 (0.0%) |
| Total | 18 (21.4%) | 21 (26.6%) |
Income Above Poverty by Sex and Age in Burnside borough
According to the poverty statistics in Burnside borough, males aged under 5 years and females aged 6 to 11 years are the age groups that are most secure financially, with 100.0% of males and 100.0% of females in these age groups living above the poverty line.
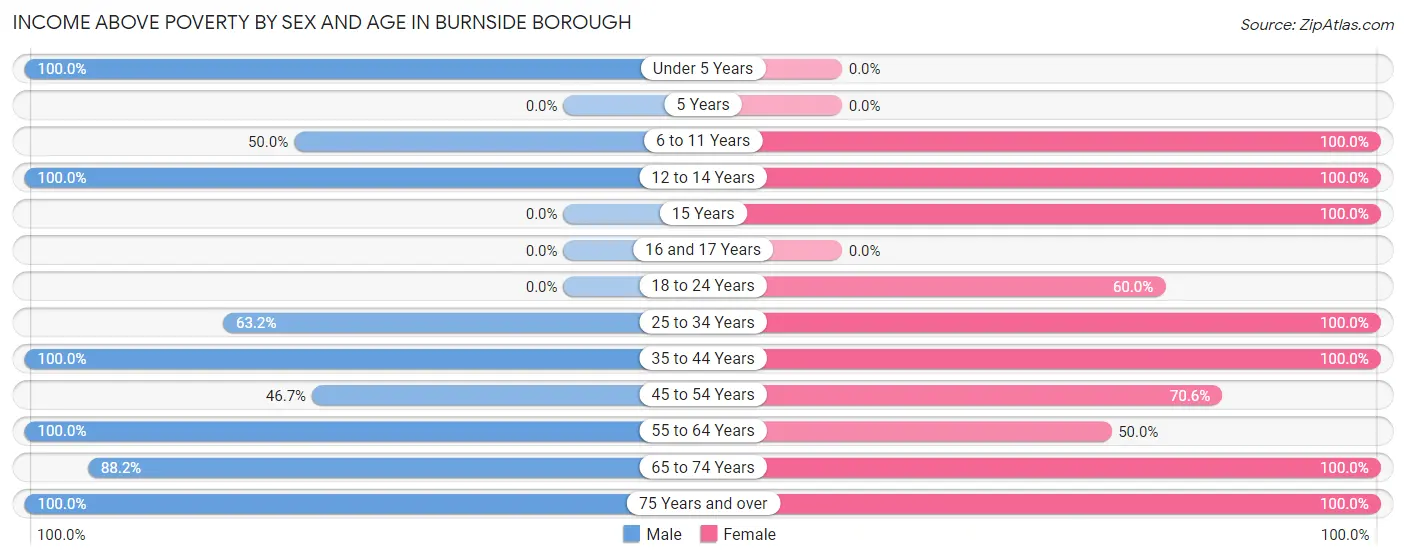
| Age Bracket | Male | Female |
| Under 5 Years | 2 (100.0%) | 0 (0.0%) |
| 5 Years | 0 (0.0%) | 0 (0.0%) |
| 6 to 11 Years | 1 (50.0%) | 5 (100.0%) |
| 12 to 14 Years | 2 (100.0%) | 2 (100.0%) |
| 15 Years | 0 (0.0%) | 1 (100.0%) |
| 16 and 17 Years | 0 (0.0%) | 0 (0.0%) |
| 18 to 24 Years | 0 (0.0%) | 3 (60.0%) |
| 25 to 34 Years | 12 (63.2%) | 1 (100.0%) |
| 35 to 44 Years | 12 (100.0%) | 5 (100.0%) |
| 45 to 54 Years | 7 (46.7%) | 12 (70.6%) |
| 55 to 64 Years | 14 (100.0%) | 10 (50.0%) |
| 65 to 74 Years | 15 (88.2%) | 8 (100.0%) |
| 75 Years and over | 1 (100.0%) | 11 (100.0%) |
| Total | 66 (78.6%) | 58 (73.4%) |
Income Below Poverty Among Married-Couple Families in Burnside borough
The poverty statistics for married-couple families in Burnside borough show that 14.7% or 5 of the total 34 families live below the poverty line. Families with no children have the highest poverty rate of 17.9%, comprising of 5 families. On the other hand, families with 1 or 2 children have the lowest poverty rate of 0.0%, which includes 0 families.
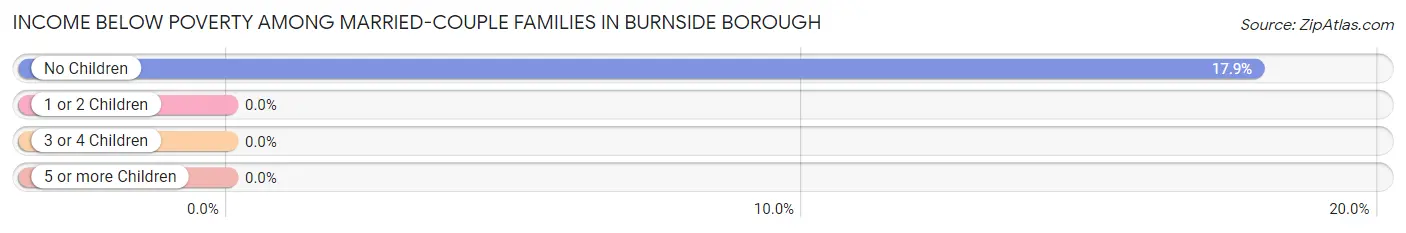
| Children | Above Poverty | Below Poverty |
| No Children | 23 (82.1%) | 5 (17.9%) |
| 1 or 2 Children | 6 (100.0%) | 0 (0.0%) |
| 3 or 4 Children | 0 (0.0%) | 0 (0.0%) |
| 5 or more Children | 0 (0.0%) | 0 (0.0%) |
| Total | 29 (85.3%) | 5 (14.7%) |
Income Below Poverty Among Single-Parent Households in Burnside borough
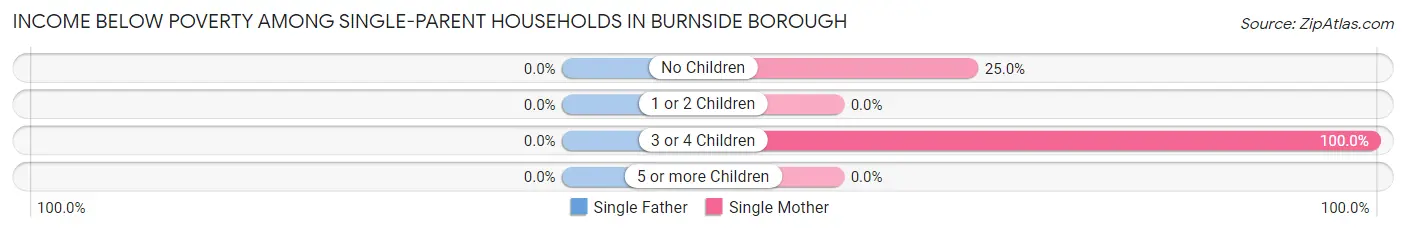
| Children | Single Father | Single Mother |
| No Children | 0 (0.0%) | 2 (25.0%) |
| 1 or 2 Children | 0 (0.0%) | 0 (0.0%) |
| 3 or 4 Children | 0 (0.0%) | 2 (100.0%) |
| 5 or more Children | 0 (0.0%) | 0 (0.0%) |
| Total | 0 (0.0%) | 4 (36.4%) |
Income Below Poverty Among Married-Couple vs Single-Parent Households in Burnside borough
The poverty data for Burnside borough shows that 5 of the married-couple family households (14.7%) and 4 of the single-parent households (33.3%) are living below the poverty level. Within the married-couple family households, those with no children have the highest poverty rate, with 5 households (17.9%) falling below the poverty line. Among the single-parent households, those with 3 or 4 children have the highest poverty rate, with 2 household (100.0%) living below poverty.
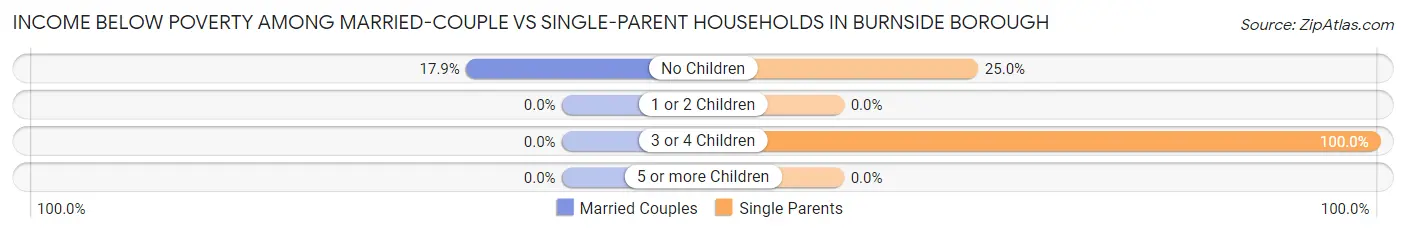
| Children | Married-Couple Families | Single-Parent Households |
| No Children | 5 (17.9%) | 2 (25.0%) |
| 1 or 2 Children | 0 (0.0%) | 0 (0.0%) |
| 3 or 4 Children | 0 (0.0%) | 2 (100.0%) |
| 5 or more Children | 0 (0.0%) | 0 (0.0%) |
| Total | 5 (14.7%) | 4 (33.3%) |
Employment Characteristics in Burnside borough
Employment by Class of Employer in Burnside borough
Among the 64 employed individuals in Burnside borough, private company employees (52 | 81.2%), self-employed (not incorporated) (7 | 10.9%), and local government employees (5 | 7.8%) make up the most common classes of employment.
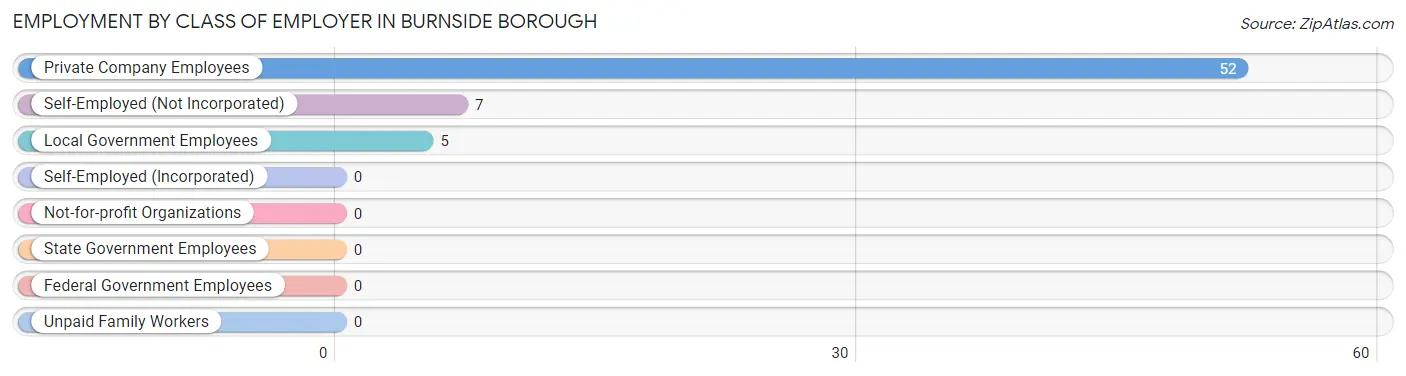
| Employer Class | # Employees | % Employees |
| Private Company Employees | 52 | 81.2% |
| Self-Employed (Incorporated) | 0 | 0.0% |
| Self-Employed (Not Incorporated) | 7 | 10.9% |
| Not-for-profit Organizations | 0 | 0.0% |
| Local Government Employees | 5 | 7.8% |
| State Government Employees | 0 | 0.0% |
| Federal Government Employees | 0 | 0.0% |
| Unpaid Family Workers | 0 | 0.0% |
| Total | 64 | 100.0% |
Employment Status by Age in Burnside borough
According to the labor force statistics for Burnside borough, out of the total population over 16 years of age (145), 60.7% or 88 individuals are in the labor force, with 27.3% or 24 of them unemployed. The age group with the highest labor force participation rate is 25 to 29 years, with 100.0% or 15 individuals in the labor force. Within the labor force, the 25 to 29 years age range has the highest percentage of unemployed individuals, with 73.3% or 11 of them being unemployed.
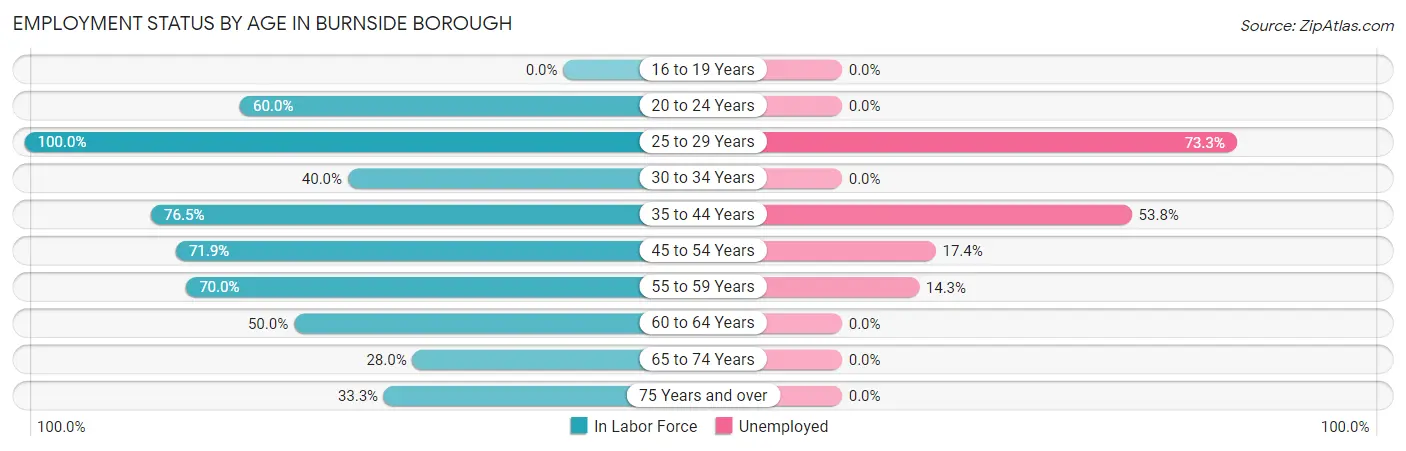
| Age Bracket | In Labor Force | Unemployed |
| 16 to 19 Years | 0 (0.0%) | 0 (0.0%) |
| 20 to 24 Years | 3 (60.0%) | 0 (0.0%) |
| 25 to 29 Years | 15 (100.0%) | 11 (73.3%) |
| 30 to 34 Years | 2 (40.0%) | 0 (0.0%) |
| 35 to 44 Years | 13 (76.5%) | 7 (53.8%) |
| 45 to 54 Years | 23 (71.9%) | 4 (17.4%) |
| 55 to 59 Years | 14 (70.0%) | 2 (14.3%) |
| 60 to 64 Years | 7 (50.0%) | 0 (0.0%) |
| 65 to 74 Years | 7 (28.0%) | 0 (0.0%) |
| 75 Years and over | 4 (33.3%) | 0 (0.0%) |
| Total | 88 (60.7%) | 24 (27.3%) |
Employment Status by Educational Attainment in Burnside borough
According to labor force statistics for Burnside borough, 71.8% of individuals (74) out of the total population between 25 and 64 years of age (103) are in the labor force, with 32.4% or 24 of them being unemployed. The group with the highest labor force participation rate are those with the educational attainment of high school diploma, with 76.3% or 61 individuals in the labor force. Within the labor force, individuals with less than high school education have the highest percentage of unemployment, with 100.0% or 1 of them being unemployed.
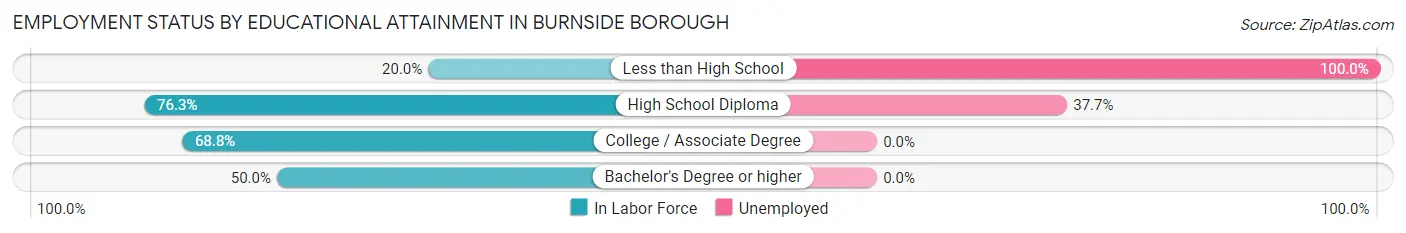
| Educational Attainment | In Labor Force | Unemployed |
| Less than High School | 1 (20.0%) | 5 (100.0%) |
| High School Diploma | 61 (76.3%) | 30 (37.7%) |
| College / Associate Degree | 11 (68.8%) | 0 (0.0%) |
| Bachelor's Degree or higher | 1 (50.0%) | 0 (0.0%) |
| Total | 74 (71.8%) | 33 (32.4%) |
Employment Occupations by Sex in Burnside borough
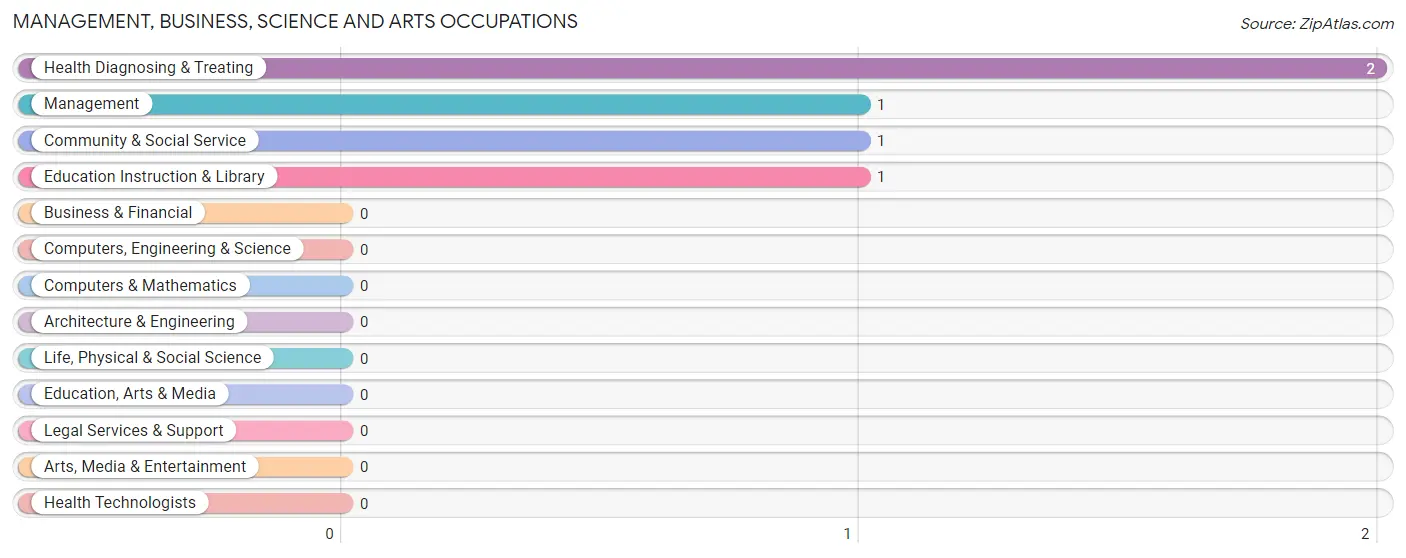
Management, Business, Science and Arts Occupations
The most common Management, Business, Science and Arts occupations in Burnside borough are Health Diagnosing & Treating (2 | 3.1%), Management (1 | 1.6%), Community & Social Service (1 | 1.6%), and Education Instruction & Library (1 | 1.6%).
Management, Business, Science and Arts Occupations by Sex
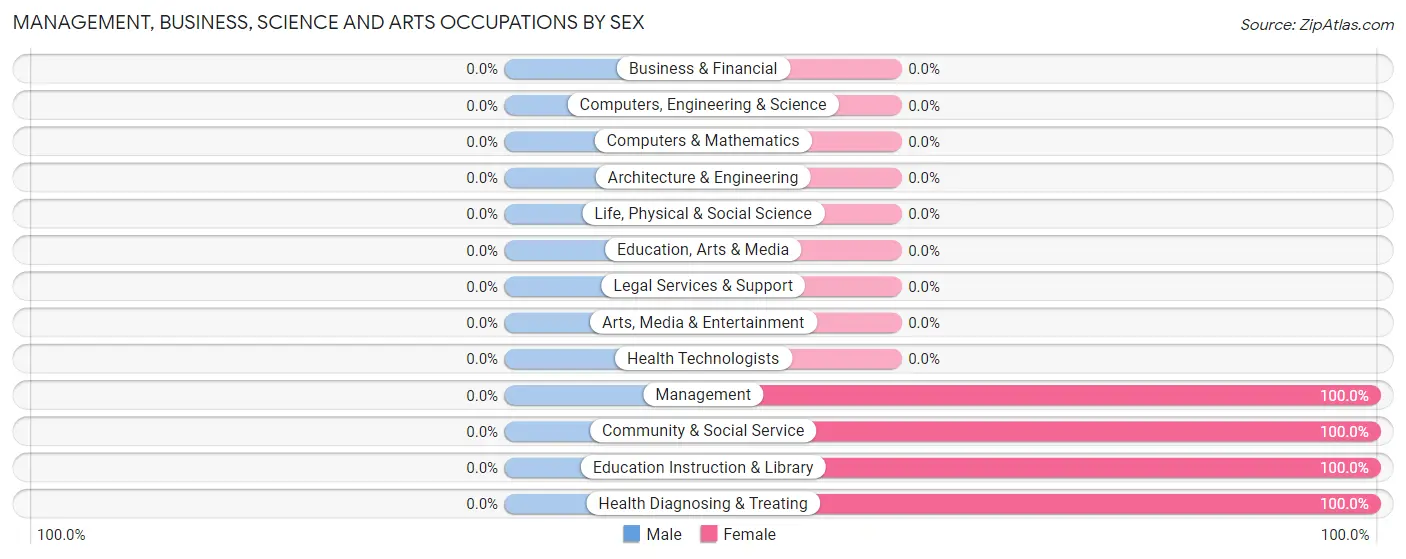
| Occupation | Male | Female |
| Management | 0 (0.0%) | 1 (100.0%) |
| Business & Financial | 0 (0.0%) | 0 (0.0%) |
| Computers, Engineering & Science | 0 (0.0%) | 0 (0.0%) |
| Computers & Mathematics | 0 (0.0%) | 0 (0.0%) |
| Architecture & Engineering | 0 (0.0%) | 0 (0.0%) |
| Life, Physical & Social Science | 0 (0.0%) | 0 (0.0%) |
| Community & Social Service | 0 (0.0%) | 1 (100.0%) |
| Education, Arts & Media | 0 (0.0%) | 0 (0.0%) |
| Legal Services & Support | 0 (0.0%) | 0 (0.0%) |
| Education Instruction & Library | 0 (0.0%) | 1 (100.0%) |
| Arts, Media & Entertainment | 0 (0.0%) | 0 (0.0%) |
| Health Diagnosing & Treating | 0 (0.0%) | 2 (100.0%) |
| Health Technologists | 0 (0.0%) | 0 (0.0%) |
| Total (Category) | 0 (0.0%) | 4 (100.0%) |
| Total (Overall) | 36 (56.2%) | 28 (43.8%) |
Services Occupations
The most common Services occupations in Burnside borough are Cleaning & Maintenance (6 | 9.4%), Security & Protection (2 | 3.1%), Firefighting & Prevention (2 | 3.1%), and Personal Care & Service (2 | 3.1%).
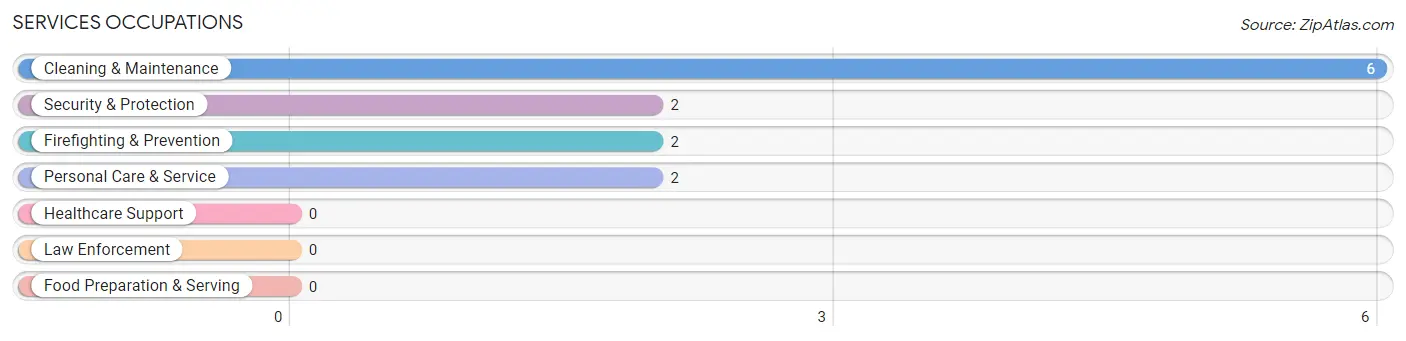
Services Occupations by Sex
Within the Services occupations in Burnside borough, the most male-oriented occupations are Security & Protection (100.0%), and Firefighting & Prevention (100.0%), while the most female-oriented occupations are Cleaning & Maintenance (100.0%), and Personal Care & Service (100.0%).
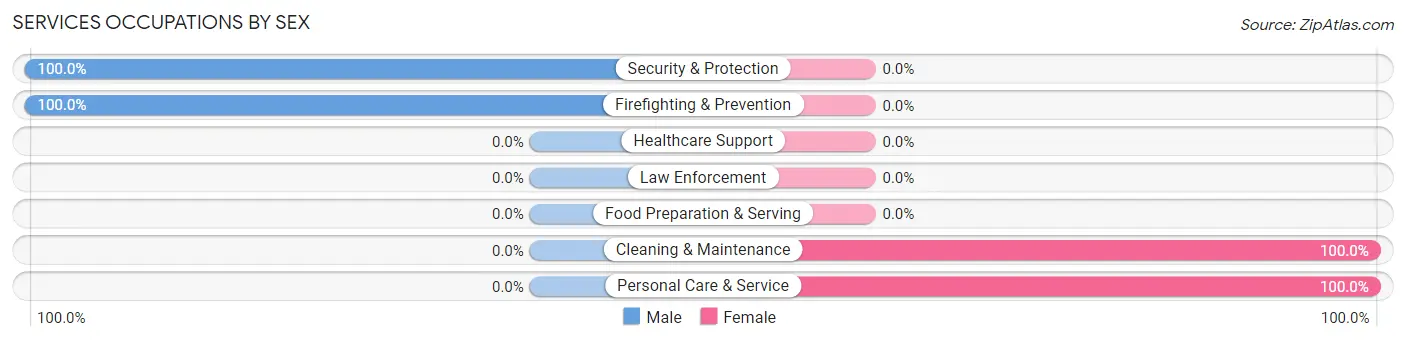
| Occupation | Male | Female |
| Healthcare Support | 0 (0.0%) | 0 (0.0%) |
| Security & Protection | 2 (100.0%) | 0 (0.0%) |
| Firefighting & Prevention | 2 (100.0%) | 0 (0.0%) |
| Law Enforcement | 0 (0.0%) | 0 (0.0%) |
| Food Preparation & Serving | 0 (0.0%) | 0 (0.0%) |
| Cleaning & Maintenance | 0 (0.0%) | 6 (100.0%) |
| Personal Care & Service | 0 (0.0%) | 2 (100.0%) |
| Total (Category) | 2 (20.0%) | 8 (80.0%) |
| Total (Overall) | 36 (56.2%) | 28 (43.8%) |
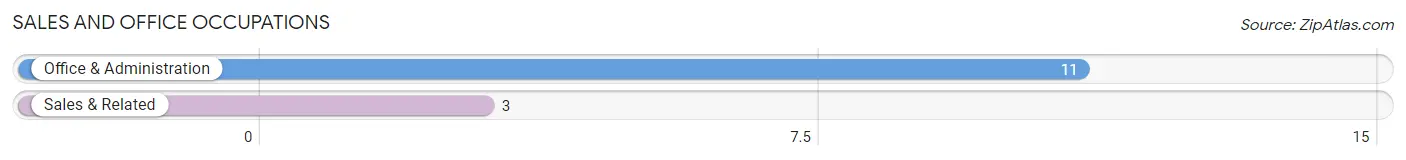
Sales and Office Occupations
The most common Sales and Office occupations in Burnside borough are Office & Administration (11 | 17.2%), and Sales & Related (3 | 4.7%).
Sales and Office Occupations by Sex
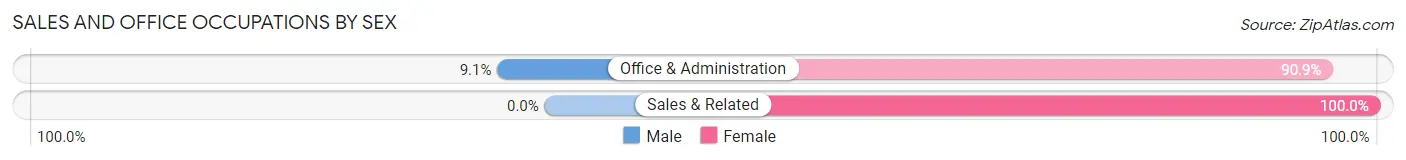
| Occupation | Male | Female |
| Sales & Related | 0 (0.0%) | 3 (100.0%) |
| Office & Administration | 1 (9.1%) | 10 (90.9%) |
| Total (Category) | 1 (7.1%) | 13 (92.9%) |
| Total (Overall) | 36 (56.2%) | 28 (43.8%) |
Natural Resources, Construction and Maintenance Occupations
The most common Natural Resources, Construction and Maintenance occupations in Burnside borough are Installation, Maintenance & Repair (8 | 12.5%), and Construction & Extraction (4 | 6.2%).
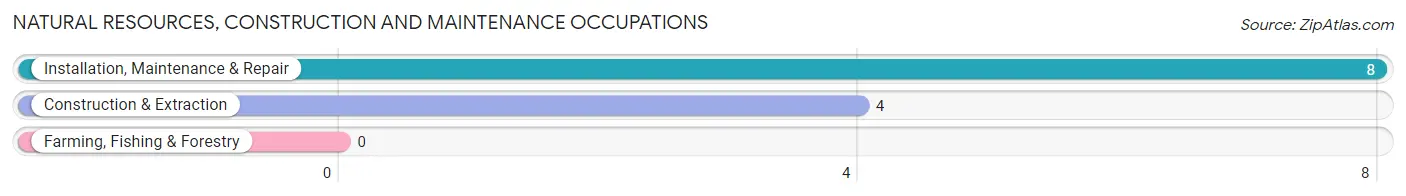
Natural Resources, Construction and Maintenance Occupations by Sex
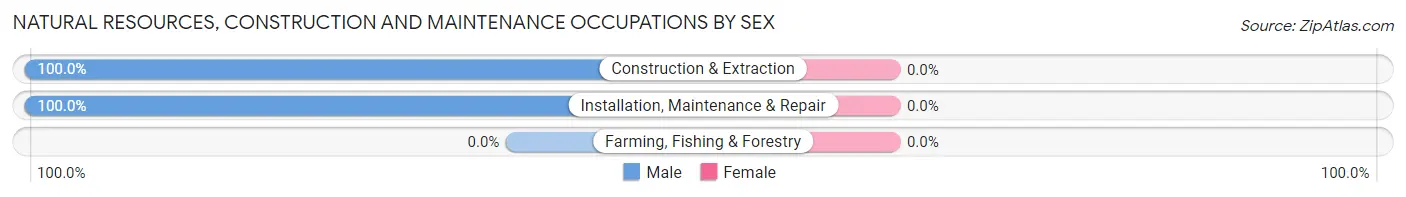
| Occupation | Male | Female |
| Farming, Fishing & Forestry | 0 (0.0%) | 0 (0.0%) |
| Construction & Extraction | 4 (100.0%) | 0 (0.0%) |
| Installation, Maintenance & Repair | 8 (100.0%) | 0 (0.0%) |
| Total (Category) | 12 (100.0%) | 0 (0.0%) |
| Total (Overall) | 36 (56.2%) | 28 (43.8%) |
Production, Transportation and Moving Occupations
The most common Production, Transportation and Moving occupations in Burnside borough are Production (15 | 23.4%), and Transportation (9 | 14.1%).
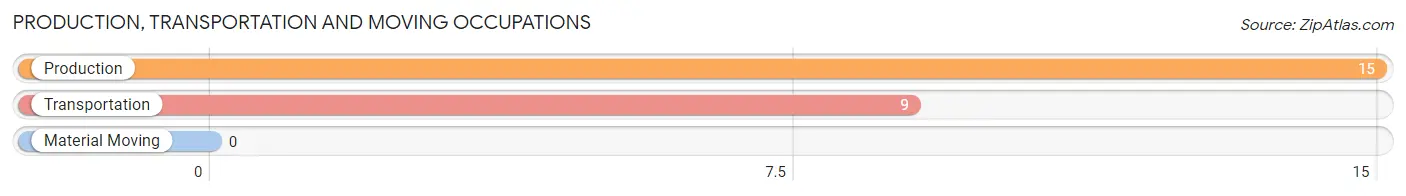
Production, Transportation and Moving Occupations by Sex
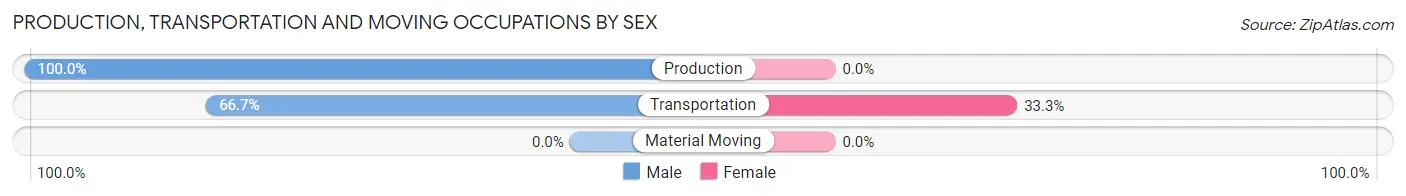
| Occupation | Male | Female |
| Production | 15 (100.0%) | 0 (0.0%) |
| Transportation | 6 (66.7%) | 3 (33.3%) |
| Material Moving | 0 (0.0%) | 0 (0.0%) |
| Total (Category) | 21 (87.5%) | 3 (12.5%) |
| Total (Overall) | 36 (56.2%) | 28 (43.8%) |
Employment Industries by Sex in Burnside borough
Employment Industries in Burnside borough
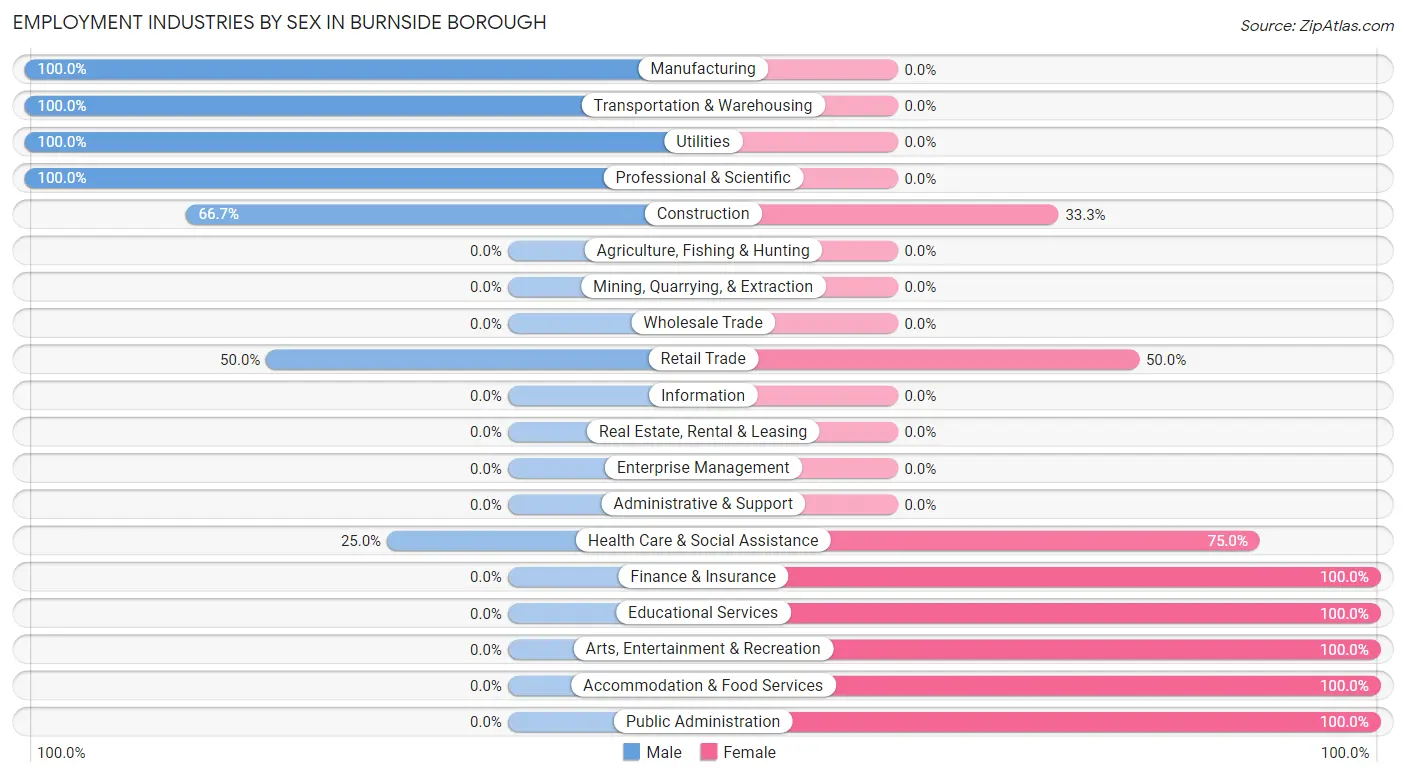
The major employment industries in Burnside borough include Manufacturing (11 | 17.2%), Retail Trade (10 | 15.6%), Health Care & Social Assistance (8 | 12.5%), Transportation & Warehousing (5 | 7.8%), and Arts, Entertainment & Recreation (5 | 7.8%).
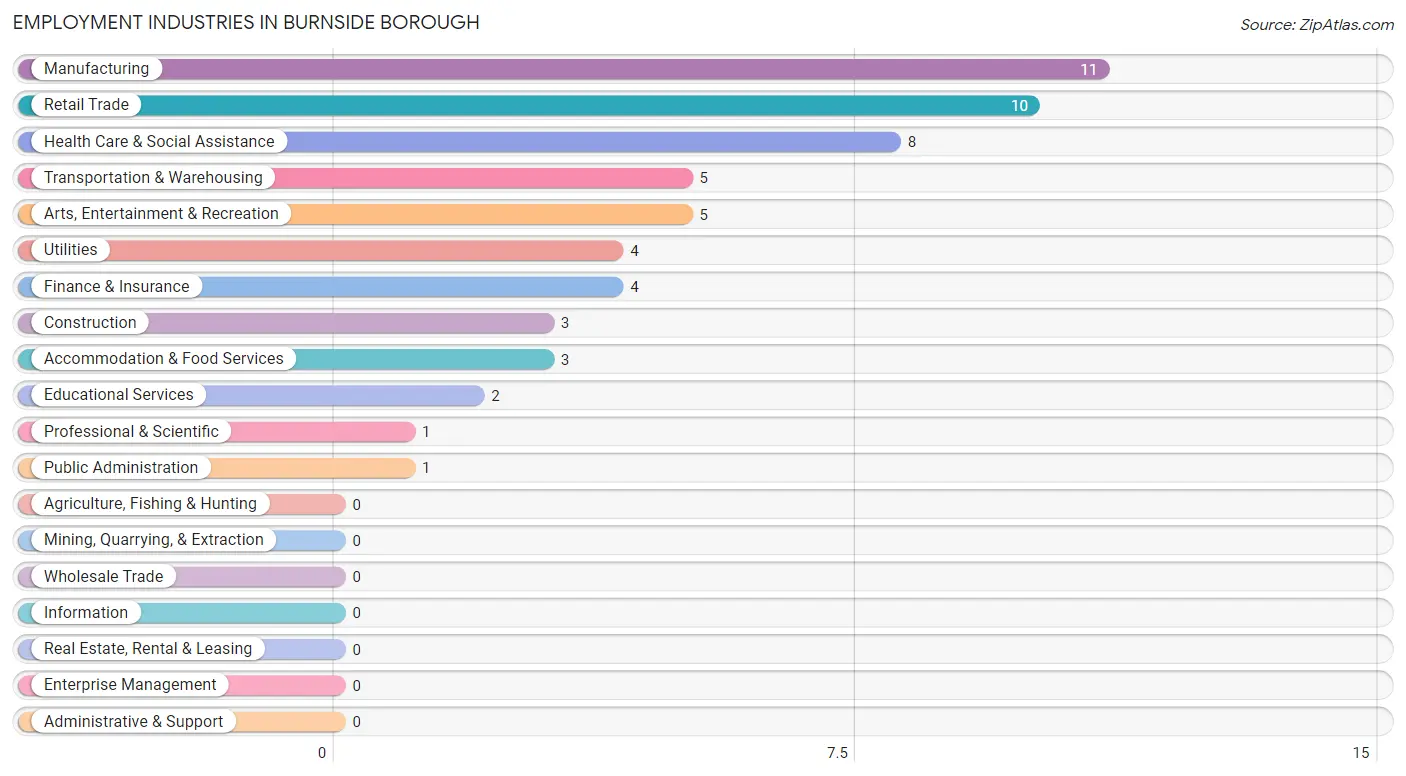
Employment Industries by Sex in Burnside borough
The Burnside borough industries that see more men than women are Manufacturing (100.0%), Transportation & Warehousing (100.0%), and Utilities (100.0%), whereas the industries that tend to have a higher number of women are Finance & Insurance (100.0%), Educational Services (100.0%), and Arts, Entertainment & Recreation (100.0%).
| Industry | Male | Female |
| Agriculture, Fishing & Hunting | 0 (0.0%) | 0 (0.0%) |
| Mining, Quarrying, & Extraction | 0 (0.0%) | 0 (0.0%) |
| Construction | 2 (66.7%) | 1 (33.3%) |
| Manufacturing | 11 (100.0%) | 0 (0.0%) |
| Wholesale Trade | 0 (0.0%) | 0 (0.0%) |
| Retail Trade | 5 (50.0%) | 5 (50.0%) |
| Transportation & Warehousing | 5 (100.0%) | 0 (0.0%) |
| Utilities | 4 (100.0%) | 0 (0.0%) |
| Information | 0 (0.0%) | 0 (0.0%) |
| Finance & Insurance | 0 (0.0%) | 4 (100.0%) |
| Real Estate, Rental & Leasing | 0 (0.0%) | 0 (0.0%) |
| Professional & Scientific | 1 (100.0%) | 0 (0.0%) |
| Enterprise Management | 0 (0.0%) | 0 (0.0%) |
| Administrative & Support | 0 (0.0%) | 0 (0.0%) |
| Educational Services | 0 (0.0%) | 2 (100.0%) |
| Health Care & Social Assistance | 2 (25.0%) | 6 (75.0%) |
| Arts, Entertainment & Recreation | 0 (0.0%) | 5 (100.0%) |
| Accommodation & Food Services | 0 (0.0%) | 3 (100.0%) |
| Public Administration | 0 (0.0%) | 1 (100.0%) |
| Total | 36 (56.2%) | 28 (43.8%) |
Education in Burnside borough
School Enrollment in Burnside borough
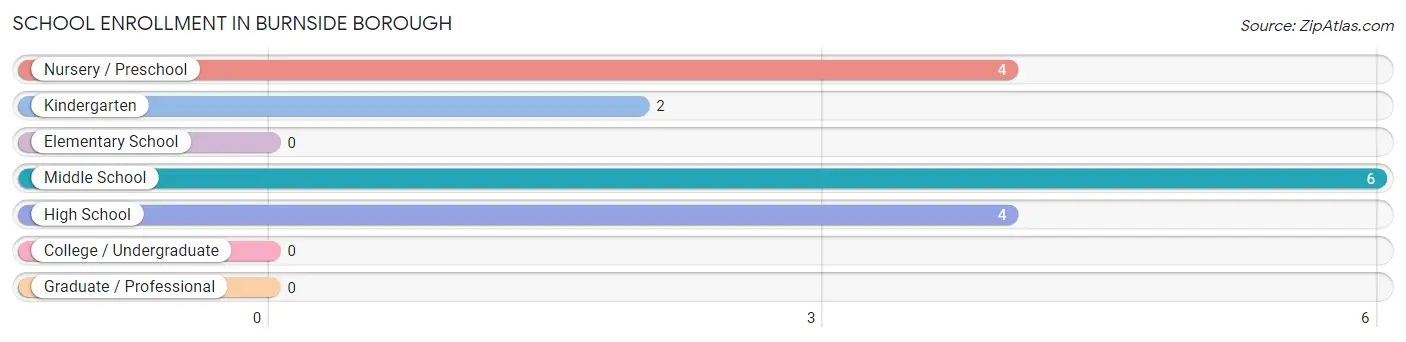
The most common levels of schooling among the 16 students in Burnside borough are middle school (6 | 37.5%), nursery / preschool (4 | 25.0%), and high school (4 | 25.0%).
| School Level | # Students | % Students |
| Nursery / Preschool | 4 | 25.0% |
| Kindergarten | 2 | 12.5% |
| Elementary School | 0 | 0.0% |
| Middle School | 6 | 37.5% |
| High School | 4 | 25.0% |
| College / Undergraduate | 0 | 0.0% |
| Graduate / Professional | 0 | 0.0% |
| Total | 16 | 100.0% |
School Enrollment by Age by Funding Source in Burnside borough
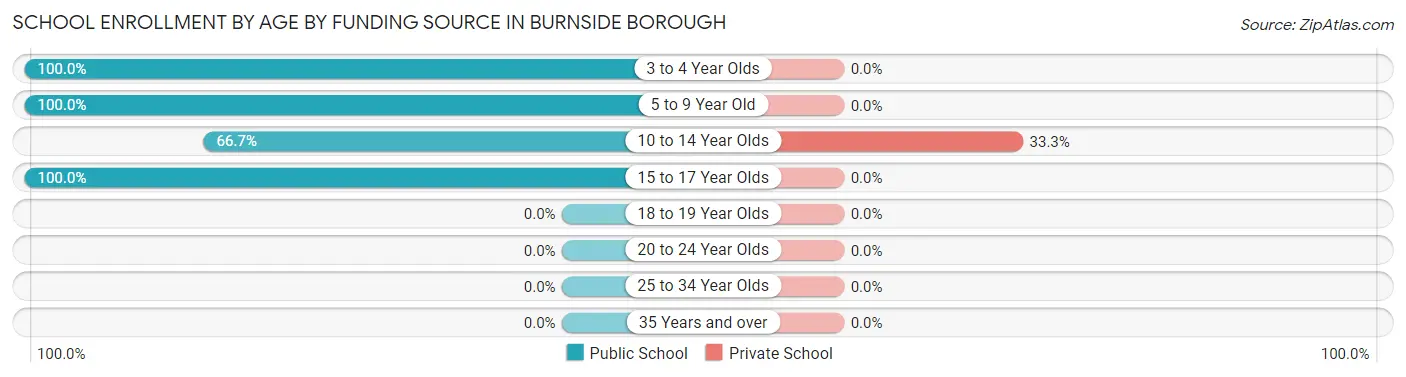
Out of a total of 16 students who are enrolled in schools in Burnside borough, 3 (18.8%) attend a private institution, while the remaining 13 (81.2%) are enrolled in public schools. The age group of 10 to 14 year olds has the highest likelihood of being enrolled in private schools, with 3 (33.3% in the age bracket) enrolled. Conversely, the age group of 3 to 4 year olds has the lowest likelihood of being enrolled in a private school, with 4 (100.0% in the age bracket) attending a public institution.
| Age Bracket | Public School | Private School |
| 3 to 4 Year Olds | 4 (100.0%) | 0 (0.0%) |
| 5 to 9 Year Old | 2 (100.0%) | 0 (0.0%) |
| 10 to 14 Year Olds | 6 (66.7%) | 3 (33.3%) |
| 15 to 17 Year Olds | 1 (100.0%) | 0 (0.0%) |
| 18 to 19 Year Olds | 0 (0.0%) | 0 (0.0%) |
| 20 to 24 Year Olds | 0 (0.0%) | 0 (0.0%) |
| 25 to 34 Year Olds | 0 (0.0%) | 0 (0.0%) |
| 35 Years and over | 0 (0.0%) | 0 (0.0%) |
| Total | 13 (81.3%) | 3 (18.8%) |
Educational Attainment by Field of Study in Burnside borough
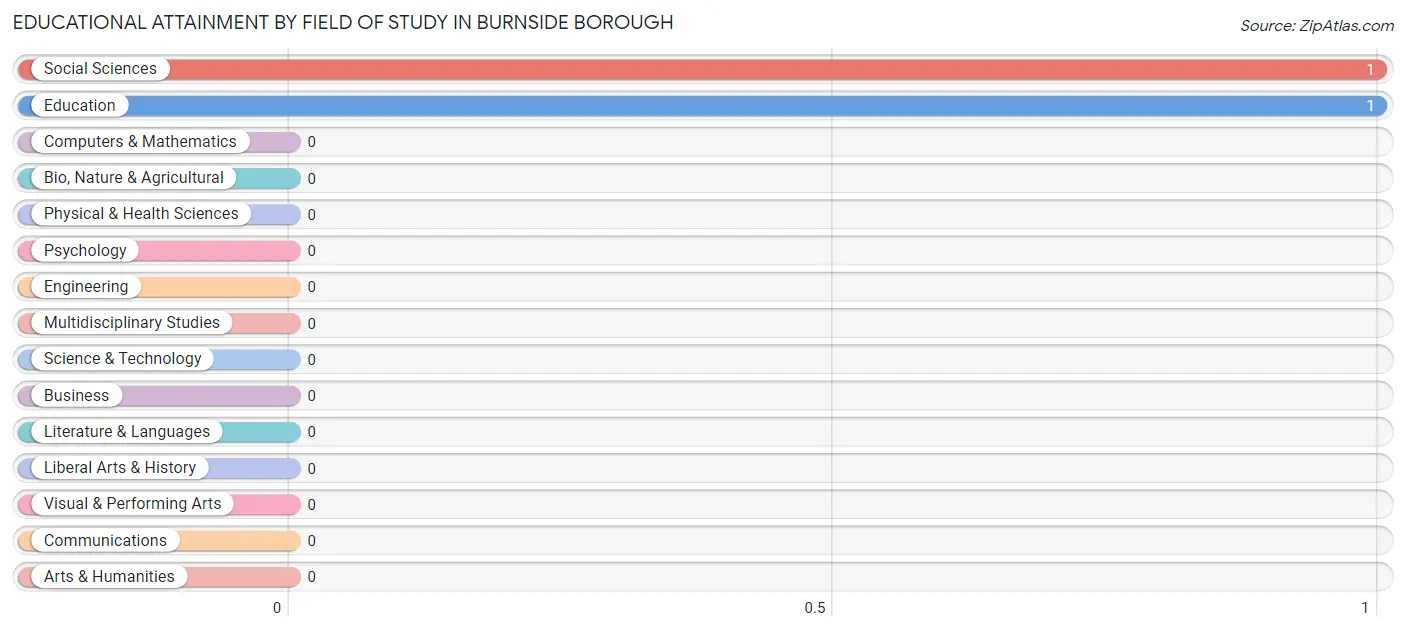
Social sciences (1 | 50.0%), and education (1 | 50.0%) are the most common fields of study among 2 individuals in Burnside borough who have obtained a bachelor's degree or higher.
| Field of Study | # Graduates | % Graduates |
| Computers & Mathematics | 0 | 0.0% |
| Bio, Nature & Agricultural | 0 | 0.0% |
| Physical & Health Sciences | 0 | 0.0% |
| Psychology | 0 | 0.0% |
| Social Sciences | 1 | 50.0% |
| Engineering | 0 | 0.0% |
| Multidisciplinary Studies | 0 | 0.0% |
| Science & Technology | 0 | 0.0% |
| Business | 0 | 0.0% |
| Education | 1 | 50.0% |
| Literature & Languages | 0 | 0.0% |
| Liberal Arts & History | 0 | 0.0% |
| Visual & Performing Arts | 0 | 0.0% |
| Communications | 0 | 0.0% |
| Arts & Humanities | 0 | 0.0% |
| Total | 2 | 100.0% |
Transportation & Commute in Burnside borough
Vehicle Availability by Sex in Burnside borough
The most prevalent vehicle ownership categories in Burnside borough are males with 3 vehicles (10, accounting for 27.8%) and females with 3 vehicles (6, making up 35.7%).
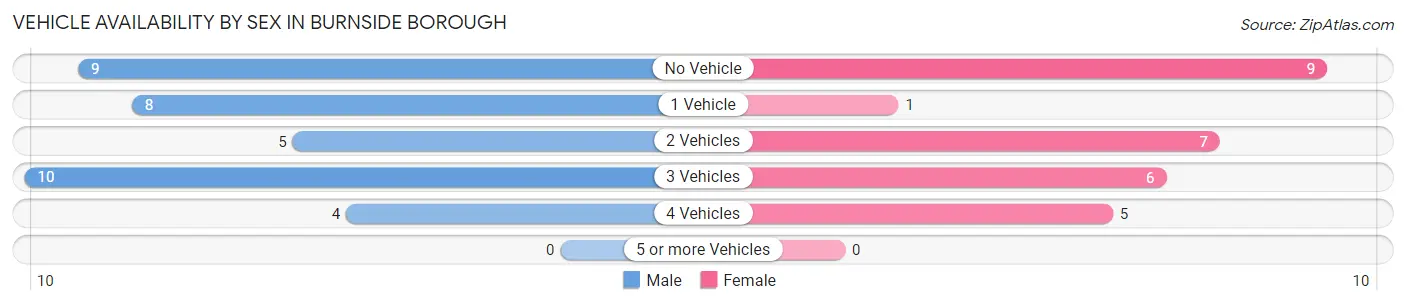
| Vehicles Available | Male | Female |
| No Vehicle | 9 (25.0%) | 9 (32.1%) |
| 1 Vehicle | 8 (22.2%) | 1 (3.6%) |
| 2 Vehicles | 5 (13.9%) | 7 (25.0%) |
| 3 Vehicles | 10 (27.8%) | 6 (21.4%) |
| 4 Vehicles | 4 (11.1%) | 5 (17.9%) |
| 5 or more Vehicles | 0 (0.0%) | 0 (0.0%) |
| Total | 36 (100.0%) | 28 (100.0%) |
Commute Time in Burnside borough
The most frequently occuring commute durations in Burnside borough are 45 to 59 minutes (19 commuters, 33.9%), 30 to 34 minutes (11 commuters, 19.6%), and 20 to 24 minutes (6 commuters, 10.7%).
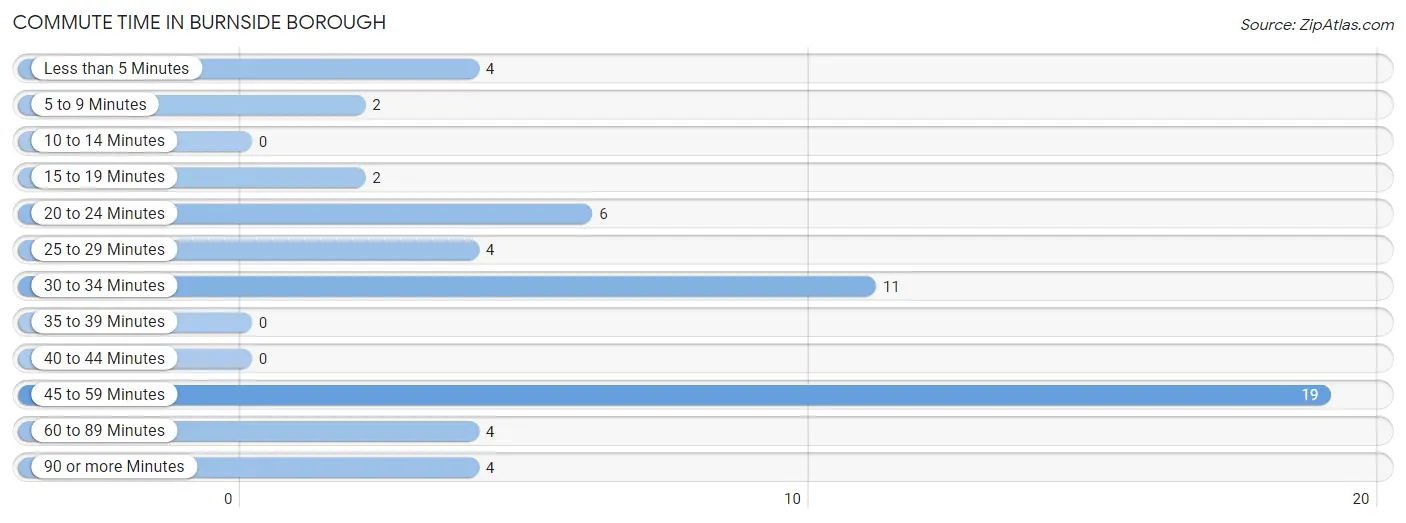
| Commute Time | # Commuters | % Commuters |
| Less than 5 Minutes | 4 | 7.1% |
| 5 to 9 Minutes | 2 | 3.6% |
| 10 to 14 Minutes | 0 | 0.0% |
| 15 to 19 Minutes | 2 | 3.6% |
| 20 to 24 Minutes | 6 | 10.7% |
| 25 to 29 Minutes | 4 | 7.1% |
| 30 to 34 Minutes | 11 | 19.6% |
| 35 to 39 Minutes | 0 | 0.0% |
| 40 to 44 Minutes | 0 | 0.0% |
| 45 to 59 Minutes | 19 | 33.9% |
| 60 to 89 Minutes | 4 | 7.1% |
| 90 or more Minutes | 4 | 7.1% |
Commute Time by Sex in Burnside borough
The most common commute times in Burnside borough are 45 to 59 minutes (8 commuters, 25.8%) for males and 30 to 34 minutes (11 commuters, 44.0%) for females.
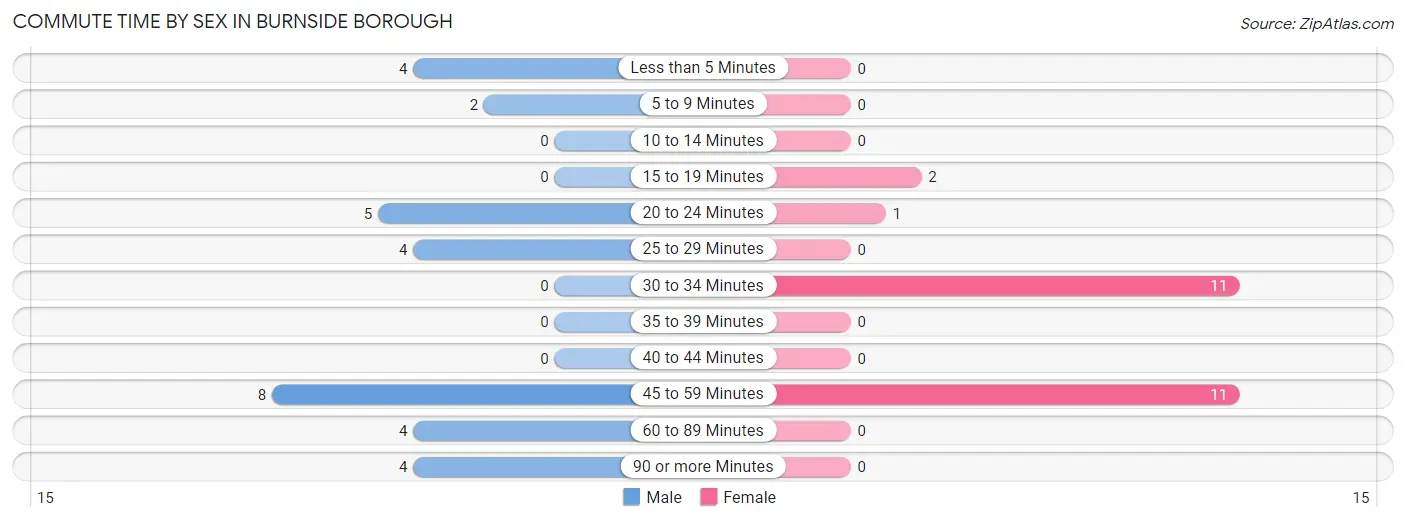
| Commute Time | Male | Female |
| Less than 5 Minutes | 4 (12.9%) | 0 (0.0%) |
| 5 to 9 Minutes | 2 (6.5%) | 0 (0.0%) |
| 10 to 14 Minutes | 0 (0.0%) | 0 (0.0%) |
| 15 to 19 Minutes | 0 (0.0%) | 2 (8.0%) |
| 20 to 24 Minutes | 5 (16.1%) | 1 (4.0%) |
| 25 to 29 Minutes | 4 (12.9%) | 0 (0.0%) |
| 30 to 34 Minutes | 0 (0.0%) | 11 (44.0%) |
| 35 to 39 Minutes | 0 (0.0%) | 0 (0.0%) |
| 40 to 44 Minutes | 0 (0.0%) | 0 (0.0%) |
| 45 to 59 Minutes | 8 (25.8%) | 11 (44.0%) |
| 60 to 89 Minutes | 4 (12.9%) | 0 (0.0%) |
| 90 or more Minutes | 4 (12.9%) | 0 (0.0%) |
Time of Departure to Work by Sex in Burnside borough
The most frequent times of departure to work in Burnside borough are 6:00 AM to 6:29 AM (9, 29.0%) for males and 7:00 AM to 7:29 AM (10, 40.0%) for females.
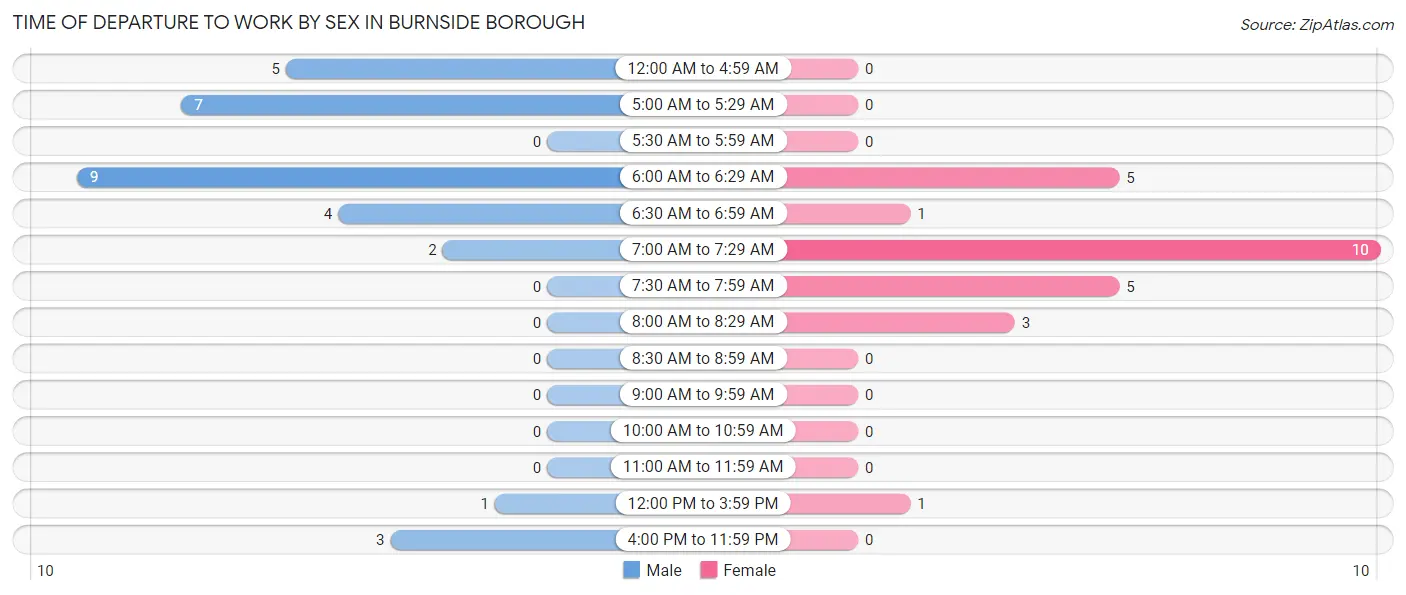
| Time of Departure | Male | Female |
| 12:00 AM to 4:59 AM | 5 (16.1%) | 0 (0.0%) |
| 5:00 AM to 5:29 AM | 7 (22.6%) | 0 (0.0%) |
| 5:30 AM to 5:59 AM | 0 (0.0%) | 0 (0.0%) |
| 6:00 AM to 6:29 AM | 9 (29.0%) | 5 (20.0%) |
| 6:30 AM to 6:59 AM | 4 (12.9%) | 1 (4.0%) |
| 7:00 AM to 7:29 AM | 2 (6.5%) | 10 (40.0%) |
| 7:30 AM to 7:59 AM | 0 (0.0%) | 5 (20.0%) |
| 8:00 AM to 8:29 AM | 0 (0.0%) | 3 (12.0%) |
| 8:30 AM to 8:59 AM | 0 (0.0%) | 0 (0.0%) |
| 9:00 AM to 9:59 AM | 0 (0.0%) | 0 (0.0%) |
| 10:00 AM to 10:59 AM | 0 (0.0%) | 0 (0.0%) |
| 11:00 AM to 11:59 AM | 0 (0.0%) | 0 (0.0%) |
| 12:00 PM to 3:59 PM | 1 (3.2%) | 1 (4.0%) |
| 4:00 PM to 11:59 PM | 3 (9.7%) | 0 (0.0%) |
| Total | 31 (100.0%) | 25 (100.0%) |
Housing Occupancy in Burnside borough
Occupancy by Ownership in Burnside borough
Of the total 72 dwellings in Burnside borough, owner-occupied units account for 63 (87.5%), while renter-occupied units make up 9 (12.5%).
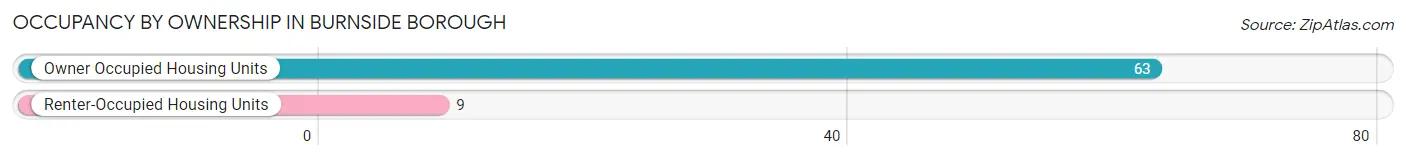
| Occupancy | # Housing Units | % Housing Units |
| Owner Occupied Housing Units | 63 | 87.5% |
| Renter-Occupied Housing Units | 9 | 12.5% |
| Total Occupied Housing Units | 72 | 100.0% |
Occupancy by Household Size in Burnside borough
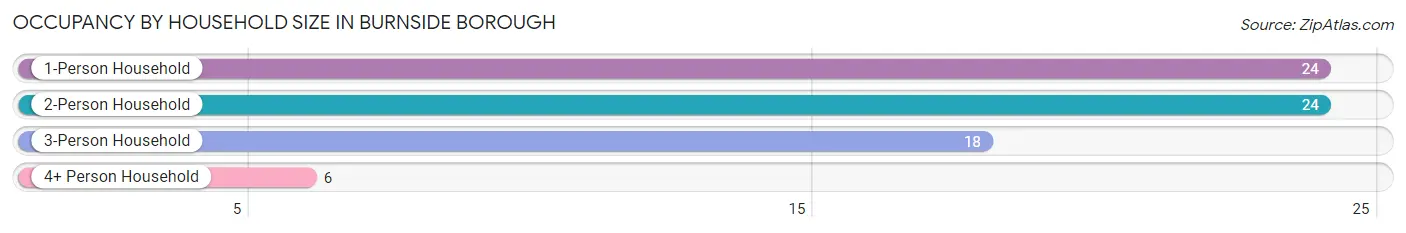
| Household Size | # Housing Units | % Housing Units |
| 1-Person Household | 24 | 33.3% |
| 2-Person Household | 24 | 33.3% |
| 3-Person Household | 18 | 25.0% |
| 4+ Person Household | 6 | 8.3% |
| Total Housing Units | 72 | 100.0% |
Occupancy by Ownership by Household Size in Burnside borough
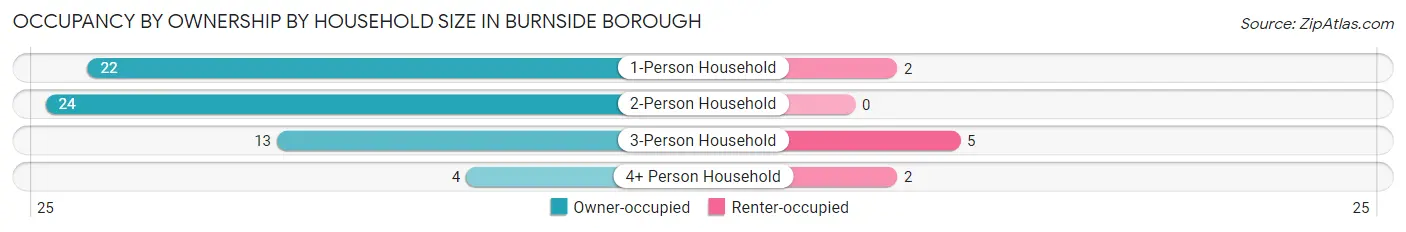
| Household Size | Owner-occupied | Renter-occupied |
| 1-Person Household | 22 (91.7%) | 2 (8.3%) |
| 2-Person Household | 24 (100.0%) | 0 (0.0%) |
| 3-Person Household | 13 (72.2%) | 5 (27.8%) |
| 4+ Person Household | 4 (66.7%) | 2 (33.3%) |
| Total Housing Units | 63 (87.5%) | 9 (12.5%) |
Occupancy by Educational Attainment in Burnside borough
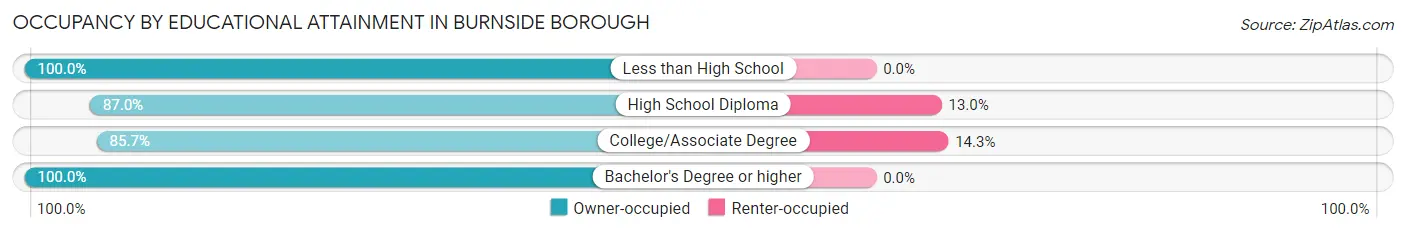
| Household Size | Owner-occupied | Renter-occupied |
| Less than High School | 2 (100.0%) | 0 (0.0%) |
| High School Diploma | 47 (87.0%) | 7 (13.0%) |
| College/Associate Degree | 12 (85.7%) | 2 (14.3%) |
| Bachelor's Degree or higher | 2 (100.0%) | 0 (0.0%) |
Occupancy by Age of Householder in Burnside borough
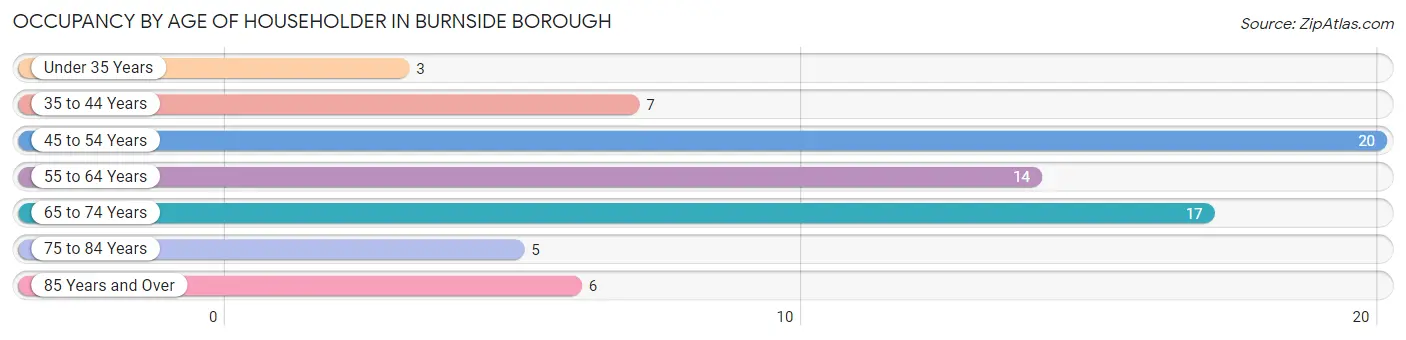
| Age Bracket | # Households | % Households |
| Under 35 Years | 3 | 4.2% |
| 35 to 44 Years | 7 | 9.7% |
| 45 to 54 Years | 20 | 27.8% |
| 55 to 64 Years | 14 | 19.4% |
| 65 to 74 Years | 17 | 23.6% |
| 75 to 84 Years | 5 | 6.9% |
| 85 Years and Over | 6 | 8.3% |
| Total | 72 | 100.0% |
Housing Finances in Burnside borough
Median Income by Occupancy in Burnside borough
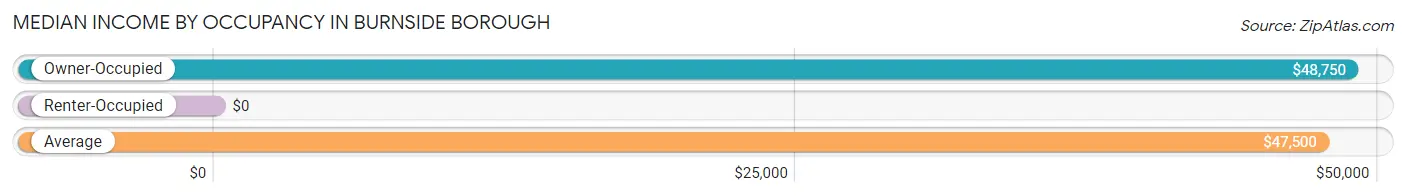
| Occupancy Type | # Households | Median Income |
| Owner-Occupied | 63 (87.5%) | $48,750 |
| Renter-Occupied | 9 (12.5%) | $0 |
| Average | 72 (100.0%) | $47,500 |
Occupancy by Householder Income Bracket in Burnside borough
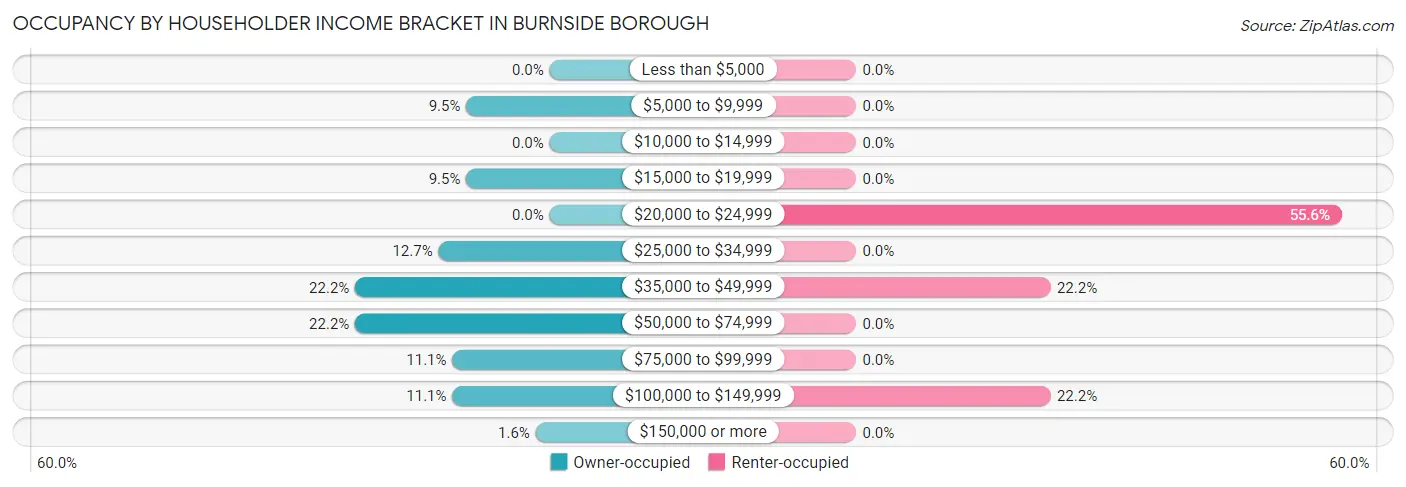
| Income Bracket | Owner-occupied | Renter-occupied |
| Less than $5,000 | 0 (0.0%) | 0 (0.0%) |
| $5,000 to $9,999 | 6 (9.5%) | 0 (0.0%) |
| $10,000 to $14,999 | 0 (0.0%) | 0 (0.0%) |
| $15,000 to $19,999 | 6 (9.5%) | 0 (0.0%) |
| $20,000 to $24,999 | 0 (0.0%) | 5 (55.6%) |
| $25,000 to $34,999 | 8 (12.7%) | 0 (0.0%) |
| $35,000 to $49,999 | 14 (22.2%) | 2 (22.2%) |
| $50,000 to $74,999 | 14 (22.2%) | 0 (0.0%) |
| $75,000 to $99,999 | 7 (11.1%) | 0 (0.0%) |
| $100,000 to $149,999 | 7 (11.1%) | 2 (22.2%) |
| $150,000 or more | 1 (1.6%) | 0 (0.0%) |
| Total | 63 (100.0%) | 9 (100.0%) |
Monthly Housing Cost Tiers in Burnside borough
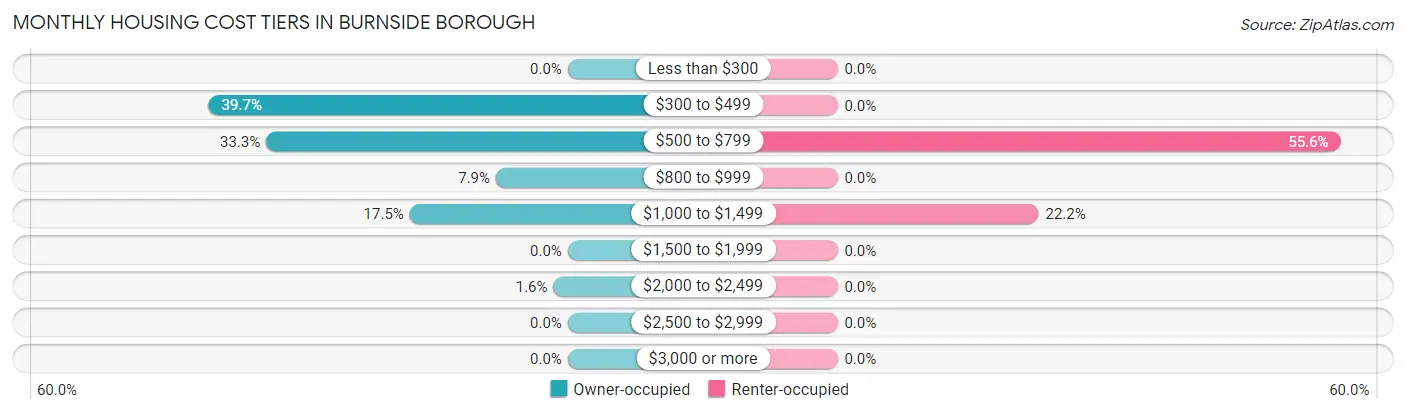
| Monthly Cost | Owner-occupied | Renter-occupied |
| Less than $300 | 0 (0.0%) | 0 (0.0%) |
| $300 to $499 | 25 (39.7%) | 0 (0.0%) |
| $500 to $799 | 21 (33.3%) | 5 (55.6%) |
| $800 to $999 | 5 (7.9%) | 0 (0.0%) |
| $1,000 to $1,499 | 11 (17.5%) | 2 (22.2%) |
| $1,500 to $1,999 | 0 (0.0%) | 0 (0.0%) |
| $2,000 to $2,499 | 1 (1.6%) | 0 (0.0%) |
| $2,500 to $2,999 | 0 (0.0%) | 0 (0.0%) |
| $3,000 or more | 0 (0.0%) | 0 (0.0%) |
| Total | 63 (100.0%) | 9 (100.0%) |
Physical Housing Characteristics in Burnside borough
Housing Structures in Burnside borough
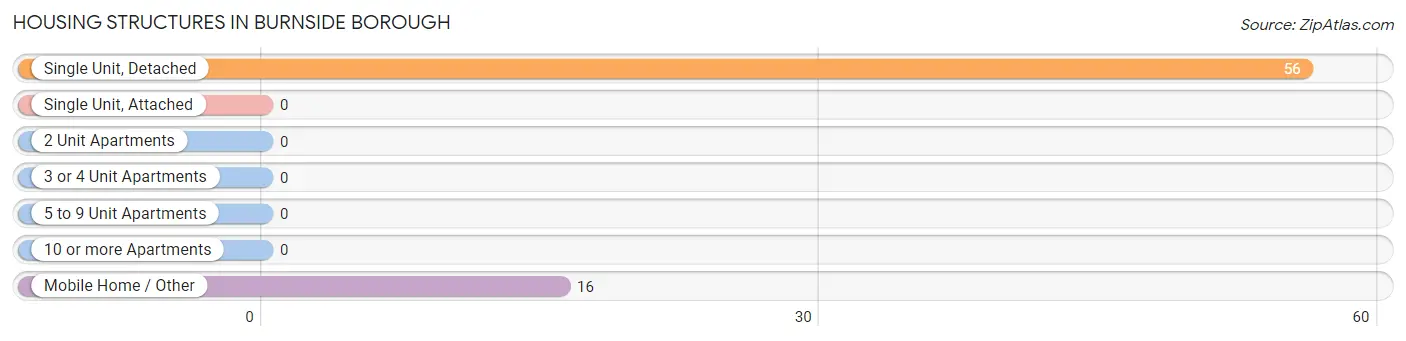
| Structure Type | # Housing Units | % Housing Units |
| Single Unit, Detached | 56 | 77.8% |
| Single Unit, Attached | 0 | 0.0% |
| 2 Unit Apartments | 0 | 0.0% |
| 3 or 4 Unit Apartments | 0 | 0.0% |
| 5 to 9 Unit Apartments | 0 | 0.0% |
| 10 or more Apartments | 0 | 0.0% |
| Mobile Home / Other | 16 | 22.2% |
| Total | 72 | 100.0% |
Housing Structures by Occupancy in Burnside borough
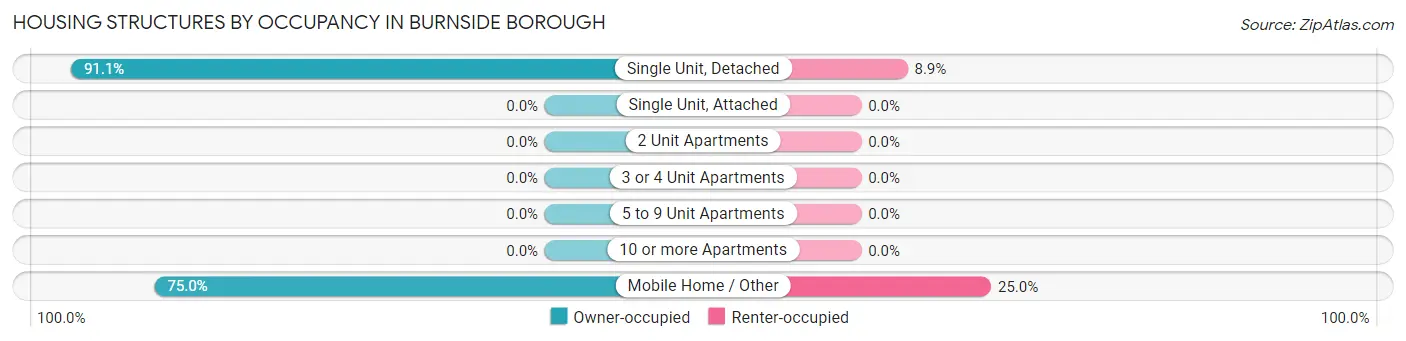
| Structure Type | Owner-occupied | Renter-occupied |
| Single Unit, Detached | 51 (91.1%) | 5 (8.9%) |
| Single Unit, Attached | 0 (0.0%) | 0 (0.0%) |
| 2 Unit Apartments | 0 (0.0%) | 0 (0.0%) |
| 3 or 4 Unit Apartments | 0 (0.0%) | 0 (0.0%) |
| 5 to 9 Unit Apartments | 0 (0.0%) | 0 (0.0%) |
| 10 or more Apartments | 0 (0.0%) | 0 (0.0%) |
| Mobile Home / Other | 12 (75.0%) | 4 (25.0%) |
| Total | 63 (87.5%) | 9 (12.5%) |
Housing Structures by Number of Rooms in Burnside borough
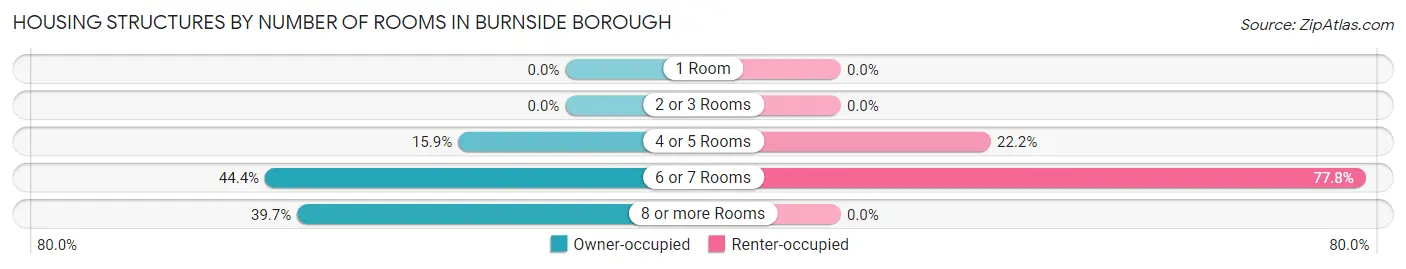
| Number of Rooms | Owner-occupied | Renter-occupied |
| 1 Room | 0 (0.0%) | 0 (0.0%) |
| 2 or 3 Rooms | 0 (0.0%) | 0 (0.0%) |
| 4 or 5 Rooms | 10 (15.9%) | 2 (22.2%) |
| 6 or 7 Rooms | 28 (44.4%) | 7 (77.8%) |
| 8 or more Rooms | 25 (39.7%) | 0 (0.0%) |
| Total | 63 (100.0%) | 9 (100.0%) |
Housing Structure by Heating Type in Burnside borough
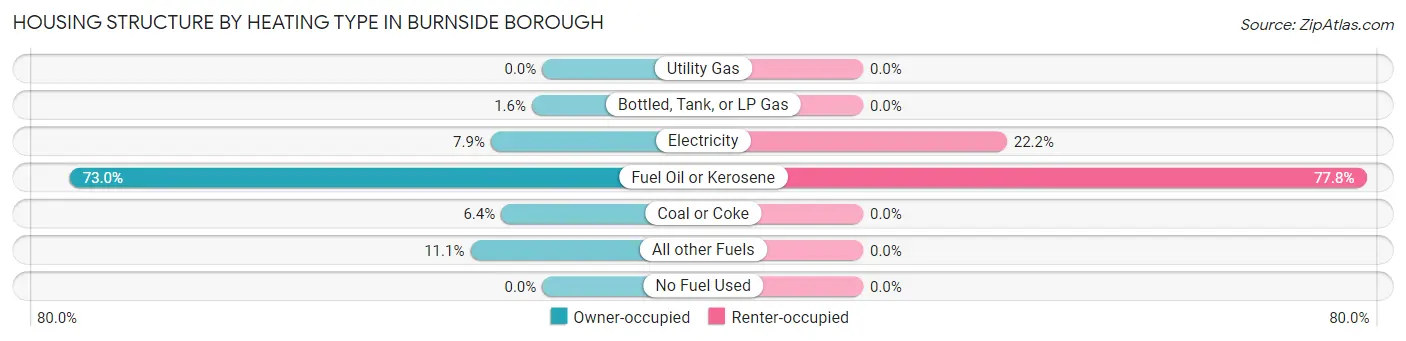
| Heating Type | Owner-occupied | Renter-occupied |
| Utility Gas | 0 (0.0%) | 0 (0.0%) |
| Bottled, Tank, or LP Gas | 1 (1.6%) | 0 (0.0%) |
| Electricity | 5 (7.9%) | 2 (22.2%) |
| Fuel Oil or Kerosene | 46 (73.0%) | 7 (77.8%) |
| Coal or Coke | 4 (6.4%) | 0 (0.0%) |
| All other Fuels | 7 (11.1%) | 0 (0.0%) |
| No Fuel Used | 0 (0.0%) | 0 (0.0%) |
| Total | 63 (100.0%) | 9 (100.0%) |
Household Vehicle Usage in Burnside borough
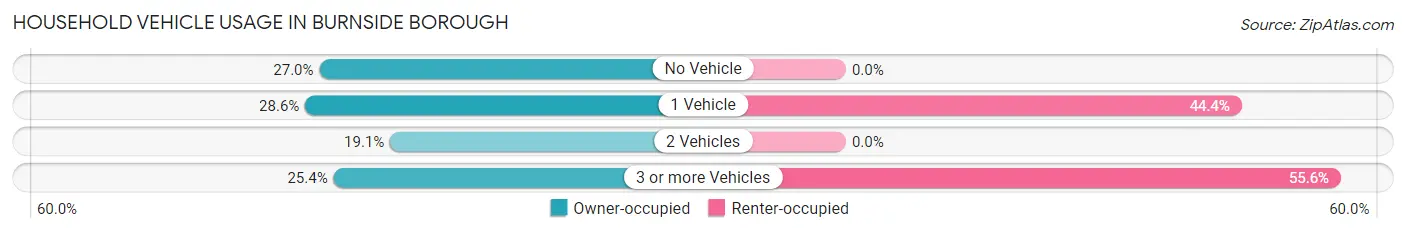
| Vehicles per Household | Owner-occupied | Renter-occupied |
| No Vehicle | 17 (27.0%) | 0 (0.0%) |
| 1 Vehicle | 18 (28.6%) | 4 (44.4%) |
| 2 Vehicles | 12 (19.1%) | 0 (0.0%) |
| 3 or more Vehicles | 16 (25.4%) | 5 (55.6%) |
| Total | 63 (100.0%) | 9 (100.0%) |
Real Estate & Mortgages in Burnside borough
Real Estate and Mortgage Overview in Burnside borough
| Characteristic | Without Mortgage | With Mortgage |
| Housing Units | 39 | 24 |
| Median Property Value | $48,800 | $64,300 |
| Median Household Income | $41,250 | $0 |
| Monthly Housing Costs | $486 | $0 |
| Real Estate Taxes | $770 | $1 |
Property Value by Mortgage Status in Burnside borough
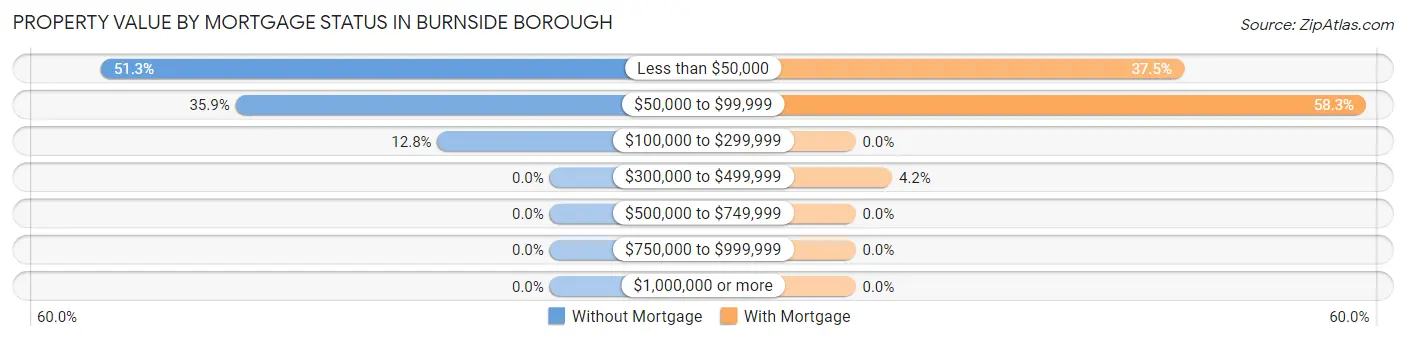
| Property Value | Without Mortgage | With Mortgage |
| Less than $50,000 | 20 (51.3%) | 9 (37.5%) |
| $50,000 to $99,999 | 14 (35.9%) | 14 (58.3%) |
| $100,000 to $299,999 | 5 (12.8%) | 0 (0.0%) |
| $300,000 to $499,999 | 0 (0.0%) | 1 (4.2%) |
| $500,000 to $749,999 | 0 (0.0%) | 0 (0.0%) |
| $750,000 to $999,999 | 0 (0.0%) | 0 (0.0%) |
| $1,000,000 or more | 0 (0.0%) | 0 (0.0%) |
| Total | 39 (100.0%) | 24 (100.0%) |
Household Income by Mortgage Status in Burnside borough
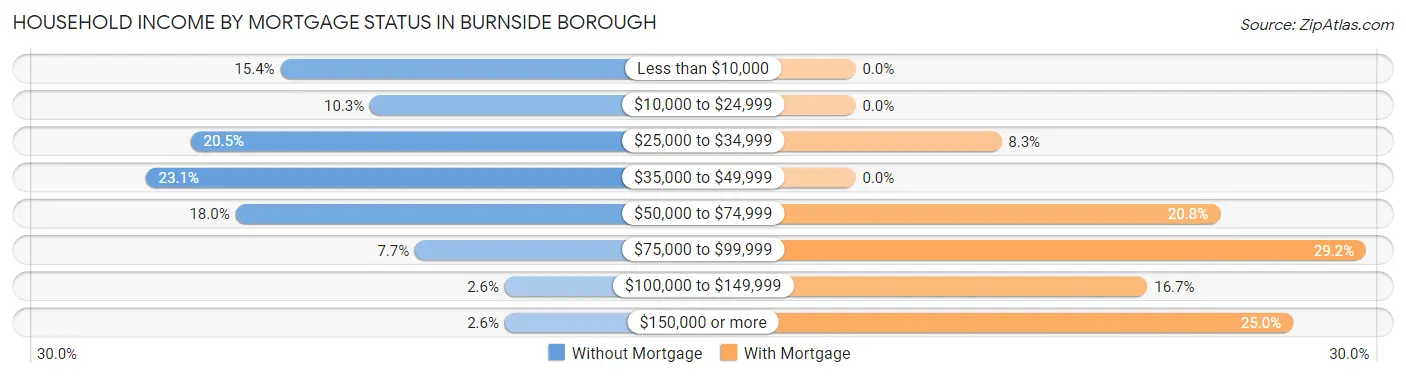
| Household Income | Without Mortgage | With Mortgage |
| Less than $10,000 | 6 (15.4%) | 0 (0.0%) |
| $10,000 to $24,999 | 4 (10.3%) | 0 (0.0%) |
| $25,000 to $34,999 | 8 (20.5%) | 2 (8.3%) |
| $35,000 to $49,999 | 9 (23.1%) | 0 (0.0%) |
| $50,000 to $74,999 | 7 (17.9%) | 5 (20.8%) |
| $75,000 to $99,999 | 3 (7.7%) | 7 (29.2%) |
| $100,000 to $149,999 | 1 (2.6%) | 4 (16.7%) |
| $150,000 or more | 1 (2.6%) | 6 (25.0%) |
| Total | 39 (100.0%) | 24 (100.0%) |
Property Value to Household Income Ratio in Burnside borough
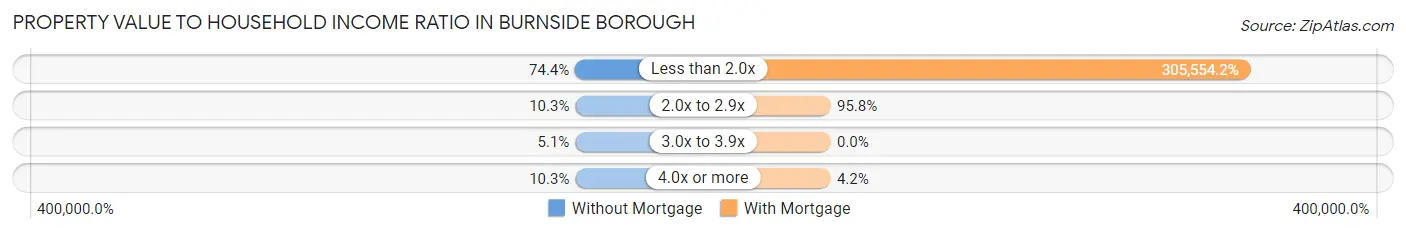
| Value-to-Income Ratio | Without Mortgage | With Mortgage |
| Less than 2.0x | 29 (74.4%) | 73,333 (305,554.2%) |
| 2.0x to 2.9x | 4 (10.3%) | 23 (95.8%) |
| 3.0x to 3.9x | 2 (5.1%) | 0 (0.0%) |
| 4.0x or more | 4 (10.3%) | 1 (4.2%) |
| Total | 39 (100.0%) | 24 (100.0%) |
Real Estate Taxes by Mortgage Status in Burnside borough
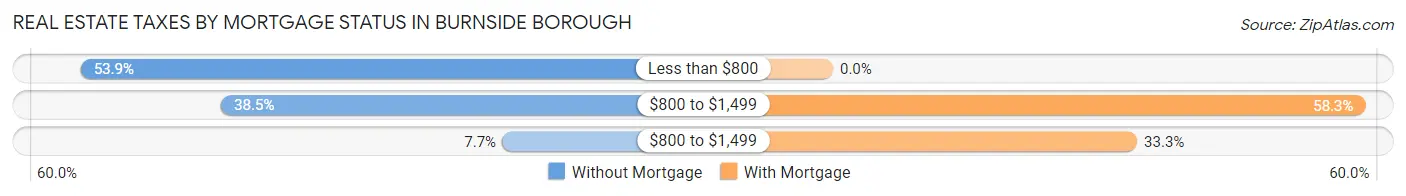
| Property Taxes | Without Mortgage | With Mortgage |
| Less than $800 | 21 (53.8%) | 0 (0.0%) |
| $800 to $1,499 | 15 (38.5%) | 14 (58.3%) |
| $800 to $1,499 | 3 (7.7%) | 8 (33.3%) |
| Total | 39 (100.0%) | 24 (100.0%) |
Health & Disability in Burnside borough
Health Insurance Coverage by Age in Burnside borough
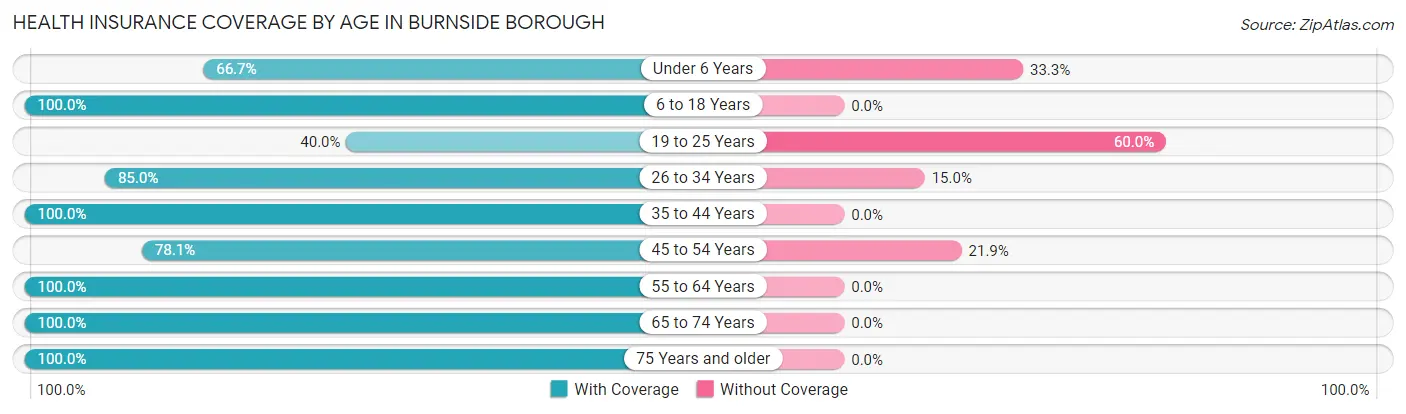
| Age Bracket | With Coverage | Without Coverage |
| Under 6 Years | 4 (66.7%) | 2 (33.3%) |
| 6 to 18 Years | 12 (100.0%) | 0 (0.0%) |
| 19 to 25 Years | 2 (40.0%) | 3 (60.0%) |
| 26 to 34 Years | 17 (85.0%) | 3 (15.0%) |
| 35 to 44 Years | 17 (100.0%) | 0 (0.0%) |
| 45 to 54 Years | 25 (78.1%) | 7 (21.9%) |
| 55 to 64 Years | 34 (100.0%) | 0 (0.0%) |
| 65 to 74 Years | 25 (100.0%) | 0 (0.0%) |
| 75 Years and older | 12 (100.0%) | 0 (0.0%) |
| Total | 148 (90.8%) | 15 (9.2%) |
Health Insurance Coverage by Citizenship Status in Burnside borough
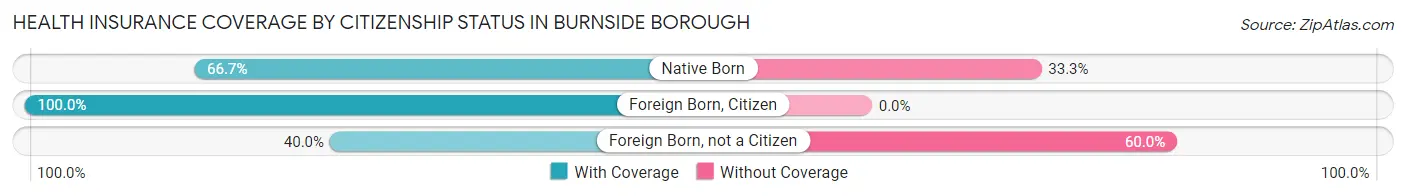
| Citizenship Status | With Coverage | Without Coverage |
| Native Born | 4 (66.7%) | 2 (33.3%) |
| Foreign Born, Citizen | 12 (100.0%) | 0 (0.0%) |
| Foreign Born, not a Citizen | 2 (40.0%) | 3 (60.0%) |
Health Insurance Coverage by Household Income in Burnside borough
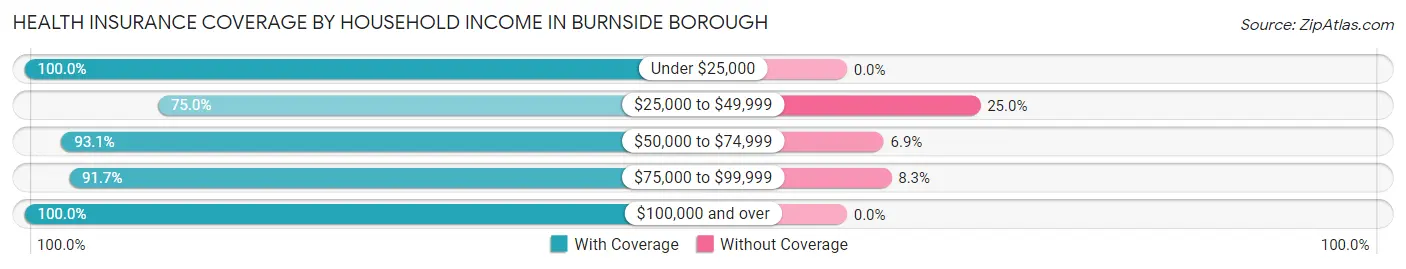
| Household Income | With Coverage | Without Coverage |
| Under $25,000 | 28 (100.0%) | 0 (0.0%) |
| $25,000 to $49,999 | 33 (75.0%) | 11 (25.0%) |
| $50,000 to $74,999 | 27 (93.1%) | 2 (6.9%) |
| $75,000 to $99,999 | 22 (91.7%) | 2 (8.3%) |
| $100,000 and over | 32 (100.0%) | 0 (0.0%) |
Public vs Private Health Insurance Coverage by Age in Burnside borough
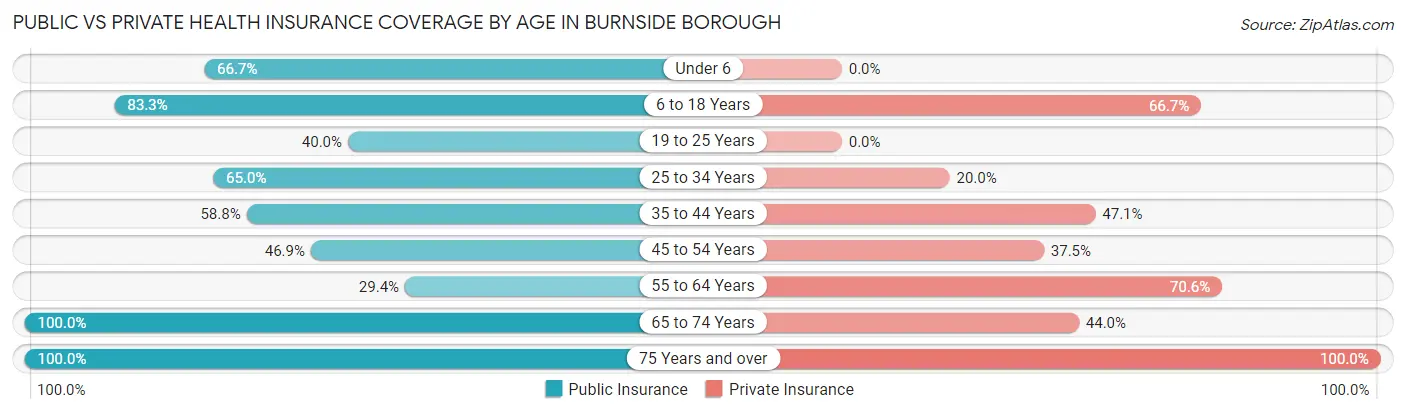
| Age Bracket | Public Insurance | Private Insurance |
| Under 6 | 4 (66.7%) | 0 (0.0%) |
| 6 to 18 Years | 10 (83.3%) | 8 (66.7%) |
| 19 to 25 Years | 2 (40.0%) | 0 (0.0%) |
| 25 to 34 Years | 13 (65.0%) | 4 (20.0%) |
| 35 to 44 Years | 10 (58.8%) | 8 (47.1%) |
| 45 to 54 Years | 15 (46.9%) | 12 (37.5%) |
| 55 to 64 Years | 10 (29.4%) | 24 (70.6%) |
| 65 to 74 Years | 25 (100.0%) | 11 (44.0%) |
| 75 Years and over | 12 (100.0%) | 12 (100.0%) |
| Total | 101 (62.0%) | 79 (48.5%) |
Disability Status by Sex by Age in Burnside borough
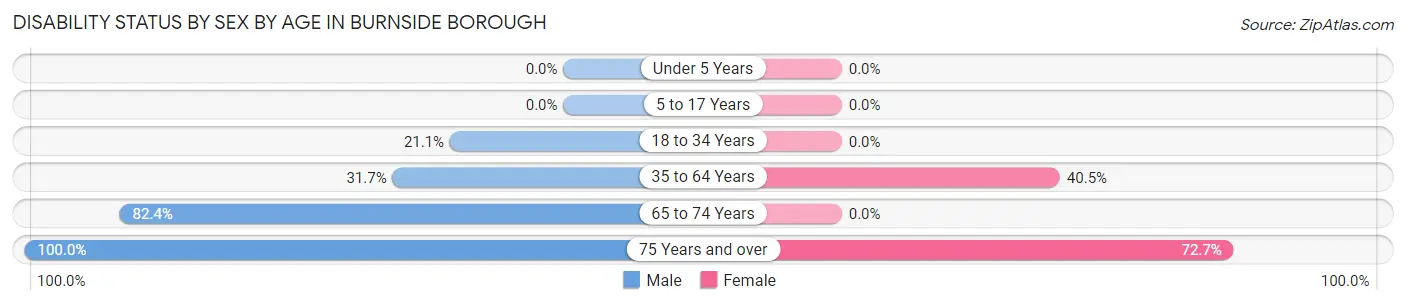
| Age Bracket | Male | Female |
| Under 5 Years | 0 (0.0%) | 0 (0.0%) |
| 5 to 17 Years | 0 (0.0%) | 0 (0.0%) |
| 18 to 34 Years | 4 (21.0%) | 0 (0.0%) |
| 35 to 64 Years | 13 (31.7%) | 17 (40.5%) |
| 65 to 74 Years | 14 (82.4%) | 0 (0.0%) |
| 75 Years and over | 1 (100.0%) | 8 (72.7%) |
Disability Class by Sex by Age in Burnside borough
Disability Class: Hearing Difficulty
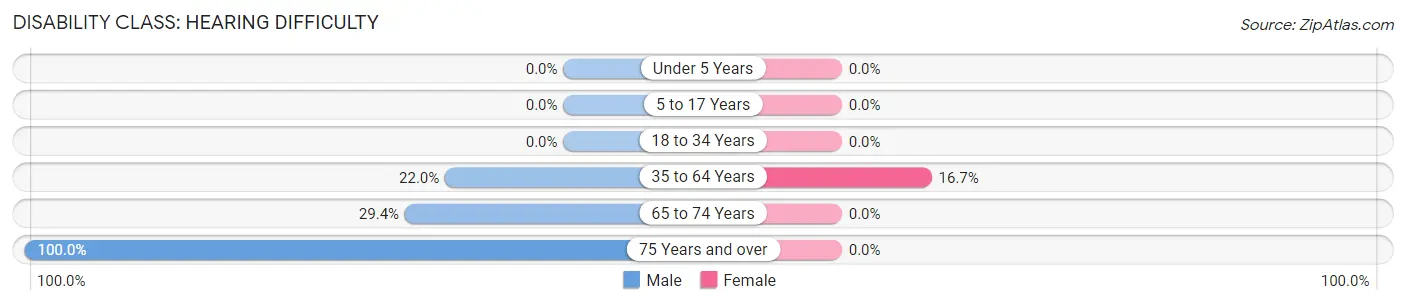
| Age Bracket | Male | Female |
| Under 5 Years | 0 (0.0%) | 0 (0.0%) |
| 5 to 17 Years | 0 (0.0%) | 0 (0.0%) |
| 18 to 34 Years | 0 (0.0%) | 0 (0.0%) |
| 35 to 64 Years | 9 (22.0%) | 7 (16.7%) |
| 65 to 74 Years | 5 (29.4%) | 0 (0.0%) |
| 75 Years and over | 1 (100.0%) | 0 (0.0%) |
Disability Class: Vision Difficulty
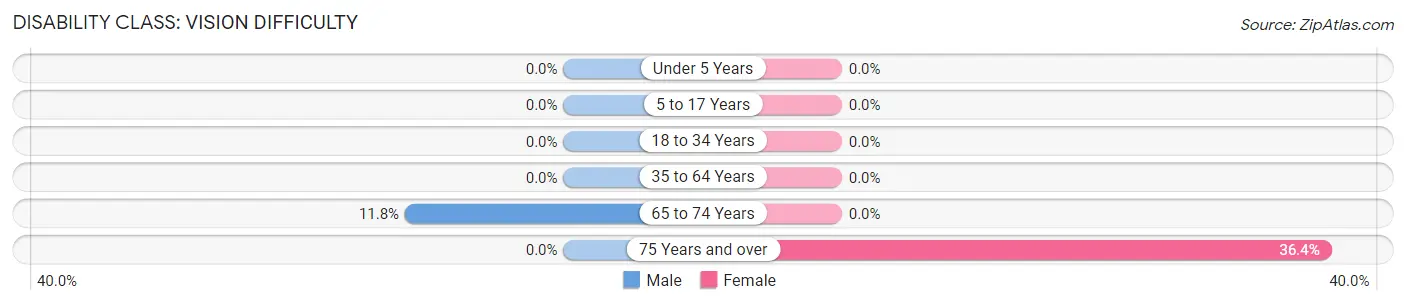
| Age Bracket | Male | Female |
| Under 5 Years | 0 (0.0%) | 0 (0.0%) |
| 5 to 17 Years | 0 (0.0%) | 0 (0.0%) |
| 18 to 34 Years | 0 (0.0%) | 0 (0.0%) |
| 35 to 64 Years | 0 (0.0%) | 0 (0.0%) |
| 65 to 74 Years | 2 (11.8%) | 0 (0.0%) |
| 75 Years and over | 0 (0.0%) | 4 (36.4%) |
Disability Class: Cognitive Difficulty
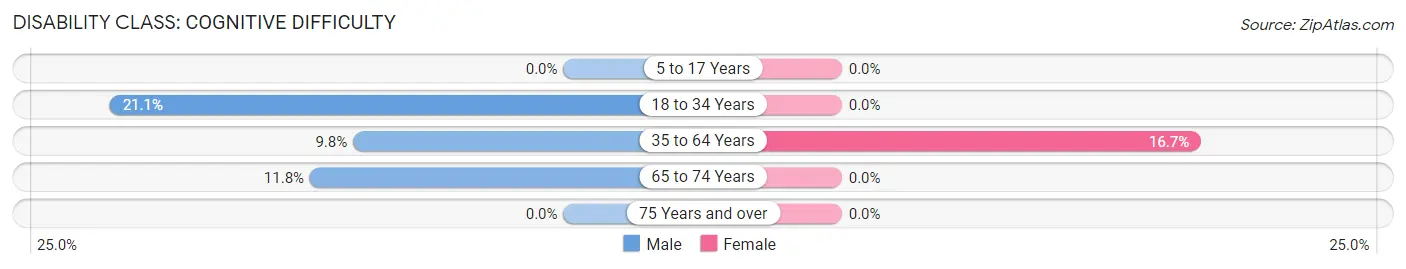
| Age Bracket | Male | Female |
| 5 to 17 Years | 0 (0.0%) | 0 (0.0%) |
| 18 to 34 Years | 4 (21.0%) | 0 (0.0%) |
| 35 to 64 Years | 4 (9.8%) | 7 (16.7%) |
| 65 to 74 Years | 2 (11.8%) | 0 (0.0%) |
| 75 Years and over | 0 (0.0%) | 0 (0.0%) |
Disability Class: Ambulatory Difficulty
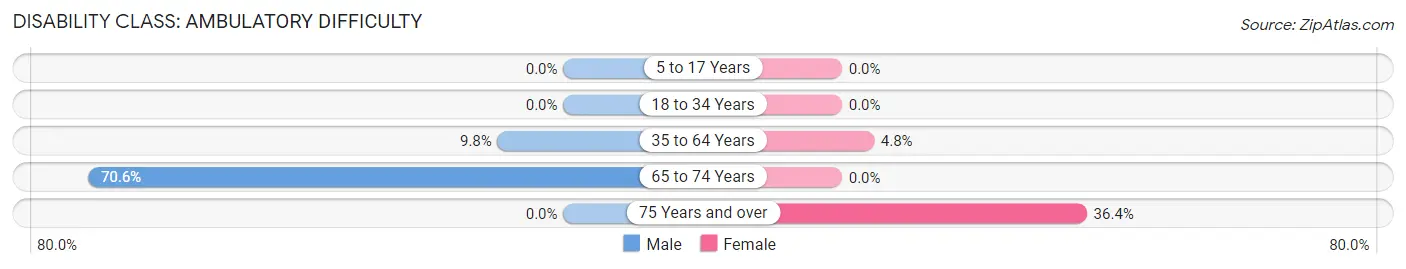
| Age Bracket | Male | Female |
| 5 to 17 Years | 0 (0.0%) | 0 (0.0%) |
| 18 to 34 Years | 0 (0.0%) | 0 (0.0%) |
| 35 to 64 Years | 4 (9.8%) | 2 (4.8%) |
| 65 to 74 Years | 12 (70.6%) | 0 (0.0%) |
| 75 Years and over | 0 (0.0%) | 4 (36.4%) |
Disability Class: Self-Care Difficulty
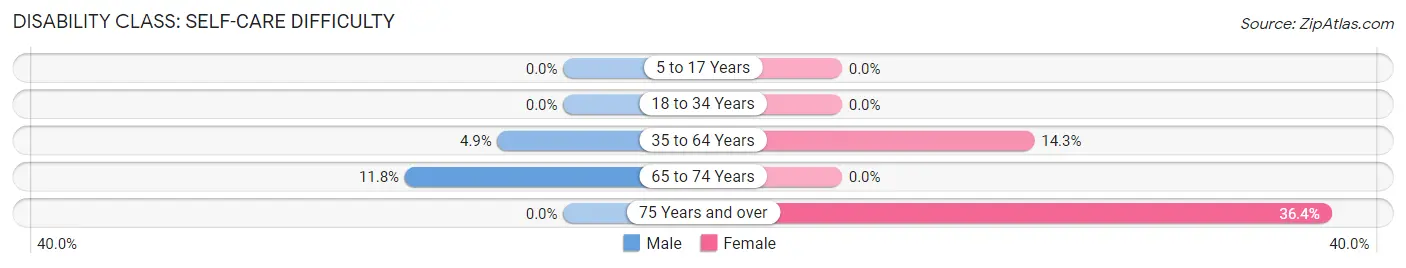
| Age Bracket | Male | Female |
| 5 to 17 Years | 0 (0.0%) | 0 (0.0%) |
| 18 to 34 Years | 0 (0.0%) | 0 (0.0%) |
| 35 to 64 Years | 2 (4.9%) | 6 (14.3%) |
| 65 to 74 Years | 2 (11.8%) | 0 (0.0%) |
| 75 Years and over | 0 (0.0%) | 4 (36.4%) |
Technology Access in Burnside borough
Computing Device Access in Burnside borough
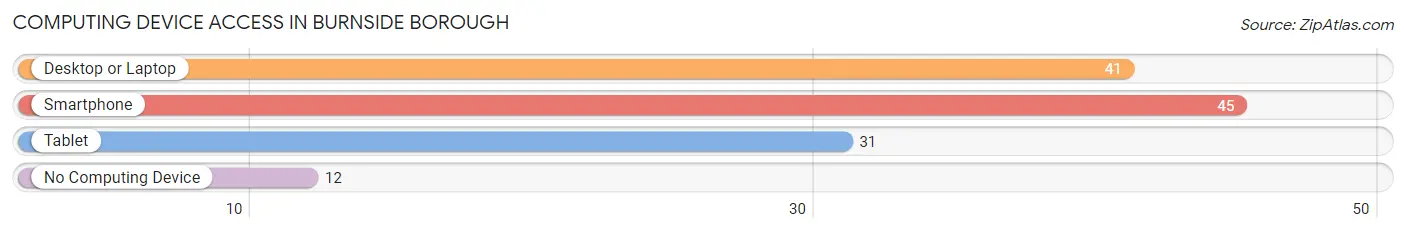
| Device Type | # Households | % Households |
| Desktop or Laptop | 41 | 56.9% |
| Smartphone | 45 | 62.5% |
| Tablet | 31 | 43.1% |
| No Computing Device | 12 | 16.7% |
| Total | 72 | 100.0% |
Internet Access in Burnside borough
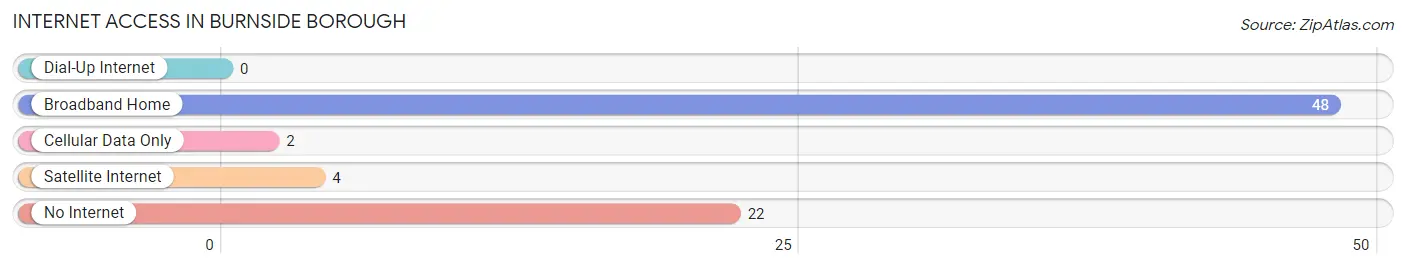
| Internet Type | # Households | % Households |
| Dial-Up Internet | 0 | 0.0% |
| Broadband Home | 48 | 66.7% |
| Cellular Data Only | 2 | 2.8% |
| Satellite Internet | 4 | 5.6% |
| No Internet | 22 | 30.6% |
| Total | 72 | 100.0% |
Burnside borough Summary
Burnside Borough is a small borough located in the state of Pennsylvania. It is situated in the northern part of the state, in the county of Cambria. The borough is bordered by the townships of East Taylor, West Taylor, and Jackson. According to the 2010 census, the population of Burnside Borough was 1,845.
History
Burnside Borough was founded in 1876 by a group of settlers from the nearby town of Ebensburg. The settlers named the borough after the nearby Burnside Creek, which was named after the Revolutionary War General, Ambrose Burnside. The first post office in the borough was established in 1877.
In the early 1900s, the borough was a thriving coal mining town. The coal industry provided jobs for many of the residents and helped to fuel the local economy. The coal industry eventually declined in the mid-1900s, and the borough began to transition to a more residential area.
Geography
Burnside Borough is located in the northern part of Cambria County, Pennsylvania. It is situated in the Appalachian Mountains, and is surrounded by the townships of East Taylor, West Taylor, and Jackson. The borough is located at an elevation of 1,845 feet above sea level.
The borough covers an area of 0.7 square miles, and is home to a variety of natural features, including forests, streams, and wetlands. The borough is also home to several parks, including Burnside Park, which features a playground, picnic area, and walking trails.
Economy
The economy of Burnside Borough is largely based on the service industry. The borough is home to a variety of businesses, including restaurants, retail stores, and professional services. The borough is also home to a number of manufacturing companies, including a paper mill and a furniture factory.
The borough is also home to a number of small businesses, including a bakery, a hardware store, and a grocery store. The borough is also home to a number of professional services, including doctors, lawyers, and accountants.
Demographics
According to the 2010 census, the population of Burnside Borough was 1,845. The population is largely white (94.3%), with a small percentage of African Americans (2.2%) and Hispanics (2.2%). The median household income in the borough is $37,917, and the median age is 43.
The borough is home to a variety of religious denominations, including Catholic (44.3%), Protestant (25.2%), and Other (30.5%). The borough is also home to a variety of educational institutions, including a public elementary school, a public middle school, and a public high school.
Conclusion
Burnside Borough is a small borough located in the northern part of Cambria County, Pennsylvania. The borough was founded in 1876 by a group of settlers from the nearby town of Ebensburg. The economy of the borough is largely based on the service industry, and the population is largely white. The borough is home to a variety of natural features, businesses, and educational institutions.
Common Questions
What is the Total Population of Burnside borough?
Total Population of Burnside borough is 163.
What is the Total Male Population of Burnside borough?
Total Male Population of Burnside borough is 84.
What is the Total Female Population of Burnside borough?
Total Female Population of Burnside borough is 79.
What is the Ratio of Males per 100 Females in Burnside borough?
There are 106.33 Males per 100 Females in Burnside borough.
What is the Ratio of Females per 100 Males in Burnside borough?
There are 94.05 Females per 100 Males in Burnside borough.
What is the Median Population Age in Burnside borough?
Median Population Age in Burnside borough is 50.6 Years.
What is the Average Family Size in Burnside borough
Average Family Size in Burnside borough is 2.7 People.
What is the Average Household Size in Burnside borough
Average Household Size in Burnside borough is 2.2 People.
What is Per Capita Income in Burnside borough?
Per Capita income in Burnside borough is $25,380.
What is the Median Family Income in Burnside borough?
Median Family Income in Burnside borough is $48,500.
What is the Median Household income in Burnside borough?
Median Household Income in Burnside borough is $47,500.
What is Inequality or Gini Index in Burnside borough?
Inequality or Gini Index in Burnside borough is 0.39.
How Large is the Labor Force in Burnside borough?
There are 88 People in the Labor Forcein in Burnside borough.
What is the Percentage of People in the Labor Force in Burnside borough?
60.7% of People are in the Labor Force in Burnside borough.
What is the Unemployment Rate in Burnside borough?
Unemployment Rate in Burnside borough is 27.3%.