Wilmerding borough, PA
Wilmerding borough Overview
1,834
TOTAL POPULATION
808
MALE POPULATION
1,026
FEMALE POPULATION
78.75
MALES / 100 FEMALES
126.98
FEMALES / 100 MALES
35.1
MEDIAN AGE
3.1
AVG FAMILY SIZE
2.1
AVG HOUSEHOLD SIZE
$23,835
PER CAPITA INCOME
$66,719
AVG FAMILY INCOME
$36,161
AVG HOUSEHOLD INCOME
20.2%
WAGE / INCOME GAP [ % ]
79.8¢/ $1
WAGE / INCOME GAP [ $ ]
0.50
INEQUALITY / GINI INDEX
953
LABOR FORCE [ PEOPLE ]
66.3%
PERCENT IN LABOR FORCE
13.2%
UNEMPLOYMENT RATE
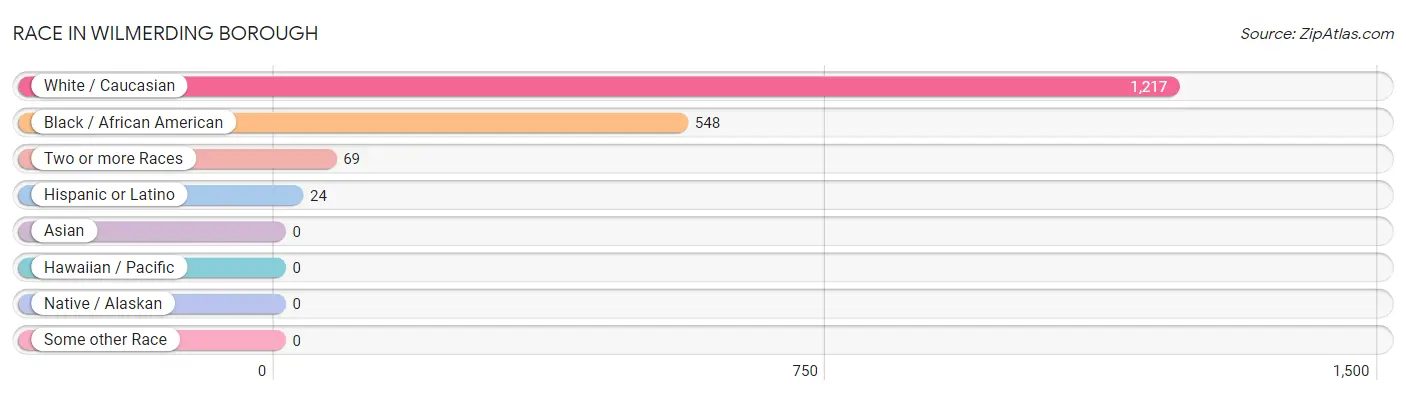
Race in Wilmerding borough
The most populous races in Wilmerding borough are White / Caucasian (1,217 | 66.4%), Black / African American (548 | 29.9%), and Two or more Races (69 | 3.8%).
| Race | # Population | % Population |
| Asian | 0 | 0.0% |
| Black / African American | 548 | 29.9% |
| Hawaiian / Pacific | 0 | 0.0% |
| Hispanic or Latino | 24 | 1.3% |
| Native / Alaskan | 0 | 0.0% |
| White / Caucasian | 1,217 | 66.4% |
| Two or more Races | 69 | 3.8% |
| Some other Race | 0 | 0.0% |
| Total | 1,834 | 100.0% |
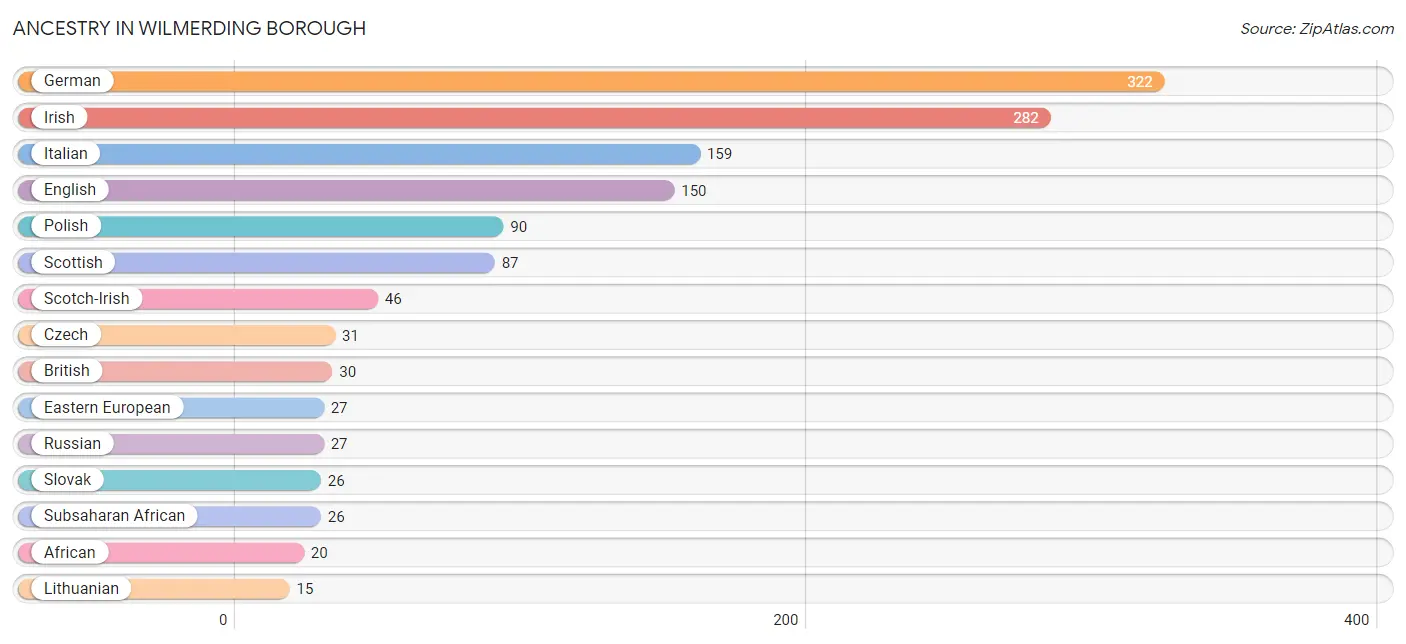
Ancestry in Wilmerding borough
The most populous ancestries reported in Wilmerding borough are German (322 | 17.6%), Irish (282 | 15.4%), Italian (159 | 8.7%), English (150 | 8.2%), and Polish (90 | 4.9%), together accounting for 54.7% of all Wilmerding borough residents.
| Ancestry | # Population | % Population |
| African | 20 | 1.1% |
| British | 30 | 1.6% |
| Cherokee | 6 | 0.3% |
| Croatian | 6 | 0.3% |
| Czech | 31 | 1.7% |
| Dutch | 5 | 0.3% |
| Eastern European | 27 | 1.5% |
| English | 150 | 8.2% |
| French | 9 | 0.5% |
| German | 322 | 17.6% |
| Hungarian | 7 | 0.4% |
| Irish | 282 | 15.4% |
| Italian | 159 | 8.7% |
| Lithuanian | 15 | 0.8% |
| Mexican | 5 | 0.3% |
| Nigerian | 6 | 0.3% |
| Polish | 90 | 4.9% |
| Puerto Rican | 8 | 0.4% |
| Romanian | 5 | 0.3% |
| Russian | 27 | 1.5% |
| Scotch-Irish | 46 | 2.5% |
| Scottish | 87 | 4.7% |
| Serbian | 6 | 0.3% |
| Slovak | 26 | 1.4% |
| Spaniard | 11 | 0.6% |
| Subsaharan African | 26 | 1.4% |
| Swiss | 6 | 0.3% |
| Ukrainian | 6 | 0.3% |
| Welsh | 5 | 0.3% | View All 29 Rows |
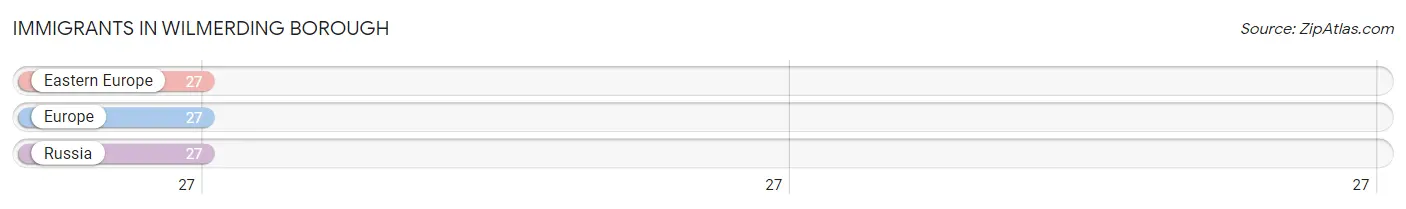
Immigrants in Wilmerding borough
The most numerous immigrant groups reported in Wilmerding borough came from Eastern Europe (27 | 1.5%), Europe (27 | 1.5%), and Russia (27 | 1.5%), together accounting for 4.4% of all Wilmerding borough residents.
| Immigration Origin | # Population | % Population |
| Eastern Europe | 27 | 1.5% |
| Europe | 27 | 1.5% |
| Russia | 27 | 1.5% | View All 3 Rows |
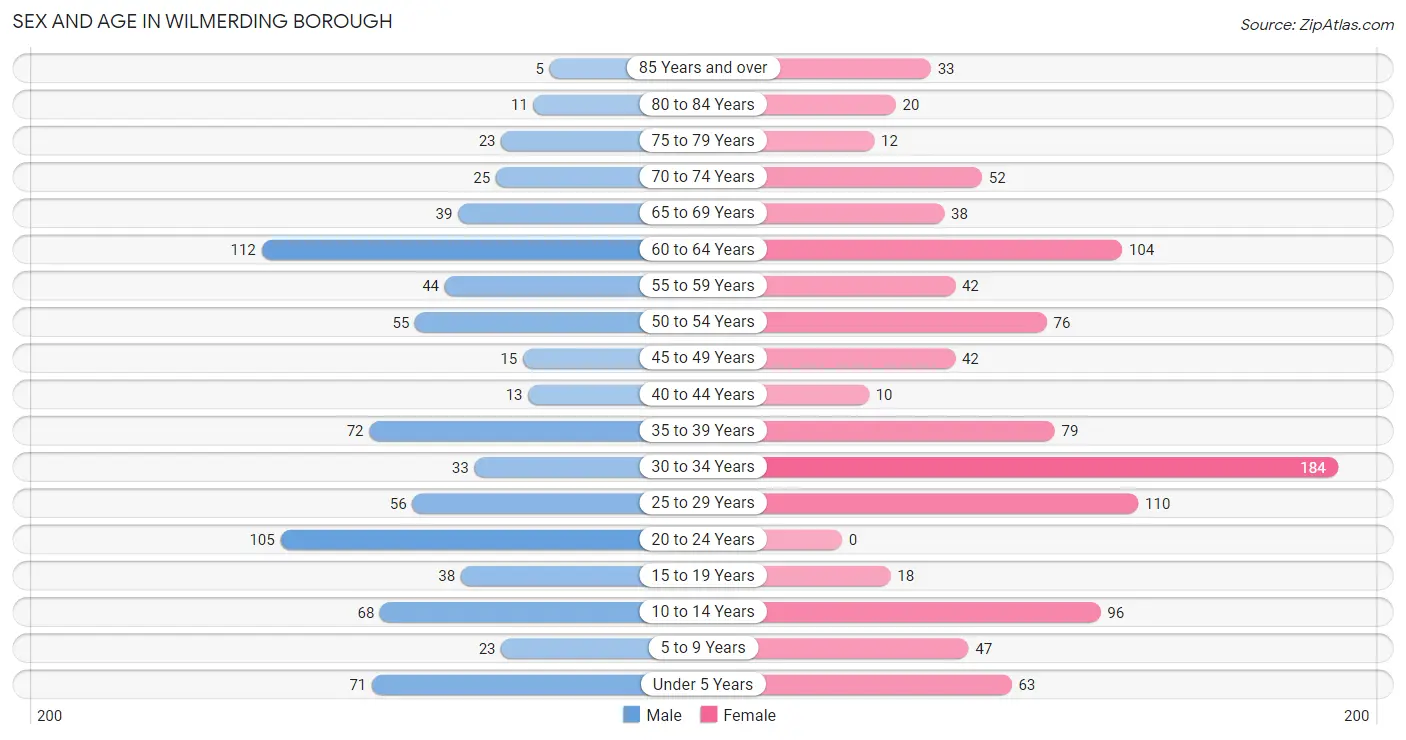
Sex and Age in Wilmerding borough
Sex and Age in Wilmerding borough
The most populous age groups in Wilmerding borough are 60 to 64 Years (112 | 13.9%) for men and 30 to 34 Years (184 | 17.9%) for women.
| Age Bracket | Male | Female |
| Under 5 Years | 71 (8.8%) | 63 (6.1%) |
| 5 to 9 Years | 23 (2.9%) | 47 (4.6%) |
| 10 to 14 Years | 68 (8.4%) | 96 (9.4%) |
| 15 to 19 Years | 38 (4.7%) | 18 (1.8%) |
| 20 to 24 Years | 105 (13.0%) | 0 (0.0%) |
| 25 to 29 Years | 56 (6.9%) | 110 (10.7%) |
| 30 to 34 Years | 33 (4.1%) | 184 (17.9%) |
| 35 to 39 Years | 72 (8.9%) | 79 (7.7%) |
| 40 to 44 Years | 13 (1.6%) | 10 (1.0%) |
| 45 to 49 Years | 15 (1.9%) | 42 (4.1%) |
| 50 to 54 Years | 55 (6.8%) | 76 (7.4%) |
| 55 to 59 Years | 44 (5.4%) | 42 (4.1%) |
| 60 to 64 Years | 112 (13.9%) | 104 (10.1%) |
| 65 to 69 Years | 39 (4.8%) | 38 (3.7%) |
| 70 to 74 Years | 25 (3.1%) | 52 (5.1%) |
| 75 to 79 Years | 23 (2.9%) | 12 (1.2%) |
| 80 to 84 Years | 11 (1.4%) | 20 (1.9%) |
| 85 Years and over | 5 (0.6%) | 33 (3.2%) |
| Total | 808 (100.0%) | 1,026 (100.0%) |
Families and Households in Wilmerding borough
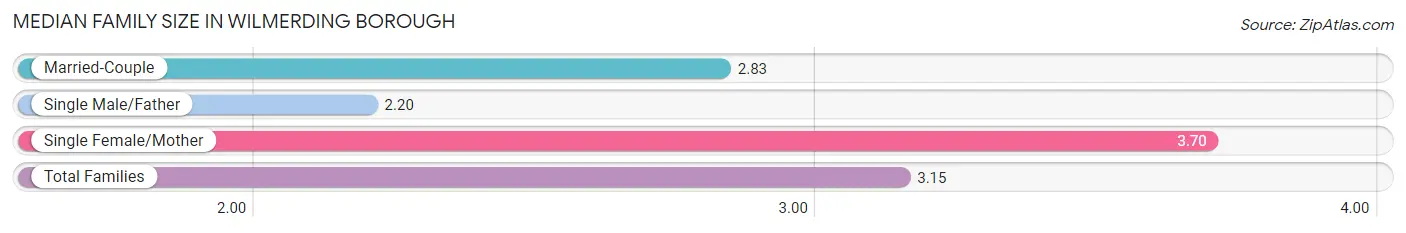
Median Family Size in Wilmerding borough
The median family size in Wilmerding borough is 3.15 persons per family, with single female/mother families (145 | 38.3%) accounting for the largest median family size of 3.7 persons per family. On the other hand, single male/father families (10 | 2.6%) represent the smallest median family size with 2.20 persons per family.
| Family Type | # Families | Family Size |
| Married-Couple | 224 (59.1%) | 2.83 |
| Single Male/Father | 10 (2.6%) | 2.20 |
| Single Female/Mother | 145 (38.3%) | 3.70 |
| Total Families | 379 (100.0%) | 3.15 |
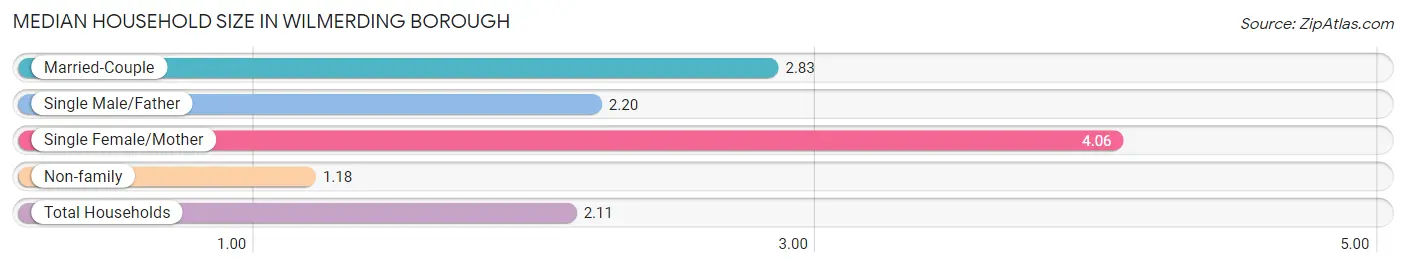
Median Household Size in Wilmerding borough
The median household size in Wilmerding borough is 2.11 persons per household, with single female/mother households (145 | 16.9%) accounting for the largest median household size of 4.06 persons per household. non-family households (477 | 55.7%) represent the smallest median household size with 1.18 persons per household.
| Household Type | # Households | Household Size |
| Married-Couple | 224 (26.2%) | 2.83 |
| Single Male/Father | 10 (1.2%) | 2.20 |
| Single Female/Mother | 145 (16.9%) | 4.06 |
| Non-family | 477 (55.7%) | 1.18 |
| Total Households | 856 (100.0%) | 2.11 |
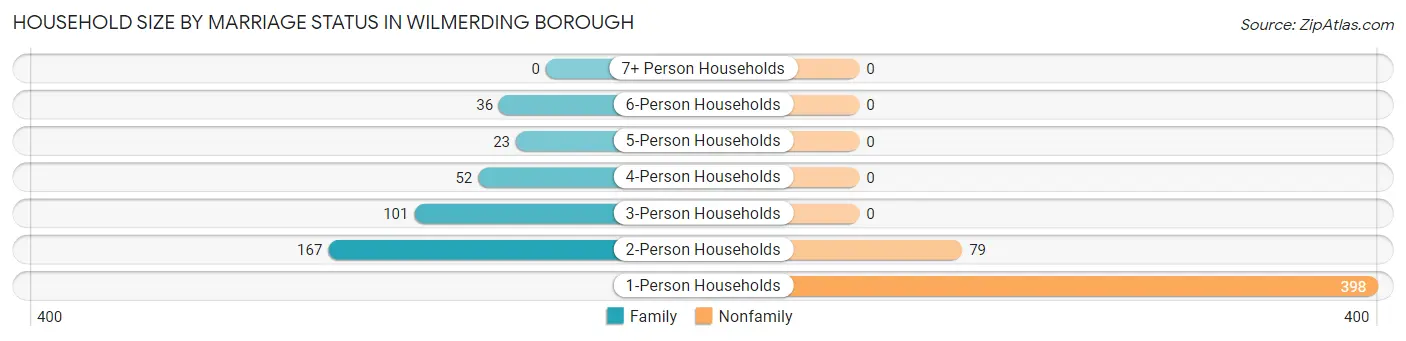
Household Size by Marriage Status in Wilmerding borough
Out of a total of 856 households in Wilmerding borough, 379 (44.3%) are family households, while 477 (55.7%) are nonfamily households. The most numerous type of family households are 2-person households, comprising 167, and the most common type of nonfamily households are 1-person households, comprising 398.
| Household Size | Family Households | Nonfamily Households |
| 1-Person Households | - | 398 (46.5%) |
| 2-Person Households | 167 (19.5%) | 79 (9.2%) |
| 3-Person Households | 101 (11.8%) | 0 (0.0%) |
| 4-Person Households | 52 (6.1%) | 0 (0.0%) |
| 5-Person Households | 23 (2.7%) | 0 (0.0%) |
| 6-Person Households | 36 (4.2%) | 0 (0.0%) |
| 7+ Person Households | 0 (0.0%) | 0 (0.0%) |
| Total | 379 (44.3%) | 477 (55.7%) |
Female Fertility in Wilmerding borough
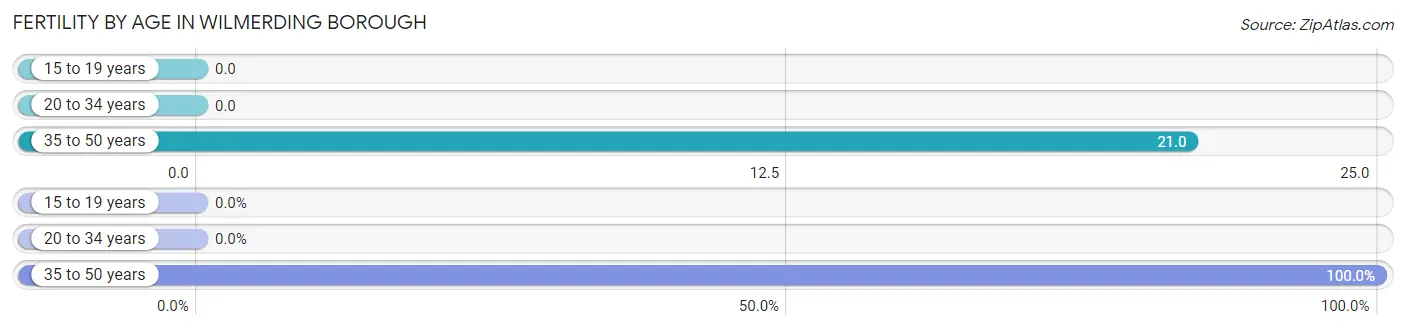
Fertility by Age in Wilmerding borough
Average fertility rate in Wilmerding borough is 7.0 births per 1,000 women. Women in the age bracket of 35 to 50 years have the highest fertility rate with 21.0 births per 1,000 women. Women in the age bracket of 35 to 50 years acount for 100.0% of all women with births.
| Age Bracket | Women with Births | Births / 1,000 Women |
| 15 to 19 years | 0 (0.0%) | 0.0 |
| 20 to 34 years | 0 (0.0%) | 0.0 |
| 35 to 50 years | 3 (100.0%) | 21.0 |
| Total | 3 (100.0%) | 7.0 |
Fertility by Age by Marriage Status in Wilmerding borough
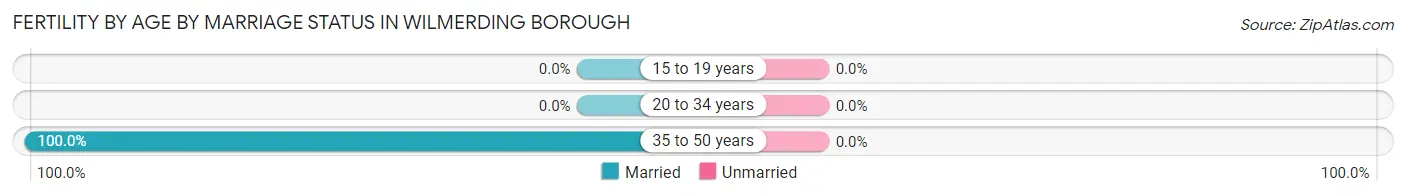
| Age Bracket | Married | Unmarried |
| 15 to 19 years | 0 (0.0%) | 0 (0.0%) |
| 20 to 34 years | 0 (0.0%) | 0 (0.0%) |
| 35 to 50 years | 3 (100.0%) | 0 (0.0%) |
| Total | 3 (100.0%) | 0 (0.0%) |
Fertility by Education in Wilmerding borough
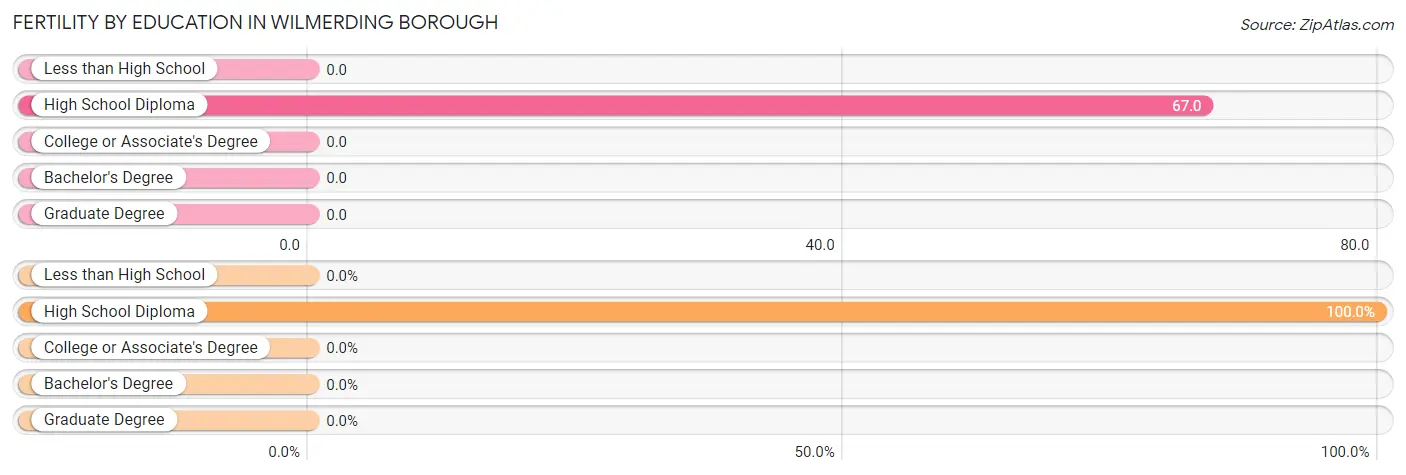
| Educational Attainment | Women with Births | Births / 1,000 Women |
| Less than High School | 0 (0.0%) | 0.0 |
| High School Diploma | 3 (100.0%) | 67.0 |
| College or Associate's Degree | 0 (0.0%) | 0.0 |
| Bachelor's Degree | 0 (0.0%) | 0.0 |
| Graduate Degree | 0 (0.0%) | 0.0 |
| Total | 3 (100.0%) | 7.0 |
Fertility by Education by Marriage Status in Wilmerding borough
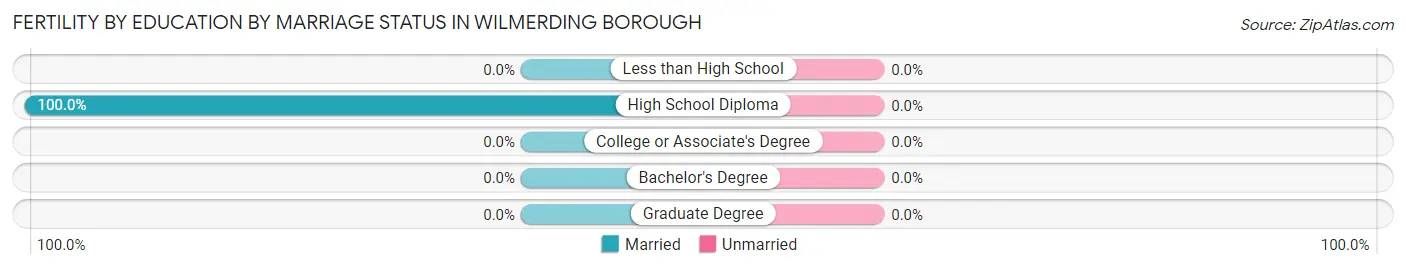
| Educational Attainment | Married | Unmarried |
| Less than High School | 0 (0.0%) | 0 (0.0%) |
| High School Diploma | 3 (100.0%) | 0 (0.0%) |
| College or Associate's Degree | 0 (0.0%) | 0 (0.0%) |
| Bachelor's Degree | 0 (0.0%) | 0 (0.0%) |
| Graduate Degree | 0 (0.0%) | 0 (0.0%) |
| Total | 3 (100.0%) | 0 (0.0%) |
Income in Wilmerding borough
Income Overview in Wilmerding borough
Per Capita Income in Wilmerding borough is $23,835, while median incomes of families and households are $66,719 and $36,161 respectively.
| Characteristic | Number | Measure |
| Per Capita Income | 1,834 | $23,835 |
| Median Family Income | 379 | $66,719 |
| Mean Family Income | 379 | $74,520 |
| Median Household Income | 856 | $36,161 |
| Mean Household Income | 856 | $48,108 |
| Income Deficit | 379 | $0 |
| Wage / Income Gap (%) | 1,834 | 20.18% |
| Wage / Income Gap ($) | 1,834 | 79.82¢ per $1 |
| Gini / Inequality Index | 1,834 | 0.50 |
Earnings by Sex in Wilmerding borough
Average Earnings in Wilmerding borough are $25,901, $29,605 for men and $23,631 for women, a difference of 20.2%.
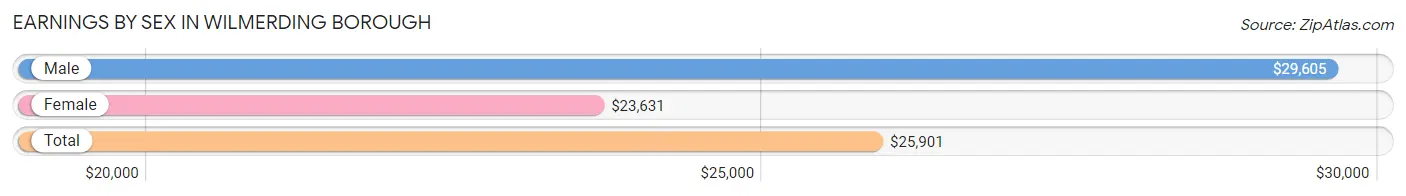
| Sex | Number | Average Earnings |
| Male | 458 (45.2%) | $29,605 |
| Female | 555 (54.8%) | $23,631 |
| Total | 1,013 (100.0%) | $25,901 |
Earnings by Sex by Income Bracket in Wilmerding borough
The most common earnings brackets in Wilmerding borough are $15,000 to $17,499 for men (69 | 15.1%) and $12,500 to $14,999 for women (102 | 18.4%).
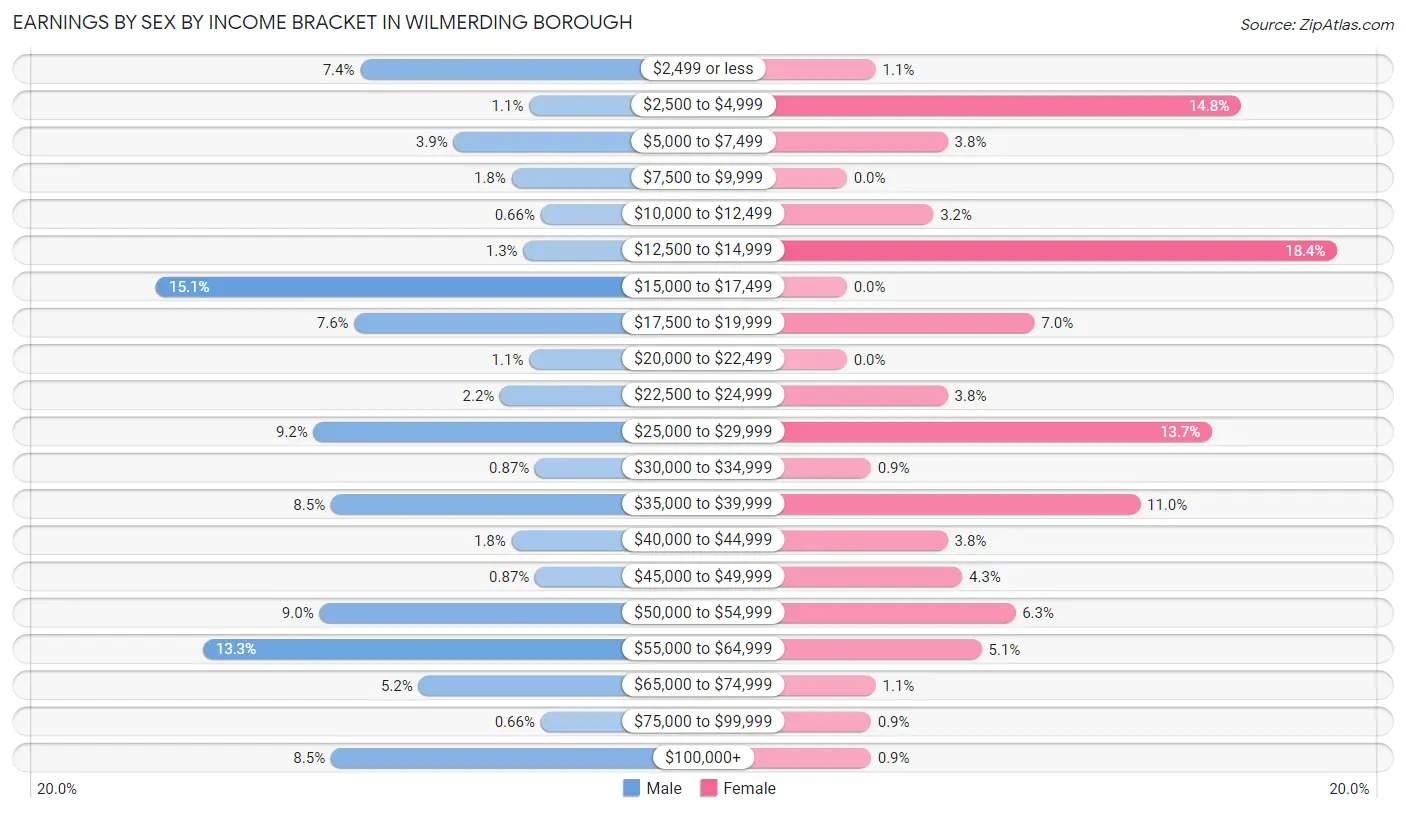
| Income | Male | Female |
| $2,499 or less | 34 (7.4%) | 6 (1.1%) |
| $2,500 to $4,999 | 5 (1.1%) | 82 (14.8%) |
| $5,000 to $7,499 | 18 (3.9%) | 21 (3.8%) |
| $7,500 to $9,999 | 8 (1.8%) | 0 (0.0%) |
| $10,000 to $12,499 | 3 (0.7%) | 18 (3.2%) |
| $12,500 to $14,999 | 6 (1.3%) | 102 (18.4%) |
| $15,000 to $17,499 | 69 (15.1%) | 0 (0.0%) |
| $17,500 to $19,999 | 35 (7.6%) | 39 (7.0%) |
| $20,000 to $22,499 | 5 (1.1%) | 0 (0.0%) |
| $22,500 to $24,999 | 10 (2.2%) | 21 (3.8%) |
| $25,000 to $29,999 | 42 (9.2%) | 76 (13.7%) |
| $30,000 to $34,999 | 4 (0.9%) | 5 (0.9%) |
| $35,000 to $39,999 | 39 (8.5%) | 61 (11.0%) |
| $40,000 to $44,999 | 8 (1.8%) | 21 (3.8%) |
| $45,000 to $49,999 | 4 (0.9%) | 24 (4.3%) |
| $50,000 to $54,999 | 41 (8.9%) | 35 (6.3%) |
| $55,000 to $64,999 | 61 (13.3%) | 28 (5.1%) |
| $65,000 to $74,999 | 24 (5.2%) | 6 (1.1%) |
| $75,000 to $99,999 | 3 (0.7%) | 5 (0.9%) |
| $100,000+ | 39 (8.5%) | 5 (0.9%) |
| Total | 458 (100.0%) | 555 (100.0%) |
Earnings by Sex by Educational Attainment in Wilmerding borough
Average earnings in Wilmerding borough are $35,846 for men and $23,631 for women, a difference of 34.1%. Men with an educational attainment of bachelor's degree enjoy the highest average annual earnings of $73,229, while those with college or associate's degree education earn the least with $56,339. Women with an educational attainment of bachelor's degree earn the most with the average annual earnings of $44,107, while those with college or associate's degree education have the smallest earnings of $25,382.
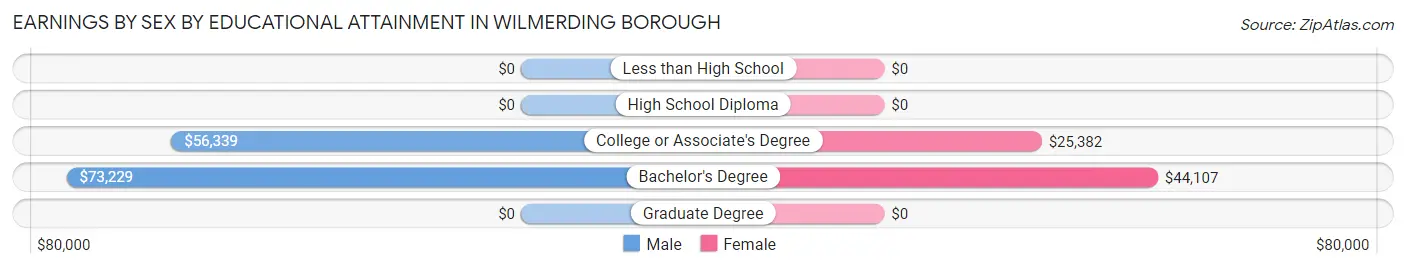
| Educational Attainment | Male Income | Female Income |
| Less than High School | - | - |
| High School Diploma | - | - |
| College or Associate's Degree | $56,339 | $25,382 |
| Bachelor's Degree | $73,229 | $44,107 |
| Graduate Degree | - | - |
| Total | $35,846 | $23,631 |
Family Income in Wilmerding borough
Family Income Brackets in Wilmerding borough
According to the Wilmerding borough family income data, there are 75 families falling into the $35,000 to $49,999 income range, which is the most common income bracket and makes up 19.8% of all families.
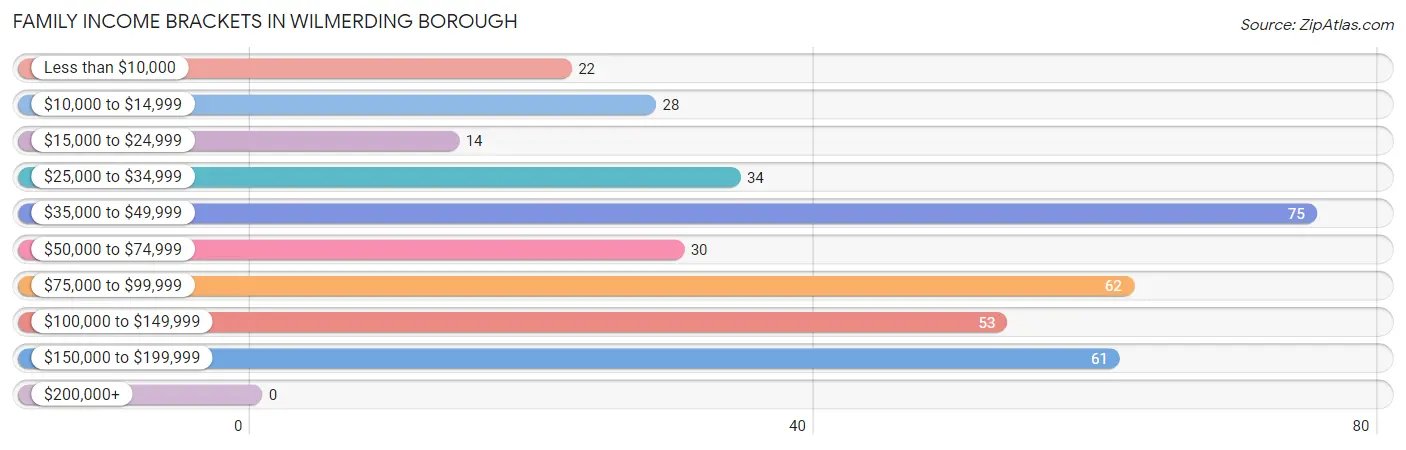
| Income Bracket | # Families | % Families |
| Less than $10,000 | 22 | 5.8% |
| $10,000 to $14,999 | 28 | 7.4% |
| $15,000 to $24,999 | 14 | 3.7% |
| $25,000 to $34,999 | 34 | 9.0% |
| $35,000 to $49,999 | 75 | 19.8% |
| $50,000 to $74,999 | 30 | 7.9% |
| $75,000 to $99,999 | 62 | 16.4% |
| $100,000 to $149,999 | 53 | 14.0% |
| $150,000 to $199,999 | 61 | 16.1% |
| $200,000+ | 0 | 0.0% |
Family Income by Famaliy Size in Wilmerding borough
3-person families (73 | 19.3%) account for the highest median family income in Wilmerding borough with $113,973 per family, while 3-person families (73 | 19.3%) have the highest median income of $37,991 per family member.
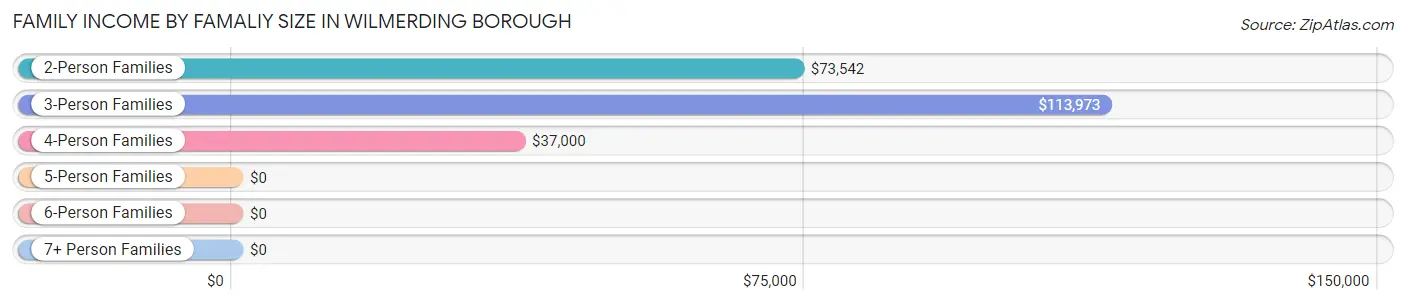
| Income Bracket | # Families | Median Income |
| 2-Person Families | 195 (51.4%) | $73,542 |
| 3-Person Families | 73 (19.3%) | $113,973 |
| 4-Person Families | 70 (18.5%) | $37,000 |
| 5-Person Families | 11 (2.9%) | $0 |
| 6-Person Families | 30 (7.9%) | $0 |
| 7+ Person Families | 0 (0.0%) | $0 |
| Total | 379 (100.0%) | $66,719 |
Family Income by Number of Earners in Wilmerding borough
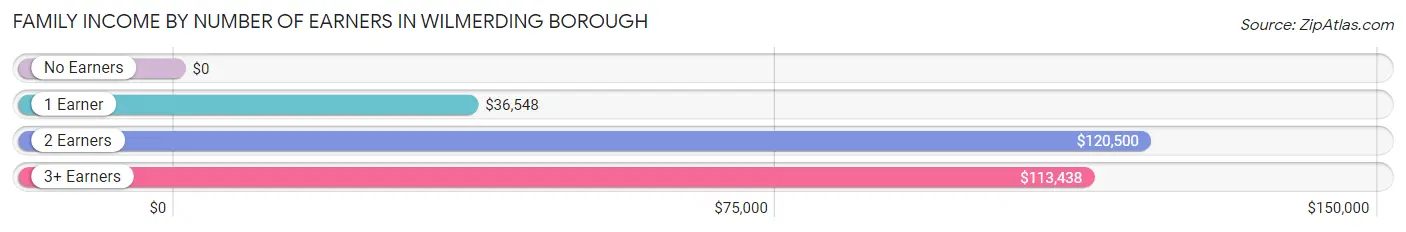
| Number of Earners | # Families | Median Income |
| No Earners | 68 (17.9%) | $0 |
| 1 Earner | 146 (38.5%) | $36,548 |
| 2 Earners | 80 (21.1%) | $120,500 |
| 3+ Earners | 85 (22.4%) | $113,438 |
| Total | 379 (100.0%) | $66,719 |
Household Income in Wilmerding borough
Household Income Brackets in Wilmerding borough
With 150 households falling in the category, the less than $10,000 income range is the most frequent in Wilmerding borough, accounting for 17.5% of all households.
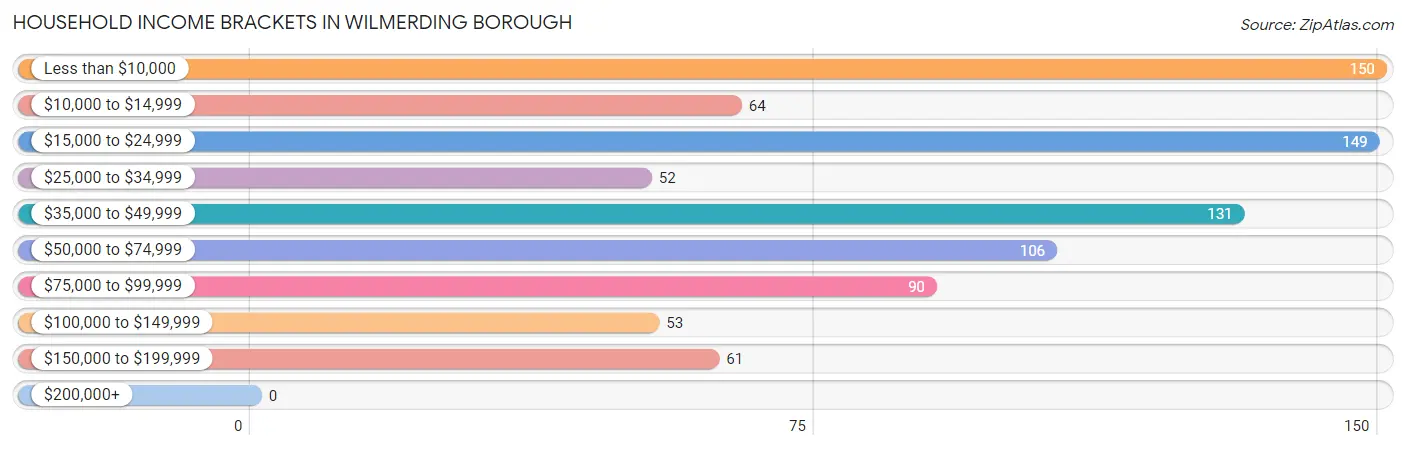
| Income Bracket | # Households | % Households |
| Less than $10,000 | 150 | 17.5% |
| $10,000 to $14,999 | 64 | 7.5% |
| $15,000 to $24,999 | 149 | 17.4% |
| $25,000 to $34,999 | 52 | 6.1% |
| $35,000 to $49,999 | 131 | 15.3% |
| $50,000 to $74,999 | 106 | 12.4% |
| $75,000 to $99,999 | 90 | 10.5% |
| $100,000 to $149,999 | 53 | 6.2% |
| $150,000 to $199,999 | 61 | 7.1% |
| $200,000+ | 0 | 0.0% |
Household Income by Householder Age in Wilmerding borough
The median household income in Wilmerding borough is $36,161, with the highest median household income of $66,250 found in the 45 to 64 years age bracket for the primary householder. A total of 299 households (34.9%) fall into this category. Meanwhile, the 15 to 24 years age bracket for the primary householder has the lowest median household income of $0, with 6 households (0.7%) in this group.
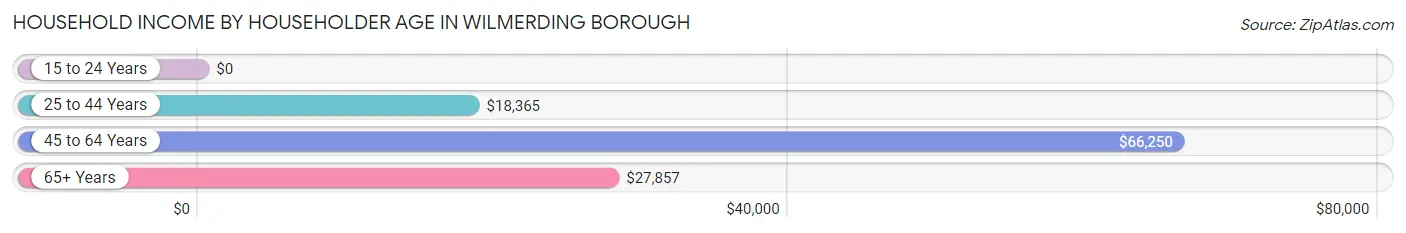
| Income Bracket | # Households | Median Income |
| 15 to 24 Years | 6 (0.7%) | $0 |
| 25 to 44 Years | 363 (42.4%) | $18,365 |
| 45 to 64 Years | 299 (34.9%) | $66,250 |
| 65+ Years | 188 (22.0%) | $27,857 |
| Total | 856 (100.0%) | $36,161 |
Poverty in Wilmerding borough
Income Below Poverty by Sex and Age in Wilmerding borough
With 28.7% poverty level for males and 27.3% for females among the residents of Wilmerding borough, 5 year old males and 15 year old females are the most vulnerable to poverty, with 3 males (100.0%) and 6 females (100.0%) in their respective age groups living below the poverty level.
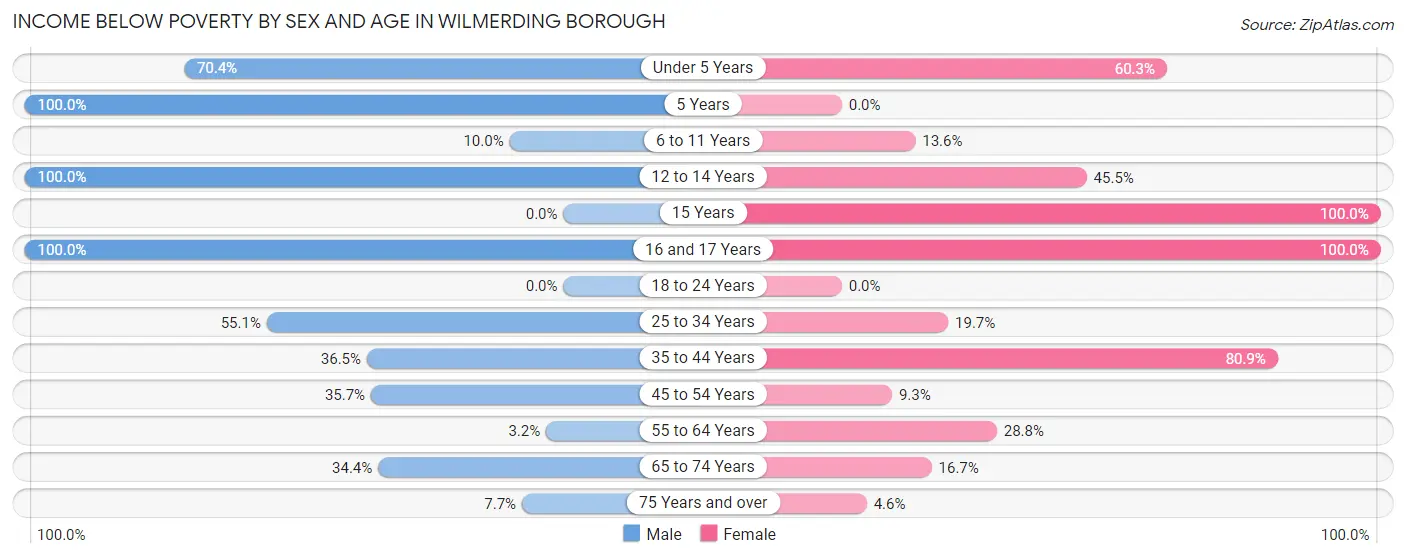
| Age Bracket | Male | Female |
| Under 5 Years | 50 (70.4%) | 38 (60.3%) |
| 5 Years | 3 (100.0%) | 0 (0.0%) |
| 6 to 11 Years | 6 (10.0%) | 18 (13.6%) |
| 12 to 14 Years | 28 (100.0%) | 5 (45.5%) |
| 15 Years | 0 (0.0%) | 6 (100.0%) |
| 16 and 17 Years | 10 (100.0%) | 12 (100.0%) |
| 18 to 24 Years | 0 (0.0%) | 0 (0.0%) |
| 25 to 34 Years | 49 (55.1%) | 58 (19.7%) |
| 35 to 44 Years | 31 (36.5%) | 72 (80.9%) |
| 45 to 54 Years | 25 (35.7%) | 11 (9.3%) |
| 55 to 64 Years | 5 (3.2%) | 42 (28.8%) |
| 65 to 74 Years | 22 (34.4%) | 15 (16.7%) |
| 75 Years and over | 3 (7.7%) | 3 (4.6%) |
| Total | 232 (28.7%) | 280 (27.3%) |
Income Above Poverty by Sex and Age in Wilmerding borough
According to the poverty statistics in Wilmerding borough, males aged 15 years and females aged 75 years and over are the age groups that are most secure financially, with 100.0% of males and 95.4% of females in these age groups living above the poverty line.
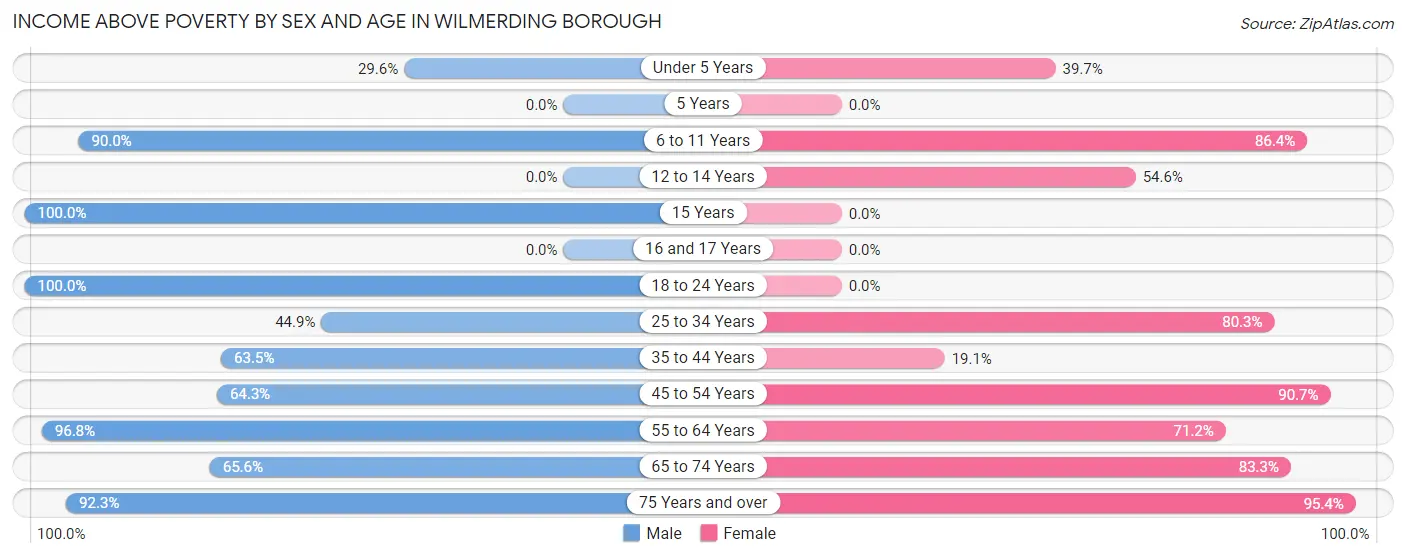
| Age Bracket | Male | Female |
| Under 5 Years | 21 (29.6%) | 25 (39.7%) |
| 5 Years | 0 (0.0%) | 0 (0.0%) |
| 6 to 11 Years | 54 (90.0%) | 114 (86.4%) |
| 12 to 14 Years | 0 (0.0%) | 6 (54.5%) |
| 15 Years | 22 (100.0%) | 0 (0.0%) |
| 16 and 17 Years | 0 (0.0%) | 0 (0.0%) |
| 18 to 24 Years | 111 (100.0%) | 0 (0.0%) |
| 25 to 34 Years | 40 (44.9%) | 236 (80.3%) |
| 35 to 44 Years | 54 (63.5%) | 17 (19.1%) |
| 45 to 54 Years | 45 (64.3%) | 107 (90.7%) |
| 55 to 64 Years | 151 (96.8%) | 104 (71.2%) |
| 65 to 74 Years | 42 (65.6%) | 75 (83.3%) |
| 75 Years and over | 36 (92.3%) | 62 (95.4%) |
| Total | 576 (71.3%) | 746 (72.7%) |
Income Below Poverty Among Married-Couple Families in Wilmerding borough
The poverty statistics for married-couple families in Wilmerding borough show that 2.2% or 5 of the total 224 families live below the poverty line. Families with 1 or 2 children have the highest poverty rate of 12.5%, comprising of 5 families. On the other hand, families with no children have the lowest poverty rate of 0.0%, which includes 0 families.
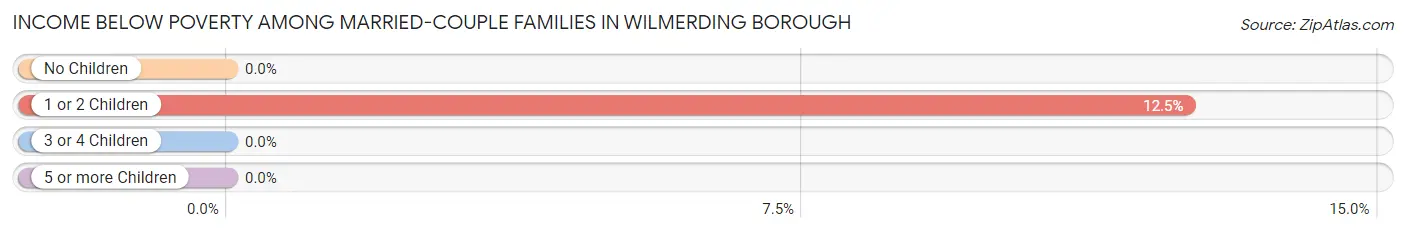
| Children | Above Poverty | Below Poverty |
| No Children | 184 (100.0%) | 0 (0.0%) |
| 1 or 2 Children | 35 (87.5%) | 5 (12.5%) |
| 3 or 4 Children | 0 (0.0%) | 0 (0.0%) |
| 5 or more Children | 0 (0.0%) | 0 (0.0%) |
| Total | 219 (97.8%) | 5 (2.2%) |
Income Below Poverty Among Single-Parent Households in Wilmerding borough
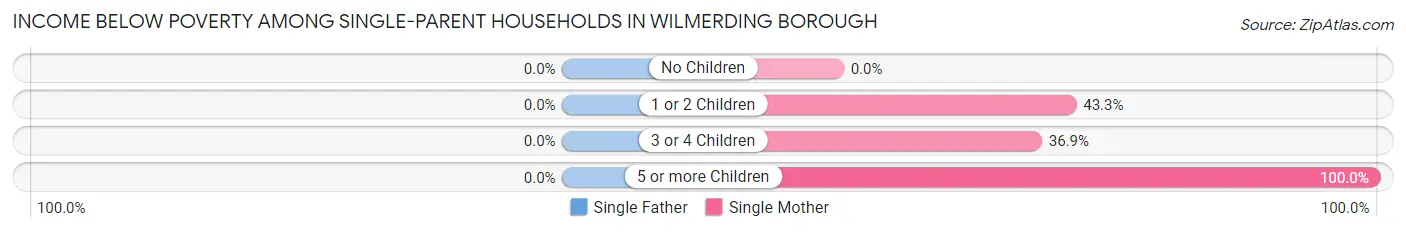
| Children | Single Father | Single Mother |
| No Children | 0 (0.0%) | 0 (0.0%) |
| 1 or 2 Children | 0 (0.0%) | 26 (43.3%) |
| 3 or 4 Children | 0 (0.0%) | 24 (36.9%) |
| 5 or more Children | 0 (0.0%) | 9 (100.0%) |
| Total | 0 (0.0%) | 59 (40.7%) |
Income Below Poverty Among Married-Couple vs Single-Parent Households in Wilmerding borough
The poverty data for Wilmerding borough shows that 5 of the married-couple family households (2.2%) and 59 of the single-parent households (38.1%) are living below the poverty level. Within the married-couple family households, those with 1 or 2 children have the highest poverty rate, with 5 households (12.5%) falling below the poverty line. Among the single-parent households, those with 5 or more children have the highest poverty rate, with 9 household (100.0%) living below poverty.
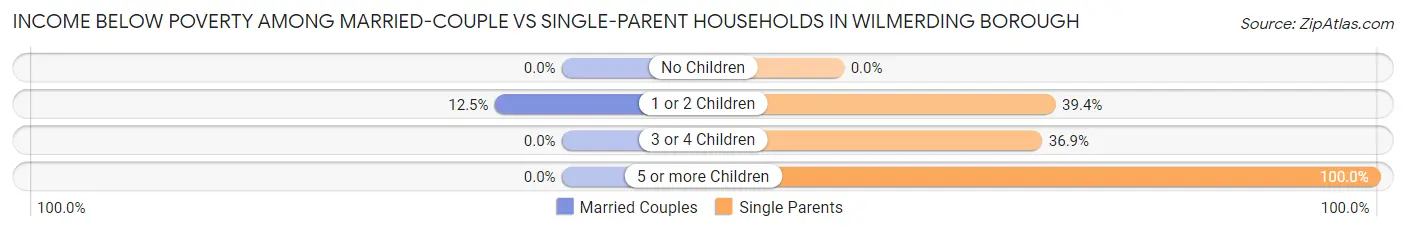
| Children | Married-Couple Families | Single-Parent Households |
| No Children | 0 (0.0%) | 0 (0.0%) |
| 1 or 2 Children | 5 (12.5%) | 26 (39.4%) |
| 3 or 4 Children | 0 (0.0%) | 24 (36.9%) |
| 5 or more Children | 0 (0.0%) | 9 (100.0%) |
| Total | 5 (2.2%) | 59 (38.1%) |
Employment Characteristics in Wilmerding borough
Employment by Class of Employer in Wilmerding borough
Among the 772 employed individuals in Wilmerding borough, private company employees (613 | 79.4%), not-for-profit organizations (95 | 12.3%), and self-employed (incorporated) (27 | 3.5%) make up the most common classes of employment.
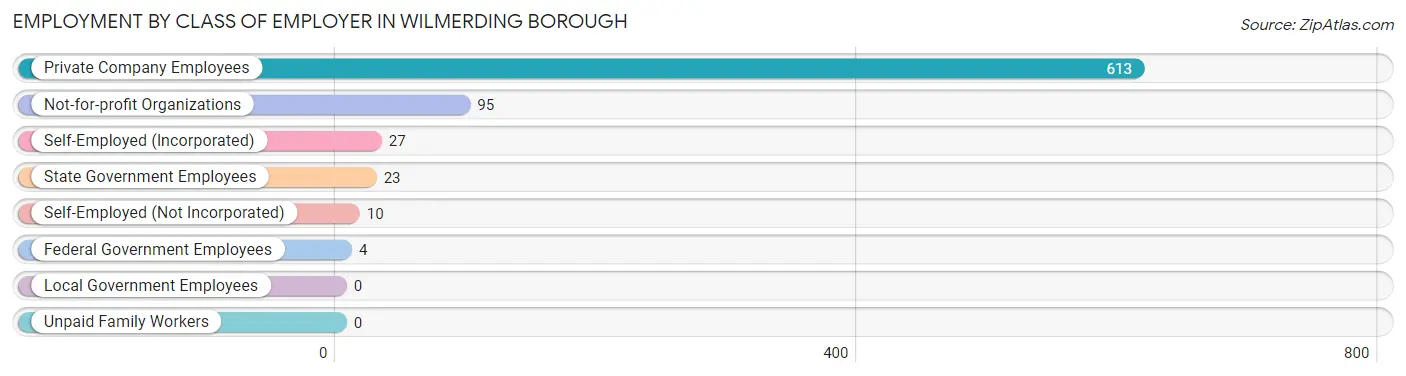
| Employer Class | # Employees | % Employees |
| Private Company Employees | 613 | 79.4% |
| Self-Employed (Incorporated) | 27 | 3.5% |
| Self-Employed (Not Incorporated) | 10 | 1.3% |
| Not-for-profit Organizations | 95 | 12.3% |
| Local Government Employees | 0 | 0.0% |
| State Government Employees | 23 | 3.0% |
| Federal Government Employees | 4 | 0.5% |
| Unpaid Family Workers | 0 | 0.0% |
| Total | 772 | 100.0% |
Employment Status by Age in Wilmerding borough
According to the labor force statistics for Wilmerding borough, out of the total population over 16 years of age (1,438), 66.3% or 953 individuals are in the labor force, with 13.2% or 126 of them unemployed. The age group with the highest labor force participation rate is 20 to 24 years, with 100.0% or 105 individuals in the labor force. Within the labor force, the 16 to 19 years age range has the highest percentage of unemployed individuals, with 100.0% or 6 of them being unemployed.
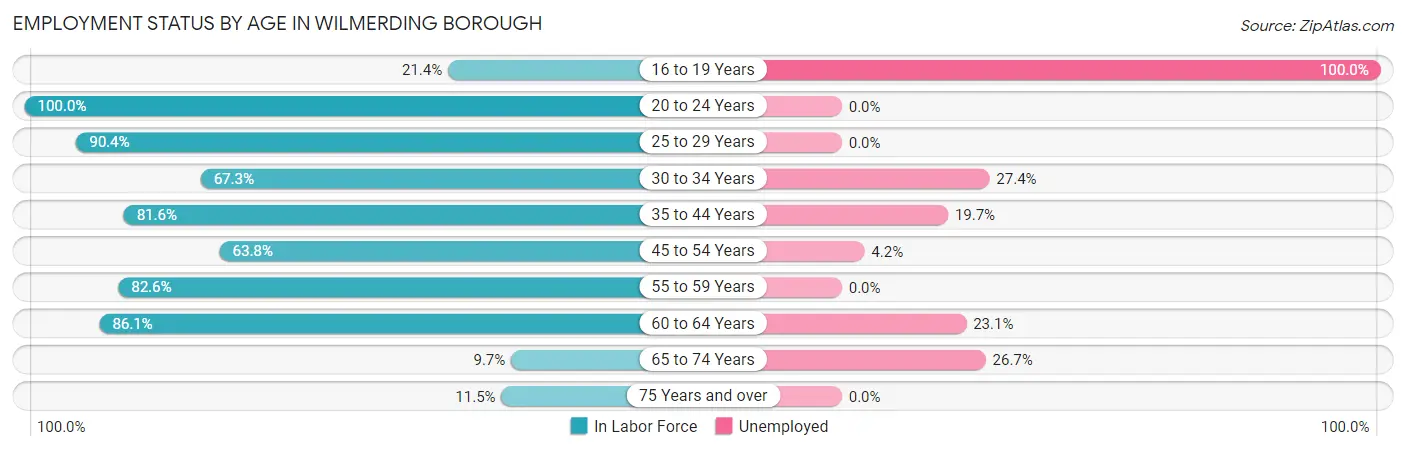
| Age Bracket | In Labor Force | Unemployed |
| 16 to 19 Years | 6 (21.4%) | 6 (100.0%) |
| 20 to 24 Years | 105 (100.0%) | 0 (0.0%) |
| 25 to 29 Years | 150 (90.4%) | 0 (0.0%) |
| 30 to 34 Years | 146 (67.3%) | 40 (27.4%) |
| 35 to 44 Years | 142 (81.6%) | 28 (19.7%) |
| 45 to 54 Years | 120 (63.8%) | 5 (4.2%) |
| 55 to 59 Years | 71 (82.6%) | 0 (0.0%) |
| 60 to 64 Years | 186 (86.1%) | 43 (23.1%) |
| 65 to 74 Years | 15 (9.7%) | 4 (26.7%) |
| 75 Years and over | 12 (11.5%) | 0 (0.0%) |
| Total | 953 (66.3%) | 126 (13.2%) |
Employment Status by Educational Attainment in Wilmerding borough
According to labor force statistics for Wilmerding borough, 77.8% of individuals (815) out of the total population between 25 and 64 years of age (1,047) are in the labor force, with 14.2% or 116 of them being unemployed. The group with the highest labor force participation rate are those with the educational attainment of college / associate degree, with 90.2% or 407 individuals in the labor force. Within the labor force, individuals with high school diploma education have the highest percentage of unemployment, with 18.5% or 43 of them being unemployed.
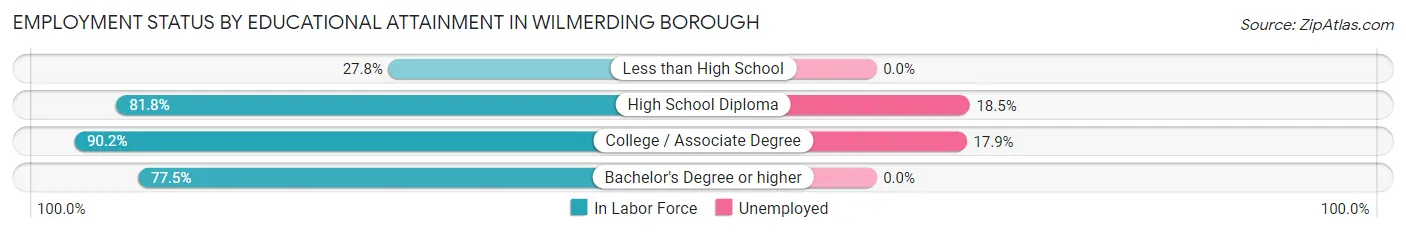
| Educational Attainment | In Labor Force | Unemployed |
| Less than High School | 37 (27.8%) | 0 (0.0%) |
| High School Diploma | 233 (81.8%) | 53 (18.5%) |
| College / Associate Degree | 407 (90.2%) | 81 (17.9%) |
| Bachelor's Degree or higher | 138 (77.5%) | 0 (0.0%) |
| Total | 815 (77.8%) | 149 (14.2%) |
Employment Occupations by Sex in Wilmerding borough
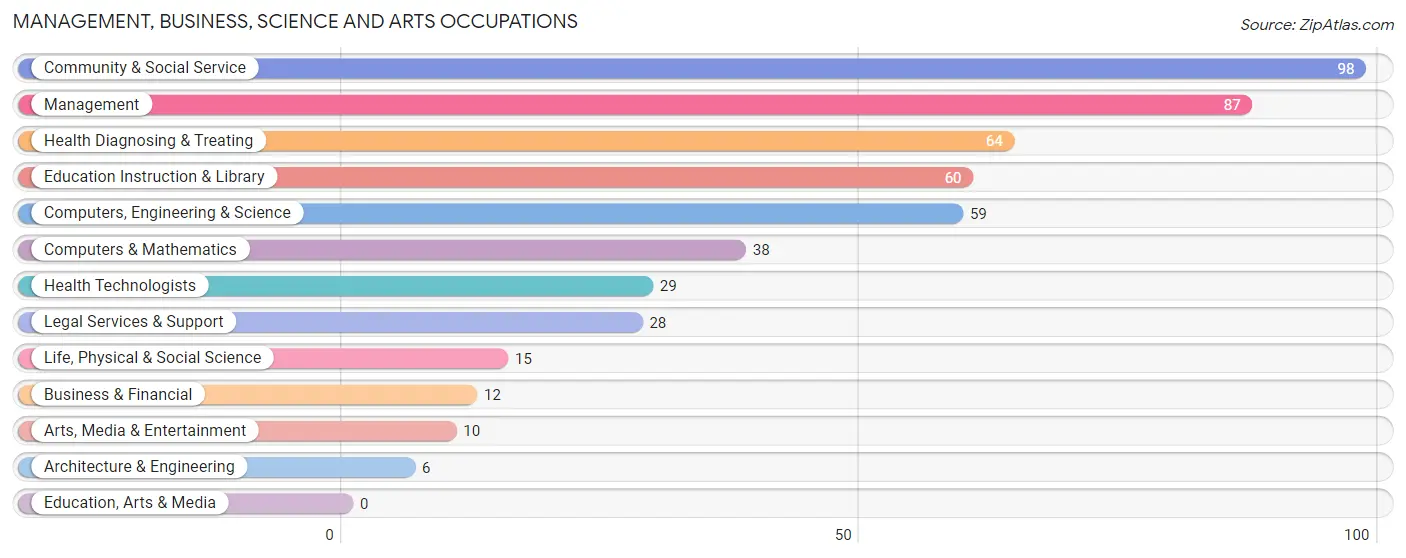
Management, Business, Science and Arts Occupations
The most common Management, Business, Science and Arts occupations in Wilmerding borough are Community & Social Service (98 | 11.8%), Management (87 | 10.5%), Health Diagnosing & Treating (64 | 7.7%), Education Instruction & Library (60 | 7.3%), and Computers, Engineering & Science (59 | 7.1%).
Management, Business, Science and Arts Occupations by Sex
Within the Management, Business, Science and Arts occupations in Wilmerding borough, the most male-oriented occupations are Computers & Mathematics (100.0%), Architecture & Engineering (100.0%), and Arts, Media & Entertainment (100.0%), while the most female-oriented occupations are Business & Financial (100.0%), Life, Physical & Social Science (100.0%), and Legal Services & Support (100.0%).
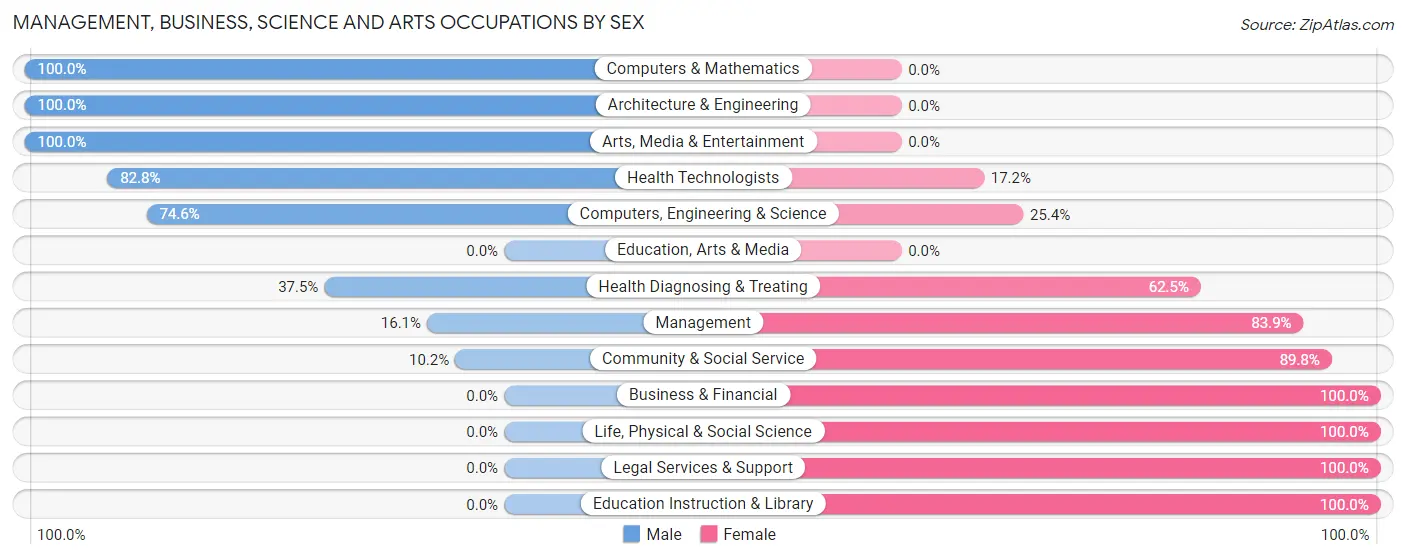
| Occupation | Male | Female |
| Management | 14 (16.1%) | 73 (83.9%) |
| Business & Financial | 0 (0.0%) | 12 (100.0%) |
| Computers, Engineering & Science | 44 (74.6%) | 15 (25.4%) |
| Computers & Mathematics | 38 (100.0%) | 0 (0.0%) |
| Architecture & Engineering | 6 (100.0%) | 0 (0.0%) |
| Life, Physical & Social Science | 0 (0.0%) | 15 (100.0%) |
| Community & Social Service | 10 (10.2%) | 88 (89.8%) |
| Education, Arts & Media | 0 (0.0%) | 0 (0.0%) |
| Legal Services & Support | 0 (0.0%) | 28 (100.0%) |
| Education Instruction & Library | 0 (0.0%) | 60 (100.0%) |
| Arts, Media & Entertainment | 10 (100.0%) | 0 (0.0%) |
| Health Diagnosing & Treating | 24 (37.5%) | 40 (62.5%) |
| Health Technologists | 24 (82.8%) | 5 (17.2%) |
| Total (Category) | 92 (28.7%) | 228 (71.3%) |
| Total (Overall) | 405 (49.0%) | 422 (51.0%) |
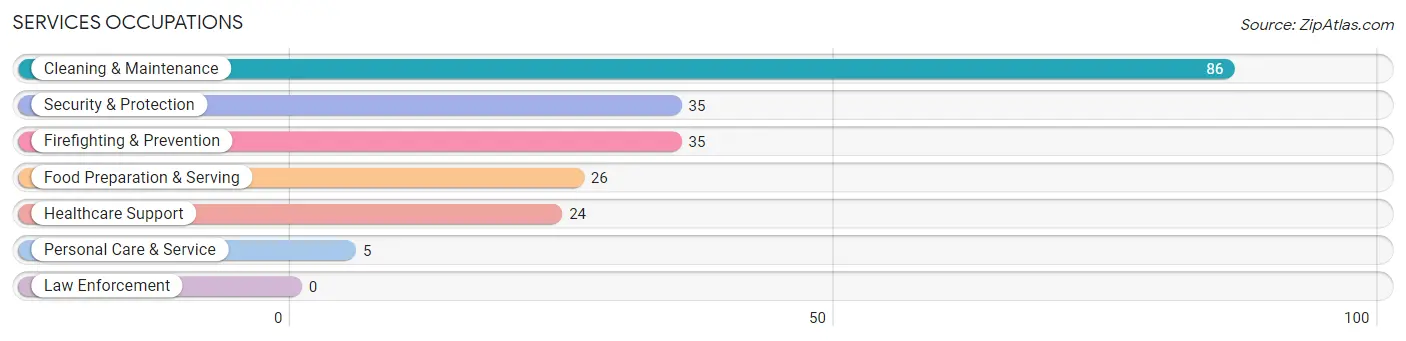
Services Occupations
The most common Services occupations in Wilmerding borough are Cleaning & Maintenance (86 | 10.4%), Security & Protection (35 | 4.2%), Firefighting & Prevention (35 | 4.2%), Food Preparation & Serving (26 | 3.1%), and Healthcare Support (24 | 2.9%).
Services Occupations by Sex
Within the Services occupations in Wilmerding borough, the most male-oriented occupations are Cleaning & Maintenance (94.2%), and Food Preparation & Serving (11.5%), while the most female-oriented occupations are Healthcare Support (100.0%), Security & Protection (100.0%), and Firefighting & Prevention (100.0%).
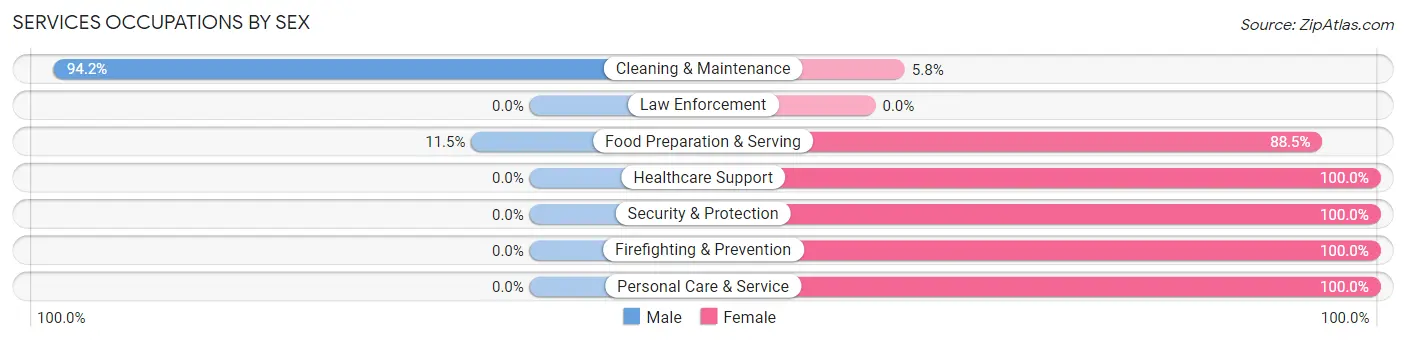
| Occupation | Male | Female |
| Healthcare Support | 0 (0.0%) | 24 (100.0%) |
| Security & Protection | 0 (0.0%) | 35 (100.0%) |
| Firefighting & Prevention | 0 (0.0%) | 35 (100.0%) |
| Law Enforcement | 0 (0.0%) | 0 (0.0%) |
| Food Preparation & Serving | 3 (11.5%) | 23 (88.5%) |
| Cleaning & Maintenance | 81 (94.2%) | 5 (5.8%) |
| Personal Care & Service | 0 (0.0%) | 5 (100.0%) |
| Total (Category) | 84 (47.7%) | 92 (52.3%) |
| Total (Overall) | 405 (49.0%) | 422 (51.0%) |
Sales and Office Occupations
The most common Sales and Office occupations in Wilmerding borough are Sales & Related (104 | 12.6%), and Office & Administration (103 | 12.4%).

Sales and Office Occupations by Sex

| Occupation | Male | Female |
| Sales & Related | 73 (70.2%) | 31 (29.8%) |
| Office & Administration | 37 (35.9%) | 66 (64.1%) |
| Total (Category) | 110 (53.1%) | 97 (46.9%) |
| Total (Overall) | 405 (49.0%) | 422 (51.0%) |
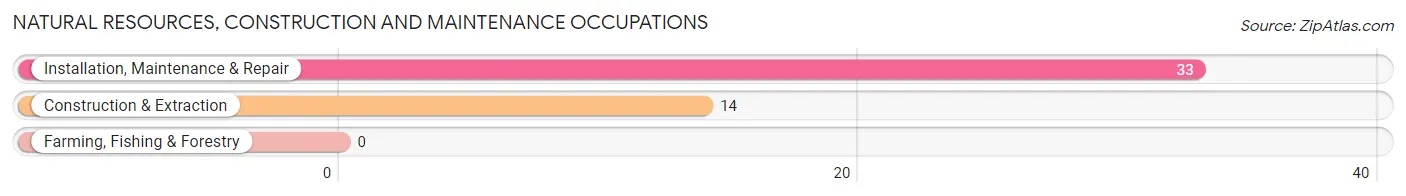
Natural Resources, Construction and Maintenance Occupations
The most common Natural Resources, Construction and Maintenance occupations in Wilmerding borough are Installation, Maintenance & Repair (33 | 4.0%), and Construction & Extraction (14 | 1.7%).
Natural Resources, Construction and Maintenance Occupations by Sex

| Occupation | Male | Female |
| Farming, Fishing & Forestry | 0 (0.0%) | 0 (0.0%) |
| Construction & Extraction | 14 (100.0%) | 0 (0.0%) |
| Installation, Maintenance & Repair | 33 (100.0%) | 0 (0.0%) |
| Total (Category) | 47 (100.0%) | 0 (0.0%) |
| Total (Overall) | 405 (49.0%) | 422 (51.0%) |
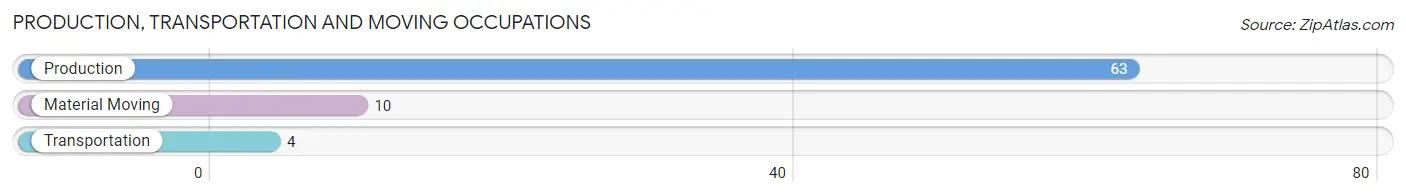
Production, Transportation and Moving Occupations
The most common Production, Transportation and Moving occupations in Wilmerding borough are Production (63 | 7.6%), Material Moving (10 | 1.2%), and Transportation (4 | 0.5%).
Production, Transportation and Moving Occupations by Sex
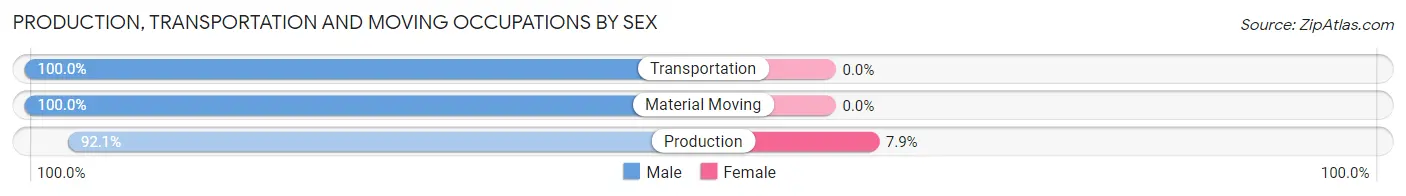
| Occupation | Male | Female |
| Production | 58 (92.1%) | 5 (7.9%) |
| Transportation | 4 (100.0%) | 0 (0.0%) |
| Material Moving | 10 (100.0%) | 0 (0.0%) |
| Total (Category) | 72 (93.5%) | 5 (6.5%) |
| Total (Overall) | 405 (49.0%) | 422 (51.0%) |
Employment Industries by Sex in Wilmerding borough
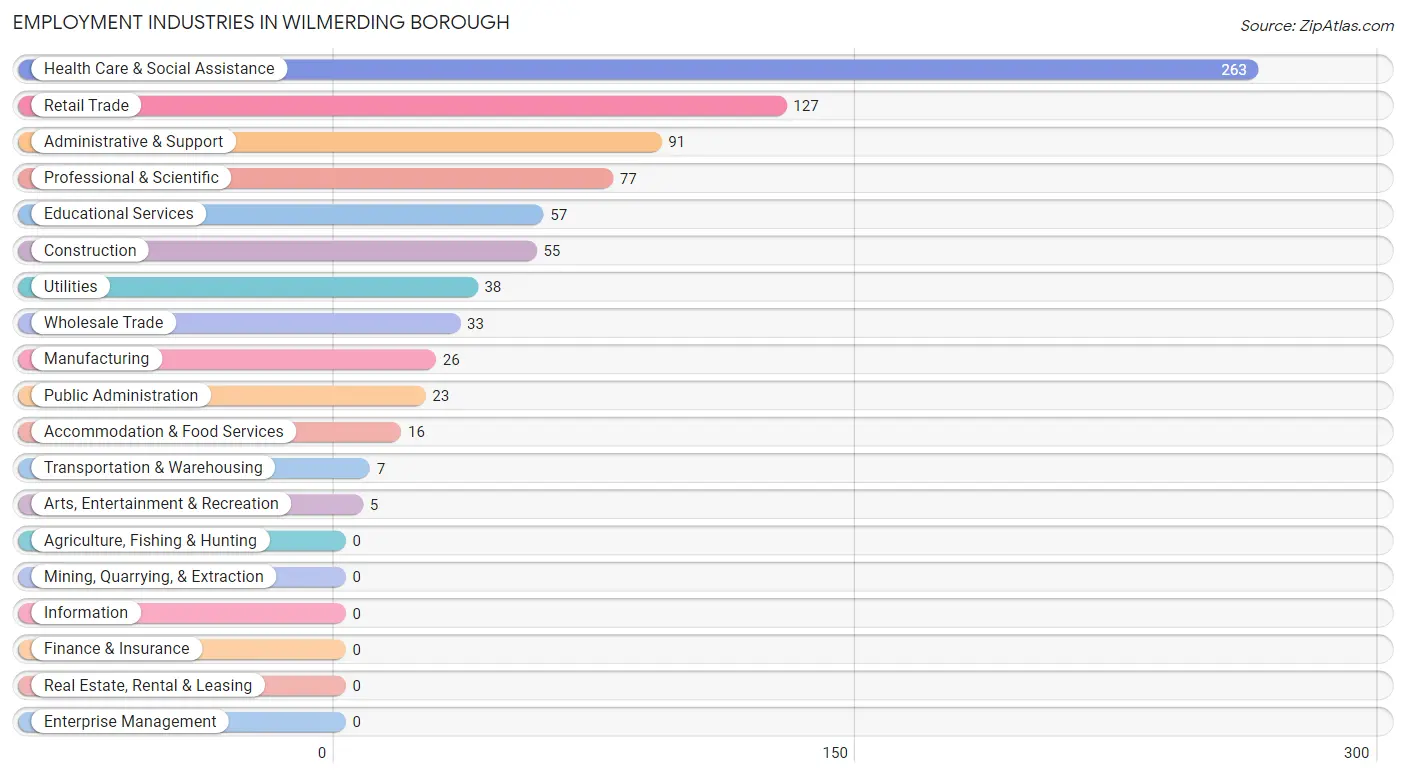
Employment Industries in Wilmerding borough
The major employment industries in Wilmerding borough include Health Care & Social Assistance (263 | 31.8%), Retail Trade (127 | 15.4%), Administrative & Support (91 | 11.0%), Professional & Scientific (77 | 9.3%), and Educational Services (57 | 6.9%).
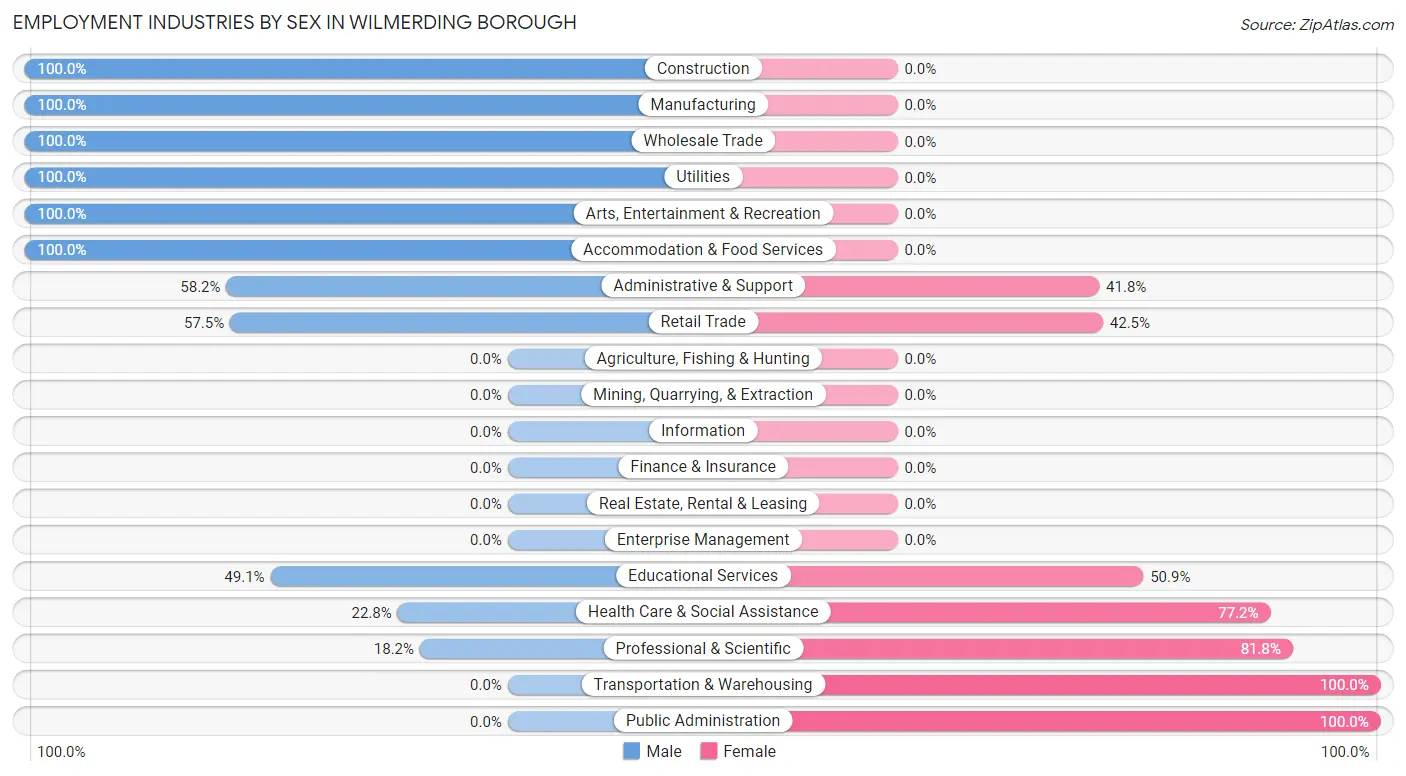
Employment Industries by Sex in Wilmerding borough
The Wilmerding borough industries that see more men than women are Construction (100.0%), Manufacturing (100.0%), and Wholesale Trade (100.0%), whereas the industries that tend to have a higher number of women are Transportation & Warehousing (100.0%), Public Administration (100.0%), and Professional & Scientific (81.8%).
| Industry | Male | Female |
| Agriculture, Fishing & Hunting | 0 (0.0%) | 0 (0.0%) |
| Mining, Quarrying, & Extraction | 0 (0.0%) | 0 (0.0%) |
| Construction | 55 (100.0%) | 0 (0.0%) |
| Manufacturing | 26 (100.0%) | 0 (0.0%) |
| Wholesale Trade | 33 (100.0%) | 0 (0.0%) |
| Retail Trade | 73 (57.5%) | 54 (42.5%) |
| Transportation & Warehousing | 0 (0.0%) | 7 (100.0%) |
| Utilities | 38 (100.0%) | 0 (0.0%) |
| Information | 0 (0.0%) | 0 (0.0%) |
| Finance & Insurance | 0 (0.0%) | 0 (0.0%) |
| Real Estate, Rental & Leasing | 0 (0.0%) | 0 (0.0%) |
| Professional & Scientific | 14 (18.2%) | 63 (81.8%) |
| Enterprise Management | 0 (0.0%) | 0 (0.0%) |
| Administrative & Support | 53 (58.2%) | 38 (41.8%) |
| Educational Services | 28 (49.1%) | 29 (50.9%) |
| Health Care & Social Assistance | 60 (22.8%) | 203 (77.2%) |
| Arts, Entertainment & Recreation | 5 (100.0%) | 0 (0.0%) |
| Accommodation & Food Services | 16 (100.0%) | 0 (0.0%) |
| Public Administration | 0 (0.0%) | 23 (100.0%) |
| Total | 405 (49.0%) | 422 (51.0%) |
Education in Wilmerding borough
School Enrollment in Wilmerding borough
The most common levels of schooling among the 326 students in Wilmerding borough are middle school (155 | 47.5%), nursery / preschool (69 | 21.2%), and elementary school (46 | 14.1%).
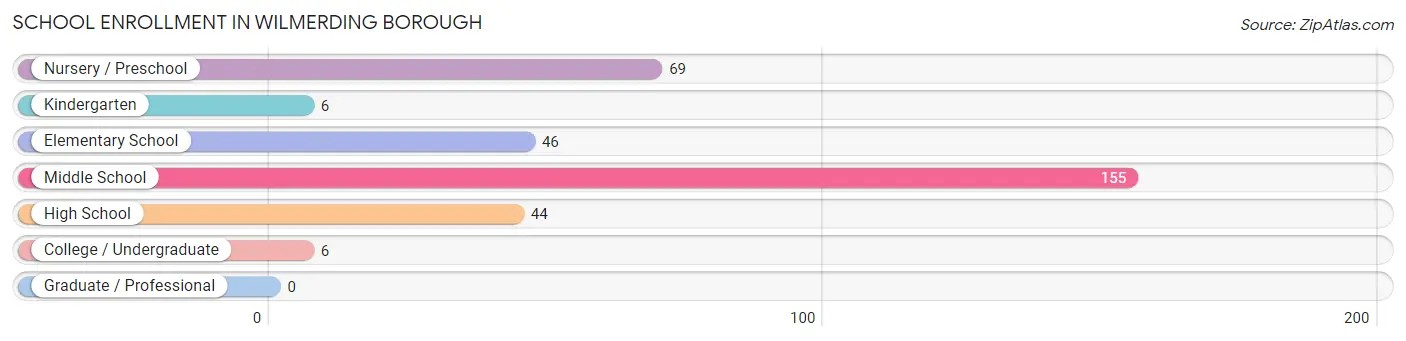
| School Level | # Students | % Students |
| Nursery / Preschool | 69 | 21.2% |
| Kindergarten | 6 | 1.8% |
| Elementary School | 46 | 14.1% |
| Middle School | 155 | 47.5% |
| High School | 44 | 13.5% |
| College / Undergraduate | 6 | 1.8% |
| Graduate / Professional | 0 | 0.0% |
| Total | 326 | 100.0% |
School Enrollment by Age by Funding Source in Wilmerding borough
Out of a total of 326 students who are enrolled in schools in Wilmerding borough, 6 (1.8%) attend a private institution, while the remaining 320 (98.2%) are enrolled in public schools. The age group of 10 to 14 year olds has the highest likelihood of being enrolled in private schools, with 6 (3.9% in the age bracket) enrolled. Conversely, the age group of 3 to 4 year olds has the lowest likelihood of being enrolled in a private school, with 60 (100.0% in the age bracket) attending a public institution.
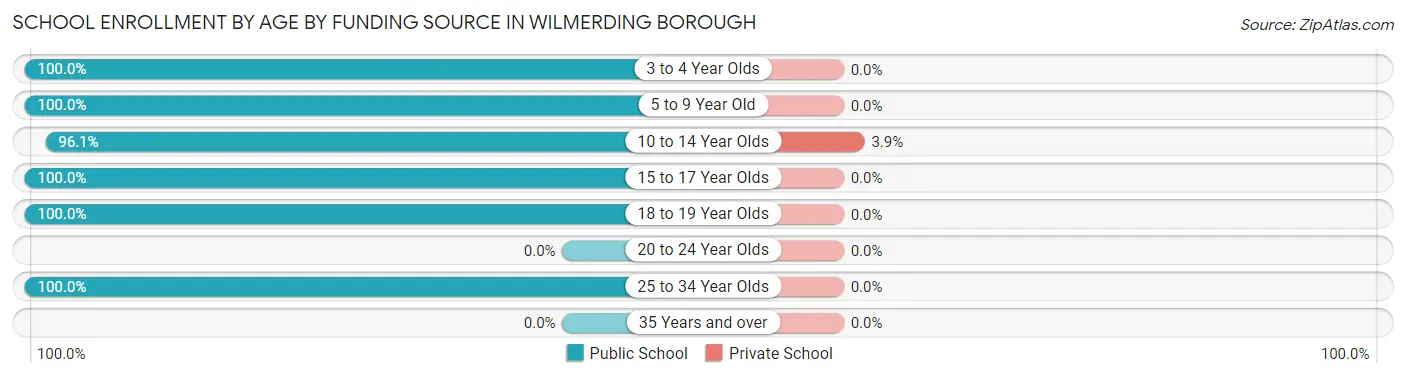
| Age Bracket | Public School | Private School |
| 3 to 4 Year Olds | 60 (100.0%) | 0 (0.0%) |
| 5 to 9 Year Old | 61 (100.0%) | 0 (0.0%) |
| 10 to 14 Year Olds | 149 (96.1%) | 6 (3.9%) |
| 15 to 17 Year Olds | 38 (100.0%) | 0 (0.0%) |
| 18 to 19 Year Olds | 6 (100.0%) | 0 (0.0%) |
| 20 to 24 Year Olds | 0 (0.0%) | 0 (0.0%) |
| 25 to 34 Year Olds | 6 (100.0%) | 0 (0.0%) |
| 35 Years and over | 0 (0.0%) | 0 (0.0%) |
| Total | 320 (98.2%) | 6 (1.8%) |
Educational Attainment by Field of Study in Wilmerding borough
Business (77 | 35.0%), psychology (35 | 15.9%), science & technology (29 | 13.2%), education (28 | 12.7%), and bio, nature & agricultural (15 | 6.8%) are the most common fields of study among 220 individuals in Wilmerding borough who have obtained a bachelor's degree or higher.
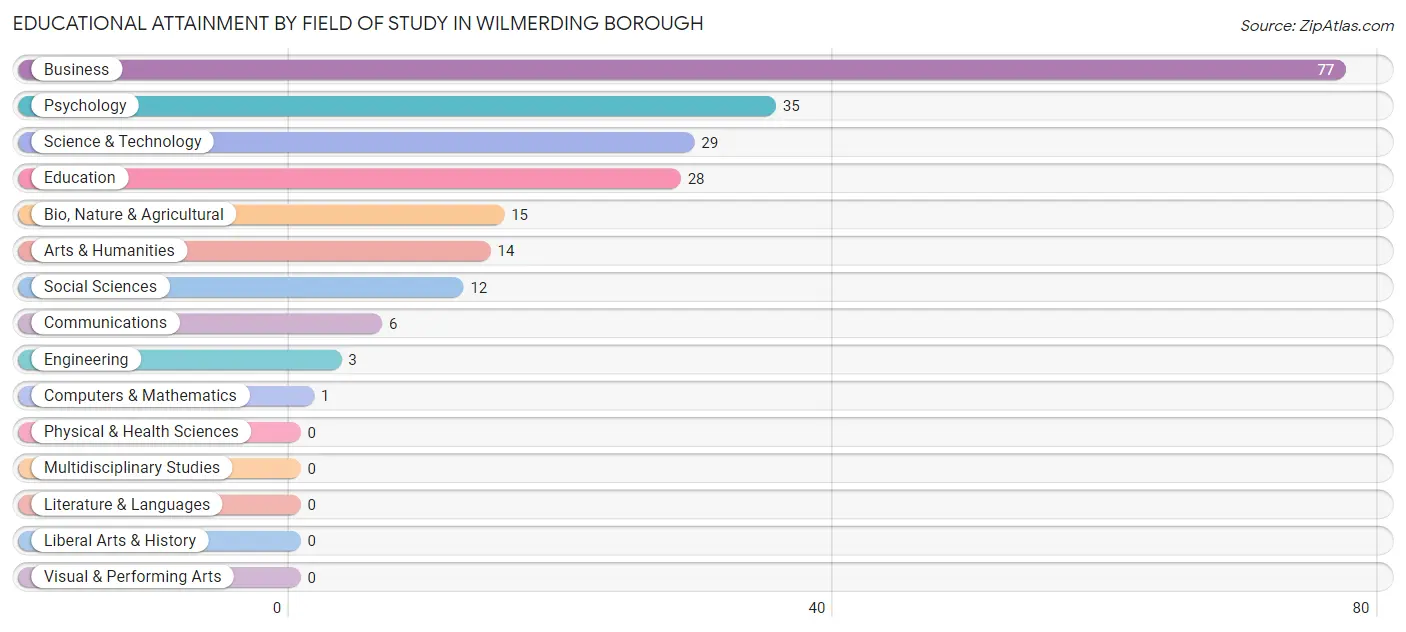
| Field of Study | # Graduates | % Graduates |
| Computers & Mathematics | 1 | 0.4% |
| Bio, Nature & Agricultural | 15 | 6.8% |
| Physical & Health Sciences | 0 | 0.0% |
| Psychology | 35 | 15.9% |
| Social Sciences | 12 | 5.4% |
| Engineering | 3 | 1.4% |
| Multidisciplinary Studies | 0 | 0.0% |
| Science & Technology | 29 | 13.2% |
| Business | 77 | 35.0% |
| Education | 28 | 12.7% |
| Literature & Languages | 0 | 0.0% |
| Liberal Arts & History | 0 | 0.0% |
| Visual & Performing Arts | 0 | 0.0% |
| Communications | 6 | 2.7% |
| Arts & Humanities | 14 | 6.4% |
| Total | 220 | 100.0% |
Transportation & Commute in Wilmerding borough
Vehicle Availability by Sex in Wilmerding borough
The most prevalent vehicle ownership categories in Wilmerding borough are males with 1 vehicle (104, accounting for 26.2%) and females with 1 vehicle (217, making up 28.0%).
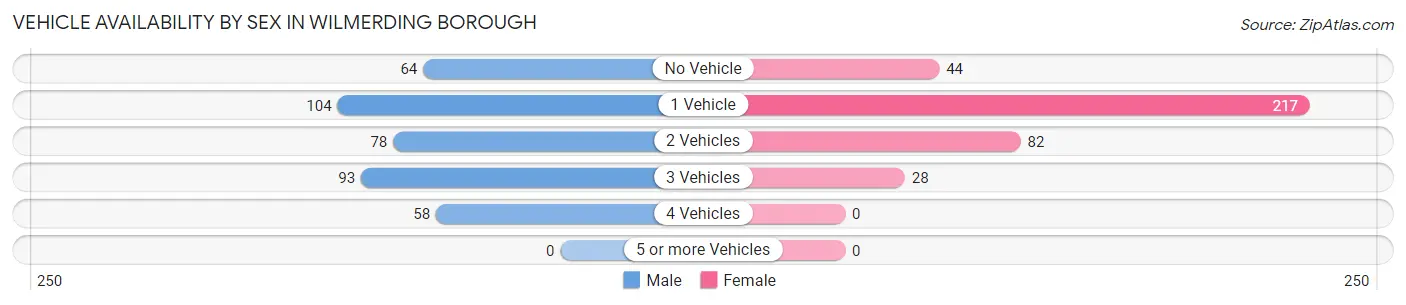
| Vehicles Available | Male | Female |
| No Vehicle | 64 (16.1%) | 44 (11.9%) |
| 1 Vehicle | 104 (26.2%) | 217 (58.5%) |
| 2 Vehicles | 78 (19.7%) | 82 (22.1%) |
| 3 Vehicles | 93 (23.4%) | 28 (7.5%) |
| 4 Vehicles | 58 (14.6%) | 0 (0.0%) |
| 5 or more Vehicles | 0 (0.0%) | 0 (0.0%) |
| Total | 397 (100.0%) | 371 (100.0%) |
Commute Time in Wilmerding borough
The most frequently occuring commute durations in Wilmerding borough are 45 to 59 minutes (159 commuters, 23.0%), 10 to 14 minutes (88 commuters, 12.8%), and 30 to 34 minutes (81 commuters, 11.7%).
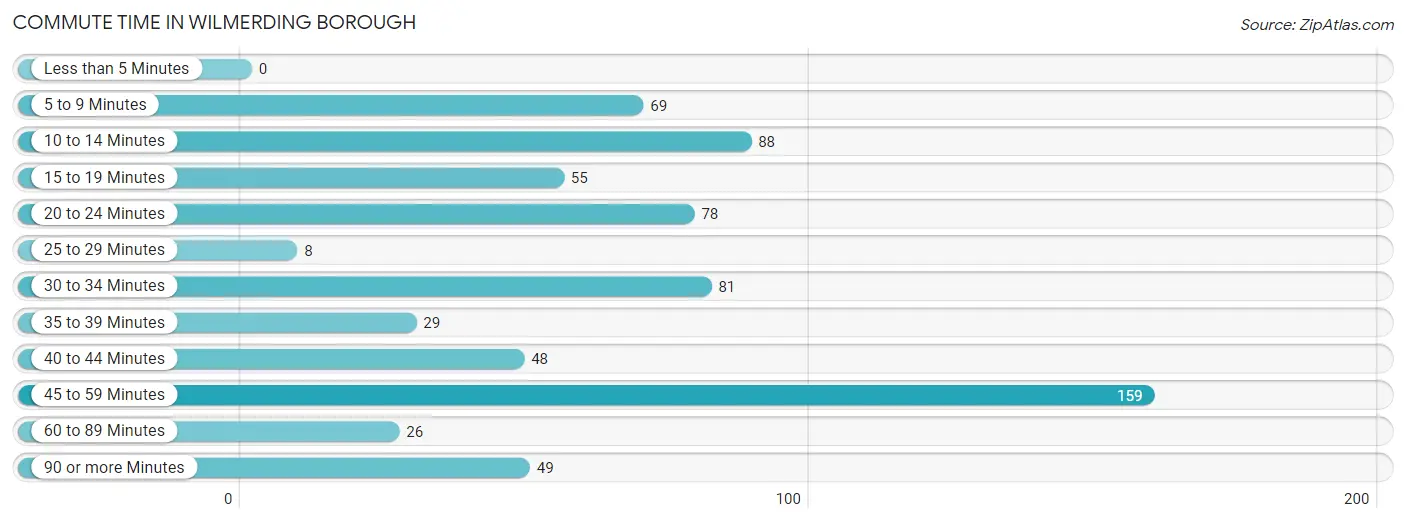
| Commute Time | # Commuters | % Commuters |
| Less than 5 Minutes | 0 | 0.0% |
| 5 to 9 Minutes | 69 | 10.0% |
| 10 to 14 Minutes | 88 | 12.8% |
| 15 to 19 Minutes | 55 | 8.0% |
| 20 to 24 Minutes | 78 | 11.3% |
| 25 to 29 Minutes | 8 | 1.2% |
| 30 to 34 Minutes | 81 | 11.7% |
| 35 to 39 Minutes | 29 | 4.2% |
| 40 to 44 Minutes | 48 | 7.0% |
| 45 to 59 Minutes | 159 | 23.0% |
| 60 to 89 Minutes | 26 | 3.8% |
| 90 or more Minutes | 49 | 7.1% |
Commute Time by Sex in Wilmerding borough
The most common commute times in Wilmerding borough are 10 to 14 minutes (71 commuters, 19.8%) for males and 45 to 59 minutes (129 commuters, 39.0%) for females.
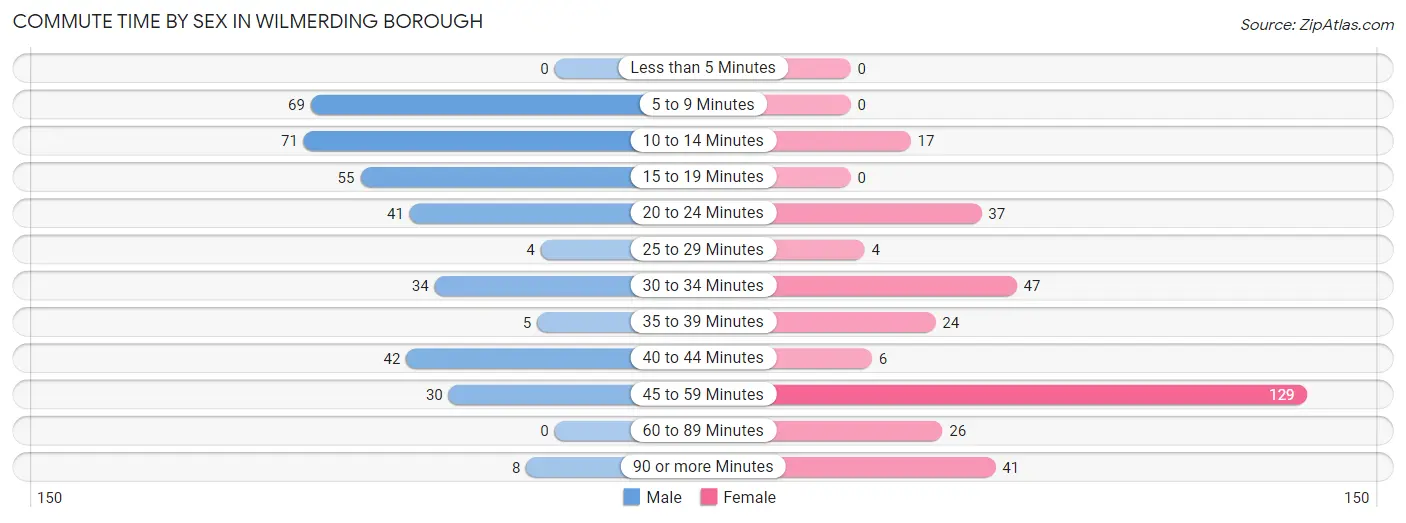
| Commute Time | Male | Female |
| Less than 5 Minutes | 0 (0.0%) | 0 (0.0%) |
| 5 to 9 Minutes | 69 (19.2%) | 0 (0.0%) |
| 10 to 14 Minutes | 71 (19.8%) | 17 (5.1%) |
| 15 to 19 Minutes | 55 (15.3%) | 0 (0.0%) |
| 20 to 24 Minutes | 41 (11.4%) | 37 (11.2%) |
| 25 to 29 Minutes | 4 (1.1%) | 4 (1.2%) |
| 30 to 34 Minutes | 34 (9.5%) | 47 (14.2%) |
| 35 to 39 Minutes | 5 (1.4%) | 24 (7.2%) |
| 40 to 44 Minutes | 42 (11.7%) | 6 (1.8%) |
| 45 to 59 Minutes | 30 (8.4%) | 129 (39.0%) |
| 60 to 89 Minutes | 0 (0.0%) | 26 (7.9%) |
| 90 or more Minutes | 8 (2.2%) | 41 (12.4%) |
Time of Departure to Work by Sex in Wilmerding borough
The most frequent times of departure to work in Wilmerding borough are 12:00 PM to 3:59 PM (93, 25.9%) for males and 6:30 AM to 6:59 AM (80, 24.2%) for females.
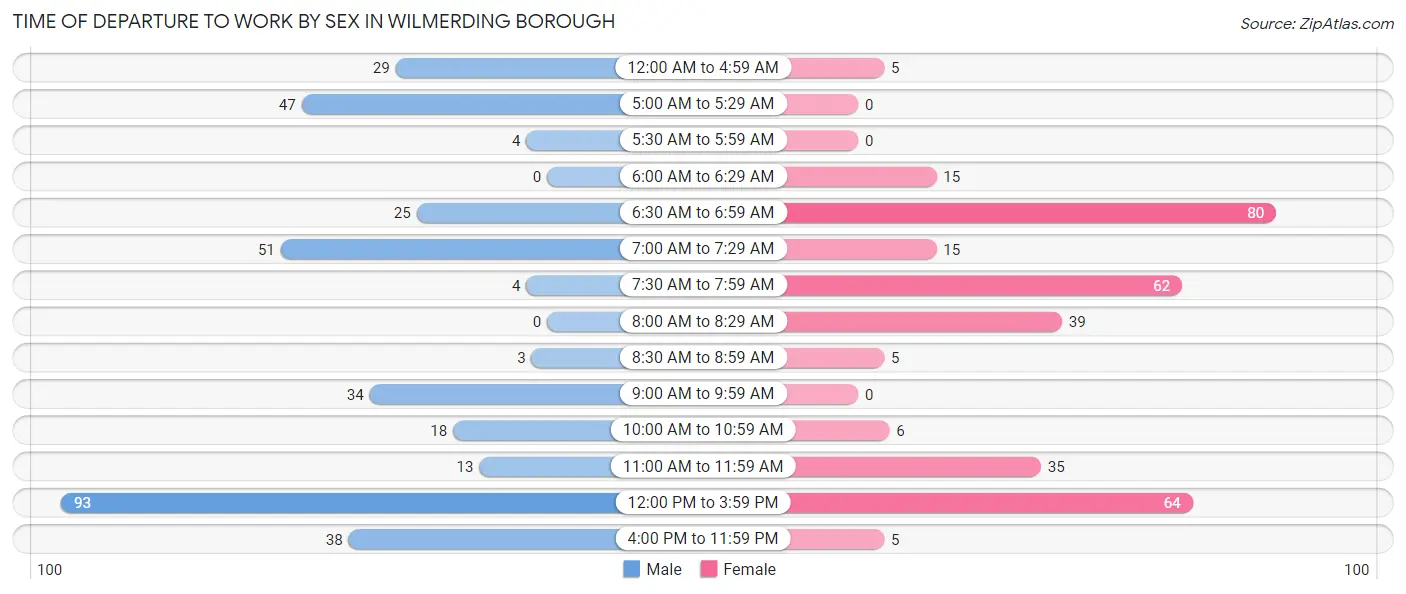
| Time of Departure | Male | Female |
| 12:00 AM to 4:59 AM | 29 (8.1%) | 5 (1.5%) |
| 5:00 AM to 5:29 AM | 47 (13.1%) | 0 (0.0%) |
| 5:30 AM to 5:59 AM | 4 (1.1%) | 0 (0.0%) |
| 6:00 AM to 6:29 AM | 0 (0.0%) | 15 (4.5%) |
| 6:30 AM to 6:59 AM | 25 (7.0%) | 80 (24.2%) |
| 7:00 AM to 7:29 AM | 51 (14.2%) | 15 (4.5%) |
| 7:30 AM to 7:59 AM | 4 (1.1%) | 62 (18.7%) |
| 8:00 AM to 8:29 AM | 0 (0.0%) | 39 (11.8%) |
| 8:30 AM to 8:59 AM | 3 (0.8%) | 5 (1.5%) |
| 9:00 AM to 9:59 AM | 34 (9.5%) | 0 (0.0%) |
| 10:00 AM to 10:59 AM | 18 (5.0%) | 6 (1.8%) |
| 11:00 AM to 11:59 AM | 13 (3.6%) | 35 (10.6%) |
| 12:00 PM to 3:59 PM | 93 (25.9%) | 64 (19.3%) |
| 4:00 PM to 11:59 PM | 38 (10.6%) | 5 (1.5%) |
| Total | 359 (100.0%) | 331 (100.0%) |
Housing Occupancy in Wilmerding borough
Occupancy by Ownership in Wilmerding borough
Of the total 856 dwellings in Wilmerding borough, owner-occupied units account for 340 (39.7%), while renter-occupied units make up 516 (60.3%).
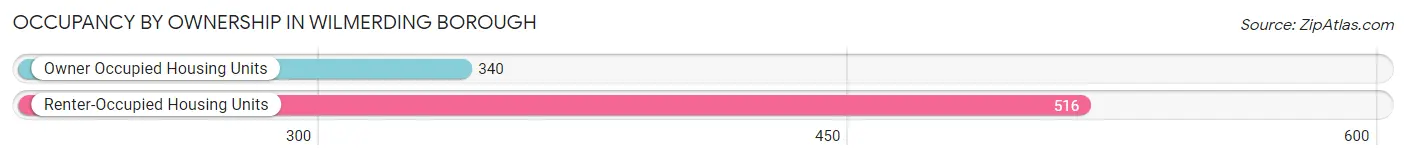
| Occupancy | # Housing Units | % Housing Units |
| Owner Occupied Housing Units | 340 | 39.7% |
| Renter-Occupied Housing Units | 516 | 60.3% |
| Total Occupied Housing Units | 856 | 100.0% |
Occupancy by Household Size in Wilmerding borough
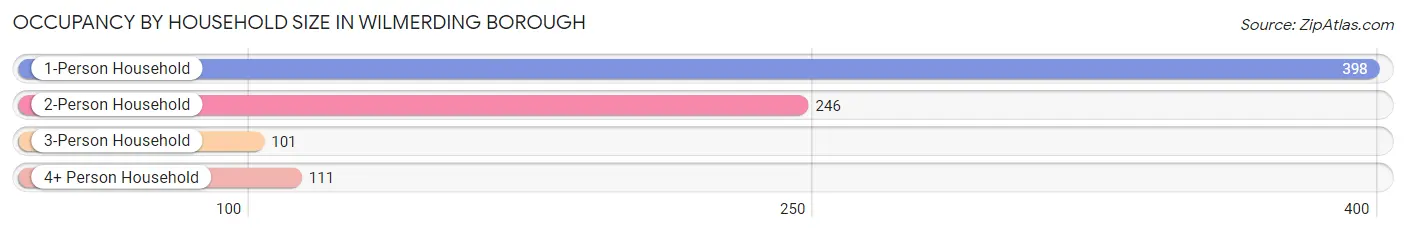
| Household Size | # Housing Units | % Housing Units |
| 1-Person Household | 398 | 46.5% |
| 2-Person Household | 246 | 28.7% |
| 3-Person Household | 101 | 11.8% |
| 4+ Person Household | 111 | 13.0% |
| Total Housing Units | 856 | 100.0% |
Occupancy by Ownership by Household Size in Wilmerding borough
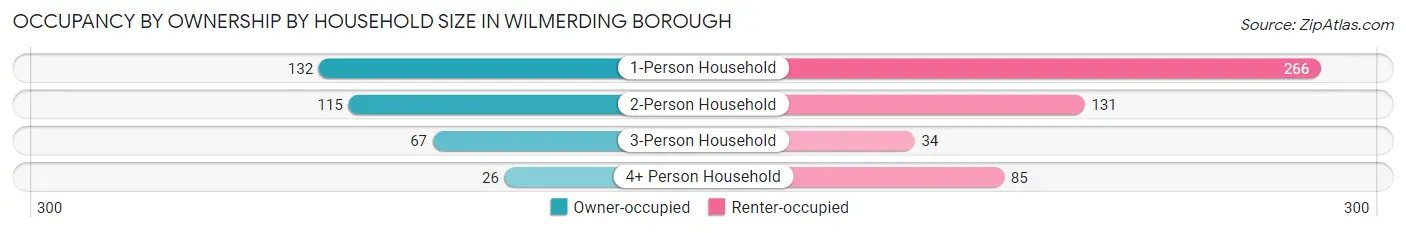
| Household Size | Owner-occupied | Renter-occupied |
| 1-Person Household | 132 (33.2%) | 266 (66.8%) |
| 2-Person Household | 115 (46.8%) | 131 (53.2%) |
| 3-Person Household | 67 (66.3%) | 34 (33.7%) |
| 4+ Person Household | 26 (23.4%) | 85 (76.6%) |
| Total Housing Units | 340 (39.7%) | 516 (60.3%) |
Occupancy by Educational Attainment in Wilmerding borough
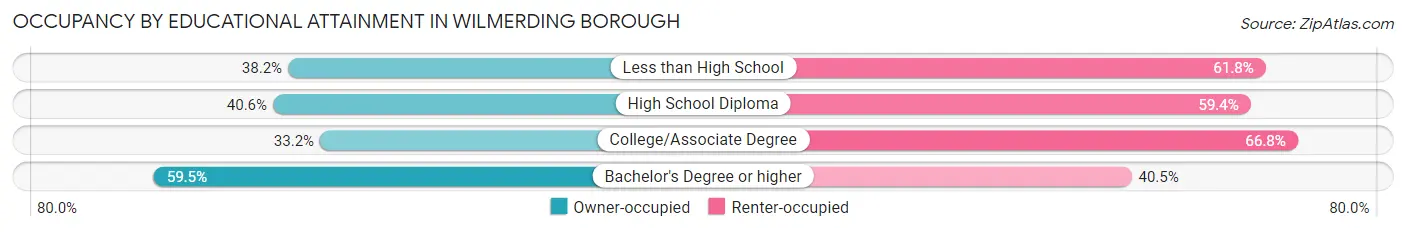
| Household Size | Owner-occupied | Renter-occupied |
| Less than High School | 39 (38.2%) | 63 (61.8%) |
| High School Diploma | 104 (40.6%) | 152 (59.4%) |
| College/Associate Degree | 125 (33.2%) | 252 (66.8%) |
| Bachelor's Degree or higher | 72 (59.5%) | 49 (40.5%) |
Occupancy by Age of Householder in Wilmerding borough
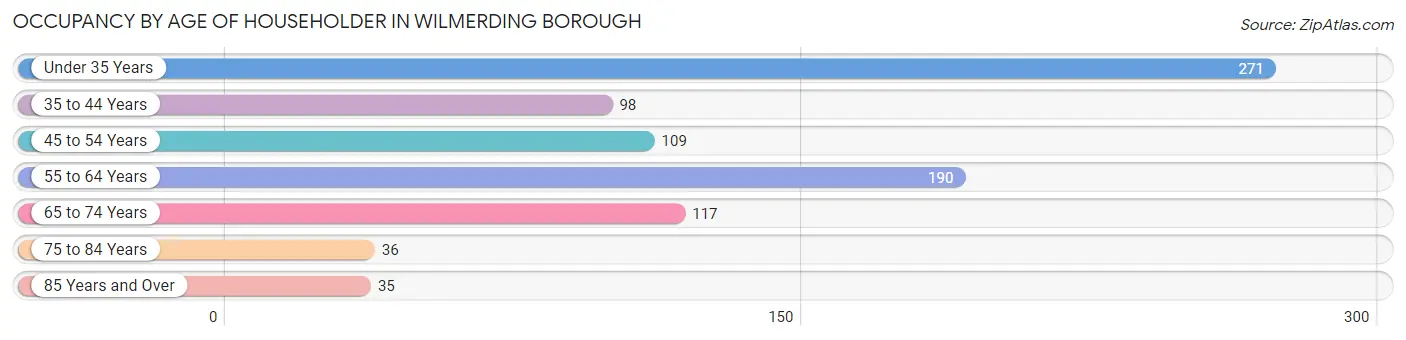
| Age Bracket | # Households | % Households |
| Under 35 Years | 271 | 31.7% |
| 35 to 44 Years | 98 | 11.5% |
| 45 to 54 Years | 109 | 12.7% |
| 55 to 64 Years | 190 | 22.2% |
| 65 to 74 Years | 117 | 13.7% |
| 75 to 84 Years | 36 | 4.2% |
| 85 Years and Over | 35 | 4.1% |
| Total | 856 | 100.0% |
Housing Finances in Wilmerding borough
Median Income by Occupancy in Wilmerding borough
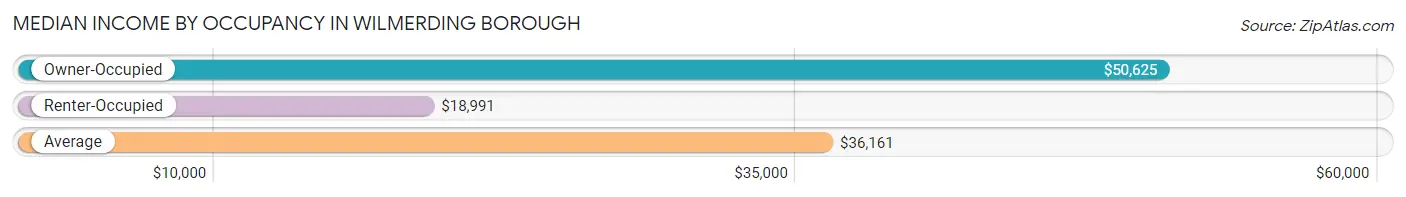
| Occupancy Type | # Households | Median Income |
| Owner-Occupied | 340 (39.7%) | $50,625 |
| Renter-Occupied | 516 (60.3%) | $18,991 |
| Average | 856 (100.0%) | $36,161 |
Occupancy by Householder Income Bracket in Wilmerding borough
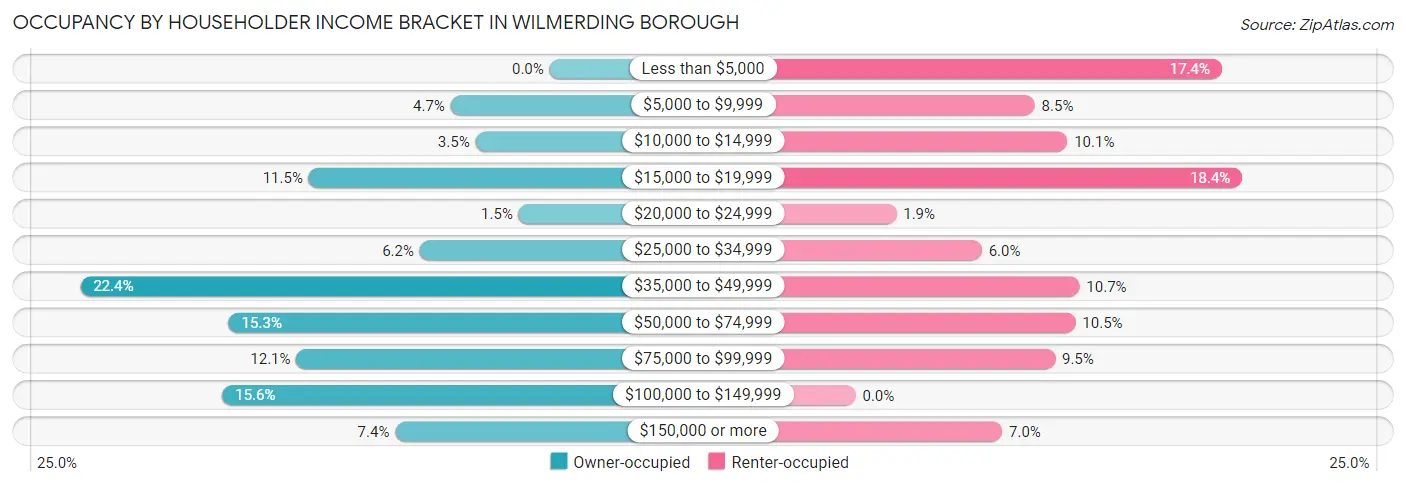
| Income Bracket | Owner-occupied | Renter-occupied |
| Less than $5,000 | 0 (0.0%) | 90 (17.4%) |
| $5,000 to $9,999 | 16 (4.7%) | 44 (8.5%) |
| $10,000 to $14,999 | 12 (3.5%) | 52 (10.1%) |
| $15,000 to $19,999 | 39 (11.5%) | 95 (18.4%) |
| $20,000 to $24,999 | 5 (1.5%) | 10 (1.9%) |
| $25,000 to $34,999 | 21 (6.2%) | 31 (6.0%) |
| $35,000 to $49,999 | 76 (22.4%) | 55 (10.7%) |
| $50,000 to $74,999 | 52 (15.3%) | 54 (10.5%) |
| $75,000 to $99,999 | 41 (12.1%) | 49 (9.5%) |
| $100,000 to $149,999 | 53 (15.6%) | 0 (0.0%) |
| $150,000 or more | 25 (7.3%) | 36 (7.0%) |
| Total | 340 (100.0%) | 516 (100.0%) |
Monthly Housing Cost Tiers in Wilmerding borough
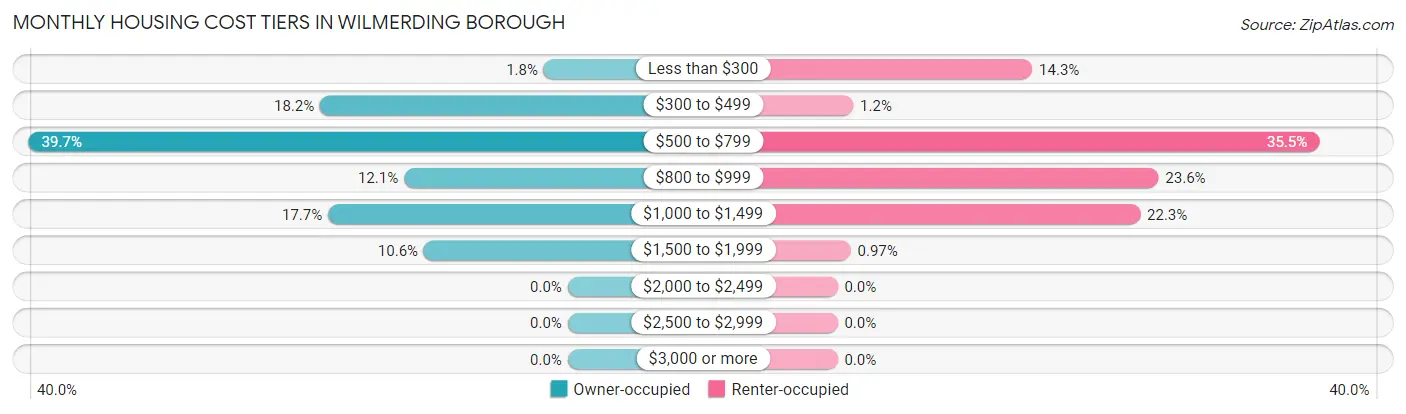
| Monthly Cost | Owner-occupied | Renter-occupied |
| Less than $300 | 6 (1.8%) | 74 (14.3%) |
| $300 to $499 | 62 (18.2%) | 6 (1.2%) |
| $500 to $799 | 135 (39.7%) | 183 (35.5%) |
| $800 to $999 | 41 (12.1%) | 122 (23.6%) |
| $1,000 to $1,499 | 60 (17.6%) | 115 (22.3%) |
| $1,500 to $1,999 | 36 (10.6%) | 5 (1.0%) |
| $2,000 to $2,499 | 0 (0.0%) | 0 (0.0%) |
| $2,500 to $2,999 | 0 (0.0%) | 0 (0.0%) |
| $3,000 or more | 0 (0.0%) | 0 (0.0%) |
| Total | 340 (100.0%) | 516 (100.0%) |
Physical Housing Characteristics in Wilmerding borough
Housing Structures in Wilmerding borough
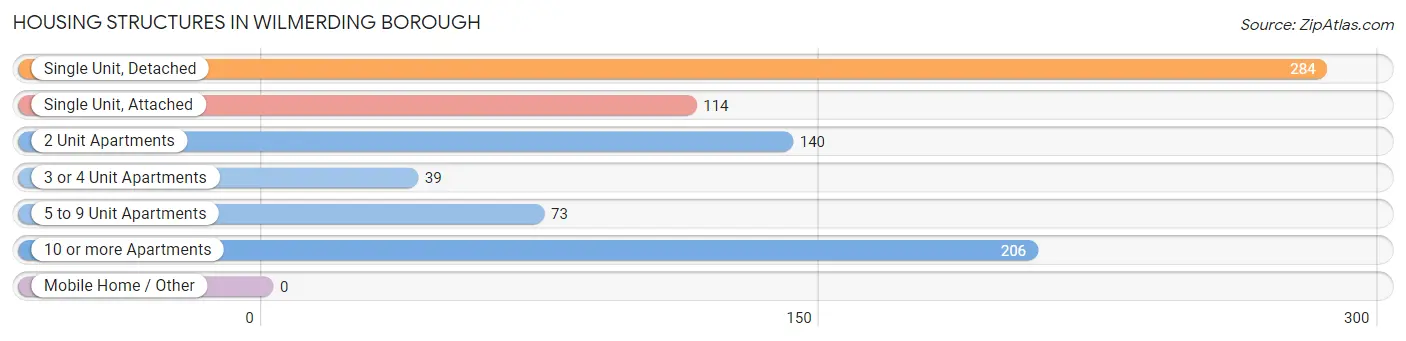
| Structure Type | # Housing Units | % Housing Units |
| Single Unit, Detached | 284 | 33.2% |
| Single Unit, Attached | 114 | 13.3% |
| 2 Unit Apartments | 140 | 16.4% |
| 3 or 4 Unit Apartments | 39 | 4.6% |
| 5 to 9 Unit Apartments | 73 | 8.5% |
| 10 or more Apartments | 206 | 24.1% |
| Mobile Home / Other | 0 | 0.0% |
| Total | 856 | 100.0% |
Housing Structures by Occupancy in Wilmerding borough
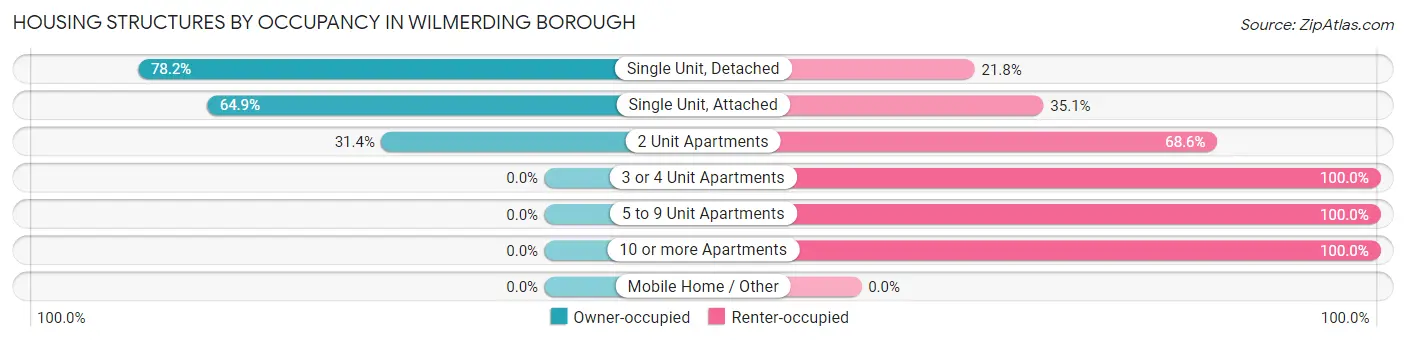
| Structure Type | Owner-occupied | Renter-occupied |
| Single Unit, Detached | 222 (78.2%) | 62 (21.8%) |
| Single Unit, Attached | 74 (64.9%) | 40 (35.1%) |
| 2 Unit Apartments | 44 (31.4%) | 96 (68.6%) |
| 3 or 4 Unit Apartments | 0 (0.0%) | 39 (100.0%) |
| 5 to 9 Unit Apartments | 0 (0.0%) | 73 (100.0%) |
| 10 or more Apartments | 0 (0.0%) | 206 (100.0%) |
| Mobile Home / Other | 0 (0.0%) | 0 (0.0%) |
| Total | 340 (39.7%) | 516 (60.3%) |
Housing Structures by Number of Rooms in Wilmerding borough
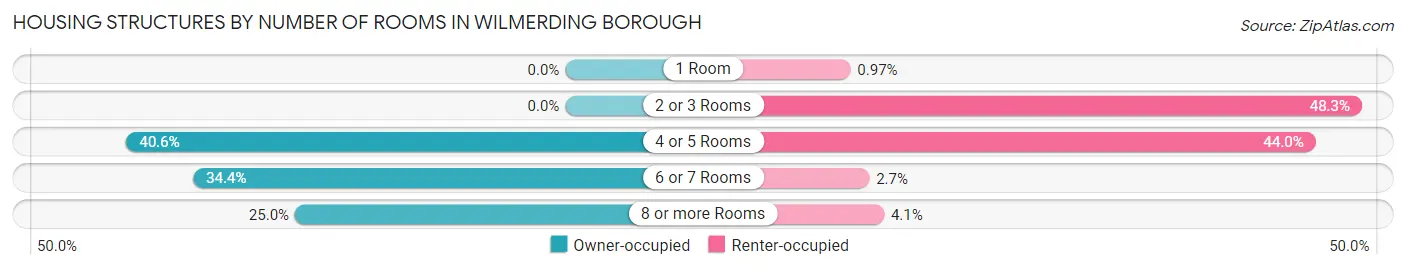
| Number of Rooms | Owner-occupied | Renter-occupied |
| 1 Room | 0 (0.0%) | 5 (1.0%) |
| 2 or 3 Rooms | 0 (0.0%) | 249 (48.3%) |
| 4 or 5 Rooms | 138 (40.6%) | 227 (44.0%) |
| 6 or 7 Rooms | 117 (34.4%) | 14 (2.7%) |
| 8 or more Rooms | 85 (25.0%) | 21 (4.1%) |
| Total | 340 (100.0%) | 516 (100.0%) |
Housing Structure by Heating Type in Wilmerding borough
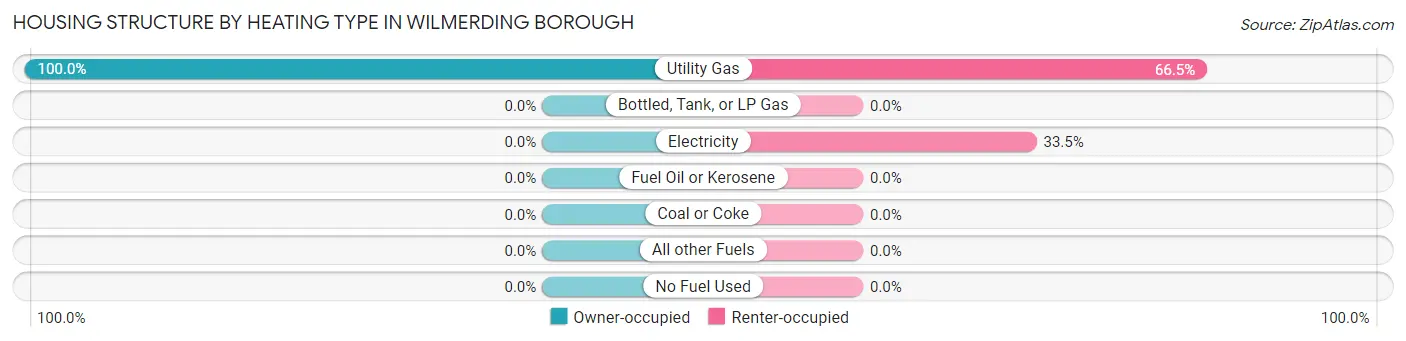
| Heating Type | Owner-occupied | Renter-occupied |
| Utility Gas | 340 (100.0%) | 343 (66.5%) |
| Bottled, Tank, or LP Gas | 0 (0.0%) | 0 (0.0%) |
| Electricity | 0 (0.0%) | 173 (33.5%) |
| Fuel Oil or Kerosene | 0 (0.0%) | 0 (0.0%) |
| Coal or Coke | 0 (0.0%) | 0 (0.0%) |
| All other Fuels | 0 (0.0%) | 0 (0.0%) |
| No Fuel Used | 0 (0.0%) | 0 (0.0%) |
| Total | 340 (100.0%) | 516 (100.0%) |
Household Vehicle Usage in Wilmerding borough
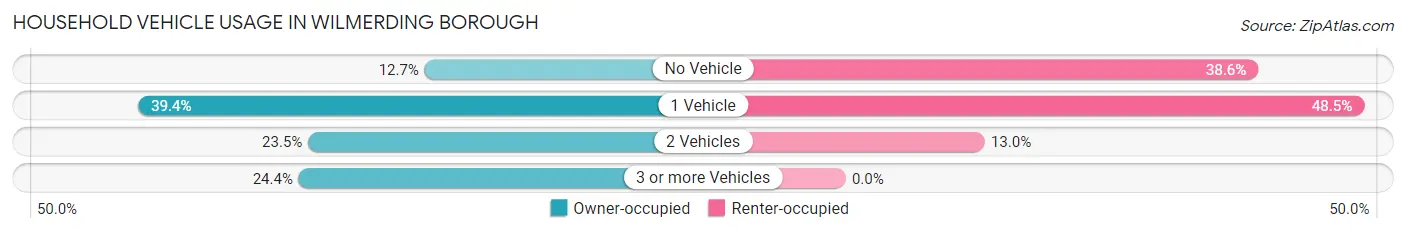
| Vehicles per Household | Owner-occupied | Renter-occupied |
| No Vehicle | 43 (12.7%) | 199 (38.6%) |
| 1 Vehicle | 134 (39.4%) | 250 (48.4%) |
| 2 Vehicles | 80 (23.5%) | 67 (13.0%) |
| 3 or more Vehicles | 83 (24.4%) | 0 (0.0%) |
| Total | 340 (100.0%) | 516 (100.0%) |
Real Estate & Mortgages in Wilmerding borough
Real Estate and Mortgage Overview in Wilmerding borough
| Characteristic | Without Mortgage | With Mortgage |
| Housing Units | 185 | 155 |
| Median Property Value | $53,700 | $77,000 |
| Median Household Income | $49,766 | $25 |
| Monthly Housing Costs | $574 | $0 |
| Real Estate Taxes | $1,157 | $11 |
Property Value by Mortgage Status in Wilmerding borough
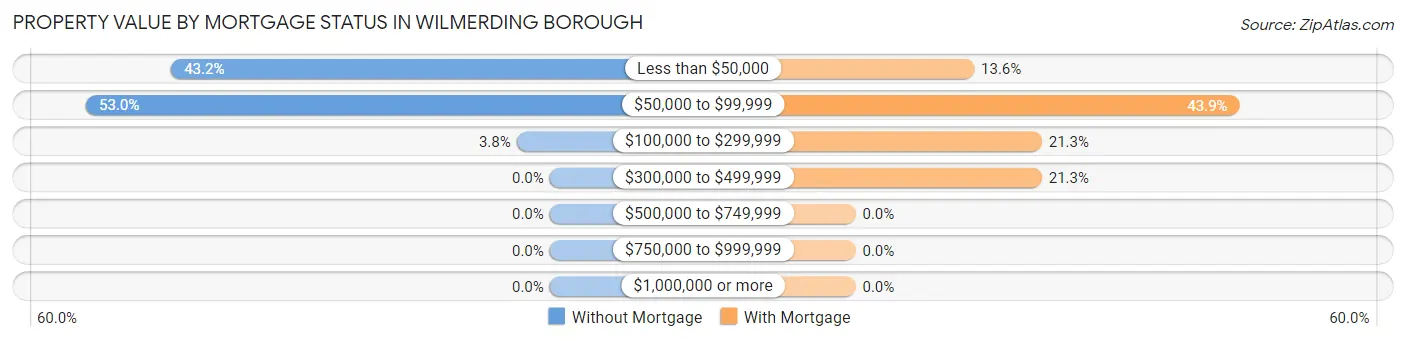
| Property Value | Without Mortgage | With Mortgage |
| Less than $50,000 | 80 (43.2%) | 21 (13.6%) |
| $50,000 to $99,999 | 98 (53.0%) | 68 (43.9%) |
| $100,000 to $299,999 | 7 (3.8%) | 33 (21.3%) |
| $300,000 to $499,999 | 0 (0.0%) | 33 (21.3%) |
| $500,000 to $749,999 | 0 (0.0%) | 0 (0.0%) |
| $750,000 to $999,999 | 0 (0.0%) | 0 (0.0%) |
| $1,000,000 or more | 0 (0.0%) | 0 (0.0%) |
| Total | 185 (100.0%) | 155 (100.0%) |
Household Income by Mortgage Status in Wilmerding borough
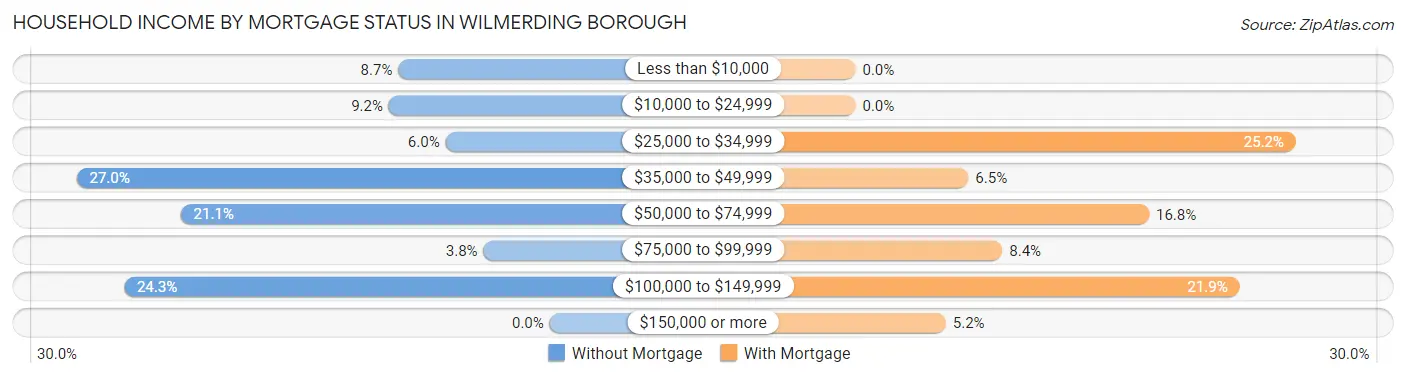
| Household Income | Without Mortgage | With Mortgage |
| Less than $10,000 | 16 (8.6%) | 0 (0.0%) |
| $10,000 to $24,999 | 17 (9.2%) | 0 (0.0%) |
| $25,000 to $34,999 | 11 (5.9%) | 39 (25.2%) |
| $35,000 to $49,999 | 50 (27.0%) | 10 (6.5%) |
| $50,000 to $74,999 | 39 (21.1%) | 26 (16.8%) |
| $75,000 to $99,999 | 7 (3.8%) | 13 (8.4%) |
| $100,000 to $149,999 | 45 (24.3%) | 34 (21.9%) |
| $150,000 or more | 0 (0.0%) | 8 (5.2%) |
| Total | 185 (100.0%) | 155 (100.0%) |
Property Value to Household Income Ratio in Wilmerding borough
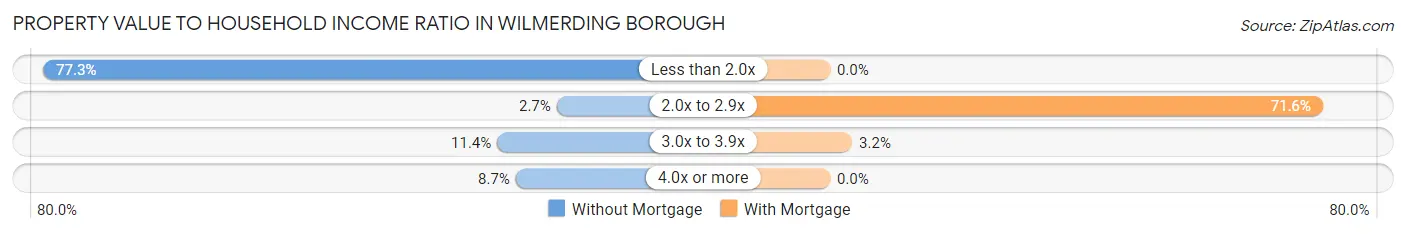
| Value-to-Income Ratio | Without Mortgage | With Mortgage |
| Less than 2.0x | 143 (77.3%) | 0 (0.0%) |
| 2.0x to 2.9x | 5 (2.7%) | 111 (71.6%) |
| 3.0x to 3.9x | 21 (11.4%) | 5 (3.2%) |
| 4.0x or more | 16 (8.6%) | 0 (0.0%) |
| Total | 185 (100.0%) | 155 (100.0%) |
Real Estate Taxes by Mortgage Status in Wilmerding borough
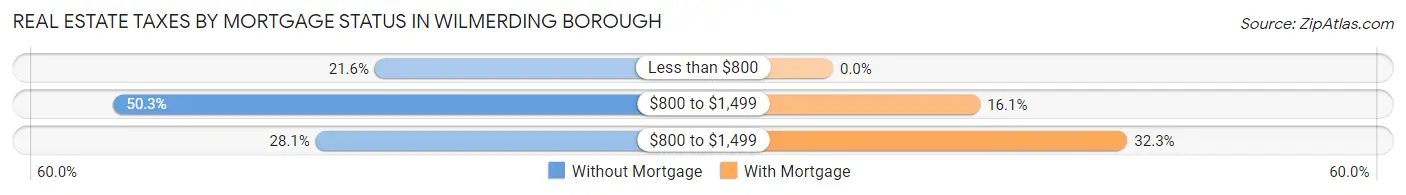
| Property Taxes | Without Mortgage | With Mortgage |
| Less than $800 | 40 (21.6%) | 0 (0.0%) |
| $800 to $1,499 | 93 (50.3%) | 25 (16.1%) |
| $800 to $1,499 | 52 (28.1%) | 50 (32.3%) |
| Total | 185 (100.0%) | 155 (100.0%) |
Health & Disability in Wilmerding borough
Health Insurance Coverage by Age in Wilmerding borough
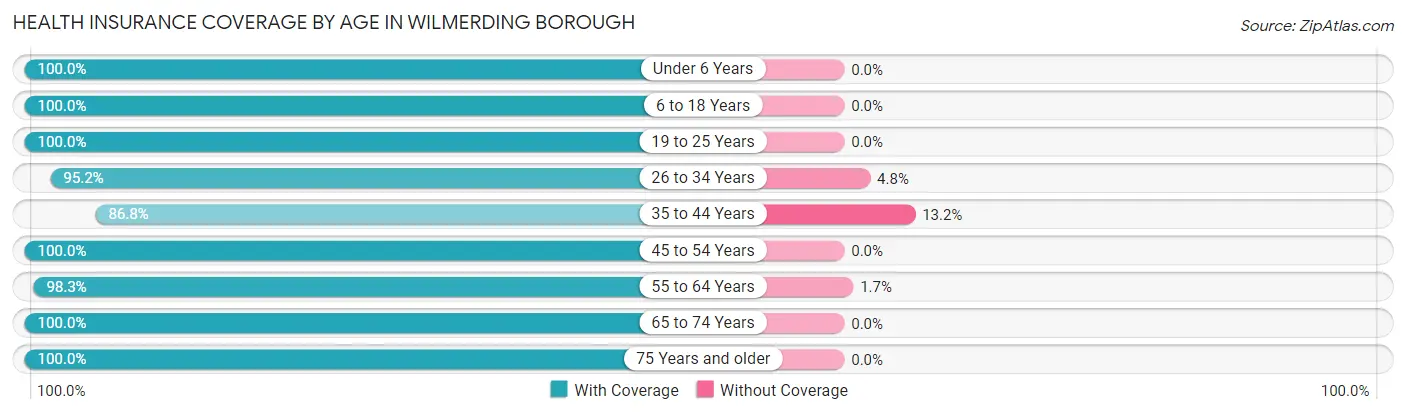
| Age Bracket | With Coverage | Without Coverage |
| Under 6 Years | 137 (100.0%) | 0 (0.0%) |
| 6 to 18 Years | 281 (100.0%) | 0 (0.0%) |
| 19 to 25 Years | 162 (100.0%) | 0 (0.0%) |
| 26 to 34 Years | 316 (95.2%) | 16 (4.8%) |
| 35 to 44 Years | 151 (86.8%) | 23 (13.2%) |
| 45 to 54 Years | 188 (100.0%) | 0 (0.0%) |
| 55 to 64 Years | 297 (98.3%) | 5 (1.7%) |
| 65 to 74 Years | 154 (100.0%) | 0 (0.0%) |
| 75 Years and older | 104 (100.0%) | 0 (0.0%) |
| Total | 1,790 (97.6%) | 44 (2.4%) |
Health Insurance Coverage by Citizenship Status in Wilmerding borough
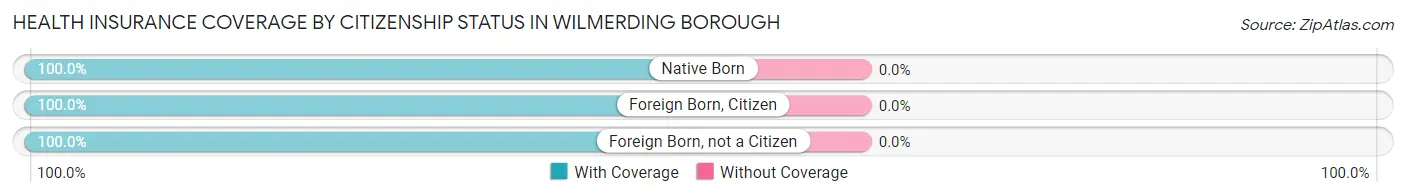
| Citizenship Status | With Coverage | Without Coverage |
| Native Born | 137 (100.0%) | 0 (0.0%) |
| Foreign Born, Citizen | 281 (100.0%) | 0 (0.0%) |
| Foreign Born, not a Citizen | 162 (100.0%) | 0 (0.0%) |
Health Insurance Coverage by Household Income in Wilmerding borough
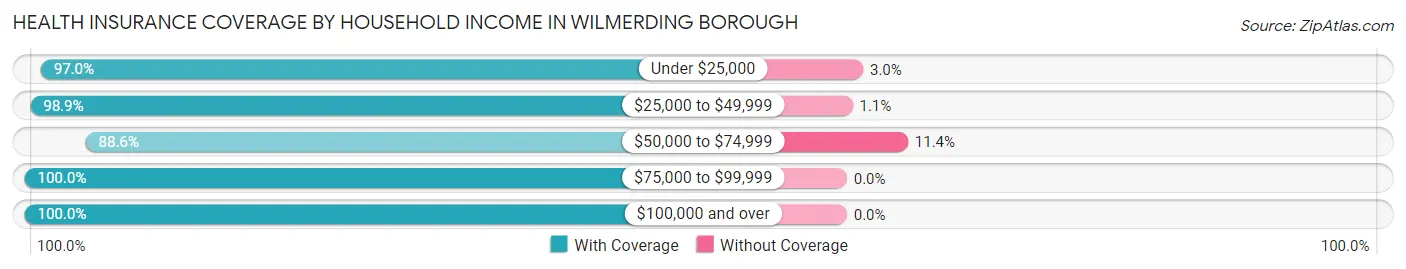
| Household Income | With Coverage | Without Coverage |
| Under $25,000 | 511 (97.0%) | 16 (3.0%) |
| $25,000 to $49,999 | 462 (98.9%) | 5 (1.1%) |
| $50,000 to $74,999 | 178 (88.6%) | 23 (11.4%) |
| $75,000 to $99,999 | 295 (100.0%) | 0 (0.0%) |
| $100,000 and over | 320 (100.0%) | 0 (0.0%) |
Public vs Private Health Insurance Coverage by Age in Wilmerding borough
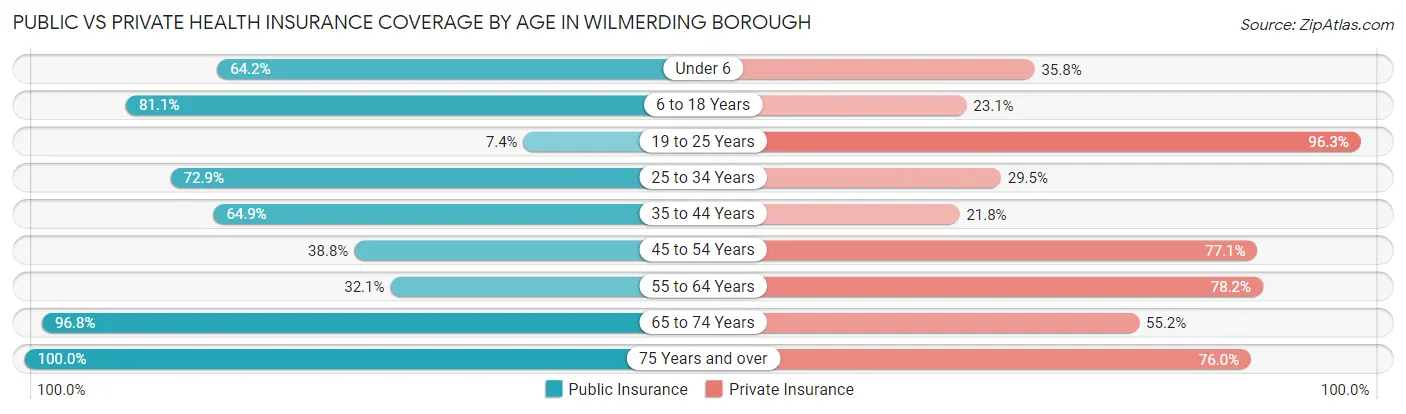
| Age Bracket | Public Insurance | Private Insurance |
| Under 6 | 88 (64.2%) | 49 (35.8%) |
| 6 to 18 Years | 228 (81.1%) | 65 (23.1%) |
| 19 to 25 Years | 12 (7.4%) | 156 (96.3%) |
| 25 to 34 Years | 242 (72.9%) | 98 (29.5%) |
| 35 to 44 Years | 113 (64.9%) | 38 (21.8%) |
| 45 to 54 Years | 73 (38.8%) | 145 (77.1%) |
| 55 to 64 Years | 97 (32.1%) | 236 (78.1%) |
| 65 to 74 Years | 149 (96.8%) | 85 (55.2%) |
| 75 Years and over | 104 (100.0%) | 79 (76.0%) |
| Total | 1,106 (60.3%) | 951 (51.8%) |
Disability Status by Sex by Age in Wilmerding borough
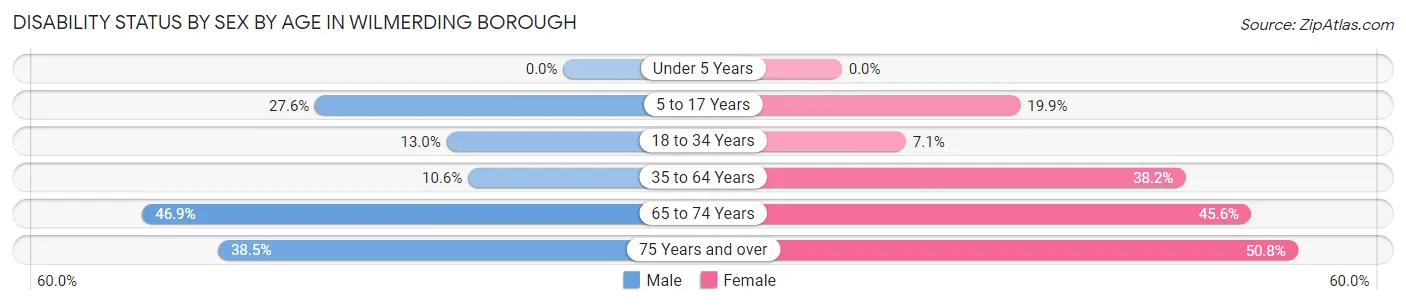
| Age Bracket | Male | Female |
| Under 5 Years | 0 (0.0%) | 0 (0.0%) |
| 5 to 17 Years | 34 (27.6%) | 32 (19.9%) |
| 18 to 34 Years | 26 (13.0%) | 21 (7.1%) |
| 35 to 64 Years | 33 (10.6%) | 135 (38.2%) |
| 65 to 74 Years | 30 (46.9%) | 41 (45.6%) |
| 75 Years and over | 15 (38.5%) | 33 (50.8%) |
Disability Class by Sex by Age in Wilmerding borough
Disability Class: Hearing Difficulty
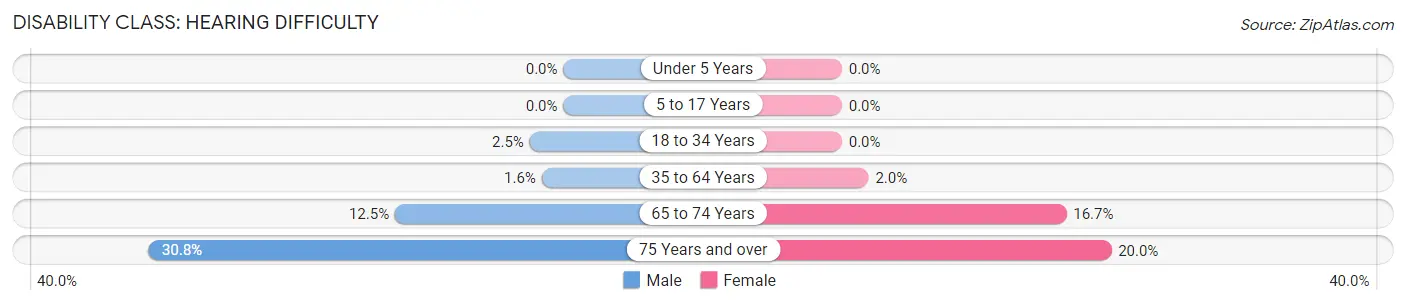
| Age Bracket | Male | Female |
| Under 5 Years | 0 (0.0%) | 0 (0.0%) |
| 5 to 17 Years | 0 (0.0%) | 0 (0.0%) |
| 18 to 34 Years | 5 (2.5%) | 0 (0.0%) |
| 35 to 64 Years | 5 (1.6%) | 7 (2.0%) |
| 65 to 74 Years | 8 (12.5%) | 15 (16.7%) |
| 75 Years and over | 12 (30.8%) | 13 (20.0%) |
Disability Class: Vision Difficulty
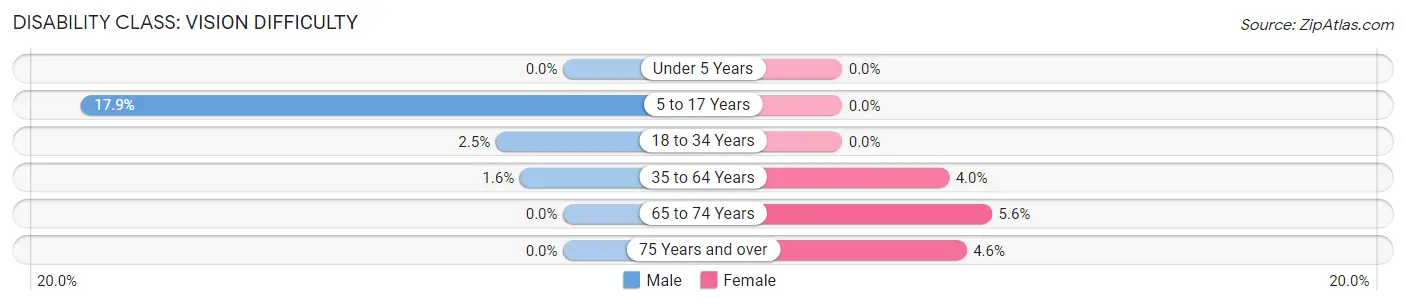
| Age Bracket | Male | Female |
| Under 5 Years | 0 (0.0%) | 0 (0.0%) |
| 5 to 17 Years | 22 (17.9%) | 0 (0.0%) |
| 18 to 34 Years | 5 (2.5%) | 0 (0.0%) |
| 35 to 64 Years | 5 (1.6%) | 14 (4.0%) |
| 65 to 74 Years | 0 (0.0%) | 5 (5.6%) |
| 75 Years and over | 0 (0.0%) | 3 (4.6%) |
Disability Class: Cognitive Difficulty
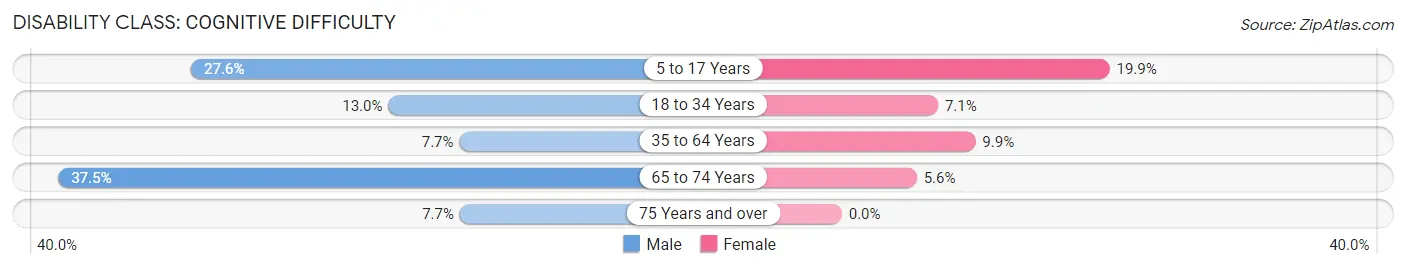
| Age Bracket | Male | Female |
| 5 to 17 Years | 34 (27.6%) | 32 (19.9%) |
| 18 to 34 Years | 26 (13.0%) | 21 (7.1%) |
| 35 to 64 Years | 24 (7.7%) | 35 (9.9%) |
| 65 to 74 Years | 24 (37.5%) | 5 (5.6%) |
| 75 Years and over | 3 (7.7%) | 0 (0.0%) |
Disability Class: Ambulatory Difficulty
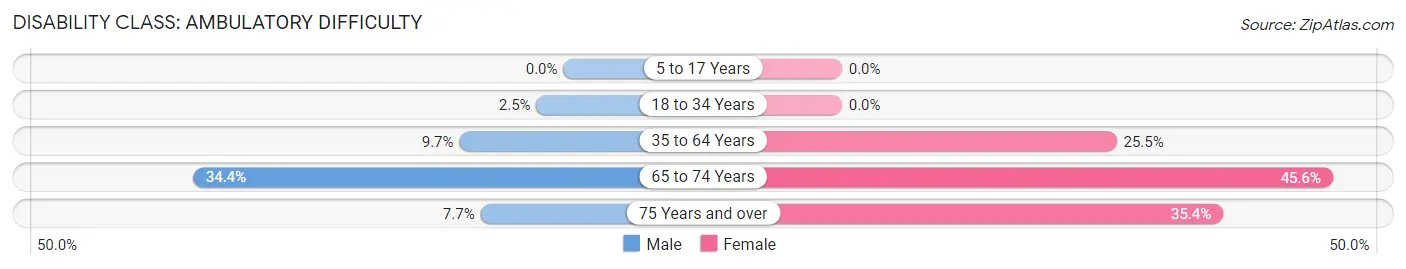
| Age Bracket | Male | Female |
| 5 to 17 Years | 0 (0.0%) | 0 (0.0%) |
| 18 to 34 Years | 5 (2.5%) | 0 (0.0%) |
| 35 to 64 Years | 30 (9.7%) | 90 (25.5%) |
| 65 to 74 Years | 22 (34.4%) | 41 (45.6%) |
| 75 Years and over | 3 (7.7%) | 23 (35.4%) |
Disability Class: Self-Care Difficulty
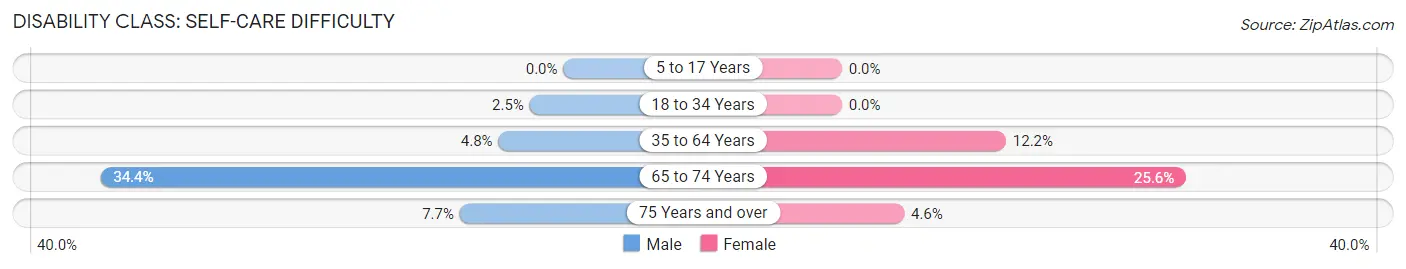
| Age Bracket | Male | Female |
| 5 to 17 Years | 0 (0.0%) | 0 (0.0%) |
| 18 to 34 Years | 5 (2.5%) | 0 (0.0%) |
| 35 to 64 Years | 15 (4.8%) | 43 (12.2%) |
| 65 to 74 Years | 22 (34.4%) | 23 (25.6%) |
| 75 Years and over | 3 (7.7%) | 3 (4.6%) |
Technology Access in Wilmerding borough
Computing Device Access in Wilmerding borough
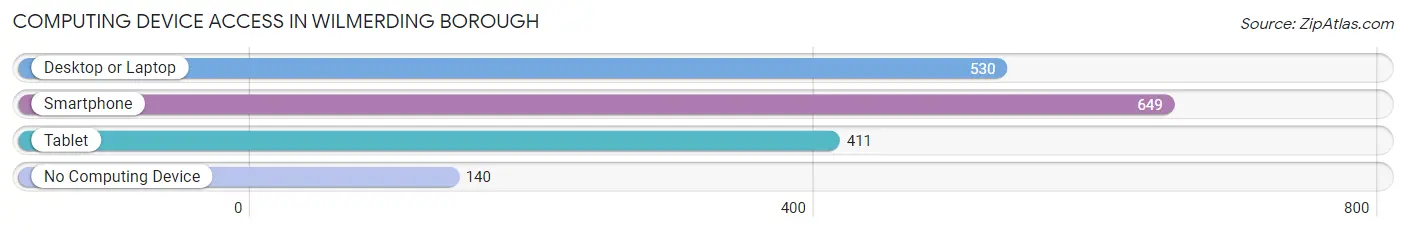
| Device Type | # Households | % Households |
| Desktop or Laptop | 530 | 61.9% |
| Smartphone | 649 | 75.8% |
| Tablet | 411 | 48.0% |
| No Computing Device | 140 | 16.4% |
| Total | 856 | 100.0% |
Internet Access in Wilmerding borough
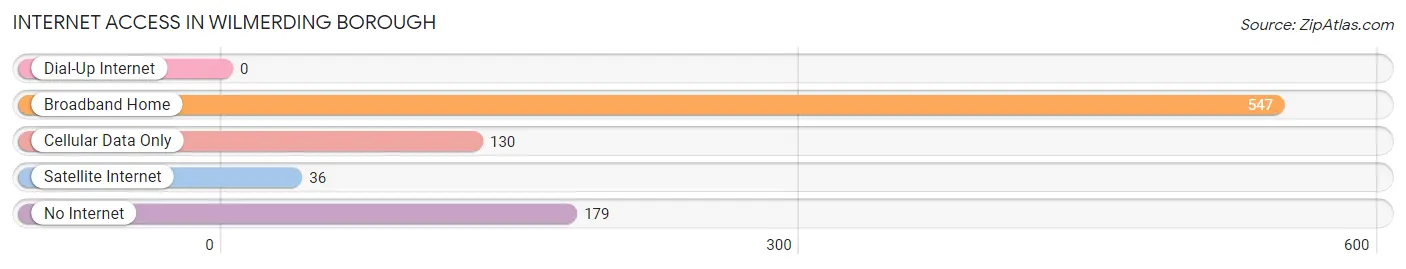
| Internet Type | # Households | % Households |
| Dial-Up Internet | 0 | 0.0% |
| Broadband Home | 547 | 63.9% |
| Cellular Data Only | 130 | 15.2% |
| Satellite Internet | 36 | 4.2% |
| No Internet | 179 | 20.9% |
| Total | 856 | 100.0% |
Wilmerding borough Summary
Wilmerding Borough is a small borough located in Allegheny County, Pennsylvania. It is situated approximately 10 miles east of Pittsburgh and is part of the Mon Valley. The borough is home to approximately 2,500 people and is known for its historic architecture and industrial heritage.
History
Wilmerding was founded in 1871 by John Wilmerding, a Pittsburgh industrialist. Wilmerding purchased the land from the heirs of the original settlers, the Boggs family. He then laid out the town and named it after himself. Wilmerding was an important industrial center in the late 19th and early 20th centuries. It was home to several factories, including the Westinghouse Air Brake Company, which was founded in Wilmerding in 1869. The company was a major employer in the area and helped to spur the growth of the town.
In the early 20th century, Wilmerding was a thriving industrial center. The town was home to several factories, including the Westinghouse Air Brake Company, the Wilmerding Steel Company, and the Wilmerding Glass Company. The town also had a thriving retail sector, with several stores and restaurants.
Geography
Wilmerding is located in Allegheny County, Pennsylvania. It is situated approximately 10 miles east of Pittsburgh and is part of the Mon Valley. The borough is bordered by Turtle Creek to the north, Wilkins Township to the east, North Versailles Township to the south, and East Pittsburgh to the west. The borough covers an area of 1.2 square miles and is located at an elevation of 890 feet.
Economy
Wilmerding’s economy is largely based on manufacturing and retail. The town is home to several factories, including the Westinghouse Air Brake Company, the Wilmerding Steel Company, and the Wilmerding Glass Company. The town also has a thriving retail sector, with several stores and restaurants.
Demographics
As of the 2010 census, Wilmerding had a population of 2,521. The racial makeup of the borough was 94.2% White, 3.2% African American, 0.2% Native American, 0.7% Asian, 0.1% Pacific Islander, 0.3% from other races, and 1.3% from two or more races. Hispanic or Latino of any race were 1.2% of the population.
The median income for a household in Wilmerding was $37,917, and the median income for a family was $45,000. The per capita income for the borough was $18,945. About 8.2% of families and 10.2% of the population were below the poverty line, including 14.2% of those under age 18 and 8.2% of those age 65 or over.
Conclusion
Wilmerding is a small borough located in Allegheny County, Pennsylvania. It is situated approximately 10 miles east of Pittsburgh and is part of the Mon Valley. The borough is home to approximately 2,500 people and is known for its historic architecture and industrial heritage. Wilmerding’s economy is largely based on manufacturing and retail. The town is home to several factories, including the Westinghouse Air Brake Company, the Wilmerding Steel Company, and the Wilmerding Glass Company. The town also has a thriving retail sector, with several stores and restaurants. As of the 2010 census, Wilmerding had a population of 2,521. The racial makeup of the borough was 94.2% White, 3.2% African American, 0.2% Native American, 0.7% Asian, 0.1% Pacific Islander, 0.3% from other races, and 1.3% from two or more races. The median income for a household in Wilmerding was $37,917, and the median income for a family was $45,000. Wilmerding is a small borough with a rich history and a vibrant economy.
Common Questions
What is the Total Population of Wilmerding borough?
Total Population of Wilmerding borough is 1,834.
What is the Total Male Population of Wilmerding borough?
Total Male Population of Wilmerding borough is 808.
What is the Total Female Population of Wilmerding borough?
Total Female Population of Wilmerding borough is 1,026.
What is the Ratio of Males per 100 Females in Wilmerding borough?
There are 78.75 Males per 100 Females in Wilmerding borough.
What is the Ratio of Females per 100 Males in Wilmerding borough?
There are 126.98 Females per 100 Males in Wilmerding borough.
What is the Median Population Age in Wilmerding borough?
Median Population Age in Wilmerding borough is 35.1 Years.
What is the Average Family Size in Wilmerding borough
Average Family Size in Wilmerding borough is 3.1 People.
What is the Average Household Size in Wilmerding borough
Average Household Size in Wilmerding borough is 2.1 People.
What is Per Capita Income in Wilmerding borough?
Per Capita income in Wilmerding borough is $23,835.
What is the Median Family Income in Wilmerding borough?
Median Family Income in Wilmerding borough is $66,719.
What is the Median Household income in Wilmerding borough?
Median Household Income in Wilmerding borough is $36,161.
What is Income or Wage Gap in Wilmerding borough?
Income or Wage Gap in Wilmerding borough is 20.2%.
Women in Wilmerding borough earn 79.8 cents for every dollar earned by a man.
What is Inequality or Gini Index in Wilmerding borough?
Inequality or Gini Index in Wilmerding borough is 0.50.
How Large is the Labor Force in Wilmerding borough?
There are 953 People in the Labor Forcein in Wilmerding borough.
What is the Percentage of People in the Labor Force in Wilmerding borough?
66.3% of People are in the Labor Force in Wilmerding borough.
What is the Unemployment Rate in Wilmerding borough?
Unemployment Rate in Wilmerding borough is 13.2%.