Kapp Heights, PA
Kapp Heights Map
Kapp Heights Overview
765
TOTAL POPULATION
405
MALE POPULATION
360
FEMALE POPULATION
112.50
MALES / 100 FEMALES
88.89
FEMALES / 100 MALES
56.3
MEDIAN AGE
2.6
AVG FAMILY SIZE
2.0
AVG HOUSEHOLD SIZE
$32,334
PER CAPITA INCOME
$76,667
AVG FAMILY INCOME
$55,815
AVG HOUSEHOLD INCOME
62.0%
WAGE / INCOME GAP [ % ]
38.0¢/ $1
WAGE / INCOME GAP [ $ ]
0.32
INEQUALITY / GINI INDEX
393
LABOR FORCE [ PEOPLE ]
58.3%
PERCENT IN LABOR FORCE
4.8%
UNEMPLOYMENT RATE
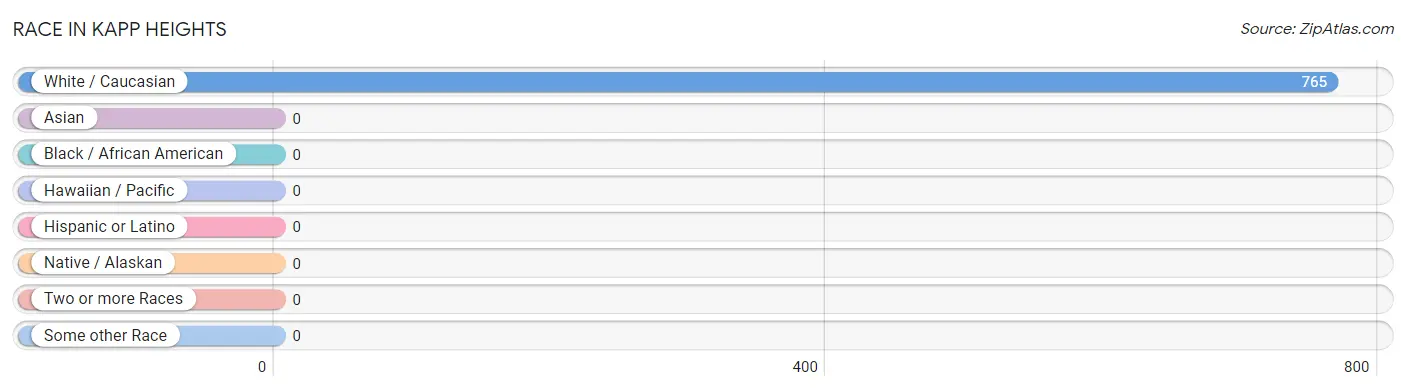
Race in Kapp Heights
The most populous races in Kapp Heights are , and White / Caucasian (765 | 100.0%).
| Race | # Population | % Population |
| Asian | 0 | 0.0% |
| Black / African American | 0 | 0.0% |
| Hawaiian / Pacific | 0 | 0.0% |
| Hispanic or Latino | 0 | 0.0% |
| Native / Alaskan | 0 | 0.0% |
| White / Caucasian | 765 | 100.0% |
| Two or more Races | 0 | 0.0% |
| Some other Race | 0 | 0.0% |
| Total | 765 | 100.0% |
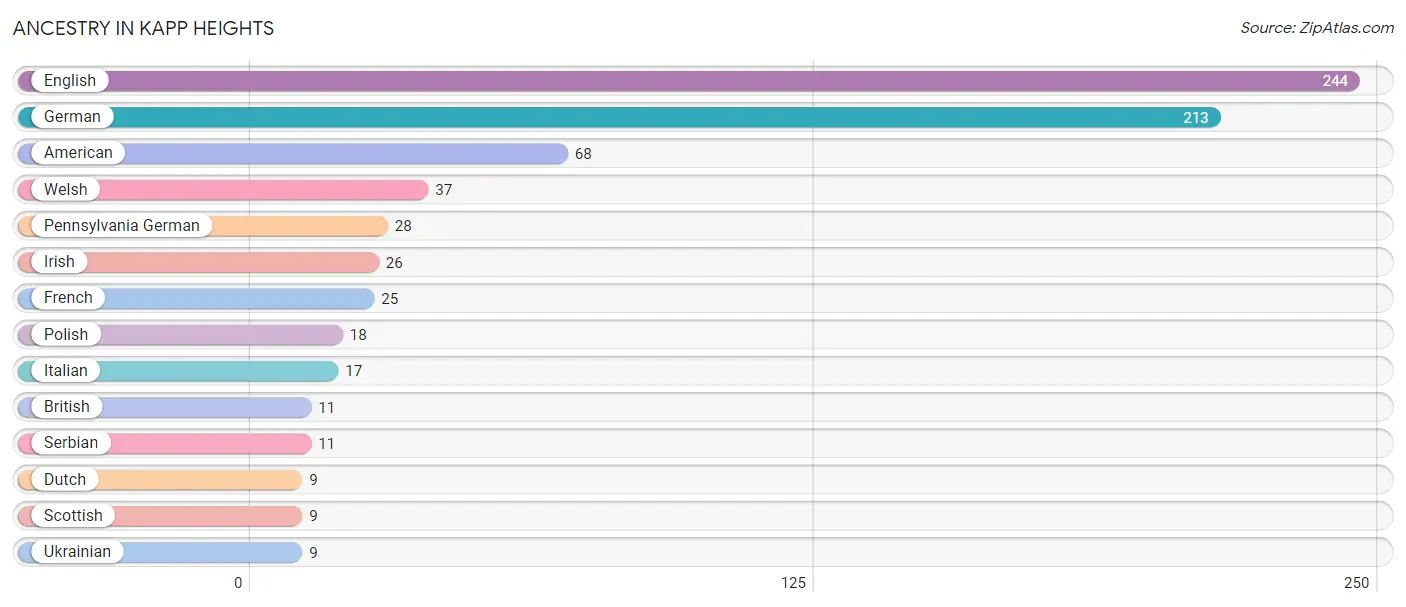
Ancestry in Kapp Heights
The most populous ancestries reported in Kapp Heights are English (244 | 31.9%), German (213 | 27.8%), American (68 | 8.9%), Welsh (37 | 4.8%), and Pennsylvania German (28 | 3.7%), together accounting for 77.1% of all Kapp Heights residents.
| Ancestry | # Population | % Population |
| American | 68 | 8.9% |
| British | 11 | 1.4% |
| Dutch | 9 | 1.2% |
| English | 244 | 31.9% |
| French | 25 | 3.3% |
| German | 213 | 27.8% |
| Irish | 26 | 3.4% |
| Italian | 17 | 2.2% |
| Pennsylvania German | 28 | 3.7% |
| Polish | 18 | 2.4% |
| Scottish | 9 | 1.2% |
| Serbian | 11 | 1.4% |
| Ukrainian | 9 | 1.2% |
| Welsh | 37 | 4.8% | View All 14 Rows |
Immigrants in Kapp Heights

| Immigration Origin | # Population | % Population | View All 0 Rows |
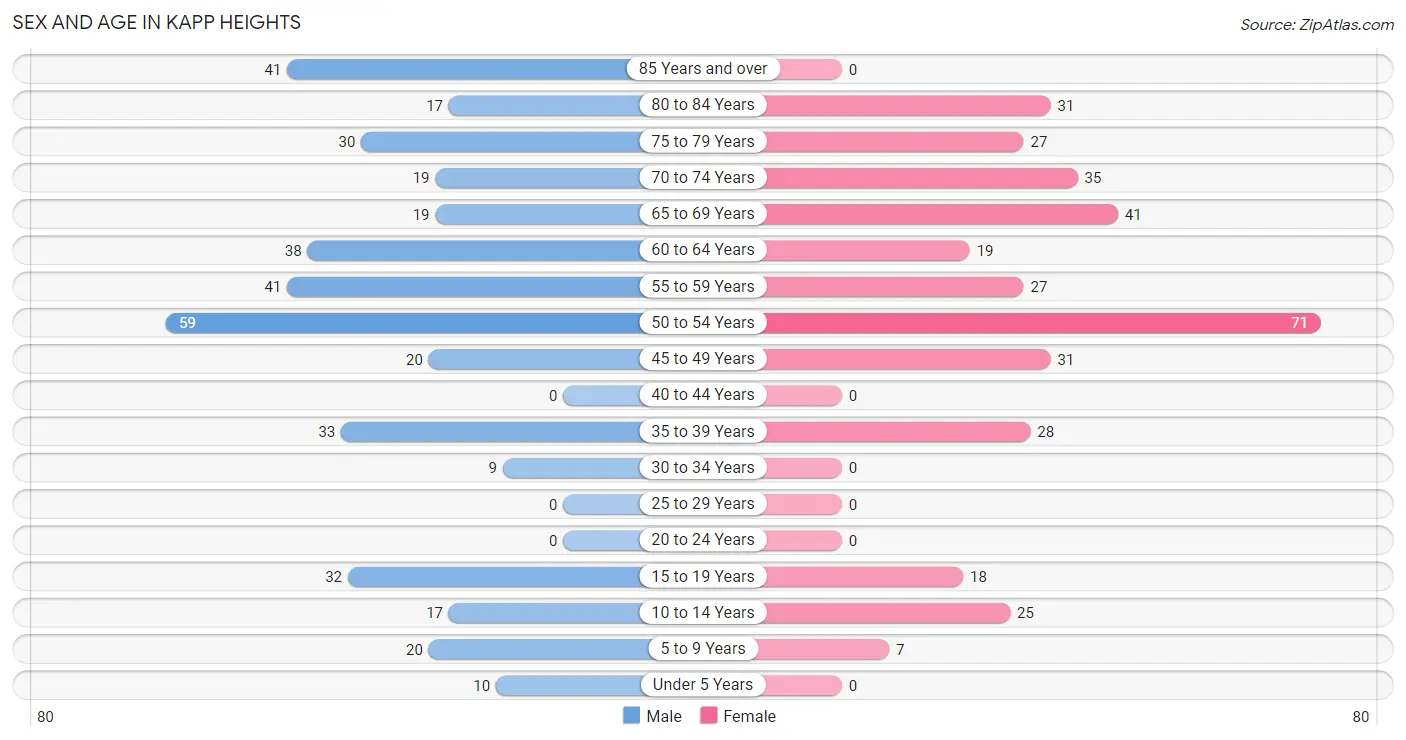
Sex and Age in Kapp Heights
Sex and Age in Kapp Heights
The most populous age groups in Kapp Heights are 50 to 54 Years (59 | 14.6%) for men and 50 to 54 Years (71 | 19.7%) for women.
| Age Bracket | Male | Female |
| Under 5 Years | 10 (2.5%) | 0 (0.0%) |
| 5 to 9 Years | 20 (4.9%) | 7 (1.9%) |
| 10 to 14 Years | 17 (4.2%) | 25 (6.9%) |
| 15 to 19 Years | 32 (7.9%) | 18 (5.0%) |
| 20 to 24 Years | 0 (0.0%) | 0 (0.0%) |
| 25 to 29 Years | 0 (0.0%) | 0 (0.0%) |
| 30 to 34 Years | 9 (2.2%) | 0 (0.0%) |
| 35 to 39 Years | 33 (8.2%) | 28 (7.8%) |
| 40 to 44 Years | 0 (0.0%) | 0 (0.0%) |
| 45 to 49 Years | 20 (4.9%) | 31 (8.6%) |
| 50 to 54 Years | 59 (14.6%) | 71 (19.7%) |
| 55 to 59 Years | 41 (10.1%) | 27 (7.5%) |
| 60 to 64 Years | 38 (9.4%) | 19 (5.3%) |
| 65 to 69 Years | 19 (4.7%) | 41 (11.4%) |
| 70 to 74 Years | 19 (4.7%) | 35 (9.7%) |
| 75 to 79 Years | 30 (7.4%) | 27 (7.5%) |
| 80 to 84 Years | 17 (4.2%) | 31 (8.6%) |
| 85 Years and over | 41 (10.1%) | 0 (0.0%) |
| Total | 405 (100.0%) | 360 (100.0%) |
Families and Households in Kapp Heights
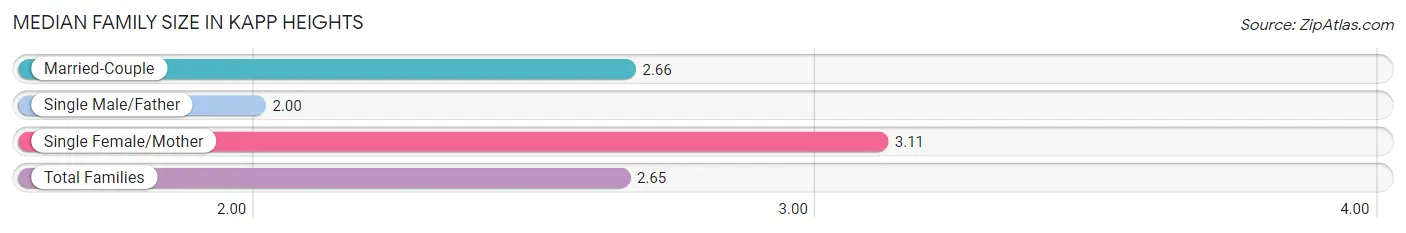
Median Family Size in Kapp Heights
The median family size in Kapp Heights is 2.65 persons per family, with single female/mother families (9 | 4.1%) accounting for the largest median family size of 3.11 persons per family. On the other hand, single male/father families (11 | 5.0%) represent the smallest median family size with 2.00 persons per family.
| Family Type | # Families | Family Size |
| Married-Couple | 202 (91.0%) | 2.66 |
| Single Male/Father | 11 (5.0%) | 2.00 |
| Single Female/Mother | 9 (4.1%) | 3.11 |
| Total Families | 222 (100.0%) | 2.65 |
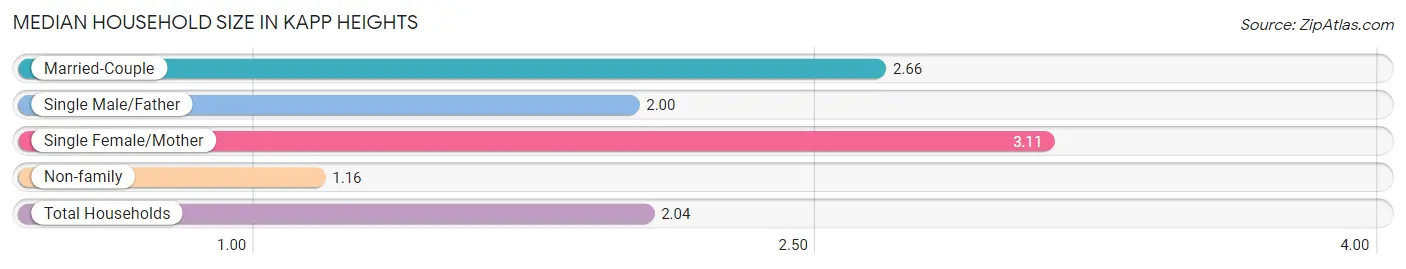
Median Household Size in Kapp Heights
The median household size in Kapp Heights is 2.04 persons per household, with single female/mother households (9 | 2.4%) accounting for the largest median household size of 3.11 persons per household. non-family households (153 | 40.8%) represent the smallest median household size with 1.16 persons per household.
| Household Type | # Households | Household Size |
| Married-Couple | 202 (53.9%) | 2.66 |
| Single Male/Father | 11 (2.9%) | 2.00 |
| Single Female/Mother | 9 (2.4%) | 3.11 |
| Non-family | 153 (40.8%) | 1.16 |
| Total Households | 375 (100.0%) | 2.04 |
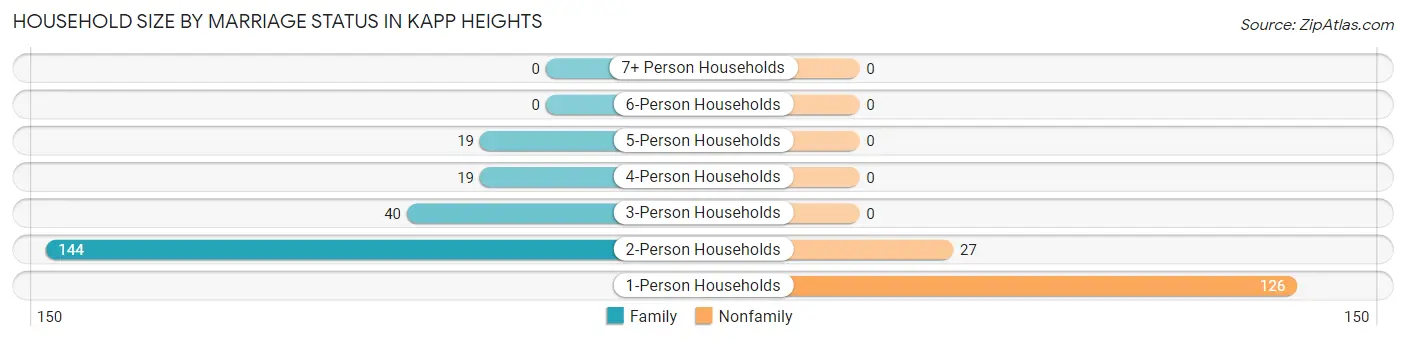
Household Size by Marriage Status in Kapp Heights
Out of a total of 375 households in Kapp Heights, 222 (59.2%) are family households, while 153 (40.8%) are nonfamily households. The most numerous type of family households are 2-person households, comprising 144, and the most common type of nonfamily households are 1-person households, comprising 126.
| Household Size | Family Households | Nonfamily Households |
| 1-Person Households | - | 126 (33.6%) |
| 2-Person Households | 144 (38.4%) | 27 (7.2%) |
| 3-Person Households | 40 (10.7%) | 0 (0.0%) |
| 4-Person Households | 19 (5.1%) | 0 (0.0%) |
| 5-Person Households | 19 (5.1%) | 0 (0.0%) |
| 6-Person Households | 0 (0.0%) | 0 (0.0%) |
| 7+ Person Households | 0 (0.0%) | 0 (0.0%) |
| Total | 222 (59.2%) | 153 (40.8%) |
Female Fertility in Kapp Heights
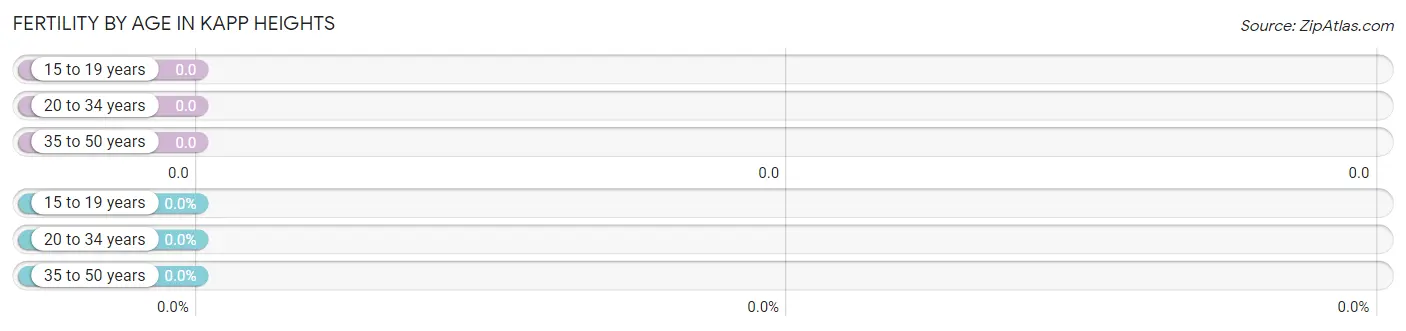
Fertility by Age in Kapp Heights
| Age Bracket | Women with Births | Births / 1,000 Women |
| 15 to 19 years | 0 (0.0%) | 0.0 |
| 20 to 34 years | 0 (0.0%) | 0.0 |
| 35 to 50 years | 0 (0.0%) | 0.0 |
| Total | 0 (0.0%) | 0.0 |
Fertility by Age by Marriage Status in Kapp Heights
| Age Bracket | Married | Unmarried |
| 15 to 19 years | 0 (0.0%) | 0 (0.0%) |
| 20 to 34 years | 0 (0.0%) | 0 (0.0%) |
| 35 to 50 years | 0 (0.0%) | 0 (0.0%) |
| Total | 0 (0.0%) | 0 (0.0%) |
Fertility by Education in Kapp Heights
| Educational Attainment | Women with Births | Births / 1,000 Women |
| Less than High School | 0 (0.0%) | 0.0 |
| High School Diploma | 0 (0.0%) | 0.0 |
| College or Associate's Degree | 0 (0.0%) | 0.0 |
| Bachelor's Degree | 0 (0.0%) | 0.0 |
| Graduate Degree | 0 (0.0%) | 0.0 |
| Total | 0 (0.0%) | 0.0 |
Fertility by Education by Marriage Status in Kapp Heights
| Educational Attainment | Married | Unmarried |
| Less than High School | 0 (0.0%) | 0 (0.0%) |
| High School Diploma | 0 (0.0%) | 0 (0.0%) |
| College or Associate's Degree | 0 (0.0%) | 0 (0.0%) |
| Bachelor's Degree | 0 (0.0%) | 0 (0.0%) |
| Graduate Degree | 0 (0.0%) | 0 (0.0%) |
| Total | 0 (0.0%) | 0 (0.0%) |
Income in Kapp Heights
Income Overview in Kapp Heights
Per Capita Income in Kapp Heights is $32,334, while median incomes of families and households are $76,667 and $55,815 respectively.
| Characteristic | Number | Measure |
| Per Capita Income | 765 | $32,334 |
| Median Family Income | 222 | $76,667 |
| Mean Family Income | 222 | $74,834 |
| Median Household Income | 375 | $55,815 |
| Mean Household Income | 375 | $64,901 |
| Income Deficit | 222 | $0 |
| Wage / Income Gap (%) | 765 | 62.05% |
| Wage / Income Gap ($) | 765 | 37.95¢ per $1 |
| Gini / Inequality Index | 765 | 0.32 |
Earnings by Sex in Kapp Heights
Average Earnings in Kapp Heights are $41,611, $50,625 for men and $19,214 for women, a difference of 62.1%.
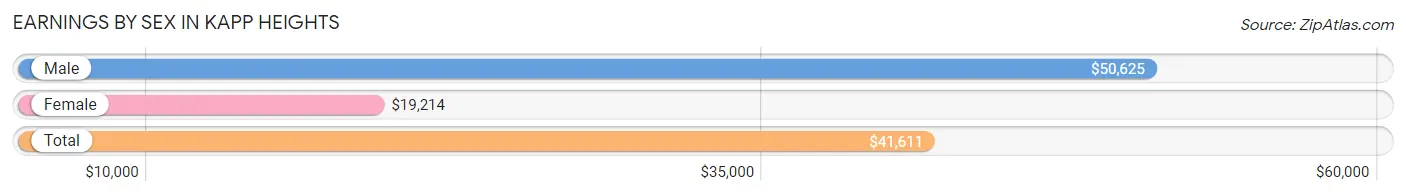
| Sex | Number | Average Earnings |
| Male | 208 (50.7%) | $50,625 |
| Female | 202 (49.3%) | $19,214 |
| Total | 410 (100.0%) | $41,611 |
Earnings by Sex by Income Bracket in Kapp Heights
The most common earnings brackets in Kapp Heights are $75,000 to $99,999 for men (51 | 24.5%) and $40,000 to $44,999 for women (45 | 22.3%).
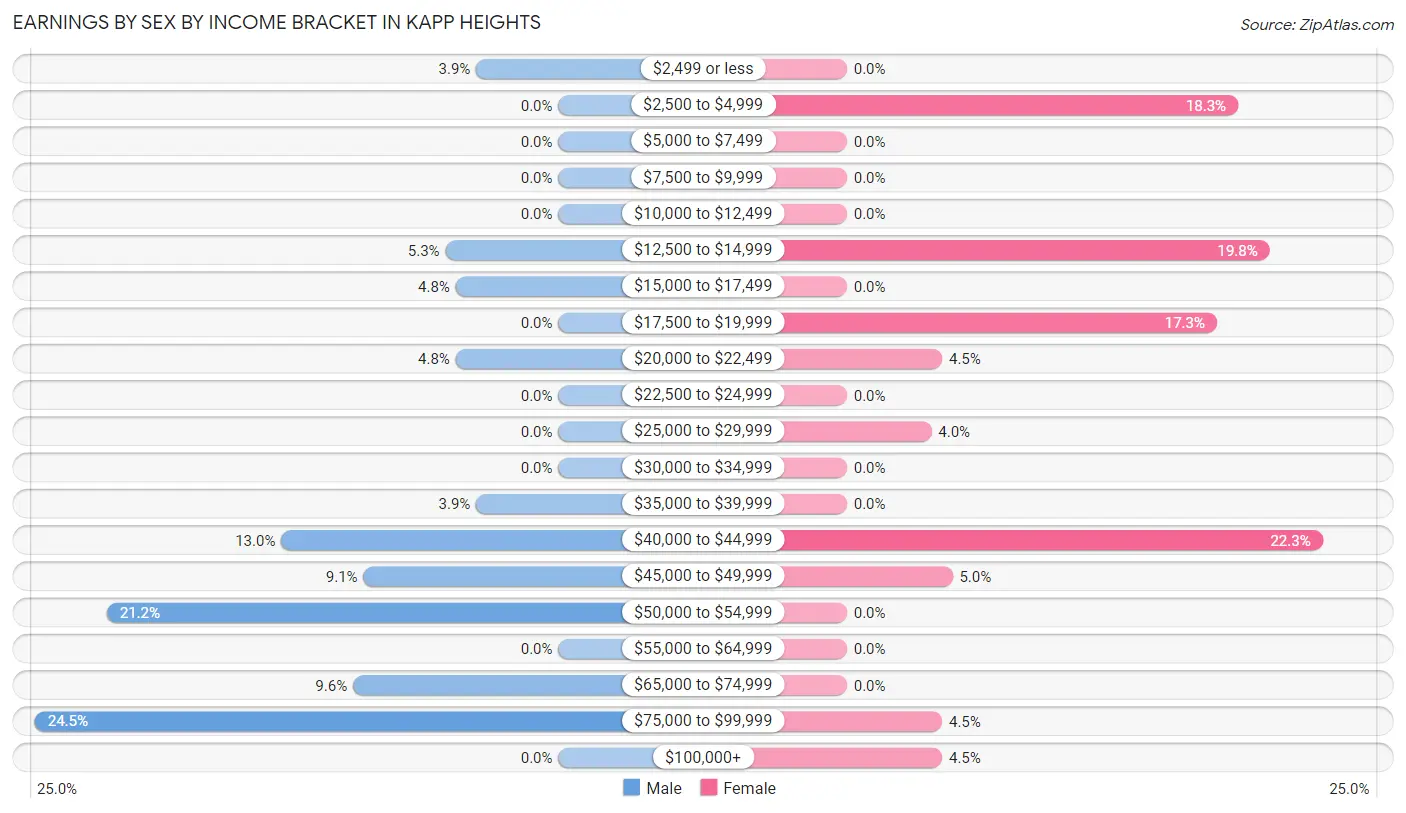
| Income | Male | Female |
| $2,499 or less | 8 (3.8%) | 0 (0.0%) |
| $2,500 to $4,999 | 0 (0.0%) | 37 (18.3%) |
| $5,000 to $7,499 | 0 (0.0%) | 0 (0.0%) |
| $7,500 to $9,999 | 0 (0.0%) | 0 (0.0%) |
| $10,000 to $12,499 | 0 (0.0%) | 0 (0.0%) |
| $12,500 to $14,999 | 11 (5.3%) | 40 (19.8%) |
| $15,000 to $17,499 | 10 (4.8%) | 0 (0.0%) |
| $17,500 to $19,999 | 0 (0.0%) | 35 (17.3%) |
| $20,000 to $22,499 | 10 (4.8%) | 9 (4.5%) |
| $22,500 to $24,999 | 0 (0.0%) | 0 (0.0%) |
| $25,000 to $29,999 | 0 (0.0%) | 8 (4.0%) |
| $30,000 to $34,999 | 0 (0.0%) | 0 (0.0%) |
| $35,000 to $39,999 | 8 (3.8%) | 0 (0.0%) |
| $40,000 to $44,999 | 27 (13.0%) | 45 (22.3%) |
| $45,000 to $49,999 | 19 (9.1%) | 10 (5.0%) |
| $50,000 to $54,999 | 44 (21.1%) | 0 (0.0%) |
| $55,000 to $64,999 | 0 (0.0%) | 0 (0.0%) |
| $65,000 to $74,999 | 20 (9.6%) | 0 (0.0%) |
| $75,000 to $99,999 | 51 (24.5%) | 9 (4.5%) |
| $100,000+ | 0 (0.0%) | 9 (4.5%) |
| Total | 208 (100.0%) | 202 (100.0%) |
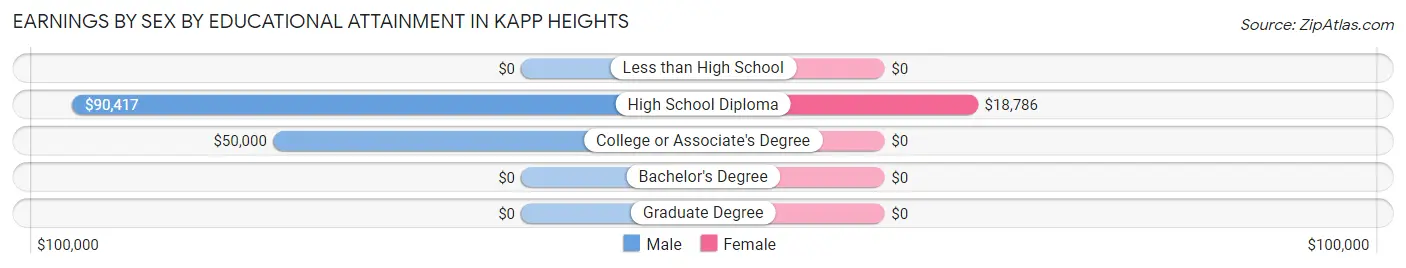
Earnings by Sex by Educational Attainment in Kapp Heights
Average earnings in Kapp Heights are $50,852 for men and $19,857 for women, a difference of 61.0%. Men with an educational attainment of high school diploma enjoy the highest average annual earnings of $90,417, while those with college or associate's degree education earn the least with $50,000. Women with an educational attainment of high school diploma earn the most with the average annual earnings of $18,786, while those with high school diploma education have the smallest earnings of $18,786.
| Educational Attainment | Male Income | Female Income |
| Less than High School | - | - |
| High School Diploma | $90,417 | $18,786 |
| College or Associate's Degree | $50,000 | $0 |
| Bachelor's Degree | - | - |
| Graduate Degree | - | - |
| Total | $50,852 | $19,857 |
Family Income in Kapp Heights
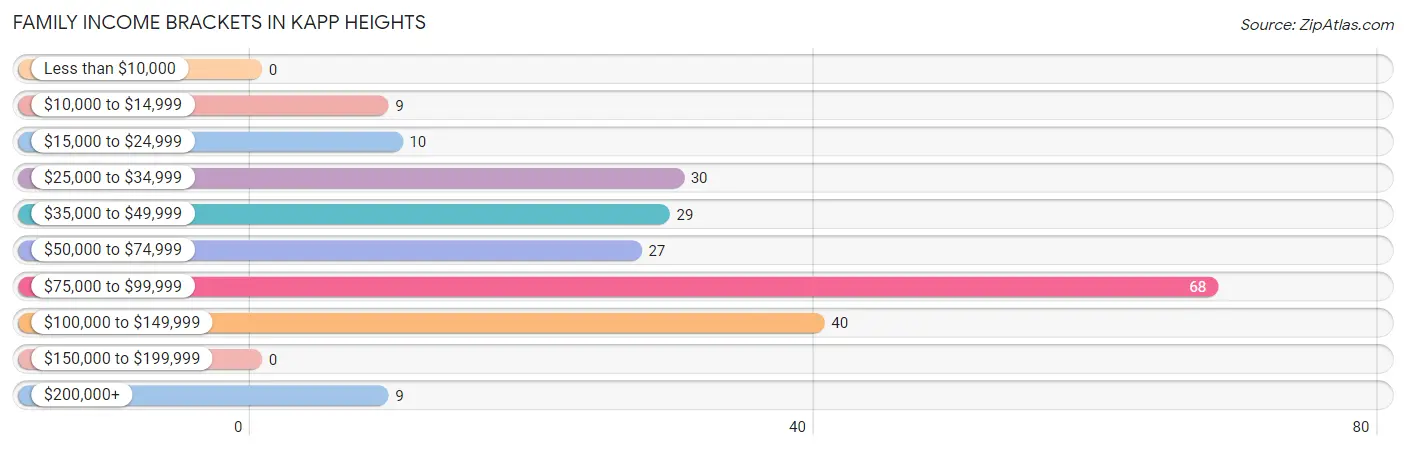
Family Income Brackets in Kapp Heights
According to the Kapp Heights family income data, there are 68 families falling into the $75,000 to $99,999 income range, which is the most common income bracket and makes up 30.6% of all families.
| Income Bracket | # Families | % Families |
| Less than $10,000 | 0 | 0.0% |
| $10,000 to $14,999 | 9 | 4.1% |
| $15,000 to $24,999 | 10 | 4.5% |
| $25,000 to $34,999 | 30 | 13.5% |
| $35,000 to $49,999 | 29 | 13.1% |
| $50,000 to $74,999 | 27 | 12.2% |
| $75,000 to $99,999 | 68 | 30.6% |
| $100,000 to $149,999 | 40 | 18.0% |
| $150,000 to $199,999 | 0 | 0.0% |
| $200,000+ | 9 | 4.1% |
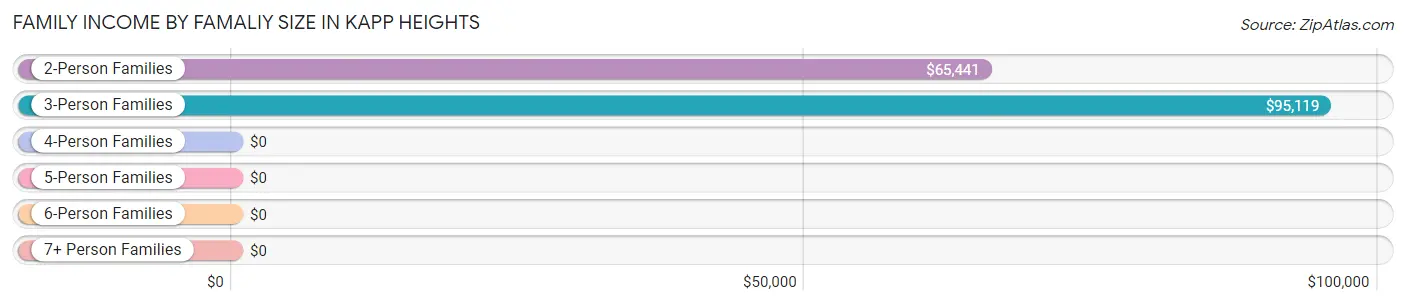
Family Income by Famaliy Size in Kapp Heights
3-person families (40 | 18.0%) account for the highest median family income in Kapp Heights with $95,119 per family, while 2-person families (144 | 64.9%) have the highest median income of $32,720 per family member.
| Income Bracket | # Families | Median Income |
| 2-Person Families | 144 (64.9%) | $65,441 |
| 3-Person Families | 40 (18.0%) | $95,119 |
| 4-Person Families | 19 (8.6%) | $0 |
| 5-Person Families | 19 (8.6%) | $0 |
| 6-Person Families | 0 (0.0%) | $0 |
| 7+ Person Families | 0 (0.0%) | $0 |
| Total | 222 (100.0%) | $76,667 |
Family Income by Number of Earners in Kapp Heights
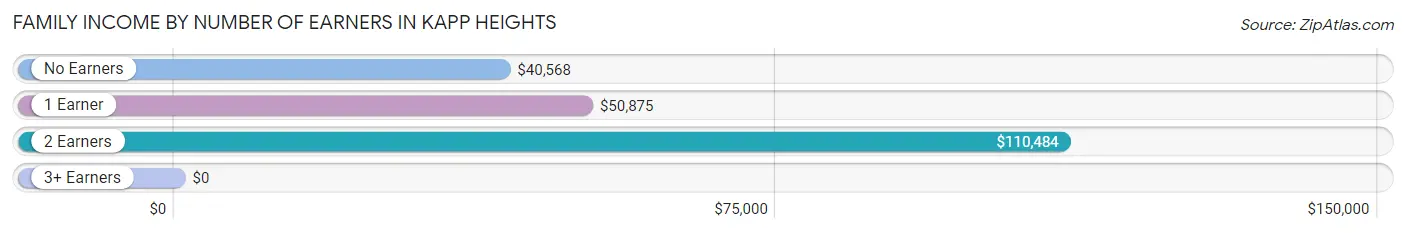
| Number of Earners | # Families | Median Income |
| No Earners | 66 (29.7%) | $40,568 |
| 1 Earner | 49 (22.1%) | $50,875 |
| 2 Earners | 86 (38.7%) | $110,484 |
| 3+ Earners | 21 (9.5%) | $0 |
| Total | 222 (100.0%) | $76,667 |
Household Income in Kapp Heights
Household Income Brackets in Kapp Heights
With 106 households falling in the category, the $75,000 to $99,999 income range is the most frequent in Kapp Heights, accounting for 28.3% of all households.
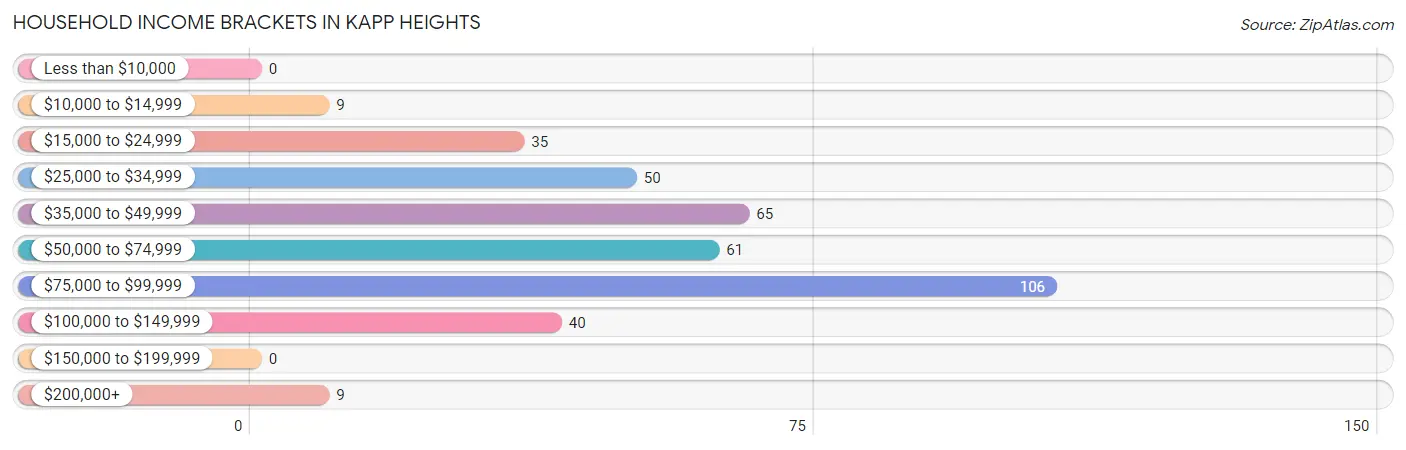
| Income Bracket | # Households | % Households |
| Less than $10,000 | 0 | 0.0% |
| $10,000 to $14,999 | 9 | 2.4% |
| $15,000 to $24,999 | 35 | 9.3% |
| $25,000 to $34,999 | 50 | 13.3% |
| $35,000 to $49,999 | 65 | 17.3% |
| $50,000 to $74,999 | 61 | 16.3% |
| $75,000 to $99,999 | 106 | 28.3% |
| $100,000 to $149,999 | 40 | 10.7% |
| $150,000 to $199,999 | 0 | 0.0% |
| $200,000+ | 9 | 2.4% |
Household Income by Householder Age in Kapp Heights
The median household income in Kapp Heights is $55,815, with the highest median household income of $85,114 found in the 25 to 44 years age bracket for the primary householder. A total of 39 households (10.4%) fall into this category.
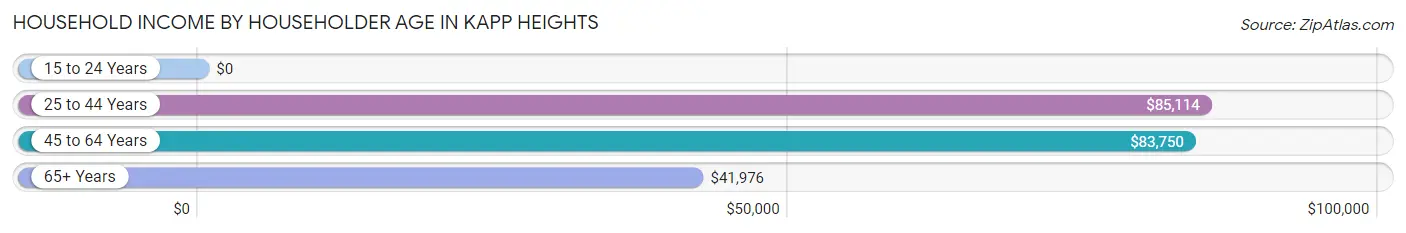
| Income Bracket | # Households | Median Income |
| 15 to 24 Years | 0 (0.0%) | $0 |
| 25 to 44 Years | 39 (10.4%) | $85,114 |
| 45 to 64 Years | 167 (44.5%) | $83,750 |
| 65+ Years | 169 (45.1%) | $41,976 |
| Total | 375 (100.0%) | $55,815 |
Poverty in Kapp Heights
Income Below Poverty by Sex and Age in Kapp Heights
With 4.7% poverty level for males and 2.5% for females among the residents of Kapp Heights, under 5 year old males and 35 to 44 year old females are the most vulnerable to poverty, with 10 males (100.0%) and 9 females (32.1%) in their respective age groups living below the poverty level.
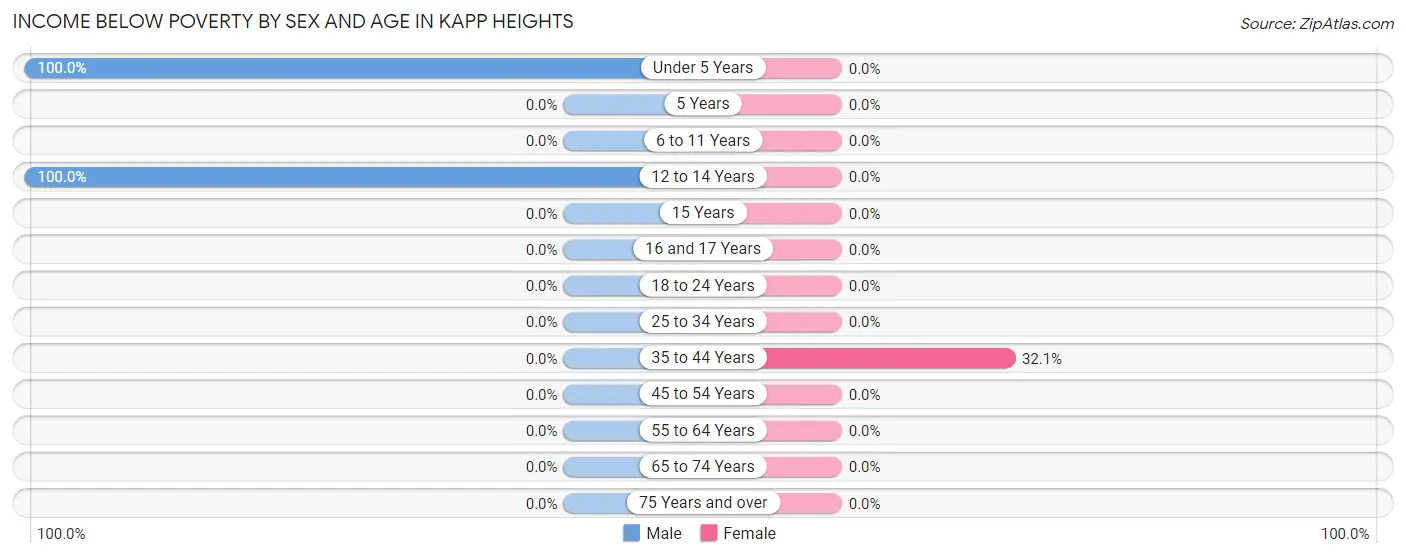
| Age Bracket | Male | Female |
| Under 5 Years | 10 (100.0%) | 0 (0.0%) |
| 5 Years | 0 (0.0%) | 0 (0.0%) |
| 6 to 11 Years | 0 (0.0%) | 0 (0.0%) |
| 12 to 14 Years | 9 (100.0%) | 0 (0.0%) |
| 15 Years | 0 (0.0%) | 0 (0.0%) |
| 16 and 17 Years | 0 (0.0%) | 0 (0.0%) |
| 18 to 24 Years | 0 (0.0%) | 0 (0.0%) |
| 25 to 34 Years | 0 (0.0%) | 0 (0.0%) |
| 35 to 44 Years | 0 (0.0%) | 9 (32.1%) |
| 45 to 54 Years | 0 (0.0%) | 0 (0.0%) |
| 55 to 64 Years | 0 (0.0%) | 0 (0.0%) |
| 65 to 74 Years | 0 (0.0%) | 0 (0.0%) |
| 75 Years and over | 0 (0.0%) | 0 (0.0%) |
| Total | 19 (4.7%) | 9 (2.5%) |
Income Above Poverty by Sex and Age in Kapp Heights
According to the poverty statistics in Kapp Heights, males aged 6 to 11 years and females aged 6 to 11 years are the age groups that are most secure financially, with 100.0% of males and 100.0% of females in these age groups living above the poverty line.
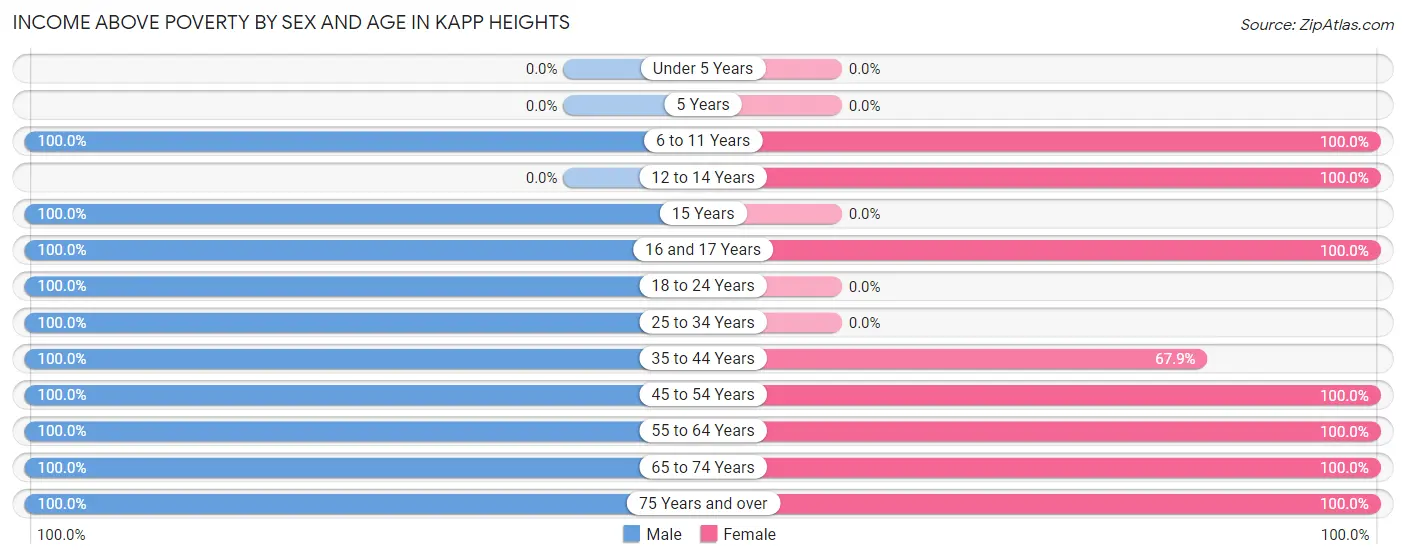
| Age Bracket | Male | Female |
| Under 5 Years | 0 (0.0%) | 0 (0.0%) |
| 5 Years | 0 (0.0%) | 0 (0.0%) |
| 6 to 11 Years | 28 (100.0%) | 23 (100.0%) |
| 12 to 14 Years | 0 (0.0%) | 9 (100.0%) |
| 15 Years | 12 (100.0%) | 0 (0.0%) |
| 16 and 17 Years | 12 (100.0%) | 18 (100.0%) |
| 18 to 24 Years | 8 (100.0%) | 0 (0.0%) |
| 25 to 34 Years | 9 (100.0%) | 0 (0.0%) |
| 35 to 44 Years | 33 (100.0%) | 19 (67.9%) |
| 45 to 54 Years | 79 (100.0%) | 102 (100.0%) |
| 55 to 64 Years | 79 (100.0%) | 46 (100.0%) |
| 65 to 74 Years | 38 (100.0%) | 76 (100.0%) |
| 75 Years and over | 88 (100.0%) | 58 (100.0%) |
| Total | 386 (95.3%) | 351 (97.5%) |
Income Below Poverty Among Married-Couple Families in Kapp Heights
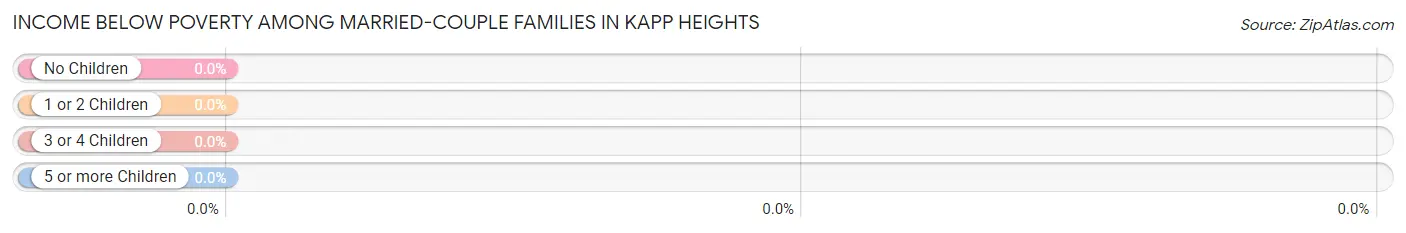
| Children | Above Poverty | Below Poverty |
| No Children | 143 (100.0%) | 0 (0.0%) |
| 1 or 2 Children | 49 (100.0%) | 0 (0.0%) |
| 3 or 4 Children | 10 (100.0%) | 0 (0.0%) |
| 5 or more Children | 0 (0.0%) | 0 (0.0%) |
| Total | 202 (100.0%) | 0 (0.0%) |
Income Below Poverty Among Single-Parent Households in Kapp Heights
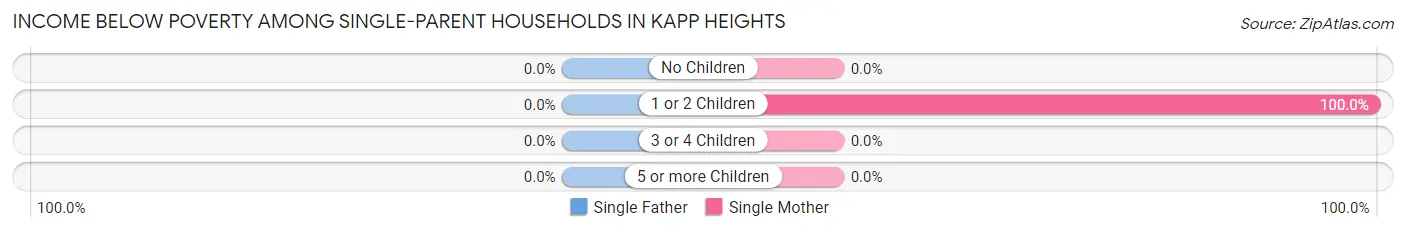
| Children | Single Father | Single Mother |
| No Children | 0 (0.0%) | 0 (0.0%) |
| 1 or 2 Children | 0 (0.0%) | 9 (100.0%) |
| 3 or 4 Children | 0 (0.0%) | 0 (0.0%) |
| 5 or more Children | 0 (0.0%) | 0 (0.0%) |
| Total | 0 (0.0%) | 9 (100.0%) |
Income Below Poverty Among Married-Couple vs Single-Parent Households in Kapp Heights
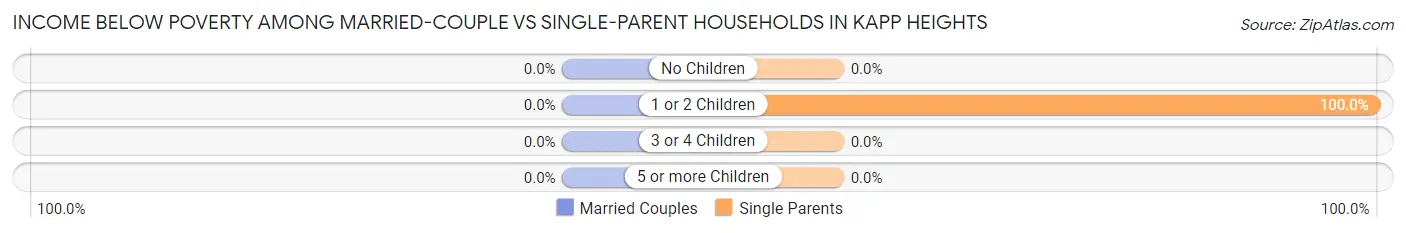
| Children | Married-Couple Families | Single-Parent Households |
| No Children | 0 (0.0%) | 0 (0.0%) |
| 1 or 2 Children | 0 (0.0%) | 9 (100.0%) |
| 3 or 4 Children | 0 (0.0%) | 0 (0.0%) |
| 5 or more Children | 0 (0.0%) | 0 (0.0%) |
| Total | 0 (0.0%) | 9 (45.0%) |
Employment Characteristics in Kapp Heights
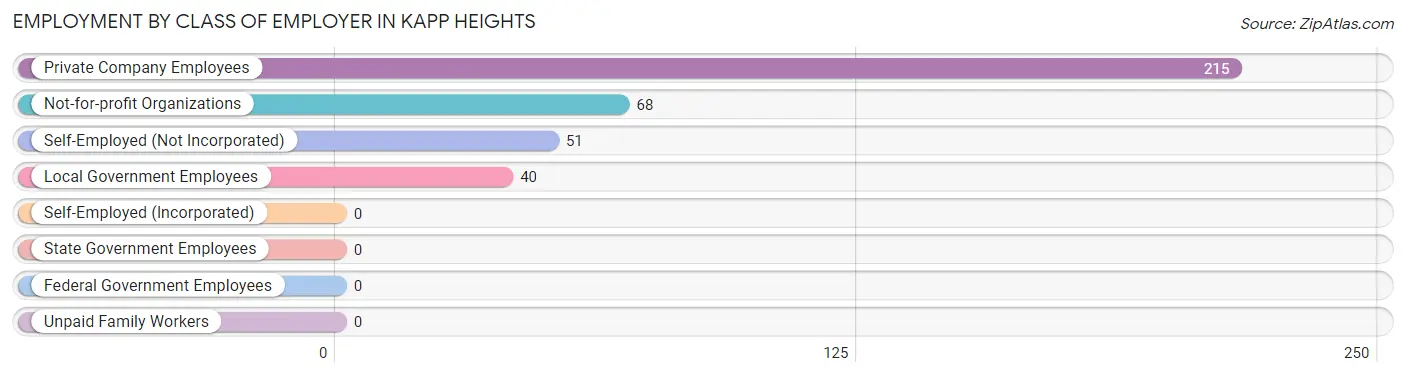
Employment by Class of Employer in Kapp Heights
Among the 374 employed individuals in Kapp Heights, private company employees (215 | 57.5%), not-for-profit organizations (68 | 18.2%), and self-employed (not incorporated) (51 | 13.6%) make up the most common classes of employment.
| Employer Class | # Employees | % Employees |
| Private Company Employees | 215 | 57.5% |
| Self-Employed (Incorporated) | 0 | 0.0% |
| Self-Employed (Not Incorporated) | 51 | 13.6% |
| Not-for-profit Organizations | 68 | 18.2% |
| Local Government Employees | 40 | 10.7% |
| State Government Employees | 0 | 0.0% |
| Federal Government Employees | 0 | 0.0% |
| Unpaid Family Workers | 0 | 0.0% |
| Total | 374 | 100.0% |
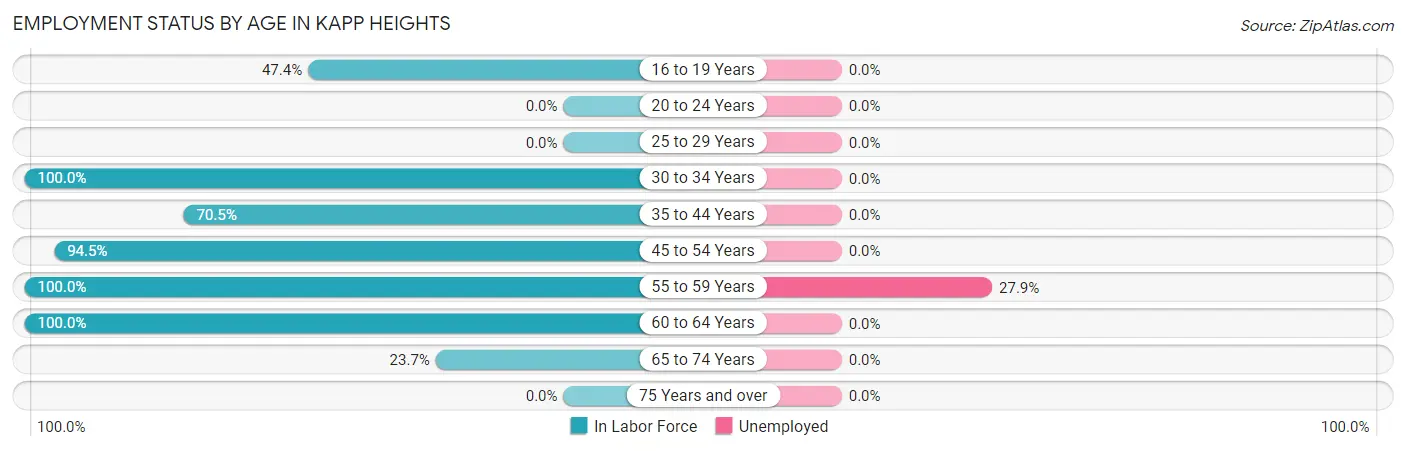
Employment Status by Age in Kapp Heights
According to the labor force statistics for Kapp Heights, out of the total population over 16 years of age (674), 58.3% or 393 individuals are in the labor force, with 4.8% or 19 of them unemployed. The age group with the highest labor force participation rate is 30 to 34 years, with 100.0% or 9 individuals in the labor force. Within the labor force, the 55 to 59 years age range has the highest percentage of unemployed individuals, with 27.9% or 19 of them being unemployed.
| Age Bracket | In Labor Force | Unemployed |
| 16 to 19 Years | 18 (47.4%) | 0 (0.0%) |
| 20 to 24 Years | 0 (0.0%) | 0 (0.0%) |
| 25 to 29 Years | 0 (0.0%) | 0 (0.0%) |
| 30 to 34 Years | 9 (100.0%) | 0 (0.0%) |
| 35 to 44 Years | 43 (70.5%) | 0 (0.0%) |
| 45 to 54 Years | 171 (94.5%) | 0 (0.0%) |
| 55 to 59 Years | 68 (100.0%) | 19 (27.9%) |
| 60 to 64 Years | 57 (100.0%) | 0 (0.0%) |
| 65 to 74 Years | 27 (23.7%) | 0 (0.0%) |
| 75 Years and over | 0 (0.0%) | 0 (0.0%) |
| Total | 393 (58.3%) | 19 (4.8%) |
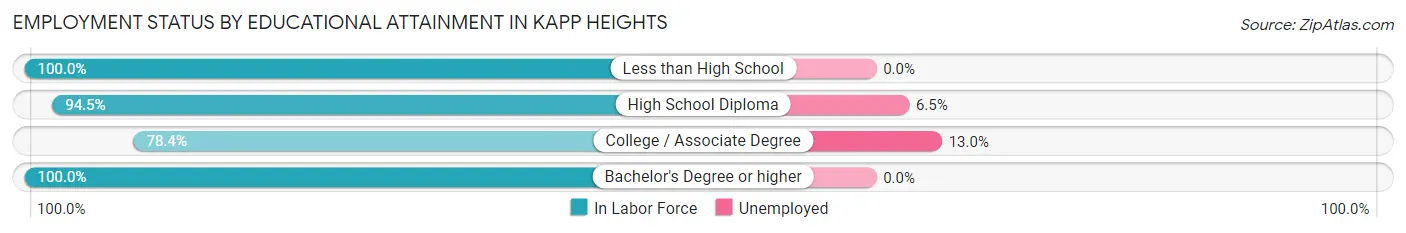
Employment Status by Educational Attainment in Kapp Heights
According to labor force statistics for Kapp Heights, 92.6% of individuals (348) out of the total population between 25 and 64 years of age (376) are in the labor force, with 5.5% or 19 of them being unemployed. The group with the highest labor force participation rate are those with the educational attainment of less than high school, with 100.0% or 24 individuals in the labor force. Within the labor force, individuals with college / associate degree education have the highest percentage of unemployment, with 13.0% or 9 of them being unemployed.
| Educational Attainment | In Labor Force | Unemployed |
| Less than High School | 24 (100.0%) | 0 (0.0%) |
| High School Diploma | 155 (94.5%) | 11 (6.5%) |
| College / Associate Degree | 69 (78.4%) | 11 (13.0%) |
| Bachelor's Degree or higher | 100 (100.0%) | 0 (0.0%) |
| Total | 348 (92.6%) | 21 (5.5%) |
Employment Occupations by Sex in Kapp Heights
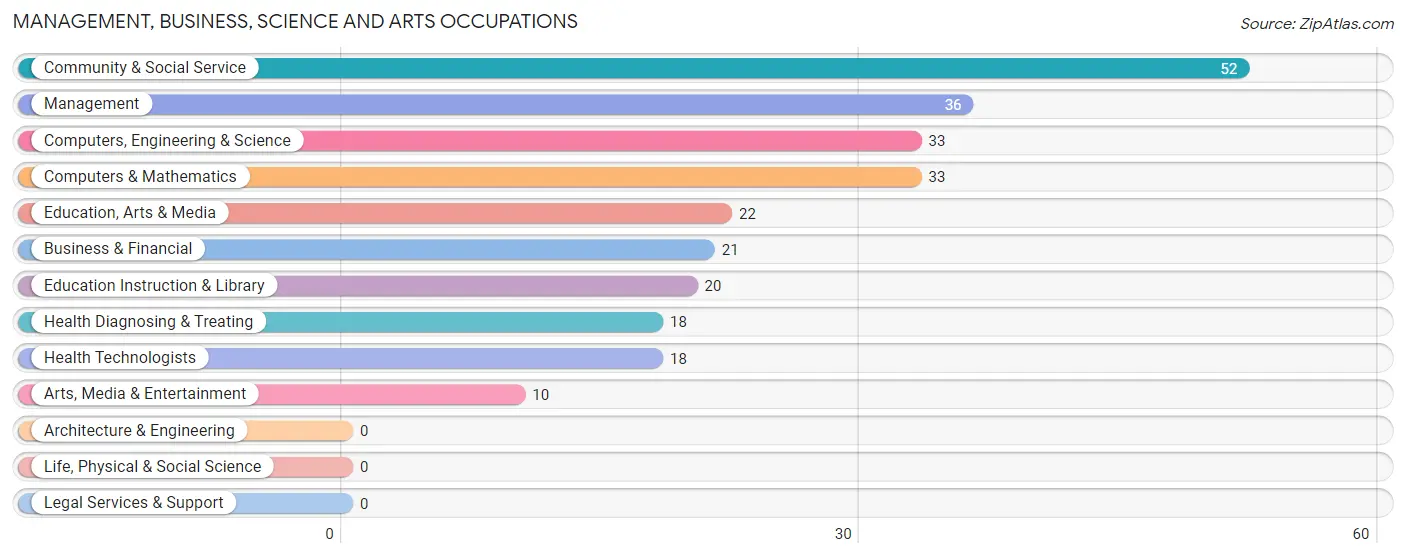
Management, Business, Science and Arts Occupations
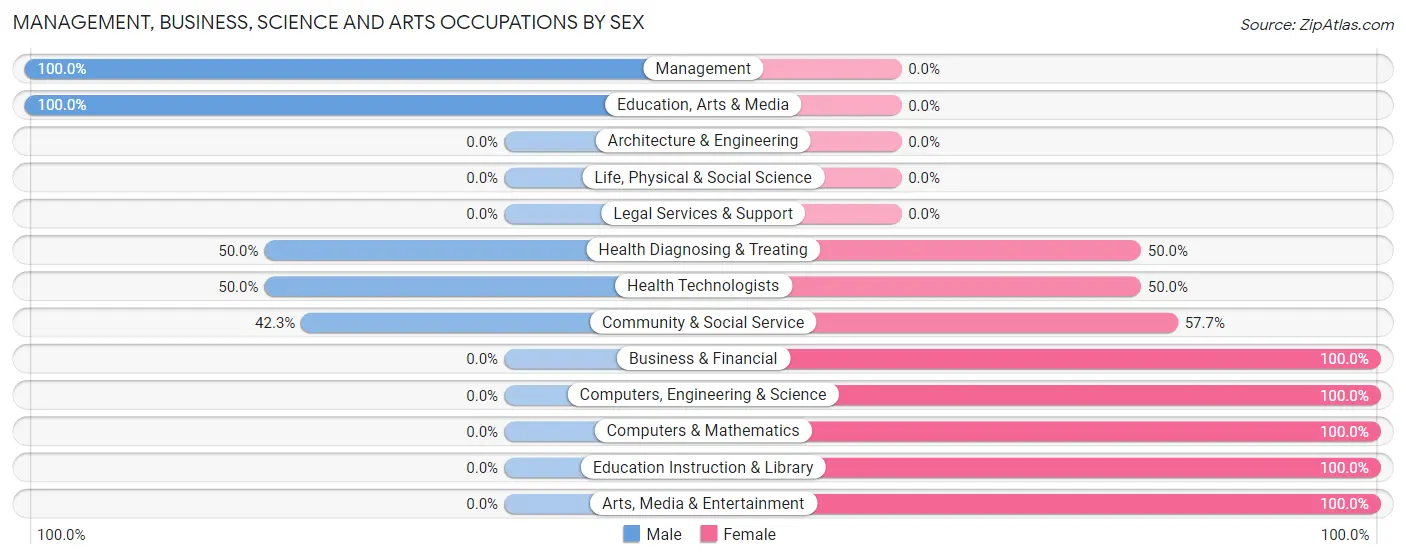
The most common Management, Business, Science and Arts occupations in Kapp Heights are Community & Social Service (52 | 13.9%), Management (36 | 9.6%), Computers, Engineering & Science (33 | 8.8%), Computers & Mathematics (33 | 8.8%), and Education, Arts & Media (22 | 5.9%).
Management, Business, Science and Arts Occupations by Sex
Within the Management, Business, Science and Arts occupations in Kapp Heights, the most male-oriented occupations are Management (100.0%), Education, Arts & Media (100.0%), and Health Diagnosing & Treating (50.0%), while the most female-oriented occupations are Business & Financial (100.0%), Computers, Engineering & Science (100.0%), and Computers & Mathematics (100.0%).
| Occupation | Male | Female |
| Management | 36 (100.0%) | 0 (0.0%) |
| Business & Financial | 0 (0.0%) | 21 (100.0%) |
| Computers, Engineering & Science | 0 (0.0%) | 33 (100.0%) |
| Computers & Mathematics | 0 (0.0%) | 33 (100.0%) |
| Architecture & Engineering | 0 (0.0%) | 0 (0.0%) |
| Life, Physical & Social Science | 0 (0.0%) | 0 (0.0%) |
| Community & Social Service | 22 (42.3%) | 30 (57.7%) |
| Education, Arts & Media | 22 (100.0%) | 0 (0.0%) |
| Legal Services & Support | 0 (0.0%) | 0 (0.0%) |
| Education Instruction & Library | 0 (0.0%) | 20 (100.0%) |
| Arts, Media & Entertainment | 0 (0.0%) | 10 (100.0%) |
| Health Diagnosing & Treating | 9 (50.0%) | 9 (50.0%) |
| Health Technologists | 9 (50.0%) | 9 (50.0%) |
| Total (Category) | 67 (41.9%) | 93 (58.1%) |
| Total (Overall) | 191 (51.1%) | 183 (48.9%) |
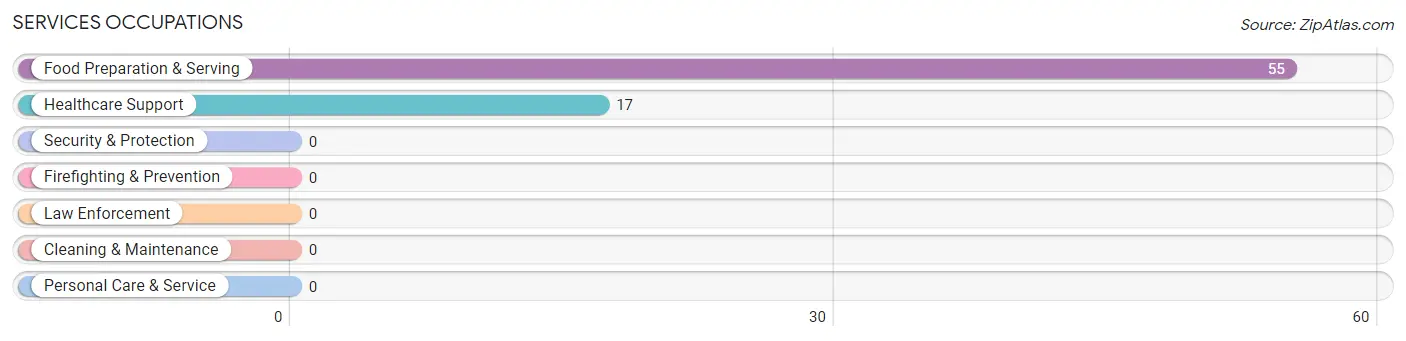
Services Occupations
The most common Services occupations in Kapp Heights are Food Preparation & Serving (55 | 14.7%), and Healthcare Support (17 | 4.5%).
Services Occupations by Sex
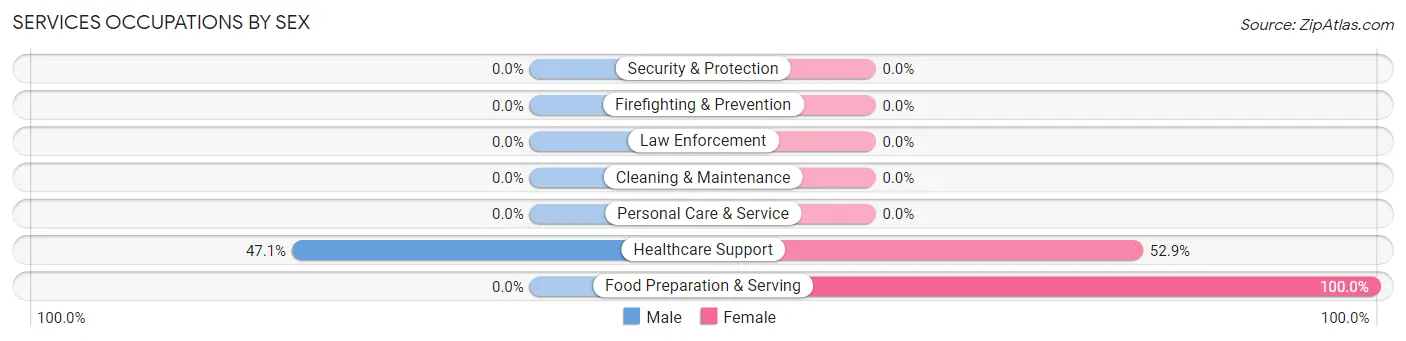
| Occupation | Male | Female |
| Healthcare Support | 8 (47.1%) | 9 (52.9%) |
| Security & Protection | 0 (0.0%) | 0 (0.0%) |
| Firefighting & Prevention | 0 (0.0%) | 0 (0.0%) |
| Law Enforcement | 0 (0.0%) | 0 (0.0%) |
| Food Preparation & Serving | 0 (0.0%) | 55 (100.0%) |
| Cleaning & Maintenance | 0 (0.0%) | 0 (0.0%) |
| Personal Care & Service | 0 (0.0%) | 0 (0.0%) |
| Total (Category) | 8 (11.1%) | 64 (88.9%) |
| Total (Overall) | 191 (51.1%) | 183 (48.9%) |
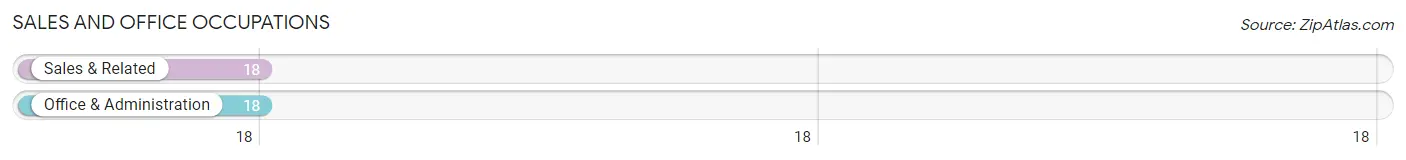
Sales and Office Occupations
The most common Sales and Office occupations in Kapp Heights are Sales & Related (18 | 4.8%), and Office & Administration (18 | 4.8%).
Sales and Office Occupations by Sex
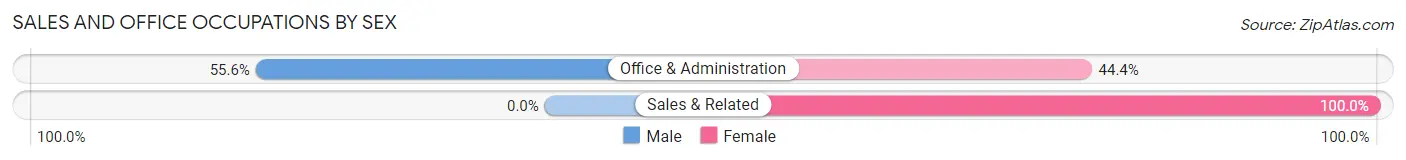
| Occupation | Male | Female |
| Sales & Related | 0 (0.0%) | 18 (100.0%) |
| Office & Administration | 10 (55.6%) | 8 (44.4%) |
| Total (Category) | 10 (27.8%) | 26 (72.2%) |
| Total (Overall) | 191 (51.1%) | 183 (48.9%) |
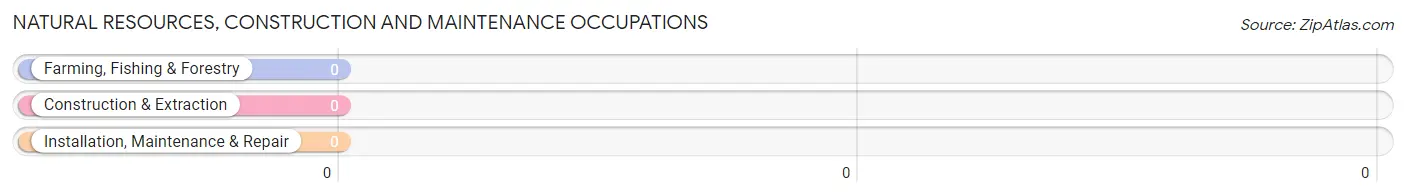
Natural Resources, Construction and Maintenance Occupations
Natural Resources, Construction and Maintenance Occupations by Sex
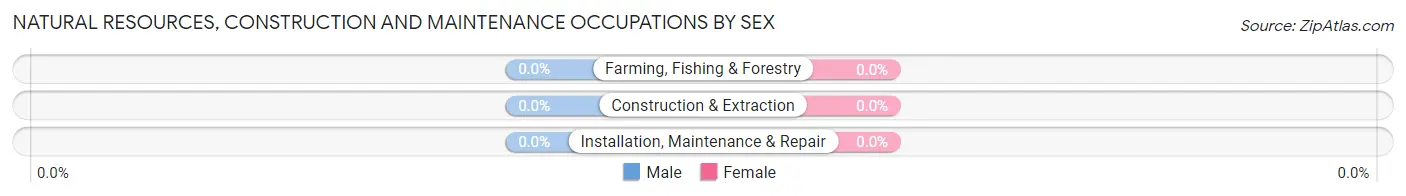
| Occupation | Male | Female |
| Farming, Fishing & Forestry | 0 (0.0%) | 0 (0.0%) |
| Construction & Extraction | 0 (0.0%) | 0 (0.0%) |
| Installation, Maintenance & Repair | 0 (0.0%) | 0 (0.0%) |
| Total (Category) | 0 (0.0%) | 0 (0.0%) |
| Total (Overall) | 191 (51.1%) | 183 (48.9%) |
Production, Transportation and Moving Occupations
The most common Production, Transportation and Moving occupations in Kapp Heights are Production (52 | 13.9%), Material Moving (34 | 9.1%), and Transportation (20 | 5.3%).
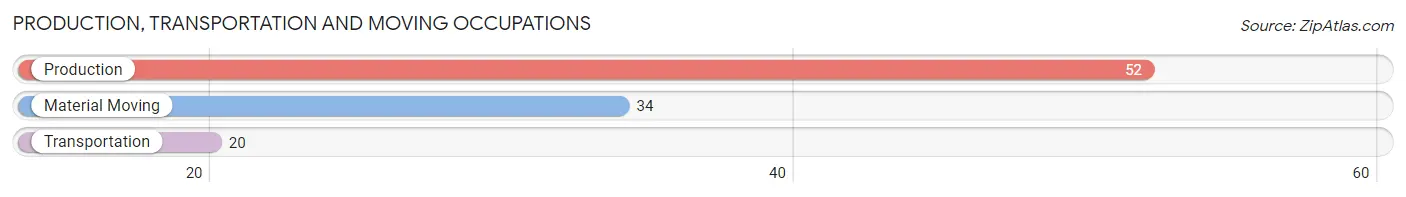
Production, Transportation and Moving Occupations by Sex
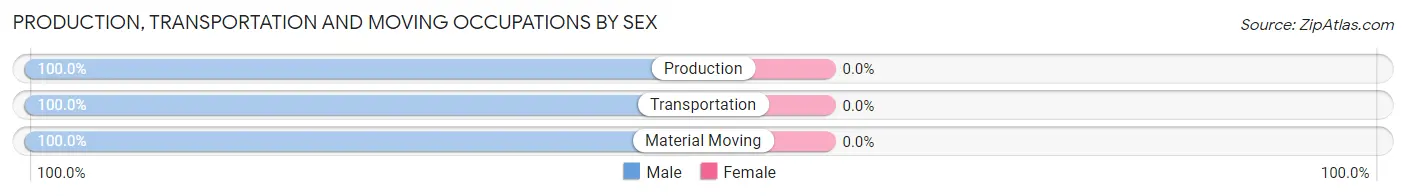
| Occupation | Male | Female |
| Production | 52 (100.0%) | 0 (0.0%) |
| Transportation | 20 (100.0%) | 0 (0.0%) |
| Material Moving | 34 (100.0%) | 0 (0.0%) |
| Total (Category) | 106 (100.0%) | 0 (0.0%) |
| Total (Overall) | 191 (51.1%) | 183 (48.9%) |
Employment Industries by Sex in Kapp Heights
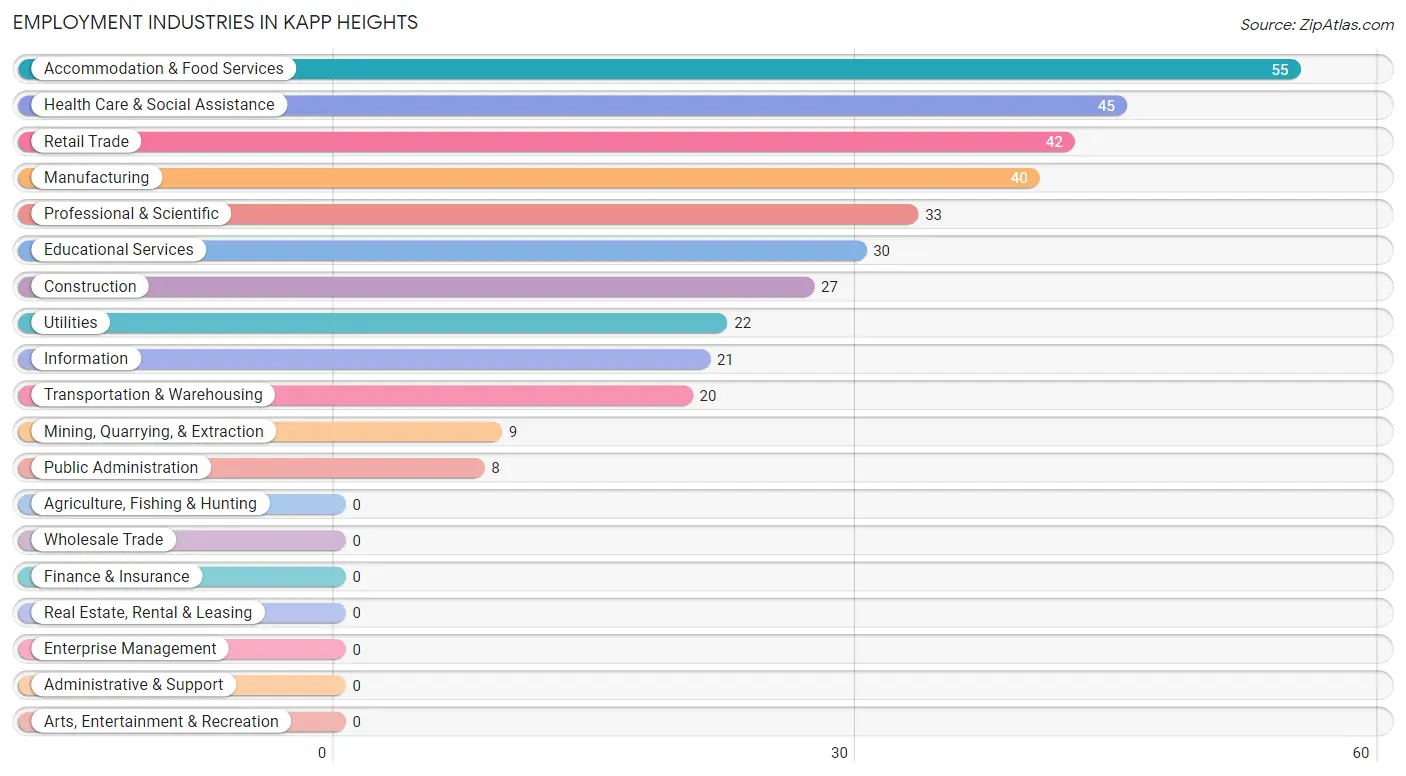
Employment Industries in Kapp Heights
The major employment industries in Kapp Heights include Accommodation & Food Services (55 | 14.7%), Health Care & Social Assistance (45 | 12.0%), Retail Trade (42 | 11.2%), Manufacturing (40 | 10.7%), and Professional & Scientific (33 | 8.8%).
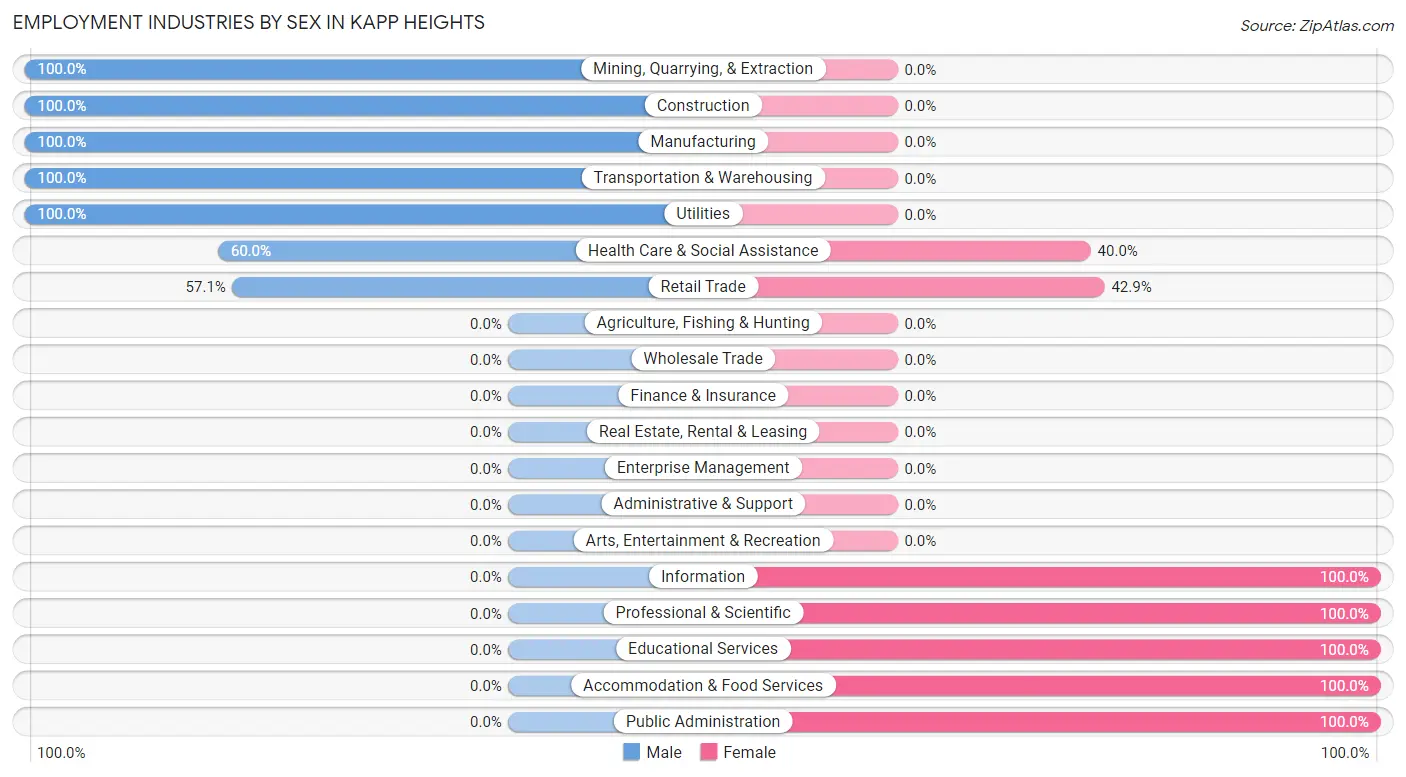
Employment Industries by Sex in Kapp Heights
The Kapp Heights industries that see more men than women are Mining, Quarrying, & Extraction (100.0%), Construction (100.0%), and Manufacturing (100.0%), whereas the industries that tend to have a higher number of women are Information (100.0%), Professional & Scientific (100.0%), and Educational Services (100.0%).
| Industry | Male | Female |
| Agriculture, Fishing & Hunting | 0 (0.0%) | 0 (0.0%) |
| Mining, Quarrying, & Extraction | 9 (100.0%) | 0 (0.0%) |
| Construction | 27 (100.0%) | 0 (0.0%) |
| Manufacturing | 40 (100.0%) | 0 (0.0%) |
| Wholesale Trade | 0 (0.0%) | 0 (0.0%) |
| Retail Trade | 24 (57.1%) | 18 (42.9%) |
| Transportation & Warehousing | 20 (100.0%) | 0 (0.0%) |
| Utilities | 22 (100.0%) | 0 (0.0%) |
| Information | 0 (0.0%) | 21 (100.0%) |
| Finance & Insurance | 0 (0.0%) | 0 (0.0%) |
| Real Estate, Rental & Leasing | 0 (0.0%) | 0 (0.0%) |
| Professional & Scientific | 0 (0.0%) | 33 (100.0%) |
| Enterprise Management | 0 (0.0%) | 0 (0.0%) |
| Administrative & Support | 0 (0.0%) | 0 (0.0%) |
| Educational Services | 0 (0.0%) | 30 (100.0%) |
| Health Care & Social Assistance | 27 (60.0%) | 18 (40.0%) |
| Arts, Entertainment & Recreation | 0 (0.0%) | 0 (0.0%) |
| Accommodation & Food Services | 0 (0.0%) | 55 (100.0%) |
| Public Administration | 0 (0.0%) | 8 (100.0%) |
| Total | 191 (51.1%) | 183 (48.9%) |
Education in Kapp Heights
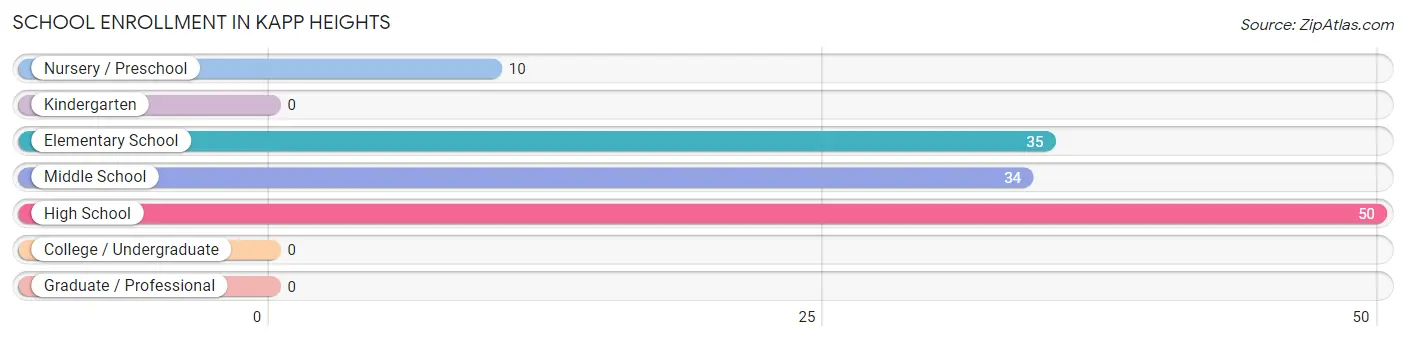
School Enrollment in Kapp Heights
The most common levels of schooling among the 129 students in Kapp Heights are high school (50 | 38.8%), elementary school (35 | 27.1%), and middle school (34 | 26.4%).
| School Level | # Students | % Students |
| Nursery / Preschool | 10 | 7.7% |
| Kindergarten | 0 | 0.0% |
| Elementary School | 35 | 27.1% |
| Middle School | 34 | 26.4% |
| High School | 50 | 38.8% |
| College / Undergraduate | 0 | 0.0% |
| Graduate / Professional | 0 | 0.0% |
| Total | 129 | 100.0% |
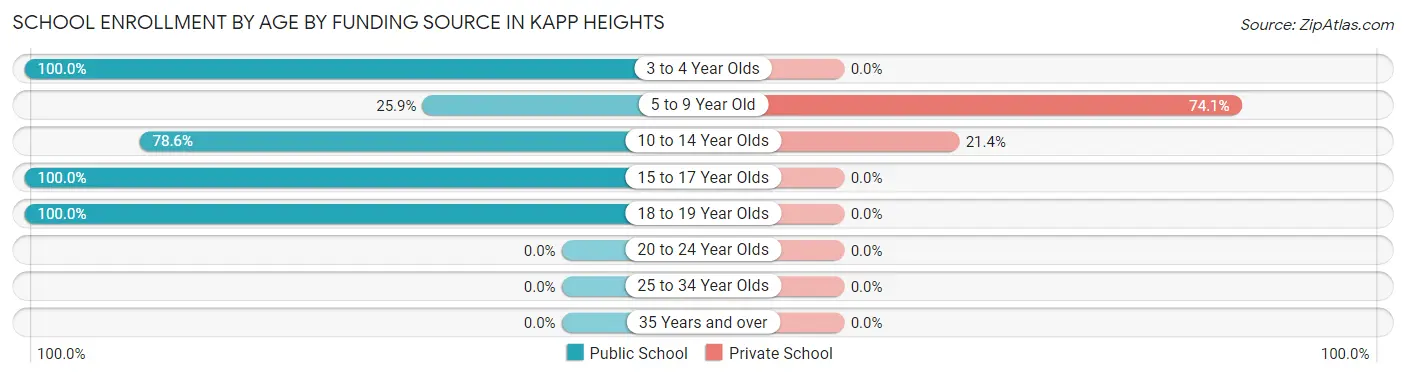
School Enrollment by Age by Funding Source in Kapp Heights
Out of a total of 129 students who are enrolled in schools in Kapp Heights, 29 (22.5%) attend a private institution, while the remaining 100 (77.5%) are enrolled in public schools. The age group of 5 to 9 year old has the highest likelihood of being enrolled in private schools, with 20 (74.1% in the age bracket) enrolled. Conversely, the age group of 3 to 4 year olds has the lowest likelihood of being enrolled in a private school, with 10 (100.0% in the age bracket) attending a public institution.
| Age Bracket | Public School | Private School |
| 3 to 4 Year Olds | 10 (100.0%) | 0 (0.0%) |
| 5 to 9 Year Old | 7 (25.9%) | 20 (74.1%) |
| 10 to 14 Year Olds | 33 (78.6%) | 9 (21.4%) |
| 15 to 17 Year Olds | 42 (100.0%) | 0 (0.0%) |
| 18 to 19 Year Olds | 8 (100.0%) | 0 (0.0%) |
| 20 to 24 Year Olds | 0 (0.0%) | 0 (0.0%) |
| 25 to 34 Year Olds | 0 (0.0%) | 0 (0.0%) |
| 35 Years and over | 0 (0.0%) | 0 (0.0%) |
| Total | 100 (77.5%) | 29 (22.5%) |
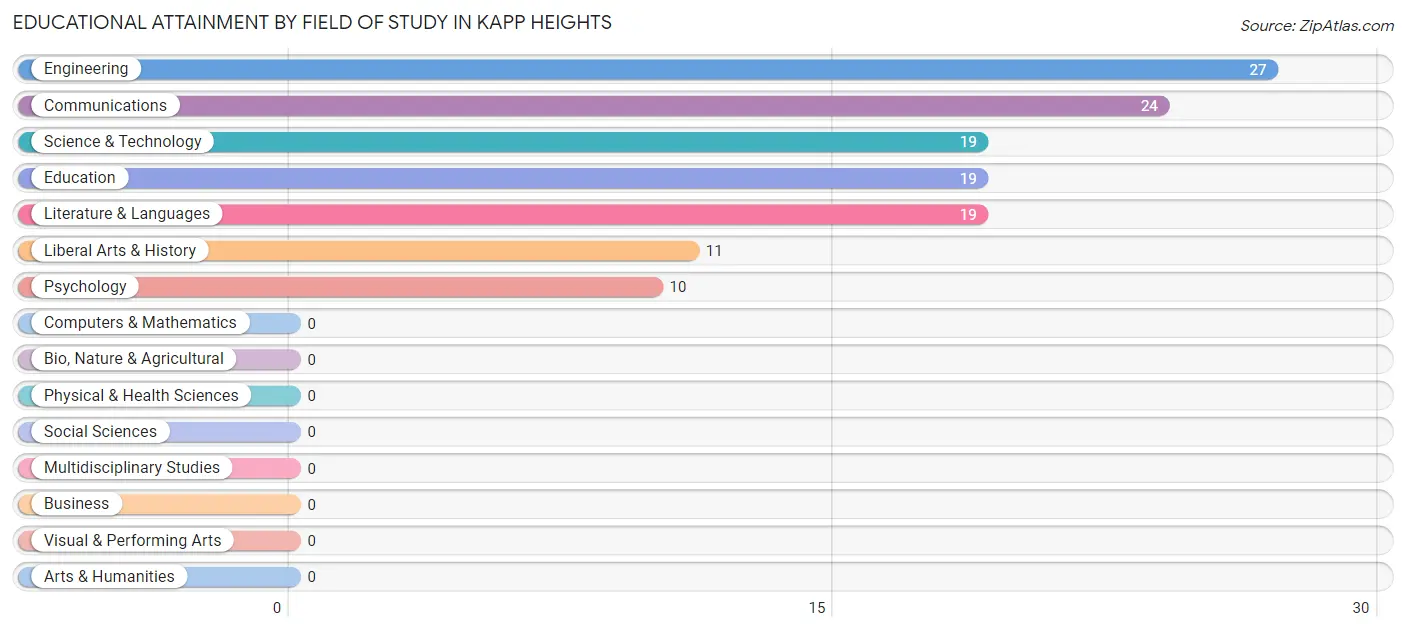
Educational Attainment by Field of Study in Kapp Heights
Engineering (27 | 20.9%), communications (24 | 18.6%), science & technology (19 | 14.7%), education (19 | 14.7%), and literature & languages (19 | 14.7%) are the most common fields of study among 129 individuals in Kapp Heights who have obtained a bachelor's degree or higher.
| Field of Study | # Graduates | % Graduates |
| Computers & Mathematics | 0 | 0.0% |
| Bio, Nature & Agricultural | 0 | 0.0% |
| Physical & Health Sciences | 0 | 0.0% |
| Psychology | 10 | 7.7% |
| Social Sciences | 0 | 0.0% |
| Engineering | 27 | 20.9% |
| Multidisciplinary Studies | 0 | 0.0% |
| Science & Technology | 19 | 14.7% |
| Business | 0 | 0.0% |
| Education | 19 | 14.7% |
| Literature & Languages | 19 | 14.7% |
| Liberal Arts & History | 11 | 8.5% |
| Visual & Performing Arts | 0 | 0.0% |
| Communications | 24 | 18.6% |
| Arts & Humanities | 0 | 0.0% |
| Total | 129 | 100.0% |
Transportation & Commute in Kapp Heights
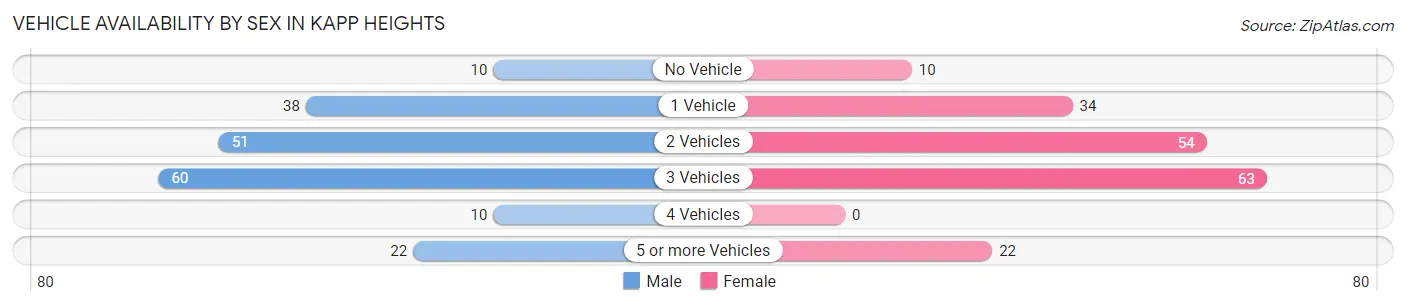
Vehicle Availability by Sex in Kapp Heights
The most prevalent vehicle ownership categories in Kapp Heights are males with 3 vehicles (60, accounting for 31.4%) and females with 3 vehicles (63, making up 32.8%).
| Vehicles Available | Male | Female |
| No Vehicle | 10 (5.2%) | 10 (5.5%) |
| 1 Vehicle | 38 (19.9%) | 34 (18.6%) |
| 2 Vehicles | 51 (26.7%) | 54 (29.5%) |
| 3 Vehicles | 60 (31.4%) | 63 (34.4%) |
| 4 Vehicles | 10 (5.2%) | 0 (0.0%) |
| 5 or more Vehicles | 22 (11.5%) | 22 (12.0%) |
| Total | 191 (100.0%) | 183 (100.0%) |
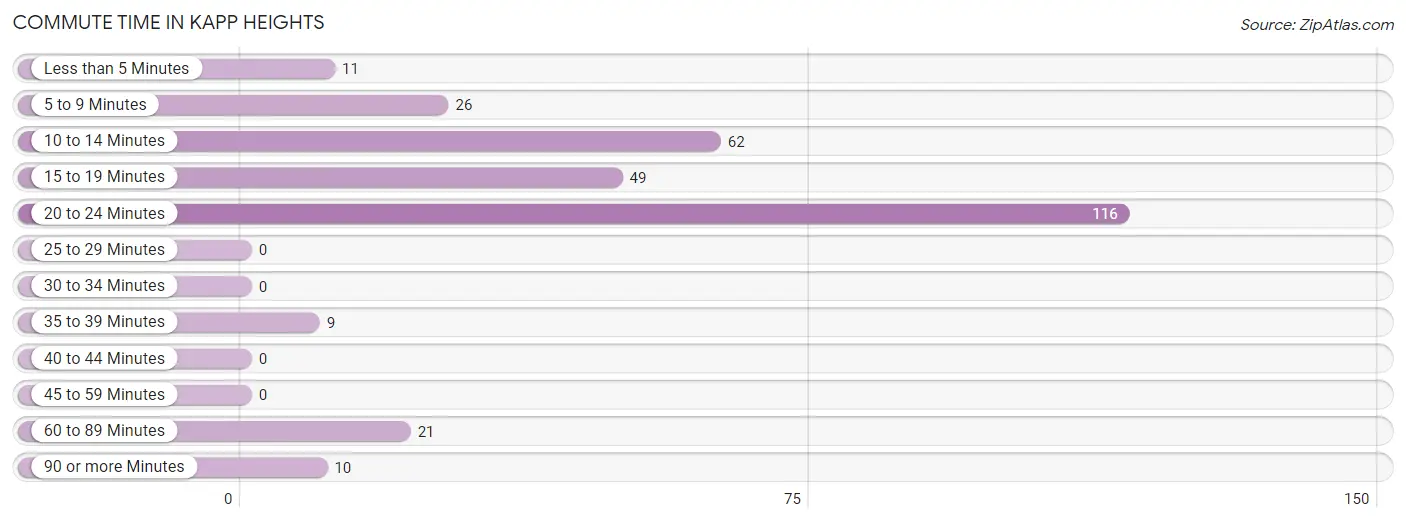
Commute Time in Kapp Heights
The most frequently occuring commute durations in Kapp Heights are 20 to 24 minutes (116 commuters, 38.2%), 10 to 14 minutes (62 commuters, 20.4%), and 15 to 19 minutes (49 commuters, 16.1%).
| Commute Time | # Commuters | % Commuters |
| Less than 5 Minutes | 11 | 3.6% |
| 5 to 9 Minutes | 26 | 8.6% |
| 10 to 14 Minutes | 62 | 20.4% |
| 15 to 19 Minutes | 49 | 16.1% |
| 20 to 24 Minutes | 116 | 38.2% |
| 25 to 29 Minutes | 0 | 0.0% |
| 30 to 34 Minutes | 0 | 0.0% |
| 35 to 39 Minutes | 9 | 3.0% |
| 40 to 44 Minutes | 0 | 0.0% |
| 45 to 59 Minutes | 0 | 0.0% |
| 60 to 89 Minutes | 21 | 6.9% |
| 90 or more Minutes | 10 | 3.3% |
Commute Time by Sex in Kapp Heights
The most common commute times in Kapp Heights are 20 to 24 minutes (63 commuters, 38.4%) for males and 20 to 24 minutes (53 commuters, 37.9%) for females.
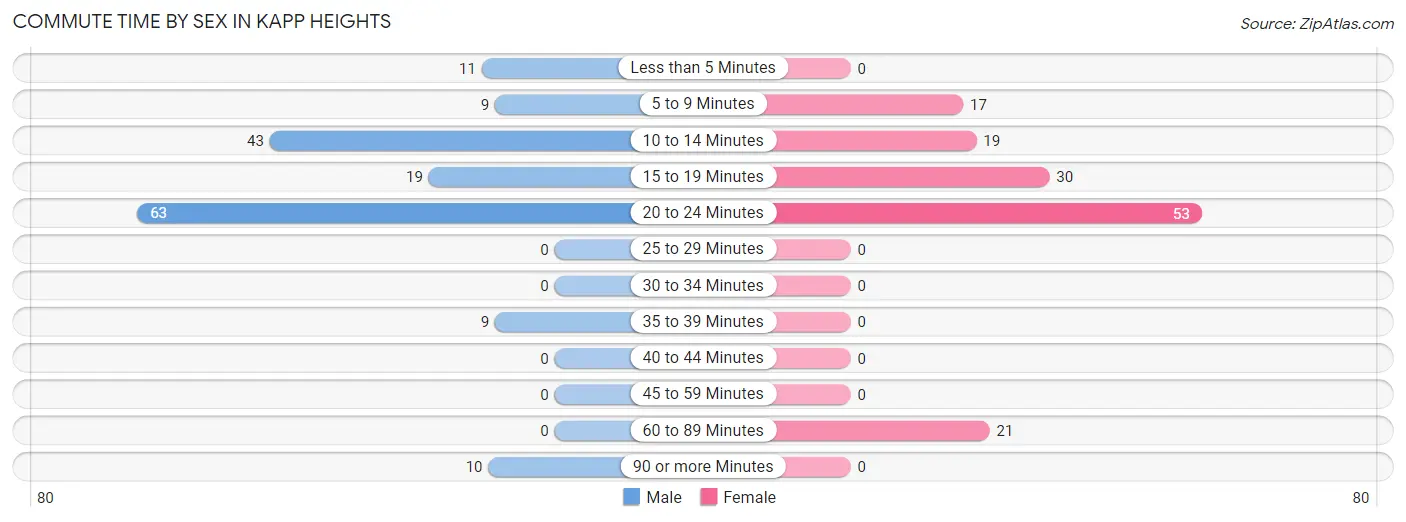
| Commute Time | Male | Female |
| Less than 5 Minutes | 11 (6.7%) | 0 (0.0%) |
| 5 to 9 Minutes | 9 (5.5%) | 17 (12.1%) |
| 10 to 14 Minutes | 43 (26.2%) | 19 (13.6%) |
| 15 to 19 Minutes | 19 (11.6%) | 30 (21.4%) |
| 20 to 24 Minutes | 63 (38.4%) | 53 (37.9%) |
| 25 to 29 Minutes | 0 (0.0%) | 0 (0.0%) |
| 30 to 34 Minutes | 0 (0.0%) | 0 (0.0%) |
| 35 to 39 Minutes | 9 (5.5%) | 0 (0.0%) |
| 40 to 44 Minutes | 0 (0.0%) | 0 (0.0%) |
| 45 to 59 Minutes | 0 (0.0%) | 0 (0.0%) |
| 60 to 89 Minutes | 0 (0.0%) | 21 (15.0%) |
| 90 or more Minutes | 10 (6.1%) | 0 (0.0%) |
Time of Departure to Work by Sex in Kapp Heights
The most frequent times of departure to work in Kapp Heights are 12:00 AM to 4:59 AM (34, 20.7%) for males and 4:00 PM to 11:59 PM (58, 41.4%) for females.
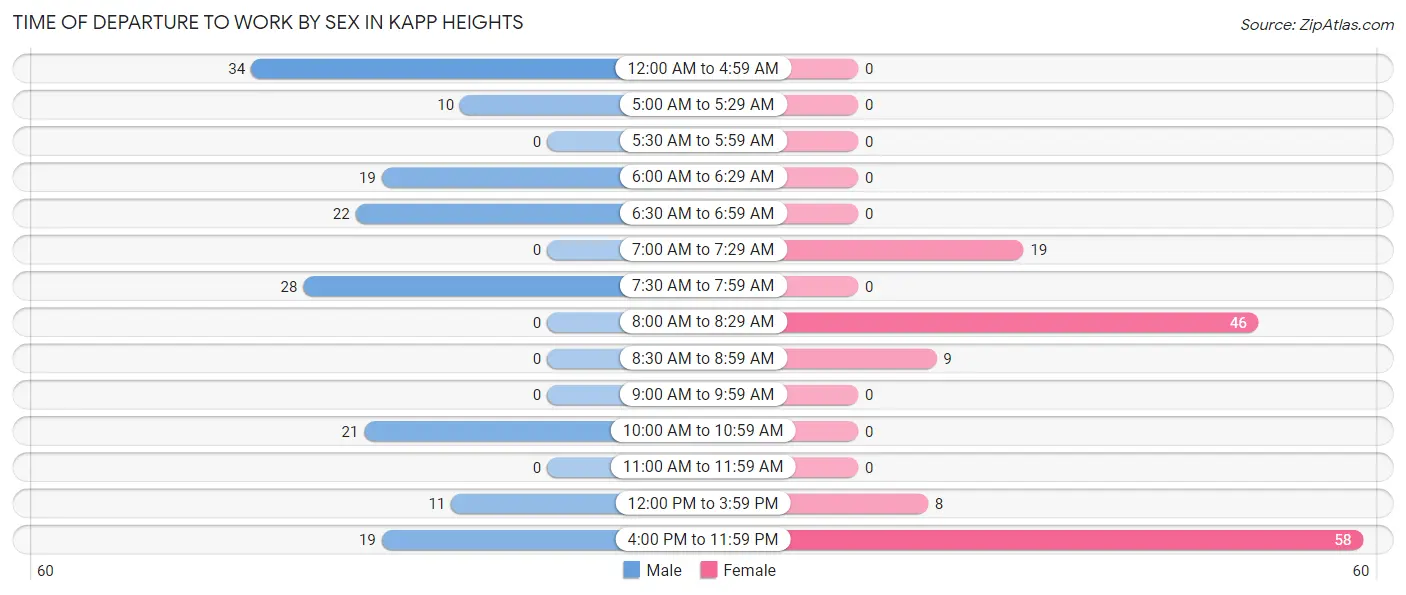
| Time of Departure | Male | Female |
| 12:00 AM to 4:59 AM | 34 (20.7%) | 0 (0.0%) |
| 5:00 AM to 5:29 AM | 10 (6.1%) | 0 (0.0%) |
| 5:30 AM to 5:59 AM | 0 (0.0%) | 0 (0.0%) |
| 6:00 AM to 6:29 AM | 19 (11.6%) | 0 (0.0%) |
| 6:30 AM to 6:59 AM | 22 (13.4%) | 0 (0.0%) |
| 7:00 AM to 7:29 AM | 0 (0.0%) | 19 (13.6%) |
| 7:30 AM to 7:59 AM | 28 (17.1%) | 0 (0.0%) |
| 8:00 AM to 8:29 AM | 0 (0.0%) | 46 (32.9%) |
| 8:30 AM to 8:59 AM | 0 (0.0%) | 9 (6.4%) |
| 9:00 AM to 9:59 AM | 0 (0.0%) | 0 (0.0%) |
| 10:00 AM to 10:59 AM | 21 (12.8%) | 0 (0.0%) |
| 11:00 AM to 11:59 AM | 0 (0.0%) | 0 (0.0%) |
| 12:00 PM to 3:59 PM | 11 (6.7%) | 8 (5.7%) |
| 4:00 PM to 11:59 PM | 19 (11.6%) | 58 (41.4%) |
| Total | 164 (100.0%) | 140 (100.0%) |
Housing Occupancy in Kapp Heights
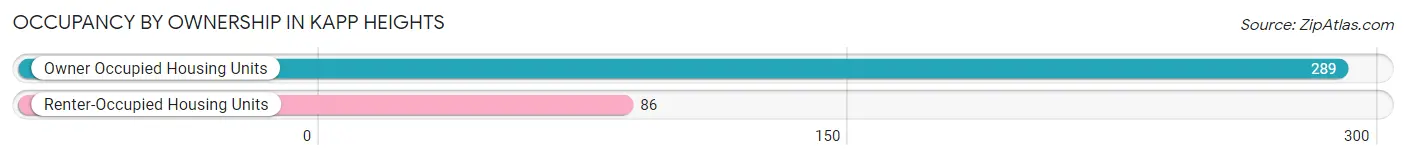
Occupancy by Ownership in Kapp Heights
Of the total 375 dwellings in Kapp Heights, owner-occupied units account for 289 (77.1%), while renter-occupied units make up 86 (22.9%).
| Occupancy | # Housing Units | % Housing Units |
| Owner Occupied Housing Units | 289 | 77.1% |
| Renter-Occupied Housing Units | 86 | 22.9% |
| Total Occupied Housing Units | 375 | 100.0% |
Occupancy by Household Size in Kapp Heights
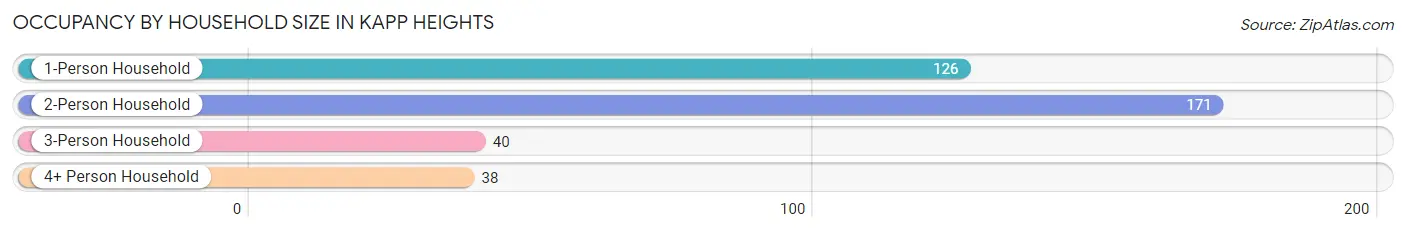
| Household Size | # Housing Units | % Housing Units |
| 1-Person Household | 126 | 33.6% |
| 2-Person Household | 171 | 45.6% |
| 3-Person Household | 40 | 10.7% |
| 4+ Person Household | 38 | 10.1% |
| Total Housing Units | 375 | 100.0% |
Occupancy by Ownership by Household Size in Kapp Heights
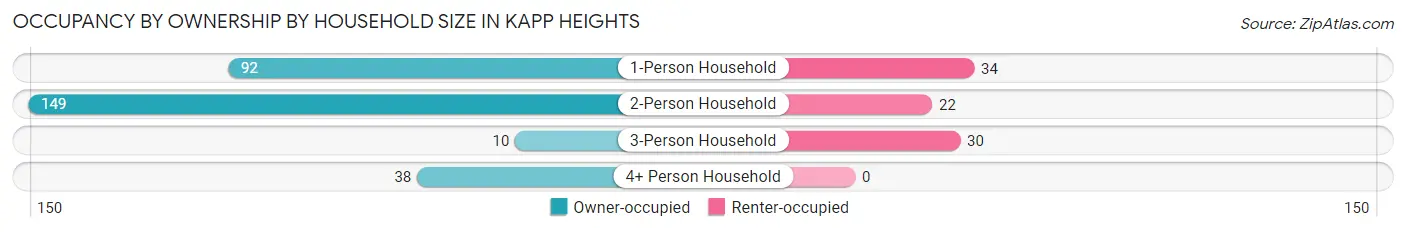
| Household Size | Owner-occupied | Renter-occupied |
| 1-Person Household | 92 (73.0%) | 34 (27.0%) |
| 2-Person Household | 149 (87.1%) | 22 (12.9%) |
| 3-Person Household | 10 (25.0%) | 30 (75.0%) |
| 4+ Person Household | 38 (100.0%) | 0 (0.0%) |
| Total Housing Units | 289 (77.1%) | 86 (22.9%) |
Occupancy by Educational Attainment in Kapp Heights
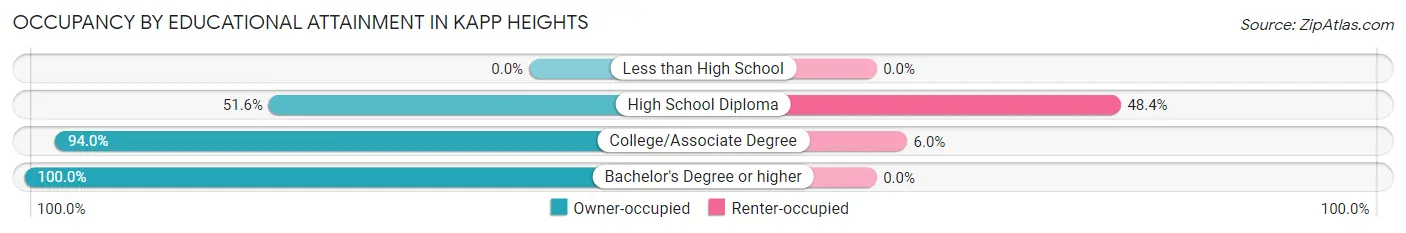
| Household Size | Owner-occupied | Renter-occupied |
| Less than High School | 0 (0.0%) | 0 (0.0%) |
| High School Diploma | 82 (51.6%) | 77 (48.4%) |
| College/Associate Degree | 140 (94.0%) | 9 (6.0%) |
| Bachelor's Degree or higher | 67 (100.0%) | 0 (0.0%) |
Occupancy by Age of Householder in Kapp Heights
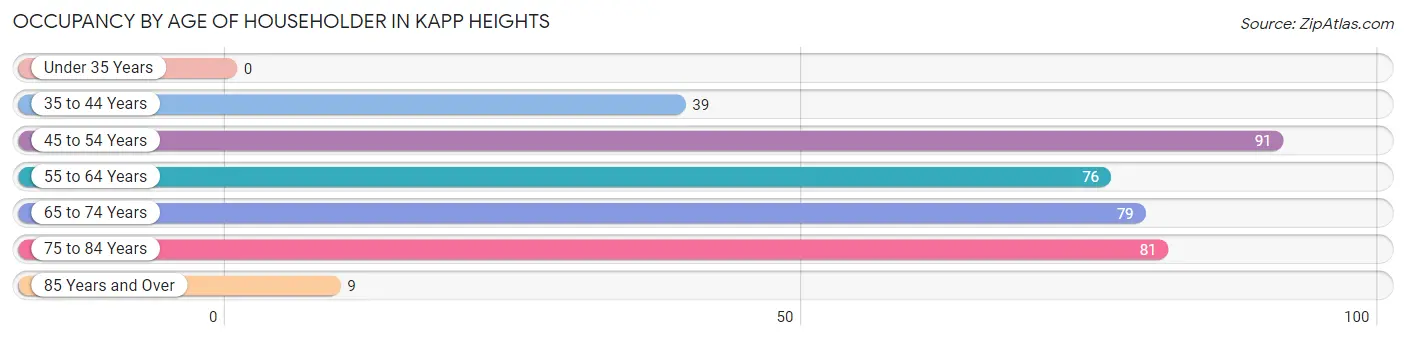
| Age Bracket | # Households | % Households |
| Under 35 Years | 0 | 0.0% |
| 35 to 44 Years | 39 | 10.4% |
| 45 to 54 Years | 91 | 24.3% |
| 55 to 64 Years | 76 | 20.3% |
| 65 to 74 Years | 79 | 21.1% |
| 75 to 84 Years | 81 | 21.6% |
| 85 Years and Over | 9 | 2.4% |
| Total | 375 | 100.0% |
Housing Finances in Kapp Heights
Median Income by Occupancy in Kapp Heights
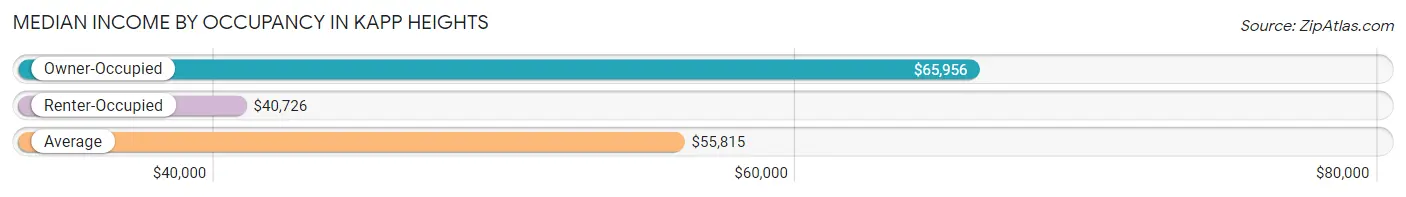
| Occupancy Type | # Households | Median Income |
| Owner-Occupied | 289 (77.1%) | $65,956 |
| Renter-Occupied | 86 (22.9%) | $40,726 |
| Average | 375 (100.0%) | $55,815 |
Occupancy by Householder Income Bracket in Kapp Heights
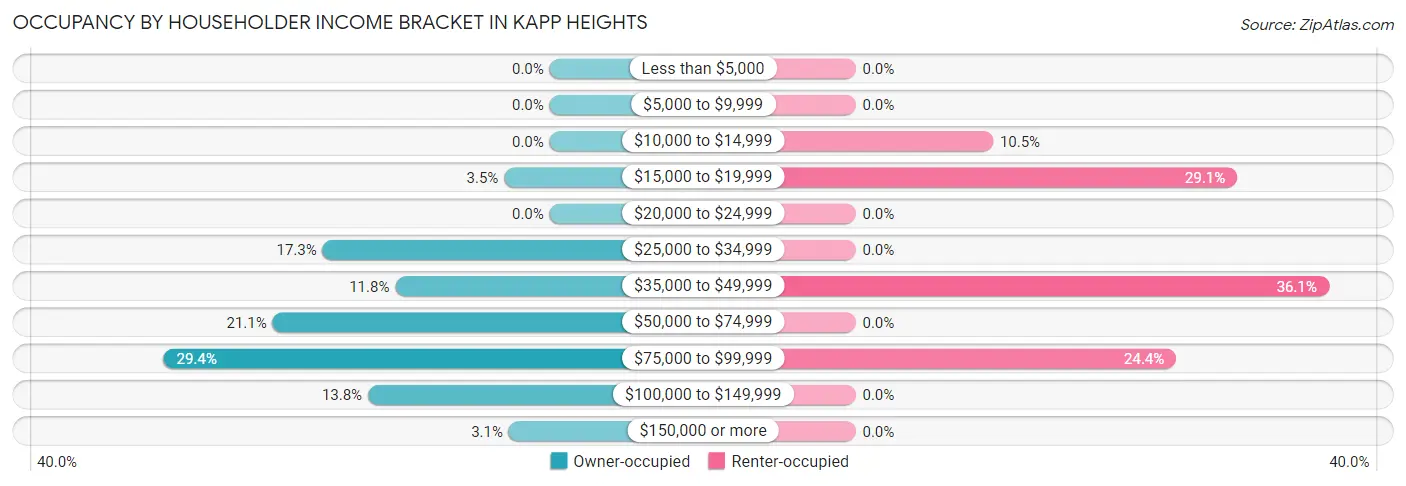
| Income Bracket | Owner-occupied | Renter-occupied |
| Less than $5,000 | 0 (0.0%) | 0 (0.0%) |
| $5,000 to $9,999 | 0 (0.0%) | 0 (0.0%) |
| $10,000 to $14,999 | 0 (0.0%) | 9 (10.5%) |
| $15,000 to $19,999 | 10 (3.5%) | 25 (29.1%) |
| $20,000 to $24,999 | 0 (0.0%) | 0 (0.0%) |
| $25,000 to $34,999 | 50 (17.3%) | 0 (0.0%) |
| $35,000 to $49,999 | 34 (11.8%) | 31 (36.0%) |
| $50,000 to $74,999 | 61 (21.1%) | 0 (0.0%) |
| $75,000 to $99,999 | 85 (29.4%) | 21 (24.4%) |
| $100,000 to $149,999 | 40 (13.8%) | 0 (0.0%) |
| $150,000 or more | 9 (3.1%) | 0 (0.0%) |
| Total | 289 (100.0%) | 86 (100.0%) |
Monthly Housing Cost Tiers in Kapp Heights
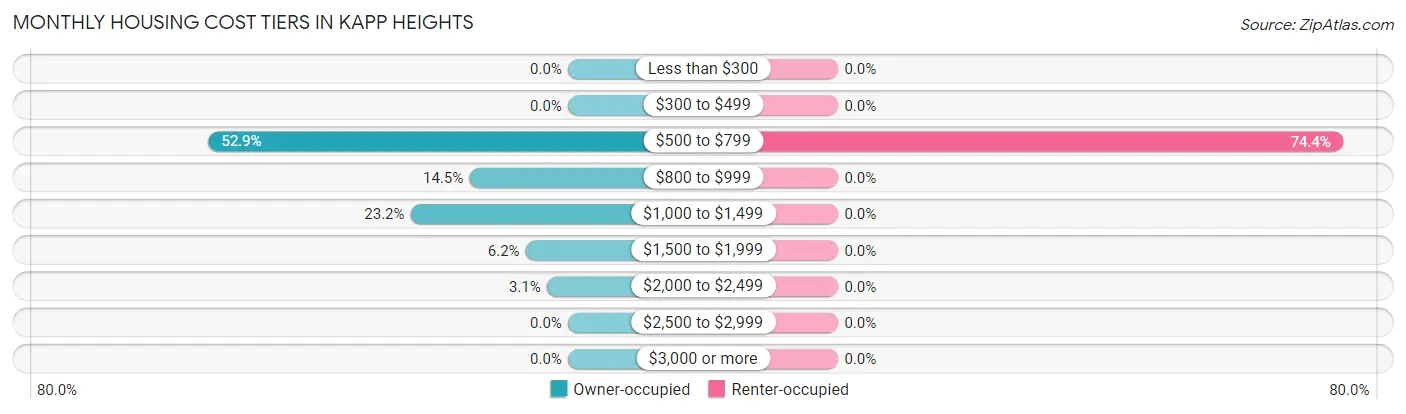
| Monthly Cost | Owner-occupied | Renter-occupied |
| Less than $300 | 0 (0.0%) | 0 (0.0%) |
| $300 to $499 | 0 (0.0%) | 0 (0.0%) |
| $500 to $799 | 153 (52.9%) | 64 (74.4%) |
| $800 to $999 | 42 (14.5%) | 0 (0.0%) |
| $1,000 to $1,499 | 67 (23.2%) | 0 (0.0%) |
| $1,500 to $1,999 | 18 (6.2%) | 0 (0.0%) |
| $2,000 to $2,499 | 9 (3.1%) | 0 (0.0%) |
| $2,500 to $2,999 | 0 (0.0%) | 0 (0.0%) |
| $3,000 or more | 0 (0.0%) | 0 (0.0%) |
| Total | 289 (100.0%) | 86 (100.0%) |
Physical Housing Characteristics in Kapp Heights
Housing Structures in Kapp Heights
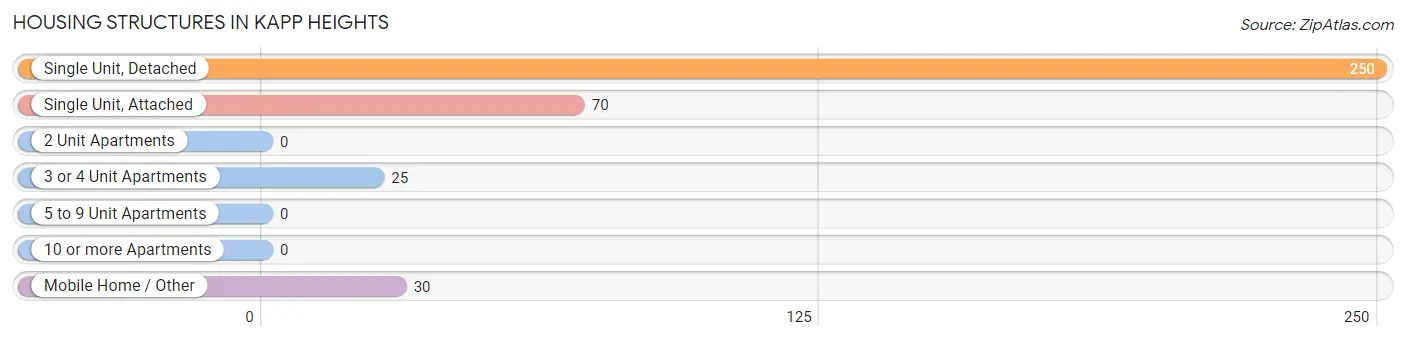
| Structure Type | # Housing Units | % Housing Units |
| Single Unit, Detached | 250 | 66.7% |
| Single Unit, Attached | 70 | 18.7% |
| 2 Unit Apartments | 0 | 0.0% |
| 3 or 4 Unit Apartments | 25 | 6.7% |
| 5 to 9 Unit Apartments | 0 | 0.0% |
| 10 or more Apartments | 0 | 0.0% |
| Mobile Home / Other | 30 | 8.0% |
| Total | 375 | 100.0% |
Housing Structures by Occupancy in Kapp Heights
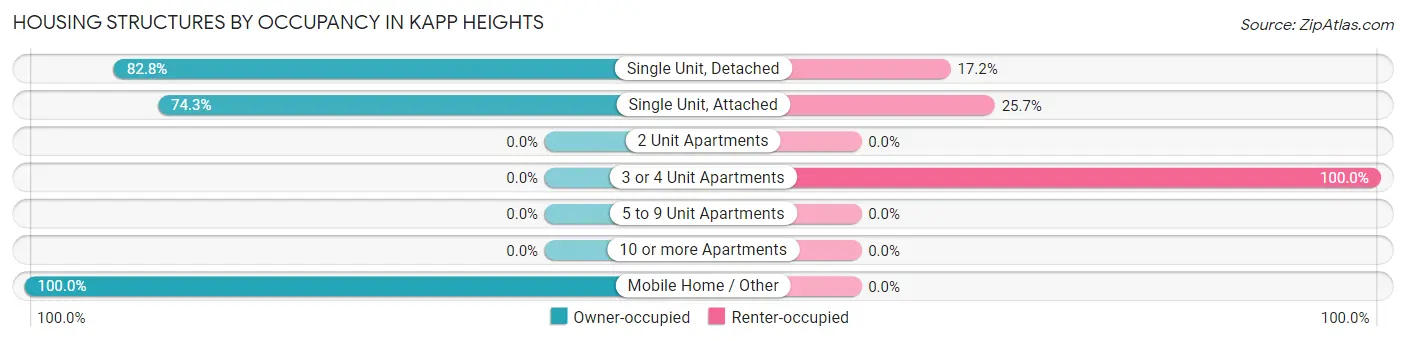
| Structure Type | Owner-occupied | Renter-occupied |
| Single Unit, Detached | 207 (82.8%) | 43 (17.2%) |
| Single Unit, Attached | 52 (74.3%) | 18 (25.7%) |
| 2 Unit Apartments | 0 (0.0%) | 0 (0.0%) |
| 3 or 4 Unit Apartments | 0 (0.0%) | 25 (100.0%) |
| 5 to 9 Unit Apartments | 0 (0.0%) | 0 (0.0%) |
| 10 or more Apartments | 0 (0.0%) | 0 (0.0%) |
| Mobile Home / Other | 30 (100.0%) | 0 (0.0%) |
| Total | 289 (77.1%) | 86 (22.9%) |
Housing Structures by Number of Rooms in Kapp Heights
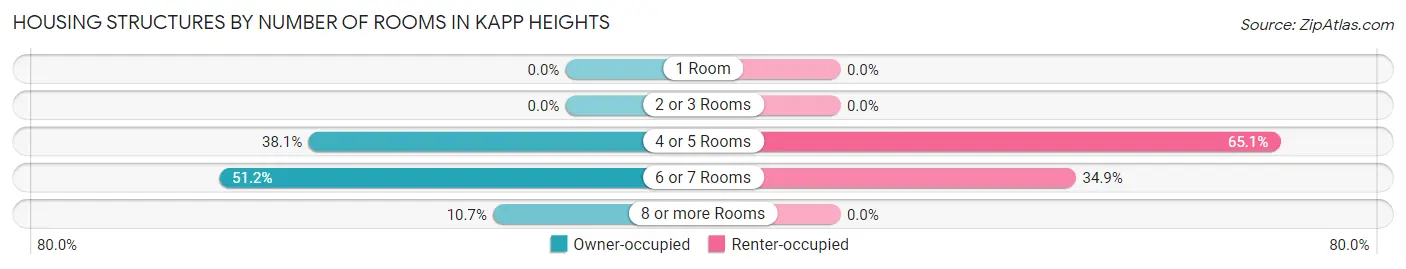
| Number of Rooms | Owner-occupied | Renter-occupied |
| 1 Room | 0 (0.0%) | 0 (0.0%) |
| 2 or 3 Rooms | 0 (0.0%) | 0 (0.0%) |
| 4 or 5 Rooms | 110 (38.1%) | 56 (65.1%) |
| 6 or 7 Rooms | 148 (51.2%) | 30 (34.9%) |
| 8 or more Rooms | 31 (10.7%) | 0 (0.0%) |
| Total | 289 (100.0%) | 86 (100.0%) |
Housing Structure by Heating Type in Kapp Heights
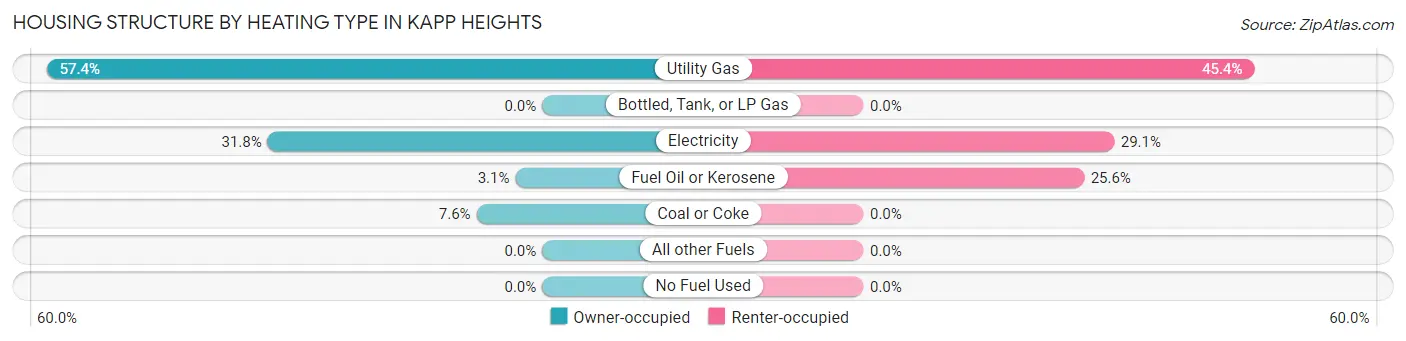
| Heating Type | Owner-occupied | Renter-occupied |
| Utility Gas | 166 (57.4%) | 39 (45.4%) |
| Bottled, Tank, or LP Gas | 0 (0.0%) | 0 (0.0%) |
| Electricity | 92 (31.8%) | 25 (29.1%) |
| Fuel Oil or Kerosene | 9 (3.1%) | 22 (25.6%) |
| Coal or Coke | 22 (7.6%) | 0 (0.0%) |
| All other Fuels | 0 (0.0%) | 0 (0.0%) |
| No Fuel Used | 0 (0.0%) | 0 (0.0%) |
| Total | 289 (100.0%) | 86 (100.0%) |
Household Vehicle Usage in Kapp Heights
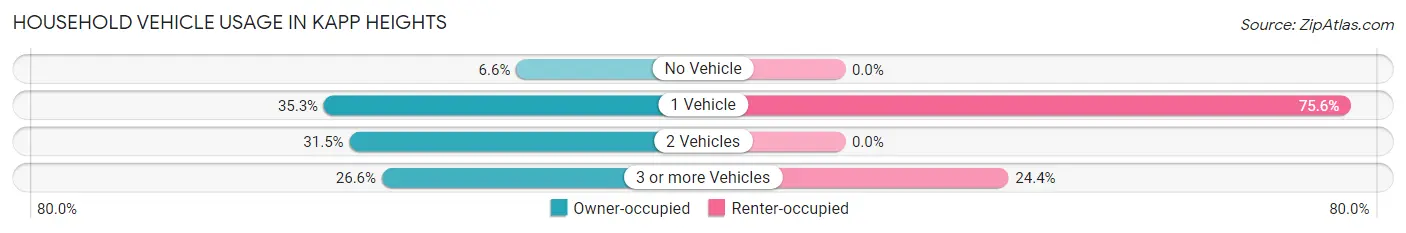
| Vehicles per Household | Owner-occupied | Renter-occupied |
| No Vehicle | 19 (6.6%) | 0 (0.0%) |
| 1 Vehicle | 102 (35.3%) | 65 (75.6%) |
| 2 Vehicles | 91 (31.5%) | 0 (0.0%) |
| 3 or more Vehicles | 77 (26.6%) | 21 (24.4%) |
| Total | 289 (100.0%) | 86 (100.0%) |
Real Estate & Mortgages in Kapp Heights
Real Estate and Mortgage Overview in Kapp Heights
| Characteristic | Without Mortgage | With Mortgage |
| Housing Units | 122 | 167 |
| Median Property Value | $158,300 | $135,200 |
| Median Household Income | $55,870 | $9 |
| Monthly Housing Costs | $572 | $0 |
| Real Estate Taxes | $2,450 | $0 |
Property Value by Mortgage Status in Kapp Heights
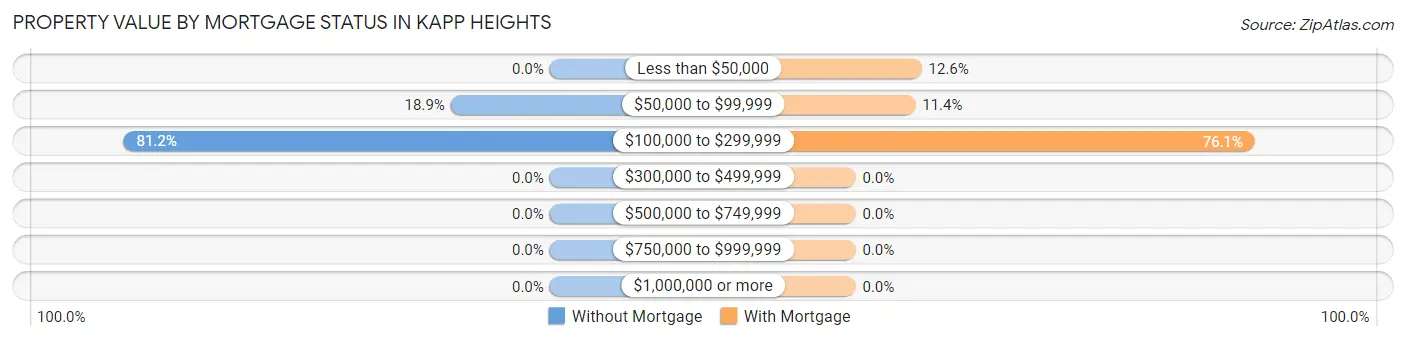
| Property Value | Without Mortgage | With Mortgage |
| Less than $50,000 | 0 (0.0%) | 21 (12.6%) |
| $50,000 to $99,999 | 23 (18.9%) | 19 (11.4%) |
| $100,000 to $299,999 | 99 (81.1%) | 127 (76.0%) |
| $300,000 to $499,999 | 0 (0.0%) | 0 (0.0%) |
| $500,000 to $749,999 | 0 (0.0%) | 0 (0.0%) |
| $750,000 to $999,999 | 0 (0.0%) | 0 (0.0%) |
| $1,000,000 or more | 0 (0.0%) | 0 (0.0%) |
| Total | 122 (100.0%) | 167 (100.0%) |
Household Income by Mortgage Status in Kapp Heights
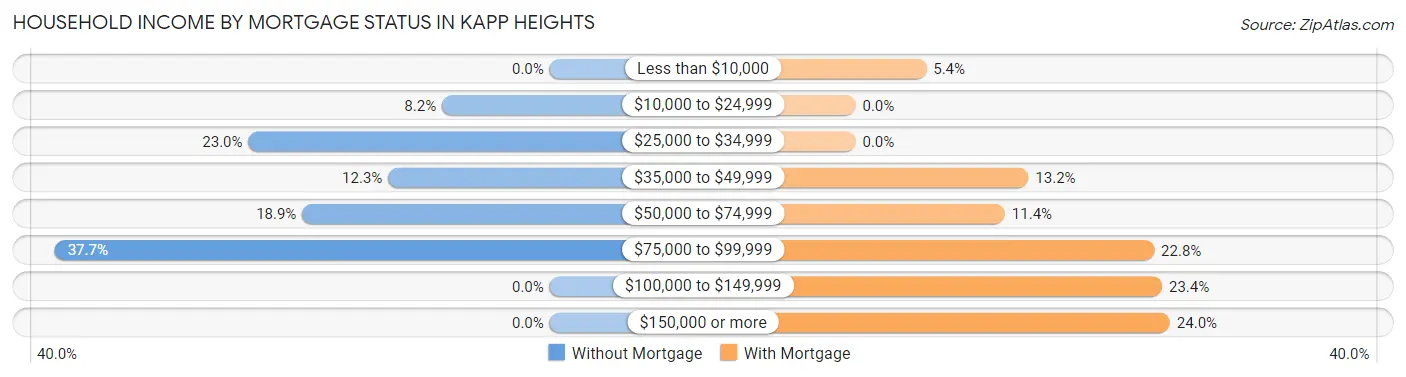
| Household Income | Without Mortgage | With Mortgage |
| Less than $10,000 | 0 (0.0%) | 9 (5.4%) |
| $10,000 to $24,999 | 10 (8.2%) | 0 (0.0%) |
| $25,000 to $34,999 | 28 (23.0%) | 0 (0.0%) |
| $35,000 to $49,999 | 15 (12.3%) | 22 (13.2%) |
| $50,000 to $74,999 | 23 (18.9%) | 19 (11.4%) |
| $75,000 to $99,999 | 46 (37.7%) | 38 (22.8%) |
| $100,000 to $149,999 | 0 (0.0%) | 39 (23.4%) |
| $150,000 or more | 0 (0.0%) | 40 (23.9%) |
| Total | 122 (100.0%) | 167 (100.0%) |
Property Value to Household Income Ratio in Kapp Heights
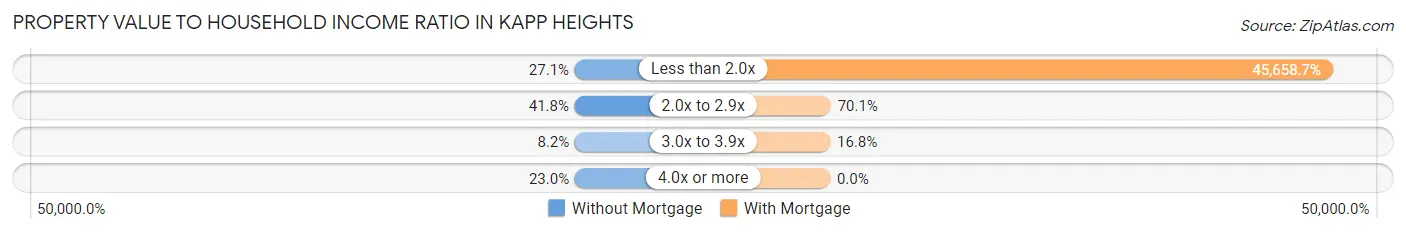
| Value-to-Income Ratio | Without Mortgage | With Mortgage |
| Less than 2.0x | 33 (27.1%) | 76,250 (45,658.7%) |
| 2.0x to 2.9x | 51 (41.8%) | 117 (70.1%) |
| 3.0x to 3.9x | 10 (8.2%) | 28 (16.8%) |
| 4.0x or more | 28 (23.0%) | 0 (0.0%) |
| Total | 122 (100.0%) | 167 (100.0%) |
Real Estate Taxes by Mortgage Status in Kapp Heights
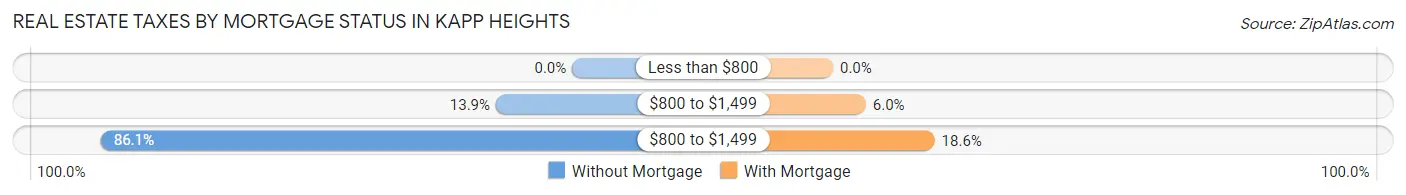
| Property Taxes | Without Mortgage | With Mortgage |
| Less than $800 | 0 (0.0%) | 0 (0.0%) |
| $800 to $1,499 | 17 (13.9%) | 10 (6.0%) |
| $800 to $1,499 | 105 (86.1%) | 31 (18.6%) |
| Total | 122 (100.0%) | 167 (100.0%) |
Health & Disability in Kapp Heights
Health Insurance Coverage by Age in Kapp Heights
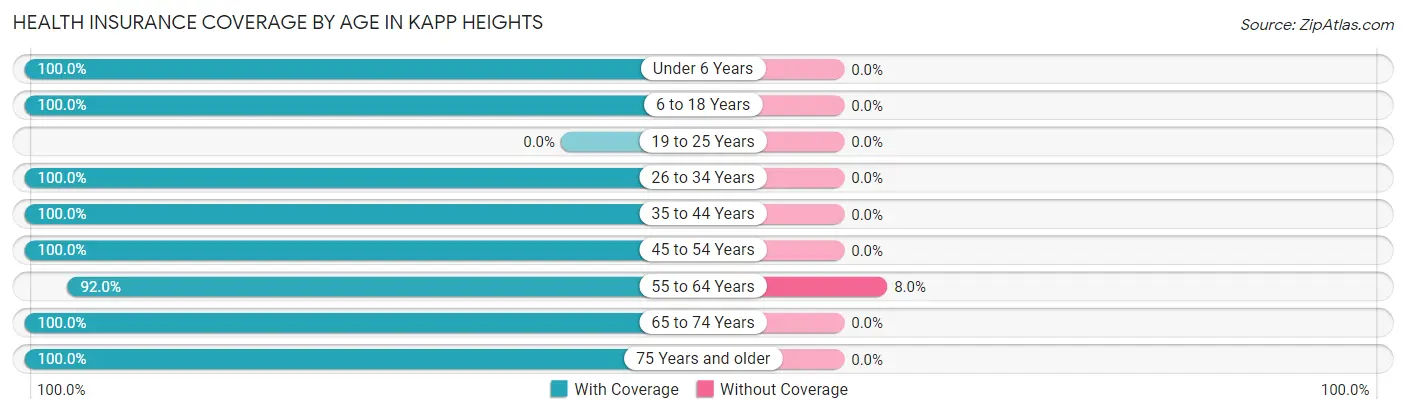
| Age Bracket | With Coverage | Without Coverage |
| Under 6 Years | 10 (100.0%) | 0 (0.0%) |
| 6 to 18 Years | 119 (100.0%) | 0 (0.0%) |
| 19 to 25 Years | 0 (0.0%) | 0 (0.0%) |
| 26 to 34 Years | 9 (100.0%) | 0 (0.0%) |
| 35 to 44 Years | 61 (100.0%) | 0 (0.0%) |
| 45 to 54 Years | 181 (100.0%) | 0 (0.0%) |
| 55 to 64 Years | 115 (92.0%) | 10 (8.0%) |
| 65 to 74 Years | 114 (100.0%) | 0 (0.0%) |
| 75 Years and older | 146 (100.0%) | 0 (0.0%) |
| Total | 755 (98.7%) | 10 (1.3%) |
Health Insurance Coverage by Citizenship Status in Kapp Heights
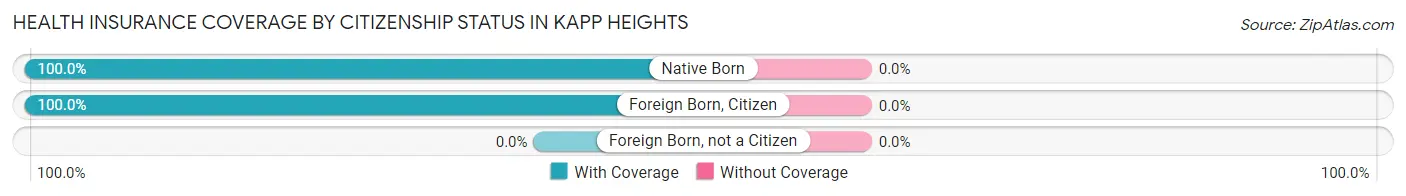
| Citizenship Status | With Coverage | Without Coverage |
| Native Born | 10 (100.0%) | 0 (0.0%) |
| Foreign Born, Citizen | 119 (100.0%) | 0 (0.0%) |
| Foreign Born, not a Citizen | 0 (0.0%) | 0 (0.0%) |
Health Insurance Coverage by Household Income in Kapp Heights
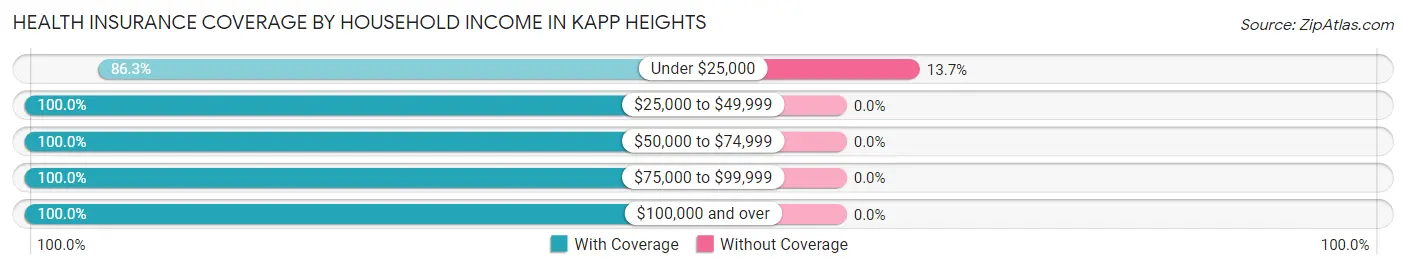
| Household Income | With Coverage | Without Coverage |
| Under $25,000 | 63 (86.3%) | 10 (13.7%) |
| $25,000 to $49,999 | 182 (100.0%) | 0 (0.0%) |
| $50,000 to $74,999 | 113 (100.0%) | 0 (0.0%) |
| $75,000 to $99,999 | 275 (100.0%) | 0 (0.0%) |
| $100,000 and over | 122 (100.0%) | 0 (0.0%) |
Public vs Private Health Insurance Coverage by Age in Kapp Heights
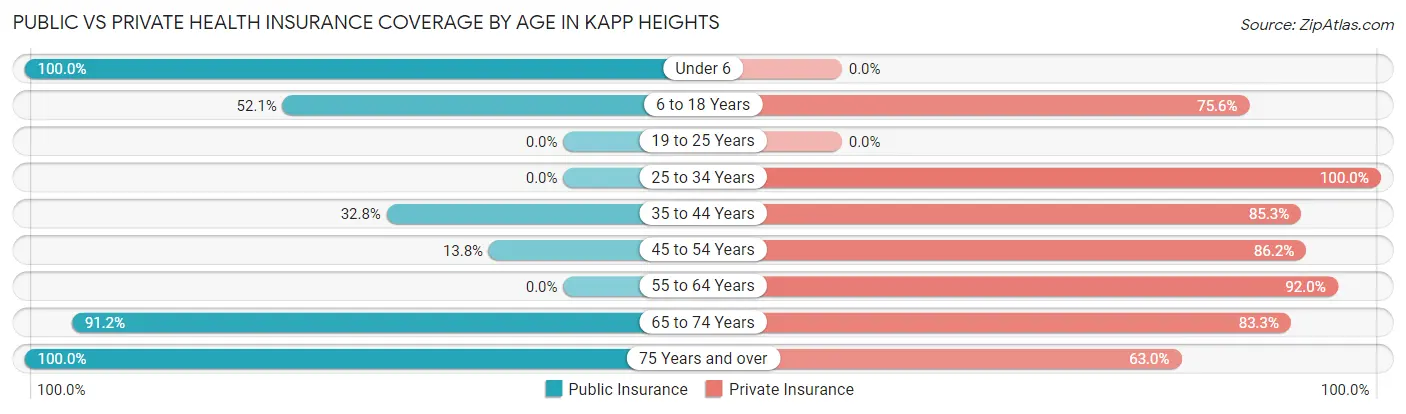
| Age Bracket | Public Insurance | Private Insurance |
| Under 6 | 10 (100.0%) | 0 (0.0%) |
| 6 to 18 Years | 62 (52.1%) | 90 (75.6%) |
| 19 to 25 Years | 0 (0.0%) | 0 (0.0%) |
| 25 to 34 Years | 0 (0.0%) | 9 (100.0%) |
| 35 to 44 Years | 20 (32.8%) | 52 (85.3%) |
| 45 to 54 Years | 25 (13.8%) | 156 (86.2%) |
| 55 to 64 Years | 0 (0.0%) | 115 (92.0%) |
| 65 to 74 Years | 104 (91.2%) | 95 (83.3%) |
| 75 Years and over | 146 (100.0%) | 92 (63.0%) |
| Total | 367 (48.0%) | 609 (79.6%) |
Disability Status by Sex by Age in Kapp Heights
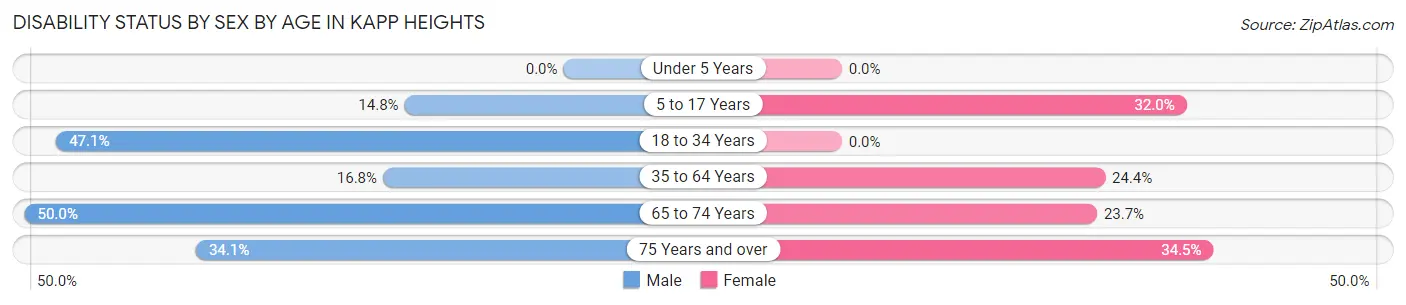
| Age Bracket | Male | Female |
| Under 5 Years | 0 (0.0%) | 0 (0.0%) |
| 5 to 17 Years | 9 (14.7%) | 16 (32.0%) |
| 18 to 34 Years | 8 (47.1%) | 0 (0.0%) |
| 35 to 64 Years | 32 (16.8%) | 43 (24.4%) |
| 65 to 74 Years | 19 (50.0%) | 18 (23.7%) |
| 75 Years and over | 30 (34.1%) | 20 (34.5%) |
Disability Class by Sex by Age in Kapp Heights
Disability Class: Hearing Difficulty
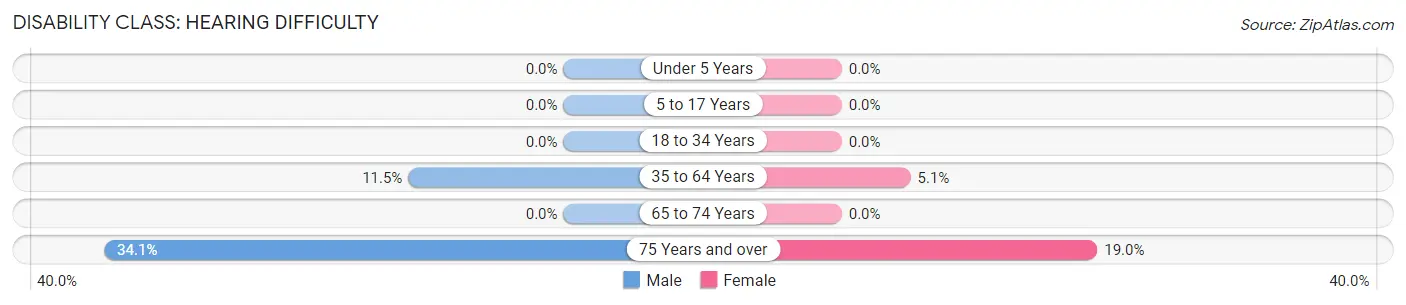
| Age Bracket | Male | Female |
| Under 5 Years | 0 (0.0%) | 0 (0.0%) |
| 5 to 17 Years | 0 (0.0%) | 0 (0.0%) |
| 18 to 34 Years | 0 (0.0%) | 0 (0.0%) |
| 35 to 64 Years | 22 (11.5%) | 9 (5.1%) |
| 65 to 74 Years | 0 (0.0%) | 0 (0.0%) |
| 75 Years and over | 30 (34.1%) | 11 (19.0%) |
Disability Class: Vision Difficulty
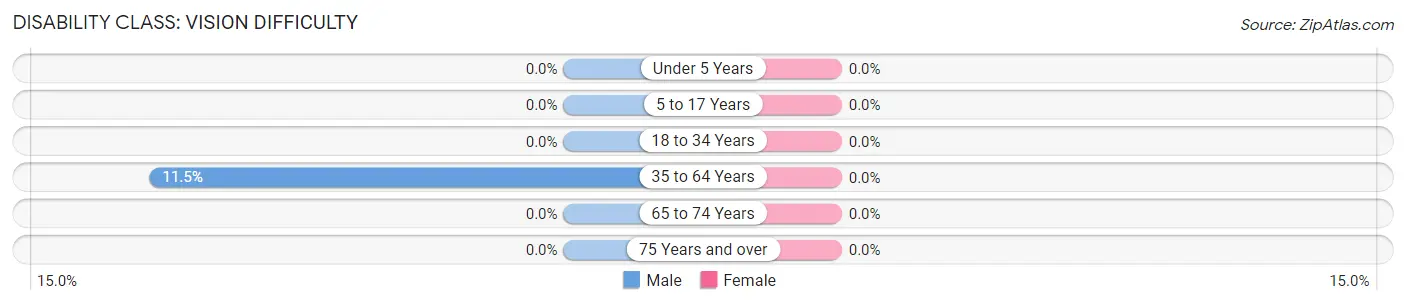
| Age Bracket | Male | Female |
| Under 5 Years | 0 (0.0%) | 0 (0.0%) |
| 5 to 17 Years | 0 (0.0%) | 0 (0.0%) |
| 18 to 34 Years | 0 (0.0%) | 0 (0.0%) |
| 35 to 64 Years | 22 (11.5%) | 0 (0.0%) |
| 65 to 74 Years | 0 (0.0%) | 0 (0.0%) |
| 75 Years and over | 0 (0.0%) | 0 (0.0%) |
Disability Class: Cognitive Difficulty
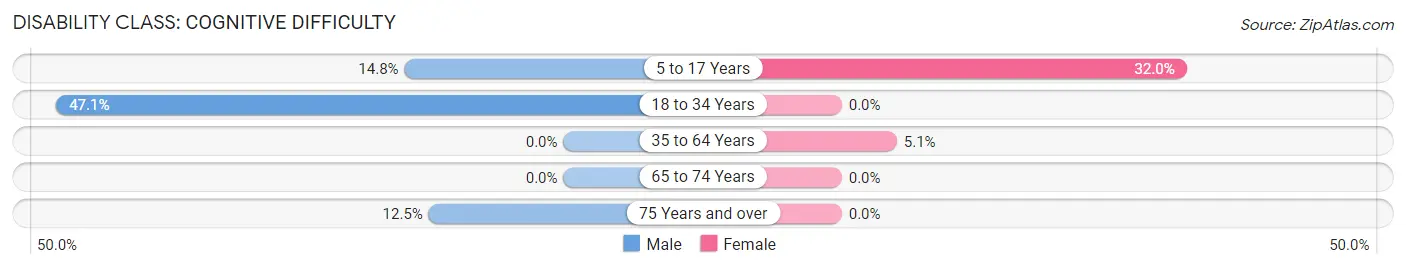
| Age Bracket | Male | Female |
| 5 to 17 Years | 9 (14.7%) | 16 (32.0%) |
| 18 to 34 Years | 8 (47.1%) | 0 (0.0%) |
| 35 to 64 Years | 0 (0.0%) | 9 (5.1%) |
| 65 to 74 Years | 0 (0.0%) | 0 (0.0%) |
| 75 Years and over | 11 (12.5%) | 0 (0.0%) |
Disability Class: Ambulatory Difficulty
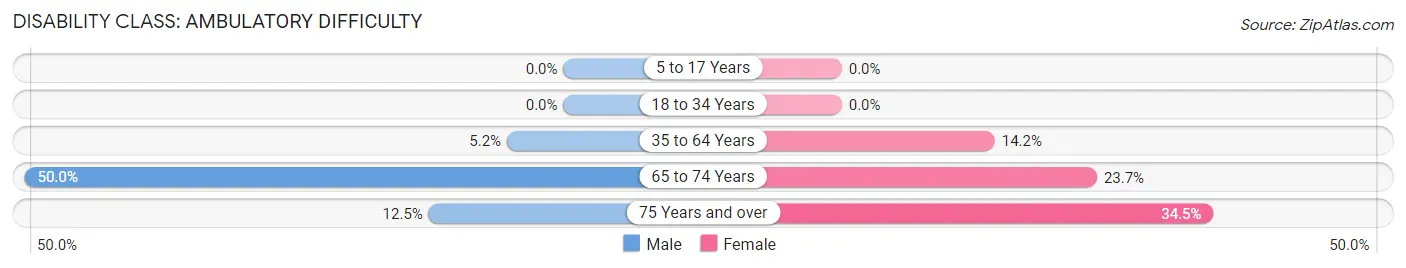
| Age Bracket | Male | Female |
| 5 to 17 Years | 0 (0.0%) | 0 (0.0%) |
| 18 to 34 Years | 0 (0.0%) | 0 (0.0%) |
| 35 to 64 Years | 10 (5.2%) | 25 (14.2%) |
| 65 to 74 Years | 19 (50.0%) | 18 (23.7%) |
| 75 Years and over | 11 (12.5%) | 20 (34.5%) |
Disability Class: Self-Care Difficulty
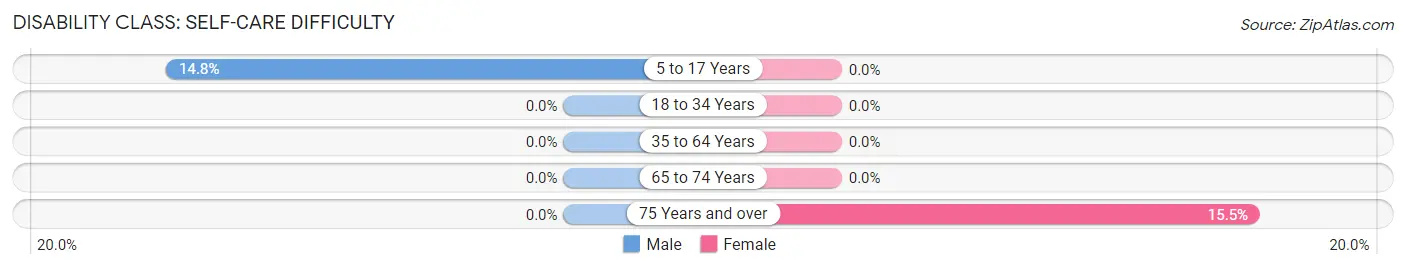
| Age Bracket | Male | Female |
| 5 to 17 Years | 9 (14.7%) | 0 (0.0%) |
| 18 to 34 Years | 0 (0.0%) | 0 (0.0%) |
| 35 to 64 Years | 0 (0.0%) | 0 (0.0%) |
| 65 to 74 Years | 0 (0.0%) | 0 (0.0%) |
| 75 Years and over | 0 (0.0%) | 9 (15.5%) |
Technology Access in Kapp Heights
Computing Device Access in Kapp Heights
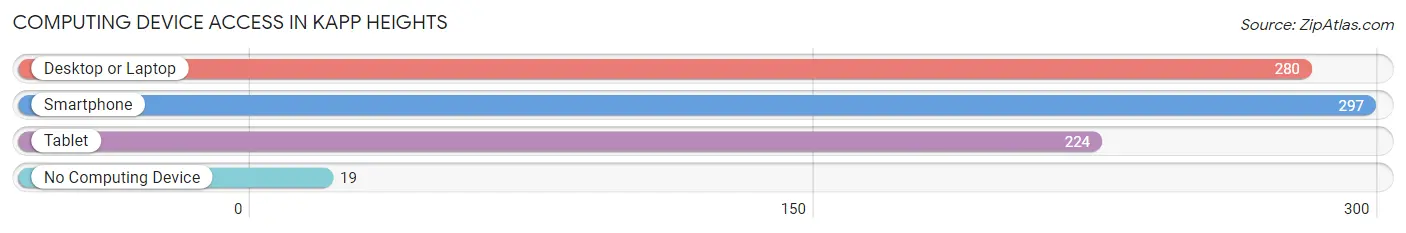
| Device Type | # Households | % Households |
| Desktop or Laptop | 280 | 74.7% |
| Smartphone | 297 | 79.2% |
| Tablet | 224 | 59.7% |
| No Computing Device | 19 | 5.1% |
| Total | 375 | 100.0% |
Internet Access in Kapp Heights
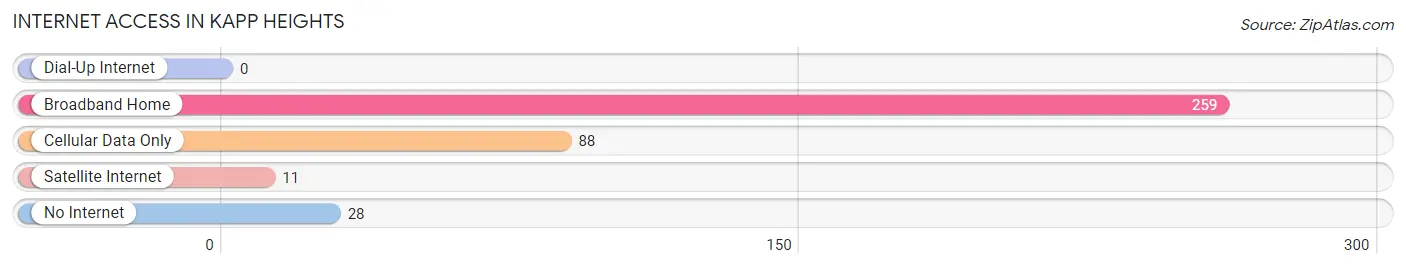
| Internet Type | # Households | % Households |
| Dial-Up Internet | 0 | 0.0% |
| Broadband Home | 259 | 69.1% |
| Cellular Data Only | 88 | 23.5% |
| Satellite Internet | 11 | 2.9% |
| No Internet | 28 | 7.5% |
| Total | 375 | 100.0% |
Kapp Heights Summary
Kapp Heights is a small borough located in Allegheny County, Pennsylvania. It is situated in the southwestern part of the state, about 20 miles from Pittsburgh. The borough was incorporated in 1891 and has a population of approximately 1,500 people.
Geography
Kapp Heights is located in the Allegheny Plateau region of Pennsylvania. The borough is situated on a hillside, with the highest elevation being 1,000 feet above sea level. The borough is surrounded by the boroughs of West Mifflin, Dravosburg, and White Oak. The borough is also bordered by the Monongahela River to the north and the Youghiogheny River to the south.
The borough is mostly residential, with some commercial and industrial areas. The main roads that run through the borough are Route 837, which runs east-west, and Route 885, which runs north-south. The borough is served by the Port Authority of Allegheny County, which provides bus service to the surrounding areas.
Climate
Kapp Heights has a humid continental climate, with hot summers and cold winters. The average annual temperature is around 50 degrees Fahrenheit. The average annual precipitation is around 40 inches.
Demographics
As of the 2010 census, the population of Kapp Heights was 1,521. The racial makeup of the borough was 94.3% White, 2.2% African American, 0.3% Native American, 0.7% Asian, 0.1% Pacific Islander, and 2.4% from other races. Hispanic or Latino of any race were 1.2% of the population.
The median income for a household in the borough was $41,250, and the median income for a family was $50,000. The per capita income for the borough was $20,845. About 8.3% of families and 10.2% of the population were below the poverty line, including 14.2% of those under age 18 and 6.2% of those age 65 or over.
Economy
Kapp Heights is primarily a residential community, with some commercial and industrial areas. The borough is home to several small businesses, including restaurants, retail stores, and professional services. The borough is also home to a number of manufacturing companies, including a steel mill and a paper mill.
The borough is served by the Port Authority of Allegheny County, which provides bus service to the surrounding areas. The borough is also served by the Allegheny Valley Railroad, which provides freight service to the surrounding areas.
Conclusion
Kapp Heights is a small borough located in Allegheny County, Pennsylvania. It is situated in the southwestern part of the state, about 20 miles from Pittsburgh. The borough was incorporated in 1891 and has a population of approximately 1,500 people. The borough is mostly residential, with some commercial and industrial areas. The borough is served by the Port Authority of Allegheny County, which provides bus service to the surrounding areas. The borough is also served by the Allegheny Valley Railroad, which provides freight service to the surrounding areas. The borough is home to several small businesses, including restaurants, retail stores, and professional services. The borough is also home to a number of manufacturing companies, including a steel mill and a paper mill.
Common Questions
What is the Total Population of Kapp Heights?
Total Population of Kapp Heights is 765.
What is the Total Male Population of Kapp Heights?
Total Male Population of Kapp Heights is 405.
What is the Total Female Population of Kapp Heights?
Total Female Population of Kapp Heights is 360.
What is the Ratio of Males per 100 Females in Kapp Heights?
There are 112.50 Males per 100 Females in Kapp Heights.
What is the Ratio of Females per 100 Males in Kapp Heights?
There are 88.89 Females per 100 Males in Kapp Heights.
What is the Median Population Age in Kapp Heights?
Median Population Age in Kapp Heights is 56.3 Years.
What is the Average Family Size in Kapp Heights
Average Family Size in Kapp Heights is 2.6 People.
What is the Average Household Size in Kapp Heights
Average Household Size in Kapp Heights is 2.0 People.
What is Per Capita Income in Kapp Heights?
Per Capita income in Kapp Heights is $32,334.
What is the Median Family Income in Kapp Heights?
Median Family Income in Kapp Heights is $76,667.
What is the Median Household income in Kapp Heights?
Median Household Income in Kapp Heights is $55,815.
What is Income or Wage Gap in Kapp Heights?
Income or Wage Gap in Kapp Heights is 62.0%.
Women in Kapp Heights earn 38.0 cents for every dollar earned by a man.
What is Inequality or Gini Index in Kapp Heights?
Inequality or Gini Index in Kapp Heights is 0.32.
How Large is the Labor Force in Kapp Heights?
There are 393 People in the Labor Forcein in Kapp Heights.
What is the Percentage of People in the Labor Force in Kapp Heights?
58.3% of People are in the Labor Force in Kapp Heights.
What is the Unemployment Rate in Kapp Heights?
Unemployment Rate in Kapp Heights is 4.8%.