Tharptown Uniontown, PA
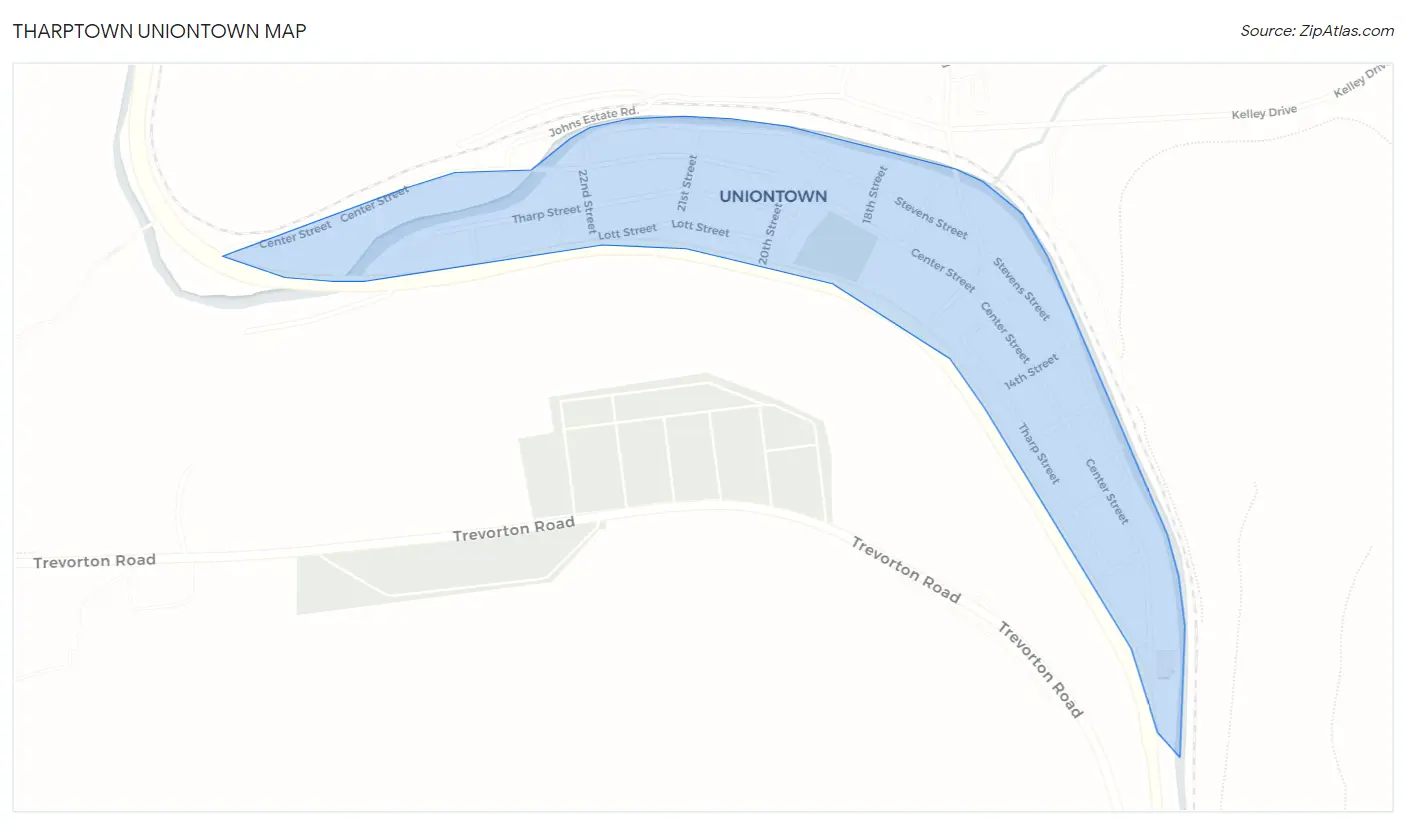
Tharptown Uniontown Map
Tharptown Uniontown Overview
269
TOTAL POPULATION
126
MALE POPULATION
143
FEMALE POPULATION
88.11
MALES / 100 FEMALES
113.49
FEMALES / 100 MALES
54.5
MEDIAN AGE
2.5
AVG FAMILY SIZE
2.3
AVG HOUSEHOLD SIZE
$30,695
PER CAPITA INCOME
$55,956
AVG FAMILY INCOME
28.5%
WAGE / INCOME GAP [ % ]
71.5¢/ $1
WAGE / INCOME GAP [ $ ]
0.50
INEQUALITY / GINI INDEX
163
LABOR FORCE [ PEOPLE ]
70.6%
PERCENT IN LABOR FORCE
17.2%
UNEMPLOYMENT RATE
Race in Tharptown Uniontown
The most populous races in Tharptown Uniontown are , and White / Caucasian (269 | 100.0%).
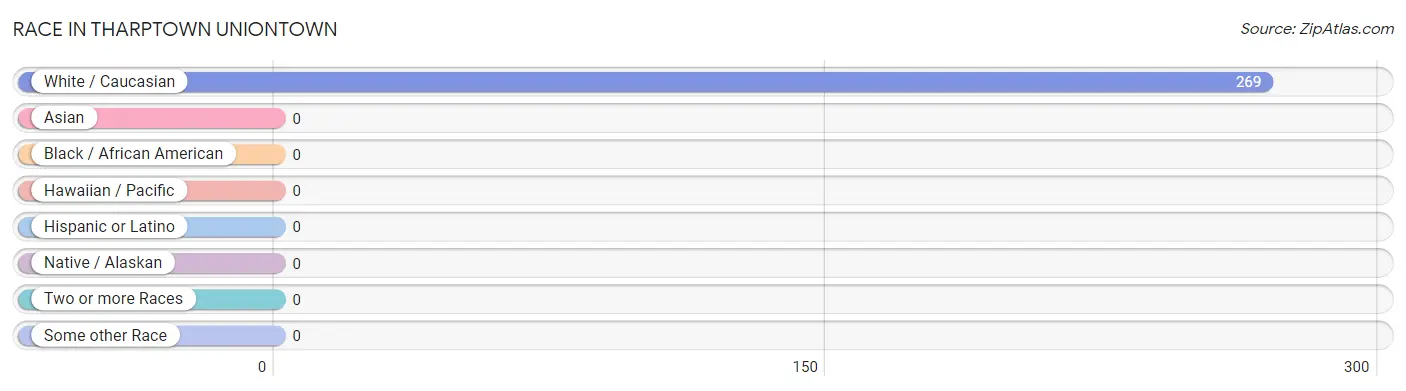
| Race | # Population | % Population |
| Asian | 0 | 0.0% |
| Black / African American | 0 | 0.0% |
| Hawaiian / Pacific | 0 | 0.0% |
| Hispanic or Latino | 0 | 0.0% |
| Native / Alaskan | 0 | 0.0% |
| White / Caucasian | 269 | 100.0% |
| Two or more Races | 0 | 0.0% |
| Some other Race | 0 | 0.0% |
| Total | 269 | 100.0% |
Ancestry in Tharptown Uniontown
The most populous ancestries reported in Tharptown Uniontown are German (131 | 48.7%), English (97 | 36.1%), Italian (53 | 19.7%), Dutch (50 | 18.6%), and Irish (16 | 5.9%), together accounting for 129.0% of all Tharptown Uniontown residents.
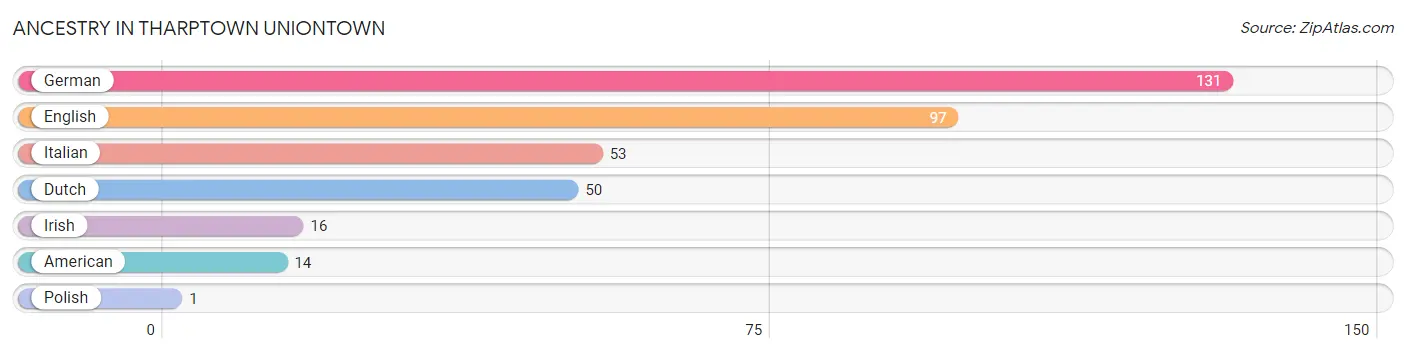
| Ancestry | # Population | % Population |
| American | 14 | 5.2% |
| Dutch | 50 | 18.6% |
| English | 97 | 36.1% |
| German | 131 | 48.7% |
| Irish | 16 | 5.9% |
| Italian | 53 | 19.7% |
| Polish | 1 | 0.4% | View All 7 Rows |
Immigrants in Tharptown Uniontown

| Immigration Origin | # Population | % Population | View All 0 Rows |
Sex and Age in Tharptown Uniontown
Sex and Age in Tharptown Uniontown
The most populous age groups in Tharptown Uniontown are 55 to 59 Years (47 | 37.3%) for men and 20 to 24 Years (32 | 22.4%) for women.
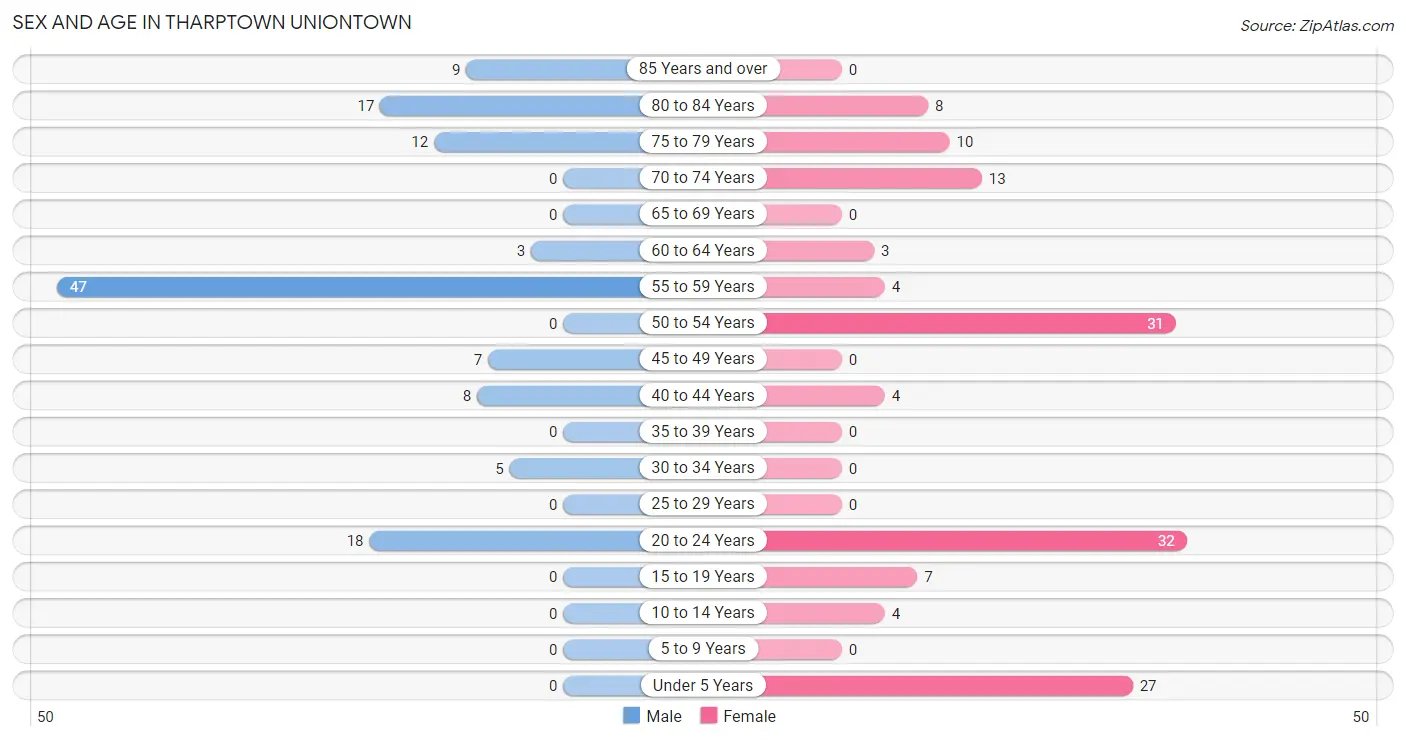
| Age Bracket | Male | Female |
| Under 5 Years | 0 (0.0%) | 27 (18.9%) |
| 5 to 9 Years | 0 (0.0%) | 0 (0.0%) |
| 10 to 14 Years | 0 (0.0%) | 4 (2.8%) |
| 15 to 19 Years | 0 (0.0%) | 7 (4.9%) |
| 20 to 24 Years | 18 (14.3%) | 32 (22.4%) |
| 25 to 29 Years | 0 (0.0%) | 0 (0.0%) |
| 30 to 34 Years | 5 (4.0%) | 0 (0.0%) |
| 35 to 39 Years | 0 (0.0%) | 0 (0.0%) |
| 40 to 44 Years | 8 (6.4%) | 4 (2.8%) |
| 45 to 49 Years | 7 (5.6%) | 0 (0.0%) |
| 50 to 54 Years | 0 (0.0%) | 31 (21.7%) |
| 55 to 59 Years | 47 (37.3%) | 4 (2.8%) |
| 60 to 64 Years | 3 (2.4%) | 3 (2.1%) |
| 65 to 69 Years | 0 (0.0%) | 0 (0.0%) |
| 70 to 74 Years | 0 (0.0%) | 13 (9.1%) |
| 75 to 79 Years | 12 (9.5%) | 10 (7.0%) |
| 80 to 84 Years | 17 (13.5%) | 8 (5.6%) |
| 85 Years and over | 9 (7.1%) | 0 (0.0%) |
| Total | 126 (100.0%) | 143 (100.0%) |
Families and Households in Tharptown Uniontown
Median Family Size in Tharptown Uniontown
The median family size in Tharptown Uniontown is 2.52 persons per family, with single male/father families (44 | 44.4%) accounting for the largest median family size of 2.68 persons per family. On the other hand, single female/mother families (17 | 17.2%) represent the smallest median family size with 2.06 persons per family.
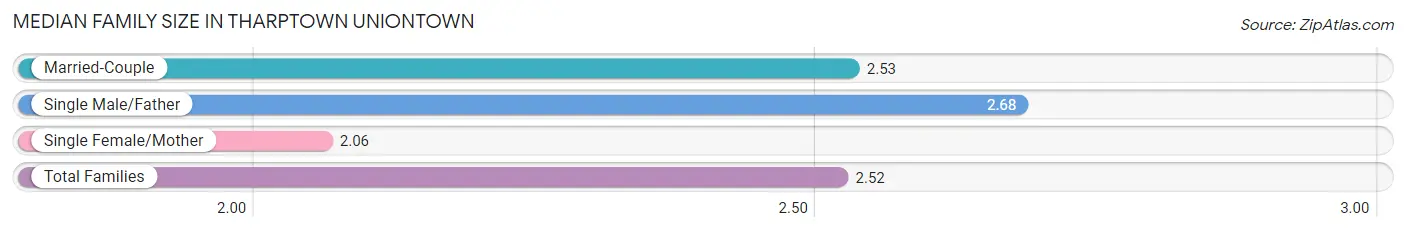
| Family Type | # Families | Family Size |
| Married-Couple | 38 (38.4%) | 2.53 |
| Single Male/Father | 44 (44.4%) | 2.68 |
| Single Female/Mother | 17 (17.2%) | 2.06 |
| Total Families | 99 (100.0%) | 2.52 |
Median Household Size in Tharptown Uniontown
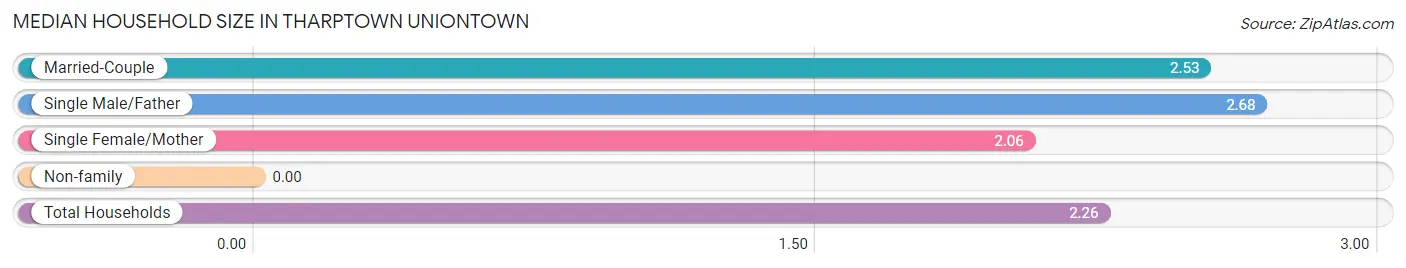
| Household Type | # Households | Household Size |
| Married-Couple | 38 (31.9%) | 2.53 |
| Single Male/Father | 44 (37.0%) | 2.68 |
| Single Female/Mother | 17 (14.3%) | 2.06 |
| Non-family | 20 (16.8%) | - |
| Total Households | 119 (100.0%) | 2.26 |
Household Size by Marriage Status in Tharptown Uniontown
Out of a total of 119 households in Tharptown Uniontown, 99 (83.2%) are family households, while 20 (16.8%) are nonfamily households. The most numerous type of family households are 2-person households, comprising 59, and the most common type of nonfamily households are 1-person households, comprising 20.
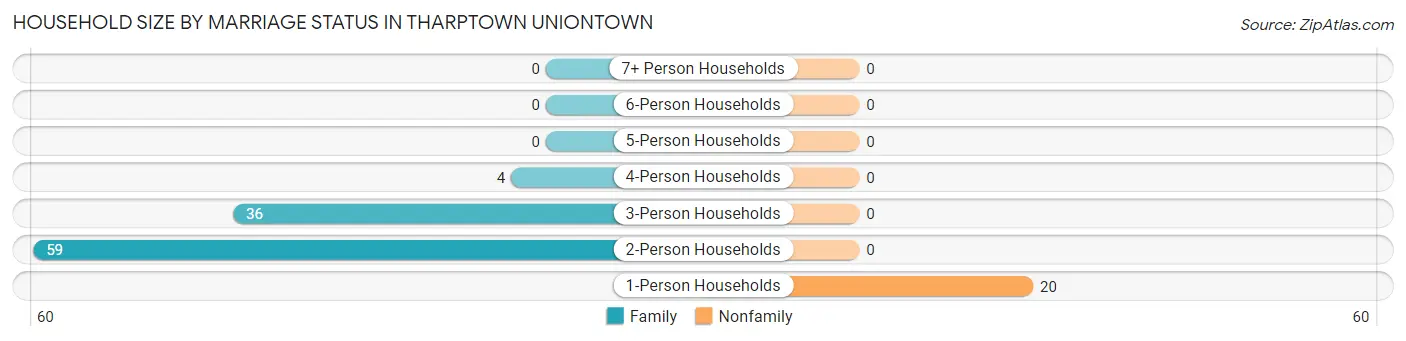
| Household Size | Family Households | Nonfamily Households |
| 1-Person Households | - | 20 (16.8%) |
| 2-Person Households | 59 (49.6%) | 0 (0.0%) |
| 3-Person Households | 36 (30.2%) | 0 (0.0%) |
| 4-Person Households | 4 (3.4%) | 0 (0.0%) |
| 5-Person Households | 0 (0.0%) | 0 (0.0%) |
| 6-Person Households | 0 (0.0%) | 0 (0.0%) |
| 7+ Person Households | 0 (0.0%) | 0 (0.0%) |
| Total | 99 (83.2%) | 20 (16.8%) |
Female Fertility in Tharptown Uniontown
Fertility by Age in Tharptown Uniontown
Average fertility rate in Tharptown Uniontown is 744.0 births per 1,000 women. Women in the age bracket of 20 to 34 years have the highest fertility rate with 1,000.0 births per 1,000 women. Women in the age bracket of 20 to 34 years acount for 100.0% of all women with births.
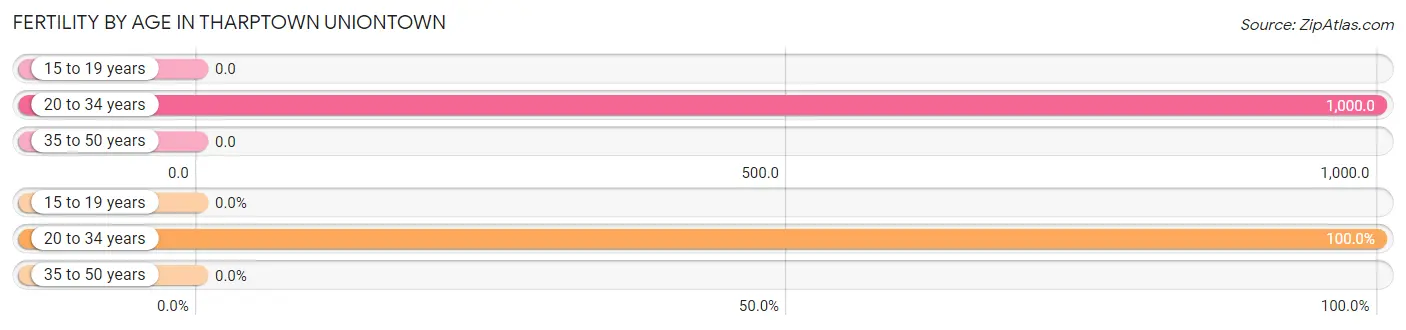
| Age Bracket | Women with Births | Births / 1,000 Women |
| 15 to 19 years | 0 (0.0%) | 0.0 |
| 20 to 34 years | 32 (100.0%) | 1,000.0 |
| 35 to 50 years | 0 (0.0%) | 0.0 |
| Total | 32 (100.0%) | 744.0 |
Fertility by Age by Marriage Status in Tharptown Uniontown
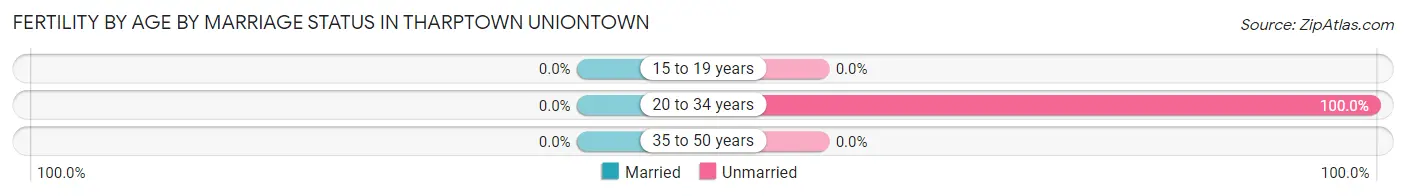
| Age Bracket | Married | Unmarried |
| 15 to 19 years | 0 (0.0%) | 0 (0.0%) |
| 20 to 34 years | 0 (0.0%) | 32 (100.0%) |
| 35 to 50 years | 0 (0.0%) | 0 (0.0%) |
| Total | 0 (0.0%) | 32 (100.0%) |
Fertility by Education in Tharptown Uniontown
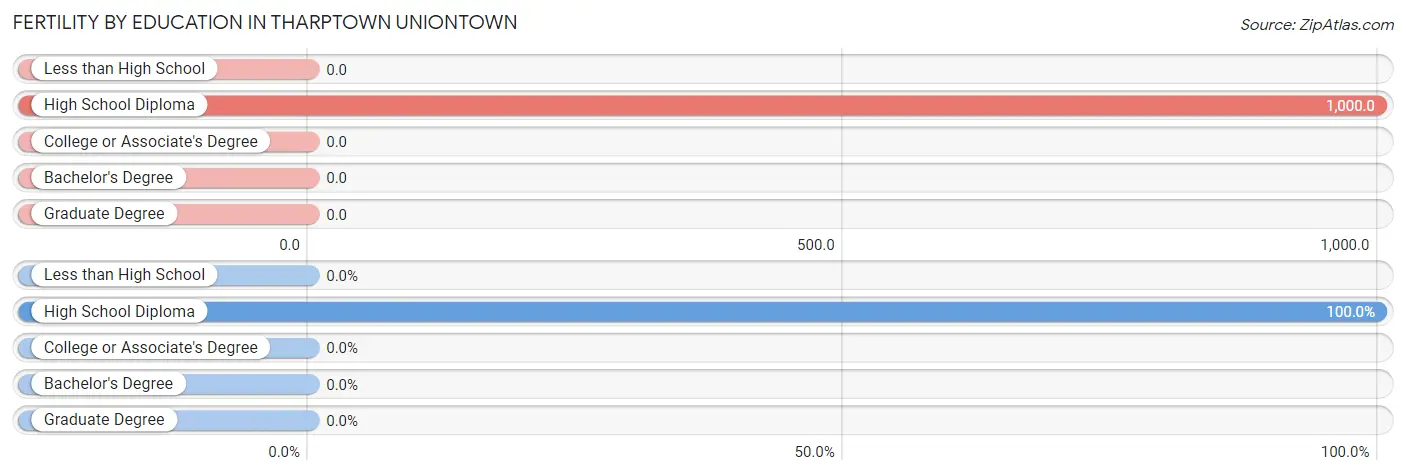
| Educational Attainment | Women with Births | Births / 1,000 Women |
| Less than High School | 0 (0.0%) | 0.0 |
| High School Diploma | 32 (100.0%) | 1,000.0 |
| College or Associate's Degree | 0 (0.0%) | 0.0 |
| Bachelor's Degree | 0 (0.0%) | 0.0 |
| Graduate Degree | 0 (0.0%) | 0.0 |
| Total | 32 (100.0%) | 744.0 |
Fertility by Education by Marriage Status in Tharptown Uniontown
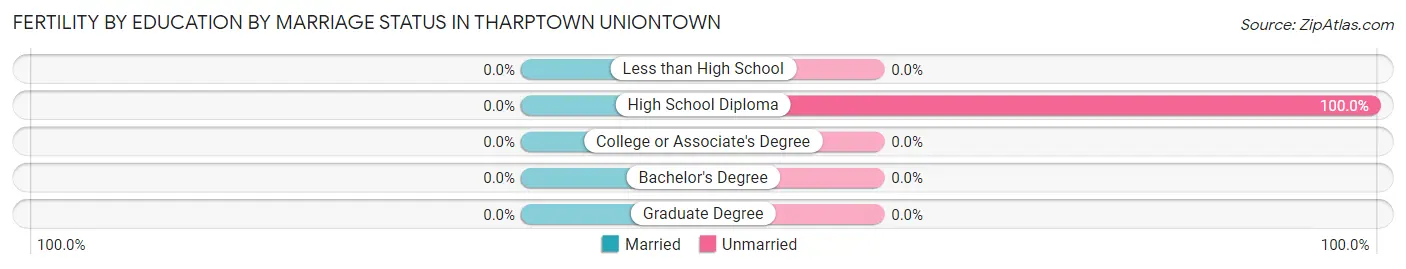
| Educational Attainment | Married | Unmarried |
| Less than High School | 0 (0.0%) | 0 (0.0%) |
| High School Diploma | 0 (0.0%) | 32 (100.0%) |
| College or Associate's Degree | 0 (0.0%) | 0 (0.0%) |
| Bachelor's Degree | 0 (0.0%) | 0 (0.0%) |
| Graduate Degree | 0 (0.0%) | 0 (0.0%) |
| Total | 0 (0.0%) | 32 (100.0%) |
Income in Tharptown Uniontown
Income Overview in Tharptown Uniontown
| Characteristic | Number | Measure |
| Per Capita Income | 269 | $30,695 |
| Median Family Income | 99 | $55,956 |
| Mean Family Income | 99 | $78,661 |
| Median Household Income | 119 | $0 |
| Mean Household Income | 119 | $69,429 |
| Income Deficit | 99 | $0 |
| Wage / Income Gap (%) | 269 | 28.47% |
| Wage / Income Gap ($) | 269 | 71.53¢ per $1 |
| Gini / Inequality Index | 269 | 0.50 |
Earnings by Sex in Tharptown Uniontown
Average Earnings in Tharptown Uniontown are $33,194, $43,438 for men and $31,071 for women, a difference of 28.5%.
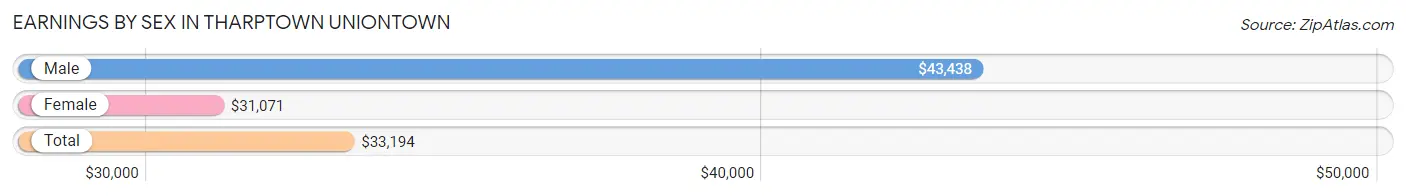
| Sex | Number | Average Earnings |
| Male | 57 (41.0%) | $43,438 |
| Female | 82 (59.0%) | $31,071 |
| Total | 139 (100.0%) | $33,194 |
Earnings by Sex by Income Bracket in Tharptown Uniontown
The most common earnings brackets in Tharptown Uniontown are $17,500 to $19,999 for men (18 | 31.6%) and $12,500 to $14,999 for women (32 | 39.0%).
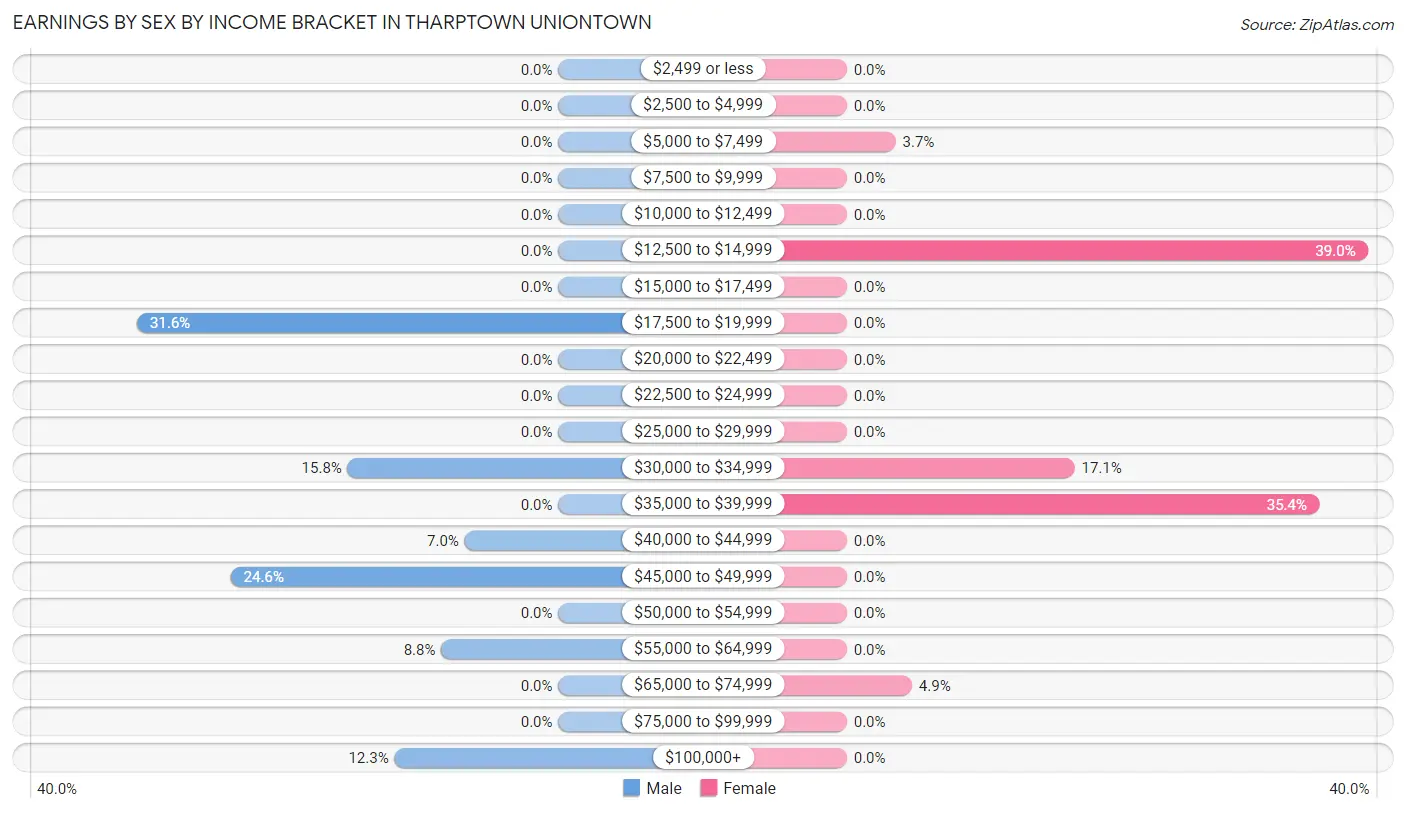
| Income | Male | Female |
| $2,499 or less | 0 (0.0%) | 0 (0.0%) |
| $2,500 to $4,999 | 0 (0.0%) | 0 (0.0%) |
| $5,000 to $7,499 | 0 (0.0%) | 3 (3.7%) |
| $7,500 to $9,999 | 0 (0.0%) | 0 (0.0%) |
| $10,000 to $12,499 | 0 (0.0%) | 0 (0.0%) |
| $12,500 to $14,999 | 0 (0.0%) | 32 (39.0%) |
| $15,000 to $17,499 | 0 (0.0%) | 0 (0.0%) |
| $17,500 to $19,999 | 18 (31.6%) | 0 (0.0%) |
| $20,000 to $22,499 | 0 (0.0%) | 0 (0.0%) |
| $22,500 to $24,999 | 0 (0.0%) | 0 (0.0%) |
| $25,000 to $29,999 | 0 (0.0%) | 0 (0.0%) |
| $30,000 to $34,999 | 9 (15.8%) | 14 (17.1%) |
| $35,000 to $39,999 | 0 (0.0%) | 29 (35.4%) |
| $40,000 to $44,999 | 4 (7.0%) | 0 (0.0%) |
| $45,000 to $49,999 | 14 (24.6%) | 0 (0.0%) |
| $50,000 to $54,999 | 0 (0.0%) | 0 (0.0%) |
| $55,000 to $64,999 | 5 (8.8%) | 0 (0.0%) |
| $65,000 to $74,999 | 0 (0.0%) | 4 (4.9%) |
| $75,000 to $99,999 | 0 (0.0%) | 0 (0.0%) |
| $100,000+ | 7 (12.3%) | 0 (0.0%) |
| Total | 57 (100.0%) | 82 (100.0%) |
Earnings by Sex by Educational Attainment in Tharptown Uniontown
| Educational Attainment | Male Income | Female Income |
| Less than High School | - | - |
| High School Diploma | - | - |
| College or Associate's Degree | - | - |
| Bachelor's Degree | - | - |
| Graduate Degree | - | - |
| Total | $46,161 | $36,667 |
Family Income in Tharptown Uniontown
Family Income Brackets in Tharptown Uniontown
According to the Tharptown Uniontown family income data, there are 29 families falling into the $15,000 to $24,999 income range, which is the most common income bracket and makes up 29.3% of all families.
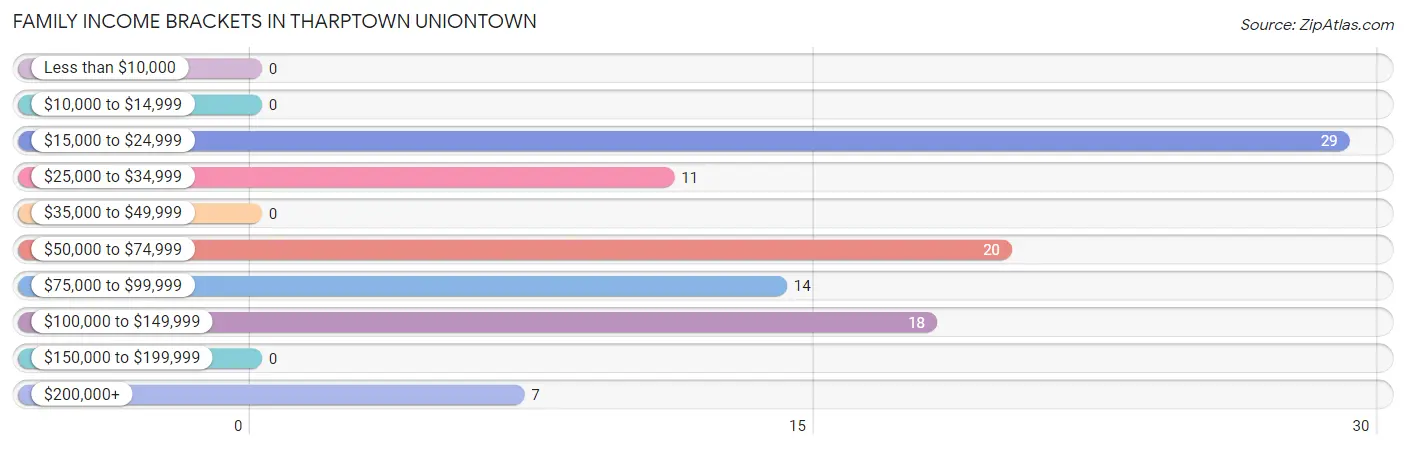
| Income Bracket | # Families | % Families |
| Less than $10,000 | 0 | 0.0% |
| $10,000 to $14,999 | 0 | 0.0% |
| $15,000 to $24,999 | 29 | 29.3% |
| $25,000 to $34,999 | 11 | 11.1% |
| $35,000 to $49,999 | 0 | 0.0% |
| $50,000 to $74,999 | 20 | 20.2% |
| $75,000 to $99,999 | 14 | 14.1% |
| $100,000 to $149,999 | 18 | 18.2% |
| $150,000 to $199,999 | 0 | 0.0% |
| $200,000+ | 7 | 7.1% |
Family Income by Famaliy Size in Tharptown Uniontown
2-person families (59 | 59.6%) account for the highest median family income in Tharptown Uniontown with $75,089 per family, while 2-person families (59 | 59.6%) have the highest median income of $37,544 per family member.
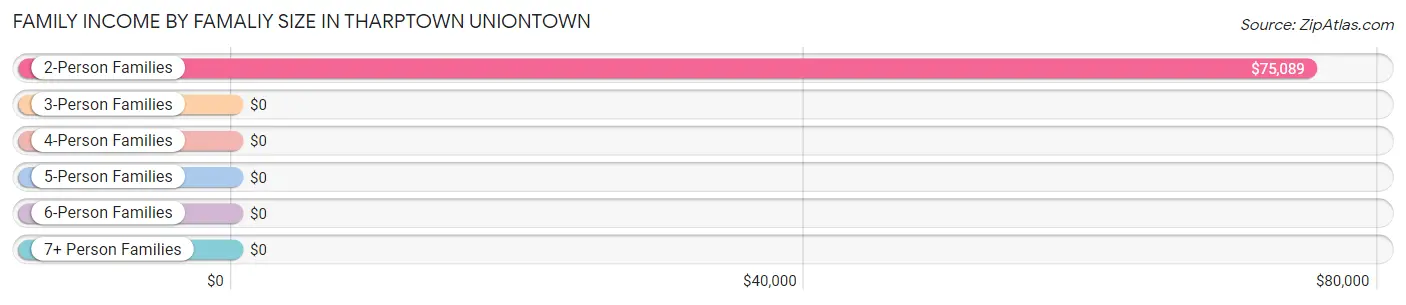
| Income Bracket | # Families | Median Income |
| 2-Person Families | 59 (59.6%) | $75,089 |
| 3-Person Families | 36 (36.4%) | $0 |
| 4-Person Families | 4 (4.0%) | $0 |
| 5-Person Families | 0 (0.0%) | $0 |
| 6-Person Families | 0 (0.0%) | $0 |
| 7+ Person Families | 0 (0.0%) | $0 |
| Total | 99 (100.0%) | $55,956 |
Family Income by Number of Earners in Tharptown Uniontown
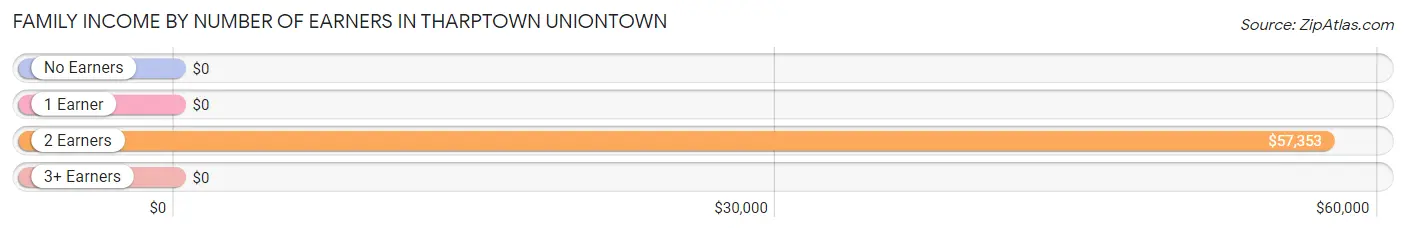
| Number of Earners | # Families | Median Income |
| No Earners | 12 (12.1%) | $0 |
| 1 Earner | 44 (44.4%) | $0 |
| 2 Earners | 38 (38.4%) | $57,353 |
| 3+ Earners | 5 (5.1%) | $0 |
| Total | 99 (100.0%) | $55,956 |
Household Income in Tharptown Uniontown
Household Income Brackets in Tharptown Uniontown
With 39 households falling in the category, the $15,000 to $24,999 income range is the most frequent in Tharptown Uniontown, accounting for 32.8% of all households.
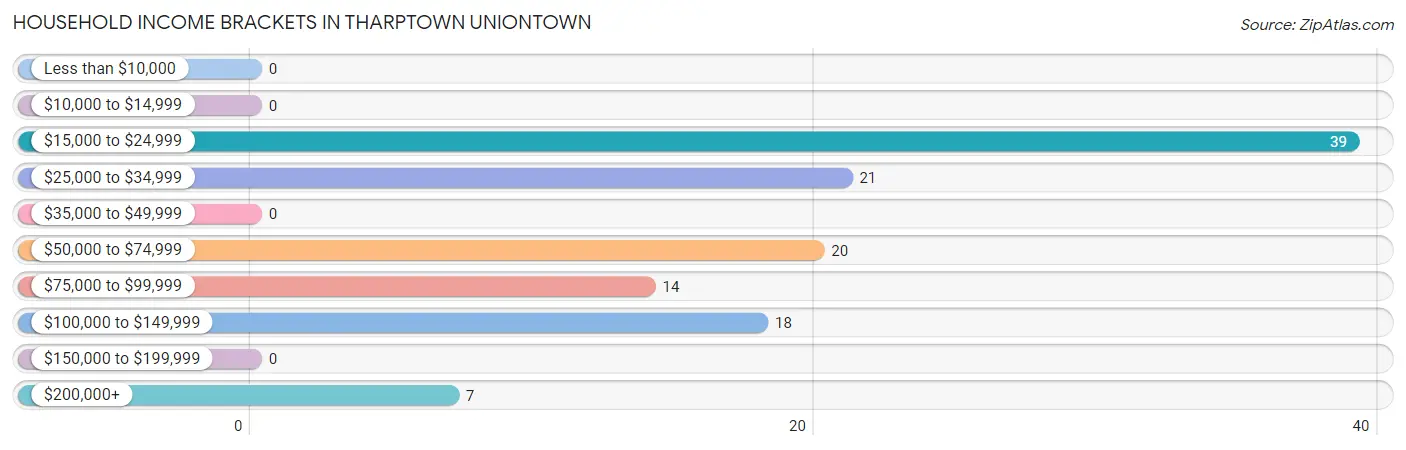
| Income Bracket | # Households | % Households |
| Less than $10,000 | 0 | 0.0% |
| $10,000 to $14,999 | 0 | 0.0% |
| $15,000 to $24,999 | 39 | 32.8% |
| $25,000 to $34,999 | 21 | 17.6% |
| $35,000 to $49,999 | 0 | 0.0% |
| $50,000 to $74,999 | 20 | 16.8% |
| $75,000 to $99,999 | 14 | 11.8% |
| $100,000 to $149,999 | 18 | 15.1% |
| $150,000 to $199,999 | 0 | 0.0% |
| $200,000+ | 7 | 5.9% |
Household Income by Householder Age in Tharptown Uniontown
| Income Bracket | # Households | Median Income |
| 15 to 24 Years | 0 (0.0%) | $0 |
| 25 to 44 Years | 4 (3.4%) | $0 |
| 45 to 64 Years | 67 (56.3%) | $0 |
| 65+ Years | 48 (40.3%) | $0 |
| Total | 119 (100.0%) | $0 |
Poverty in Tharptown Uniontown
Income Below Poverty by Sex and Age in Tharptown Uniontown
With 23.0% poverty level for males and 43.4% for females among the residents of Tharptown Uniontown, 55 to 64 year old males and under 5 year old females are the most vulnerable to poverty, with 28 males (56.0%) and 27 females (100.0%) in their respective age groups living below the poverty level.
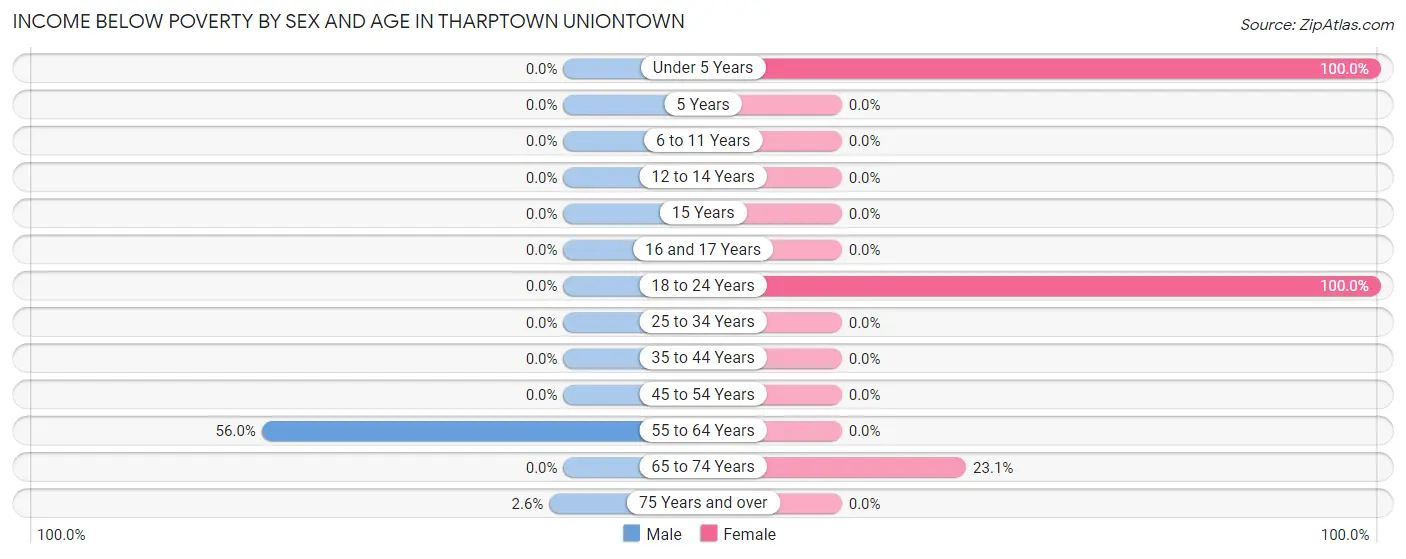
| Age Bracket | Male | Female |
| Under 5 Years | 0 (0.0%) | 27 (100.0%) |
| 5 Years | 0 (0.0%) | 0 (0.0%) |
| 6 to 11 Years | 0 (0.0%) | 0 (0.0%) |
| 12 to 14 Years | 0 (0.0%) | 0 (0.0%) |
| 15 Years | 0 (0.0%) | 0 (0.0%) |
| 16 and 17 Years | 0 (0.0%) | 0 (0.0%) |
| 18 to 24 Years | 0 (0.0%) | 32 (100.0%) |
| 25 to 34 Years | 0 (0.0%) | 0 (0.0%) |
| 35 to 44 Years | 0 (0.0%) | 0 (0.0%) |
| 45 to 54 Years | 0 (0.0%) | 0 (0.0%) |
| 55 to 64 Years | 28 (56.0%) | 0 (0.0%) |
| 65 to 74 Years | 0 (0.0%) | 3 (23.1%) |
| 75 Years and over | 1 (2.6%) | 0 (0.0%) |
| Total | 29 (23.0%) | 62 (43.4%) |
Income Above Poverty by Sex and Age in Tharptown Uniontown
According to the poverty statistics in Tharptown Uniontown, males aged 18 to 24 years and females aged 12 to 14 years are the age groups that are most secure financially, with 100.0% of males and 100.0% of females in these age groups living above the poverty line.
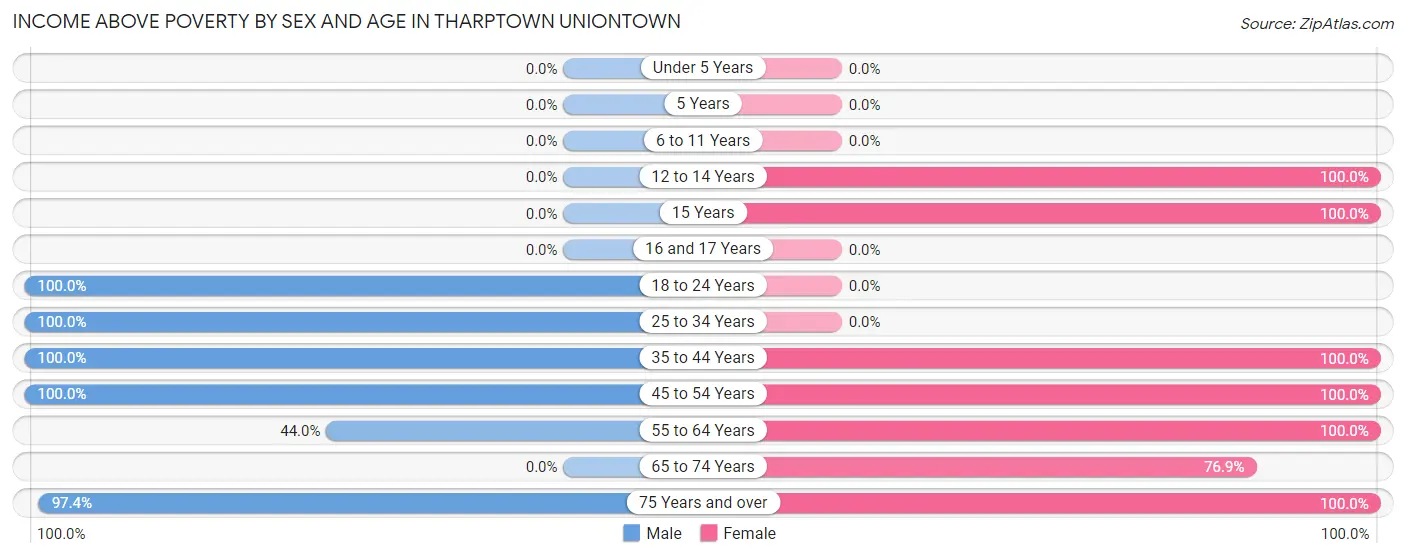
| Age Bracket | Male | Female |
| Under 5 Years | 0 (0.0%) | 0 (0.0%) |
| 5 Years | 0 (0.0%) | 0 (0.0%) |
| 6 to 11 Years | 0 (0.0%) | 0 (0.0%) |
| 12 to 14 Years | 0 (0.0%) | 4 (100.0%) |
| 15 Years | 0 (0.0%) | 7 (100.0%) |
| 16 and 17 Years | 0 (0.0%) | 0 (0.0%) |
| 18 to 24 Years | 18 (100.0%) | 0 (0.0%) |
| 25 to 34 Years | 5 (100.0%) | 0 (0.0%) |
| 35 to 44 Years | 8 (100.0%) | 4 (100.0%) |
| 45 to 54 Years | 7 (100.0%) | 31 (100.0%) |
| 55 to 64 Years | 22 (44.0%) | 7 (100.0%) |
| 65 to 74 Years | 0 (0.0%) | 10 (76.9%) |
| 75 Years and over | 37 (97.4%) | 18 (100.0%) |
| Total | 97 (77.0%) | 81 (56.6%) |
Income Below Poverty Among Married-Couple Families in Tharptown Uniontown
The poverty statistics for married-couple families in Tharptown Uniontown show that 2.6% or 1 of the total 38 families live below the poverty line. Families with no children have the highest poverty rate of 2.9%, comprising of 1 families. On the other hand, families with 1 or 2 children have the lowest poverty rate of 0.0%, which includes 0 families.
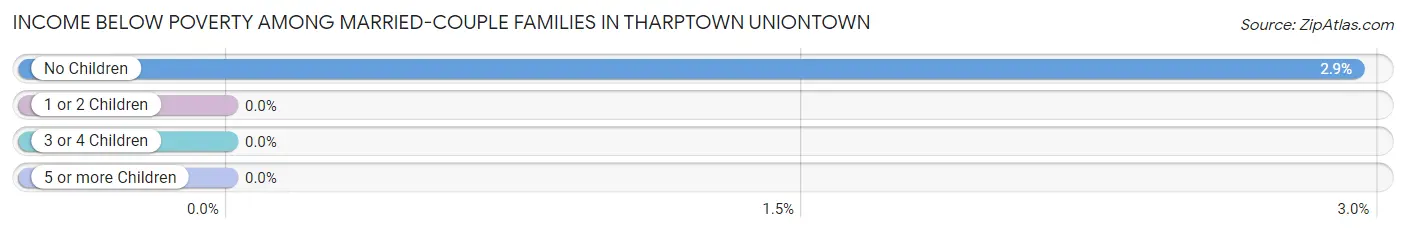
| Children | Above Poverty | Below Poverty |
| No Children | 33 (97.1%) | 1 (2.9%) |
| 1 or 2 Children | 4 (100.0%) | 0 (0.0%) |
| 3 or 4 Children | 0 (0.0%) | 0 (0.0%) |
| 5 or more Children | 0 (0.0%) | 0 (0.0%) |
| Total | 37 (97.4%) | 1 (2.6%) |
Income Below Poverty Among Single-Parent Households in Tharptown Uniontown
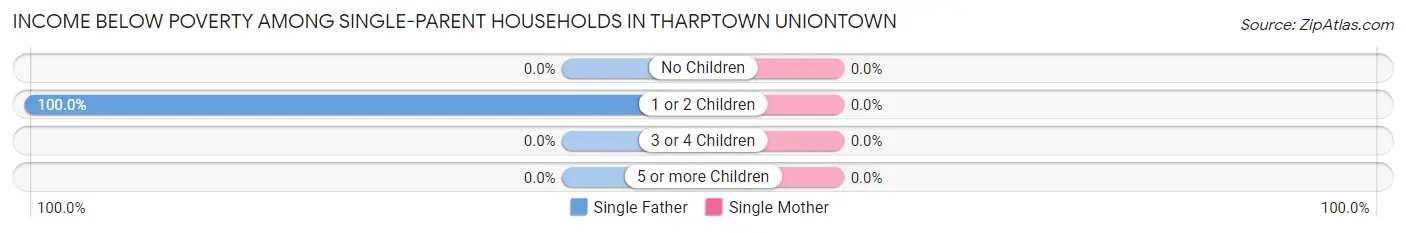
| Children | Single Father | Single Mother |
| No Children | 0 (0.0%) | 0 (0.0%) |
| 1 or 2 Children | 28 (100.0%) | 0 (0.0%) |
| 3 or 4 Children | 0 (0.0%) | 0 (0.0%) |
| 5 or more Children | 0 (0.0%) | 0 (0.0%) |
| Total | 28 (63.6%) | 0 (0.0%) |
Income Below Poverty Among Married-Couple vs Single-Parent Households in Tharptown Uniontown
The poverty data for Tharptown Uniontown shows that 1 of the married-couple family households (2.6%) and 28 of the single-parent households (45.9%) are living below the poverty level. Within the married-couple family households, those with no children have the highest poverty rate, with 1 households (2.9%) falling below the poverty line. Among the single-parent households, those with 1 or 2 children have the highest poverty rate, with 28 household (100.0%) living below poverty.
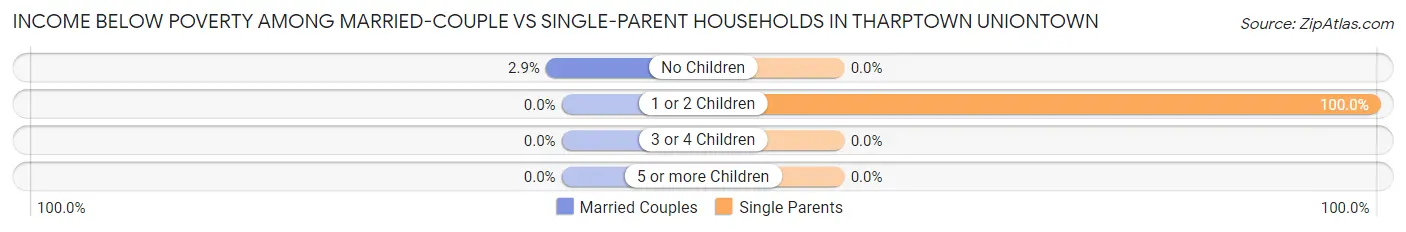
| Children | Married-Couple Families | Single-Parent Households |
| No Children | 1 (2.9%) | 0 (0.0%) |
| 1 or 2 Children | 0 (0.0%) | 28 (100.0%) |
| 3 or 4 Children | 0 (0.0%) | 0 (0.0%) |
| 5 or more Children | 0 (0.0%) | 0 (0.0%) |
| Total | 1 (2.6%) | 28 (45.9%) |
Employment Characteristics in Tharptown Uniontown
Employment by Class of Employer in Tharptown Uniontown
Among the 135 employed individuals in Tharptown Uniontown, private company employees (117 | 86.7%), and not-for-profit organizations (18 | 13.3%) make up the most common classes of employment.
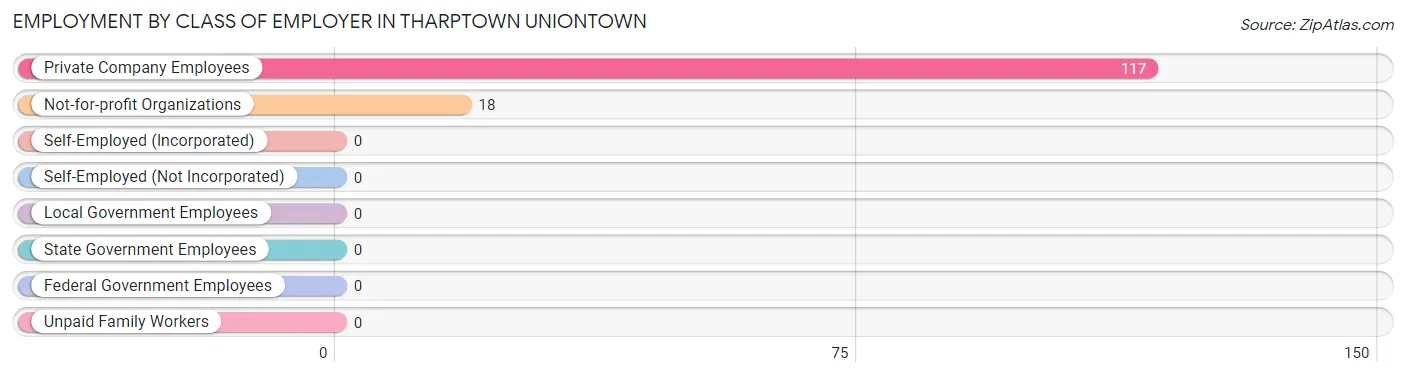
| Employer Class | # Employees | % Employees |
| Private Company Employees | 117 | 86.7% |
| Self-Employed (Incorporated) | 0 | 0.0% |
| Self-Employed (Not Incorporated) | 0 | 0.0% |
| Not-for-profit Organizations | 18 | 13.3% |
| Local Government Employees | 0 | 0.0% |
| State Government Employees | 0 | 0.0% |
| Federal Government Employees | 0 | 0.0% |
| Unpaid Family Workers | 0 | 0.0% |
| Total | 135 | 100.0% |
Employment Status by Age in Tharptown Uniontown
According to the labor force statistics for Tharptown Uniontown, out of the total population over 16 years of age (231), 70.6% or 163 individuals are in the labor force, with 17.2% or 28 of them unemployed. The age group with the highest labor force participation rate is 20 to 24 years, with 100.0% or 50 individuals in the labor force. Within the labor force, the 55 to 59 years age range has the highest percentage of unemployed individuals, with 54.9% or 28 of them being unemployed.
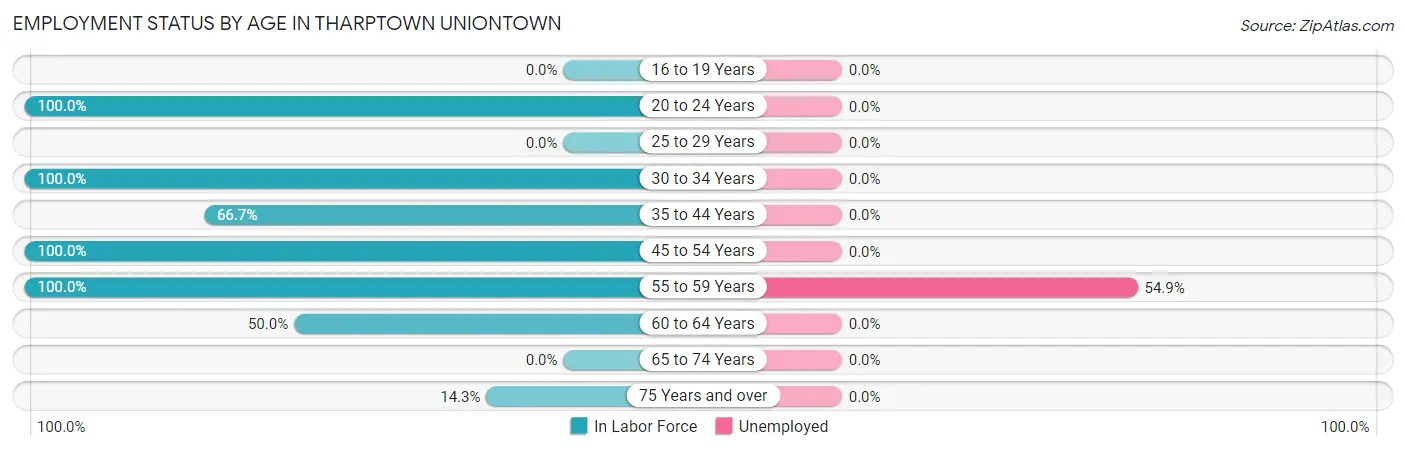
| Age Bracket | In Labor Force | Unemployed |
| 16 to 19 Years | 0 (0.0%) | 0 (0.0%) |
| 20 to 24 Years | 50 (100.0%) | 0 (0.0%) |
| 25 to 29 Years | 0 (0.0%) | 0 (0.0%) |
| 30 to 34 Years | 5 (100.0%) | 0 (0.0%) |
| 35 to 44 Years | 8 (66.7%) | 0 (0.0%) |
| 45 to 54 Years | 38 (100.0%) | 0 (0.0%) |
| 55 to 59 Years | 51 (100.0%) | 28 (54.9%) |
| 60 to 64 Years | 3 (50.0%) | 0 (0.0%) |
| 65 to 74 Years | 0 (0.0%) | 0 (0.0%) |
| 75 Years and over | 8 (14.3%) | 0 (0.0%) |
| Total | 163 (70.6%) | 28 (17.2%) |
Employment Status by Educational Attainment in Tharptown Uniontown
According to labor force statistics for Tharptown Uniontown, 93.8% of individuals (105) out of the total population between 25 and 64 years of age (112) are in the labor force, with 26.7% or 28 of them being unemployed. The group with the highest labor force participation rate are those with the educational attainment of less than high school, with 100.0% or 10 individuals in the labor force. Within the labor force, individuals with college / associate degree education have the highest percentage of unemployment, with 44.4% or 28 of them being unemployed.
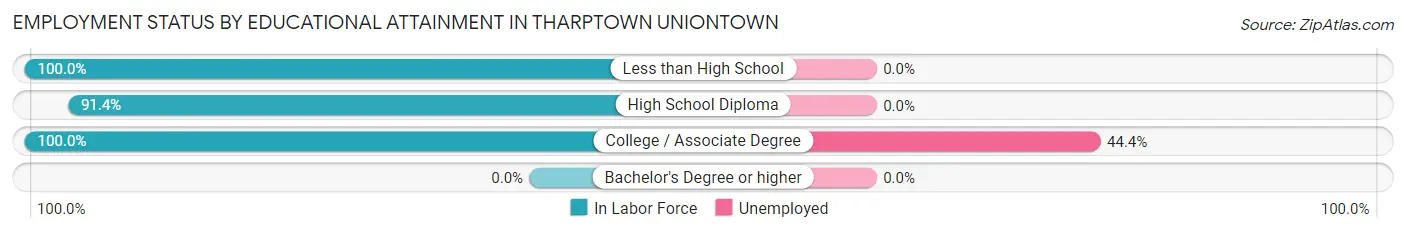
| Educational Attainment | In Labor Force | Unemployed |
| Less than High School | 10 (100.0%) | 0 (0.0%) |
| High School Diploma | 32 (91.4%) | 0 (0.0%) |
| College / Associate Degree | 63 (100.0%) | 28 (44.4%) |
| Bachelor's Degree or higher | 0 (0.0%) | 0 (0.0%) |
| Total | 105 (93.8%) | 30 (26.7%) |
Employment Occupations by Sex in Tharptown Uniontown
Management, Business, Science and Arts Occupations
The most common Management, Business, Science and Arts occupations in Tharptown Uniontown are Management (8 | 5.9%), Computers, Engineering & Science (4 | 3.0%), and Architecture & Engineering (4 | 3.0%).
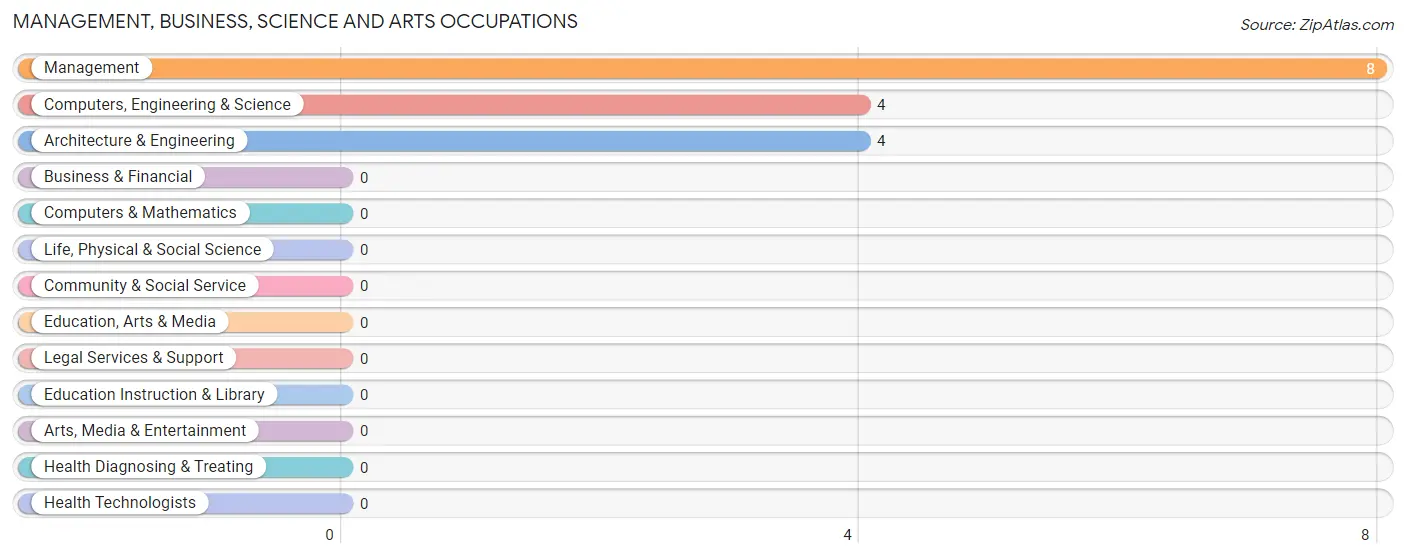
Management, Business, Science and Arts Occupations by Sex
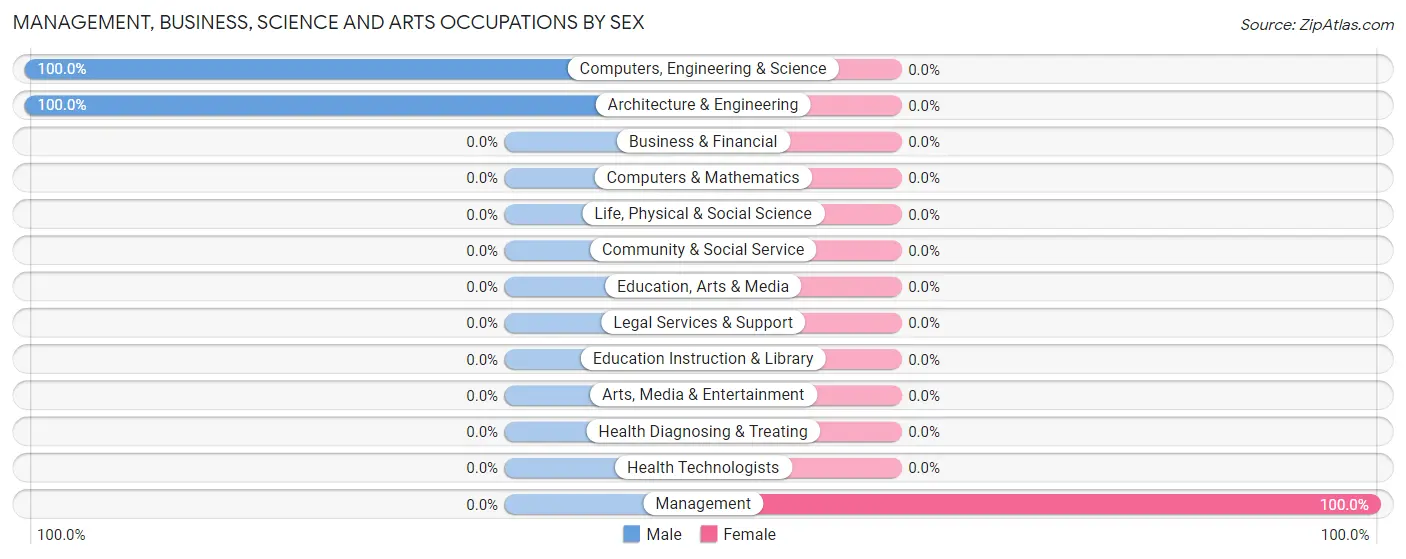
| Occupation | Male | Female |
| Management | 0 (0.0%) | 8 (100.0%) |
| Business & Financial | 0 (0.0%) | 0 (0.0%) |
| Computers, Engineering & Science | 4 (100.0%) | 0 (0.0%) |
| Computers & Mathematics | 0 (0.0%) | 0 (0.0%) |
| Architecture & Engineering | 4 (100.0%) | 0 (0.0%) |
| Life, Physical & Social Science | 0 (0.0%) | 0 (0.0%) |
| Community & Social Service | 0 (0.0%) | 0 (0.0%) |
| Education, Arts & Media | 0 (0.0%) | 0 (0.0%) |
| Legal Services & Support | 0 (0.0%) | 0 (0.0%) |
| Education Instruction & Library | 0 (0.0%) | 0 (0.0%) |
| Arts, Media & Entertainment | 0 (0.0%) | 0 (0.0%) |
| Health Diagnosing & Treating | 0 (0.0%) | 0 (0.0%) |
| Health Technologists | 0 (0.0%) | 0 (0.0%) |
| Total (Category) | 4 (33.3%) | 8 (66.7%) |
| Total (Overall) | 57 (42.2%) | 78 (57.8%) |
Services Occupations
The most common Services occupations in Tharptown Uniontown are Healthcare Support (36 | 26.7%), and Food Preparation & Serving (3 | 2.2%).
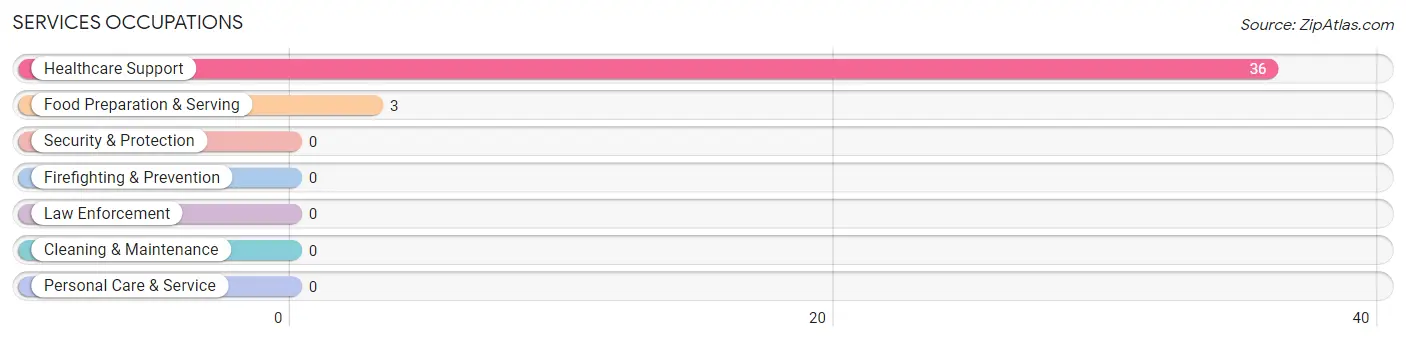
Services Occupations by Sex
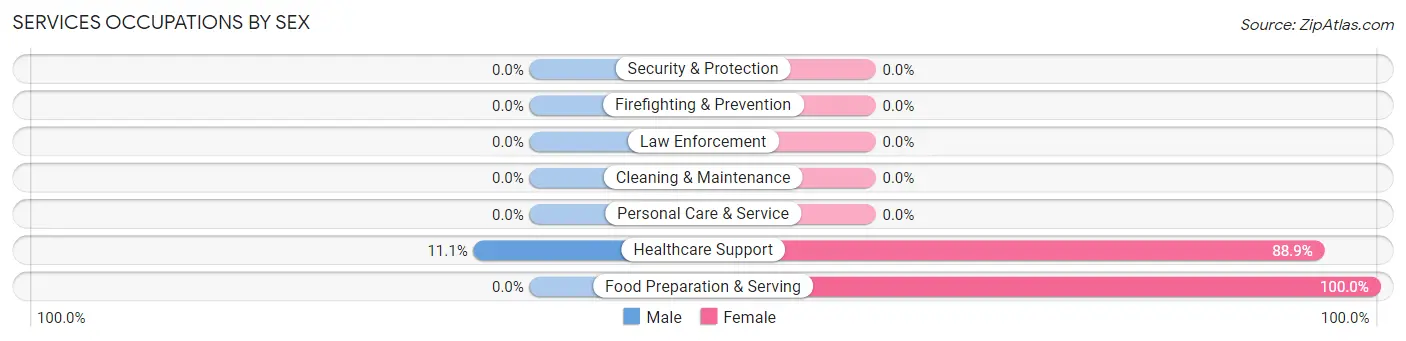
| Occupation | Male | Female |
| Healthcare Support | 4 (11.1%) | 32 (88.9%) |
| Security & Protection | 0 (0.0%) | 0 (0.0%) |
| Firefighting & Prevention | 0 (0.0%) | 0 (0.0%) |
| Law Enforcement | 0 (0.0%) | 0 (0.0%) |
| Food Preparation & Serving | 0 (0.0%) | 3 (100.0%) |
| Cleaning & Maintenance | 0 (0.0%) | 0 (0.0%) |
| Personal Care & Service | 0 (0.0%) | 0 (0.0%) |
| Total (Category) | 4 (10.3%) | 35 (89.7%) |
| Total (Overall) | 57 (42.2%) | 78 (57.8%) |
Sales and Office Occupations
The most common Sales and Office occupations in Tharptown Uniontown are , and Office & Administration (31 | 23.0%).
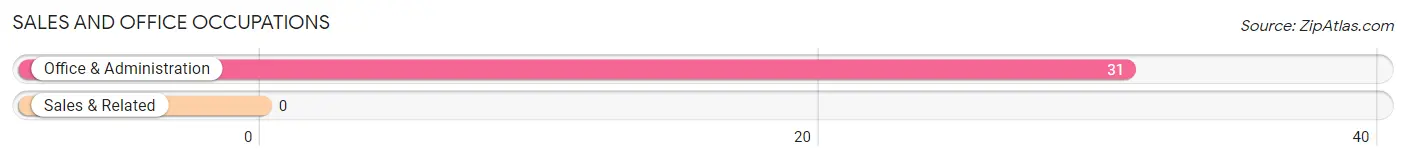
Sales and Office Occupations by Sex
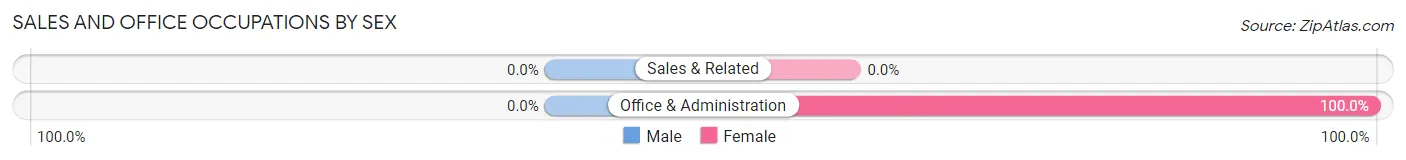
| Occupation | Male | Female |
| Sales & Related | 0 (0.0%) | 0 (0.0%) |
| Office & Administration | 0 (0.0%) | 31 (100.0%) |
| Total (Category) | 0 (0.0%) | 31 (100.0%) |
| Total (Overall) | 57 (42.2%) | 78 (57.8%) |
Natural Resources, Construction and Maintenance Occupations
The most common Natural Resources, Construction and Maintenance occupations in Tharptown Uniontown are , and Construction & Extraction (7 | 5.2%).
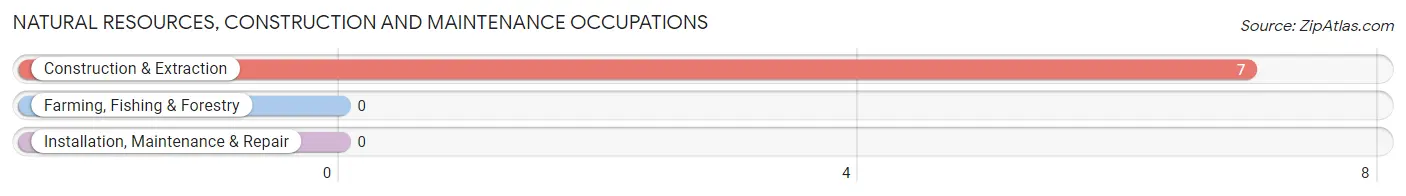
Natural Resources, Construction and Maintenance Occupations by Sex
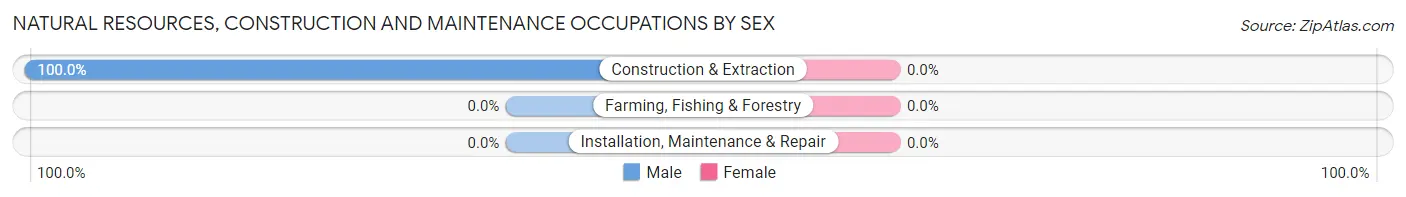
| Occupation | Male | Female |
| Farming, Fishing & Forestry | 0 (0.0%) | 0 (0.0%) |
| Construction & Extraction | 7 (100.0%) | 0 (0.0%) |
| Installation, Maintenance & Repair | 0 (0.0%) | 0 (0.0%) |
| Total (Category) | 7 (100.0%) | 0 (0.0%) |
| Total (Overall) | 57 (42.2%) | 78 (57.8%) |
Production, Transportation and Moving Occupations
The most common Production, Transportation and Moving occupations in Tharptown Uniontown are Material Moving (18 | 13.3%), Production (14 | 10.4%), and Transportation (14 | 10.4%).
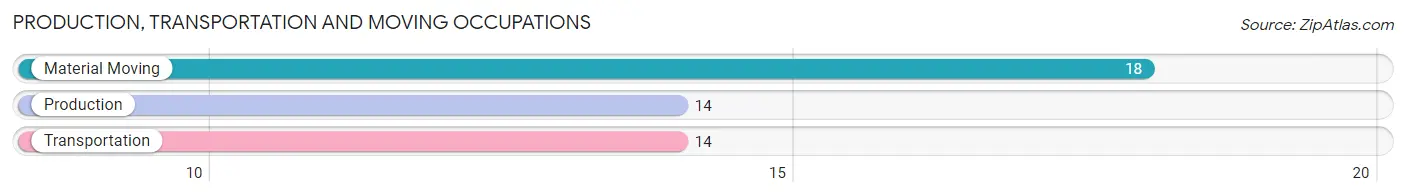
Production, Transportation and Moving Occupations by Sex
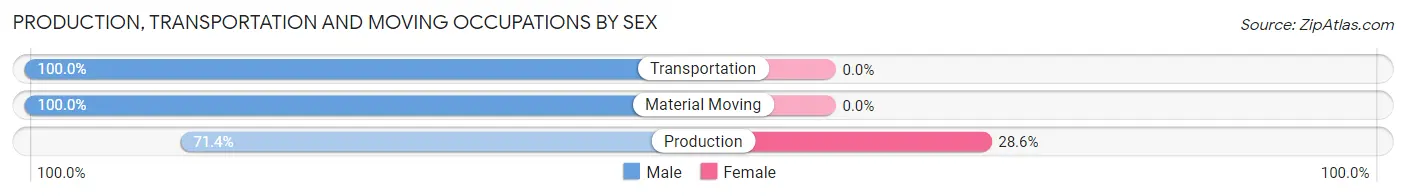
| Occupation | Male | Female |
| Production | 10 (71.4%) | 4 (28.6%) |
| Transportation | 14 (100.0%) | 0 (0.0%) |
| Material Moving | 18 (100.0%) | 0 (0.0%) |
| Total (Category) | 42 (91.3%) | 4 (8.7%) |
| Total (Overall) | 57 (42.2%) | 78 (57.8%) |
Employment Industries by Sex in Tharptown Uniontown
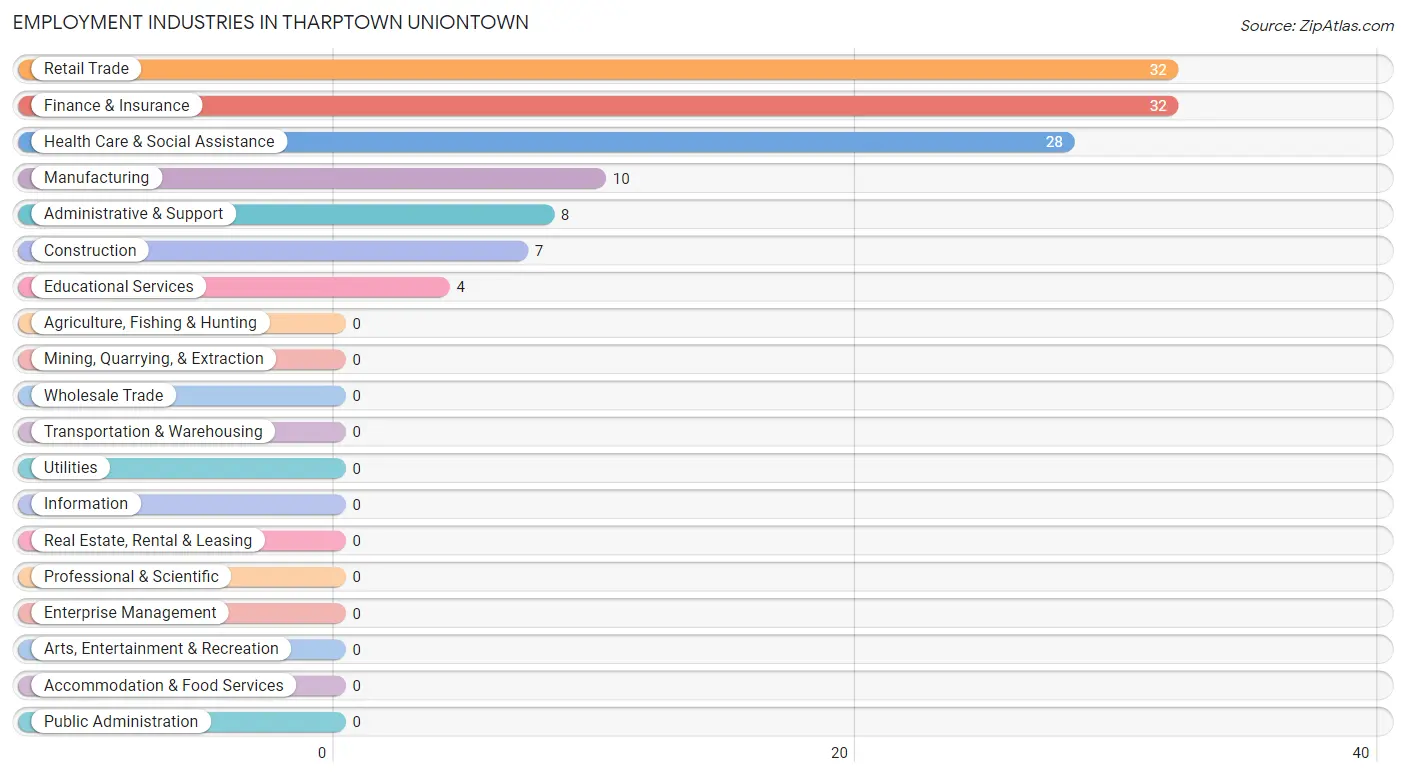
Employment Industries in Tharptown Uniontown
The major employment industries in Tharptown Uniontown include Retail Trade (32 | 23.7%), Finance & Insurance (32 | 23.7%), Health Care & Social Assistance (28 | 20.7%), Manufacturing (10 | 7.4%), and Administrative & Support (8 | 5.9%).
Employment Industries by Sex in Tharptown Uniontown
The Tharptown Uniontown industries that see more men than women are Construction (100.0%), Manufacturing (100.0%), and Retail Trade (100.0%), whereas the industries that tend to have a higher number of women are Finance & Insurance (100.0%), Administrative & Support (100.0%), and Health Care & Social Assistance (85.7%).
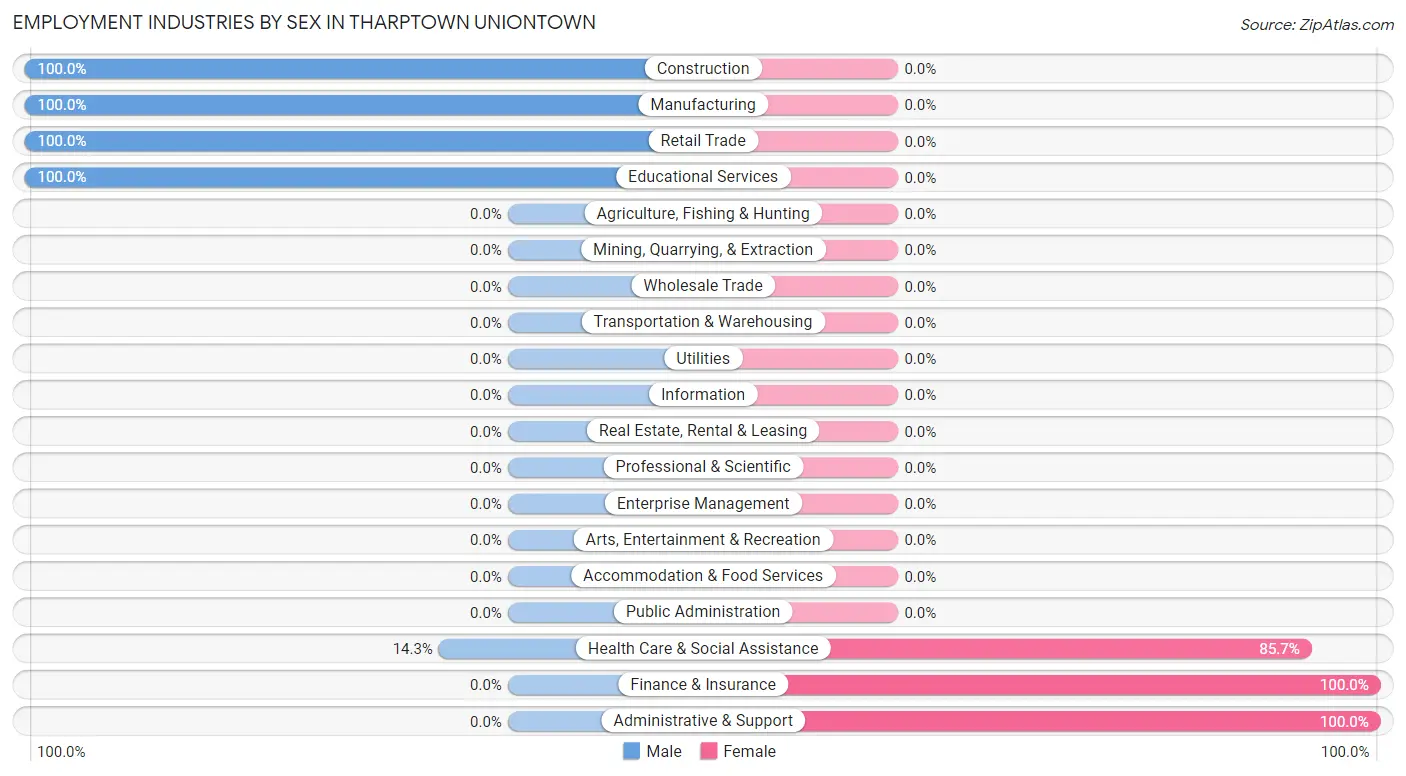
| Industry | Male | Female |
| Agriculture, Fishing & Hunting | 0 (0.0%) | 0 (0.0%) |
| Mining, Quarrying, & Extraction | 0 (0.0%) | 0 (0.0%) |
| Construction | 7 (100.0%) | 0 (0.0%) |
| Manufacturing | 10 (100.0%) | 0 (0.0%) |
| Wholesale Trade | 0 (0.0%) | 0 (0.0%) |
| Retail Trade | 32 (100.0%) | 0 (0.0%) |
| Transportation & Warehousing | 0 (0.0%) | 0 (0.0%) |
| Utilities | 0 (0.0%) | 0 (0.0%) |
| Information | 0 (0.0%) | 0 (0.0%) |
| Finance & Insurance | 0 (0.0%) | 32 (100.0%) |
| Real Estate, Rental & Leasing | 0 (0.0%) | 0 (0.0%) |
| Professional & Scientific | 0 (0.0%) | 0 (0.0%) |
| Enterprise Management | 0 (0.0%) | 0 (0.0%) |
| Administrative & Support | 0 (0.0%) | 8 (100.0%) |
| Educational Services | 4 (100.0%) | 0 (0.0%) |
| Health Care & Social Assistance | 4 (14.3%) | 24 (85.7%) |
| Arts, Entertainment & Recreation | 0 (0.0%) | 0 (0.0%) |
| Accommodation & Food Services | 0 (0.0%) | 0 (0.0%) |
| Public Administration | 0 (0.0%) | 0 (0.0%) |
| Total | 57 (42.2%) | 78 (57.8%) |
Education in Tharptown Uniontown
School Enrollment in Tharptown Uniontown
The most common levels of schooling among the 11 students in Tharptown Uniontown are high school (7 | 63.6%), and middle school (4 | 36.4%).
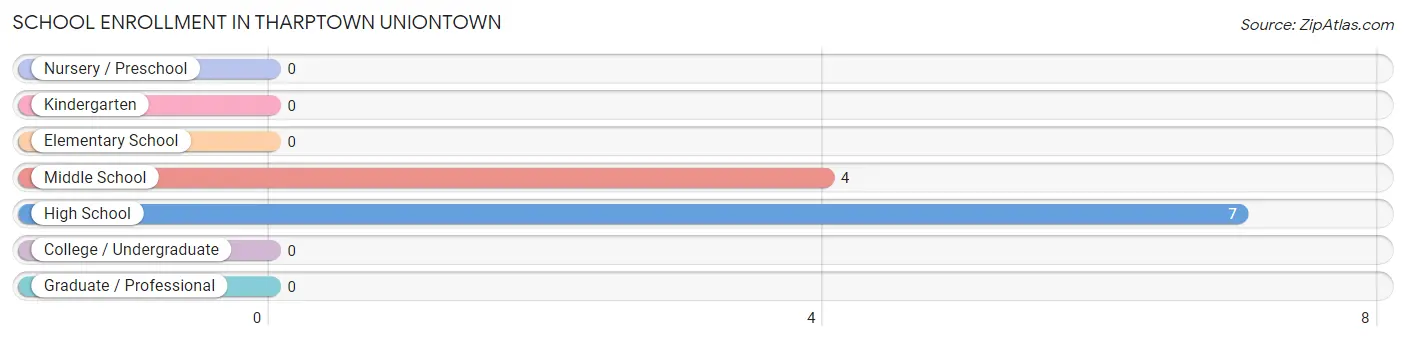
| School Level | # Students | % Students |
| Nursery / Preschool | 0 | 0.0% |
| Kindergarten | 0 | 0.0% |
| Elementary School | 0 | 0.0% |
| Middle School | 4 | 36.4% |
| High School | 7 | 63.6% |
| College / Undergraduate | 0 | 0.0% |
| Graduate / Professional | 0 | 0.0% |
| Total | 11 | 100.0% |
School Enrollment by Age by Funding Source in Tharptown Uniontown
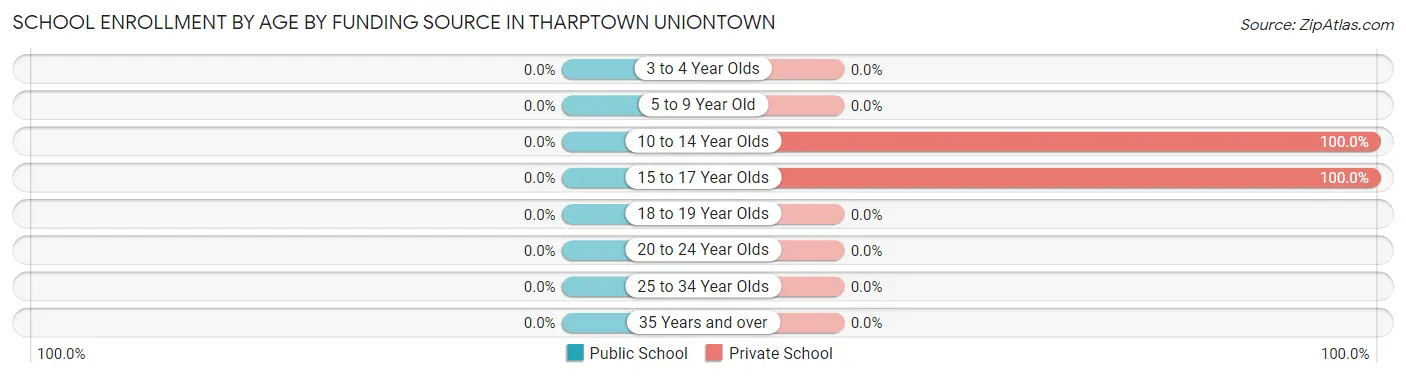
| Age Bracket | Public School | Private School |
| 3 to 4 Year Olds | 0 (0.0%) | 0 (0.0%) |
| 5 to 9 Year Old | 0 (0.0%) | 0 (0.0%) |
| 10 to 14 Year Olds | 0 (0.0%) | 4 (100.0%) |
| 15 to 17 Year Olds | 0 (0.0%) | 7 (100.0%) |
| 18 to 19 Year Olds | 0 (0.0%) | 0 (0.0%) |
| 20 to 24 Year Olds | 0 (0.0%) | 0 (0.0%) |
| 25 to 34 Year Olds | 0 (0.0%) | 0 (0.0%) |
| 35 Years and over | 0 (0.0%) | 0 (0.0%) |
| Total | 0 (0.0%) | 11 (100.0%) |
Educational Attainment by Field of Study in Tharptown Uniontown
, and science & technology (4 | 100.0%) are the most common fields of study among 4 individuals in Tharptown Uniontown who have obtained a bachelor's degree or higher.
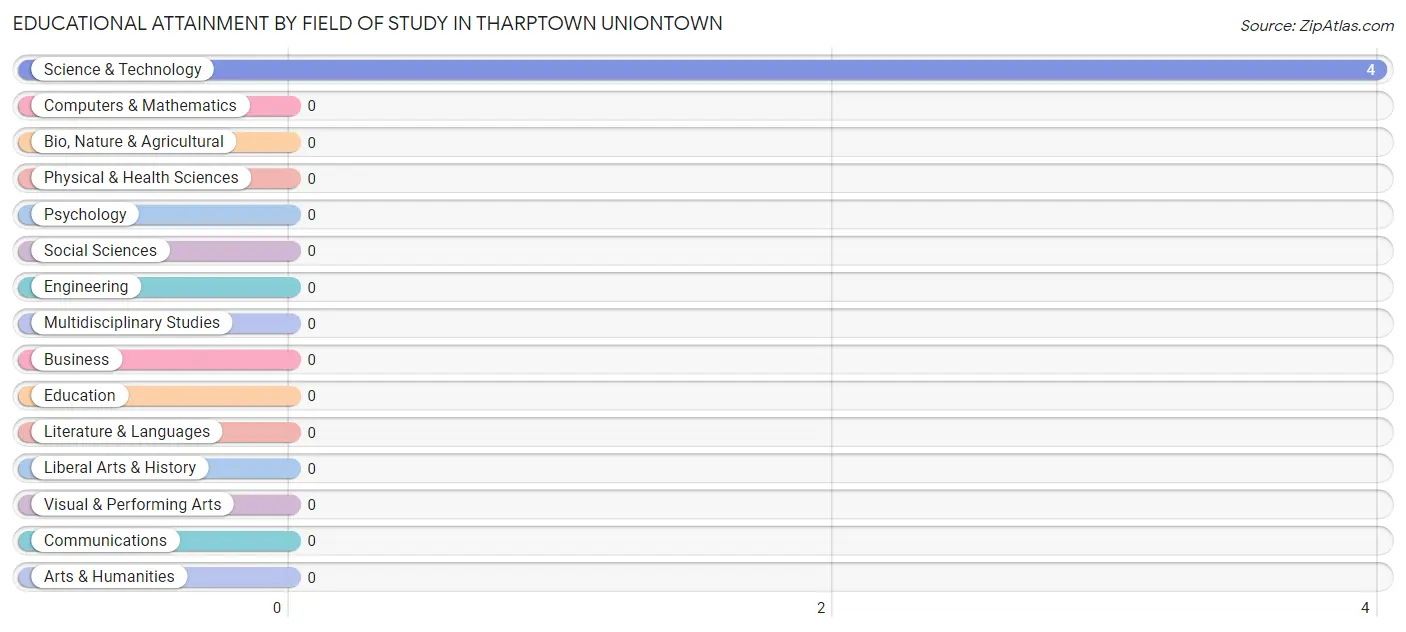
| Field of Study | # Graduates | % Graduates |
| Computers & Mathematics | 0 | 0.0% |
| Bio, Nature & Agricultural | 0 | 0.0% |
| Physical & Health Sciences | 0 | 0.0% |
| Psychology | 0 | 0.0% |
| Social Sciences | 0 | 0.0% |
| Engineering | 0 | 0.0% |
| Multidisciplinary Studies | 0 | 0.0% |
| Science & Technology | 4 | 100.0% |
| Business | 0 | 0.0% |
| Education | 0 | 0.0% |
| Literature & Languages | 0 | 0.0% |
| Liberal Arts & History | 0 | 0.0% |
| Visual & Performing Arts | 0 | 0.0% |
| Communications | 0 | 0.0% |
| Arts & Humanities | 0 | 0.0% |
| Total | 4 | 100.0% |
Transportation & Commute in Tharptown Uniontown
Vehicle Availability by Sex in Tharptown Uniontown
The most prevalent vehicle ownership categories in Tharptown Uniontown are males with 2 vehicles (35, accounting for 61.4%) and females with 2 vehicles (61, making up 44.9%).
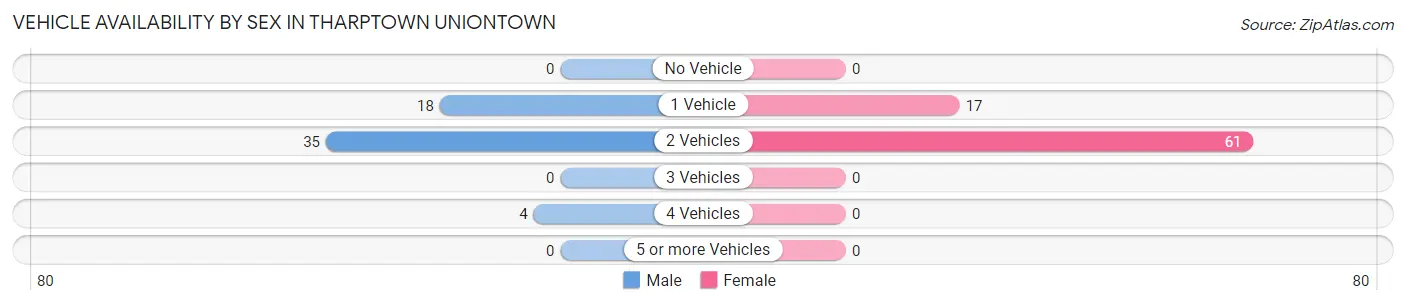
| Vehicles Available | Male | Female |
| No Vehicle | 0 (0.0%) | 0 (0.0%) |
| 1 Vehicle | 18 (31.6%) | 17 (21.8%) |
| 2 Vehicles | 35 (61.4%) | 61 (78.2%) |
| 3 Vehicles | 0 (0.0%) | 0 (0.0%) |
| 4 Vehicles | 4 (7.0%) | 0 (0.0%) |
| 5 or more Vehicles | 0 (0.0%) | 0 (0.0%) |
| Total | 57 (100.0%) | 78 (100.0%) |
Commute Time in Tharptown Uniontown
The most frequently occuring commute durations in Tharptown Uniontown are 30 to 34 minutes (53 commuters, 39.3%), 35 to 39 minutes (31 commuters, 23.0%), and 15 to 19 minutes (27 commuters, 20.0%).
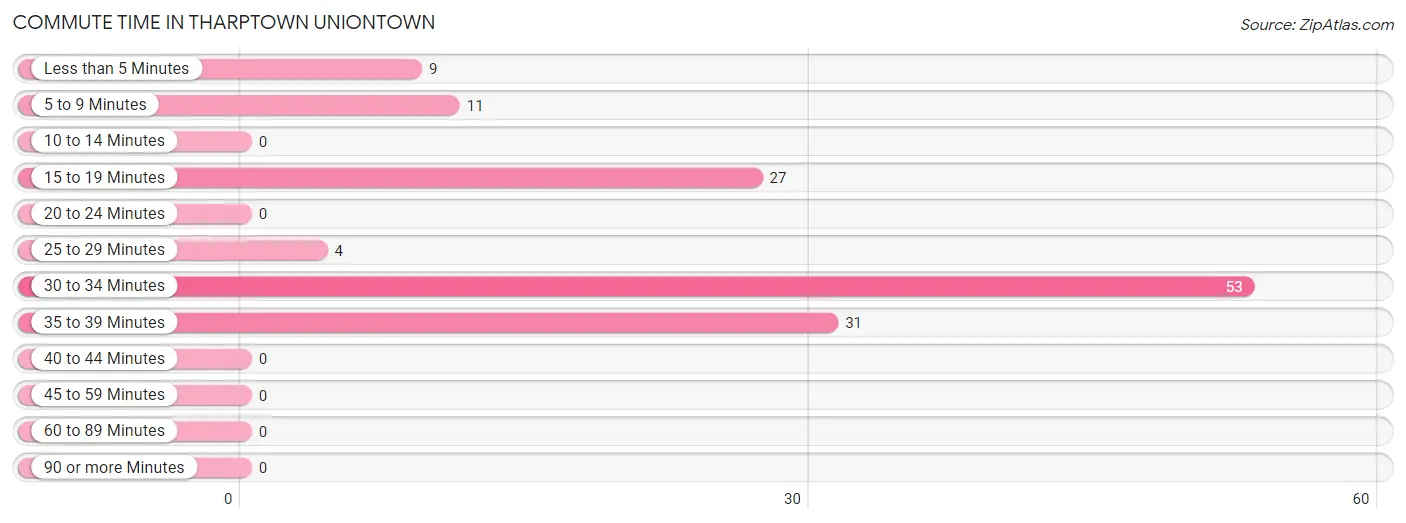
| Commute Time | # Commuters | % Commuters |
| Less than 5 Minutes | 9 | 6.7% |
| 5 to 9 Minutes | 11 | 8.2% |
| 10 to 14 Minutes | 0 | 0.0% |
| 15 to 19 Minutes | 27 | 20.0% |
| 20 to 24 Minutes | 0 | 0.0% |
| 25 to 29 Minutes | 4 | 3.0% |
| 30 to 34 Minutes | 53 | 39.3% |
| 35 to 39 Minutes | 31 | 23.0% |
| 40 to 44 Minutes | 0 | 0.0% |
| 45 to 59 Minutes | 0 | 0.0% |
| 60 to 89 Minutes | 0 | 0.0% |
| 90 or more Minutes | 0 | 0.0% |
Commute Time by Sex in Tharptown Uniontown
The most common commute times in Tharptown Uniontown are 15 to 19 minutes (27 commuters, 47.4%) for males and 30 to 34 minutes (46 commuters, 59.0%) for females.
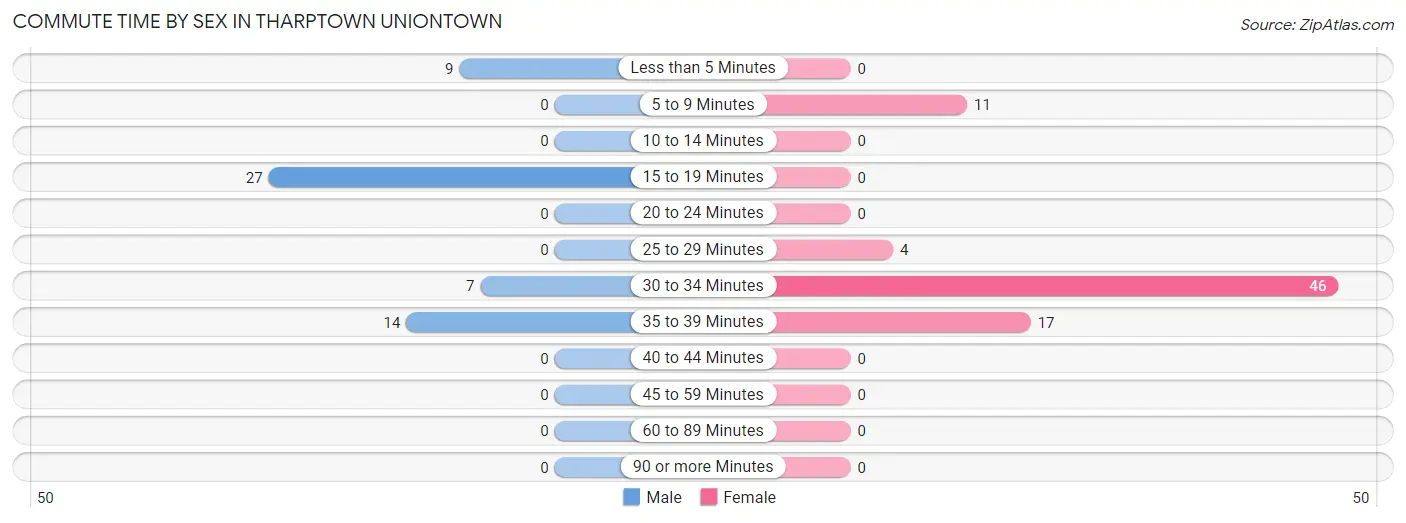
| Commute Time | Male | Female |
| Less than 5 Minutes | 9 (15.8%) | 0 (0.0%) |
| 5 to 9 Minutes | 0 (0.0%) | 11 (14.1%) |
| 10 to 14 Minutes | 0 (0.0%) | 0 (0.0%) |
| 15 to 19 Minutes | 27 (47.4%) | 0 (0.0%) |
| 20 to 24 Minutes | 0 (0.0%) | 0 (0.0%) |
| 25 to 29 Minutes | 0 (0.0%) | 4 (5.1%) |
| 30 to 34 Minutes | 7 (12.3%) | 46 (59.0%) |
| 35 to 39 Minutes | 14 (24.6%) | 17 (21.8%) |
| 40 to 44 Minutes | 0 (0.0%) | 0 (0.0%) |
| 45 to 59 Minutes | 0 (0.0%) | 0 (0.0%) |
| 60 to 89 Minutes | 0 (0.0%) | 0 (0.0%) |
| 90 or more Minutes | 0 (0.0%) | 0 (0.0%) |
Time of Departure to Work by Sex in Tharptown Uniontown
The most frequent times of departure to work in Tharptown Uniontown are 4:00 PM to 11:59 PM (18, 31.6%) for males and 9:00 AM to 9:59 AM (32, 41.0%) for females.
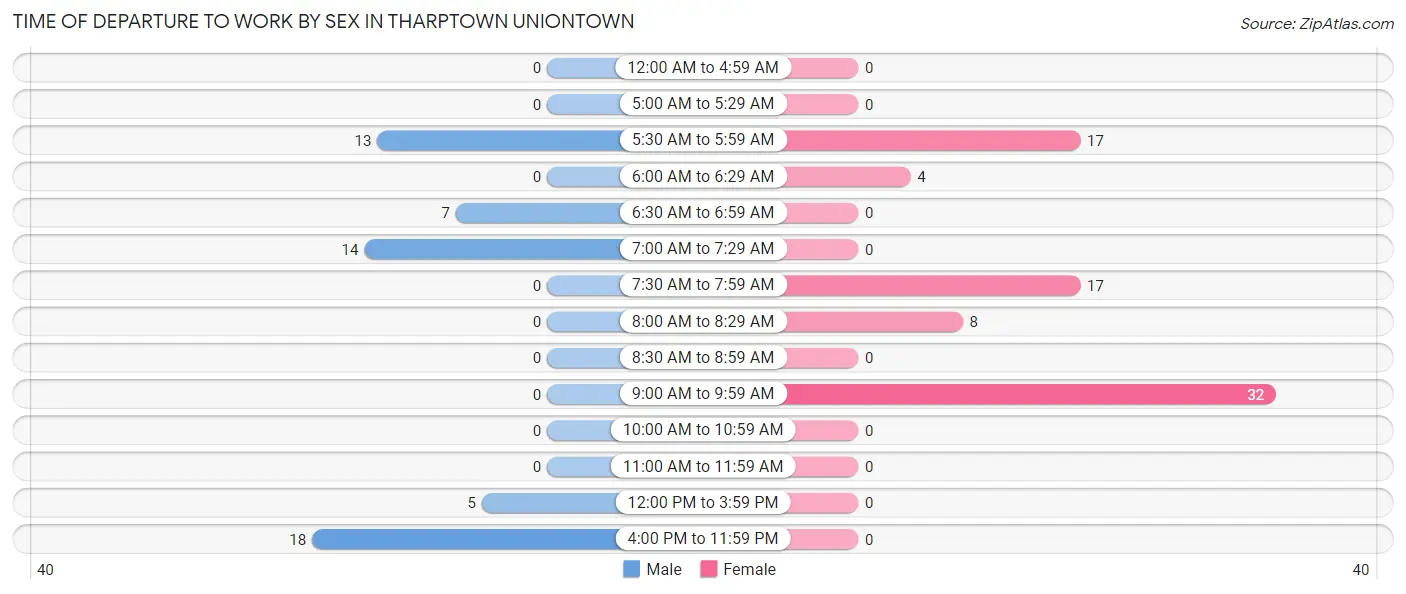
| Time of Departure | Male | Female |
| 12:00 AM to 4:59 AM | 0 (0.0%) | 0 (0.0%) |
| 5:00 AM to 5:29 AM | 0 (0.0%) | 0 (0.0%) |
| 5:30 AM to 5:59 AM | 13 (22.8%) | 17 (21.8%) |
| 6:00 AM to 6:29 AM | 0 (0.0%) | 4 (5.1%) |
| 6:30 AM to 6:59 AM | 7 (12.3%) | 0 (0.0%) |
| 7:00 AM to 7:29 AM | 14 (24.6%) | 0 (0.0%) |
| 7:30 AM to 7:59 AM | 0 (0.0%) | 17 (21.8%) |
| 8:00 AM to 8:29 AM | 0 (0.0%) | 8 (10.3%) |
| 8:30 AM to 8:59 AM | 0 (0.0%) | 0 (0.0%) |
| 9:00 AM to 9:59 AM | 0 (0.0%) | 32 (41.0%) |
| 10:00 AM to 10:59 AM | 0 (0.0%) | 0 (0.0%) |
| 11:00 AM to 11:59 AM | 0 (0.0%) | 0 (0.0%) |
| 12:00 PM to 3:59 PM | 5 (8.8%) | 0 (0.0%) |
| 4:00 PM to 11:59 PM | 18 (31.6%) | 0 (0.0%) |
| Total | 57 (100.0%) | 78 (100.0%) |
Housing Occupancy in Tharptown Uniontown
Occupancy by Ownership in Tharptown Uniontown
Of the total 119 dwellings in Tharptown Uniontown, owner-occupied units account for 105 (88.2%), while renter-occupied units make up 14 (11.8%).
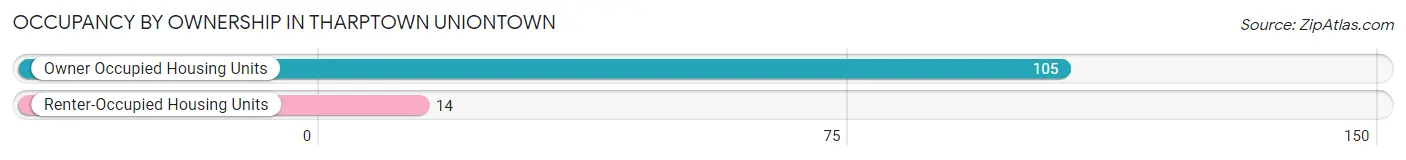
| Occupancy | # Housing Units | % Housing Units |
| Owner Occupied Housing Units | 105 | 88.2% |
| Renter-Occupied Housing Units | 14 | 11.8% |
| Total Occupied Housing Units | 119 | 100.0% |
Occupancy by Household Size in Tharptown Uniontown
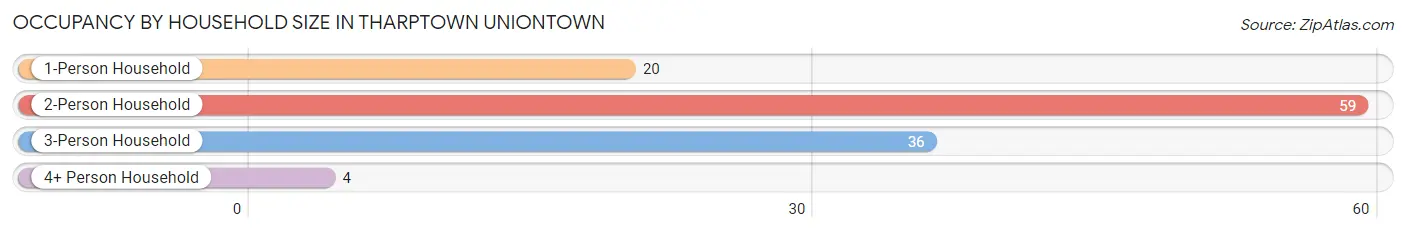
| Household Size | # Housing Units | % Housing Units |
| 1-Person Household | 20 | 16.8% |
| 2-Person Household | 59 | 49.6% |
| 3-Person Household | 36 | 30.2% |
| 4+ Person Household | 4 | 3.4% |
| Total Housing Units | 119 | 100.0% |
Occupancy by Ownership by Household Size in Tharptown Uniontown
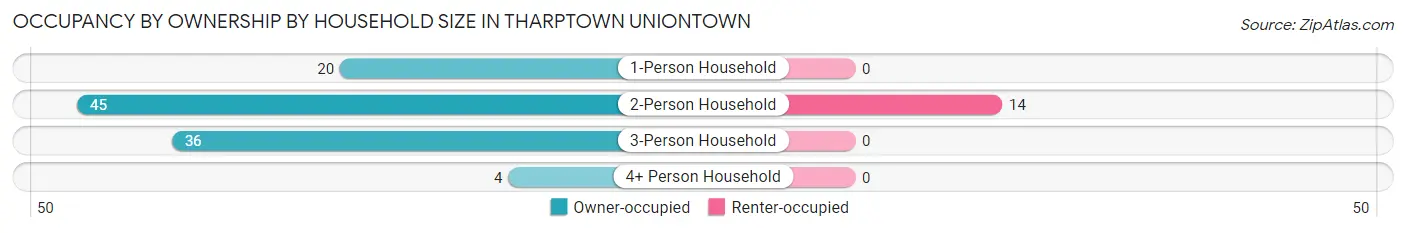
| Household Size | Owner-occupied | Renter-occupied |
| 1-Person Household | 20 (100.0%) | 0 (0.0%) |
| 2-Person Household | 45 (76.3%) | 14 (23.7%) |
| 3-Person Household | 36 (100.0%) | 0 (0.0%) |
| 4+ Person Household | 4 (100.0%) | 0 (0.0%) |
| Total Housing Units | 105 (88.2%) | 14 (11.8%) |
Occupancy by Educational Attainment in Tharptown Uniontown
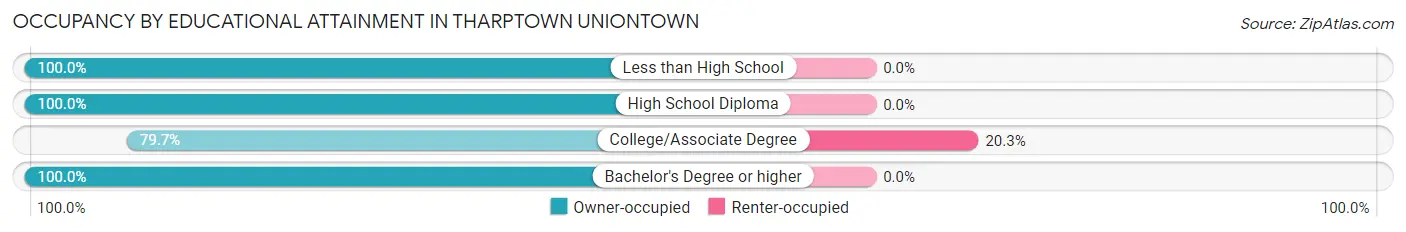
| Household Size | Owner-occupied | Renter-occupied |
| Less than High School | 6 (100.0%) | 0 (0.0%) |
| High School Diploma | 40 (100.0%) | 0 (0.0%) |
| College/Associate Degree | 55 (79.7%) | 14 (20.3%) |
| Bachelor's Degree or higher | 4 (100.0%) | 0 (0.0%) |
Occupancy by Age of Householder in Tharptown Uniontown
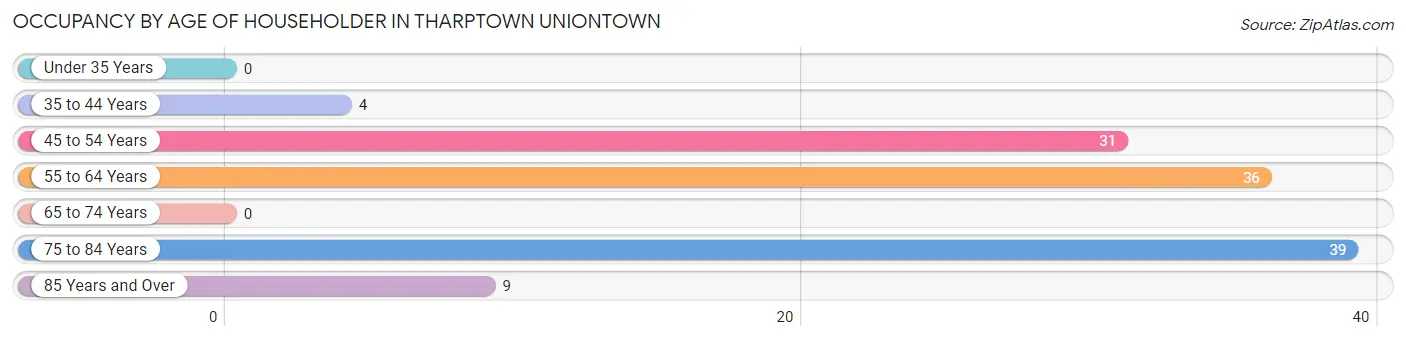
| Age Bracket | # Households | % Households |
| Under 35 Years | 0 | 0.0% |
| 35 to 44 Years | 4 | 3.4% |
| 45 to 54 Years | 31 | 26.1% |
| 55 to 64 Years | 36 | 30.2% |
| 65 to 74 Years | 0 | 0.0% |
| 75 to 84 Years | 39 | 32.8% |
| 85 Years and Over | 9 | 7.6% |
| Total | 119 | 100.0% |
Housing Finances in Tharptown Uniontown
Median Income by Occupancy in Tharptown Uniontown
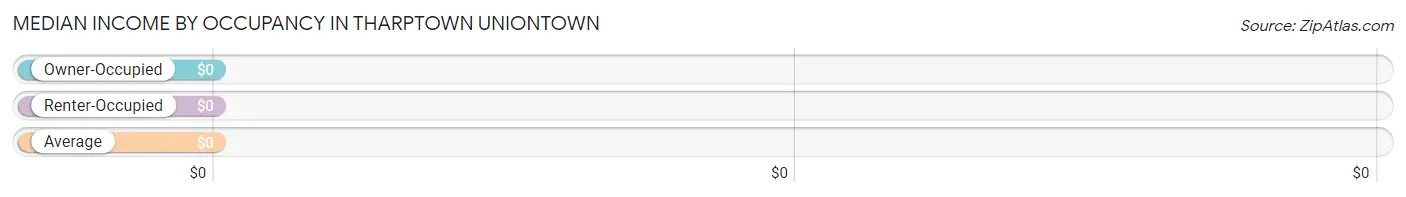
| Occupancy Type | # Households | Median Income |
| Owner-Occupied | 105 (88.2%) | $0 |
| Renter-Occupied | 14 (11.8%) | $0 |
| Average | 119 (100.0%) | $0 |
Occupancy by Householder Income Bracket in Tharptown Uniontown
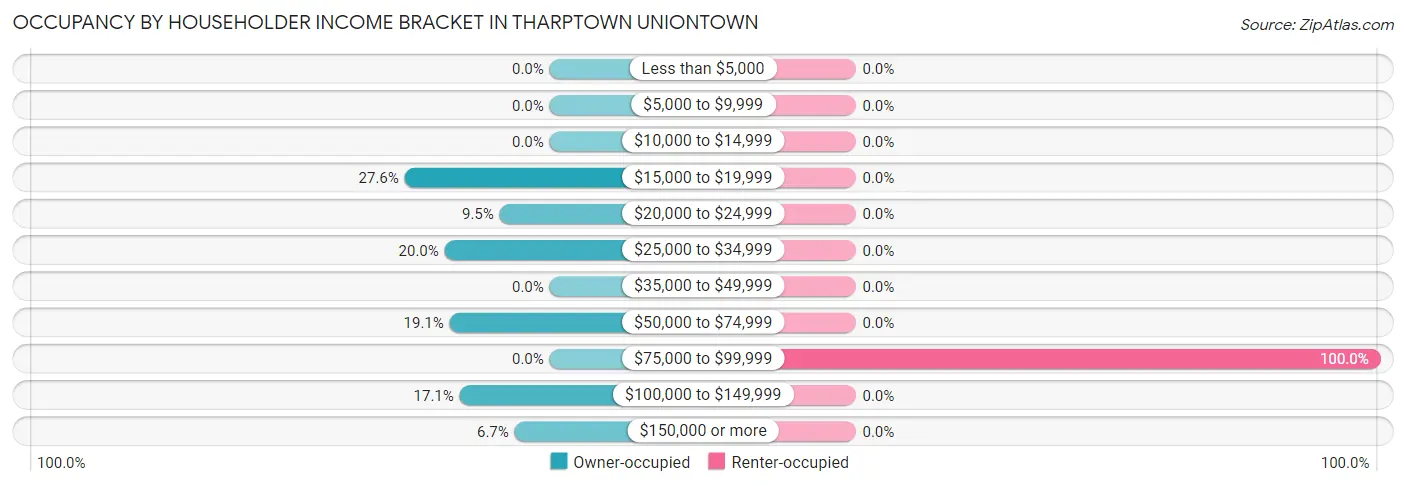
| Income Bracket | Owner-occupied | Renter-occupied |
| Less than $5,000 | 0 (0.0%) | 0 (0.0%) |
| $5,000 to $9,999 | 0 (0.0%) | 0 (0.0%) |
| $10,000 to $14,999 | 0 (0.0%) | 0 (0.0%) |
| $15,000 to $19,999 | 29 (27.6%) | 0 (0.0%) |
| $20,000 to $24,999 | 10 (9.5%) | 0 (0.0%) |
| $25,000 to $34,999 | 21 (20.0%) | 0 (0.0%) |
| $35,000 to $49,999 | 0 (0.0%) | 0 (0.0%) |
| $50,000 to $74,999 | 20 (19.1%) | 0 (0.0%) |
| $75,000 to $99,999 | 0 (0.0%) | 14 (100.0%) |
| $100,000 to $149,999 | 18 (17.1%) | 0 (0.0%) |
| $150,000 or more | 7 (6.7%) | 0 (0.0%) |
| Total | 105 (100.0%) | 14 (100.0%) |
Monthly Housing Cost Tiers in Tharptown Uniontown
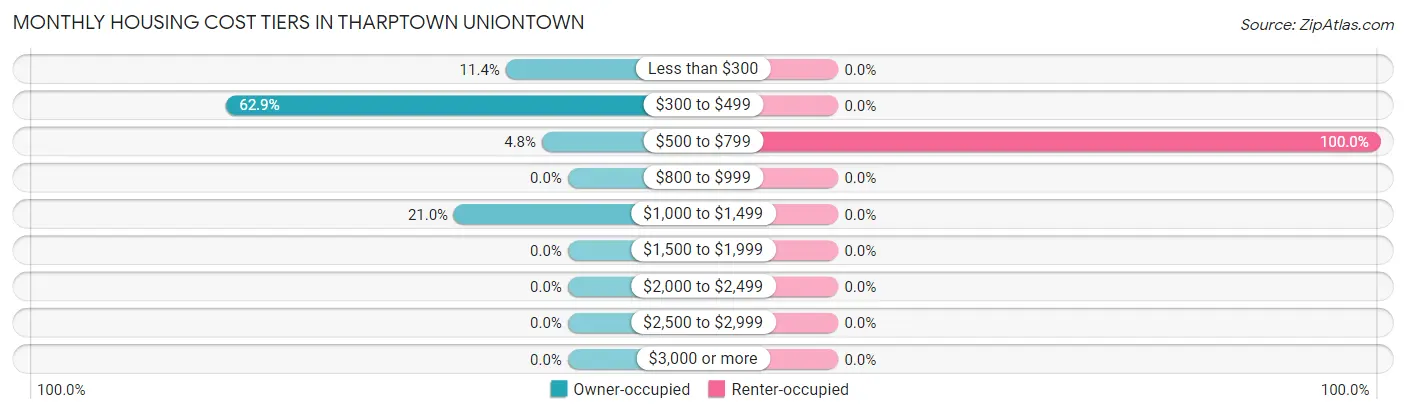
| Monthly Cost | Owner-occupied | Renter-occupied |
| Less than $300 | 12 (11.4%) | 0 (0.0%) |
| $300 to $499 | 66 (62.9%) | 0 (0.0%) |
| $500 to $799 | 5 (4.8%) | 14 (100.0%) |
| $800 to $999 | 0 (0.0%) | 0 (0.0%) |
| $1,000 to $1,499 | 22 (20.9%) | 0 (0.0%) |
| $1,500 to $1,999 | 0 (0.0%) | 0 (0.0%) |
| $2,000 to $2,499 | 0 (0.0%) | 0 (0.0%) |
| $2,500 to $2,999 | 0 (0.0%) | 0 (0.0%) |
| $3,000 or more | 0 (0.0%) | 0 (0.0%) |
| Total | 105 (100.0%) | 14 (100.0%) |
Physical Housing Characteristics in Tharptown Uniontown
Housing Structures in Tharptown Uniontown
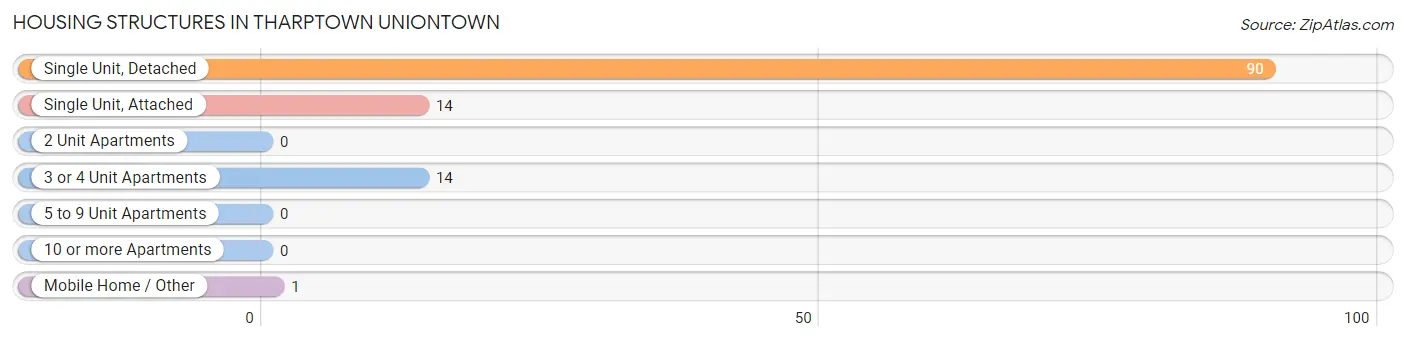
| Structure Type | # Housing Units | % Housing Units |
| Single Unit, Detached | 90 | 75.6% |
| Single Unit, Attached | 14 | 11.8% |
| 2 Unit Apartments | 0 | 0.0% |
| 3 or 4 Unit Apartments | 14 | 11.8% |
| 5 to 9 Unit Apartments | 0 | 0.0% |
| 10 or more Apartments | 0 | 0.0% |
| Mobile Home / Other | 1 | 0.8% |
| Total | 119 | 100.0% |
Housing Structures by Occupancy in Tharptown Uniontown
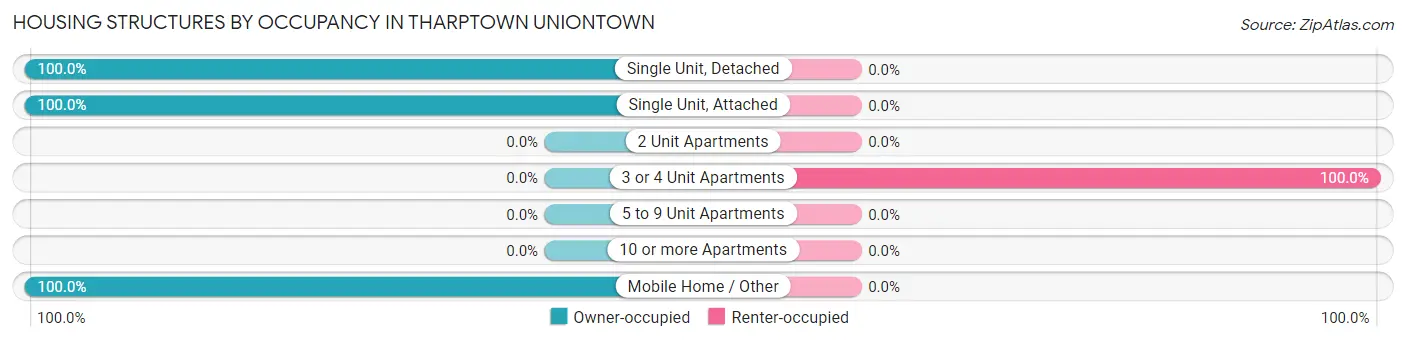
| Structure Type | Owner-occupied | Renter-occupied |
| Single Unit, Detached | 90 (100.0%) | 0 (0.0%) |
| Single Unit, Attached | 14 (100.0%) | 0 (0.0%) |
| 2 Unit Apartments | 0 (0.0%) | 0 (0.0%) |
| 3 or 4 Unit Apartments | 0 (0.0%) | 14 (100.0%) |
| 5 to 9 Unit Apartments | 0 (0.0%) | 0 (0.0%) |
| 10 or more Apartments | 0 (0.0%) | 0 (0.0%) |
| Mobile Home / Other | 1 (100.0%) | 0 (0.0%) |
| Total | 105 (88.2%) | 14 (11.8%) |
Housing Structures by Number of Rooms in Tharptown Uniontown
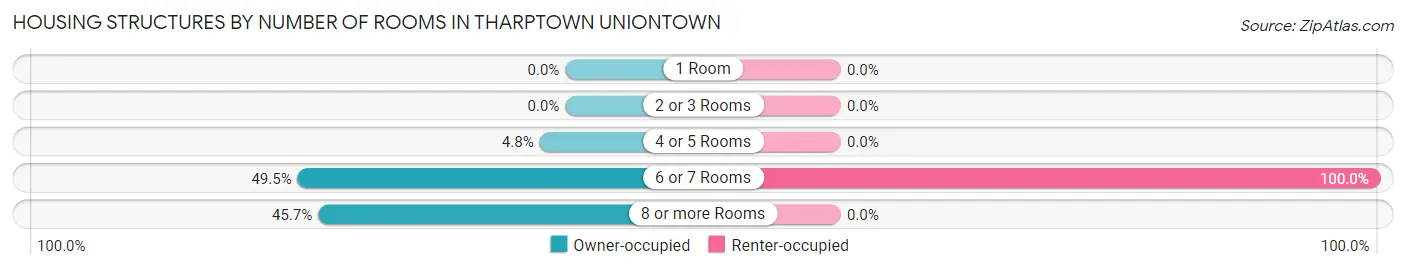
| Number of Rooms | Owner-occupied | Renter-occupied |
| 1 Room | 0 (0.0%) | 0 (0.0%) |
| 2 or 3 Rooms | 0 (0.0%) | 0 (0.0%) |
| 4 or 5 Rooms | 5 (4.8%) | 0 (0.0%) |
| 6 or 7 Rooms | 52 (49.5%) | 14 (100.0%) |
| 8 or more Rooms | 48 (45.7%) | 0 (0.0%) |
| Total | 105 (100.0%) | 14 (100.0%) |
Housing Structure by Heating Type in Tharptown Uniontown
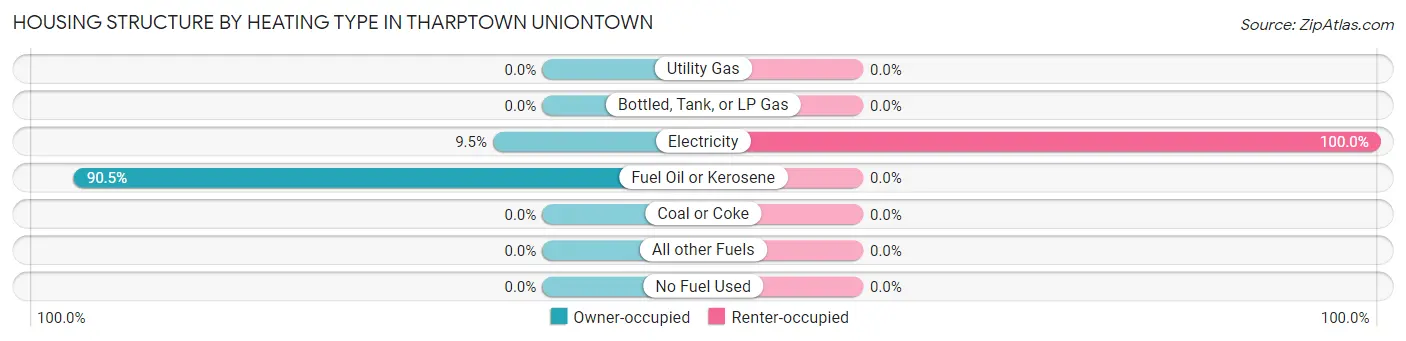
| Heating Type | Owner-occupied | Renter-occupied |
| Utility Gas | 0 (0.0%) | 0 (0.0%) |
| Bottled, Tank, or LP Gas | 0 (0.0%) | 0 (0.0%) |
| Electricity | 10 (9.5%) | 14 (100.0%) |
| Fuel Oil or Kerosene | 95 (90.5%) | 0 (0.0%) |
| Coal or Coke | 0 (0.0%) | 0 (0.0%) |
| All other Fuels | 0 (0.0%) | 0 (0.0%) |
| No Fuel Used | 0 (0.0%) | 0 (0.0%) |
| Total | 105 (100.0%) | 14 (100.0%) |
Household Vehicle Usage in Tharptown Uniontown
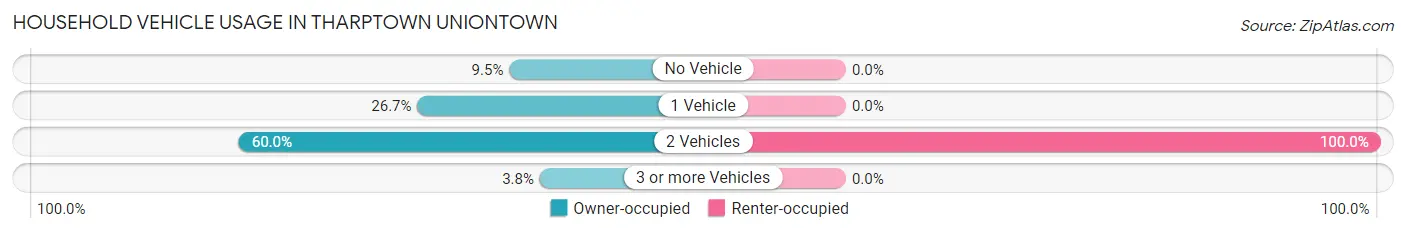
| Vehicles per Household | Owner-occupied | Renter-occupied |
| No Vehicle | 10 (9.5%) | 0 (0.0%) |
| 1 Vehicle | 28 (26.7%) | 0 (0.0%) |
| 2 Vehicles | 63 (60.0%) | 14 (100.0%) |
| 3 or more Vehicles | 4 (3.8%) | 0 (0.0%) |
| Total | 105 (100.0%) | 14 (100.0%) |
Real Estate & Mortgages in Tharptown Uniontown
Real Estate and Mortgage Overview in Tharptown Uniontown
| Characteristic | Without Mortgage | With Mortgage |
| Housing Units | 83 | 22 |
| Median Property Value | $64,200 | $0 |
| Median Household Income | $25,625 | $0 |
| Monthly Housing Costs | $438 | $0 |
| Real Estate Taxes | $609 | $0 |
Property Value by Mortgage Status in Tharptown Uniontown
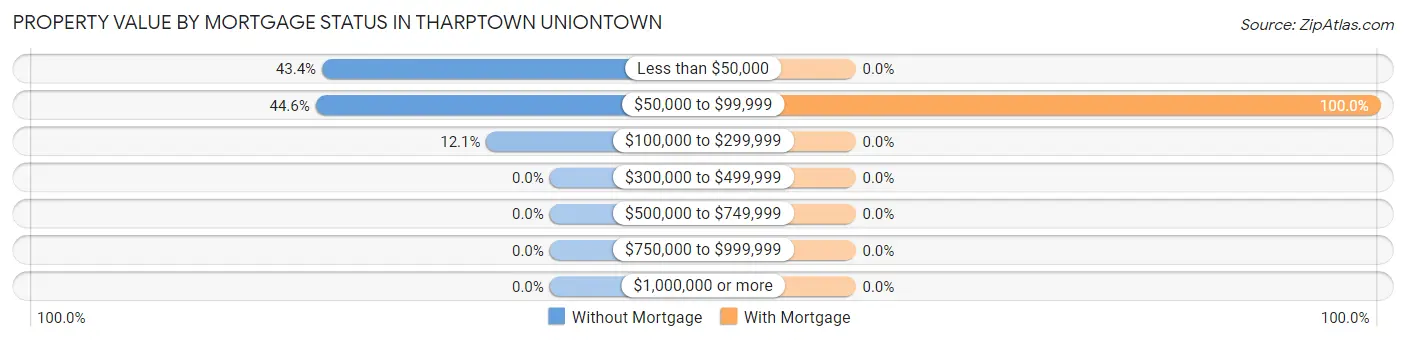
| Property Value | Without Mortgage | With Mortgage |
| Less than $50,000 | 36 (43.4%) | 0 (0.0%) |
| $50,000 to $99,999 | 37 (44.6%) | 22 (100.0%) |
| $100,000 to $299,999 | 10 (12.0%) | 0 (0.0%) |
| $300,000 to $499,999 | 0 (0.0%) | 0 (0.0%) |
| $500,000 to $749,999 | 0 (0.0%) | 0 (0.0%) |
| $750,000 to $999,999 | 0 (0.0%) | 0 (0.0%) |
| $1,000,000 or more | 0 (0.0%) | 0 (0.0%) |
| Total | 83 (100.0%) | 22 (100.0%) |
Household Income by Mortgage Status in Tharptown Uniontown
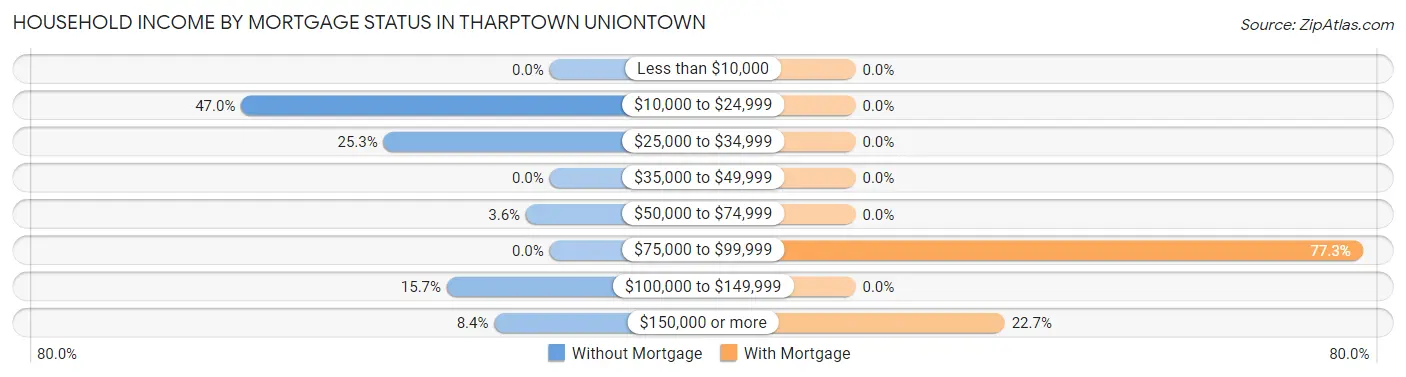
| Household Income | Without Mortgage | With Mortgage |
| Less than $10,000 | 0 (0.0%) | 0 (0.0%) |
| $10,000 to $24,999 | 39 (47.0%) | 0 (0.0%) |
| $25,000 to $34,999 | 21 (25.3%) | 0 (0.0%) |
| $35,000 to $49,999 | 0 (0.0%) | 0 (0.0%) |
| $50,000 to $74,999 | 3 (3.6%) | 0 (0.0%) |
| $75,000 to $99,999 | 0 (0.0%) | 17 (77.3%) |
| $100,000 to $149,999 | 13 (15.7%) | 0 (0.0%) |
| $150,000 or more | 7 (8.4%) | 5 (22.7%) |
| Total | 83 (100.0%) | 22 (100.0%) |
Property Value to Household Income Ratio in Tharptown Uniontown
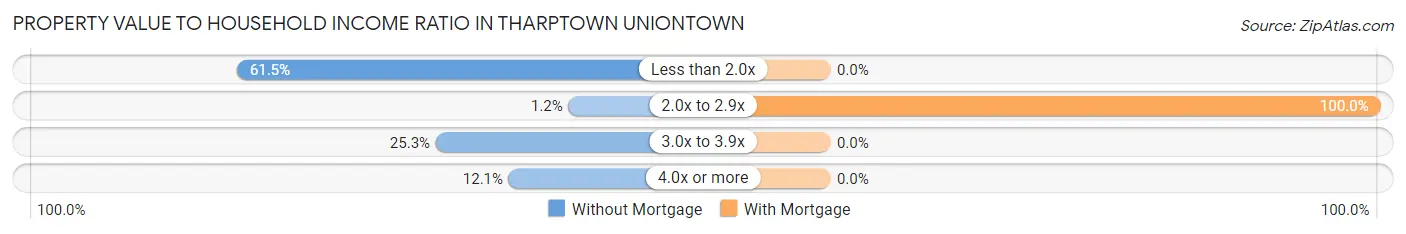
| Value-to-Income Ratio | Without Mortgage | With Mortgage |
| Less than 2.0x | 51 (61.5%) | 0 (0.0%) |
| 2.0x to 2.9x | 1 (1.2%) | 22 (100.0%) |
| 3.0x to 3.9x | 21 (25.3%) | 0 (0.0%) |
| 4.0x or more | 10 (12.0%) | 0 (0.0%) |
| Total | 83 (100.0%) | 22 (100.0%) |
Real Estate Taxes by Mortgage Status in Tharptown Uniontown
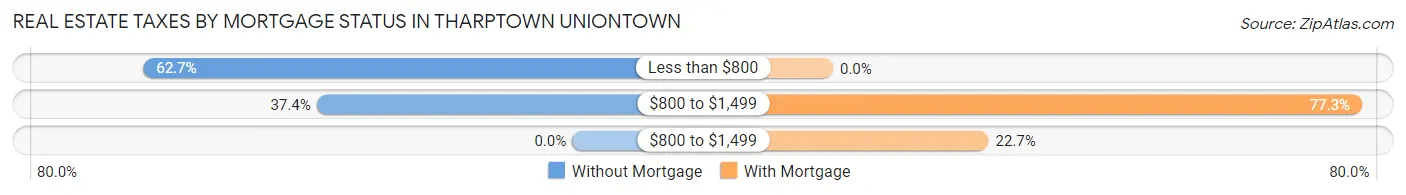
| Property Taxes | Without Mortgage | With Mortgage |
| Less than $800 | 52 (62.6%) | 0 (0.0%) |
| $800 to $1,499 | 31 (37.3%) | 17 (77.3%) |
| $800 to $1,499 | 0 (0.0%) | 5 (22.7%) |
| Total | 83 (100.0%) | 22 (100.0%) |
Health & Disability in Tharptown Uniontown
Health Insurance Coverage by Age in Tharptown Uniontown
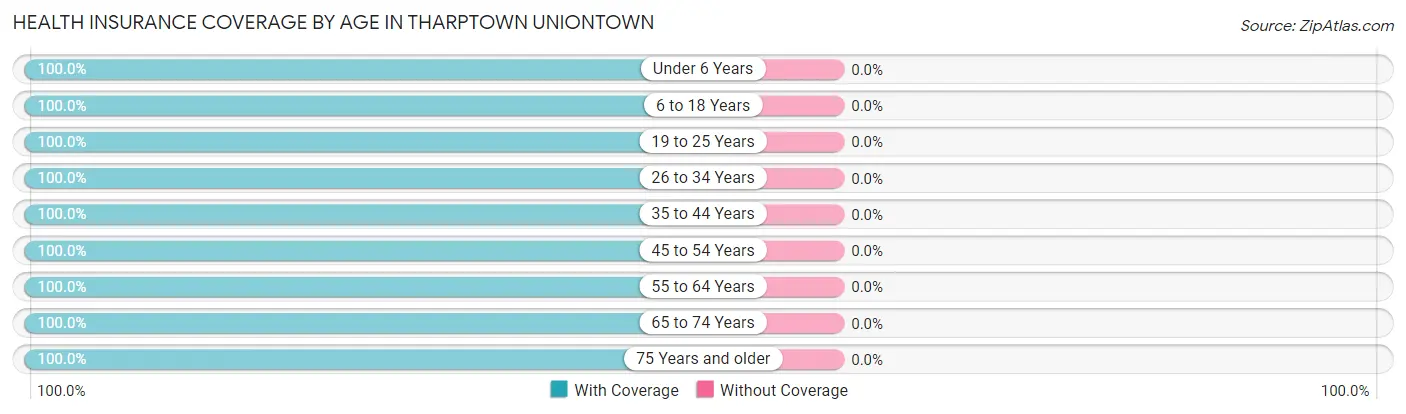
| Age Bracket | With Coverage | Without Coverage |
| Under 6 Years | 27 (100.0%) | 0 (0.0%) |
| 6 to 18 Years | 11 (100.0%) | 0 (0.0%) |
| 19 to 25 Years | 50 (100.0%) | 0 (0.0%) |
| 26 to 34 Years | 5 (100.0%) | 0 (0.0%) |
| 35 to 44 Years | 12 (100.0%) | 0 (0.0%) |
| 45 to 54 Years | 38 (100.0%) | 0 (0.0%) |
| 55 to 64 Years | 57 (100.0%) | 0 (0.0%) |
| 65 to 74 Years | 13 (100.0%) | 0 (0.0%) |
| 75 Years and older | 56 (100.0%) | 0 (0.0%) |
| Total | 269 (100.0%) | 0 (0.0%) |
Health Insurance Coverage by Citizenship Status in Tharptown Uniontown
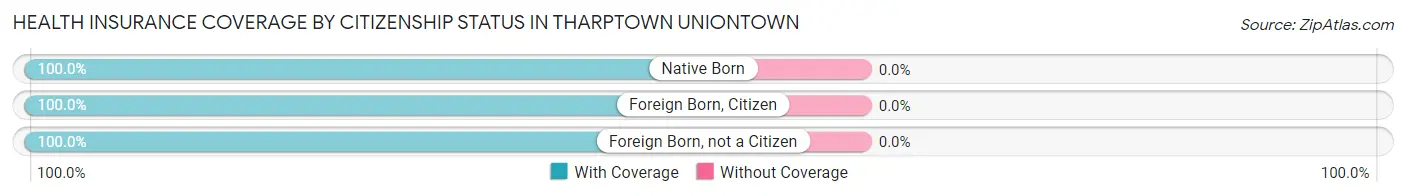
| Citizenship Status | With Coverage | Without Coverage |
| Native Born | 27 (100.0%) | 0 (0.0%) |
| Foreign Born, Citizen | 11 (100.0%) | 0 (0.0%) |
| Foreign Born, not a Citizen | 50 (100.0%) | 0 (0.0%) |
Health Insurance Coverage by Household Income in Tharptown Uniontown
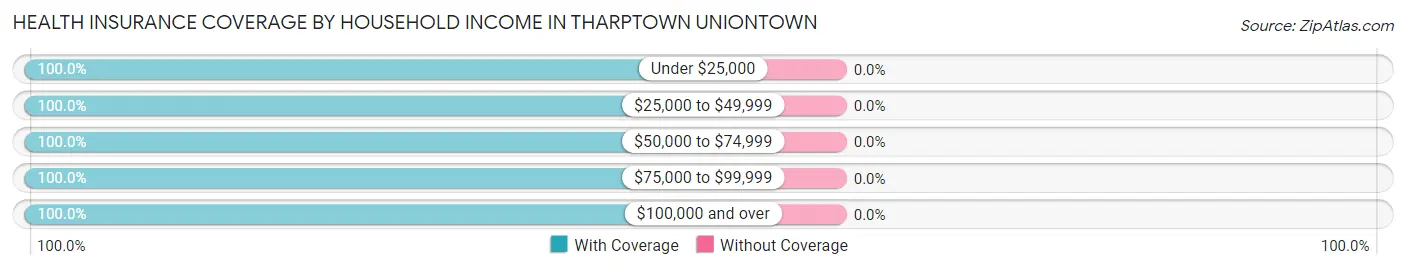
| Household Income | With Coverage | Without Coverage |
| Under $25,000 | 101 (100.0%) | 0 (0.0%) |
| $25,000 to $49,999 | 31 (100.0%) | 0 (0.0%) |
| $50,000 to $74,999 | 45 (100.0%) | 0 (0.0%) |
| $75,000 to $99,999 | 28 (100.0%) | 0 (0.0%) |
| $100,000 and over | 64 (100.0%) | 0 (0.0%) |
Public vs Private Health Insurance Coverage by Age in Tharptown Uniontown
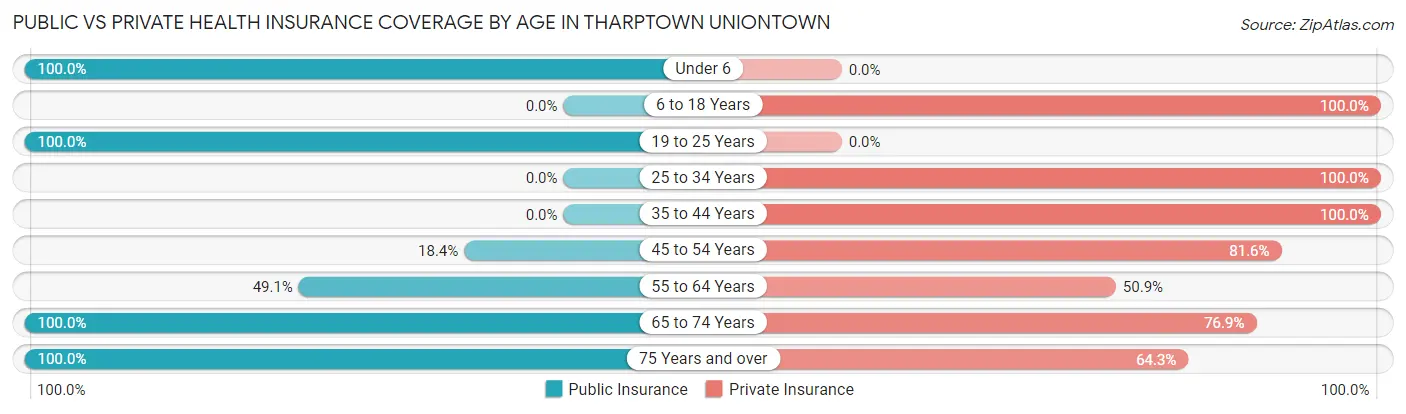
| Age Bracket | Public Insurance | Private Insurance |
| Under 6 | 27 (100.0%) | 0 (0.0%) |
| 6 to 18 Years | 0 (0.0%) | 11 (100.0%) |
| 19 to 25 Years | 50 (100.0%) | 0 (0.0%) |
| 25 to 34 Years | 0 (0.0%) | 5 (100.0%) |
| 35 to 44 Years | 0 (0.0%) | 12 (100.0%) |
| 45 to 54 Years | 7 (18.4%) | 31 (81.6%) |
| 55 to 64 Years | 28 (49.1%) | 29 (50.9%) |
| 65 to 74 Years | 13 (100.0%) | 10 (76.9%) |
| 75 Years and over | 56 (100.0%) | 36 (64.3%) |
| Total | 181 (67.3%) | 134 (49.8%) |
Disability Status by Sex by Age in Tharptown Uniontown
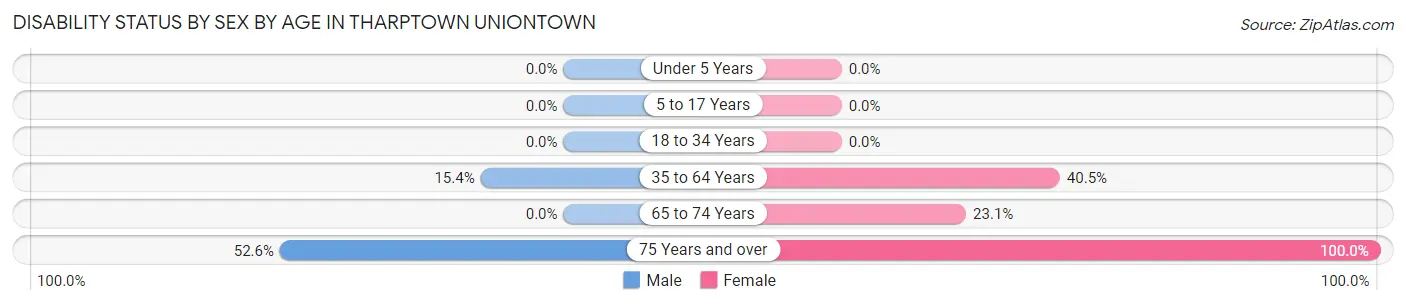
| Age Bracket | Male | Female |
| Under 5 Years | 0 (0.0%) | 0 (0.0%) |
| 5 to 17 Years | 0 (0.0%) | 0 (0.0%) |
| 18 to 34 Years | 0 (0.0%) | 0 (0.0%) |
| 35 to 64 Years | 10 (15.4%) | 17 (40.5%) |
| 65 to 74 Years | 0 (0.0%) | 3 (23.1%) |
| 75 Years and over | 20 (52.6%) | 18 (100.0%) |
Disability Class by Sex by Age in Tharptown Uniontown
Disability Class: Hearing Difficulty
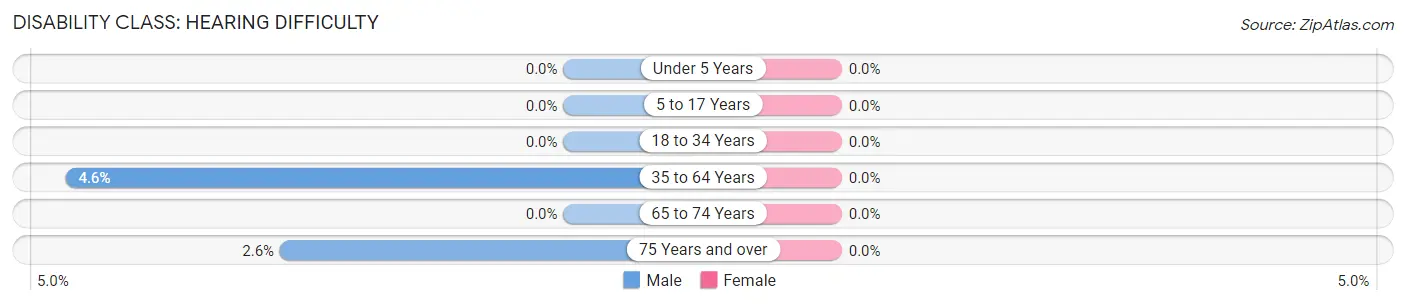
| Age Bracket | Male | Female |
| Under 5 Years | 0 (0.0%) | 0 (0.0%) |
| 5 to 17 Years | 0 (0.0%) | 0 (0.0%) |
| 18 to 34 Years | 0 (0.0%) | 0 (0.0%) |
| 35 to 64 Years | 3 (4.6%) | 0 (0.0%) |
| 65 to 74 Years | 0 (0.0%) | 0 (0.0%) |
| 75 Years and over | 1 (2.6%) | 0 (0.0%) |
Disability Class: Vision Difficulty
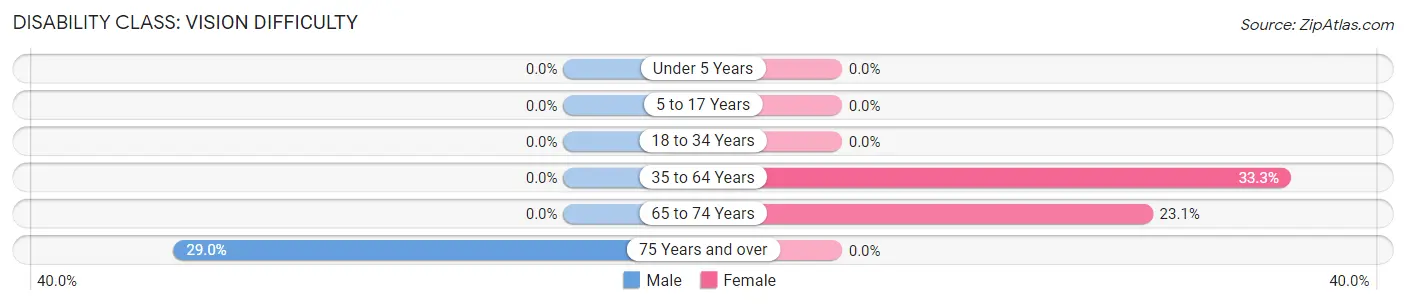
| Age Bracket | Male | Female |
| Under 5 Years | 0 (0.0%) | 0 (0.0%) |
| 5 to 17 Years | 0 (0.0%) | 0 (0.0%) |
| 18 to 34 Years | 0 (0.0%) | 0 (0.0%) |
| 35 to 64 Years | 0 (0.0%) | 14 (33.3%) |
| 65 to 74 Years | 0 (0.0%) | 3 (23.1%) |
| 75 Years and over | 11 (28.9%) | 0 (0.0%) |
Disability Class: Cognitive Difficulty
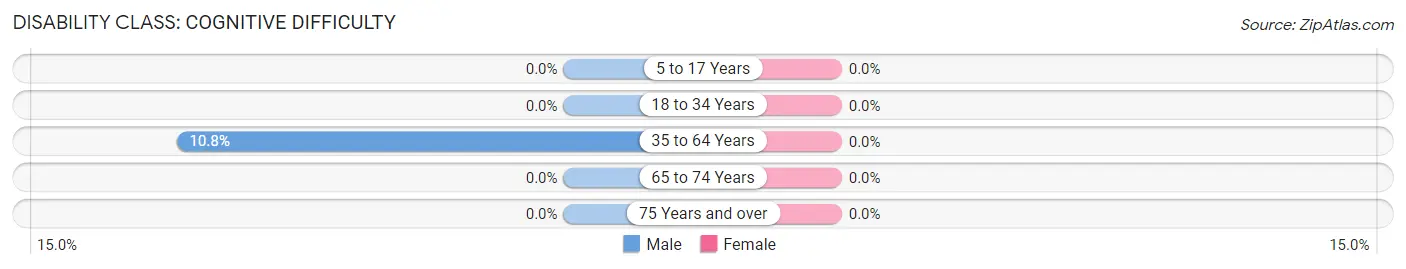
| Age Bracket | Male | Female |
| 5 to 17 Years | 0 (0.0%) | 0 (0.0%) |
| 18 to 34 Years | 0 (0.0%) | 0 (0.0%) |
| 35 to 64 Years | 7 (10.8%) | 0 (0.0%) |
| 65 to 74 Years | 0 (0.0%) | 0 (0.0%) |
| 75 Years and over | 0 (0.0%) | 0 (0.0%) |
Disability Class: Ambulatory Difficulty
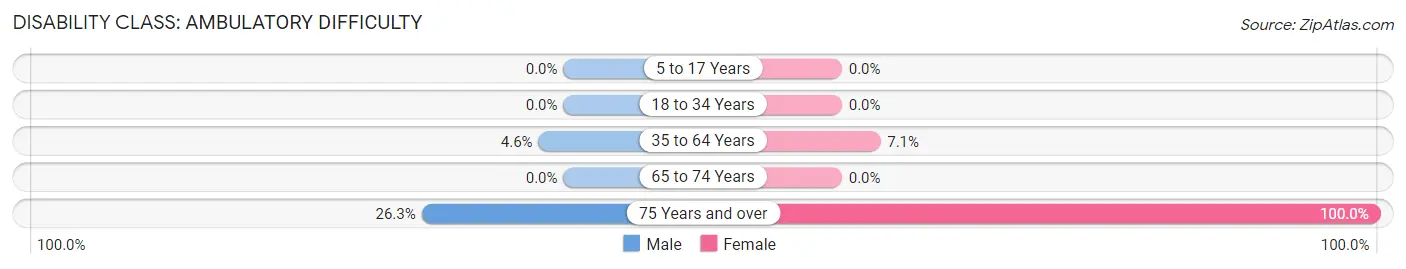
| Age Bracket | Male | Female |
| 5 to 17 Years | 0 (0.0%) | 0 (0.0%) |
| 18 to 34 Years | 0 (0.0%) | 0 (0.0%) |
| 35 to 64 Years | 3 (4.6%) | 3 (7.1%) |
| 65 to 74 Years | 0 (0.0%) | 0 (0.0%) |
| 75 Years and over | 10 (26.3%) | 18 (100.0%) |
Disability Class: Self-Care Difficulty
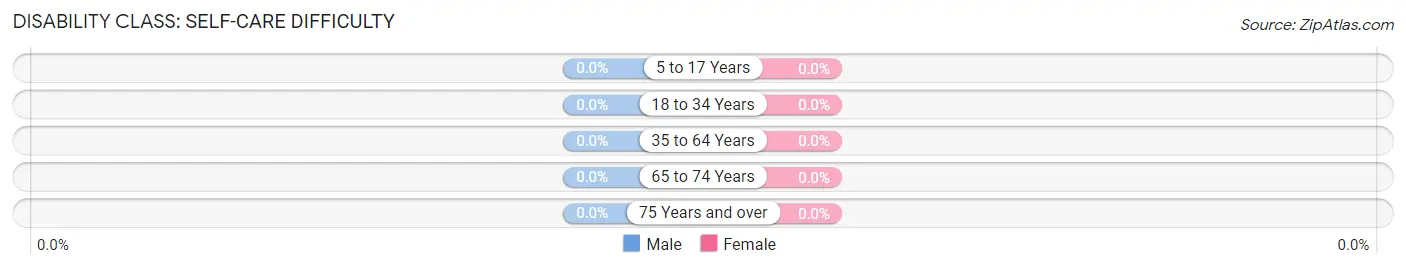
| Age Bracket | Male | Female |
| 5 to 17 Years | 0 (0.0%) | 0 (0.0%) |
| 18 to 34 Years | 0 (0.0%) | 0 (0.0%) |
| 35 to 64 Years | 0 (0.0%) | 0 (0.0%) |
| 65 to 74 Years | 0 (0.0%) | 0 (0.0%) |
| 75 Years and over | 0 (0.0%) | 0 (0.0%) |
Technology Access in Tharptown Uniontown
Computing Device Access in Tharptown Uniontown
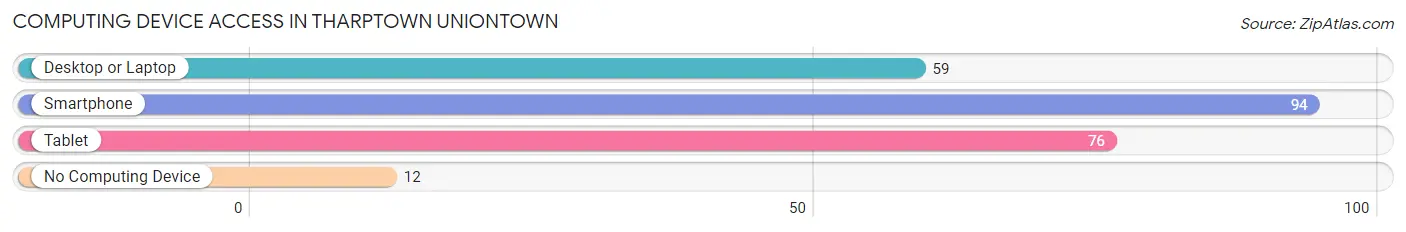
| Device Type | # Households | % Households |
| Desktop or Laptop | 59 | 49.6% |
| Smartphone | 94 | 79.0% |
| Tablet | 76 | 63.9% |
| No Computing Device | 12 | 10.1% |
| Total | 119 | 100.0% |
Internet Access in Tharptown Uniontown
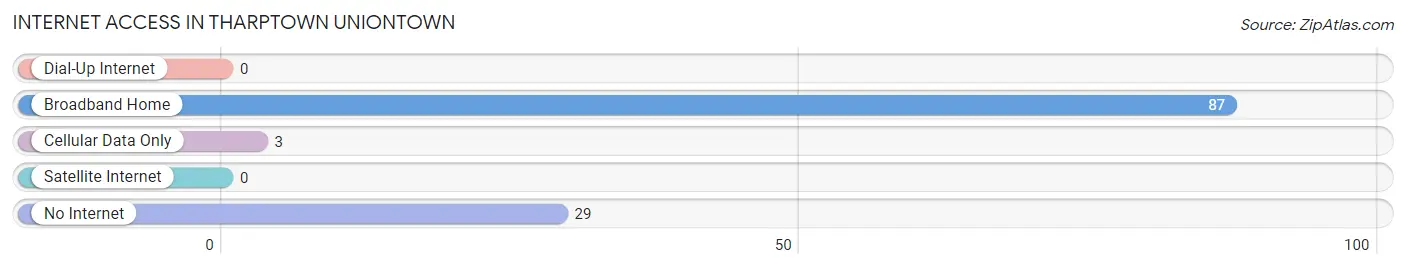
| Internet Type | # Households | % Households |
| Dial-Up Internet | 0 | 0.0% |
| Broadband Home | 87 | 73.1% |
| Cellular Data Only | 3 | 2.5% |
| Satellite Internet | 0 | 0.0% |
| No Internet | 29 | 24.4% |
| Total | 119 | 100.0% |
Tharptown Uniontown Summary
Tharptown, Uniontown, Pennsylvania is a small borough located in Fayette County, Pennsylvania. It is situated in the southwestern corner of the county, approximately 25 miles south of Pittsburgh. The borough is bordered by the townships of German, South Union, and North Union. The population of Tharptown was 1,845 as of the 2010 census.
History
Tharptown was founded in 1817 by John Tharp, a Revolutionary War veteran. The town was originally known as Tharp’s Town, but the name was changed to Tharptown in 1820. The town was incorporated in 1836.
The town was a major stop on the Pittsburgh and Connellsville Railroad, which ran through the town from 1871 to 1952. The railroad was a major factor in the growth of the town, as it allowed for the transportation of goods and people to and from the town.
Geography
Tharptown is located at 39°53'N 79°48'W (39.8833, -79.8000). According to the United States Census Bureau, the borough has a total area of 0.6 square miles (1.6 km2), all of it land.
The town is situated in the Appalachian Mountains, and is surrounded by rolling hills and forests. The town is located in the Monongahela River Valley, and is approximately 25 miles south of Pittsburgh.
Economy
The economy of Tharptown is largely based on agriculture and tourism. The town is home to several small businesses, including a grocery store, a hardware store, and a few restaurants. The town also has a few small manufacturing companies.
The town is also home to a number of tourist attractions, including the Tharptown Historical Society Museum, the Tharptown Railroad Museum, and the Tharptown Antique Mall.
Demographics
As of the 2010 census, the population of Tharptown was 1,845. The racial makeup of the town was 97.2% White, 0.7% African American, 0.2% Native American, 0.2% Asian, 0.2% from other races, and 1.7% from two or more races. Hispanic or Latino of any race were 0.7% of the population.
The median income for a household in the town was $37,500, and the median income for a family was $45,000. The per capita income for the town was $18,000. About 11.2% of families and 13.2% of the population were below the poverty line, including 17.2% of those under age 18 and 8.2% of those age 65 or over.
Tharptown is a small, rural town with a strong sense of community. The town is home to a variety of businesses and attractions, and is a popular destination for tourists. The town is also home to a number of historical sites, making it a great place to visit for those interested in the history of the area.
Common Questions
What is the Total Population of Tharptown Uniontown?
Total Population of Tharptown Uniontown is 269.
What is the Total Male Population of Tharptown Uniontown?
Total Male Population of Tharptown Uniontown is 126.
What is the Total Female Population of Tharptown Uniontown?
Total Female Population of Tharptown Uniontown is 143.
What is the Ratio of Males per 100 Females in Tharptown Uniontown?
There are 88.11 Males per 100 Females in Tharptown Uniontown.
What is the Ratio of Females per 100 Males in Tharptown Uniontown?
There are 113.49 Females per 100 Males in Tharptown Uniontown.
What is the Median Population Age in Tharptown Uniontown?
Median Population Age in Tharptown Uniontown is 54.5 Years.
What is the Average Family Size in Tharptown Uniontown
Average Family Size in Tharptown Uniontown is 2.5 People.
What is the Average Household Size in Tharptown Uniontown
Average Household Size in Tharptown Uniontown is 2.3 People.
What is Per Capita Income in Tharptown Uniontown?
Per Capita income in Tharptown Uniontown is $30,695.
What is the Median Family Income in Tharptown Uniontown?
Median Family Income in Tharptown Uniontown is $55,956.
What is Income or Wage Gap in Tharptown Uniontown?
Income or Wage Gap in Tharptown Uniontown is 28.5%.
Women in Tharptown Uniontown earn 71.5 cents for every dollar earned by a man.
What is Inequality or Gini Index in Tharptown Uniontown?
Inequality or Gini Index in Tharptown Uniontown is 0.50.
How Large is the Labor Force in Tharptown Uniontown?
There are 163 People in the Labor Forcein in Tharptown Uniontown.
What is the Percentage of People in the Labor Force in Tharptown Uniontown?
70.6% of People are in the Labor Force in Tharptown Uniontown.
What is the Unemployment Rate in Tharptown Uniontown?
Unemployment Rate in Tharptown Uniontown is 17.2%.