Farrell, PA
Farrell Map
Farrell Overview
4,280
TOTAL POPULATION
2,088
MALE POPULATION
2,192
FEMALE POPULATION
95.26
MALES / 100 FEMALES
104.98
FEMALES / 100 MALES
39.8
MEDIAN AGE
3.0
AVG FAMILY SIZE
2.1
AVG HOUSEHOLD SIZE
$22,635
PER CAPITA INCOME
$36,283
AVG FAMILY INCOME
$29,063
AVG HOUSEHOLD INCOME
3.8%
WAGE / INCOME GAP [ % ]
96.2¢/ $1
WAGE / INCOME GAP [ $ ]
0.57
INEQUALITY / GINI INDEX
1,233
LABOR FORCE [ PEOPLE ]
36.9%
PERCENT IN LABOR FORCE
7.4%
UNEMPLOYMENT RATE
Farrell Zip Codes
Farrell Area Codes
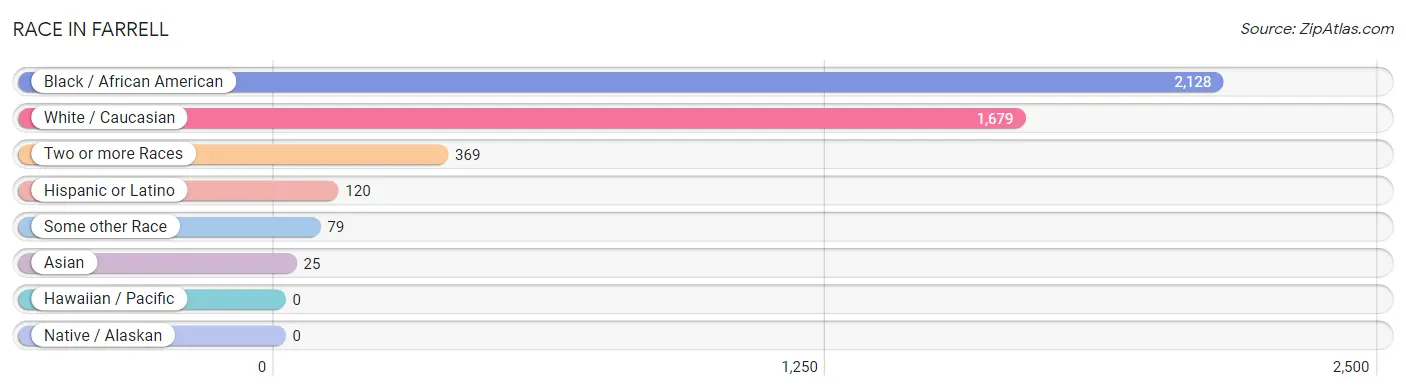
Race in Farrell
The most populous races in Farrell are Black / African American (2,128 | 49.7%), White / Caucasian (1,679 | 39.2%), and Two or more Races (369 | 8.6%).
| Race | # Population | % Population |
| Asian | 25 | 0.6% |
| Black / African American | 2,128 | 49.7% |
| Hawaiian / Pacific | 0 | 0.0% |
| Hispanic or Latino | 120 | 2.8% |
| Native / Alaskan | 0 | 0.0% |
| White / Caucasian | 1,679 | 39.2% |
| Two or more Races | 369 | 8.6% |
| Some other Race | 79 | 1.8% |
| Total | 4,280 | 100.0% |
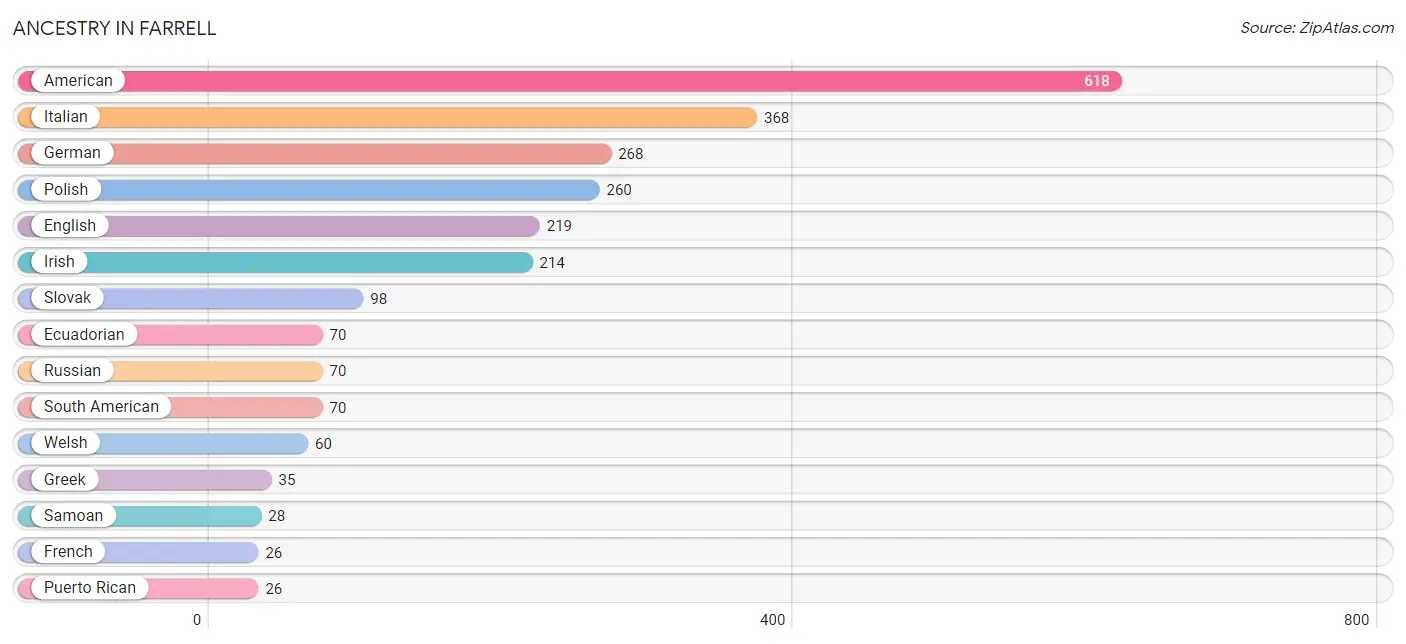
Ancestry in Farrell
The most populous ancestries reported in Farrell are American (618 | 14.4%), Italian (368 | 8.6%), German (268 | 6.3%), Polish (260 | 6.1%), and English (219 | 5.1%), together accounting for 40.5% of all Farrell residents.
| Ancestry | # Population | % Population |
| African | 1 | 0.0% |
| American | 618 | 14.4% |
| Arab | 15 | 0.4% |
| Armenian | 6 | 0.1% |
| Bhutanese | 23 | 0.5% |
| Bulgarian | 2 | 0.1% |
| Cherokee | 11 | 0.3% |
| Chippewa | 18 | 0.4% |
| Croatian | 22 | 0.5% |
| Cuban | 9 | 0.2% |
| Ecuadorian | 70 | 1.6% |
| English | 219 | 5.1% |
| European | 25 | 0.6% |
| Finnish | 17 | 0.4% |
| French | 26 | 0.6% |
| German | 268 | 6.3% |
| Greek | 35 | 0.8% |
| Hungarian | 10 | 0.2% |
| Indian (Asian) | 25 | 0.6% |
| Irish | 214 | 5.0% |
| Italian | 368 | 8.6% |
| Korean | 23 | 0.5% |
| Lebanese | 15 | 0.4% |
| Northern European | 5 | 0.1% |
| Norwegian | 4 | 0.1% |
| Polish | 260 | 6.1% |
| Puerto Rican | 26 | 0.6% |
| Romanian | 12 | 0.3% |
| Russian | 70 | 1.6% |
| Samoan | 28 | 0.6% |
| Scotch-Irish | 19 | 0.4% |
| Serbian | 19 | 0.4% |
| Sioux | 6 | 0.1% |
| Slovak | 98 | 2.3% |
| South American | 70 | 1.6% |
| Subsaharan African | 1 | 0.0% |
| Swedish | 6 | 0.1% |
| Welsh | 60 | 1.4% | View All 38 Rows |
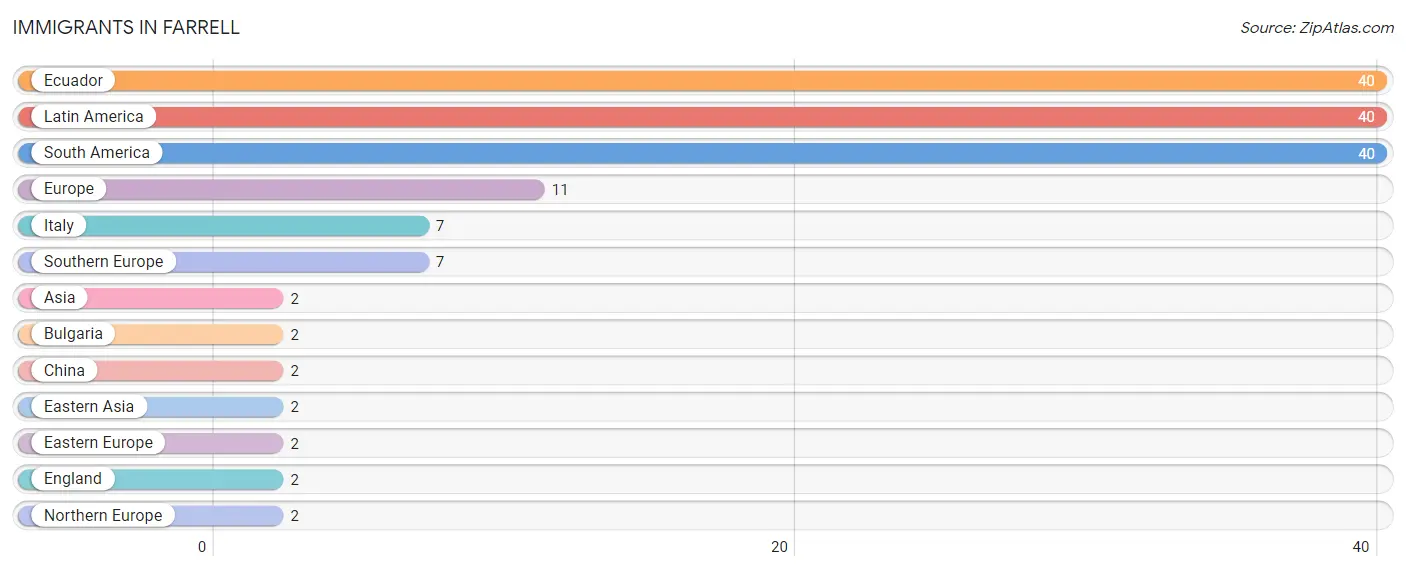
Immigrants in Farrell
The most numerous immigrant groups reported in Farrell came from Ecuador (40 | 0.9%), Latin America (40 | 0.9%), South America (40 | 0.9%), Europe (11 | 0.3%), and Italy (7 | 0.2%), together accounting for 3.2% of all Farrell residents.
| Immigration Origin | # Population | % Population |
| Asia | 2 | 0.1% |
| Bulgaria | 2 | 0.1% |
| China | 2 | 0.1% |
| Eastern Asia | 2 | 0.1% |
| Eastern Europe | 2 | 0.1% |
| Ecuador | 40 | 0.9% |
| England | 2 | 0.1% |
| Europe | 11 | 0.3% |
| Italy | 7 | 0.2% |
| Latin America | 40 | 0.9% |
| Northern Europe | 2 | 0.1% |
| South America | 40 | 0.9% |
| Southern Europe | 7 | 0.2% | View All 13 Rows |
Sex and Age in Farrell
Sex and Age in Farrell
The most populous age groups in Farrell are 15 to 19 Years (336 | 16.1%) for men and 60 to 64 Years (268 | 12.2%) for women.
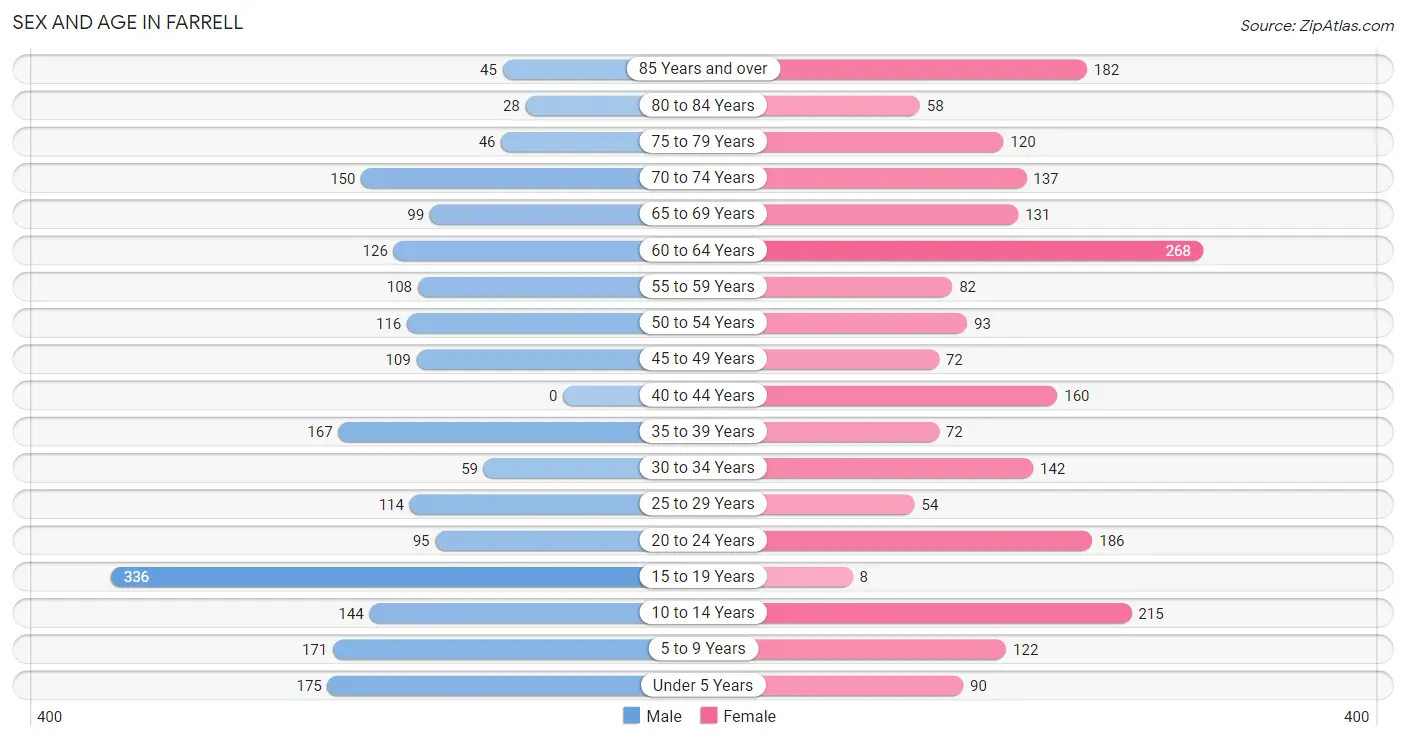
| Age Bracket | Male | Female |
| Under 5 Years | 175 (8.4%) | 90 (4.1%) |
| 5 to 9 Years | 171 (8.2%) | 122 (5.6%) |
| 10 to 14 Years | 144 (6.9%) | 215 (9.8%) |
| 15 to 19 Years | 336 (16.1%) | 8 (0.4%) |
| 20 to 24 Years | 95 (4.5%) | 186 (8.5%) |
| 25 to 29 Years | 114 (5.5%) | 54 (2.5%) |
| 30 to 34 Years | 59 (2.8%) | 142 (6.5%) |
| 35 to 39 Years | 167 (8.0%) | 72 (3.3%) |
| 40 to 44 Years | 0 (0.0%) | 160 (7.3%) |
| 45 to 49 Years | 109 (5.2%) | 72 (3.3%) |
| 50 to 54 Years | 116 (5.6%) | 93 (4.2%) |
| 55 to 59 Years | 108 (5.2%) | 82 (3.7%) |
| 60 to 64 Years | 126 (6.0%) | 268 (12.2%) |
| 65 to 69 Years | 99 (4.7%) | 131 (6.0%) |
| 70 to 74 Years | 150 (7.2%) | 137 (6.2%) |
| 75 to 79 Years | 46 (2.2%) | 120 (5.5%) |
| 80 to 84 Years | 28 (1.3%) | 58 (2.6%) |
| 85 Years and over | 45 (2.2%) | 182 (8.3%) |
| Total | 2,088 (100.0%) | 2,192 (100.0%) |
Families and Households in Farrell
Median Family Size in Farrell
The median family size in Farrell is 3.00 persons per family, with single male/father families (82 | 8.0%) accounting for the largest median family size of 4.1 persons per family. On the other hand, married-couple families (461 | 44.8%) represent the smallest median family size with 2.74 persons per family.
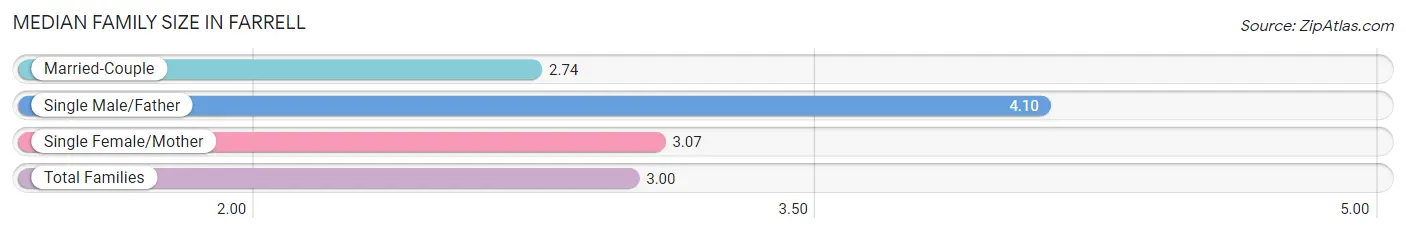
| Family Type | # Families | Family Size |
| Married-Couple | 461 (44.8%) | 2.74 |
| Single Male/Father | 82 (8.0%) | 4.10 |
| Single Female/Mother | 486 (47.2%) | 3.07 |
| Total Families | 1,029 (100.0%) | 3.00 |
Median Household Size in Farrell
The median household size in Farrell is 2.14 persons per household, with single male/father households (82 | 4.2%) accounting for the largest median household size of 4.13 persons per household. non-family households (947 | 47.9%) represent the smallest median household size with 1.11 persons per household.
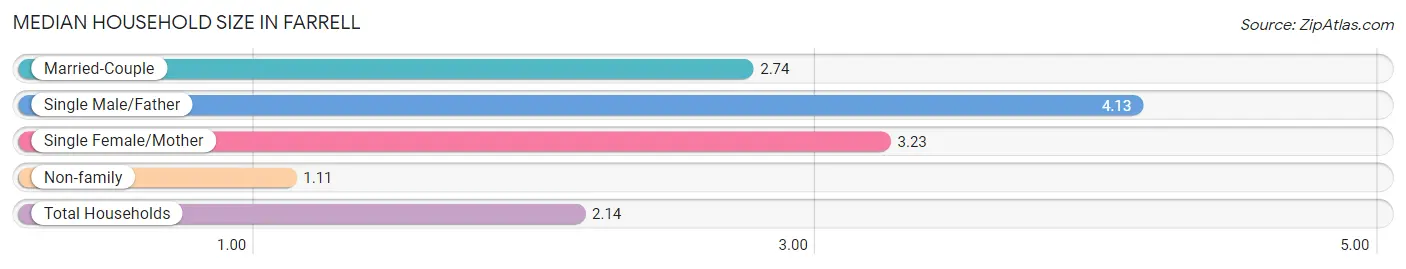
| Household Type | # Households | Household Size |
| Married-Couple | 461 (23.3%) | 2.74 |
| Single Male/Father | 82 (4.2%) | 4.13 |
| Single Female/Mother | 486 (24.6%) | 3.23 |
| Non-family | 947 (47.9%) | 1.11 |
| Total Households | 1,976 (100.0%) | 2.14 |
Household Size by Marriage Status in Farrell
Out of a total of 1,976 households in Farrell, 1,029 (52.1%) are family households, while 947 (47.9%) are nonfamily households. The most numerous type of family households are 2-person households, comprising 528, and the most common type of nonfamily households are 1-person households, comprising 850.
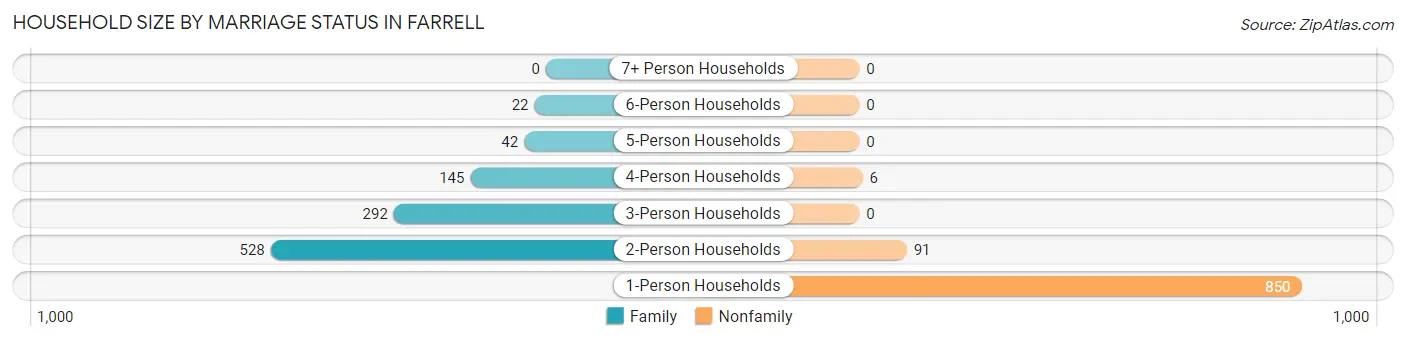
| Household Size | Family Households | Nonfamily Households |
| 1-Person Households | - | 850 (43.0%) |
| 2-Person Households | 528 (26.7%) | 91 (4.6%) |
| 3-Person Households | 292 (14.8%) | 0 (0.0%) |
| 4-Person Households | 145 (7.3%) | 6 (0.3%) |
| 5-Person Households | 42 (2.1%) | 0 (0.0%) |
| 6-Person Households | 22 (1.1%) | 0 (0.0%) |
| 7+ Person Households | 0 (0.0%) | 0 (0.0%) |
| Total | 1,029 (52.1%) | 947 (47.9%) |
Female Fertility in Farrell
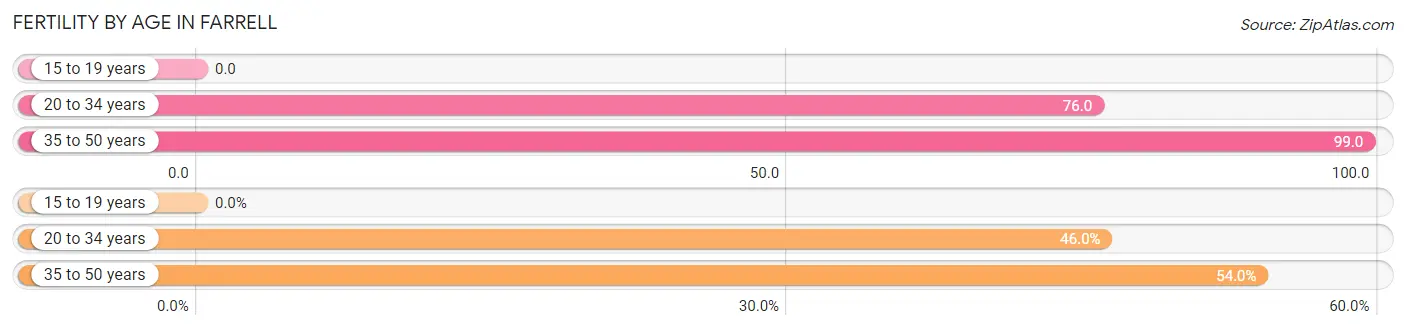
Fertility by Age in Farrell
Average fertility rate in Farrell is 86.0 births per 1,000 women. Women in the age bracket of 35 to 50 years have the highest fertility rate with 99.0 births per 1,000 women. Women in the age bracket of 35 to 50 years acount for 54.0% of all women with births.
| Age Bracket | Women with Births | Births / 1,000 Women |
| 15 to 19 years | 0 (0.0%) | 0.0 |
| 20 to 34 years | 29 (46.0%) | 76.0 |
| 35 to 50 years | 34 (54.0%) | 99.0 |
| Total | 63 (100.0%) | 86.0 |
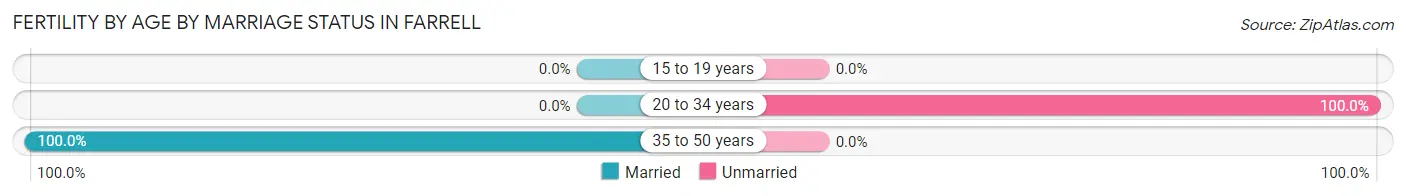
Fertility by Age by Marriage Status in Farrell
54.0% of women with births (63) in Farrell are married. The highest percentage of unmarried women with births falls into 20 to 34 years age bracket with 100.0% of them unmarried at the time of birth, while the lowest percentage of unmarried women with births belong to 35 to 50 years age bracket with 0.0% of them unmarried.
| Age Bracket | Married | Unmarried |
| 15 to 19 years | 0 (0.0%) | 0 (0.0%) |
| 20 to 34 years | 0 (0.0%) | 29 (100.0%) |
| 35 to 50 years | 34 (100.0%) | 0 (0.0%) |
| Total | 34 (54.0%) | 29 (46.0%) |
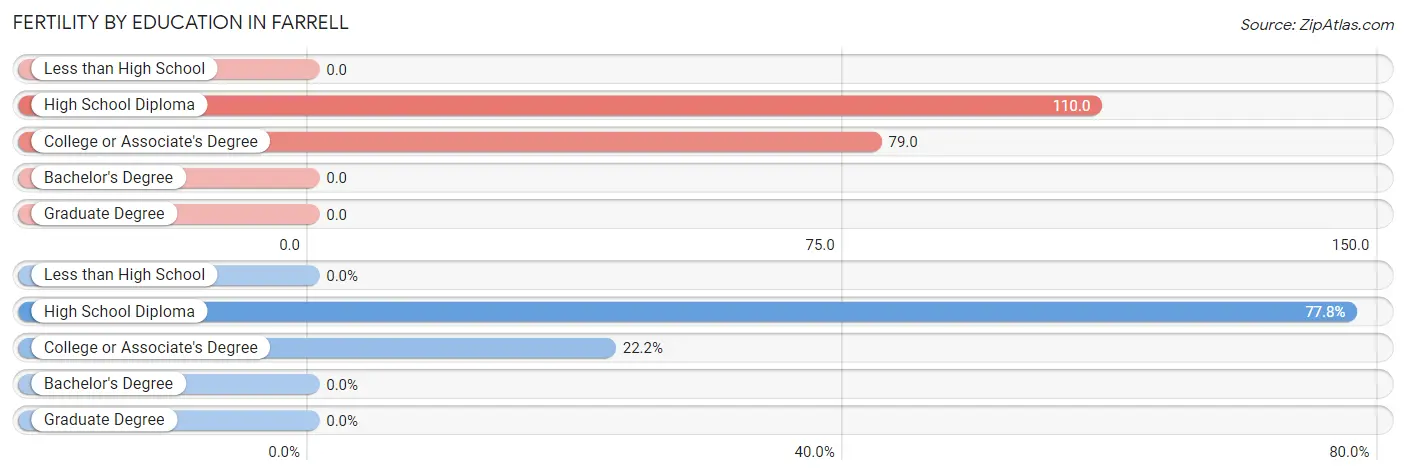
Fertility by Education in Farrell
| Educational Attainment | Women with Births | Births / 1,000 Women |
| Less than High School | 0 (0.0%) | 0.0 |
| High School Diploma | 49 (77.8%) | 110.0 |
| College or Associate's Degree | 14 (22.2%) | 79.0 |
| Bachelor's Degree | 0 (0.0%) | 0.0 |
| Graduate Degree | 0 (0.0%) | 0.0 |
| Total | 63 (100.0%) | 86.0 |
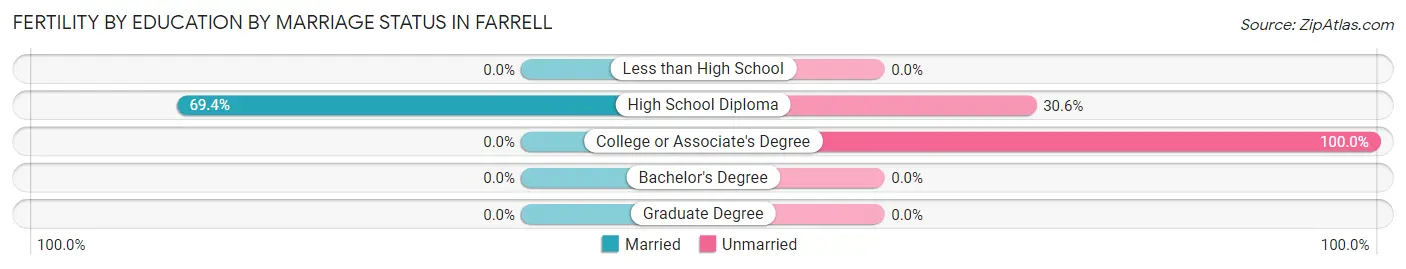
Fertility by Education by Marriage Status in Farrell
46.0% of women with births in Farrell are unmarried. Women with the educational attainment of high school diploma are most likely to be married with 69.4% of them married at childbirth, while women with the educational attainment of college or associate's degree are least likely to be married with 100.0% of them unmarried at childbirth.
| Educational Attainment | Married | Unmarried |
| Less than High School | 0 (0.0%) | 0 (0.0%) |
| High School Diploma | 34 (69.4%) | 15 (30.6%) |
| College or Associate's Degree | 0 (0.0%) | 14 (100.0%) |
| Bachelor's Degree | 0 (0.0%) | 0 (0.0%) |
| Graduate Degree | 0 (0.0%) | 0 (0.0%) |
| Total | 34 (54.0%) | 29 (46.0%) |
Income in Farrell
Income Overview in Farrell
Per Capita Income in Farrell is $22,635, while median incomes of families and households are $36,283 and $29,063 respectively.
| Characteristic | Number | Measure |
| Per Capita Income | 4,280 | $22,635 |
| Median Family Income | 1,029 | $36,283 |
| Mean Family Income | 1,029 | $56,693 |
| Median Household Income | 1,976 | $29,063 |
| Mean Household Income | 1,976 | $48,940 |
| Income Deficit | 1,029 | $0 |
| Wage / Income Gap (%) | 4,280 | 3.81% |
| Wage / Income Gap ($) | 4,280 | 96.19¢ per $1 |
| Gini / Inequality Index | 4,280 | 0.57 |
Earnings by Sex in Farrell
Average Earnings in Farrell are $26,585, $26,331 for men and $27,375 for women, a difference of 3.8%.
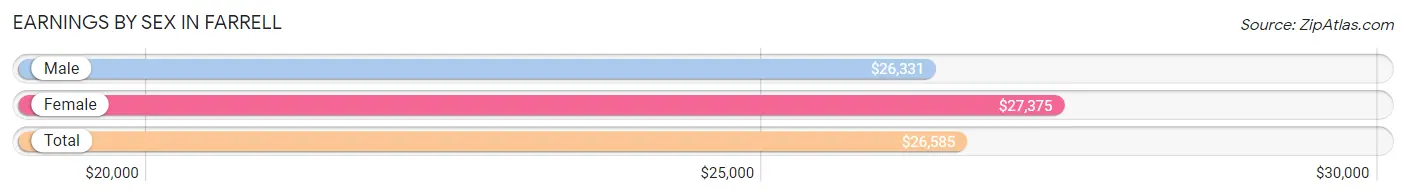
| Sex | Number | Average Earnings |
| Male | 730 (51.3%) | $26,331 |
| Female | 694 (48.7%) | $27,375 |
| Total | 1,424 (100.0%) | $26,585 |
Earnings by Sex by Income Bracket in Farrell
The most common earnings brackets in Farrell are $2,500 to $4,999 for men (85 | 11.6%) and $30,000 to $34,999 for women (76 | 11.0%).
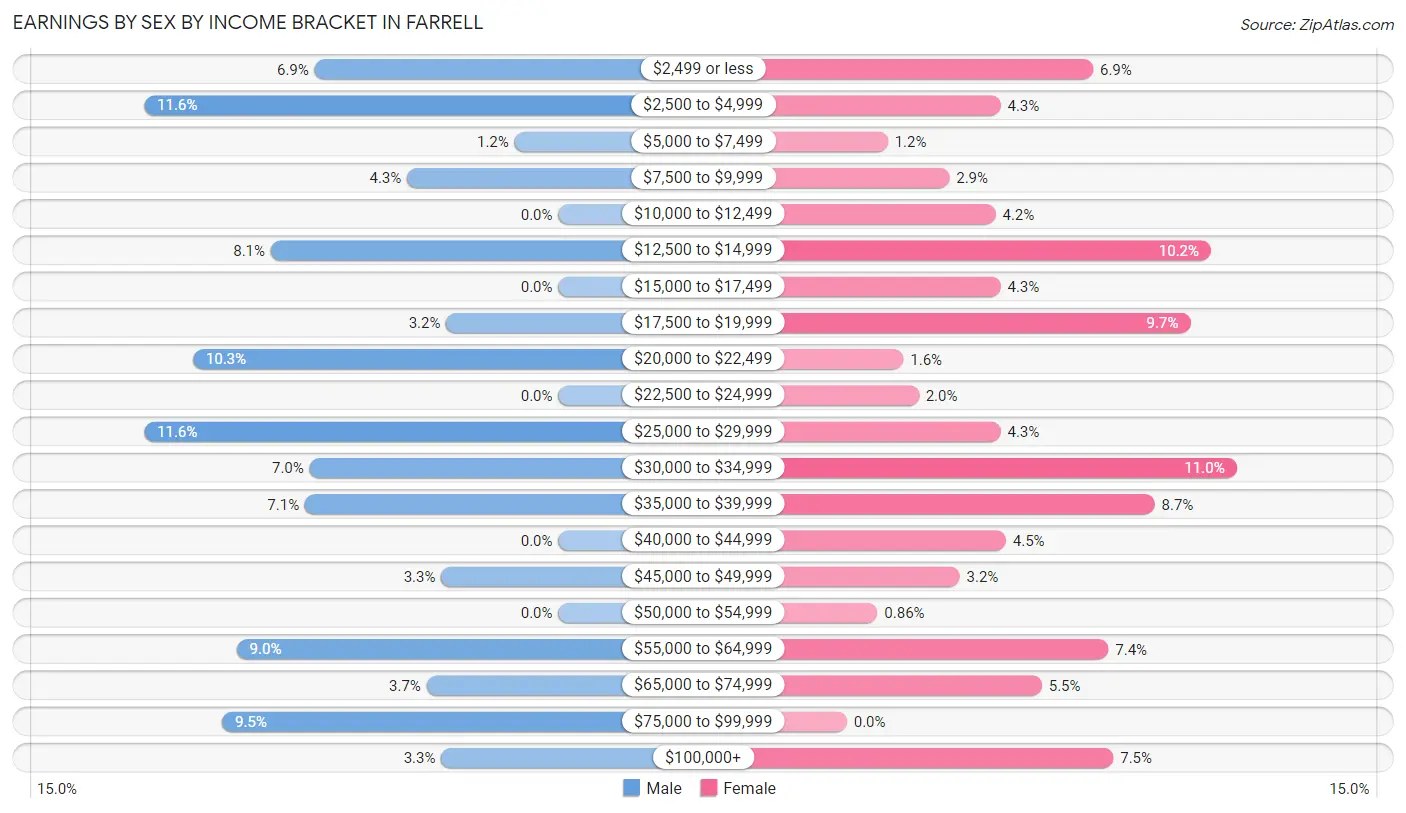
| Income | Male | Female |
| $2,499 or less | 50 (6.9%) | 48 (6.9%) |
| $2,500 to $4,999 | 85 (11.6%) | 30 (4.3%) |
| $5,000 to $7,499 | 9 (1.2%) | 8 (1.1%) |
| $7,500 to $9,999 | 31 (4.3%) | 20 (2.9%) |
| $10,000 to $12,499 | 0 (0.0%) | 29 (4.2%) |
| $12,500 to $14,999 | 59 (8.1%) | 71 (10.2%) |
| $15,000 to $17,499 | 0 (0.0%) | 30 (4.3%) |
| $17,500 to $19,999 | 23 (3.2%) | 67 (9.7%) |
| $20,000 to $22,499 | 75 (10.3%) | 11 (1.6%) |
| $22,500 to $24,999 | 0 (0.0%) | 14 (2.0%) |
| $25,000 to $29,999 | 85 (11.6%) | 30 (4.3%) |
| $30,000 to $34,999 | 51 (7.0%) | 76 (11.0%) |
| $35,000 to $39,999 | 52 (7.1%) | 60 (8.6%) |
| $40,000 to $44,999 | 0 (0.0%) | 31 (4.5%) |
| $45,000 to $49,999 | 24 (3.3%) | 22 (3.2%) |
| $50,000 to $54,999 | 0 (0.0%) | 6 (0.9%) |
| $55,000 to $64,999 | 66 (9.0%) | 51 (7.3%) |
| $65,000 to $74,999 | 27 (3.7%) | 38 (5.5%) |
| $75,000 to $99,999 | 69 (9.5%) | 0 (0.0%) |
| $100,000+ | 24 (3.3%) | 52 (7.5%) |
| Total | 730 (100.0%) | 694 (100.0%) |
Earnings by Sex by Educational Attainment in Farrell
Average earnings in Farrell are $35,652 for men and $28,375 for women, a difference of 20.4%. Men with an educational attainment of bachelor's degree enjoy the highest average annual earnings of $83,889, while those with college or associate's degree education earn the least with $28,750. Women with an educational attainment of bachelor's degree earn the most with the average annual earnings of $61,438, while those with college or associate's degree education have the smallest earnings of $14,279.
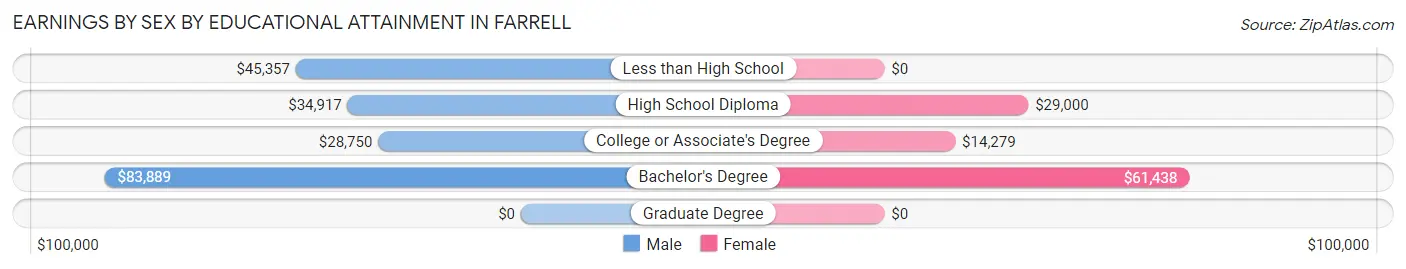
| Educational Attainment | Male Income | Female Income |
| Less than High School | $45,357 | $0 |
| High School Diploma | $34,917 | $29,000 |
| College or Associate's Degree | $28,750 | $14,279 |
| Bachelor's Degree | $83,889 | $61,438 |
| Graduate Degree | - | - |
| Total | $35,652 | $28,375 |
Family Income in Farrell
Family Income Brackets in Farrell
According to the Farrell family income data, there are 189 families falling into the $50,000 to $74,999 income range, which is the most common income bracket and makes up 18.4% of all families. Conversely, the $150,000 to $199,999 income bracket is the least frequent group with only 7 families (0.7%) belonging to this category.
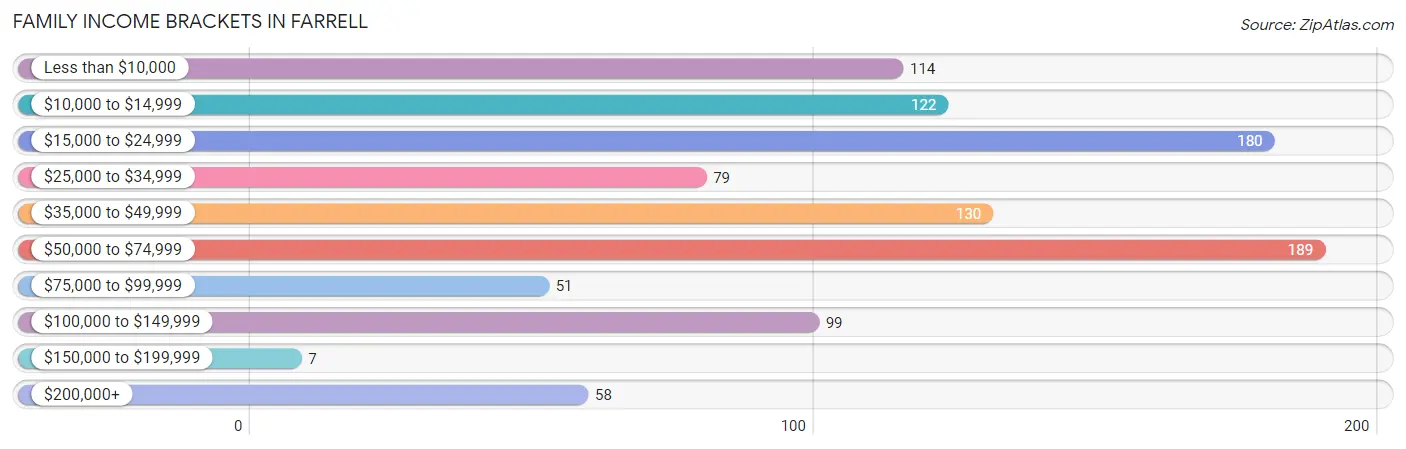
| Income Bracket | # Families | % Families |
| Less than $10,000 | 114 | 11.1% |
| $10,000 to $14,999 | 122 | 11.9% |
| $15,000 to $24,999 | 180 | 17.5% |
| $25,000 to $34,999 | 79 | 7.7% |
| $35,000 to $49,999 | 130 | 12.6% |
| $50,000 to $74,999 | 189 | 18.4% |
| $75,000 to $99,999 | 51 | 5.0% |
| $100,000 to $149,999 | 99 | 9.6% |
| $150,000 to $199,999 | 7 | 0.7% |
| $200,000+ | 58 | 5.6% |
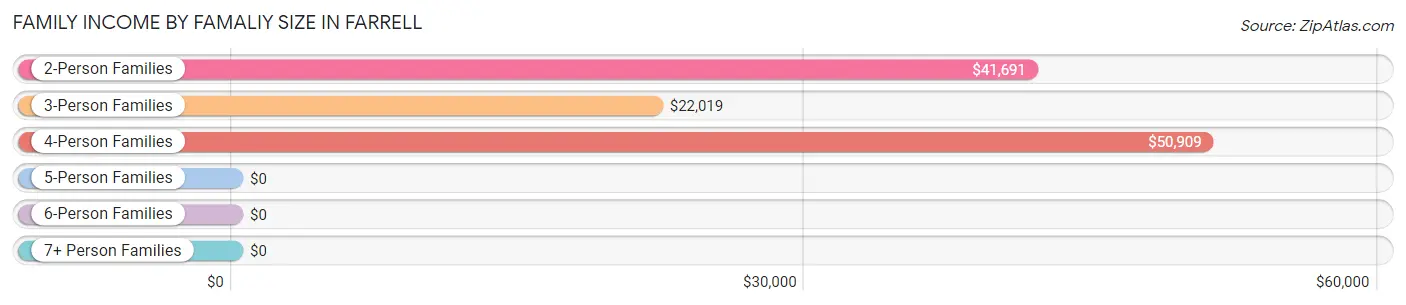
Family Income by Famaliy Size in Farrell
4-person families (176 | 17.1%) account for the highest median family income in Farrell with $50,909 per family, while 2-person families (537 | 52.2%) have the highest median income of $20,846 per family member.
| Income Bracket | # Families | Median Income |
| 2-Person Families | 537 (52.2%) | $41,691 |
| 3-Person Families | 294 (28.6%) | $22,019 |
| 4-Person Families | 176 (17.1%) | $50,909 |
| 5-Person Families | 22 (2.1%) | $0 |
| 6-Person Families | 0 (0.0%) | $0 |
| 7+ Person Families | 0 (0.0%) | $0 |
| Total | 1,029 (100.0%) | $36,283 |
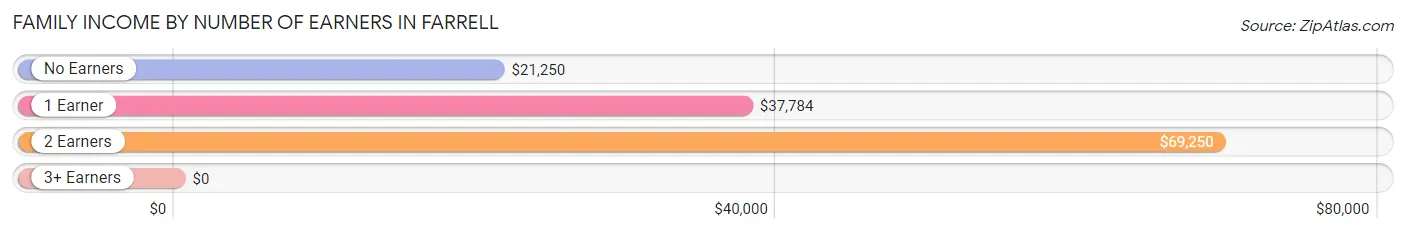
Family Income by Number of Earners in Farrell
| Number of Earners | # Families | Median Income |
| No Earners | 421 (40.9%) | $21,250 |
| 1 Earner | 347 (33.7%) | $37,784 |
| 2 Earners | 206 (20.0%) | $69,250 |
| 3+ Earners | 55 (5.3%) | $0 |
| Total | 1,029 (100.0%) | $36,283 |
Household Income in Farrell
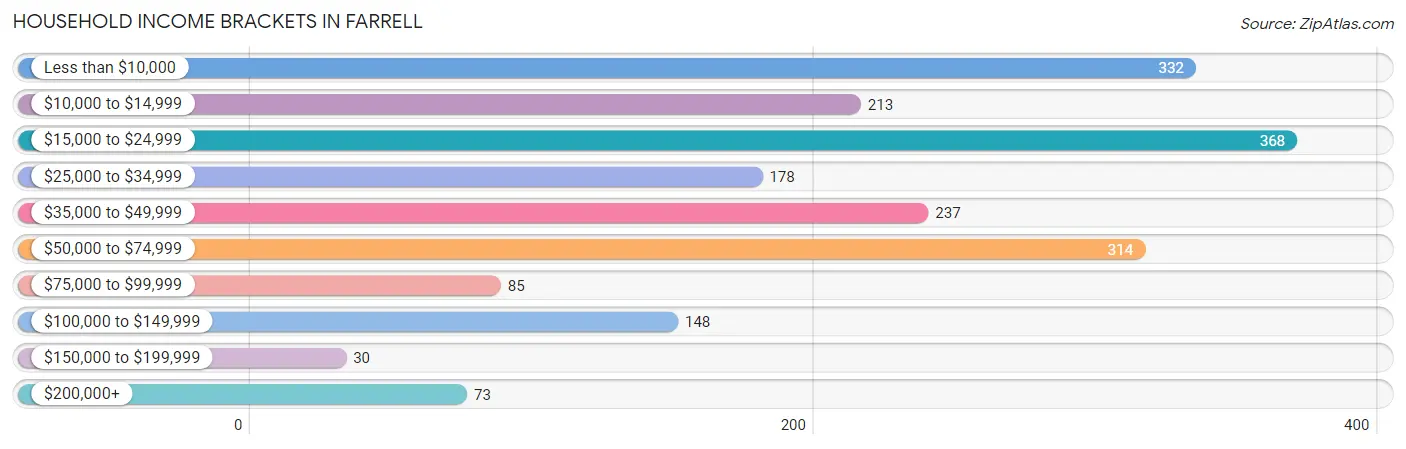
Household Income Brackets in Farrell
With 368 households falling in the category, the $15,000 to $24,999 income range is the most frequent in Farrell, accounting for 18.6% of all households. In contrast, only 30 households (1.5%) fall into the $150,000 to $199,999 income bracket, making it the least populous group.
| Income Bracket | # Households | % Households |
| Less than $10,000 | 332 | 16.8% |
| $10,000 to $14,999 | 213 | 10.8% |
| $15,000 to $24,999 | 368 | 18.6% |
| $25,000 to $34,999 | 178 | 9.0% |
| $35,000 to $49,999 | 237 | 12.0% |
| $50,000 to $74,999 | 314 | 15.9% |
| $75,000 to $99,999 | 85 | 4.3% |
| $100,000 to $149,999 | 148 | 7.5% |
| $150,000 to $199,999 | 30 | 1.5% |
| $200,000+ | 73 | 3.7% |
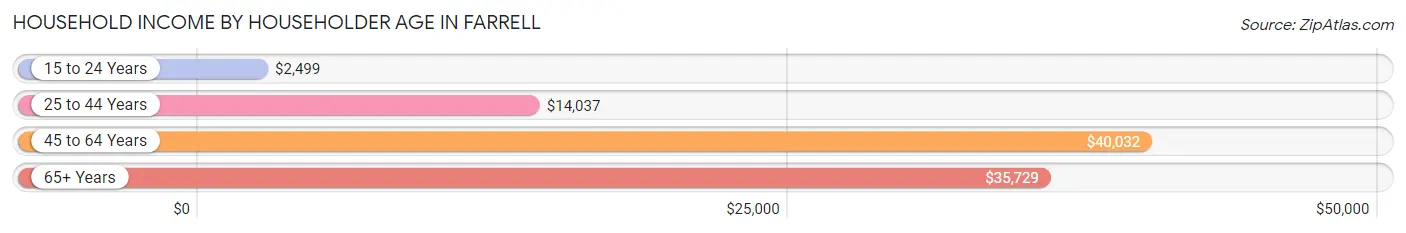
Household Income by Householder Age in Farrell
The median household income in Farrell is $29,063, with the highest median household income of $40,032 found in the 45 to 64 years age bracket for the primary householder. A total of 593 households (30.0%) fall into this category. Meanwhile, the 15 to 24 years age bracket for the primary householder has the lowest median household income of $2,499, with 136 households (6.9%) in this group.
| Income Bracket | # Households | Median Income |
| 15 to 24 Years | 136 (6.9%) | $2,499 |
| 25 to 44 Years | 517 (26.2%) | $14,037 |
| 45 to 64 Years | 593 (30.0%) | $40,032 |
| 65+ Years | 730 (36.9%) | $35,729 |
| Total | 1,976 (100.0%) | $29,063 |
Poverty in Farrell
Income Below Poverty by Sex and Age in Farrell
With 35.4% poverty level for males and 34.6% for females among the residents of Farrell, 5 year old males and 25 to 34 year old females are the most vulnerable to poverty, with 13 males (100.0%) and 161 females (83.9%) in their respective age groups living below the poverty level.
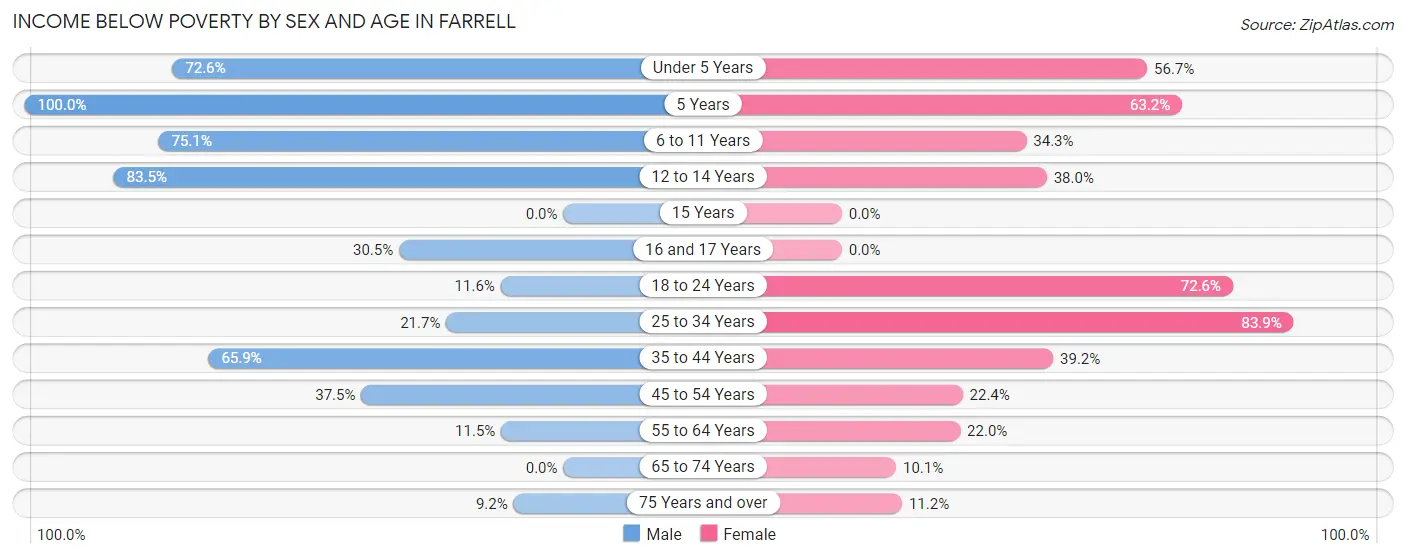
| Age Bracket | Male | Female |
| Under 5 Years | 127 (72.6%) | 51 (56.7%) |
| 5 Years | 13 (100.0%) | 24 (63.2%) |
| 6 to 11 Years | 130 (75.1%) | 37 (34.3%) |
| 12 to 14 Years | 106 (83.5%) | 70 (38.0%) |
| 15 Years | 0 (0.0%) | 0 (0.0%) |
| 16 and 17 Years | 68 (30.5%) | 0 (0.0%) |
| 18 to 24 Years | 22 (11.6%) | 135 (72.6%) |
| 25 to 34 Years | 35 (21.7%) | 161 (83.9%) |
| 35 to 44 Years | 110 (65.9%) | 91 (39.2%) |
| 45 to 54 Years | 84 (37.5%) | 37 (22.4%) |
| 55 to 64 Years | 27 (11.5%) | 76 (22.0%) |
| 65 to 74 Years | 0 (0.0%) | 27 (10.1%) |
| 75 Years and over | 11 (9.2%) | 40 (11.2%) |
| Total | 733 (35.4%) | 749 (34.6%) |
Income Above Poverty by Sex and Age in Farrell
According to the poverty statistics in Farrell, males aged 15 years and females aged 65 to 74 years are the age groups that are most secure financially, with 100.0% of males and 89.9% of females in these age groups living above the poverty line.
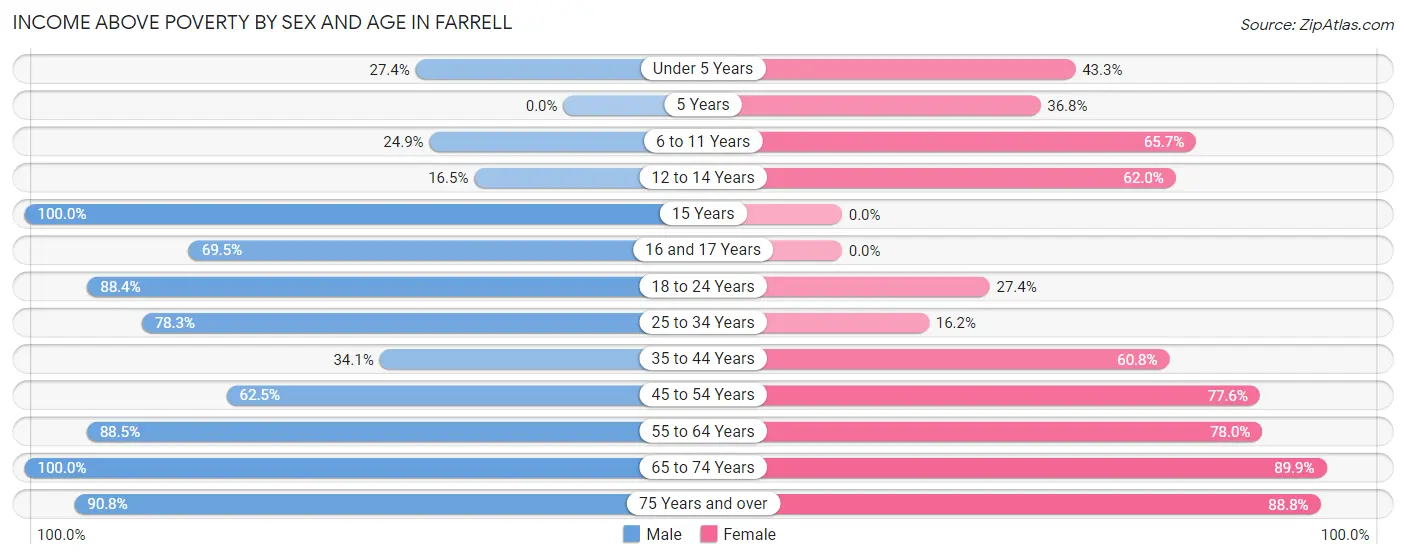
| Age Bracket | Male | Female |
| Under 5 Years | 48 (27.4%) | 39 (43.3%) |
| 5 Years | 0 (0.0%) | 14 (36.8%) |
| 6 to 11 Years | 43 (24.9%) | 71 (65.7%) |
| 12 to 14 Years | 21 (16.5%) | 114 (62.0%) |
| 15 Years | 16 (100.0%) | 0 (0.0%) |
| 16 and 17 Years | 155 (69.5%) | 0 (0.0%) |
| 18 to 24 Years | 167 (88.4%) | 51 (27.4%) |
| 25 to 34 Years | 126 (78.3%) | 31 (16.2%) |
| 35 to 44 Years | 57 (34.1%) | 141 (60.8%) |
| 45 to 54 Years | 140 (62.5%) | 128 (77.6%) |
| 55 to 64 Years | 207 (88.5%) | 270 (78.0%) |
| 65 to 74 Years | 247 (100.0%) | 241 (89.9%) |
| 75 Years and over | 108 (90.8%) | 318 (88.8%) |
| Total | 1,335 (64.6%) | 1,418 (65.4%) |
Income Below Poverty Among Married-Couple Families in Farrell
The poverty statistics for married-couple families in Farrell show that 10.2% or 47 of the total 461 families live below the poverty line. Families with 1 or 2 children have the highest poverty rate of 33.8%, comprising of 47 families. On the other hand, families with no children have the lowest poverty rate of 0.0%, which includes 0 families.
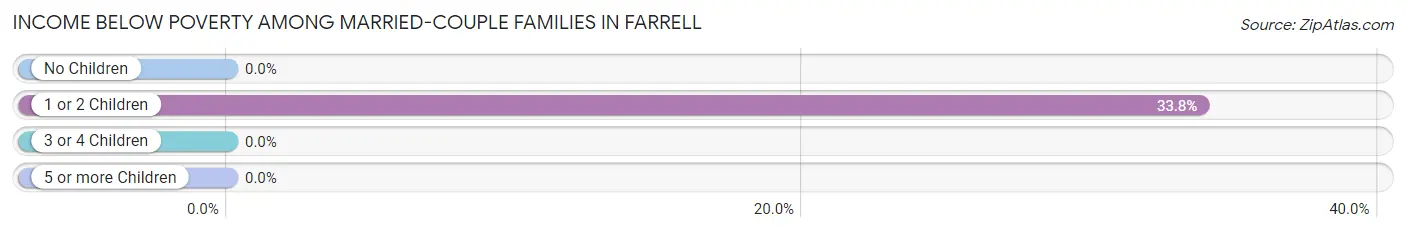
| Children | Above Poverty | Below Poverty |
| No Children | 322 (100.0%) | 0 (0.0%) |
| 1 or 2 Children | 92 (66.2%) | 47 (33.8%) |
| 3 or 4 Children | 0 (0.0%) | 0 (0.0%) |
| 5 or more Children | 0 (0.0%) | 0 (0.0%) |
| Total | 414 (89.8%) | 47 (10.2%) |
Income Below Poverty Among Single-Parent Households in Farrell
According to the poverty data in Farrell, 63.4% or 52 single-father households and 51.4% or 250 single-mother households are living below the poverty line. Among single-father households, those with 1 or 2 children have the highest poverty rate, with 52 households (100.0%) experiencing poverty. Likewise, among single-mother households, those with 1 or 2 children have the highest poverty rate, with 206 households (62.1%) falling below the poverty line.
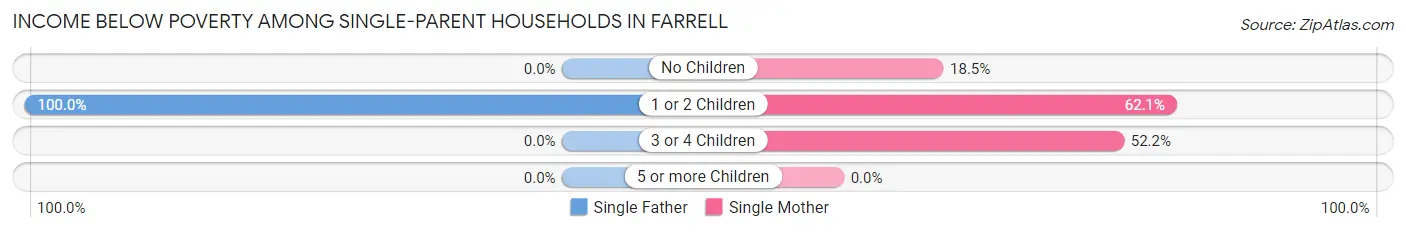
| Children | Single Father | Single Mother |
| No Children | 0 (0.0%) | 20 (18.5%) |
| 1 or 2 Children | 52 (100.0%) | 206 (62.1%) |
| 3 or 4 Children | 0 (0.0%) | 24 (52.2%) |
| 5 or more Children | 0 (0.0%) | 0 (0.0%) |
| Total | 52 (63.4%) | 250 (51.4%) |
Income Below Poverty Among Married-Couple vs Single-Parent Households in Farrell
The poverty data for Farrell shows that 47 of the married-couple family households (10.2%) and 302 of the single-parent households (53.2%) are living below the poverty level. Within the married-couple family households, those with 1 or 2 children have the highest poverty rate, with 47 households (33.8%) falling below the poverty line. Among the single-parent households, those with 1 or 2 children have the highest poverty rate, with 258 household (67.2%) living below poverty.
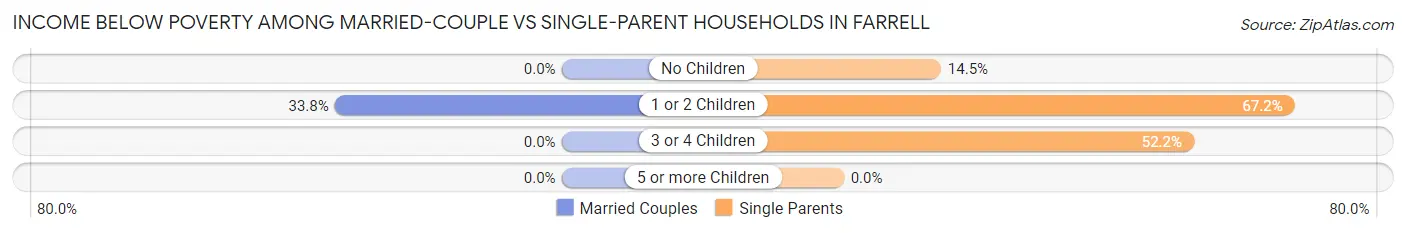
| Children | Married-Couple Families | Single-Parent Households |
| No Children | 0 (0.0%) | 20 (14.5%) |
| 1 or 2 Children | 47 (33.8%) | 258 (67.2%) |
| 3 or 4 Children | 0 (0.0%) | 24 (52.2%) |
| 5 or more Children | 0 (0.0%) | 0 (0.0%) |
| Total | 47 (10.2%) | 302 (53.2%) |
Employment Characteristics in Farrell
Employment by Class of Employer in Farrell
Among the 1,127 employed individuals in Farrell, private company employees (864 | 76.7%), not-for-profit organizations (196 | 17.4%), and local government employees (37 | 3.3%) make up the most common classes of employment.
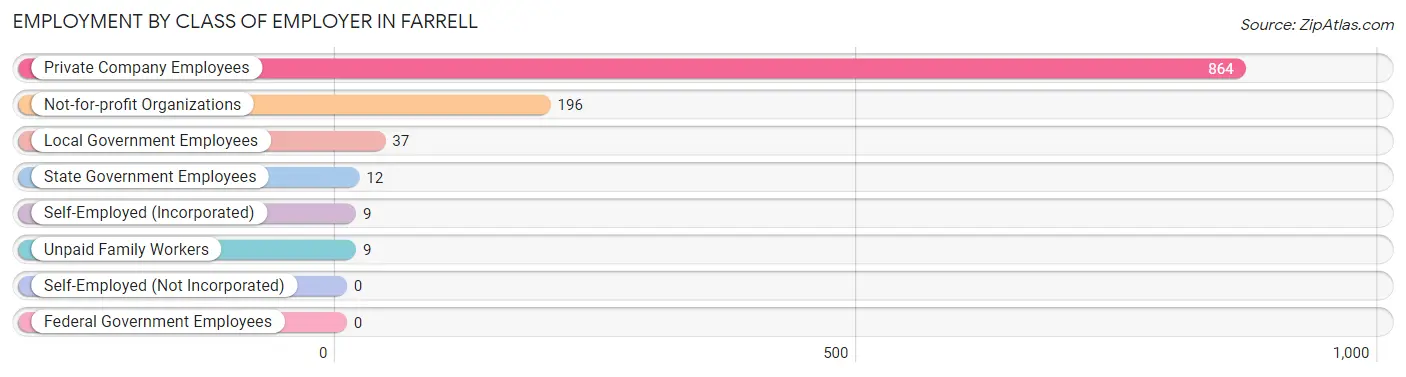
| Employer Class | # Employees | % Employees |
| Private Company Employees | 864 | 76.7% |
| Self-Employed (Incorporated) | 9 | 0.8% |
| Self-Employed (Not Incorporated) | 0 | 0.0% |
| Not-for-profit Organizations | 196 | 17.4% |
| Local Government Employees | 37 | 3.3% |
| State Government Employees | 12 | 1.1% |
| Federal Government Employees | 0 | 0.0% |
| Unpaid Family Workers | 9 | 0.8% |
| Total | 1,127 | 100.0% |
Employment Status by Age in Farrell
According to the labor force statistics for Farrell, out of the total population over 16 years of age (3,342), 36.9% or 1,233 individuals are in the labor force, with 7.4% or 91 of them unemployed. The age group with the highest labor force participation rate is 35 to 44 years, with 70.7% or 282 individuals in the labor force. Within the labor force, the 75 years and over age range has the highest percentage of unemployed individuals, with 30.0% or 6 of them being unemployed.
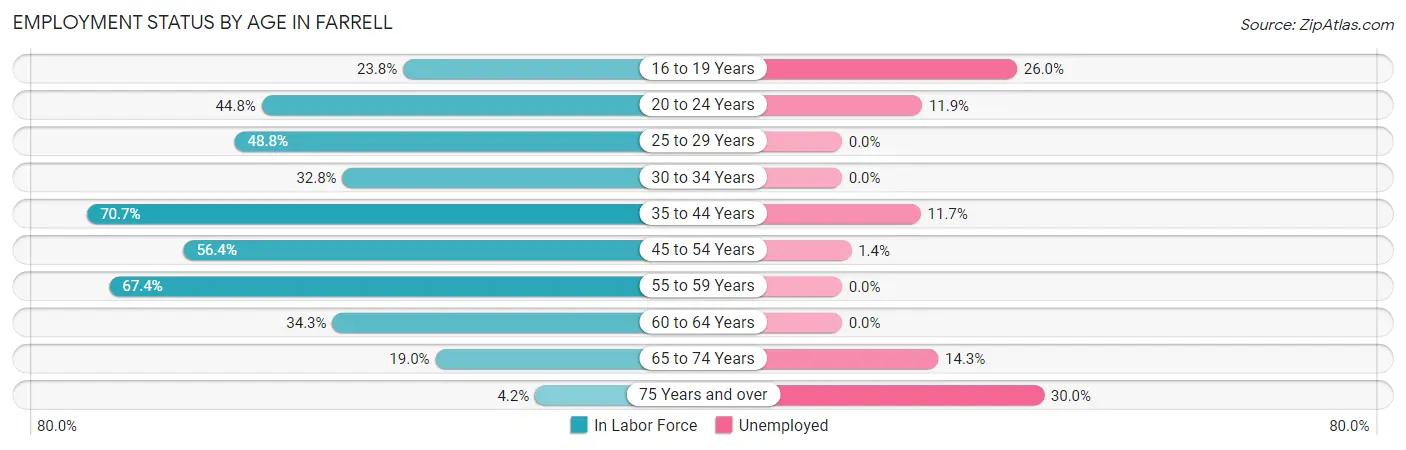
| Age Bracket | In Labor Force | Unemployed |
| 16 to 19 Years | 77 (23.8%) | 20 (26.0%) |
| 20 to 24 Years | 126 (44.8%) | 15 (11.9%) |
| 25 to 29 Years | 82 (48.8%) | 0 (0.0%) |
| 30 to 34 Years | 66 (32.8%) | 0 (0.0%) |
| 35 to 44 Years | 282 (70.7%) | 33 (11.7%) |
| 45 to 54 Years | 220 (56.4%) | 3 (1.4%) |
| 55 to 59 Years | 128 (67.4%) | 0 (0.0%) |
| 60 to 64 Years | 135 (34.3%) | 0 (0.0%) |
| 65 to 74 Years | 98 (19.0%) | 14 (14.3%) |
| 75 Years and over | 20 (4.2%) | 6 (30.0%) |
| Total | 1,233 (36.9%) | 91 (7.4%) |
Employment Status by Educational Attainment in Farrell
According to labor force statistics for Farrell, 52.4% of individuals (913) out of the total population between 25 and 64 years of age (1,742) are in the labor force, with 3.9% or 36 of them being unemployed. The group with the highest labor force participation rate are those with the educational attainment of bachelor's degree or higher, with 93.7% or 163 individuals in the labor force. Within the labor force, individuals with high school diploma education have the highest percentage of unemployment, with 10.7% or 36 of them being unemployed.
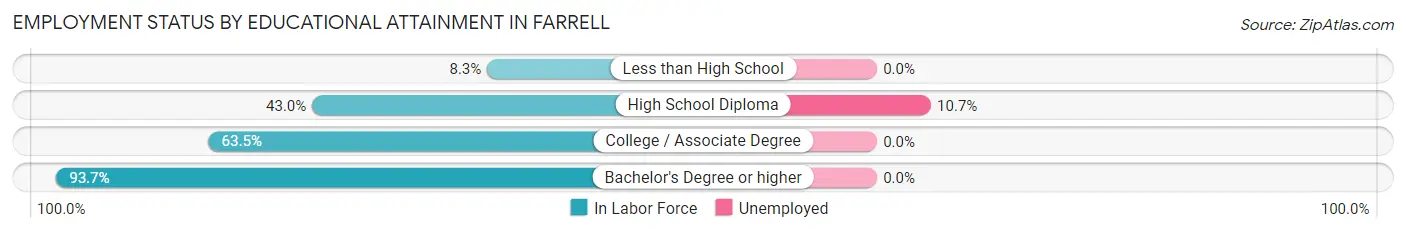
| Educational Attainment | In Labor Force | Unemployed |
| Less than High School | 13 (8.3%) | 0 (0.0%) |
| High School Diploma | 335 (43.0%) | 83 (10.7%) |
| College / Associate Degree | 402 (63.5%) | 0 (0.0%) |
| Bachelor's Degree or higher | 163 (93.7%) | 0 (0.0%) |
| Total | 913 (52.4%) | 68 (3.9%) |
Employment Occupations by Sex in Farrell
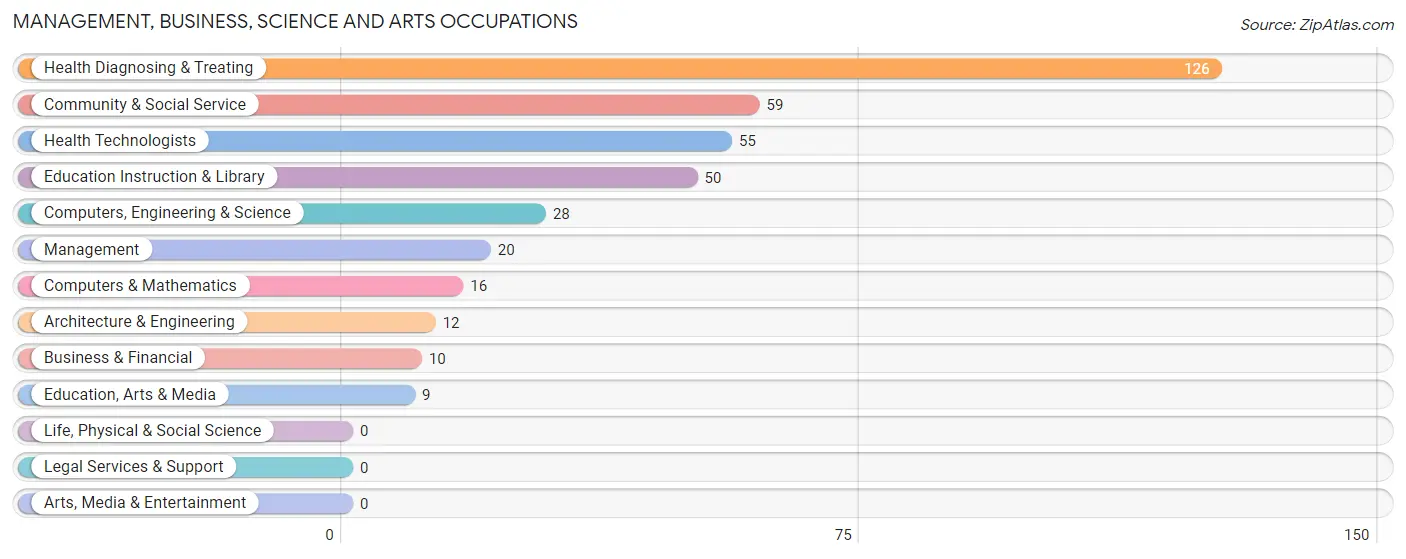
Management, Business, Science and Arts Occupations
The most common Management, Business, Science and Arts occupations in Farrell are Health Diagnosing & Treating (126 | 11.0%), Community & Social Service (59 | 5.2%), Health Technologists (55 | 4.8%), Education Instruction & Library (50 | 4.4%), and Computers, Engineering & Science (28 | 2.5%).
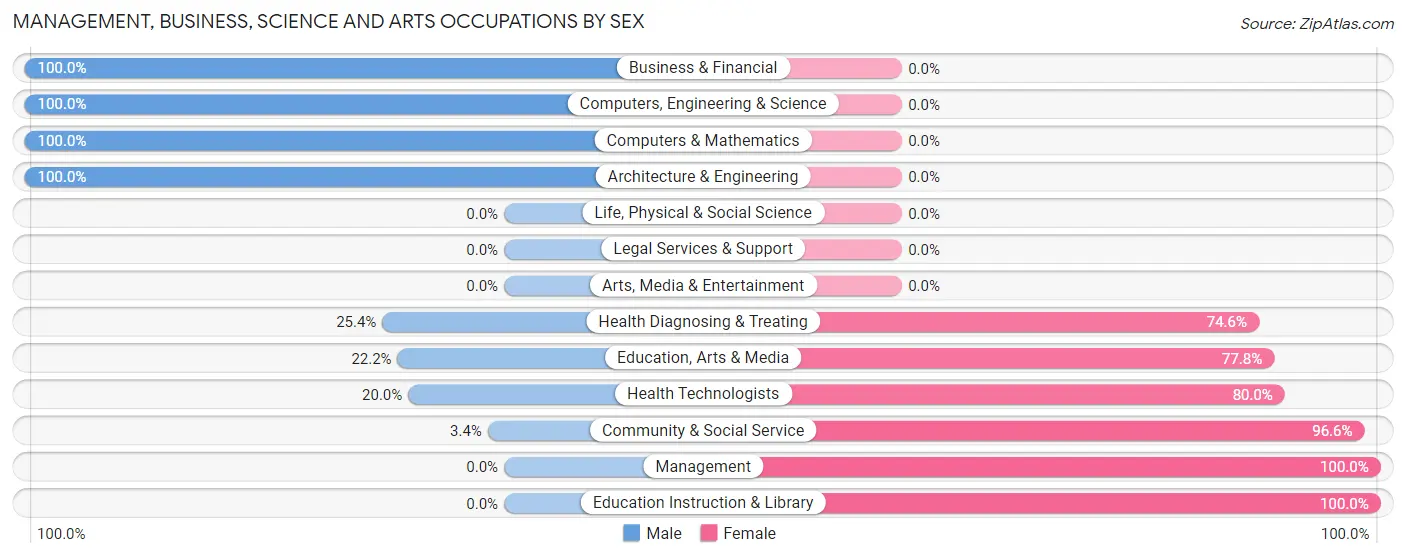
Management, Business, Science and Arts Occupations by Sex
Within the Management, Business, Science and Arts occupations in Farrell, the most male-oriented occupations are Business & Financial (100.0%), Computers, Engineering & Science (100.0%), and Computers & Mathematics (100.0%), while the most female-oriented occupations are Management (100.0%), Education Instruction & Library (100.0%), and Community & Social Service (96.6%).
| Occupation | Male | Female |
| Management | 0 (0.0%) | 20 (100.0%) |
| Business & Financial | 10 (100.0%) | 0 (0.0%) |
| Computers, Engineering & Science | 28 (100.0%) | 0 (0.0%) |
| Computers & Mathematics | 16 (100.0%) | 0 (0.0%) |
| Architecture & Engineering | 12 (100.0%) | 0 (0.0%) |
| Life, Physical & Social Science | 0 (0.0%) | 0 (0.0%) |
| Community & Social Service | 2 (3.4%) | 57 (96.6%) |
| Education, Arts & Media | 2 (22.2%) | 7 (77.8%) |
| Legal Services & Support | 0 (0.0%) | 0 (0.0%) |
| Education Instruction & Library | 0 (0.0%) | 50 (100.0%) |
| Arts, Media & Entertainment | 0 (0.0%) | 0 (0.0%) |
| Health Diagnosing & Treating | 32 (25.4%) | 94 (74.6%) |
| Health Technologists | 11 (20.0%) | 44 (80.0%) |
| Total (Category) | 72 (29.6%) | 171 (70.4%) |
| Total (Overall) | 595 (52.1%) | 548 (47.9%) |
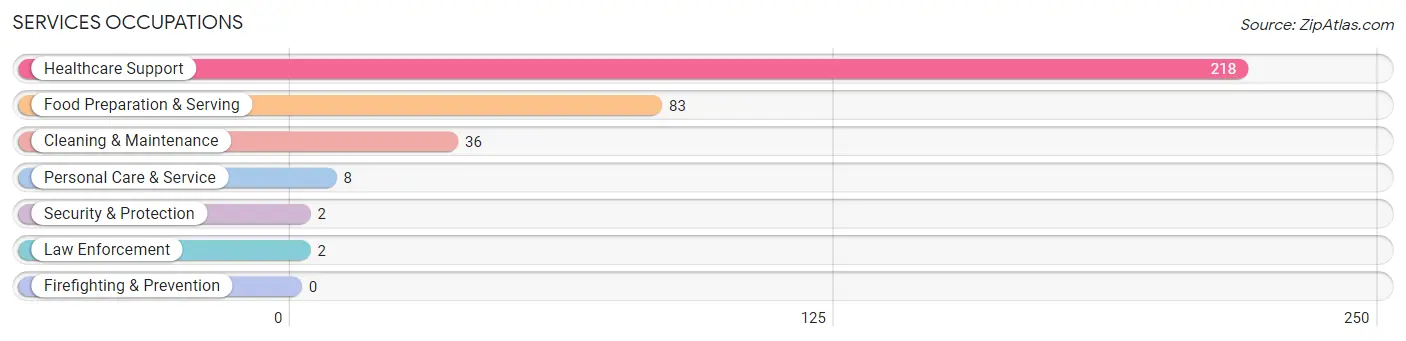
Services Occupations
The most common Services occupations in Farrell are Healthcare Support (218 | 19.1%), Food Preparation & Serving (83 | 7.3%), Cleaning & Maintenance (36 | 3.2%), Personal Care & Service (8 | 0.7%), and Security & Protection (2 | 0.2%).
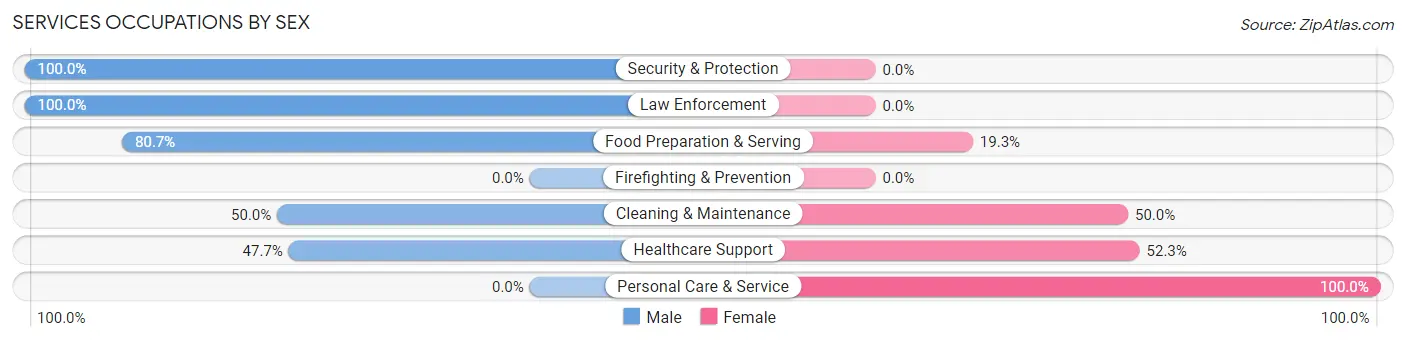
Services Occupations by Sex
Within the Services occupations in Farrell, the most male-oriented occupations are Security & Protection (100.0%), Law Enforcement (100.0%), and Food Preparation & Serving (80.7%), while the most female-oriented occupations are Personal Care & Service (100.0%), Healthcare Support (52.3%), and Cleaning & Maintenance (50.0%).
| Occupation | Male | Female |
| Healthcare Support | 104 (47.7%) | 114 (52.3%) |
| Security & Protection | 2 (100.0%) | 0 (0.0%) |
| Firefighting & Prevention | 0 (0.0%) | 0 (0.0%) |
| Law Enforcement | 2 (100.0%) | 0 (0.0%) |
| Food Preparation & Serving | 67 (80.7%) | 16 (19.3%) |
| Cleaning & Maintenance | 18 (50.0%) | 18 (50.0%) |
| Personal Care & Service | 0 (0.0%) | 8 (100.0%) |
| Total (Category) | 191 (55.0%) | 156 (45.0%) |
| Total (Overall) | 595 (52.1%) | 548 (47.9%) |
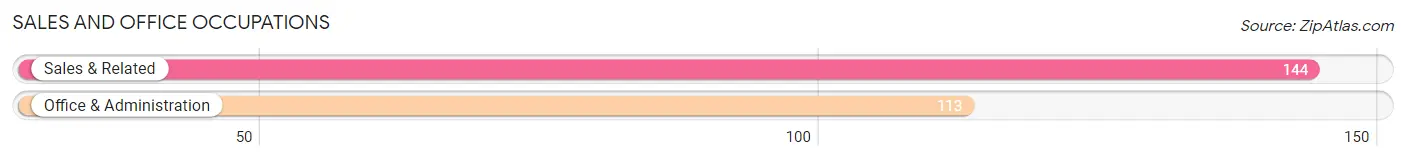
Sales and Office Occupations
The most common Sales and Office occupations in Farrell are Sales & Related (144 | 12.6%), and Office & Administration (113 | 9.9%).
Sales and Office Occupations by Sex
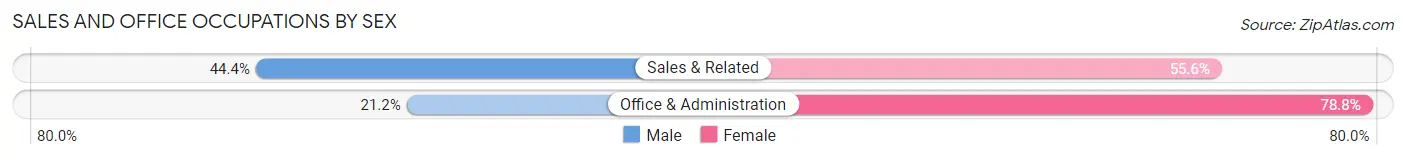
| Occupation | Male | Female |
| Sales & Related | 64 (44.4%) | 80 (55.6%) |
| Office & Administration | 24 (21.2%) | 89 (78.8%) |
| Total (Category) | 88 (34.2%) | 169 (65.8%) |
| Total (Overall) | 595 (52.1%) | 548 (47.9%) |
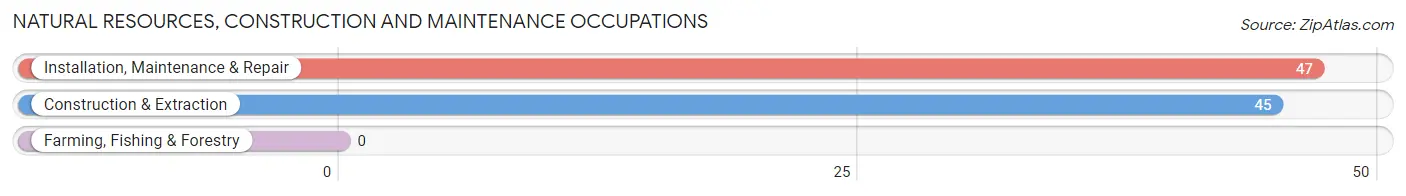
Natural Resources, Construction and Maintenance Occupations
The most common Natural Resources, Construction and Maintenance occupations in Farrell are Installation, Maintenance & Repair (47 | 4.1%), and Construction & Extraction (45 | 3.9%).
Natural Resources, Construction and Maintenance Occupations by Sex
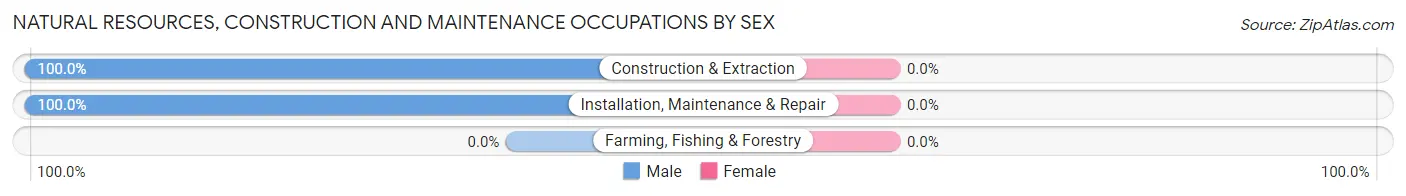
| Occupation | Male | Female |
| Farming, Fishing & Forestry | 0 (0.0%) | 0 (0.0%) |
| Construction & Extraction | 45 (100.0%) | 0 (0.0%) |
| Installation, Maintenance & Repair | 47 (100.0%) | 0 (0.0%) |
| Total (Category) | 92 (100.0%) | 0 (0.0%) |
| Total (Overall) | 595 (52.1%) | 548 (47.9%) |
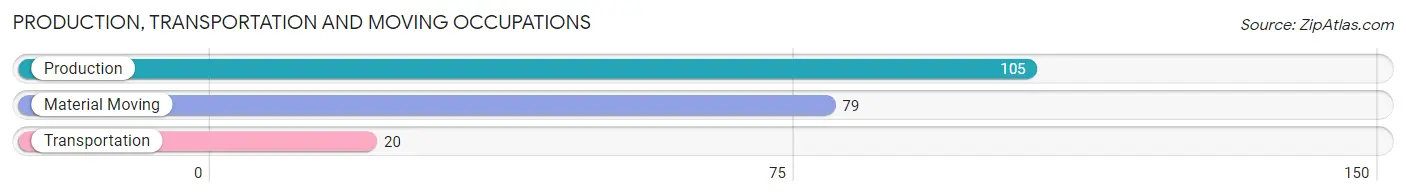
Production, Transportation and Moving Occupations
The most common Production, Transportation and Moving occupations in Farrell are Production (105 | 9.2%), Material Moving (79 | 6.9%), and Transportation (20 | 1.8%).
Production, Transportation and Moving Occupations by Sex
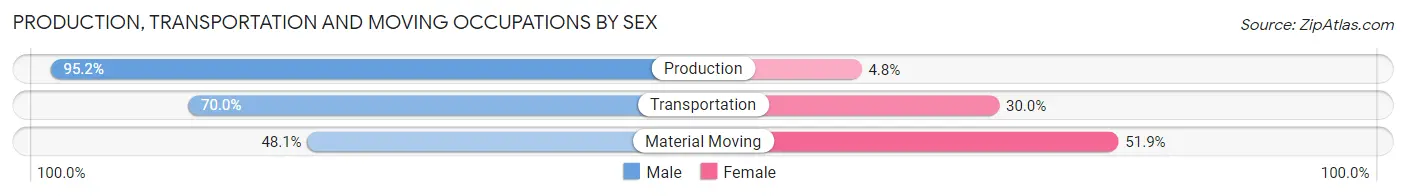
| Occupation | Male | Female |
| Production | 100 (95.2%) | 5 (4.8%) |
| Transportation | 14 (70.0%) | 6 (30.0%) |
| Material Moving | 38 (48.1%) | 41 (51.9%) |
| Total (Category) | 152 (74.5%) | 52 (25.5%) |
| Total (Overall) | 595 (52.1%) | 548 (47.9%) |
Employment Industries by Sex in Farrell
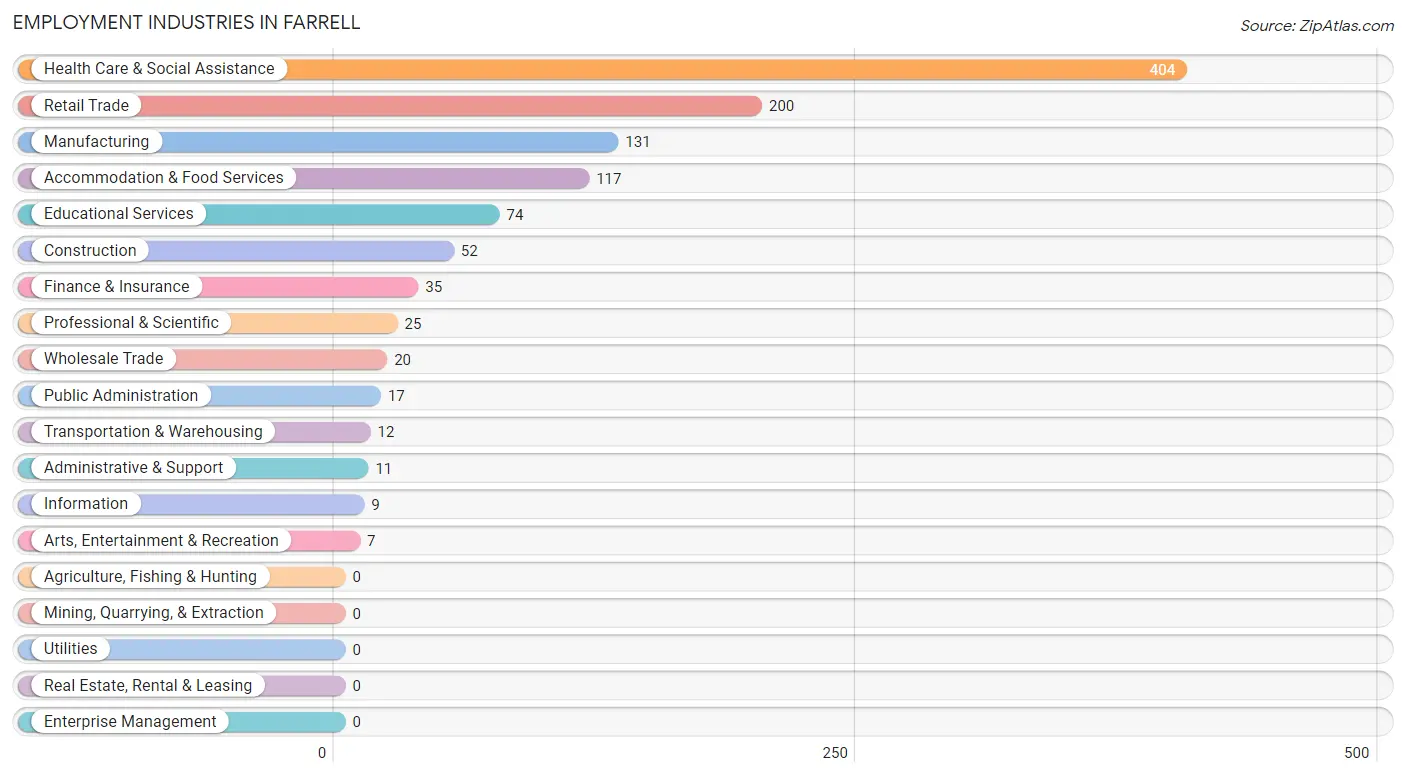
Employment Industries in Farrell
The major employment industries in Farrell include Health Care & Social Assistance (404 | 35.3%), Retail Trade (200 | 17.5%), Manufacturing (131 | 11.5%), Accommodation & Food Services (117 | 10.2%), and Educational Services (74 | 6.5%).
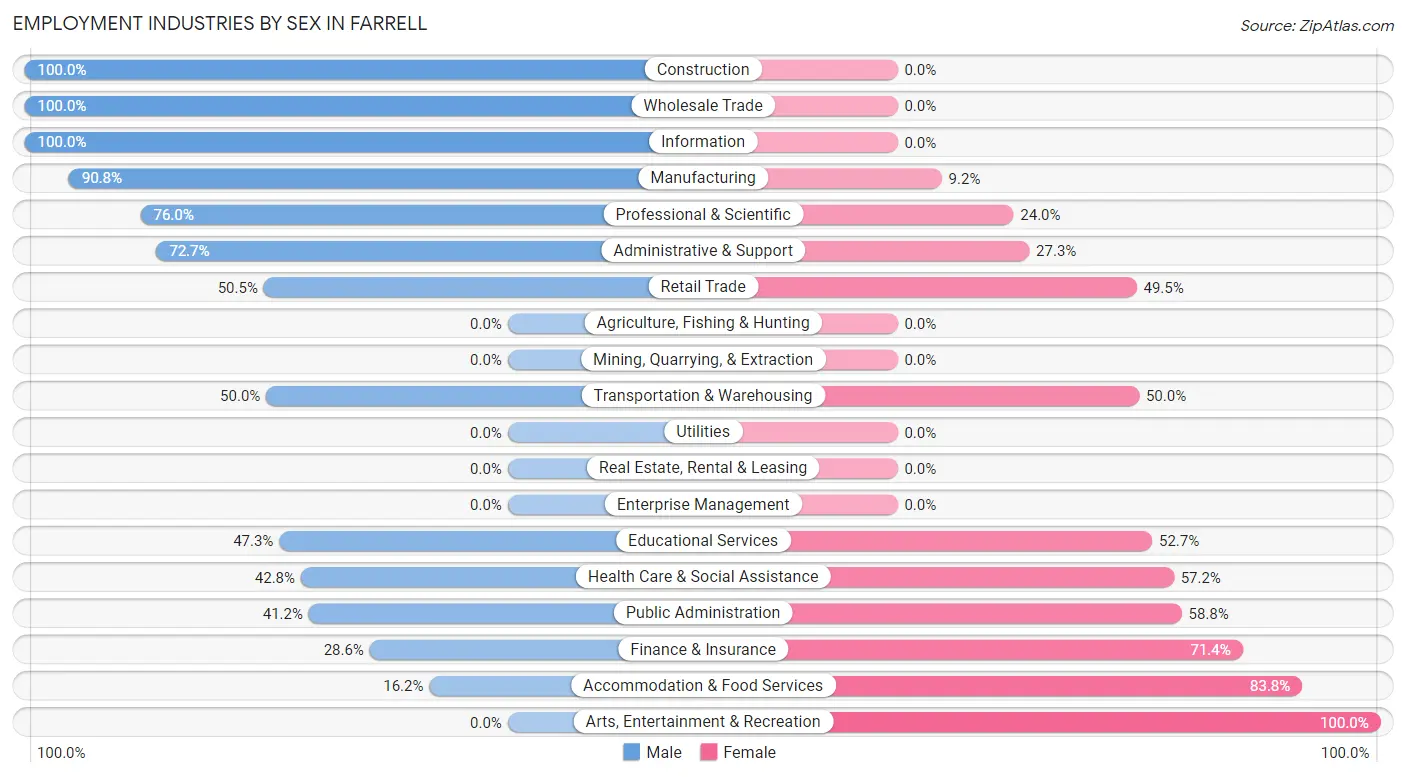
Employment Industries by Sex in Farrell
The Farrell industries that see more men than women are Construction (100.0%), Wholesale Trade (100.0%), and Information (100.0%), whereas the industries that tend to have a higher number of women are Arts, Entertainment & Recreation (100.0%), Accommodation & Food Services (83.8%), and Finance & Insurance (71.4%).
| Industry | Male | Female |
| Agriculture, Fishing & Hunting | 0 (0.0%) | 0 (0.0%) |
| Mining, Quarrying, & Extraction | 0 (0.0%) | 0 (0.0%) |
| Construction | 52 (100.0%) | 0 (0.0%) |
| Manufacturing | 119 (90.8%) | 12 (9.2%) |
| Wholesale Trade | 20 (100.0%) | 0 (0.0%) |
| Retail Trade | 101 (50.5%) | 99 (49.5%) |
| Transportation & Warehousing | 6 (50.0%) | 6 (50.0%) |
| Utilities | 0 (0.0%) | 0 (0.0%) |
| Information | 9 (100.0%) | 0 (0.0%) |
| Finance & Insurance | 10 (28.6%) | 25 (71.4%) |
| Real Estate, Rental & Leasing | 0 (0.0%) | 0 (0.0%) |
| Professional & Scientific | 19 (76.0%) | 6 (24.0%) |
| Enterprise Management | 0 (0.0%) | 0 (0.0%) |
| Administrative & Support | 8 (72.7%) | 3 (27.3%) |
| Educational Services | 35 (47.3%) | 39 (52.7%) |
| Health Care & Social Assistance | 173 (42.8%) | 231 (57.2%) |
| Arts, Entertainment & Recreation | 0 (0.0%) | 7 (100.0%) |
| Accommodation & Food Services | 19 (16.2%) | 98 (83.8%) |
| Public Administration | 7 (41.2%) | 10 (58.8%) |
| Total | 595 (52.1%) | 548 (47.9%) |
Education in Farrell
School Enrollment in Farrell
The most common levels of schooling among the 1,019 students in Farrell are high school (434 | 42.6%), elementary school (174 | 17.1%), and middle school (162 | 15.9%).
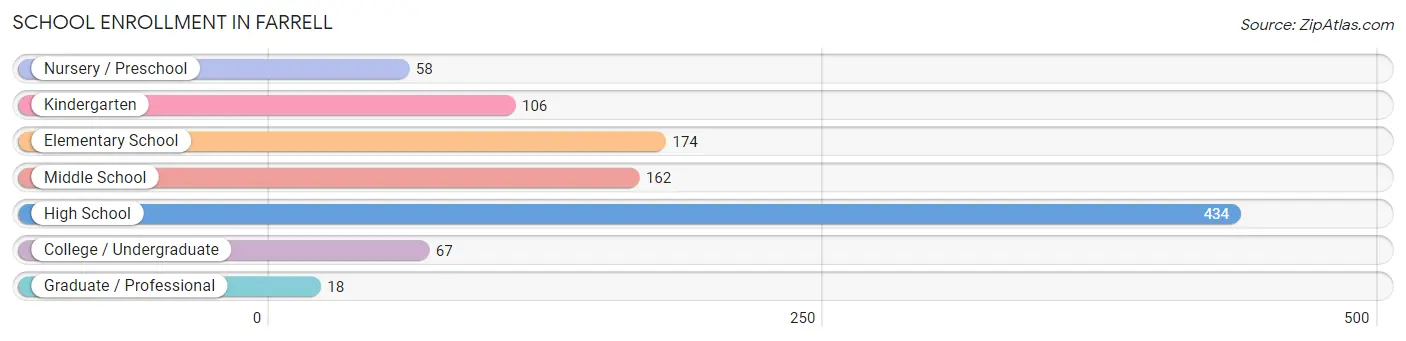
| School Level | # Students | % Students |
| Nursery / Preschool | 58 | 5.7% |
| Kindergarten | 106 | 10.4% |
| Elementary School | 174 | 17.1% |
| Middle School | 162 | 15.9% |
| High School | 434 | 42.6% |
| College / Undergraduate | 67 | 6.6% |
| Graduate / Professional | 18 | 1.8% |
| Total | 1,019 | 100.0% |
School Enrollment by Age by Funding Source in Farrell
Out of a total of 1,019 students who are enrolled in schools in Farrell, 87 (8.5%) attend a private institution, while the remaining 932 (91.5%) are enrolled in public schools. The age group of 25 to 34 year olds has the highest likelihood of being enrolled in private schools, with 44 (100.0% in the age bracket) enrolled. Conversely, the age group of 3 to 4 year olds has the lowest likelihood of being enrolled in a private school, with 58 (100.0% in the age bracket) attending a public institution.
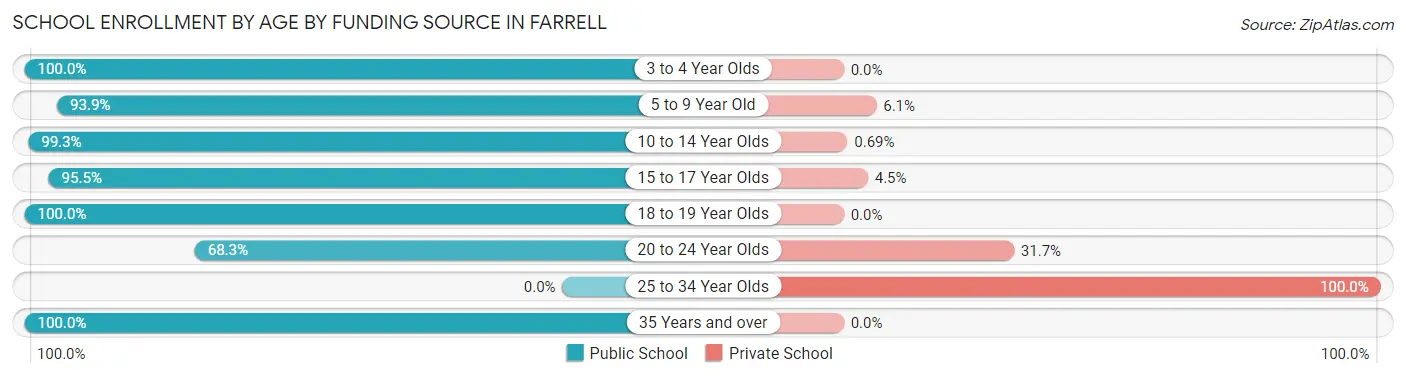
| Age Bracket | Public School | Private School |
| 3 to 4 Year Olds | 58 (100.0%) | 0 (0.0%) |
| 5 to 9 Year Old | 263 (93.9%) | 17 (6.1%) |
| 10 to 14 Year Olds | 287 (99.3%) | 2 (0.7%) |
| 15 to 17 Year Olds | 234 (95.5%) | 11 (4.5%) |
| 18 to 19 Year Olds | 55 (100.0%) | 0 (0.0%) |
| 20 to 24 Year Olds | 28 (68.3%) | 13 (31.7%) |
| 25 to 34 Year Olds | 0 (0.0%) | 44 (100.0%) |
| 35 Years and over | 7 (100.0%) | 0 (0.0%) |
| Total | 932 (91.5%) | 87 (8.5%) |
Educational Attainment by Field of Study in Farrell
Science & technology (86 | 33.3%), education (82 | 31.8%), social sciences (40 | 15.5%), engineering (25 | 9.7%), and business (9 | 3.5%) are the most common fields of study among 258 individuals in Farrell who have obtained a bachelor's degree or higher.
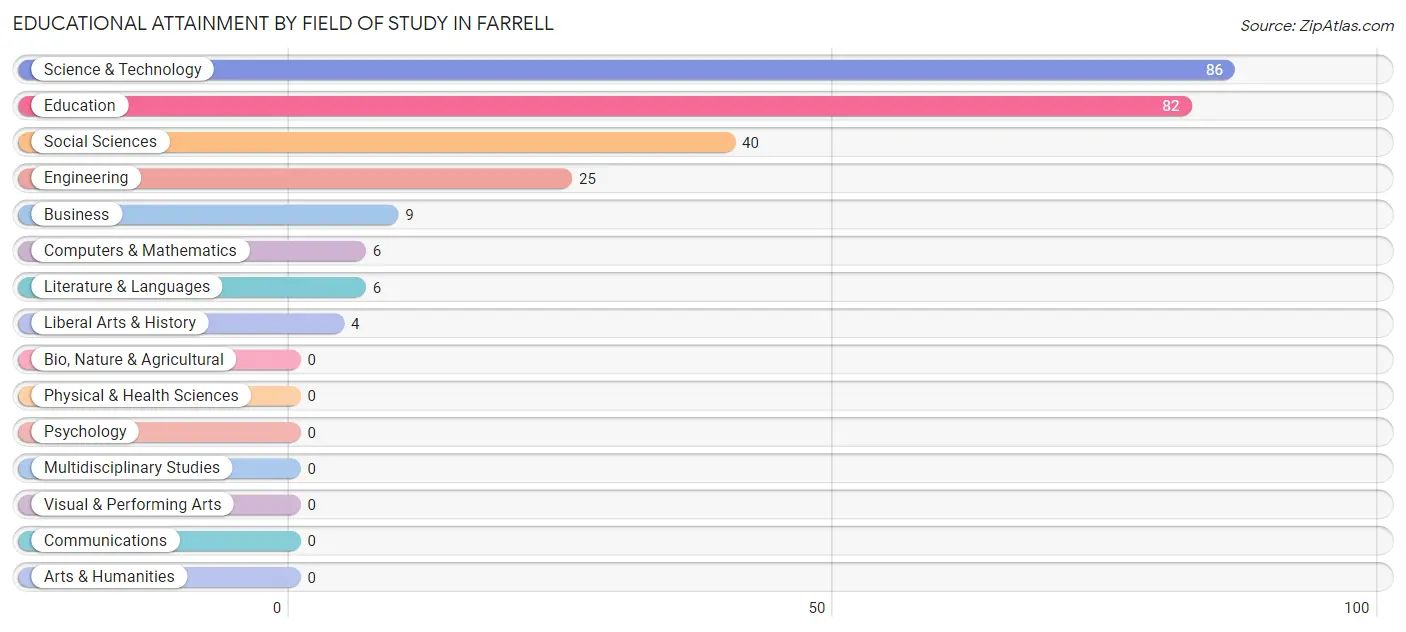
| Field of Study | # Graduates | % Graduates |
| Computers & Mathematics | 6 | 2.3% |
| Bio, Nature & Agricultural | 0 | 0.0% |
| Physical & Health Sciences | 0 | 0.0% |
| Psychology | 0 | 0.0% |
| Social Sciences | 40 | 15.5% |
| Engineering | 25 | 9.7% |
| Multidisciplinary Studies | 0 | 0.0% |
| Science & Technology | 86 | 33.3% |
| Business | 9 | 3.5% |
| Education | 82 | 31.8% |
| Literature & Languages | 6 | 2.3% |
| Liberal Arts & History | 4 | 1.5% |
| Visual & Performing Arts | 0 | 0.0% |
| Communications | 0 | 0.0% |
| Arts & Humanities | 0 | 0.0% |
| Total | 258 | 100.0% |
Transportation & Commute in Farrell
Vehicle Availability by Sex in Farrell
The most prevalent vehicle ownership categories in Farrell are males with 1 vehicle (303, accounting for 51.3%) and females with 1 vehicle (287, making up 57.4%).
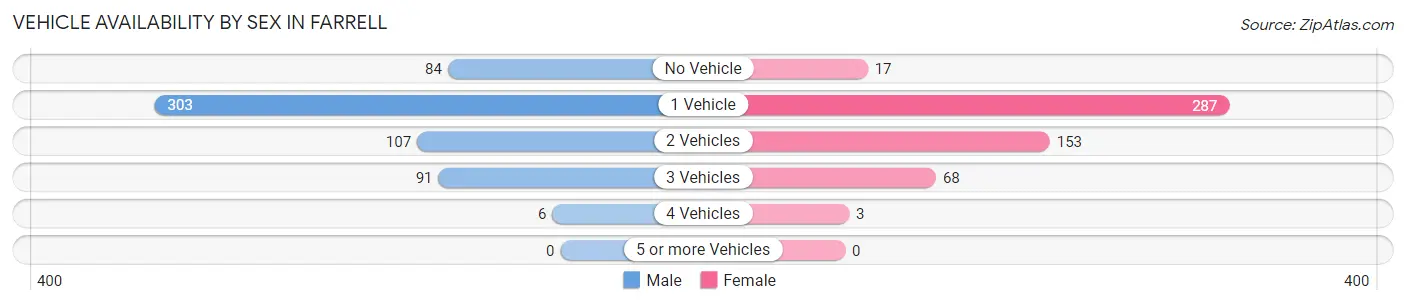
| Vehicles Available | Male | Female |
| No Vehicle | 84 (14.2%) | 17 (3.2%) |
| 1 Vehicle | 303 (51.3%) | 287 (54.4%) |
| 2 Vehicles | 107 (18.1%) | 153 (29.0%) |
| 3 Vehicles | 91 (15.4%) | 68 (12.9%) |
| 4 Vehicles | 6 (1.0%) | 3 (0.6%) |
| 5 or more Vehicles | 0 (0.0%) | 0 (0.0%) |
| Total | 591 (100.0%) | 528 (100.0%) |
Commute Time in Farrell
The most frequently occuring commute durations in Farrell are 10 to 14 minutes (230 commuters, 20.8%), 15 to 19 minutes (221 commuters, 20.0%), and 5 to 9 minutes (188 commuters, 17.0%).
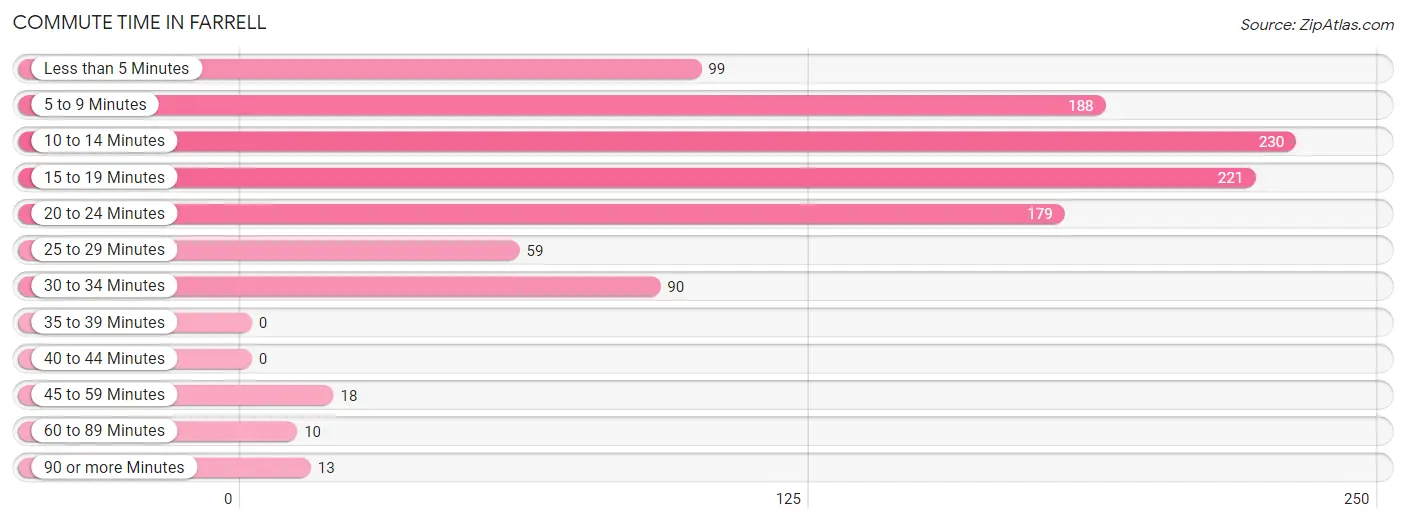
| Commute Time | # Commuters | % Commuters |
| Less than 5 Minutes | 99 | 8.9% |
| 5 to 9 Minutes | 188 | 17.0% |
| 10 to 14 Minutes | 230 | 20.8% |
| 15 to 19 Minutes | 221 | 20.0% |
| 20 to 24 Minutes | 179 | 16.2% |
| 25 to 29 Minutes | 59 | 5.3% |
| 30 to 34 Minutes | 90 | 8.1% |
| 35 to 39 Minutes | 0 | 0.0% |
| 40 to 44 Minutes | 0 | 0.0% |
| 45 to 59 Minutes | 18 | 1.6% |
| 60 to 89 Minutes | 10 | 0.9% |
| 90 or more Minutes | 13 | 1.2% |
Commute Time by Sex in Farrell
The most common commute times in Farrell are 15 to 19 minutes (191 commuters, 32.3%) for males and 10 to 14 minutes (132 commuters, 25.6%) for females.
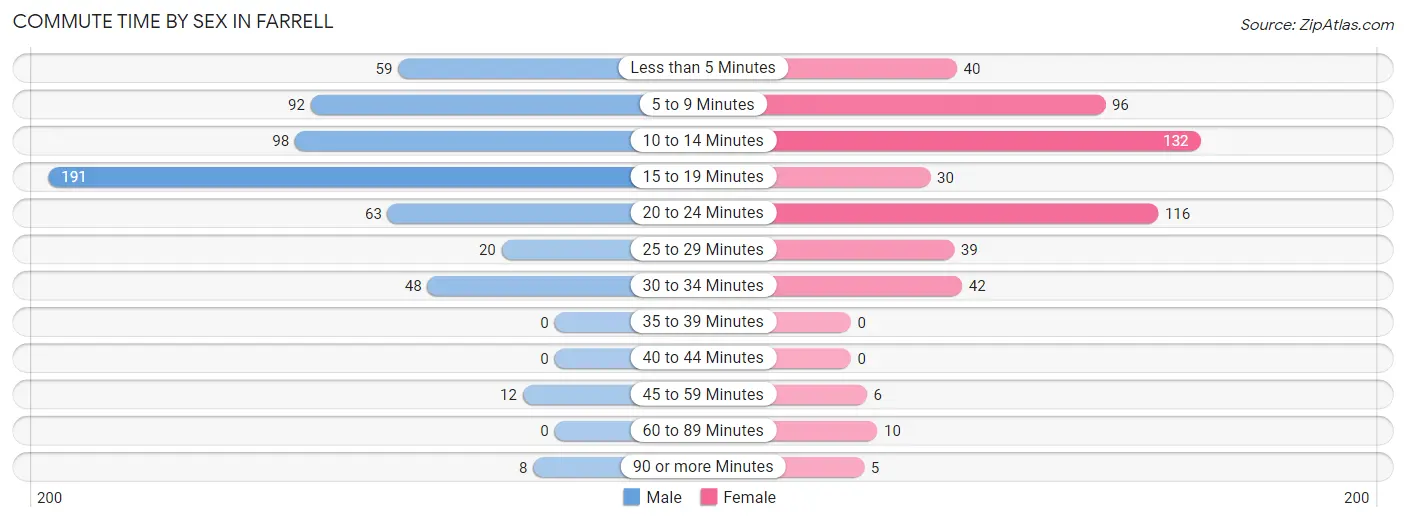
| Commute Time | Male | Female |
| Less than 5 Minutes | 59 (10.0%) | 40 (7.7%) |
| 5 to 9 Minutes | 92 (15.6%) | 96 (18.6%) |
| 10 to 14 Minutes | 98 (16.6%) | 132 (25.6%) |
| 15 to 19 Minutes | 191 (32.3%) | 30 (5.8%) |
| 20 to 24 Minutes | 63 (10.7%) | 116 (22.5%) |
| 25 to 29 Minutes | 20 (3.4%) | 39 (7.6%) |
| 30 to 34 Minutes | 48 (8.1%) | 42 (8.1%) |
| 35 to 39 Minutes | 0 (0.0%) | 0 (0.0%) |
| 40 to 44 Minutes | 0 (0.0%) | 0 (0.0%) |
| 45 to 59 Minutes | 12 (2.0%) | 6 (1.2%) |
| 60 to 89 Minutes | 0 (0.0%) | 10 (1.9%) |
| 90 or more Minutes | 8 (1.3%) | 5 (1.0%) |
Time of Departure to Work by Sex in Farrell
The most frequent times of departure to work in Farrell are 12:00 PM to 3:59 PM (113, 19.1%) for males and 12:00 PM to 3:59 PM (112, 21.7%) for females.
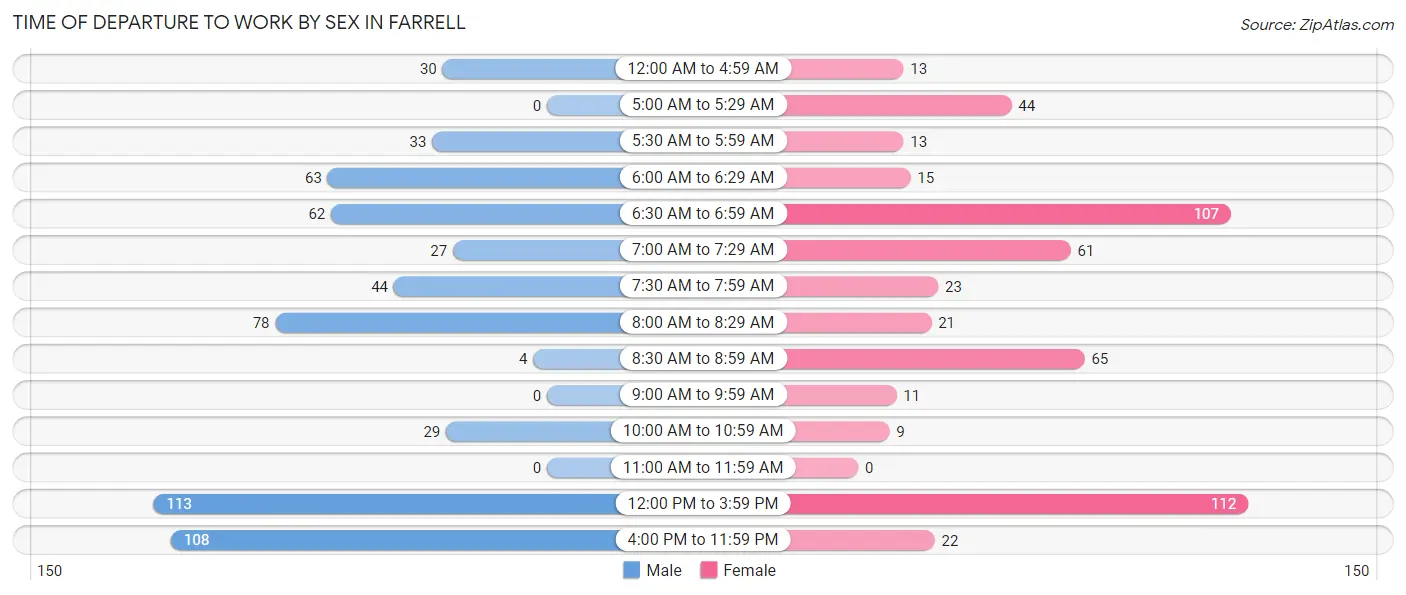
| Time of Departure | Male | Female |
| 12:00 AM to 4:59 AM | 30 (5.1%) | 13 (2.5%) |
| 5:00 AM to 5:29 AM | 0 (0.0%) | 44 (8.5%) |
| 5:30 AM to 5:59 AM | 33 (5.6%) | 13 (2.5%) |
| 6:00 AM to 6:29 AM | 63 (10.7%) | 15 (2.9%) |
| 6:30 AM to 6:59 AM | 62 (10.5%) | 107 (20.7%) |
| 7:00 AM to 7:29 AM | 27 (4.6%) | 61 (11.8%) |
| 7:30 AM to 7:59 AM | 44 (7.4%) | 23 (4.5%) |
| 8:00 AM to 8:29 AM | 78 (13.2%) | 21 (4.1%) |
| 8:30 AM to 8:59 AM | 4 (0.7%) | 65 (12.6%) |
| 9:00 AM to 9:59 AM | 0 (0.0%) | 11 (2.1%) |
| 10:00 AM to 10:59 AM | 29 (4.9%) | 9 (1.7%) |
| 11:00 AM to 11:59 AM | 0 (0.0%) | 0 (0.0%) |
| 12:00 PM to 3:59 PM | 113 (19.1%) | 112 (21.7%) |
| 4:00 PM to 11:59 PM | 108 (18.3%) | 22 (4.3%) |
| Total | 591 (100.0%) | 516 (100.0%) |
Housing Occupancy in Farrell
Occupancy by Ownership in Farrell
Of the total 1,976 dwellings in Farrell, owner-occupied units account for 1,185 (60.0%), while renter-occupied units make up 791 (40.0%).
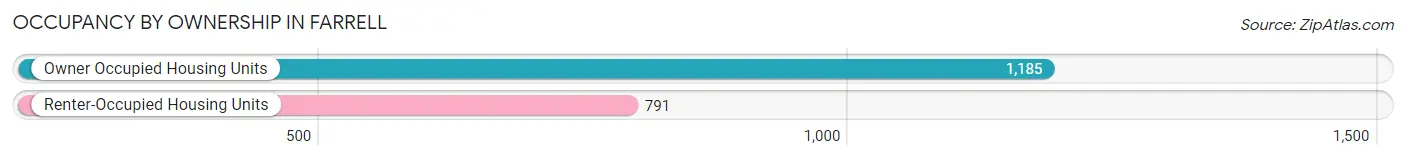
| Occupancy | # Housing Units | % Housing Units |
| Owner Occupied Housing Units | 1,185 | 60.0% |
| Renter-Occupied Housing Units | 791 | 40.0% |
| Total Occupied Housing Units | 1,976 | 100.0% |
Occupancy by Household Size in Farrell
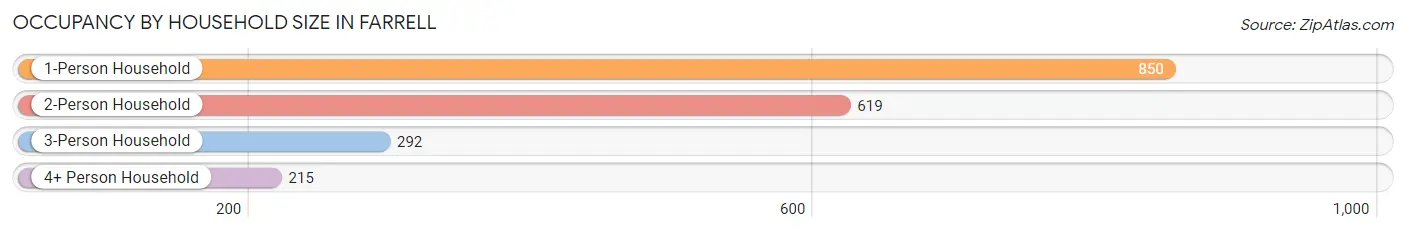
| Household Size | # Housing Units | % Housing Units |
| 1-Person Household | 850 | 43.0% |
| 2-Person Household | 619 | 31.3% |
| 3-Person Household | 292 | 14.8% |
| 4+ Person Household | 215 | 10.9% |
| Total Housing Units | 1,976 | 100.0% |
Occupancy by Ownership by Household Size in Farrell
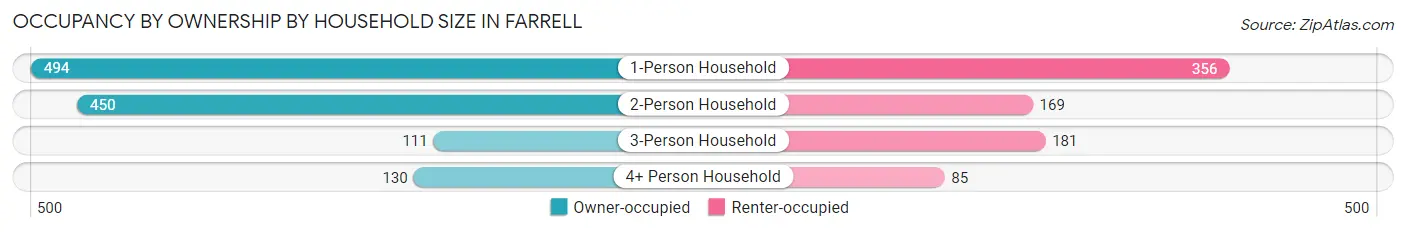
| Household Size | Owner-occupied | Renter-occupied |
| 1-Person Household | 494 (58.1%) | 356 (41.9%) |
| 2-Person Household | 450 (72.7%) | 169 (27.3%) |
| 3-Person Household | 111 (38.0%) | 181 (62.0%) |
| 4+ Person Household | 130 (60.5%) | 85 (39.5%) |
| Total Housing Units | 1,185 (60.0%) | 791 (40.0%) |
Occupancy by Educational Attainment in Farrell
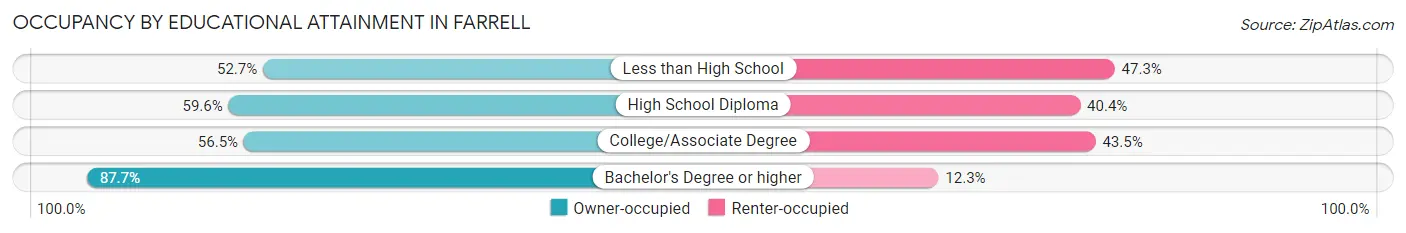
| Household Size | Owner-occupied | Renter-occupied |
| Less than High School | 126 (52.7%) | 113 (47.3%) |
| High School Diploma | 573 (59.6%) | 389 (40.4%) |
| College/Associate Degree | 351 (56.5%) | 270 (43.5%) |
| Bachelor's Degree or higher | 135 (87.7%) | 19 (12.3%) |
Occupancy by Age of Householder in Farrell
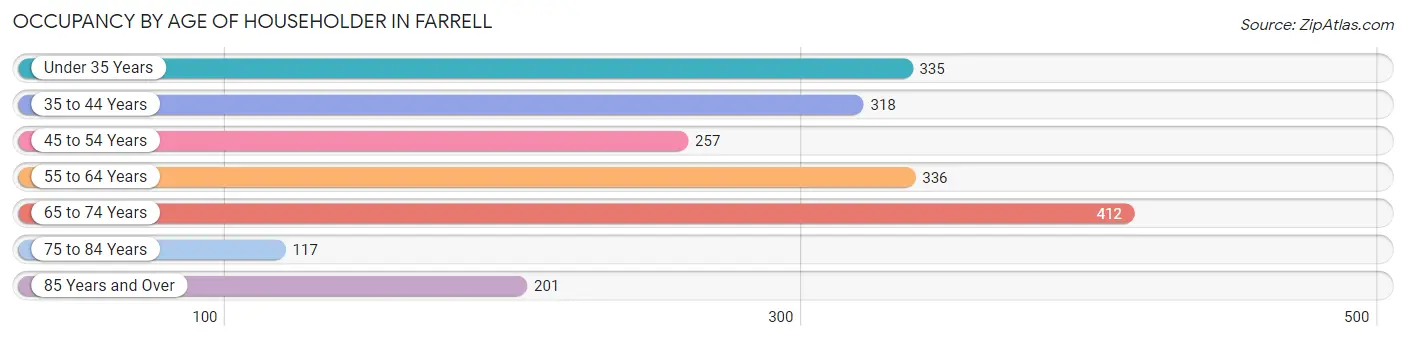
| Age Bracket | # Households | % Households |
| Under 35 Years | 335 | 17.0% |
| 35 to 44 Years | 318 | 16.1% |
| 45 to 54 Years | 257 | 13.0% |
| 55 to 64 Years | 336 | 17.0% |
| 65 to 74 Years | 412 | 20.8% |
| 75 to 84 Years | 117 | 5.9% |
| 85 Years and Over | 201 | 10.2% |
| Total | 1,976 | 100.0% |
Housing Finances in Farrell
Median Income by Occupancy in Farrell
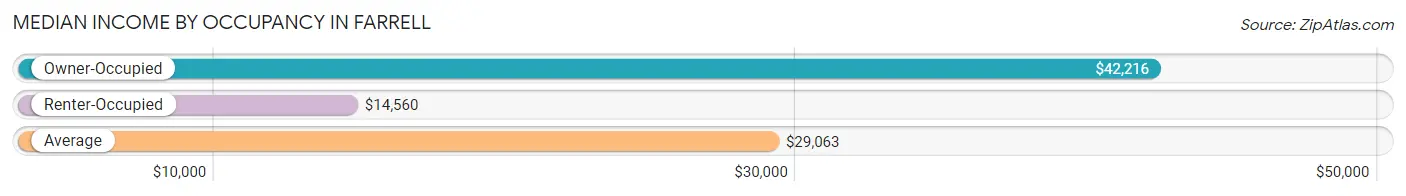
| Occupancy Type | # Households | Median Income |
| Owner-Occupied | 1,185 (60.0%) | $42,216 |
| Renter-Occupied | 791 (40.0%) | $14,560 |
| Average | 1,976 (100.0%) | $29,063 |
Occupancy by Householder Income Bracket in Farrell
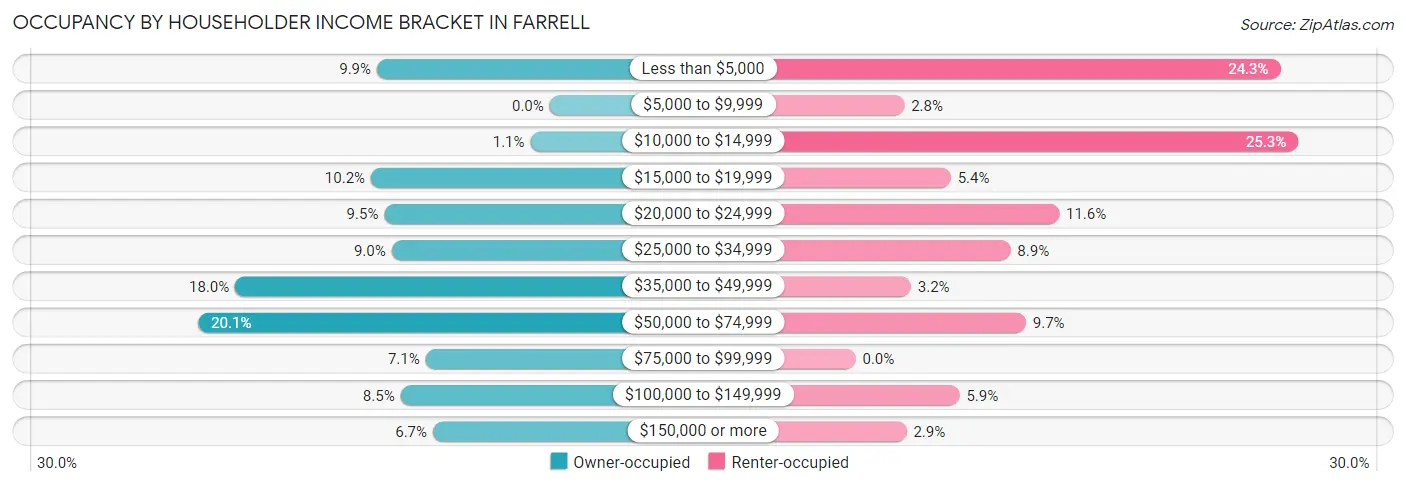
| Income Bracket | Owner-occupied | Renter-occupied |
| Less than $5,000 | 117 (9.9%) | 192 (24.3%) |
| $5,000 to $9,999 | 0 (0.0%) | 22 (2.8%) |
| $10,000 to $14,999 | 13 (1.1%) | 200 (25.3%) |
| $15,000 to $19,999 | 121 (10.2%) | 43 (5.4%) |
| $20,000 to $24,999 | 112 (9.5%) | 92 (11.6%) |
| $25,000 to $34,999 | 107 (9.0%) | 70 (8.8%) |
| $35,000 to $49,999 | 213 (18.0%) | 25 (3.2%) |
| $50,000 to $74,999 | 238 (20.1%) | 77 (9.7%) |
| $75,000 to $99,999 | 84 (7.1%) | 0 (0.0%) |
| $100,000 to $149,999 | 101 (8.5%) | 47 (5.9%) |
| $150,000 or more | 79 (6.7%) | 23 (2.9%) |
| Total | 1,185 (100.0%) | 791 (100.0%) |
Monthly Housing Cost Tiers in Farrell
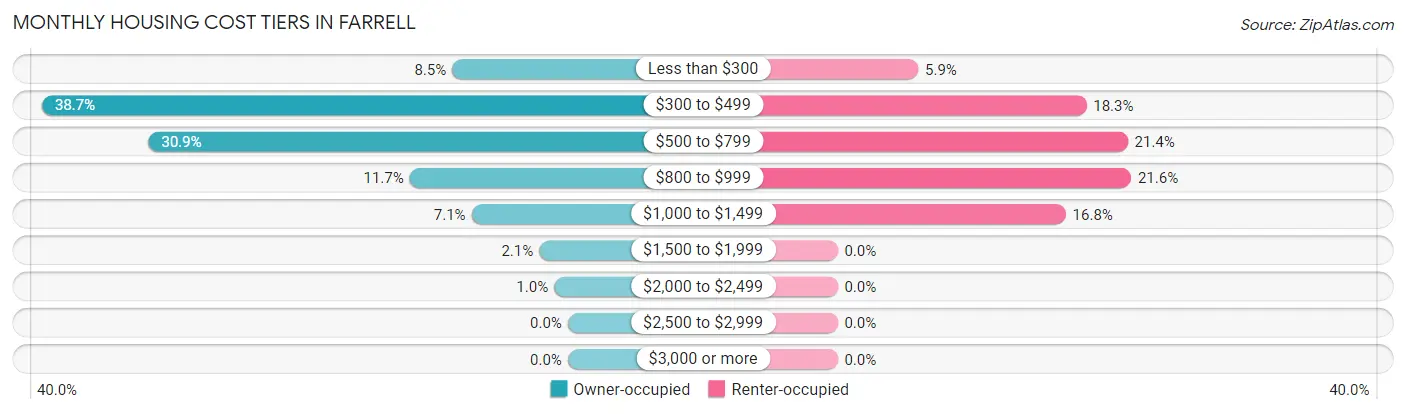
| Monthly Cost | Owner-occupied | Renter-occupied |
| Less than $300 | 101 (8.5%) | 47 (5.9%) |
| $300 to $499 | 459 (38.7%) | 145 (18.3%) |
| $500 to $799 | 366 (30.9%) | 169 (21.4%) |
| $800 to $999 | 138 (11.7%) | 171 (21.6%) |
| $1,000 to $1,499 | 84 (7.1%) | 133 (16.8%) |
| $1,500 to $1,999 | 25 (2.1%) | 0 (0.0%) |
| $2,000 to $2,499 | 12 (1.0%) | 0 (0.0%) |
| $2,500 to $2,999 | 0 (0.0%) | 0 (0.0%) |
| $3,000 or more | 0 (0.0%) | 0 (0.0%) |
| Total | 1,185 (100.0%) | 791 (100.0%) |
Physical Housing Characteristics in Farrell
Housing Structures in Farrell
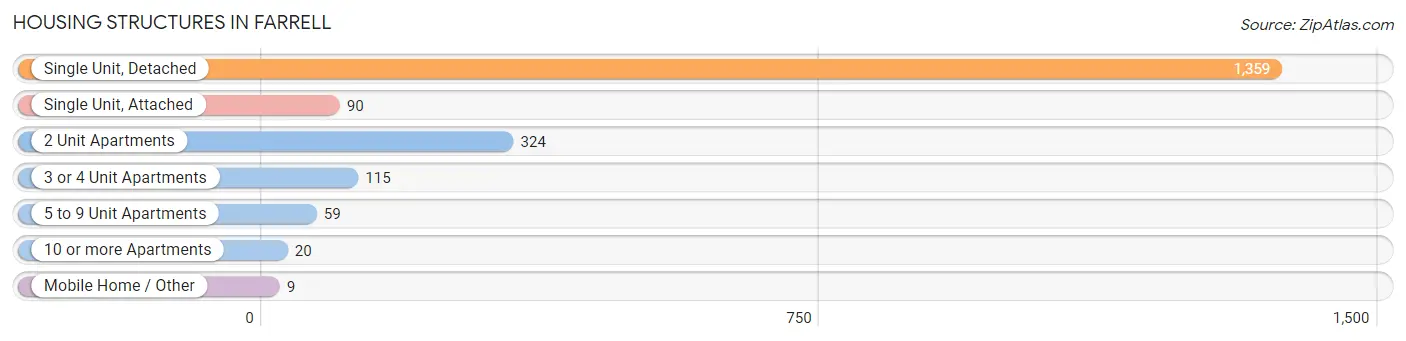
| Structure Type | # Housing Units | % Housing Units |
| Single Unit, Detached | 1,359 | 68.8% |
| Single Unit, Attached | 90 | 4.5% |
| 2 Unit Apartments | 324 | 16.4% |
| 3 or 4 Unit Apartments | 115 | 5.8% |
| 5 to 9 Unit Apartments | 59 | 3.0% |
| 10 or more Apartments | 20 | 1.0% |
| Mobile Home / Other | 9 | 0.5% |
| Total | 1,976 | 100.0% |
Housing Structures by Occupancy in Farrell
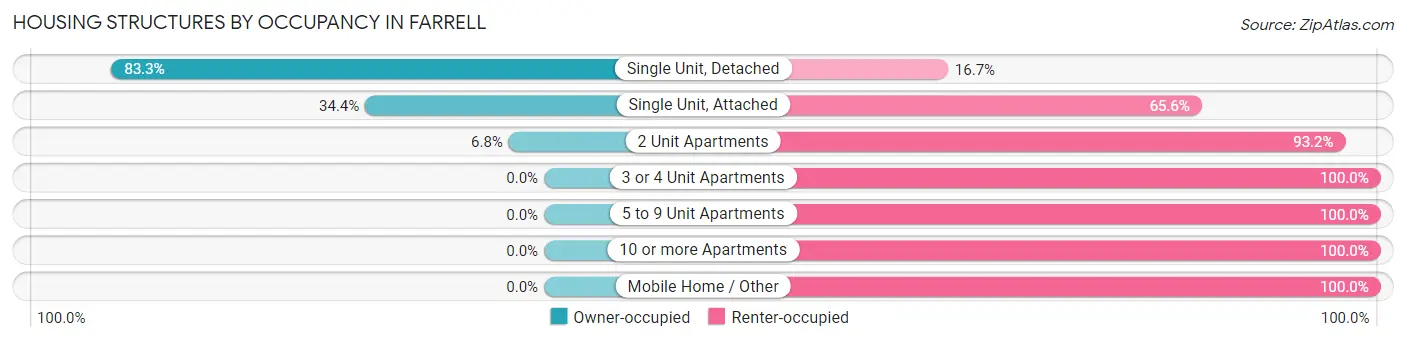
| Structure Type | Owner-occupied | Renter-occupied |
| Single Unit, Detached | 1,132 (83.3%) | 227 (16.7%) |
| Single Unit, Attached | 31 (34.4%) | 59 (65.6%) |
| 2 Unit Apartments | 22 (6.8%) | 302 (93.2%) |
| 3 or 4 Unit Apartments | 0 (0.0%) | 115 (100.0%) |
| 5 to 9 Unit Apartments | 0 (0.0%) | 59 (100.0%) |
| 10 or more Apartments | 0 (0.0%) | 20 (100.0%) |
| Mobile Home / Other | 0 (0.0%) | 9 (100.0%) |
| Total | 1,185 (60.0%) | 791 (40.0%) |
Housing Structures by Number of Rooms in Farrell
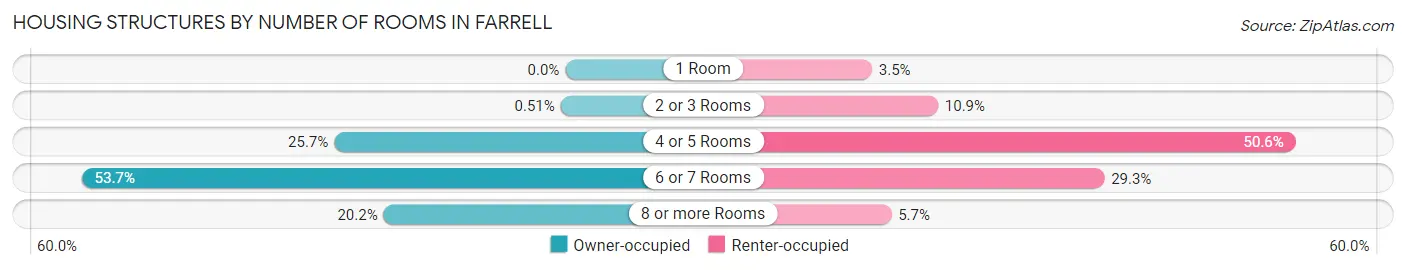
| Number of Rooms | Owner-occupied | Renter-occupied |
| 1 Room | 0 (0.0%) | 28 (3.5%) |
| 2 or 3 Rooms | 6 (0.5%) | 86 (10.9%) |
| 4 or 5 Rooms | 304 (25.7%) | 400 (50.6%) |
| 6 or 7 Rooms | 636 (53.7%) | 232 (29.3%) |
| 8 or more Rooms | 239 (20.2%) | 45 (5.7%) |
| Total | 1,185 (100.0%) | 791 (100.0%) |
Housing Structure by Heating Type in Farrell
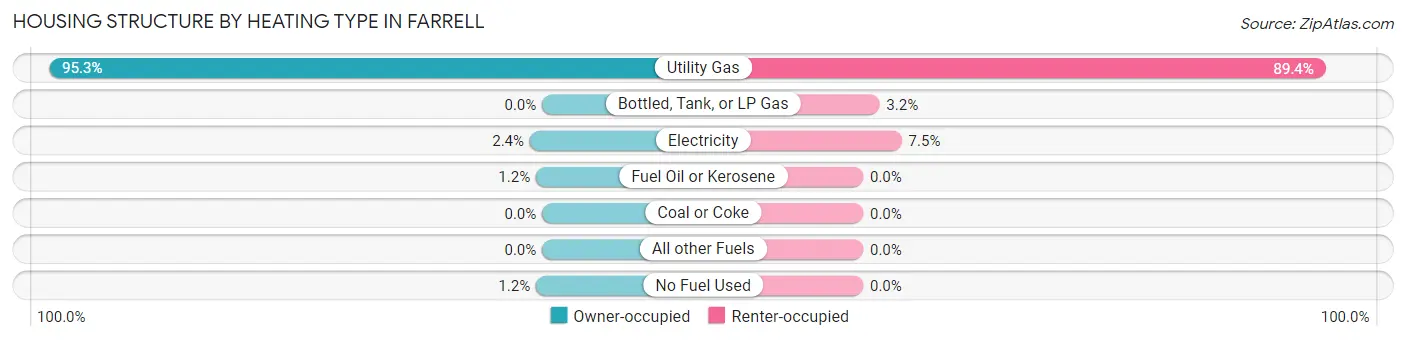
| Heating Type | Owner-occupied | Renter-occupied |
| Utility Gas | 1,129 (95.3%) | 707 (89.4%) |
| Bottled, Tank, or LP Gas | 0 (0.0%) | 25 (3.2%) |
| Electricity | 28 (2.4%) | 59 (7.5%) |
| Fuel Oil or Kerosene | 14 (1.2%) | 0 (0.0%) |
| Coal or Coke | 0 (0.0%) | 0 (0.0%) |
| All other Fuels | 0 (0.0%) | 0 (0.0%) |
| No Fuel Used | 14 (1.2%) | 0 (0.0%) |
| Total | 1,185 (100.0%) | 791 (100.0%) |
Household Vehicle Usage in Farrell
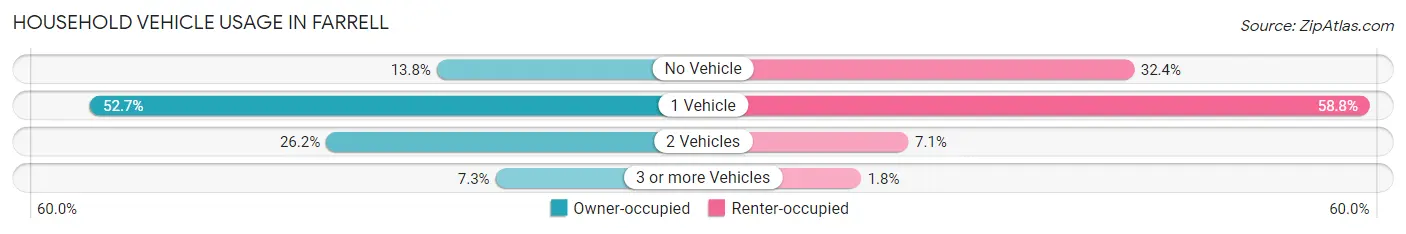
| Vehicles per Household | Owner-occupied | Renter-occupied |
| No Vehicle | 164 (13.8%) | 256 (32.4%) |
| 1 Vehicle | 624 (52.7%) | 465 (58.8%) |
| 2 Vehicles | 311 (26.2%) | 56 (7.1%) |
| 3 or more Vehicles | 86 (7.3%) | 14 (1.8%) |
| Total | 1,185 (100.0%) | 791 (100.0%) |
Real Estate & Mortgages in Farrell
Real Estate and Mortgage Overview in Farrell
| Characteristic | Without Mortgage | With Mortgage |
| Housing Units | 685 | 500 |
| Median Property Value | $55,800 | $81,100 |
| Median Household Income | $47,969 | $10 |
| Monthly Housing Costs | $425 | $0 |
| Real Estate Taxes | $999 | $12 |
Property Value by Mortgage Status in Farrell
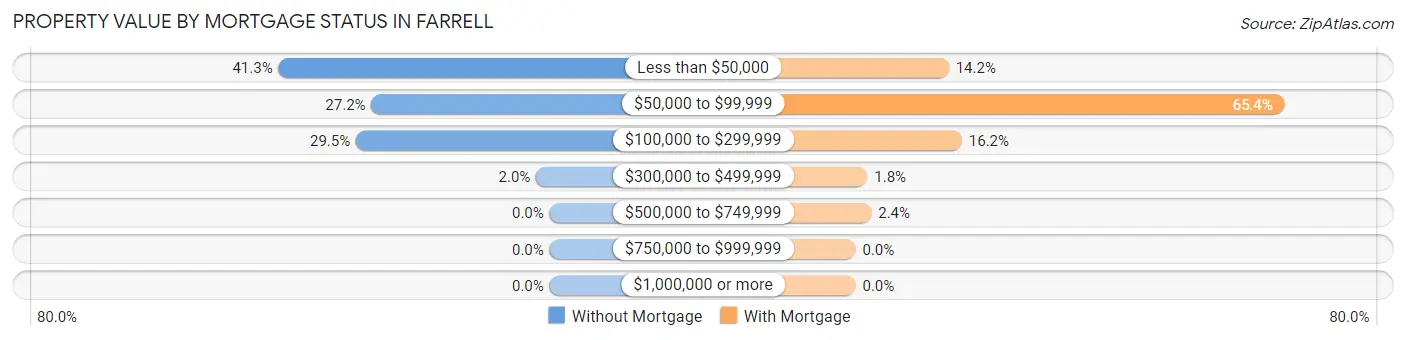
| Property Value | Without Mortgage | With Mortgage |
| Less than $50,000 | 283 (41.3%) | 71 (14.2%) |
| $50,000 to $99,999 | 186 (27.2%) | 327 (65.4%) |
| $100,000 to $299,999 | 202 (29.5%) | 81 (16.2%) |
| $300,000 to $499,999 | 14 (2.0%) | 9 (1.8%) |
| $500,000 to $749,999 | 0 (0.0%) | 12 (2.4%) |
| $750,000 to $999,999 | 0 (0.0%) | 0 (0.0%) |
| $1,000,000 or more | 0 (0.0%) | 0 (0.0%) |
| Total | 685 (100.0%) | 500 (100.0%) |
Household Income by Mortgage Status in Farrell
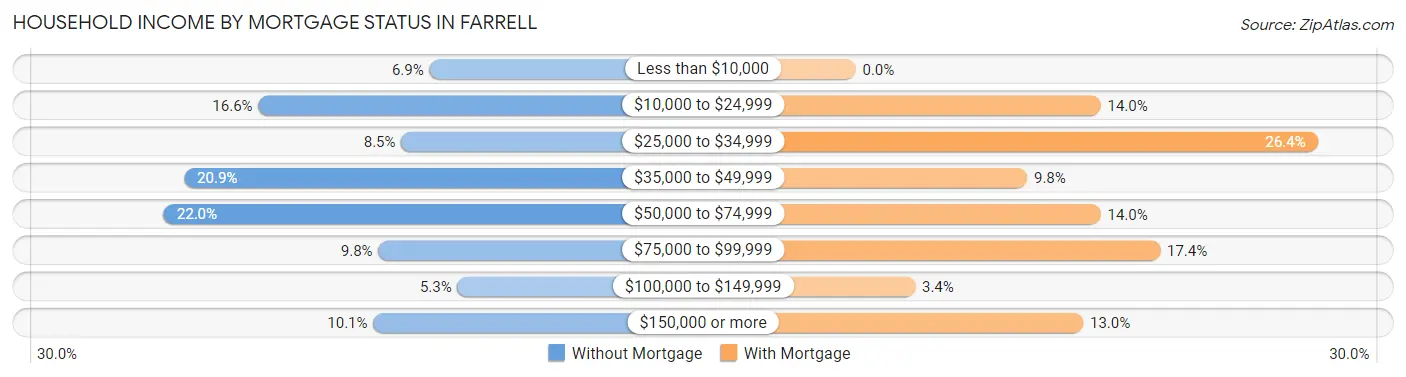
| Household Income | Without Mortgage | With Mortgage |
| Less than $10,000 | 47 (6.9%) | 0 (0.0%) |
| $10,000 to $24,999 | 114 (16.6%) | 70 (14.0%) |
| $25,000 to $34,999 | 58 (8.5%) | 132 (26.4%) |
| $35,000 to $49,999 | 143 (20.9%) | 49 (9.8%) |
| $50,000 to $74,999 | 151 (22.0%) | 70 (14.0%) |
| $75,000 to $99,999 | 67 (9.8%) | 87 (17.4%) |
| $100,000 to $149,999 | 36 (5.3%) | 17 (3.4%) |
| $150,000 or more | 69 (10.1%) | 65 (13.0%) |
| Total | 685 (100.0%) | 500 (100.0%) |
Property Value to Household Income Ratio in Farrell
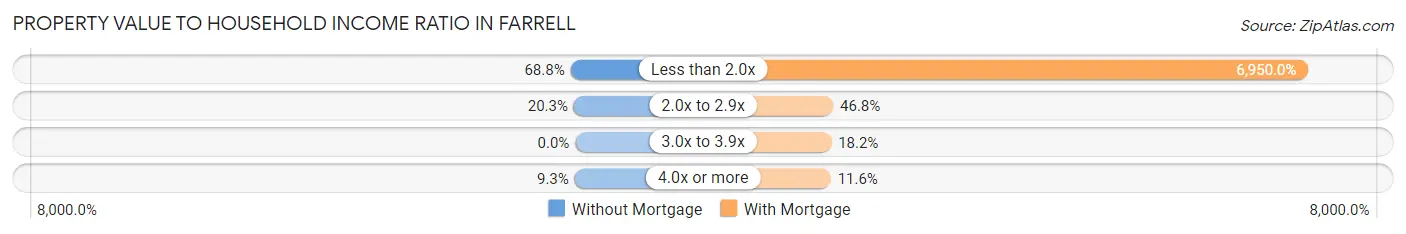
| Value-to-Income Ratio | Without Mortgage | With Mortgage |
| Less than 2.0x | 471 (68.8%) | 34,750 (6,950.0%) |
| 2.0x to 2.9x | 139 (20.3%) | 234 (46.8%) |
| 3.0x to 3.9x | 0 (0.0%) | 91 (18.2%) |
| 4.0x or more | 64 (9.3%) | 58 (11.6%) |
| Total | 685 (100.0%) | 500 (100.0%) |
Real Estate Taxes by Mortgage Status in Farrell
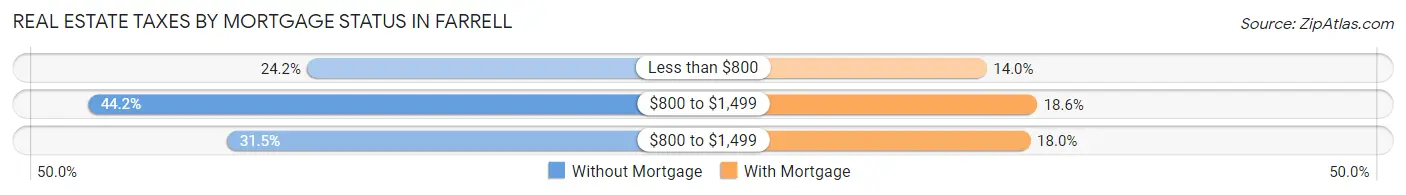
| Property Taxes | Without Mortgage | With Mortgage |
| Less than $800 | 166 (24.2%) | 70 (14.0%) |
| $800 to $1,499 | 303 (44.2%) | 93 (18.6%) |
| $800 to $1,499 | 216 (31.5%) | 90 (18.0%) |
| Total | 685 (100.0%) | 500 (100.0%) |
Health & Disability in Farrell
Health Insurance Coverage by Age in Farrell
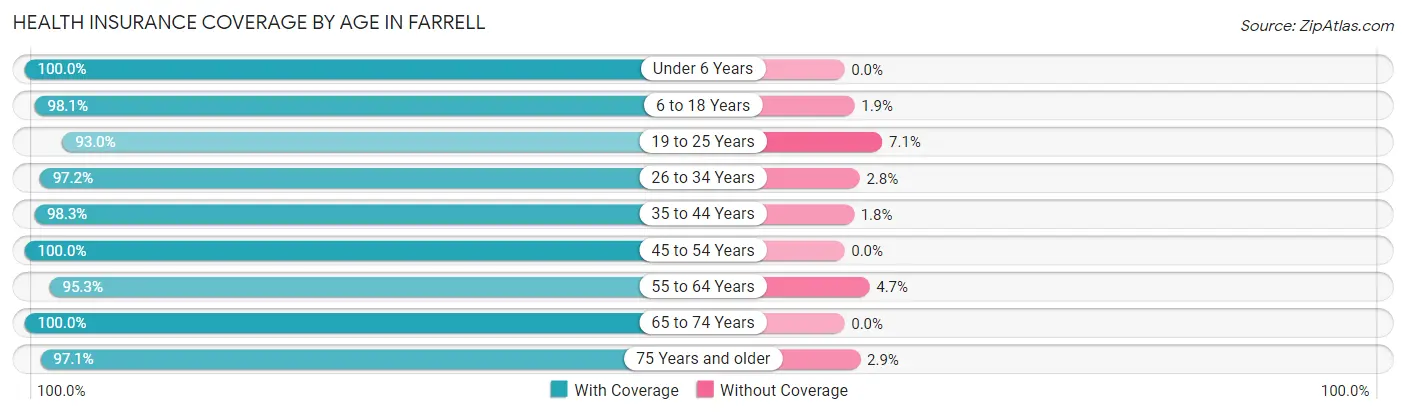
| Age Bracket | With Coverage | Without Coverage |
| Under 6 Years | 316 (100.0%) | 0 (0.0%) |
| 6 to 18 Years | 845 (98.1%) | 16 (1.9%) |
| 19 to 25 Years | 356 (92.9%) | 27 (7.0%) |
| 26 to 34 Years | 309 (97.2%) | 9 (2.8%) |
| 35 to 44 Years | 392 (98.3%) | 7 (1.8%) |
| 45 to 54 Years | 389 (100.0%) | 0 (0.0%) |
| 55 to 64 Years | 553 (95.3%) | 27 (4.7%) |
| 65 to 74 Years | 515 (100.0%) | 0 (0.0%) |
| 75 Years and older | 463 (97.1%) | 14 (2.9%) |
| Total | 4,138 (97.6%) | 100 (2.4%) |
Health Insurance Coverage by Citizenship Status in Farrell
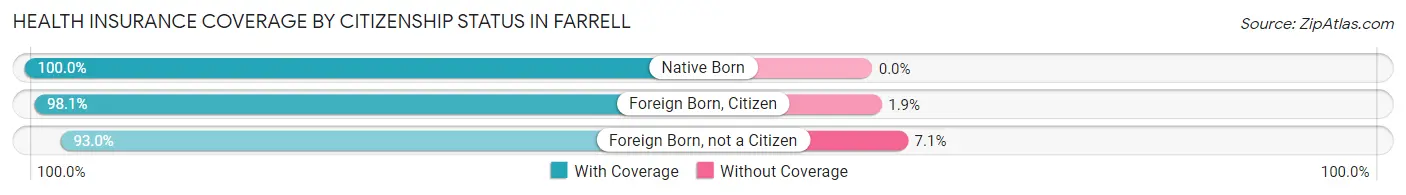
| Citizenship Status | With Coverage | Without Coverage |
| Native Born | 316 (100.0%) | 0 (0.0%) |
| Foreign Born, Citizen | 845 (98.1%) | 16 (1.9%) |
| Foreign Born, not a Citizen | 356 (92.9%) | 27 (7.0%) |
Health Insurance Coverage by Household Income in Farrell
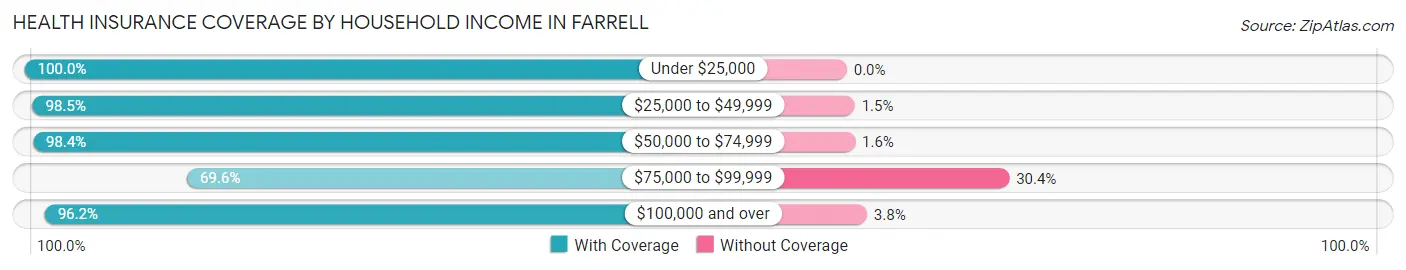
| Household Income | With Coverage | Without Coverage |
| Under $25,000 | 1,686 (100.0%) | 0 (0.0%) |
| $25,000 to $49,999 | 801 (98.5%) | 12 (1.5%) |
| $50,000 to $74,999 | 882 (98.4%) | 14 (1.6%) |
| $75,000 to $99,999 | 112 (69.6%) | 49 (30.4%) |
| $100,000 and over | 638 (96.2%) | 25 (3.8%) |
Public vs Private Health Insurance Coverage by Age in Farrell
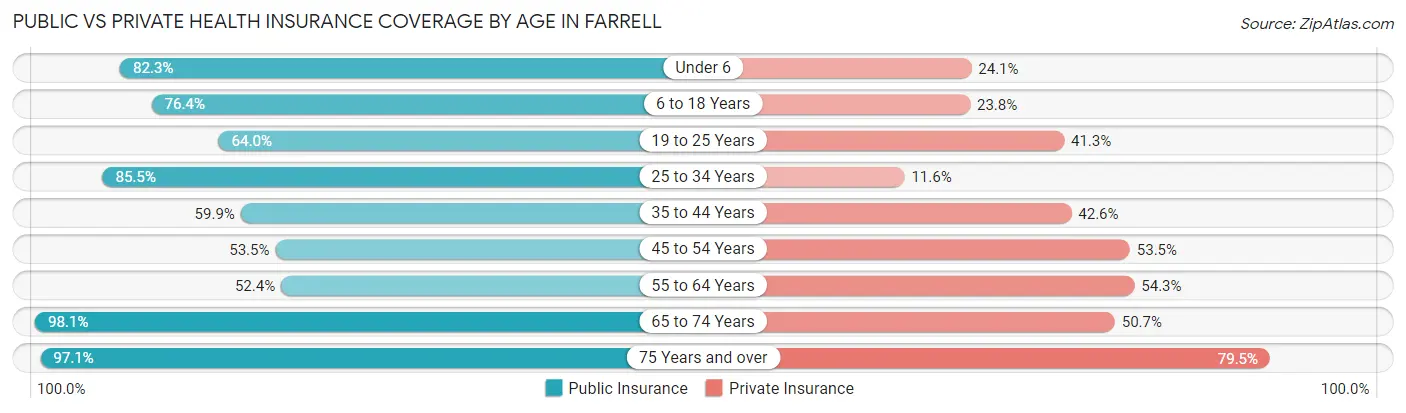
| Age Bracket | Public Insurance | Private Insurance |
| Under 6 | 260 (82.3%) | 76 (24.0%) |
| 6 to 18 Years | 658 (76.4%) | 205 (23.8%) |
| 19 to 25 Years | 245 (64.0%) | 158 (41.2%) |
| 25 to 34 Years | 272 (85.5%) | 37 (11.6%) |
| 35 to 44 Years | 239 (59.9%) | 170 (42.6%) |
| 45 to 54 Years | 208 (53.5%) | 208 (53.5%) |
| 55 to 64 Years | 304 (52.4%) | 315 (54.3%) |
| 65 to 74 Years | 505 (98.1%) | 261 (50.7%) |
| 75 Years and over | 463 (97.1%) | 379 (79.4%) |
| Total | 3,154 (74.4%) | 1,809 (42.7%) |
Disability Status by Sex by Age in Farrell
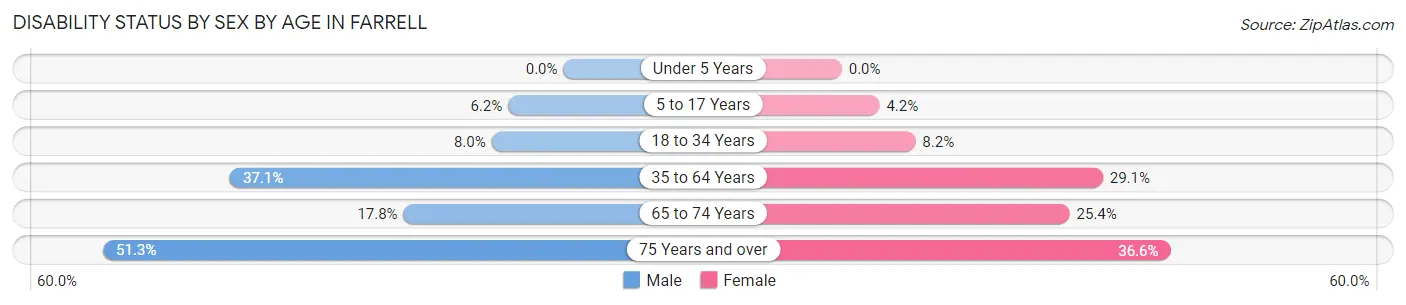
| Age Bracket | Male | Female |
| Under 5 Years | 0 (0.0%) | 0 (0.0%) |
| 5 to 17 Years | 34 (6.2%) | 14 (4.2%) |
| 18 to 34 Years | 28 (8.0%) | 31 (8.2%) |
| 35 to 64 Years | 232 (37.1%) | 216 (29.1%) |
| 65 to 74 Years | 44 (17.8%) | 68 (25.4%) |
| 75 Years and over | 61 (51.3%) | 131 (36.6%) |
Disability Class by Sex by Age in Farrell
Disability Class: Hearing Difficulty
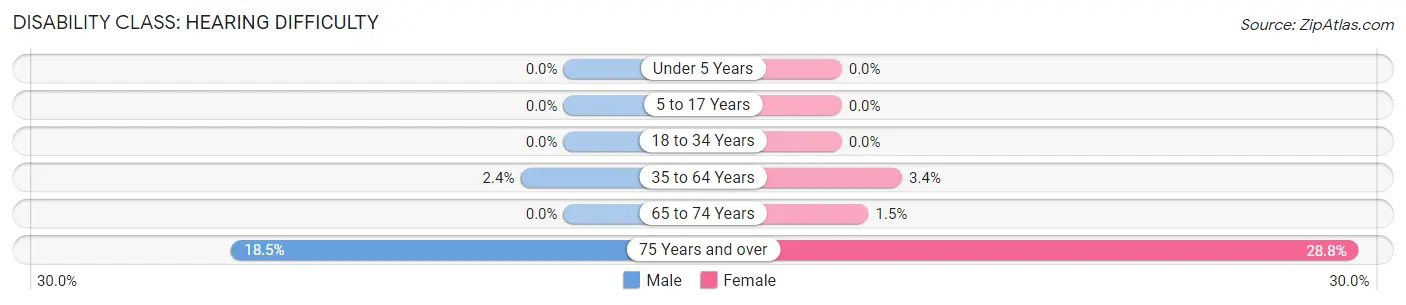
| Age Bracket | Male | Female |
| Under 5 Years | 0 (0.0%) | 0 (0.0%) |
| 5 to 17 Years | 0 (0.0%) | 0 (0.0%) |
| 18 to 34 Years | 0 (0.0%) | 0 (0.0%) |
| 35 to 64 Years | 15 (2.4%) | 25 (3.4%) |
| 65 to 74 Years | 0 (0.0%) | 4 (1.5%) |
| 75 Years and over | 22 (18.5%) | 103 (28.8%) |
Disability Class: Vision Difficulty
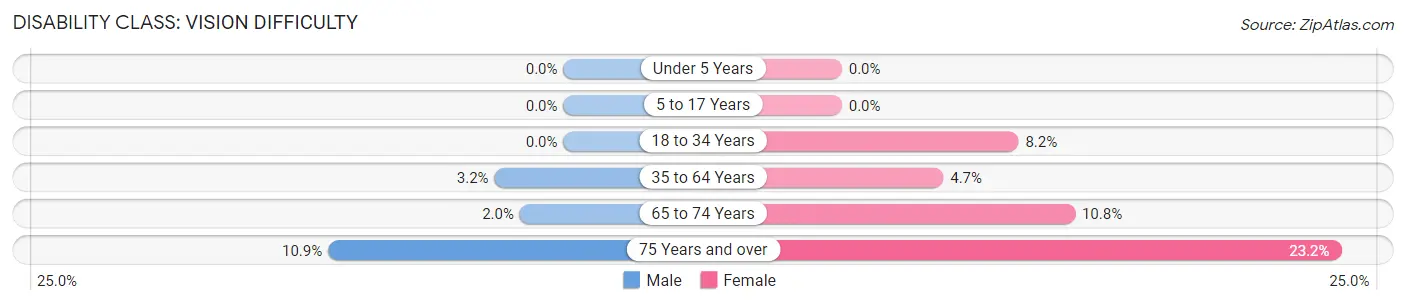
| Age Bracket | Male | Female |
| Under 5 Years | 0 (0.0%) | 0 (0.0%) |
| 5 to 17 Years | 0 (0.0%) | 0 (0.0%) |
| 18 to 34 Years | 0 (0.0%) | 31 (8.2%) |
| 35 to 64 Years | 20 (3.2%) | 35 (4.7%) |
| 65 to 74 Years | 5 (2.0%) | 29 (10.8%) |
| 75 Years and over | 13 (10.9%) | 83 (23.2%) |
Disability Class: Cognitive Difficulty
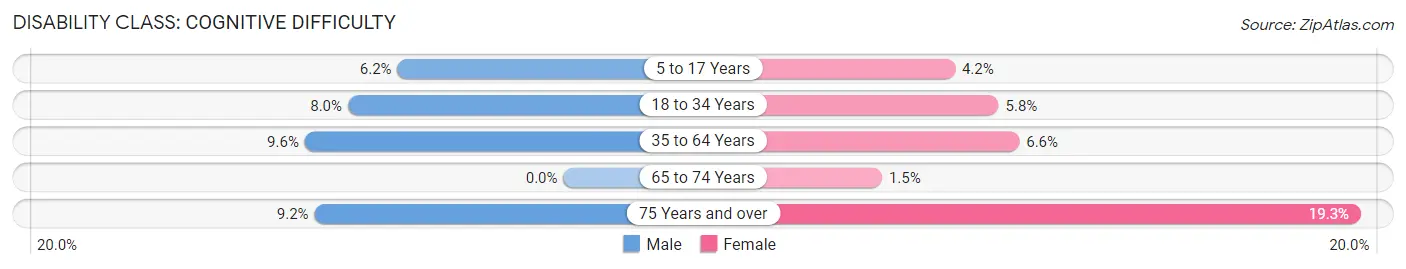
| Age Bracket | Male | Female |
| 5 to 17 Years | 34 (6.2%) | 14 (4.2%) |
| 18 to 34 Years | 28 (8.0%) | 22 (5.8%) |
| 35 to 64 Years | 60 (9.6%) | 49 (6.6%) |
| 65 to 74 Years | 0 (0.0%) | 4 (1.5%) |
| 75 Years and over | 11 (9.2%) | 69 (19.3%) |
Disability Class: Ambulatory Difficulty
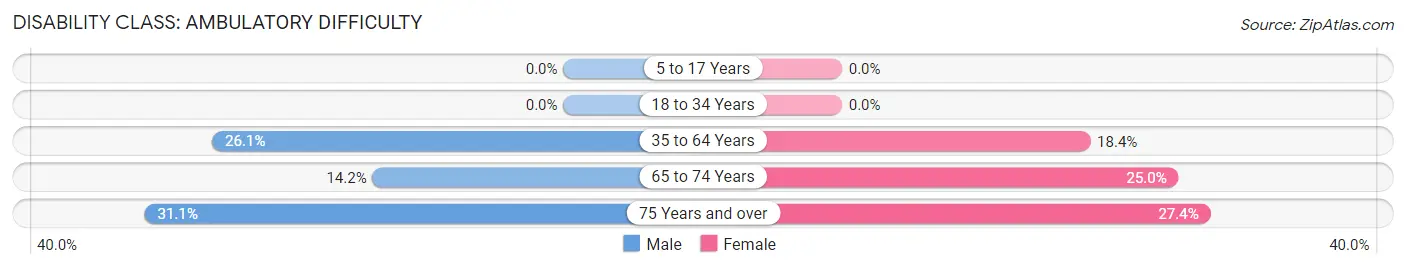
| Age Bracket | Male | Female |
| 5 to 17 Years | 0 (0.0%) | 0 (0.0%) |
| 18 to 34 Years | 0 (0.0%) | 0 (0.0%) |
| 35 to 64 Years | 163 (26.1%) | 137 (18.4%) |
| 65 to 74 Years | 35 (14.2%) | 67 (25.0%) |
| 75 Years and over | 37 (31.1%) | 98 (27.4%) |
Disability Class: Self-Care Difficulty
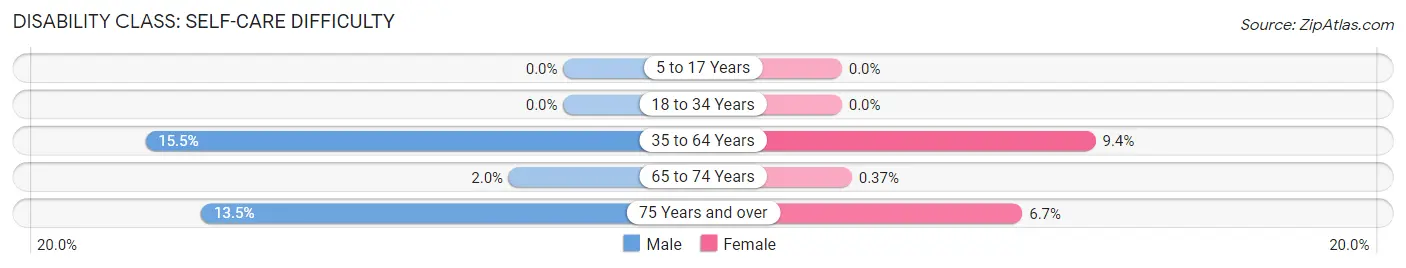
| Age Bracket | Male | Female |
| 5 to 17 Years | 0 (0.0%) | 0 (0.0%) |
| 18 to 34 Years | 0 (0.0%) | 0 (0.0%) |
| 35 to 64 Years | 97 (15.5%) | 70 (9.4%) |
| 65 to 74 Years | 5 (2.0%) | 1 (0.4%) |
| 75 Years and over | 16 (13.5%) | 24 (6.7%) |
Technology Access in Farrell
Computing Device Access in Farrell
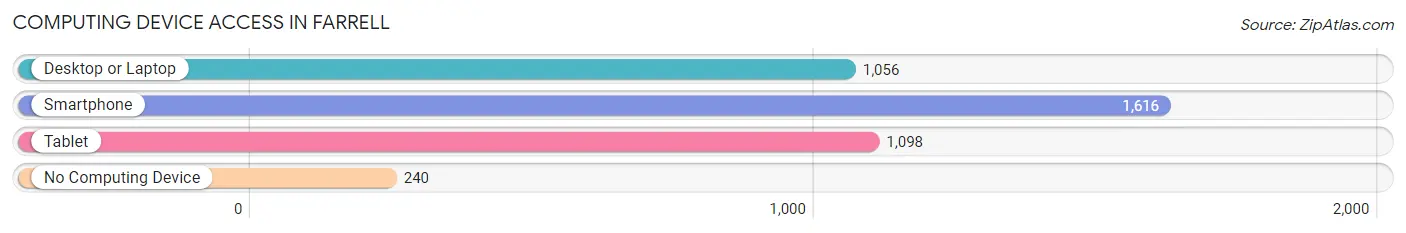
| Device Type | # Households | % Households |
| Desktop or Laptop | 1,056 | 53.4% |
| Smartphone | 1,616 | 81.8% |
| Tablet | 1,098 | 55.6% |
| No Computing Device | 240 | 12.1% |
| Total | 1,976 | 100.0% |
Internet Access in Farrell
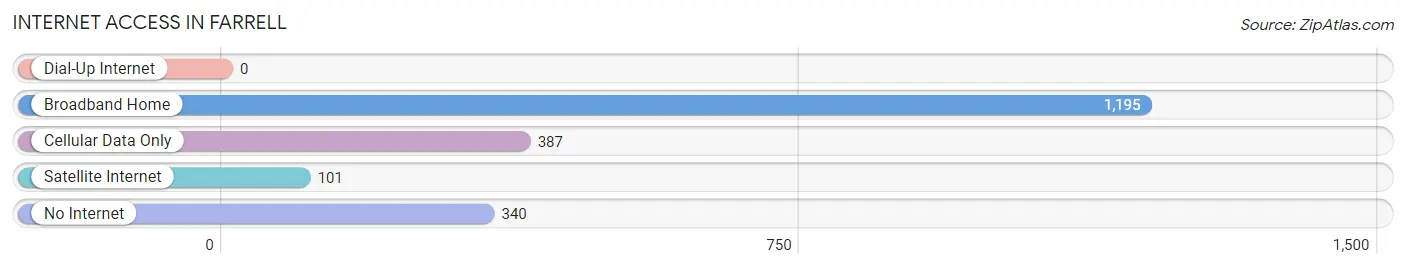
| Internet Type | # Households | % Households |
| Dial-Up Internet | 0 | 0.0% |
| Broadband Home | 1,195 | 60.5% |
| Cellular Data Only | 387 | 19.6% |
| Satellite Internet | 101 | 5.1% |
| No Internet | 340 | 17.2% |
| Total | 1,976 | 100.0% |
Farrell Summary
Farrell, Pennsylvania is a small city located in Mercer County, Pennsylvania. It is situated along the Shenango River and is part of the Youngstown-Warren-Boardman metropolitan area. The city has a population of 5,111 as of the 2010 census.
History
Farrell was founded in 1891 by J.W. Farrell, a local businessman. He purchased the land from the Pennsylvania Railroad and began to develop the area. The city was incorporated in 1895 and was named after its founder.
Farrell was a major industrial center in the early 20th century. It was home to several steel mills, including the Sharon Steel Corporation, which was the largest employer in the city. The steel industry declined in the late 20th century, and Farrell has since become a bedroom community for nearby Youngstown, Ohio.
Geography
Farrell is located at 41°12'N 80°31'W (41.20, -80.52). It is situated along the Shenango River in western Pennsylvania. The city has a total area of 1.3 square miles, all of which is land.
Economy
Farrell’s economy is largely based on manufacturing and services. The city is home to several factories, including a steel mill, a plastics plant, and a paper mill. The city also has a number of retail stores and restaurants.
Demographics
As of the 2010 census, there were 5,111 people, 2,093 households, and 1,323 families living in Farrell. The population density was 3,919.3 people per square mile. The racial makeup of the city was 79.2% White, 16.2% African American, 0.3% Native American, 0.7% Asian, 0.1% Pacific Islander, 1.2% from other races, and 2.3% from two or more races. Hispanic or Latino of any race were 3.2% of the population.
The median income for a household in Farrell was $27,917, and the median income for a family was $35,938. Males had a median income of $30,917 versus $22,917 for females. The per capita income for the city was $14,945. About 17.2% of families and 20.2% of the population were below the poverty line, including 28.2% of those under age 18 and 11.2% of those age 65 or over.
Common Questions
What is the Total Population of Farrell?
Total Population of Farrell is 4,280.
What is the Total Male Population of Farrell?
Total Male Population of Farrell is 2,088.
What is the Total Female Population of Farrell?
Total Female Population of Farrell is 2,192.
What is the Ratio of Males per 100 Females in Farrell?
There are 95.26 Males per 100 Females in Farrell.
What is the Ratio of Females per 100 Males in Farrell?
There are 104.98 Females per 100 Males in Farrell.
What is the Median Population Age in Farrell?
Median Population Age in Farrell is 39.8 Years.
What is the Average Family Size in Farrell
Average Family Size in Farrell is 3.0 People.
What is the Average Household Size in Farrell
Average Household Size in Farrell is 2.1 People.
What is Per Capita Income in Farrell?
Per Capita income in Farrell is $22,635.
What is the Median Family Income in Farrell?
Median Family Income in Farrell is $36,283.
What is the Median Household income in Farrell?
Median Household Income in Farrell is $29,063.
What is Income or Wage Gap in Farrell?
Income or Wage Gap in Farrell is 3.8%.
Women in Farrell earn 96.2 cents for every dollar earned by a man.
What is Inequality or Gini Index in Farrell?
Inequality or Gini Index in Farrell is 0.57.
How Large is the Labor Force in Farrell?
There are 1,233 People in the Labor Forcein in Farrell.
What is the Percentage of People in the Labor Force in Farrell?
36.9% of People are in the Labor Force in Farrell.
What is the Unemployment Rate in Farrell?
Unemployment Rate in Farrell is 7.4%.