Knox borough, PA
Knox borough Overview
1,063
TOTAL POPULATION
547
MALE POPULATION
516
FEMALE POPULATION
106.01
MALES / 100 FEMALES
94.33
FEMALES / 100 MALES
38.7
MEDIAN AGE
2.5
AVG FAMILY SIZE
2.3
AVG HOUSEHOLD SIZE
$29,945
PER CAPITA INCOME
$43,750
AVG FAMILY INCOME
$51,023
AVG HOUSEHOLD INCOME
28.9%
WAGE / INCOME GAP [ % ]
71.1¢/ $1
WAGE / INCOME GAP [ $ ]
0.46
INEQUALITY / GINI INDEX
515
LABOR FORCE [ PEOPLE ]
60.7%
PERCENT IN LABOR FORCE
11.5%
UNEMPLOYMENT RATE
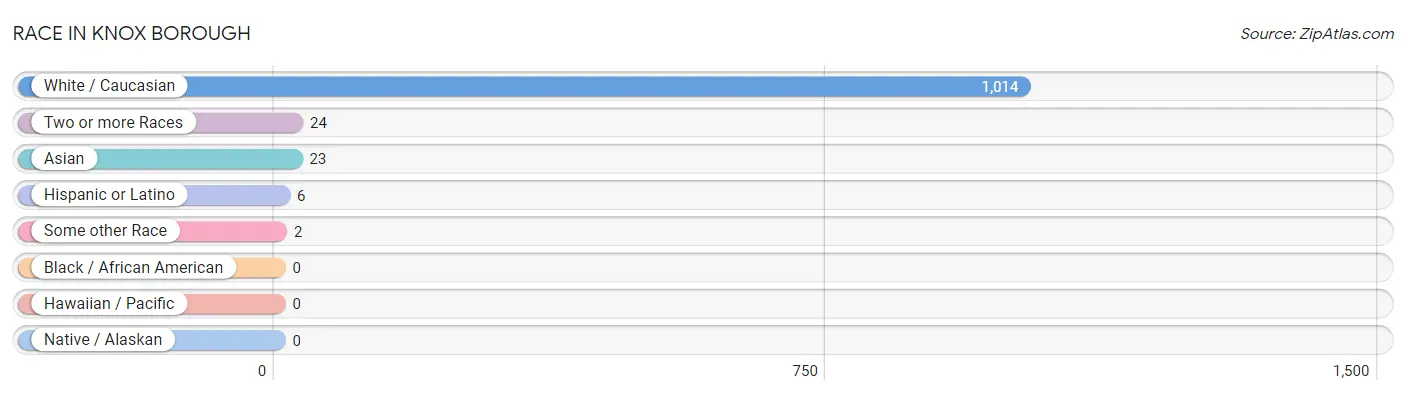
Race in Knox borough
The most populous races in Knox borough are White / Caucasian (1,014 | 95.4%), Two or more Races (24 | 2.3%), and Asian (23 | 2.2%).
| Race | # Population | % Population |
| Asian | 23 | 2.2% |
| Black / African American | 0 | 0.0% |
| Hawaiian / Pacific | 0 | 0.0% |
| Hispanic or Latino | 6 | 0.6% |
| Native / Alaskan | 0 | 0.0% |
| White / Caucasian | 1,014 | 95.4% |
| Two or more Races | 24 | 2.3% |
| Some other Race | 2 | 0.2% |
| Total | 1,063 | 100.0% |
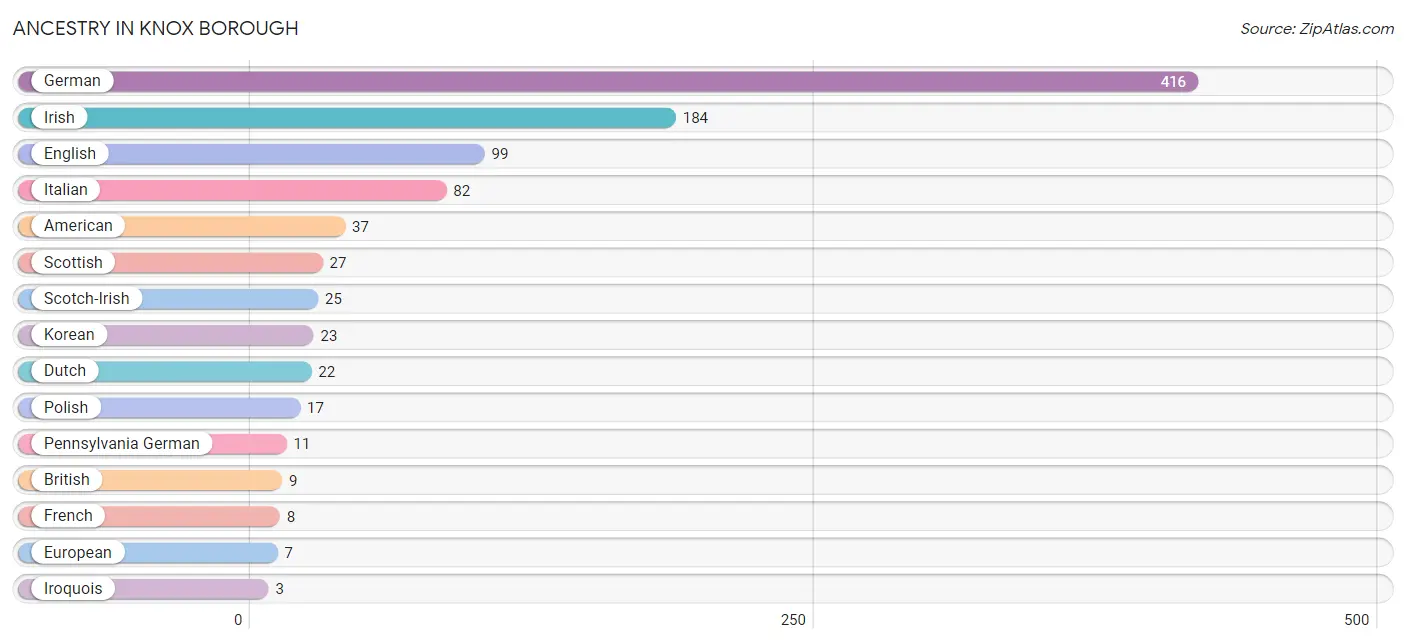
Ancestry in Knox borough
The most populous ancestries reported in Knox borough are German (416 | 39.1%), Irish (184 | 17.3%), English (99 | 9.3%), Italian (82 | 7.7%), and American (37 | 3.5%), together accounting for 76.9% of all Knox borough residents.
| Ancestry | # Population | % Population |
| American | 37 | 3.5% |
| British | 9 | 0.9% |
| Dutch | 22 | 2.1% |
| English | 99 | 9.3% |
| European | 7 | 0.7% |
| French | 8 | 0.7% |
| German | 416 | 39.1% |
| Irish | 184 | 17.3% |
| Iroquois | 3 | 0.3% |
| Italian | 82 | 7.7% |
| Korean | 23 | 2.2% |
| Mexican | 2 | 0.2% |
| Pennsylvania German | 11 | 1.0% |
| Polish | 17 | 1.6% |
| Scotch-Irish | 25 | 2.4% |
| Scottish | 27 | 2.5% |
| Spanish | 1 | 0.1% |
| Swedish | 3 | 0.3% |
| Swiss | 3 | 0.3% |
| Welsh | 2 | 0.2% | View All 20 Rows |
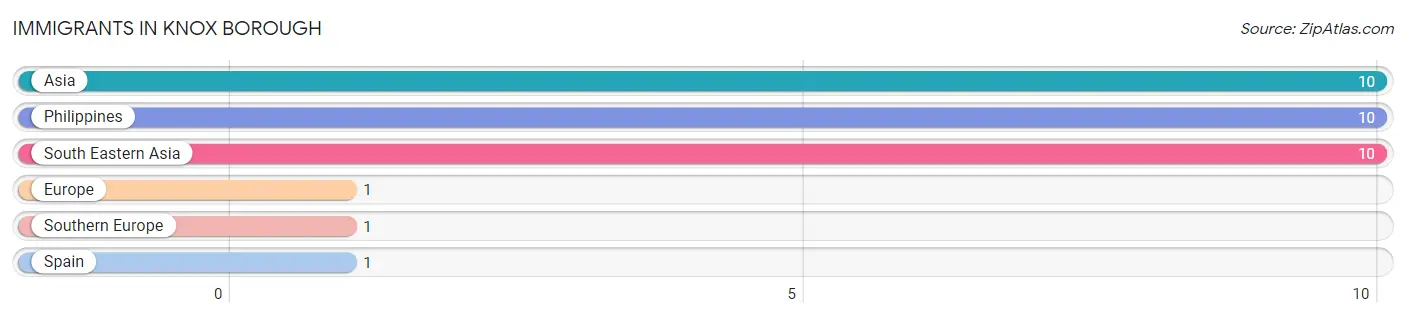
Immigrants in Knox borough
The most numerous immigrant groups reported in Knox borough came from Asia (10 | 0.9%), Philippines (10 | 0.9%), South Eastern Asia (10 | 0.9%), Europe (1 | 0.1%), and Southern Europe (1 | 0.1%), together accounting for 3.0% of all Knox borough residents.
| Immigration Origin | # Population | % Population |
| Asia | 10 | 0.9% |
| Europe | 1 | 0.1% |
| Philippines | 10 | 0.9% |
| South Eastern Asia | 10 | 0.9% |
| Southern Europe | 1 | 0.1% |
| Spain | 1 | 0.1% | View All 6 Rows |
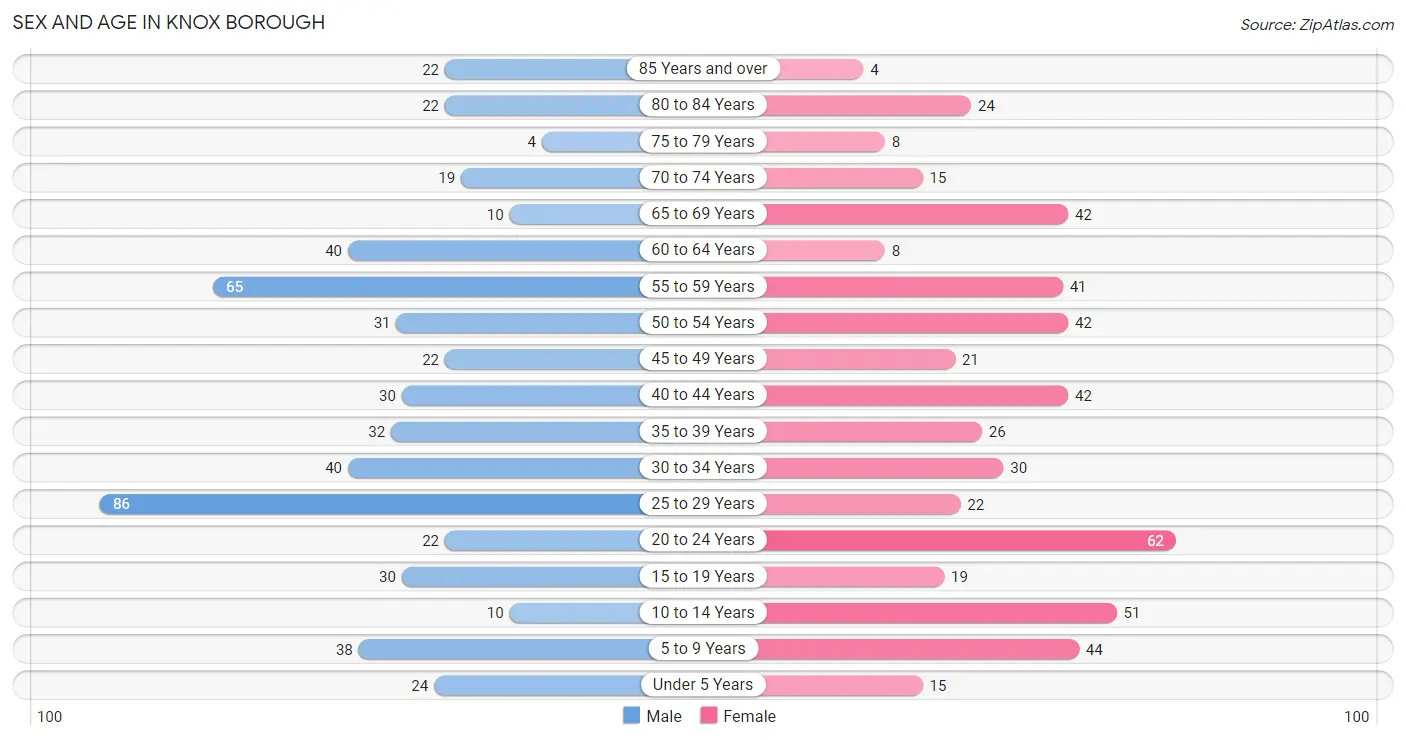
Sex and Age in Knox borough
Sex and Age in Knox borough
The most populous age groups in Knox borough are 25 to 29 Years (86 | 15.7%) for men and 20 to 24 Years (62 | 12.0%) for women.
| Age Bracket | Male | Female |
| Under 5 Years | 24 (4.4%) | 15 (2.9%) |
| 5 to 9 Years | 38 (7.0%) | 44 (8.5%) |
| 10 to 14 Years | 10 (1.8%) | 51 (9.9%) |
| 15 to 19 Years | 30 (5.5%) | 19 (3.7%) |
| 20 to 24 Years | 22 (4.0%) | 62 (12.0%) |
| 25 to 29 Years | 86 (15.7%) | 22 (4.3%) |
| 30 to 34 Years | 40 (7.3%) | 30 (5.8%) |
| 35 to 39 Years | 32 (5.9%) | 26 (5.0%) |
| 40 to 44 Years | 30 (5.5%) | 42 (8.1%) |
| 45 to 49 Years | 22 (4.0%) | 21 (4.1%) |
| 50 to 54 Years | 31 (5.7%) | 42 (8.1%) |
| 55 to 59 Years | 65 (11.9%) | 41 (8.0%) |
| 60 to 64 Years | 40 (7.3%) | 8 (1.5%) |
| 65 to 69 Years | 10 (1.8%) | 42 (8.1%) |
| 70 to 74 Years | 19 (3.5%) | 15 (2.9%) |
| 75 to 79 Years | 4 (0.7%) | 8 (1.5%) |
| 80 to 84 Years | 22 (4.0%) | 24 (4.6%) |
| 85 Years and over | 22 (4.0%) | 4 (0.8%) |
| Total | 547 (100.0%) | 516 (100.0%) |
Families and Households in Knox borough
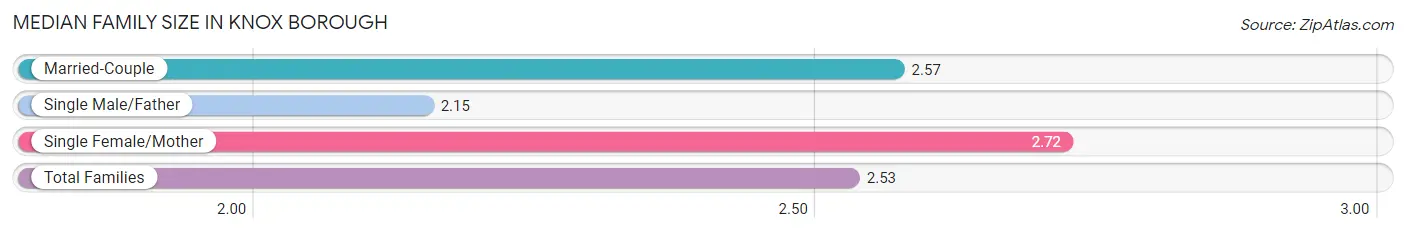
Median Family Size in Knox borough
The median family size in Knox borough is 2.53 persons per family, with single female/mother families (82 | 28.4%) accounting for the largest median family size of 2.72 persons per family. On the other hand, single male/father families (59 | 20.4%) represent the smallest median family size with 2.15 persons per family.
| Family Type | # Families | Family Size |
| Married-Couple | 148 (51.2%) | 2.57 |
| Single Male/Father | 59 (20.4%) | 2.15 |
| Single Female/Mother | 82 (28.4%) | 2.72 |
| Total Families | 289 (100.0%) | 2.53 |
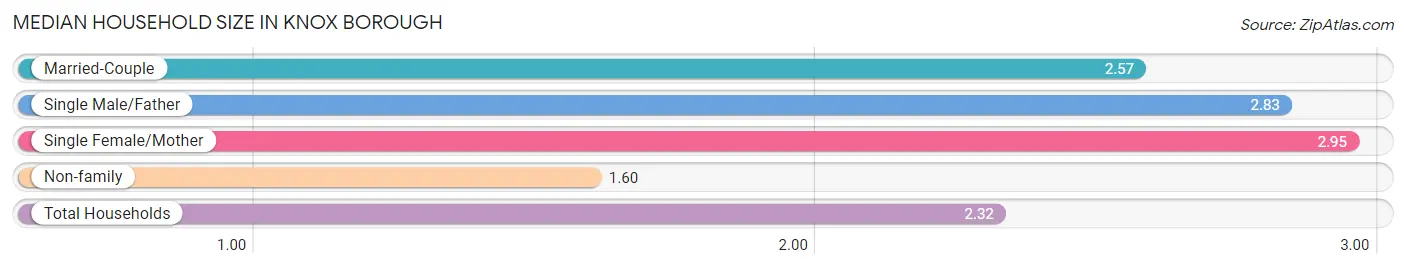
Median Household Size in Knox borough
The median household size in Knox borough is 2.32 persons per household, with single female/mother households (82 | 18.1%) accounting for the largest median household size of 2.95 persons per household. non-family households (164 | 36.2%) represent the smallest median household size with 1.60 persons per household.
| Household Type | # Households | Household Size |
| Married-Couple | 148 (32.7%) | 2.57 |
| Single Male/Father | 59 (13.0%) | 2.83 |
| Single Female/Mother | 82 (18.1%) | 2.95 |
| Non-family | 164 (36.2%) | 1.60 |
| Total Households | 453 (100.0%) | 2.32 |
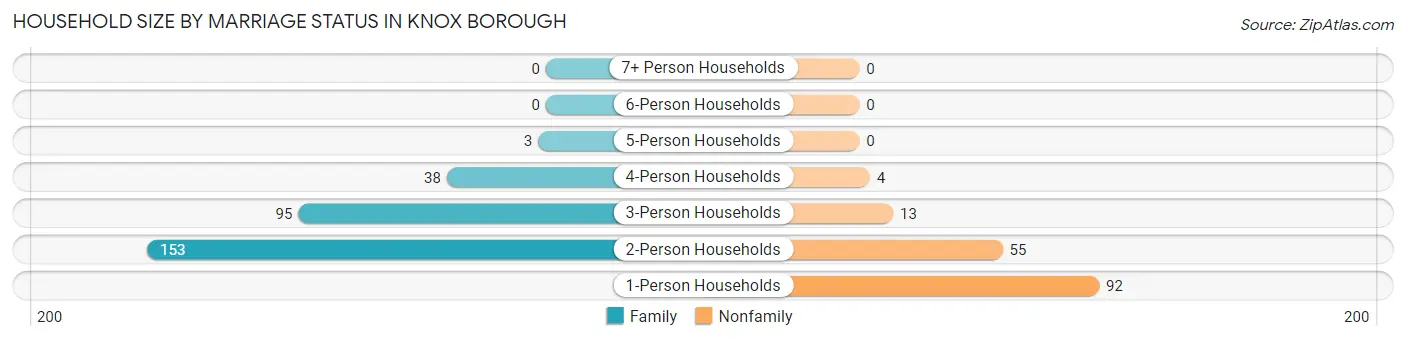
Household Size by Marriage Status in Knox borough
Out of a total of 453 households in Knox borough, 289 (63.8%) are family households, while 164 (36.2%) are nonfamily households. The most numerous type of family households are 2-person households, comprising 153, and the most common type of nonfamily households are 1-person households, comprising 92.
| Household Size | Family Households | Nonfamily Households |
| 1-Person Households | - | 92 (20.3%) |
| 2-Person Households | 153 (33.8%) | 55 (12.1%) |
| 3-Person Households | 95 (21.0%) | 13 (2.9%) |
| 4-Person Households | 38 (8.4%) | 4 (0.9%) |
| 5-Person Households | 3 (0.7%) | 0 (0.0%) |
| 6-Person Households | 0 (0.0%) | 0 (0.0%) |
| 7+ Person Households | 0 (0.0%) | 0 (0.0%) |
| Total | 289 (63.8%) | 164 (36.2%) |
Female Fertility in Knox borough
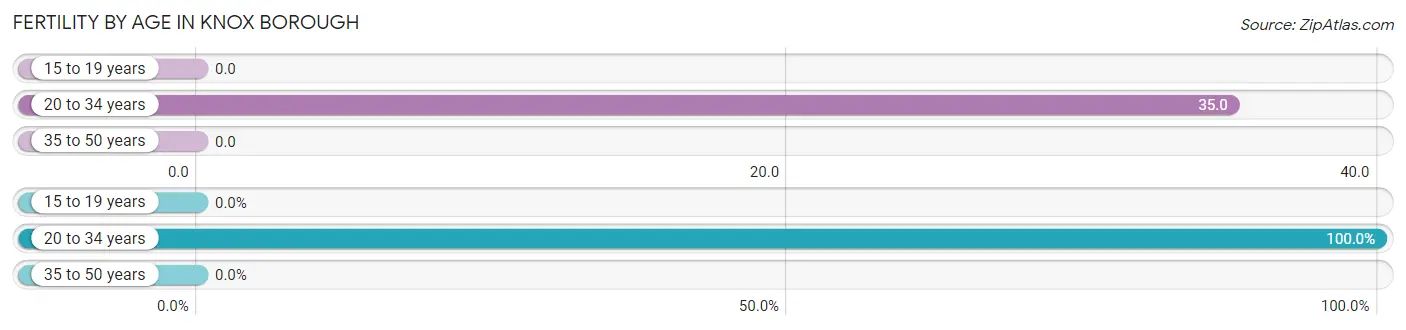
Fertility by Age in Knox borough
Average fertility rate in Knox borough is 17.0 births per 1,000 women. Women in the age bracket of 20 to 34 years have the highest fertility rate with 35.0 births per 1,000 women. Women in the age bracket of 20 to 34 years acount for 100.0% of all women with births.
| Age Bracket | Women with Births | Births / 1,000 Women |
| 15 to 19 years | 0 (0.0%) | 0.0 |
| 20 to 34 years | 4 (100.0%) | 35.0 |
| 35 to 50 years | 0 (0.0%) | 0.0 |
| Total | 4 (100.0%) | 17.0 |
Fertility by Age by Marriage Status in Knox borough
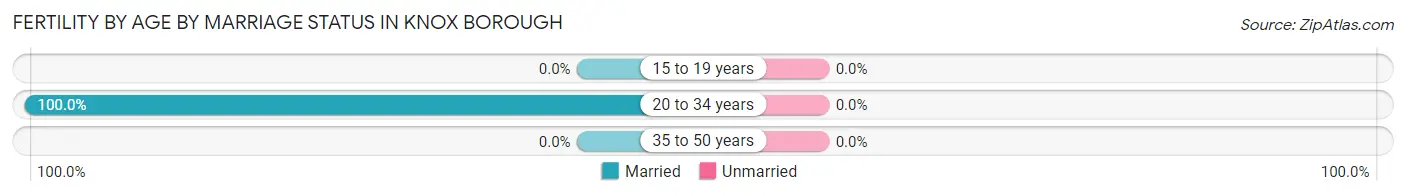
| Age Bracket | Married | Unmarried |
| 15 to 19 years | 0 (0.0%) | 0 (0.0%) |
| 20 to 34 years | 4 (100.0%) | 0 (0.0%) |
| 35 to 50 years | 0 (0.0%) | 0 (0.0%) |
| Total | 4 (100.0%) | 0 (0.0%) |
Fertility by Education in Knox borough
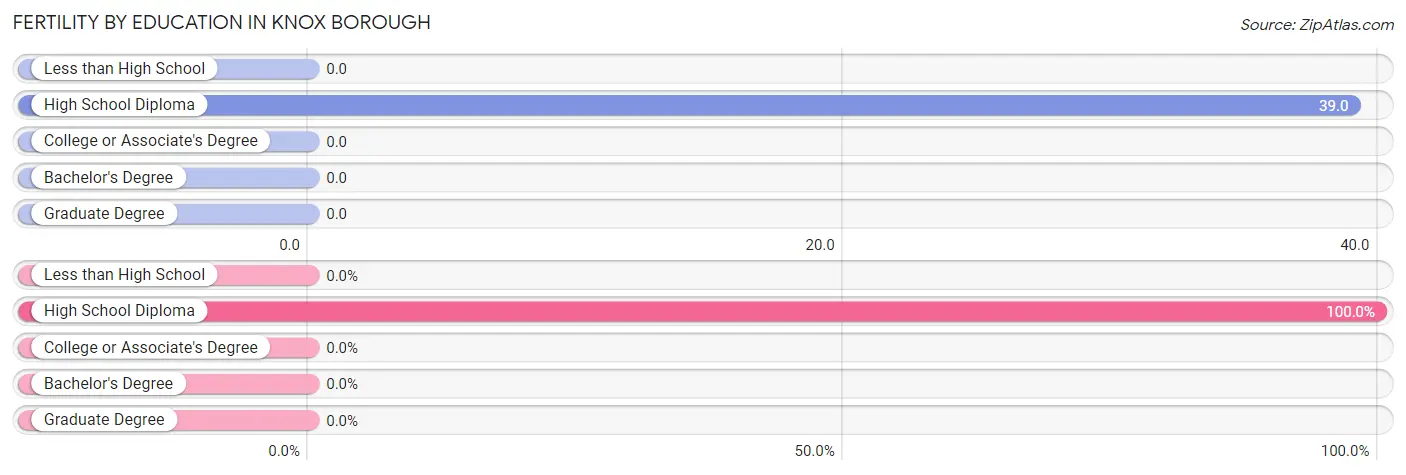
| Educational Attainment | Women with Births | Births / 1,000 Women |
| Less than High School | 0 (0.0%) | 0.0 |
| High School Diploma | 4 (100.0%) | 39.0 |
| College or Associate's Degree | 0 (0.0%) | 0.0 |
| Bachelor's Degree | 0 (0.0%) | 0.0 |
| Graduate Degree | 0 (0.0%) | 0.0 |
| Total | 4 (100.0%) | 17.0 |
Fertility by Education by Marriage Status in Knox borough
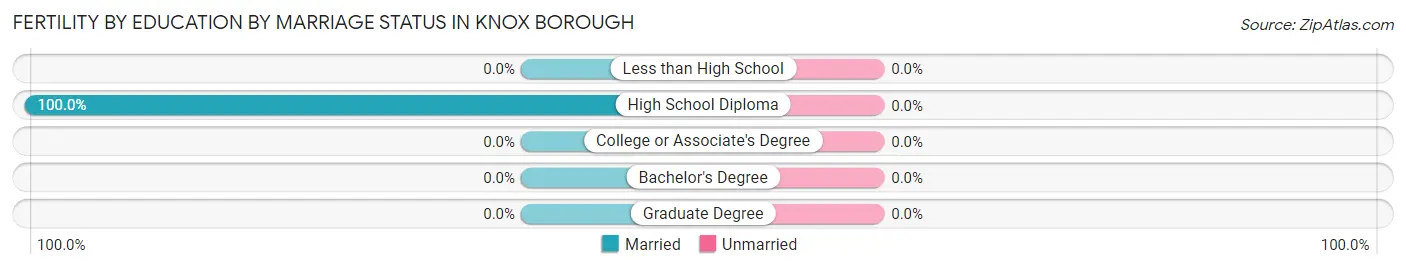
| Educational Attainment | Married | Unmarried |
| Less than High School | 0 (0.0%) | 0 (0.0%) |
| High School Diploma | 4 (100.0%) | 0 (0.0%) |
| College or Associate's Degree | 0 (0.0%) | 0 (0.0%) |
| Bachelor's Degree | 0 (0.0%) | 0 (0.0%) |
| Graduate Degree | 0 (0.0%) | 0 (0.0%) |
| Total | 4 (100.0%) | 0 (0.0%) |
Income in Knox borough
Income Overview in Knox borough
Per Capita Income in Knox borough is $29,945, while median incomes of families and households are $43,750 and $51,023 respectively.
| Characteristic | Number | Measure |
| Per Capita Income | 1,063 | $29,945 |
| Median Family Income | 289 | $43,750 |
| Mean Family Income | 289 | $75,035 |
| Median Household Income | 453 | $51,023 |
| Mean Household Income | 453 | $68,093 |
| Income Deficit | 289 | $0 |
| Wage / Income Gap (%) | 1,063 | 28.93% |
| Wage / Income Gap ($) | 1,063 | 71.07¢ per $1 |
| Gini / Inequality Index | 1,063 | 0.46 |
Earnings by Sex in Knox borough
Average Earnings in Knox borough are $35,826, $41,250 for men and $29,318 for women, a difference of 28.9%.
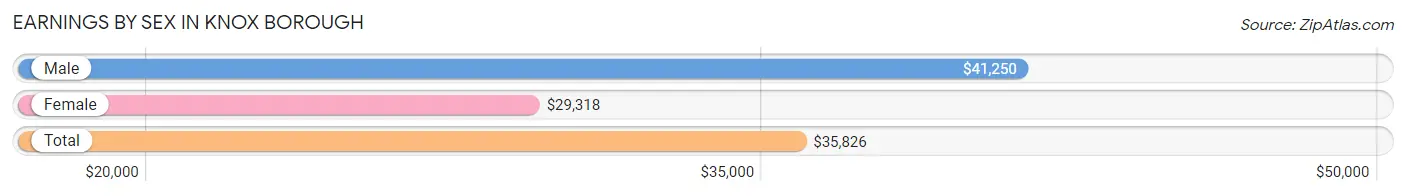
| Sex | Number | Average Earnings |
| Male | 241 (45.9%) | $41,250 |
| Female | 284 (54.1%) | $29,318 |
| Total | 525 (100.0%) | $35,826 |
Earnings by Sex by Income Bracket in Knox borough
The most common earnings brackets in Knox borough are $35,000 to $39,999 for men (56 | 23.2%) and $25,000 to $29,999 for women (36 | 12.7%).
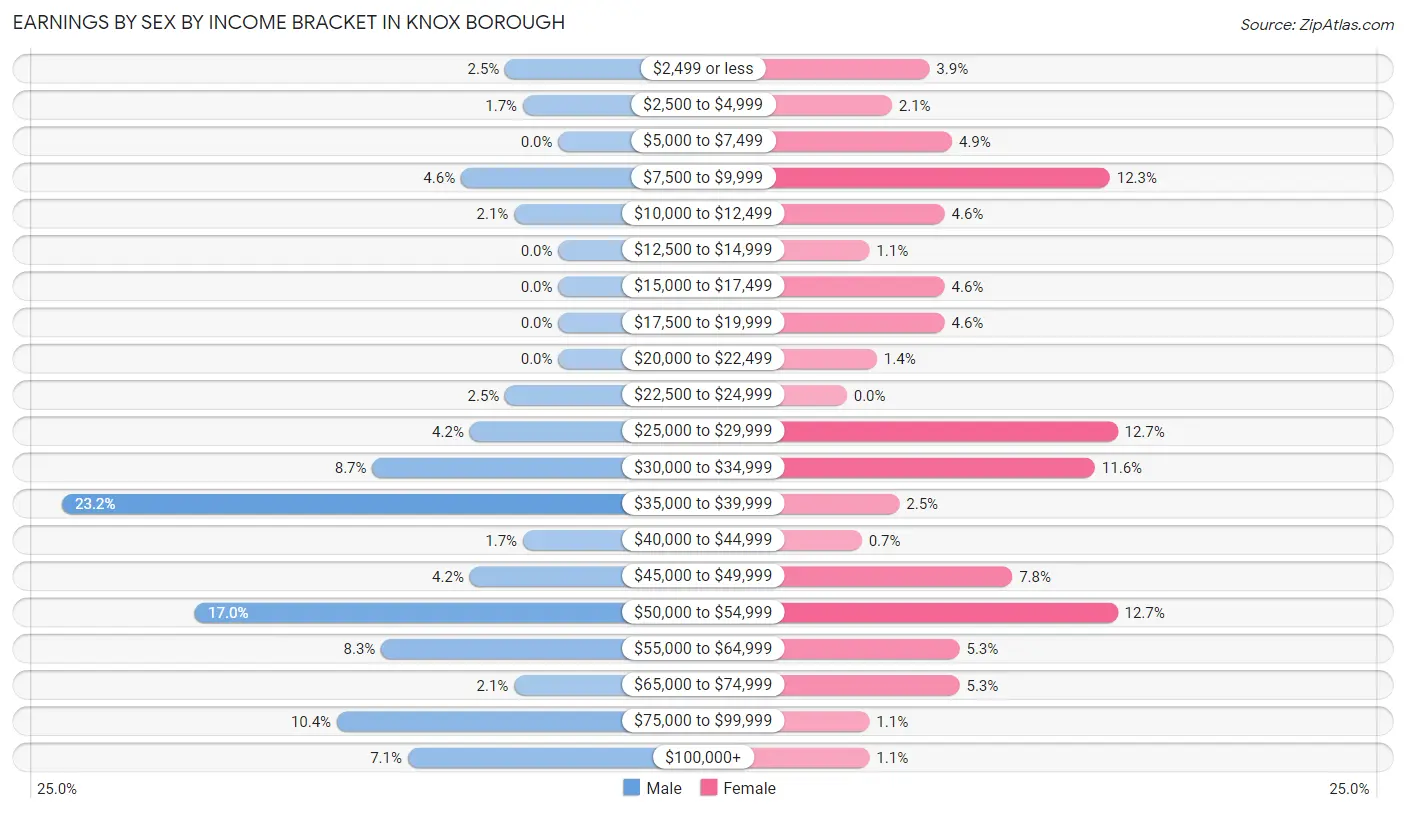
| Income | Male | Female |
| $2,499 or less | 6 (2.5%) | 11 (3.9%) |
| $2,500 to $4,999 | 4 (1.7%) | 6 (2.1%) |
| $5,000 to $7,499 | 0 (0.0%) | 14 (4.9%) |
| $7,500 to $9,999 | 11 (4.6%) | 35 (12.3%) |
| $10,000 to $12,499 | 5 (2.1%) | 13 (4.6%) |
| $12,500 to $14,999 | 0 (0.0%) | 3 (1.1%) |
| $15,000 to $17,499 | 0 (0.0%) | 13 (4.6%) |
| $17,500 to $19,999 | 0 (0.0%) | 13 (4.6%) |
| $20,000 to $22,499 | 0 (0.0%) | 4 (1.4%) |
| $22,500 to $24,999 | 6 (2.5%) | 0 (0.0%) |
| $25,000 to $29,999 | 10 (4.2%) | 36 (12.7%) |
| $30,000 to $34,999 | 21 (8.7%) | 33 (11.6%) |
| $35,000 to $39,999 | 56 (23.2%) | 7 (2.5%) |
| $40,000 to $44,999 | 4 (1.7%) | 2 (0.7%) |
| $45,000 to $49,999 | 10 (4.2%) | 22 (7.7%) |
| $50,000 to $54,999 | 41 (17.0%) | 36 (12.7%) |
| $55,000 to $64,999 | 20 (8.3%) | 15 (5.3%) |
| $65,000 to $74,999 | 5 (2.1%) | 15 (5.3%) |
| $75,000 to $99,999 | 25 (10.4%) | 3 (1.1%) |
| $100,000+ | 17 (7.0%) | 3 (1.1%) |
| Total | 241 (100.0%) | 284 (100.0%) |
Earnings by Sex by Educational Attainment in Knox borough
Average earnings in Knox borough are $39,286 for men and $26,786 for women, a difference of 31.8%. Men with an educational attainment of graduate degree enjoy the highest average annual earnings of $55,833, while those with high school diploma education earn the least with $36,500. Women with an educational attainment of graduate degree earn the most with the average annual earnings of $52,917, while those with graduate degree education have the smallest earnings of $52,917.
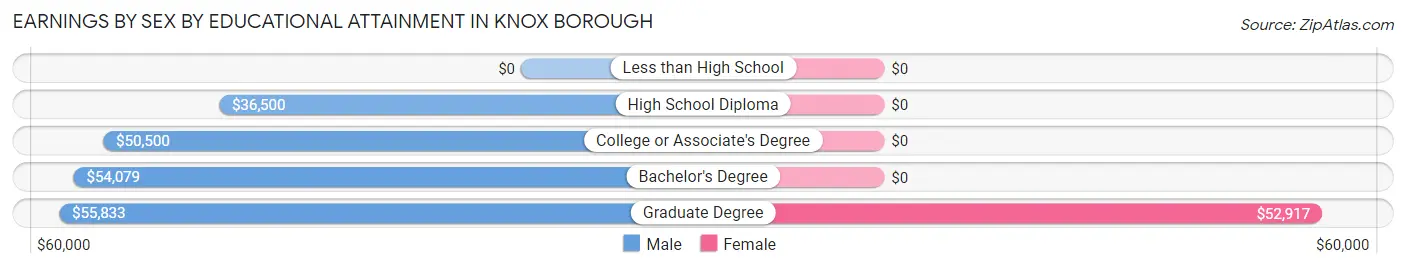
| Educational Attainment | Male Income | Female Income |
| Less than High School | - | - |
| High School Diploma | $36,500 | $0 |
| College or Associate's Degree | $50,500 | $0 |
| Bachelor's Degree | $54,079 | $0 |
| Graduate Degree | $55,833 | $52,917 |
| Total | $39,286 | $26,786 |
Family Income in Knox borough
Family Income Brackets in Knox borough
According to the Knox borough family income data, there are 62 families falling into the $35,000 to $49,999 income range, which is the most common income bracket and makes up 21.4% of all families.
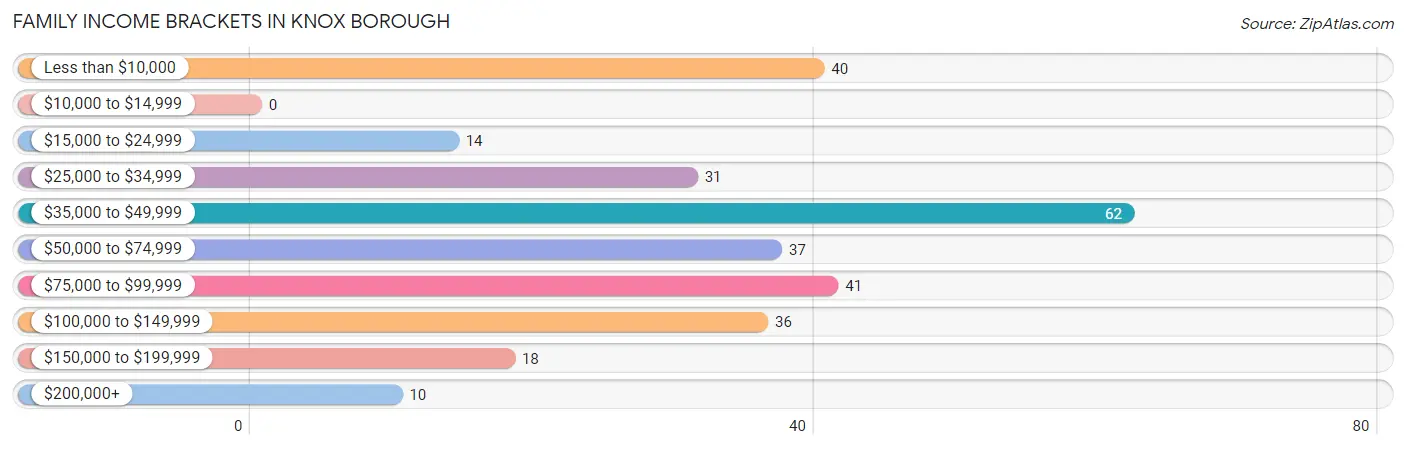
| Income Bracket | # Families | % Families |
| Less than $10,000 | 40 | 13.8% |
| $10,000 to $14,999 | 0 | 0.0% |
| $15,000 to $24,999 | 14 | 4.8% |
| $25,000 to $34,999 | 31 | 10.7% |
| $35,000 to $49,999 | 62 | 21.5% |
| $50,000 to $74,999 | 37 | 12.8% |
| $75,000 to $99,999 | 41 | 14.2% |
| $100,000 to $149,999 | 36 | 12.5% |
| $150,000 to $199,999 | 18 | 6.2% |
| $200,000+ | 10 | 3.5% |
Family Income by Famaliy Size in Knox borough
4-person families (24 | 8.3%) account for the highest median family income in Knox borough with $115,625 per family, while 4-person families (24 | 8.3%) have the highest median income of $28,906 per family member.
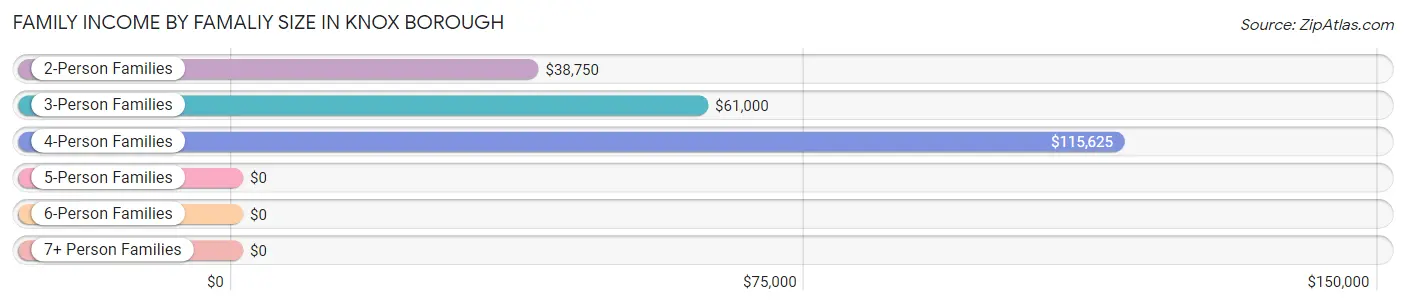
| Income Bracket | # Families | Median Income |
| 2-Person Families | 200 (69.2%) | $38,750 |
| 3-Person Families | 62 (21.4%) | $61,000 |
| 4-Person Families | 24 (8.3%) | $115,625 |
| 5-Person Families | 3 (1.0%) | $0 |
| 6-Person Families | 0 (0.0%) | $0 |
| 7+ Person Families | 0 (0.0%) | $0 |
| Total | 289 (100.0%) | $43,750 |
Family Income by Number of Earners in Knox borough
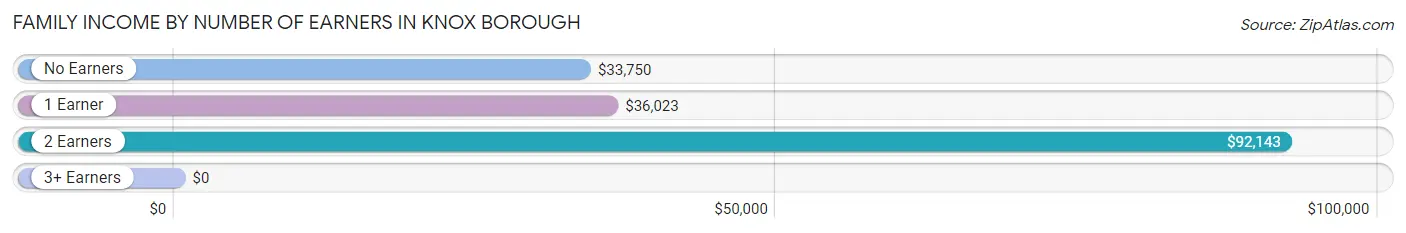
| Number of Earners | # Families | Median Income |
| No Earners | 58 (20.1%) | $33,750 |
| 1 Earner | 117 (40.5%) | $36,023 |
| 2 Earners | 108 (37.4%) | $92,143 |
| 3+ Earners | 6 (2.1%) | $0 |
| Total | 289 (100.0%) | $43,750 |
Household Income in Knox borough
Household Income Brackets in Knox borough
With 83 households falling in the category, the $75,000 to $99,999 income range is the most frequent in Knox borough, accounting for 18.3% of all households. In contrast, only 10 households (2.2%) fall into the $200,000+ income bracket, making it the least populous group.
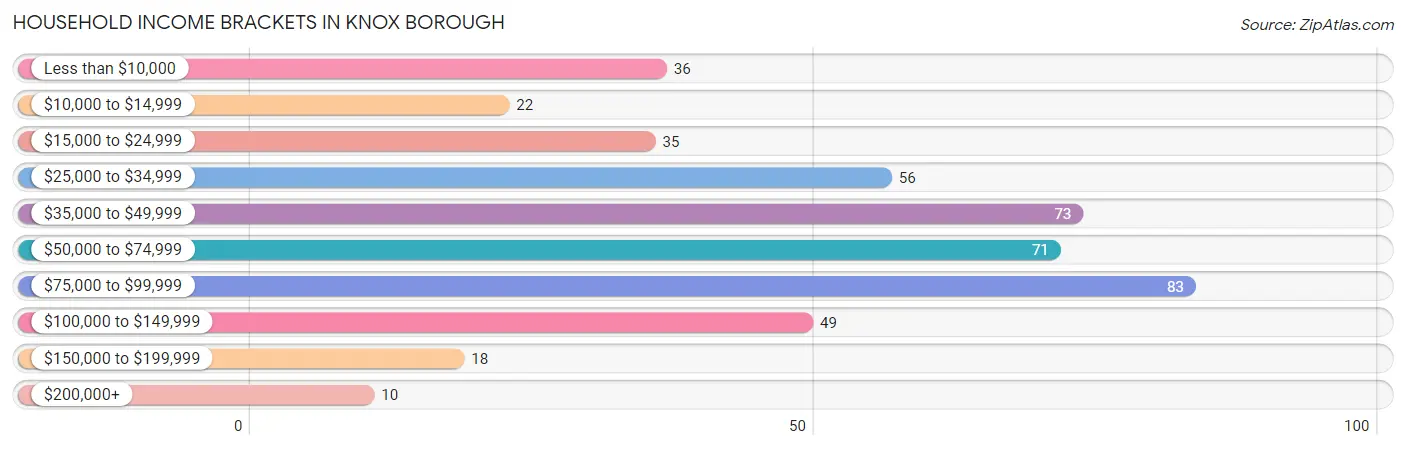
| Income Bracket | # Households | % Households |
| Less than $10,000 | 36 | 7.9% |
| $10,000 to $14,999 | 22 | 4.9% |
| $15,000 to $24,999 | 35 | 7.7% |
| $25,000 to $34,999 | 56 | 12.4% |
| $35,000 to $49,999 | 73 | 16.1% |
| $50,000 to $74,999 | 71 | 15.7% |
| $75,000 to $99,999 | 83 | 18.3% |
| $100,000 to $149,999 | 49 | 10.8% |
| $150,000 to $199,999 | 18 | 4.0% |
| $200,000+ | 10 | 2.2% |
Household Income by Householder Age in Knox borough
The median household income in Knox borough is $51,023, with the highest median household income of $61,833 found in the 25 to 44 years age bracket for the primary householder. A total of 196 households (43.3%) fall into this category. Meanwhile, the 15 to 24 years age bracket for the primary householder has the lowest median household income of $0, with 7 households (1.5%) in this group.
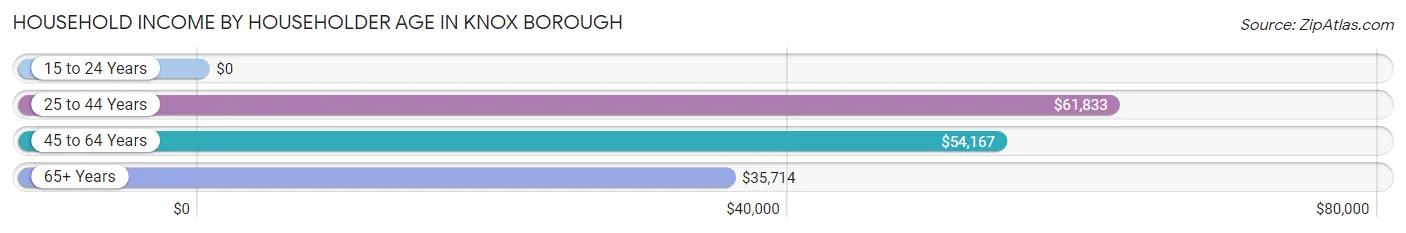
| Income Bracket | # Households | Median Income |
| 15 to 24 Years | 7 (1.5%) | $0 |
| 25 to 44 Years | 196 (43.3%) | $61,833 |
| 45 to 64 Years | 132 (29.1%) | $54,167 |
| 65+ Years | 118 (26.1%) | $35,714 |
| Total | 453 (100.0%) | $51,023 |
Poverty in Knox borough
Income Below Poverty by Sex and Age in Knox borough
With 23.2% poverty level for males and 19.0% for females among the residents of Knox borough, under 5 year old males and under 5 year old females are the most vulnerable to poverty, with 10 males (58.8%) and 15 females (100.0%) in their respective age groups living below the poverty level.
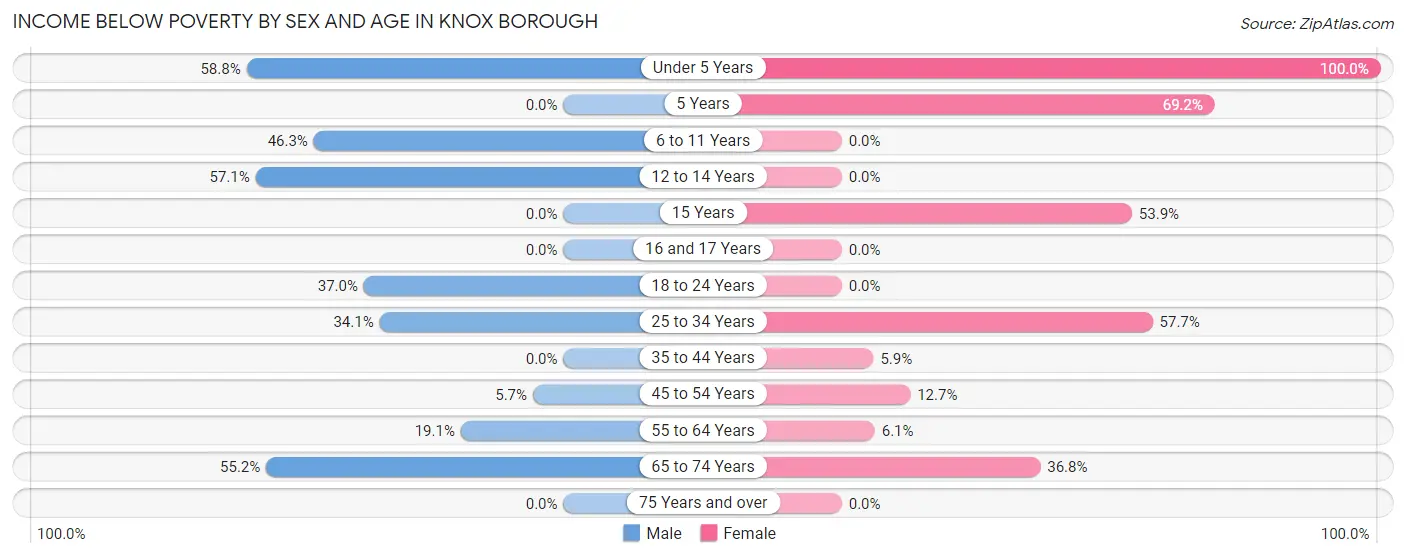
| Age Bracket | Male | Female |
| Under 5 Years | 10 (58.8%) | 15 (100.0%) |
| 5 Years | 0 (0.0%) | 9 (69.2%) |
| 6 to 11 Years | 19 (46.3%) | 0 (0.0%) |
| 12 to 14 Years | 4 (57.1%) | 0 (0.0%) |
| 15 Years | 0 (0.0%) | 7 (53.8%) |
| 16 and 17 Years | 0 (0.0%) | 0 (0.0%) |
| 18 to 24 Years | 10 (37.0%) | 0 (0.0%) |
| 25 to 34 Years | 43 (34.1%) | 30 (57.7%) |
| 35 to 44 Years | 0 (0.0%) | 4 (5.9%) |
| 45 to 54 Years | 3 (5.7%) | 8 (12.7%) |
| 55 to 64 Years | 20 (19.1%) | 3 (6.1%) |
| 65 to 74 Years | 16 (55.2%) | 21 (36.8%) |
| 75 Years and over | 0 (0.0%) | 0 (0.0%) |
| Total | 125 (23.2%) | 97 (19.0%) |
Income Above Poverty by Sex and Age in Knox borough
According to the poverty statistics in Knox borough, males aged 15 years and females aged 6 to 11 years are the age groups that are most secure financially, with 100.0% of males and 100.0% of females in these age groups living above the poverty line.
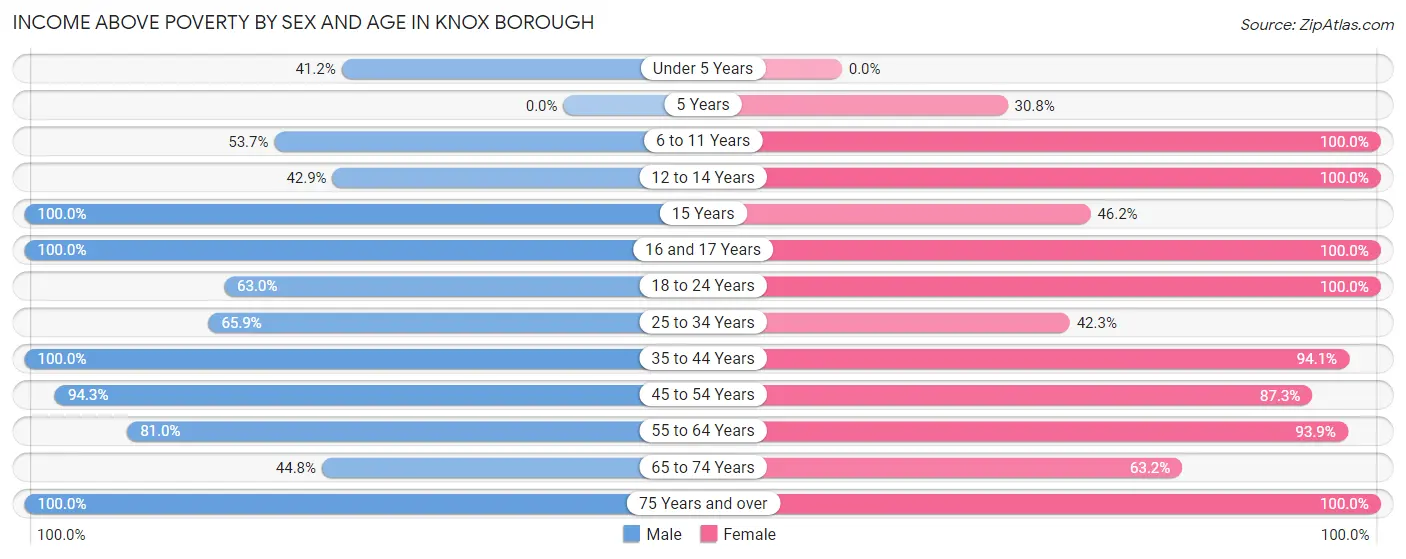
| Age Bracket | Male | Female |
| Under 5 Years | 7 (41.2%) | 0 (0.0%) |
| 5 Years | 0 (0.0%) | 4 (30.8%) |
| 6 to 11 Years | 22 (53.7%) | 42 (100.0%) |
| 12 to 14 Years | 3 (42.9%) | 34 (100.0%) |
| 15 Years | 20 (100.0%) | 6 (46.2%) |
| 16 and 17 Years | 5 (100.0%) | 6 (100.0%) |
| 18 to 24 Years | 17 (63.0%) | 62 (100.0%) |
| 25 to 34 Years | 83 (65.9%) | 22 (42.3%) |
| 35 to 44 Years | 62 (100.0%) | 64 (94.1%) |
| 45 to 54 Years | 50 (94.3%) | 55 (87.3%) |
| 55 to 64 Years | 85 (80.9%) | 46 (93.9%) |
| 65 to 74 Years | 13 (44.8%) | 36 (63.2%) |
| 75 Years and over | 48 (100.0%) | 36 (100.0%) |
| Total | 415 (76.8%) | 413 (81.0%) |
Income Below Poverty Among Married-Couple Families in Knox borough
The poverty statistics for married-couple families in Knox borough show that 9.5% or 14 of the total 148 families live below the poverty line. Families with 1 or 2 children have the highest poverty rate of 11.4%, comprising of 4 families. On the other hand, families with 3 or 4 children have the lowest poverty rate of 0.0%, which includes 0 families.
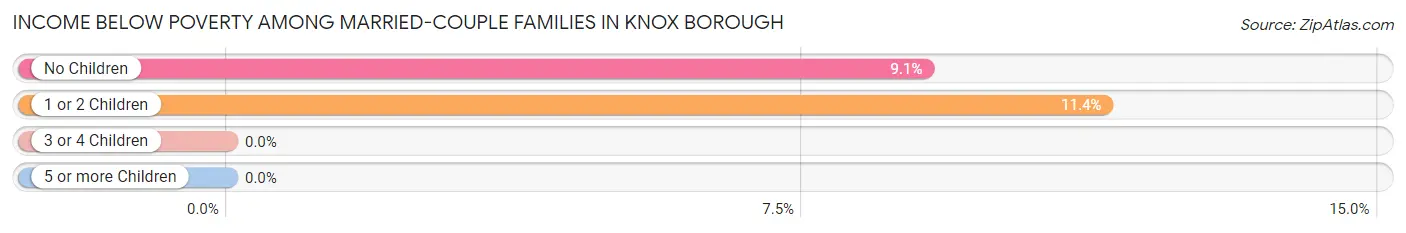
| Children | Above Poverty | Below Poverty |
| No Children | 100 (90.9%) | 10 (9.1%) |
| 1 or 2 Children | 31 (88.6%) | 4 (11.4%) |
| 3 or 4 Children | 3 (100.0%) | 0 (0.0%) |
| 5 or more Children | 0 (0.0%) | 0 (0.0%) |
| Total | 134 (90.5%) | 14 (9.5%) |
Income Below Poverty Among Single-Parent Households in Knox borough
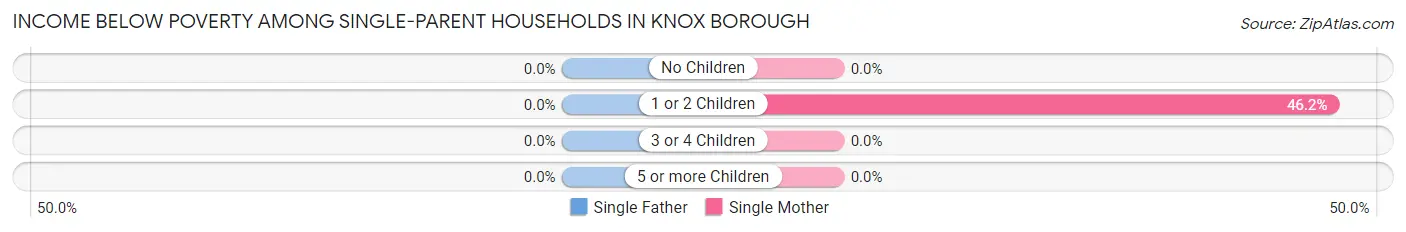
| Children | Single Father | Single Mother |
| No Children | 0 (0.0%) | 0 (0.0%) |
| 1 or 2 Children | 0 (0.0%) | 30 (46.2%) |
| 3 or 4 Children | 0 (0.0%) | 0 (0.0%) |
| 5 or more Children | 0 (0.0%) | 0 (0.0%) |
| Total | 0 (0.0%) | 30 (36.6%) |
Income Below Poverty Among Married-Couple vs Single-Parent Households in Knox borough
The poverty data for Knox borough shows that 14 of the married-couple family households (9.5%) and 30 of the single-parent households (21.3%) are living below the poverty level. Within the married-couple family households, those with 1 or 2 children have the highest poverty rate, with 4 households (11.4%) falling below the poverty line. Among the single-parent households, those with 1 or 2 children have the highest poverty rate, with 30 household (28.3%) living below poverty.
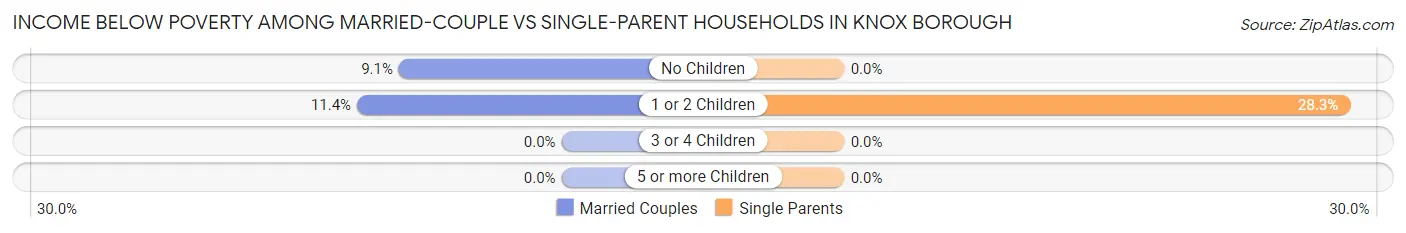
| Children | Married-Couple Families | Single-Parent Households |
| No Children | 10 (9.1%) | 0 (0.0%) |
| 1 or 2 Children | 4 (11.4%) | 30 (28.3%) |
| 3 or 4 Children | 0 (0.0%) | 0 (0.0%) |
| 5 or more Children | 0 (0.0%) | 0 (0.0%) |
| Total | 14 (9.5%) | 30 (21.3%) |
Employment Characteristics in Knox borough
Employment by Class of Employer in Knox borough
Among the 456 employed individuals in Knox borough, private company employees (280 | 61.4%), not-for-profit organizations (50 | 11.0%), and state government employees (36 | 7.9%) make up the most common classes of employment.
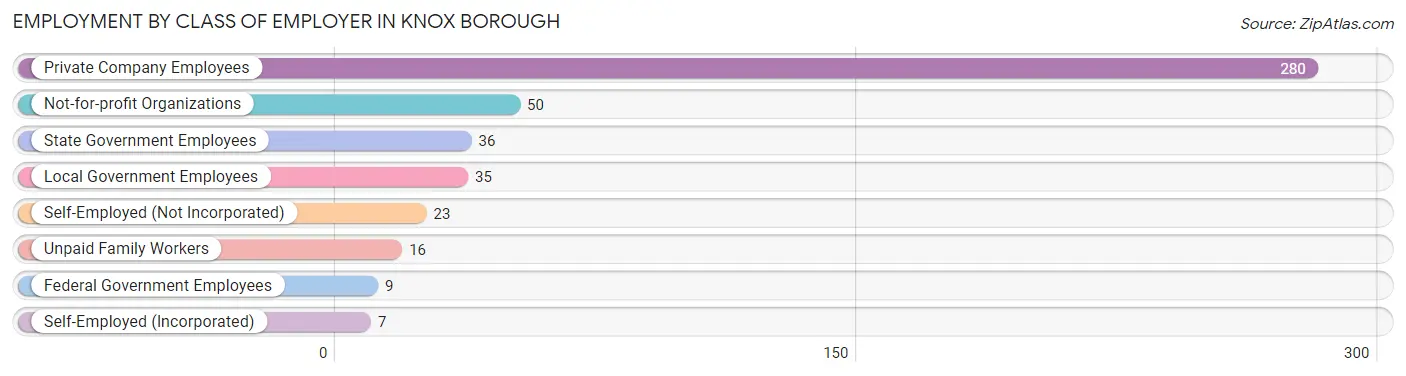
| Employer Class | # Employees | % Employees |
| Private Company Employees | 280 | 61.4% |
| Self-Employed (Incorporated) | 7 | 1.5% |
| Self-Employed (Not Incorporated) | 23 | 5.0% |
| Not-for-profit Organizations | 50 | 11.0% |
| Local Government Employees | 35 | 7.7% |
| State Government Employees | 36 | 7.9% |
| Federal Government Employees | 9 | 2.0% |
| Unpaid Family Workers | 16 | 3.5% |
| Total | 456 | 100.0% |
Employment Status by Age in Knox borough
According to the labor force statistics for Knox borough, out of the total population over 16 years of age (848), 60.7% or 515 individuals are in the labor force, with 11.5% or 59 of them unemployed. The age group with the highest labor force participation rate is 35 to 44 years, with 96.9% or 126 individuals in the labor force. Within the labor force, the 25 to 29 years age range has the highest percentage of unemployed individuals, with 39.0% or 30 of them being unemployed.
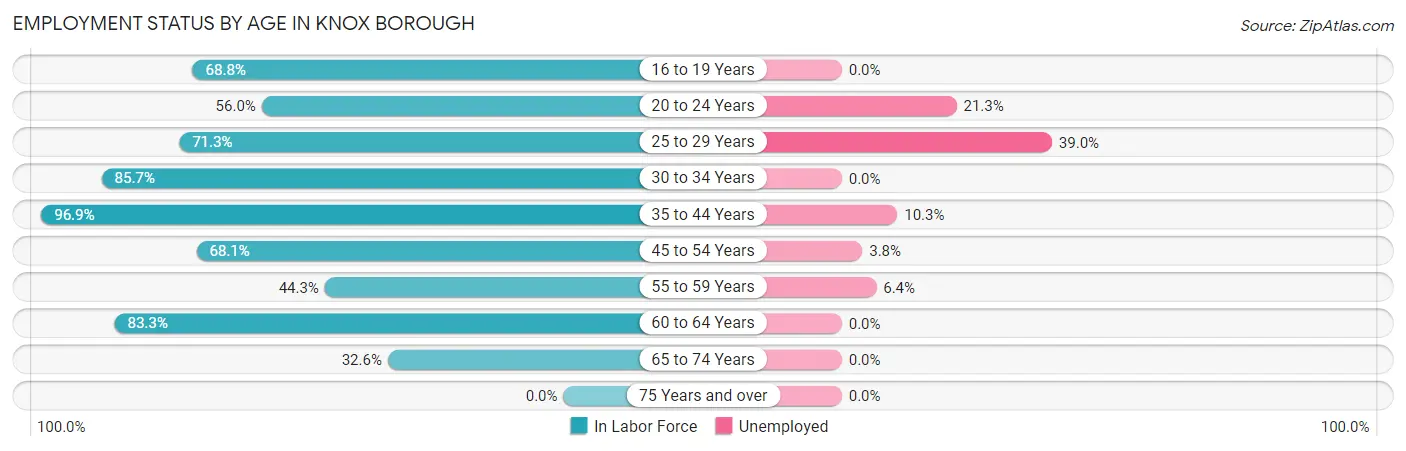
| Age Bracket | In Labor Force | Unemployed |
| 16 to 19 Years | 11 (68.8%) | 0 (0.0%) |
| 20 to 24 Years | 47 (56.0%) | 10 (21.3%) |
| 25 to 29 Years | 77 (71.3%) | 30 (39.0%) |
| 30 to 34 Years | 60 (85.7%) | 0 (0.0%) |
| 35 to 44 Years | 126 (96.9%) | 13 (10.3%) |
| 45 to 54 Years | 79 (68.1%) | 3 (3.8%) |
| 55 to 59 Years | 47 (44.3%) | 3 (6.4%) |
| 60 to 64 Years | 40 (83.3%) | 0 (0.0%) |
| 65 to 74 Years | 28 (32.6%) | 0 (0.0%) |
| 75 Years and over | 0 (0.0%) | 0 (0.0%) |
| Total | 515 (60.7%) | 59 (11.5%) |
Employment Status by Educational Attainment in Knox borough
According to labor force statistics for Knox borough, 74.2% of individuals (429) out of the total population between 25 and 64 years of age (578) are in the labor force, with 11.4% or 49 of them being unemployed. The group with the highest labor force participation rate are those with the educational attainment of bachelor's degree or higher, with 100.0% or 159 individuals in the labor force. Within the labor force, individuals with less than high school education have the highest percentage of unemployment, with 71.4% or 20 of them being unemployed.
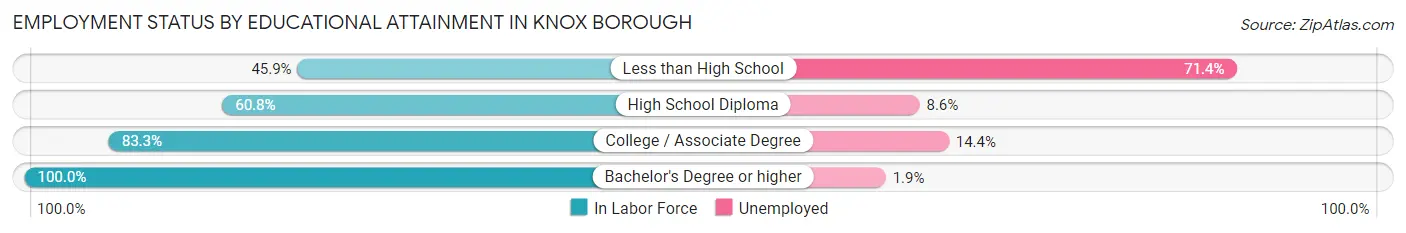
| Educational Attainment | In Labor Force | Unemployed |
| Less than High School | 28 (45.9%) | 44 (71.4%) |
| High School Diploma | 152 (60.8%) | 22 (8.6%) |
| College / Associate Degree | 90 (83.3%) | 16 (14.4%) |
| Bachelor's Degree or higher | 159 (100.0%) | 3 (1.9%) |
| Total | 429 (74.2%) | 66 (11.4%) |
Employment Occupations by Sex in Knox borough
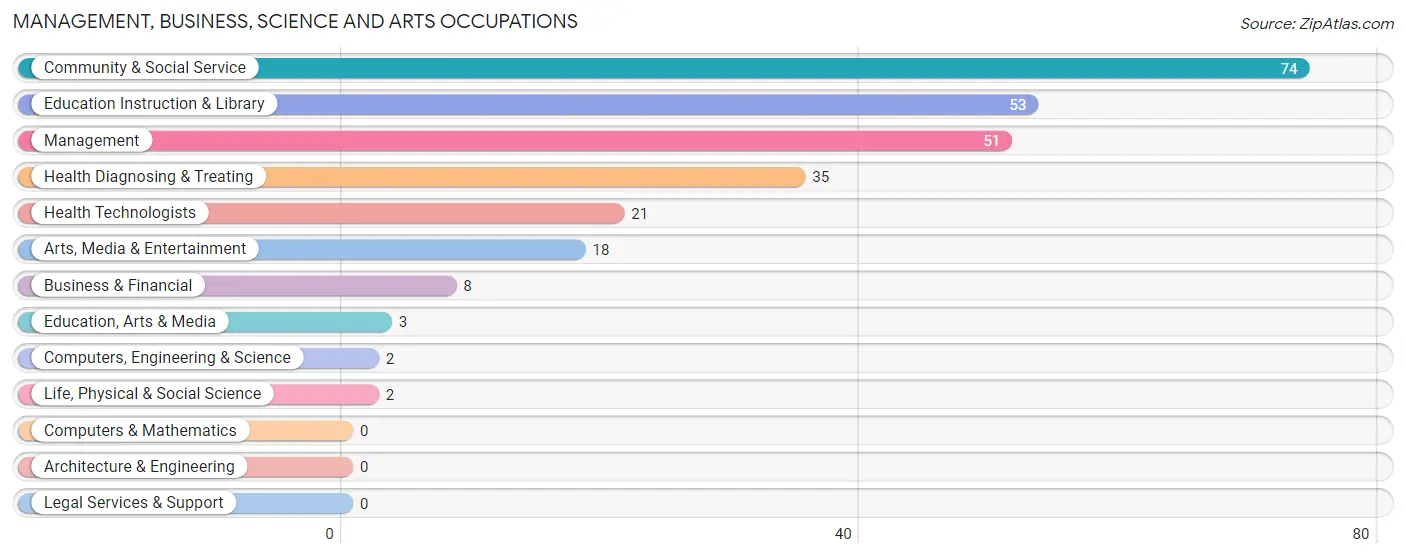
Management, Business, Science and Arts Occupations
The most common Management, Business, Science and Arts occupations in Knox borough are Community & Social Service (74 | 16.2%), Education Instruction & Library (53 | 11.6%), Management (51 | 11.2%), Health Diagnosing & Treating (35 | 7.7%), and Health Technologists (21 | 4.6%).
Management, Business, Science and Arts Occupations by Sex
Within the Management, Business, Science and Arts occupations in Knox borough, the most male-oriented occupations are Business & Financial (100.0%), Computers, Engineering & Science (100.0%), and Life, Physical & Social Science (100.0%), while the most female-oriented occupations are Education, Arts & Media (100.0%), Health Technologists (85.7%), and Management (66.7%).
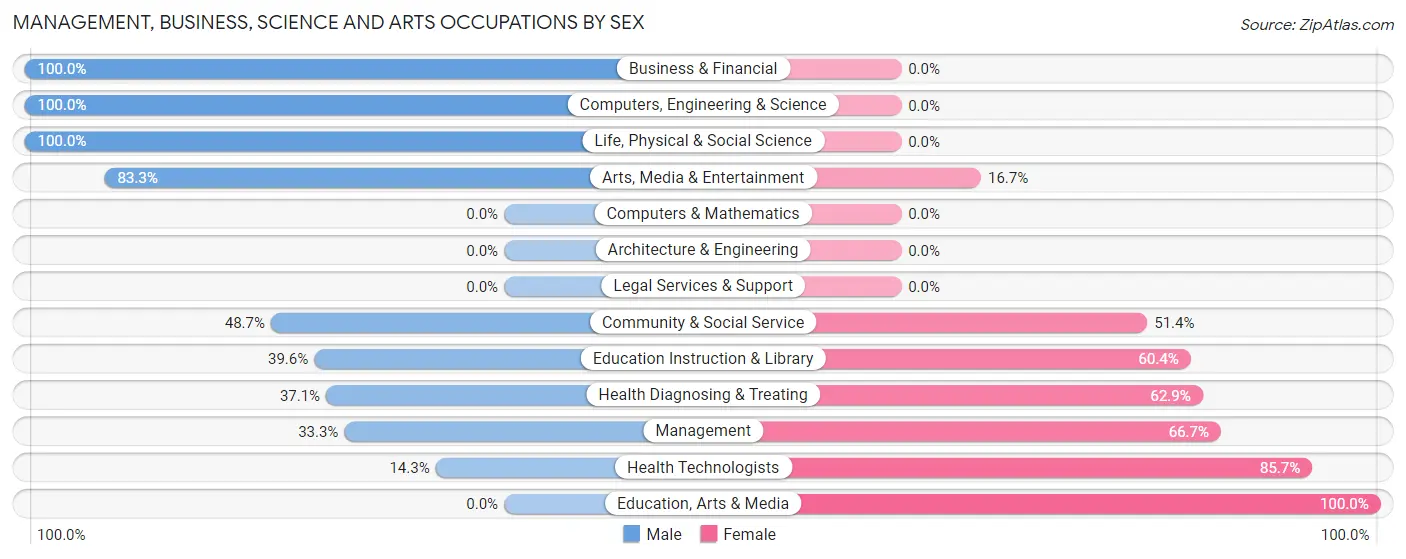
| Occupation | Male | Female |
| Management | 17 (33.3%) | 34 (66.7%) |
| Business & Financial | 8 (100.0%) | 0 (0.0%) |
| Computers, Engineering & Science | 2 (100.0%) | 0 (0.0%) |
| Computers & Mathematics | 0 (0.0%) | 0 (0.0%) |
| Architecture & Engineering | 0 (0.0%) | 0 (0.0%) |
| Life, Physical & Social Science | 2 (100.0%) | 0 (0.0%) |
| Community & Social Service | 36 (48.6%) | 38 (51.3%) |
| Education, Arts & Media | 0 (0.0%) | 3 (100.0%) |
| Legal Services & Support | 0 (0.0%) | 0 (0.0%) |
| Education Instruction & Library | 21 (39.6%) | 32 (60.4%) |
| Arts, Media & Entertainment | 15 (83.3%) | 3 (16.7%) |
| Health Diagnosing & Treating | 13 (37.1%) | 22 (62.9%) |
| Health Technologists | 3 (14.3%) | 18 (85.7%) |
| Total (Category) | 76 (44.7%) | 94 (55.3%) |
| Total (Overall) | 235 (51.5%) | 221 (48.5%) |
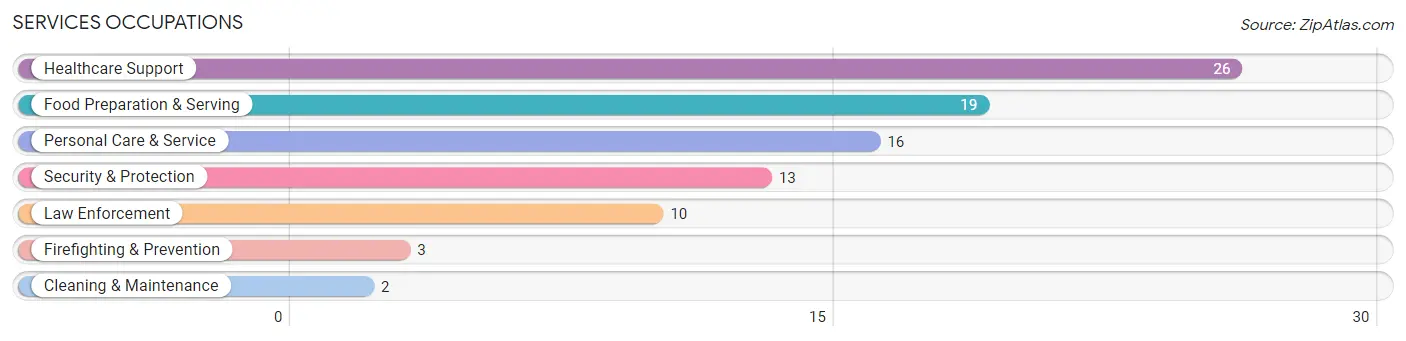
Services Occupations
The most common Services occupations in Knox borough are Healthcare Support (26 | 5.7%), Food Preparation & Serving (19 | 4.2%), Personal Care & Service (16 | 3.5%), Security & Protection (13 | 2.9%), and Law Enforcement (10 | 2.2%).
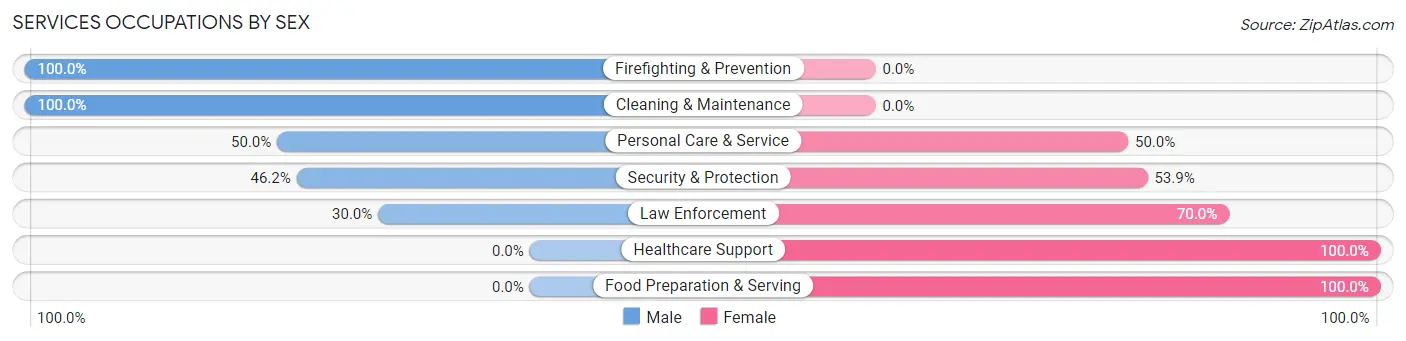
Services Occupations by Sex
Within the Services occupations in Knox borough, the most male-oriented occupations are Firefighting & Prevention (100.0%), Cleaning & Maintenance (100.0%), and Personal Care & Service (50.0%), while the most female-oriented occupations are Healthcare Support (100.0%), Food Preparation & Serving (100.0%), and Law Enforcement (70.0%).
| Occupation | Male | Female |
| Healthcare Support | 0 (0.0%) | 26 (100.0%) |
| Security & Protection | 6 (46.2%) | 7 (53.8%) |
| Firefighting & Prevention | 3 (100.0%) | 0 (0.0%) |
| Law Enforcement | 3 (30.0%) | 7 (70.0%) |
| Food Preparation & Serving | 0 (0.0%) | 19 (100.0%) |
| Cleaning & Maintenance | 2 (100.0%) | 0 (0.0%) |
| Personal Care & Service | 8 (50.0%) | 8 (50.0%) |
| Total (Category) | 16 (21.0%) | 60 (78.9%) |
| Total (Overall) | 235 (51.5%) | 221 (48.5%) |
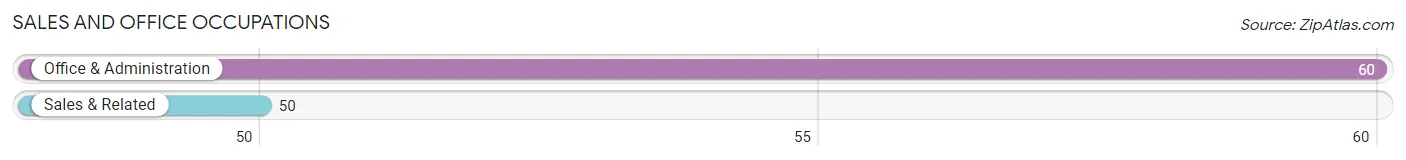
Sales and Office Occupations
The most common Sales and Office occupations in Knox borough are Office & Administration (60 | 13.2%), and Sales & Related (50 | 11.0%).
Sales and Office Occupations by Sex
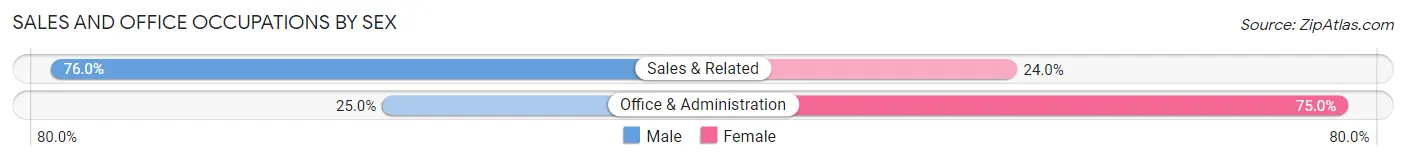
| Occupation | Male | Female |
| Sales & Related | 38 (76.0%) | 12 (24.0%) |
| Office & Administration | 15 (25.0%) | 45 (75.0%) |
| Total (Category) | 53 (48.2%) | 57 (51.8%) |
| Total (Overall) | 235 (51.5%) | 221 (48.5%) |
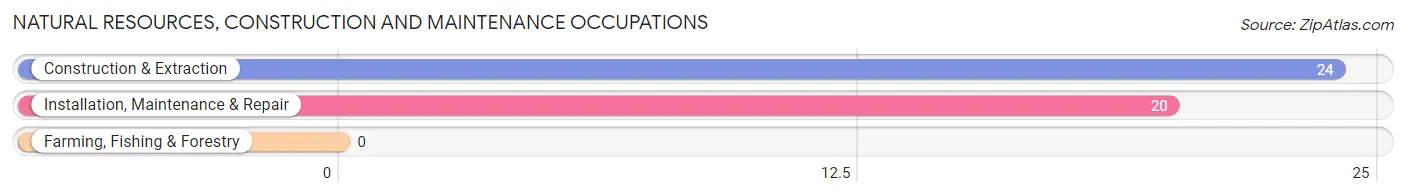
Natural Resources, Construction and Maintenance Occupations
The most common Natural Resources, Construction and Maintenance occupations in Knox borough are Construction & Extraction (24 | 5.3%), and Installation, Maintenance & Repair (20 | 4.4%).
Natural Resources, Construction and Maintenance Occupations by Sex
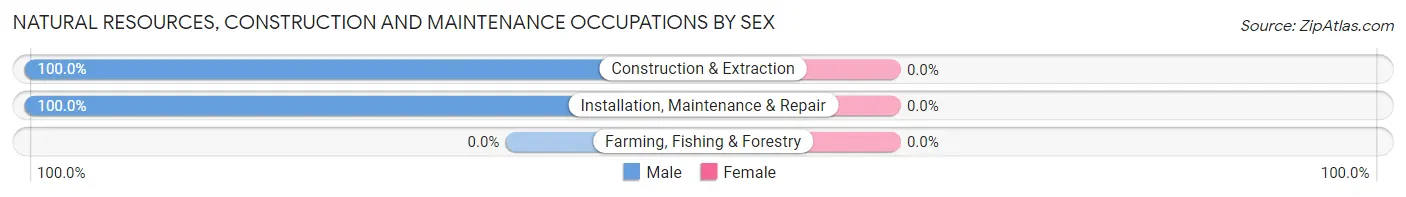
| Occupation | Male | Female |
| Farming, Fishing & Forestry | 0 (0.0%) | 0 (0.0%) |
| Construction & Extraction | 24 (100.0%) | 0 (0.0%) |
| Installation, Maintenance & Repair | 20 (100.0%) | 0 (0.0%) |
| Total (Category) | 44 (100.0%) | 0 (0.0%) |
| Total (Overall) | 235 (51.5%) | 221 (48.5%) |
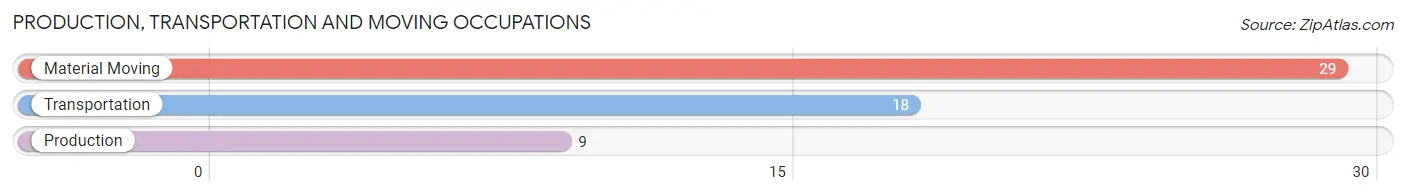
Production, Transportation and Moving Occupations
The most common Production, Transportation and Moving occupations in Knox borough are Material Moving (29 | 6.4%), Transportation (18 | 4.0%), and Production (9 | 2.0%).
Production, Transportation and Moving Occupations by Sex
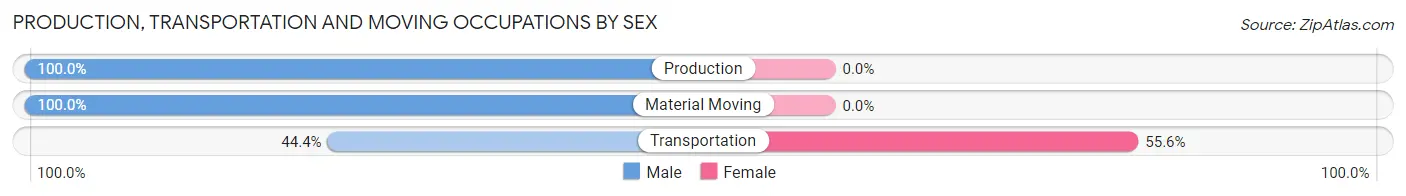
| Occupation | Male | Female |
| Production | 9 (100.0%) | 0 (0.0%) |
| Transportation | 8 (44.4%) | 10 (55.6%) |
| Material Moving | 29 (100.0%) | 0 (0.0%) |
| Total (Category) | 46 (82.1%) | 10 (17.9%) |
| Total (Overall) | 235 (51.5%) | 221 (48.5%) |
Employment Industries by Sex in Knox borough
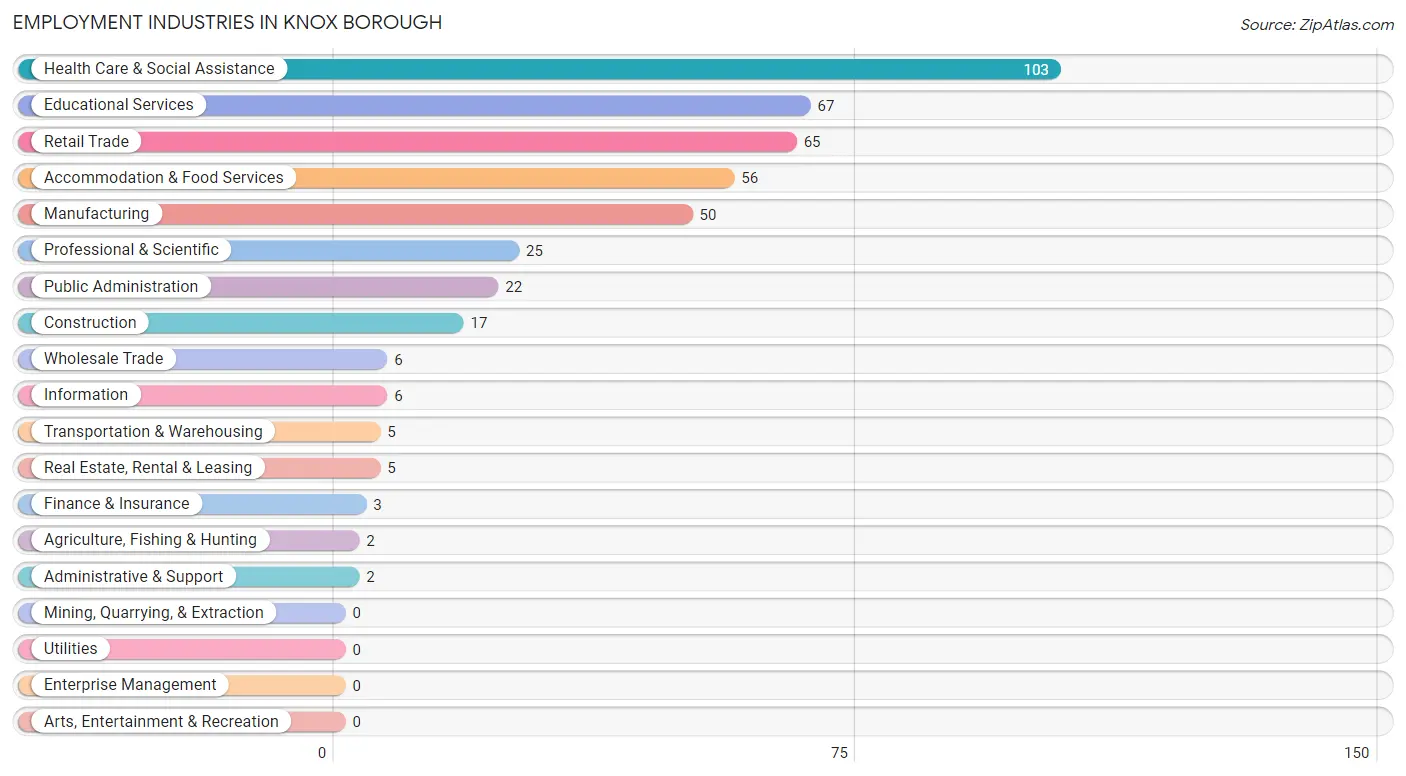
Employment Industries in Knox borough
The major employment industries in Knox borough include Health Care & Social Assistance (103 | 22.6%), Educational Services (67 | 14.7%), Retail Trade (65 | 14.2%), Accommodation & Food Services (56 | 12.3%), and Manufacturing (50 | 11.0%).
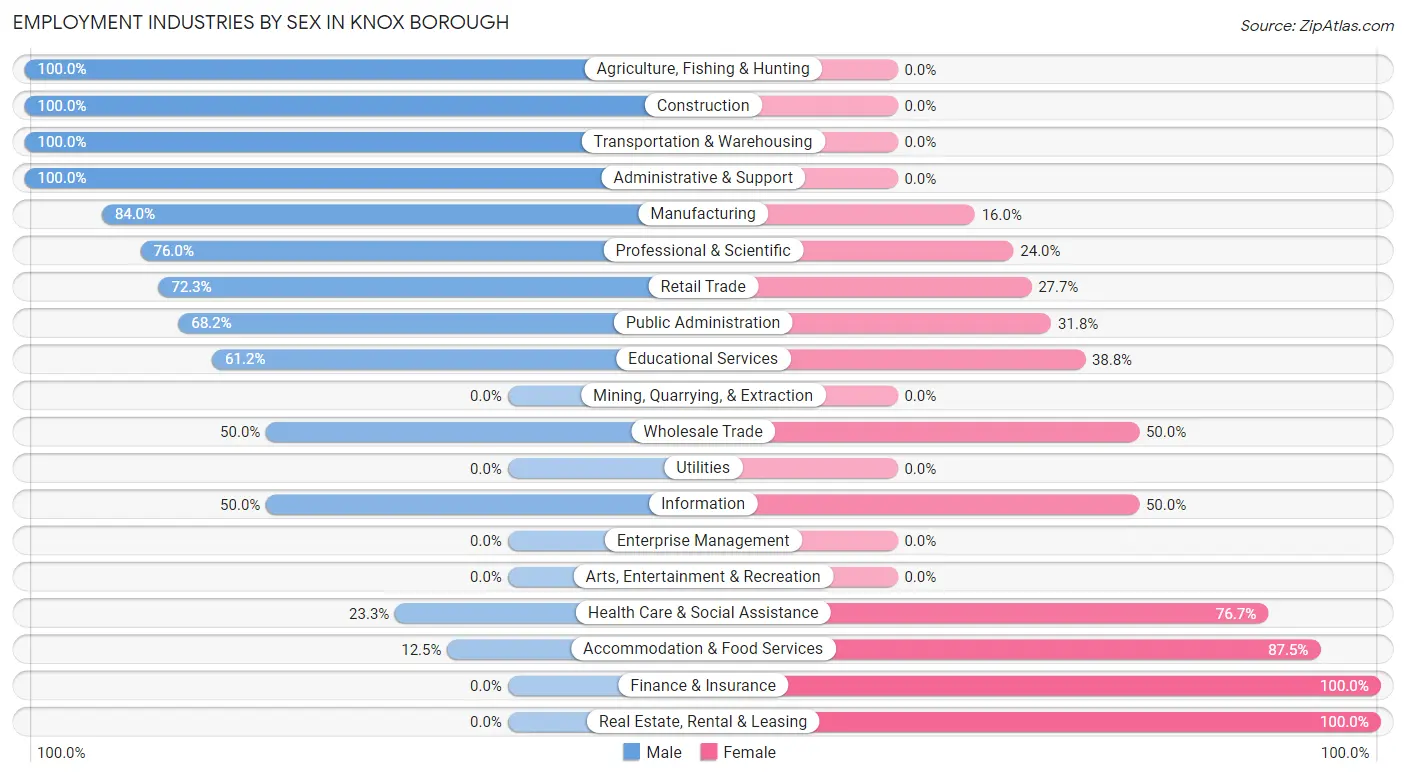
Employment Industries by Sex in Knox borough
The Knox borough industries that see more men than women are Agriculture, Fishing & Hunting (100.0%), Construction (100.0%), and Transportation & Warehousing (100.0%), whereas the industries that tend to have a higher number of women are Finance & Insurance (100.0%), Real Estate, Rental & Leasing (100.0%), and Accommodation & Food Services (87.5%).
| Industry | Male | Female |
| Agriculture, Fishing & Hunting | 2 (100.0%) | 0 (0.0%) |
| Mining, Quarrying, & Extraction | 0 (0.0%) | 0 (0.0%) |
| Construction | 17 (100.0%) | 0 (0.0%) |
| Manufacturing | 42 (84.0%) | 8 (16.0%) |
| Wholesale Trade | 3 (50.0%) | 3 (50.0%) |
| Retail Trade | 47 (72.3%) | 18 (27.7%) |
| Transportation & Warehousing | 5 (100.0%) | 0 (0.0%) |
| Utilities | 0 (0.0%) | 0 (0.0%) |
| Information | 3 (50.0%) | 3 (50.0%) |
| Finance & Insurance | 0 (0.0%) | 3 (100.0%) |
| Real Estate, Rental & Leasing | 0 (0.0%) | 5 (100.0%) |
| Professional & Scientific | 19 (76.0%) | 6 (24.0%) |
| Enterprise Management | 0 (0.0%) | 0 (0.0%) |
| Administrative & Support | 2 (100.0%) | 0 (0.0%) |
| Educational Services | 41 (61.2%) | 26 (38.8%) |
| Health Care & Social Assistance | 24 (23.3%) | 79 (76.7%) |
| Arts, Entertainment & Recreation | 0 (0.0%) | 0 (0.0%) |
| Accommodation & Food Services | 7 (12.5%) | 49 (87.5%) |
| Public Administration | 15 (68.2%) | 7 (31.8%) |
| Total | 235 (51.5%) | 221 (48.5%) |
Education in Knox borough
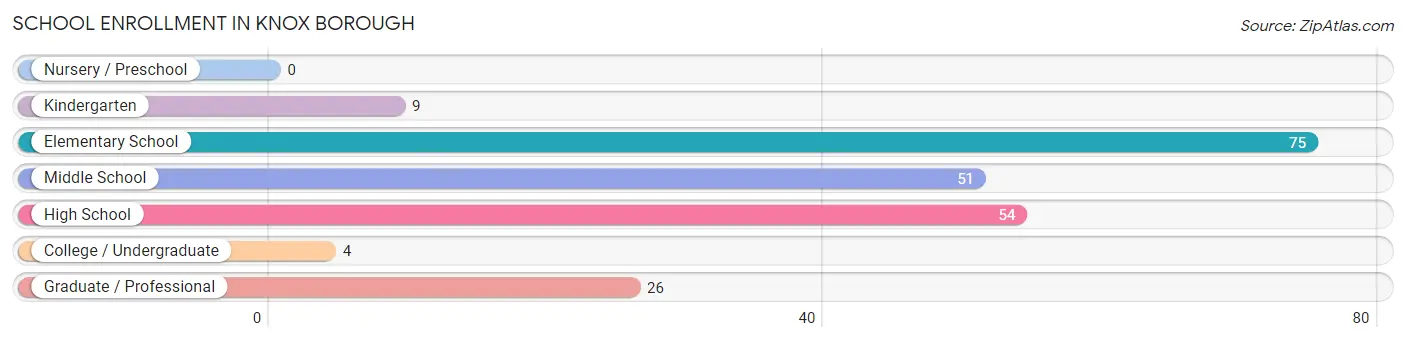
School Enrollment in Knox borough
The most common levels of schooling among the 219 students in Knox borough are elementary school (75 | 34.3%), high school (54 | 24.7%), and middle school (51 | 23.3%).
| School Level | # Students | % Students |
| Nursery / Preschool | 0 | 0.0% |
| Kindergarten | 9 | 4.1% |
| Elementary School | 75 | 34.3% |
| Middle School | 51 | 23.3% |
| High School | 54 | 24.7% |
| College / Undergraduate | 4 | 1.8% |
| Graduate / Professional | 26 | 11.9% |
| Total | 219 | 100.0% |
School Enrollment by Age by Funding Source in Knox borough
Out of a total of 219 students who are enrolled in schools in Knox borough, 31 (14.2%) attend a private institution, while the remaining 188 (85.8%) are enrolled in public schools. The age group of 35 years and over has the highest likelihood of being enrolled in private schools, with 14 (58.3% in the age bracket) enrolled. Conversely, the age group of 5 to 9 year old has the lowest likelihood of being enrolled in a private school, with 74 (100.0% in the age bracket) attending a public institution.
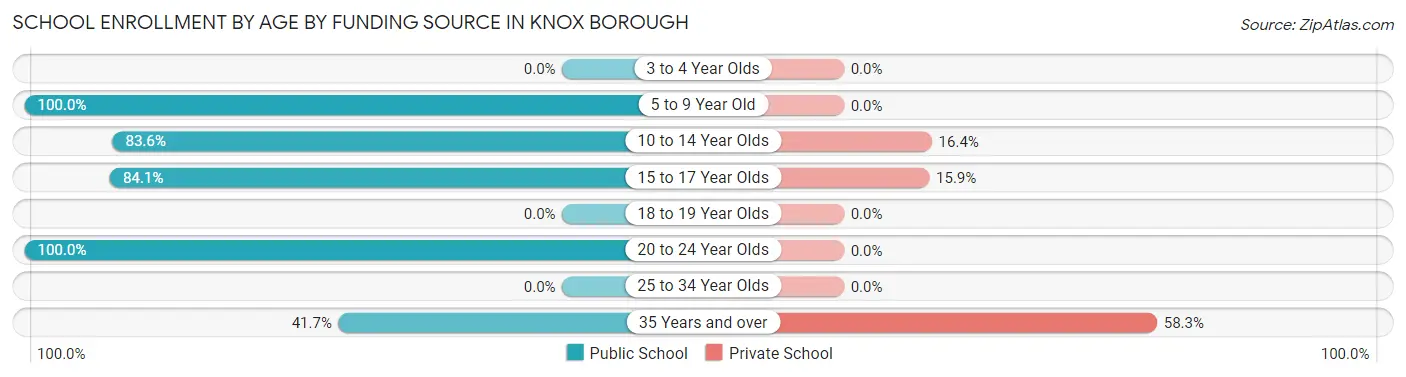
| Age Bracket | Public School | Private School |
| 3 to 4 Year Olds | 0 (0.0%) | 0 (0.0%) |
| 5 to 9 Year Old | 74 (100.0%) | 0 (0.0%) |
| 10 to 14 Year Olds | 51 (83.6%) | 10 (16.4%) |
| 15 to 17 Year Olds | 37 (84.1%) | 7 (15.9%) |
| 18 to 19 Year Olds | 0 (0.0%) | 0 (0.0%) |
| 20 to 24 Year Olds | 16 (100.0%) | 0 (0.0%) |
| 25 to 34 Year Olds | 0 (0.0%) | 0 (0.0%) |
| 35 Years and over | 10 (41.7%) | 14 (58.3%) |
| Total | 188 (85.8%) | 31 (14.2%) |
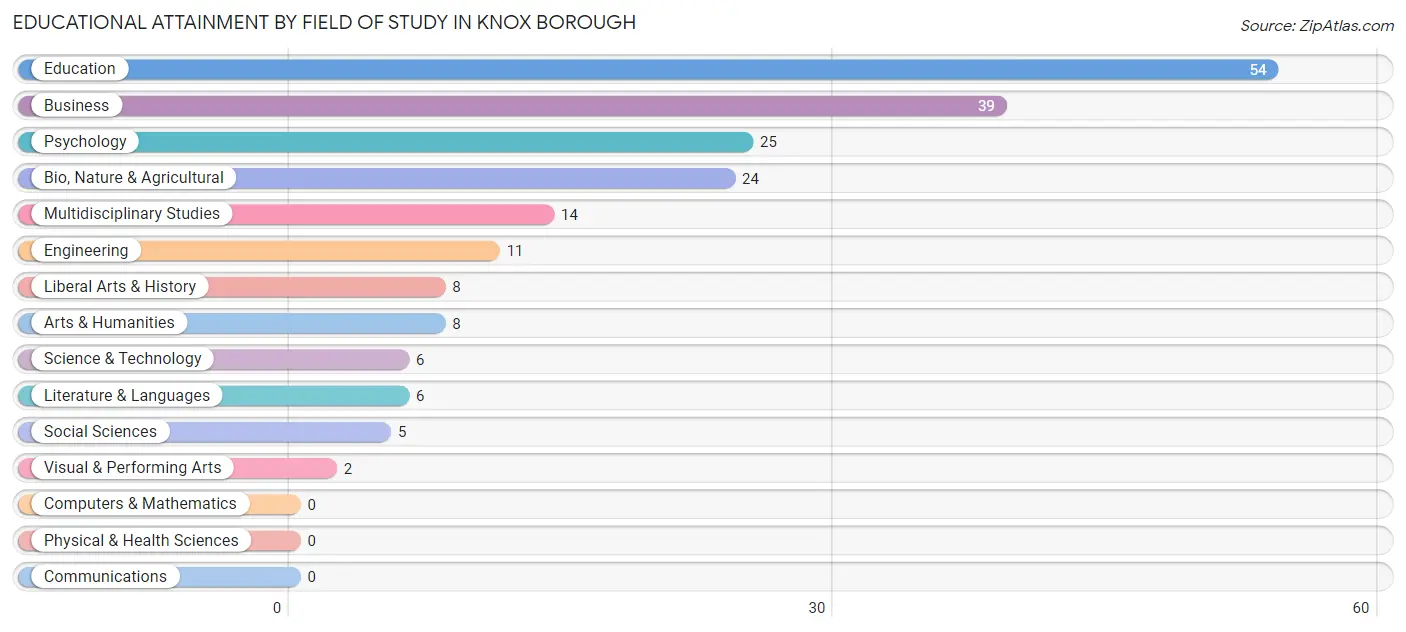
Educational Attainment by Field of Study in Knox borough
Education (54 | 26.7%), business (39 | 19.3%), psychology (25 | 12.4%), bio, nature & agricultural (24 | 11.9%), and multidisciplinary studies (14 | 6.9%) are the most common fields of study among 202 individuals in Knox borough who have obtained a bachelor's degree or higher.
| Field of Study | # Graduates | % Graduates |
| Computers & Mathematics | 0 | 0.0% |
| Bio, Nature & Agricultural | 24 | 11.9% |
| Physical & Health Sciences | 0 | 0.0% |
| Psychology | 25 | 12.4% |
| Social Sciences | 5 | 2.5% |
| Engineering | 11 | 5.4% |
| Multidisciplinary Studies | 14 | 6.9% |
| Science & Technology | 6 | 3.0% |
| Business | 39 | 19.3% |
| Education | 54 | 26.7% |
| Literature & Languages | 6 | 3.0% |
| Liberal Arts & History | 8 | 4.0% |
| Visual & Performing Arts | 2 | 1.0% |
| Communications | 0 | 0.0% |
| Arts & Humanities | 8 | 4.0% |
| Total | 202 | 100.0% |
Transportation & Commute in Knox borough
Vehicle Availability by Sex in Knox borough
The most prevalent vehicle ownership categories in Knox borough are males with 2 vehicles (125, accounting for 53.9%) and females with 2 vehicles (79, making up 56.6%).
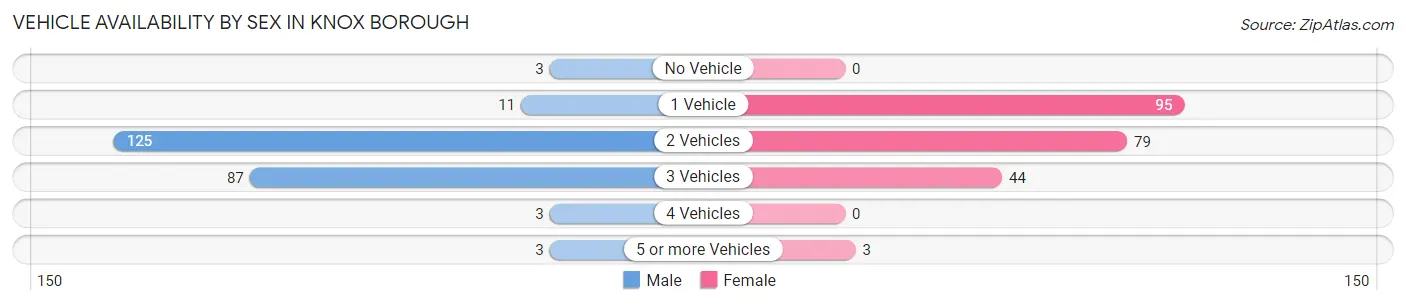
| Vehicles Available | Male | Female |
| No Vehicle | 3 (1.3%) | 0 (0.0%) |
| 1 Vehicle | 11 (4.7%) | 95 (43.0%) |
| 2 Vehicles | 125 (53.9%) | 79 (35.7%) |
| 3 Vehicles | 87 (37.5%) | 44 (19.9%) |
| 4 Vehicles | 3 (1.3%) | 0 (0.0%) |
| 5 or more Vehicles | 3 (1.3%) | 3 (1.4%) |
| Total | 232 (100.0%) | 221 (100.0%) |
Commute Time in Knox borough
The most frequently occuring commute durations in Knox borough are less than 5 minutes (95 commuters, 21.8%), 5 to 9 minutes (66 commuters, 15.2%), and 35 to 39 minutes (61 commuters, 14.0%).
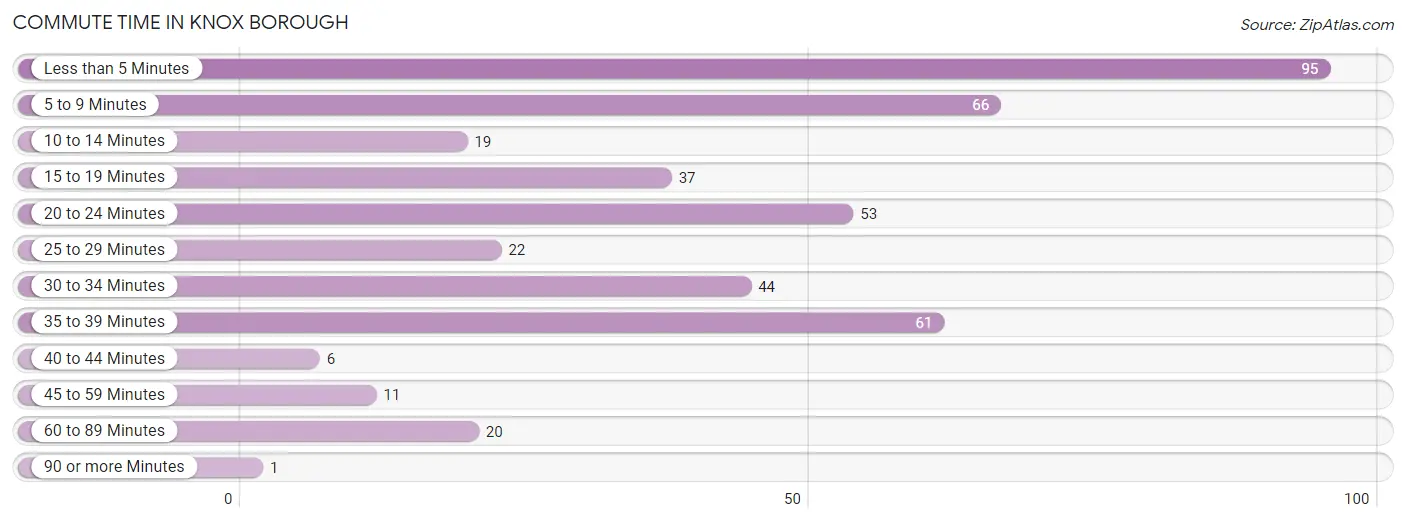
| Commute Time | # Commuters | % Commuters |
| Less than 5 Minutes | 95 | 21.8% |
| 5 to 9 Minutes | 66 | 15.2% |
| 10 to 14 Minutes | 19 | 4.4% |
| 15 to 19 Minutes | 37 | 8.5% |
| 20 to 24 Minutes | 53 | 12.2% |
| 25 to 29 Minutes | 22 | 5.1% |
| 30 to 34 Minutes | 44 | 10.1% |
| 35 to 39 Minutes | 61 | 14.0% |
| 40 to 44 Minutes | 6 | 1.4% |
| 45 to 59 Minutes | 11 | 2.5% |
| 60 to 89 Minutes | 20 | 4.6% |
| 90 or more Minutes | 1 | 0.2% |
Commute Time by Sex in Knox borough
The most common commute times in Knox borough are less than 5 minutes (58 commuters, 25.3%) for males and 35 to 39 minutes (42 commuters, 20.4%) for females.
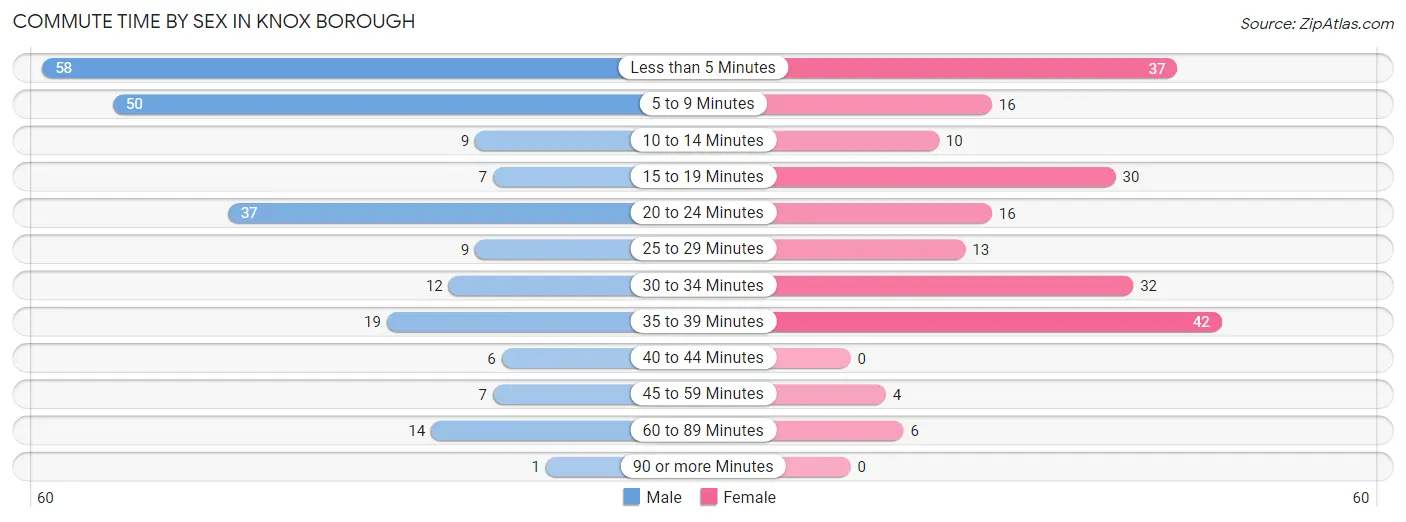
| Commute Time | Male | Female |
| Less than 5 Minutes | 58 (25.3%) | 37 (18.0%) |
| 5 to 9 Minutes | 50 (21.8%) | 16 (7.8%) |
| 10 to 14 Minutes | 9 (3.9%) | 10 (4.9%) |
| 15 to 19 Minutes | 7 (3.1%) | 30 (14.6%) |
| 20 to 24 Minutes | 37 (16.2%) | 16 (7.8%) |
| 25 to 29 Minutes | 9 (3.9%) | 13 (6.3%) |
| 30 to 34 Minutes | 12 (5.2%) | 32 (15.5%) |
| 35 to 39 Minutes | 19 (8.3%) | 42 (20.4%) |
| 40 to 44 Minutes | 6 (2.6%) | 0 (0.0%) |
| 45 to 59 Minutes | 7 (3.1%) | 4 (1.9%) |
| 60 to 89 Minutes | 14 (6.1%) | 6 (2.9%) |
| 90 or more Minutes | 1 (0.4%) | 0 (0.0%) |
Time of Departure to Work by Sex in Knox borough
The most frequent times of departure to work in Knox borough are 9:00 AM to 9:59 AM (52, 22.7%) for males and 8:00 AM to 8:29 AM (55, 26.7%) for females.
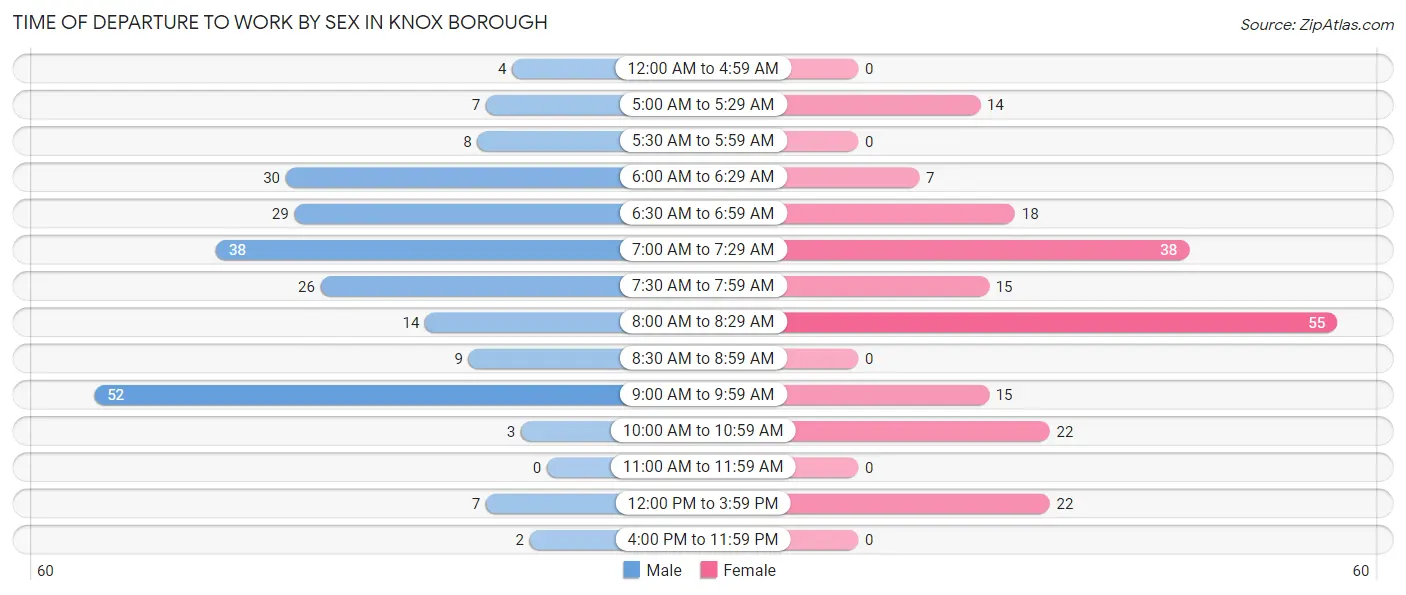
| Time of Departure | Male | Female |
| 12:00 AM to 4:59 AM | 4 (1.8%) | 0 (0.0%) |
| 5:00 AM to 5:29 AM | 7 (3.1%) | 14 (6.8%) |
| 5:30 AM to 5:59 AM | 8 (3.5%) | 0 (0.0%) |
| 6:00 AM to 6:29 AM | 30 (13.1%) | 7 (3.4%) |
| 6:30 AM to 6:59 AM | 29 (12.7%) | 18 (8.7%) |
| 7:00 AM to 7:29 AM | 38 (16.6%) | 38 (18.4%) |
| 7:30 AM to 7:59 AM | 26 (11.4%) | 15 (7.3%) |
| 8:00 AM to 8:29 AM | 14 (6.1%) | 55 (26.7%) |
| 8:30 AM to 8:59 AM | 9 (3.9%) | 0 (0.0%) |
| 9:00 AM to 9:59 AM | 52 (22.7%) | 15 (7.3%) |
| 10:00 AM to 10:59 AM | 3 (1.3%) | 22 (10.7%) |
| 11:00 AM to 11:59 AM | 0 (0.0%) | 0 (0.0%) |
| 12:00 PM to 3:59 PM | 7 (3.1%) | 22 (10.7%) |
| 4:00 PM to 11:59 PM | 2 (0.9%) | 0 (0.0%) |
| Total | 229 (100.0%) | 206 (100.0%) |
Housing Occupancy in Knox borough
Occupancy by Ownership in Knox borough
Of the total 453 dwellings in Knox borough, owner-occupied units account for 274 (60.5%), while renter-occupied units make up 179 (39.5%).
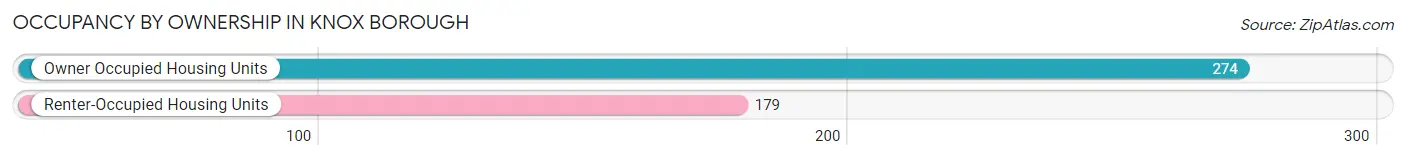
| Occupancy | # Housing Units | % Housing Units |
| Owner Occupied Housing Units | 274 | 60.5% |
| Renter-Occupied Housing Units | 179 | 39.5% |
| Total Occupied Housing Units | 453 | 100.0% |
Occupancy by Household Size in Knox borough
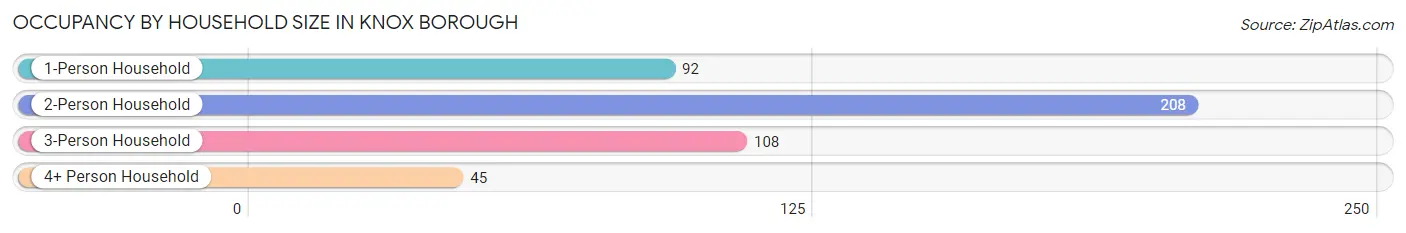
| Household Size | # Housing Units | % Housing Units |
| 1-Person Household | 92 | 20.3% |
| 2-Person Household | 208 | 45.9% |
| 3-Person Household | 108 | 23.8% |
| 4+ Person Household | 45 | 9.9% |
| Total Housing Units | 453 | 100.0% |
Occupancy by Ownership by Household Size in Knox borough
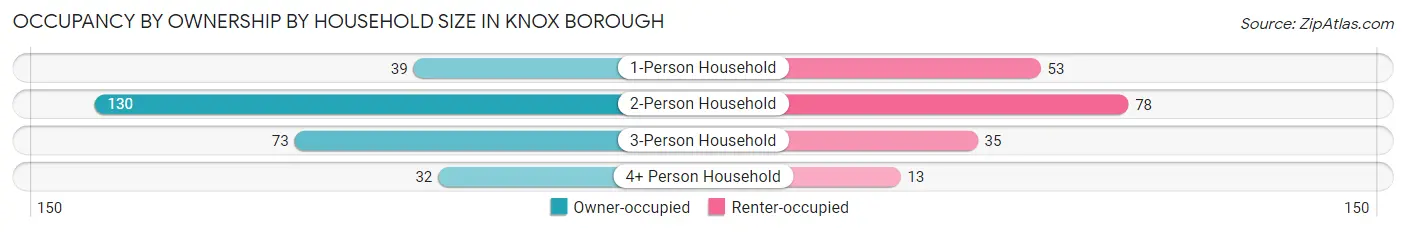
| Household Size | Owner-occupied | Renter-occupied |
| 1-Person Household | 39 (42.4%) | 53 (57.6%) |
| 2-Person Household | 130 (62.5%) | 78 (37.5%) |
| 3-Person Household | 73 (67.6%) | 35 (32.4%) |
| 4+ Person Household | 32 (71.1%) | 13 (28.9%) |
| Total Housing Units | 274 (60.5%) | 179 (39.5%) |
Occupancy by Educational Attainment in Knox borough
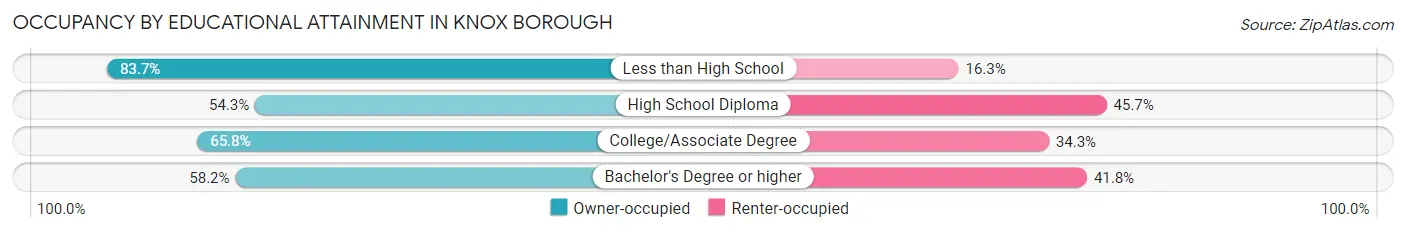
| Household Size | Owner-occupied | Renter-occupied |
| Less than High School | 41 (83.7%) | 8 (16.3%) |
| High School Diploma | 107 (54.3%) | 90 (45.7%) |
| College/Associate Degree | 48 (65.7%) | 25 (34.3%) |
| Bachelor's Degree or higher | 78 (58.2%) | 56 (41.8%) |
Occupancy by Age of Householder in Knox borough
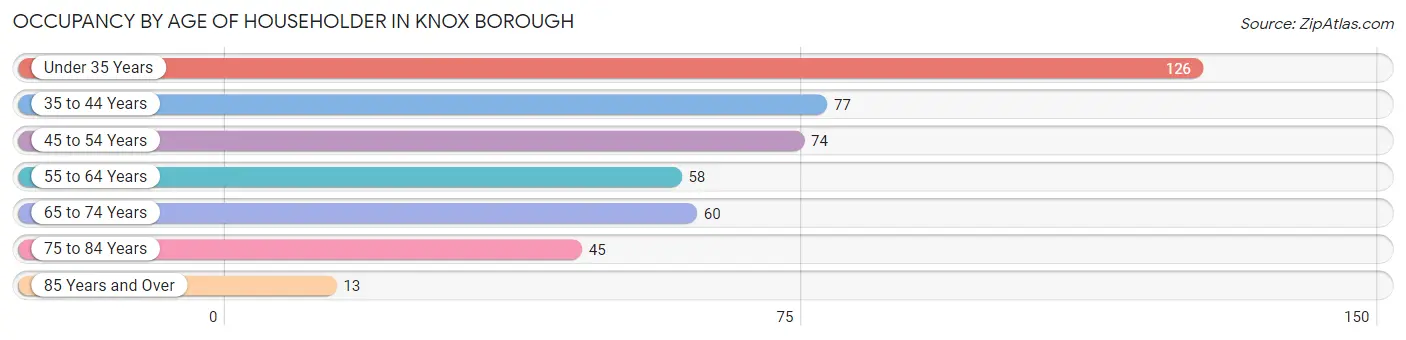
| Age Bracket | # Households | % Households |
| Under 35 Years | 126 | 27.8% |
| 35 to 44 Years | 77 | 17.0% |
| 45 to 54 Years | 74 | 16.3% |
| 55 to 64 Years | 58 | 12.8% |
| 65 to 74 Years | 60 | 13.3% |
| 75 to 84 Years | 45 | 9.9% |
| 85 Years and Over | 13 | 2.9% |
| Total | 453 | 100.0% |
Housing Finances in Knox borough
Median Income by Occupancy in Knox borough
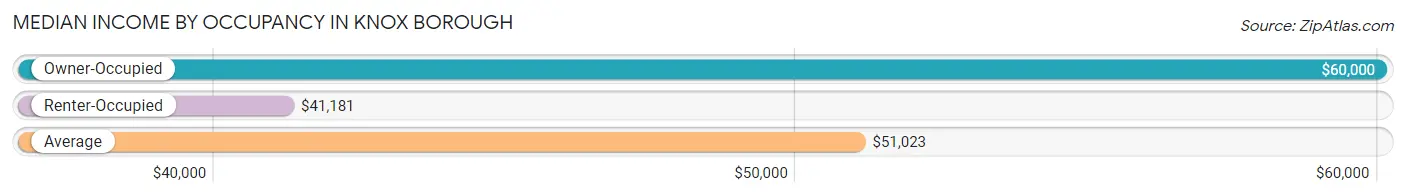
| Occupancy Type | # Households | Median Income |
| Owner-Occupied | 274 (60.5%) | $60,000 |
| Renter-Occupied | 179 (39.5%) | $41,181 |
| Average | 453 (100.0%) | $51,023 |
Occupancy by Householder Income Bracket in Knox borough
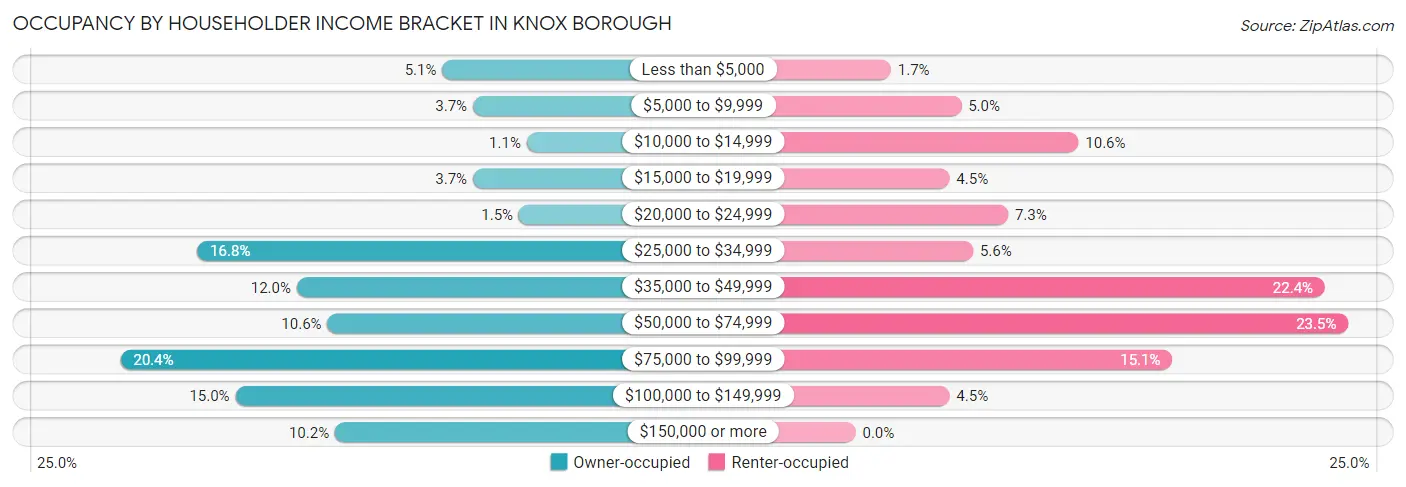
| Income Bracket | Owner-occupied | Renter-occupied |
| Less than $5,000 | 14 (5.1%) | 3 (1.7%) |
| $5,000 to $9,999 | 10 (3.6%) | 9 (5.0%) |
| $10,000 to $14,999 | 3 (1.1%) | 19 (10.6%) |
| $15,000 to $19,999 | 10 (3.6%) | 8 (4.5%) |
| $20,000 to $24,999 | 4 (1.5%) | 13 (7.3%) |
| $25,000 to $34,999 | 46 (16.8%) | 10 (5.6%) |
| $35,000 to $49,999 | 33 (12.0%) | 40 (22.4%) |
| $50,000 to $74,999 | 29 (10.6%) | 42 (23.5%) |
| $75,000 to $99,999 | 56 (20.4%) | 27 (15.1%) |
| $100,000 to $149,999 | 41 (15.0%) | 8 (4.5%) |
| $150,000 or more | 28 (10.2%) | 0 (0.0%) |
| Total | 274 (100.0%) | 179 (100.0%) |
Monthly Housing Cost Tiers in Knox borough
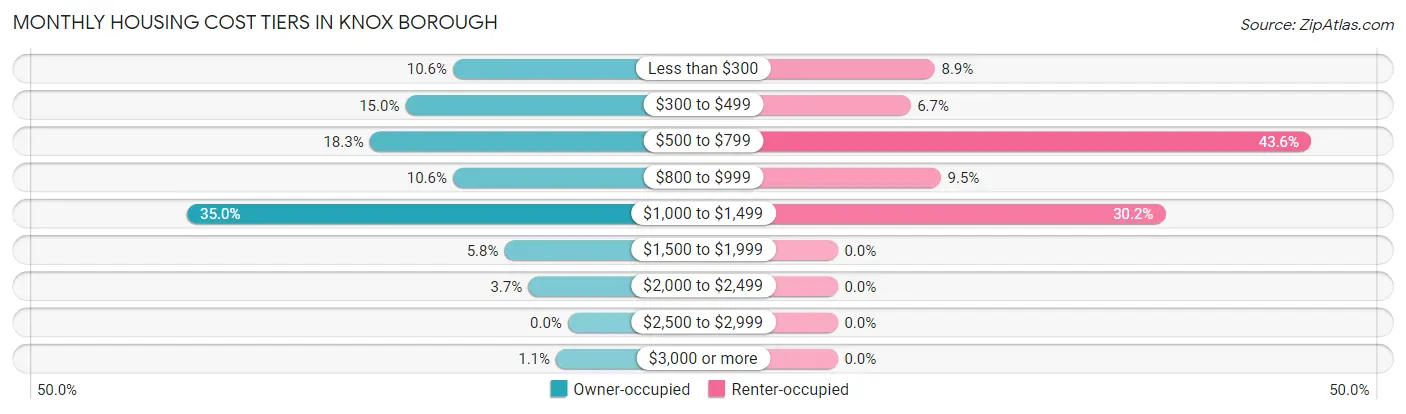
| Monthly Cost | Owner-occupied | Renter-occupied |
| Less than $300 | 29 (10.6%) | 16 (8.9%) |
| $300 to $499 | 41 (15.0%) | 12 (6.7%) |
| $500 to $799 | 50 (18.2%) | 78 (43.6%) |
| $800 to $999 | 29 (10.6%) | 17 (9.5%) |
| $1,000 to $1,499 | 96 (35.0%) | 54 (30.2%) |
| $1,500 to $1,999 | 16 (5.8%) | 0 (0.0%) |
| $2,000 to $2,499 | 10 (3.6%) | 0 (0.0%) |
| $2,500 to $2,999 | 0 (0.0%) | 0 (0.0%) |
| $3,000 or more | 3 (1.1%) | 0 (0.0%) |
| Total | 274 (100.0%) | 179 (100.0%) |
Physical Housing Characteristics in Knox borough
Housing Structures in Knox borough
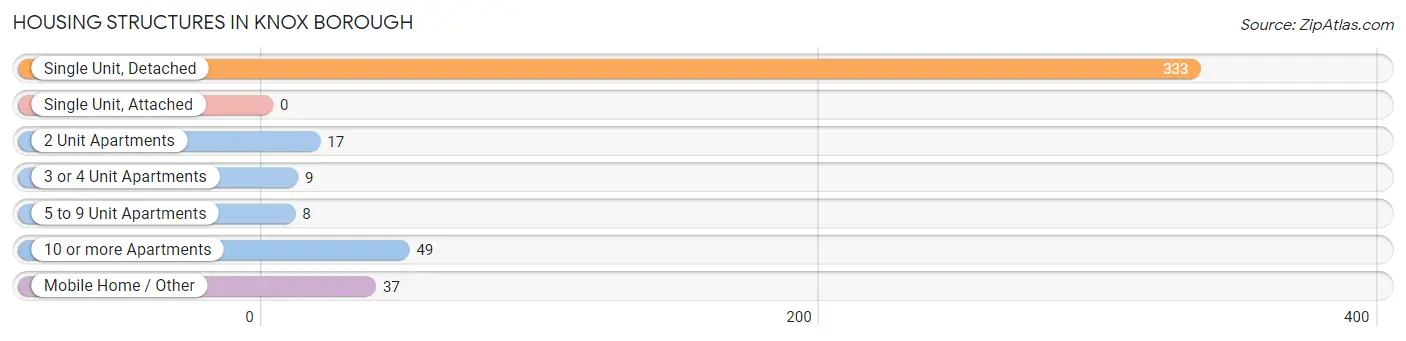
| Structure Type | # Housing Units | % Housing Units |
| Single Unit, Detached | 333 | 73.5% |
| Single Unit, Attached | 0 | 0.0% |
| 2 Unit Apartments | 17 | 3.7% |
| 3 or 4 Unit Apartments | 9 | 2.0% |
| 5 to 9 Unit Apartments | 8 | 1.8% |
| 10 or more Apartments | 49 | 10.8% |
| Mobile Home / Other | 37 | 8.2% |
| Total | 453 | 100.0% |
Housing Structures by Occupancy in Knox borough
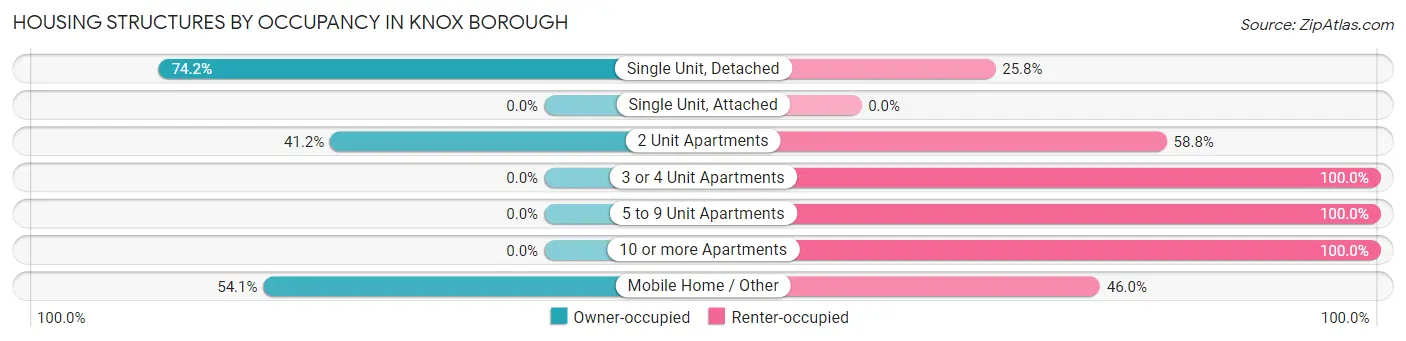
| Structure Type | Owner-occupied | Renter-occupied |
| Single Unit, Detached | 247 (74.2%) | 86 (25.8%) |
| Single Unit, Attached | 0 (0.0%) | 0 (0.0%) |
| 2 Unit Apartments | 7 (41.2%) | 10 (58.8%) |
| 3 or 4 Unit Apartments | 0 (0.0%) | 9 (100.0%) |
| 5 to 9 Unit Apartments | 0 (0.0%) | 8 (100.0%) |
| 10 or more Apartments | 0 (0.0%) | 49 (100.0%) |
| Mobile Home / Other | 20 (54.0%) | 17 (46.0%) |
| Total | 274 (60.5%) | 179 (39.5%) |
Housing Structures by Number of Rooms in Knox borough
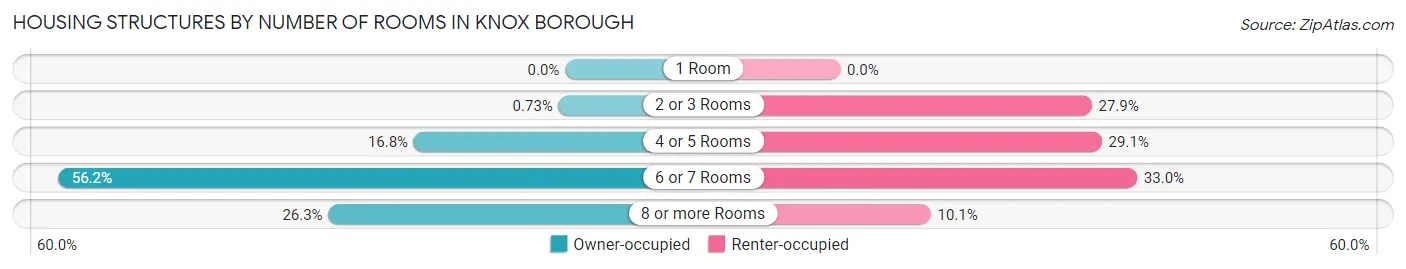
| Number of Rooms | Owner-occupied | Renter-occupied |
| 1 Room | 0 (0.0%) | 0 (0.0%) |
| 2 or 3 Rooms | 2 (0.7%) | 50 (27.9%) |
| 4 or 5 Rooms | 46 (16.8%) | 52 (29.0%) |
| 6 or 7 Rooms | 154 (56.2%) | 59 (33.0%) |
| 8 or more Rooms | 72 (26.3%) | 18 (10.1%) |
| Total | 274 (100.0%) | 179 (100.0%) |
Housing Structure by Heating Type in Knox borough
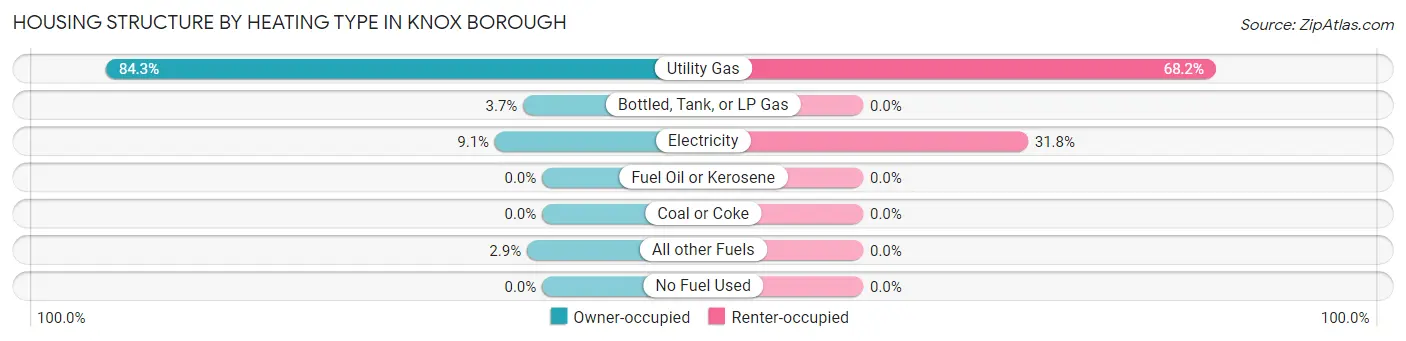
| Heating Type | Owner-occupied | Renter-occupied |
| Utility Gas | 231 (84.3%) | 122 (68.2%) |
| Bottled, Tank, or LP Gas | 10 (3.6%) | 0 (0.0%) |
| Electricity | 25 (9.1%) | 57 (31.8%) |
| Fuel Oil or Kerosene | 0 (0.0%) | 0 (0.0%) |
| Coal or Coke | 0 (0.0%) | 0 (0.0%) |
| All other Fuels | 8 (2.9%) | 0 (0.0%) |
| No Fuel Used | 0 (0.0%) | 0 (0.0%) |
| Total | 274 (100.0%) | 179 (100.0%) |
Household Vehicle Usage in Knox borough
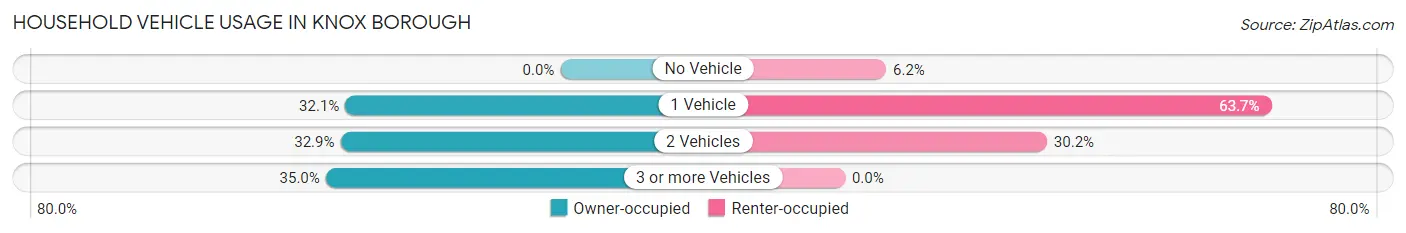
| Vehicles per Household | Owner-occupied | Renter-occupied |
| No Vehicle | 0 (0.0%) | 11 (6.1%) |
| 1 Vehicle | 88 (32.1%) | 114 (63.7%) |
| 2 Vehicles | 90 (32.9%) | 54 (30.2%) |
| 3 or more Vehicles | 96 (35.0%) | 0 (0.0%) |
| Total | 274 (100.0%) | 179 (100.0%) |
Real Estate & Mortgages in Knox borough
Real Estate and Mortgage Overview in Knox borough
| Characteristic | Without Mortgage | With Mortgage |
| Housing Units | 136 | 138 |
| Median Property Value | $138,500 | $115,600 |
| Median Household Income | $35,893 | $19 |
| Monthly Housing Costs | $493 | $3 |
| Real Estate Taxes | $1,182 | $0 |
Property Value by Mortgage Status in Knox borough
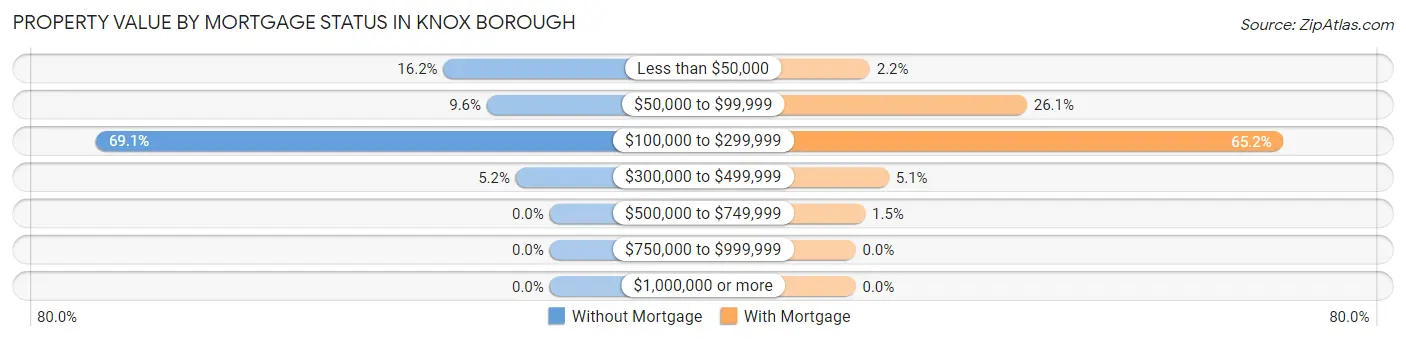
| Property Value | Without Mortgage | With Mortgage |
| Less than $50,000 | 22 (16.2%) | 3 (2.2%) |
| $50,000 to $99,999 | 13 (9.6%) | 36 (26.1%) |
| $100,000 to $299,999 | 94 (69.1%) | 90 (65.2%) |
| $300,000 to $499,999 | 7 (5.1%) | 7 (5.1%) |
| $500,000 to $749,999 | 0 (0.0%) | 2 (1.5%) |
| $750,000 to $999,999 | 0 (0.0%) | 0 (0.0%) |
| $1,000,000 or more | 0 (0.0%) | 0 (0.0%) |
| Total | 136 (100.0%) | 138 (100.0%) |
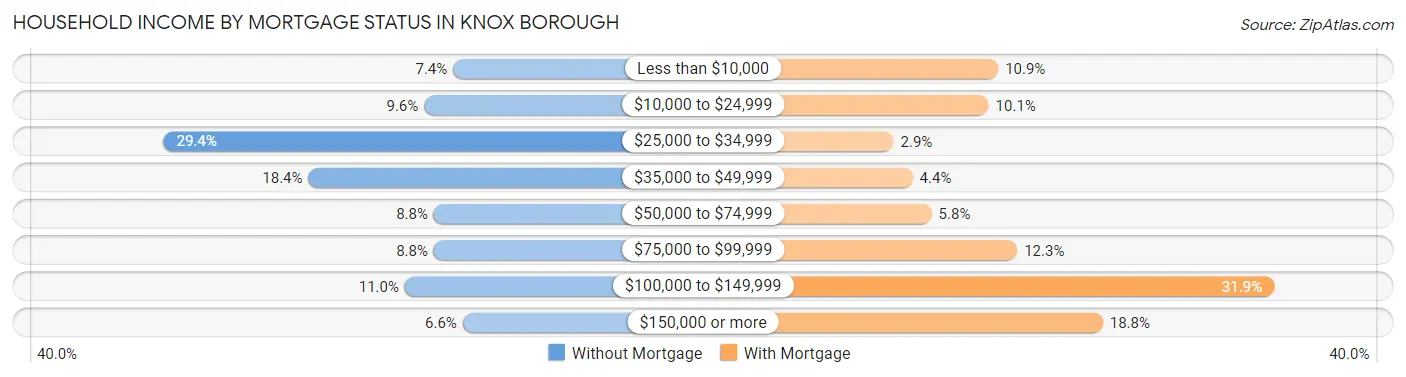
Household Income by Mortgage Status in Knox borough
| Household Income | Without Mortgage | With Mortgage |
| Less than $10,000 | 10 (7.3%) | 15 (10.9%) |
| $10,000 to $24,999 | 13 (9.6%) | 14 (10.1%) |
| $25,000 to $34,999 | 40 (29.4%) | 4 (2.9%) |
| $35,000 to $49,999 | 25 (18.4%) | 6 (4.3%) |
| $50,000 to $74,999 | 12 (8.8%) | 8 (5.8%) |
| $75,000 to $99,999 | 12 (8.8%) | 17 (12.3%) |
| $100,000 to $149,999 | 15 (11.0%) | 44 (31.9%) |
| $150,000 or more | 9 (6.6%) | 26 (18.8%) |
| Total | 136 (100.0%) | 138 (100.0%) |
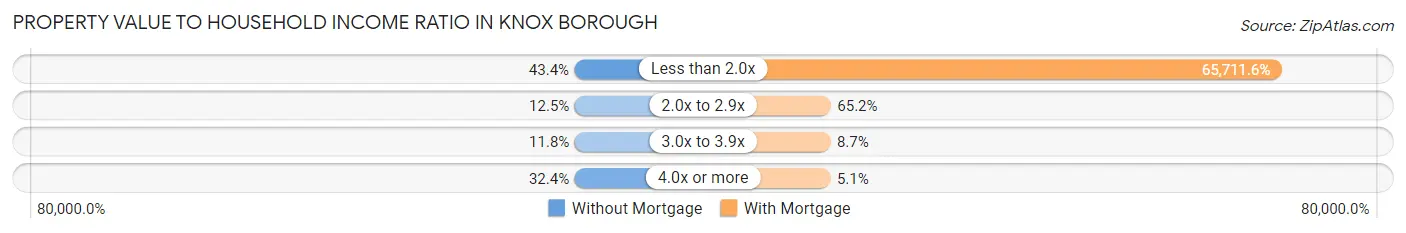
Property Value to Household Income Ratio in Knox borough
| Value-to-Income Ratio | Without Mortgage | With Mortgage |
| Less than 2.0x | 59 (43.4%) | 90,682 (65,711.6%) |
| 2.0x to 2.9x | 17 (12.5%) | 90 (65.2%) |
| 3.0x to 3.9x | 16 (11.8%) | 12 (8.7%) |
| 4.0x or more | 44 (32.4%) | 7 (5.1%) |
| Total | 136 (100.0%) | 138 (100.0%) |
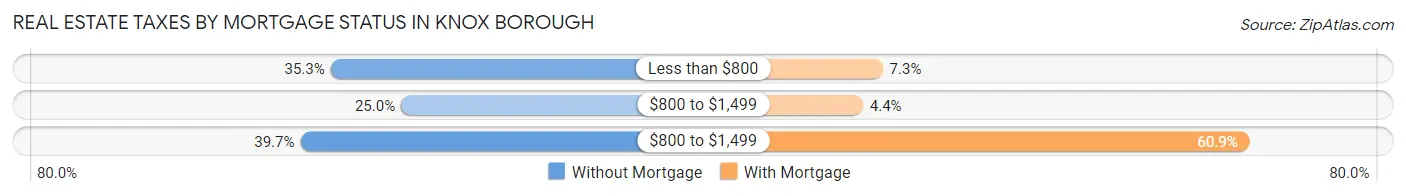
Real Estate Taxes by Mortgage Status in Knox borough
| Property Taxes | Without Mortgage | With Mortgage |
| Less than $800 | 48 (35.3%) | 10 (7.2%) |
| $800 to $1,499 | 34 (25.0%) | 6 (4.3%) |
| $800 to $1,499 | 54 (39.7%) | 84 (60.9%) |
| Total | 136 (100.0%) | 138 (100.0%) |
Health & Disability in Knox borough
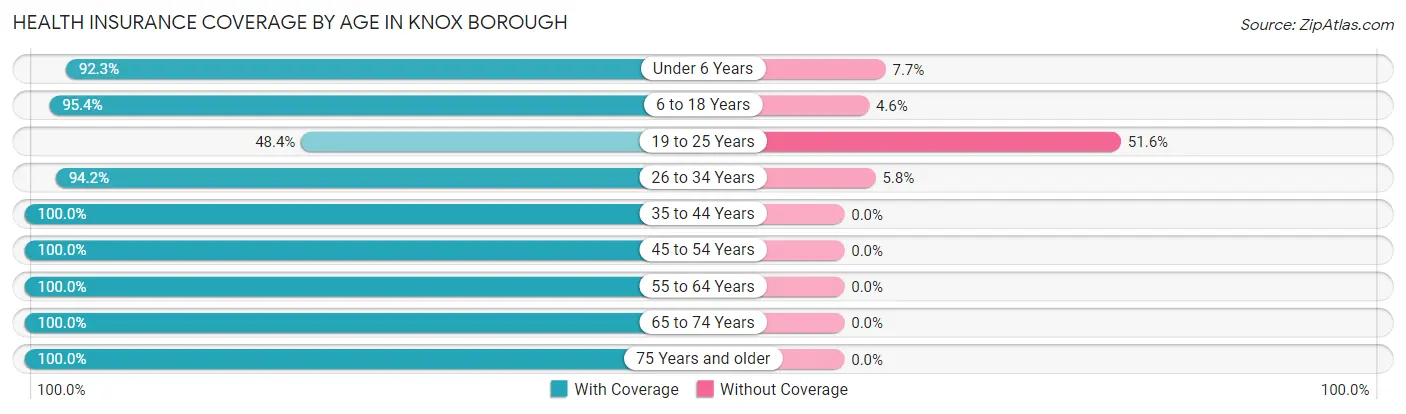
Health Insurance Coverage by Age in Knox borough
| Age Bracket | With Coverage | Without Coverage |
| Under 6 Years | 48 (92.3%) | 4 (7.7%) |
| 6 to 18 Years | 166 (95.4%) | 8 (4.6%) |
| 19 to 25 Years | 46 (48.4%) | 49 (51.6%) |
| 26 to 34 Years | 162 (94.2%) | 10 (5.8%) |
| 35 to 44 Years | 130 (100.0%) | 0 (0.0%) |
| 45 to 54 Years | 116 (100.0%) | 0 (0.0%) |
| 55 to 64 Years | 154 (100.0%) | 0 (0.0%) |
| 65 to 74 Years | 86 (100.0%) | 0 (0.0%) |
| 75 Years and older | 84 (100.0%) | 0 (0.0%) |
| Total | 992 (93.3%) | 71 (6.7%) |
Health Insurance Coverage by Citizenship Status in Knox borough
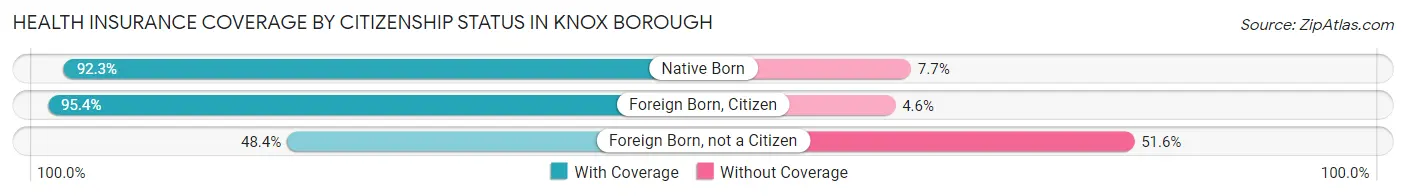
| Citizenship Status | With Coverage | Without Coverage |
| Native Born | 48 (92.3%) | 4 (7.7%) |
| Foreign Born, Citizen | 166 (95.4%) | 8 (4.6%) |
| Foreign Born, not a Citizen | 46 (48.4%) | 49 (51.6%) |
Health Insurance Coverage by Household Income in Knox borough

| Household Income | With Coverage | Without Coverage |
| Under $25,000 | 150 (91.5%) | 14 (8.5%) |
| $25,000 to $49,999 | 262 (94.9%) | 14 (5.1%) |
| $50,000 to $74,999 | 140 (93.3%) | 10 (6.7%) |
| $75,000 to $99,999 | 215 (86.7%) | 33 (13.3%) |
| $100,000 and over | 214 (100.0%) | 0 (0.0%) |
Public vs Private Health Insurance Coverage by Age in Knox borough
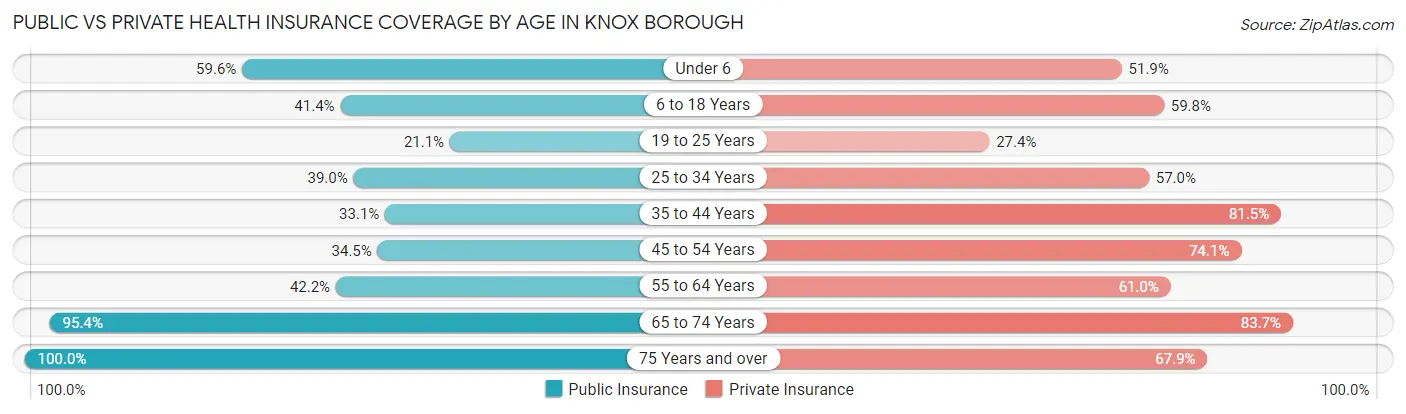
| Age Bracket | Public Insurance | Private Insurance |
| Under 6 | 31 (59.6%) | 27 (51.9%) |
| 6 to 18 Years | 72 (41.4%) | 104 (59.8%) |
| 19 to 25 Years | 20 (21.0%) | 26 (27.4%) |
| 25 to 34 Years | 67 (39.0%) | 98 (57.0%) |
| 35 to 44 Years | 43 (33.1%) | 106 (81.5%) |
| 45 to 54 Years | 40 (34.5%) | 86 (74.1%) |
| 55 to 64 Years | 65 (42.2%) | 94 (61.0%) |
| 65 to 74 Years | 82 (95.4%) | 72 (83.7%) |
| 75 Years and over | 84 (100.0%) | 57 (67.9%) |
| Total | 504 (47.4%) | 670 (63.0%) |
Disability Status by Sex by Age in Knox borough
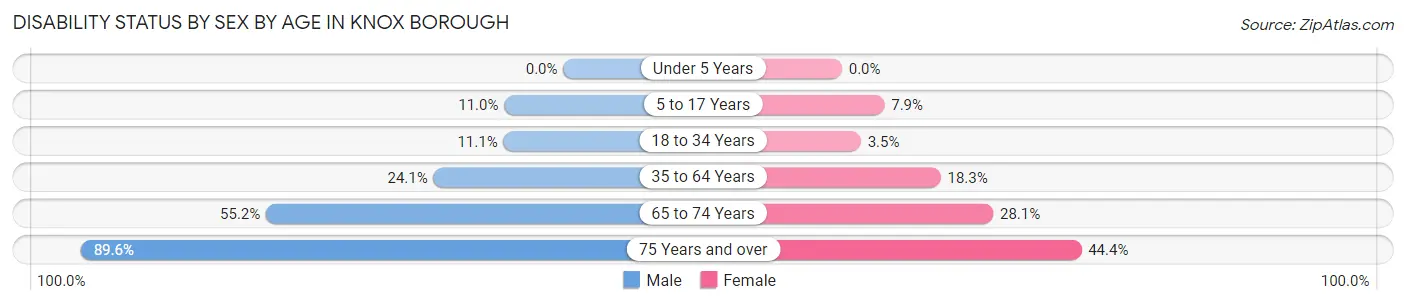
| Age Bracket | Male | Female |
| Under 5 Years | 0 (0.0%) | 0 (0.0%) |
| 5 to 17 Years | 8 (11.0%) | 9 (7.9%) |
| 18 to 34 Years | 17 (11.1%) | 4 (3.5%) |
| 35 to 64 Years | 53 (24.1%) | 33 (18.3%) |
| 65 to 74 Years | 16 (55.2%) | 16 (28.1%) |
| 75 Years and over | 43 (89.6%) | 16 (44.4%) |
Disability Class by Sex by Age in Knox borough
Disability Class: Hearing Difficulty
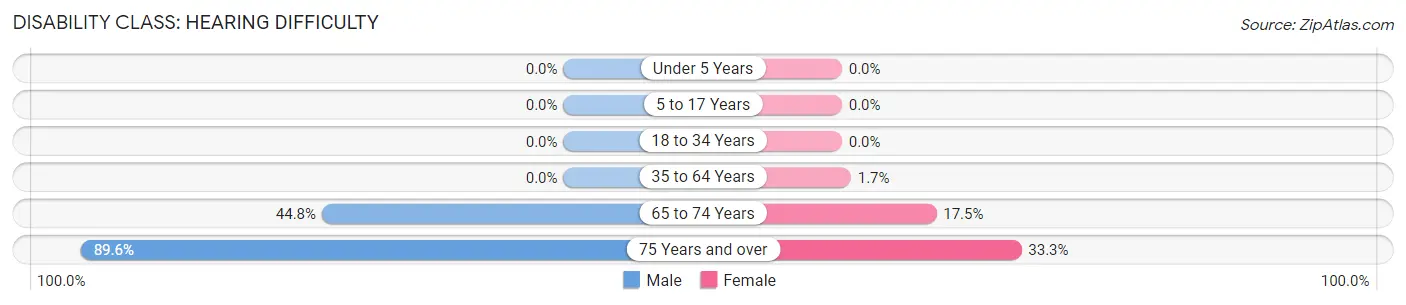
| Age Bracket | Male | Female |
| Under 5 Years | 0 (0.0%) | 0 (0.0%) |
| 5 to 17 Years | 0 (0.0%) | 0 (0.0%) |
| 18 to 34 Years | 0 (0.0%) | 0 (0.0%) |
| 35 to 64 Years | 0 (0.0%) | 3 (1.7%) |
| 65 to 74 Years | 13 (44.8%) | 10 (17.5%) |
| 75 Years and over | 43 (89.6%) | 12 (33.3%) |
Disability Class: Vision Difficulty
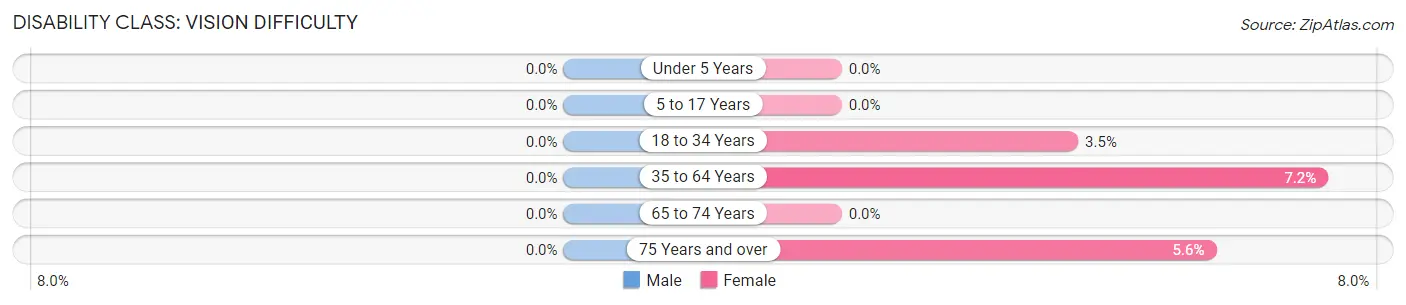
| Age Bracket | Male | Female |
| Under 5 Years | 0 (0.0%) | 0 (0.0%) |
| 5 to 17 Years | 0 (0.0%) | 0 (0.0%) |
| 18 to 34 Years | 0 (0.0%) | 4 (3.5%) |
| 35 to 64 Years | 0 (0.0%) | 13 (7.2%) |
| 65 to 74 Years | 0 (0.0%) | 0 (0.0%) |
| 75 Years and over | 0 (0.0%) | 2 (5.6%) |
Disability Class: Cognitive Difficulty
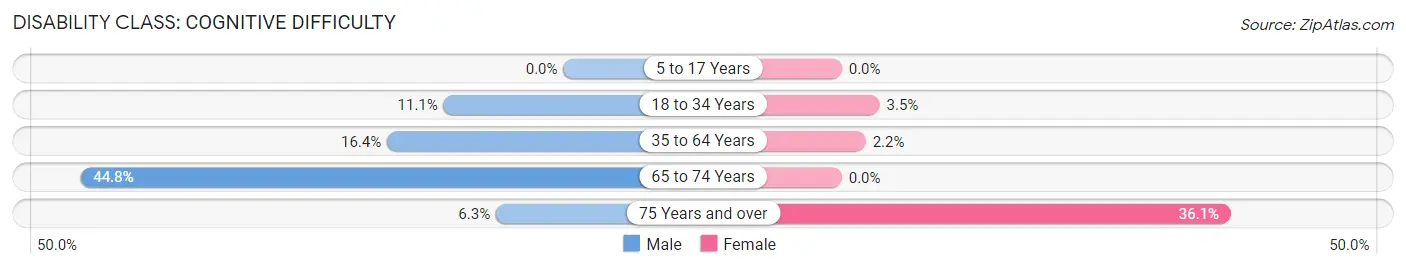
| Age Bracket | Male | Female |
| 5 to 17 Years | 0 (0.0%) | 0 (0.0%) |
| 18 to 34 Years | 17 (11.1%) | 4 (3.5%) |
| 35 to 64 Years | 36 (16.4%) | 4 (2.2%) |
| 65 to 74 Years | 13 (44.8%) | 0 (0.0%) |
| 75 Years and over | 3 (6.2%) | 13 (36.1%) |
Disability Class: Ambulatory Difficulty
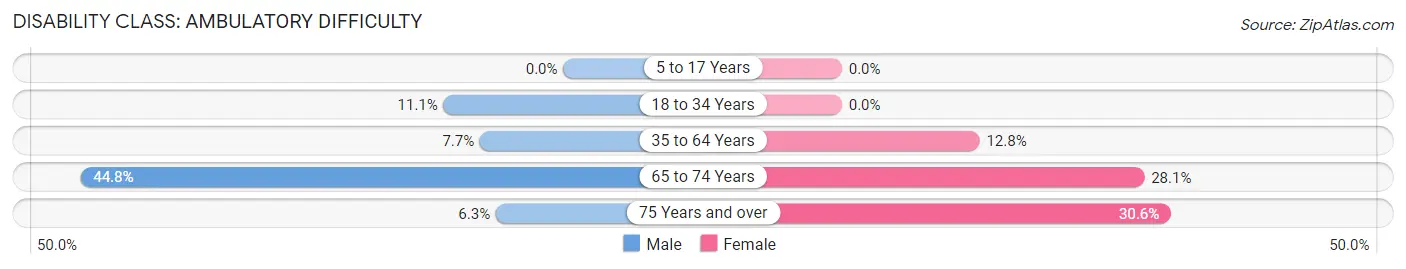
| Age Bracket | Male | Female |
| 5 to 17 Years | 0 (0.0%) | 0 (0.0%) |
| 18 to 34 Years | 17 (11.1%) | 0 (0.0%) |
| 35 to 64 Years | 17 (7.7%) | 23 (12.8%) |
| 65 to 74 Years | 13 (44.8%) | 16 (28.1%) |
| 75 Years and over | 3 (6.2%) | 11 (30.6%) |
Disability Class: Self-Care Difficulty
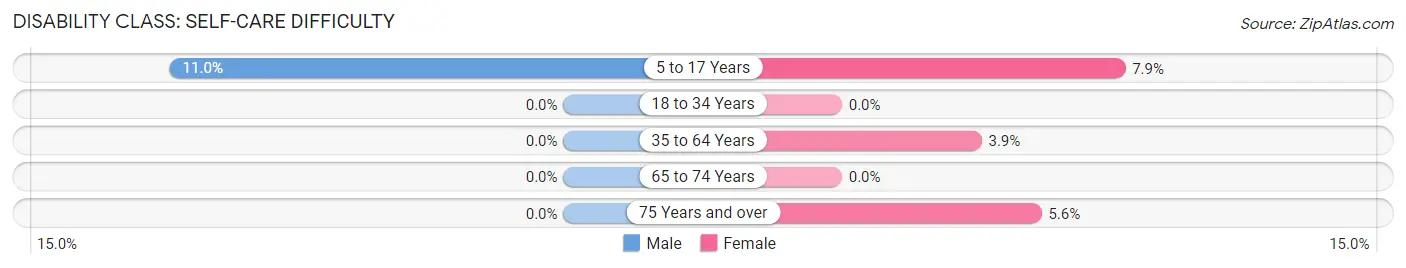
| Age Bracket | Male | Female |
| 5 to 17 Years | 8 (11.0%) | 9 (7.9%) |
| 18 to 34 Years | 0 (0.0%) | 0 (0.0%) |
| 35 to 64 Years | 0 (0.0%) | 7 (3.9%) |
| 65 to 74 Years | 0 (0.0%) | 0 (0.0%) |
| 75 Years and over | 0 (0.0%) | 2 (5.6%) |
Technology Access in Knox borough
Computing Device Access in Knox borough
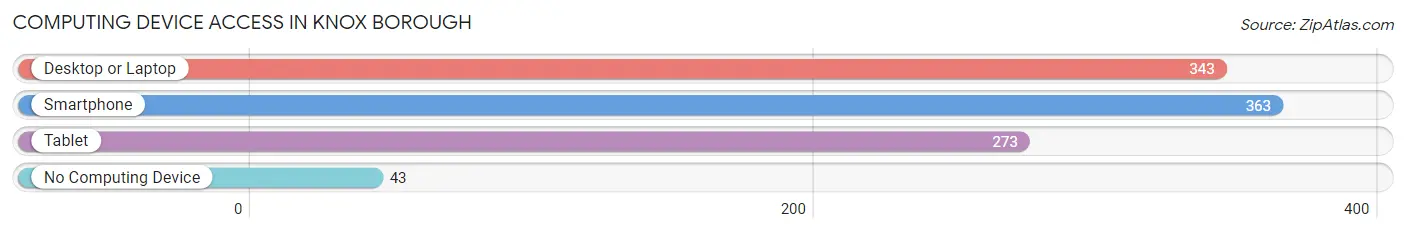
| Device Type | # Households | % Households |
| Desktop or Laptop | 343 | 75.7% |
| Smartphone | 363 | 80.1% |
| Tablet | 273 | 60.3% |
| No Computing Device | 43 | 9.5% |
| Total | 453 | 100.0% |
Internet Access in Knox borough

| Internet Type | # Households | % Households |
| Dial-Up Internet | 0 | 0.0% |
| Broadband Home | 303 | 66.9% |
| Cellular Data Only | 32 | 7.1% |
| Satellite Internet | 39 | 8.6% |
| No Internet | 97 | 21.4% |
| Total | 453 | 100.0% |
Knox borough Summary
Knox Borough is a small borough located in Clarion County, Pennsylvania. It is situated in the foothills of the Allegheny Mountains, approximately 50 miles northeast of Pittsburgh. The borough is home to a population of approximately 1,000 people, and is the county seat of Clarion County.
History
Knox Borough was founded in 1839 by a group of settlers from the nearby town of Knoxville. The settlers were looking for a place to settle and build a new community. The town was named after the nearby Knoxville, and was officially incorporated in 1845.
The town was originally a farming community, and the main industry was the production of lumber. The lumber industry was the main source of income for the town until the late 19th century, when the oil and gas industry began to take off in the area. The town was also home to a number of small businesses, including a general store, a blacksmith shop, and a hotel.
In the early 20th century, the town began to experience a period of growth and prosperity. The oil and gas industry continued to be a major source of income for the town, and the population began to grow. The town also began to attract new businesses, including a bank, a movie theater, and a number of other small businesses.
Geography
Knox Borough is located in the foothills of the Allegheny Mountains, approximately 50 miles northeast of Pittsburgh. The borough is situated in a valley, surrounded by hills and mountains. The borough is located in a rural area, and is home to a number of small farms and wooded areas.
The borough is located in Clarion County, and is bordered by the towns of Knoxville, Shippenville, and Sligo. The borough is also located near the Clarion River, which is a popular destination for fishing and other recreational activities.
Economy
The economy of Knox Borough is largely based on the oil and gas industry. The town is home to a number of oil and gas companies, and the industry is the main source of income for the town. The town is also home to a number of small businesses, including a general store, a bank, and a movie theater.
The town is also home to a number of small farms, and the production of dairy products is a major source of income for the town. The town is also home to a number of small manufacturing companies, and the production of furniture and other wood products is a major source of income for the town.
Demographics
As of the 2010 census, the population of Knox Borough was 1,000 people. The racial makeup of the town was 97.2% White, 0.7% African American, 0.2% Native American, 0.2% Asian, 0.2% from other races, and 1.7% from two or more races. Hispanic or Latino of any race were 0.7% of the population.
The median income for a household in the borough was $37,500, and the median income for a family was $45,000. The per capita income for the borough was $18,000. About 10.2% of families and 12.2% of the population were below the poverty line, including 16.7% of those under age 18 and 8.3% of those age 65 or over.
Conclusion
Knox Borough is a small borough located in Clarion County, Pennsylvania. It is situated in the foothills of the Allegheny Mountains, approximately 50 miles northeast of Pittsburgh. The borough is home to a population of approximately 1,000 people, and is the county seat of Clarion County. The economy of the town is largely based on the oil and gas industry, and the town is also home to a number of small businesses and farms. The racial makeup of the town is predominantly white, and the median income for a household is $37,500.
Common Questions
What is the Total Population of Knox borough?
Total Population of Knox borough is 1,063.
What is the Total Male Population of Knox borough?
Total Male Population of Knox borough is 547.
What is the Total Female Population of Knox borough?
Total Female Population of Knox borough is 516.
What is the Ratio of Males per 100 Females in Knox borough?
There are 106.01 Males per 100 Females in Knox borough.
What is the Ratio of Females per 100 Males in Knox borough?
There are 94.33 Females per 100 Males in Knox borough.
What is the Median Population Age in Knox borough?
Median Population Age in Knox borough is 38.7 Years.
What is the Average Family Size in Knox borough
Average Family Size in Knox borough is 2.5 People.
What is the Average Household Size in Knox borough
Average Household Size in Knox borough is 2.3 People.
What is Per Capita Income in Knox borough?
Per Capita income in Knox borough is $29,945.
What is the Median Family Income in Knox borough?
Median Family Income in Knox borough is $43,750.
What is the Median Household income in Knox borough?
Median Household Income in Knox borough is $51,023.
What is Income or Wage Gap in Knox borough?
Income or Wage Gap in Knox borough is 28.9%.
Women in Knox borough earn 71.1 cents for every dollar earned by a man.
What is Inequality or Gini Index in Knox borough?
Inequality or Gini Index in Knox borough is 0.46.
How Large is the Labor Force in Knox borough?
There are 515 People in the Labor Forcein in Knox borough.
What is the Percentage of People in the Labor Force in Knox borough?
60.7% of People are in the Labor Force in Knox borough.
What is the Unemployment Rate in Knox borough?
Unemployment Rate in Knox borough is 11.5%.