Brisbin borough, PA
Brisbin borough Overview
387
TOTAL POPULATION
188
MALE POPULATION
199
FEMALE POPULATION
94.47
MALES / 100 FEMALES
105.85
FEMALES / 100 MALES
50.9
MEDIAN AGE
2.6
AVG FAMILY SIZE
2.4
AVG HOUSEHOLD SIZE
$29,477
PER CAPITA INCOME
$60,833
AVG FAMILY INCOME
$55,833
AVG HOUSEHOLD INCOME
13.7%
WAGE / INCOME GAP [ % ]
86.3¢/ $1
WAGE / INCOME GAP [ $ ]
0.40
INEQUALITY / GINI INDEX
184
LABOR FORCE [ PEOPLE ]
54.9%
PERCENT IN LABOR FORCE
6.0%
UNEMPLOYMENT RATE
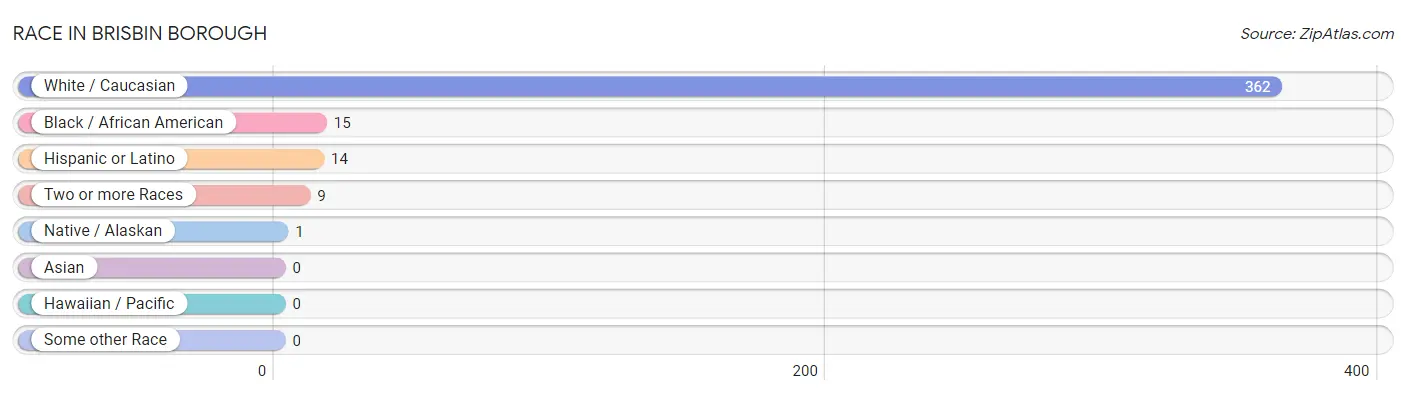
Race in Brisbin borough
The most populous races in Brisbin borough are White / Caucasian (362 | 93.5%), Black / African American (15 | 3.9%), and Hispanic or Latino (14 | 3.6%).
| Race | # Population | % Population |
| Asian | 0 | 0.0% |
| Black / African American | 15 | 3.9% |
| Hawaiian / Pacific | 0 | 0.0% |
| Hispanic or Latino | 14 | 3.6% |
| Native / Alaskan | 1 | 0.3% |
| White / Caucasian | 362 | 93.5% |
| Two or more Races | 9 | 2.3% |
| Some other Race | 0 | 0.0% |
| Total | 387 | 100.0% |
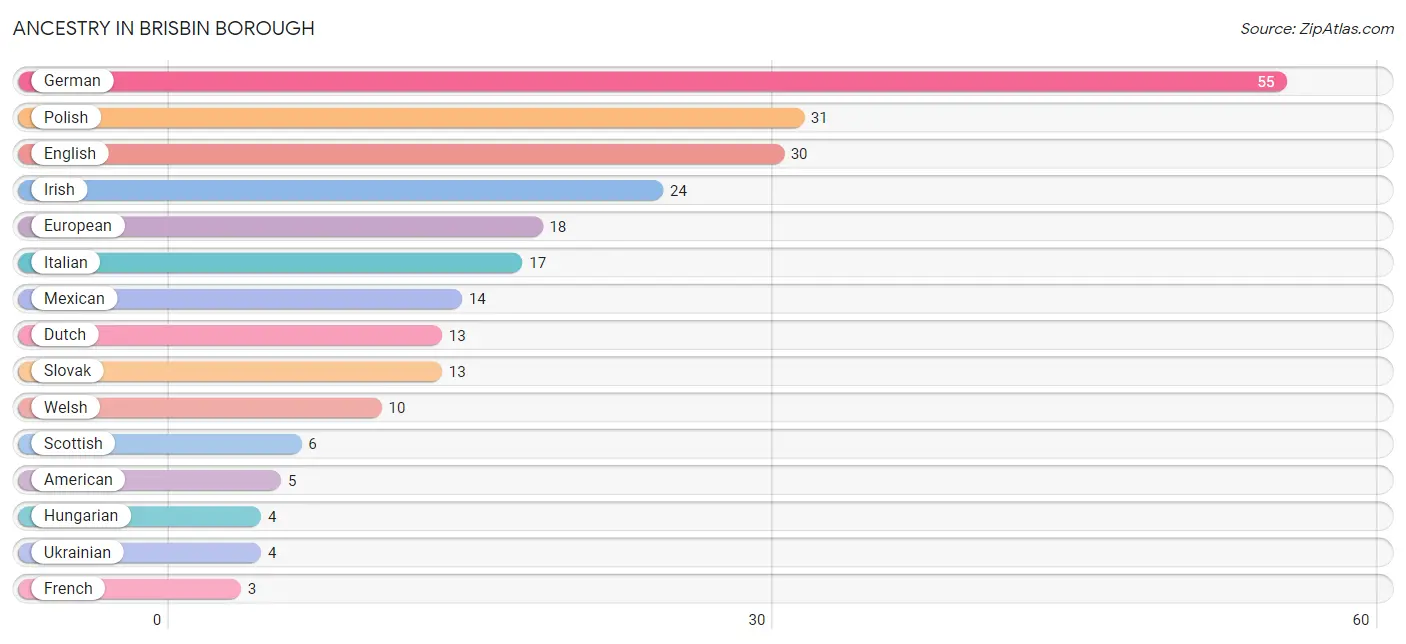
Ancestry in Brisbin borough
The most populous ancestries reported in Brisbin borough are German (55 | 14.2%), Polish (31 | 8.0%), English (30 | 7.7%), Irish (24 | 6.2%), and European (18 | 4.6%), together accounting for 40.8% of all Brisbin borough residents.
| Ancestry | # Population | % Population |
| American | 5 | 1.3% |
| Blackfeet | 1 | 0.3% |
| Cherokee | 1 | 0.3% |
| Czech | 2 | 0.5% |
| Czechoslovakian | 2 | 0.5% |
| Dutch | 13 | 3.4% |
| Eastern European | 1 | 0.3% |
| English | 30 | 7.7% |
| European | 18 | 4.6% |
| French | 3 | 0.8% |
| French Canadian | 1 | 0.3% |
| German | 55 | 14.2% |
| Hungarian | 4 | 1.0% |
| Irish | 24 | 6.2% |
| Italian | 17 | 4.4% |
| Mexican | 14 | 3.6% |
| Pennsylvania German | 3 | 0.8% |
| Polish | 31 | 8.0% |
| Scotch-Irish | 1 | 0.3% |
| Scottish | 6 | 1.5% |
| Slovak | 13 | 3.4% |
| Ukrainian | 4 | 1.0% |
| Welsh | 10 | 2.6% | View All 23 Rows |
Immigrants in Brisbin borough

| Immigration Origin | # Population | % Population | View All 0 Rows |
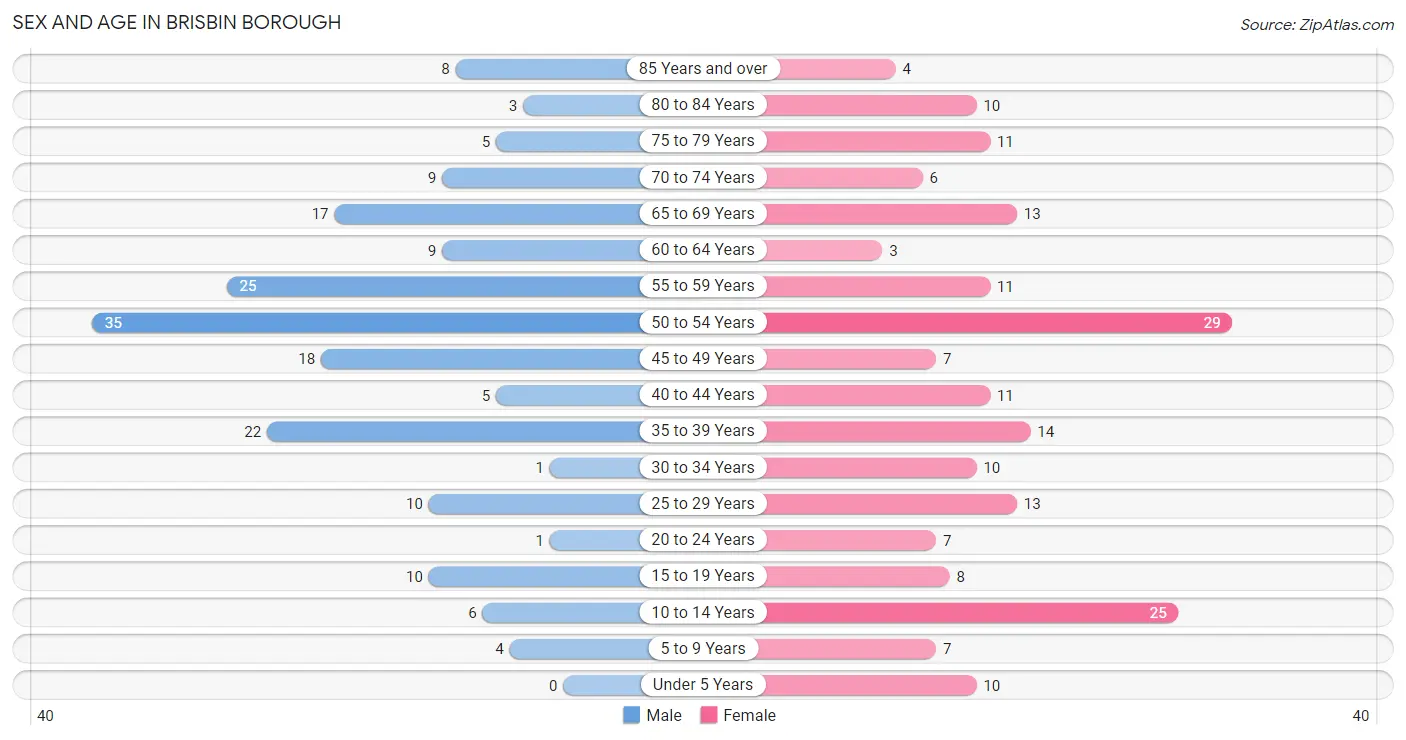
Sex and Age in Brisbin borough
Sex and Age in Brisbin borough
The most populous age groups in Brisbin borough are 50 to 54 Years (35 | 18.6%) for men and 50 to 54 Years (29 | 14.6%) for women.
| Age Bracket | Male | Female |
| Under 5 Years | 0 (0.0%) | 10 (5.0%) |
| 5 to 9 Years | 4 (2.1%) | 7 (3.5%) |
| 10 to 14 Years | 6 (3.2%) | 25 (12.6%) |
| 15 to 19 Years | 10 (5.3%) | 8 (4.0%) |
| 20 to 24 Years | 1 (0.5%) | 7 (3.5%) |
| 25 to 29 Years | 10 (5.3%) | 13 (6.5%) |
| 30 to 34 Years | 1 (0.5%) | 10 (5.0%) |
| 35 to 39 Years | 22 (11.7%) | 14 (7.0%) |
| 40 to 44 Years | 5 (2.7%) | 11 (5.5%) |
| 45 to 49 Years | 18 (9.6%) | 7 (3.5%) |
| 50 to 54 Years | 35 (18.6%) | 29 (14.6%) |
| 55 to 59 Years | 25 (13.3%) | 11 (5.5%) |
| 60 to 64 Years | 9 (4.8%) | 3 (1.5%) |
| 65 to 69 Years | 17 (9.0%) | 13 (6.5%) |
| 70 to 74 Years | 9 (4.8%) | 6 (3.0%) |
| 75 to 79 Years | 5 (2.7%) | 11 (5.5%) |
| 80 to 84 Years | 3 (1.6%) | 10 (5.0%) |
| 85 Years and over | 8 (4.3%) | 4 (2.0%) |
| Total | 188 (100.0%) | 199 (100.0%) |
Families and Households in Brisbin borough
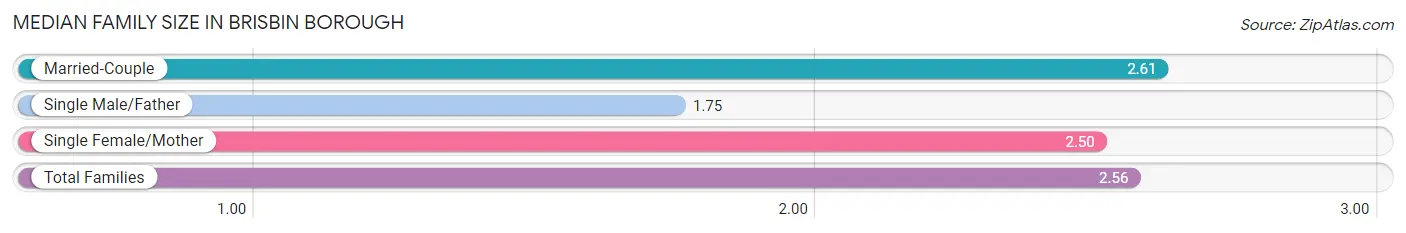
Median Family Size in Brisbin borough
The median family size in Brisbin borough is 2.56 persons per family, with married-couple families (92 | 78.0%) accounting for the largest median family size of 2.61 persons per family. On the other hand, single male/father families (4 | 3.4%) represent the smallest median family size with 1.75 persons per family.
| Family Type | # Families | Family Size |
| Married-Couple | 92 (78.0%) | 2.61 |
| Single Male/Father | 4 (3.4%) | 1.75 |
| Single Female/Mother | 22 (18.6%) | 2.50 |
| Total Families | 118 (100.0%) | 2.56 |
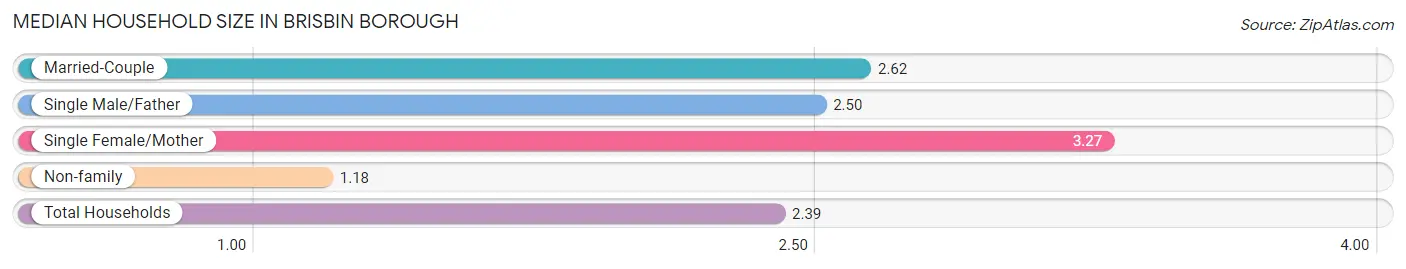
Median Household Size in Brisbin borough
The median household size in Brisbin borough is 2.39 persons per household, with single female/mother households (22 | 14.5%) accounting for the largest median household size of 3.27 persons per household. non-family households (34 | 22.4%) represent the smallest median household size with 1.18 persons per household.
| Household Type | # Households | Household Size |
| Married-Couple | 92 (60.5%) | 2.62 |
| Single Male/Father | 4 (2.6%) | 2.50 |
| Single Female/Mother | 22 (14.5%) | 3.27 |
| Non-family | 34 (22.4%) | 1.18 |
| Total Households | 152 (100.0%) | 2.39 |
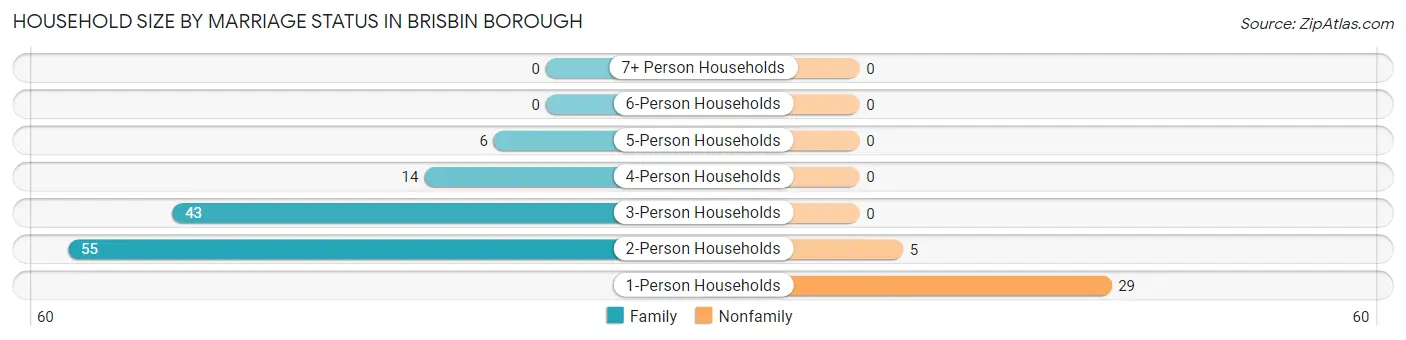
Household Size by Marriage Status in Brisbin borough
Out of a total of 152 households in Brisbin borough, 118 (77.6%) are family households, while 34 (22.4%) are nonfamily households. The most numerous type of family households are 2-person households, comprising 55, and the most common type of nonfamily households are 1-person households, comprising 29.
| Household Size | Family Households | Nonfamily Households |
| 1-Person Households | - | 29 (19.1%) |
| 2-Person Households | 55 (36.2%) | 5 (3.3%) |
| 3-Person Households | 43 (28.3%) | 0 (0.0%) |
| 4-Person Households | 14 (9.2%) | 0 (0.0%) |
| 5-Person Households | 6 (4.0%) | 0 (0.0%) |
| 6-Person Households | 0 (0.0%) | 0 (0.0%) |
| 7+ Person Households | 0 (0.0%) | 0 (0.0%) |
| Total | 118 (77.6%) | 34 (22.4%) |
Female Fertility in Brisbin borough
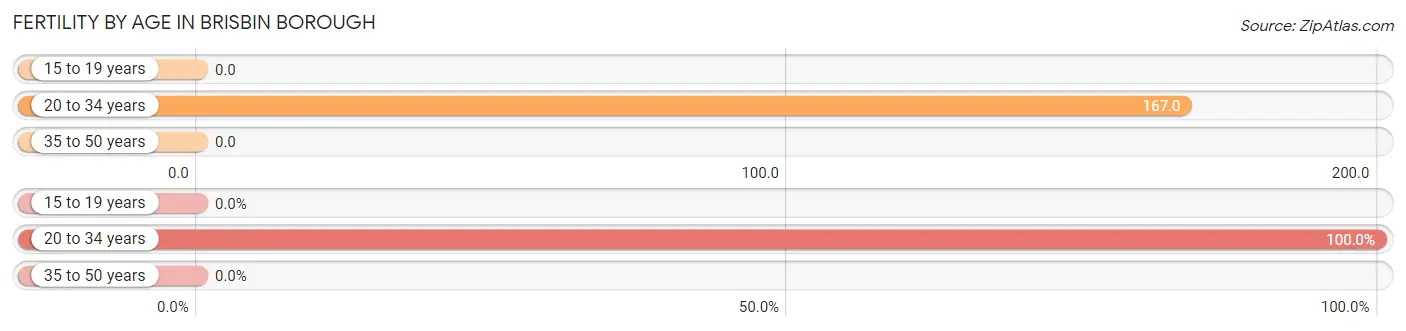
Fertility by Age in Brisbin borough
Average fertility rate in Brisbin borough is 68.0 births per 1,000 women. Women in the age bracket of 20 to 34 years have the highest fertility rate with 167.0 births per 1,000 women. Women in the age bracket of 20 to 34 years acount for 100.0% of all women with births.
| Age Bracket | Women with Births | Births / 1,000 Women |
| 15 to 19 years | 0 (0.0%) | 0.0 |
| 20 to 34 years | 5 (100.0%) | 167.0 |
| 35 to 50 years | 0 (0.0%) | 0.0 |
| Total | 5 (100.0%) | 68.0 |
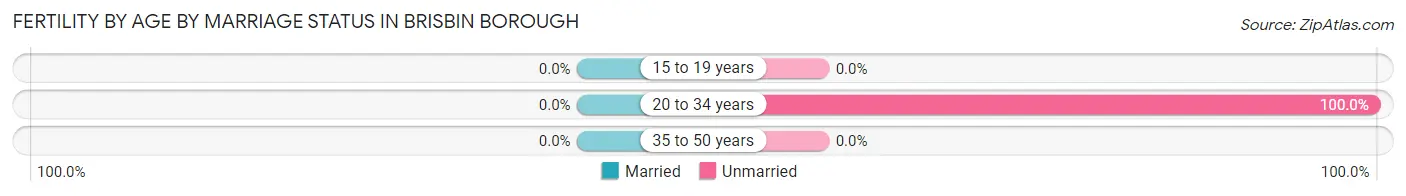
Fertility by Age by Marriage Status in Brisbin borough
| Age Bracket | Married | Unmarried |
| 15 to 19 years | 0 (0.0%) | 0 (0.0%) |
| 20 to 34 years | 0 (0.0%) | 5 (100.0%) |
| 35 to 50 years | 0 (0.0%) | 0 (0.0%) |
| Total | 0 (0.0%) | 5 (100.0%) |
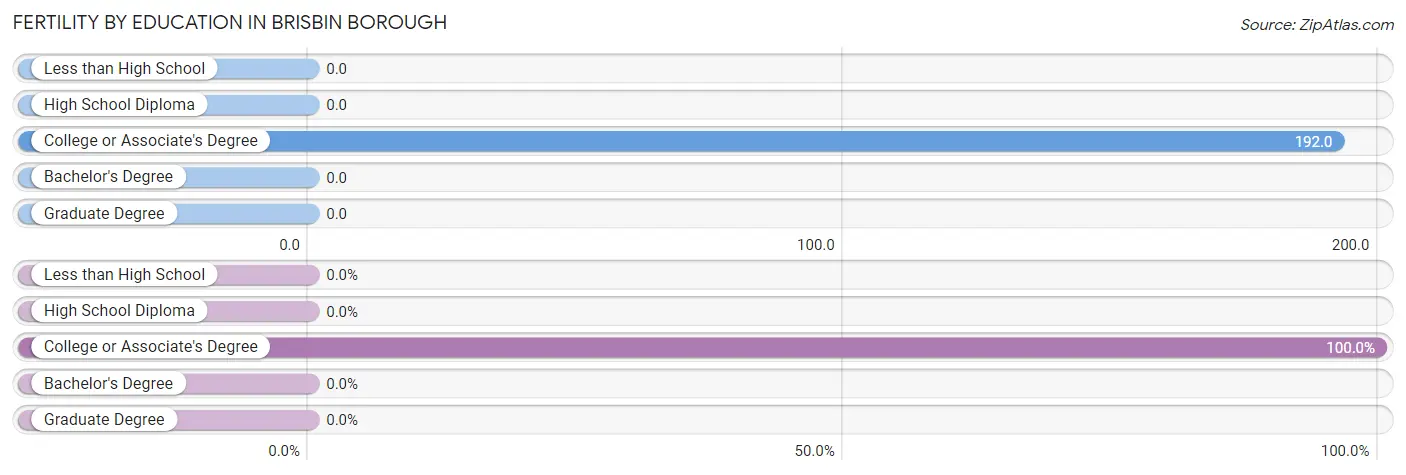
Fertility by Education in Brisbin borough
| Educational Attainment | Women with Births | Births / 1,000 Women |
| Less than High School | 0 (0.0%) | 0.0 |
| High School Diploma | 0 (0.0%) | 0.0 |
| College or Associate's Degree | 5 (100.0%) | 192.0 |
| Bachelor's Degree | 0 (0.0%) | 0.0 |
| Graduate Degree | 0 (0.0%) | 0.0 |
| Total | 5 (100.0%) | 68.0 |
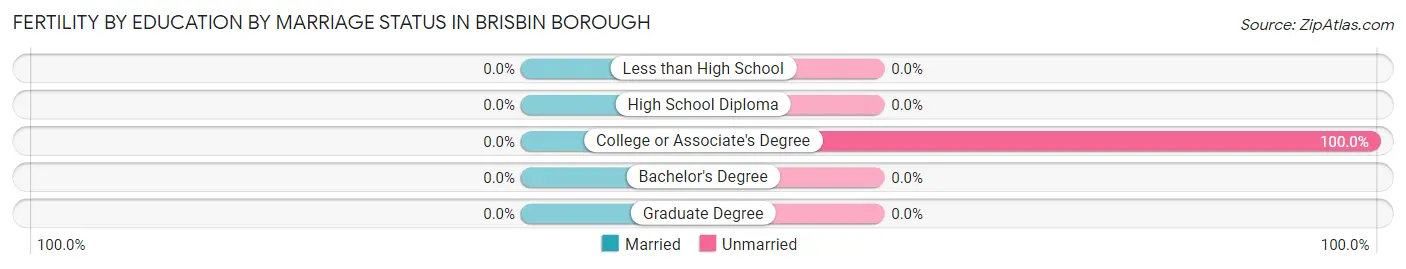
Fertility by Education by Marriage Status in Brisbin borough
| Educational Attainment | Married | Unmarried |
| Less than High School | 0 (0.0%) | 0 (0.0%) |
| High School Diploma | 0 (0.0%) | 0 (0.0%) |
| College or Associate's Degree | 0 (0.0%) | 5 (100.0%) |
| Bachelor's Degree | 0 (0.0%) | 0 (0.0%) |
| Graduate Degree | 0 (0.0%) | 0 (0.0%) |
| Total | 0 (0.0%) | 5 (100.0%) |
Income in Brisbin borough
Income Overview in Brisbin borough
Per Capita Income in Brisbin borough is $29,477, while median incomes of families and households are $60,833 and $55,833 respectively.
| Characteristic | Number | Measure |
| Per Capita Income | 387 | $29,477 |
| Median Family Income | 118 | $60,833 |
| Mean Family Income | 118 | $71,820 |
| Median Household Income | 152 | $55,833 |
| Mean Household Income | 152 | $66,430 |
| Income Deficit | 118 | $0 |
| Wage / Income Gap (%) | 387 | 13.74% |
| Wage / Income Gap ($) | 387 | 86.26¢ per $1 |
| Gini / Inequality Index | 387 | 0.40 |
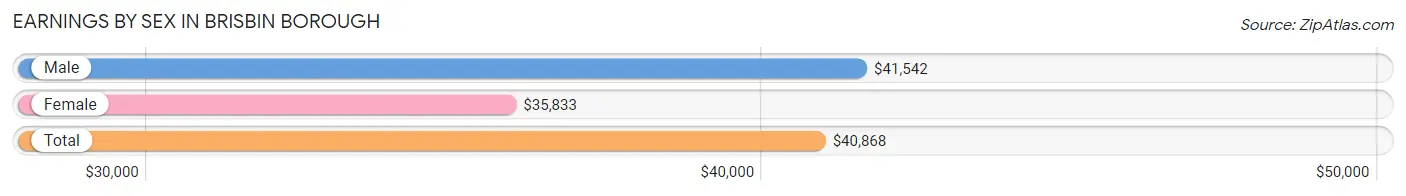
Earnings by Sex in Brisbin borough
Average Earnings in Brisbin borough are $40,868, $41,542 for men and $35,833 for women, a difference of 13.7%.
| Sex | Number | Average Earnings |
| Male | 101 (53.4%) | $41,542 |
| Female | 88 (46.6%) | $35,833 |
| Total | 189 (100.0%) | $40,868 |
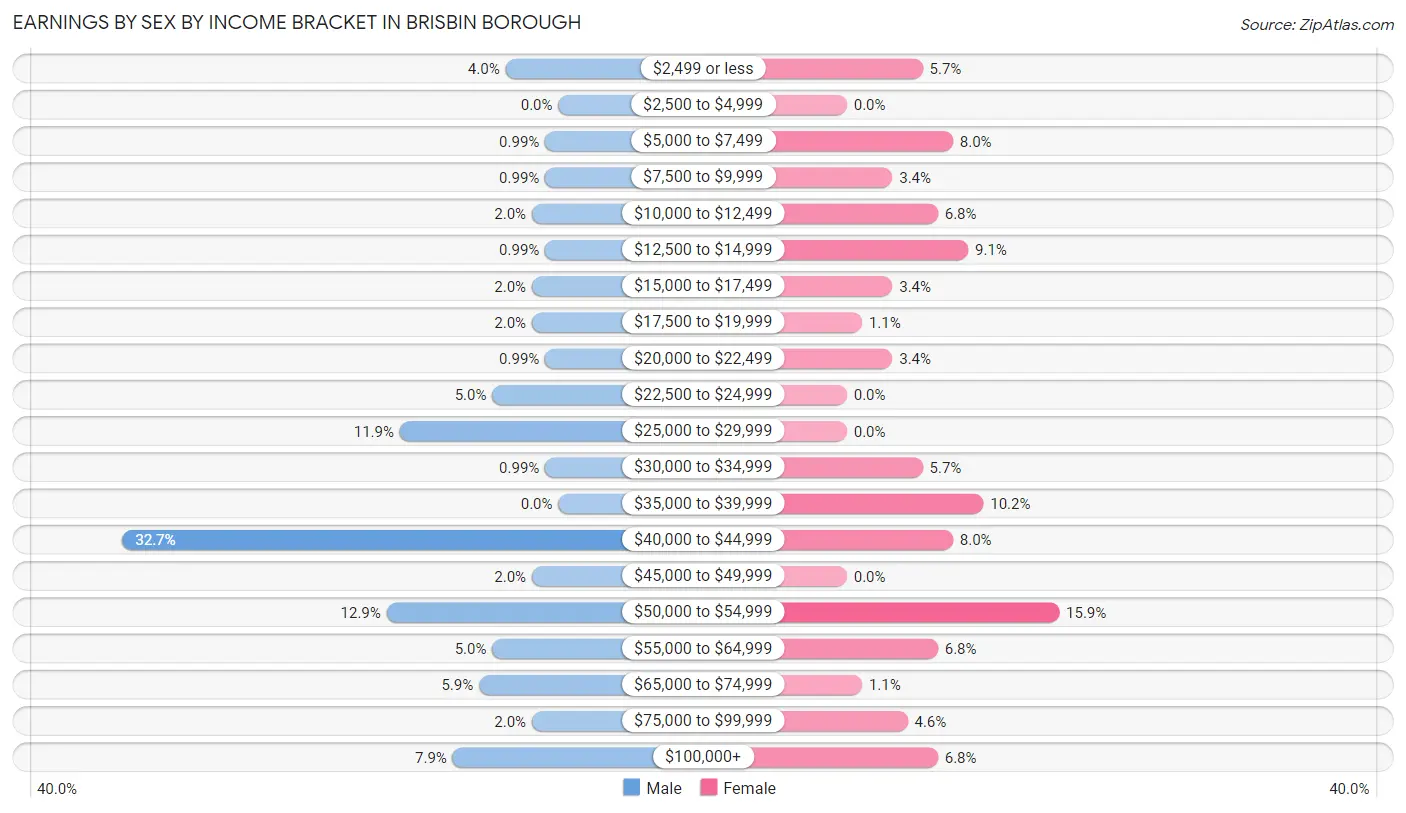
Earnings by Sex by Income Bracket in Brisbin borough
The most common earnings brackets in Brisbin borough are $40,000 to $44,999 for men (33 | 32.7%) and $50,000 to $54,999 for women (14 | 15.9%).
| Income | Male | Female |
| $2,499 or less | 4 (4.0%) | 5 (5.7%) |
| $2,500 to $4,999 | 0 (0.0%) | 0 (0.0%) |
| $5,000 to $7,499 | 1 (1.0%) | 7 (8.0%) |
| $7,500 to $9,999 | 1 (1.0%) | 3 (3.4%) |
| $10,000 to $12,499 | 2 (2.0%) | 6 (6.8%) |
| $12,500 to $14,999 | 1 (1.0%) | 8 (9.1%) |
| $15,000 to $17,499 | 2 (2.0%) | 3 (3.4%) |
| $17,500 to $19,999 | 2 (2.0%) | 1 (1.1%) |
| $20,000 to $22,499 | 1 (1.0%) | 3 (3.4%) |
| $22,500 to $24,999 | 5 (5.0%) | 0 (0.0%) |
| $25,000 to $29,999 | 12 (11.9%) | 0 (0.0%) |
| $30,000 to $34,999 | 1 (1.0%) | 5 (5.7%) |
| $35,000 to $39,999 | 0 (0.0%) | 9 (10.2%) |
| $40,000 to $44,999 | 33 (32.7%) | 7 (8.0%) |
| $45,000 to $49,999 | 2 (2.0%) | 0 (0.0%) |
| $50,000 to $54,999 | 13 (12.9%) | 14 (15.9%) |
| $55,000 to $64,999 | 5 (5.0%) | 6 (6.8%) |
| $65,000 to $74,999 | 6 (5.9%) | 1 (1.1%) |
| $75,000 to $99,999 | 2 (2.0%) | 4 (4.5%) |
| $100,000+ | 8 (7.9%) | 6 (6.8%) |
| Total | 101 (100.0%) | 88 (100.0%) |
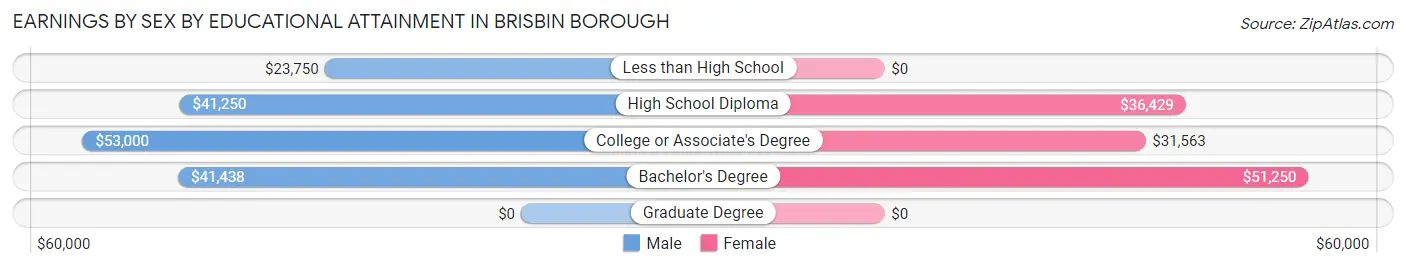
Earnings by Sex by Educational Attainment in Brisbin borough
Average earnings in Brisbin borough are $41,625 for men and $37,361 for women, a difference of 10.2%. Men with an educational attainment of college or associate's degree enjoy the highest average annual earnings of $53,000, while those with less than high school education earn the least with $23,750. Women with an educational attainment of bachelor's degree earn the most with the average annual earnings of $51,250, while those with college or associate's degree education have the smallest earnings of $31,563.
| Educational Attainment | Male Income | Female Income |
| Less than High School | $23,750 | $0 |
| High School Diploma | $41,250 | $36,429 |
| College or Associate's Degree | $53,000 | $31,563 |
| Bachelor's Degree | $41,438 | $51,250 |
| Graduate Degree | - | - |
| Total | $41,625 | $37,361 |
Family Income in Brisbin borough
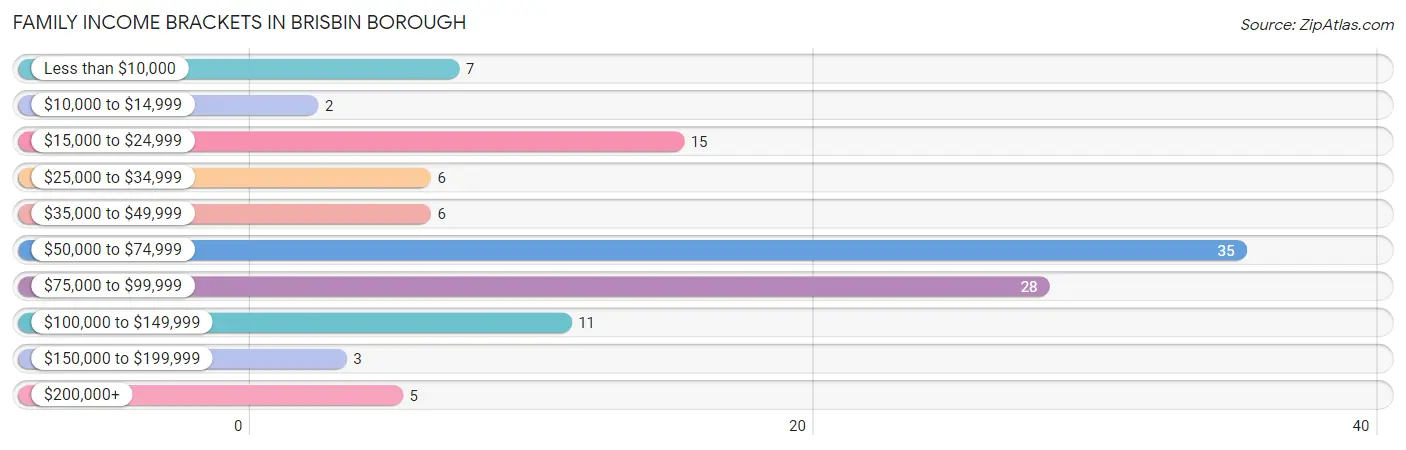
Family Income Brackets in Brisbin borough
According to the Brisbin borough family income data, there are 35 families falling into the $50,000 to $74,999 income range, which is the most common income bracket and makes up 29.7% of all families. Conversely, the $10,000 to $14,999 income bracket is the least frequent group with only 2 families (1.7%) belonging to this category.
| Income Bracket | # Families | % Families |
| Less than $10,000 | 7 | 5.9% |
| $10,000 to $14,999 | 2 | 1.7% |
| $15,000 to $24,999 | 15 | 12.7% |
| $25,000 to $34,999 | 6 | 5.1% |
| $35,000 to $49,999 | 6 | 5.1% |
| $50,000 to $74,999 | 35 | 29.7% |
| $75,000 to $99,999 | 28 | 23.7% |
| $100,000 to $149,999 | 11 | 9.3% |
| $150,000 to $199,999 | 3 | 2.5% |
| $200,000+ | 5 | 4.2% |
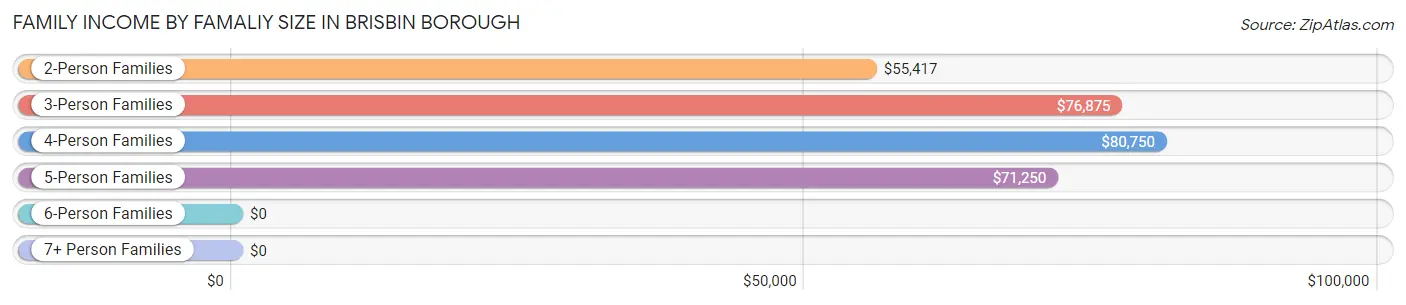
Family Income by Famaliy Size in Brisbin borough
4-person families (13 | 11.0%) account for the highest median family income in Brisbin borough with $80,750 per family, while 2-person families (67 | 56.8%) have the highest median income of $27,708 per family member.
| Income Bracket | # Families | Median Income |
| 2-Person Families | 67 (56.8%) | $55,417 |
| 3-Person Families | 34 (28.8%) | $76,875 |
| 4-Person Families | 13 (11.0%) | $80,750 |
| 5-Person Families | 4 (3.4%) | $71,250 |
| 6-Person Families | 0 (0.0%) | $0 |
| 7+ Person Families | 0 (0.0%) | $0 |
| Total | 118 (100.0%) | $60,833 |
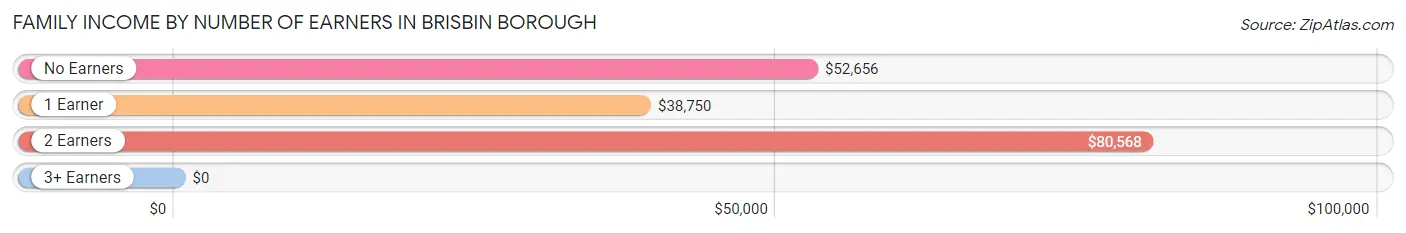
Family Income by Number of Earners in Brisbin borough
| Number of Earners | # Families | Median Income |
| No Earners | 29 (24.6%) | $52,656 |
| 1 Earner | 31 (26.3%) | $38,750 |
| 2 Earners | 53 (44.9%) | $80,568 |
| 3+ Earners | 5 (4.2%) | $0 |
| Total | 118 (100.0%) | $60,833 |
Household Income in Brisbin borough
Household Income Brackets in Brisbin borough
With 40 households falling in the category, the $50,000 to $74,999 income range is the most frequent in Brisbin borough, accounting for 26.3% of all households. In contrast, only 2 households (1.3%) fall into the $10,000 to $14,999 income bracket, making it the least populous group.
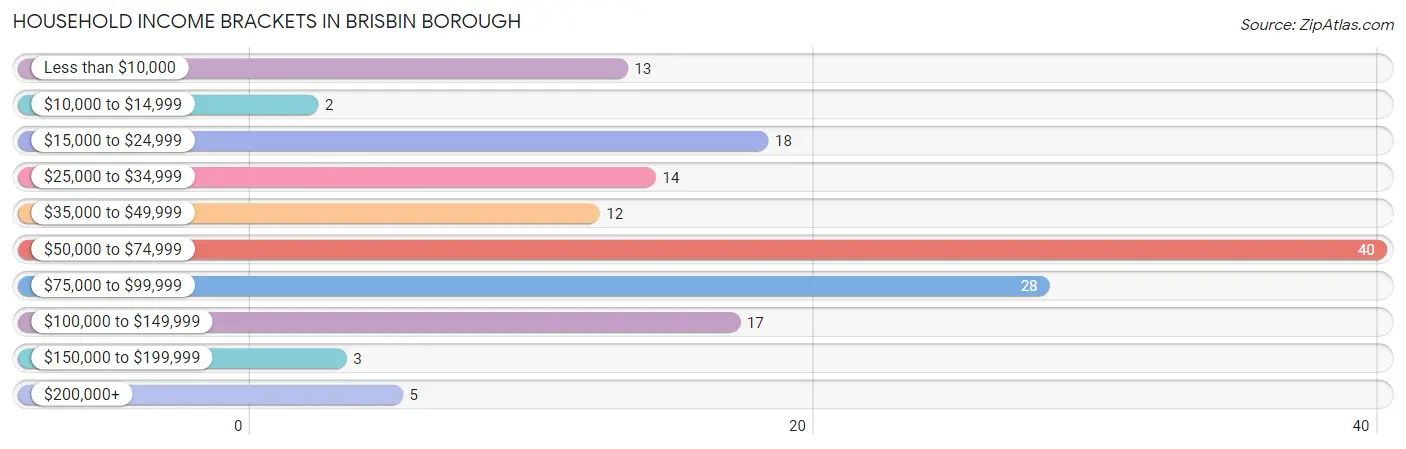
| Income Bracket | # Households | % Households |
| Less than $10,000 | 13 | 8.6% |
| $10,000 to $14,999 | 2 | 1.3% |
| $15,000 to $24,999 | 18 | 11.8% |
| $25,000 to $34,999 | 14 | 9.2% |
| $35,000 to $49,999 | 12 | 7.9% |
| $50,000 to $74,999 | 40 | 26.3% |
| $75,000 to $99,999 | 28 | 18.4% |
| $100,000 to $149,999 | 17 | 11.2% |
| $150,000 to $199,999 | 3 | 2.0% |
| $200,000+ | 5 | 3.3% |
Household Income by Householder Age in Brisbin borough
The median household income in Brisbin borough is $55,833, with the highest median household income of $71,250 found in the 45 to 64 years age bracket for the primary householder. A total of 67 households (44.1%) fall into this category. Meanwhile, the 15 to 24 years age bracket for the primary householder has the lowest median household income of $0, with 1 households (0.7%) in this group.
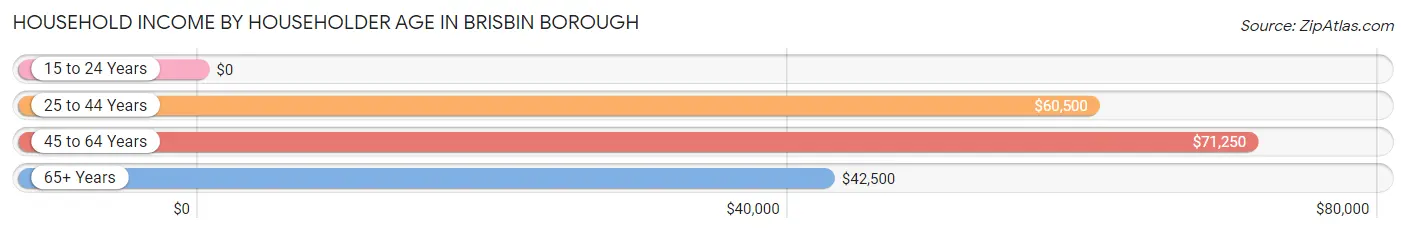
| Income Bracket | # Households | Median Income |
| 15 to 24 Years | 1 (0.7%) | $0 |
| 25 to 44 Years | 34 (22.4%) | $60,500 |
| 45 to 64 Years | 67 (44.1%) | $71,250 |
| 65+ Years | 50 (32.9%) | $42,500 |
| Total | 152 (100.0%) | $55,833 |
Poverty in Brisbin borough
Income Below Poverty by Sex and Age in Brisbin borough
With 17.5% poverty level for males and 22.6% for females among the residents of Brisbin borough, 18 to 24 year old males and 5 year old females are the most vulnerable to poverty, with 2 males (100.0%) and 2 females (100.0%) in their respective age groups living below the poverty level.
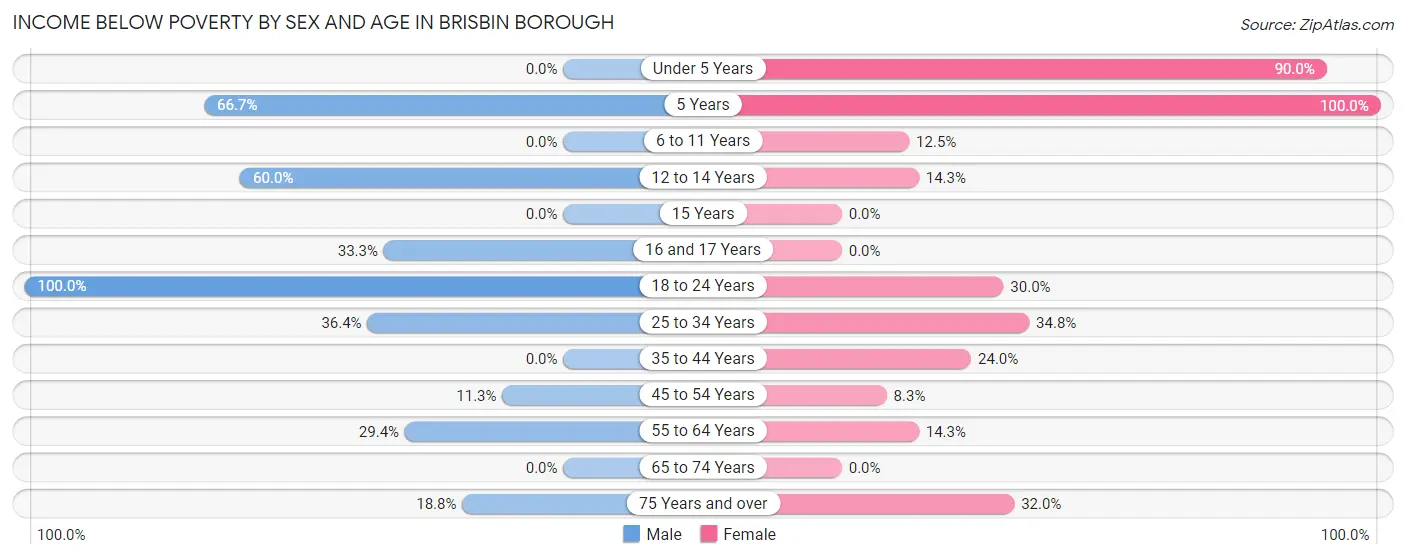
| Age Bracket | Male | Female |
| Under 5 Years | 0 (0.0%) | 9 (90.0%) |
| 5 Years | 2 (66.7%) | 2 (100.0%) |
| 6 to 11 Years | 0 (0.0%) | 2 (12.5%) |
| 12 to 14 Years | 3 (60.0%) | 2 (14.3%) |
| 15 Years | 0 (0.0%) | 0 (0.0%) |
| 16 and 17 Years | 3 (33.3%) | 0 (0.0%) |
| 18 to 24 Years | 2 (100.0%) | 3 (30.0%) |
| 25 to 34 Years | 4 (36.4%) | 8 (34.8%) |
| 35 to 44 Years | 0 (0.0%) | 6 (24.0%) |
| 45 to 54 Years | 6 (11.3%) | 3 (8.3%) |
| 55 to 64 Years | 10 (29.4%) | 2 (14.3%) |
| 65 to 74 Years | 0 (0.0%) | 0 (0.0%) |
| 75 Years and over | 3 (18.8%) | 8 (32.0%) |
| Total | 33 (17.5%) | 45 (22.6%) |
Income Above Poverty by Sex and Age in Brisbin borough
According to the poverty statistics in Brisbin borough, males aged 6 to 11 years and females aged 16 and 17 years are the age groups that are most secure financially, with 100.0% of males and 100.0% of females in these age groups living above the poverty line.
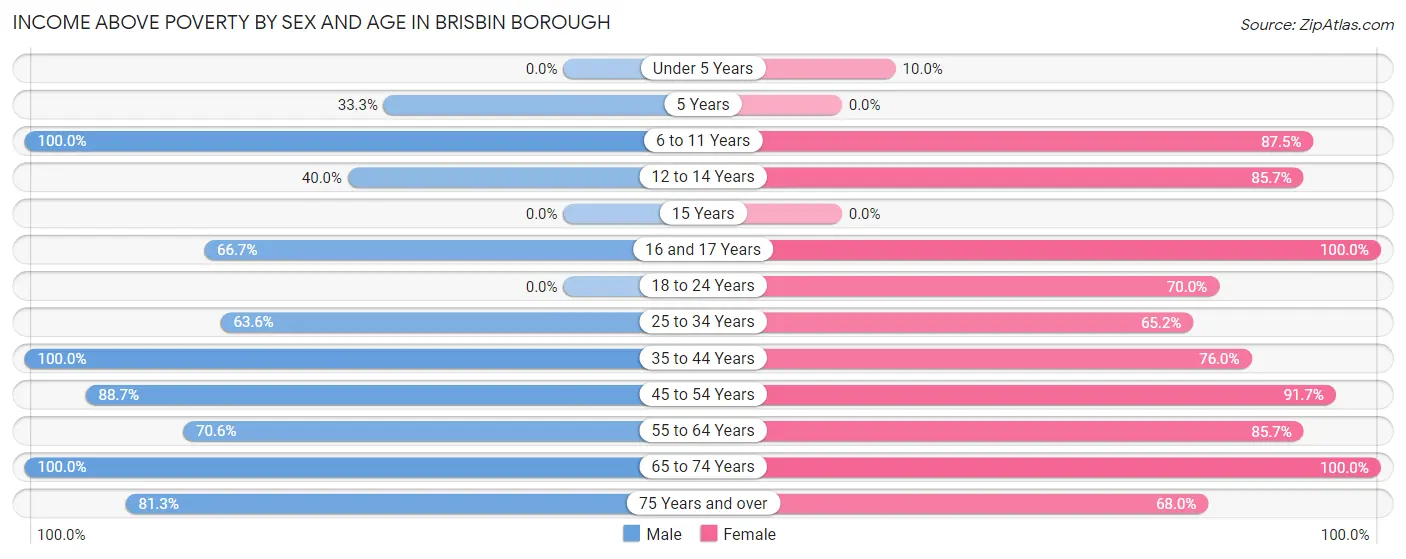
| Age Bracket | Male | Female |
| Under 5 Years | 0 (0.0%) | 1 (10.0%) |
| 5 Years | 1 (33.3%) | 0 (0.0%) |
| 6 to 11 Years | 2 (100.0%) | 14 (87.5%) |
| 12 to 14 Years | 2 (40.0%) | 12 (85.7%) |
| 15 Years | 0 (0.0%) | 0 (0.0%) |
| 16 and 17 Years | 6 (66.7%) | 5 (100.0%) |
| 18 to 24 Years | 0 (0.0%) | 7 (70.0%) |
| 25 to 34 Years | 7 (63.6%) | 15 (65.2%) |
| 35 to 44 Years | 27 (100.0%) | 19 (76.0%) |
| 45 to 54 Years | 47 (88.7%) | 33 (91.7%) |
| 55 to 64 Years | 24 (70.6%) | 12 (85.7%) |
| 65 to 74 Years | 26 (100.0%) | 19 (100.0%) |
| 75 Years and over | 13 (81.2%) | 17 (68.0%) |
| Total | 155 (82.5%) | 154 (77.4%) |
Income Below Poverty Among Married-Couple Families in Brisbin borough
The poverty statistics for married-couple families in Brisbin borough show that 5.4% or 5 of the total 92 families live below the poverty line. Families with 3 or 4 children have the highest poverty rate of 25.0%, comprising of 1 families. On the other hand, families with no children have the lowest poverty rate of 2.9%, which includes 2 families.
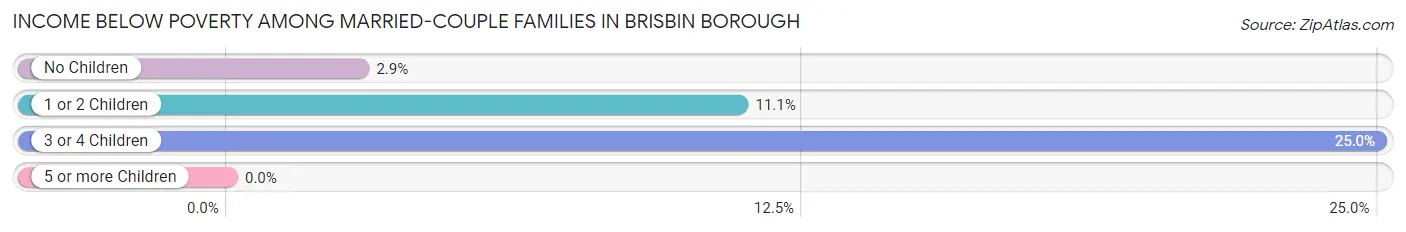
| Children | Above Poverty | Below Poverty |
| No Children | 68 (97.1%) | 2 (2.9%) |
| 1 or 2 Children | 16 (88.9%) | 2 (11.1%) |
| 3 or 4 Children | 3 (75.0%) | 1 (25.0%) |
| 5 or more Children | 0 (0.0%) | 0 (0.0%) |
| Total | 87 (94.6%) | 5 (5.4%) |
Income Below Poverty Among Single-Parent Households in Brisbin borough
According to the poverty data in Brisbin borough, 50.0% or 2 single-father households and 54.5% or 12 single-mother households are living below the poverty line. Among single-father households, those with 1 or 2 children have the highest poverty rate, with 2 households (50.0%) experiencing poverty. Likewise, among single-mother households, those with 1 or 2 children have the highest poverty rate, with 9 households (64.3%) falling below the poverty line.
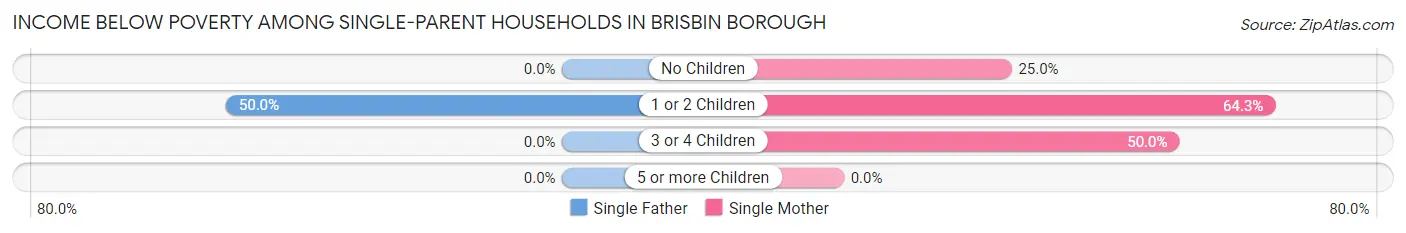
| Children | Single Father | Single Mother |
| No Children | 0 (0.0%) | 1 (25.0%) |
| 1 or 2 Children | 2 (50.0%) | 9 (64.3%) |
| 3 or 4 Children | 0 (0.0%) | 2 (50.0%) |
| 5 or more Children | 0 (0.0%) | 0 (0.0%) |
| Total | 2 (50.0%) | 12 (54.5%) |
Income Below Poverty Among Married-Couple vs Single-Parent Households in Brisbin borough
The poverty data for Brisbin borough shows that 5 of the married-couple family households (5.4%) and 14 of the single-parent households (53.8%) are living below the poverty level. Within the married-couple family households, those with 3 or 4 children have the highest poverty rate, with 1 households (25.0%) falling below the poverty line. Among the single-parent households, those with 1 or 2 children have the highest poverty rate, with 11 household (61.1%) living below poverty.
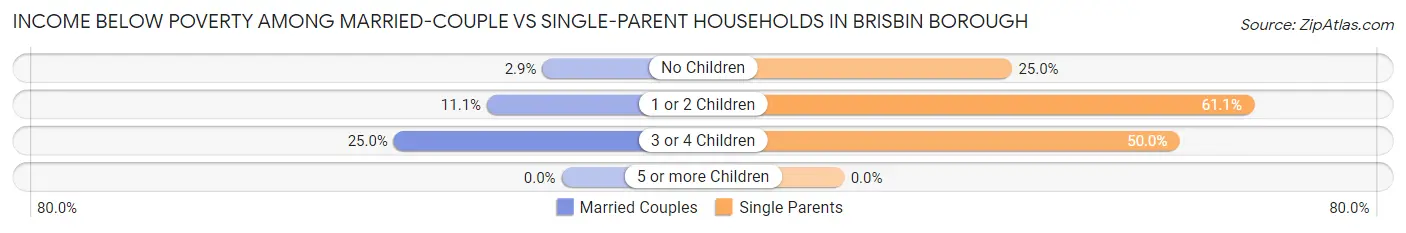
| Children | Married-Couple Families | Single-Parent Households |
| No Children | 2 (2.9%) | 1 (25.0%) |
| 1 or 2 Children | 2 (11.1%) | 11 (61.1%) |
| 3 or 4 Children | 1 (25.0%) | 2 (50.0%) |
| 5 or more Children | 0 (0.0%) | 0 (0.0%) |
| Total | 5 (5.4%) | 14 (53.8%) |
Employment Characteristics in Brisbin borough
Employment by Class of Employer in Brisbin borough
Among the 173 employed individuals in Brisbin borough, private company employees (102 | 59.0%), not-for-profit organizations (25 | 14.4%), and local government employees (19 | 11.0%) make up the most common classes of employment.
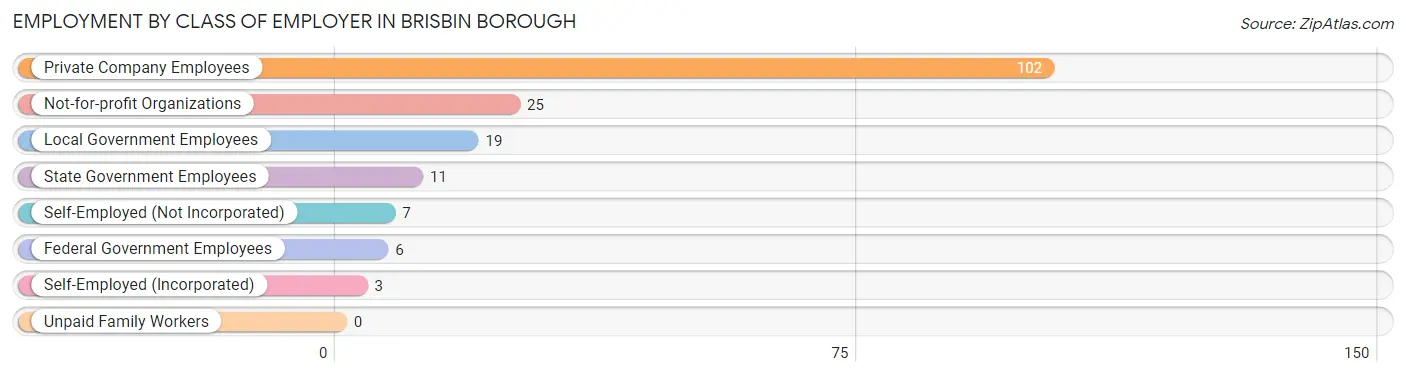
| Employer Class | # Employees | % Employees |
| Private Company Employees | 102 | 59.0% |
| Self-Employed (Incorporated) | 3 | 1.7% |
| Self-Employed (Not Incorporated) | 7 | 4.1% |
| Not-for-profit Organizations | 25 | 14.4% |
| Local Government Employees | 19 | 11.0% |
| State Government Employees | 11 | 6.4% |
| Federal Government Employees | 6 | 3.5% |
| Unpaid Family Workers | 0 | 0.0% |
| Total | 173 | 100.0% |
Employment Status by Age in Brisbin borough
According to the labor force statistics for Brisbin borough, out of the total population over 16 years of age (335), 54.9% or 184 individuals are in the labor force, with 6.0% or 11 of them unemployed. The age group with the highest labor force participation rate is 35 to 44 years, with 84.6% or 44 individuals in the labor force. Within the labor force, the 55 to 59 years age range has the highest percentage of unemployed individuals, with 14.8% or 4 of them being unemployed.
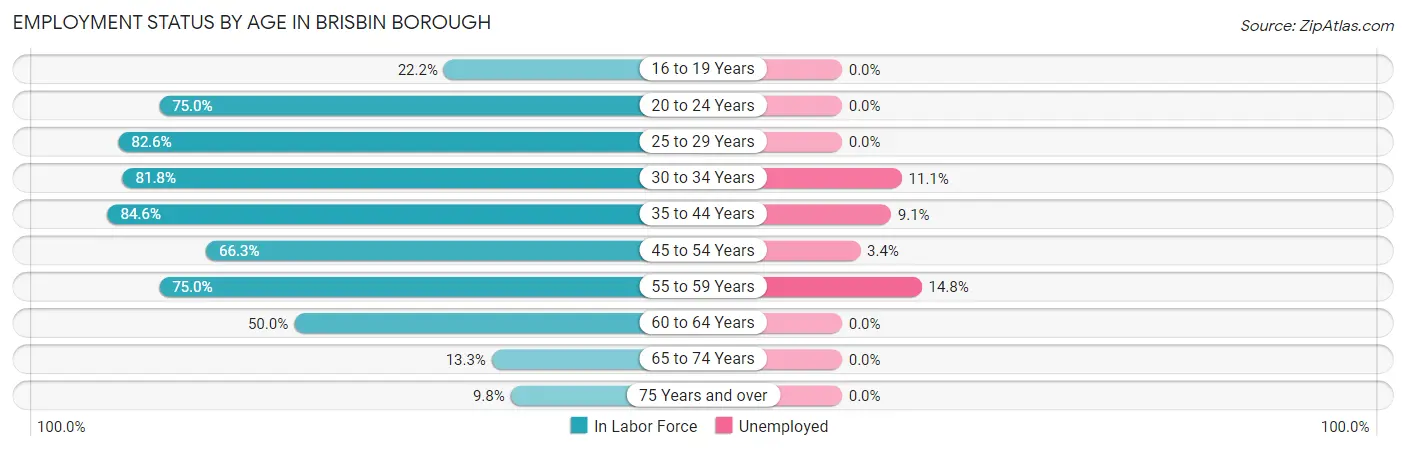
| Age Bracket | In Labor Force | Unemployed |
| 16 to 19 Years | 4 (22.2%) | 0 (0.0%) |
| 20 to 24 Years | 6 (75.0%) | 0 (0.0%) |
| 25 to 29 Years | 19 (82.6%) | 0 (0.0%) |
| 30 to 34 Years | 9 (81.8%) | 1 (11.1%) |
| 35 to 44 Years | 44 (84.6%) | 4 (9.1%) |
| 45 to 54 Years | 59 (66.3%) | 2 (3.4%) |
| 55 to 59 Years | 27 (75.0%) | 4 (14.8%) |
| 60 to 64 Years | 6 (50.0%) | 0 (0.0%) |
| 65 to 74 Years | 6 (13.3%) | 0 (0.0%) |
| 75 Years and over | 4 (9.8%) | 0 (0.0%) |
| Total | 184 (54.9%) | 11 (6.0%) |
Employment Status by Educational Attainment in Brisbin borough
According to labor force statistics for Brisbin borough, 73.5% of individuals (164) out of the total population between 25 and 64 years of age (223) are in the labor force, with 6.7% or 11 of them being unemployed. The group with the highest labor force participation rate are those with the educational attainment of college / associate degree, with 86.2% or 56 individuals in the labor force. Within the labor force, individuals with high school diploma education have the highest percentage of unemployment, with 14.6% or 7 of them being unemployed.
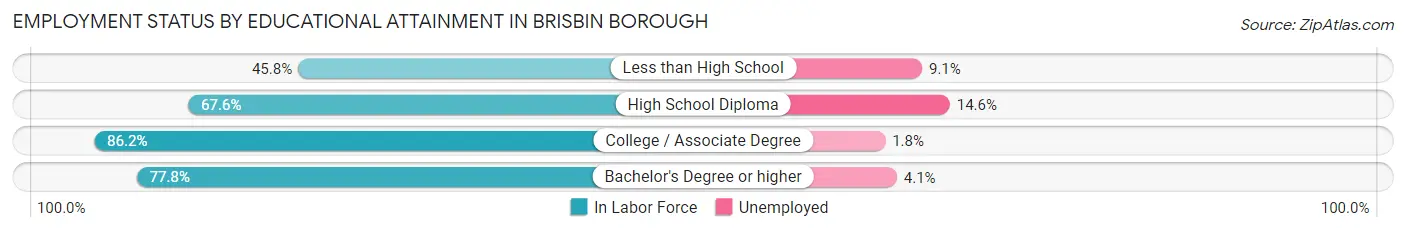
| Educational Attainment | In Labor Force | Unemployed |
| Less than High School | 11 (45.8%) | 2 (9.1%) |
| High School Diploma | 48 (67.6%) | 10 (14.6%) |
| College / Associate Degree | 56 (86.2%) | 1 (1.8%) |
| Bachelor's Degree or higher | 49 (77.8%) | 3 (4.1%) |
| Total | 164 (73.5%) | 15 (6.7%) |
Employment Occupations by Sex in Brisbin borough
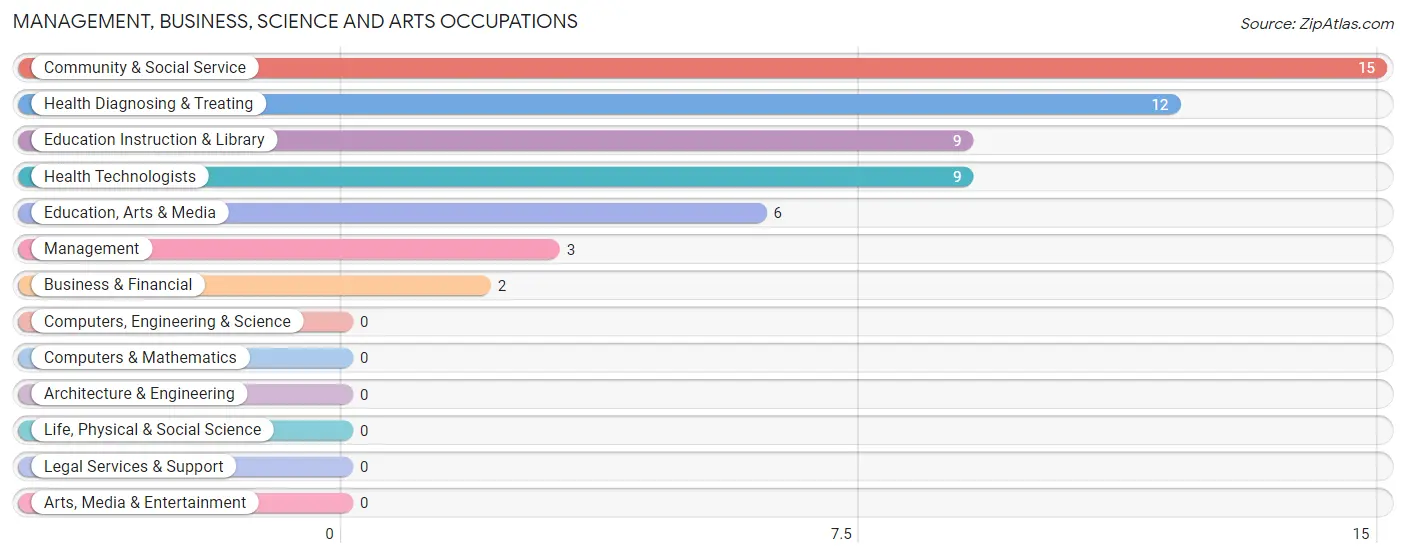
Management, Business, Science and Arts Occupations
The most common Management, Business, Science and Arts occupations in Brisbin borough are Community & Social Service (15 | 8.7%), Health Diagnosing & Treating (12 | 6.9%), Education Instruction & Library (9 | 5.2%), Health Technologists (9 | 5.2%), and Education, Arts & Media (6 | 3.5%).
Management, Business, Science and Arts Occupations by Sex
Within the Management, Business, Science and Arts occupations in Brisbin borough, the most male-oriented occupations are Management (100.0%), Education, Arts & Media (100.0%), and Community & Social Service (66.7%), while the most female-oriented occupations are Business & Financial (100.0%), Health Diagnosing & Treating (100.0%), and Health Technologists (100.0%).
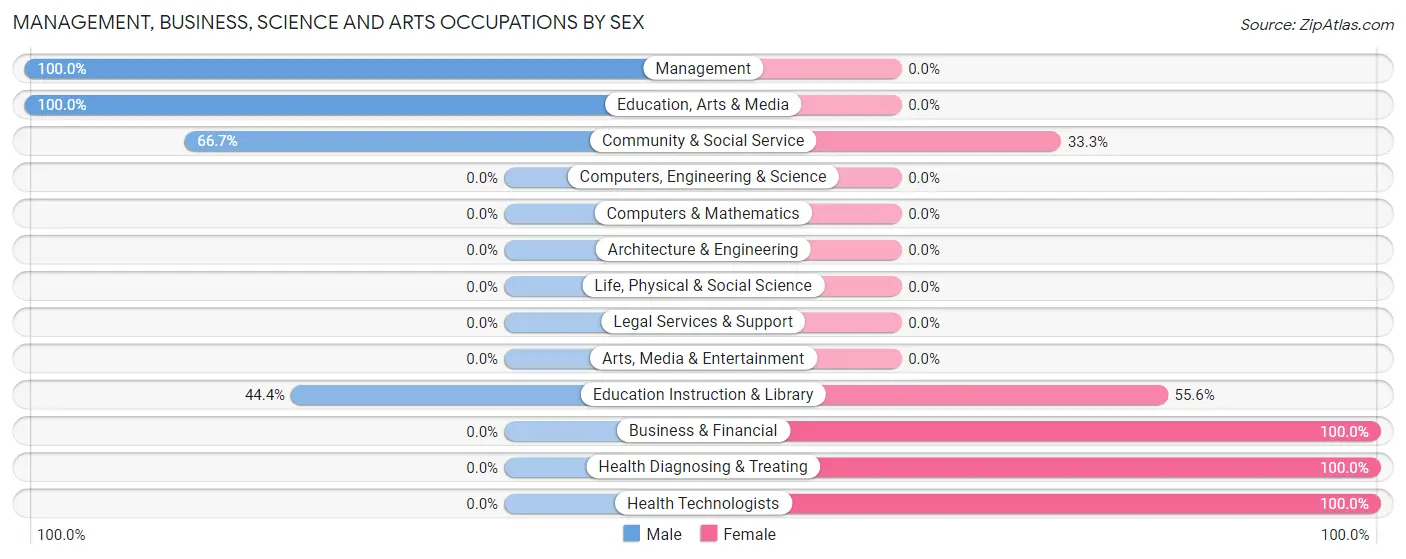
| Occupation | Male | Female |
| Management | 3 (100.0%) | 0 (0.0%) |
| Business & Financial | 0 (0.0%) | 2 (100.0%) |
| Computers, Engineering & Science | 0 (0.0%) | 0 (0.0%) |
| Computers & Mathematics | 0 (0.0%) | 0 (0.0%) |
| Architecture & Engineering | 0 (0.0%) | 0 (0.0%) |
| Life, Physical & Social Science | 0 (0.0%) | 0 (0.0%) |
| Community & Social Service | 10 (66.7%) | 5 (33.3%) |
| Education, Arts & Media | 6 (100.0%) | 0 (0.0%) |
| Legal Services & Support | 0 (0.0%) | 0 (0.0%) |
| Education Instruction & Library | 4 (44.4%) | 5 (55.6%) |
| Arts, Media & Entertainment | 0 (0.0%) | 0 (0.0%) |
| Health Diagnosing & Treating | 0 (0.0%) | 12 (100.0%) |
| Health Technologists | 0 (0.0%) | 9 (100.0%) |
| Total (Category) | 13 (40.6%) | 19 (59.4%) |
| Total (Overall) | 89 (51.4%) | 84 (48.5%) |
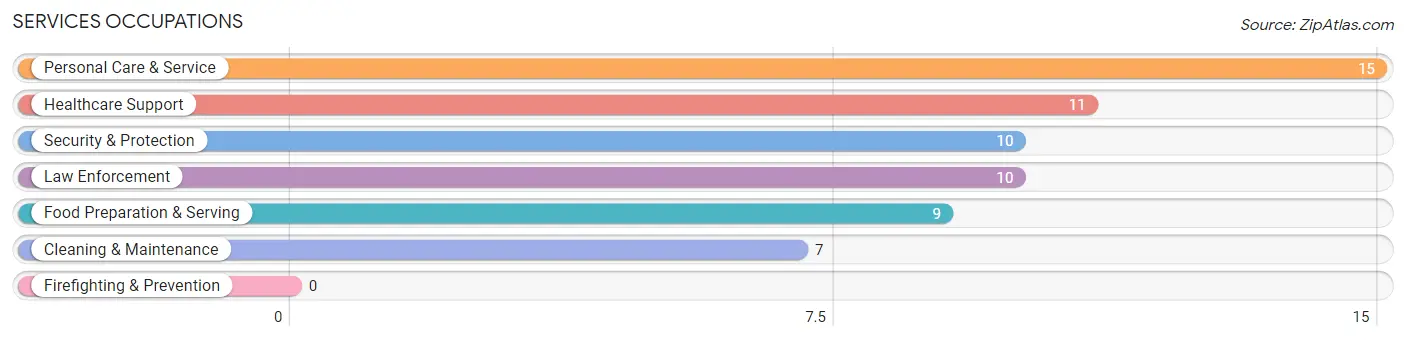
Services Occupations
The most common Services occupations in Brisbin borough are Personal Care & Service (15 | 8.7%), Healthcare Support (11 | 6.4%), Security & Protection (10 | 5.8%), Law Enforcement (10 | 5.8%), and Food Preparation & Serving (9 | 5.2%).
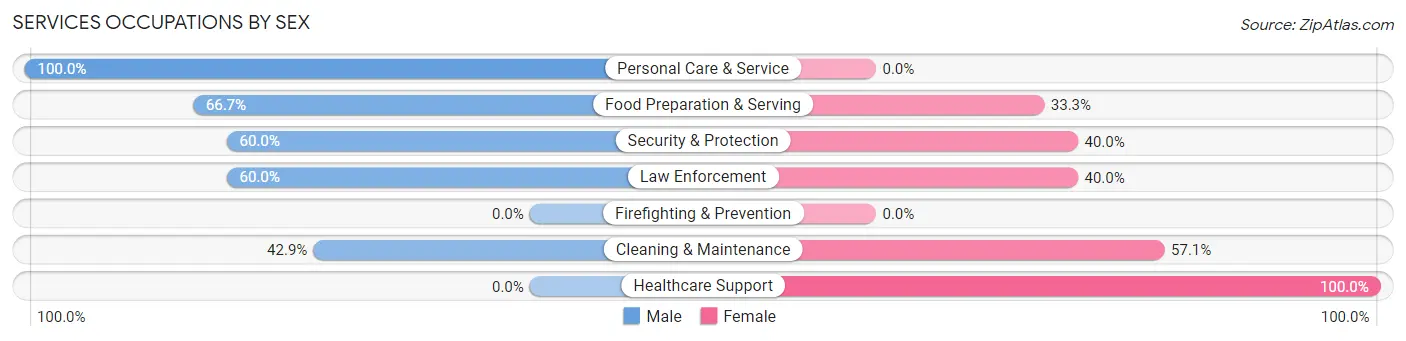
Services Occupations by Sex
Within the Services occupations in Brisbin borough, the most male-oriented occupations are Personal Care & Service (100.0%), Food Preparation & Serving (66.7%), and Security & Protection (60.0%), while the most female-oriented occupations are Healthcare Support (100.0%), Cleaning & Maintenance (57.1%), and Security & Protection (40.0%).
| Occupation | Male | Female |
| Healthcare Support | 0 (0.0%) | 11 (100.0%) |
| Security & Protection | 6 (60.0%) | 4 (40.0%) |
| Firefighting & Prevention | 0 (0.0%) | 0 (0.0%) |
| Law Enforcement | 6 (60.0%) | 4 (40.0%) |
| Food Preparation & Serving | 6 (66.7%) | 3 (33.3%) |
| Cleaning & Maintenance | 3 (42.9%) | 4 (57.1%) |
| Personal Care & Service | 15 (100.0%) | 0 (0.0%) |
| Total (Category) | 30 (57.7%) | 22 (42.3%) |
| Total (Overall) | 89 (51.4%) | 84 (48.5%) |
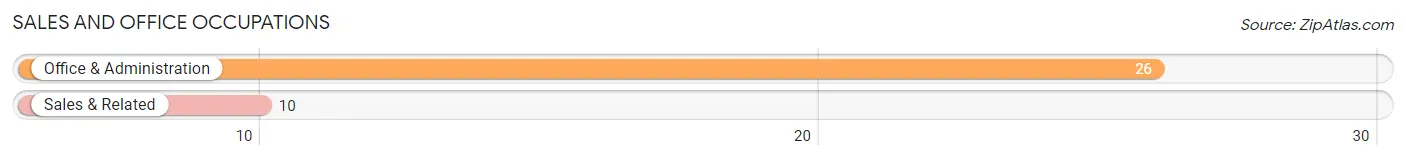
Sales and Office Occupations
The most common Sales and Office occupations in Brisbin borough are Office & Administration (26 | 15.0%), and Sales & Related (10 | 5.8%).
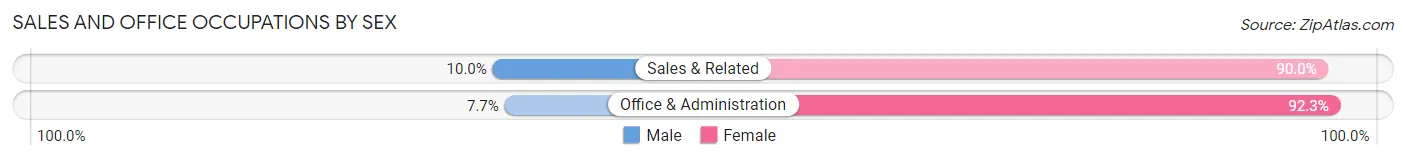
Sales and Office Occupations by Sex
| Occupation | Male | Female |
| Sales & Related | 1 (10.0%) | 9 (90.0%) |
| Office & Administration | 2 (7.7%) | 24 (92.3%) |
| Total (Category) | 3 (8.3%) | 33 (91.7%) |
| Total (Overall) | 89 (51.4%) | 84 (48.5%) |
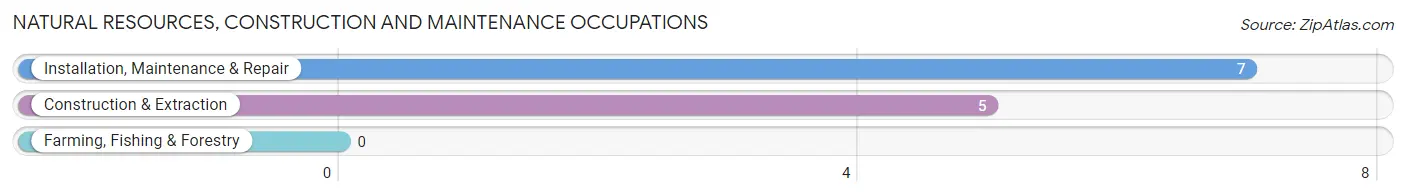
Natural Resources, Construction and Maintenance Occupations
The most common Natural Resources, Construction and Maintenance occupations in Brisbin borough are Installation, Maintenance & Repair (7 | 4.1%), and Construction & Extraction (5 | 2.9%).
Natural Resources, Construction and Maintenance Occupations by Sex
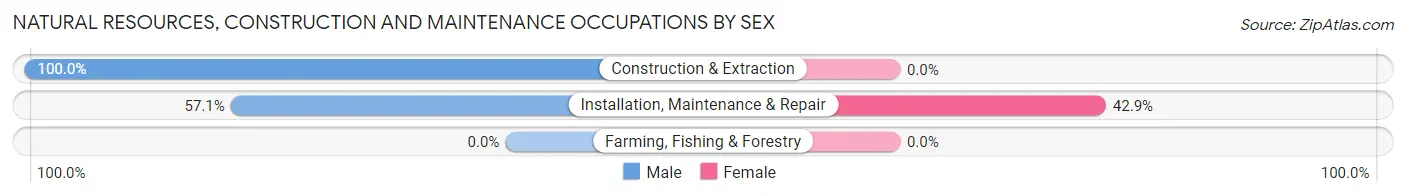
| Occupation | Male | Female |
| Farming, Fishing & Forestry | 0 (0.0%) | 0 (0.0%) |
| Construction & Extraction | 5 (100.0%) | 0 (0.0%) |
| Installation, Maintenance & Repair | 4 (57.1%) | 3 (42.9%) |
| Total (Category) | 9 (75.0%) | 3 (25.0%) |
| Total (Overall) | 89 (51.4%) | 84 (48.5%) |
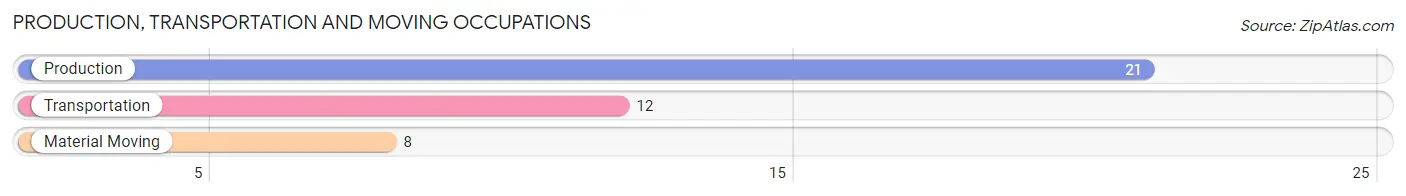
Production, Transportation and Moving Occupations
The most common Production, Transportation and Moving occupations in Brisbin borough are Production (21 | 12.1%), Transportation (12 | 6.9%), and Material Moving (8 | 4.6%).
Production, Transportation and Moving Occupations by Sex
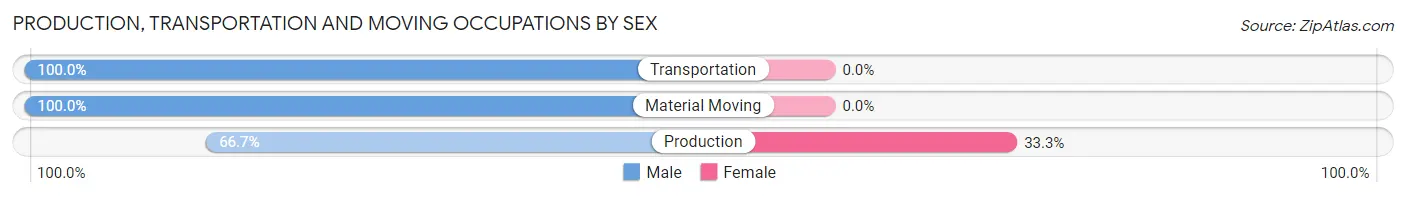
| Occupation | Male | Female |
| Production | 14 (66.7%) | 7 (33.3%) |
| Transportation | 12 (100.0%) | 0 (0.0%) |
| Material Moving | 8 (100.0%) | 0 (0.0%) |
| Total (Category) | 34 (82.9%) | 7 (17.1%) |
| Total (Overall) | 89 (51.4%) | 84 (48.5%) |
Employment Industries by Sex in Brisbin borough
Employment Industries in Brisbin borough
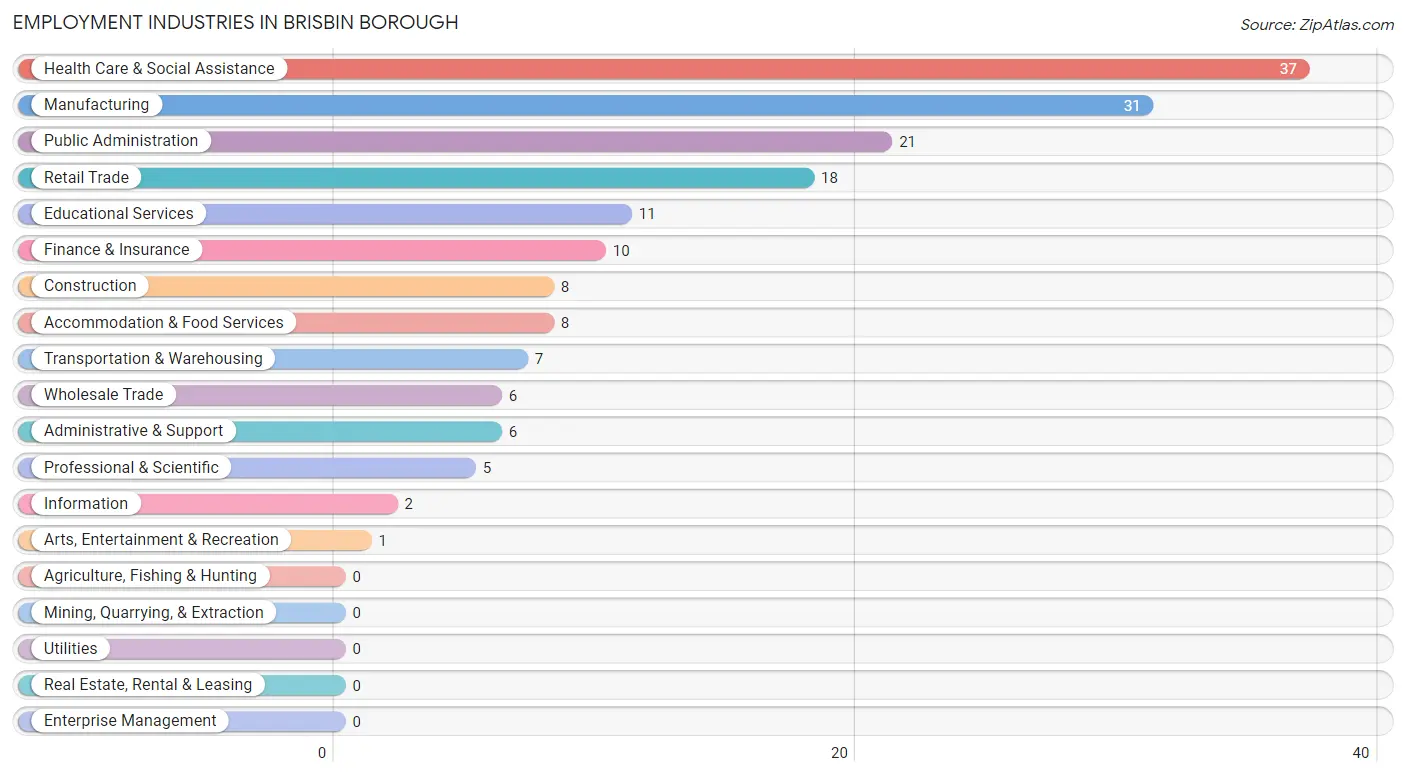
The major employment industries in Brisbin borough include Health Care & Social Assistance (37 | 21.4%), Manufacturing (31 | 17.9%), Public Administration (21 | 12.1%), Retail Trade (18 | 10.4%), and Educational Services (11 | 6.4%).
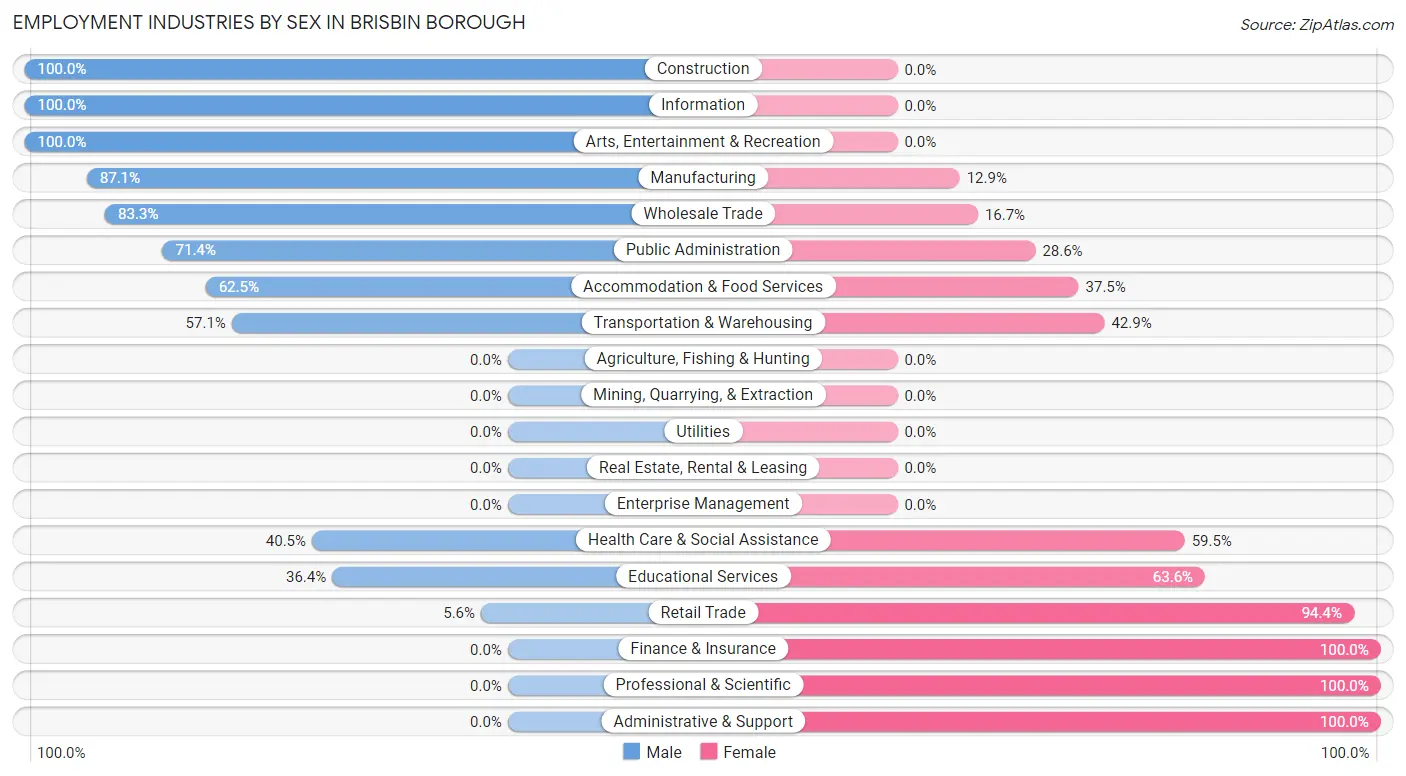
Employment Industries by Sex in Brisbin borough
The Brisbin borough industries that see more men than women are Construction (100.0%), Information (100.0%), and Arts, Entertainment & Recreation (100.0%), whereas the industries that tend to have a higher number of women are Finance & Insurance (100.0%), Professional & Scientific (100.0%), and Administrative & Support (100.0%).
| Industry | Male | Female |
| Agriculture, Fishing & Hunting | 0 (0.0%) | 0 (0.0%) |
| Mining, Quarrying, & Extraction | 0 (0.0%) | 0 (0.0%) |
| Construction | 8 (100.0%) | 0 (0.0%) |
| Manufacturing | 27 (87.1%) | 4 (12.9%) |
| Wholesale Trade | 5 (83.3%) | 1 (16.7%) |
| Retail Trade | 1 (5.6%) | 17 (94.4%) |
| Transportation & Warehousing | 4 (57.1%) | 3 (42.9%) |
| Utilities | 0 (0.0%) | 0 (0.0%) |
| Information | 2 (100.0%) | 0 (0.0%) |
| Finance & Insurance | 0 (0.0%) | 10 (100.0%) |
| Real Estate, Rental & Leasing | 0 (0.0%) | 0 (0.0%) |
| Professional & Scientific | 0 (0.0%) | 5 (100.0%) |
| Enterprise Management | 0 (0.0%) | 0 (0.0%) |
| Administrative & Support | 0 (0.0%) | 6 (100.0%) |
| Educational Services | 4 (36.4%) | 7 (63.6%) |
| Health Care & Social Assistance | 15 (40.5%) | 22 (59.5%) |
| Arts, Entertainment & Recreation | 1 (100.0%) | 0 (0.0%) |
| Accommodation & Food Services | 5 (62.5%) | 3 (37.5%) |
| Public Administration | 15 (71.4%) | 6 (28.6%) |
| Total | 89 (51.4%) | 84 (48.5%) |
Education in Brisbin borough
School Enrollment in Brisbin borough
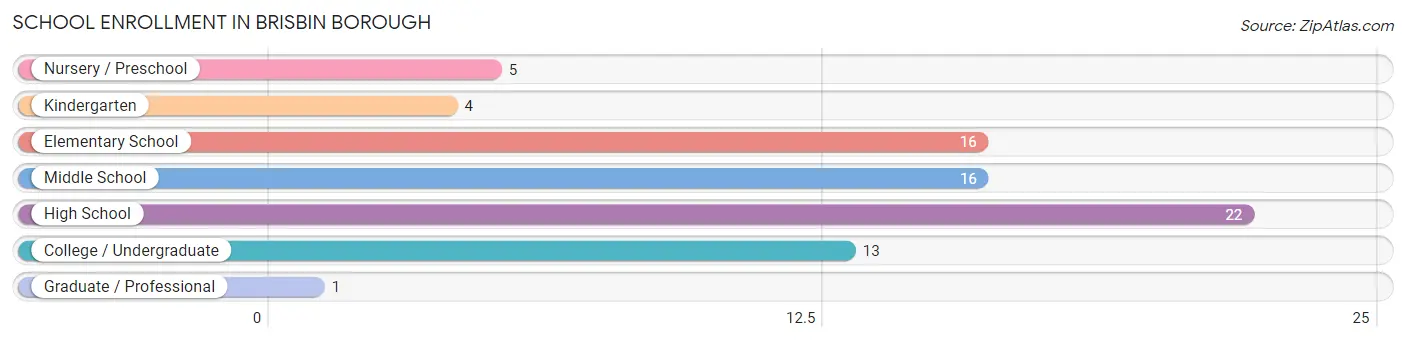
The most common levels of schooling among the 77 students in Brisbin borough are high school (22 | 28.6%), elementary school (16 | 20.8%), and middle school (16 | 20.8%).
| School Level | # Students | % Students |
| Nursery / Preschool | 5 | 6.5% |
| Kindergarten | 4 | 5.2% |
| Elementary School | 16 | 20.8% |
| Middle School | 16 | 20.8% |
| High School | 22 | 28.6% |
| College / Undergraduate | 13 | 16.9% |
| Graduate / Professional | 1 | 1.3% |
| Total | 77 | 100.0% |
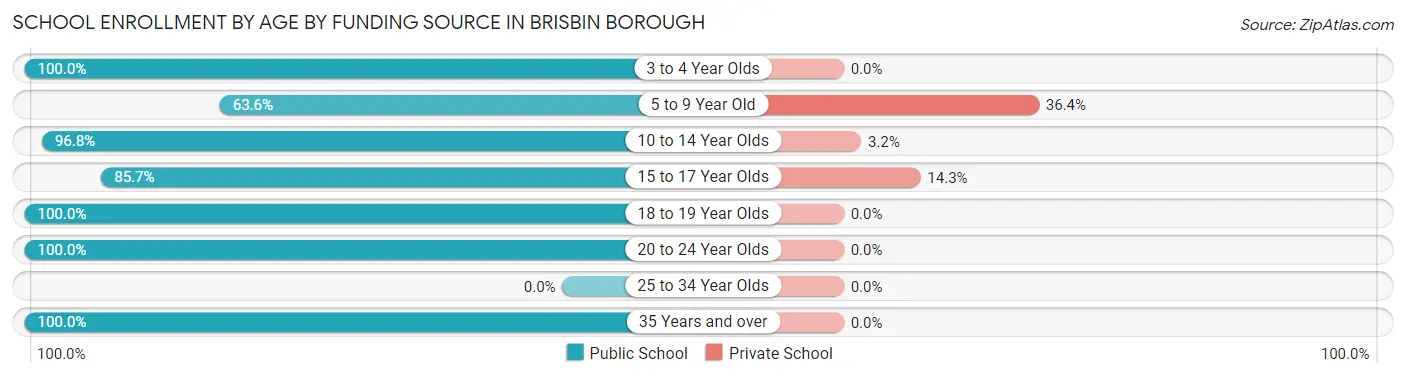
School Enrollment by Age by Funding Source in Brisbin borough
Out of a total of 77 students who are enrolled in schools in Brisbin borough, 7 (9.1%) attend a private institution, while the remaining 70 (90.9%) are enrolled in public schools. The age group of 5 to 9 year old has the highest likelihood of being enrolled in private schools, with 4 (36.4% in the age bracket) enrolled. Conversely, the age group of 3 to 4 year olds has the lowest likelihood of being enrolled in a private school, with 4 (100.0% in the age bracket) attending a public institution.
| Age Bracket | Public School | Private School |
| 3 to 4 Year Olds | 4 (100.0%) | 0 (0.0%) |
| 5 to 9 Year Old | 7 (63.6%) | 4 (36.4%) |
| 10 to 14 Year Olds | 30 (96.8%) | 1 (3.2%) |
| 15 to 17 Year Olds | 12 (85.7%) | 2 (14.3%) |
| 18 to 19 Year Olds | 4 (100.0%) | 0 (0.0%) |
| 20 to 24 Year Olds | 2 (100.0%) | 0 (0.0%) |
| 25 to 34 Year Olds | 0 (0.0%) | 0 (0.0%) |
| 35 Years and over | 11 (100.0%) | 0 (0.0%) |
| Total | 70 (90.9%) | 7 (9.1%) |
Educational Attainment by Field of Study in Brisbin borough
Science & technology (24 | 31.2%), business (18 | 23.4%), arts & humanities (13 | 16.9%), education (7 | 9.1%), and visual & performing arts (4 | 5.2%) are the most common fields of study among 77 individuals in Brisbin borough who have obtained a bachelor's degree or higher.
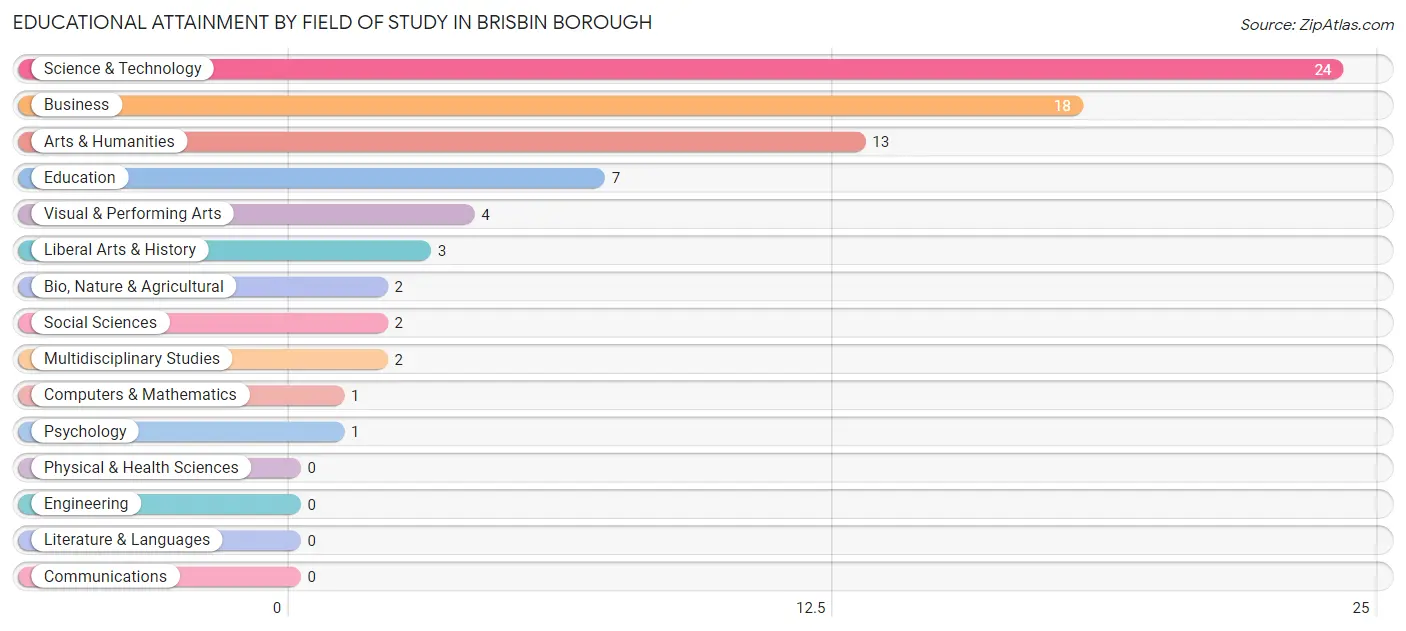
| Field of Study | # Graduates | % Graduates |
| Computers & Mathematics | 1 | 1.3% |
| Bio, Nature & Agricultural | 2 | 2.6% |
| Physical & Health Sciences | 0 | 0.0% |
| Psychology | 1 | 1.3% |
| Social Sciences | 2 | 2.6% |
| Engineering | 0 | 0.0% |
| Multidisciplinary Studies | 2 | 2.6% |
| Science & Technology | 24 | 31.2% |
| Business | 18 | 23.4% |
| Education | 7 | 9.1% |
| Literature & Languages | 0 | 0.0% |
| Liberal Arts & History | 3 | 3.9% |
| Visual & Performing Arts | 4 | 5.2% |
| Communications | 0 | 0.0% |
| Arts & Humanities | 13 | 16.9% |
| Total | 77 | 100.0% |
Transportation & Commute in Brisbin borough
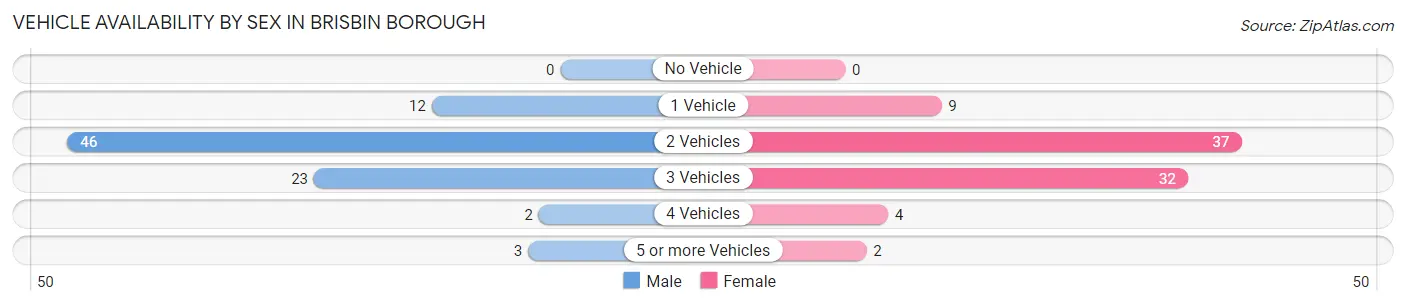
Vehicle Availability by Sex in Brisbin borough
The most prevalent vehicle ownership categories in Brisbin borough are males with 2 vehicles (46, accounting for 53.5%) and females with 2 vehicles (37, making up 54.8%).
| Vehicles Available | Male | Female |
| No Vehicle | 0 (0.0%) | 0 (0.0%) |
| 1 Vehicle | 12 (14.0%) | 9 (10.7%) |
| 2 Vehicles | 46 (53.5%) | 37 (44.1%) |
| 3 Vehicles | 23 (26.7%) | 32 (38.1%) |
| 4 Vehicles | 2 (2.3%) | 4 (4.8%) |
| 5 or more Vehicles | 3 (3.5%) | 2 (2.4%) |
| Total | 86 (100.0%) | 84 (100.0%) |
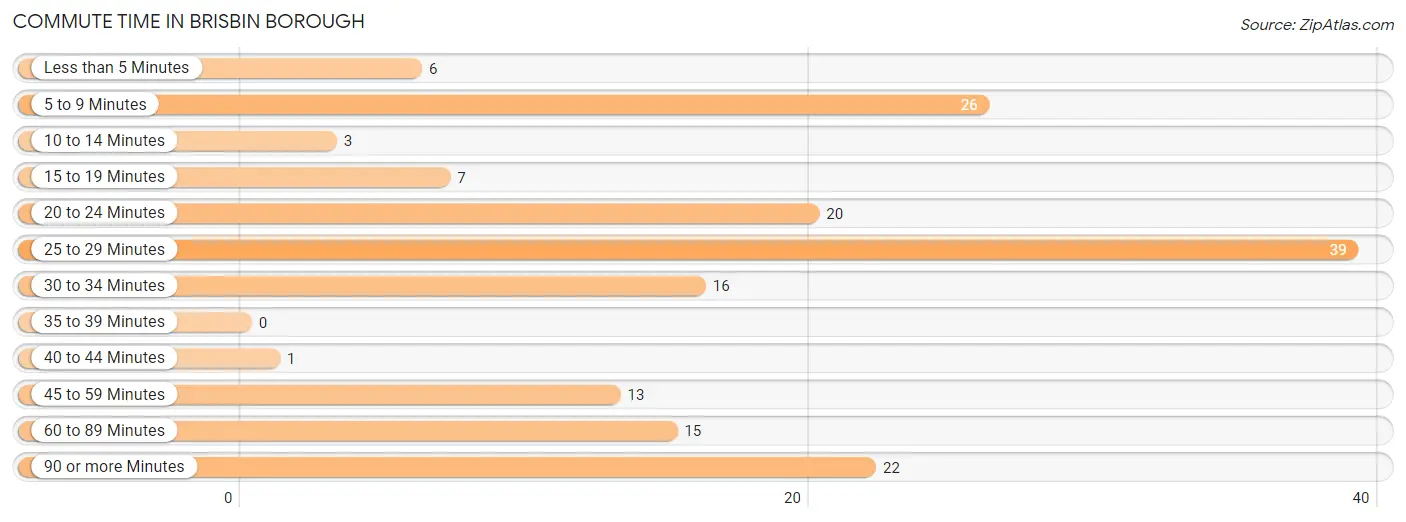
Commute Time in Brisbin borough
The most frequently occuring commute durations in Brisbin borough are 25 to 29 minutes (39 commuters, 23.2%), 5 to 9 minutes (26 commuters, 15.5%), and 90 or more minutes (22 commuters, 13.1%).
| Commute Time | # Commuters | % Commuters |
| Less than 5 Minutes | 6 | 3.6% |
| 5 to 9 Minutes | 26 | 15.5% |
| 10 to 14 Minutes | 3 | 1.8% |
| 15 to 19 Minutes | 7 | 4.2% |
| 20 to 24 Minutes | 20 | 11.9% |
| 25 to 29 Minutes | 39 | 23.2% |
| 30 to 34 Minutes | 16 | 9.5% |
| 35 to 39 Minutes | 0 | 0.0% |
| 40 to 44 Minutes | 1 | 0.6% |
| 45 to 59 Minutes | 13 | 7.7% |
| 60 to 89 Minutes | 15 | 8.9% |
| 90 or more Minutes | 22 | 13.1% |
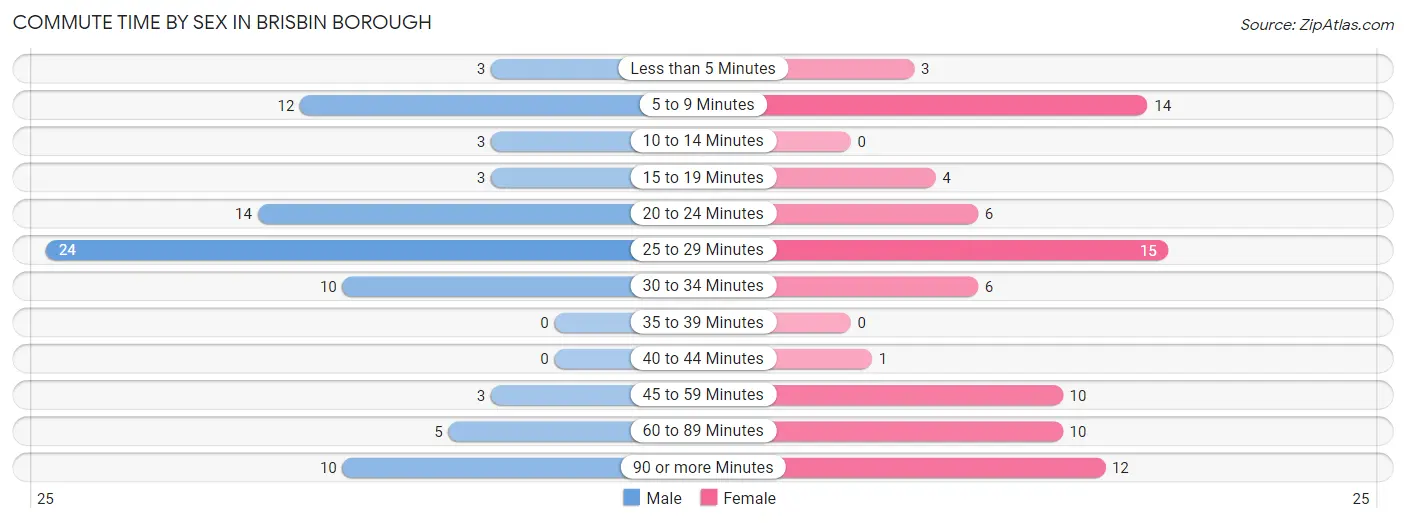
Commute Time by Sex in Brisbin borough
The most common commute times in Brisbin borough are 25 to 29 minutes (24 commuters, 27.6%) for males and 25 to 29 minutes (15 commuters, 18.5%) for females.
| Commute Time | Male | Female |
| Less than 5 Minutes | 3 (3.5%) | 3 (3.7%) |
| 5 to 9 Minutes | 12 (13.8%) | 14 (17.3%) |
| 10 to 14 Minutes | 3 (3.5%) | 0 (0.0%) |
| 15 to 19 Minutes | 3 (3.5%) | 4 (4.9%) |
| 20 to 24 Minutes | 14 (16.1%) | 6 (7.4%) |
| 25 to 29 Minutes | 24 (27.6%) | 15 (18.5%) |
| 30 to 34 Minutes | 10 (11.5%) | 6 (7.4%) |
| 35 to 39 Minutes | 0 (0.0%) | 0 (0.0%) |
| 40 to 44 Minutes | 0 (0.0%) | 1 (1.2%) |
| 45 to 59 Minutes | 3 (3.5%) | 10 (12.3%) |
| 60 to 89 Minutes | 5 (5.8%) | 10 (12.3%) |
| 90 or more Minutes | 10 (11.5%) | 12 (14.8%) |
Time of Departure to Work by Sex in Brisbin borough
The most frequent times of departure to work in Brisbin borough are 12:00 PM to 3:59 PM (19, 21.8%) for males and 7:00 AM to 7:29 AM (28, 34.6%) for females.
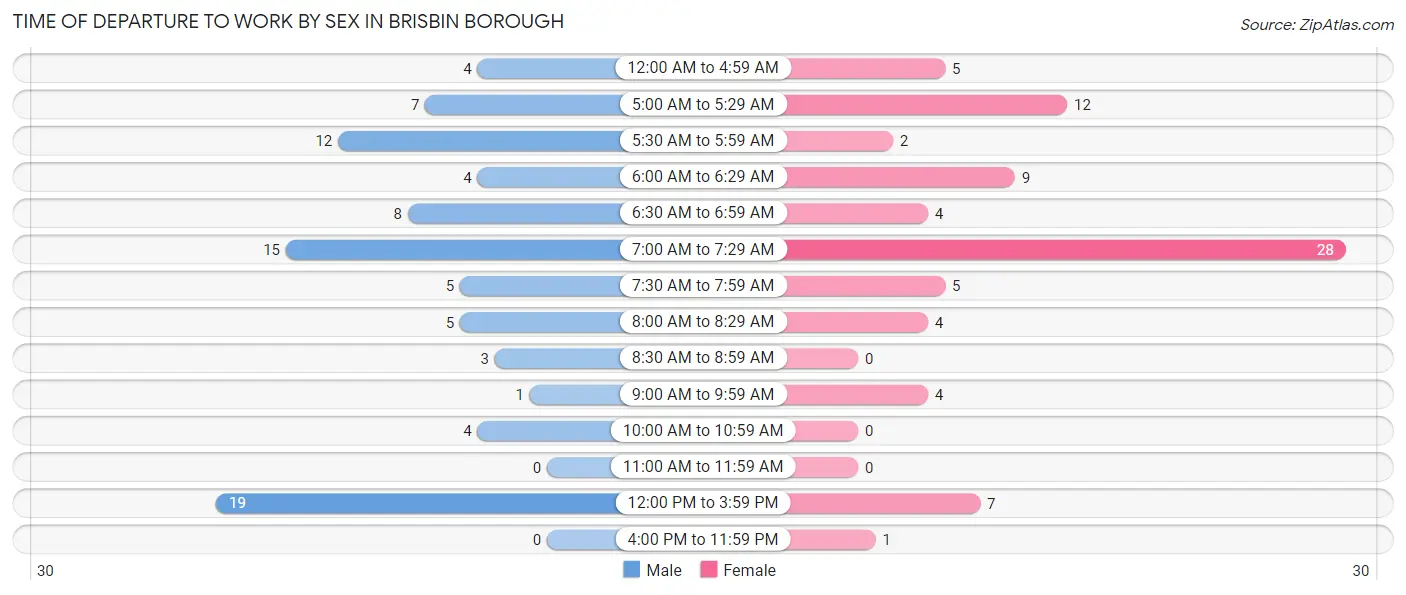
| Time of Departure | Male | Female |
| 12:00 AM to 4:59 AM | 4 (4.6%) | 5 (6.2%) |
| 5:00 AM to 5:29 AM | 7 (8.1%) | 12 (14.8%) |
| 5:30 AM to 5:59 AM | 12 (13.8%) | 2 (2.5%) |
| 6:00 AM to 6:29 AM | 4 (4.6%) | 9 (11.1%) |
| 6:30 AM to 6:59 AM | 8 (9.2%) | 4 (4.9%) |
| 7:00 AM to 7:29 AM | 15 (17.2%) | 28 (34.6%) |
| 7:30 AM to 7:59 AM | 5 (5.8%) | 5 (6.2%) |
| 8:00 AM to 8:29 AM | 5 (5.8%) | 4 (4.9%) |
| 8:30 AM to 8:59 AM | 3 (3.5%) | 0 (0.0%) |
| 9:00 AM to 9:59 AM | 1 (1.1%) | 4 (4.9%) |
| 10:00 AM to 10:59 AM | 4 (4.6%) | 0 (0.0%) |
| 11:00 AM to 11:59 AM | 0 (0.0%) | 0 (0.0%) |
| 12:00 PM to 3:59 PM | 19 (21.8%) | 7 (8.6%) |
| 4:00 PM to 11:59 PM | 0 (0.0%) | 1 (1.2%) |
| Total | 87 (100.0%) | 81 (100.0%) |
Housing Occupancy in Brisbin borough
Occupancy by Ownership in Brisbin borough
Of the total 152 dwellings in Brisbin borough, owner-occupied units account for 121 (79.6%), while renter-occupied units make up 31 (20.4%).
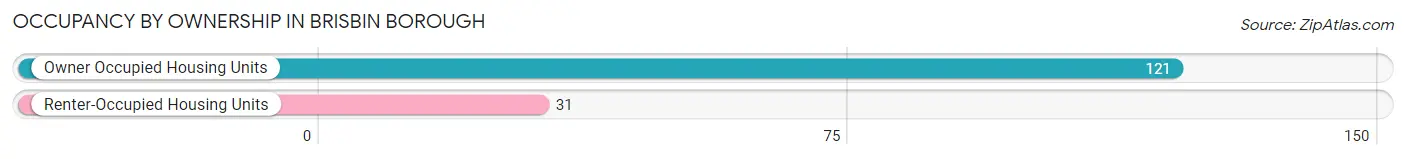
| Occupancy | # Housing Units | % Housing Units |
| Owner Occupied Housing Units | 121 | 79.6% |
| Renter-Occupied Housing Units | 31 | 20.4% |
| Total Occupied Housing Units | 152 | 100.0% |
Occupancy by Household Size in Brisbin borough
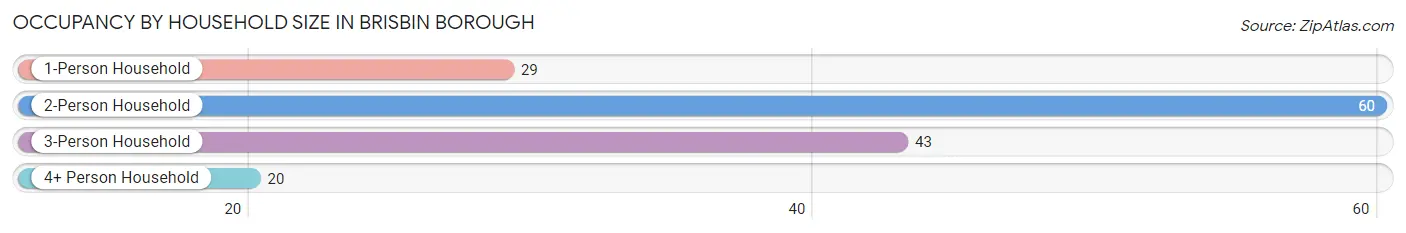
| Household Size | # Housing Units | % Housing Units |
| 1-Person Household | 29 | 19.1% |
| 2-Person Household | 60 | 39.5% |
| 3-Person Household | 43 | 28.3% |
| 4+ Person Household | 20 | 13.2% |
| Total Housing Units | 152 | 100.0% |
Occupancy by Ownership by Household Size in Brisbin borough
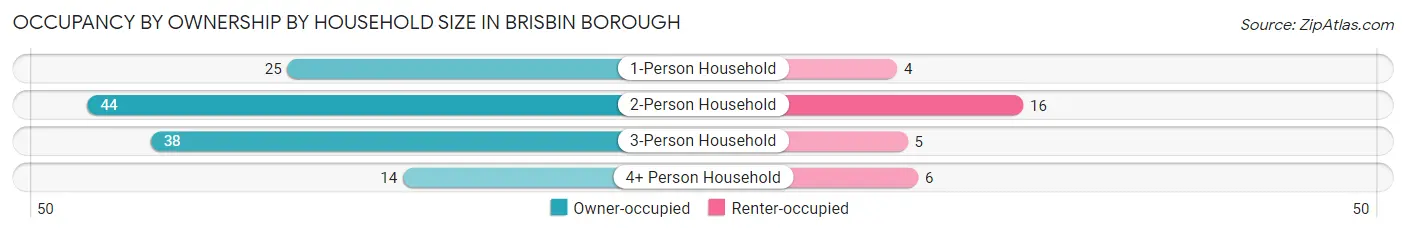
| Household Size | Owner-occupied | Renter-occupied |
| 1-Person Household | 25 (86.2%) | 4 (13.8%) |
| 2-Person Household | 44 (73.3%) | 16 (26.7%) |
| 3-Person Household | 38 (88.4%) | 5 (11.6%) |
| 4+ Person Household | 14 (70.0%) | 6 (30.0%) |
| Total Housing Units | 121 (79.6%) | 31 (20.4%) |
Occupancy by Educational Attainment in Brisbin borough
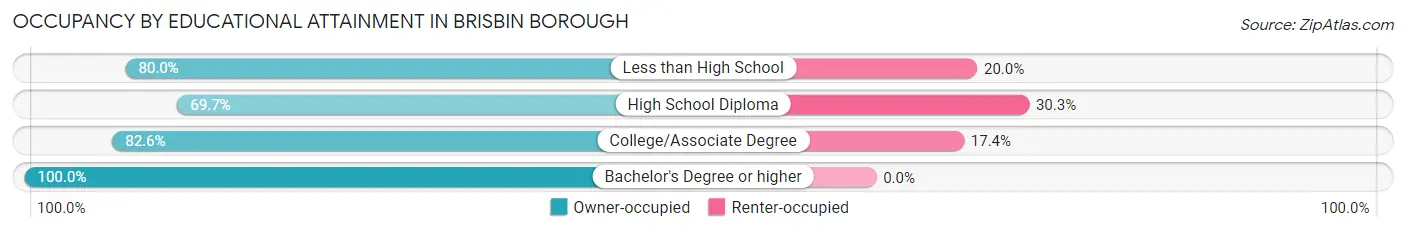
| Household Size | Owner-occupied | Renter-occupied |
| Less than High School | 12 (80.0%) | 3 (20.0%) |
| High School Diploma | 46 (69.7%) | 20 (30.3%) |
| College/Associate Degree | 38 (82.6%) | 8 (17.4%) |
| Bachelor's Degree or higher | 25 (100.0%) | 0 (0.0%) |
Occupancy by Age of Householder in Brisbin borough
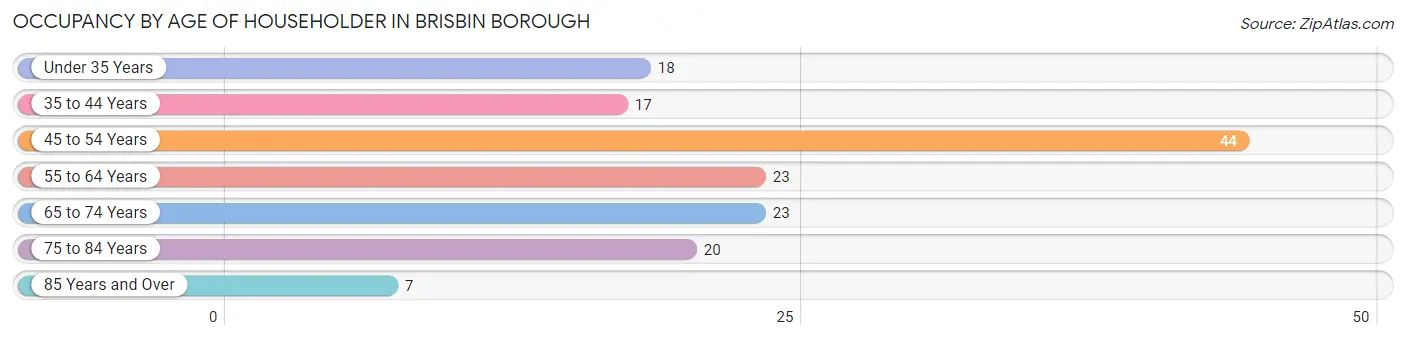
| Age Bracket | # Households | % Households |
| Under 35 Years | 18 | 11.8% |
| 35 to 44 Years | 17 | 11.2% |
| 45 to 54 Years | 44 | 28.9% |
| 55 to 64 Years | 23 | 15.1% |
| 65 to 74 Years | 23 | 15.1% |
| 75 to 84 Years | 20 | 13.2% |
| 85 Years and Over | 7 | 4.6% |
| Total | 152 | 100.0% |
Housing Finances in Brisbin borough
Median Income by Occupancy in Brisbin borough
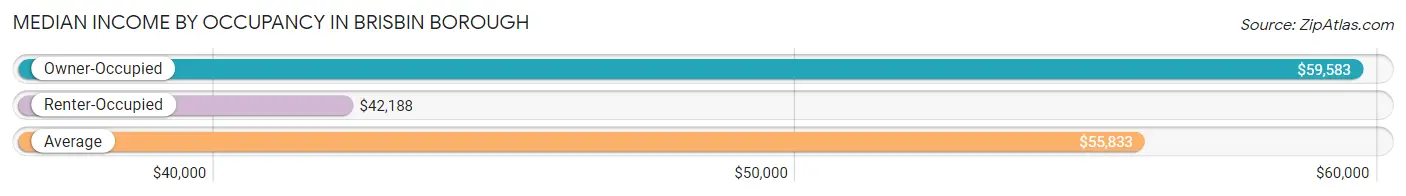
| Occupancy Type | # Households | Median Income |
| Owner-Occupied | 121 (79.6%) | $59,583 |
| Renter-Occupied | 31 (20.4%) | $42,188 |
| Average | 152 (100.0%) | $55,833 |
Occupancy by Householder Income Bracket in Brisbin borough
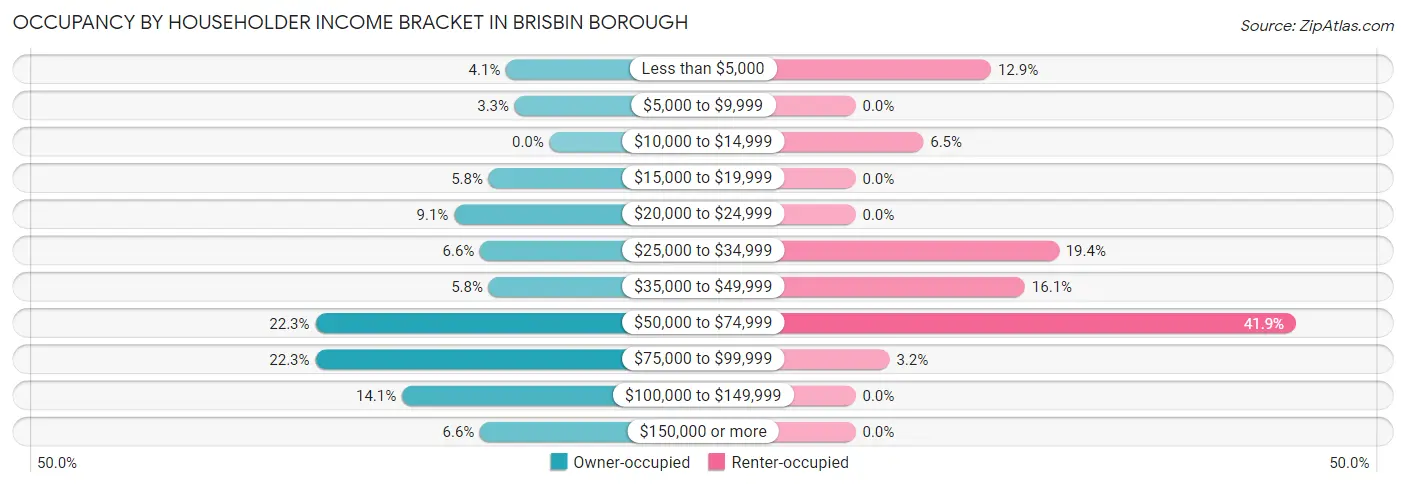
| Income Bracket | Owner-occupied | Renter-occupied |
| Less than $5,000 | 5 (4.1%) | 4 (12.9%) |
| $5,000 to $9,999 | 4 (3.3%) | 0 (0.0%) |
| $10,000 to $14,999 | 0 (0.0%) | 2 (6.5%) |
| $15,000 to $19,999 | 7 (5.8%) | 0 (0.0%) |
| $20,000 to $24,999 | 11 (9.1%) | 0 (0.0%) |
| $25,000 to $34,999 | 8 (6.6%) | 6 (19.4%) |
| $35,000 to $49,999 | 7 (5.8%) | 5 (16.1%) |
| $50,000 to $74,999 | 27 (22.3%) | 13 (41.9%) |
| $75,000 to $99,999 | 27 (22.3%) | 1 (3.2%) |
| $100,000 to $149,999 | 17 (14.1%) | 0 (0.0%) |
| $150,000 or more | 8 (6.6%) | 0 (0.0%) |
| Total | 121 (100.0%) | 31 (100.0%) |
Monthly Housing Cost Tiers in Brisbin borough
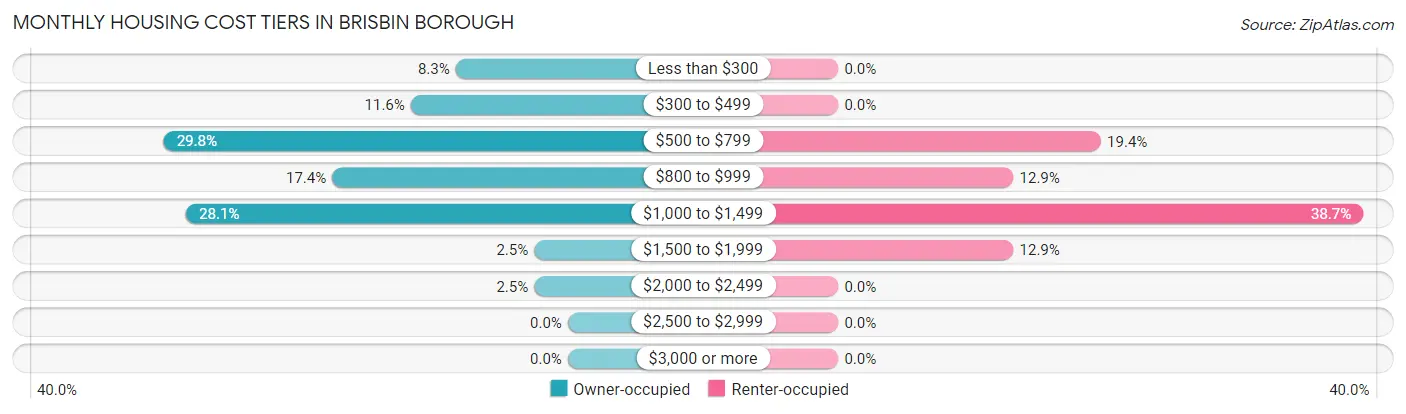
| Monthly Cost | Owner-occupied | Renter-occupied |
| Less than $300 | 10 (8.3%) | 0 (0.0%) |
| $300 to $499 | 14 (11.6%) | 0 (0.0%) |
| $500 to $799 | 36 (29.7%) | 6 (19.4%) |
| $800 to $999 | 21 (17.4%) | 4 (12.9%) |
| $1,000 to $1,499 | 34 (28.1%) | 12 (38.7%) |
| $1,500 to $1,999 | 3 (2.5%) | 4 (12.9%) |
| $2,000 to $2,499 | 3 (2.5%) | 0 (0.0%) |
| $2,500 to $2,999 | 0 (0.0%) | 0 (0.0%) |
| $3,000 or more | 0 (0.0%) | 0 (0.0%) |
| Total | 121 (100.0%) | 31 (100.0%) |
Physical Housing Characteristics in Brisbin borough
Housing Structures in Brisbin borough
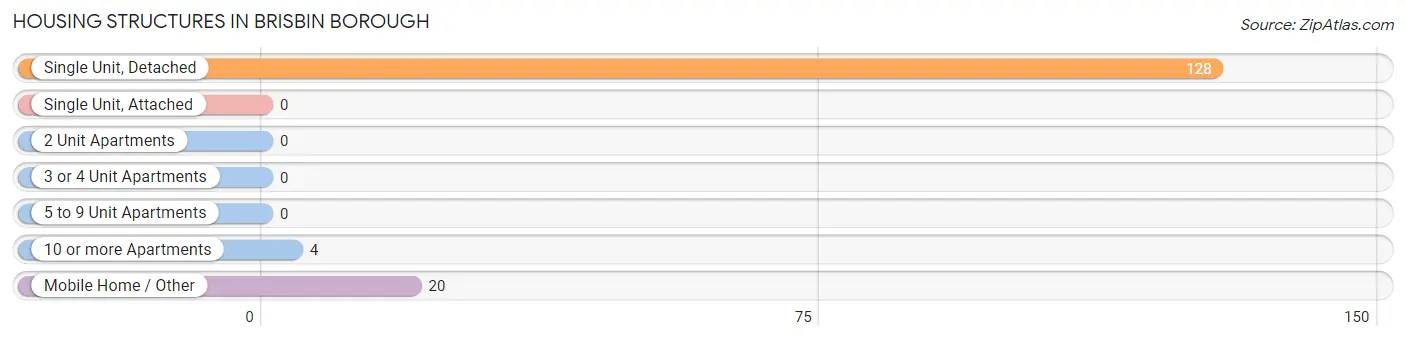
| Structure Type | # Housing Units | % Housing Units |
| Single Unit, Detached | 128 | 84.2% |
| Single Unit, Attached | 0 | 0.0% |
| 2 Unit Apartments | 0 | 0.0% |
| 3 or 4 Unit Apartments | 0 | 0.0% |
| 5 to 9 Unit Apartments | 0 | 0.0% |
| 10 or more Apartments | 4 | 2.6% |
| Mobile Home / Other | 20 | 13.2% |
| Total | 152 | 100.0% |
Housing Structures by Occupancy in Brisbin borough
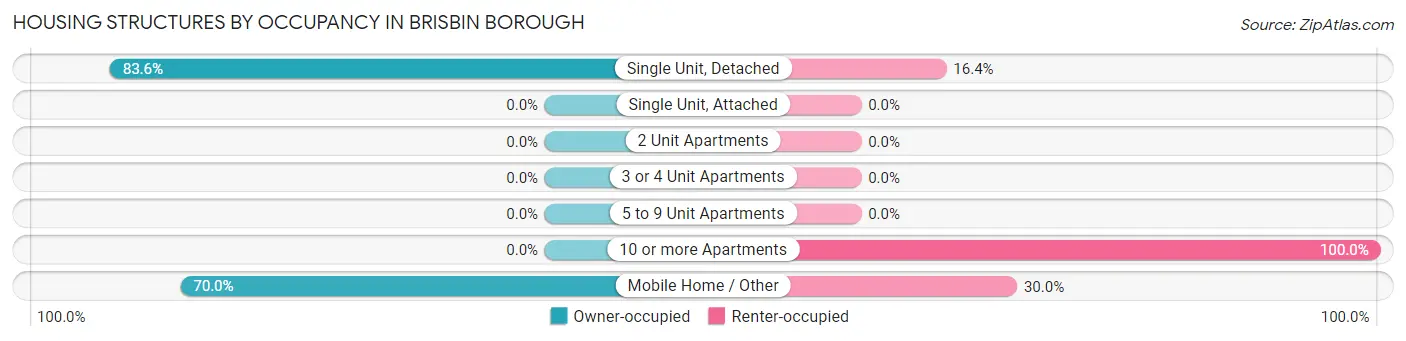
| Structure Type | Owner-occupied | Renter-occupied |
| Single Unit, Detached | 107 (83.6%) | 21 (16.4%) |
| Single Unit, Attached | 0 (0.0%) | 0 (0.0%) |
| 2 Unit Apartments | 0 (0.0%) | 0 (0.0%) |
| 3 or 4 Unit Apartments | 0 (0.0%) | 0 (0.0%) |
| 5 to 9 Unit Apartments | 0 (0.0%) | 0 (0.0%) |
| 10 or more Apartments | 0 (0.0%) | 4 (100.0%) |
| Mobile Home / Other | 14 (70.0%) | 6 (30.0%) |
| Total | 121 (79.6%) | 31 (20.4%) |
Housing Structures by Number of Rooms in Brisbin borough
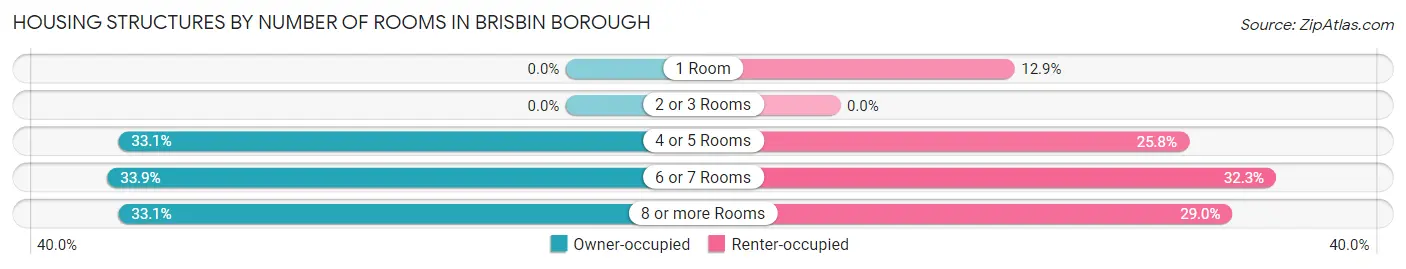
| Number of Rooms | Owner-occupied | Renter-occupied |
| 1 Room | 0 (0.0%) | 4 (12.9%) |
| 2 or 3 Rooms | 0 (0.0%) | 0 (0.0%) |
| 4 or 5 Rooms | 40 (33.1%) | 8 (25.8%) |
| 6 or 7 Rooms | 41 (33.9%) | 10 (32.3%) |
| 8 or more Rooms | 40 (33.1%) | 9 (29.0%) |
| Total | 121 (100.0%) | 31 (100.0%) |
Housing Structure by Heating Type in Brisbin borough
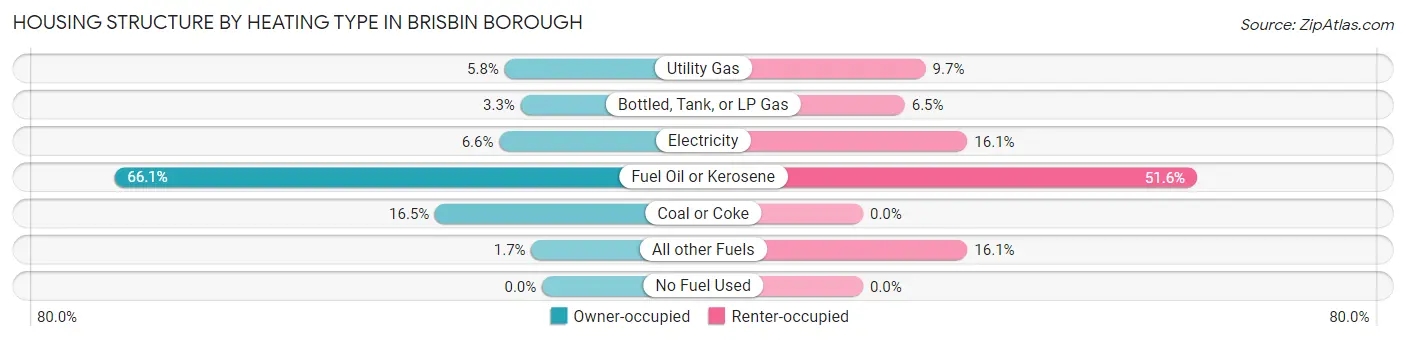
| Heating Type | Owner-occupied | Renter-occupied |
| Utility Gas | 7 (5.8%) | 3 (9.7%) |
| Bottled, Tank, or LP Gas | 4 (3.3%) | 2 (6.5%) |
| Electricity | 8 (6.6%) | 5 (16.1%) |
| Fuel Oil or Kerosene | 80 (66.1%) | 16 (51.6%) |
| Coal or Coke | 20 (16.5%) | 0 (0.0%) |
| All other Fuels | 2 (1.7%) | 5 (16.1%) |
| No Fuel Used | 0 (0.0%) | 0 (0.0%) |
| Total | 121 (100.0%) | 31 (100.0%) |
Household Vehicle Usage in Brisbin borough
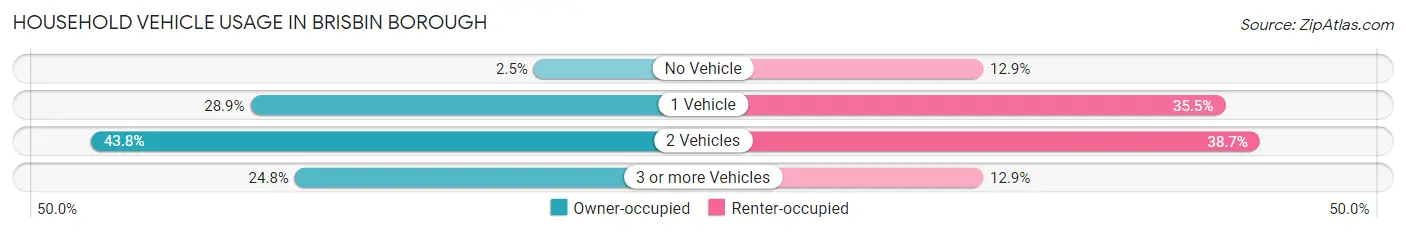
| Vehicles per Household | Owner-occupied | Renter-occupied |
| No Vehicle | 3 (2.5%) | 4 (12.9%) |
| 1 Vehicle | 35 (28.9%) | 11 (35.5%) |
| 2 Vehicles | 53 (43.8%) | 12 (38.7%) |
| 3 or more Vehicles | 30 (24.8%) | 4 (12.9%) |
| Total | 121 (100.0%) | 31 (100.0%) |
Real Estate & Mortgages in Brisbin borough
Real Estate and Mortgage Overview in Brisbin borough
| Characteristic | Without Mortgage | With Mortgage |
| Housing Units | 62 | 59 |
| Median Property Value | $125,000 | $110,400 |
| Median Household Income | $53,125 | $2 |
| Monthly Housing Costs | $570 | $0 |
| Real Estate Taxes | $1,292 | $0 |
Property Value by Mortgage Status in Brisbin borough
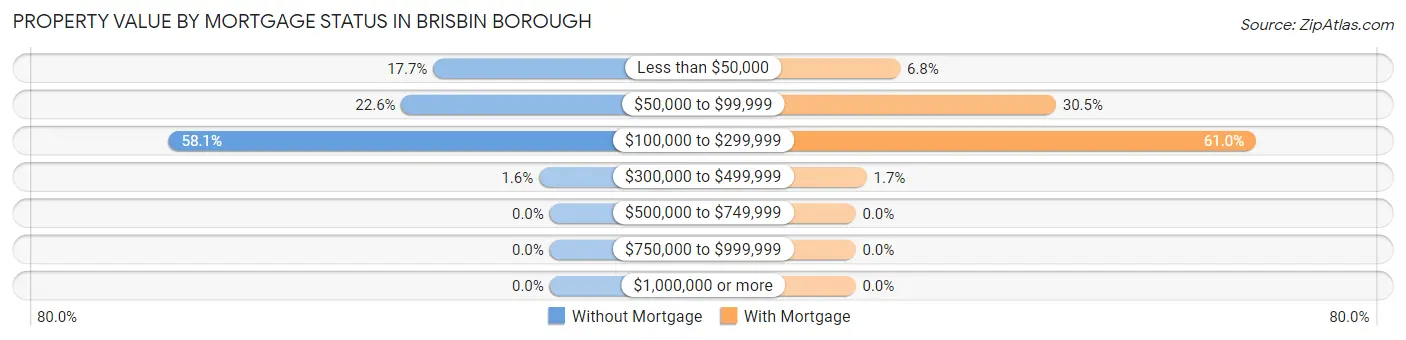
| Property Value | Without Mortgage | With Mortgage |
| Less than $50,000 | 11 (17.7%) | 4 (6.8%) |
| $50,000 to $99,999 | 14 (22.6%) | 18 (30.5%) |
| $100,000 to $299,999 | 36 (58.1%) | 36 (61.0%) |
| $300,000 to $499,999 | 1 (1.6%) | 1 (1.7%) |
| $500,000 to $749,999 | 0 (0.0%) | 0 (0.0%) |
| $750,000 to $999,999 | 0 (0.0%) | 0 (0.0%) |
| $1,000,000 or more | 0 (0.0%) | 0 (0.0%) |
| Total | 62 (100.0%) | 59 (100.0%) |
Household Income by Mortgage Status in Brisbin borough
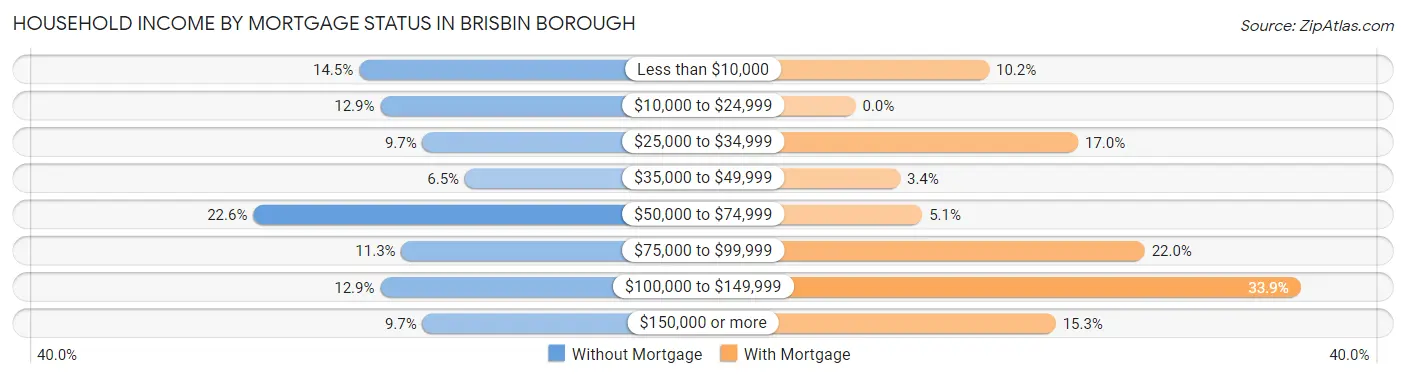
| Household Income | Without Mortgage | With Mortgage |
| Less than $10,000 | 9 (14.5%) | 6 (10.2%) |
| $10,000 to $24,999 | 8 (12.9%) | 0 (0.0%) |
| $25,000 to $34,999 | 6 (9.7%) | 10 (17.0%) |
| $35,000 to $49,999 | 4 (6.5%) | 2 (3.4%) |
| $50,000 to $74,999 | 14 (22.6%) | 3 (5.1%) |
| $75,000 to $99,999 | 7 (11.3%) | 13 (22.0%) |
| $100,000 to $149,999 | 8 (12.9%) | 20 (33.9%) |
| $150,000 or more | 6 (9.7%) | 9 (15.2%) |
| Total | 62 (100.0%) | 59 (100.0%) |
Property Value to Household Income Ratio in Brisbin borough
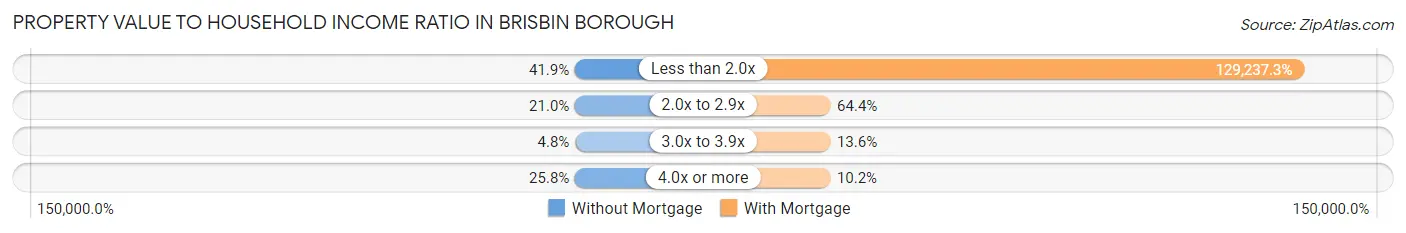
| Value-to-Income Ratio | Without Mortgage | With Mortgage |
| Less than 2.0x | 26 (41.9%) | 76,250 (129,237.3%) |
| 2.0x to 2.9x | 13 (21.0%) | 38 (64.4%) |
| 3.0x to 3.9x | 3 (4.8%) | 8 (13.6%) |
| 4.0x or more | 16 (25.8%) | 6 (10.2%) |
| Total | 62 (100.0%) | 59 (100.0%) |
Real Estate Taxes by Mortgage Status in Brisbin borough
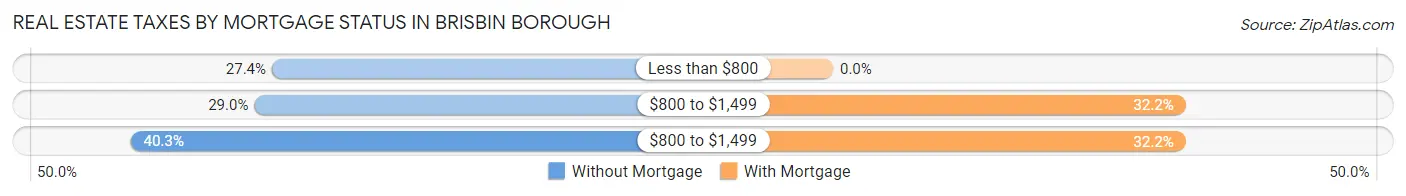
| Property Taxes | Without Mortgage | With Mortgage |
| Less than $800 | 17 (27.4%) | 0 (0.0%) |
| $800 to $1,499 | 18 (29.0%) | 19 (32.2%) |
| $800 to $1,499 | 25 (40.3%) | 19 (32.2%) |
| Total | 62 (100.0%) | 59 (100.0%) |
Health & Disability in Brisbin borough
Health Insurance Coverage by Age in Brisbin borough
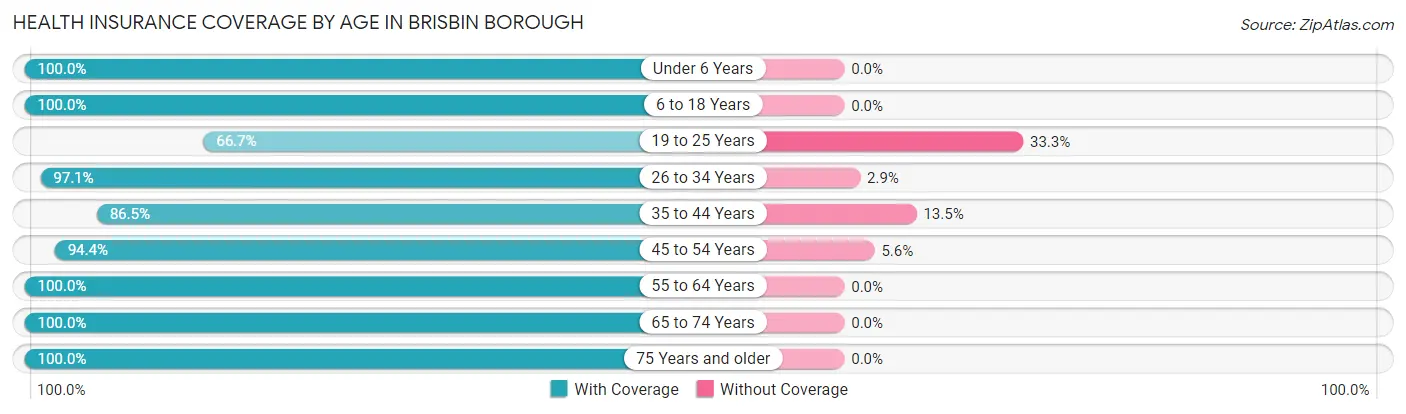
| Age Bracket | With Coverage | Without Coverage |
| Under 6 Years | 15 (100.0%) | 0 (0.0%) |
| 6 to 18 Years | 51 (100.0%) | 0 (0.0%) |
| 19 to 25 Years | 8 (66.7%) | 4 (33.3%) |
| 26 to 34 Years | 33 (97.1%) | 1 (2.9%) |
| 35 to 44 Years | 45 (86.5%) | 7 (13.5%) |
| 45 to 54 Years | 84 (94.4%) | 5 (5.6%) |
| 55 to 64 Years | 48 (100.0%) | 0 (0.0%) |
| 65 to 74 Years | 45 (100.0%) | 0 (0.0%) |
| 75 Years and older | 41 (100.0%) | 0 (0.0%) |
| Total | 370 (95.6%) | 17 (4.4%) |
Health Insurance Coverage by Citizenship Status in Brisbin borough
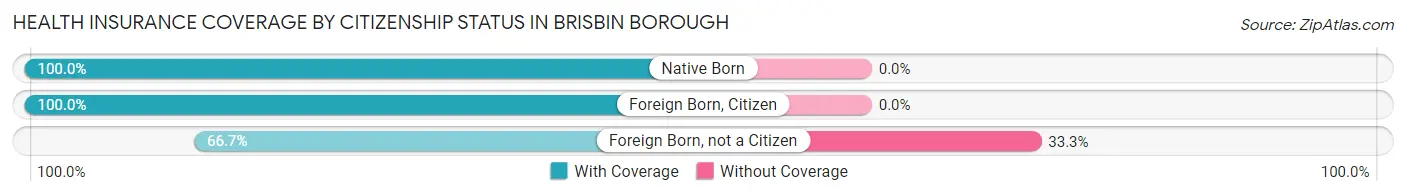
| Citizenship Status | With Coverage | Without Coverage |
| Native Born | 15 (100.0%) | 0 (0.0%) |
| Foreign Born, Citizen | 51 (100.0%) | 0 (0.0%) |
| Foreign Born, not a Citizen | 8 (66.7%) | 4 (33.3%) |
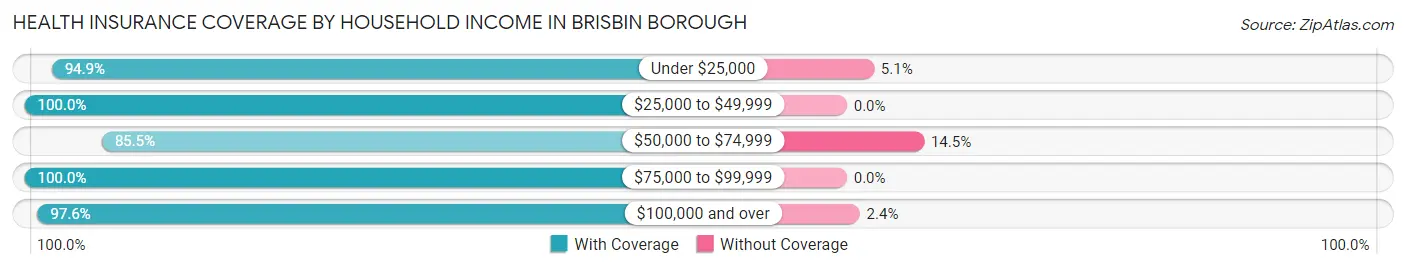
Health Insurance Coverage by Household Income in Brisbin borough
| Household Income | With Coverage | Without Coverage |
| Under $25,000 | 56 (94.9%) | 3 (5.1%) |
| $25,000 to $49,999 | 56 (100.0%) | 0 (0.0%) |
| $50,000 to $74,999 | 71 (85.5%) | 12 (14.5%) |
| $75,000 to $99,999 | 82 (100.0%) | 0 (0.0%) |
| $100,000 and over | 81 (97.6%) | 2 (2.4%) |
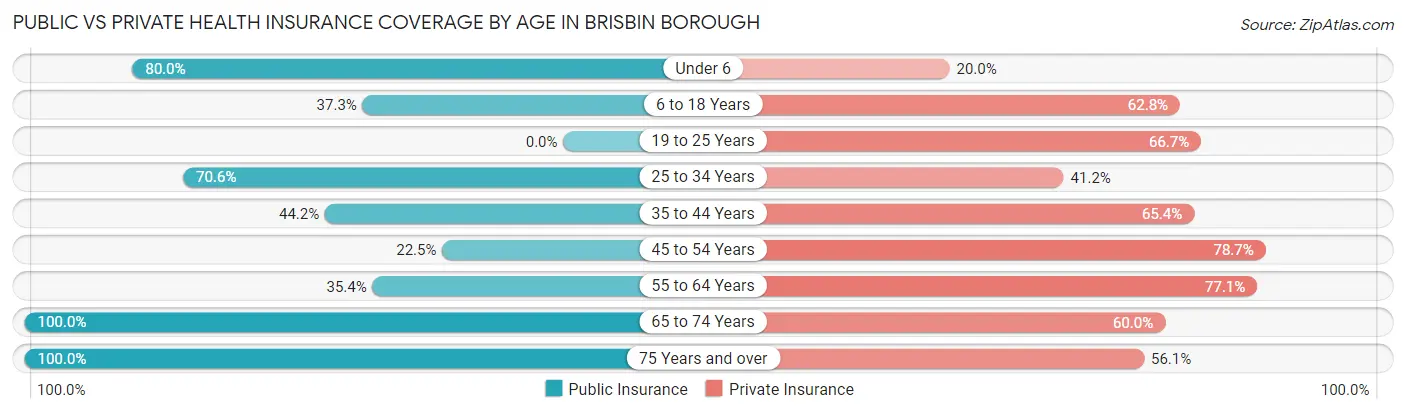
Public vs Private Health Insurance Coverage by Age in Brisbin borough
| Age Bracket | Public Insurance | Private Insurance |
| Under 6 | 12 (80.0%) | 3 (20.0%) |
| 6 to 18 Years | 19 (37.2%) | 32 (62.7%) |
| 19 to 25 Years | 0 (0.0%) | 8 (66.7%) |
| 25 to 34 Years | 24 (70.6%) | 14 (41.2%) |
| 35 to 44 Years | 23 (44.2%) | 34 (65.4%) |
| 45 to 54 Years | 20 (22.5%) | 70 (78.6%) |
| 55 to 64 Years | 17 (35.4%) | 37 (77.1%) |
| 65 to 74 Years | 45 (100.0%) | 27 (60.0%) |
| 75 Years and over | 41 (100.0%) | 23 (56.1%) |
| Total | 201 (51.9%) | 248 (64.1%) |
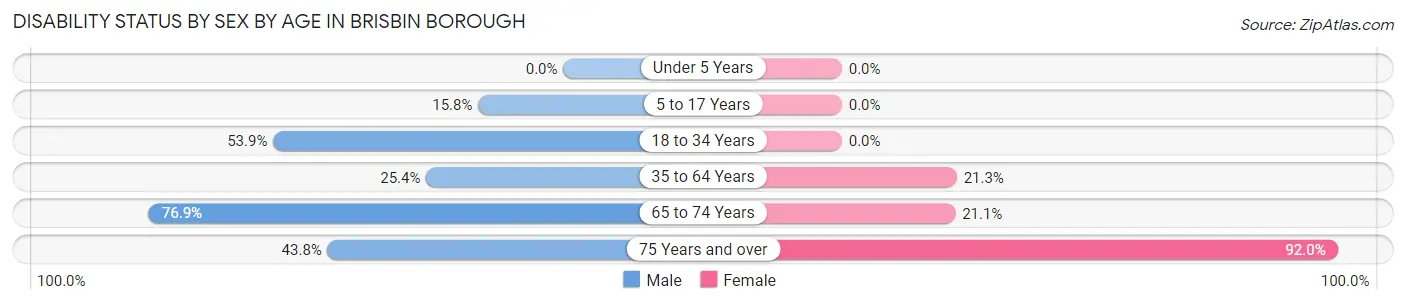
Disability Status by Sex by Age in Brisbin borough
| Age Bracket | Male | Female |
| Under 5 Years | 0 (0.0%) | 0 (0.0%) |
| 5 to 17 Years | 3 (15.8%) | 0 (0.0%) |
| 18 to 34 Years | 7 (53.8%) | 0 (0.0%) |
| 35 to 64 Years | 29 (25.4%) | 16 (21.3%) |
| 65 to 74 Years | 20 (76.9%) | 4 (21.0%) |
| 75 Years and over | 7 (43.8%) | 23 (92.0%) |
Disability Class by Sex by Age in Brisbin borough
Disability Class: Hearing Difficulty
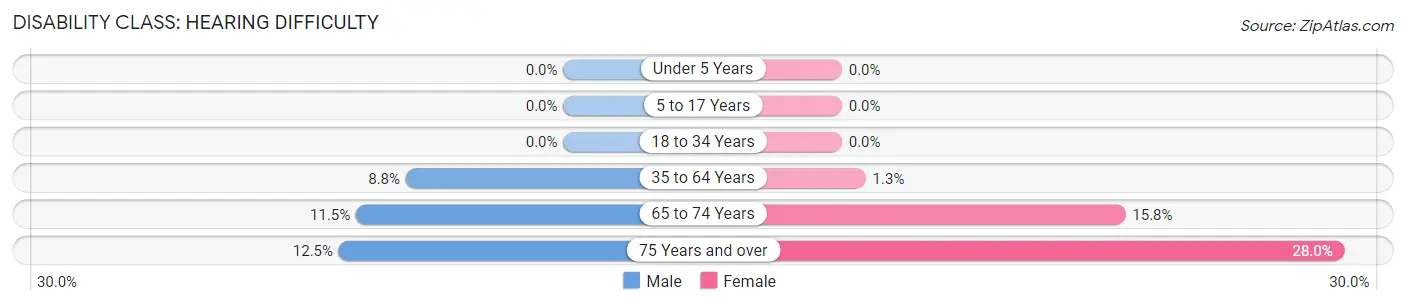
| Age Bracket | Male | Female |
| Under 5 Years | 0 (0.0%) | 0 (0.0%) |
| 5 to 17 Years | 0 (0.0%) | 0 (0.0%) |
| 18 to 34 Years | 0 (0.0%) | 0 (0.0%) |
| 35 to 64 Years | 10 (8.8%) | 1 (1.3%) |
| 65 to 74 Years | 3 (11.5%) | 3 (15.8%) |
| 75 Years and over | 2 (12.5%) | 7 (28.0%) |
Disability Class: Vision Difficulty
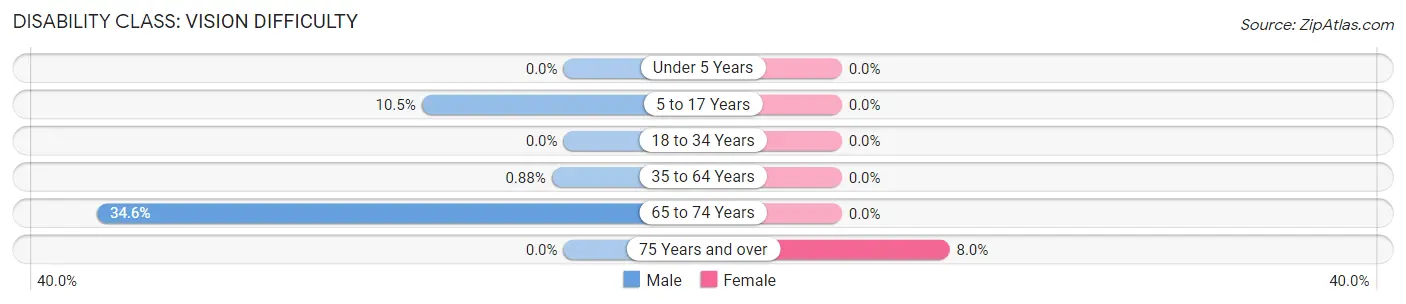
| Age Bracket | Male | Female |
| Under 5 Years | 0 (0.0%) | 0 (0.0%) |
| 5 to 17 Years | 2 (10.5%) | 0 (0.0%) |
| 18 to 34 Years | 0 (0.0%) | 0 (0.0%) |
| 35 to 64 Years | 1 (0.9%) | 0 (0.0%) |
| 65 to 74 Years | 9 (34.6%) | 0 (0.0%) |
| 75 Years and over | 0 (0.0%) | 2 (8.0%) |
Disability Class: Cognitive Difficulty
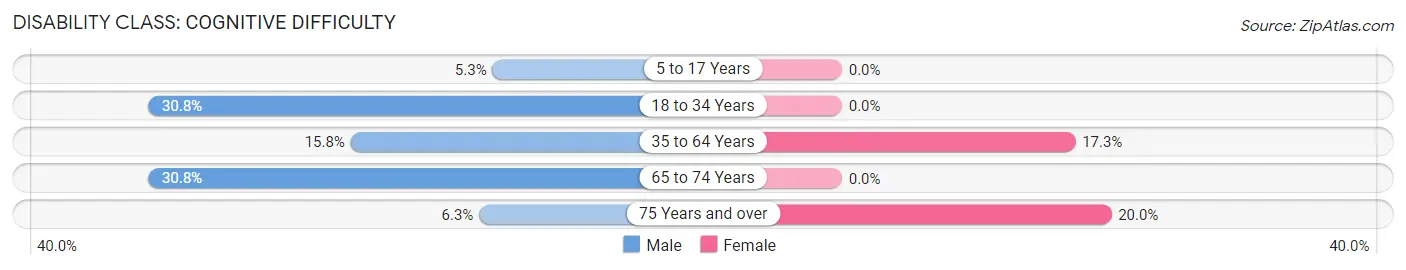
| Age Bracket | Male | Female |
| 5 to 17 Years | 1 (5.3%) | 0 (0.0%) |
| 18 to 34 Years | 4 (30.8%) | 0 (0.0%) |
| 35 to 64 Years | 18 (15.8%) | 13 (17.3%) |
| 65 to 74 Years | 8 (30.8%) | 0 (0.0%) |
| 75 Years and over | 1 (6.2%) | 5 (20.0%) |
Disability Class: Ambulatory Difficulty
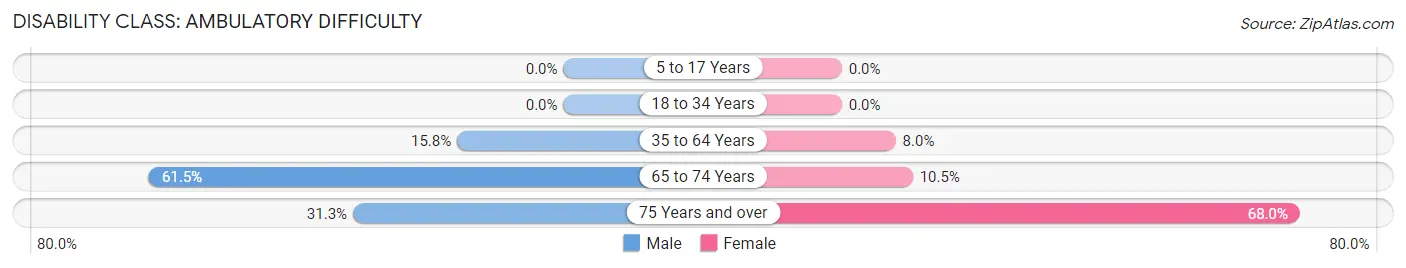
| Age Bracket | Male | Female |
| 5 to 17 Years | 0 (0.0%) | 0 (0.0%) |
| 18 to 34 Years | 0 (0.0%) | 0 (0.0%) |
| 35 to 64 Years | 18 (15.8%) | 6 (8.0%) |
| 65 to 74 Years | 16 (61.5%) | 2 (10.5%) |
| 75 Years and over | 5 (31.2%) | 17 (68.0%) |
Disability Class: Self-Care Difficulty
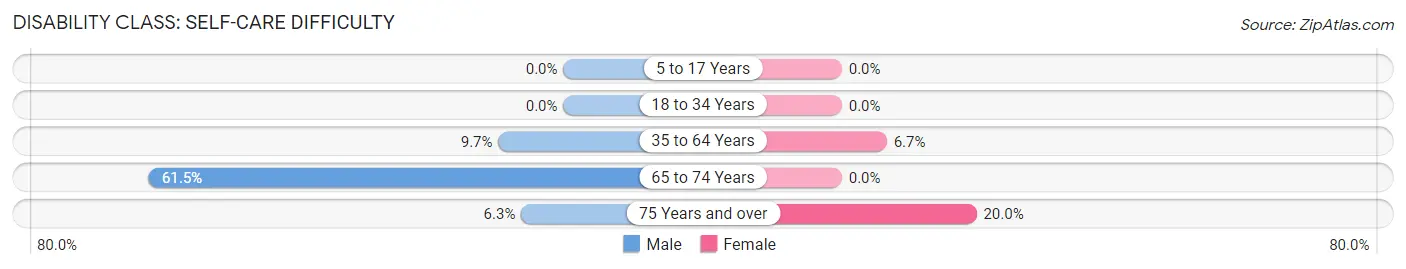
| Age Bracket | Male | Female |
| 5 to 17 Years | 0 (0.0%) | 0 (0.0%) |
| 18 to 34 Years | 0 (0.0%) | 0 (0.0%) |
| 35 to 64 Years | 11 (9.7%) | 5 (6.7%) |
| 65 to 74 Years | 16 (61.5%) | 0 (0.0%) |
| 75 Years and over | 1 (6.2%) | 5 (20.0%) |
Technology Access in Brisbin borough
Computing Device Access in Brisbin borough
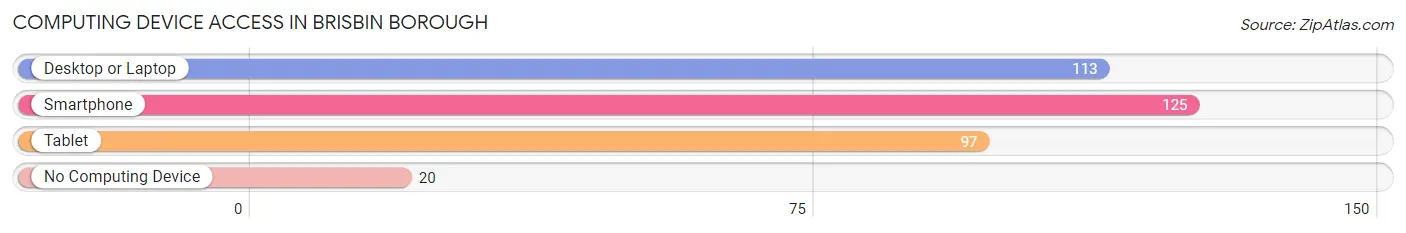
| Device Type | # Households | % Households |
| Desktop or Laptop | 113 | 74.3% |
| Smartphone | 125 | 82.2% |
| Tablet | 97 | 63.8% |
| No Computing Device | 20 | 13.2% |
| Total | 152 | 100.0% |
Internet Access in Brisbin borough
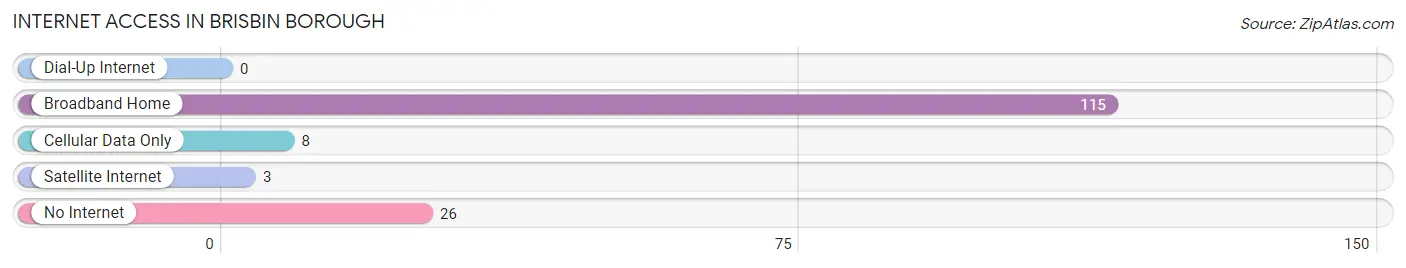
| Internet Type | # Households | % Households |
| Dial-Up Internet | 0 | 0.0% |
| Broadband Home | 115 | 75.7% |
| Cellular Data Only | 8 | 5.3% |
| Satellite Internet | 3 | 2.0% |
| No Internet | 26 | 17.1% |
| Total | 152 | 100.0% |
Brisbin borough Summary
Brisbin Borough is a small borough located in Clearfield County, Pennsylvania. It is situated in the western part of the state, approximately 70 miles northeast of Pittsburgh. The borough is bordered by the townships of Brady, Beccaria, and Decatur. As of the 2010 census, the population of Brisbin Borough was 1,093.
History
Brisbin Borough was founded in 1876 by John Brisbin, a local farmer. The town was named after him and was incorporated in 1883. The first post office was established in 1884.
In the early 1900s, Brisbin Borough was a thriving coal mining town. The coal industry provided jobs for many of the residents and helped to fuel the local economy. The coal mines were eventually closed in the 1950s, and the town began to decline.
In the late 1970s, the town began to experience a resurgence. The local economy was revitalized by the opening of a new industrial park, which brought in new businesses and jobs. The town also began to attract new residents, and the population began to grow.
Geography
Brisbin Borough is located in western Pennsylvania, approximately 70 miles northeast of Pittsburgh. It is situated in Clearfield County, and is bordered by the townships of Brady, Beccaria, and Decatur.
The borough is located in the Allegheny Plateau region of Pennsylvania. The terrain is mostly hilly, with some flat areas. The highest point in the borough is 1,890 feet above sea level.
The climate in Brisbin Borough is classified as humid continental. The average annual temperature is 48°F, and the average annual precipitation is 40 inches.
Economy
The economy of Brisbin Borough is largely based on manufacturing and services. The largest employers in the borough are the industrial park, which employs over 500 people, and the local school district, which employs over 200 people.
The borough also has a number of small businesses, including restaurants, retail stores, and professional services.
Demographics
As of the 2010 census, the population of Brisbin Borough was 1,093. The racial makeup of the borough was 97.3% White, 0.7% African American, 0.2% Native American, 0.2% Asian, and 1.6% from other races.
The median household income in Brisbin Borough was $37,917, and the median family income was $45,000. The per capita income was $18,945. Approximately 11.3% of the population was below the poverty line.
Conclusion
Brisbin Borough is a small borough located in Clearfield County, Pennsylvania. It was founded in 1876 and was once a thriving coal mining town. The coal mines were eventually closed in the 1950s, and the town began to decline. In the late 1970s, the town began to experience a resurgence, and the local economy was revitalized by the opening of a new industrial park. The population of Brisbin Borough was 1,093 as of the 2010 census, and the economy is largely based on manufacturing and services.
Common Questions
What is the Total Population of Brisbin borough?
Total Population of Brisbin borough is 387.
What is the Total Male Population of Brisbin borough?
Total Male Population of Brisbin borough is 188.
What is the Total Female Population of Brisbin borough?
Total Female Population of Brisbin borough is 199.
What is the Ratio of Males per 100 Females in Brisbin borough?
There are 94.47 Males per 100 Females in Brisbin borough.
What is the Ratio of Females per 100 Males in Brisbin borough?
There are 105.85 Females per 100 Males in Brisbin borough.
What is the Median Population Age in Brisbin borough?
Median Population Age in Brisbin borough is 50.9 Years.
What is the Average Family Size in Brisbin borough
Average Family Size in Brisbin borough is 2.6 People.
What is the Average Household Size in Brisbin borough
Average Household Size in Brisbin borough is 2.4 People.
What is Per Capita Income in Brisbin borough?
Per Capita income in Brisbin borough is $29,477.
What is the Median Family Income in Brisbin borough?
Median Family Income in Brisbin borough is $60,833.
What is the Median Household income in Brisbin borough?
Median Household Income in Brisbin borough is $55,833.
What is Income or Wage Gap in Brisbin borough?
Income or Wage Gap in Brisbin borough is 13.7%.
Women in Brisbin borough earn 86.3 cents for every dollar earned by a man.
What is Inequality or Gini Index in Brisbin borough?
Inequality or Gini Index in Brisbin borough is 0.40.
How Large is the Labor Force in Brisbin borough?
There are 184 People in the Labor Forcein in Brisbin borough.
What is the Percentage of People in the Labor Force in Brisbin borough?
54.9% of People are in the Labor Force in Brisbin borough.
What is the Unemployment Rate in Brisbin borough?
Unemployment Rate in Brisbin borough is 6.0%.