Turtle Creek borough, PA
Turtle Creek borough Overview
5,087
TOTAL POPULATION
2,326
MALE POPULATION
2,761
FEMALE POPULATION
84.24
MALES / 100 FEMALES
118.70
FEMALES / 100 MALES
43.0
MEDIAN AGE
2.8
AVG FAMILY SIZE
2.3
AVG HOUSEHOLD SIZE
$23,199
PER CAPITA INCOME
$46,759
AVG FAMILY INCOME
$42,344
AVG HOUSEHOLD INCOME
25.2%
WAGE / INCOME GAP [ % ]
74.8¢/ $1
WAGE / INCOME GAP [ $ ]
0.41
INEQUALITY / GINI INDEX
2,392
LABOR FORCE [ PEOPLE ]
56.1%
PERCENT IN LABOR FORCE
14.5%
UNEMPLOYMENT RATE
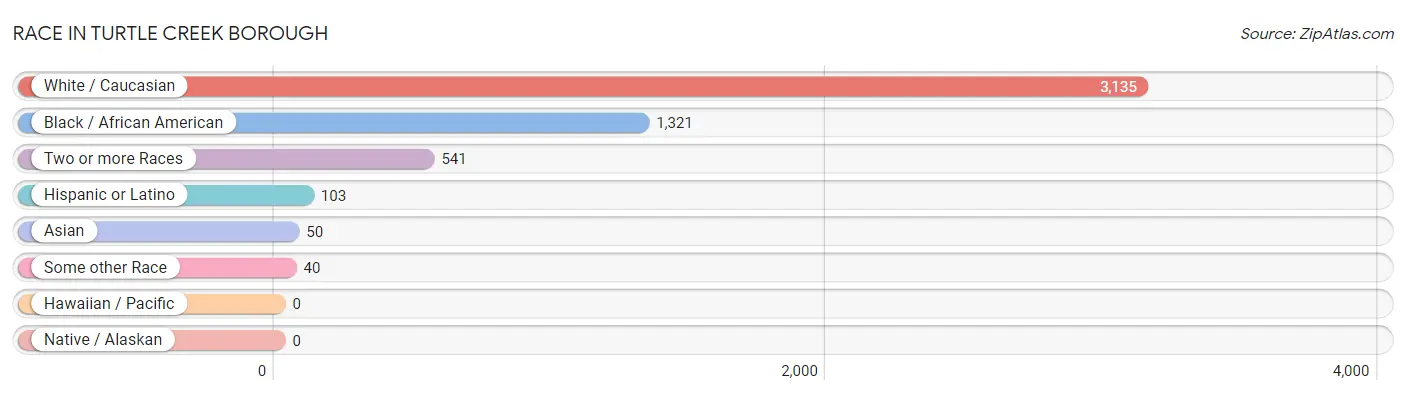
Race in Turtle Creek borough
The most populous races in Turtle Creek borough are White / Caucasian (3,135 | 61.6%), Black / African American (1,321 | 26.0%), and Two or more Races (541 | 10.6%).
| Race | # Population | % Population |
| Asian | 50 | 1.0% |
| Black / African American | 1,321 | 26.0% |
| Hawaiian / Pacific | 0 | 0.0% |
| Hispanic or Latino | 103 | 2.0% |
| Native / Alaskan | 0 | 0.0% |
| White / Caucasian | 3,135 | 61.6% |
| Two or more Races | 541 | 10.6% |
| Some other Race | 40 | 0.8% |
| Total | 5,087 | 100.0% |
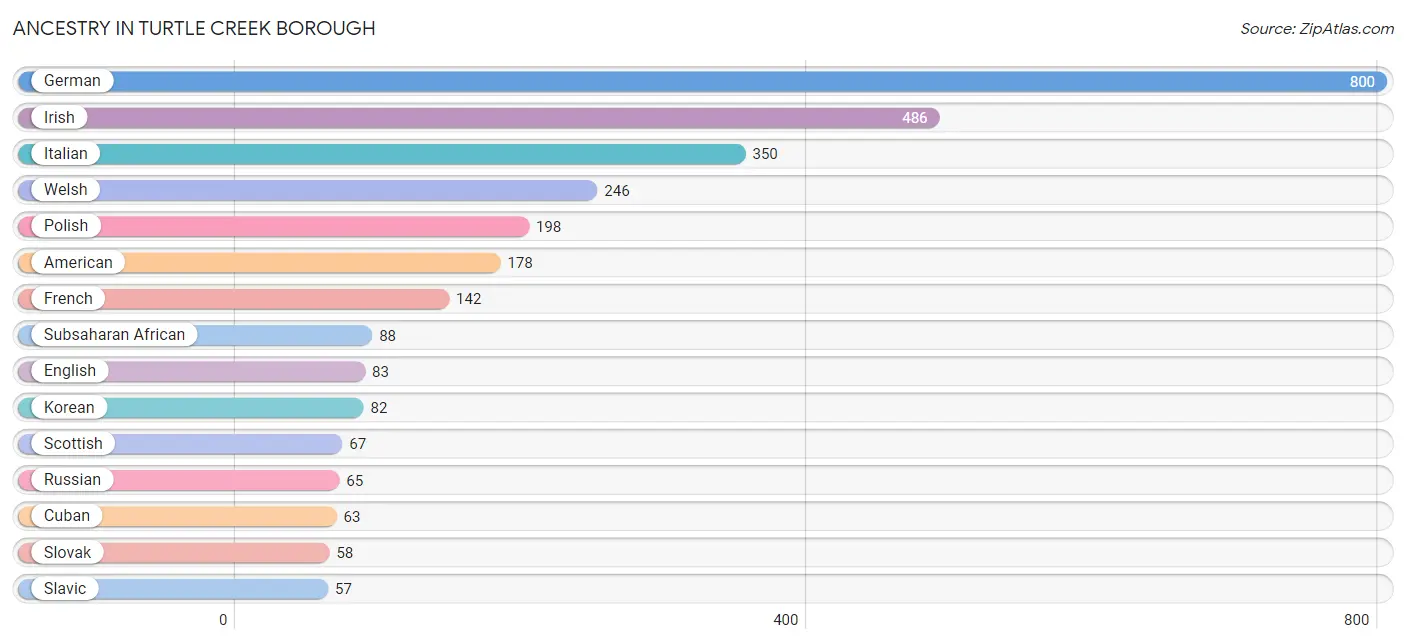
Ancestry in Turtle Creek borough
The most populous ancestries reported in Turtle Creek borough are German (800 | 15.7%), Irish (486 | 9.6%), Italian (350 | 6.9%), Welsh (246 | 4.8%), and Polish (198 | 3.9%), together accounting for 40.9% of all Turtle Creek borough residents.
| Ancestry | # Population | % Population |
| African | 48 | 0.9% |
| American | 178 | 3.5% |
| Arab | 25 | 0.5% |
| Austrian | 38 | 0.7% |
| Croatian | 42 | 0.8% |
| Cuban | 63 | 1.2% |
| Dutch | 12 | 0.2% |
| Eastern European | 22 | 0.4% |
| English | 83 | 1.6% |
| Ethiopian | 8 | 0.2% |
| French | 142 | 2.8% |
| German | 800 | 15.7% |
| Greek | 26 | 0.5% |
| Hungarian | 28 | 0.5% |
| Irish | 486 | 9.6% |
| Italian | 350 | 6.9% |
| Korean | 82 | 1.6% |
| Nigerian | 32 | 0.6% |
| Pennsylvania German | 9 | 0.2% |
| Polish | 198 | 3.9% |
| Puerto Rican | 40 | 0.8% |
| Russian | 65 | 1.3% |
| Scotch-Irish | 50 | 1.0% |
| Scottish | 67 | 1.3% |
| Slavic | 57 | 1.1% |
| Slovak | 58 | 1.1% |
| Slovene | 35 | 0.7% |
| Subsaharan African | 88 | 1.7% |
| Swedish | 12 | 0.2% |
| Welsh | 246 | 4.8% | View All 30 Rows |
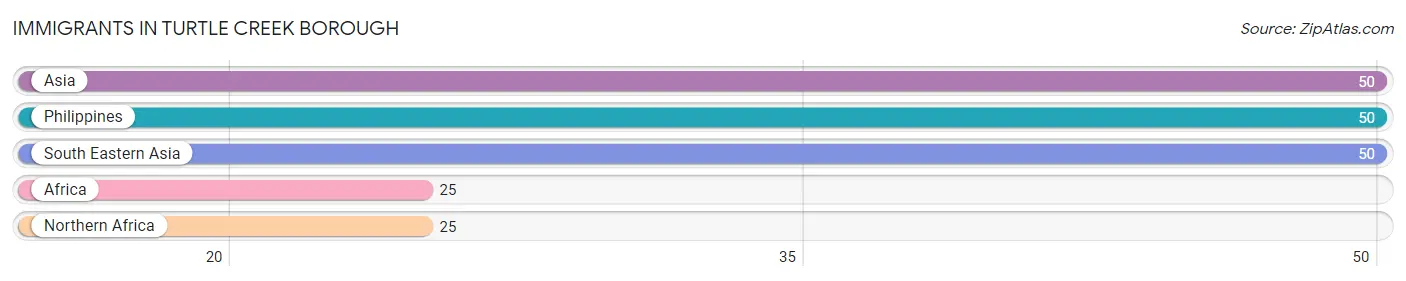
Immigrants in Turtle Creek borough
The most numerous immigrant groups reported in Turtle Creek borough came from Asia (50 | 1.0%), Philippines (50 | 1.0%), South Eastern Asia (50 | 1.0%), Africa (25 | 0.5%), and Northern Africa (25 | 0.5%), together accounting for 3.9% of all Turtle Creek borough residents.
| Immigration Origin | # Population | % Population |
| Africa | 25 | 0.5% |
| Asia | 50 | 1.0% |
| Northern Africa | 25 | 0.5% |
| Philippines | 50 | 1.0% |
| South Eastern Asia | 50 | 1.0% | View All 5 Rows |
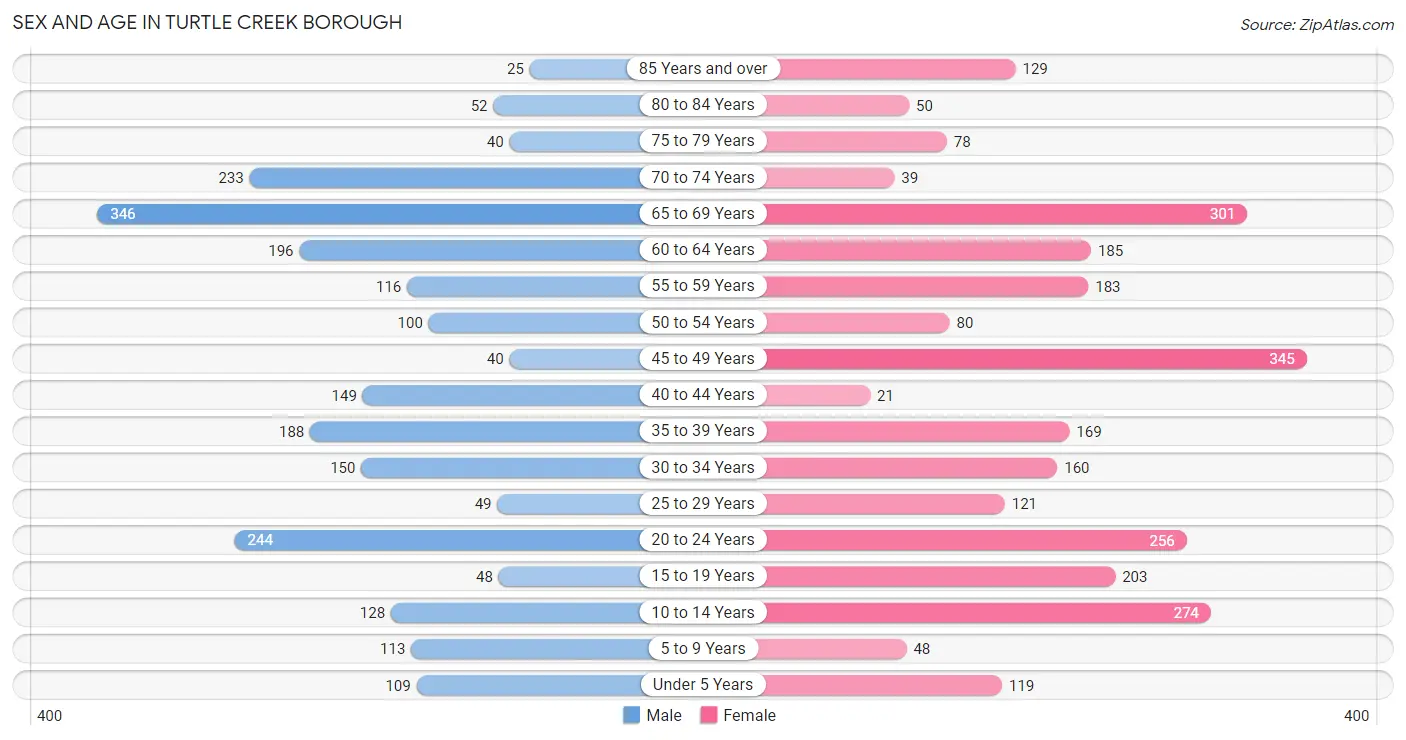
Sex and Age in Turtle Creek borough
Sex and Age in Turtle Creek borough
The most populous age groups in Turtle Creek borough are 65 to 69 Years (346 | 14.9%) for men and 45 to 49 Years (345 | 12.5%) for women.
| Age Bracket | Male | Female |
| Under 5 Years | 109 (4.7%) | 119 (4.3%) |
| 5 to 9 Years | 113 (4.9%) | 48 (1.7%) |
| 10 to 14 Years | 128 (5.5%) | 274 (9.9%) |
| 15 to 19 Years | 48 (2.1%) | 203 (7.3%) |
| 20 to 24 Years | 244 (10.5%) | 256 (9.3%) |
| 25 to 29 Years | 49 (2.1%) | 121 (4.4%) |
| 30 to 34 Years | 150 (6.5%) | 160 (5.8%) |
| 35 to 39 Years | 188 (8.1%) | 169 (6.1%) |
| 40 to 44 Years | 149 (6.4%) | 21 (0.8%) |
| 45 to 49 Years | 40 (1.7%) | 345 (12.5%) |
| 50 to 54 Years | 100 (4.3%) | 80 (2.9%) |
| 55 to 59 Years | 116 (5.0%) | 183 (6.6%) |
| 60 to 64 Years | 196 (8.4%) | 185 (6.7%) |
| 65 to 69 Years | 346 (14.9%) | 301 (10.9%) |
| 70 to 74 Years | 233 (10.0%) | 39 (1.4%) |
| 75 to 79 Years | 40 (1.7%) | 78 (2.8%) |
| 80 to 84 Years | 52 (2.2%) | 50 (1.8%) |
| 85 Years and over | 25 (1.1%) | 129 (4.7%) |
| Total | 2,326 (100.0%) | 2,761 (100.0%) |
Families and Households in Turtle Creek borough
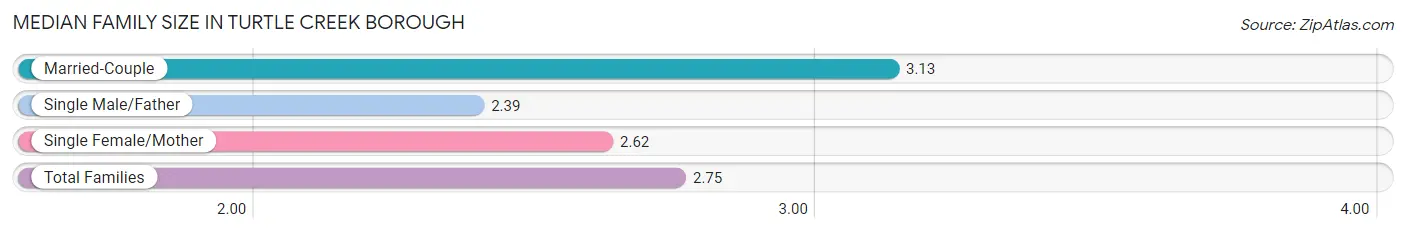
Median Family Size in Turtle Creek borough
The median family size in Turtle Creek borough is 2.75 persons per family, with married-couple families (455 | 33.9%) accounting for the largest median family size of 3.13 persons per family. On the other hand, single male/father families (246 | 18.3%) represent the smallest median family size with 2.39 persons per family.
| Family Type | # Families | Family Size |
| Married-Couple | 455 (33.9%) | 3.13 |
| Single Male/Father | 246 (18.3%) | 2.39 |
| Single Female/Mother | 641 (47.8%) | 2.62 |
| Total Families | 1,342 (100.0%) | 2.75 |
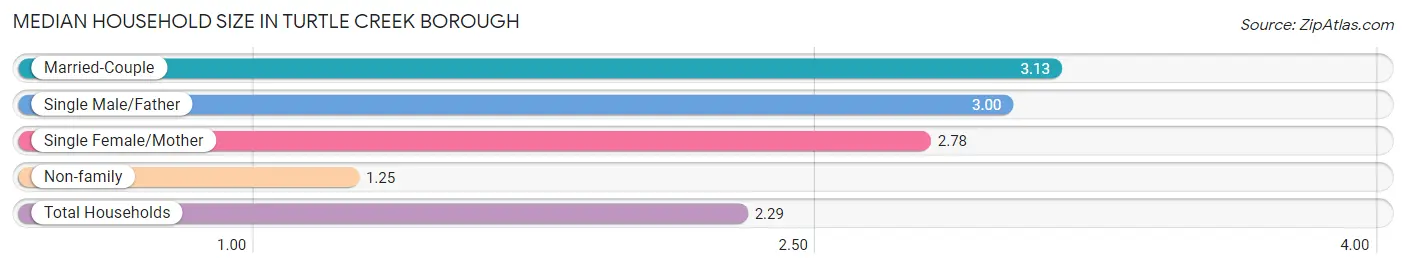
Median Household Size in Turtle Creek borough
The median household size in Turtle Creek borough is 2.29 persons per household, with married-couple households (455 | 20.9%) accounting for the largest median household size of 3.13 persons per household. non-family households (832 | 38.3%) represent the smallest median household size with 1.25 persons per household.
| Household Type | # Households | Household Size |
| Married-Couple | 455 (20.9%) | 3.13 |
| Single Male/Father | 246 (11.3%) | 3.00 |
| Single Female/Mother | 641 (29.5%) | 2.78 |
| Non-family | 832 (38.3%) | 1.25 |
| Total Households | 2,174 (100.0%) | 2.29 |
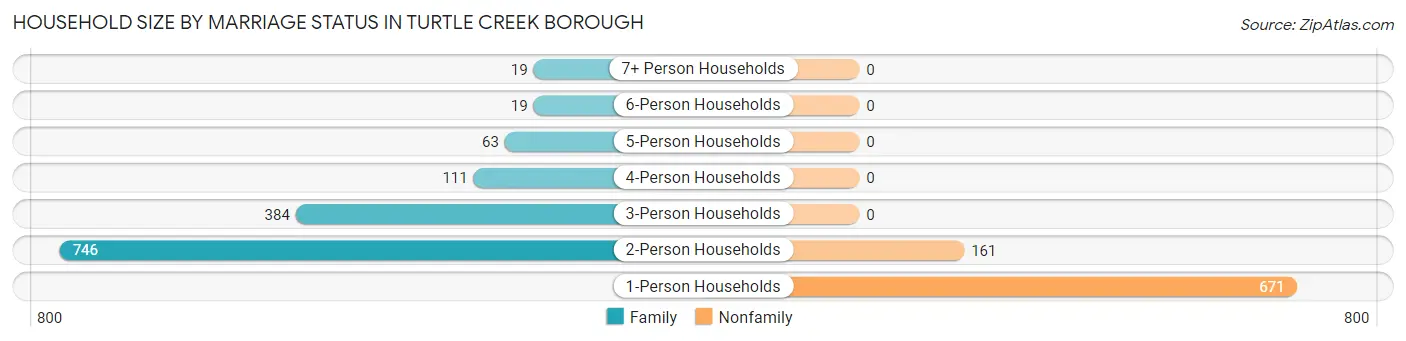
Household Size by Marriage Status in Turtle Creek borough
Out of a total of 2,174 households in Turtle Creek borough, 1,342 (61.7%) are family households, while 832 (38.3%) are nonfamily households. The most numerous type of family households are 2-person households, comprising 746, and the most common type of nonfamily households are 1-person households, comprising 671.
| Household Size | Family Households | Nonfamily Households |
| 1-Person Households | - | 671 (30.9%) |
| 2-Person Households | 746 (34.3%) | 161 (7.4%) |
| 3-Person Households | 384 (17.7%) | 0 (0.0%) |
| 4-Person Households | 111 (5.1%) | 0 (0.0%) |
| 5-Person Households | 63 (2.9%) | 0 (0.0%) |
| 6-Person Households | 19 (0.9%) | 0 (0.0%) |
| 7+ Person Households | 19 (0.9%) | 0 (0.0%) |
| Total | 1,342 (61.7%) | 832 (38.3%) |
Female Fertility in Turtle Creek borough
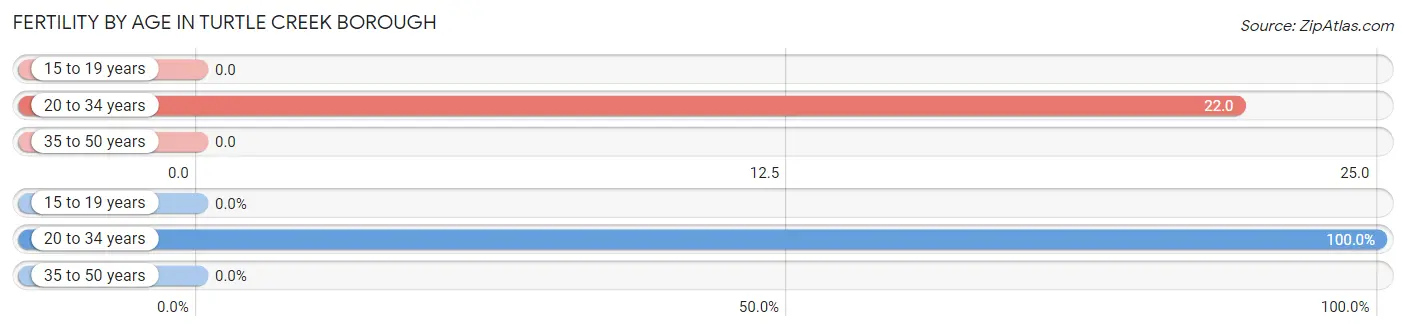
Fertility by Age in Turtle Creek borough
Average fertility rate in Turtle Creek borough is 9.0 births per 1,000 women. Women in the age bracket of 20 to 34 years have the highest fertility rate with 22.0 births per 1,000 women. Women in the age bracket of 20 to 34 years acount for 100.0% of all women with births.
| Age Bracket | Women with Births | Births / 1,000 Women |
| 15 to 19 years | 0 (0.0%) | 0.0 |
| 20 to 34 years | 12 (100.0%) | 22.0 |
| 35 to 50 years | 0 (0.0%) | 0.0 |
| Total | 12 (100.0%) | 9.0 |
Fertility by Age by Marriage Status in Turtle Creek borough
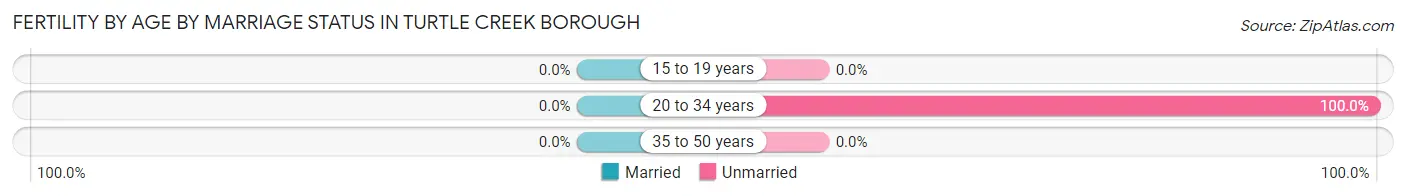
| Age Bracket | Married | Unmarried |
| 15 to 19 years | 0 (0.0%) | 0 (0.0%) |
| 20 to 34 years | 0 (0.0%) | 12 (100.0%) |
| 35 to 50 years | 0 (0.0%) | 0 (0.0%) |
| Total | 0 (0.0%) | 12 (100.0%) |
Fertility by Education in Turtle Creek borough
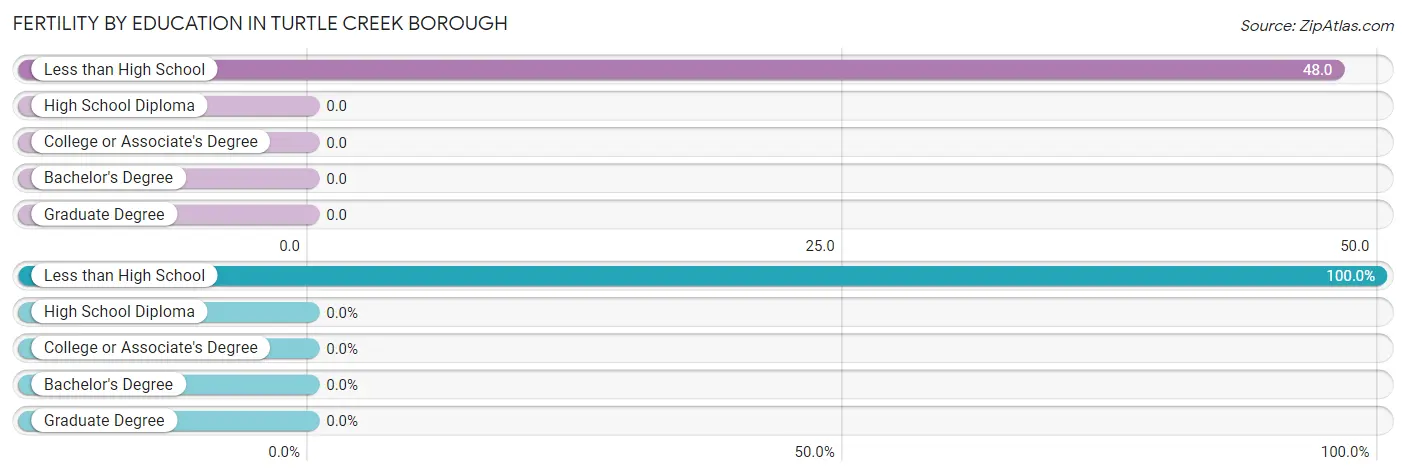
| Educational Attainment | Women with Births | Births / 1,000 Women |
| Less than High School | 12 (100.0%) | 48.0 |
| High School Diploma | 0 (0.0%) | 0.0 |
| College or Associate's Degree | 0 (0.0%) | 0.0 |
| Bachelor's Degree | 0 (0.0%) | 0.0 |
| Graduate Degree | 0 (0.0%) | 0.0 |
| Total | 12 (100.0%) | 9.0 |
Fertility by Education by Marriage Status in Turtle Creek borough
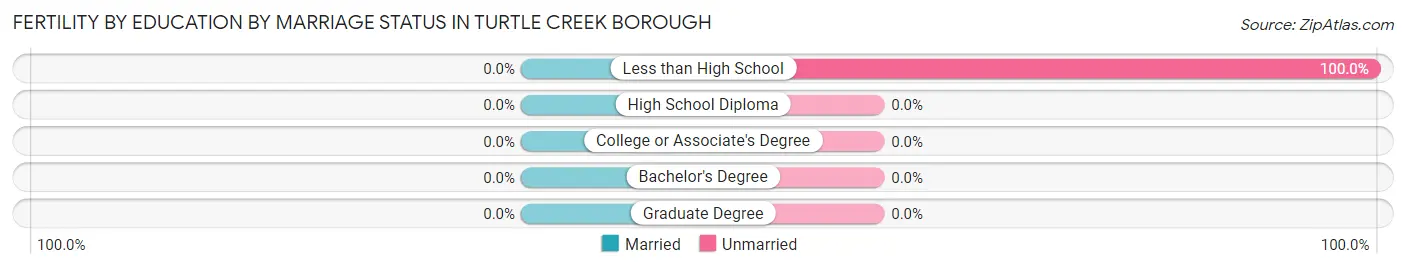
| Educational Attainment | Married | Unmarried |
| Less than High School | 0 (0.0%) | 12 (100.0%) |
| High School Diploma | 0 (0.0%) | 0 (0.0%) |
| College or Associate's Degree | 0 (0.0%) | 0 (0.0%) |
| Bachelor's Degree | 0 (0.0%) | 0 (0.0%) |
| Graduate Degree | 0 (0.0%) | 0 (0.0%) |
| Total | 0 (0.0%) | 12 (100.0%) |
Income in Turtle Creek borough
Income Overview in Turtle Creek borough
Per Capita Income in Turtle Creek borough is $23,199, while median incomes of families and households are $46,759 and $42,344 respectively.
| Characteristic | Number | Measure |
| Per Capita Income | 5,087 | $23,199 |
| Median Family Income | 1,342 | $46,759 |
| Mean Family Income | 1,342 | $58,520 |
| Median Household Income | 2,174 | $42,344 |
| Mean Household Income | 2,174 | $51,219 |
| Income Deficit | 1,342 | $0 |
| Wage / Income Gap (%) | 5,087 | 25.22% |
| Wage / Income Gap ($) | 5,087 | 74.78¢ per $1 |
| Gini / Inequality Index | 5,087 | 0.41 |
Earnings by Sex in Turtle Creek borough
Average Earnings in Turtle Creek borough are $23,177, $26,746 for men and $20,000 for women, a difference of 25.2%.
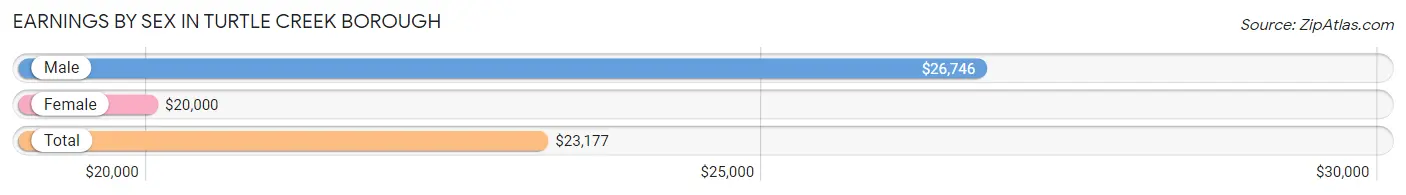
| Sex | Number | Average Earnings |
| Male | 1,245 (48.6%) | $26,746 |
| Female | 1,316 (51.4%) | $20,000 |
| Total | 2,561 (100.0%) | $23,177 |
Earnings by Sex by Income Bracket in Turtle Creek borough
The most common earnings brackets in Turtle Creek borough are $45,000 to $49,999 for men (147 | 11.8%) and $5,000 to $7,499 for women (170 | 12.9%).
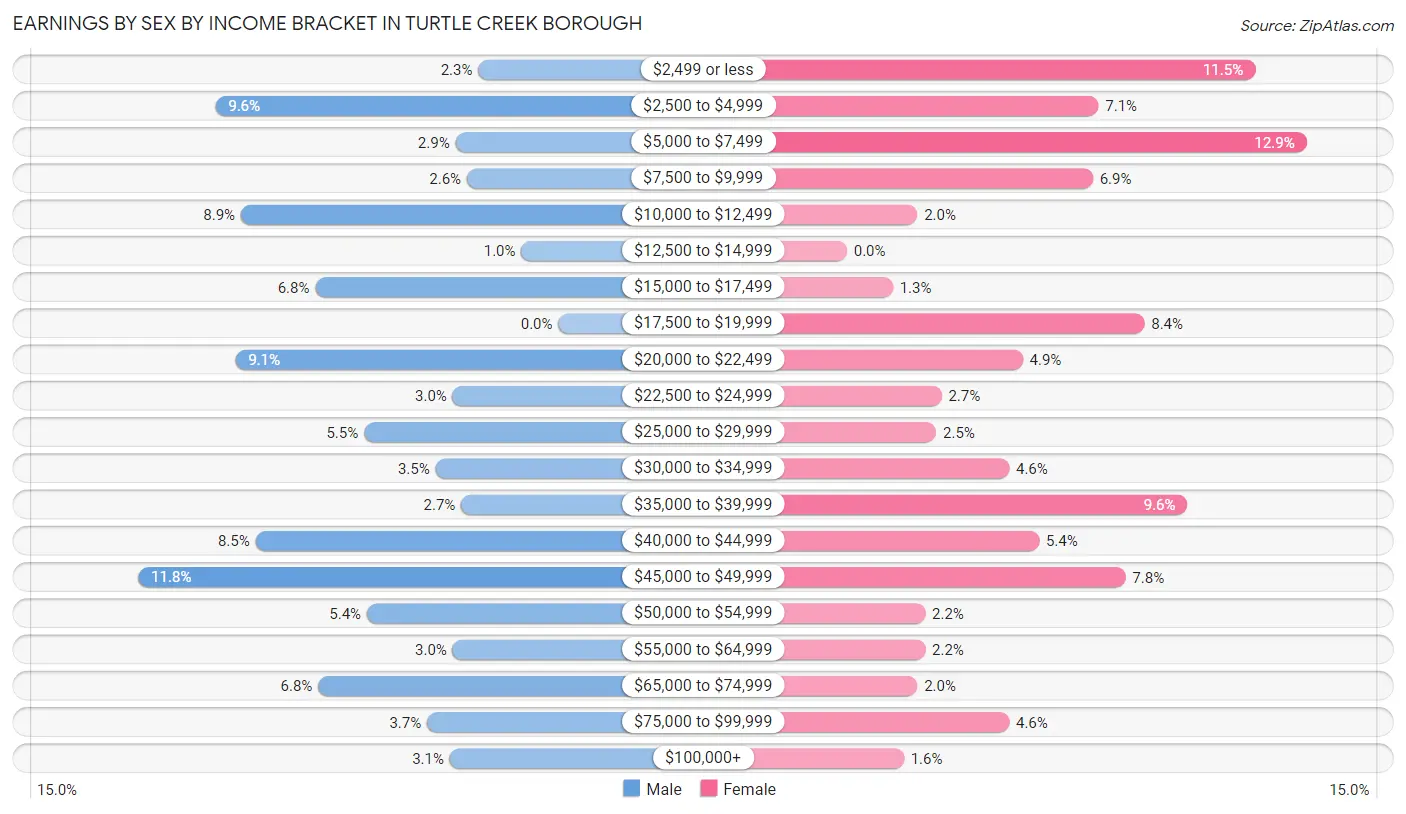
| Income | Male | Female |
| $2,499 or less | 28 (2.2%) | 151 (11.5%) |
| $2,500 to $4,999 | 120 (9.6%) | 93 (7.1%) |
| $5,000 to $7,499 | 36 (2.9%) | 170 (12.9%) |
| $7,500 to $9,999 | 32 (2.6%) | 91 (6.9%) |
| $10,000 to $12,499 | 111 (8.9%) | 26 (2.0%) |
| $12,500 to $14,999 | 13 (1.0%) | 0 (0.0%) |
| $15,000 to $17,499 | 85 (6.8%) | 17 (1.3%) |
| $17,500 to $19,999 | 0 (0.0%) | 110 (8.4%) |
| $20,000 to $22,499 | 113 (9.1%) | 65 (4.9%) |
| $22,500 to $24,999 | 37 (3.0%) | 35 (2.7%) |
| $25,000 to $29,999 | 68 (5.5%) | 33 (2.5%) |
| $30,000 to $34,999 | 43 (3.5%) | 60 (4.6%) |
| $35,000 to $39,999 | 34 (2.7%) | 126 (9.6%) |
| $40,000 to $44,999 | 106 (8.5%) | 71 (5.4%) |
| $45,000 to $49,999 | 147 (11.8%) | 103 (7.8%) |
| $50,000 to $54,999 | 67 (5.4%) | 29 (2.2%) |
| $55,000 to $64,999 | 37 (3.0%) | 29 (2.2%) |
| $65,000 to $74,999 | 84 (6.8%) | 26 (2.0%) |
| $75,000 to $99,999 | 46 (3.7%) | 60 (4.6%) |
| $100,000+ | 38 (3.0%) | 21 (1.6%) |
| Total | 1,245 (100.0%) | 1,316 (100.0%) |
Earnings by Sex by Educational Attainment in Turtle Creek borough
Average earnings in Turtle Creek borough are $37,740 for men and $30,547 for women, a difference of 19.1%. Men with an educational attainment of college or associate's degree enjoy the highest average annual earnings of $54,531, while those with less than high school education earn the least with $20,503. Women with an educational attainment of graduate degree earn the most with the average annual earnings of $64,784, while those with high school diploma education have the smallest earnings of $20,904.
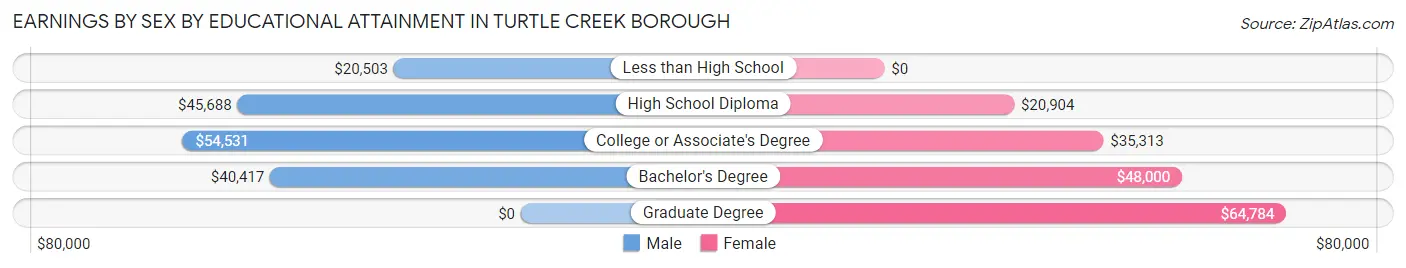
| Educational Attainment | Male Income | Female Income |
| Less than High School | $20,503 | $0 |
| High School Diploma | $45,688 | $20,904 |
| College or Associate's Degree | $54,531 | $35,313 |
| Bachelor's Degree | $40,417 | $48,000 |
| Graduate Degree | - | - |
| Total | $37,740 | $30,547 |
Family Income in Turtle Creek borough
Family Income Brackets in Turtle Creek borough
According to the Turtle Creek borough family income data, there are 321 families falling into the $50,000 to $74,999 income range, which is the most common income bracket and makes up 23.9% of all families. Conversely, the $200,000+ income bracket is the least frequent group with only 21 families (1.6%) belonging to this category.
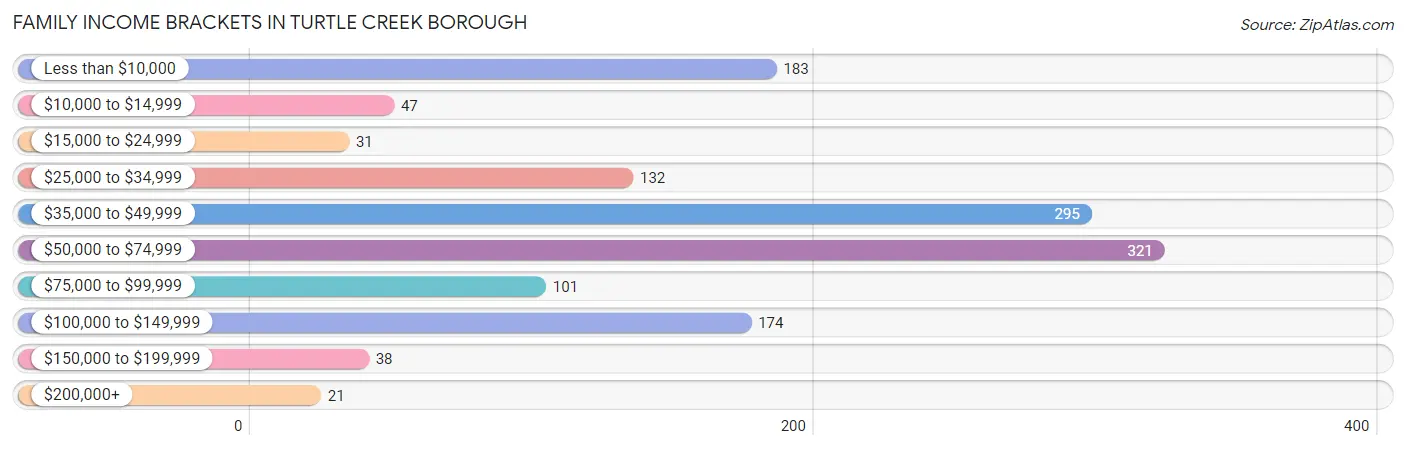
| Income Bracket | # Families | % Families |
| Less than $10,000 | 183 | 13.6% |
| $10,000 to $14,999 | 47 | 3.5% |
| $15,000 to $24,999 | 31 | 2.3% |
| $25,000 to $34,999 | 132 | 9.8% |
| $35,000 to $49,999 | 295 | 22.0% |
| $50,000 to $74,999 | 321 | 23.9% |
| $75,000 to $99,999 | 101 | 7.5% |
| $100,000 to $149,999 | 174 | 13.0% |
| $150,000 to $199,999 | 38 | 2.8% |
| $200,000+ | 21 | 1.6% |
Family Income by Famaliy Size in Turtle Creek borough
4-person families (101 | 7.5%) account for the highest median family income in Turtle Creek borough with $94,155 per family, while 2-person families (923 | 68.8%) have the highest median income of $25,153 per family member.
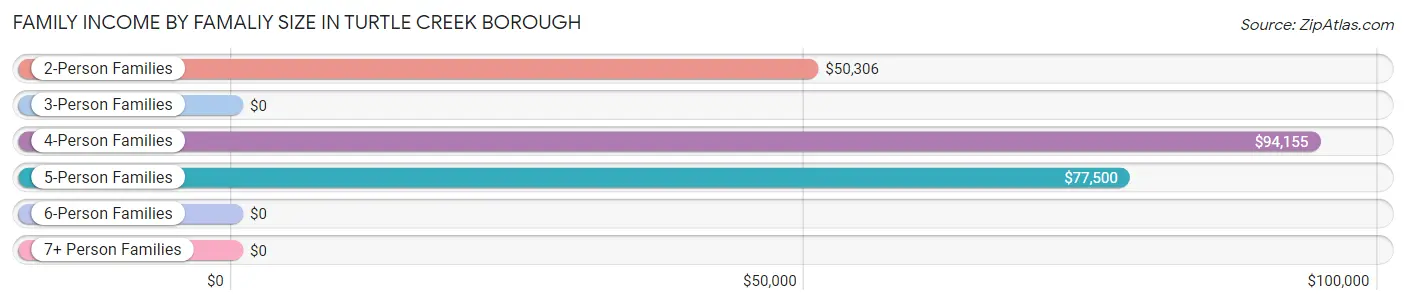
| Income Bracket | # Families | Median Income |
| 2-Person Families | 923 (68.8%) | $50,306 |
| 3-Person Families | 231 (17.2%) | $0 |
| 4-Person Families | 101 (7.5%) | $94,155 |
| 5-Person Families | 68 (5.1%) | $77,500 |
| 6-Person Families | 0 (0.0%) | $0 |
| 7+ Person Families | 19 (1.4%) | $0 |
| Total | 1,342 (100.0%) | $46,759 |
Family Income by Number of Earners in Turtle Creek borough
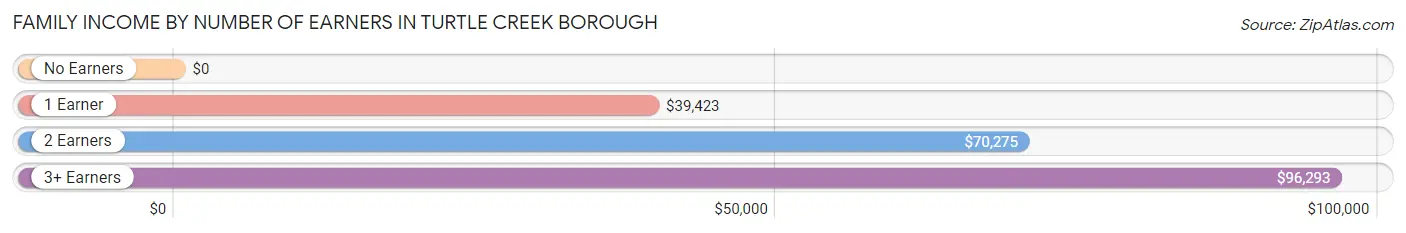
| Number of Earners | # Families | Median Income |
| No Earners | 87 (6.5%) | $0 |
| 1 Earner | 654 (48.7%) | $39,423 |
| 2 Earners | 497 (37.0%) | $70,275 |
| 3+ Earners | 104 (7.7%) | $96,293 |
| Total | 1,342 (100.0%) | $46,759 |
Household Income in Turtle Creek borough
Household Income Brackets in Turtle Creek borough
With 461 households falling in the category, the $35,000 to $49,999 income range is the most frequent in Turtle Creek borough, accounting for 21.2% of all households. In contrast, only 22 households (1.0%) fall into the $200,000+ income bracket, making it the least populous group.
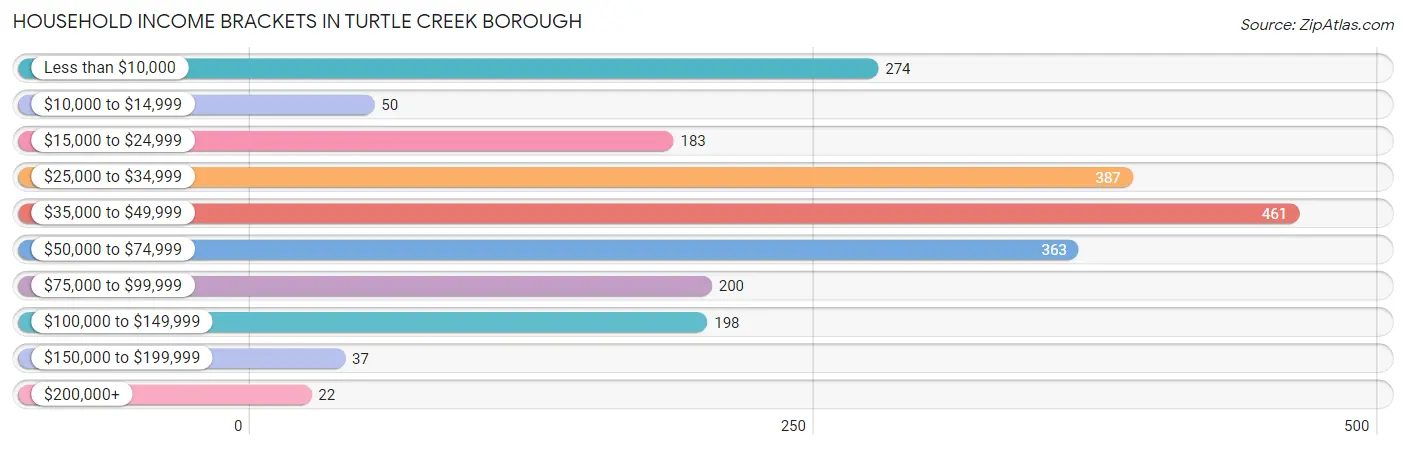
| Income Bracket | # Households | % Households |
| Less than $10,000 | 274 | 12.6% |
| $10,000 to $14,999 | 50 | 2.3% |
| $15,000 to $24,999 | 183 | 8.4% |
| $25,000 to $34,999 | 387 | 17.8% |
| $35,000 to $49,999 | 461 | 21.2% |
| $50,000 to $74,999 | 363 | 16.7% |
| $75,000 to $99,999 | 200 | 9.2% |
| $100,000 to $149,999 | 198 | 9.1% |
| $150,000 to $199,999 | 37 | 1.7% |
| $200,000+ | 22 | 1.0% |
Household Income by Householder Age in Turtle Creek borough
The median household income in Turtle Creek borough is $42,344, with the highest median household income of $47,813 found in the 45 to 64 years age bracket for the primary householder. A total of 880 households (40.5%) fall into this category. Meanwhile, the 25 to 44 years age bracket for the primary householder has the lowest median household income of $0, with 440 households (20.2%) in this group.
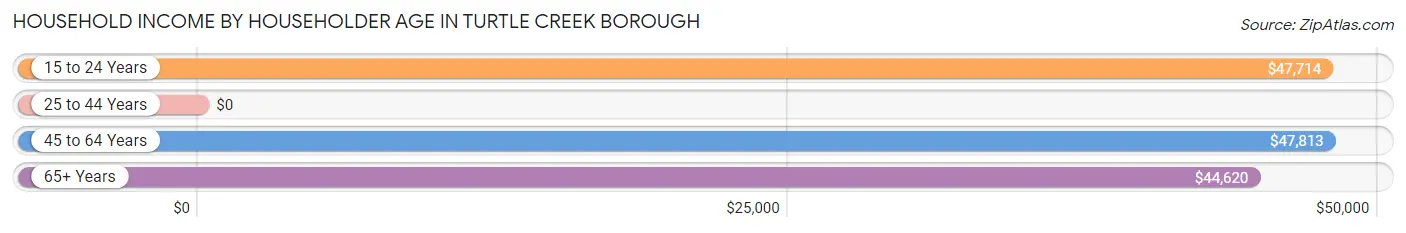
| Income Bracket | # Households | Median Income |
| 15 to 24 Years | 80 (3.7%) | $47,714 |
| 25 to 44 Years | 440 (20.2%) | $0 |
| 45 to 64 Years | 880 (40.5%) | $47,813 |
| 65+ Years | 774 (35.6%) | $44,620 |
| Total | 2,174 (100.0%) | $42,344 |
Poverty in Turtle Creek borough
Income Below Poverty by Sex and Age in Turtle Creek borough
With 27.5% poverty level for males and 28.2% for females among the residents of Turtle Creek borough, 16 and 17 year old males and 5 year old females are the most vulnerable to poverty, with 48 males (100.0%) and 48 females (100.0%) in their respective age groups living below the poverty level.
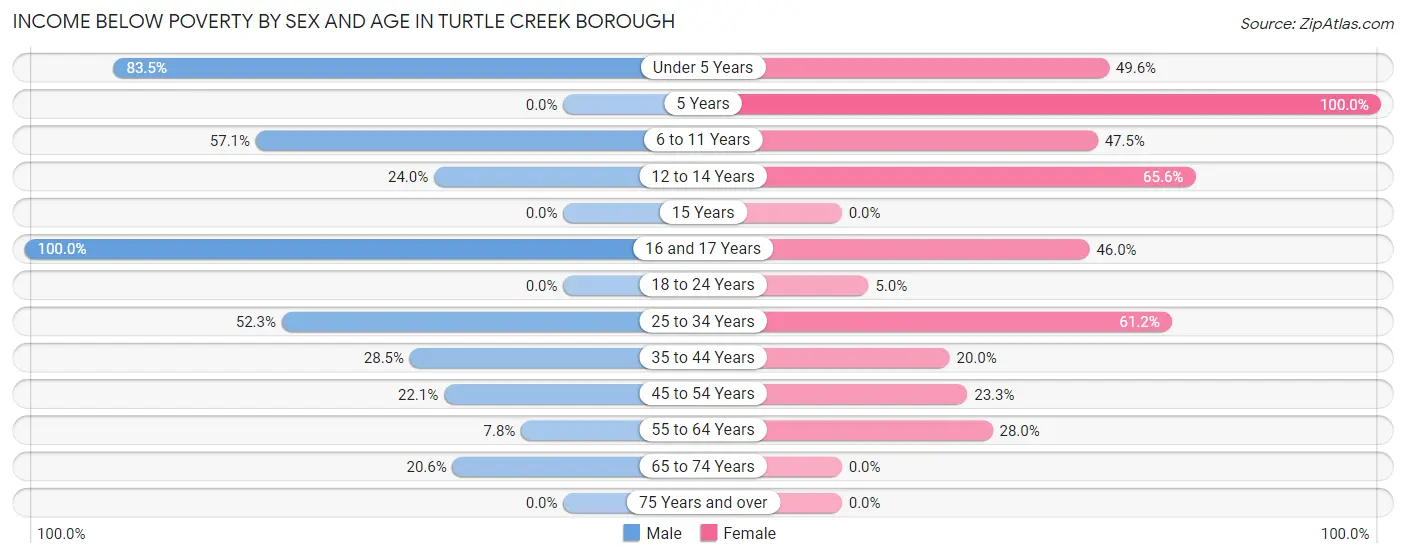
| Age Bracket | Male | Female |
| Under 5 Years | 91 (83.5%) | 59 (49.6%) |
| 5 Years | 0 (0.0%) | 48 (100.0%) |
| 6 to 11 Years | 109 (57.1%) | 19 (47.5%) |
| 12 to 14 Years | 12 (24.0%) | 141 (65.6%) |
| 15 Years | 0 (0.0%) | 0 (0.0%) |
| 16 and 17 Years | 48 (100.0%) | 57 (46.0%) |
| 18 to 24 Years | 0 (0.0%) | 15 (5.0%) |
| 25 to 34 Years | 104 (52.3%) | 172 (61.2%) |
| 35 to 44 Years | 96 (28.5%) | 38 (20.0%) |
| 45 to 54 Years | 31 (22.1%) | 99 (23.3%) |
| 55 to 64 Years | 24 (7.8%) | 101 (28.0%) |
| 65 to 74 Years | 118 (20.6%) | 0 (0.0%) |
| 75 Years and over | 0 (0.0%) | 0 (0.0%) |
| Total | 633 (27.5%) | 749 (28.2%) |
Income Above Poverty by Sex and Age in Turtle Creek borough
According to the poverty statistics in Turtle Creek borough, males aged 18 to 24 years and females aged 15 years are the age groups that are most secure financially, with 100.0% of males and 100.0% of females in these age groups living above the poverty line.
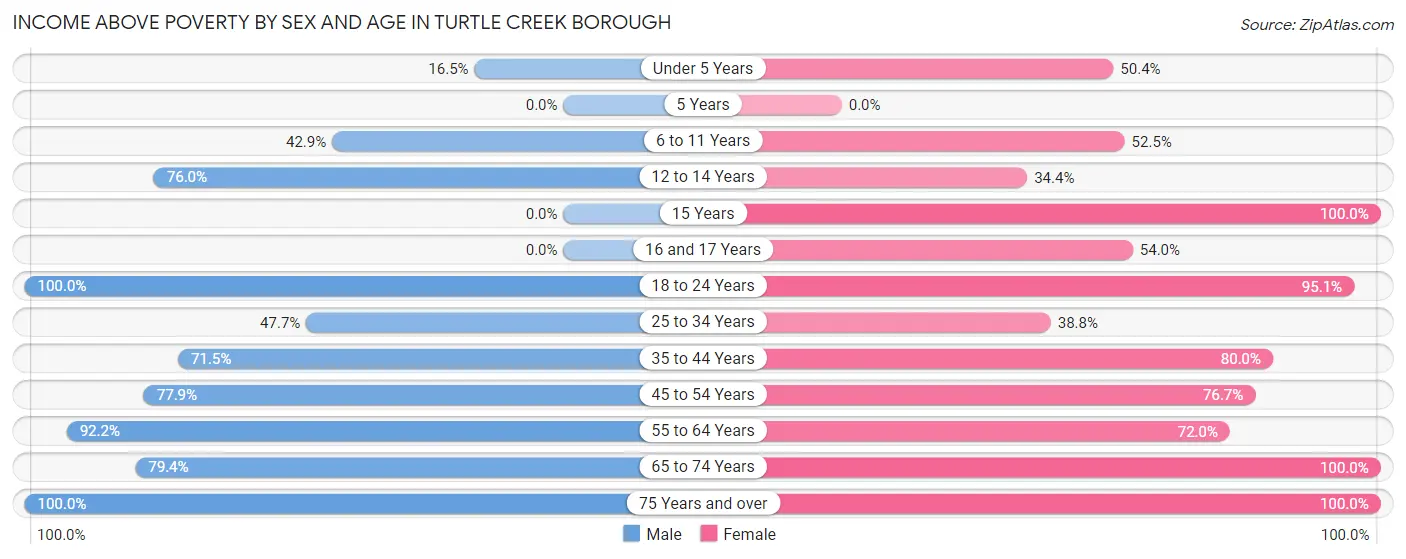
| Age Bracket | Male | Female |
| Under 5 Years | 18 (16.5%) | 60 (50.4%) |
| 5 Years | 0 (0.0%) | 0 (0.0%) |
| 6 to 11 Years | 82 (42.9%) | 21 (52.5%) |
| 12 to 14 Years | 38 (76.0%) | 74 (34.4%) |
| 15 Years | 0 (0.0%) | 32 (100.0%) |
| 16 and 17 Years | 0 (0.0%) | 67 (54.0%) |
| 18 to 24 Years | 244 (100.0%) | 288 (95.1%) |
| 25 to 34 Years | 95 (47.7%) | 109 (38.8%) |
| 35 to 44 Years | 241 (71.5%) | 152 (80.0%) |
| 45 to 54 Years | 109 (77.9%) | 326 (76.7%) |
| 55 to 64 Years | 283 (92.2%) | 260 (72.0%) |
| 65 to 74 Years | 456 (79.4%) | 309 (100.0%) |
| 75 Years and over | 106 (100.0%) | 208 (100.0%) |
| Total | 1,672 (72.5%) | 1,906 (71.8%) |
Income Below Poverty Among Married-Couple Families in Turtle Creek borough
The poverty statistics for married-couple families in Turtle Creek borough show that 4.2% or 19 of the total 455 families live below the poverty line. Families with 5 or more children have the highest poverty rate of 100.0%, comprising of 19 families. On the other hand, families with no children have the lowest poverty rate of 0.0%, which includes 0 families.
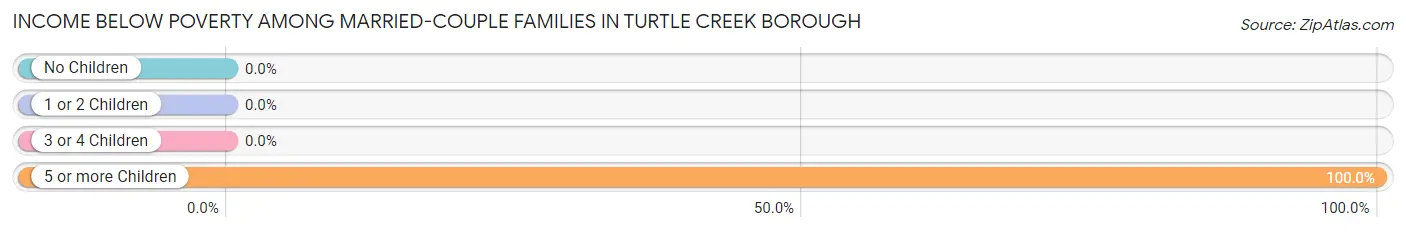
| Children | Above Poverty | Below Poverty |
| No Children | 342 (100.0%) | 0 (0.0%) |
| 1 or 2 Children | 94 (100.0%) | 0 (0.0%) |
| 3 or 4 Children | 0 (0.0%) | 0 (0.0%) |
| 5 or more Children | 0 (0.0%) | 19 (100.0%) |
| Total | 436 (95.8%) | 19 (4.2%) |
Income Below Poverty Among Single-Parent Households in Turtle Creek borough
According to the poverty data in Turtle Creek borough, 29.7% or 73 single-father households and 29.2% or 187 single-mother households are living below the poverty line. Among single-father households, those with 3 or 4 children have the highest poverty rate, with 14 households (100.0%) experiencing poverty. Likewise, among single-mother households, those with 3 or 4 children have the highest poverty rate, with 31 households (100.0%) falling below the poverty line.
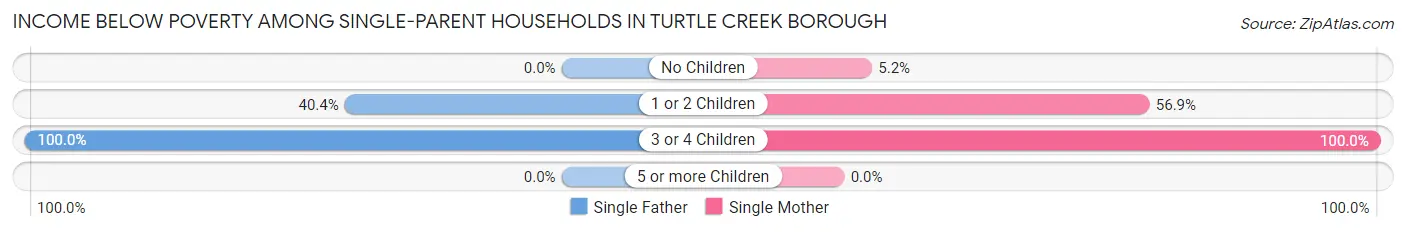
| Children | Single Father | Single Mother |
| No Children | 0 (0.0%) | 19 (5.1%) |
| 1 or 2 Children | 59 (40.4%) | 137 (56.9%) |
| 3 or 4 Children | 14 (100.0%) | 31 (100.0%) |
| 5 or more Children | 0 (0.0%) | 0 (0.0%) |
| Total | 73 (29.7%) | 187 (29.2%) |
Income Below Poverty Among Married-Couple vs Single-Parent Households in Turtle Creek borough
The poverty data for Turtle Creek borough shows that 19 of the married-couple family households (4.2%) and 260 of the single-parent households (29.3%) are living below the poverty level. Within the married-couple family households, those with 5 or more children have the highest poverty rate, with 19 households (100.0%) falling below the poverty line. Among the single-parent households, those with 3 or 4 children have the highest poverty rate, with 45 household (100.0%) living below poverty.
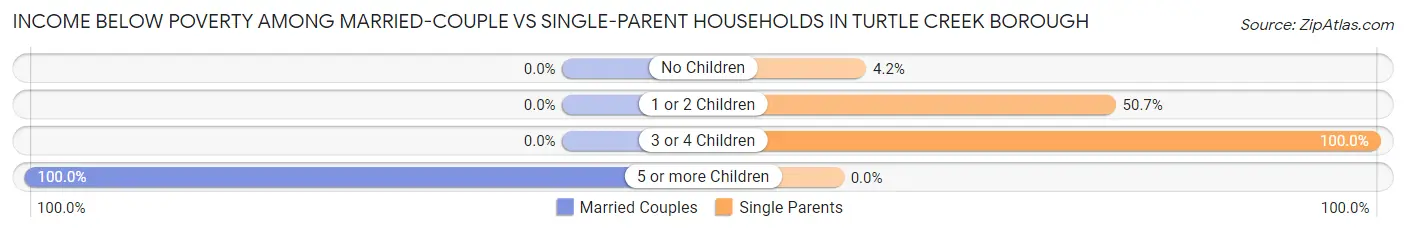
| Children | Married-Couple Families | Single-Parent Households |
| No Children | 0 (0.0%) | 19 (4.2%) |
| 1 or 2 Children | 0 (0.0%) | 196 (50.6%) |
| 3 or 4 Children | 0 (0.0%) | 45 (100.0%) |
| 5 or more Children | 19 (100.0%) | 0 (0.0%) |
| Total | 19 (4.2%) | 260 (29.3%) |
Employment Characteristics in Turtle Creek borough
Employment by Class of Employer in Turtle Creek borough
Among the 2,013 employed individuals in Turtle Creek borough, private company employees (1,419 | 70.5%), self-employed (incorporated) (181 | 9.0%), and not-for-profit organizations (176 | 8.7%) make up the most common classes of employment.
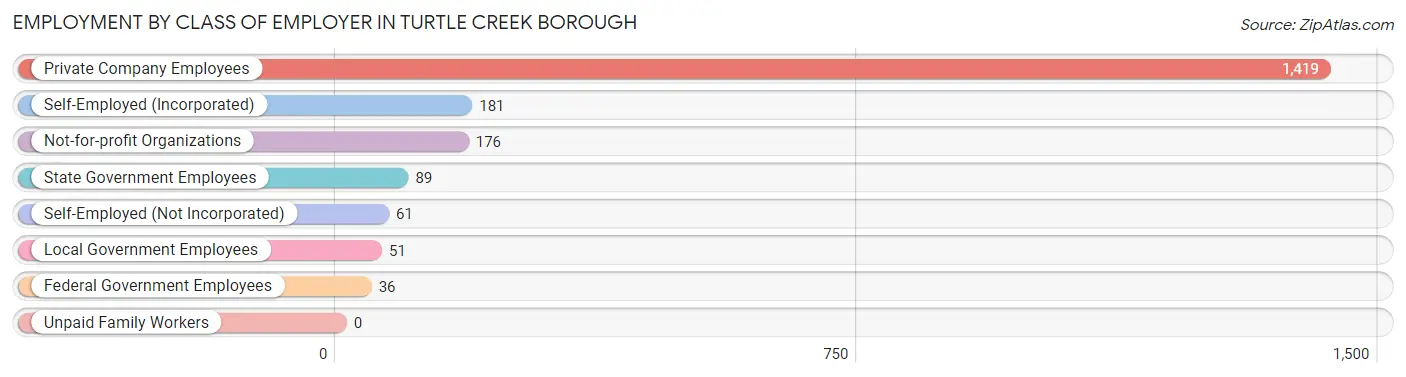
| Employer Class | # Employees | % Employees |
| Private Company Employees | 1,419 | 70.5% |
| Self-Employed (Incorporated) | 181 | 9.0% |
| Self-Employed (Not Incorporated) | 61 | 3.0% |
| Not-for-profit Organizations | 176 | 8.7% |
| Local Government Employees | 51 | 2.5% |
| State Government Employees | 89 | 4.4% |
| Federal Government Employees | 36 | 1.8% |
| Unpaid Family Workers | 0 | 0.0% |
| Total | 2,013 | 100.0% |
Employment Status by Age in Turtle Creek borough
According to the labor force statistics for Turtle Creek borough, out of the total population over 16 years of age (4,264), 56.1% or 2,392 individuals are in the labor force, with 14.5% or 347 of them unemployed. The age group with the highest labor force participation rate is 45 to 54 years, with 92.4% or 522 individuals in the labor force. Within the labor force, the 30 to 34 years age range has the highest percentage of unemployed individuals, with 23.4% or 55 of them being unemployed.
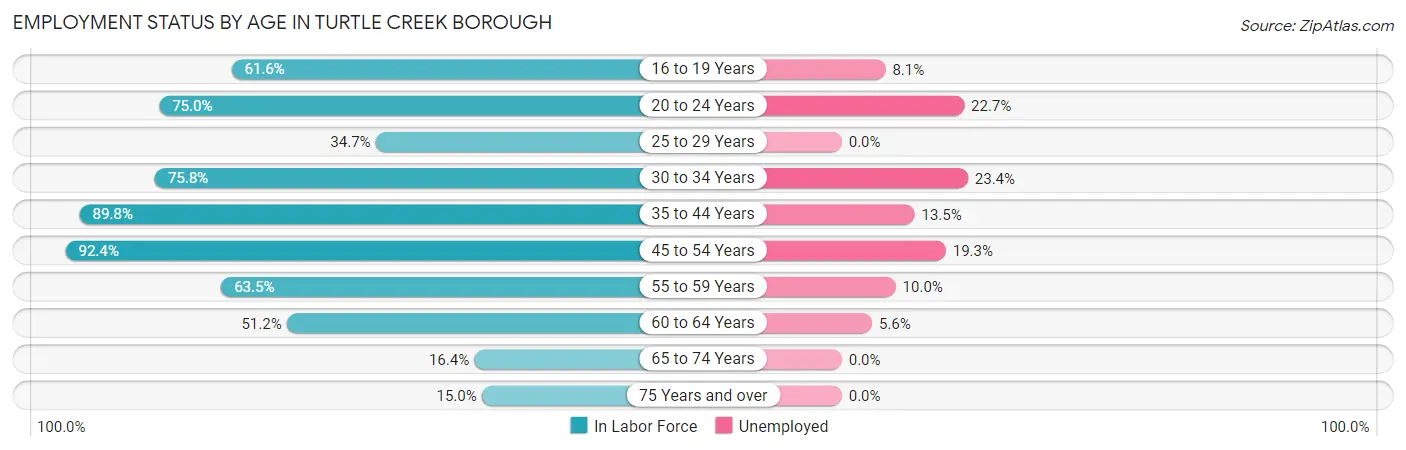
| Age Bracket | In Labor Force | Unemployed |
| 16 to 19 Years | 135 (61.6%) | 11 (8.1%) |
| 20 to 24 Years | 375 (75.0%) | 85 (22.7%) |
| 25 to 29 Years | 59 (34.7%) | 0 (0.0%) |
| 30 to 34 Years | 235 (75.8%) | 55 (23.4%) |
| 35 to 44 Years | 473 (89.8%) | 64 (13.5%) |
| 45 to 54 Years | 522 (92.4%) | 101 (19.3%) |
| 55 to 59 Years | 190 (63.5%) | 19 (10.0%) |
| 60 to 64 Years | 195 (51.2%) | 11 (5.6%) |
| 65 to 74 Years | 151 (16.4%) | 0 (0.0%) |
| 75 Years and over | 56 (15.0%) | 0 (0.0%) |
| Total | 2,392 (56.1%) | 347 (14.5%) |
Employment Status by Educational Attainment in Turtle Creek borough
According to labor force statistics for Turtle Creek borough, 74.3% of individuals (1,673) out of the total population between 25 and 64 years of age (2,252) are in the labor force, with 14.9% or 249 of them being unemployed. The group with the highest labor force participation rate are those with the educational attainment of college / associate degree, with 80.8% or 741 individuals in the labor force. Within the labor force, individuals with less than high school education have the highest percentage of unemployment, with 29.5% or 91 of them being unemployed.
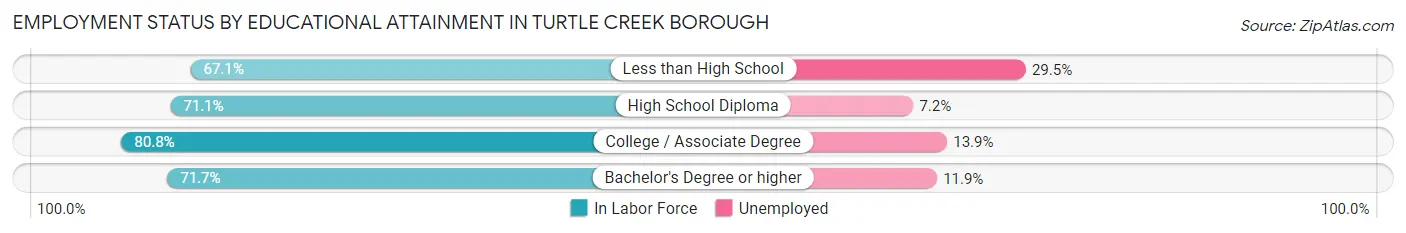
| Educational Attainment | In Labor Force | Unemployed |
| Less than High School | 308 (67.1%) | 135 (29.5%) |
| High School Diploma | 389 (71.1%) | 39 (7.2%) |
| College / Associate Degree | 741 (80.8%) | 127 (13.9%) |
| Bachelor's Degree or higher | 236 (71.7%) | 39 (11.9%) |
| Total | 1,673 (74.3%) | 336 (14.9%) |
Employment Occupations by Sex in Turtle Creek borough
Management, Business, Science and Arts Occupations
The most common Management, Business, Science and Arts occupations in Turtle Creek borough are Management (173 | 8.5%), Computers, Engineering & Science (105 | 5.1%), Business & Financial (79 | 3.9%), Architecture & Engineering (53 | 2.6%), and Computers & Mathematics (52 | 2.5%).
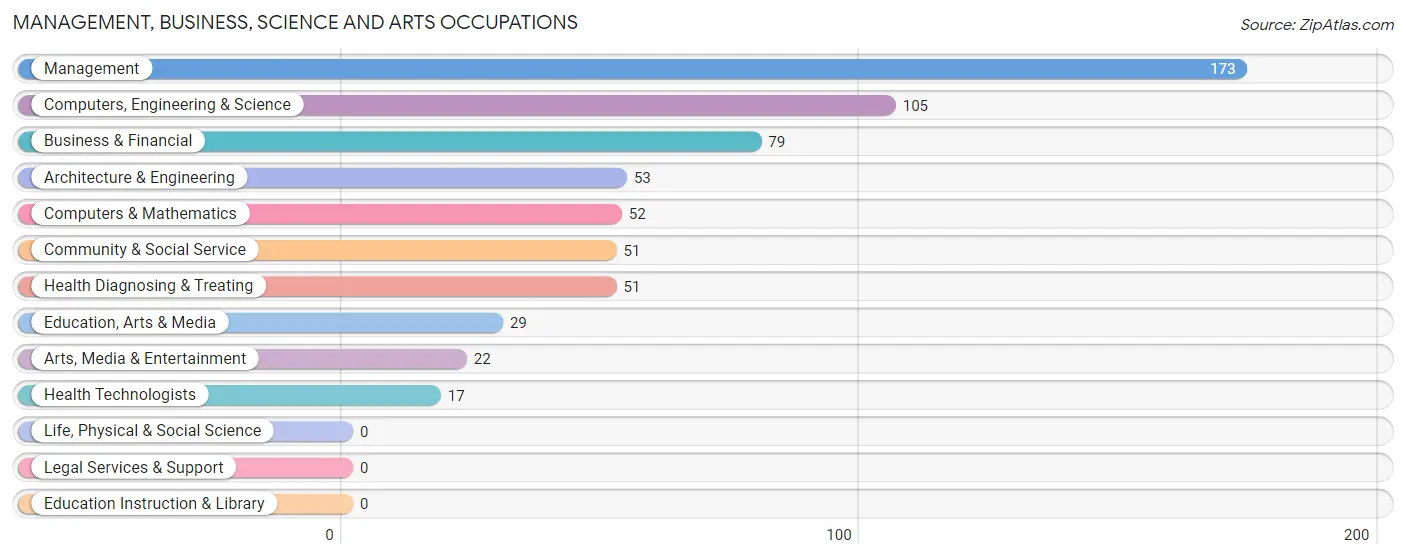
Management, Business, Science and Arts Occupations by Sex
Within the Management, Business, Science and Arts occupations in Turtle Creek borough, the most male-oriented occupations are Architecture & Engineering (100.0%), Arts, Media & Entertainment (100.0%), and Computers, Engineering & Science (85.7%), while the most female-oriented occupations are Education, Arts & Media (100.0%), Health Diagnosing & Treating (100.0%), and Health Technologists (100.0%).
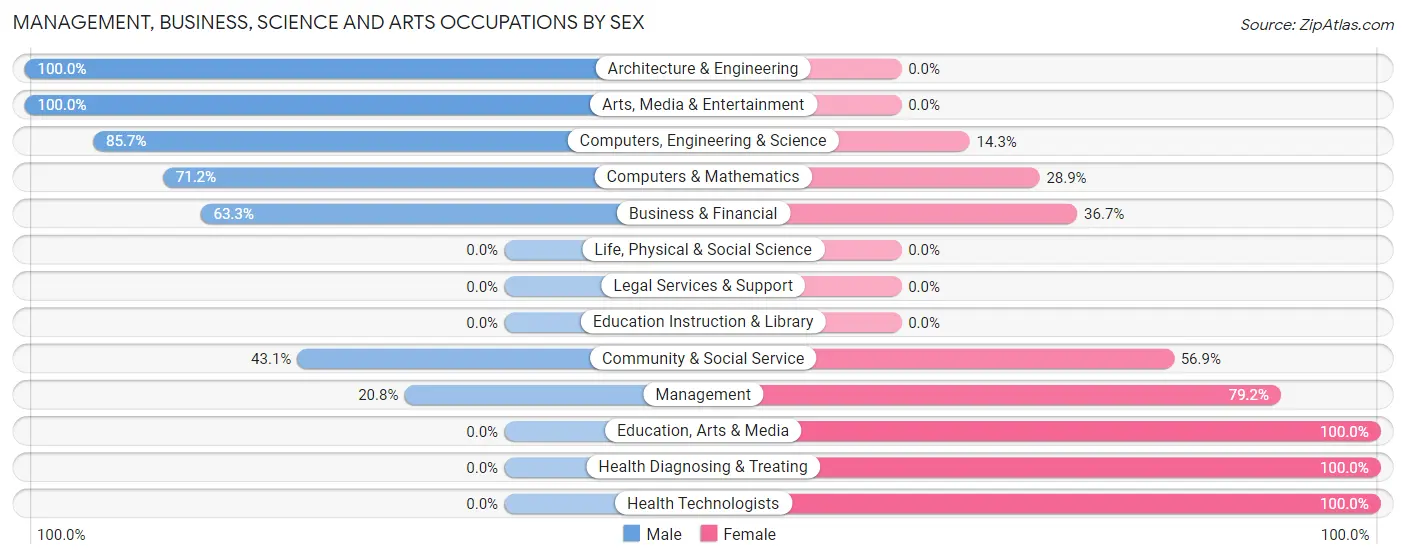
| Occupation | Male | Female |
| Management | 36 (20.8%) | 137 (79.2%) |
| Business & Financial | 50 (63.3%) | 29 (36.7%) |
| Computers, Engineering & Science | 90 (85.7%) | 15 (14.3%) |
| Computers & Mathematics | 37 (71.2%) | 15 (28.8%) |
| Architecture & Engineering | 53 (100.0%) | 0 (0.0%) |
| Life, Physical & Social Science | 0 (0.0%) | 0 (0.0%) |
| Community & Social Service | 22 (43.1%) | 29 (56.9%) |
| Education, Arts & Media | 0 (0.0%) | 29 (100.0%) |
| Legal Services & Support | 0 (0.0%) | 0 (0.0%) |
| Education Instruction & Library | 0 (0.0%) | 0 (0.0%) |
| Arts, Media & Entertainment | 22 (100.0%) | 0 (0.0%) |
| Health Diagnosing & Treating | 0 (0.0%) | 51 (100.0%) |
| Health Technologists | 0 (0.0%) | 17 (100.0%) |
| Total (Category) | 198 (43.1%) | 261 (56.9%) |
| Total (Overall) | 979 (47.9%) | 1,066 (52.1%) |
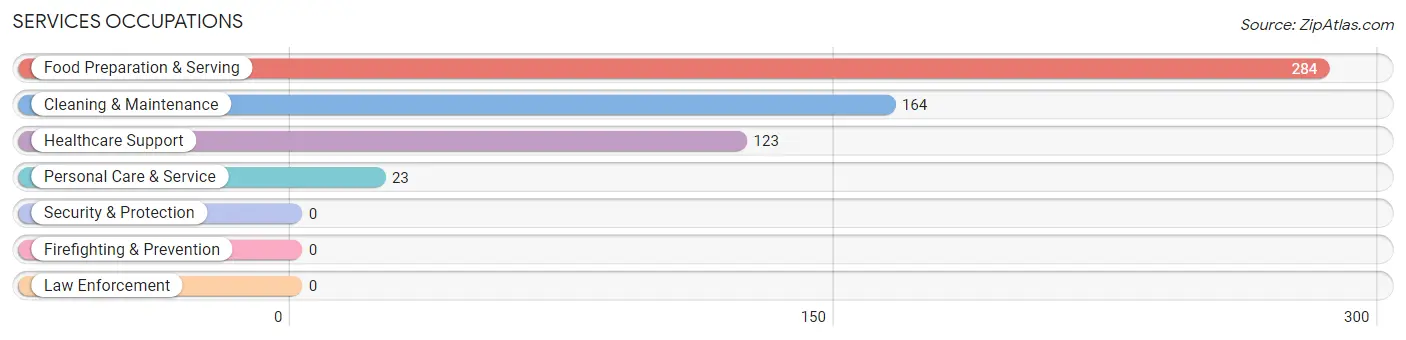
Services Occupations
The most common Services occupations in Turtle Creek borough are Food Preparation & Serving (284 | 13.9%), Cleaning & Maintenance (164 | 8.0%), Healthcare Support (123 | 6.0%), and Personal Care & Service (23 | 1.1%).
Services Occupations by Sex
Within the Services occupations in Turtle Creek borough, the most male-oriented occupations are Personal Care & Service (65.2%), Food Preparation & Serving (50.3%), and Cleaning & Maintenance (23.8%), while the most female-oriented occupations are Healthcare Support (100.0%), Cleaning & Maintenance (76.2%), and Food Preparation & Serving (49.6%).
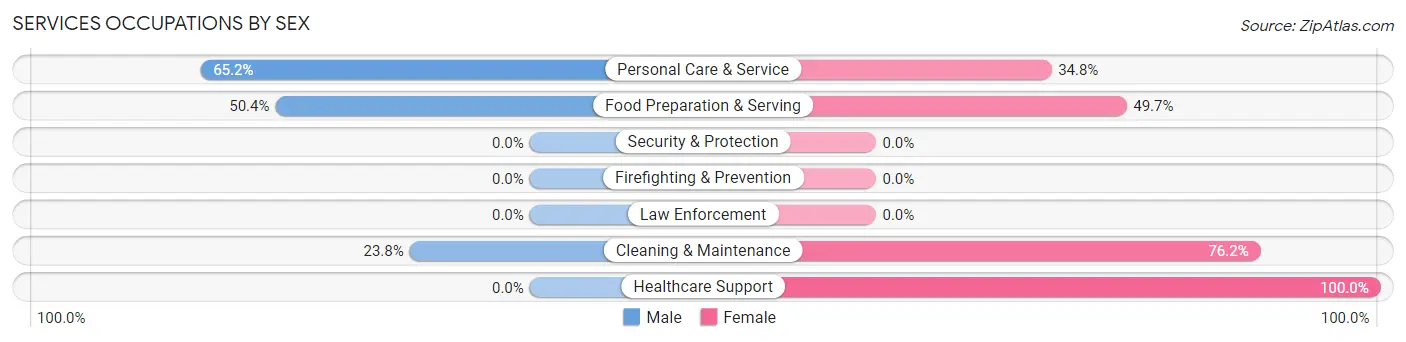
| Occupation | Male | Female |
| Healthcare Support | 0 (0.0%) | 123 (100.0%) |
| Security & Protection | 0 (0.0%) | 0 (0.0%) |
| Firefighting & Prevention | 0 (0.0%) | 0 (0.0%) |
| Law Enforcement | 0 (0.0%) | 0 (0.0%) |
| Food Preparation & Serving | 143 (50.3%) | 141 (49.6%) |
| Cleaning & Maintenance | 39 (23.8%) | 125 (76.2%) |
| Personal Care & Service | 15 (65.2%) | 8 (34.8%) |
| Total (Category) | 197 (33.2%) | 397 (66.8%) |
| Total (Overall) | 979 (47.9%) | 1,066 (52.1%) |
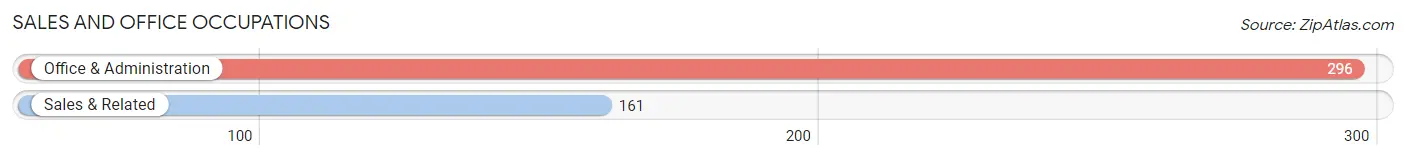
Sales and Office Occupations
The most common Sales and Office occupations in Turtle Creek borough are Office & Administration (296 | 14.5%), and Sales & Related (161 | 7.9%).
Sales and Office Occupations by Sex
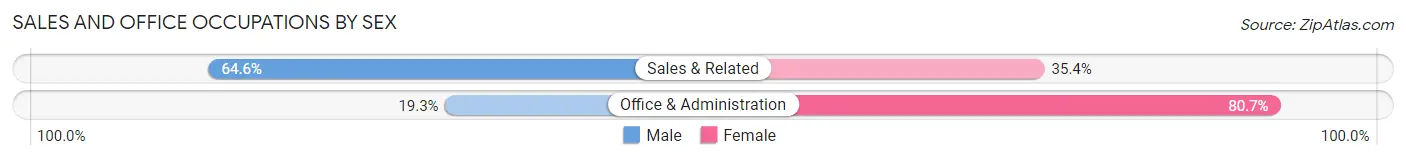
| Occupation | Male | Female |
| Sales & Related | 104 (64.6%) | 57 (35.4%) |
| Office & Administration | 57 (19.3%) | 239 (80.7%) |
| Total (Category) | 161 (35.2%) | 296 (64.8%) |
| Total (Overall) | 979 (47.9%) | 1,066 (52.1%) |
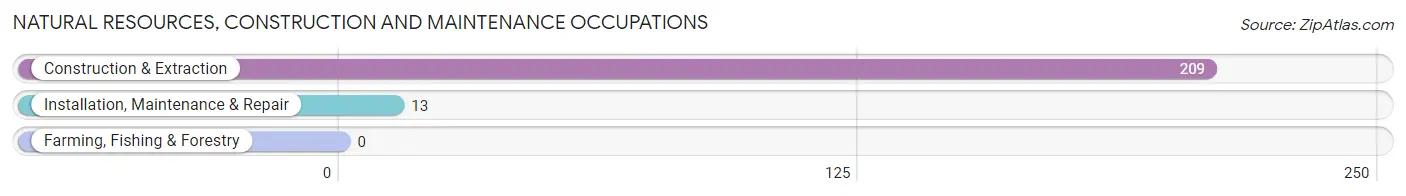
Natural Resources, Construction and Maintenance Occupations
The most common Natural Resources, Construction and Maintenance occupations in Turtle Creek borough are Construction & Extraction (209 | 10.2%), and Installation, Maintenance & Repair (13 | 0.6%).
Natural Resources, Construction and Maintenance Occupations by Sex
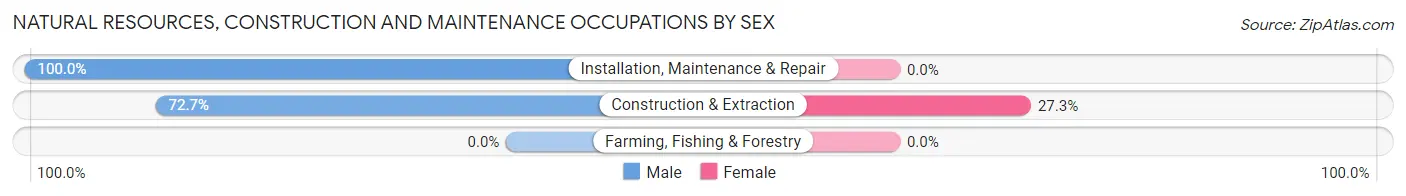
| Occupation | Male | Female |
| Farming, Fishing & Forestry | 0 (0.0%) | 0 (0.0%) |
| Construction & Extraction | 152 (72.7%) | 57 (27.3%) |
| Installation, Maintenance & Repair | 13 (100.0%) | 0 (0.0%) |
| Total (Category) | 165 (74.3%) | 57 (25.7%) |
| Total (Overall) | 979 (47.9%) | 1,066 (52.1%) |
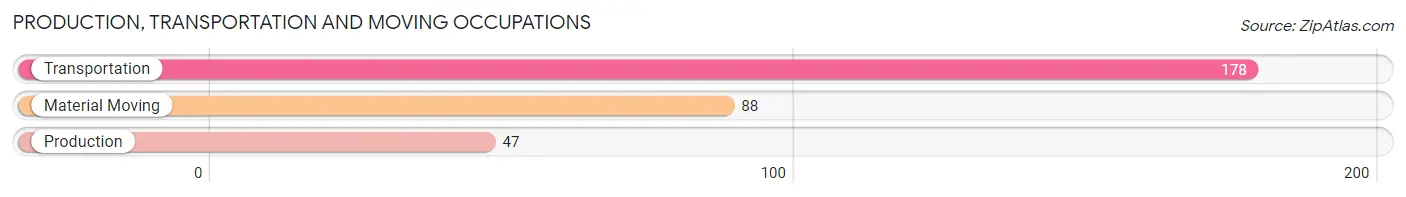
Production, Transportation and Moving Occupations
The most common Production, Transportation and Moving occupations in Turtle Creek borough are Transportation (178 | 8.7%), Material Moving (88 | 4.3%), and Production (47 | 2.3%).
Production, Transportation and Moving Occupations by Sex
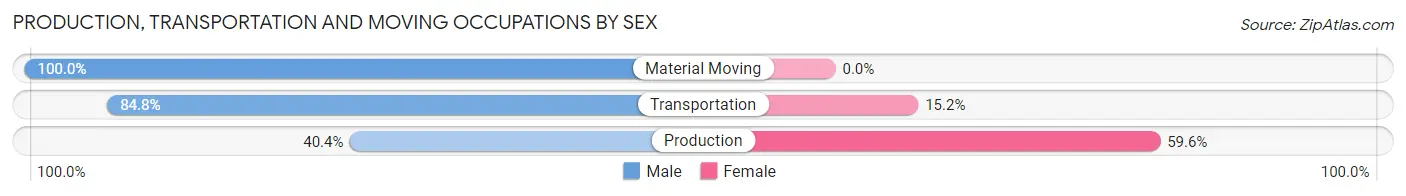
| Occupation | Male | Female |
| Production | 19 (40.4%) | 28 (59.6%) |
| Transportation | 151 (84.8%) | 27 (15.2%) |
| Material Moving | 88 (100.0%) | 0 (0.0%) |
| Total (Category) | 258 (82.4%) | 55 (17.6%) |
| Total (Overall) | 979 (47.9%) | 1,066 (52.1%) |
Employment Industries by Sex in Turtle Creek borough
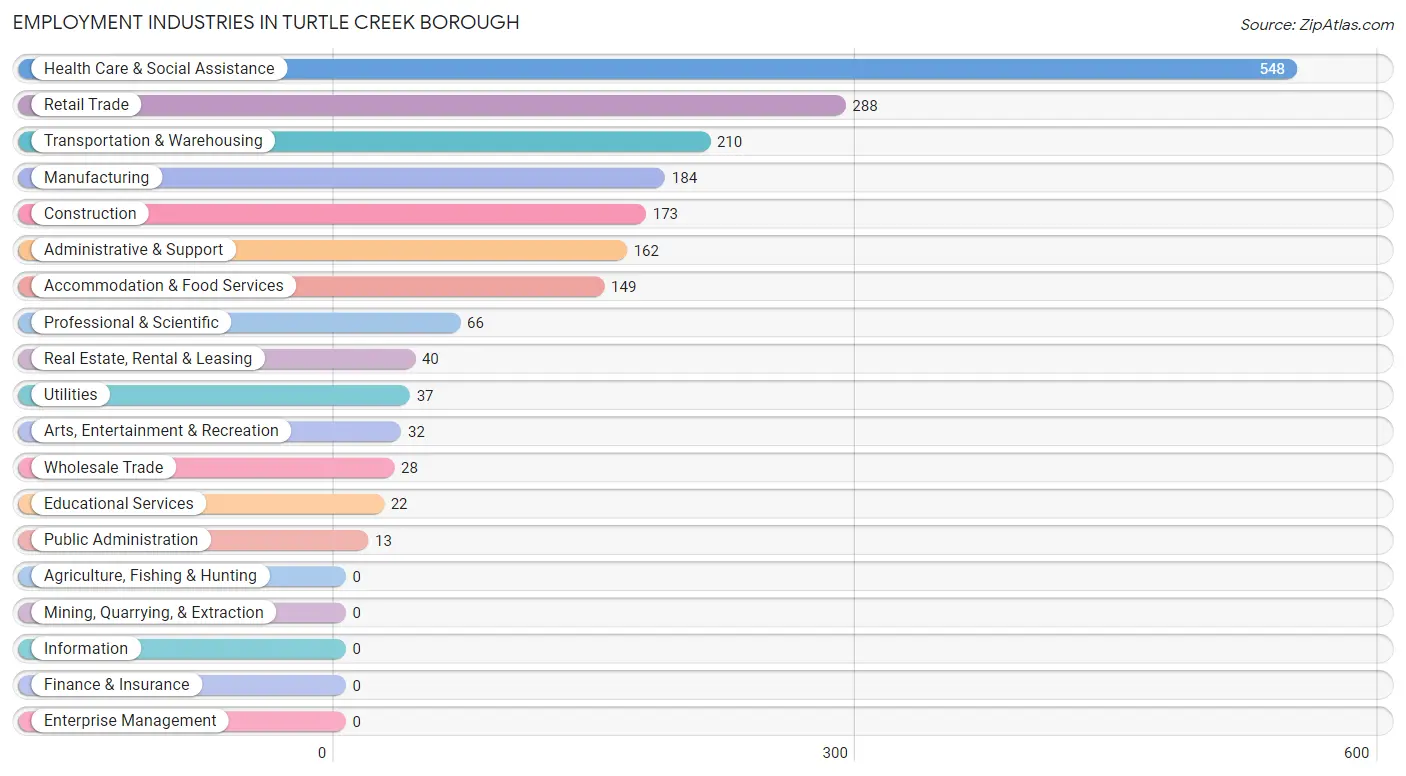
Employment Industries in Turtle Creek borough
The major employment industries in Turtle Creek borough include Health Care & Social Assistance (548 | 26.8%), Retail Trade (288 | 14.1%), Transportation & Warehousing (210 | 10.3%), Manufacturing (184 | 9.0%), and Construction (173 | 8.5%).
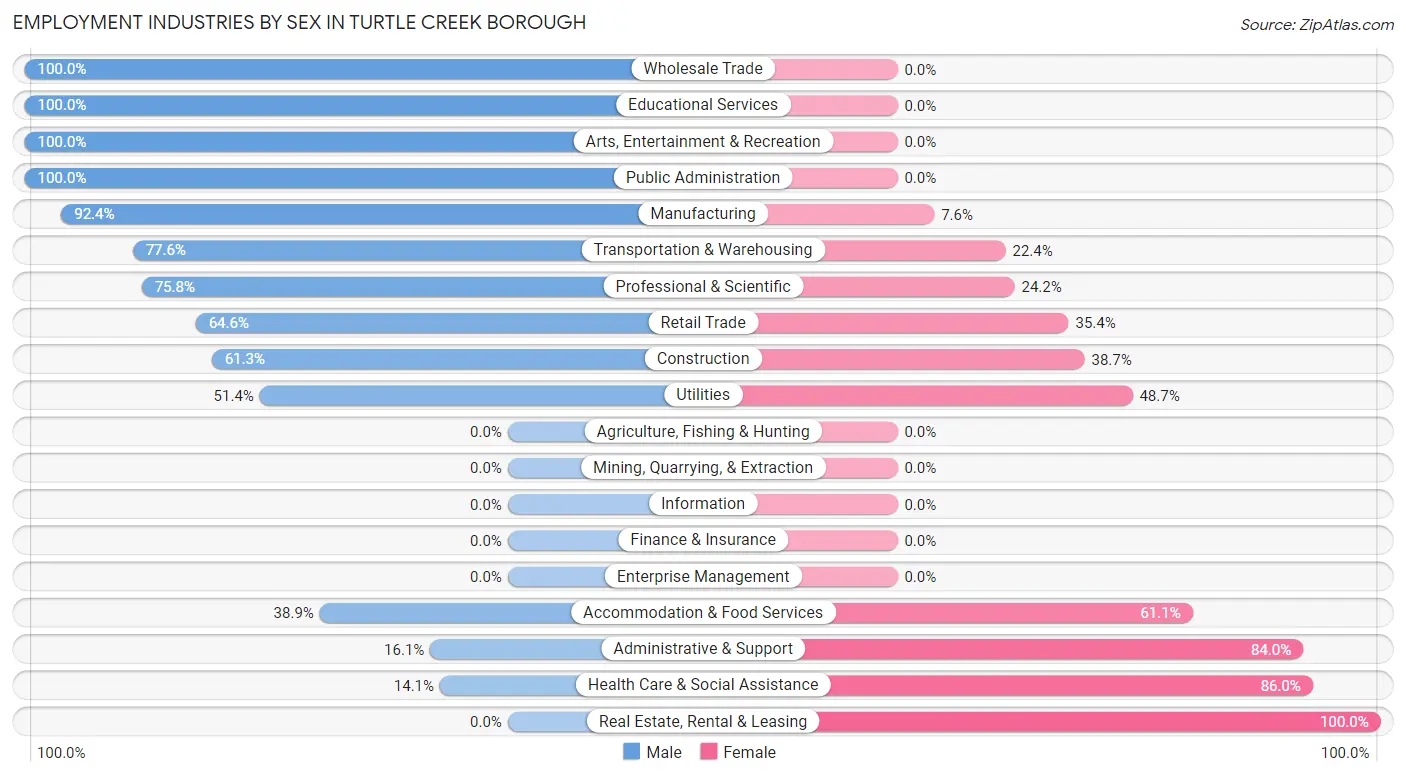
Employment Industries by Sex in Turtle Creek borough
The Turtle Creek borough industries that see more men than women are Wholesale Trade (100.0%), Educational Services (100.0%), and Arts, Entertainment & Recreation (100.0%), whereas the industries that tend to have a higher number of women are Real Estate, Rental & Leasing (100.0%), Health Care & Social Assistance (86.0%), and Administrative & Support (84.0%).
| Industry | Male | Female |
| Agriculture, Fishing & Hunting | 0 (0.0%) | 0 (0.0%) |
| Mining, Quarrying, & Extraction | 0 (0.0%) | 0 (0.0%) |
| Construction | 106 (61.3%) | 67 (38.7%) |
| Manufacturing | 170 (92.4%) | 14 (7.6%) |
| Wholesale Trade | 28 (100.0%) | 0 (0.0%) |
| Retail Trade | 186 (64.6%) | 102 (35.4%) |
| Transportation & Warehousing | 163 (77.6%) | 47 (22.4%) |
| Utilities | 19 (51.3%) | 18 (48.6%) |
| Information | 0 (0.0%) | 0 (0.0%) |
| Finance & Insurance | 0 (0.0%) | 0 (0.0%) |
| Real Estate, Rental & Leasing | 0 (0.0%) | 40 (100.0%) |
| Professional & Scientific | 50 (75.8%) | 16 (24.2%) |
| Enterprise Management | 0 (0.0%) | 0 (0.0%) |
| Administrative & Support | 26 (16.1%) | 136 (84.0%) |
| Educational Services | 22 (100.0%) | 0 (0.0%) |
| Health Care & Social Assistance | 77 (14.1%) | 471 (86.0%) |
| Arts, Entertainment & Recreation | 32 (100.0%) | 0 (0.0%) |
| Accommodation & Food Services | 58 (38.9%) | 91 (61.1%) |
| Public Administration | 13 (100.0%) | 0 (0.0%) |
| Total | 979 (47.9%) | 1,066 (52.1%) |
Education in Turtle Creek borough
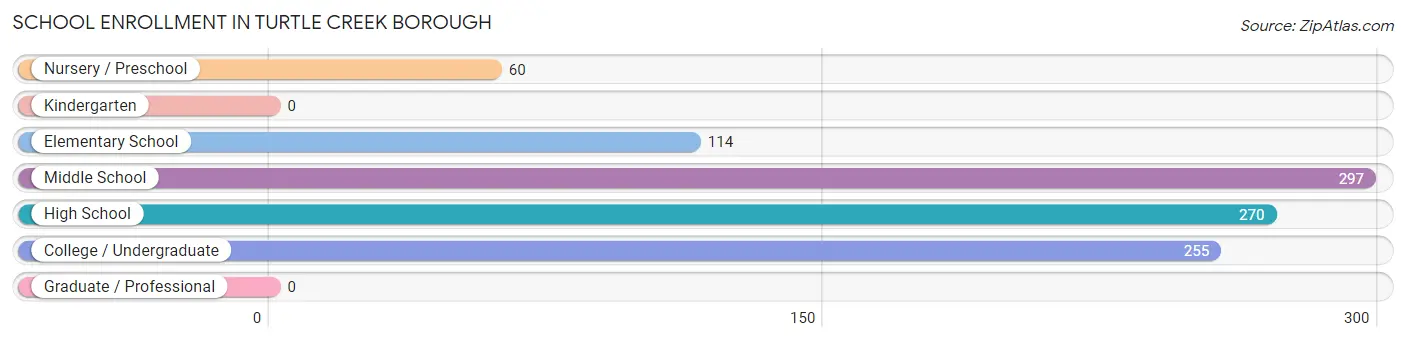
School Enrollment in Turtle Creek borough
The most common levels of schooling among the 996 students in Turtle Creek borough are middle school (297 | 29.8%), high school (270 | 27.1%), and college / undergraduate (255 | 25.6%).
| School Level | # Students | % Students |
| Nursery / Preschool | 60 | 6.0% |
| Kindergarten | 0 | 0.0% |
| Elementary School | 114 | 11.5% |
| Middle School | 297 | 29.8% |
| High School | 270 | 27.1% |
| College / Undergraduate | 255 | 25.6% |
| Graduate / Professional | 0 | 0.0% |
| Total | 996 | 100.0% |
School Enrollment by Age by Funding Source in Turtle Creek borough
Out of a total of 996 students who are enrolled in schools in Turtle Creek borough, 38 (3.8%) attend a private institution, while the remaining 958 (96.2%) are enrolled in public schools. The age group of 10 to 14 year olds has the highest likelihood of being enrolled in private schools, with 38 (9.5% in the age bracket) enrolled. Conversely, the age group of 3 to 4 year olds has the lowest likelihood of being enrolled in a private school, with 12 (100.0% in the age bracket) attending a public institution.
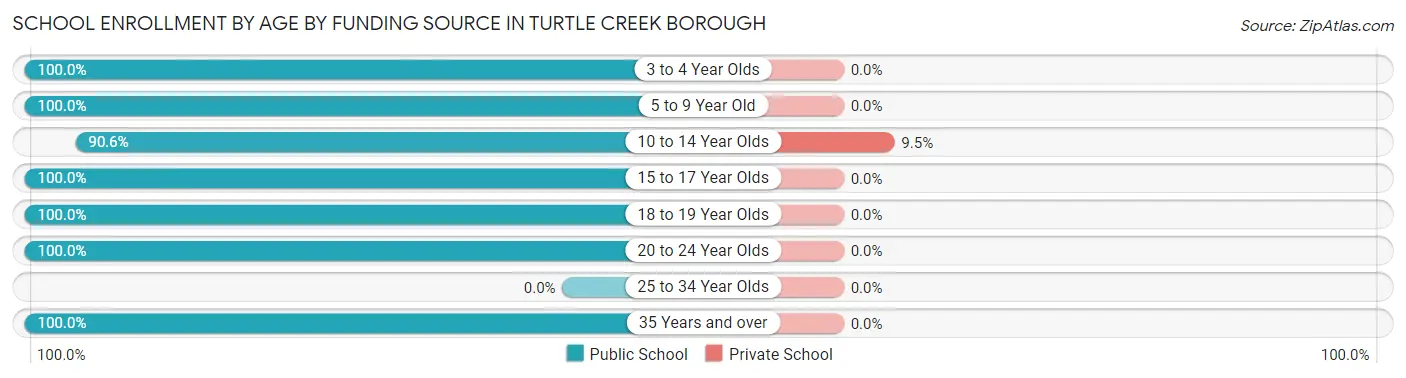
| Age Bracket | Public School | Private School |
| 3 to 4 Year Olds | 12 (100.0%) | 0 (0.0%) |
| 5 to 9 Year Old | 123 (100.0%) | 0 (0.0%) |
| 10 to 14 Year Olds | 364 (90.5%) | 38 (9.5%) |
| 15 to 17 Year Olds | 204 (100.0%) | 0 (0.0%) |
| 18 to 19 Year Olds | 47 (100.0%) | 0 (0.0%) |
| 20 to 24 Year Olds | 125 (100.0%) | 0 (0.0%) |
| 25 to 34 Year Olds | 0 (0.0%) | 0 (0.0%) |
| 35 Years and over | 83 (100.0%) | 0 (0.0%) |
| Total | 958 (96.2%) | 38 (3.8%) |
Educational Attainment by Field of Study in Turtle Creek borough
Science & technology (107 | 22.9%), arts & humanities (78 | 16.7%), business (69 | 14.8%), education (52 | 11.1%), and psychology (37 | 7.9%) are the most common fields of study among 467 individuals in Turtle Creek borough who have obtained a bachelor's degree or higher.
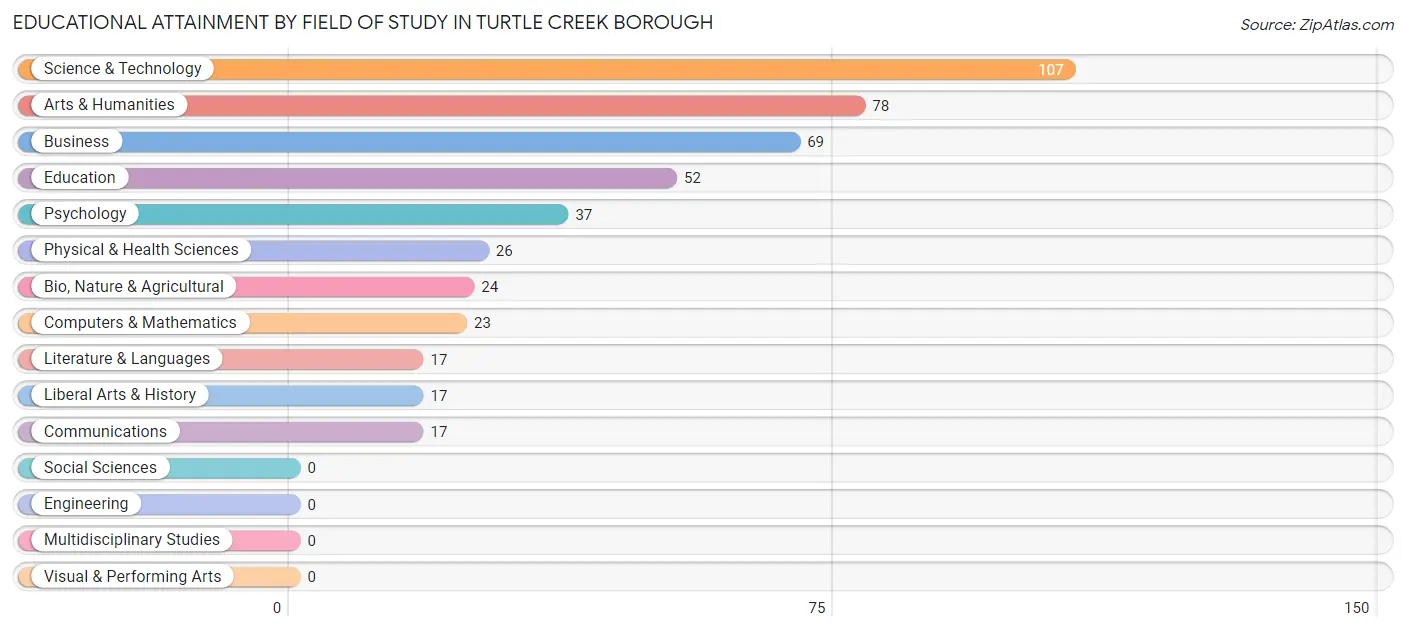
| Field of Study | # Graduates | % Graduates |
| Computers & Mathematics | 23 | 4.9% |
| Bio, Nature & Agricultural | 24 | 5.1% |
| Physical & Health Sciences | 26 | 5.6% |
| Psychology | 37 | 7.9% |
| Social Sciences | 0 | 0.0% |
| Engineering | 0 | 0.0% |
| Multidisciplinary Studies | 0 | 0.0% |
| Science & Technology | 107 | 22.9% |
| Business | 69 | 14.8% |
| Education | 52 | 11.1% |
| Literature & Languages | 17 | 3.6% |
| Liberal Arts & History | 17 | 3.6% |
| Visual & Performing Arts | 0 | 0.0% |
| Communications | 17 | 3.6% |
| Arts & Humanities | 78 | 16.7% |
| Total | 467 | 100.0% |
Transportation & Commute in Turtle Creek borough
Vehicle Availability by Sex in Turtle Creek borough
The most prevalent vehicle ownership categories in Turtle Creek borough are males with 2 vehicles (443, accounting for 46.8%) and females with 2 vehicles (606, making up 41.6%).
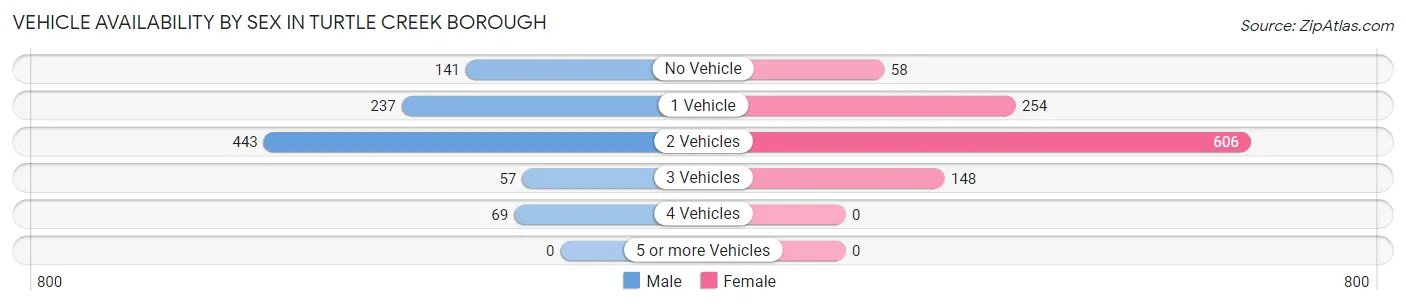
| Vehicles Available | Male | Female |
| No Vehicle | 141 (14.9%) | 58 (5.4%) |
| 1 Vehicle | 237 (25.0%) | 254 (23.8%) |
| 2 Vehicles | 443 (46.8%) | 606 (56.9%) |
| 3 Vehicles | 57 (6.0%) | 148 (13.9%) |
| 4 Vehicles | 69 (7.3%) | 0 (0.0%) |
| 5 or more Vehicles | 0 (0.0%) | 0 (0.0%) |
| Total | 947 (100.0%) | 1,066 (100.0%) |
Commute Time in Turtle Creek borough
The most frequently occuring commute durations in Turtle Creek borough are 30 to 34 minutes (420 commuters, 21.5%), 10 to 14 minutes (298 commuters, 15.3%), and 60 to 89 minutes (269 commuters, 13.8%).
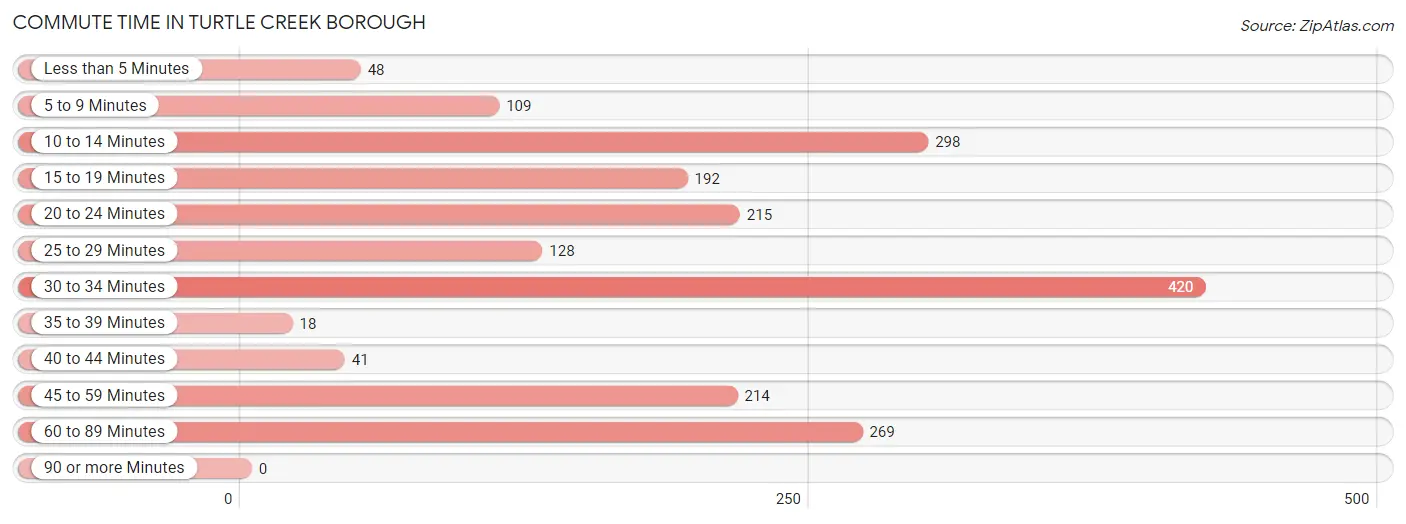
| Commute Time | # Commuters | % Commuters |
| Less than 5 Minutes | 48 | 2.5% |
| 5 to 9 Minutes | 109 | 5.6% |
| 10 to 14 Minutes | 298 | 15.3% |
| 15 to 19 Minutes | 192 | 9.8% |
| 20 to 24 Minutes | 215 | 11.0% |
| 25 to 29 Minutes | 128 | 6.6% |
| 30 to 34 Minutes | 420 | 21.5% |
| 35 to 39 Minutes | 18 | 0.9% |
| 40 to 44 Minutes | 41 | 2.1% |
| 45 to 59 Minutes | 214 | 11.0% |
| 60 to 89 Minutes | 269 | 13.8% |
| 90 or more Minutes | 0 | 0.0% |
Commute Time by Sex in Turtle Creek borough
The most common commute times in Turtle Creek borough are 30 to 34 minutes (235 commuters, 24.8%) for males and 10 to 14 minutes (211 commuters, 21.0%) for females.
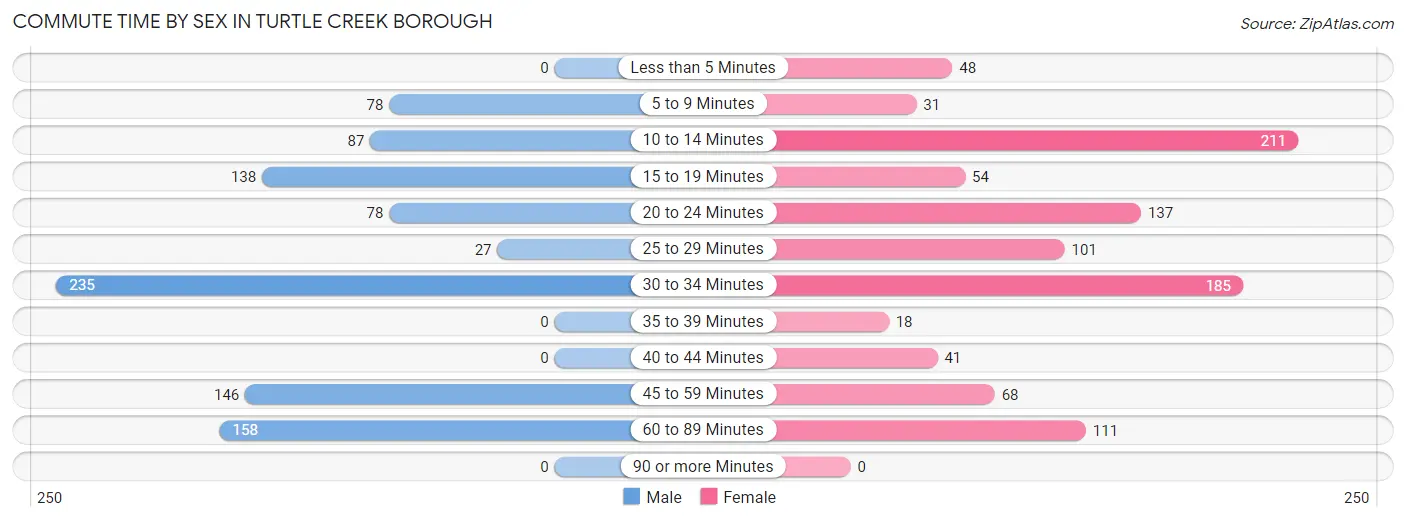
| Commute Time | Male | Female |
| Less than 5 Minutes | 0 (0.0%) | 48 (4.8%) |
| 5 to 9 Minutes | 78 (8.2%) | 31 (3.1%) |
| 10 to 14 Minutes | 87 (9.2%) | 211 (21.0%) |
| 15 to 19 Minutes | 138 (14.6%) | 54 (5.4%) |
| 20 to 24 Minutes | 78 (8.2%) | 137 (13.6%) |
| 25 to 29 Minutes | 27 (2.9%) | 101 (10.1%) |
| 30 to 34 Minutes | 235 (24.8%) | 185 (18.4%) |
| 35 to 39 Minutes | 0 (0.0%) | 18 (1.8%) |
| 40 to 44 Minutes | 0 (0.0%) | 41 (4.1%) |
| 45 to 59 Minutes | 146 (15.4%) | 68 (6.8%) |
| 60 to 89 Minutes | 158 (16.7%) | 111 (11.0%) |
| 90 or more Minutes | 0 (0.0%) | 0 (0.0%) |
Time of Departure to Work by Sex in Turtle Creek borough
The most frequent times of departure to work in Turtle Creek borough are 7:00 AM to 7:29 AM (253, 26.7%) for males and 5:30 AM to 5:59 AM (248, 24.7%) for females.
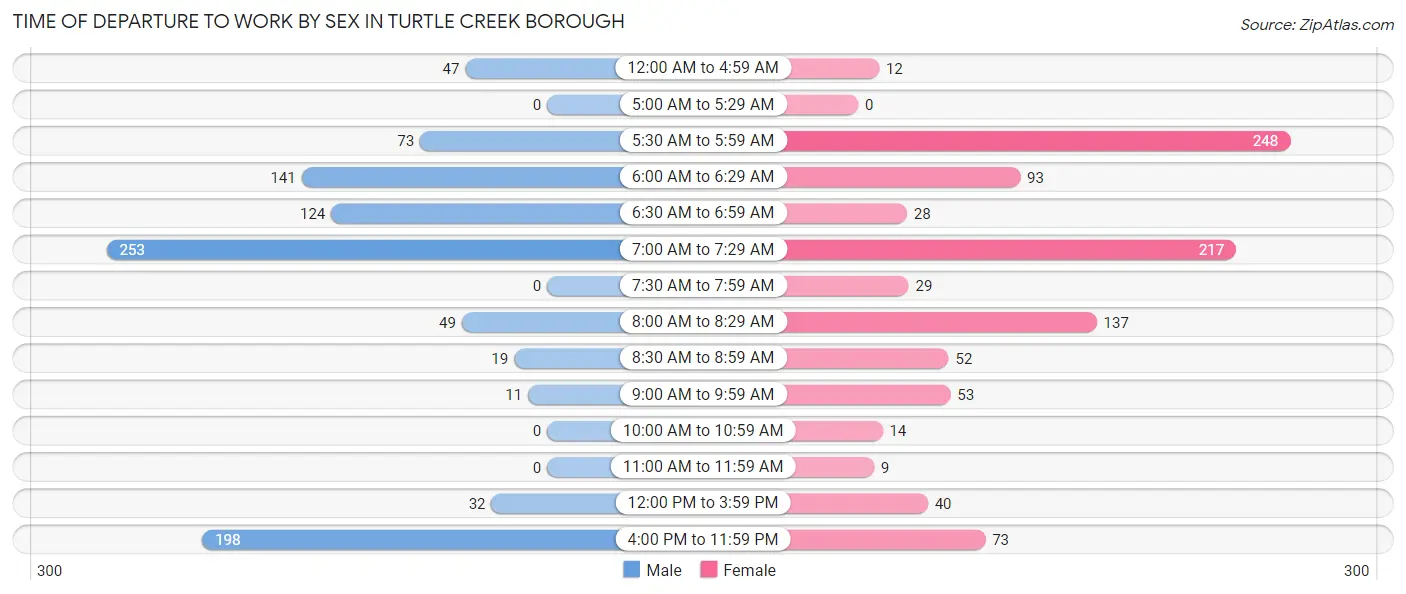
| Time of Departure | Male | Female |
| 12:00 AM to 4:59 AM | 47 (5.0%) | 12 (1.2%) |
| 5:00 AM to 5:29 AM | 0 (0.0%) | 0 (0.0%) |
| 5:30 AM to 5:59 AM | 73 (7.7%) | 248 (24.7%) |
| 6:00 AM to 6:29 AM | 141 (14.9%) | 93 (9.2%) |
| 6:30 AM to 6:59 AM | 124 (13.1%) | 28 (2.8%) |
| 7:00 AM to 7:29 AM | 253 (26.7%) | 217 (21.6%) |
| 7:30 AM to 7:59 AM | 0 (0.0%) | 29 (2.9%) |
| 8:00 AM to 8:29 AM | 49 (5.2%) | 137 (13.6%) |
| 8:30 AM to 8:59 AM | 19 (2.0%) | 52 (5.2%) |
| 9:00 AM to 9:59 AM | 11 (1.2%) | 53 (5.3%) |
| 10:00 AM to 10:59 AM | 0 (0.0%) | 14 (1.4%) |
| 11:00 AM to 11:59 AM | 0 (0.0%) | 9 (0.9%) |
| 12:00 PM to 3:59 PM | 32 (3.4%) | 40 (4.0%) |
| 4:00 PM to 11:59 PM | 198 (20.9%) | 73 (7.3%) |
| Total | 947 (100.0%) | 1,005 (100.0%) |
Housing Occupancy in Turtle Creek borough
Occupancy by Ownership in Turtle Creek borough
Of the total 2,174 dwellings in Turtle Creek borough, owner-occupied units account for 800 (36.8%), while renter-occupied units make up 1,374 (63.2%).
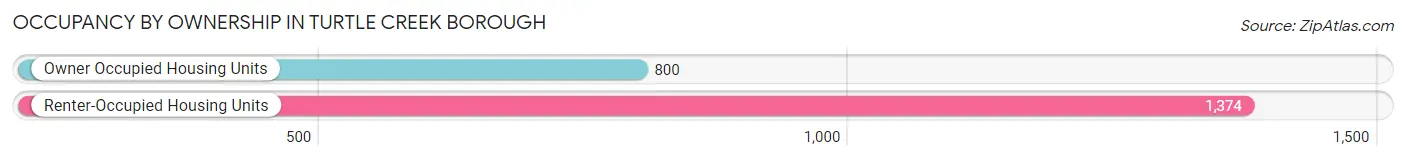
| Occupancy | # Housing Units | % Housing Units |
| Owner Occupied Housing Units | 800 | 36.8% |
| Renter-Occupied Housing Units | 1,374 | 63.2% |
| Total Occupied Housing Units | 2,174 | 100.0% |
Occupancy by Household Size in Turtle Creek borough
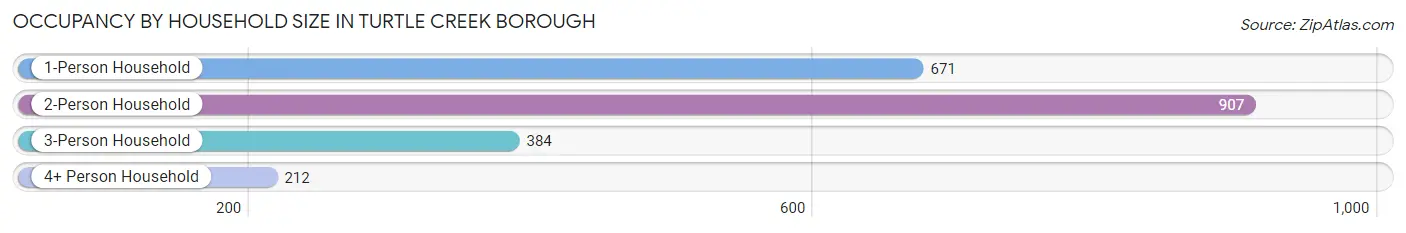
| Household Size | # Housing Units | % Housing Units |
| 1-Person Household | 671 | 30.9% |
| 2-Person Household | 907 | 41.7% |
| 3-Person Household | 384 | 17.7% |
| 4+ Person Household | 212 | 9.8% |
| Total Housing Units | 2,174 | 100.0% |
Occupancy by Ownership by Household Size in Turtle Creek borough
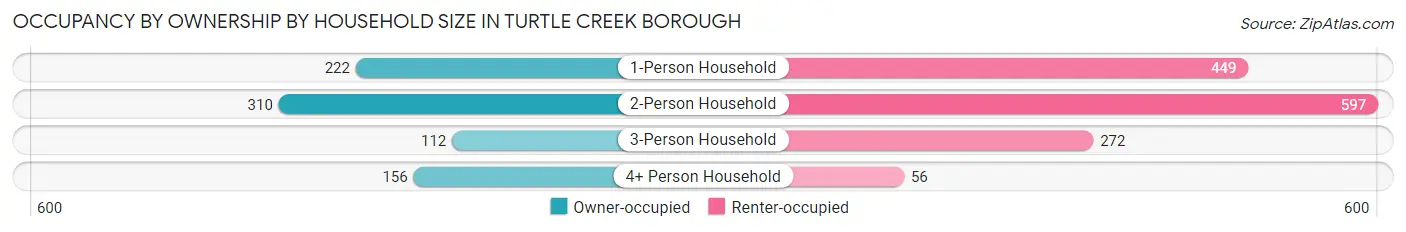
| Household Size | Owner-occupied | Renter-occupied |
| 1-Person Household | 222 (33.1%) | 449 (66.9%) |
| 2-Person Household | 310 (34.2%) | 597 (65.8%) |
| 3-Person Household | 112 (29.2%) | 272 (70.8%) |
| 4+ Person Household | 156 (73.6%) | 56 (26.4%) |
| Total Housing Units | 800 (36.8%) | 1,374 (63.2%) |
Occupancy by Educational Attainment in Turtle Creek borough
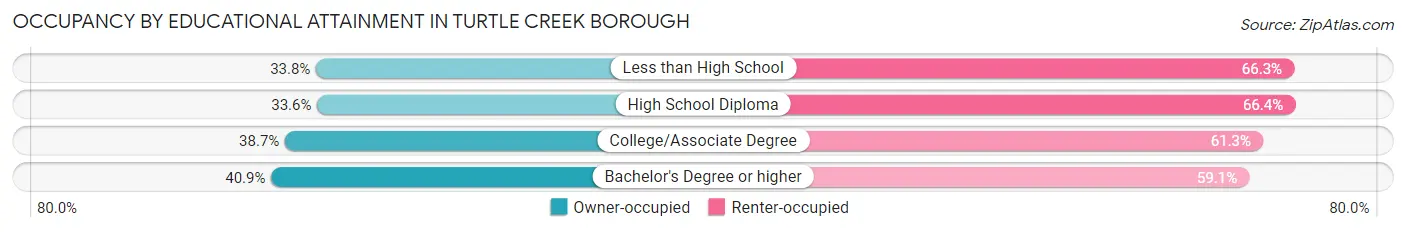
| Household Size | Owner-occupied | Renter-occupied |
| Less than High School | 81 (33.8%) | 159 (66.2%) |
| High School Diploma | 237 (33.6%) | 469 (66.4%) |
| College/Associate Degree | 350 (38.7%) | 555 (61.3%) |
| Bachelor's Degree or higher | 132 (40.9%) | 191 (59.1%) |
Occupancy by Age of Householder in Turtle Creek borough
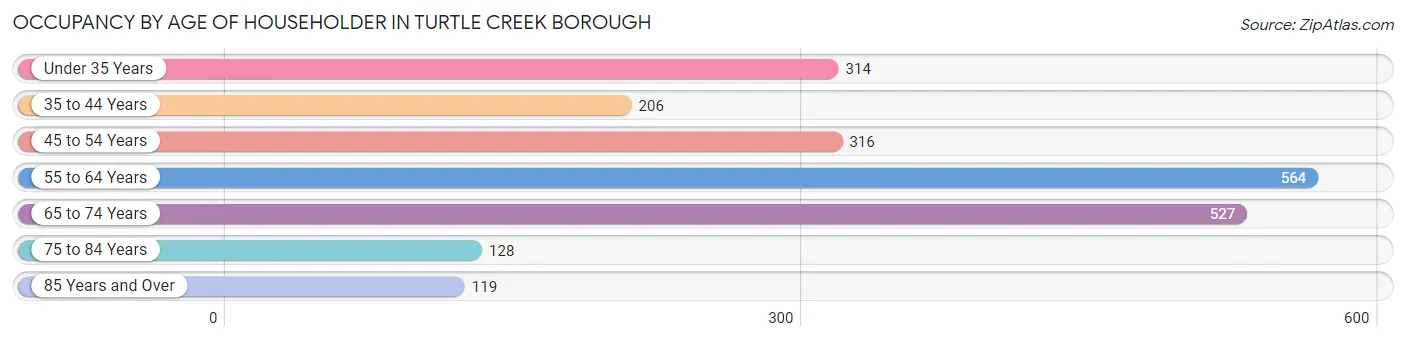
| Age Bracket | # Households | % Households |
| Under 35 Years | 314 | 14.4% |
| 35 to 44 Years | 206 | 9.5% |
| 45 to 54 Years | 316 | 14.5% |
| 55 to 64 Years | 564 | 25.9% |
| 65 to 74 Years | 527 | 24.2% |
| 75 to 84 Years | 128 | 5.9% |
| 85 Years and Over | 119 | 5.5% |
| Total | 2,174 | 100.0% |
Housing Finances in Turtle Creek borough
Median Income by Occupancy in Turtle Creek borough
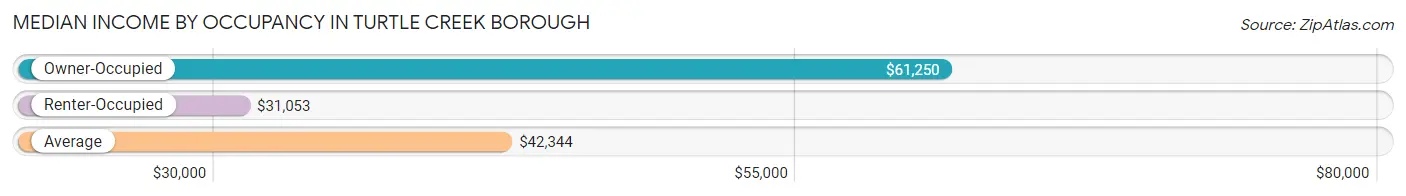
| Occupancy Type | # Households | Median Income |
| Owner-Occupied | 800 (36.8%) | $61,250 |
| Renter-Occupied | 1,374 (63.2%) | $31,053 |
| Average | 2,174 (100.0%) | $42,344 |
Occupancy by Householder Income Bracket in Turtle Creek borough
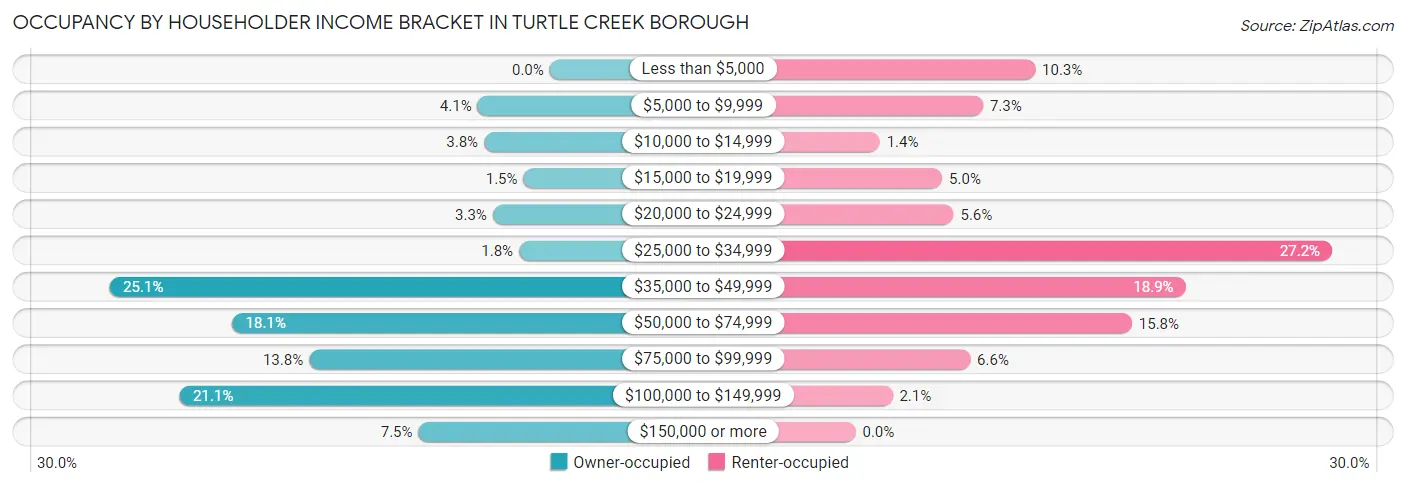
| Income Bracket | Owner-occupied | Renter-occupied |
| Less than $5,000 | 0 (0.0%) | 141 (10.3%) |
| $5,000 to $9,999 | 33 (4.1%) | 100 (7.3%) |
| $10,000 to $14,999 | 30 (3.7%) | 19 (1.4%) |
| $15,000 to $19,999 | 12 (1.5%) | 68 (5.0%) |
| $20,000 to $24,999 | 26 (3.3%) | 77 (5.6%) |
| $25,000 to $34,999 | 14 (1.8%) | 374 (27.2%) |
| $35,000 to $49,999 | 201 (25.1%) | 259 (18.9%) |
| $50,000 to $74,999 | 145 (18.1%) | 217 (15.8%) |
| $75,000 to $99,999 | 110 (13.8%) | 90 (6.6%) |
| $100,000 to $149,999 | 169 (21.1%) | 29 (2.1%) |
| $150,000 or more | 60 (7.5%) | 0 (0.0%) |
| Total | 800 (100.0%) | 1,374 (100.0%) |
Monthly Housing Cost Tiers in Turtle Creek borough
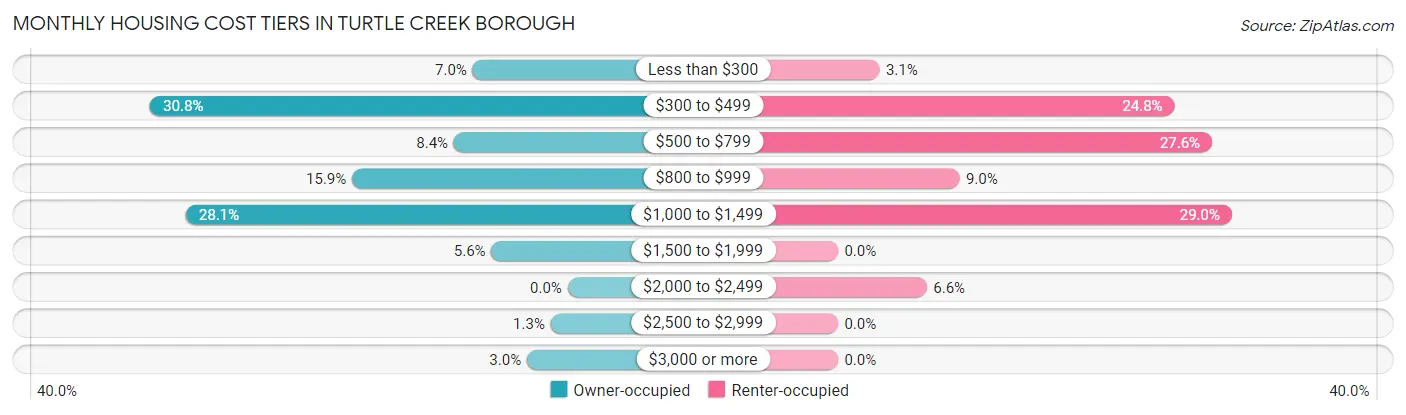
| Monthly Cost | Owner-occupied | Renter-occupied |
| Less than $300 | 56 (7.0%) | 42 (3.1%) |
| $300 to $499 | 246 (30.7%) | 341 (24.8%) |
| $500 to $799 | 67 (8.4%) | 379 (27.6%) |
| $800 to $999 | 127 (15.9%) | 123 (8.9%) |
| $1,000 to $1,499 | 225 (28.1%) | 399 (29.0%) |
| $1,500 to $1,999 | 45 (5.6%) | 0 (0.0%) |
| $2,000 to $2,499 | 0 (0.0%) | 90 (6.6%) |
| $2,500 to $2,999 | 10 (1.3%) | 0 (0.0%) |
| $3,000 or more | 24 (3.0%) | 0 (0.0%) |
| Total | 800 (100.0%) | 1,374 (100.0%) |
Physical Housing Characteristics in Turtle Creek borough
Housing Structures in Turtle Creek borough
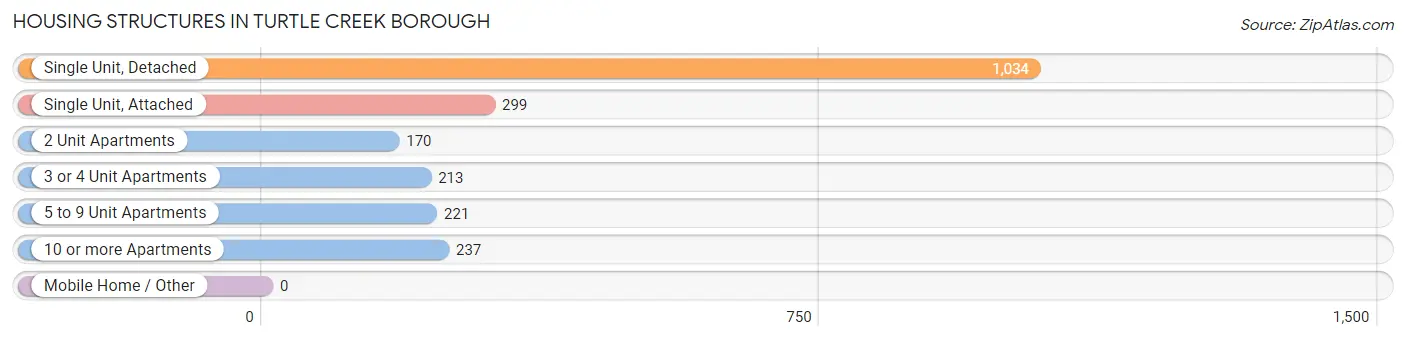
| Structure Type | # Housing Units | % Housing Units |
| Single Unit, Detached | 1,034 | 47.6% |
| Single Unit, Attached | 299 | 13.8% |
| 2 Unit Apartments | 170 | 7.8% |
| 3 or 4 Unit Apartments | 213 | 9.8% |
| 5 to 9 Unit Apartments | 221 | 10.2% |
| 10 or more Apartments | 237 | 10.9% |
| Mobile Home / Other | 0 | 0.0% |
| Total | 2,174 | 100.0% |
Housing Structures by Occupancy in Turtle Creek borough
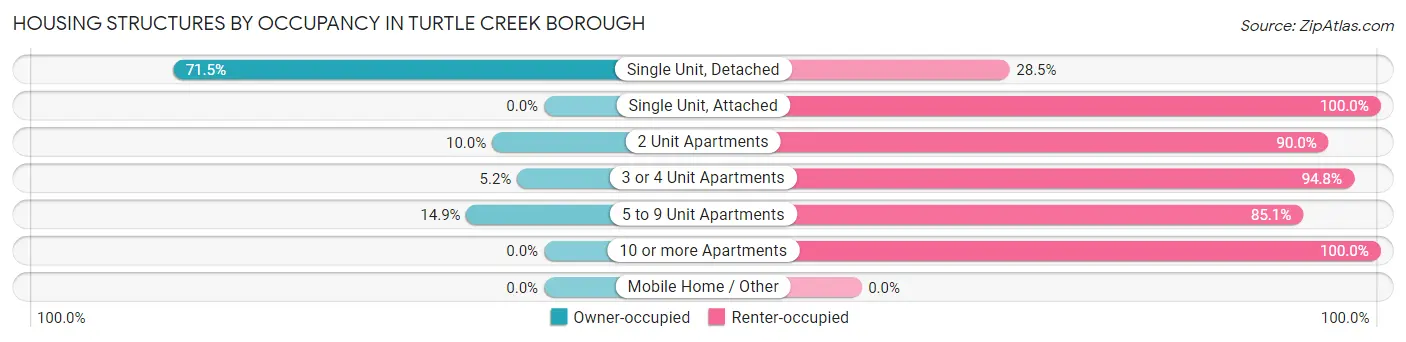
| Structure Type | Owner-occupied | Renter-occupied |
| Single Unit, Detached | 739 (71.5%) | 295 (28.5%) |
| Single Unit, Attached | 0 (0.0%) | 299 (100.0%) |
| 2 Unit Apartments | 17 (10.0%) | 153 (90.0%) |
| 3 or 4 Unit Apartments | 11 (5.2%) | 202 (94.8%) |
| 5 to 9 Unit Apartments | 33 (14.9%) | 188 (85.1%) |
| 10 or more Apartments | 0 (0.0%) | 237 (100.0%) |
| Mobile Home / Other | 0 (0.0%) | 0 (0.0%) |
| Total | 800 (36.8%) | 1,374 (63.2%) |
Housing Structures by Number of Rooms in Turtle Creek borough
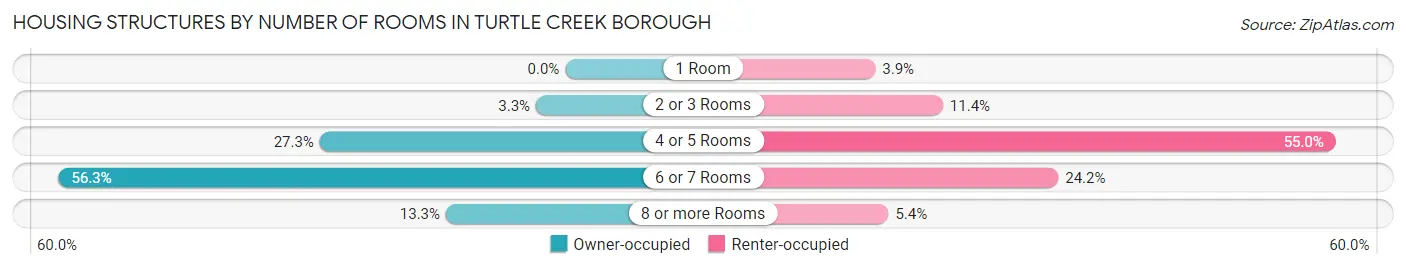
| Number of Rooms | Owner-occupied | Renter-occupied |
| 1 Room | 0 (0.0%) | 54 (3.9%) |
| 2 or 3 Rooms | 26 (3.3%) | 157 (11.4%) |
| 4 or 5 Rooms | 218 (27.3%) | 756 (55.0%) |
| 6 or 7 Rooms | 450 (56.2%) | 333 (24.2%) |
| 8 or more Rooms | 106 (13.3%) | 74 (5.4%) |
| Total | 800 (100.0%) | 1,374 (100.0%) |
Housing Structure by Heating Type in Turtle Creek borough
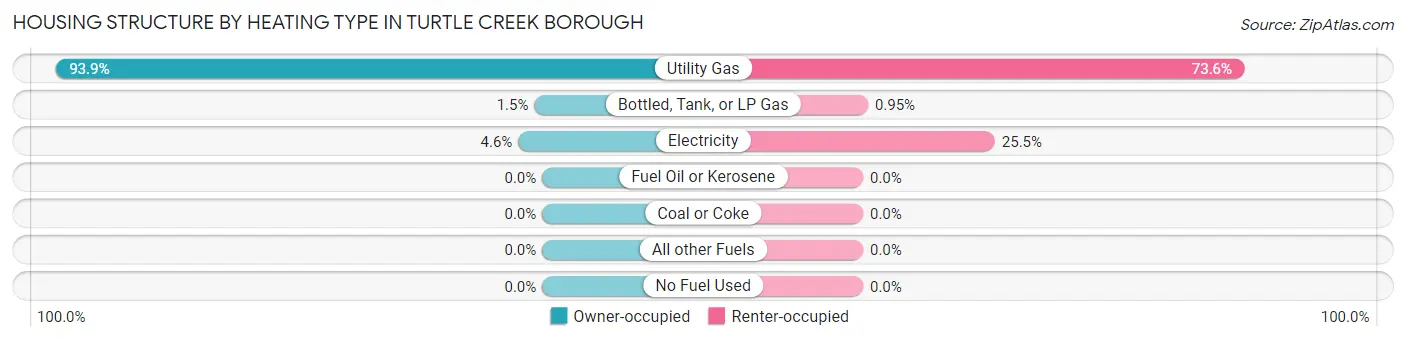
| Heating Type | Owner-occupied | Renter-occupied |
| Utility Gas | 751 (93.9%) | 1,011 (73.6%) |
| Bottled, Tank, or LP Gas | 12 (1.5%) | 13 (0.9%) |
| Electricity | 37 (4.6%) | 350 (25.5%) |
| Fuel Oil or Kerosene | 0 (0.0%) | 0 (0.0%) |
| Coal or Coke | 0 (0.0%) | 0 (0.0%) |
| All other Fuels | 0 (0.0%) | 0 (0.0%) |
| No Fuel Used | 0 (0.0%) | 0 (0.0%) |
| Total | 800 (100.0%) | 1,374 (100.0%) |
Household Vehicle Usage in Turtle Creek borough
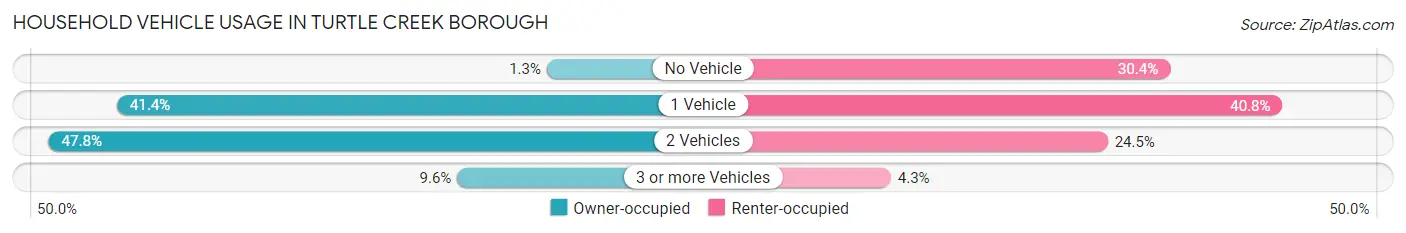
| Vehicles per Household | Owner-occupied | Renter-occupied |
| No Vehicle | 10 (1.3%) | 417 (30.3%) |
| 1 Vehicle | 331 (41.4%) | 561 (40.8%) |
| 2 Vehicles | 382 (47.7%) | 337 (24.5%) |
| 3 or more Vehicles | 77 (9.6%) | 59 (4.3%) |
| Total | 800 (100.0%) | 1,374 (100.0%) |
Real Estate & Mortgages in Turtle Creek borough
Real Estate and Mortgage Overview in Turtle Creek borough
| Characteristic | Without Mortgage | With Mortgage |
| Housing Units | 394 | 406 |
| Median Property Value | $56,100 | $94,000 |
| Median Household Income | $55,208 | $60 |
| Monthly Housing Costs | $434 | $24 |
| Real Estate Taxes | $1,815 | $11 |
Property Value by Mortgage Status in Turtle Creek borough
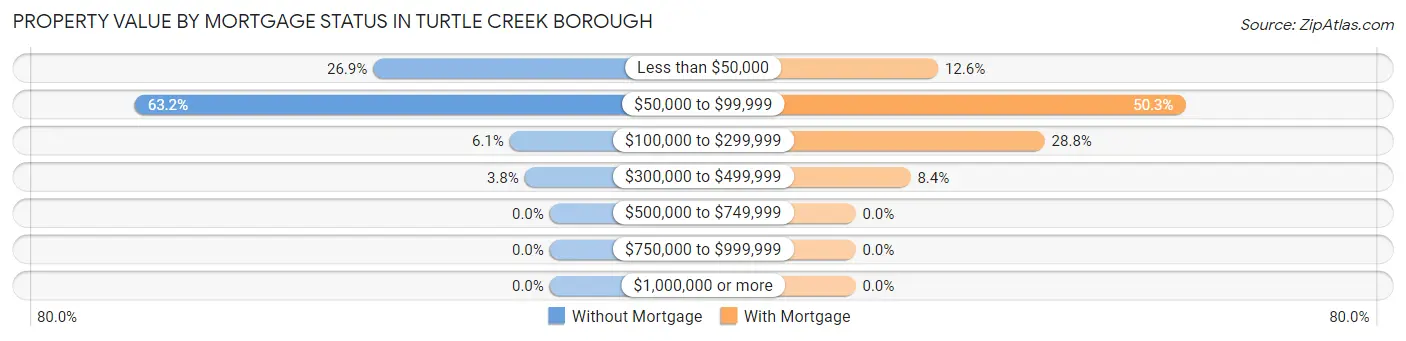
| Property Value | Without Mortgage | With Mortgage |
| Less than $50,000 | 106 (26.9%) | 51 (12.6%) |
| $50,000 to $99,999 | 249 (63.2%) | 204 (50.2%) |
| $100,000 to $299,999 | 24 (6.1%) | 117 (28.8%) |
| $300,000 to $499,999 | 15 (3.8%) | 34 (8.4%) |
| $500,000 to $749,999 | 0 (0.0%) | 0 (0.0%) |
| $750,000 to $999,999 | 0 (0.0%) | 0 (0.0%) |
| $1,000,000 or more | 0 (0.0%) | 0 (0.0%) |
| Total | 394 (100.0%) | 406 (100.0%) |
Household Income by Mortgage Status in Turtle Creek borough
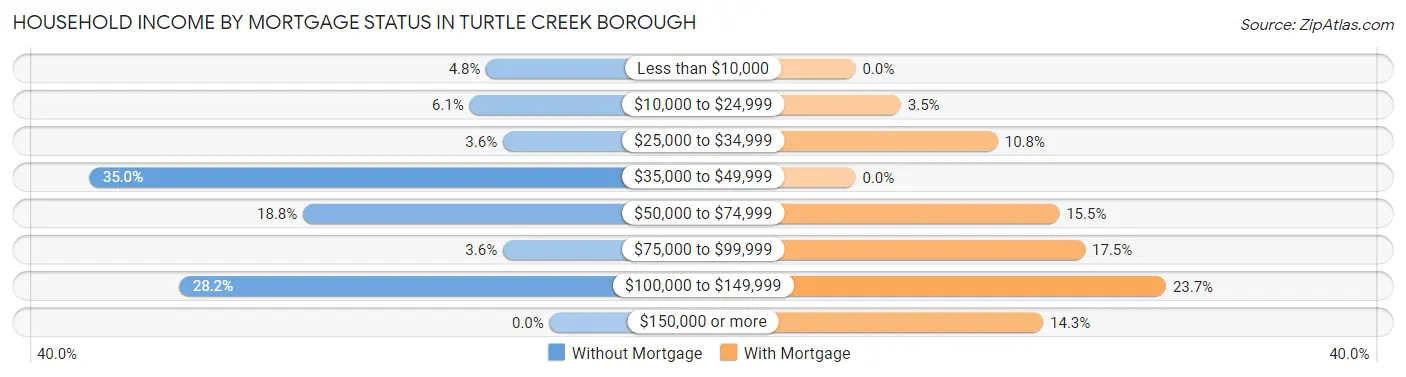
| Household Income | Without Mortgage | With Mortgage |
| Less than $10,000 | 19 (4.8%) | 0 (0.0%) |
| $10,000 to $24,999 | 24 (6.1%) | 14 (3.5%) |
| $25,000 to $34,999 | 14 (3.5%) | 44 (10.8%) |
| $35,000 to $49,999 | 138 (35.0%) | 0 (0.0%) |
| $50,000 to $74,999 | 74 (18.8%) | 63 (15.5%) |
| $75,000 to $99,999 | 14 (3.5%) | 71 (17.5%) |
| $100,000 to $149,999 | 111 (28.2%) | 96 (23.6%) |
| $150,000 or more | 0 (0.0%) | 58 (14.3%) |
| Total | 394 (100.0%) | 406 (100.0%) |
Property Value to Household Income Ratio in Turtle Creek borough
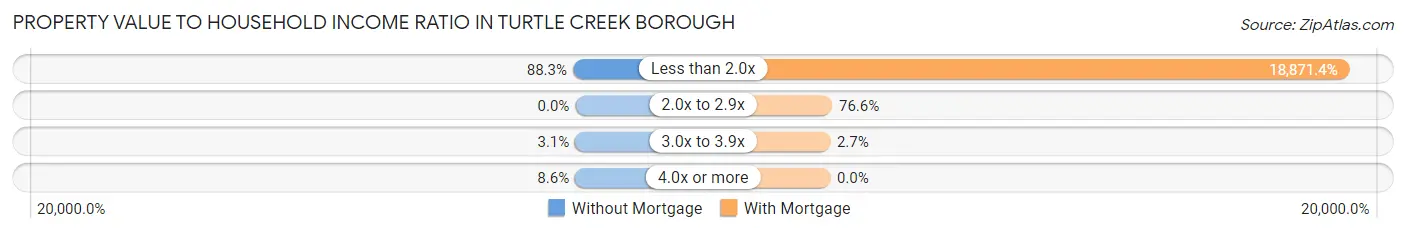
| Value-to-Income Ratio | Without Mortgage | With Mortgage |
| Less than 2.0x | 348 (88.3%) | 76,618 (18,871.4%) |
| 2.0x to 2.9x | 0 (0.0%) | 311 (76.6%) |
| 3.0x to 3.9x | 12 (3.0%) | 11 (2.7%) |
| 4.0x or more | 34 (8.6%) | 0 (0.0%) |
| Total | 394 (100.0%) | 406 (100.0%) |
Real Estate Taxes by Mortgage Status in Turtle Creek borough
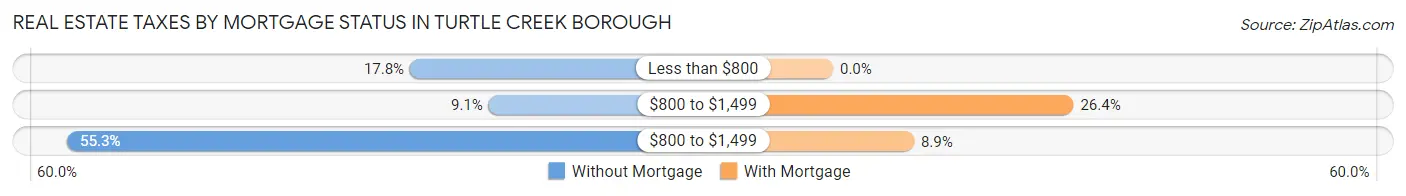
| Property Taxes | Without Mortgage | With Mortgage |
| Less than $800 | 70 (17.8%) | 0 (0.0%) |
| $800 to $1,499 | 36 (9.1%) | 107 (26.4%) |
| $800 to $1,499 | 218 (55.3%) | 36 (8.9%) |
| Total | 394 (100.0%) | 406 (100.0%) |
Health & Disability in Turtle Creek borough
Health Insurance Coverage by Age in Turtle Creek borough
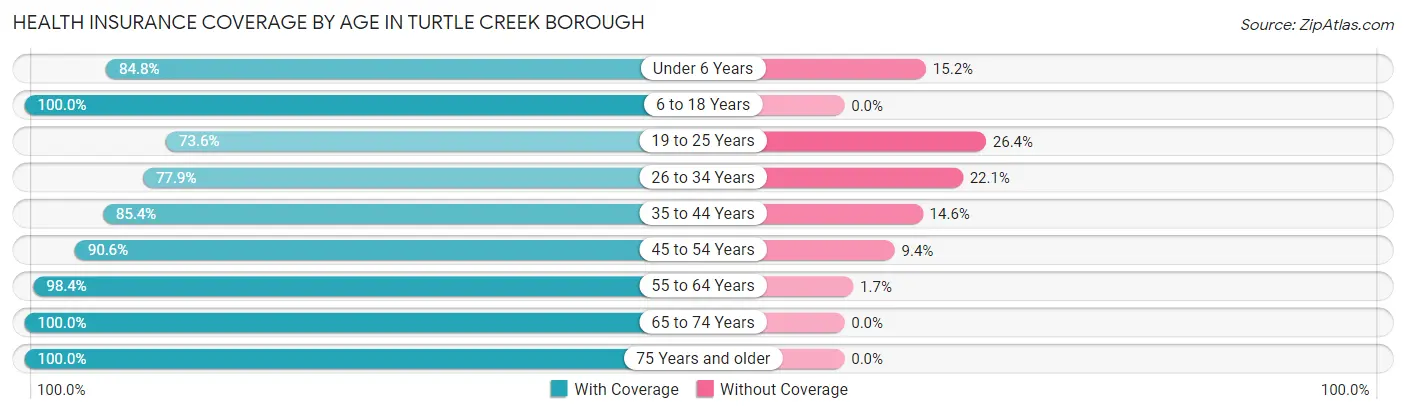
| Age Bracket | With Coverage | Without Coverage |
| Under 6 Years | 234 (84.8%) | 42 (15.2%) |
| 6 to 18 Years | 766 (100.0%) | 0 (0.0%) |
| 19 to 25 Years | 368 (73.6%) | 132 (26.4%) |
| 26 to 34 Years | 374 (77.9%) | 106 (22.1%) |
| 35 to 44 Years | 450 (85.4%) | 77 (14.6%) |
| 45 to 54 Years | 512 (90.6%) | 53 (9.4%) |
| 55 to 64 Years | 657 (98.4%) | 11 (1.7%) |
| 65 to 74 Years | 883 (100.0%) | 0 (0.0%) |
| 75 Years and older | 314 (100.0%) | 0 (0.0%) |
| Total | 4,558 (91.5%) | 421 (8.5%) |
Health Insurance Coverage by Citizenship Status in Turtle Creek borough
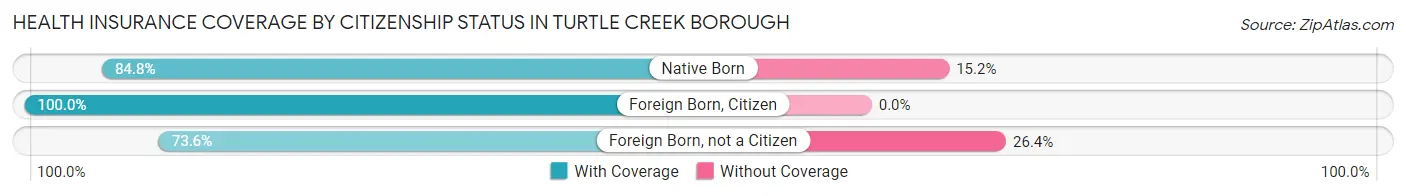
| Citizenship Status | With Coverage | Without Coverage |
| Native Born | 234 (84.8%) | 42 (15.2%) |
| Foreign Born, Citizen | 766 (100.0%) | 0 (0.0%) |
| Foreign Born, not a Citizen | 368 (73.6%) | 132 (26.4%) |
Health Insurance Coverage by Household Income in Turtle Creek borough
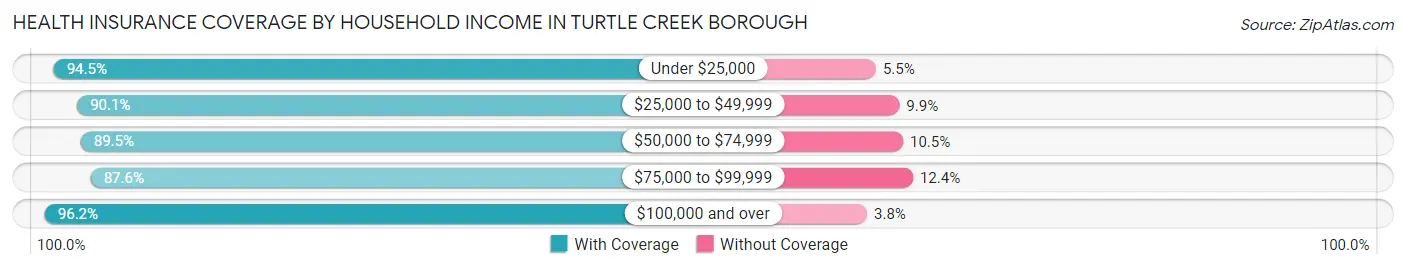
| Household Income | With Coverage | Without Coverage |
| Under $25,000 | 1,071 (94.5%) | 62 (5.5%) |
| $25,000 to $49,999 | 1,518 (90.1%) | 166 (9.9%) |
| $50,000 to $74,999 | 781 (89.5%) | 92 (10.5%) |
| $75,000 to $99,999 | 530 (87.6%) | 75 (12.4%) |
| $100,000 and over | 658 (96.2%) | 26 (3.8%) |
Public vs Private Health Insurance Coverage by Age in Turtle Creek borough
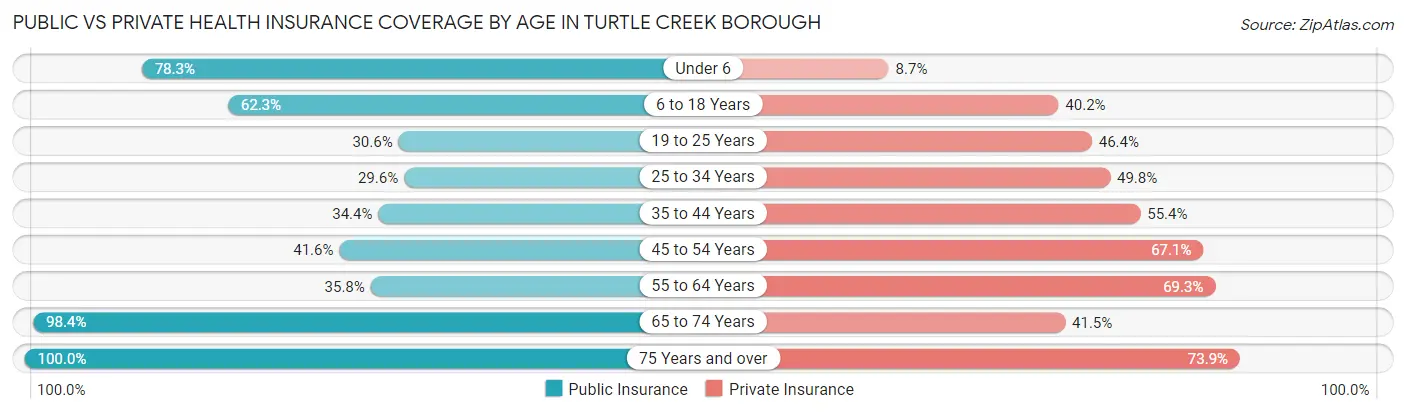
| Age Bracket | Public Insurance | Private Insurance |
| Under 6 | 216 (78.3%) | 24 (8.7%) |
| 6 to 18 Years | 477 (62.3%) | 308 (40.2%) |
| 19 to 25 Years | 153 (30.6%) | 232 (46.4%) |
| 25 to 34 Years | 142 (29.6%) | 239 (49.8%) |
| 35 to 44 Years | 181 (34.4%) | 292 (55.4%) |
| 45 to 54 Years | 235 (41.6%) | 379 (67.1%) |
| 55 to 64 Years | 239 (35.8%) | 463 (69.3%) |
| 65 to 74 Years | 869 (98.4%) | 366 (41.4%) |
| 75 Years and over | 314 (100.0%) | 232 (73.9%) |
| Total | 2,826 (56.8%) | 2,535 (50.9%) |
Disability Status by Sex by Age in Turtle Creek borough
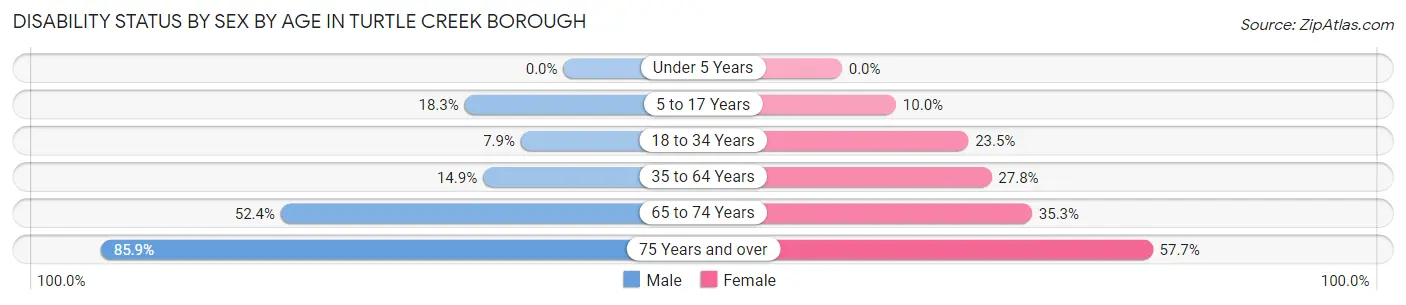
| Age Bracket | Male | Female |
| Under 5 Years | 0 (0.0%) | 0 (0.0%) |
| 5 to 17 Years | 53 (18.3%) | 48 (10.0%) |
| 18 to 34 Years | 35 (7.9%) | 137 (23.5%) |
| 35 to 64 Years | 117 (14.9%) | 271 (27.8%) |
| 65 to 74 Years | 301 (52.4%) | 109 (35.3%) |
| 75 Years and over | 91 (85.9%) | 120 (57.7%) |
Disability Class by Sex by Age in Turtle Creek borough
Disability Class: Hearing Difficulty
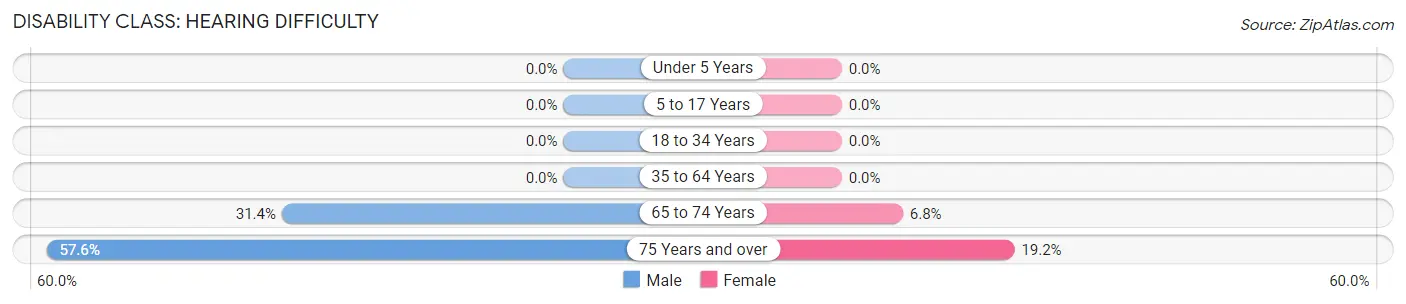
| Age Bracket | Male | Female |
| Under 5 Years | 0 (0.0%) | 0 (0.0%) |
| 5 to 17 Years | 0 (0.0%) | 0 (0.0%) |
| 18 to 34 Years | 0 (0.0%) | 0 (0.0%) |
| 35 to 64 Years | 0 (0.0%) | 0 (0.0%) |
| 65 to 74 Years | 180 (31.4%) | 21 (6.8%) |
| 75 Years and over | 61 (57.6%) | 40 (19.2%) |
Disability Class: Vision Difficulty
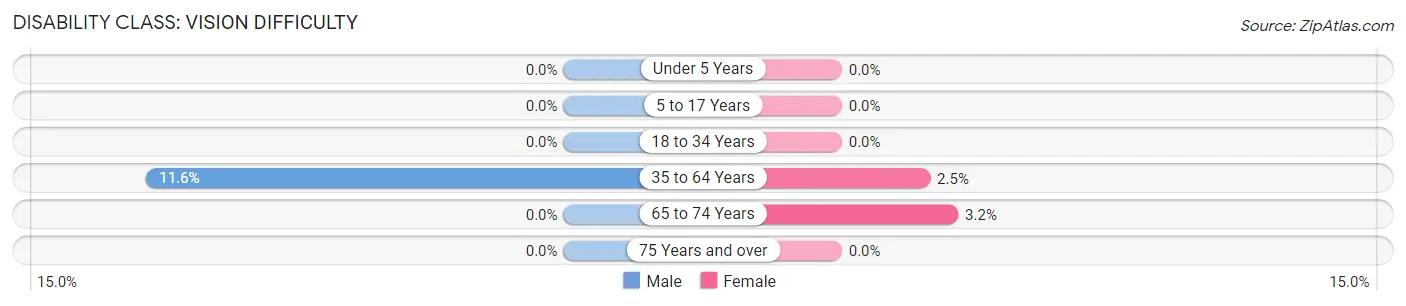
| Age Bracket | Male | Female |
| Under 5 Years | 0 (0.0%) | 0 (0.0%) |
| 5 to 17 Years | 0 (0.0%) | 0 (0.0%) |
| 18 to 34 Years | 0 (0.0%) | 0 (0.0%) |
| 35 to 64 Years | 91 (11.6%) | 24 (2.5%) |
| 65 to 74 Years | 0 (0.0%) | 10 (3.2%) |
| 75 Years and over | 0 (0.0%) | 0 (0.0%) |
Disability Class: Cognitive Difficulty
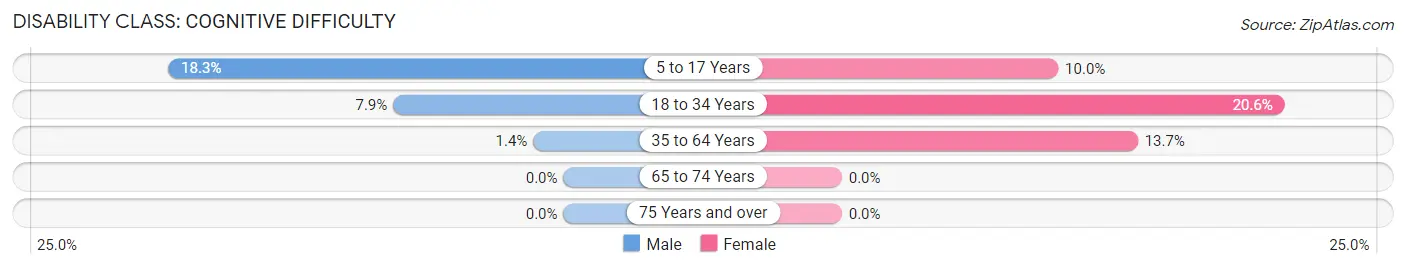
| Age Bracket | Male | Female |
| 5 to 17 Years | 53 (18.3%) | 48 (10.0%) |
| 18 to 34 Years | 35 (7.9%) | 120 (20.5%) |
| 35 to 64 Years | 11 (1.4%) | 134 (13.7%) |
| 65 to 74 Years | 0 (0.0%) | 0 (0.0%) |
| 75 Years and over | 0 (0.0%) | 0 (0.0%) |
Disability Class: Ambulatory Difficulty
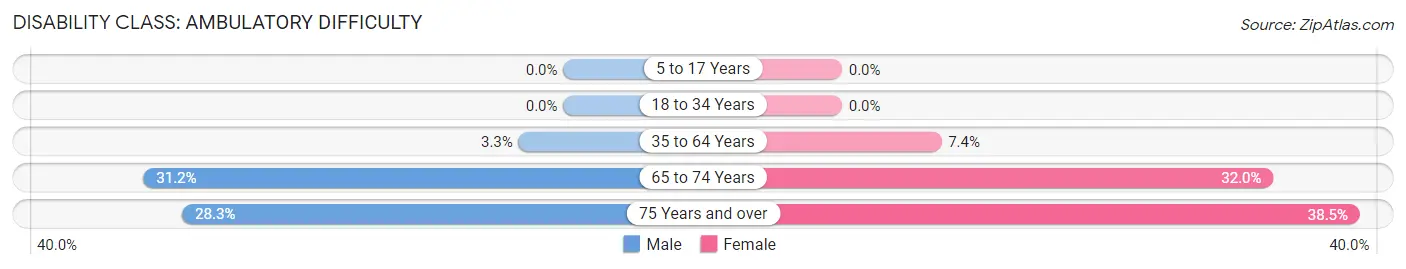
| Age Bracket | Male | Female |
| 5 to 17 Years | 0 (0.0%) | 0 (0.0%) |
| 18 to 34 Years | 0 (0.0%) | 0 (0.0%) |
| 35 to 64 Years | 26 (3.3%) | 72 (7.4%) |
| 65 to 74 Years | 179 (31.2%) | 99 (32.0%) |
| 75 Years and over | 30 (28.3%) | 80 (38.5%) |
Disability Class: Self-Care Difficulty
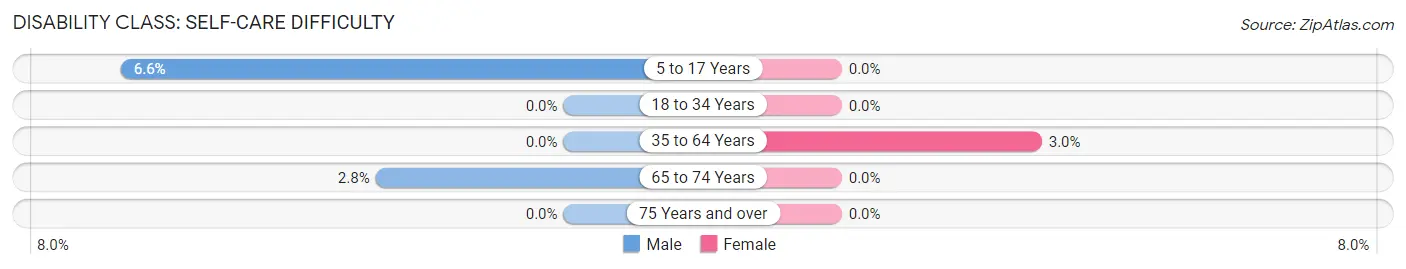
| Age Bracket | Male | Female |
| 5 to 17 Years | 19 (6.6%) | 0 (0.0%) |
| 18 to 34 Years | 0 (0.0%) | 0 (0.0%) |
| 35 to 64 Years | 0 (0.0%) | 29 (3.0%) |
| 65 to 74 Years | 16 (2.8%) | 0 (0.0%) |
| 75 Years and over | 0 (0.0%) | 0 (0.0%) |
Technology Access in Turtle Creek borough
Computing Device Access in Turtle Creek borough
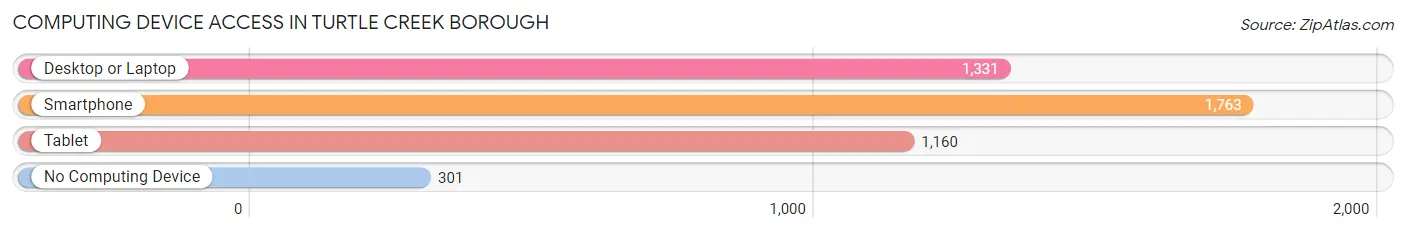
| Device Type | # Households | % Households |
| Desktop or Laptop | 1,331 | 61.2% |
| Smartphone | 1,763 | 81.1% |
| Tablet | 1,160 | 53.4% |
| No Computing Device | 301 | 13.9% |
| Total | 2,174 | 100.0% |
Internet Access in Turtle Creek borough
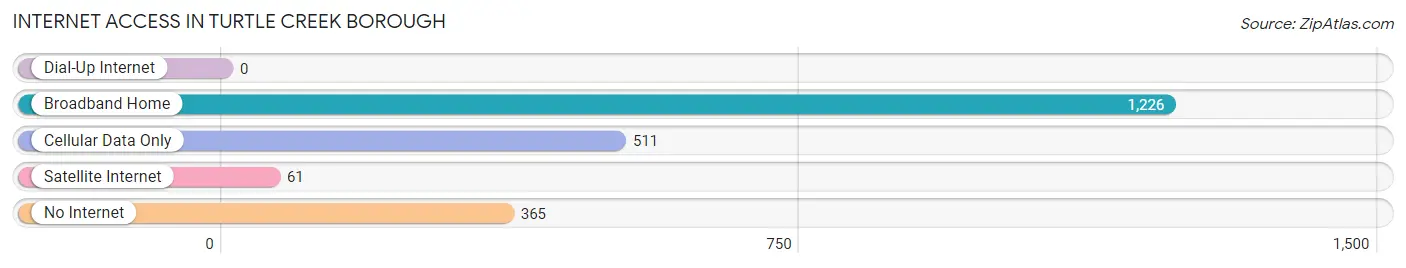
| Internet Type | # Households | % Households |
| Dial-Up Internet | 0 | 0.0% |
| Broadband Home | 1,226 | 56.4% |
| Cellular Data Only | 511 | 23.5% |
| Satellite Internet | 61 | 2.8% |
| No Internet | 365 | 16.8% |
| Total | 2,174 | 100.0% |
Turtle Creek borough Summary
Turtle Creek Borough is a small borough located in Allegheny County, Pennsylvania. It is situated approximately 10 miles east of Pittsburgh and is part of the Pittsburgh Metropolitan Statistical Area. The borough was incorporated in 1894 and has a population of approximately 8,000 people.
History
Turtle Creek Borough was originally part of Wilkins Township, which was established in 1788. The area was first settled in the late 1700s by German and Scotch-Irish immigrants. The area was known as Turtle Creek Valley, and the creek was named for the abundance of turtles that lived in the area. The first post office was established in 1845, and the first school was built in 1848.
In 1894, the area was incorporated as Turtle Creek Borough. The borough was named after the creek that ran through the area. The first mayor of the borough was John W. Miller, who served from 1894 to 1896.
Geography
Turtle Creek Borough is located in Allegheny County, Pennsylvania. It is situated approximately 10 miles east of Pittsburgh and is part of the Pittsburgh Metropolitan Statistical Area. The borough is bordered by Wilkins Township to the north, Monroeville to the east, Penn Hills to the south, and Wilkinsburg to the west.
The borough has a total area of 1.2 square miles, all of which is land. The borough is located in the Allegheny Plateau region of Pennsylvania and is part of the Allegheny River watershed. The borough is located at an elevation of 1,000 feet above sea level.
Economy
Turtle Creek Borough has a diverse economy. The borough is home to a variety of businesses, including manufacturing, retail, and service industries. The borough is also home to several large employers, including UPMC, Highmark, and the University of Pittsburgh Medical Center.
The borough is also home to several small businesses, including restaurants, shops, and other services. The borough is also home to several parks and recreational facilities, including Turtle Creek Park, which is a popular destination for outdoor activities.
Demographics
As of the 2010 census, the population of Turtle Creek Borough was 8,068. The racial makeup of the borough was 87.3% White, 8.2% African American, 0.3% Native American, 1.2% Asian, 0.1% Pacific Islander, 0.7% from other races, and 2.4% from two or more races. Hispanic or Latino of any race were 2.2% of the population.
The median household income in the borough was $41,945, and the median family income was $50,945. The per capita income for the borough was $20,945. About 8.2% of families and 10.2% of the population were below the poverty line, including 14.2% of those under age 18 and 6.2% of those age 65 or over.
Turtle Creek Borough is a small borough with a diverse population and economy. The borough is home to a variety of businesses, including manufacturing, retail, and service industries. The borough is also home to several parks and recreational facilities, making it a popular destination for outdoor activities.
Common Questions
What is the Total Population of Turtle Creek borough?
Total Population of Turtle Creek borough is 5,087.
What is the Total Male Population of Turtle Creek borough?
Total Male Population of Turtle Creek borough is 2,326.
What is the Total Female Population of Turtle Creek borough?
Total Female Population of Turtle Creek borough is 2,761.
What is the Ratio of Males per 100 Females in Turtle Creek borough?
There are 84.24 Males per 100 Females in Turtle Creek borough.
What is the Ratio of Females per 100 Males in Turtle Creek borough?
There are 118.70 Females per 100 Males in Turtle Creek borough.
What is the Median Population Age in Turtle Creek borough?
Median Population Age in Turtle Creek borough is 43.0 Years.
What is the Average Family Size in Turtle Creek borough
Average Family Size in Turtle Creek borough is 2.8 People.
What is the Average Household Size in Turtle Creek borough
Average Household Size in Turtle Creek borough is 2.3 People.
What is Per Capita Income in Turtle Creek borough?
Per Capita income in Turtle Creek borough is $23,199.
What is the Median Family Income in Turtle Creek borough?
Median Family Income in Turtle Creek borough is $46,759.
What is the Median Household income in Turtle Creek borough?
Median Household Income in Turtle Creek borough is $42,344.
What is Income or Wage Gap in Turtle Creek borough?
Income or Wage Gap in Turtle Creek borough is 25.2%.
Women in Turtle Creek borough earn 74.8 cents for every dollar earned by a man.
What is Inequality or Gini Index in Turtle Creek borough?
Inequality or Gini Index in Turtle Creek borough is 0.41.
How Large is the Labor Force in Turtle Creek borough?
There are 2,392 People in the Labor Forcein in Turtle Creek borough.
What is the Percentage of People in the Labor Force in Turtle Creek borough?
56.1% of People are in the Labor Force in Turtle Creek borough.
What is the Unemployment Rate in Turtle Creek borough?
Unemployment Rate in Turtle Creek borough is 14.5%.