Donora borough, PA
Donora borough Overview
4,561
TOTAL POPULATION
2,220
MALE POPULATION
2,341
FEMALE POPULATION
94.83
MALES / 100 FEMALES
105.45
FEMALES / 100 MALES
46.8
MEDIAN AGE
2.6
AVG FAMILY SIZE
2.0
AVG HOUSEHOLD SIZE
$24,209
PER CAPITA INCOME
$63,203
AVG FAMILY INCOME
$42,651
AVG HOUSEHOLD INCOME
27.2%
WAGE / INCOME GAP [ % ]
72.8¢/ $1
WAGE / INCOME GAP [ $ ]
0.46
INEQUALITY / GINI INDEX
2,199
LABOR FORCE [ PEOPLE ]
60.5%
PERCENT IN LABOR FORCE
12.7%
UNEMPLOYMENT RATE
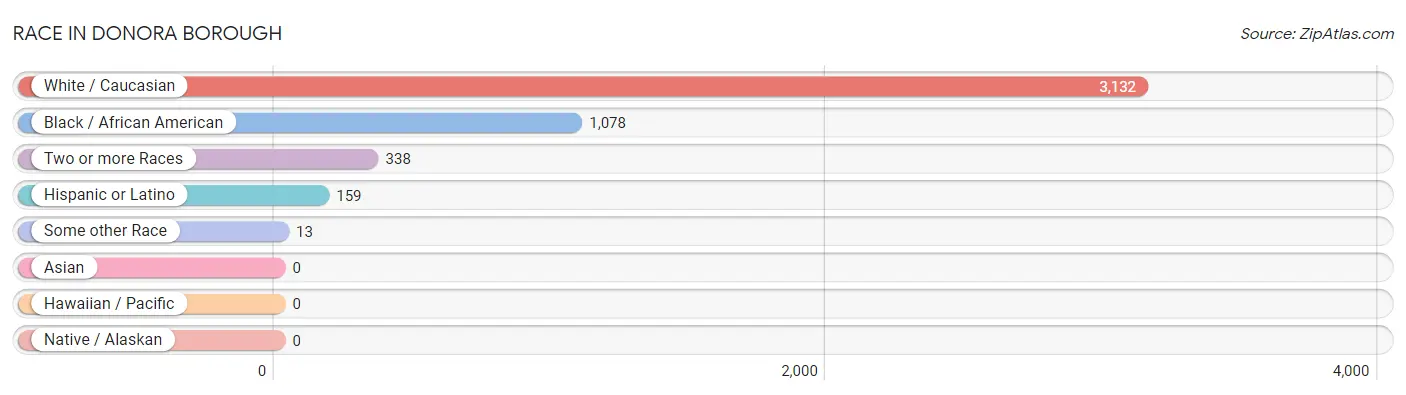
Race in Donora borough
The most populous races in Donora borough are White / Caucasian (3,132 | 68.7%), Black / African American (1,078 | 23.6%), and Two or more Races (338 | 7.4%).
| Race | # Population | % Population |
| Asian | 0 | 0.0% |
| Black / African American | 1,078 | 23.6% |
| Hawaiian / Pacific | 0 | 0.0% |
| Hispanic or Latino | 159 | 3.5% |
| Native / Alaskan | 0 | 0.0% |
| White / Caucasian | 3,132 | 68.7% |
| Two or more Races | 338 | 7.4% |
| Some other Race | 13 | 0.3% |
| Total | 4,561 | 100.0% |
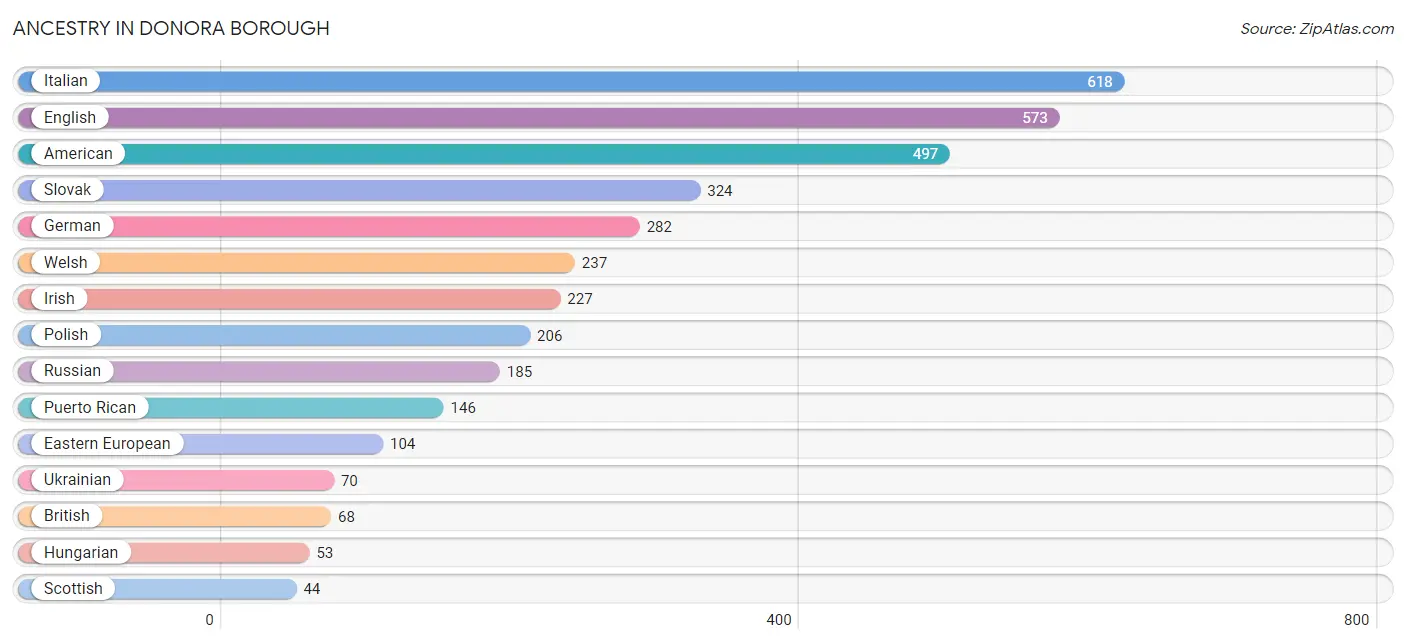
Ancestry in Donora borough
The most populous ancestries reported in Donora borough are Italian (618 | 13.6%), English (573 | 12.6%), American (497 | 10.9%), Slovak (324 | 7.1%), and German (282 | 6.2%), together accounting for 50.3% of all Donora borough residents.
| Ancestry | # Population | % Population |
| African | 39 | 0.9% |
| American | 497 | 10.9% |
| Arab | 15 | 0.3% |
| Austrian | 12 | 0.3% |
| Belgian | 11 | 0.2% |
| British | 68 | 1.5% |
| Cherokee | 16 | 0.4% |
| Croatian | 33 | 0.7% |
| Cuban | 12 | 0.3% |
| Czechoslovakian | 10 | 0.2% |
| Dutch | 11 | 0.2% |
| Eastern European | 104 | 2.3% |
| English | 573 | 12.6% |
| European | 10 | 0.2% |
| Finnish | 11 | 0.2% |
| French | 10 | 0.2% |
| German | 282 | 6.2% |
| Greek | 40 | 0.9% |
| Hungarian | 53 | 1.2% |
| Irish | 227 | 5.0% |
| Italian | 618 | 13.6% |
| Lithuanian | 11 | 0.2% |
| Mexican | 1 | 0.0% |
| Polish | 206 | 4.5% |
| Puerto Rican | 146 | 3.2% |
| Russian | 185 | 4.1% |
| Scotch-Irish | 24 | 0.5% |
| Scottish | 44 | 1.0% |
| Slovak | 324 | 7.1% |
| Slovene | 10 | 0.2% |
| Subsaharan African | 39 | 0.9% |
| Swedish | 23 | 0.5% |
| Swiss | 11 | 0.2% |
| Syrian | 15 | 0.3% |
| Ukrainian | 70 | 1.5% |
| Welsh | 237 | 5.2% | View All 36 Rows |
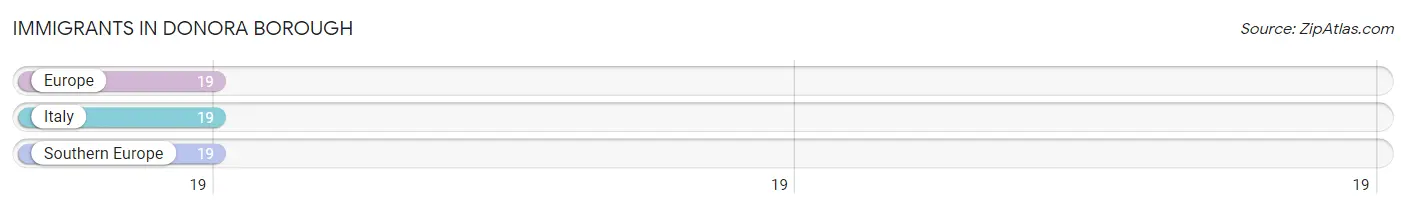
Immigrants in Donora borough
The most numerous immigrant groups reported in Donora borough came from Europe (19 | 0.4%), Italy (19 | 0.4%), and Southern Europe (19 | 0.4%), together accounting for 1.3% of all Donora borough residents.
| Immigration Origin | # Population | % Population |
| Europe | 19 | 0.4% |
| Italy | 19 | 0.4% |
| Southern Europe | 19 | 0.4% | View All 3 Rows |
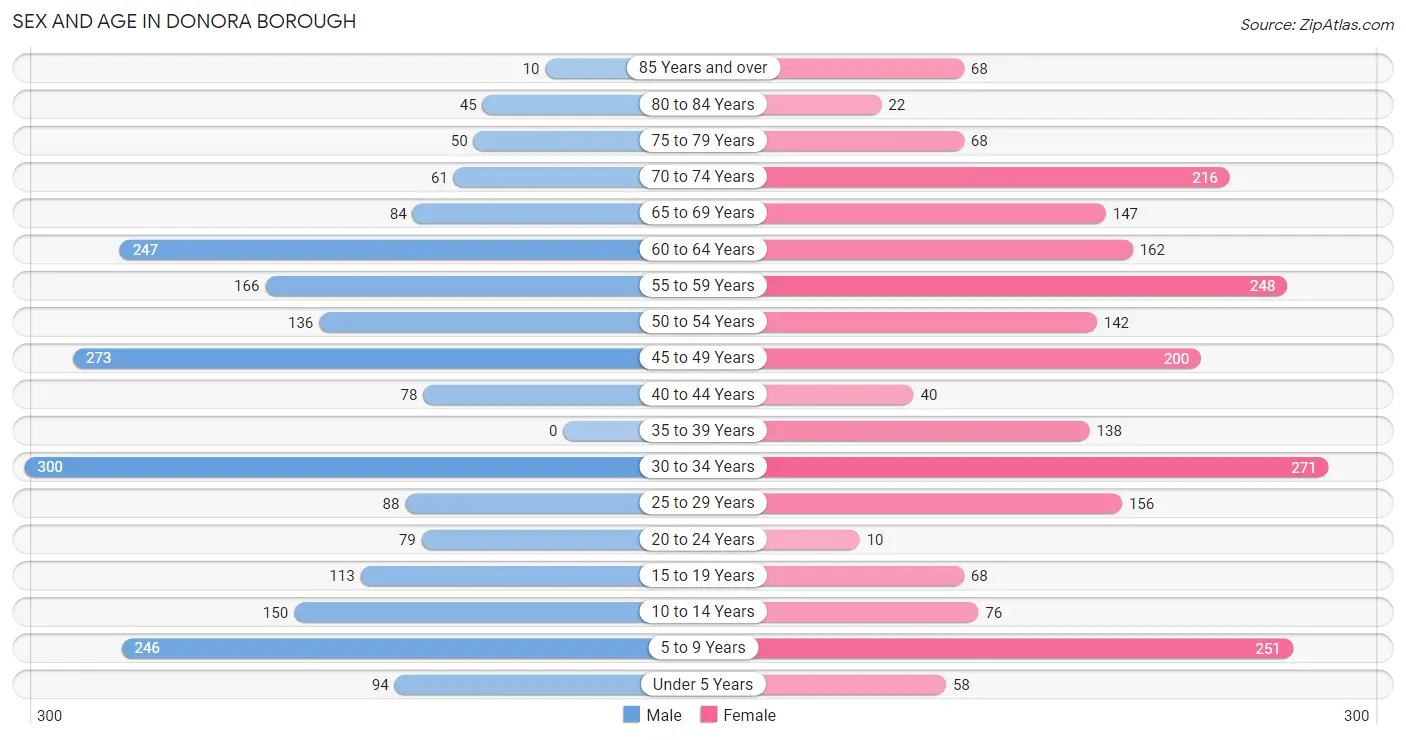
Sex and Age in Donora borough
Sex and Age in Donora borough
The most populous age groups in Donora borough are 30 to 34 Years (300 | 13.5%) for men and 30 to 34 Years (271 | 11.6%) for women.
| Age Bracket | Male | Female |
| Under 5 Years | 94 (4.2%) | 58 (2.5%) |
| 5 to 9 Years | 246 (11.1%) | 251 (10.7%) |
| 10 to 14 Years | 150 (6.8%) | 76 (3.3%) |
| 15 to 19 Years | 113 (5.1%) | 68 (2.9%) |
| 20 to 24 Years | 79 (3.6%) | 10 (0.4%) |
| 25 to 29 Years | 88 (4.0%) | 156 (6.7%) |
| 30 to 34 Years | 300 (13.5%) | 271 (11.6%) |
| 35 to 39 Years | 0 (0.0%) | 138 (5.9%) |
| 40 to 44 Years | 78 (3.5%) | 40 (1.7%) |
| 45 to 49 Years | 273 (12.3%) | 200 (8.5%) |
| 50 to 54 Years | 136 (6.1%) | 142 (6.1%) |
| 55 to 59 Years | 166 (7.5%) | 248 (10.6%) |
| 60 to 64 Years | 247 (11.1%) | 162 (6.9%) |
| 65 to 69 Years | 84 (3.8%) | 147 (6.3%) |
| 70 to 74 Years | 61 (2.8%) | 216 (9.2%) |
| 75 to 79 Years | 50 (2.2%) | 68 (2.9%) |
| 80 to 84 Years | 45 (2.0%) | 22 (0.9%) |
| 85 Years and over | 10 (0.4%) | 68 (2.9%) |
| Total | 2,220 (100.0%) | 2,341 (100.0%) |
Families and Households in Donora borough
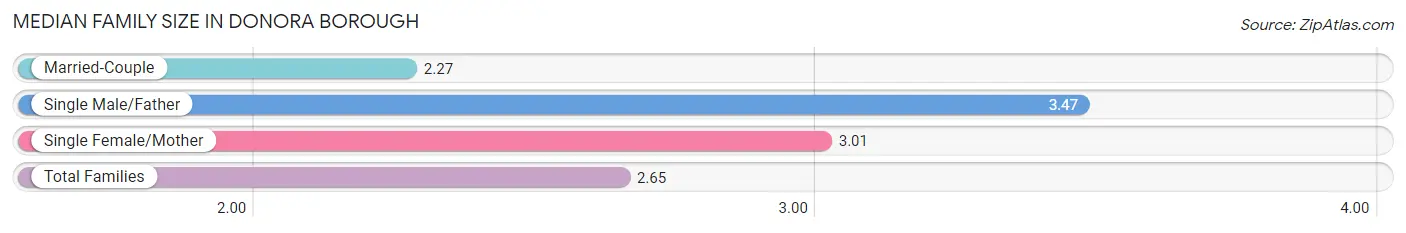
Median Family Size in Donora borough
The median family size in Donora borough is 2.65 persons per family, with single male/father families (112 | 9.3%) accounting for the largest median family size of 3.47 persons per family. On the other hand, married-couple families (655 | 54.5%) represent the smallest median family size with 2.27 persons per family.
| Family Type | # Families | Family Size |
| Married-Couple | 655 (54.5%) | 2.27 |
| Single Male/Father | 112 (9.3%) | 3.47 |
| Single Female/Mother | 434 (36.1%) | 3.01 |
| Total Families | 1,201 (100.0%) | 2.65 |
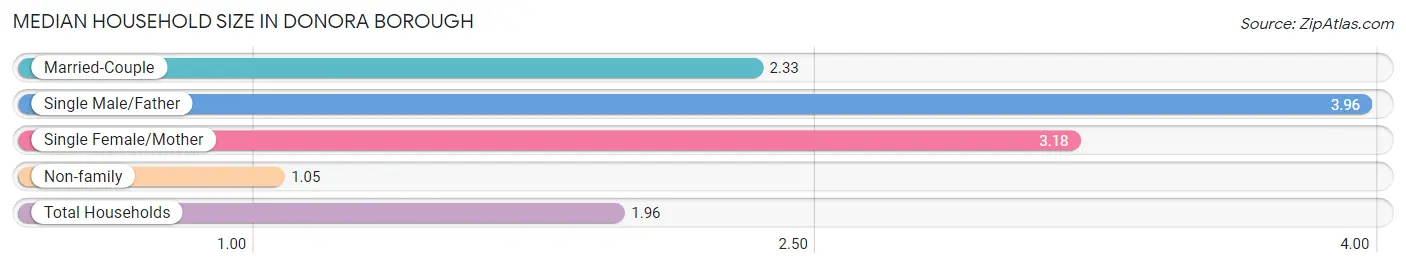
Median Household Size in Donora borough
The median household size in Donora borough is 1.96 persons per household, with single male/father households (112 | 4.9%) accounting for the largest median household size of 3.96 persons per household. non-family households (1,078 | 47.3%) represent the smallest median household size with 1.05 persons per household.
| Household Type | # Households | Household Size |
| Married-Couple | 655 (28.7%) | 2.33 |
| Single Male/Father | 112 (4.9%) | 3.96 |
| Single Female/Mother | 434 (19.0%) | 3.18 |
| Non-family | 1,078 (47.3%) | 1.05 |
| Total Households | 2,279 (100.0%) | 1.96 |
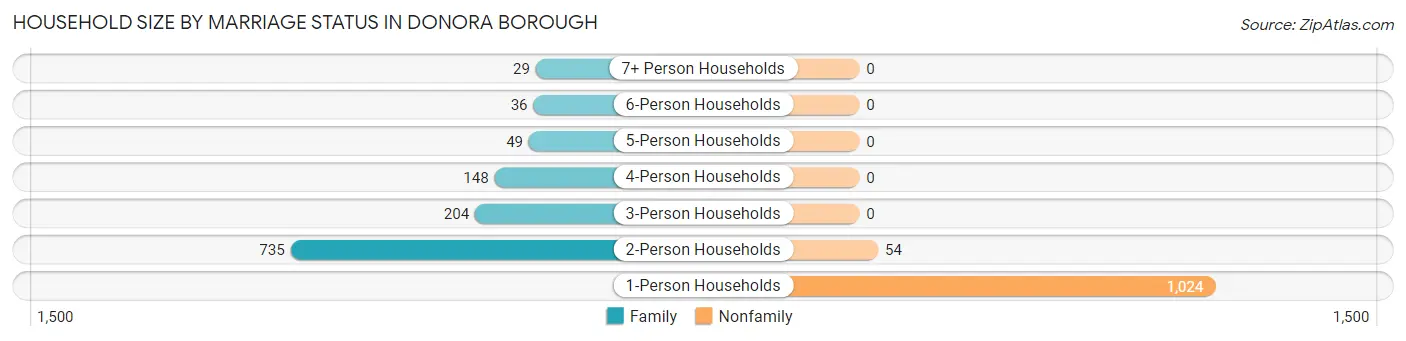
Household Size by Marriage Status in Donora borough
Out of a total of 2,279 households in Donora borough, 1,201 (52.7%) are family households, while 1,078 (47.3%) are nonfamily households. The most numerous type of family households are 2-person households, comprising 735, and the most common type of nonfamily households are 1-person households, comprising 1,024.
| Household Size | Family Households | Nonfamily Households |
| 1-Person Households | - | 1,024 (44.9%) |
| 2-Person Households | 735 (32.3%) | 54 (2.4%) |
| 3-Person Households | 204 (8.9%) | 0 (0.0%) |
| 4-Person Households | 148 (6.5%) | 0 (0.0%) |
| 5-Person Households | 49 (2.1%) | 0 (0.0%) |
| 6-Person Households | 36 (1.6%) | 0 (0.0%) |
| 7+ Person Households | 29 (1.3%) | 0 (0.0%) |
| Total | 1,201 (52.7%) | 1,078 (47.3%) |
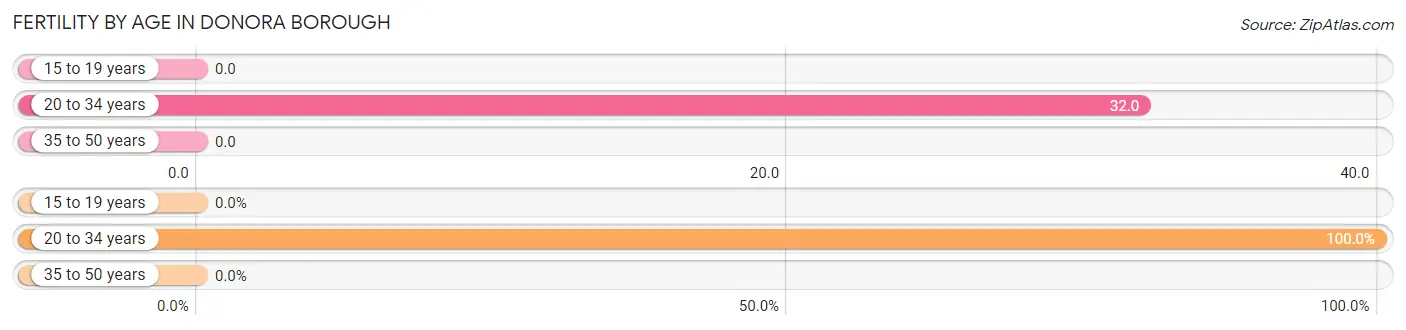
Female Fertility in Donora borough
Fertility by Age in Donora borough
Average fertility rate in Donora borough is 16.0 births per 1,000 women. Women in the age bracket of 20 to 34 years have the highest fertility rate with 32.0 births per 1,000 women. Women in the age bracket of 20 to 34 years acount for 100.0% of all women with births.
| Age Bracket | Women with Births | Births / 1,000 Women |
| 15 to 19 years | 0 (0.0%) | 0.0 |
| 20 to 34 years | 14 (100.0%) | 32.0 |
| 35 to 50 years | 0 (0.0%) | 0.0 |
| Total | 14 (100.0%) | 16.0 |
Fertility by Age by Marriage Status in Donora borough
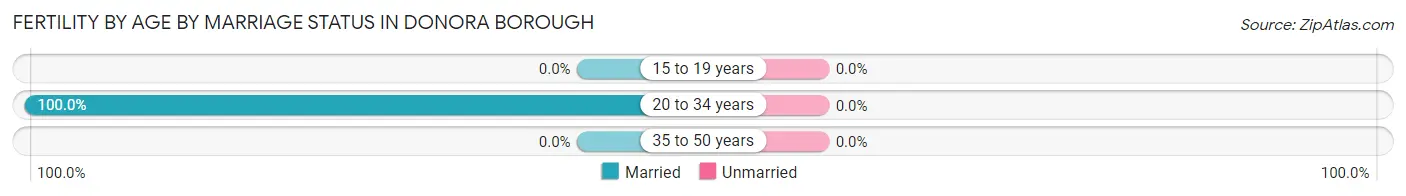
| Age Bracket | Married | Unmarried |
| 15 to 19 years | 0 (0.0%) | 0 (0.0%) |
| 20 to 34 years | 14 (100.0%) | 0 (0.0%) |
| 35 to 50 years | 0 (0.0%) | 0 (0.0%) |
| Total | 14 (100.0%) | 0 (0.0%) |
Fertility by Education in Donora borough
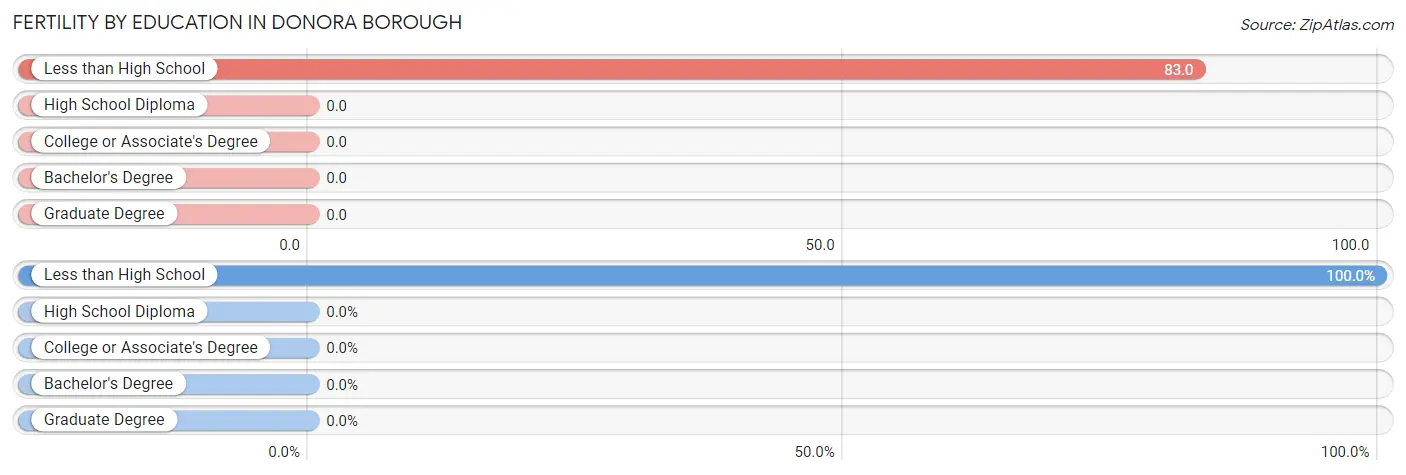
| Educational Attainment | Women with Births | Births / 1,000 Women |
| Less than High School | 14 (100.0%) | 83.0 |
| High School Diploma | 0 (0.0%) | 0.0 |
| College or Associate's Degree | 0 (0.0%) | 0.0 |
| Bachelor's Degree | 0 (0.0%) | 0.0 |
| Graduate Degree | 0 (0.0%) | 0.0 |
| Total | 14 (100.0%) | 16.0 |
Fertility by Education by Marriage Status in Donora borough
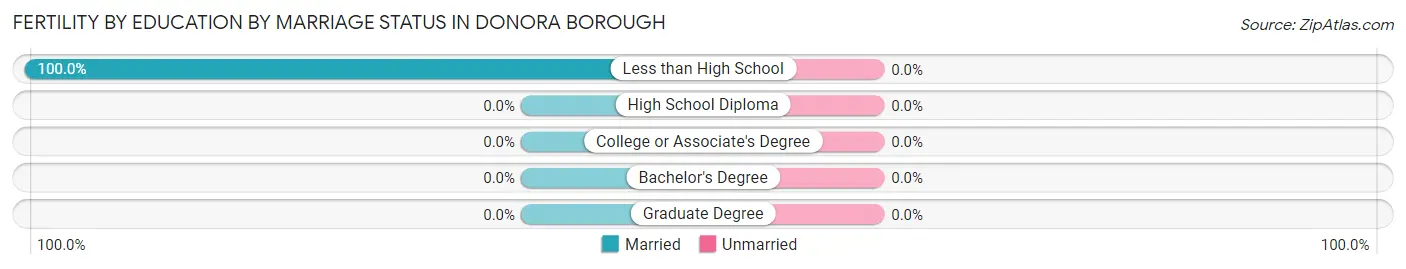
| Educational Attainment | Married | Unmarried |
| Less than High School | 14 (100.0%) | 0 (0.0%) |
| High School Diploma | 0 (0.0%) | 0 (0.0%) |
| College or Associate's Degree | 0 (0.0%) | 0 (0.0%) |
| Bachelor's Degree | 0 (0.0%) | 0 (0.0%) |
| Graduate Degree | 0 (0.0%) | 0 (0.0%) |
| Total | 14 (100.0%) | 0 (0.0%) |
Income in Donora borough
Income Overview in Donora borough
Per Capita Income in Donora borough is $24,209, while median incomes of families and households are $63,203 and $42,651 respectively.
| Characteristic | Number | Measure |
| Per Capita Income | 4,561 | $24,209 |
| Median Family Income | 1,201 | $63,203 |
| Mean Family Income | 1,201 | $60,201 |
| Median Household Income | 2,279 | $42,651 |
| Mean Household Income | 2,279 | $47,817 |
| Income Deficit | 1,201 | $0 |
| Wage / Income Gap (%) | 4,561 | 27.19% |
| Wage / Income Gap ($) | 4,561 | 72.81¢ per $1 |
| Gini / Inequality Index | 4,561 | 0.46 |
Earnings by Sex in Donora borough
Average Earnings in Donora borough are $32,817, $37,607 for men and $27,381 for women, a difference of 27.2%.
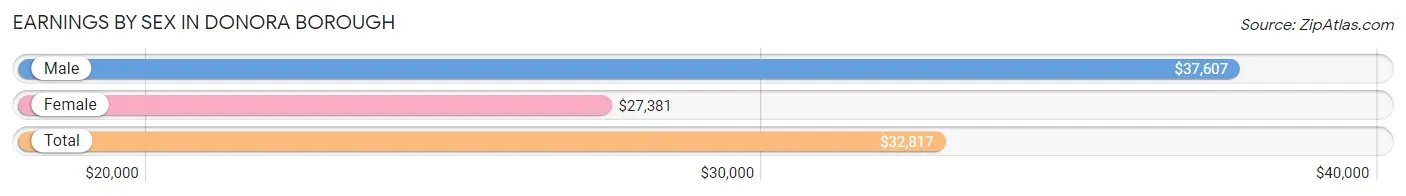
| Sex | Number | Average Earnings |
| Male | 1,137 (54.0%) | $37,607 |
| Female | 970 (46.0%) | $27,381 |
| Total | 2,107 (100.0%) | $32,817 |
Earnings by Sex by Income Bracket in Donora borough
The most common earnings brackets in Donora borough are $30,000 to $34,999 for men (194 | 17.1%) and $25,000 to $29,999 for women (141 | 14.5%).
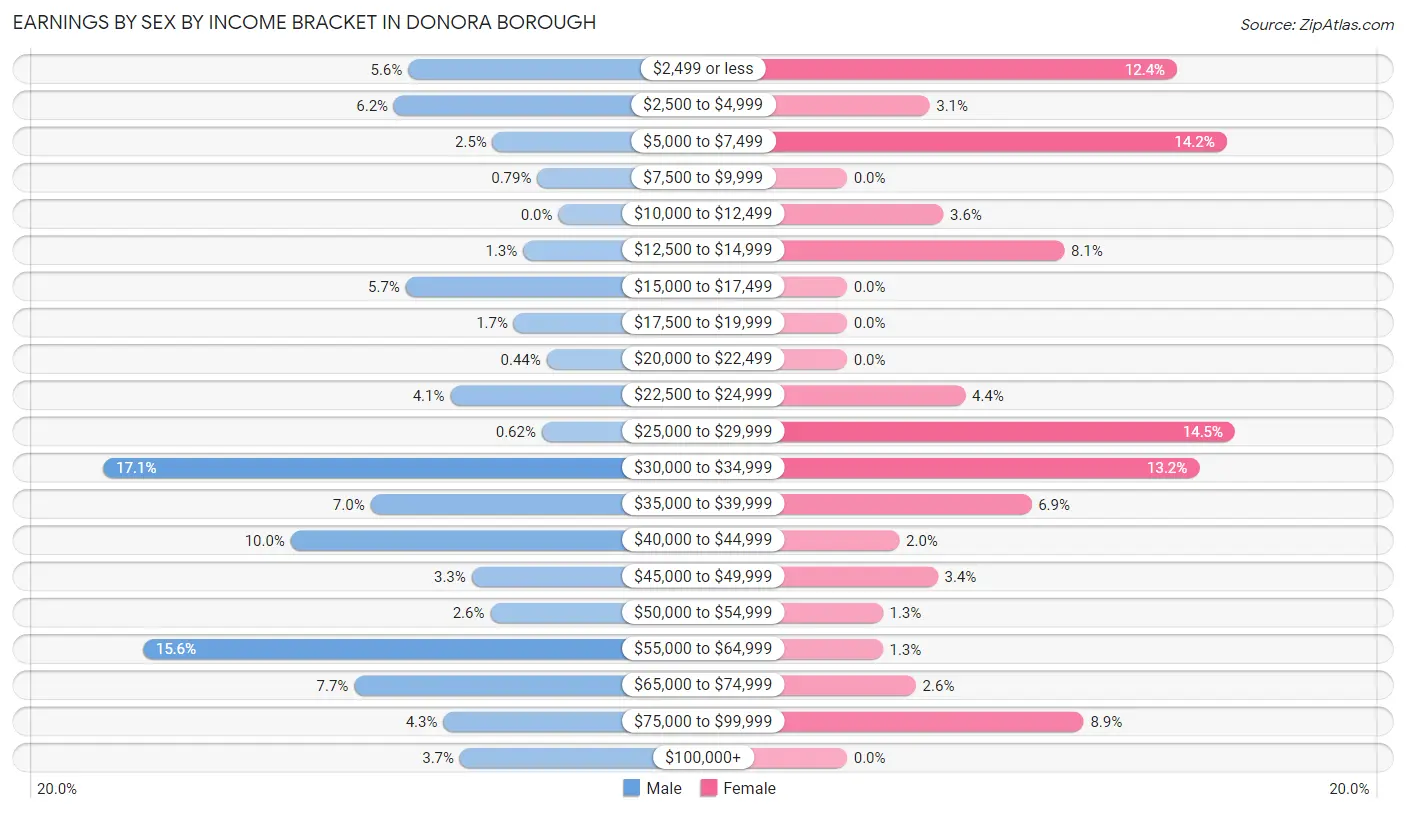
| Income | Male | Female |
| $2,499 or less | 64 (5.6%) | 120 (12.4%) |
| $2,500 to $4,999 | 70 (6.2%) | 30 (3.1%) |
| $5,000 to $7,499 | 28 (2.5%) | 138 (14.2%) |
| $7,500 to $9,999 | 9 (0.8%) | 0 (0.0%) |
| $10,000 to $12,499 | 0 (0.0%) | 35 (3.6%) |
| $12,500 to $14,999 | 15 (1.3%) | 79 (8.1%) |
| $15,000 to $17,499 | 65 (5.7%) | 0 (0.0%) |
| $17,500 to $19,999 | 19 (1.7%) | 0 (0.0%) |
| $20,000 to $22,499 | 5 (0.4%) | 0 (0.0%) |
| $22,500 to $24,999 | 46 (4.1%) | 43 (4.4%) |
| $25,000 to $29,999 | 7 (0.6%) | 141 (14.5%) |
| $30,000 to $34,999 | 194 (17.1%) | 128 (13.2%) |
| $35,000 to $39,999 | 80 (7.0%) | 67 (6.9%) |
| $40,000 to $44,999 | 114 (10.0%) | 19 (2.0%) |
| $45,000 to $49,999 | 37 (3.3%) | 33 (3.4%) |
| $50,000 to $54,999 | 29 (2.5%) | 13 (1.3%) |
| $55,000 to $64,999 | 177 (15.6%) | 13 (1.3%) |
| $65,000 to $74,999 | 87 (7.6%) | 25 (2.6%) |
| $75,000 to $99,999 | 49 (4.3%) | 86 (8.9%) |
| $100,000+ | 42 (3.7%) | 0 (0.0%) |
| Total | 1,137 (100.0%) | 970 (100.0%) |
Earnings by Sex by Educational Attainment in Donora borough
Average earnings in Donora borough are $38,607 for men and $28,283 for women, a difference of 26.7%. Men with an educational attainment of college or associate's degree enjoy the highest average annual earnings of $44,755, while those with high school diploma education earn the least with $34,348. Women with an educational attainment of graduate degree earn the most with the average annual earnings of $70,391, while those with college or associate's degree education have the smallest earnings of $30,582.
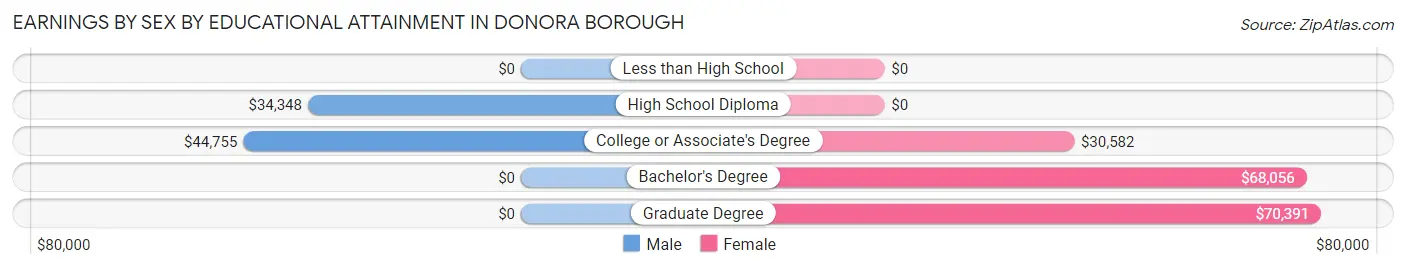
| Educational Attainment | Male Income | Female Income |
| Less than High School | - | - |
| High School Diploma | $34,348 | $0 |
| College or Associate's Degree | $44,755 | $30,582 |
| Bachelor's Degree | - | - |
| Graduate Degree | - | - |
| Total | $38,607 | $28,283 |
Family Income in Donora borough
Family Income Brackets in Donora borough
According to the Donora borough family income data, there are 414 families falling into the $50,000 to $74,999 income range, which is the most common income bracket and makes up 34.5% of all families.
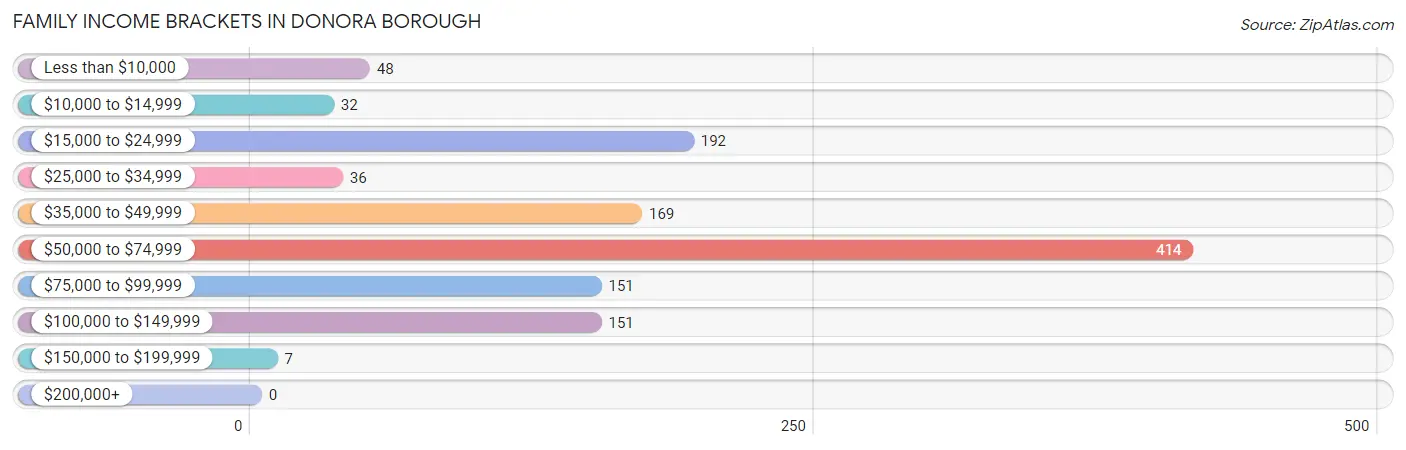
| Income Bracket | # Families | % Families |
| Less than $10,000 | 48 | 4.0% |
| $10,000 to $14,999 | 32 | 2.7% |
| $15,000 to $24,999 | 192 | 16.0% |
| $25,000 to $34,999 | 36 | 3.0% |
| $35,000 to $49,999 | 169 | 14.1% |
| $50,000 to $74,999 | 414 | 34.5% |
| $75,000 to $99,999 | 151 | 12.6% |
| $100,000 to $149,999 | 151 | 12.6% |
| $150,000 to $199,999 | 7 | 0.6% |
| $200,000+ | 0 | 0.0% |
Family Income by Famaliy Size in Donora borough
4-person families (121 | 10.1%) account for the highest median family income in Donora borough with $67,224 per family, while 2-person families (806 | 67.1%) have the highest median income of $31,662 per family member.
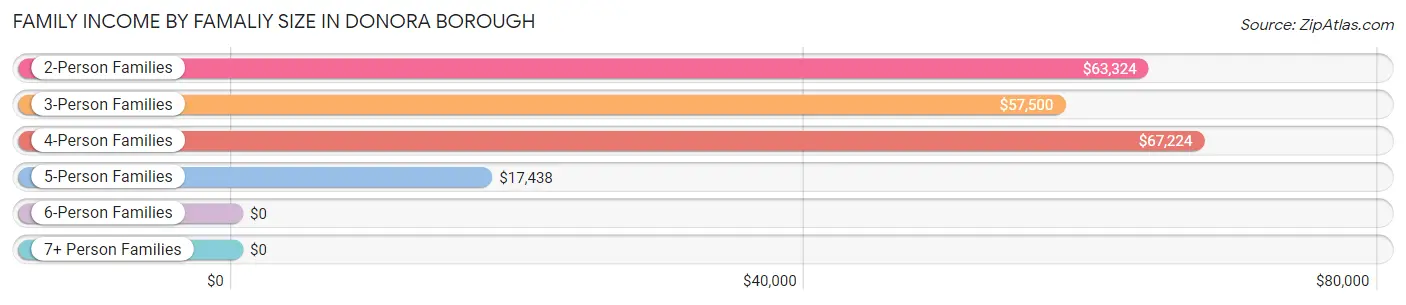
| Income Bracket | # Families | Median Income |
| 2-Person Families | 806 (67.1%) | $63,324 |
| 3-Person Families | 160 (13.3%) | $57,500 |
| 4-Person Families | 121 (10.1%) | $67,224 |
| 5-Person Families | 78 (6.5%) | $17,438 |
| 6-Person Families | 36 (3.0%) | $0 |
| 7+ Person Families | 0 (0.0%) | $0 |
| Total | 1,201 (100.0%) | $63,203 |
Family Income by Number of Earners in Donora borough
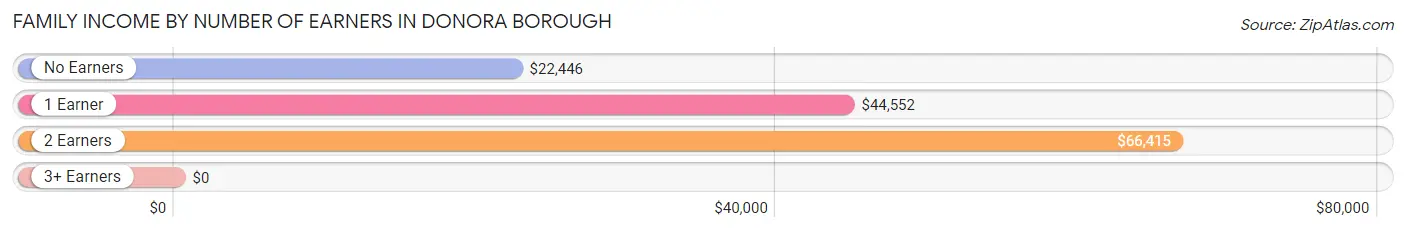
| Number of Earners | # Families | Median Income |
| No Earners | 215 (17.9%) | $22,446 |
| 1 Earner | 402 (33.5%) | $44,552 |
| 2 Earners | 551 (45.9%) | $66,415 |
| 3+ Earners | 33 (2.8%) | $0 |
| Total | 1,201 (100.0%) | $63,203 |
Household Income in Donora borough
Household Income Brackets in Donora borough
With 488 households falling in the category, the $50,000 to $74,999 income range is the most frequent in Donora borough, accounting for 21.4% of all households. In contrast, only 7 households (0.3%) fall into the $150,000 to $199,999 income bracket, making it the least populous group.
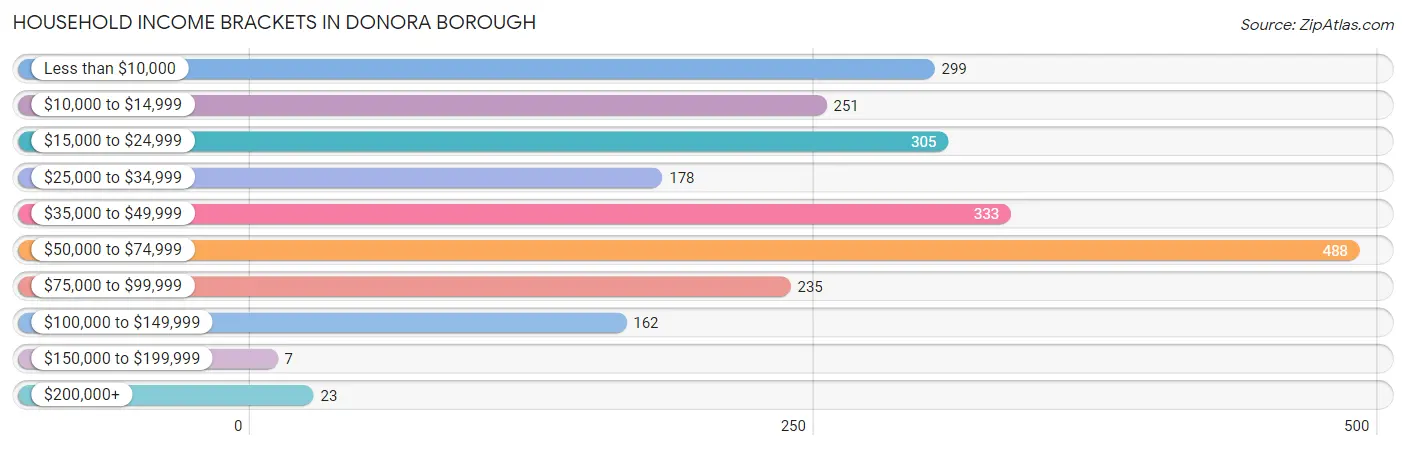
| Income Bracket | # Households | % Households |
| Less than $10,000 | 299 | 13.1% |
| $10,000 to $14,999 | 251 | 11.0% |
| $15,000 to $24,999 | 305 | 13.4% |
| $25,000 to $34,999 | 178 | 7.8% |
| $35,000 to $49,999 | 333 | 14.6% |
| $50,000 to $74,999 | 488 | 21.4% |
| $75,000 to $99,999 | 235 | 10.3% |
| $100,000 to $149,999 | 162 | 7.1% |
| $150,000 to $199,999 | 7 | 0.3% |
| $200,000+ | 23 | 1.0% |
Household Income by Householder Age in Donora borough
The median household income in Donora borough is $42,651, with the highest median household income of $48,447 found in the 45 to 64 years age bracket for the primary householder. A total of 993 households (43.6%) fall into this category.
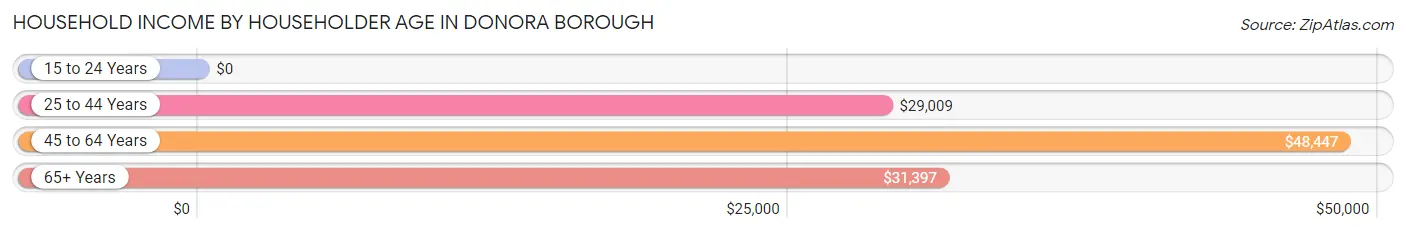
| Income Bracket | # Households | Median Income |
| 15 to 24 Years | 0 (0.0%) | $0 |
| 25 to 44 Years | 751 (33.0%) | $29,009 |
| 45 to 64 Years | 993 (43.6%) | $48,447 |
| 65+ Years | 535 (23.5%) | $31,397 |
| Total | 2,279 (100.0%) | $42,651 |
Poverty in Donora borough
Income Below Poverty by Sex and Age in Donora borough
With 35.2% poverty level for males and 36.8% for females among the residents of Donora borough, under 5 year old males and under 5 year old females are the most vulnerable to poverty, with 94 males (100.0%) and 58 females (100.0%) in their respective age groups living below the poverty level.
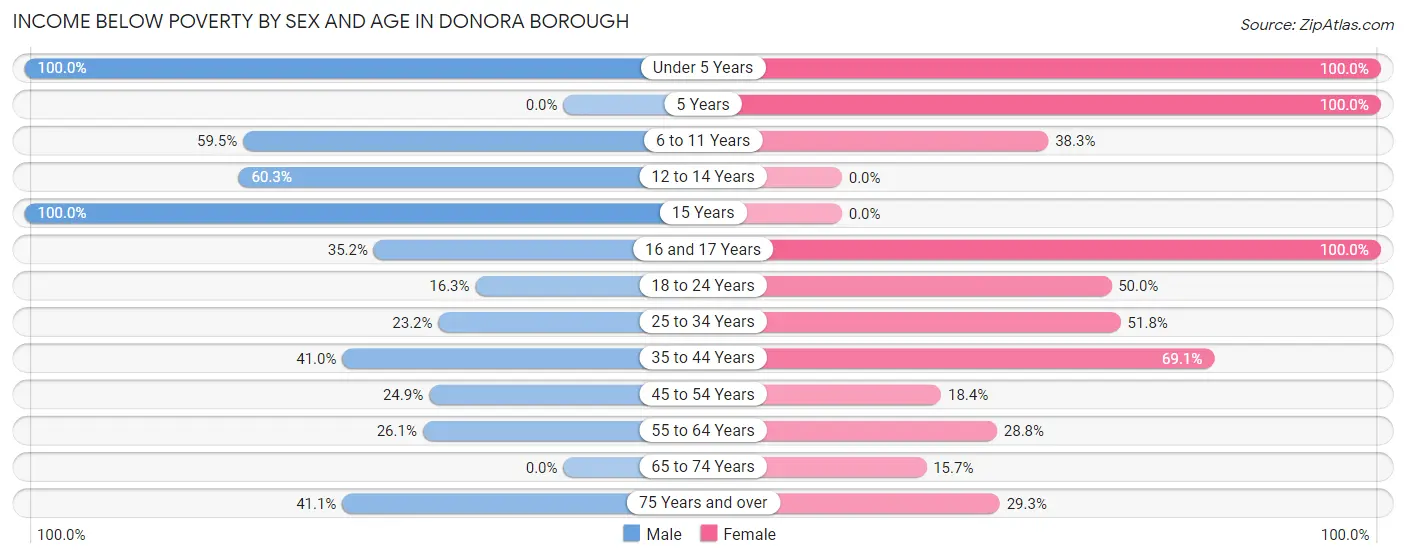
| Age Bracket | Male | Female |
| Under 5 Years | 94 (100.0%) | 58 (100.0%) |
| 5 Years | 0 (0.0%) | 21 (100.0%) |
| 6 to 11 Years | 195 (59.5%) | 82 (38.3%) |
| 12 to 14 Years | 41 (60.3%) | 0 (0.0%) |
| 15 Years | 40 (100.0%) | 0 (0.0%) |
| 16 and 17 Years | 19 (35.2%) | 46 (100.0%) |
| 18 to 24 Years | 16 (16.3%) | 10 (50.0%) |
| 25 to 34 Years | 90 (23.2%) | 221 (51.8%) |
| 35 to 44 Years | 32 (41.0%) | 123 (69.1%) |
| 45 to 54 Years | 102 (24.9%) | 63 (18.4%) |
| 55 to 64 Years | 101 (26.1%) | 118 (28.8%) |
| 65 to 74 Years | 0 (0.0%) | 55 (15.7%) |
| 75 Years and over | 39 (41.0%) | 39 (29.3%) |
| Total | 769 (35.2%) | 836 (36.8%) |
Income Above Poverty by Sex and Age in Donora borough
According to the poverty statistics in Donora borough, males aged 65 to 74 years and females aged 12 to 14 years are the age groups that are most secure financially, with 100.0% of males and 100.0% of females in these age groups living above the poverty line.
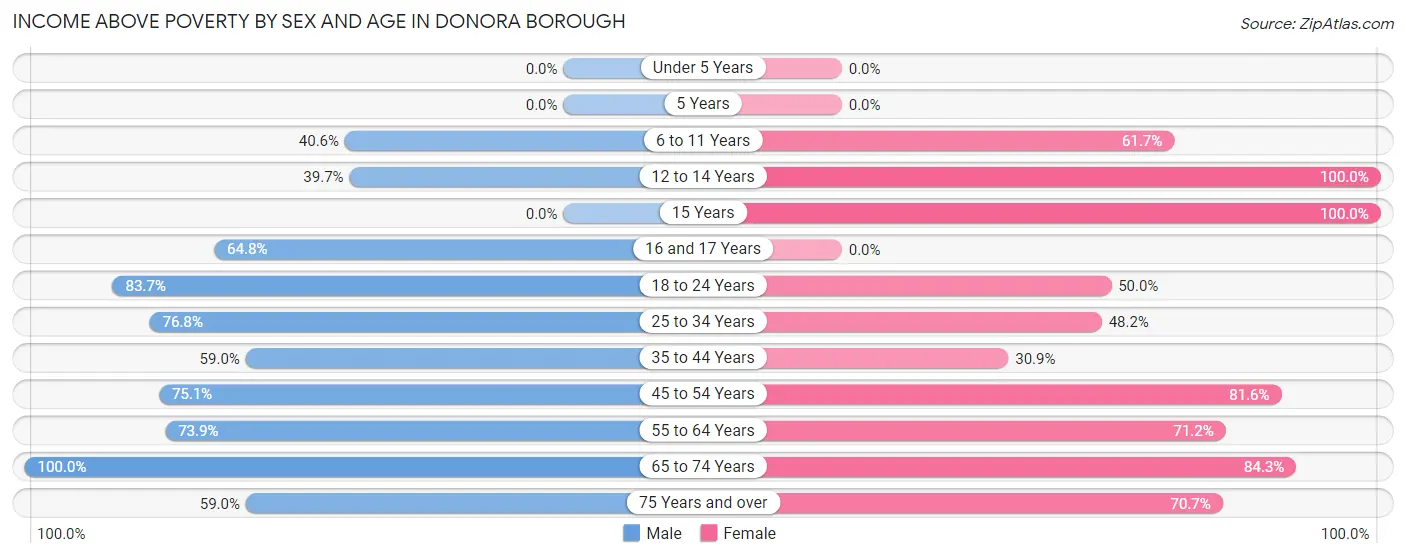
| Age Bracket | Male | Female |
| Under 5 Years | 0 (0.0%) | 0 (0.0%) |
| 5 Years | 0 (0.0%) | 0 (0.0%) |
| 6 to 11 Years | 133 (40.6%) | 132 (61.7%) |
| 12 to 14 Years | 27 (39.7%) | 62 (100.0%) |
| 15 Years | 0 (0.0%) | 12 (100.0%) |
| 16 and 17 Years | 35 (64.8%) | 0 (0.0%) |
| 18 to 24 Years | 82 (83.7%) | 10 (50.0%) |
| 25 to 34 Years | 298 (76.8%) | 206 (48.2%) |
| 35 to 44 Years | 46 (59.0%) | 55 (30.9%) |
| 45 to 54 Years | 307 (75.1%) | 279 (81.6%) |
| 55 to 64 Years | 286 (73.9%) | 292 (71.2%) |
| 65 to 74 Years | 145 (100.0%) | 296 (84.3%) |
| 75 Years and over | 56 (59.0%) | 94 (70.7%) |
| Total | 1,415 (64.8%) | 1,438 (63.2%) |
Income Below Poverty Among Married-Couple Families in Donora borough
The poverty statistics for married-couple families in Donora borough show that 8.1% or 53 of the total 655 families live below the poverty line. Families with no children have the highest poverty rate of 9.6%, comprising of 53 families. On the other hand, families with 1 or 2 children have the lowest poverty rate of 0.0%, which includes 0 families.
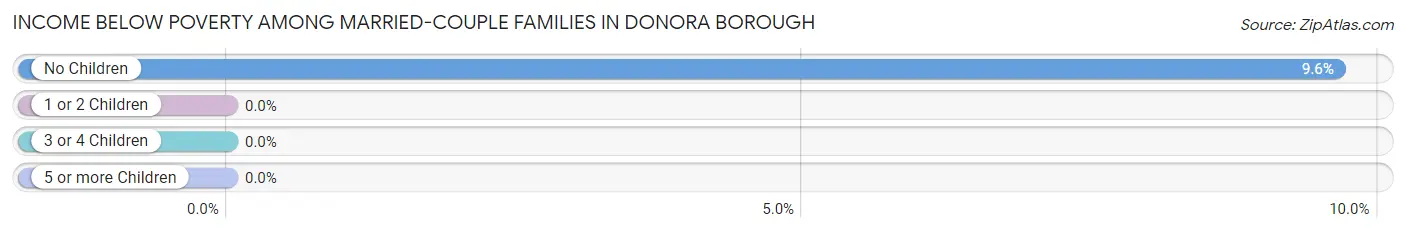
| Children | Above Poverty | Below Poverty |
| No Children | 497 (90.4%) | 53 (9.6%) |
| 1 or 2 Children | 105 (100.0%) | 0 (0.0%) |
| 3 or 4 Children | 0 (0.0%) | 0 (0.0%) |
| 5 or more Children | 0 (0.0%) | 0 (0.0%) |
| Total | 602 (91.9%) | 53 (8.1%) |
Income Below Poverty Among Single-Parent Households in Donora borough
According to the poverty data in Donora borough, 25.9% or 29 single-father households and 38.7% or 168 single-mother households are living below the poverty line. Among single-father households, those with 3 or 4 children have the highest poverty rate, with 29 households (100.0%) experiencing poverty. Likewise, among single-mother households, those with 3 or 4 children have the highest poverty rate, with 40 households (100.0%) falling below the poverty line.
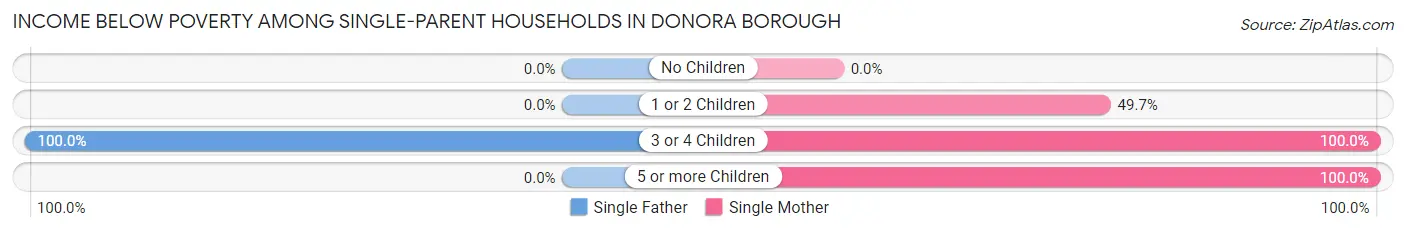
| Children | Single Father | Single Mother |
| No Children | 0 (0.0%) | 0 (0.0%) |
| 1 or 2 Children | 0 (0.0%) | 92 (49.7%) |
| 3 or 4 Children | 29 (100.0%) | 40 (100.0%) |
| 5 or more Children | 0 (0.0%) | 36 (100.0%) |
| Total | 29 (25.9%) | 168 (38.7%) |
Income Below Poverty Among Married-Couple vs Single-Parent Households in Donora borough
The poverty data for Donora borough shows that 53 of the married-couple family households (8.1%) and 197 of the single-parent households (36.1%) are living below the poverty level. Within the married-couple family households, those with no children have the highest poverty rate, with 53 households (9.6%) falling below the poverty line. Among the single-parent households, those with 3 or 4 children have the highest poverty rate, with 69 household (100.0%) living below poverty.
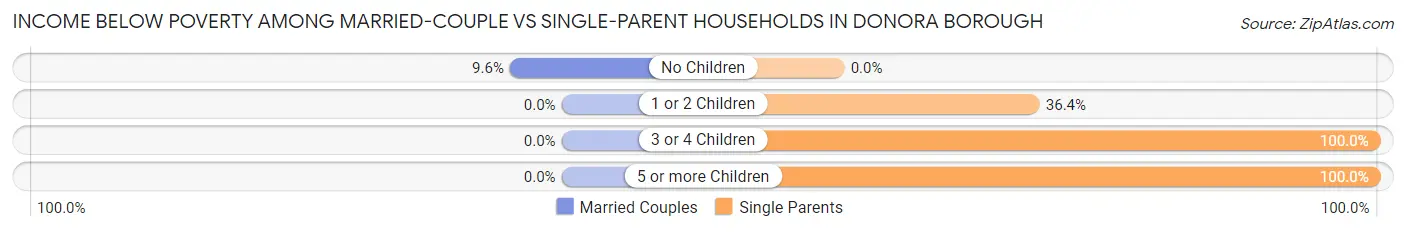
| Children | Married-Couple Families | Single-Parent Households |
| No Children | 53 (9.6%) | 0 (0.0%) |
| 1 or 2 Children | 0 (0.0%) | 92 (36.4%) |
| 3 or 4 Children | 0 (0.0%) | 69 (100.0%) |
| 5 or more Children | 0 (0.0%) | 36 (100.0%) |
| Total | 53 (8.1%) | 197 (36.1%) |
Employment Characteristics in Donora borough
Employment by Class of Employer in Donora borough
Among the 1,899 employed individuals in Donora borough, private company employees (1,381 | 72.7%), not-for-profit organizations (175 | 9.2%), and state government employees (142 | 7.5%) make up the most common classes of employment.
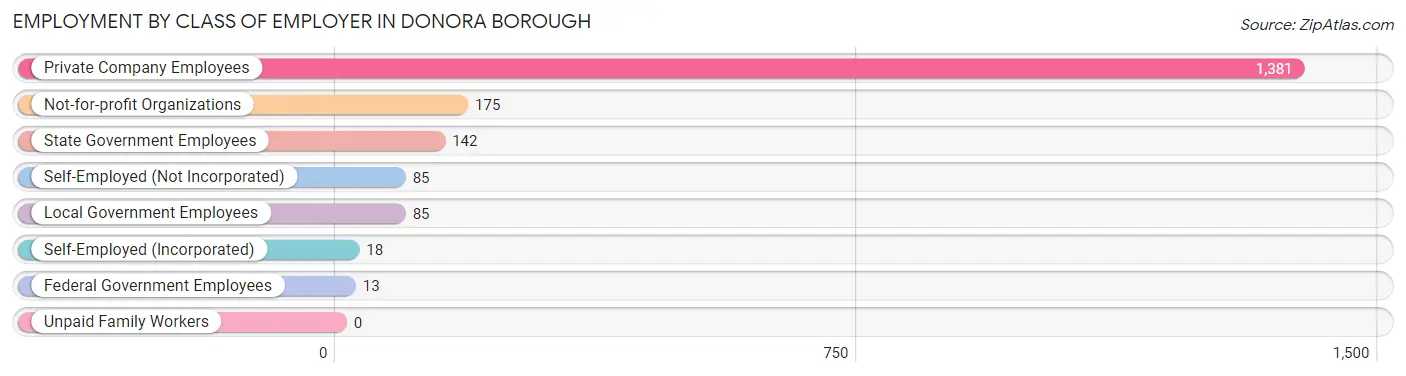
| Employer Class | # Employees | % Employees |
| Private Company Employees | 1,381 | 72.7% |
| Self-Employed (Incorporated) | 18 | 0.9% |
| Self-Employed (Not Incorporated) | 85 | 4.5% |
| Not-for-profit Organizations | 175 | 9.2% |
| Local Government Employees | 85 | 4.5% |
| State Government Employees | 142 | 7.5% |
| Federal Government Employees | 13 | 0.7% |
| Unpaid Family Workers | 0 | 0.0% |
| Total | 1,899 | 100.0% |
Employment Status by Age in Donora borough
According to the labor force statistics for Donora borough, out of the total population over 16 years of age (3,634), 60.5% or 2,199 individuals are in the labor force, with 12.7% or 279 of them unemployed. The age group with the highest labor force participation rate is 35 to 44 years, with 100.0% or 256 individuals in the labor force. Within the labor force, the 30 to 34 years age range has the highest percentage of unemployed individuals, with 42.3% or 220 of them being unemployed.
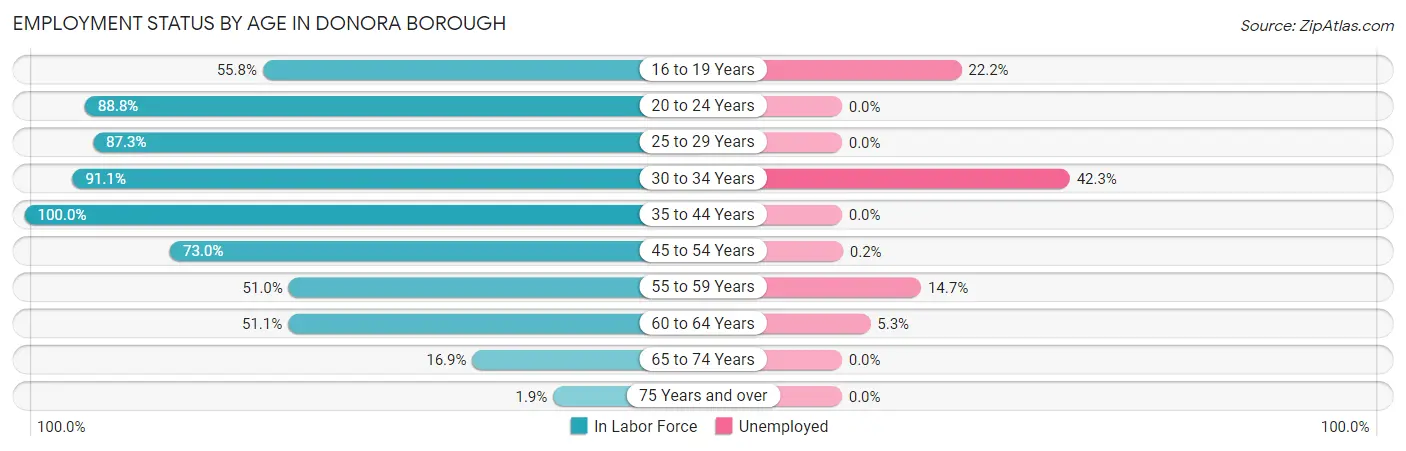
| Age Bracket | In Labor Force | Unemployed |
| 16 to 19 Years | 72 (55.8%) | 16 (22.2%) |
| 20 to 24 Years | 79 (88.8%) | 0 (0.0%) |
| 25 to 29 Years | 213 (87.3%) | 0 (0.0%) |
| 30 to 34 Years | 520 (91.1%) | 220 (42.3%) |
| 35 to 44 Years | 256 (100.0%) | 0 (0.0%) |
| 45 to 54 Years | 548 (73.0%) | 1 (0.2%) |
| 55 to 59 Years | 211 (51.0%) | 31 (14.7%) |
| 60 to 64 Years | 209 (51.1%) | 11 (5.3%) |
| 65 to 74 Years | 86 (16.9%) | 0 (0.0%) |
| 75 Years and over | 5 (1.9%) | 0 (0.0%) |
| Total | 2,199 (60.5%) | 279 (12.7%) |
Employment Status by Educational Attainment in Donora borough
According to labor force statistics for Donora borough, 74.0% of individuals (1,957) out of the total population between 25 and 64 years of age (2,645) are in the labor force, with 13.4% or 262 of them being unemployed. The group with the highest labor force participation rate are those with the educational attainment of bachelor's degree or higher, with 96.8% or 270 individuals in the labor force. Within the labor force, individuals with high school diploma education have the highest percentage of unemployment, with 26.4% or 237 of them being unemployed.
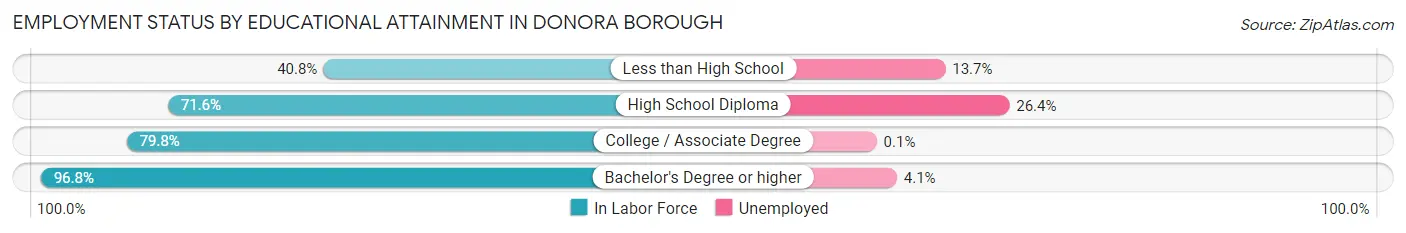
| Educational Attainment | In Labor Force | Unemployed |
| Less than High School | 102 (40.8%) | 34 (13.7%) |
| High School Diploma | 899 (71.6%) | 331 (26.4%) |
| College / Associate Degree | 687 (79.8%) | 1 (0.1%) |
| Bachelor's Degree or higher | 270 (96.8%) | 11 (4.1%) |
| Total | 1,957 (74.0%) | 354 (13.4%) |
Employment Occupations by Sex in Donora borough
Management, Business, Science and Arts Occupations
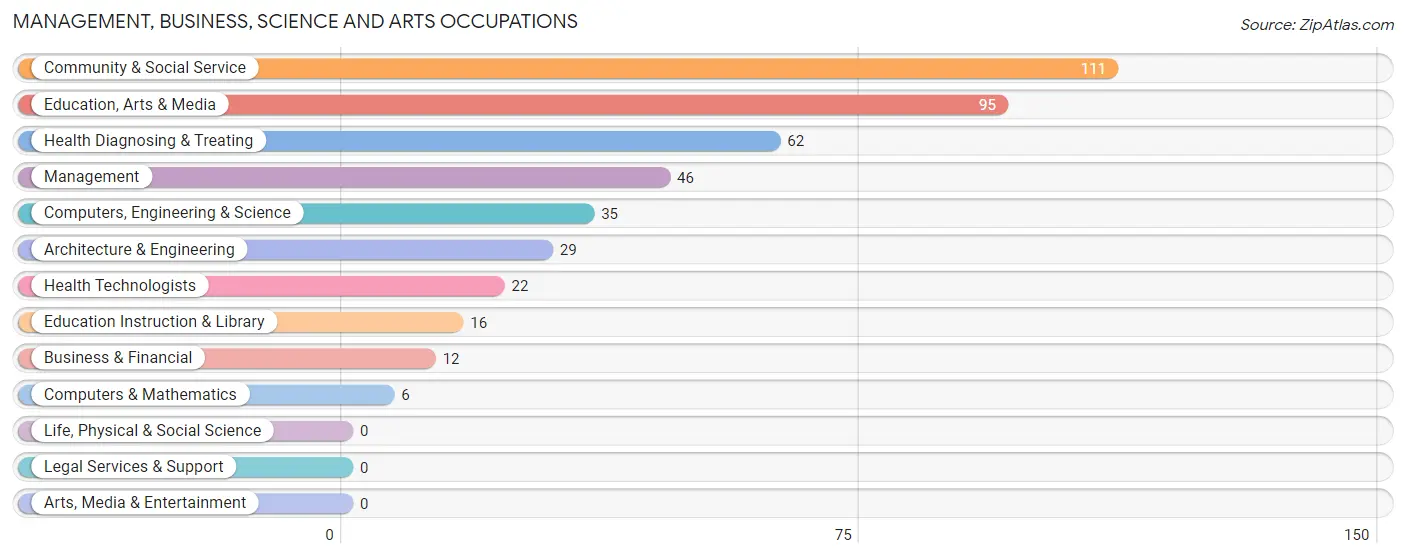
The most common Management, Business, Science and Arts occupations in Donora borough are Community & Social Service (111 | 5.8%), Education, Arts & Media (95 | 5.0%), Health Diagnosing & Treating (62 | 3.2%), Management (46 | 2.4%), and Computers, Engineering & Science (35 | 1.8%).
Management, Business, Science and Arts Occupations by Sex
Within the Management, Business, Science and Arts occupations in Donora borough, the most male-oriented occupations are Architecture & Engineering (100.0%), Education, Arts & Media (89.5%), and Computers, Engineering & Science (82.9%), while the most female-oriented occupations are Business & Financial (100.0%), Computers & Mathematics (100.0%), and Education Instruction & Library (100.0%).
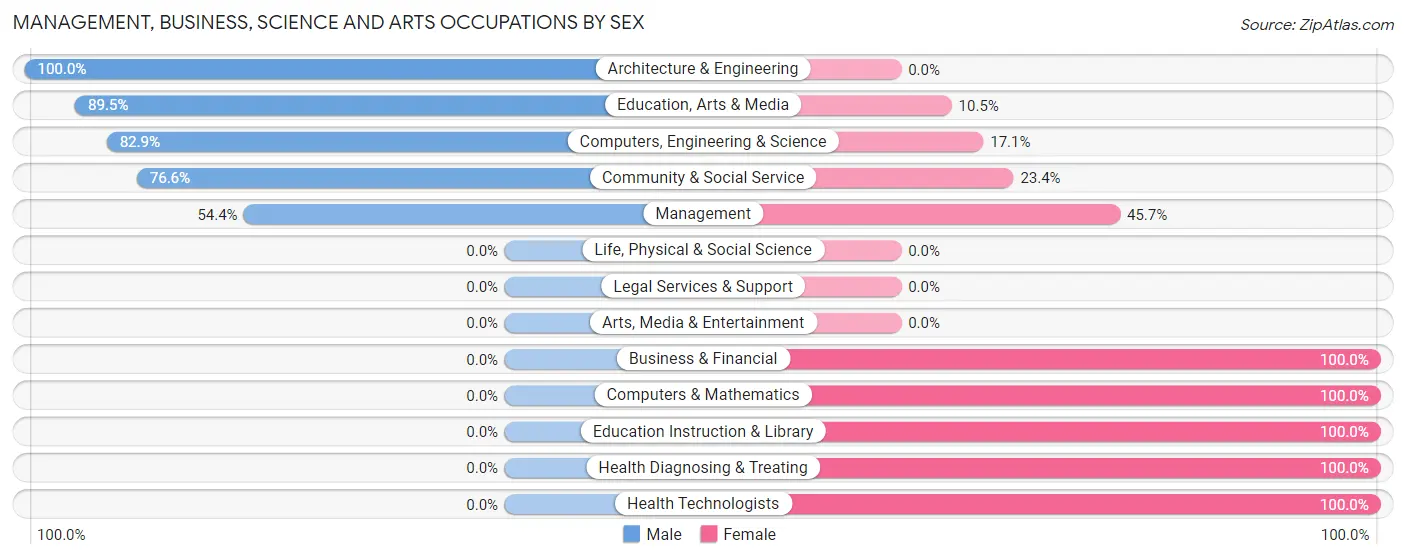
| Occupation | Male | Female |
| Management | 25 (54.3%) | 21 (45.7%) |
| Business & Financial | 0 (0.0%) | 12 (100.0%) |
| Computers, Engineering & Science | 29 (82.9%) | 6 (17.1%) |
| Computers & Mathematics | 0 (0.0%) | 6 (100.0%) |
| Architecture & Engineering | 29 (100.0%) | 0 (0.0%) |
| Life, Physical & Social Science | 0 (0.0%) | 0 (0.0%) |
| Community & Social Service | 85 (76.6%) | 26 (23.4%) |
| Education, Arts & Media | 85 (89.5%) | 10 (10.5%) |
| Legal Services & Support | 0 (0.0%) | 0 (0.0%) |
| Education Instruction & Library | 0 (0.0%) | 16 (100.0%) |
| Arts, Media & Entertainment | 0 (0.0%) | 0 (0.0%) |
| Health Diagnosing & Treating | 0 (0.0%) | 62 (100.0%) |
| Health Technologists | 0 (0.0%) | 22 (100.0%) |
| Total (Category) | 139 (52.3%) | 127 (47.7%) |
| Total (Overall) | 1,084 (56.5%) | 836 (43.5%) |
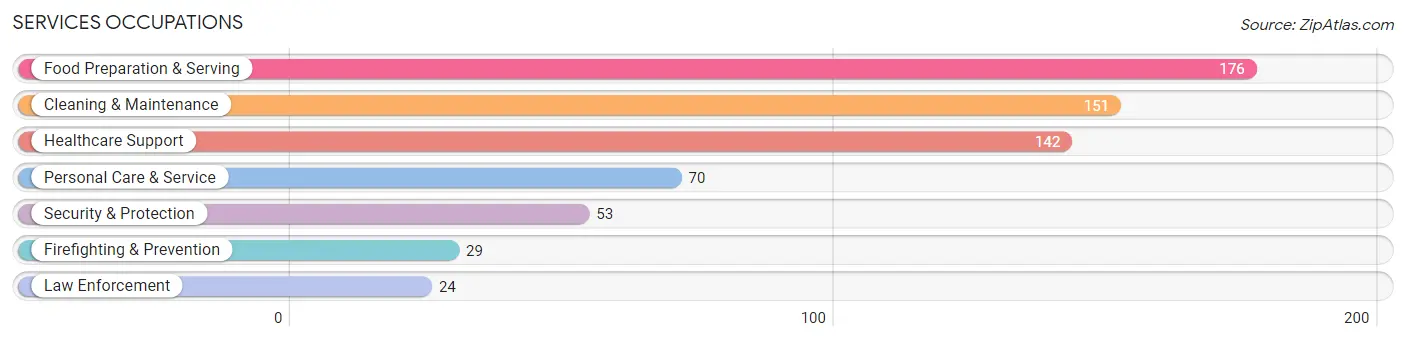
Services Occupations
The most common Services occupations in Donora borough are Food Preparation & Serving (176 | 9.2%), Cleaning & Maintenance (151 | 7.9%), Healthcare Support (142 | 7.4%), Personal Care & Service (70 | 3.6%), and Security & Protection (53 | 2.8%).
Services Occupations by Sex
Within the Services occupations in Donora borough, the most male-oriented occupations are Security & Protection (100.0%), Firefighting & Prevention (100.0%), and Law Enforcement (100.0%), while the most female-oriented occupations are Healthcare Support (95.1%), Food Preparation & Serving (85.8%), and Cleaning & Maintenance (69.5%).
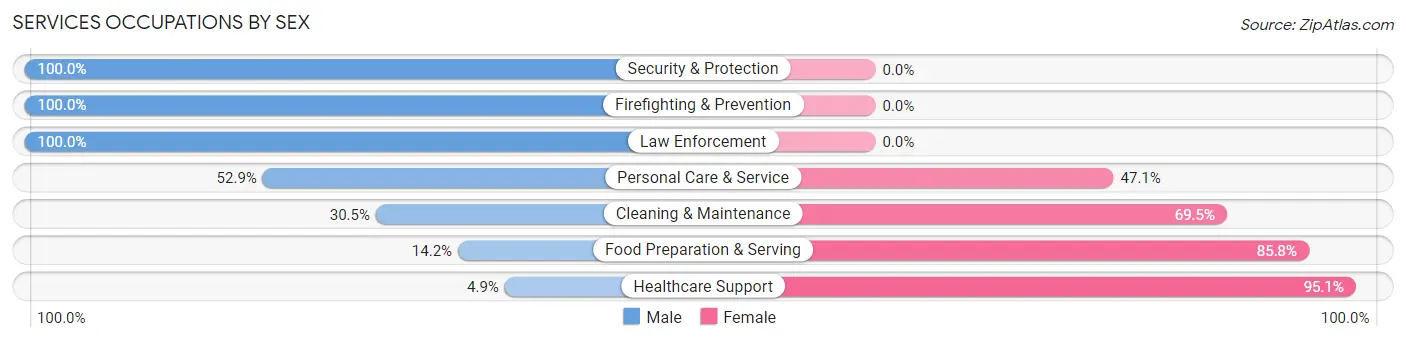
| Occupation | Male | Female |
| Healthcare Support | 7 (4.9%) | 135 (95.1%) |
| Security & Protection | 53 (100.0%) | 0 (0.0%) |
| Firefighting & Prevention | 29 (100.0%) | 0 (0.0%) |
| Law Enforcement | 24 (100.0%) | 0 (0.0%) |
| Food Preparation & Serving | 25 (14.2%) | 151 (85.8%) |
| Cleaning & Maintenance | 46 (30.5%) | 105 (69.5%) |
| Personal Care & Service | 37 (52.9%) | 33 (47.1%) |
| Total (Category) | 168 (28.4%) | 424 (71.6%) |
| Total (Overall) | 1,084 (56.5%) | 836 (43.5%) |
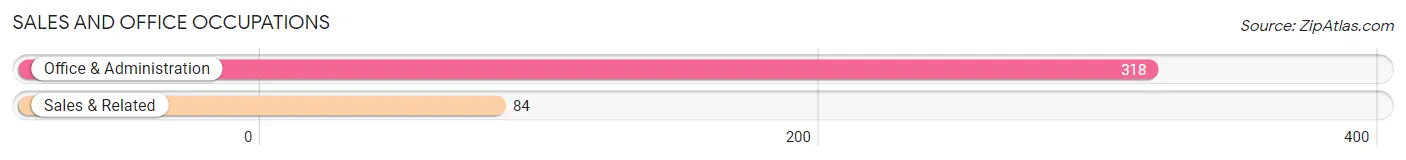
Sales and Office Occupations
The most common Sales and Office occupations in Donora borough are Office & Administration (318 | 16.6%), and Sales & Related (84 | 4.4%).
Sales and Office Occupations by Sex
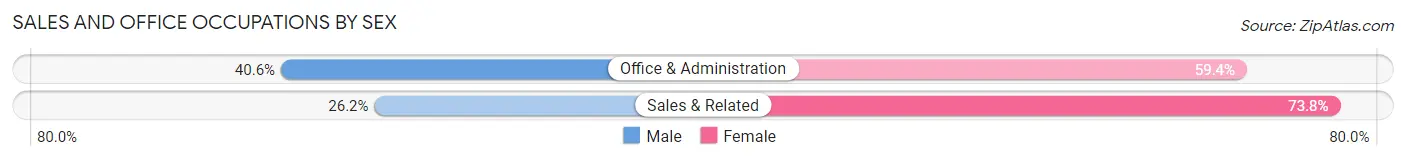
| Occupation | Male | Female |
| Sales & Related | 22 (26.2%) | 62 (73.8%) |
| Office & Administration | 129 (40.6%) | 189 (59.4%) |
| Total (Category) | 151 (37.6%) | 251 (62.4%) |
| Total (Overall) | 1,084 (56.5%) | 836 (43.5%) |
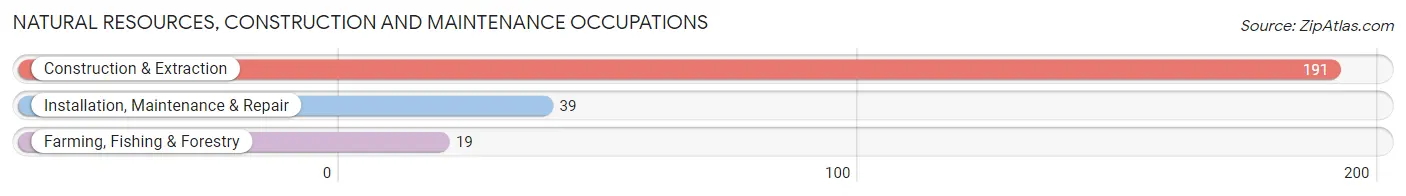
Natural Resources, Construction and Maintenance Occupations
The most common Natural Resources, Construction and Maintenance occupations in Donora borough are Construction & Extraction (191 | 10.0%), Installation, Maintenance & Repair (39 | 2.0%), and Farming, Fishing & Forestry (19 | 1.0%).
Natural Resources, Construction and Maintenance Occupations by Sex
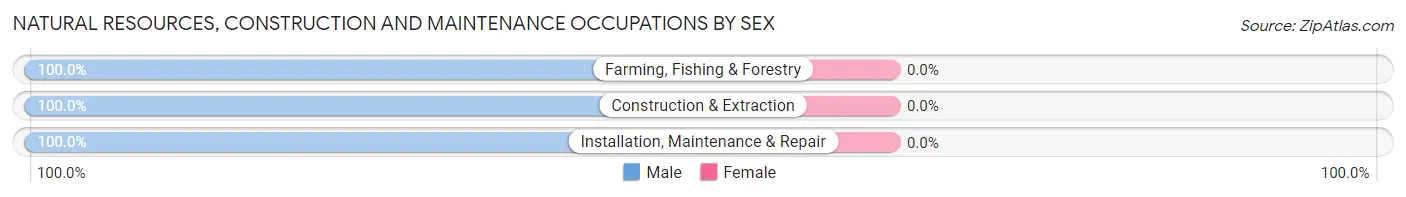
| Occupation | Male | Female |
| Farming, Fishing & Forestry | 19 (100.0%) | 0 (0.0%) |
| Construction & Extraction | 191 (100.0%) | 0 (0.0%) |
| Installation, Maintenance & Repair | 39 (100.0%) | 0 (0.0%) |
| Total (Category) | 249 (100.0%) | 0 (0.0%) |
| Total (Overall) | 1,084 (56.5%) | 836 (43.5%) |
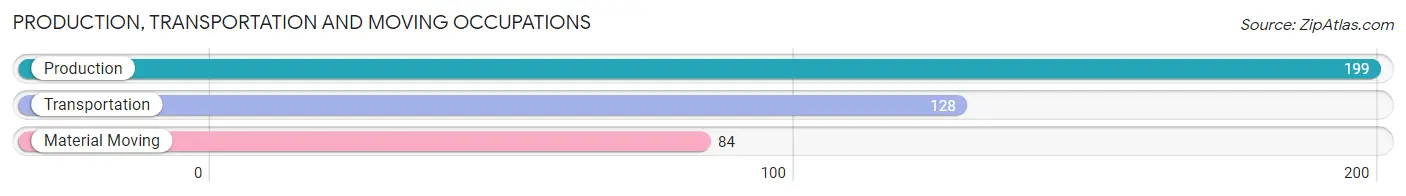
Production, Transportation and Moving Occupations
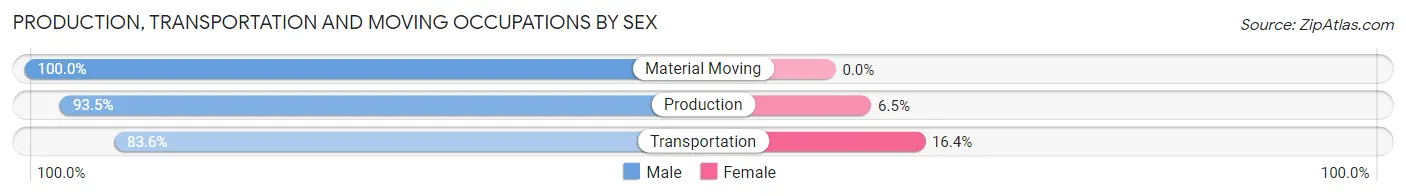
The most common Production, Transportation and Moving occupations in Donora borough are Production (199 | 10.4%), Transportation (128 | 6.7%), and Material Moving (84 | 4.4%).
Production, Transportation and Moving Occupations by Sex
| Occupation | Male | Female |
| Production | 186 (93.5%) | 13 (6.5%) |
| Transportation | 107 (83.6%) | 21 (16.4%) |
| Material Moving | 84 (100.0%) | 0 (0.0%) |
| Total (Category) | 377 (91.7%) | 34 (8.3%) |
| Total (Overall) | 1,084 (56.5%) | 836 (43.5%) |
Employment Industries by Sex in Donora borough
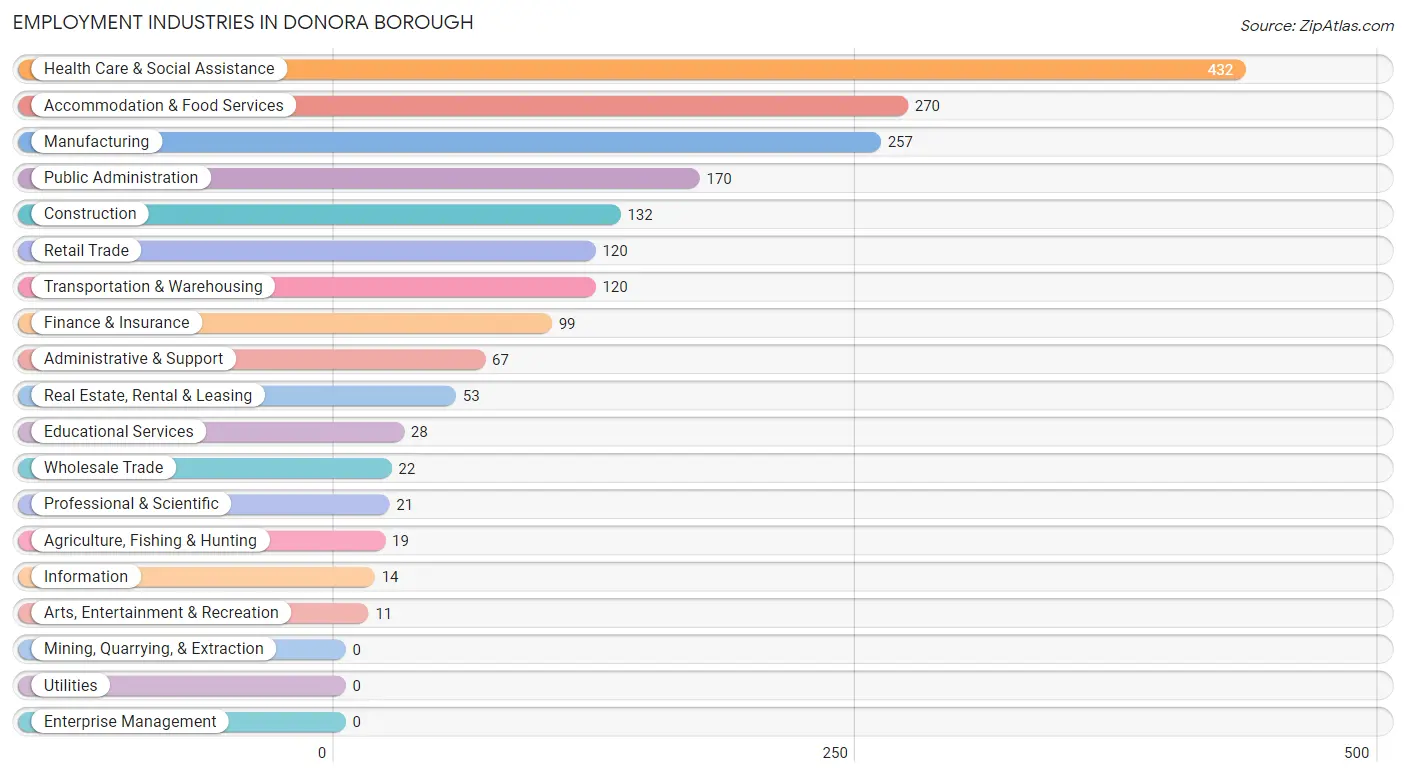
Employment Industries in Donora borough
The major employment industries in Donora borough include Health Care & Social Assistance (432 | 22.5%), Accommodation & Food Services (270 | 14.1%), Manufacturing (257 | 13.4%), Public Administration (170 | 8.8%), and Construction (132 | 6.9%).
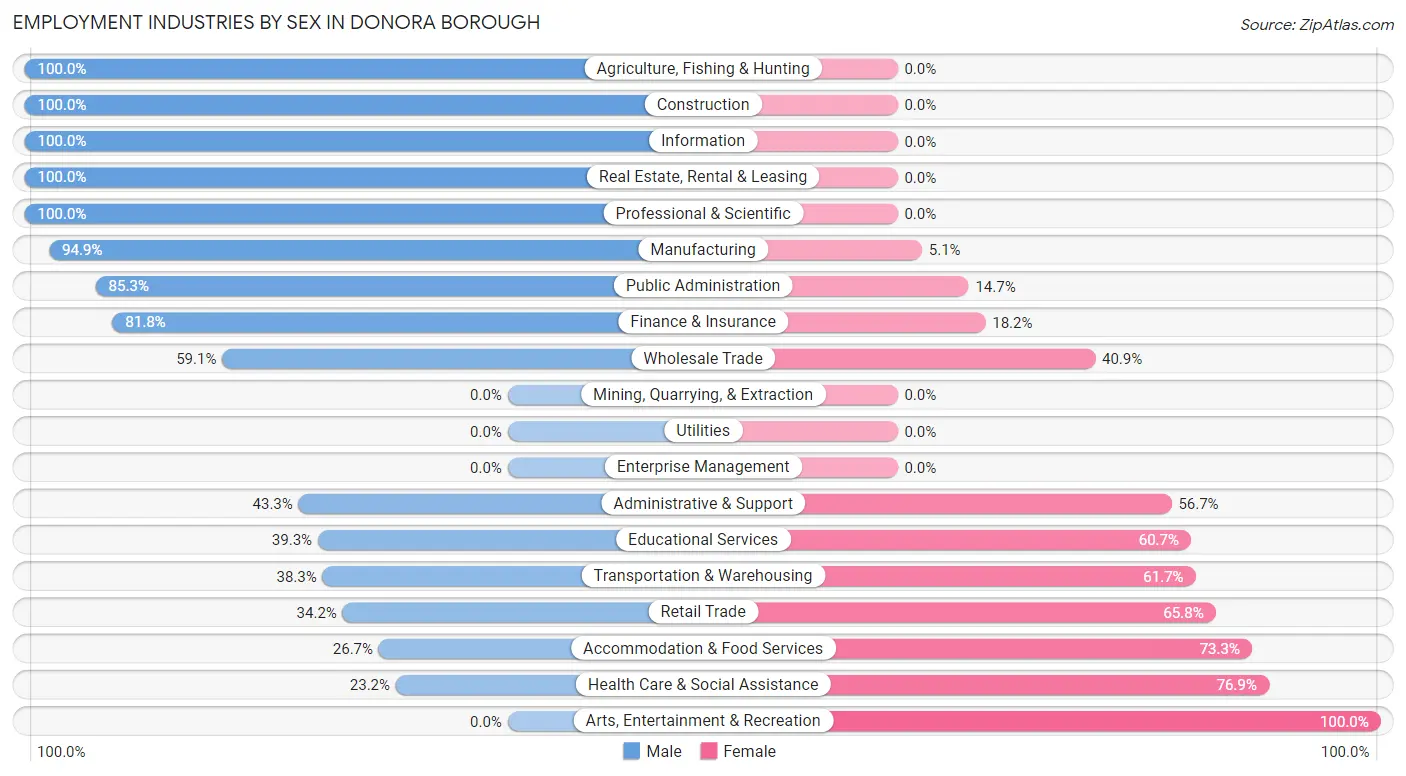
Employment Industries by Sex in Donora borough
The Donora borough industries that see more men than women are Agriculture, Fishing & Hunting (100.0%), Construction (100.0%), and Information (100.0%), whereas the industries that tend to have a higher number of women are Arts, Entertainment & Recreation (100.0%), Health Care & Social Assistance (76.8%), and Accommodation & Food Services (73.3%).
| Industry | Male | Female |
| Agriculture, Fishing & Hunting | 19 (100.0%) | 0 (0.0%) |
| Mining, Quarrying, & Extraction | 0 (0.0%) | 0 (0.0%) |
| Construction | 132 (100.0%) | 0 (0.0%) |
| Manufacturing | 244 (94.9%) | 13 (5.1%) |
| Wholesale Trade | 13 (59.1%) | 9 (40.9%) |
| Retail Trade | 41 (34.2%) | 79 (65.8%) |
| Transportation & Warehousing | 46 (38.3%) | 74 (61.7%) |
| Utilities | 0 (0.0%) | 0 (0.0%) |
| Information | 14 (100.0%) | 0 (0.0%) |
| Finance & Insurance | 81 (81.8%) | 18 (18.2%) |
| Real Estate, Rental & Leasing | 53 (100.0%) | 0 (0.0%) |
| Professional & Scientific | 21 (100.0%) | 0 (0.0%) |
| Enterprise Management | 0 (0.0%) | 0 (0.0%) |
| Administrative & Support | 29 (43.3%) | 38 (56.7%) |
| Educational Services | 11 (39.3%) | 17 (60.7%) |
| Health Care & Social Assistance | 100 (23.2%) | 332 (76.8%) |
| Arts, Entertainment & Recreation | 0 (0.0%) | 11 (100.0%) |
| Accommodation & Food Services | 72 (26.7%) | 198 (73.3%) |
| Public Administration | 145 (85.3%) | 25 (14.7%) |
| Total | 1,084 (56.5%) | 836 (43.5%) |
Education in Donora borough
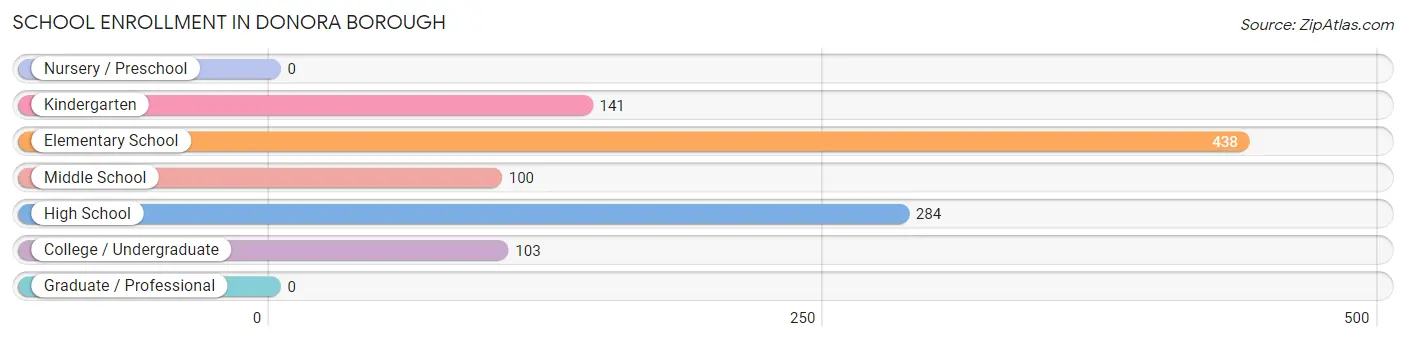
School Enrollment in Donora borough
The most common levels of schooling among the 1,066 students in Donora borough are elementary school (438 | 41.1%), high school (284 | 26.6%), and kindergarten (141 | 13.2%).
| School Level | # Students | % Students |
| Nursery / Preschool | 0 | 0.0% |
| Kindergarten | 141 | 13.2% |
| Elementary School | 438 | 41.1% |
| Middle School | 100 | 9.4% |
| High School | 284 | 26.6% |
| College / Undergraduate | 103 | 9.7% |
| Graduate / Professional | 0 | 0.0% |
| Total | 1,066 | 100.0% |
School Enrollment by Age by Funding Source in Donora borough
Out of a total of 1,066 students who are enrolled in schools in Donora borough, 44 (4.1%) attend a private institution, while the remaining 1,022 (95.9%) are enrolled in public schools. The age group of 10 to 14 year olds has the highest likelihood of being enrolled in private schools, with 41 (18.1% in the age bracket) enrolled. Conversely, the age group of 5 to 9 year old has the lowest likelihood of being enrolled in a private school, with 497 (100.0% in the age bracket) attending a public institution.
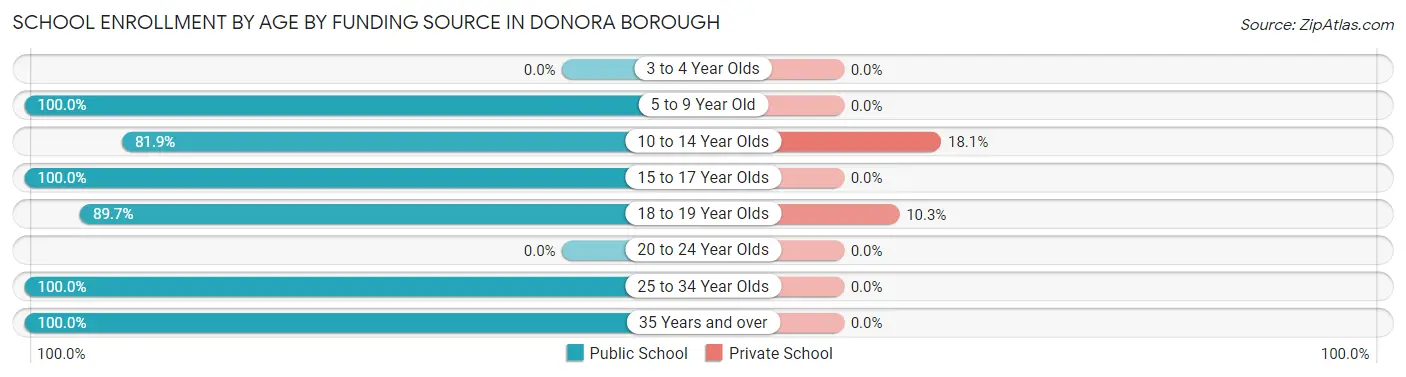
| Age Bracket | Public School | Private School |
| 3 to 4 Year Olds | 0 (0.0%) | 0 (0.0%) |
| 5 to 9 Year Old | 497 (100.0%) | 0 (0.0%) |
| 10 to 14 Year Olds | 185 (81.9%) | 41 (18.1%) |
| 15 to 17 Year Olds | 152 (100.0%) | 0 (0.0%) |
| 18 to 19 Year Olds | 26 (89.7%) | 3 (10.3%) |
| 20 to 24 Year Olds | 0 (0.0%) | 0 (0.0%) |
| 25 to 34 Year Olds | 86 (100.0%) | 0 (0.0%) |
| 35 Years and over | 76 (100.0%) | 0 (0.0%) |
| Total | 1,022 (95.9%) | 44 (4.1%) |
Educational Attainment by Field of Study in Donora borough
Business (94 | 19.4%), education (88 | 18.1%), physical & health sciences (56 | 11.6%), communications (51 | 10.5%), and engineering (40 | 8.3%) are the most common fields of study among 485 individuals in Donora borough who have obtained a bachelor's degree or higher.
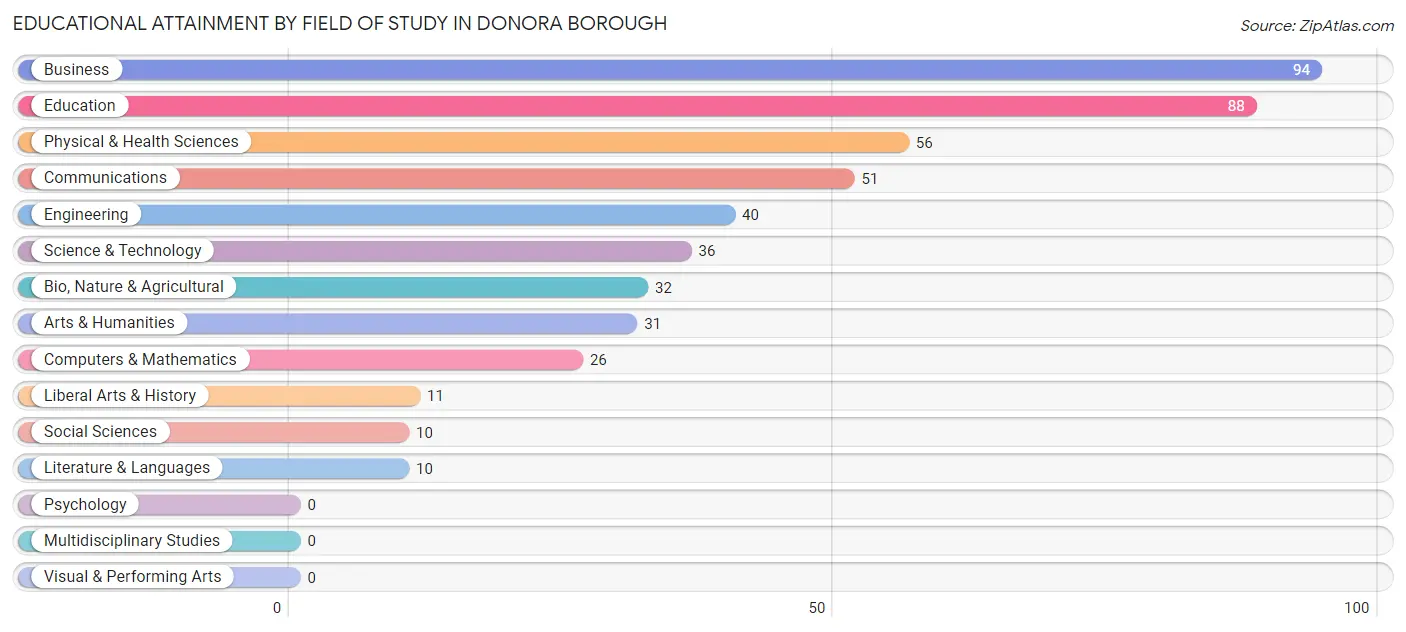
| Field of Study | # Graduates | % Graduates |
| Computers & Mathematics | 26 | 5.4% |
| Bio, Nature & Agricultural | 32 | 6.6% |
| Physical & Health Sciences | 56 | 11.6% |
| Psychology | 0 | 0.0% |
| Social Sciences | 10 | 2.1% |
| Engineering | 40 | 8.3% |
| Multidisciplinary Studies | 0 | 0.0% |
| Science & Technology | 36 | 7.4% |
| Business | 94 | 19.4% |
| Education | 88 | 18.1% |
| Literature & Languages | 10 | 2.1% |
| Liberal Arts & History | 11 | 2.3% |
| Visual & Performing Arts | 0 | 0.0% |
| Communications | 51 | 10.5% |
| Arts & Humanities | 31 | 6.4% |
| Total | 485 | 100.0% |
Transportation & Commute in Donora borough
Vehicle Availability by Sex in Donora borough
The most prevalent vehicle ownership categories in Donora borough are males with 1 vehicle (352, accounting for 32.5%) and females with 1 vehicle (316, making up 43.2%).
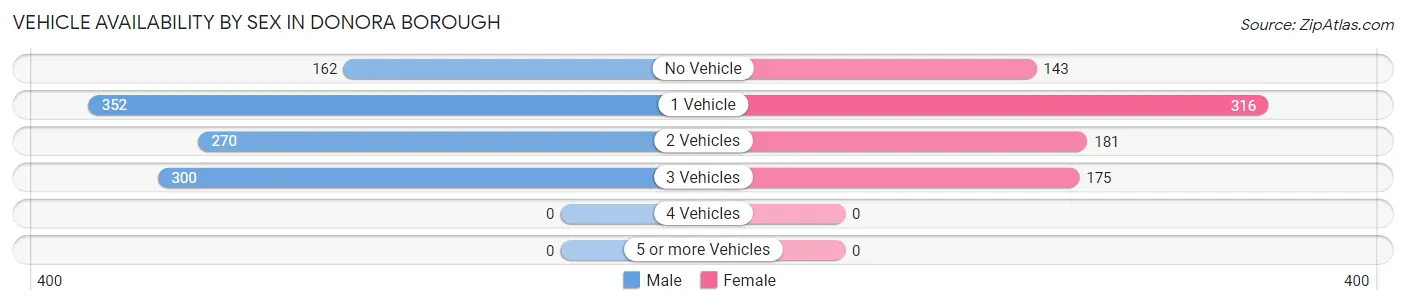
| Vehicles Available | Male | Female |
| No Vehicle | 162 (14.9%) | 143 (17.5%) |
| 1 Vehicle | 352 (32.5%) | 316 (38.8%) |
| 2 Vehicles | 270 (24.9%) | 181 (22.2%) |
| 3 Vehicles | 300 (27.7%) | 175 (21.5%) |
| 4 Vehicles | 0 (0.0%) | 0 (0.0%) |
| 5 or more Vehicles | 0 (0.0%) | 0 (0.0%) |
| Total | 1,084 (100.0%) | 815 (100.0%) |
Commute Time in Donora borough
The most frequently occuring commute durations in Donora borough are 10 to 14 minutes (420 commuters, 23.5%), 45 to 59 minutes (345 commuters, 19.3%), and 40 to 44 minutes (253 commuters, 14.2%).
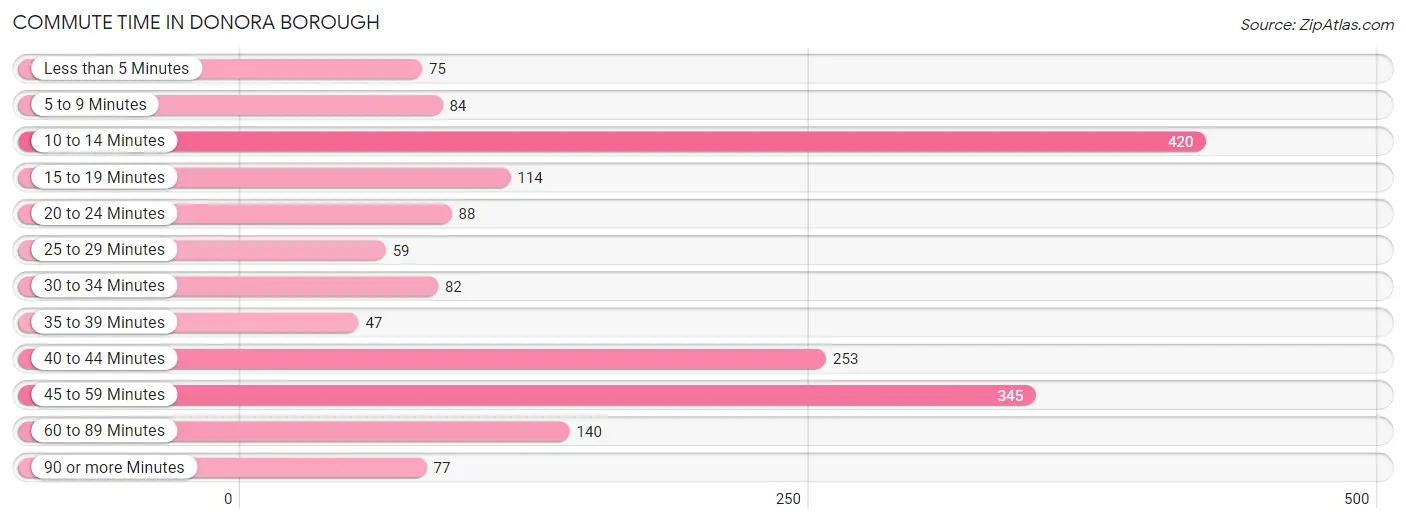
| Commute Time | # Commuters | % Commuters |
| Less than 5 Minutes | 75 | 4.2% |
| 5 to 9 Minutes | 84 | 4.7% |
| 10 to 14 Minutes | 420 | 23.5% |
| 15 to 19 Minutes | 114 | 6.4% |
| 20 to 24 Minutes | 88 | 4.9% |
| 25 to 29 Minutes | 59 | 3.3% |
| 30 to 34 Minutes | 82 | 4.6% |
| 35 to 39 Minutes | 47 | 2.6% |
| 40 to 44 Minutes | 253 | 14.2% |
| 45 to 59 Minutes | 345 | 19.3% |
| 60 to 89 Minutes | 140 | 7.9% |
| 90 or more Minutes | 77 | 4.3% |
Commute Time by Sex in Donora borough
The most common commute times in Donora borough are 40 to 44 minutes (220 commuters, 22.3%) for males and 10 to 14 minutes (328 commuters, 41.1%) for females.
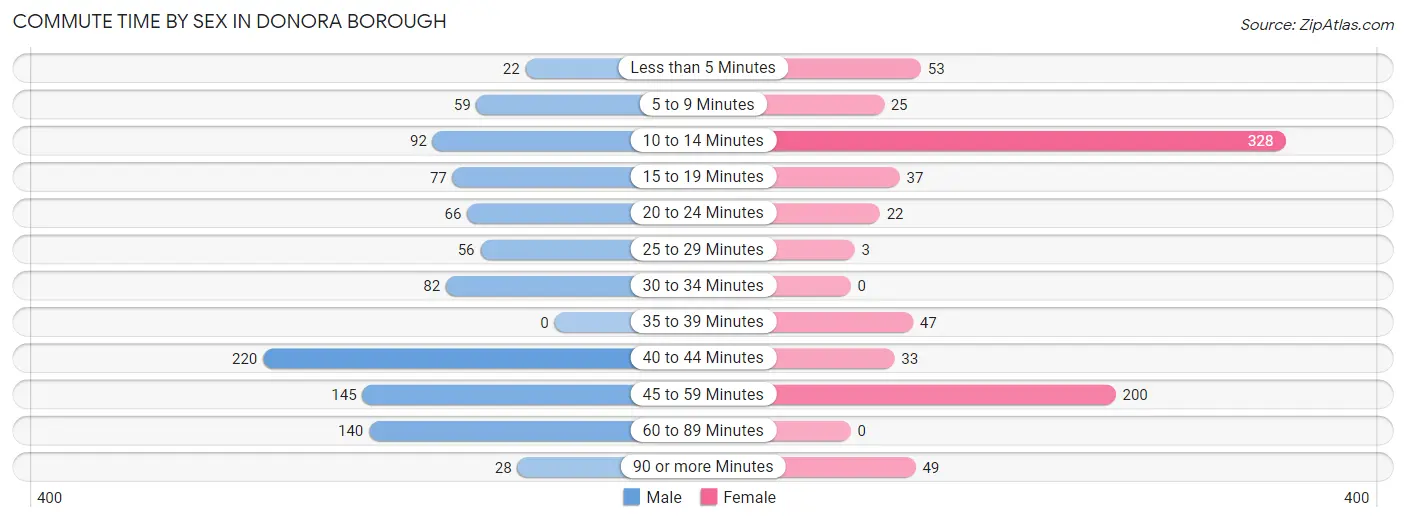
| Commute Time | Male | Female |
| Less than 5 Minutes | 22 (2.2%) | 53 (6.7%) |
| 5 to 9 Minutes | 59 (6.0%) | 25 (3.1%) |
| 10 to 14 Minutes | 92 (9.3%) | 328 (41.1%) |
| 15 to 19 Minutes | 77 (7.8%) | 37 (4.6%) |
| 20 to 24 Minutes | 66 (6.7%) | 22 (2.8%) |
| 25 to 29 Minutes | 56 (5.7%) | 3 (0.4%) |
| 30 to 34 Minutes | 82 (8.3%) | 0 (0.0%) |
| 35 to 39 Minutes | 0 (0.0%) | 47 (5.9%) |
| 40 to 44 Minutes | 220 (22.3%) | 33 (4.1%) |
| 45 to 59 Minutes | 145 (14.7%) | 200 (25.1%) |
| 60 to 89 Minutes | 140 (14.2%) | 0 (0.0%) |
| 90 or more Minutes | 28 (2.8%) | 49 (6.1%) |
Time of Departure to Work by Sex in Donora borough
The most frequent times of departure to work in Donora borough are 4:00 PM to 11:59 PM (210, 21.3%) for males and 7:00 AM to 7:29 AM (197, 24.7%) for females.
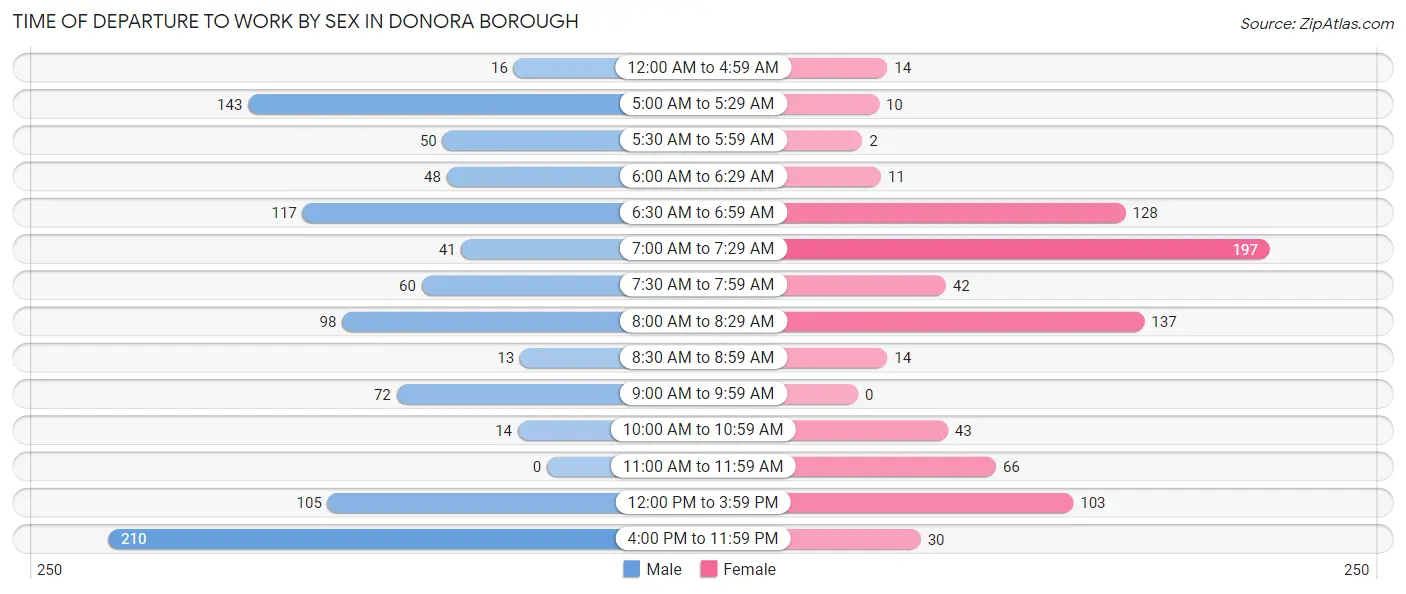
| Time of Departure | Male | Female |
| 12:00 AM to 4:59 AM | 16 (1.6%) | 14 (1.8%) |
| 5:00 AM to 5:29 AM | 143 (14.5%) | 10 (1.3%) |
| 5:30 AM to 5:59 AM | 50 (5.1%) | 2 (0.3%) |
| 6:00 AM to 6:29 AM | 48 (4.9%) | 11 (1.4%) |
| 6:30 AM to 6:59 AM | 117 (11.8%) | 128 (16.1%) |
| 7:00 AM to 7:29 AM | 41 (4.2%) | 197 (24.7%) |
| 7:30 AM to 7:59 AM | 60 (6.1%) | 42 (5.3%) |
| 8:00 AM to 8:29 AM | 98 (9.9%) | 137 (17.2%) |
| 8:30 AM to 8:59 AM | 13 (1.3%) | 14 (1.8%) |
| 9:00 AM to 9:59 AM | 72 (7.3%) | 0 (0.0%) |
| 10:00 AM to 10:59 AM | 14 (1.4%) | 43 (5.4%) |
| 11:00 AM to 11:59 AM | 0 (0.0%) | 66 (8.3%) |
| 12:00 PM to 3:59 PM | 105 (10.6%) | 103 (12.9%) |
| 4:00 PM to 11:59 PM | 210 (21.3%) | 30 (3.8%) |
| Total | 987 (100.0%) | 797 (100.0%) |
Housing Occupancy in Donora borough
Occupancy by Ownership in Donora borough
Of the total 2,279 dwellings in Donora borough, owner-occupied units account for 1,176 (51.6%), while renter-occupied units make up 1,103 (48.4%).
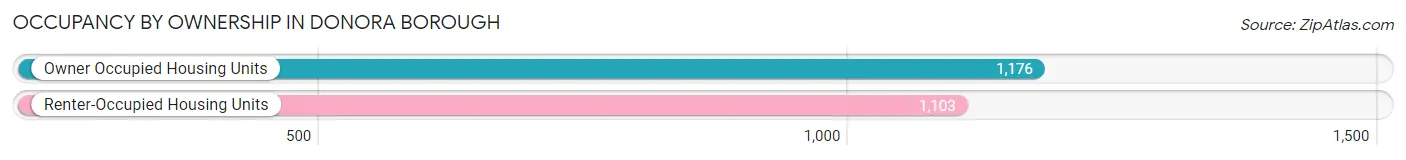
| Occupancy | # Housing Units | % Housing Units |
| Owner Occupied Housing Units | 1,176 | 51.6% |
| Renter-Occupied Housing Units | 1,103 | 48.4% |
| Total Occupied Housing Units | 2,279 | 100.0% |
Occupancy by Household Size in Donora borough
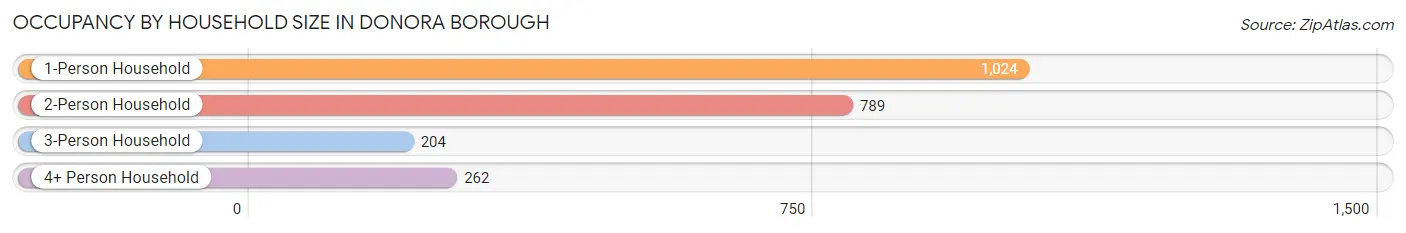
| Household Size | # Housing Units | % Housing Units |
| 1-Person Household | 1,024 | 44.9% |
| 2-Person Household | 789 | 34.6% |
| 3-Person Household | 204 | 8.9% |
| 4+ Person Household | 262 | 11.5% |
| Total Housing Units | 2,279 | 100.0% |
Occupancy by Ownership by Household Size in Donora borough
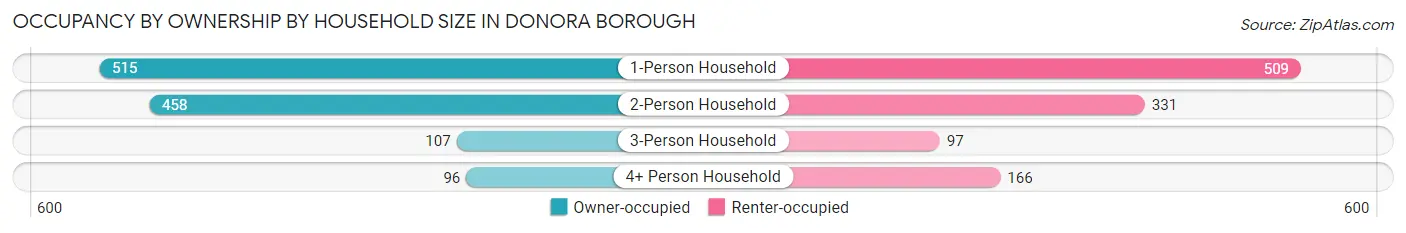
| Household Size | Owner-occupied | Renter-occupied |
| 1-Person Household | 515 (50.3%) | 509 (49.7%) |
| 2-Person Household | 458 (58.1%) | 331 (41.9%) |
| 3-Person Household | 107 (52.4%) | 97 (47.5%) |
| 4+ Person Household | 96 (36.6%) | 166 (63.4%) |
| Total Housing Units | 1,176 (51.6%) | 1,103 (48.4%) |
Occupancy by Educational Attainment in Donora borough
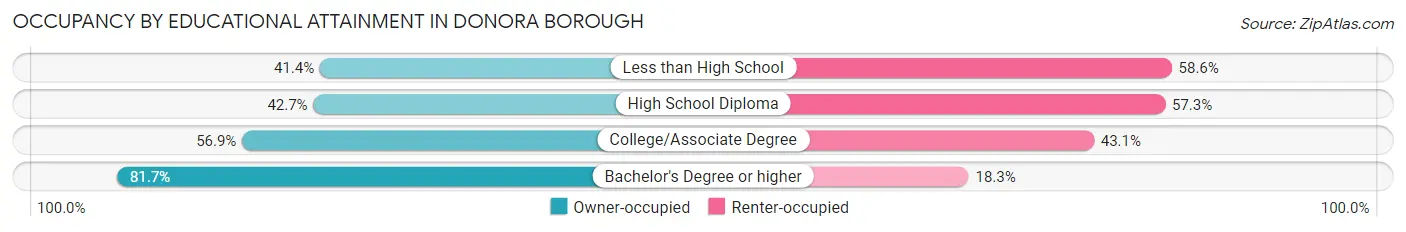
| Household Size | Owner-occupied | Renter-occupied |
| Less than High School | 70 (41.4%) | 99 (58.6%) |
| High School Diploma | 497 (42.7%) | 666 (57.3%) |
| College/Associate Degree | 377 (56.9%) | 286 (43.1%) |
| Bachelor's Degree or higher | 232 (81.7%) | 52 (18.3%) |
Occupancy by Age of Householder in Donora borough
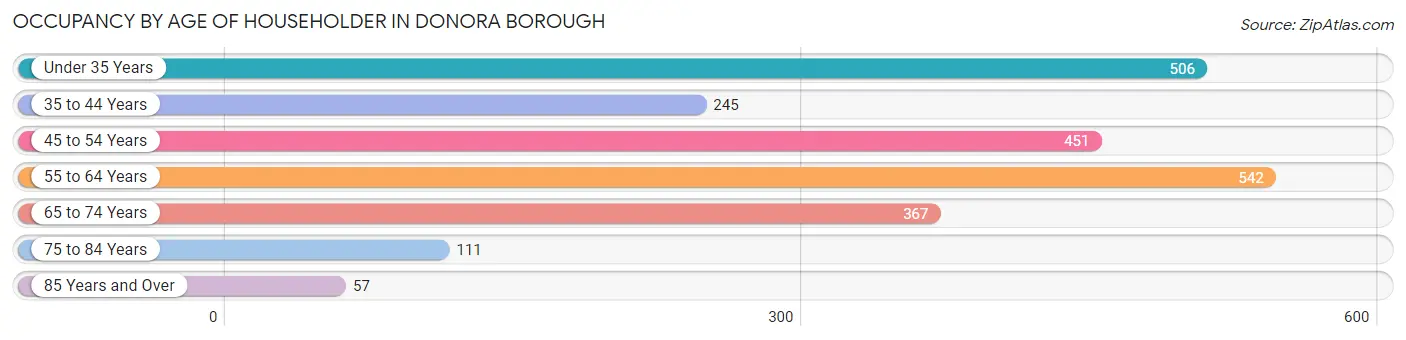
| Age Bracket | # Households | % Households |
| Under 35 Years | 506 | 22.2% |
| 35 to 44 Years | 245 | 10.7% |
| 45 to 54 Years | 451 | 19.8% |
| 55 to 64 Years | 542 | 23.8% |
| 65 to 74 Years | 367 | 16.1% |
| 75 to 84 Years | 111 | 4.9% |
| 85 Years and Over | 57 | 2.5% |
| Total | 2,279 | 100.0% |
Housing Finances in Donora borough
Median Income by Occupancy in Donora borough
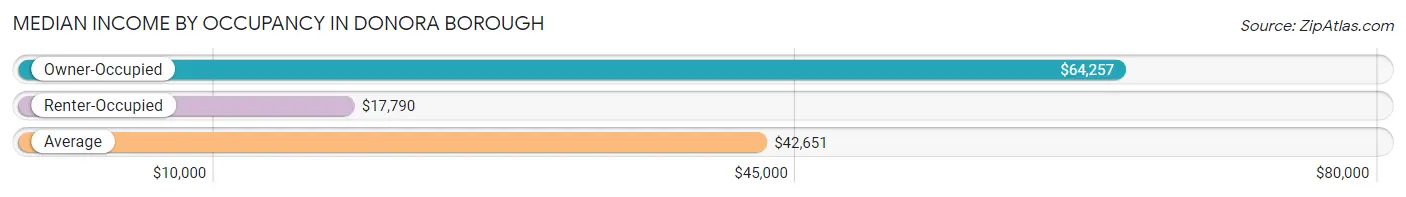
| Occupancy Type | # Households | Median Income |
| Owner-Occupied | 1,176 (51.6%) | $64,257 |
| Renter-Occupied | 1,103 (48.4%) | $17,790 |
| Average | 2,279 (100.0%) | $42,651 |
Occupancy by Householder Income Bracket in Donora borough
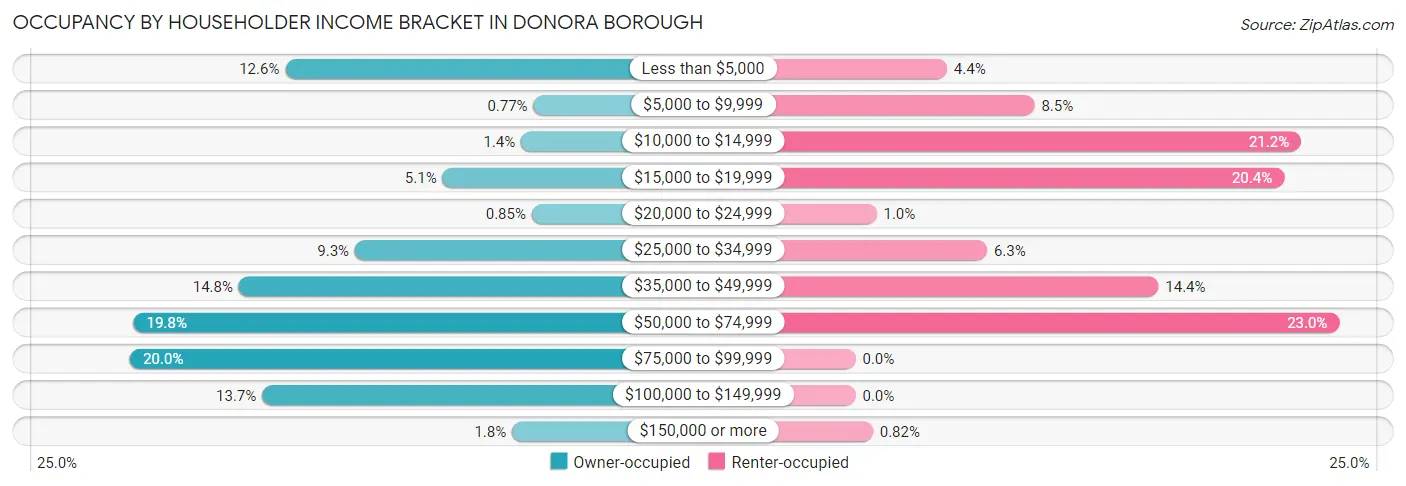
| Income Bracket | Owner-occupied | Renter-occupied |
| Less than $5,000 | 148 (12.6%) | 48 (4.3%) |
| $5,000 to $9,999 | 9 (0.8%) | 94 (8.5%) |
| $10,000 to $14,999 | 16 (1.4%) | 234 (21.2%) |
| $15,000 to $19,999 | 60 (5.1%) | 225 (20.4%) |
| $20,000 to $24,999 | 10 (0.9%) | 11 (1.0%) |
| $25,000 to $34,999 | 109 (9.3%) | 69 (6.3%) |
| $35,000 to $49,999 | 174 (14.8%) | 159 (14.4%) |
| $50,000 to $74,999 | 233 (19.8%) | 254 (23.0%) |
| $75,000 to $99,999 | 235 (20.0%) | 0 (0.0%) |
| $100,000 to $149,999 | 161 (13.7%) | 0 (0.0%) |
| $150,000 or more | 21 (1.8%) | 9 (0.8%) |
| Total | 1,176 (100.0%) | 1,103 (100.0%) |
Monthly Housing Cost Tiers in Donora borough
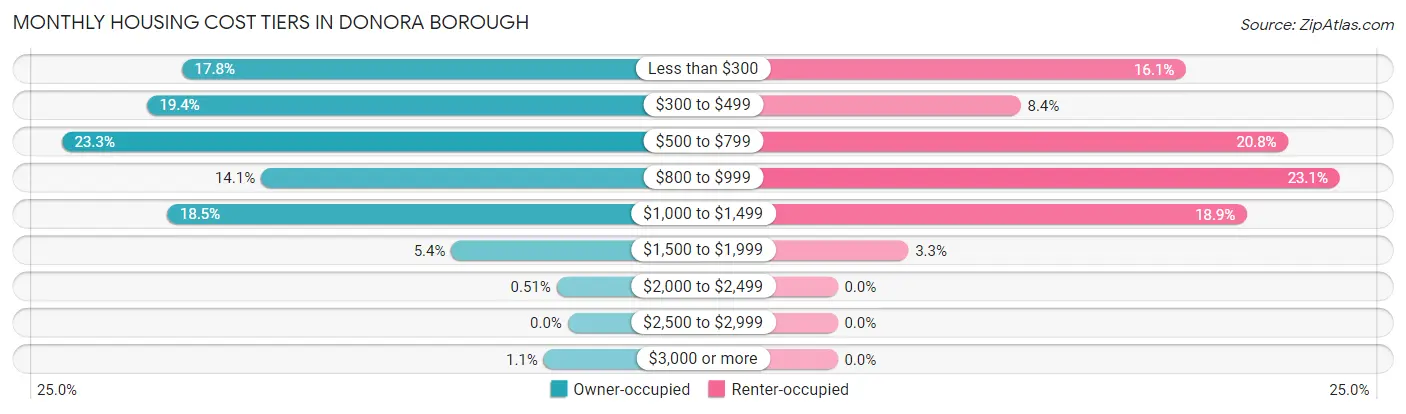
| Monthly Cost | Owner-occupied | Renter-occupied |
| Less than $300 | 209 (17.8%) | 177 (16.1%) |
| $300 to $499 | 228 (19.4%) | 93 (8.4%) |
| $500 to $799 | 274 (23.3%) | 229 (20.8%) |
| $800 to $999 | 166 (14.1%) | 255 (23.1%) |
| $1,000 to $1,499 | 217 (18.4%) | 208 (18.9%) |
| $1,500 to $1,999 | 63 (5.4%) | 36 (3.3%) |
| $2,000 to $2,499 | 6 (0.5%) | 0 (0.0%) |
| $2,500 to $2,999 | 0 (0.0%) | 0 (0.0%) |
| $3,000 or more | 13 (1.1%) | 0 (0.0%) |
| Total | 1,176 (100.0%) | 1,103 (100.0%) |
Physical Housing Characteristics in Donora borough
Housing Structures in Donora borough
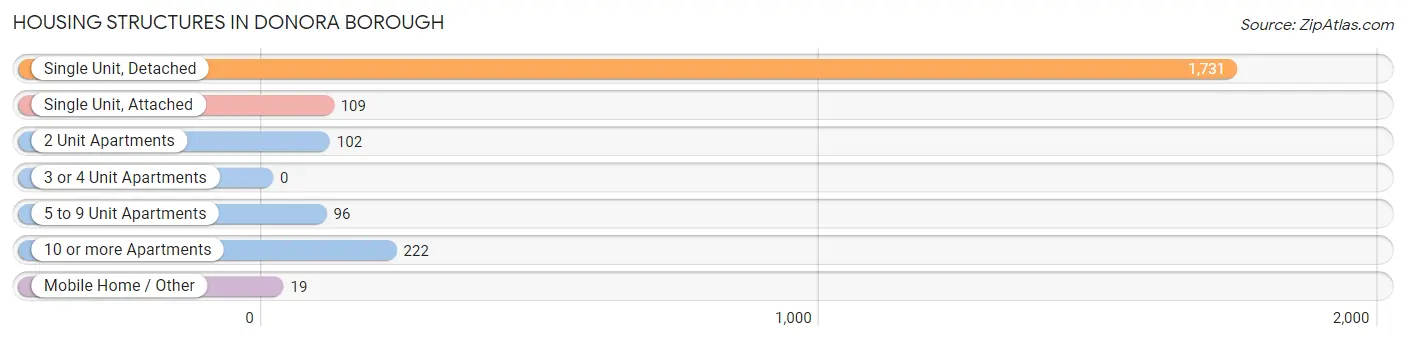
| Structure Type | # Housing Units | % Housing Units |
| Single Unit, Detached | 1,731 | 75.9% |
| Single Unit, Attached | 109 | 4.8% |
| 2 Unit Apartments | 102 | 4.5% |
| 3 or 4 Unit Apartments | 0 | 0.0% |
| 5 to 9 Unit Apartments | 96 | 4.2% |
| 10 or more Apartments | 222 | 9.7% |
| Mobile Home / Other | 19 | 0.8% |
| Total | 2,279 | 100.0% |
Housing Structures by Occupancy in Donora borough
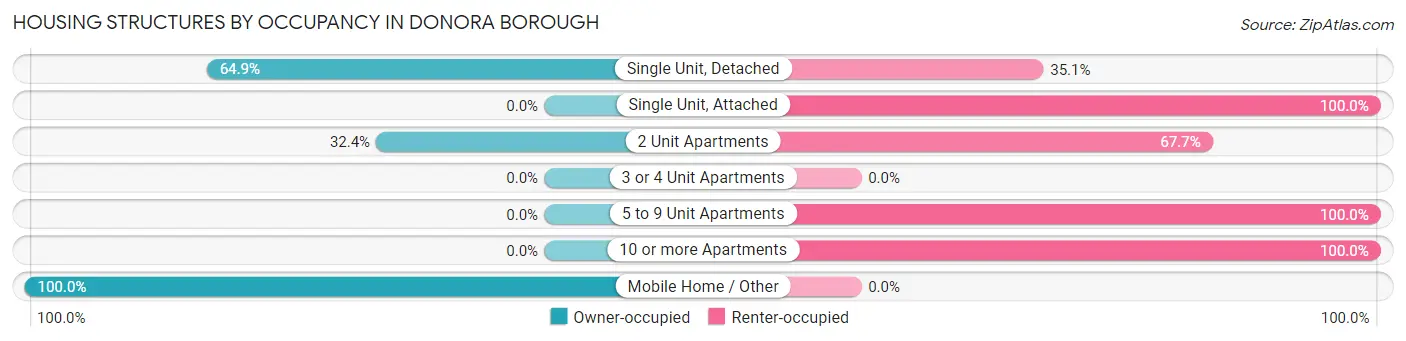
| Structure Type | Owner-occupied | Renter-occupied |
| Single Unit, Detached | 1,124 (64.9%) | 607 (35.1%) |
| Single Unit, Attached | 0 (0.0%) | 109 (100.0%) |
| 2 Unit Apartments | 33 (32.4%) | 69 (67.6%) |
| 3 or 4 Unit Apartments | 0 (0.0%) | 0 (0.0%) |
| 5 to 9 Unit Apartments | 0 (0.0%) | 96 (100.0%) |
| 10 or more Apartments | 0 (0.0%) | 222 (100.0%) |
| Mobile Home / Other | 19 (100.0%) | 0 (0.0%) |
| Total | 1,176 (51.6%) | 1,103 (48.4%) |
Housing Structures by Number of Rooms in Donora borough
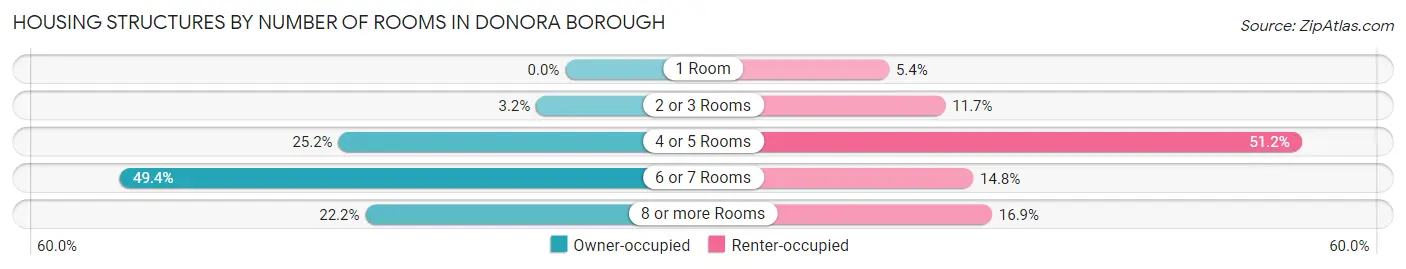
| Number of Rooms | Owner-occupied | Renter-occupied |
| 1 Room | 0 (0.0%) | 60 (5.4%) |
| 2 or 3 Rooms | 38 (3.2%) | 129 (11.7%) |
| 4 or 5 Rooms | 296 (25.2%) | 565 (51.2%) |
| 6 or 7 Rooms | 581 (49.4%) | 163 (14.8%) |
| 8 or more Rooms | 261 (22.2%) | 186 (16.9%) |
| Total | 1,176 (100.0%) | 1,103 (100.0%) |
Housing Structure by Heating Type in Donora borough
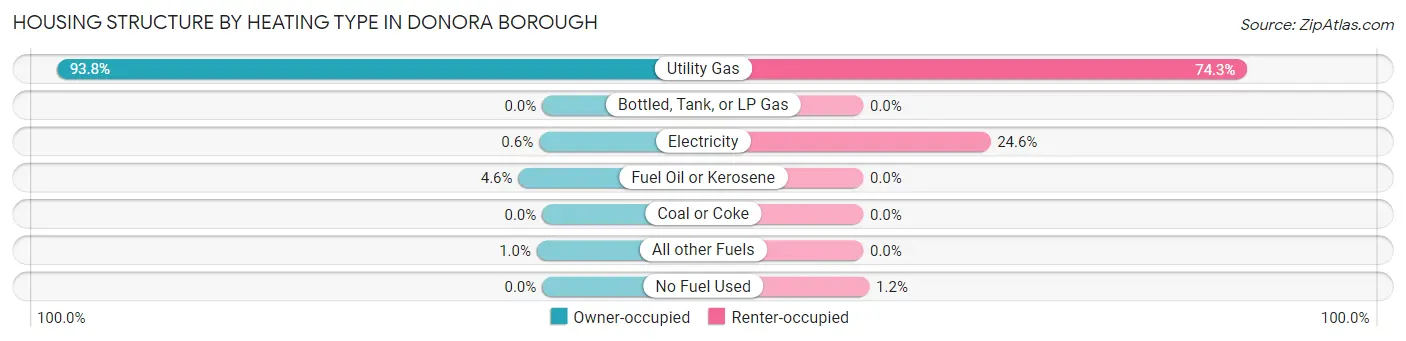
| Heating Type | Owner-occupied | Renter-occupied |
| Utility Gas | 1,103 (93.8%) | 819 (74.3%) |
| Bottled, Tank, or LP Gas | 0 (0.0%) | 0 (0.0%) |
| Electricity | 7 (0.6%) | 271 (24.6%) |
| Fuel Oil or Kerosene | 54 (4.6%) | 0 (0.0%) |
| Coal or Coke | 0 (0.0%) | 0 (0.0%) |
| All other Fuels | 12 (1.0%) | 0 (0.0%) |
| No Fuel Used | 0 (0.0%) | 13 (1.2%) |
| Total | 1,176 (100.0%) | 1,103 (100.0%) |
Household Vehicle Usage in Donora borough
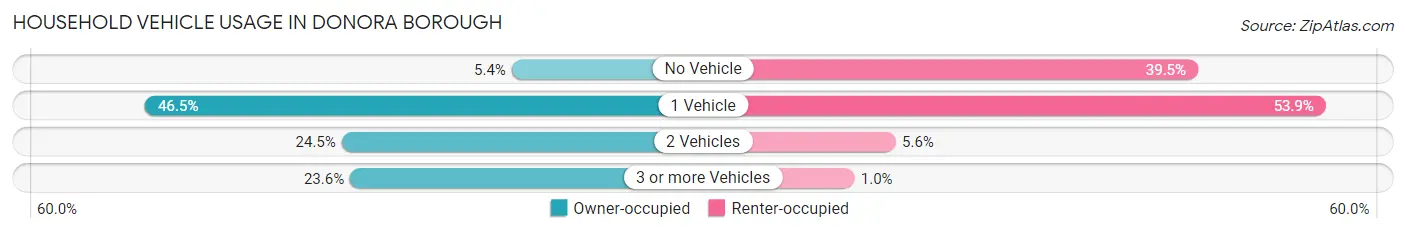
| Vehicles per Household | Owner-occupied | Renter-occupied |
| No Vehicle | 64 (5.4%) | 436 (39.5%) |
| 1 Vehicle | 547 (46.5%) | 594 (53.8%) |
| 2 Vehicles | 288 (24.5%) | 62 (5.6%) |
| 3 or more Vehicles | 277 (23.5%) | 11 (1.0%) |
| Total | 1,176 (100.0%) | 1,103 (100.0%) |
Real Estate & Mortgages in Donora borough
Real Estate and Mortgage Overview in Donora borough
| Characteristic | Without Mortgage | With Mortgage |
| Housing Units | 561 | 615 |
| Median Property Value | $38,500 | $67,500 |
| Median Household Income | $34,141 | $21 |
| Monthly Housing Costs | $363 | $13 |
| Real Estate Taxes | $561 | $10 |
Property Value by Mortgage Status in Donora borough
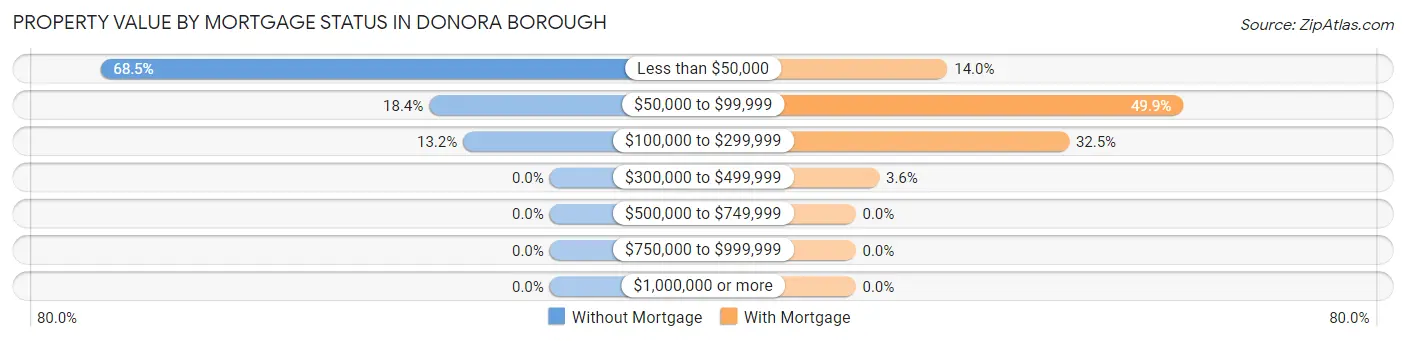
| Property Value | Without Mortgage | With Mortgage |
| Less than $50,000 | 384 (68.4%) | 86 (14.0%) |
| $50,000 to $99,999 | 103 (18.4%) | 307 (49.9%) |
| $100,000 to $299,999 | 74 (13.2%) | 200 (32.5%) |
| $300,000 to $499,999 | 0 (0.0%) | 22 (3.6%) |
| $500,000 to $749,999 | 0 (0.0%) | 0 (0.0%) |
| $750,000 to $999,999 | 0 (0.0%) | 0 (0.0%) |
| $1,000,000 or more | 0 (0.0%) | 0 (0.0%) |
| Total | 561 (100.0%) | 615 (100.0%) |
Household Income by Mortgage Status in Donora borough
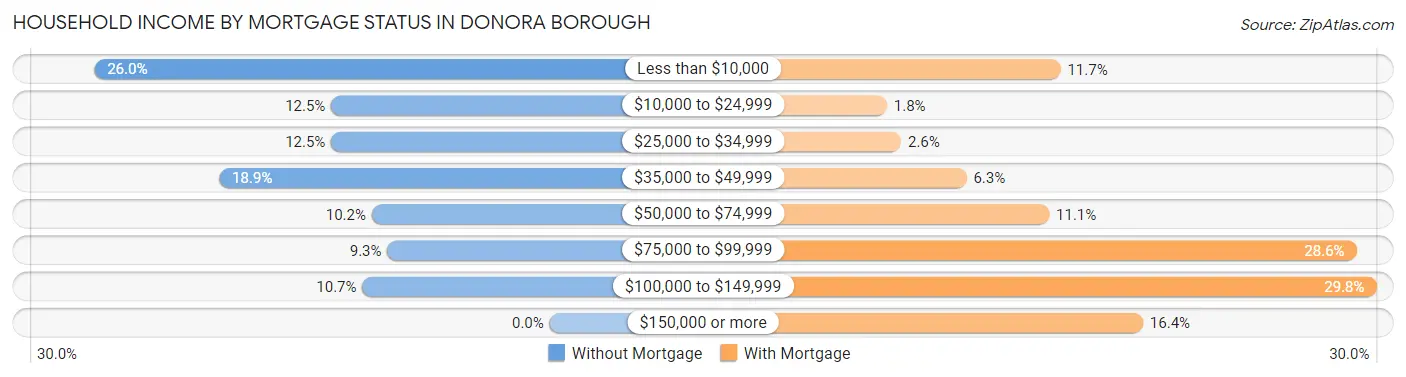
| Household Income | Without Mortgage | With Mortgage |
| Less than $10,000 | 146 (26.0%) | 72 (11.7%) |
| $10,000 to $24,999 | 70 (12.5%) | 11 (1.8%) |
| $25,000 to $34,999 | 70 (12.5%) | 16 (2.6%) |
| $35,000 to $49,999 | 106 (18.9%) | 39 (6.3%) |
| $50,000 to $74,999 | 57 (10.2%) | 68 (11.1%) |
| $75,000 to $99,999 | 52 (9.3%) | 176 (28.6%) |
| $100,000 to $149,999 | 60 (10.7%) | 183 (29.8%) |
| $150,000 or more | 0 (0.0%) | 101 (16.4%) |
| Total | 561 (100.0%) | 615 (100.0%) |
Property Value to Household Income Ratio in Donora borough
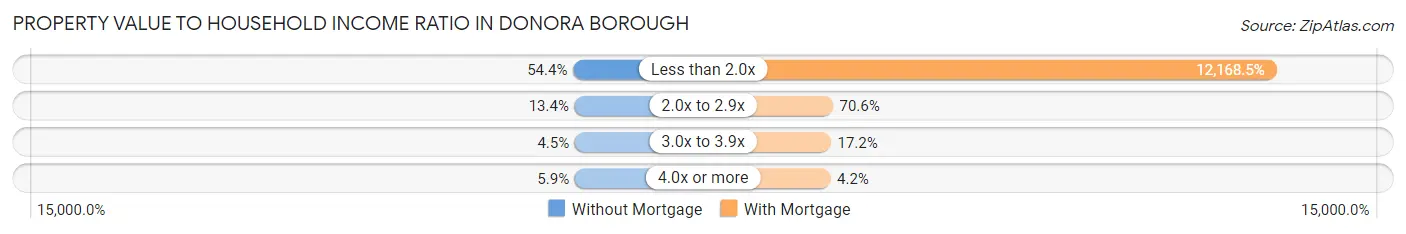
| Value-to-Income Ratio | Without Mortgage | With Mortgage |
| Less than 2.0x | 305 (54.4%) | 74,836 (12,168.5%) |
| 2.0x to 2.9x | 75 (13.4%) | 434 (70.6%) |
| 3.0x to 3.9x | 25 (4.5%) | 106 (17.2%) |
| 4.0x or more | 33 (5.9%) | 26 (4.2%) |
| Total | 561 (100.0%) | 615 (100.0%) |
Real Estate Taxes by Mortgage Status in Donora borough
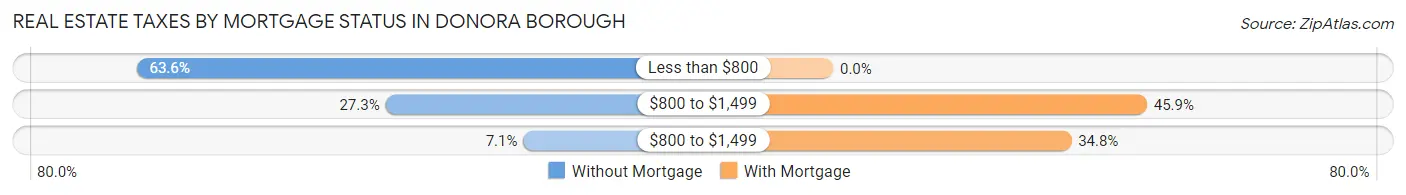
| Property Taxes | Without Mortgage | With Mortgage |
| Less than $800 | 357 (63.6%) | 0 (0.0%) |
| $800 to $1,499 | 153 (27.3%) | 282 (45.9%) |
| $800 to $1,499 | 40 (7.1%) | 214 (34.8%) |
| Total | 561 (100.0%) | 615 (100.0%) |
Health & Disability in Donora borough
Health Insurance Coverage by Age in Donora borough
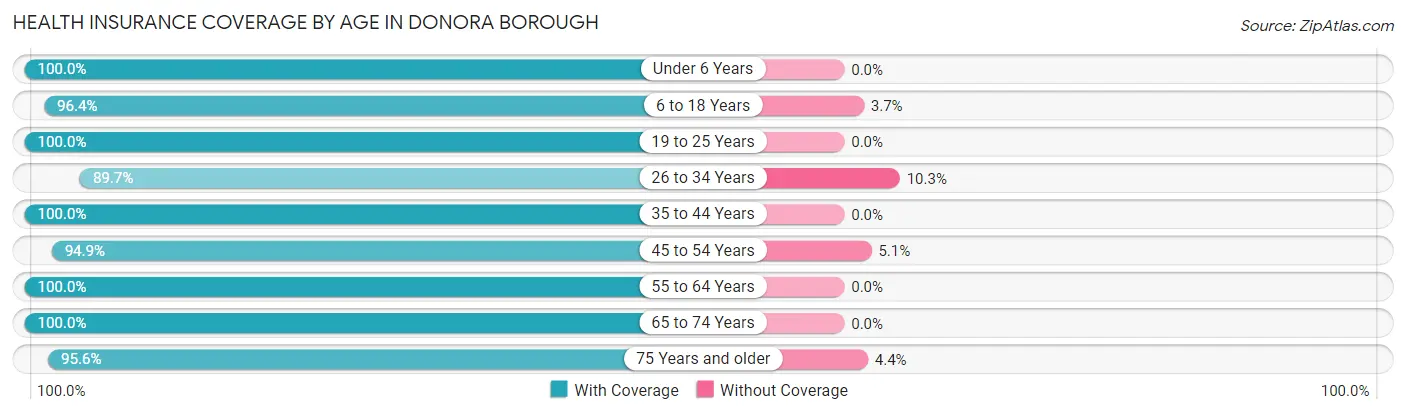
| Age Bracket | With Coverage | Without Coverage |
| Under 6 Years | 203 (100.0%) | 0 (0.0%) |
| 6 to 18 Years | 819 (96.4%) | 31 (3.6%) |
| 19 to 25 Years | 133 (100.0%) | 0 (0.0%) |
| 26 to 34 Years | 694 (89.7%) | 80 (10.3%) |
| 35 to 44 Years | 256 (100.0%) | 0 (0.0%) |
| 45 to 54 Years | 713 (94.9%) | 38 (5.1%) |
| 55 to 64 Years | 797 (100.0%) | 0 (0.0%) |
| 65 to 74 Years | 496 (100.0%) | 0 (0.0%) |
| 75 Years and older | 218 (95.6%) | 10 (4.4%) |
| Total | 4,329 (96.5%) | 159 (3.5%) |
Health Insurance Coverage by Citizenship Status in Donora borough
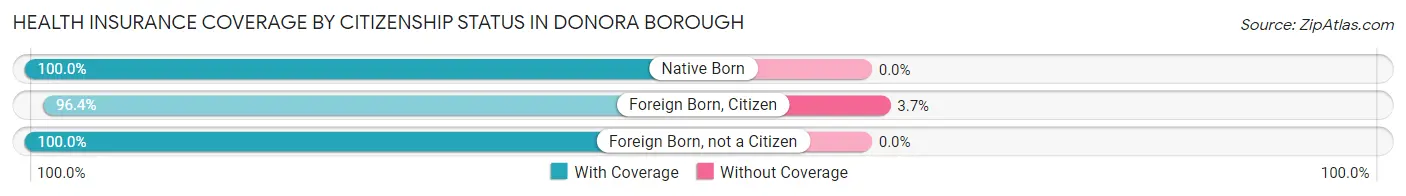
| Citizenship Status | With Coverage | Without Coverage |
| Native Born | 203 (100.0%) | 0 (0.0%) |
| Foreign Born, Citizen | 819 (96.4%) | 31 (3.6%) |
| Foreign Born, not a Citizen | 133 (100.0%) | 0 (0.0%) |
Health Insurance Coverage by Household Income in Donora borough
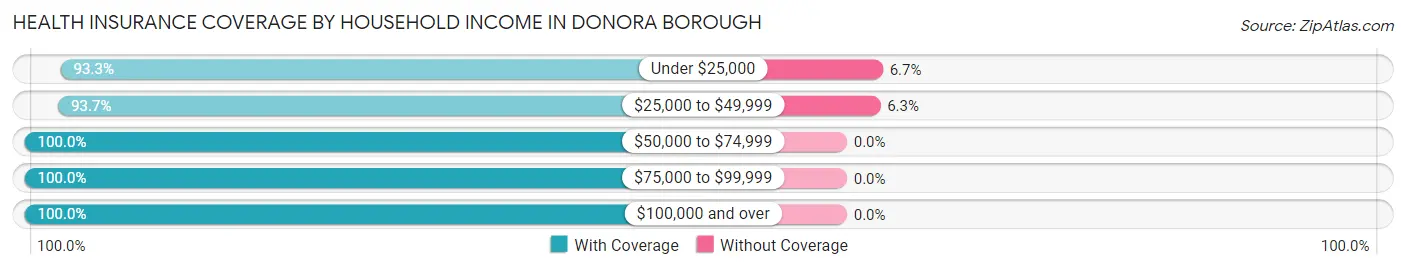
| Household Income | With Coverage | Without Coverage |
| Under $25,000 | 1,289 (93.3%) | 93 (6.7%) |
| $25,000 to $49,999 | 988 (93.7%) | 66 (6.3%) |
| $50,000 to $74,999 | 1,156 (100.0%) | 0 (0.0%) |
| $75,000 to $99,999 | 448 (100.0%) | 0 (0.0%) |
| $100,000 and over | 438 (100.0%) | 0 (0.0%) |
Public vs Private Health Insurance Coverage by Age in Donora borough
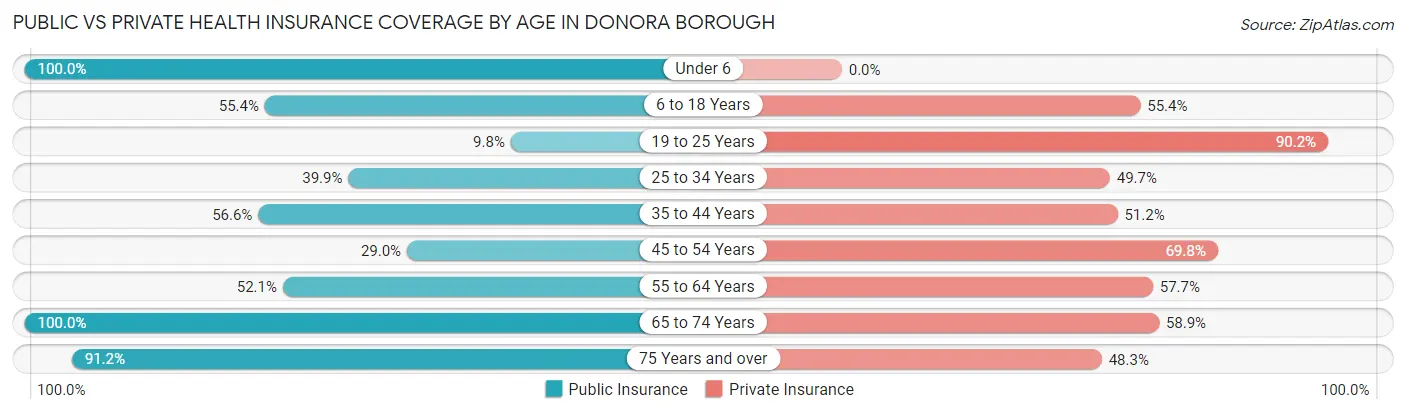
| Age Bracket | Public Insurance | Private Insurance |
| Under 6 | 203 (100.0%) | 0 (0.0%) |
| 6 to 18 Years | 471 (55.4%) | 471 (55.4%) |
| 19 to 25 Years | 13 (9.8%) | 120 (90.2%) |
| 25 to 34 Years | 309 (39.9%) | 385 (49.7%) |
| 35 to 44 Years | 145 (56.6%) | 131 (51.2%) |
| 45 to 54 Years | 218 (29.0%) | 524 (69.8%) |
| 55 to 64 Years | 415 (52.1%) | 460 (57.7%) |
| 65 to 74 Years | 496 (100.0%) | 292 (58.9%) |
| 75 Years and over | 208 (91.2%) | 110 (48.2%) |
| Total | 2,478 (55.2%) | 2,493 (55.5%) |
Disability Status by Sex by Age in Donora borough
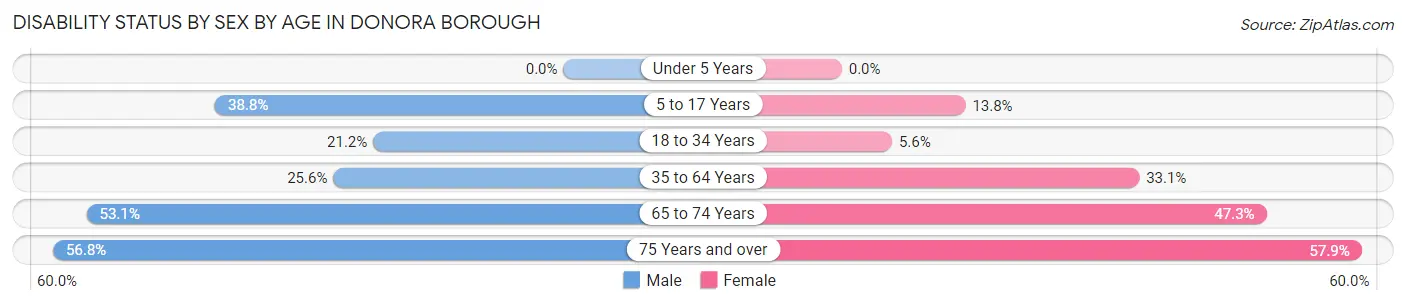
| Age Bracket | Male | Female |
| Under 5 Years | 0 (0.0%) | 0 (0.0%) |
| 5 to 17 Years | 190 (38.8%) | 53 (13.8%) |
| 18 to 34 Years | 103 (21.2%) | 25 (5.6%) |
| 35 to 64 Years | 224 (25.6%) | 308 (33.1%) |
| 65 to 74 Years | 77 (53.1%) | 166 (47.3%) |
| 75 Years and over | 54 (56.8%) | 77 (57.9%) |
Disability Class by Sex by Age in Donora borough
Disability Class: Hearing Difficulty
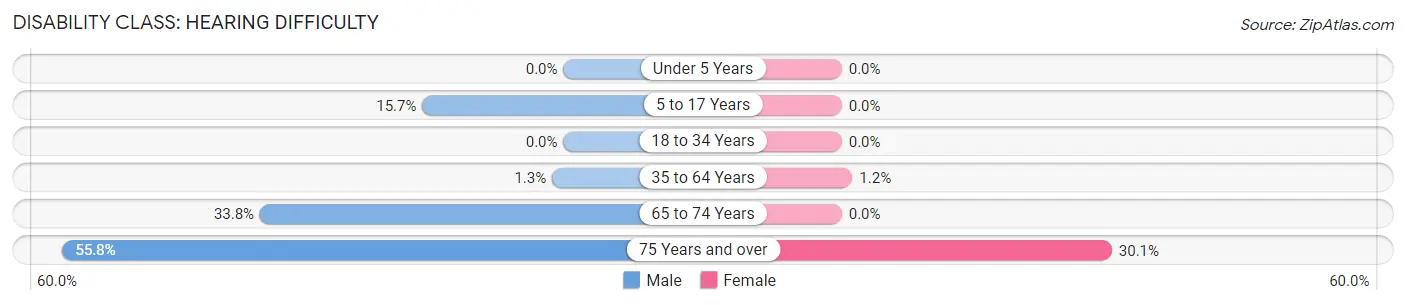
| Age Bracket | Male | Female |
| Under 5 Years | 0 (0.0%) | 0 (0.0%) |
| 5 to 17 Years | 77 (15.7%) | 0 (0.0%) |
| 18 to 34 Years | 0 (0.0%) | 0 (0.0%) |
| 35 to 64 Years | 11 (1.3%) | 11 (1.2%) |
| 65 to 74 Years | 49 (33.8%) | 0 (0.0%) |
| 75 Years and over | 53 (55.8%) | 40 (30.1%) |
Disability Class: Vision Difficulty
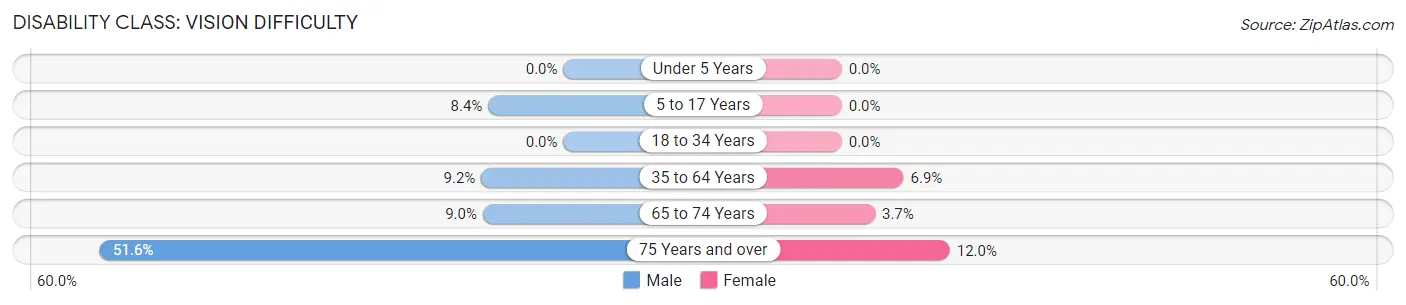
| Age Bracket | Male | Female |
| Under 5 Years | 0 (0.0%) | 0 (0.0%) |
| 5 to 17 Years | 41 (8.4%) | 0 (0.0%) |
| 18 to 34 Years | 0 (0.0%) | 0 (0.0%) |
| 35 to 64 Years | 80 (9.1%) | 64 (6.9%) |
| 65 to 74 Years | 13 (9.0%) | 13 (3.7%) |
| 75 Years and over | 49 (51.6%) | 16 (12.0%) |
Disability Class: Cognitive Difficulty
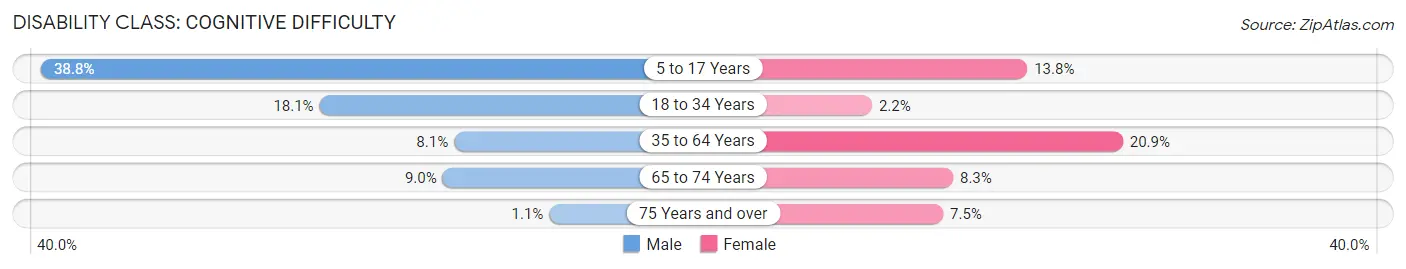
| Age Bracket | Male | Female |
| 5 to 17 Years | 190 (38.8%) | 53 (13.8%) |
| 18 to 34 Years | 88 (18.1%) | 10 (2.2%) |
| 35 to 64 Years | 71 (8.1%) | 194 (20.9%) |
| 65 to 74 Years | 13 (9.0%) | 29 (8.3%) |
| 75 Years and over | 1 (1.1%) | 10 (7.5%) |
Disability Class: Ambulatory Difficulty
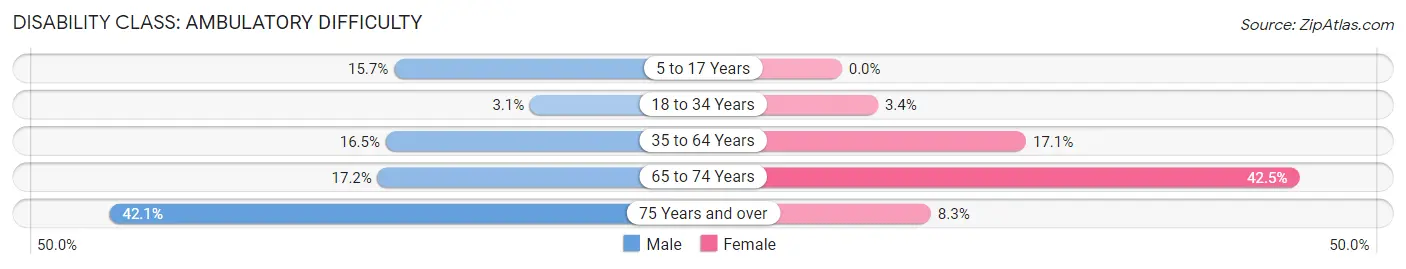
| Age Bracket | Male | Female |
| 5 to 17 Years | 77 (15.7%) | 0 (0.0%) |
| 18 to 34 Years | 15 (3.1%) | 15 (3.4%) |
| 35 to 64 Years | 144 (16.5%) | 159 (17.1%) |
| 65 to 74 Years | 25 (17.2%) | 149 (42.4%) |
| 75 Years and over | 40 (42.1%) | 11 (8.3%) |
Disability Class: Self-Care Difficulty
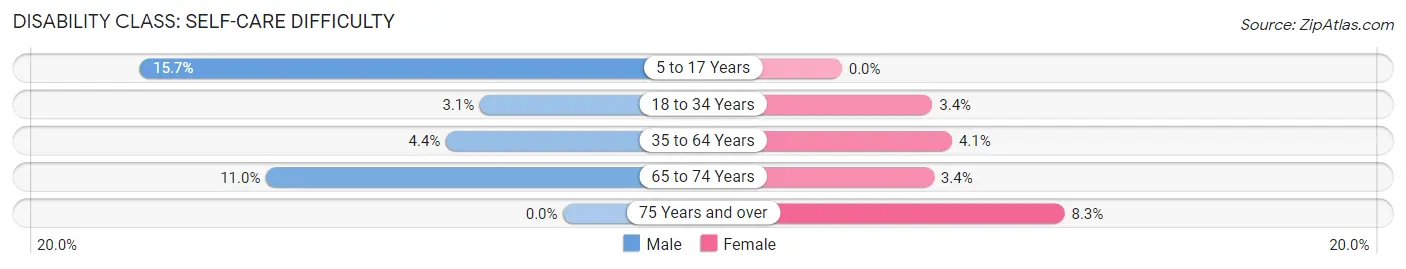
| Age Bracket | Male | Female |
| 5 to 17 Years | 77 (15.7%) | 0 (0.0%) |
| 18 to 34 Years | 15 (3.1%) | 15 (3.4%) |
| 35 to 64 Years | 38 (4.3%) | 38 (4.1%) |
| 65 to 74 Years | 16 (11.0%) | 12 (3.4%) |
| 75 Years and over | 0 (0.0%) | 11 (8.3%) |
Technology Access in Donora borough
Computing Device Access in Donora borough
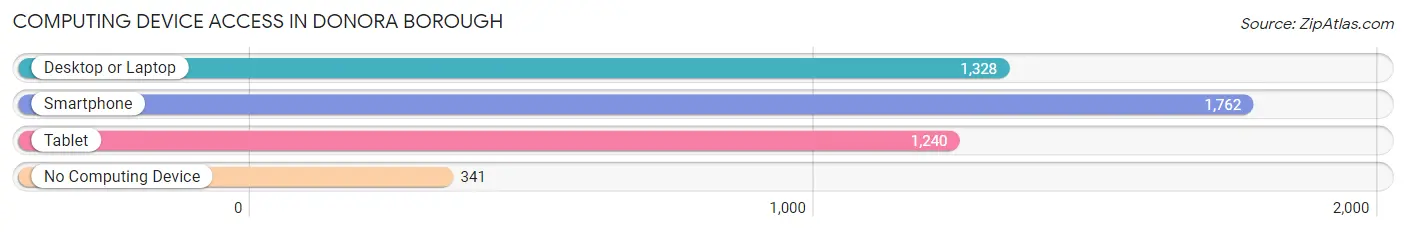
| Device Type | # Households | % Households |
| Desktop or Laptop | 1,328 | 58.3% |
| Smartphone | 1,762 | 77.3% |
| Tablet | 1,240 | 54.4% |
| No Computing Device | 341 | 15.0% |
| Total | 2,279 | 100.0% |
Internet Access in Donora borough
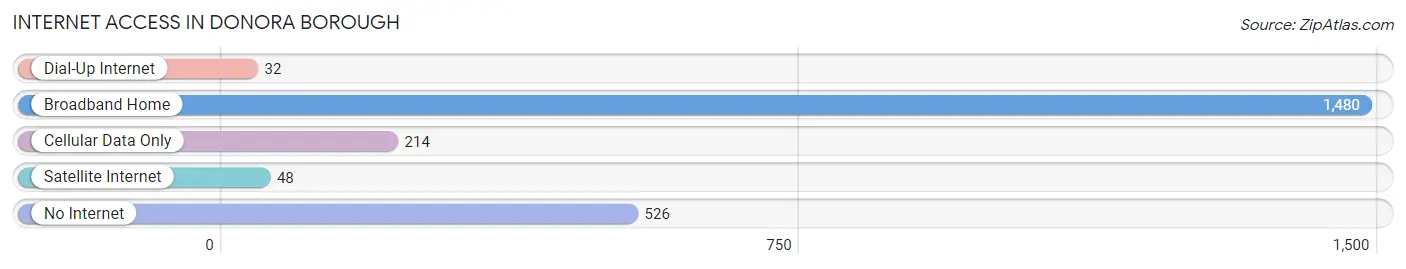
| Internet Type | # Households | % Households |
| Dial-Up Internet | 32 | 1.4% |
| Broadband Home | 1,480 | 64.9% |
| Cellular Data Only | 214 | 9.4% |
| Satellite Internet | 48 | 2.1% |
| No Internet | 526 | 23.1% |
| Total | 2,279 | 100.0% |
Donora borough Summary
Donora Borough is a small borough located in Washington County, Pennsylvania. It is situated along the Monongahela River, approximately 20 miles south of Pittsburgh. The borough was founded in 1901 and has a population of approximately 5,000 people.
History
Donora Borough was founded in 1901 by industrialist Henry Clay Frick. Frick had purchased the land from the Donora Land Company and named the borough after his wife, Donna. The borough was originally intended to be a model industrial town, and Frick built a steel mill, a zinc smelter, and a wire mill. The steel mill was the largest in the world at the time, and it employed thousands of people.
The borough quickly grew and became a major industrial center. The steel mill and other industries provided jobs for many of the residents, and the population grew to over 10,000 by the 1920s. The borough was also home to a number of other businesses, including a glass factory, a brickyard, and a coal mine.
In 1948, a major smog event occurred in Donora, caused by the steel mill and other industrial plants. The smog was so thick that it caused the deaths of 20 people and made hundreds of others ill. The event led to the passage of the Clean Air Act of 1963, which set standards for air pollution.
Geography
Donora Borough is located in Washington County, Pennsylvania. It is situated along the Monongahela River, approximately 20 miles south of Pittsburgh. The borough covers an area of 1.3 square miles and is bordered by the boroughs of Monongahela and Charleroi.
The terrain of Donora Borough is mostly flat, with some hills in the northern part of the borough. The borough is located in the Appalachian Plateau region of Pennsylvania, and the climate is humid continental.
Economy
Donora Borough’s economy is largely based on manufacturing. The steel mill, which was founded by Henry Clay Frick in 1901, is still in operation and is the borough’s largest employer. Other major employers include a glass factory, a brickyard, and a coal mine.
The borough also has a number of small businesses, including restaurants, shops, and other services. The borough is home to a number of parks and recreational facilities, including a golf course, a swimming pool, and a skate park.
Demographics
As of the 2010 census, Donora Borough had a population of 5,000 people. The racial makeup of the borough was 95.2% White, 2.2% African American, 0.4% Native American, 0.4% Asian, and 1.8% from other races. The median household income was $30,000, and the median age was 40.
The borough is home to a number of churches, including the First Presbyterian Church, the First United Methodist Church, and the St. John the Baptist Catholic Church. The borough also has a public library and a number of schools, including Donora Elementary School and Donora High School.
Common Questions
What is the Total Population of Donora borough?
Total Population of Donora borough is 4,561.
What is the Total Male Population of Donora borough?
Total Male Population of Donora borough is 2,220.
What is the Total Female Population of Donora borough?
Total Female Population of Donora borough is 2,341.
What is the Ratio of Males per 100 Females in Donora borough?
There are 94.83 Males per 100 Females in Donora borough.
What is the Ratio of Females per 100 Males in Donora borough?
There are 105.45 Females per 100 Males in Donora borough.
What is the Median Population Age in Donora borough?
Median Population Age in Donora borough is 46.8 Years.
What is the Average Family Size in Donora borough
Average Family Size in Donora borough is 2.6 People.
What is the Average Household Size in Donora borough
Average Household Size in Donora borough is 2.0 People.
What is Per Capita Income in Donora borough?
Per Capita income in Donora borough is $24,209.
What is the Median Family Income in Donora borough?
Median Family Income in Donora borough is $63,203.
What is the Median Household income in Donora borough?
Median Household Income in Donora borough is $42,651.
What is Income or Wage Gap in Donora borough?
Income or Wage Gap in Donora borough is 27.2%.
Women in Donora borough earn 72.8 cents for every dollar earned by a man.
What is Inequality or Gini Index in Donora borough?
Inequality or Gini Index in Donora borough is 0.46.
How Large is the Labor Force in Donora borough?
There are 2,199 People in the Labor Forcein in Donora borough.
What is the Percentage of People in the Labor Force in Donora borough?
60.5% of People are in the Labor Force in Donora borough.
What is the Unemployment Rate in Donora borough?
Unemployment Rate in Donora borough is 12.7%.