Zip Codes with the Highest Poverty Level Among Children Under the Age of 5 in Pennsylvania
RELATED REPORTS & OPTIONS
Highest Poverty | Child 0-5
Pennsylvania
Compare Zip Codes
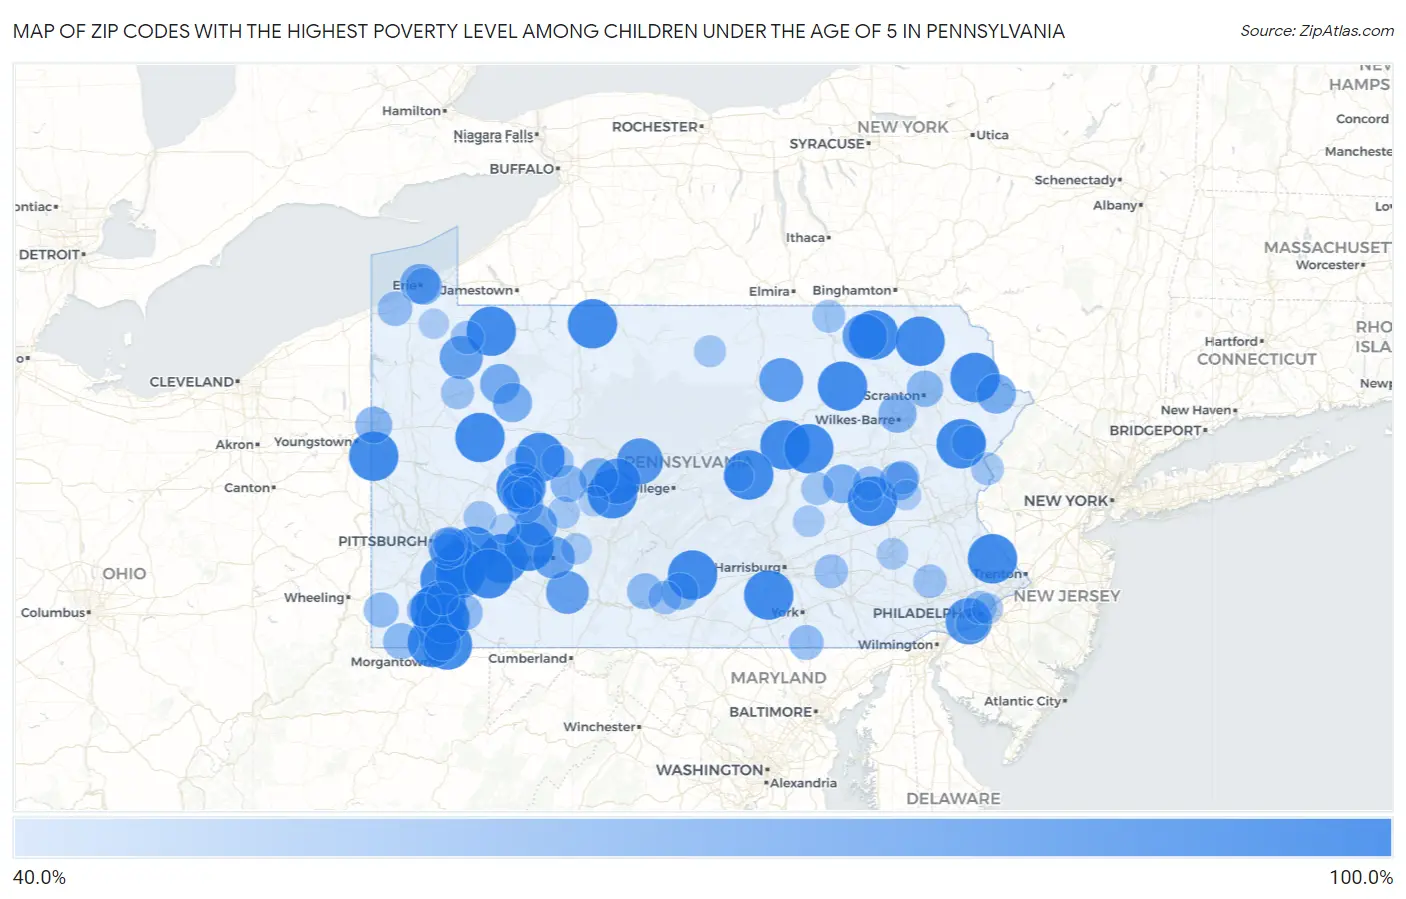
Map of Zip Codes with the Highest Poverty Level Among Children Under the Age of 5 in Pennsylvania
0.0%
100.0%
Zip Codes with the Highest Poverty Level Among Children Under the Age of 5 in Pennsylvania
| Zip Code | Child Poverty | vs State | vs National | |
| 1. | 15033 | 100.0% | 17.3%(+82.7)#1 | 18.1%(+81.9)#7 |
| 2. | 18370 | 100.0% | 17.3%(+82.7)#2 | 18.1%(+81.9)#87 |
| 3. | 15661 | 100.0% | 17.3%(+82.7)#3 | 18.1%(+81.9)#89 |
| 4. | 15351 | 100.0% | 17.3%(+82.7)#4 | 18.1%(+81.9)#98 |
| 5. | 15444 | 100.0% | 17.3%(+82.7)#5 | 18.1%(+81.9)#114 |
| 6. | 15451 | 100.0% | 17.3%(+82.7)#6 | 18.1%(+81.9)#127 |
| 7. | 17887 | 100.0% | 17.3%(+82.7)#7 | 18.1%(+81.9)#131 |
| 8. | 15315 | 100.0% | 17.3%(+82.7)#8 | 18.1%(+81.9)#135 |
| 9. | 15623 | 100.0% | 17.3%(+82.7)#9 | 18.1%(+81.9)#149 |
| 10. | 15433 | 100.0% | 17.3%(+82.7)#10 | 18.1%(+81.9)#158 |
| 11. | 15949 | 100.0% | 17.3%(+82.7)#11 | 18.1%(+81.9)#165 |
| 12. | 15678 | 100.0% | 17.3%(+82.7)#12 | 18.1%(+81.9)#223 |
| 13. | 17219 | 100.0% | 17.3%(+82.7)#13 | 18.1%(+81.9)#229 |
| 14. | 15640 | 100.0% | 17.3%(+82.7)#14 | 18.1%(+81.9)#230 |
| 15. | 18632 | 100.0% | 17.3%(+82.7)#15 | 18.1%(+81.9)#245 |
| 16. | 18473 | 100.0% | 17.3%(+82.7)#16 | 18.1%(+81.9)#271 |
| 17. | 16680 | 100.0% | 17.3%(+82.7)#17 | 18.1%(+81.9)#304 |
| 18. | 16132 | 100.0% | 17.3%(+82.7)#18 | 18.1%(+81.9)#308 |
| 19. | 15443 | 100.0% | 17.3%(+82.7)#19 | 18.1%(+81.9)#337 |
| 20. | 17930 | 100.0% | 17.3%(+82.7)#20 | 18.1%(+81.9)#356 |
| 21. | 16744 | 100.0% | 17.3%(+82.7)#21 | 18.1%(+81.9)#391 |
| 22. | 17884 | 100.0% | 17.3%(+82.7)#22 | 18.1%(+81.9)#392 |
| 23. | 18828 | 100.0% | 17.3%(+82.7)#23 | 18.1%(+81.9)#397 |
| 24. | 18912 | 100.0% | 17.3%(+82.7)#24 | 18.1%(+81.9)#434 |
| 25. | 17835 | 100.0% | 17.3%(+82.7)#25 | 18.1%(+81.9)#452 |
| 26. | 15764 | 100.0% | 17.3%(+82.7)#26 | 18.1%(+81.9)#459 |
| 27. | 16213 | 100.0% | 17.3%(+82.7)#27 | 18.1%(+81.9)#464 |
| 28. | 16416 | 100.0% | 17.3%(+82.7)#28 | 18.1%(+81.9)#479 |
| 29. | 18823 | 100.0% | 17.3%(+82.7)#29 | 18.1%(+81.9)#508 |
| 30. | 16211 | 100.0% | 17.3%(+82.7)#30 | 18.1%(+81.9)#518 |
| 31. | 17323 | 100.0% | 17.3%(+82.7)#31 | 18.1%(+81.9)#522 |
| 32. | 15689 | 100.0% | 17.3%(+82.7)#32 | 18.1%(+81.9)#527 |
| 33. | 19079 | 92.0% | 17.3%(+74.7)#33 | 18.1%(+73.9)#617 |
| 34. | 16879 | 90.9% | 17.3%(+73.6)#34 | 18.1%(+72.8)#627 |
| 35. | 16620 | 90.0% | 17.3%(+72.7)#35 | 18.1%(+71.9)#639 |
| 36. | 18845 | 87.5% | 17.3%(+70.2)#36 | 18.1%(+69.4)#664 |
| 37. | 17763 | 85.7% | 17.3%(+68.5)#37 | 18.1%(+67.7)#693 |
| 38. | 16328 | 83.3% | 17.3%(+66.1)#38 | 18.1%(+65.3)#746 |
| 39. | 15924 | 82.6% | 17.3%(+65.3)#39 | 18.1%(+64.5)#754 |
| 40. | 15901 | 80.9% | 17.3%(+63.6)#40 | 18.1%(+62.8)#793 |
| 41. | 15720 | 80.0% | 17.3%(+62.7)#41 | 18.1%(+61.9)#819 |
| 42. | 16246 | 80.0% | 17.3%(+62.7)#42 | 18.1%(+61.9)#825 |
| 43. | 16353 | 74.6% | 17.3%(+57.4)#43 | 18.1%(+56.6)#980 |
| 44. | 16507 | 74.6% | 17.3%(+57.3)#44 | 18.1%(+56.5)#982 |
| 45. | 18425 | 74.1% | 17.3%(+56.9)#45 | 18.1%(+56.1)#1,002 |
| 46. | 16233 | 73.2% | 17.3%(+55.9)#46 | 18.1%(+55.1)#1,044 |
| 47. | 17888 | 72.0% | 17.3%(+54.7)#47 | 18.1%(+53.9)#1,086 |
| 48. | 16861 | 71.4% | 17.3%(+54.2)#48 | 18.1%(+53.4)#1,101 |
| 49. | 18232 | 70.9% | 17.3%(+53.7)#49 | 18.1%(+52.9)#1,114 |
| 50. | 18709 | 70.2% | 17.3%(+52.9)#50 | 18.1%(+52.1)#1,140 |
| 51. | 15148 | 69.5% | 17.3%(+52.2)#51 | 18.1%(+51.4)#1,173 |
| 52. | 17271 | 67.6% | 17.3%(+50.3)#52 | 18.1%(+49.5)#1,252 |
| 53. | 16503 | 67.4% | 17.3%(+50.1)#53 | 18.1%(+49.3)#1,261 |
| 54. | 16121 | 67.2% | 17.3%(+49.9)#54 | 18.1%(+49.1)#1,266 |
| 55. | 15104 | 66.7% | 17.3%(+49.4)#55 | 18.1%(+48.6)#1,277 |
| 56. | 15474 | 66.7% | 17.3%(+49.4)#56 | 18.1%(+48.6)#1,279 |
| 57. | 15739 | 66.7% | 17.3%(+49.4)#57 | 18.1%(+48.6)#1,298 |
| 58. | 15721 | 66.7% | 17.3%(+49.4)#58 | 18.1%(+48.6)#1,312 |
| 59. | 18508 | 65.7% | 17.3%(+48.4)#59 | 18.1%(+47.6)#1,357 |
| 60. | 15316 | 65.0% | 17.3%(+47.7)#60 | 18.1%(+46.9)#1,382 |
| 61. | 15110 | 64.5% | 17.3%(+47.2)#61 | 18.1%(+46.4)#1,411 |
| 62. | 16689 | 64.3% | 17.3%(+47.0)#62 | 18.1%(+46.2)#1,430 |
| 63. | 15489 | 63.3% | 17.3%(+46.1)#63 | 18.1%(+45.3)#1,484 |
| 64. | 15377 | 61.9% | 17.3%(+44.6)#64 | 18.1%(+43.8)#1,564 |
| 65. | 17355 | 61.5% | 17.3%(+44.3)#65 | 18.1%(+43.5)#1,596 |
| 66. | 17948 | 60.8% | 17.3%(+43.5)#66 | 18.1%(+42.7)#1,636 |
| 67. | 16417 | 60.7% | 17.3%(+43.5)#67 | 18.1%(+42.7)#1,638 |
| 68. | 18332 | 60.0% | 17.3%(+42.7)#68 | 18.1%(+41.9)#1,672 |
| 69. | 16250 | 60.0% | 17.3%(+42.7)#69 | 18.1%(+41.9)#1,698 |
| 70. | 15145 | 59.3% | 17.3%(+42.0)#70 | 18.1%(+41.2)#1,745 |
| 71. | 15322 | 59.0% | 17.3%(+41.8)#71 | 18.1%(+41.0)#1,766 |
| 72. | 18240 | 59.0% | 17.3%(+41.7)#72 | 18.1%(+40.9)#1,772 |
| 73. | 17223 | 58.8% | 17.3%(+41.6)#73 | 18.1%(+40.8)#1,782 |
| 74. | 17064 | 58.6% | 17.3%(+41.3)#74 | 18.1%(+40.5)#1,790 |
| 75. | 16434 | 58.3% | 17.3%(+41.1)#75 | 18.1%(+40.3)#1,805 |
| 76. | 19153 | 58.2% | 17.3%(+40.9)#76 | 18.1%(+40.1)#1,814 |
| 77. | 19475 | 58.0% | 17.3%(+40.8)#77 | 18.1%(+40.0)#1,826 |
| 78. | 16343 | 57.8% | 17.3%(+40.5)#78 | 18.1%(+39.7)#1,846 |
| 79. | 19132 | 57.5% | 17.3%(+40.2)#79 | 18.1%(+39.4)#1,866 |
| 80. | 15419 | 57.3% | 17.3%(+40.1)#80 | 18.1%(+39.3)#1,874 |
| 81. | 18810 | 57.0% | 17.3%(+39.8)#81 | 18.1%(+39.0)#1,904 |
| 82. | 18351 | 56.5% | 17.3%(+39.3)#82 | 18.1%(+38.5)#1,945 |
| 83. | 15629 | 56.4% | 17.3%(+39.1)#83 | 18.1%(+38.3)#1,958 |
| 84. | 17872 | 56.3% | 17.3%(+39.1)#84 | 18.1%(+38.3)#1,963 |
| 85. | 15732 | 56.0% | 17.3%(+38.7)#85 | 18.1%(+37.9)#1,988 |
| 86. | 15715 | 55.6% | 17.3%(+38.3)#86 | 18.1%(+37.5)#2,037 |
| 87. | 15714 | 54.9% | 17.3%(+37.7)#87 | 18.1%(+36.9)#2,074 |
| 88. | 16921 | 54.2% | 17.3%(+36.9)#88 | 18.1%(+36.1)#2,126 |
| 89. | 19601 | 53.5% | 17.3%(+36.2)#89 | 18.1%(+35.4)#2,195 |
| 90. | 17097 | 53.4% | 17.3%(+36.2)#90 | 18.1%(+35.4)#2,197 |
| 91. | 15962 | 52.9% | 17.3%(+35.7)#91 | 18.1%(+34.9)#2,253 |
| 92. | 19134 | 52.6% | 17.3%(+35.3)#92 | 18.1%(+34.5)#2,290 |
| 93. | 15747 | 52.0% | 17.3%(+34.7)#93 | 18.1%(+33.9)#2,341 |
| 94. | 17959 | 50.0% | 17.3%(+32.7)#94 | 18.1%(+31.9)#2,540 |
| 95. | 15725 | 50.0% | 17.3%(+32.7)#95 | 18.1%(+31.9)#2,542 |
| 96. | 18211 | 50.0% | 17.3%(+32.7)#96 | 18.1%(+31.9)#2,545 |
| 97. | 16640 | 50.0% | 17.3%(+32.7)#97 | 18.1%(+31.9)#2,554 |
| 98. | 15778 | 50.0% | 17.3%(+32.7)#98 | 18.1%(+31.9)#2,577 |
| 99. | 17885 | 50.0% | 17.3%(+32.7)#99 | 18.1%(+31.9)#2,593 |
| 100. | 16427 | 50.0% | 17.3%(+32.7)#100 | 18.1%(+31.9)#2,595 |
Common Questions
What are the Top 10 Zip Codes with the Highest Poverty Level Among Children Under the Age of 5 in Pennsylvania?
Top 10 Zip Codes with the Highest Poverty Level Among Children Under the Age of 5 in Pennsylvania are:
What zip code has the Highest Poverty Level Among Children Under the Age of 5 in Pennsylvania?
15033 has the Highest Poverty Level Among Children Under the Age of 5 in Pennsylvania with 100.0%.
What is the Poverty Level Among Children Under the Age of 5 in the State of Pennsylvania?
Poverty Level Among Children Under the Age of 5 in Pennsylvania is 17.3%.
What is the Poverty Level Among Children Under the Age of 5 in the United States?
Poverty Level Among Children Under the Age of 5 in the United States is 18.1%.