Hydetown borough, PA
Hydetown borough Overview
647
TOTAL POPULATION
300
MALE POPULATION
347
FEMALE POPULATION
86.46
MALES / 100 FEMALES
115.67
FEMALES / 100 MALES
50.2
MEDIAN AGE
2.8
AVG FAMILY SIZE
2.3
AVG HOUSEHOLD SIZE
$27,076
PER CAPITA INCOME
$57,750
AVG FAMILY INCOME
$45,179
AVG HOUSEHOLD INCOME
37.4%
WAGE / INCOME GAP [ % ]
62.6¢/ $1
WAGE / INCOME GAP [ $ ]
0.39
INEQUALITY / GINI INDEX
274
LABOR FORCE [ PEOPLE ]
49.9%
PERCENT IN LABOR FORCE
7.7%
UNEMPLOYMENT RATE
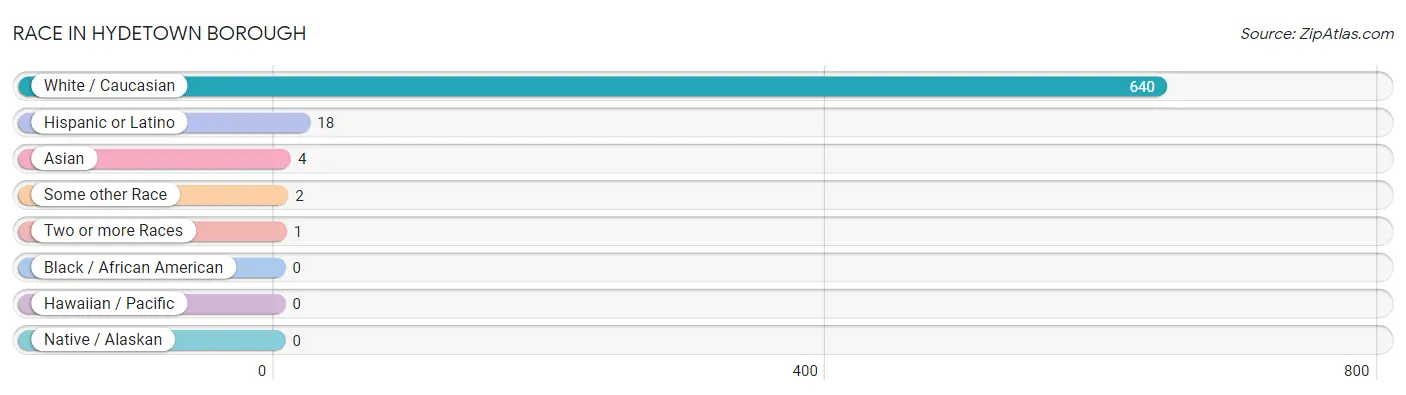
Race in Hydetown borough
The most populous races in Hydetown borough are White / Caucasian (640 | 98.9%), Hispanic or Latino (18 | 2.8%), and Asian (4 | 0.6%).
| Race | # Population | % Population |
| Asian | 4 | 0.6% |
| Black / African American | 0 | 0.0% |
| Hawaiian / Pacific | 0 | 0.0% |
| Hispanic or Latino | 18 | 2.8% |
| Native / Alaskan | 0 | 0.0% |
| White / Caucasian | 640 | 98.9% |
| Two or more Races | 1 | 0.2% |
| Some other Race | 2 | 0.3% |
| Total | 647 | 100.0% |
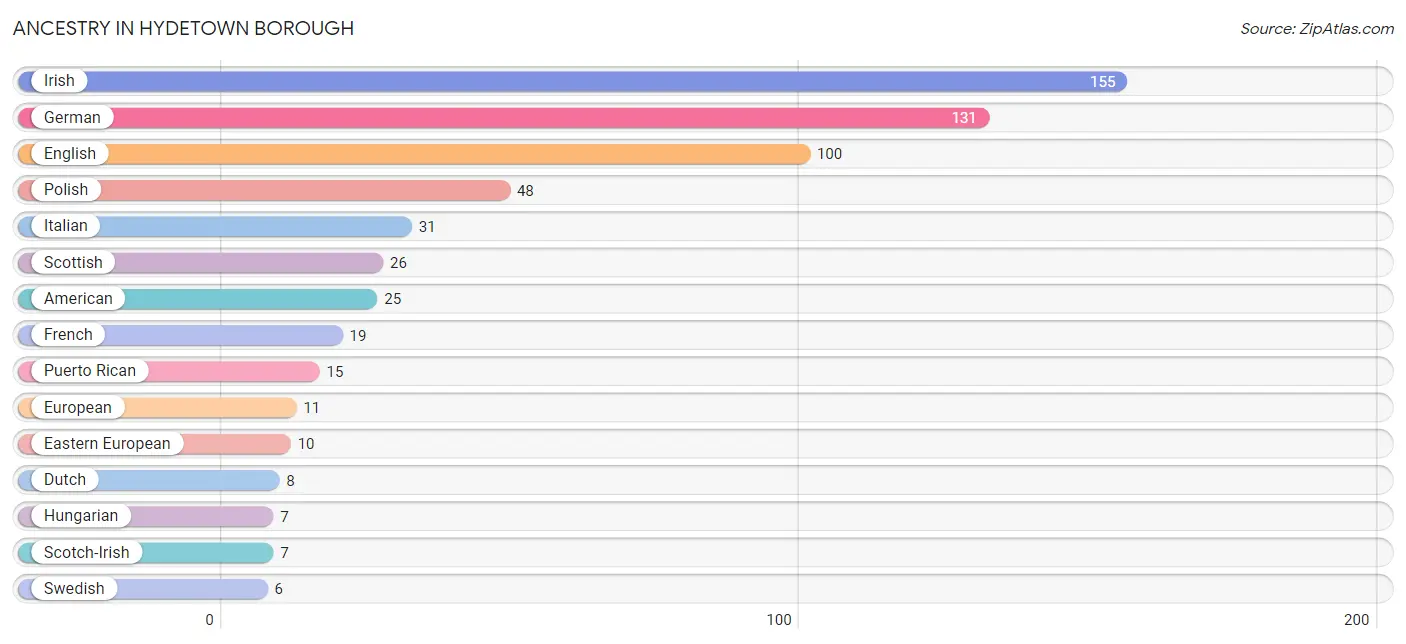
Ancestry in Hydetown borough
The most populous ancestries reported in Hydetown borough are Irish (155 | 24.0%), German (131 | 20.3%), English (100 | 15.5%), Polish (48 | 7.4%), and Italian (31 | 4.8%), together accounting for 71.9% of all Hydetown borough residents.
| Ancestry | # Population | % Population |
| American | 25 | 3.9% |
| Bhutanese | 2 | 0.3% |
| Croatian | 1 | 0.2% |
| Delaware | 1 | 0.2% |
| Dutch | 8 | 1.2% |
| Eastern European | 10 | 1.5% |
| English | 100 | 15.5% |
| European | 11 | 1.7% |
| Finnish | 5 | 0.8% |
| French | 19 | 2.9% |
| French Canadian | 1 | 0.2% |
| German | 131 | 20.3% |
| Hungarian | 7 | 1.1% |
| Indian (Asian) | 2 | 0.3% |
| Irish | 155 | 24.0% |
| Italian | 31 | 4.8% |
| Mexican | 3 | 0.5% |
| Polish | 48 | 7.4% |
| Puerto Rican | 15 | 2.3% |
| Scotch-Irish | 7 | 1.1% |
| Scottish | 26 | 4.0% |
| Slovak | 2 | 0.3% |
| Swedish | 6 | 0.9% |
| Welsh | 5 | 0.8% | View All 24 Rows |
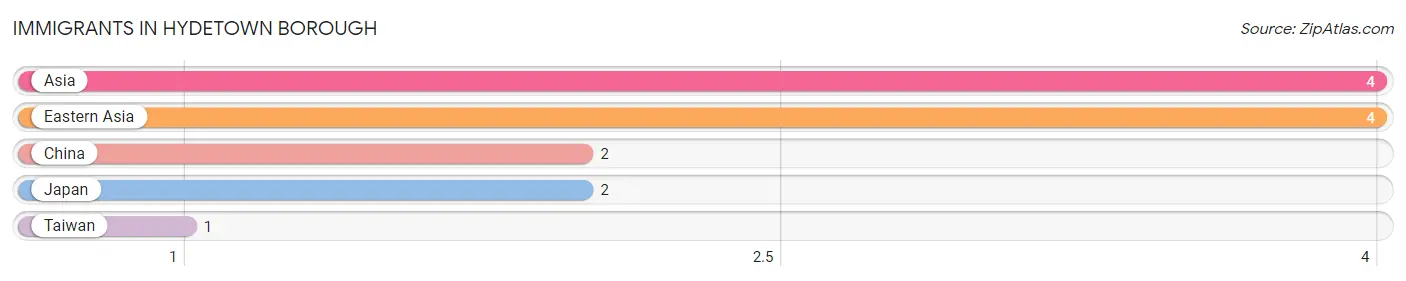
Immigrants in Hydetown borough
The most numerous immigrant groups reported in Hydetown borough came from Asia (4 | 0.6%), Eastern Asia (4 | 0.6%), China (2 | 0.3%), Japan (2 | 0.3%), and Taiwan (1 | 0.2%), together accounting for 2.0% of all Hydetown borough residents.
| Immigration Origin | # Population | % Population |
| Asia | 4 | 0.6% |
| China | 2 | 0.3% |
| Eastern Asia | 4 | 0.6% |
| Japan | 2 | 0.3% |
| Taiwan | 1 | 0.2% | View All 5 Rows |
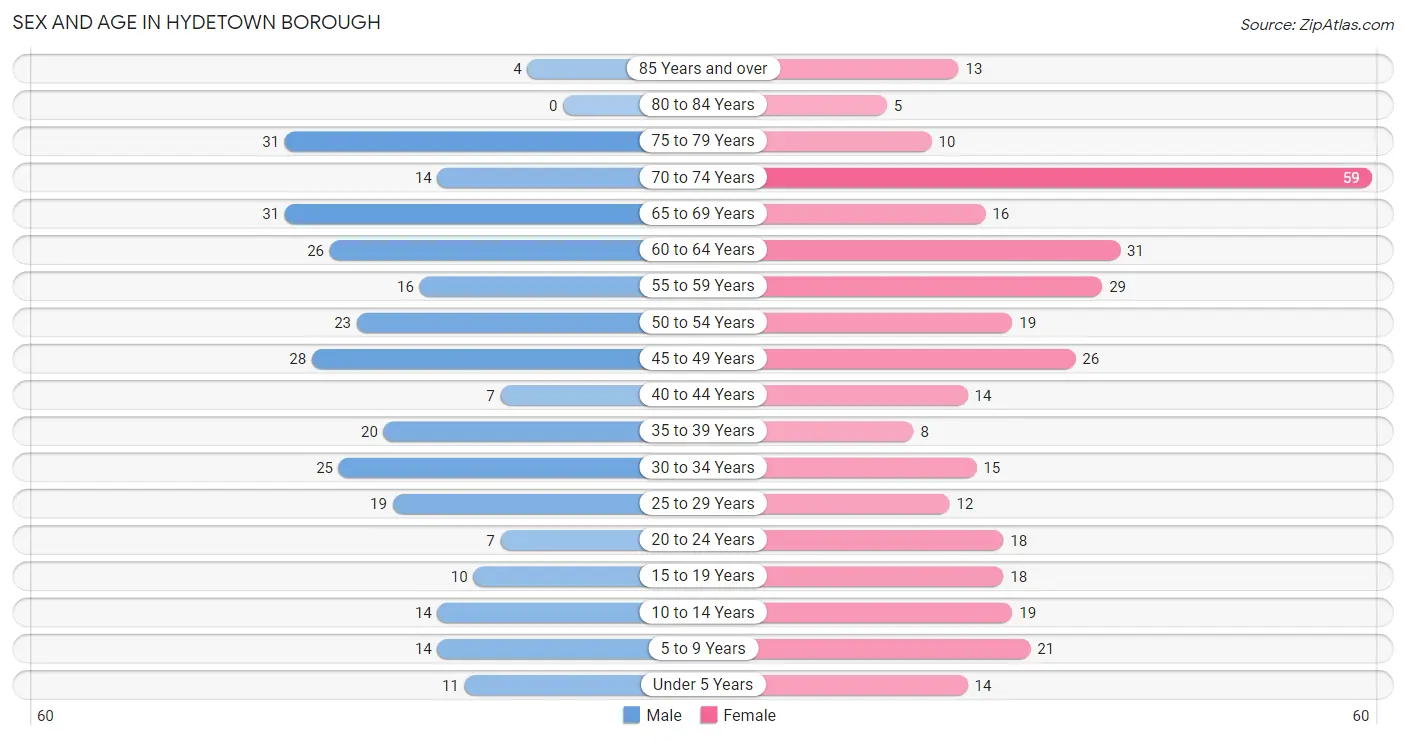
Sex and Age in Hydetown borough
Sex and Age in Hydetown borough
The most populous age groups in Hydetown borough are 65 to 69 Years (31 | 10.3%) for men and 70 to 74 Years (59 | 17.0%) for women.
| Age Bracket | Male | Female |
| Under 5 Years | 11 (3.7%) | 14 (4.0%) |
| 5 to 9 Years | 14 (4.7%) | 21 (6.0%) |
| 10 to 14 Years | 14 (4.7%) | 19 (5.5%) |
| 15 to 19 Years | 10 (3.3%) | 18 (5.2%) |
| 20 to 24 Years | 7 (2.3%) | 18 (5.2%) |
| 25 to 29 Years | 19 (6.3%) | 12 (3.5%) |
| 30 to 34 Years | 25 (8.3%) | 15 (4.3%) |
| 35 to 39 Years | 20 (6.7%) | 8 (2.3%) |
| 40 to 44 Years | 7 (2.3%) | 14 (4.0%) |
| 45 to 49 Years | 28 (9.3%) | 26 (7.5%) |
| 50 to 54 Years | 23 (7.7%) | 19 (5.5%) |
| 55 to 59 Years | 16 (5.3%) | 29 (8.4%) |
| 60 to 64 Years | 26 (8.7%) | 31 (8.9%) |
| 65 to 69 Years | 31 (10.3%) | 16 (4.6%) |
| 70 to 74 Years | 14 (4.7%) | 59 (17.0%) |
| 75 to 79 Years | 31 (10.3%) | 10 (2.9%) |
| 80 to 84 Years | 0 (0.0%) | 5 (1.4%) |
| 85 Years and over | 4 (1.3%) | 13 (3.7%) |
| Total | 300 (100.0%) | 347 (100.0%) |
Families and Households in Hydetown borough
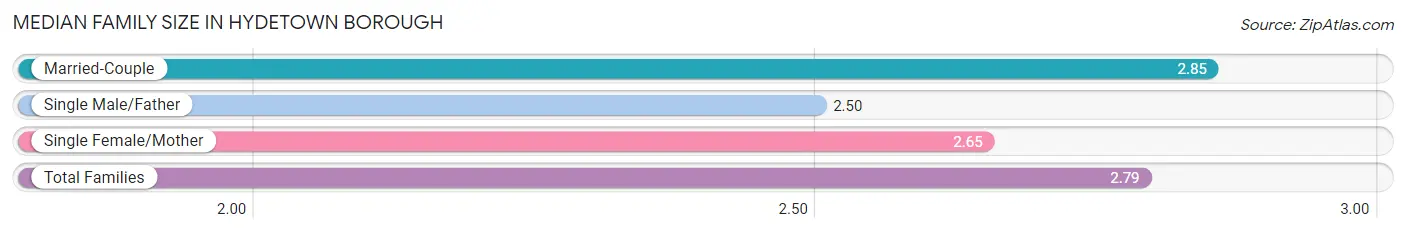
Median Family Size in Hydetown borough
The median family size in Hydetown borough is 2.79 persons per family, with married-couple families (124 | 70.5%) accounting for the largest median family size of 2.85 persons per family. On the other hand, single male/father families (4 | 2.3%) represent the smallest median family size with 2.50 persons per family.
| Family Type | # Families | Family Size |
| Married-Couple | 124 (70.5%) | 2.85 |
| Single Male/Father | 4 (2.3%) | 2.50 |
| Single Female/Mother | 48 (27.3%) | 2.65 |
| Total Families | 176 (100.0%) | 2.79 |
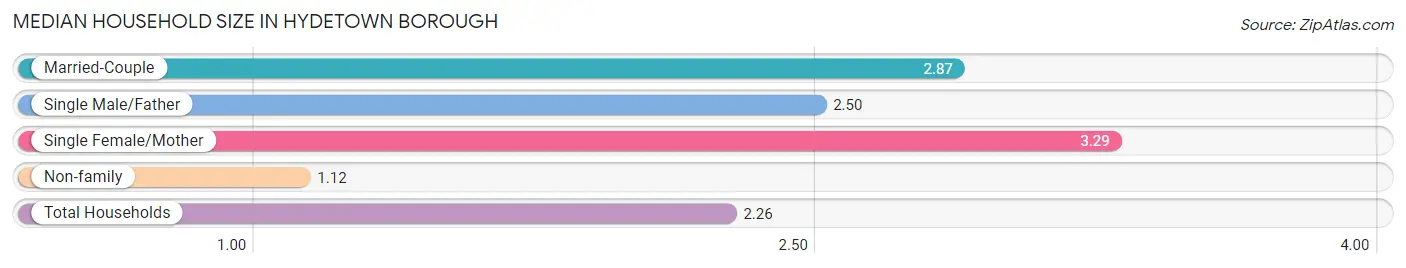
Median Household Size in Hydetown borough
The median household size in Hydetown borough is 2.26 persons per household, with single female/mother households (48 | 16.8%) accounting for the largest median household size of 3.29 persons per household. non-family households (110 | 38.5%) represent the smallest median household size with 1.12 persons per household.
| Household Type | # Households | Household Size |
| Married-Couple | 124 (43.4%) | 2.87 |
| Single Male/Father | 4 (1.4%) | 2.50 |
| Single Female/Mother | 48 (16.8%) | 3.29 |
| Non-family | 110 (38.5%) | 1.12 |
| Total Households | 286 (100.0%) | 2.26 |
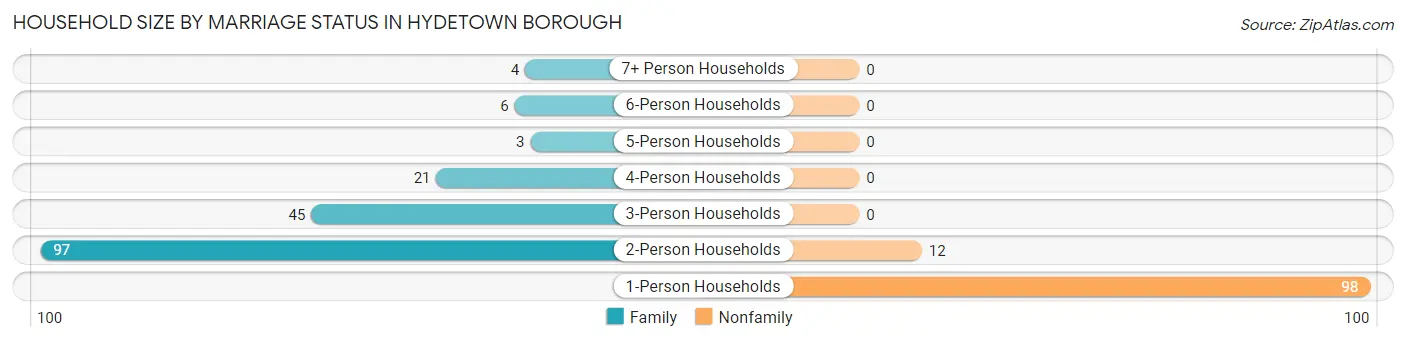
Household Size by Marriage Status in Hydetown borough
Out of a total of 286 households in Hydetown borough, 176 (61.5%) are family households, while 110 (38.5%) are nonfamily households. The most numerous type of family households are 2-person households, comprising 97, and the most common type of nonfamily households are 1-person households, comprising 98.
| Household Size | Family Households | Nonfamily Households |
| 1-Person Households | - | 98 (34.3%) |
| 2-Person Households | 97 (33.9%) | 12 (4.2%) |
| 3-Person Households | 45 (15.7%) | 0 (0.0%) |
| 4-Person Households | 21 (7.3%) | 0 (0.0%) |
| 5-Person Households | 3 (1.1%) | 0 (0.0%) |
| 6-Person Households | 6 (2.1%) | 0 (0.0%) |
| 7+ Person Households | 4 (1.4%) | 0 (0.0%) |
| Total | 176 (61.5%) | 110 (38.5%) |
Female Fertility in Hydetown borough
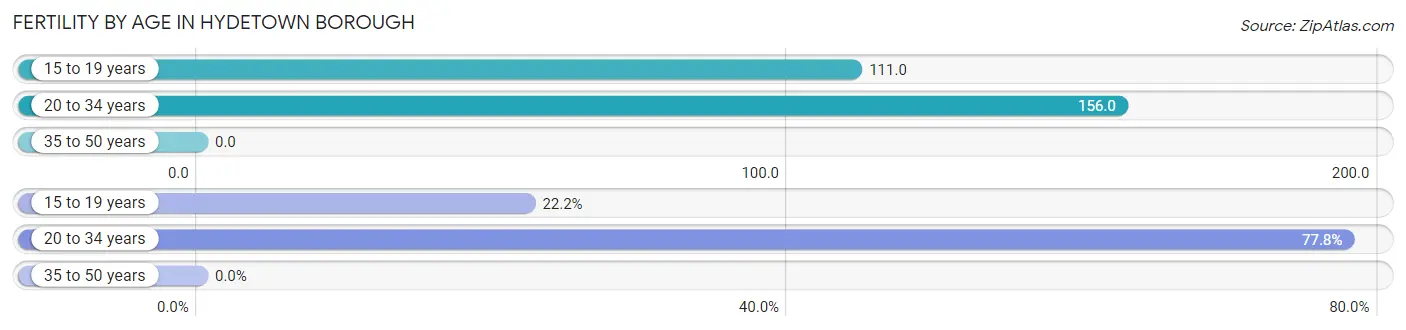
Fertility by Age in Hydetown borough
Average fertility rate in Hydetown borough is 75.0 births per 1,000 women. Women in the age bracket of 20 to 34 years have the highest fertility rate with 156.0 births per 1,000 women. Women in the age bracket of 20 to 34 years acount for 77.8% of all women with births.
| Age Bracket | Women with Births | Births / 1,000 Women |
| 15 to 19 years | 2 (22.2%) | 111.0 |
| 20 to 34 years | 7 (77.8%) | 156.0 |
| 35 to 50 years | 0 (0.0%) | 0.0 |
| Total | 9 (100.0%) | 75.0 |
Fertility by Age by Marriage Status in Hydetown borough
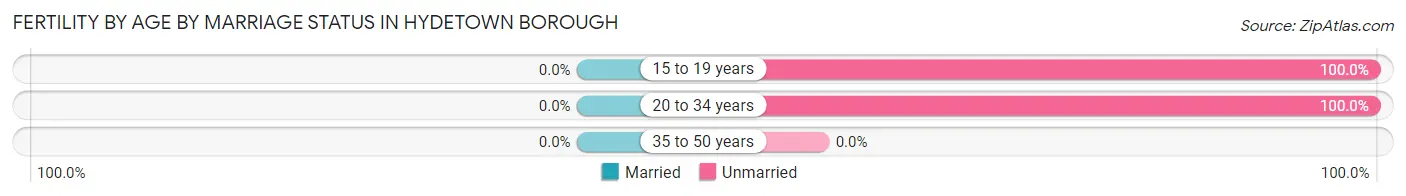
| Age Bracket | Married | Unmarried |
| 15 to 19 years | 0 (0.0%) | 2 (100.0%) |
| 20 to 34 years | 0 (0.0%) | 7 (100.0%) |
| 35 to 50 years | 0 (0.0%) | 0 (0.0%) |
| Total | 0 (0.0%) | 9 (100.0%) |
Fertility by Education in Hydetown borough
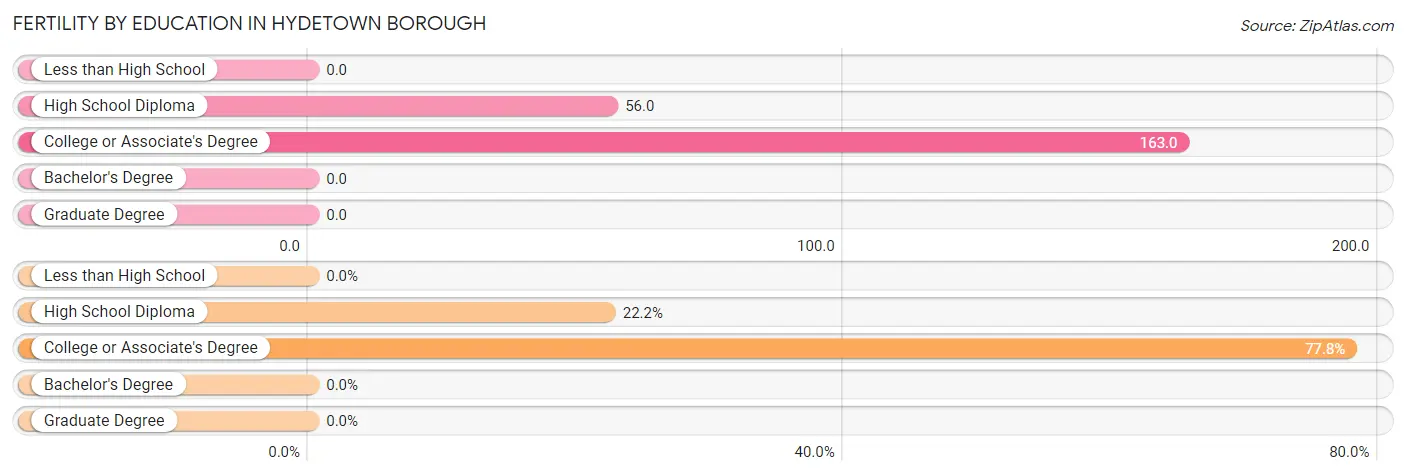
| Educational Attainment | Women with Births | Births / 1,000 Women |
| Less than High School | 0 (0.0%) | 0.0 |
| High School Diploma | 2 (22.2%) | 56.0 |
| College or Associate's Degree | 7 (77.8%) | 163.0 |
| Bachelor's Degree | 0 (0.0%) | 0.0 |
| Graduate Degree | 0 (0.0%) | 0.0 |
| Total | 9 (100.0%) | 75.0 |
Fertility by Education by Marriage Status in Hydetown borough
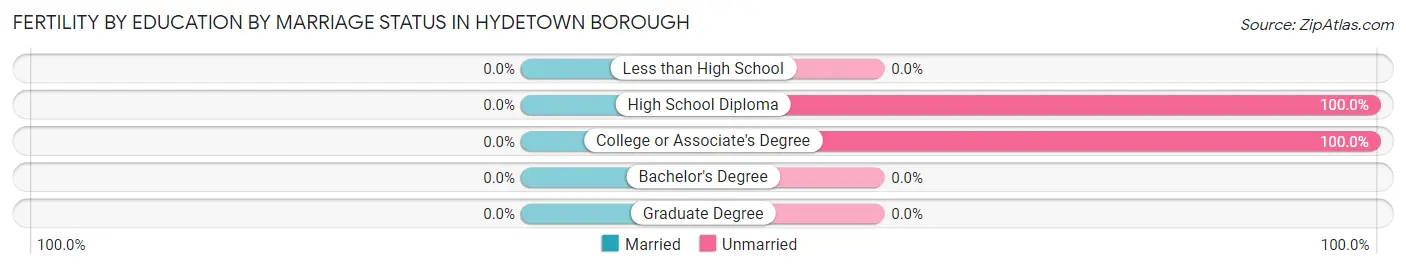
| Educational Attainment | Married | Unmarried |
| Less than High School | 0 (0.0%) | 0 (0.0%) |
| High School Diploma | 0 (0.0%) | 2 (100.0%) |
| College or Associate's Degree | 0 (0.0%) | 7 (100.0%) |
| Bachelor's Degree | 0 (0.0%) | 0 (0.0%) |
| Graduate Degree | 0 (0.0%) | 0 (0.0%) |
| Total | 0 (0.0%) | 9 (100.0%) |
Income in Hydetown borough
Income Overview in Hydetown borough
Per Capita Income in Hydetown borough is $27,076, while median incomes of families and households are $57,750 and $45,179 respectively.
| Characteristic | Number | Measure |
| Per Capita Income | 647 | $27,076 |
| Median Family Income | 176 | $57,750 |
| Mean Family Income | 176 | $69,945 |
| Median Household Income | 286 | $45,179 |
| Mean Household Income | 286 | $59,086 |
| Income Deficit | 176 | $0 |
| Wage / Income Gap (%) | 647 | 37.39% |
| Wage / Income Gap ($) | 647 | 62.61¢ per $1 |
| Gini / Inequality Index | 647 | 0.39 |
Earnings by Sex in Hydetown borough
Average Earnings in Hydetown borough are $32,969, $41,429 for men and $25,938 for women, a difference of 37.4%.
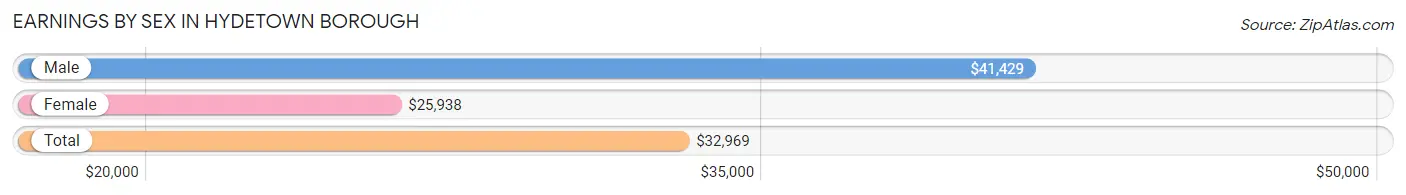
| Sex | Number | Average Earnings |
| Male | 148 (49.5%) | $41,429 |
| Female | 151 (50.5%) | $25,938 |
| Total | 299 (100.0%) | $32,969 |
Earnings by Sex by Income Bracket in Hydetown borough
The most common earnings brackets in Hydetown borough are $7,500 to $9,999 for men (22 | 14.9%) and $22,500 to $24,999 for women (16 | 10.6%).
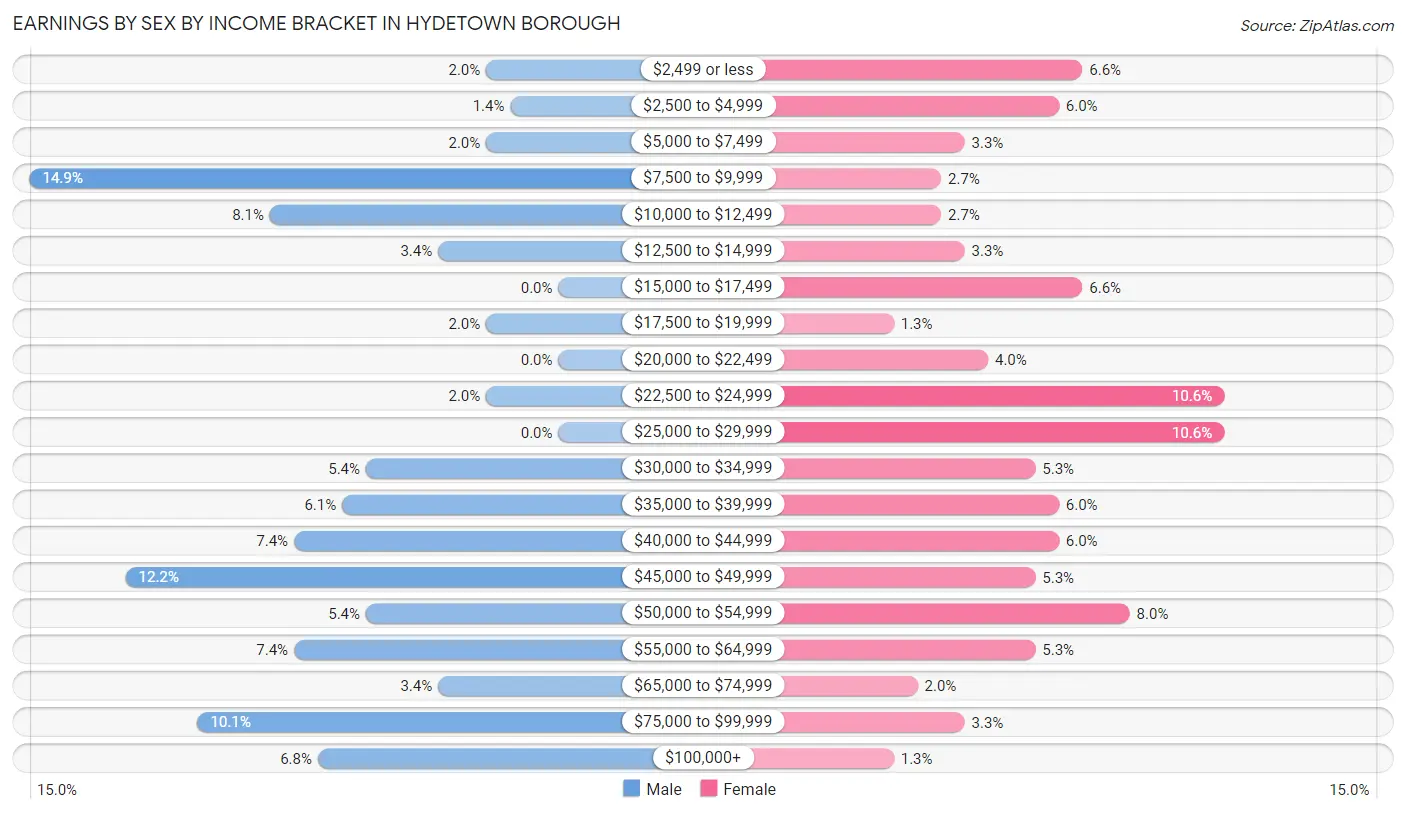
| Income | Male | Female |
| $2,499 or less | 3 (2.0%) | 10 (6.6%) |
| $2,500 to $4,999 | 2 (1.3%) | 9 (6.0%) |
| $5,000 to $7,499 | 3 (2.0%) | 5 (3.3%) |
| $7,500 to $9,999 | 22 (14.9%) | 4 (2.6%) |
| $10,000 to $12,499 | 12 (8.1%) | 4 (2.6%) |
| $12,500 to $14,999 | 5 (3.4%) | 5 (3.3%) |
| $15,000 to $17,499 | 0 (0.0%) | 10 (6.6%) |
| $17,500 to $19,999 | 3 (2.0%) | 2 (1.3%) |
| $20,000 to $22,499 | 0 (0.0%) | 6 (4.0%) |
| $22,500 to $24,999 | 3 (2.0%) | 16 (10.6%) |
| $25,000 to $29,999 | 0 (0.0%) | 16 (10.6%) |
| $30,000 to $34,999 | 8 (5.4%) | 8 (5.3%) |
| $35,000 to $39,999 | 9 (6.1%) | 9 (6.0%) |
| $40,000 to $44,999 | 11 (7.4%) | 9 (6.0%) |
| $45,000 to $49,999 | 18 (12.2%) | 8 (5.3%) |
| $50,000 to $54,999 | 8 (5.4%) | 12 (8.0%) |
| $55,000 to $64,999 | 11 (7.4%) | 8 (5.3%) |
| $65,000 to $74,999 | 5 (3.4%) | 3 (2.0%) |
| $75,000 to $99,999 | 15 (10.1%) | 5 (3.3%) |
| $100,000+ | 10 (6.8%) | 2 (1.3%) |
| Total | 148 (100.0%) | 151 (100.0%) |
Earnings by Sex by Educational Attainment in Hydetown borough
Average earnings in Hydetown borough are $42,321 for men and $28,750 for women, a difference of 32.1%. Men with an educational attainment of graduate degree enjoy the highest average annual earnings of $105,417, while those with high school diploma education earn the least with $43,750. Women with an educational attainment of graduate degree earn the most with the average annual earnings of $47,000, while those with college or associate's degree education have the smallest earnings of $24,375.
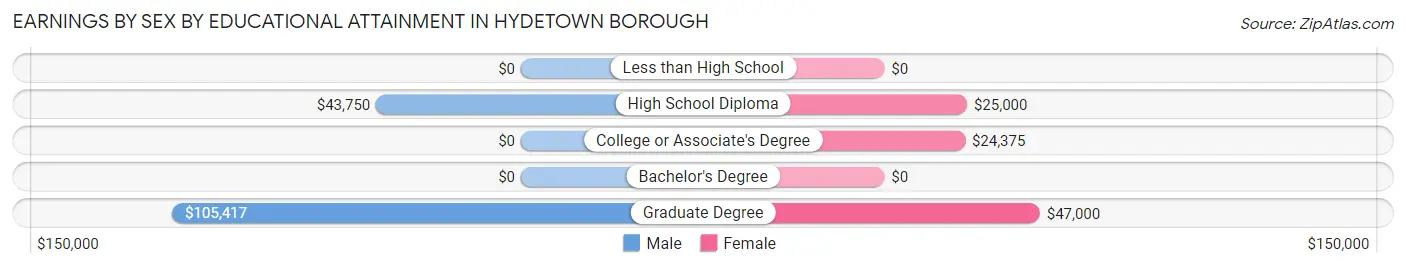
| Educational Attainment | Male Income | Female Income |
| Less than High School | - | - |
| High School Diploma | $43,750 | $25,000 |
| College or Associate's Degree | - | - |
| Bachelor's Degree | - | - |
| Graduate Degree | $105,417 | $47,000 |
| Total | $42,321 | $28,750 |
Family Income in Hydetown borough
Family Income Brackets in Hydetown borough
According to the Hydetown borough family income data, there are 44 families falling into the $50,000 to $74,999 income range, which is the most common income bracket and makes up 25.0% of all families. Conversely, the $150,000 to $199,999 income bracket is the least frequent group with only 3 families (1.7%) belonging to this category.
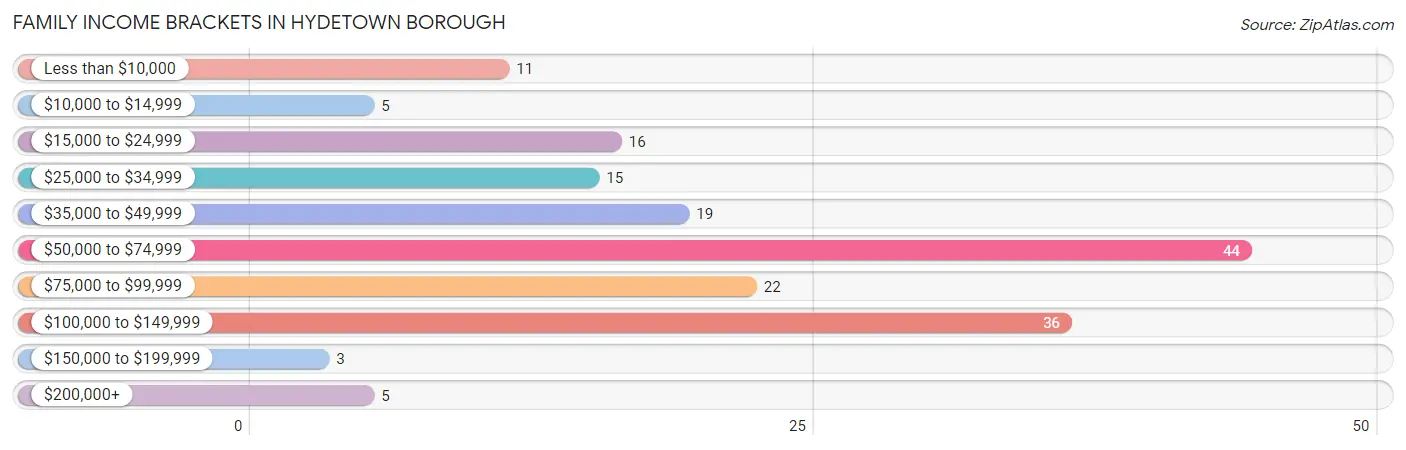
| Income Bracket | # Families | % Families |
| Less than $10,000 | 11 | 6.3% |
| $10,000 to $14,999 | 5 | 2.8% |
| $15,000 to $24,999 | 16 | 9.1% |
| $25,000 to $34,999 | 15 | 8.5% |
| $35,000 to $49,999 | 19 | 10.8% |
| $50,000 to $74,999 | 44 | 25.0% |
| $75,000 to $99,999 | 22 | 12.5% |
| $100,000 to $149,999 | 36 | 20.5% |
| $150,000 to $199,999 | 3 | 1.7% |
| $200,000+ | 5 | 2.8% |
Family Income by Famaliy Size in Hydetown borough
4-person families (19 | 10.8%) account for the highest median family income in Hydetown borough with $120,417 per family, while 4-person families (19 | 10.8%) have the highest median income of $30,104 per family member.
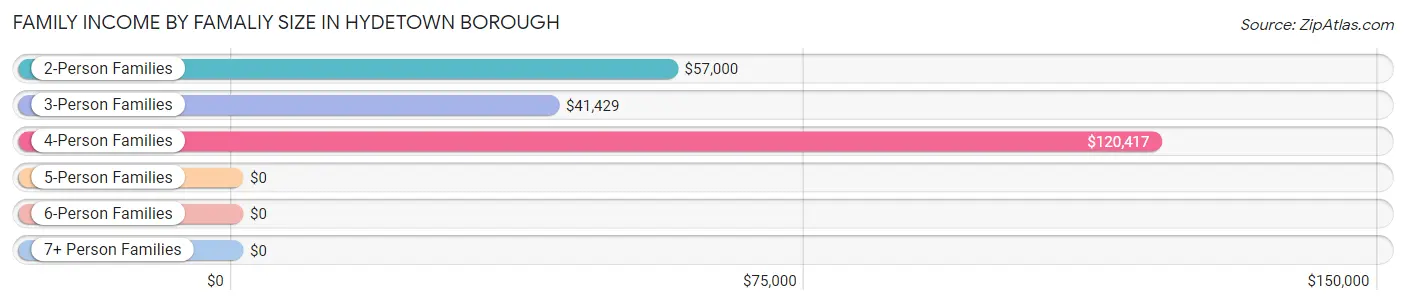
| Income Bracket | # Families | Median Income |
| 2-Person Families | 116 (65.9%) | $57,000 |
| 3-Person Families | 30 (17.1%) | $41,429 |
| 4-Person Families | 19 (10.8%) | $120,417 |
| 5-Person Families | 8 (4.5%) | $0 |
| 6-Person Families | 1 (0.6%) | $0 |
| 7+ Person Families | 2 (1.1%) | $0 |
| Total | 176 (100.0%) | $57,750 |
Family Income by Number of Earners in Hydetown borough
The median family income in Hydetown borough is $57,750, with families comprising 3+ earners (12) having the highest median family income of $125,833, while families with no earners (53) have the lowest median family income of $50,341, accounting for 6.8% and 30.1% of families, respectively.
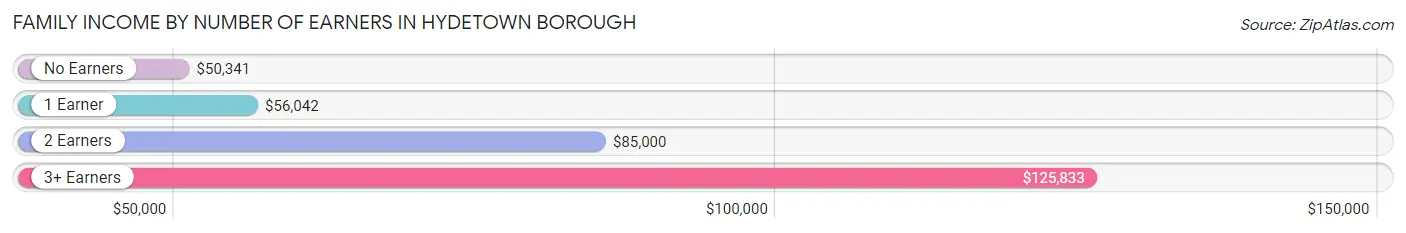
| Number of Earners | # Families | Median Income |
| No Earners | 53 (30.1%) | $50,341 |
| 1 Earner | 45 (25.6%) | $56,042 |
| 2 Earners | 66 (37.5%) | $85,000 |
| 3+ Earners | 12 (6.8%) | $125,833 |
| Total | 176 (100.0%) | $57,750 |
Household Income in Hydetown borough
Household Income Brackets in Hydetown borough
With 50 households falling in the category, the $25,000 to $34,999 income range is the most frequent in Hydetown borough, accounting for 17.5% of all households. In contrast, only 4 households (1.4%) fall into the less than $10,000 income bracket, making it the least populous group.
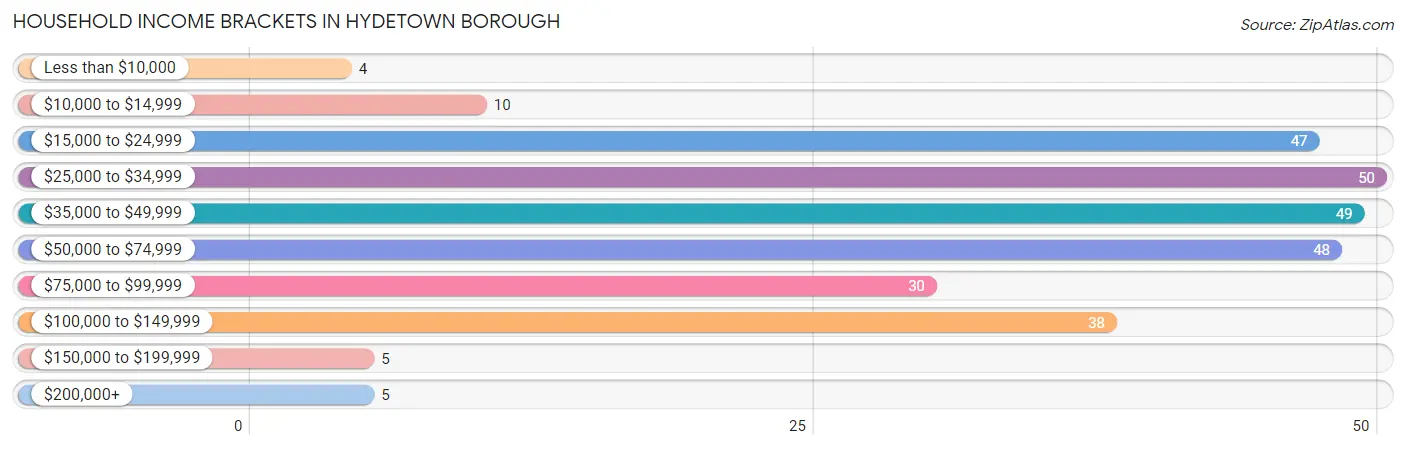
| Income Bracket | # Households | % Households |
| Less than $10,000 | 4 | 1.4% |
| $10,000 to $14,999 | 10 | 3.5% |
| $15,000 to $24,999 | 47 | 16.4% |
| $25,000 to $34,999 | 50 | 17.5% |
| $35,000 to $49,999 | 49 | 17.1% |
| $50,000 to $74,999 | 48 | 16.8% |
| $75,000 to $99,999 | 30 | 10.5% |
| $100,000 to $149,999 | 38 | 13.3% |
| $150,000 to $199,999 | 5 | 1.7% |
| $200,000+ | 5 | 1.7% |
Household Income by Householder Age in Hydetown borough
The median household income in Hydetown borough is $45,179, with the highest median household income of $60,313 found in the 45 to 64 years age bracket for the primary householder. A total of 113 households (39.5%) fall into this category. Meanwhile, the 15 to 24 years age bracket for the primary householder has the lowest median household income of $0, with 5 households (1.8%) in this group.
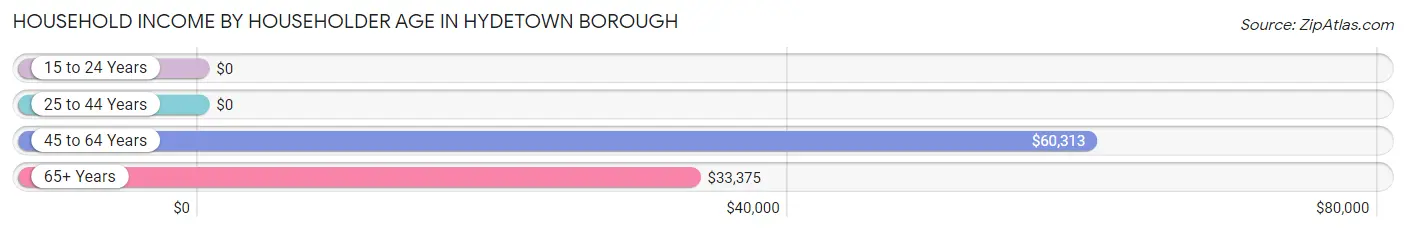
| Income Bracket | # Households | Median Income |
| 15 to 24 Years | 5 (1.8%) | $0 |
| 25 to 44 Years | 39 (13.6%) | $0 |
| 45 to 64 Years | 113 (39.5%) | $60,313 |
| 65+ Years | 129 (45.1%) | $33,375 |
| Total | 286 (100.0%) | $45,179 |
Poverty in Hydetown borough
Income Below Poverty by Sex and Age in Hydetown borough
With 14.4% poverty level for males and 16.6% for females among the residents of Hydetown borough, under 5 year old males and under 5 year old females are the most vulnerable to poverty, with 7 males (63.6%) and 11 females (84.6%) in their respective age groups living below the poverty level.
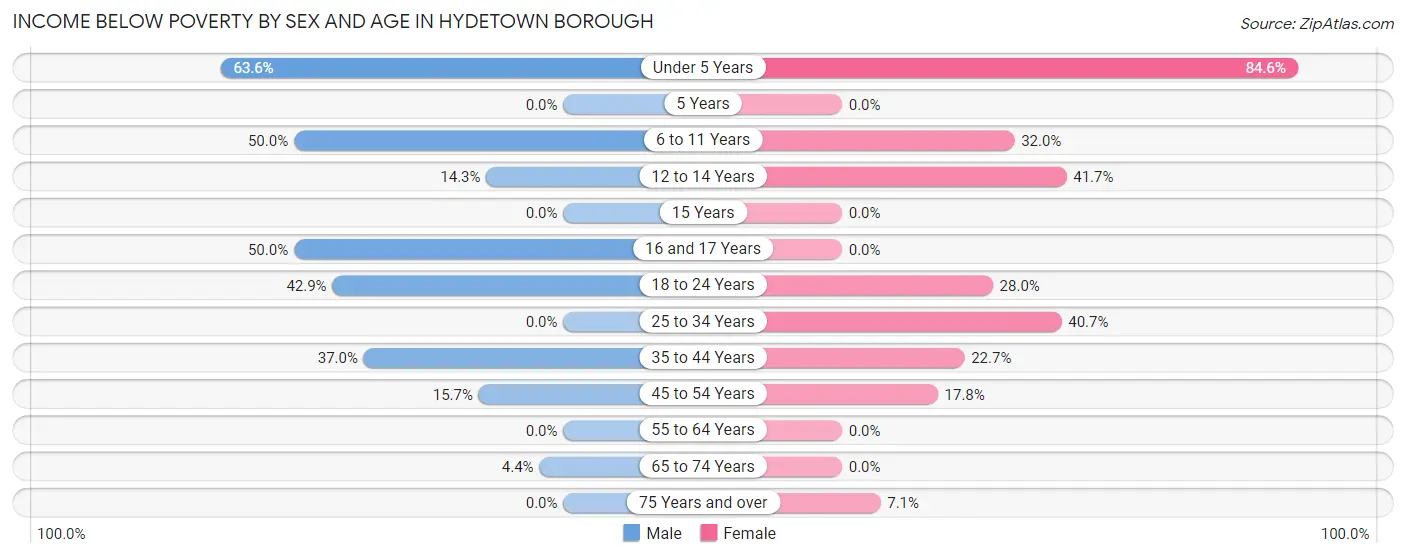
| Age Bracket | Male | Female |
| Under 5 Years | 7 (63.6%) | 11 (84.6%) |
| 5 Years | 0 (0.0%) | 0 (0.0%) |
| 6 to 11 Years | 6 (50.0%) | 8 (32.0%) |
| 12 to 14 Years | 2 (14.3%) | 5 (41.7%) |
| 15 Years | 0 (0.0%) | 0 (0.0%) |
| 16 and 17 Years | 5 (50.0%) | 0 (0.0%) |
| 18 to 24 Years | 3 (42.9%) | 7 (28.0%) |
| 25 to 34 Years | 0 (0.0%) | 11 (40.7%) |
| 35 to 44 Years | 10 (37.0%) | 5 (22.7%) |
| 45 to 54 Years | 8 (15.7%) | 8 (17.8%) |
| 55 to 64 Years | 0 (0.0%) | 0 (0.0%) |
| 65 to 74 Years | 2 (4.4%) | 0 (0.0%) |
| 75 Years and over | 0 (0.0%) | 2 (7.1%) |
| Total | 43 (14.4%) | 57 (16.6%) |
Income Above Poverty by Sex and Age in Hydetown borough
According to the poverty statistics in Hydetown borough, males aged 25 to 34 years and females aged 5 years are the age groups that are most secure financially, with 100.0% of males and 100.0% of females in these age groups living above the poverty line.
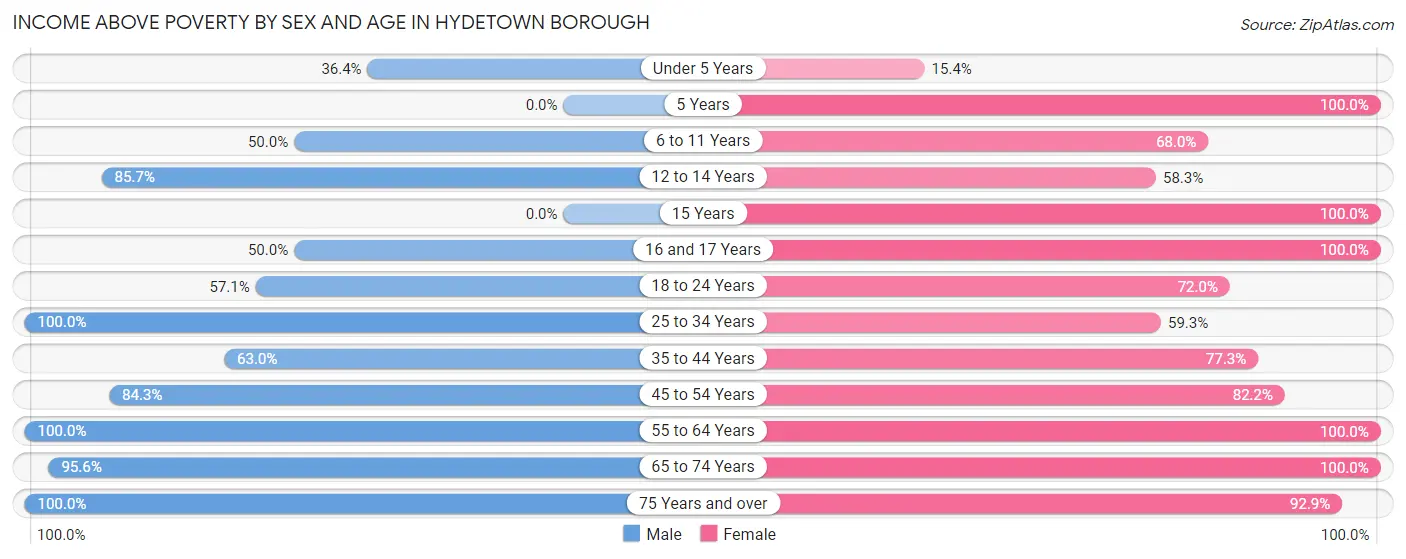
| Age Bracket | Male | Female |
| Under 5 Years | 4 (36.4%) | 2 (15.4%) |
| 5 Years | 0 (0.0%) | 1 (100.0%) |
| 6 to 11 Years | 6 (50.0%) | 17 (68.0%) |
| 12 to 14 Years | 12 (85.7%) | 7 (58.3%) |
| 15 Years | 0 (0.0%) | 5 (100.0%) |
| 16 and 17 Years | 5 (50.0%) | 6 (100.0%) |
| 18 to 24 Years | 4 (57.1%) | 18 (72.0%) |
| 25 to 34 Years | 44 (100.0%) | 16 (59.3%) |
| 35 to 44 Years | 17 (63.0%) | 17 (77.3%) |
| 45 to 54 Years | 43 (84.3%) | 37 (82.2%) |
| 55 to 64 Years | 42 (100.0%) | 60 (100.0%) |
| 65 to 74 Years | 43 (95.6%) | 75 (100.0%) |
| 75 Years and over | 35 (100.0%) | 26 (92.9%) |
| Total | 255 (85.6%) | 287 (83.4%) |
Income Below Poverty Among Married-Couple Families in Hydetown borough
The poverty statistics for married-couple families in Hydetown borough show that 1.6% or 2 of the total 124 families live below the poverty line. Families with 3 or 4 children have the highest poverty rate of 50.0%, comprising of 2 families. On the other hand, families with no children have the lowest poverty rate of 0.0%, which includes 0 families.
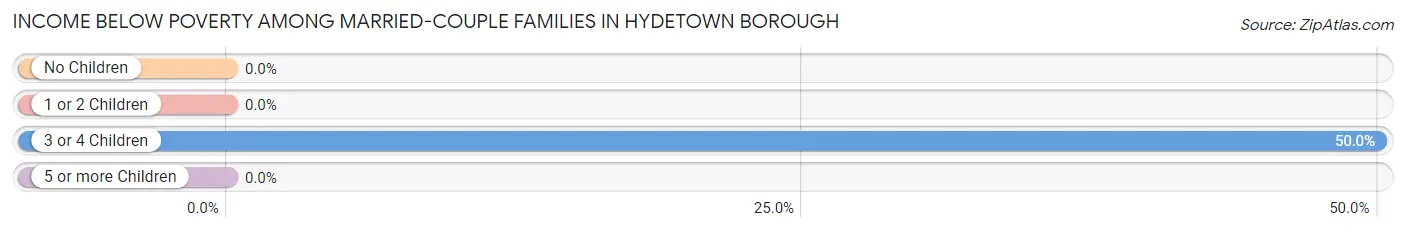
| Children | Above Poverty | Below Poverty |
| No Children | 98 (100.0%) | 0 (0.0%) |
| 1 or 2 Children | 20 (100.0%) | 0 (0.0%) |
| 3 or 4 Children | 2 (50.0%) | 2 (50.0%) |
| 5 or more Children | 2 (100.0%) | 0 (0.0%) |
| Total | 122 (98.4%) | 2 (1.6%) |
Income Below Poverty Among Single-Parent Households in Hydetown borough
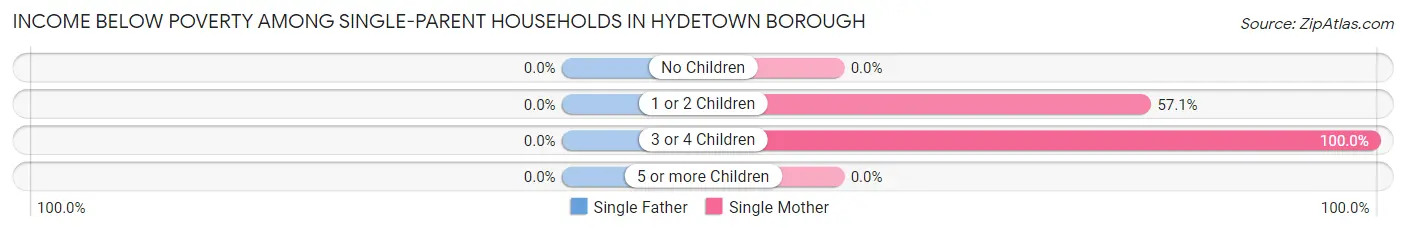
| Children | Single Father | Single Mother |
| No Children | 0 (0.0%) | 0 (0.0%) |
| 1 or 2 Children | 0 (0.0%) | 16 (57.1%) |
| 3 or 4 Children | 0 (0.0%) | 5 (100.0%) |
| 5 or more Children | 0 (0.0%) | 0 (0.0%) |
| Total | 0 (0.0%) | 21 (43.8%) |
Income Below Poverty Among Married-Couple vs Single-Parent Households in Hydetown borough
The poverty data for Hydetown borough shows that 2 of the married-couple family households (1.6%) and 21 of the single-parent households (40.4%) are living below the poverty level. Within the married-couple family households, those with 3 or 4 children have the highest poverty rate, with 2 households (50.0%) falling below the poverty line. Among the single-parent households, those with 3 or 4 children have the highest poverty rate, with 5 household (100.0%) living below poverty.
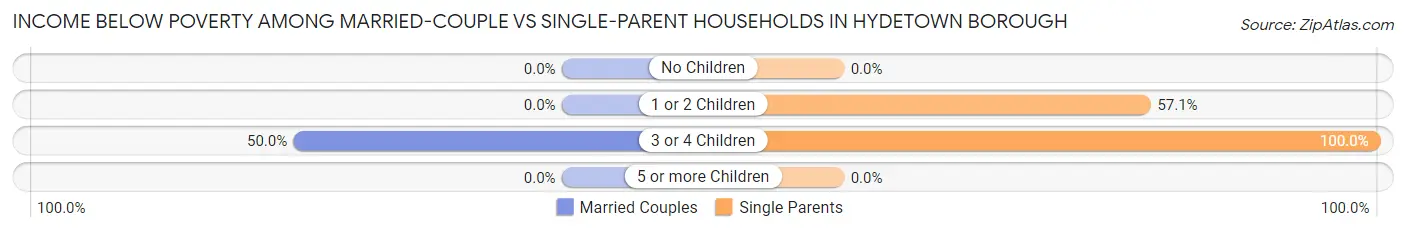
| Children | Married-Couple Families | Single-Parent Households |
| No Children | 0 (0.0%) | 0 (0.0%) |
| 1 or 2 Children | 0 (0.0%) | 16 (57.1%) |
| 3 or 4 Children | 2 (50.0%) | 5 (100.0%) |
| 5 or more Children | 0 (0.0%) | 0 (0.0%) |
| Total | 2 (1.6%) | 21 (40.4%) |
Employment Characteristics in Hydetown borough
Employment by Class of Employer in Hydetown borough
Among the 253 employed individuals in Hydetown borough, private company employees (161 | 63.6%), not-for-profit organizations (36 | 14.2%), and local government employees (17 | 6.7%) make up the most common classes of employment.
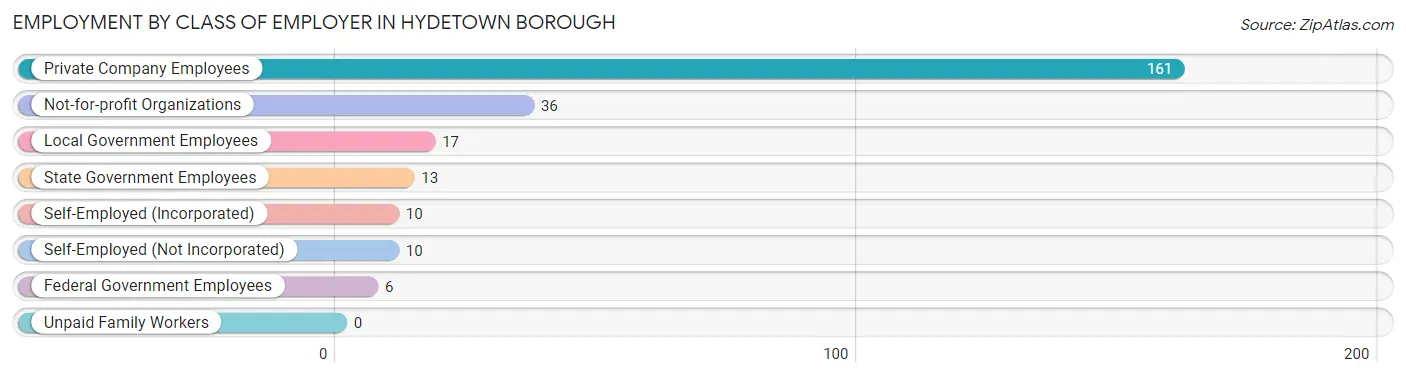
| Employer Class | # Employees | % Employees |
| Private Company Employees | 161 | 63.6% |
| Self-Employed (Incorporated) | 10 | 4.0% |
| Self-Employed (Not Incorporated) | 10 | 4.0% |
| Not-for-profit Organizations | 36 | 14.2% |
| Local Government Employees | 17 | 6.7% |
| State Government Employees | 13 | 5.1% |
| Federal Government Employees | 6 | 2.4% |
| Unpaid Family Workers | 0 | 0.0% |
| Total | 253 | 100.0% |
Employment Status by Age in Hydetown borough
According to the labor force statistics for Hydetown borough, out of the total population over 16 years of age (549), 49.9% or 274 individuals are in the labor force, with 7.7% or 21 of them unemployed. The age group with the highest labor force participation rate is 30 to 34 years, with 100.0% or 40 individuals in the labor force. Within the labor force, the 25 to 29 years age range has the highest percentage of unemployed individuals, with 44.4% or 8 of them being unemployed.
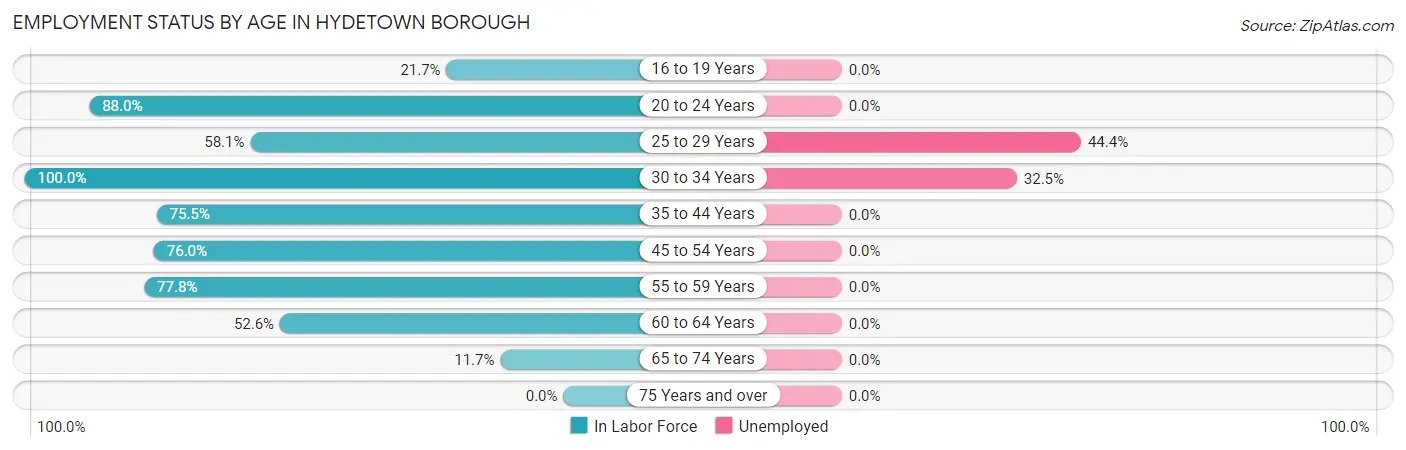
| Age Bracket | In Labor Force | Unemployed |
| 16 to 19 Years | 5 (21.7%) | 0 (0.0%) |
| 20 to 24 Years | 22 (88.0%) | 0 (0.0%) |
| 25 to 29 Years | 18 (58.1%) | 8 (44.4%) |
| 30 to 34 Years | 40 (100.0%) | 13 (32.5%) |
| 35 to 44 Years | 37 (75.5%) | 0 (0.0%) |
| 45 to 54 Years | 73 (76.0%) | 0 (0.0%) |
| 55 to 59 Years | 35 (77.8%) | 0 (0.0%) |
| 60 to 64 Years | 30 (52.6%) | 0 (0.0%) |
| 65 to 74 Years | 14 (11.7%) | 0 (0.0%) |
| 75 Years and over | 0 (0.0%) | 0 (0.0%) |
| Total | 274 (49.9%) | 21 (7.7%) |
Employment Status by Educational Attainment in Hydetown borough
According to labor force statistics for Hydetown borough, 73.3% of individuals (233) out of the total population between 25 and 64 years of age (318) are in the labor force, with 9.0% or 21 of them being unemployed. The group with the highest labor force participation rate are those with the educational attainment of bachelor's degree or higher, with 88.4% or 38 individuals in the labor force. Within the labor force, individuals with college / associate degree education have the highest percentage of unemployment, with 15.5% or 13 of them being unemployed.
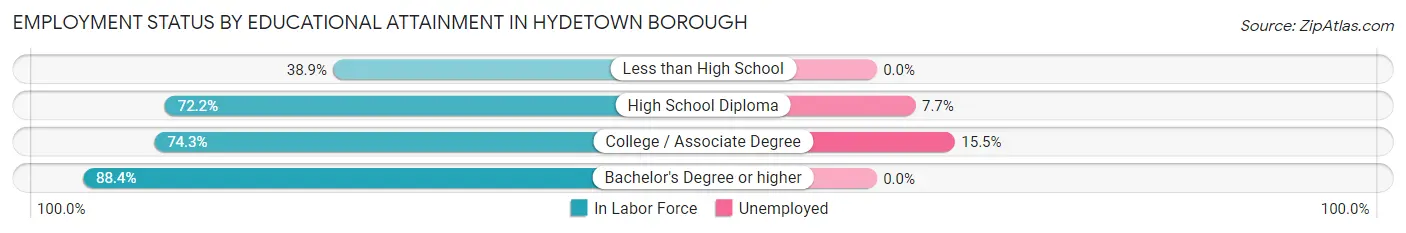
| Educational Attainment | In Labor Force | Unemployed |
| Less than High School | 7 (38.9%) | 0 (0.0%) |
| High School Diploma | 104 (72.2%) | 11 (7.7%) |
| College / Associate Degree | 84 (74.3%) | 18 (15.5%) |
| Bachelor's Degree or higher | 38 (88.4%) | 0 (0.0%) |
| Total | 233 (73.3%) | 29 (9.0%) |
Employment Occupations by Sex in Hydetown borough
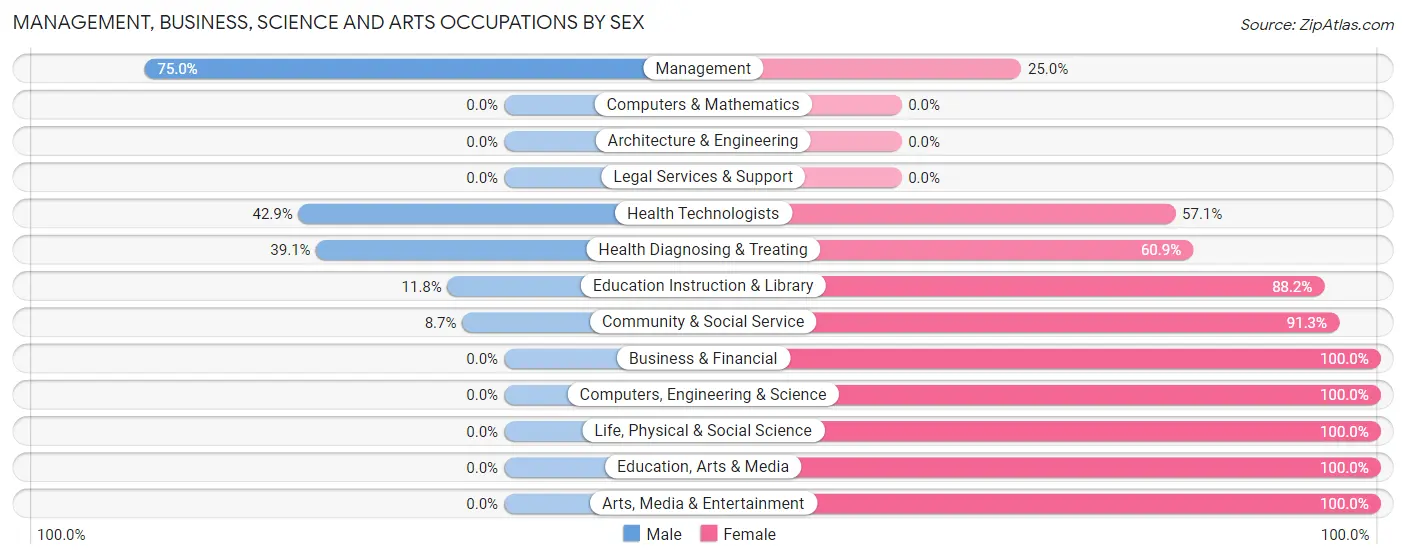
Management, Business, Science and Arts Occupations
The most common Management, Business, Science and Arts occupations in Hydetown borough are Community & Social Service (23 | 9.1%), Health Diagnosing & Treating (23 | 9.1%), Education Instruction & Library (17 | 6.7%), Health Technologists (14 | 5.5%), and Business & Financial (5 | 2.0%).
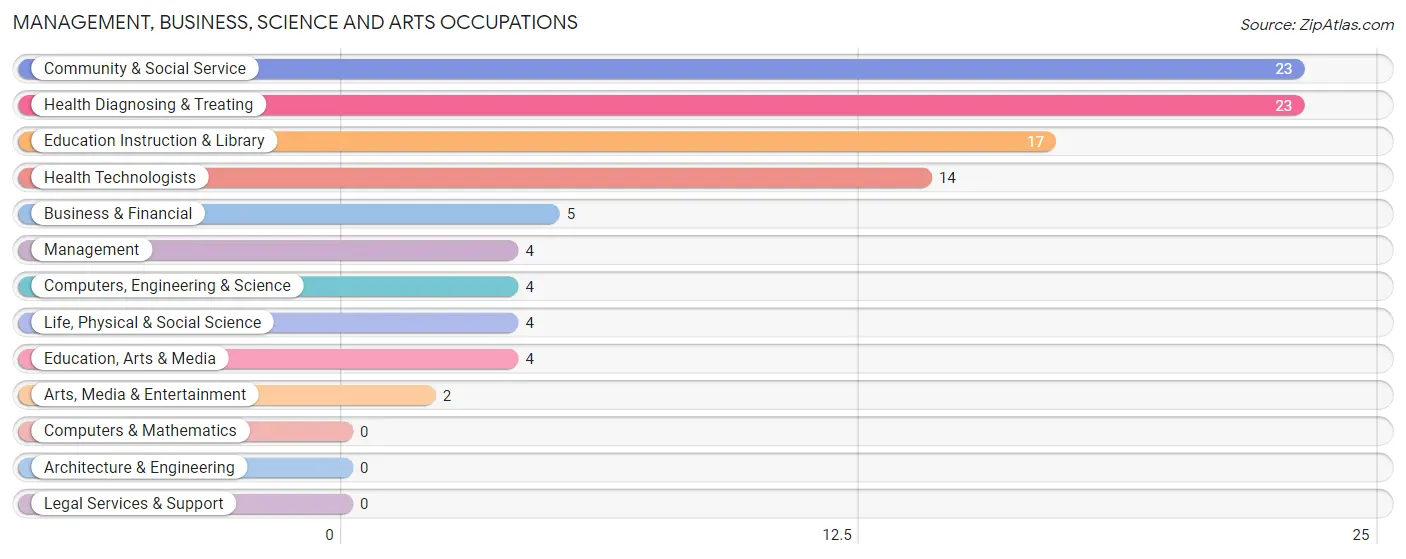
Management, Business, Science and Arts Occupations by Sex
Within the Management, Business, Science and Arts occupations in Hydetown borough, the most male-oriented occupations are Management (75.0%), Health Technologists (42.9%), and Health Diagnosing & Treating (39.1%), while the most female-oriented occupations are Business & Financial (100.0%), Computers, Engineering & Science (100.0%), and Life, Physical & Social Science (100.0%).
| Occupation | Male | Female |
| Management | 3 (75.0%) | 1 (25.0%) |
| Business & Financial | 0 (0.0%) | 5 (100.0%) |
| Computers, Engineering & Science | 0 (0.0%) | 4 (100.0%) |
| Computers & Mathematics | 0 (0.0%) | 0 (0.0%) |
| Architecture & Engineering | 0 (0.0%) | 0 (0.0%) |
| Life, Physical & Social Science | 0 (0.0%) | 4 (100.0%) |
| Community & Social Service | 2 (8.7%) | 21 (91.3%) |
| Education, Arts & Media | 0 (0.0%) | 4 (100.0%) |
| Legal Services & Support | 0 (0.0%) | 0 (0.0%) |
| Education Instruction & Library | 2 (11.8%) | 15 (88.2%) |
| Arts, Media & Entertainment | 0 (0.0%) | 2 (100.0%) |
| Health Diagnosing & Treating | 9 (39.1%) | 14 (60.9%) |
| Health Technologists | 6 (42.9%) | 8 (57.1%) |
| Total (Category) | 14 (23.7%) | 45 (76.3%) |
| Total (Overall) | 123 (48.6%) | 130 (51.4%) |
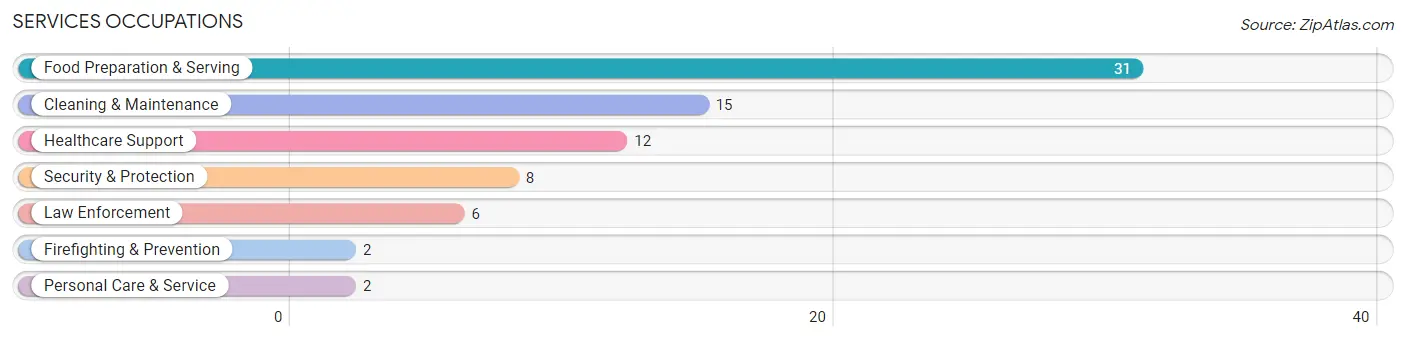
Services Occupations
The most common Services occupations in Hydetown borough are Food Preparation & Serving (31 | 12.2%), Cleaning & Maintenance (15 | 5.9%), Healthcare Support (12 | 4.7%), Security & Protection (8 | 3.2%), and Law Enforcement (6 | 2.4%).
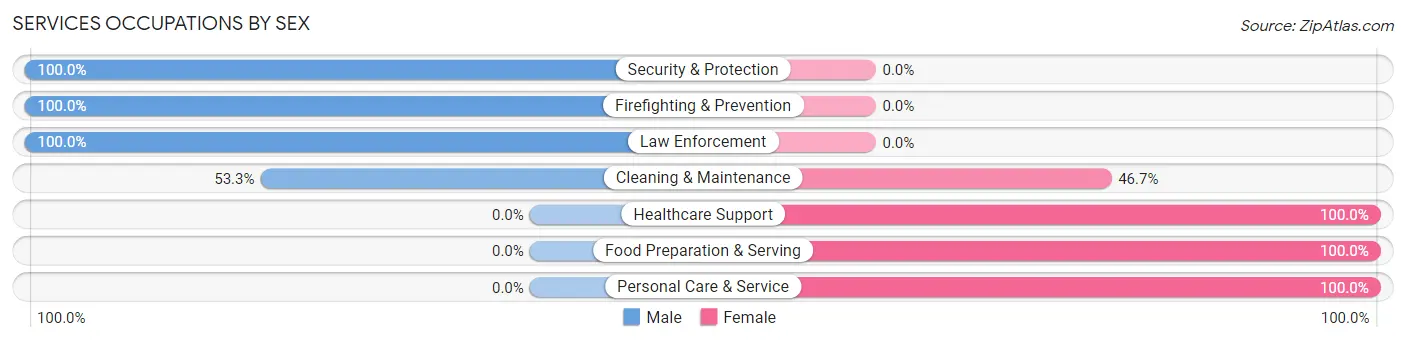
Services Occupations by Sex
Within the Services occupations in Hydetown borough, the most male-oriented occupations are Security & Protection (100.0%), Firefighting & Prevention (100.0%), and Law Enforcement (100.0%), while the most female-oriented occupations are Healthcare Support (100.0%), Food Preparation & Serving (100.0%), and Personal Care & Service (100.0%).
| Occupation | Male | Female |
| Healthcare Support | 0 (0.0%) | 12 (100.0%) |
| Security & Protection | 8 (100.0%) | 0 (0.0%) |
| Firefighting & Prevention | 2 (100.0%) | 0 (0.0%) |
| Law Enforcement | 6 (100.0%) | 0 (0.0%) |
| Food Preparation & Serving | 0 (0.0%) | 31 (100.0%) |
| Cleaning & Maintenance | 8 (53.3%) | 7 (46.7%) |
| Personal Care & Service | 0 (0.0%) | 2 (100.0%) |
| Total (Category) | 16 (23.5%) | 52 (76.5%) |
| Total (Overall) | 123 (48.6%) | 130 (51.4%) |
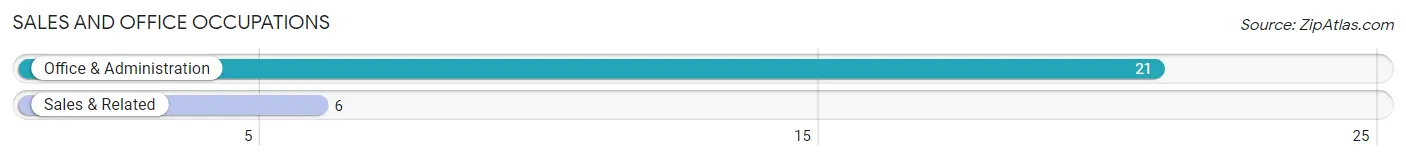
Sales and Office Occupations
The most common Sales and Office occupations in Hydetown borough are Office & Administration (21 | 8.3%), and Sales & Related (6 | 2.4%).
Sales and Office Occupations by Sex
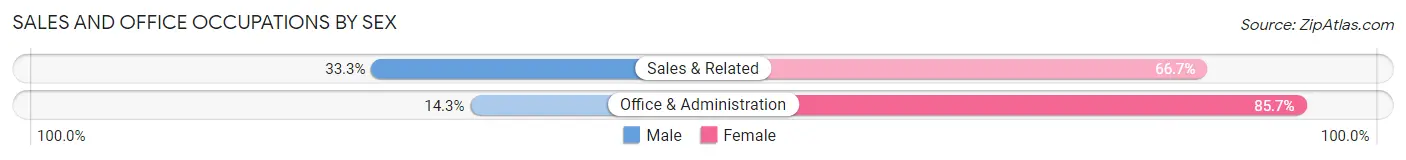
| Occupation | Male | Female |
| Sales & Related | 2 (33.3%) | 4 (66.7%) |
| Office & Administration | 3 (14.3%) | 18 (85.7%) |
| Total (Category) | 5 (18.5%) | 22 (81.5%) |
| Total (Overall) | 123 (48.6%) | 130 (51.4%) |
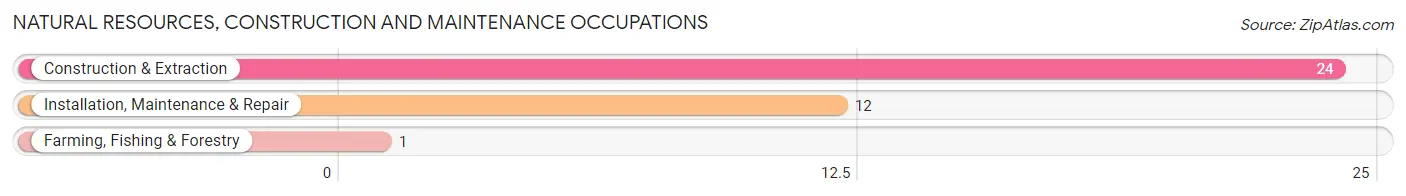
Natural Resources, Construction and Maintenance Occupations
The most common Natural Resources, Construction and Maintenance occupations in Hydetown borough are Construction & Extraction (24 | 9.5%), Installation, Maintenance & Repair (12 | 4.7%), and Farming, Fishing & Forestry (1 | 0.4%).
Natural Resources, Construction and Maintenance Occupations by Sex
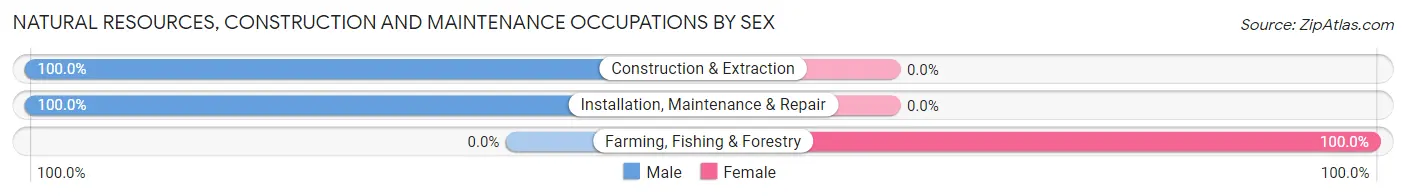
| Occupation | Male | Female |
| Farming, Fishing & Forestry | 0 (0.0%) | 1 (100.0%) |
| Construction & Extraction | 24 (100.0%) | 0 (0.0%) |
| Installation, Maintenance & Repair | 12 (100.0%) | 0 (0.0%) |
| Total (Category) | 36 (97.3%) | 1 (2.7%) |
| Total (Overall) | 123 (48.6%) | 130 (51.4%) |
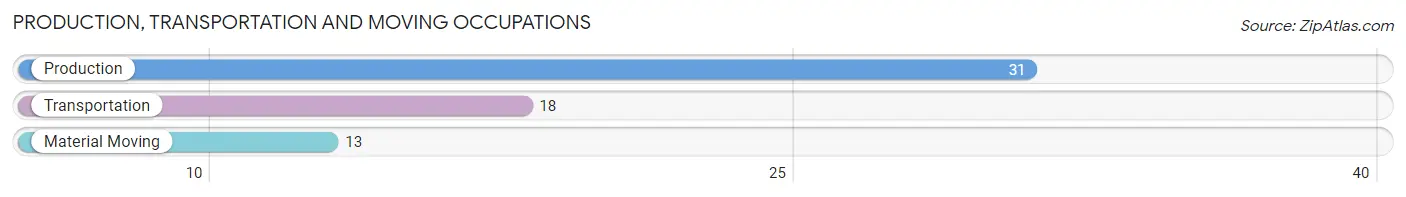
Production, Transportation and Moving Occupations
The most common Production, Transportation and Moving occupations in Hydetown borough are Production (31 | 12.2%), Transportation (18 | 7.1%), and Material Moving (13 | 5.1%).
Production, Transportation and Moving Occupations by Sex
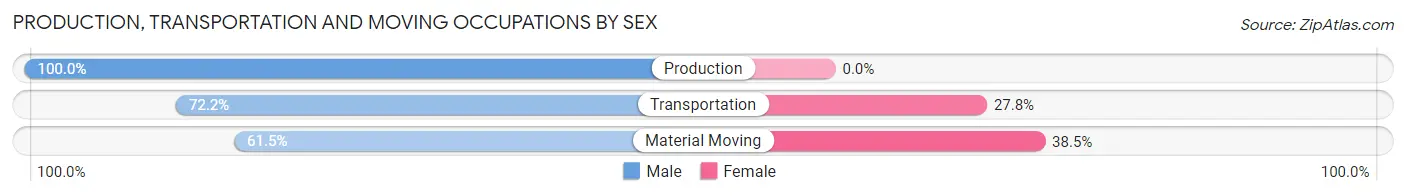
| Occupation | Male | Female |
| Production | 31 (100.0%) | 0 (0.0%) |
| Transportation | 13 (72.2%) | 5 (27.8%) |
| Material Moving | 8 (61.5%) | 5 (38.5%) |
| Total (Category) | 52 (83.9%) | 10 (16.1%) |
| Total (Overall) | 123 (48.6%) | 130 (51.4%) |
Employment Industries by Sex in Hydetown borough
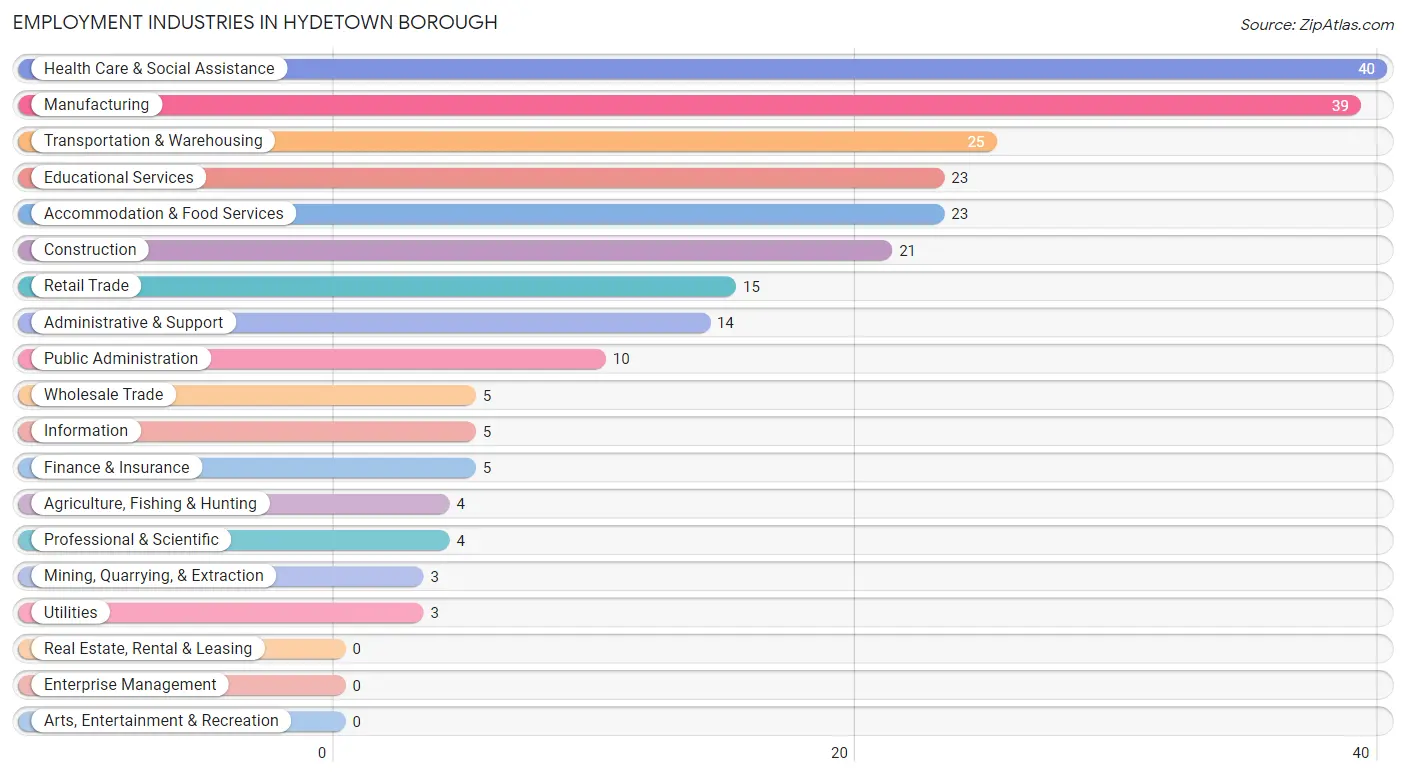
Employment Industries in Hydetown borough
The major employment industries in Hydetown borough include Health Care & Social Assistance (40 | 15.8%), Manufacturing (39 | 15.4%), Transportation & Warehousing (25 | 9.9%), Educational Services (23 | 9.1%), and Accommodation & Food Services (23 | 9.1%).
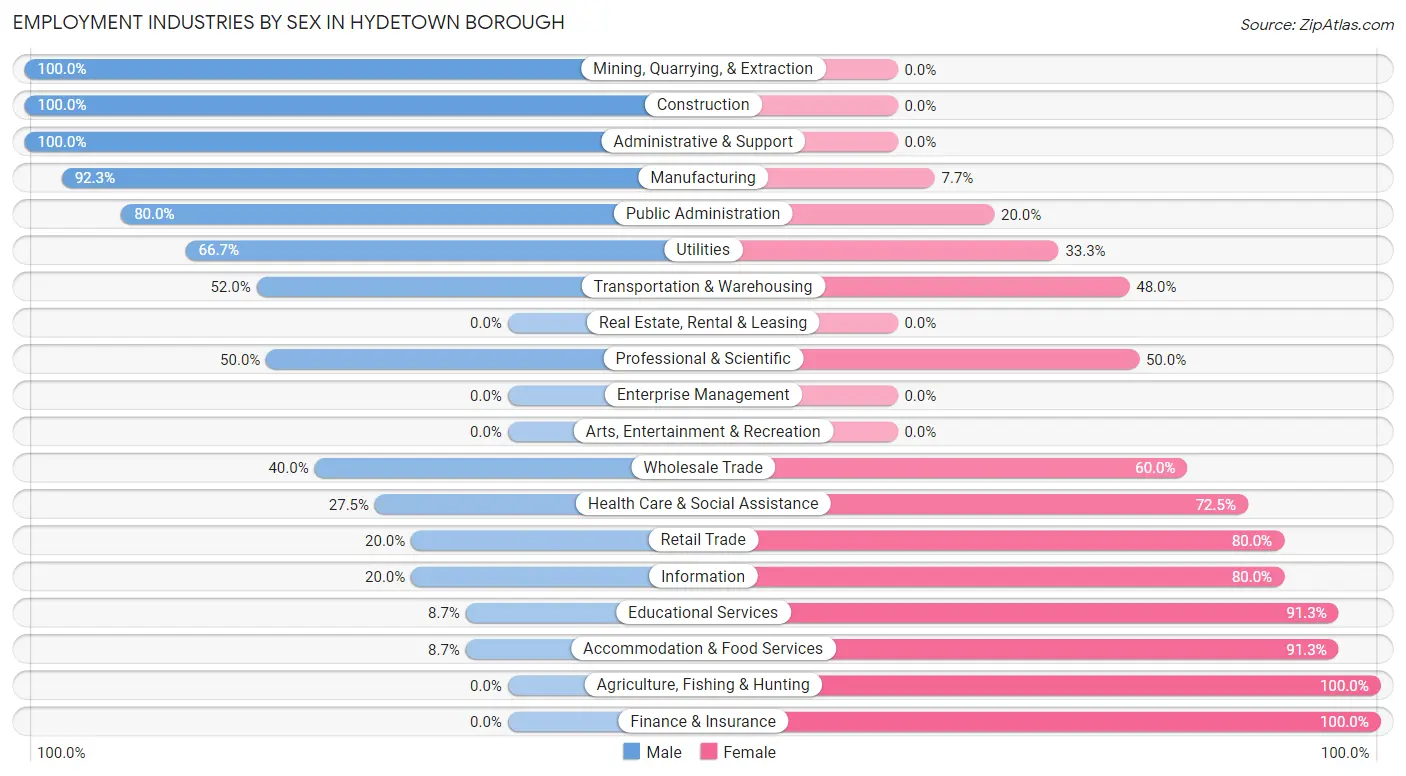
Employment Industries by Sex in Hydetown borough
The Hydetown borough industries that see more men than women are Mining, Quarrying, & Extraction (100.0%), Construction (100.0%), and Administrative & Support (100.0%), whereas the industries that tend to have a higher number of women are Agriculture, Fishing & Hunting (100.0%), Finance & Insurance (100.0%), and Educational Services (91.3%).
| Industry | Male | Female |
| Agriculture, Fishing & Hunting | 0 (0.0%) | 4 (100.0%) |
| Mining, Quarrying, & Extraction | 3 (100.0%) | 0 (0.0%) |
| Construction | 21 (100.0%) | 0 (0.0%) |
| Manufacturing | 36 (92.3%) | 3 (7.7%) |
| Wholesale Trade | 2 (40.0%) | 3 (60.0%) |
| Retail Trade | 3 (20.0%) | 12 (80.0%) |
| Transportation & Warehousing | 13 (52.0%) | 12 (48.0%) |
| Utilities | 2 (66.7%) | 1 (33.3%) |
| Information | 1 (20.0%) | 4 (80.0%) |
| Finance & Insurance | 0 (0.0%) | 5 (100.0%) |
| Real Estate, Rental & Leasing | 0 (0.0%) | 0 (0.0%) |
| Professional & Scientific | 2 (50.0%) | 2 (50.0%) |
| Enterprise Management | 0 (0.0%) | 0 (0.0%) |
| Administrative & Support | 14 (100.0%) | 0 (0.0%) |
| Educational Services | 2 (8.7%) | 21 (91.3%) |
| Health Care & Social Assistance | 11 (27.5%) | 29 (72.5%) |
| Arts, Entertainment & Recreation | 0 (0.0%) | 0 (0.0%) |
| Accommodation & Food Services | 2 (8.7%) | 21 (91.3%) |
| Public Administration | 8 (80.0%) | 2 (20.0%) |
| Total | 123 (48.6%) | 130 (51.4%) |
Education in Hydetown borough
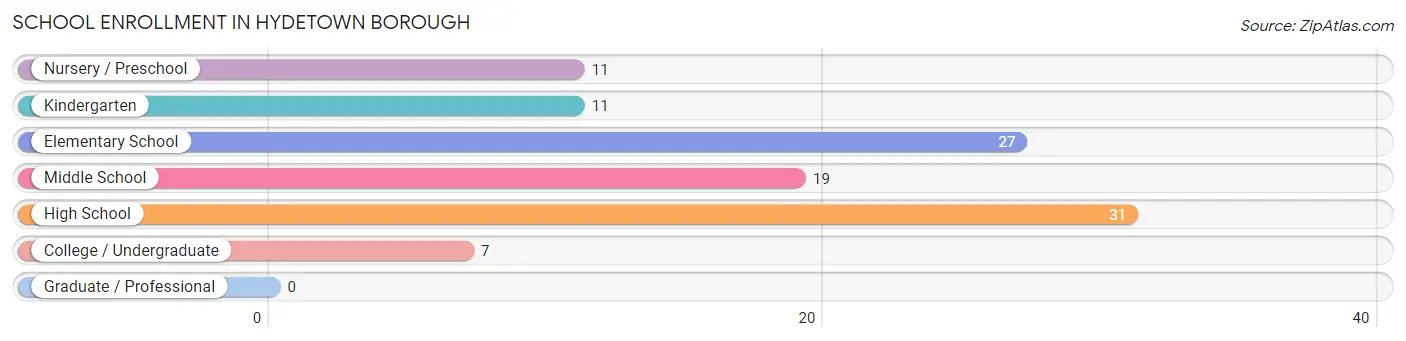
School Enrollment in Hydetown borough
The most common levels of schooling among the 106 students in Hydetown borough are high school (31 | 29.2%), elementary school (27 | 25.5%), and middle school (19 | 17.9%).
| School Level | # Students | % Students |
| Nursery / Preschool | 11 | 10.4% |
| Kindergarten | 11 | 10.4% |
| Elementary School | 27 | 25.5% |
| Middle School | 19 | 17.9% |
| High School | 31 | 29.2% |
| College / Undergraduate | 7 | 6.6% |
| Graduate / Professional | 0 | 0.0% |
| Total | 106 | 100.0% |
School Enrollment by Age by Funding Source in Hydetown borough
Out of a total of 106 students who are enrolled in schools in Hydetown borough, 18 (17.0%) attend a private institution, while the remaining 88 (83.0%) are enrolled in public schools. The age group of 20 to 24 year olds has the highest likelihood of being enrolled in private schools, with 3 (100.0% in the age bracket) enrolled. Conversely, the age group of 15 to 17 year olds has the lowest likelihood of being enrolled in a private school, with 21 (100.0% in the age bracket) attending a public institution.
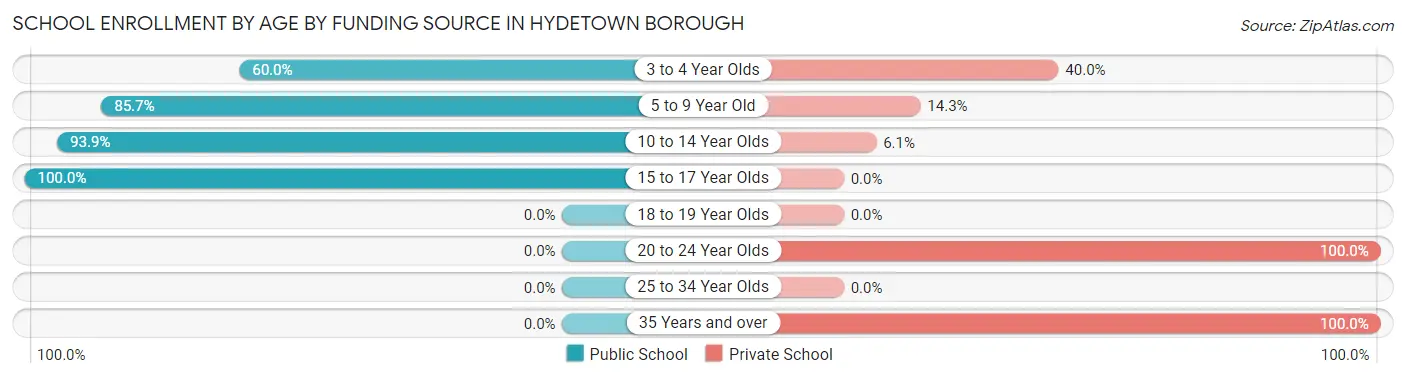
| Age Bracket | Public School | Private School |
| 3 to 4 Year Olds | 6 (60.0%) | 4 (40.0%) |
| 5 to 9 Year Old | 30 (85.7%) | 5 (14.3%) |
| 10 to 14 Year Olds | 31 (93.9%) | 2 (6.1%) |
| 15 to 17 Year Olds | 21 (100.0%) | 0 (0.0%) |
| 18 to 19 Year Olds | 0 (0.0%) | 0 (0.0%) |
| 20 to 24 Year Olds | 0 (0.0%) | 3 (100.0%) |
| 25 to 34 Year Olds | 0 (0.0%) | 0 (0.0%) |
| 35 Years and over | 0 (0.0%) | 4 (100.0%) |
| Total | 88 (83.0%) | 18 (17.0%) |
Educational Attainment by Field of Study in Hydetown borough
Education (16 | 28.6%), bio, nature & agricultural (15 | 26.8%), social sciences (7 | 12.5%), business (4 | 7.1%), and arts & humanities (4 | 7.1%) are the most common fields of study among 56 individuals in Hydetown borough who have obtained a bachelor's degree or higher.
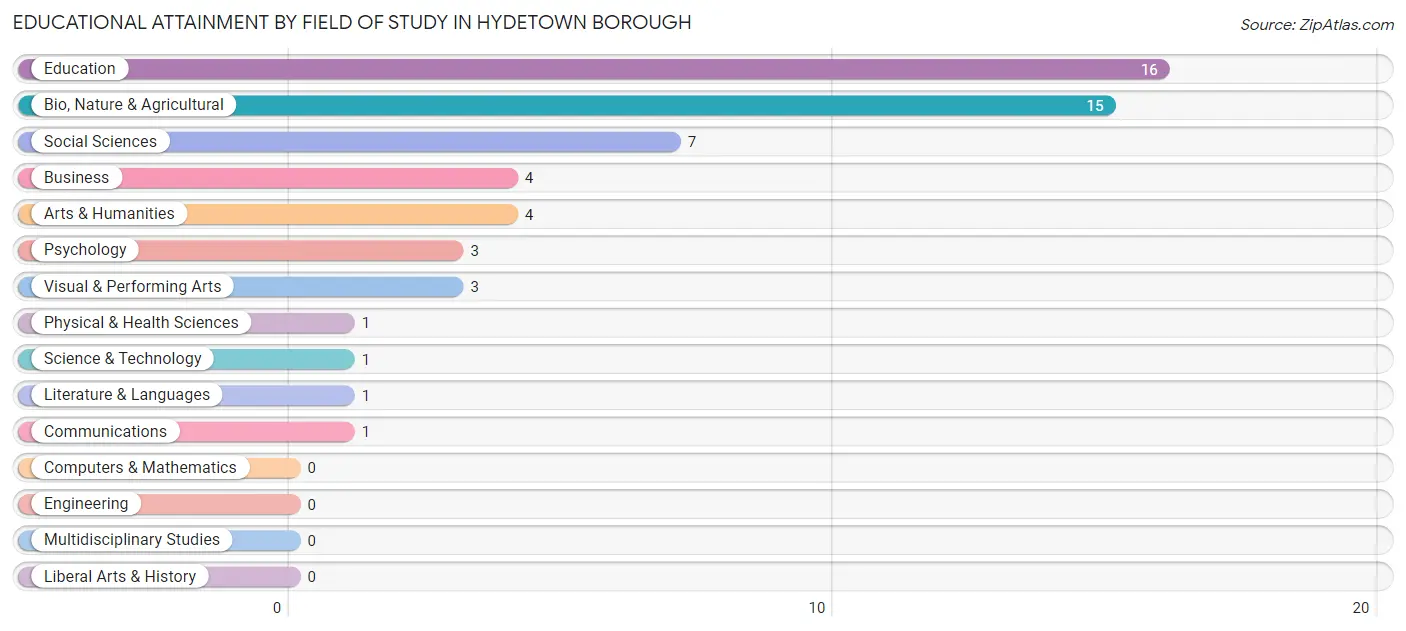
| Field of Study | # Graduates | % Graduates |
| Computers & Mathematics | 0 | 0.0% |
| Bio, Nature & Agricultural | 15 | 26.8% |
| Physical & Health Sciences | 1 | 1.8% |
| Psychology | 3 | 5.4% |
| Social Sciences | 7 | 12.5% |
| Engineering | 0 | 0.0% |
| Multidisciplinary Studies | 0 | 0.0% |
| Science & Technology | 1 | 1.8% |
| Business | 4 | 7.1% |
| Education | 16 | 28.6% |
| Literature & Languages | 1 | 1.8% |
| Liberal Arts & History | 0 | 0.0% |
| Visual & Performing Arts | 3 | 5.4% |
| Communications | 1 | 1.8% |
| Arts & Humanities | 4 | 7.1% |
| Total | 56 | 100.0% |
Transportation & Commute in Hydetown borough
Vehicle Availability by Sex in Hydetown borough
The most prevalent vehicle ownership categories in Hydetown borough are males with 2 vehicles (60, accounting for 48.8%) and females with 2 vehicles (63, making up 46.2%).
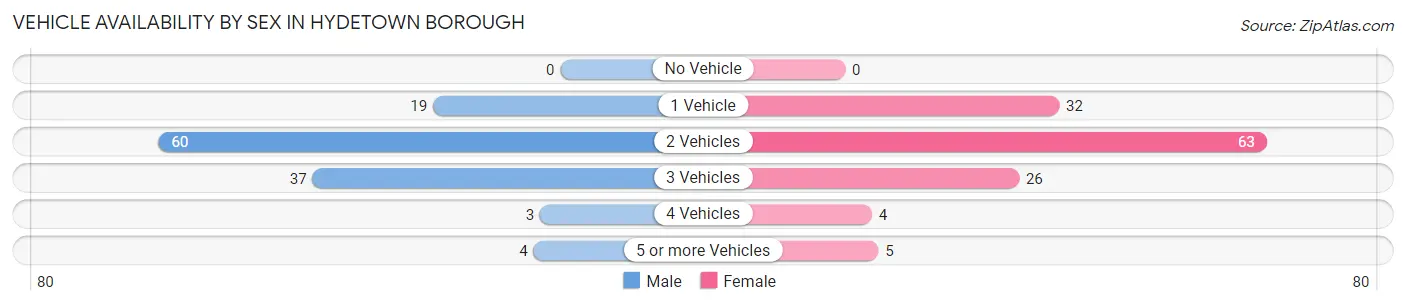
| Vehicles Available | Male | Female |
| No Vehicle | 0 (0.0%) | 0 (0.0%) |
| 1 Vehicle | 19 (15.4%) | 32 (24.6%) |
| 2 Vehicles | 60 (48.8%) | 63 (48.5%) |
| 3 Vehicles | 37 (30.1%) | 26 (20.0%) |
| 4 Vehicles | 3 (2.4%) | 4 (3.1%) |
| 5 or more Vehicles | 4 (3.3%) | 5 (3.8%) |
| Total | 123 (100.0%) | 130 (100.0%) |
Commute Time in Hydetown borough
The most frequently occuring commute durations in Hydetown borough are 10 to 14 minutes (56 commuters, 24.2%), 5 to 9 minutes (43 commuters, 18.6%), and 30 to 34 minutes (27 commuters, 11.7%).
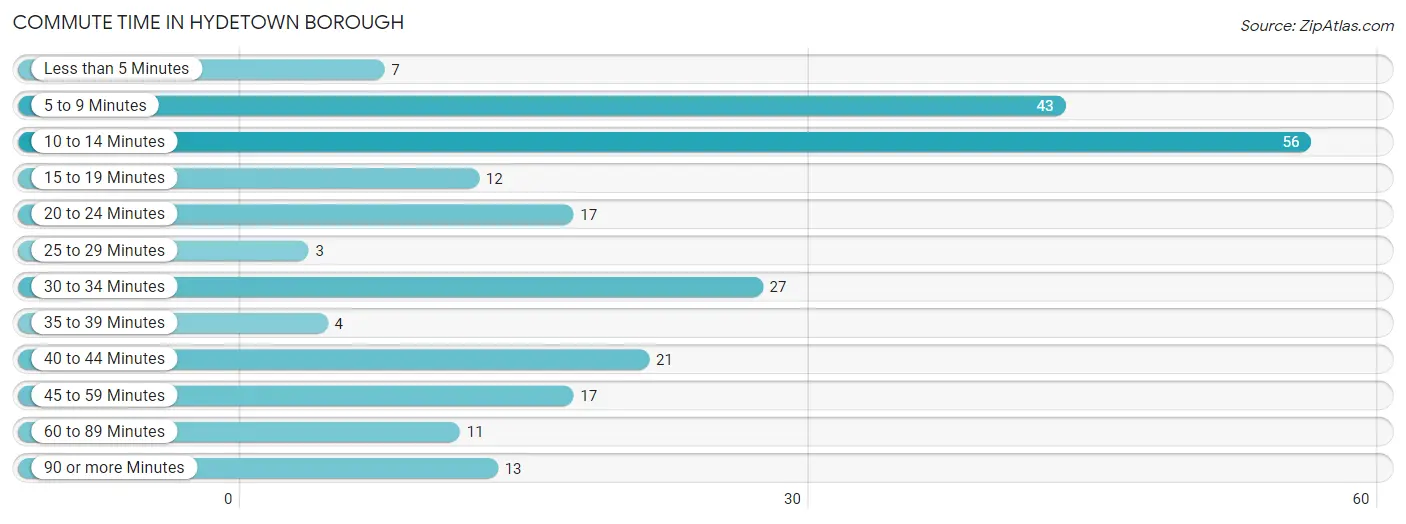
| Commute Time | # Commuters | % Commuters |
| Less than 5 Minutes | 7 | 3.0% |
| 5 to 9 Minutes | 43 | 18.6% |
| 10 to 14 Minutes | 56 | 24.2% |
| 15 to 19 Minutes | 12 | 5.2% |
| 20 to 24 Minutes | 17 | 7.4% |
| 25 to 29 Minutes | 3 | 1.3% |
| 30 to 34 Minutes | 27 | 11.7% |
| 35 to 39 Minutes | 4 | 1.7% |
| 40 to 44 Minutes | 21 | 9.1% |
| 45 to 59 Minutes | 17 | 7.4% |
| 60 to 89 Minutes | 11 | 4.8% |
| 90 or more Minutes | 13 | 5.6% |
Commute Time by Sex in Hydetown borough
The most common commute times in Hydetown borough are 5 to 9 minutes (28 commuters, 23.9%) for males and 10 to 14 minutes (41 commuters, 36.0%) for females.
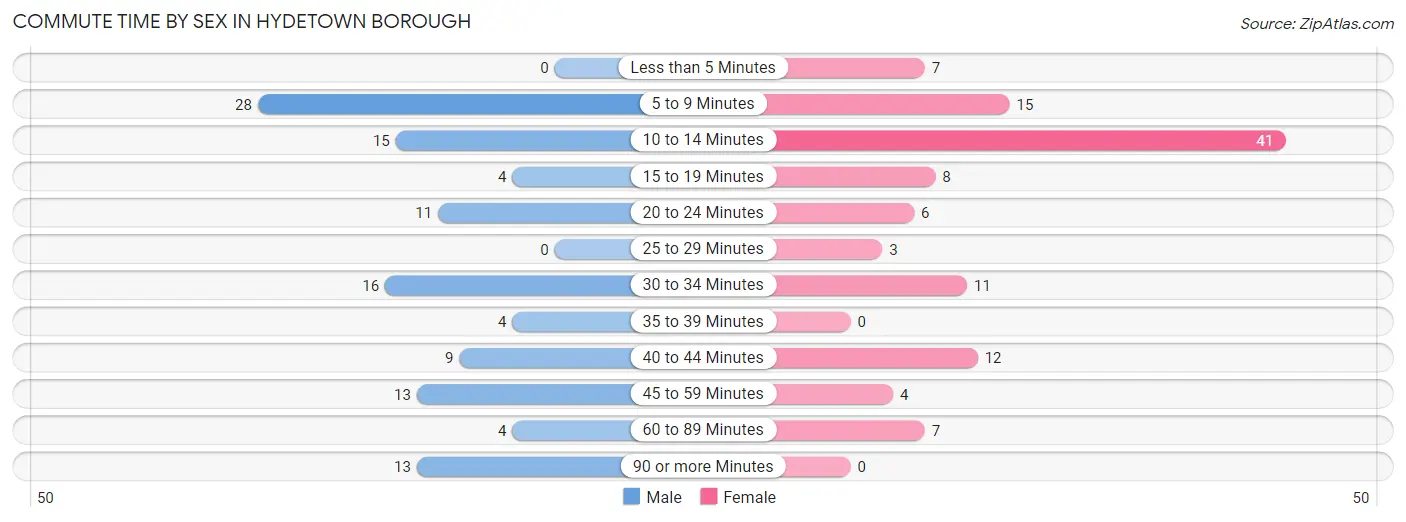
| Commute Time | Male | Female |
| Less than 5 Minutes | 0 (0.0%) | 7 (6.1%) |
| 5 to 9 Minutes | 28 (23.9%) | 15 (13.2%) |
| 10 to 14 Minutes | 15 (12.8%) | 41 (36.0%) |
| 15 to 19 Minutes | 4 (3.4%) | 8 (7.0%) |
| 20 to 24 Minutes | 11 (9.4%) | 6 (5.3%) |
| 25 to 29 Minutes | 0 (0.0%) | 3 (2.6%) |
| 30 to 34 Minutes | 16 (13.7%) | 11 (9.7%) |
| 35 to 39 Minutes | 4 (3.4%) | 0 (0.0%) |
| 40 to 44 Minutes | 9 (7.7%) | 12 (10.5%) |
| 45 to 59 Minutes | 13 (11.1%) | 4 (3.5%) |
| 60 to 89 Minutes | 4 (3.4%) | 7 (6.1%) |
| 90 or more Minutes | 13 (11.1%) | 0 (0.0%) |
Time of Departure to Work by Sex in Hydetown borough
The most frequent times of departure to work in Hydetown borough are 5:00 AM to 5:29 AM (22, 18.8%) for males and 7:00 AM to 7:29 AM (25, 21.9%) for females.
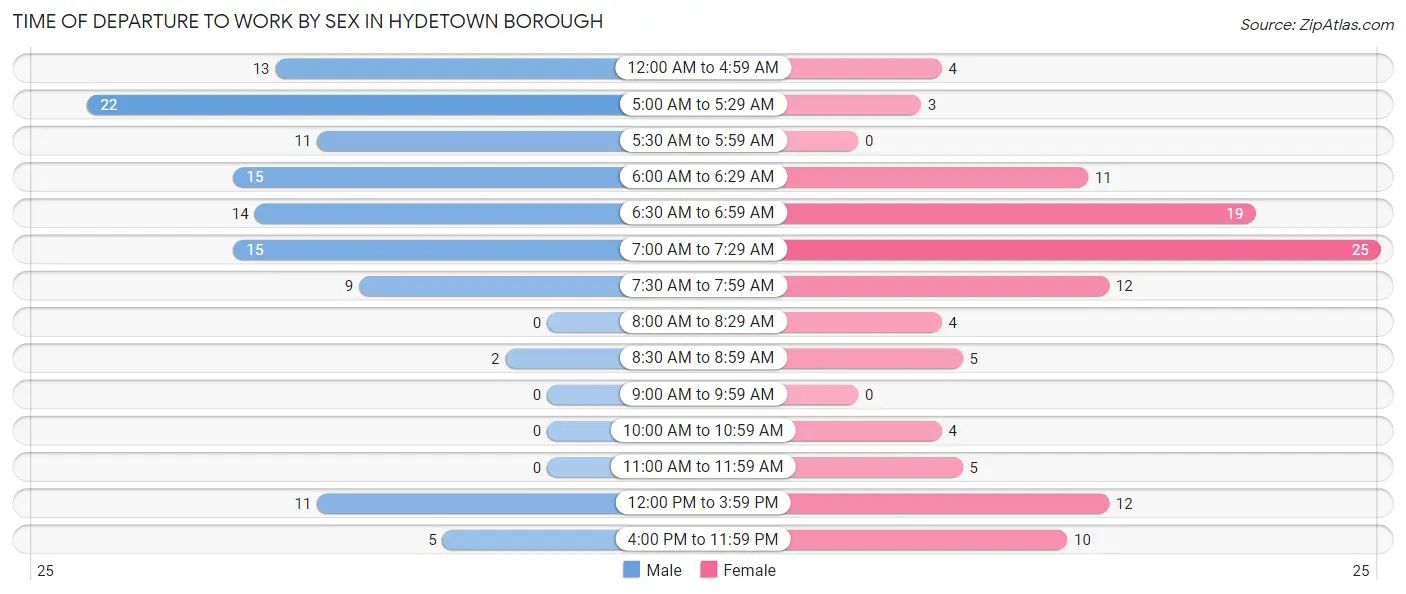
| Time of Departure | Male | Female |
| 12:00 AM to 4:59 AM | 13 (11.1%) | 4 (3.5%) |
| 5:00 AM to 5:29 AM | 22 (18.8%) | 3 (2.6%) |
| 5:30 AM to 5:59 AM | 11 (9.4%) | 0 (0.0%) |
| 6:00 AM to 6:29 AM | 15 (12.8%) | 11 (9.7%) |
| 6:30 AM to 6:59 AM | 14 (12.0%) | 19 (16.7%) |
| 7:00 AM to 7:29 AM | 15 (12.8%) | 25 (21.9%) |
| 7:30 AM to 7:59 AM | 9 (7.7%) | 12 (10.5%) |
| 8:00 AM to 8:29 AM | 0 (0.0%) | 4 (3.5%) |
| 8:30 AM to 8:59 AM | 2 (1.7%) | 5 (4.4%) |
| 9:00 AM to 9:59 AM | 0 (0.0%) | 0 (0.0%) |
| 10:00 AM to 10:59 AM | 0 (0.0%) | 4 (3.5%) |
| 11:00 AM to 11:59 AM | 0 (0.0%) | 5 (4.4%) |
| 12:00 PM to 3:59 PM | 11 (9.4%) | 12 (10.5%) |
| 4:00 PM to 11:59 PM | 5 (4.3%) | 10 (8.8%) |
| Total | 117 (100.0%) | 114 (100.0%) |
Housing Occupancy in Hydetown borough
Occupancy by Ownership in Hydetown borough
Of the total 286 dwellings in Hydetown borough, owner-occupied units account for 234 (81.8%), while renter-occupied units make up 52 (18.2%).
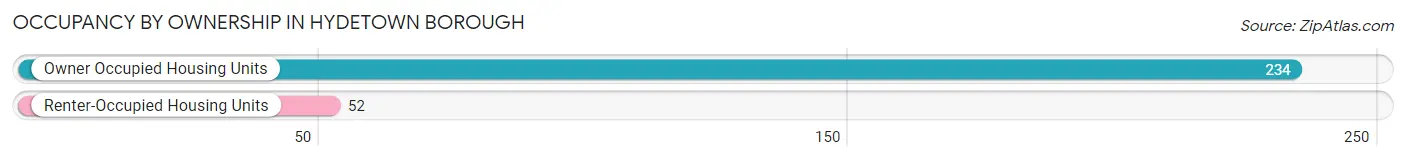
| Occupancy | # Housing Units | % Housing Units |
| Owner Occupied Housing Units | 234 | 81.8% |
| Renter-Occupied Housing Units | 52 | 18.2% |
| Total Occupied Housing Units | 286 | 100.0% |
Occupancy by Household Size in Hydetown borough
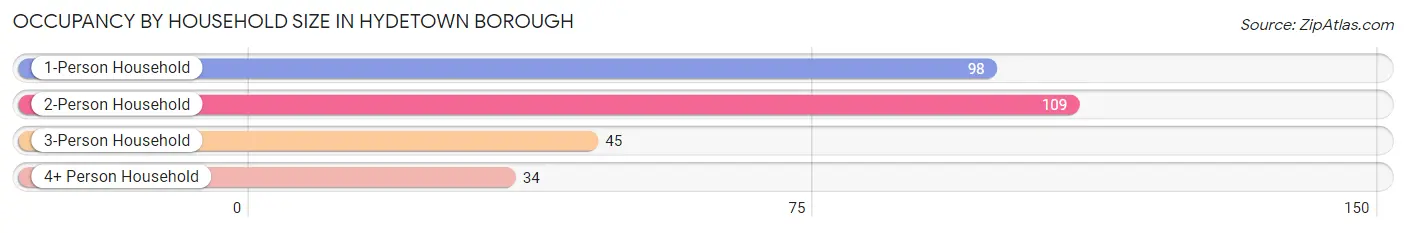
| Household Size | # Housing Units | % Housing Units |
| 1-Person Household | 98 | 34.3% |
| 2-Person Household | 109 | 38.1% |
| 3-Person Household | 45 | 15.7% |
| 4+ Person Household | 34 | 11.9% |
| Total Housing Units | 286 | 100.0% |
Occupancy by Ownership by Household Size in Hydetown borough
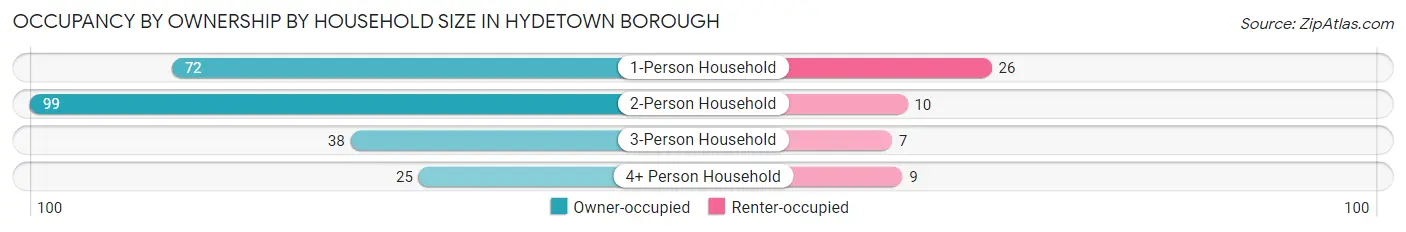
| Household Size | Owner-occupied | Renter-occupied |
| 1-Person Household | 72 (73.5%) | 26 (26.5%) |
| 2-Person Household | 99 (90.8%) | 10 (9.2%) |
| 3-Person Household | 38 (84.4%) | 7 (15.6%) |
| 4+ Person Household | 25 (73.5%) | 9 (26.5%) |
| Total Housing Units | 234 (81.8%) | 52 (18.2%) |
Occupancy by Educational Attainment in Hydetown borough
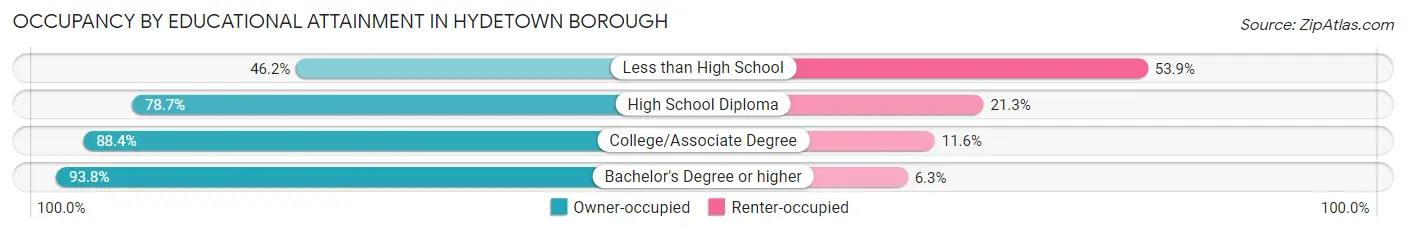
| Household Size | Owner-occupied | Renter-occupied |
| Less than High School | 6 (46.2%) | 7 (53.8%) |
| High School Diploma | 122 (78.7%) | 33 (21.3%) |
| College/Associate Degree | 76 (88.4%) | 10 (11.6%) |
| Bachelor's Degree or higher | 30 (93.8%) | 2 (6.2%) |
Occupancy by Age of Householder in Hydetown borough
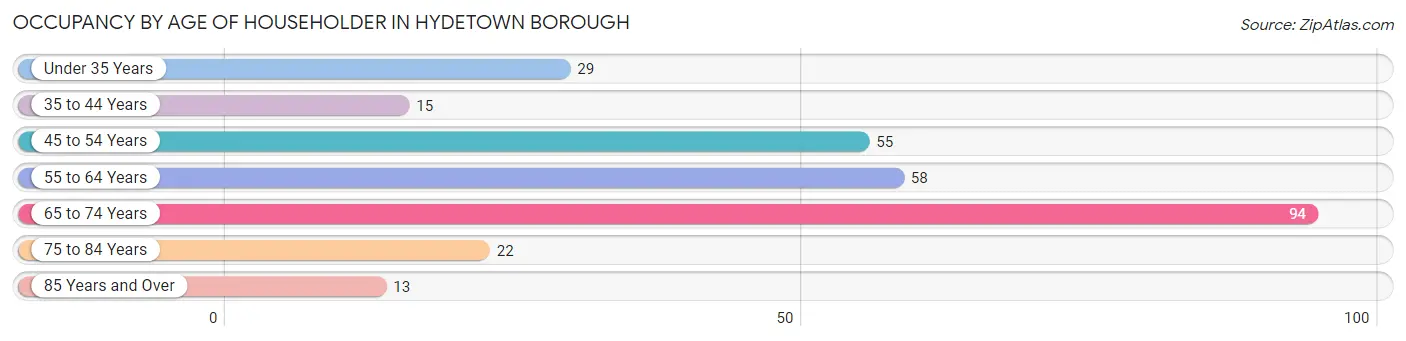
| Age Bracket | # Households | % Households |
| Under 35 Years | 29 | 10.1% |
| 35 to 44 Years | 15 | 5.2% |
| 45 to 54 Years | 55 | 19.2% |
| 55 to 64 Years | 58 | 20.3% |
| 65 to 74 Years | 94 | 32.9% |
| 75 to 84 Years | 22 | 7.7% |
| 85 Years and Over | 13 | 4.5% |
| Total | 286 | 100.0% |
Housing Finances in Hydetown borough
Median Income by Occupancy in Hydetown borough
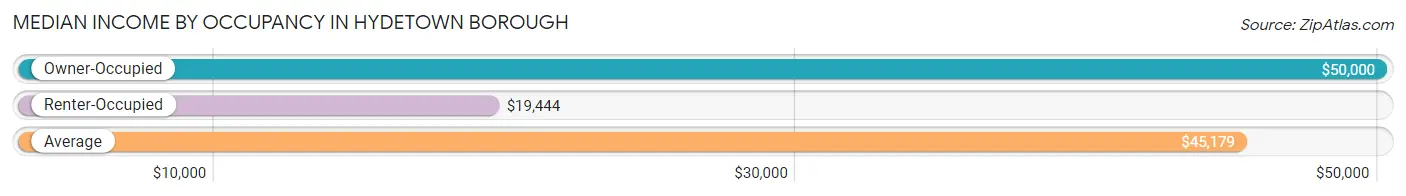
| Occupancy Type | # Households | Median Income |
| Owner-Occupied | 234 (81.8%) | $50,000 |
| Renter-Occupied | 52 (18.2%) | $19,444 |
| Average | 286 (100.0%) | $45,179 |
Occupancy by Householder Income Bracket in Hydetown borough
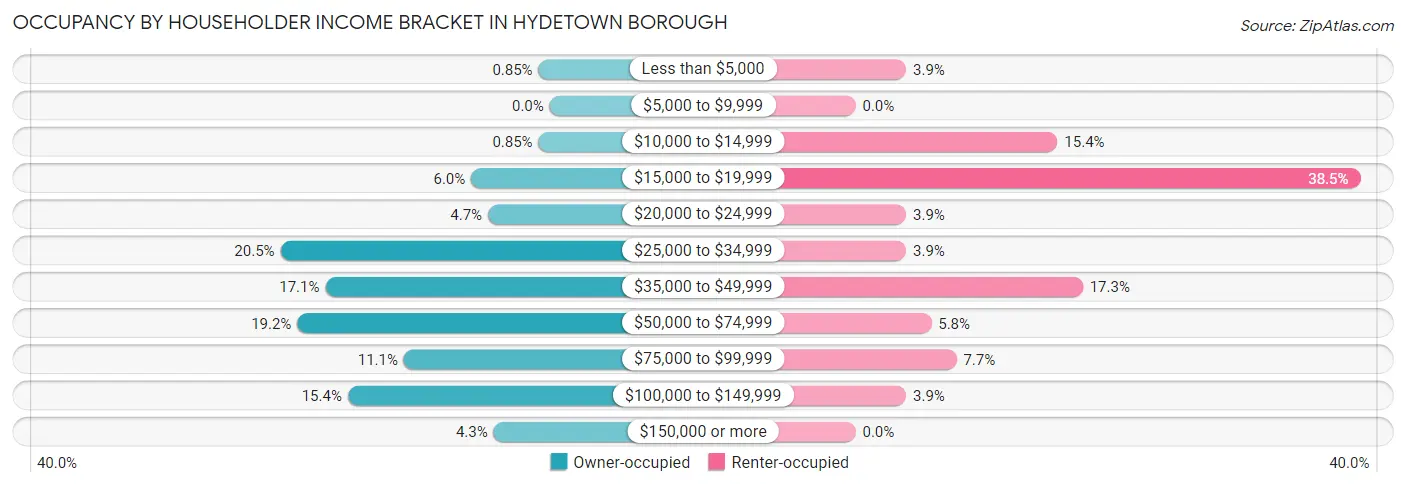
| Income Bracket | Owner-occupied | Renter-occupied |
| Less than $5,000 | 2 (0.9%) | 2 (3.8%) |
| $5,000 to $9,999 | 0 (0.0%) | 0 (0.0%) |
| $10,000 to $14,999 | 2 (0.9%) | 8 (15.4%) |
| $15,000 to $19,999 | 14 (6.0%) | 20 (38.5%) |
| $20,000 to $24,999 | 11 (4.7%) | 2 (3.8%) |
| $25,000 to $34,999 | 48 (20.5%) | 2 (3.8%) |
| $35,000 to $49,999 | 40 (17.1%) | 9 (17.3%) |
| $50,000 to $74,999 | 45 (19.2%) | 3 (5.8%) |
| $75,000 to $99,999 | 26 (11.1%) | 4 (7.7%) |
| $100,000 to $149,999 | 36 (15.4%) | 2 (3.8%) |
| $150,000 or more | 10 (4.3%) | 0 (0.0%) |
| Total | 234 (100.0%) | 52 (100.0%) |
Monthly Housing Cost Tiers in Hydetown borough
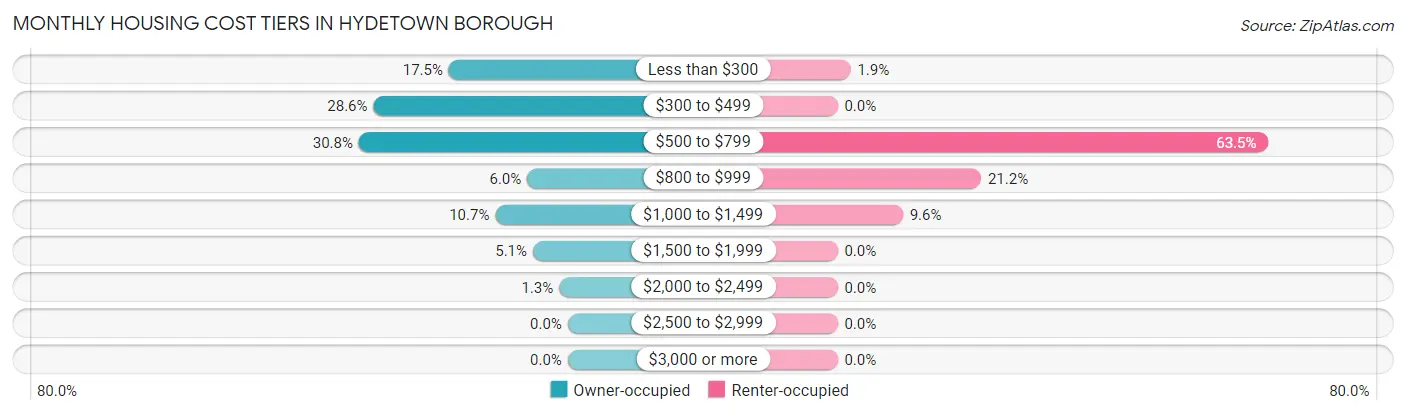
| Monthly Cost | Owner-occupied | Renter-occupied |
| Less than $300 | 41 (17.5%) | 1 (1.9%) |
| $300 to $499 | 67 (28.6%) | 0 (0.0%) |
| $500 to $799 | 72 (30.8%) | 33 (63.5%) |
| $800 to $999 | 14 (6.0%) | 11 (21.1%) |
| $1,000 to $1,499 | 25 (10.7%) | 5 (9.6%) |
| $1,500 to $1,999 | 12 (5.1%) | 0 (0.0%) |
| $2,000 to $2,499 | 3 (1.3%) | 0 (0.0%) |
| $2,500 to $2,999 | 0 (0.0%) | 0 (0.0%) |
| $3,000 or more | 0 (0.0%) | 0 (0.0%) |
| Total | 234 (100.0%) | 52 (100.0%) |
Physical Housing Characteristics in Hydetown borough
Housing Structures in Hydetown borough
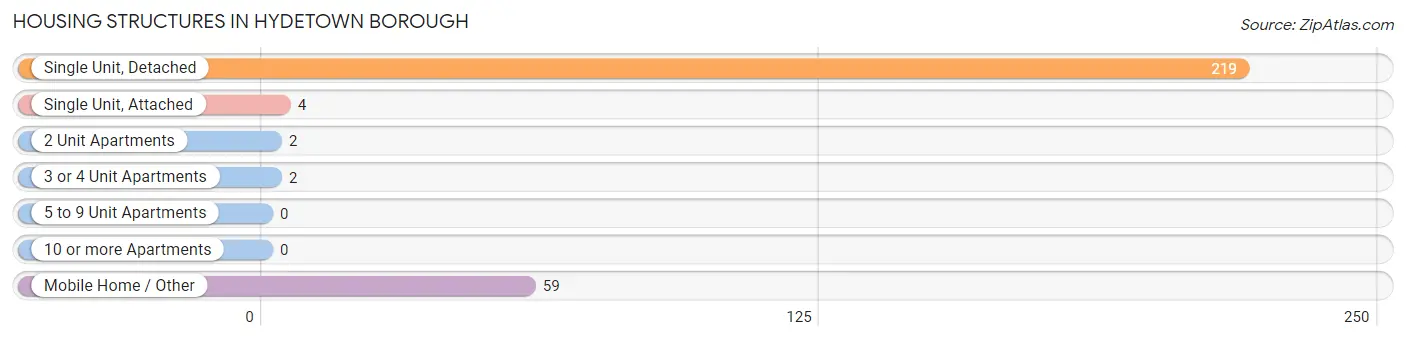
| Structure Type | # Housing Units | % Housing Units |
| Single Unit, Detached | 219 | 76.6% |
| Single Unit, Attached | 4 | 1.4% |
| 2 Unit Apartments | 2 | 0.7% |
| 3 or 4 Unit Apartments | 2 | 0.7% |
| 5 to 9 Unit Apartments | 0 | 0.0% |
| 10 or more Apartments | 0 | 0.0% |
| Mobile Home / Other | 59 | 20.6% |
| Total | 286 | 100.0% |
Housing Structures by Occupancy in Hydetown borough
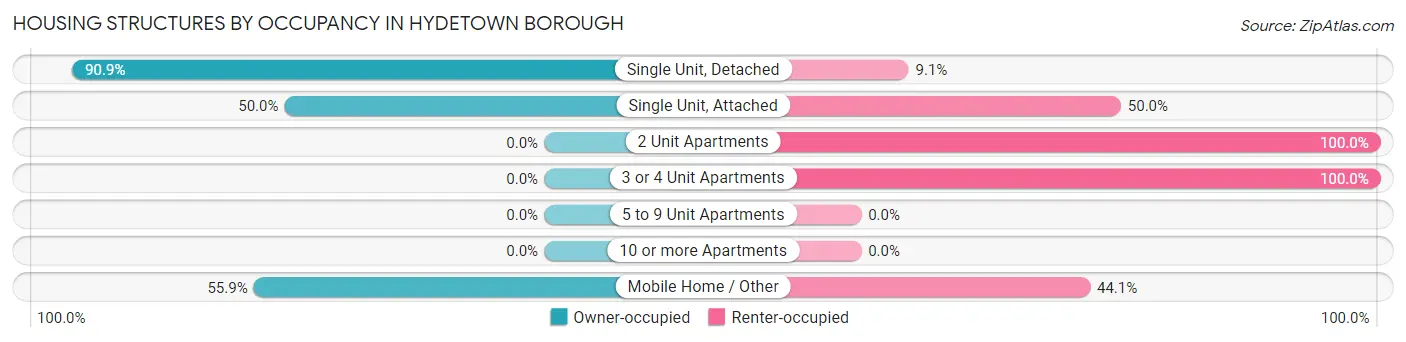
| Structure Type | Owner-occupied | Renter-occupied |
| Single Unit, Detached | 199 (90.9%) | 20 (9.1%) |
| Single Unit, Attached | 2 (50.0%) | 2 (50.0%) |
| 2 Unit Apartments | 0 (0.0%) | 2 (100.0%) |
| 3 or 4 Unit Apartments | 0 (0.0%) | 2 (100.0%) |
| 5 to 9 Unit Apartments | 0 (0.0%) | 0 (0.0%) |
| 10 or more Apartments | 0 (0.0%) | 0 (0.0%) |
| Mobile Home / Other | 33 (55.9%) | 26 (44.1%) |
| Total | 234 (81.8%) | 52 (18.2%) |
Housing Structures by Number of Rooms in Hydetown borough
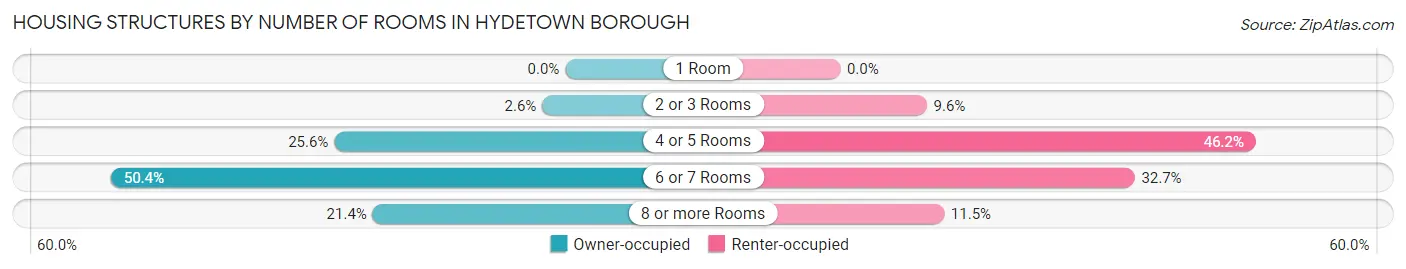
| Number of Rooms | Owner-occupied | Renter-occupied |
| 1 Room | 0 (0.0%) | 0 (0.0%) |
| 2 or 3 Rooms | 6 (2.6%) | 5 (9.6%) |
| 4 or 5 Rooms | 60 (25.6%) | 24 (46.2%) |
| 6 or 7 Rooms | 118 (50.4%) | 17 (32.7%) |
| 8 or more Rooms | 50 (21.4%) | 6 (11.5%) |
| Total | 234 (100.0%) | 52 (100.0%) |
Housing Structure by Heating Type in Hydetown borough
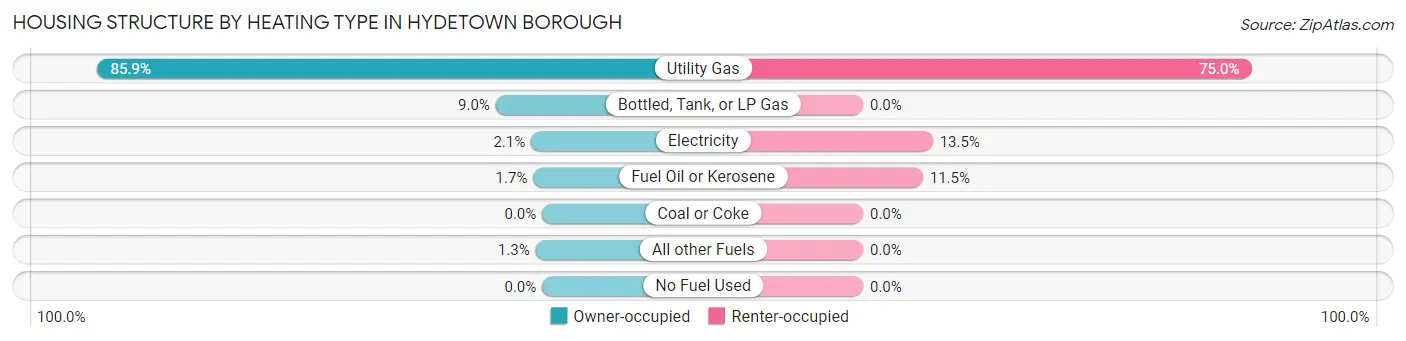
| Heating Type | Owner-occupied | Renter-occupied |
| Utility Gas | 201 (85.9%) | 39 (75.0%) |
| Bottled, Tank, or LP Gas | 21 (9.0%) | 0 (0.0%) |
| Electricity | 5 (2.1%) | 7 (13.5%) |
| Fuel Oil or Kerosene | 4 (1.7%) | 6 (11.5%) |
| Coal or Coke | 0 (0.0%) | 0 (0.0%) |
| All other Fuels | 3 (1.3%) | 0 (0.0%) |
| No Fuel Used | 0 (0.0%) | 0 (0.0%) |
| Total | 234 (100.0%) | 52 (100.0%) |
Household Vehicle Usage in Hydetown borough
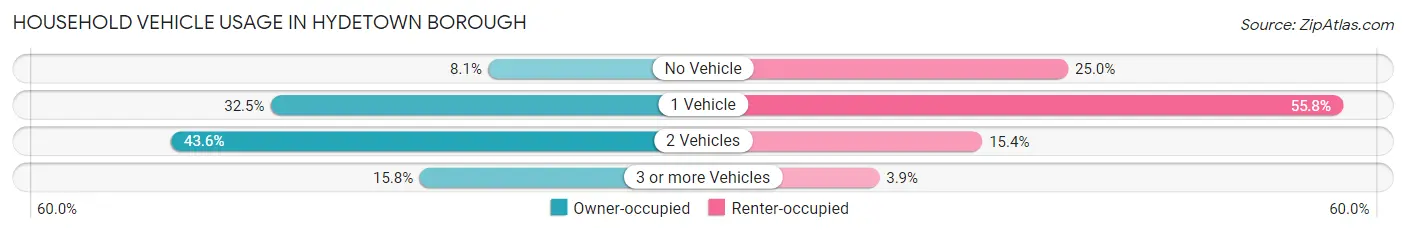
| Vehicles per Household | Owner-occupied | Renter-occupied |
| No Vehicle | 19 (8.1%) | 13 (25.0%) |
| 1 Vehicle | 76 (32.5%) | 29 (55.8%) |
| 2 Vehicles | 102 (43.6%) | 8 (15.4%) |
| 3 or more Vehicles | 37 (15.8%) | 2 (3.8%) |
| Total | 234 (100.0%) | 52 (100.0%) |
Real Estate & Mortgages in Hydetown borough
Real Estate and Mortgage Overview in Hydetown borough
| Characteristic | Without Mortgage | With Mortgage |
| Housing Units | 142 | 92 |
| Median Property Value | $69,100 | $135,400 |
| Median Household Income | $41,923 | $7 |
| Monthly Housing Costs | $400 | $0 |
| Real Estate Taxes | $1,182 | $6 |
Property Value by Mortgage Status in Hydetown borough
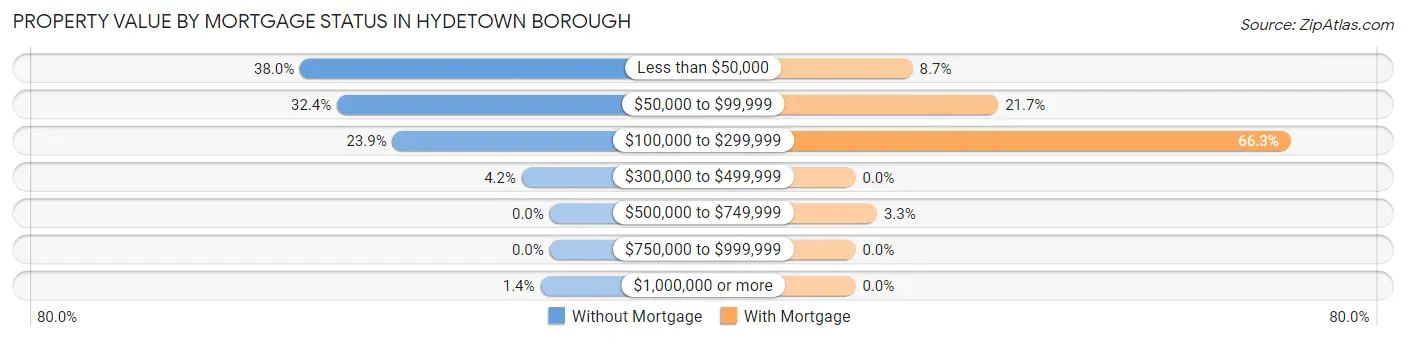
| Property Value | Without Mortgage | With Mortgage |
| Less than $50,000 | 54 (38.0%) | 8 (8.7%) |
| $50,000 to $99,999 | 46 (32.4%) | 20 (21.7%) |
| $100,000 to $299,999 | 34 (23.9%) | 61 (66.3%) |
| $300,000 to $499,999 | 6 (4.2%) | 0 (0.0%) |
| $500,000 to $749,999 | 0 (0.0%) | 3 (3.3%) |
| $750,000 to $999,999 | 0 (0.0%) | 0 (0.0%) |
| $1,000,000 or more | 2 (1.4%) | 0 (0.0%) |
| Total | 142 (100.0%) | 92 (100.0%) |
Household Income by Mortgage Status in Hydetown borough
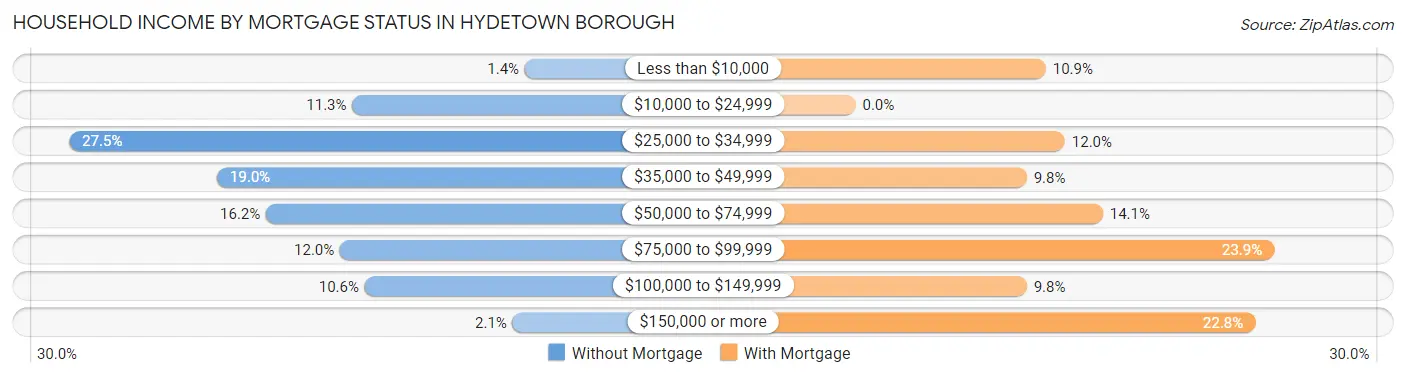
| Household Income | Without Mortgage | With Mortgage |
| Less than $10,000 | 2 (1.4%) | 10 (10.9%) |
| $10,000 to $24,999 | 16 (11.3%) | 0 (0.0%) |
| $25,000 to $34,999 | 39 (27.5%) | 11 (12.0%) |
| $35,000 to $49,999 | 27 (19.0%) | 9 (9.8%) |
| $50,000 to $74,999 | 23 (16.2%) | 13 (14.1%) |
| $75,000 to $99,999 | 17 (12.0%) | 22 (23.9%) |
| $100,000 to $149,999 | 15 (10.6%) | 9 (9.8%) |
| $150,000 or more | 3 (2.1%) | 21 (22.8%) |
| Total | 142 (100.0%) | 92 (100.0%) |
Property Value to Household Income Ratio in Hydetown borough
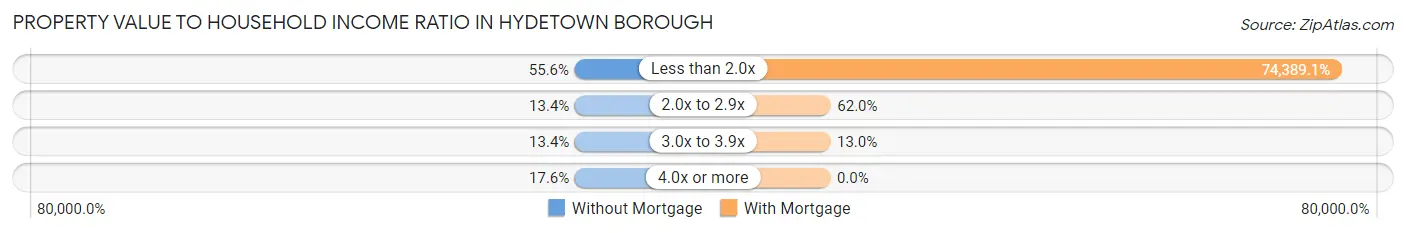
| Value-to-Income Ratio | Without Mortgage | With Mortgage |
| Less than 2.0x | 79 (55.6%) | 68,438 (74,389.1%) |
| 2.0x to 2.9x | 19 (13.4%) | 57 (62.0%) |
| 3.0x to 3.9x | 19 (13.4%) | 12 (13.0%) |
| 4.0x or more | 25 (17.6%) | 0 (0.0%) |
| Total | 142 (100.0%) | 92 (100.0%) |
Real Estate Taxes by Mortgage Status in Hydetown borough
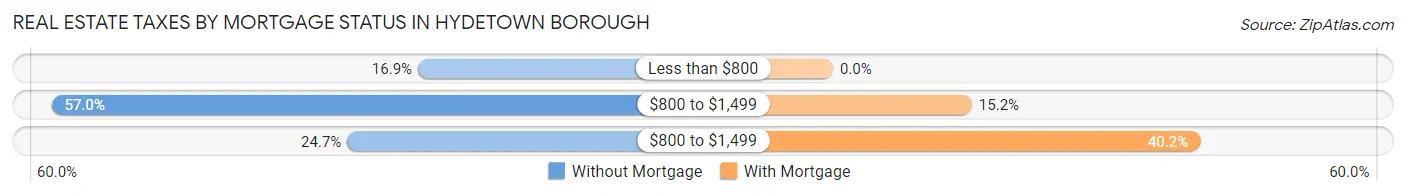
| Property Taxes | Without Mortgage | With Mortgage |
| Less than $800 | 24 (16.9%) | 0 (0.0%) |
| $800 to $1,499 | 81 (57.0%) | 14 (15.2%) |
| $800 to $1,499 | 35 (24.6%) | 37 (40.2%) |
| Total | 142 (100.0%) | 92 (100.0%) |
Health & Disability in Hydetown borough
Health Insurance Coverage by Age in Hydetown borough
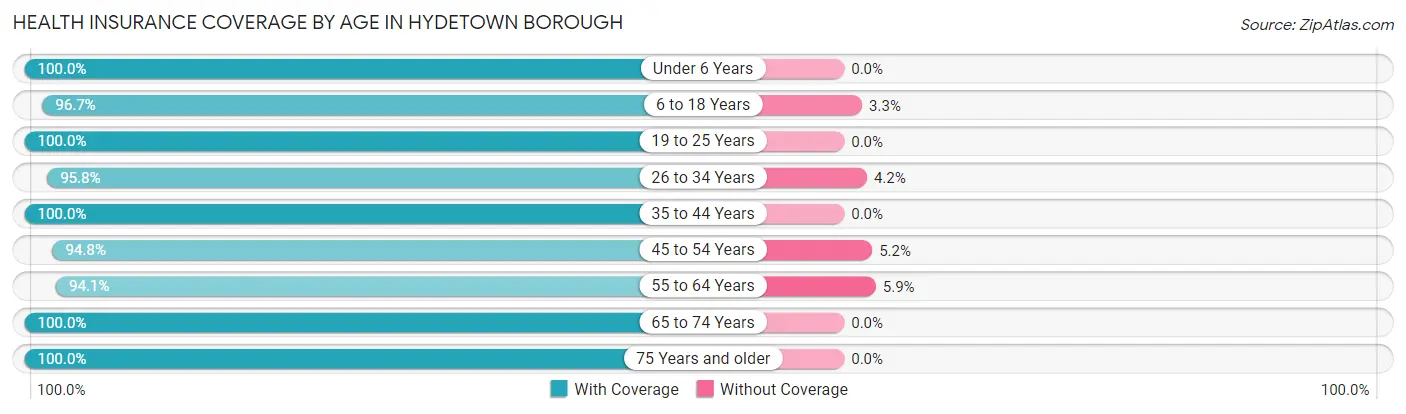
| Age Bracket | With Coverage | Without Coverage |
| Under 6 Years | 26 (100.0%) | 0 (0.0%) |
| 6 to 18 Years | 87 (96.7%) | 3 (3.3%) |
| 19 to 25 Years | 30 (100.0%) | 0 (0.0%) |
| 26 to 34 Years | 68 (95.8%) | 3 (4.2%) |
| 35 to 44 Years | 49 (100.0%) | 0 (0.0%) |
| 45 to 54 Years | 91 (94.8%) | 5 (5.2%) |
| 55 to 64 Years | 96 (94.1%) | 6 (5.9%) |
| 65 to 74 Years | 120 (100.0%) | 0 (0.0%) |
| 75 Years and older | 63 (100.0%) | 0 (0.0%) |
| Total | 630 (97.4%) | 17 (2.6%) |
Health Insurance Coverage by Citizenship Status in Hydetown borough
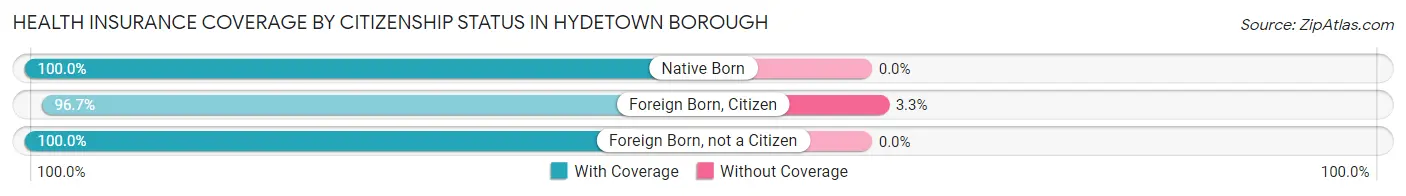
| Citizenship Status | With Coverage | Without Coverage |
| Native Born | 26 (100.0%) | 0 (0.0%) |
| Foreign Born, Citizen | 87 (96.7%) | 3 (3.3%) |
| Foreign Born, not a Citizen | 30 (100.0%) | 0 (0.0%) |
Health Insurance Coverage by Household Income in Hydetown borough
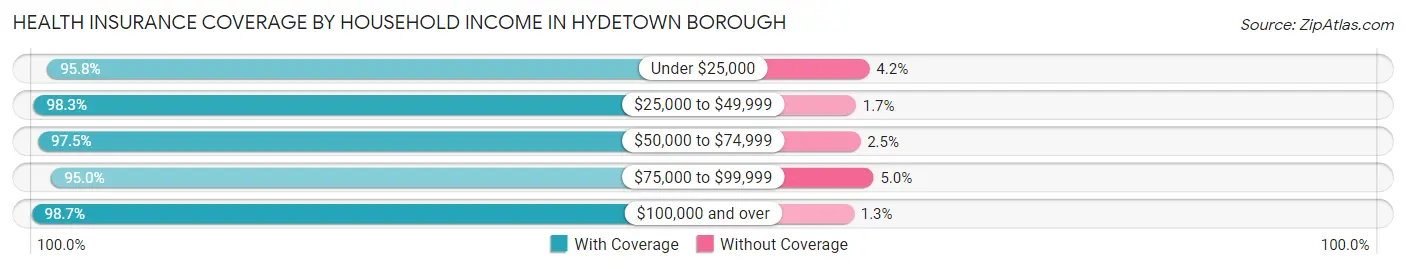
| Household Income | With Coverage | Without Coverage |
| Under $25,000 | 113 (95.8%) | 5 (4.2%) |
| $25,000 to $49,999 | 174 (98.3%) | 3 (1.7%) |
| $50,000 to $74,999 | 116 (97.5%) | 3 (2.5%) |
| $75,000 to $99,999 | 76 (95.0%) | 4 (5.0%) |
| $100,000 and over | 151 (98.7%) | 2 (1.3%) |
Public vs Private Health Insurance Coverage by Age in Hydetown borough
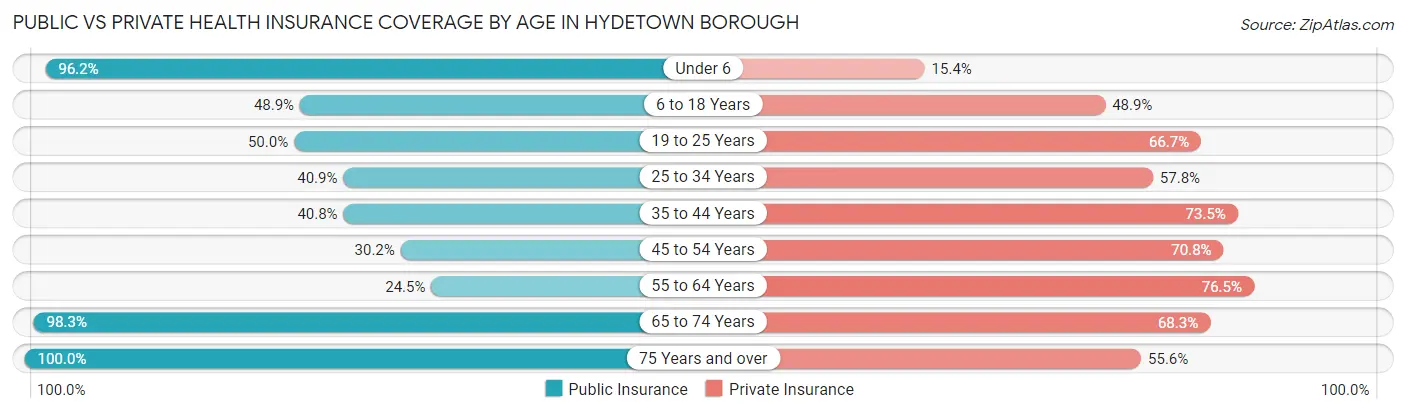
| Age Bracket | Public Insurance | Private Insurance |
| Under 6 | 25 (96.2%) | 4 (15.4%) |
| 6 to 18 Years | 44 (48.9%) | 44 (48.9%) |
| 19 to 25 Years | 15 (50.0%) | 20 (66.7%) |
| 25 to 34 Years | 29 (40.8%) | 41 (57.8%) |
| 35 to 44 Years | 20 (40.8%) | 36 (73.5%) |
| 45 to 54 Years | 29 (30.2%) | 68 (70.8%) |
| 55 to 64 Years | 25 (24.5%) | 78 (76.5%) |
| 65 to 74 Years | 118 (98.3%) | 82 (68.3%) |
| 75 Years and over | 63 (100.0%) | 35 (55.6%) |
| Total | 368 (56.9%) | 408 (63.1%) |
Disability Status by Sex by Age in Hydetown borough
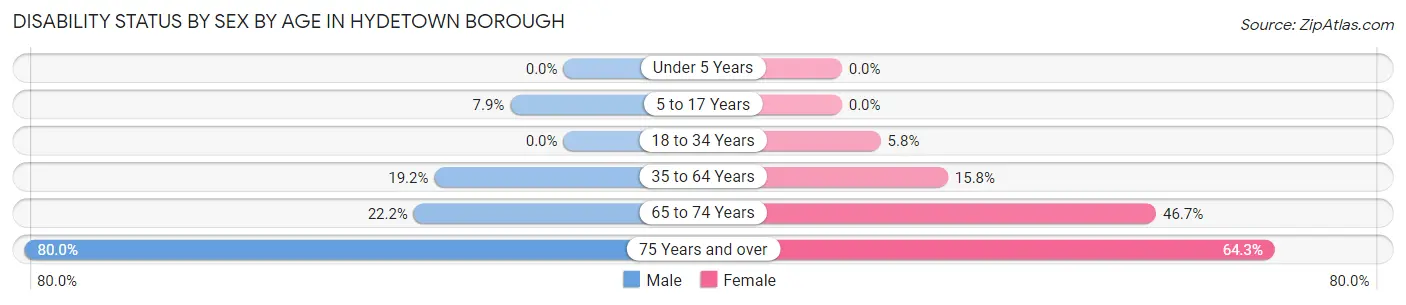
| Age Bracket | Male | Female |
| Under 5 Years | 0 (0.0%) | 0 (0.0%) |
| 5 to 17 Years | 3 (7.9%) | 0 (0.0%) |
| 18 to 34 Years | 0 (0.0%) | 3 (5.8%) |
| 35 to 64 Years | 23 (19.2%) | 20 (15.8%) |
| 65 to 74 Years | 10 (22.2%) | 35 (46.7%) |
| 75 Years and over | 28 (80.0%) | 18 (64.3%) |
Disability Class by Sex by Age in Hydetown borough
Disability Class: Hearing Difficulty
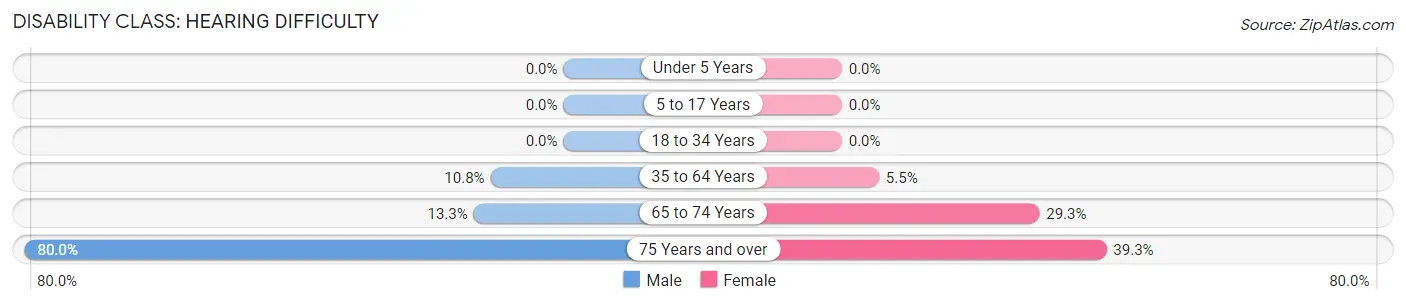
| Age Bracket | Male | Female |
| Under 5 Years | 0 (0.0%) | 0 (0.0%) |
| 5 to 17 Years | 0 (0.0%) | 0 (0.0%) |
| 18 to 34 Years | 0 (0.0%) | 0 (0.0%) |
| 35 to 64 Years | 13 (10.8%) | 7 (5.5%) |
| 65 to 74 Years | 6 (13.3%) | 22 (29.3%) |
| 75 Years and over | 28 (80.0%) | 11 (39.3%) |
Disability Class: Vision Difficulty
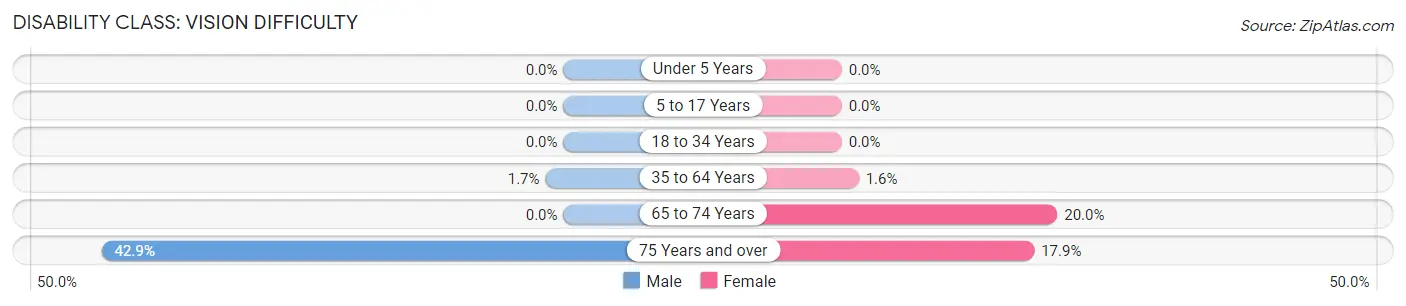
| Age Bracket | Male | Female |
| Under 5 Years | 0 (0.0%) | 0 (0.0%) |
| 5 to 17 Years | 0 (0.0%) | 0 (0.0%) |
| 18 to 34 Years | 0 (0.0%) | 0 (0.0%) |
| 35 to 64 Years | 2 (1.7%) | 2 (1.6%) |
| 65 to 74 Years | 0 (0.0%) | 15 (20.0%) |
| 75 Years and over | 15 (42.9%) | 5 (17.9%) |
Disability Class: Cognitive Difficulty
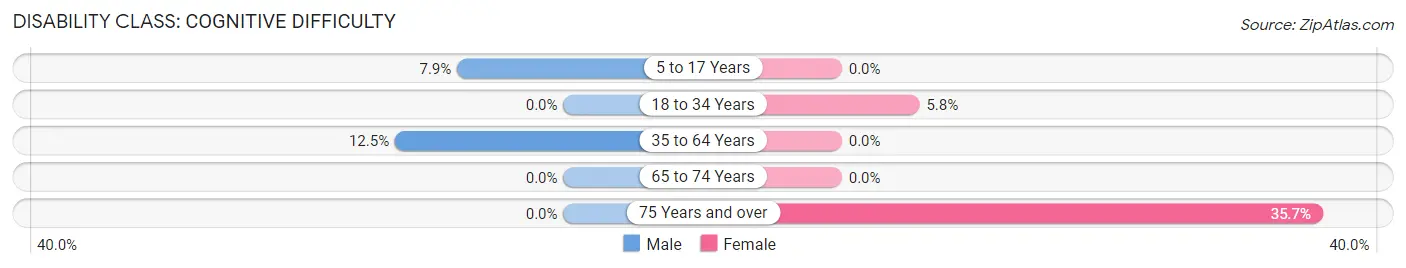
| Age Bracket | Male | Female |
| 5 to 17 Years | 3 (7.9%) | 0 (0.0%) |
| 18 to 34 Years | 0 (0.0%) | 3 (5.8%) |
| 35 to 64 Years | 15 (12.5%) | 0 (0.0%) |
| 65 to 74 Years | 0 (0.0%) | 0 (0.0%) |
| 75 Years and over | 0 (0.0%) | 10 (35.7%) |
Disability Class: Ambulatory Difficulty
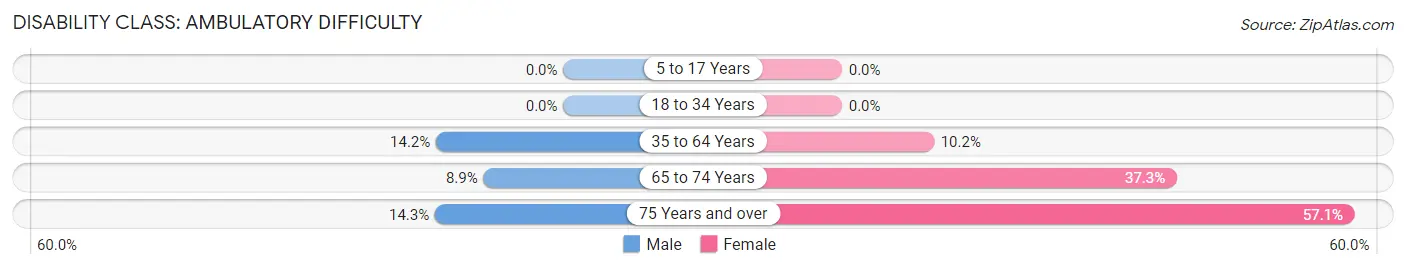
| Age Bracket | Male | Female |
| 5 to 17 Years | 0 (0.0%) | 0 (0.0%) |
| 18 to 34 Years | 0 (0.0%) | 0 (0.0%) |
| 35 to 64 Years | 17 (14.2%) | 13 (10.2%) |
| 65 to 74 Years | 4 (8.9%) | 28 (37.3%) |
| 75 Years and over | 5 (14.3%) | 16 (57.1%) |
Disability Class: Self-Care Difficulty
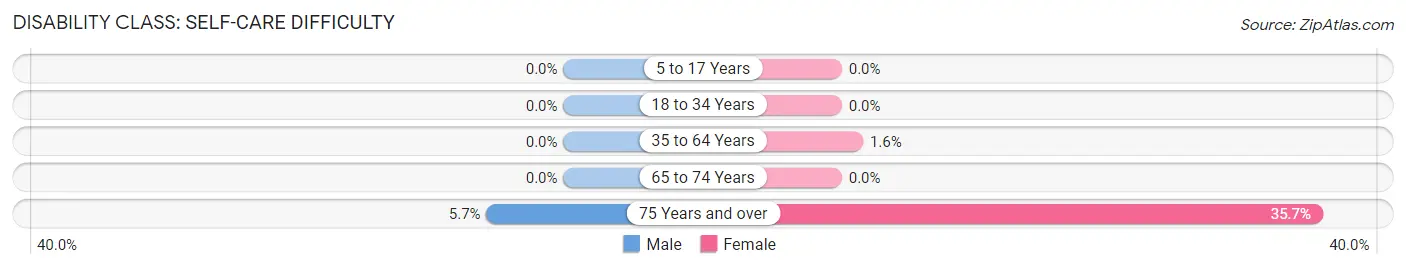
| Age Bracket | Male | Female |
| 5 to 17 Years | 0 (0.0%) | 0 (0.0%) |
| 18 to 34 Years | 0 (0.0%) | 0 (0.0%) |
| 35 to 64 Years | 0 (0.0%) | 2 (1.6%) |
| 65 to 74 Years | 0 (0.0%) | 0 (0.0%) |
| 75 Years and over | 2 (5.7%) | 10 (35.7%) |
Technology Access in Hydetown borough
Computing Device Access in Hydetown borough
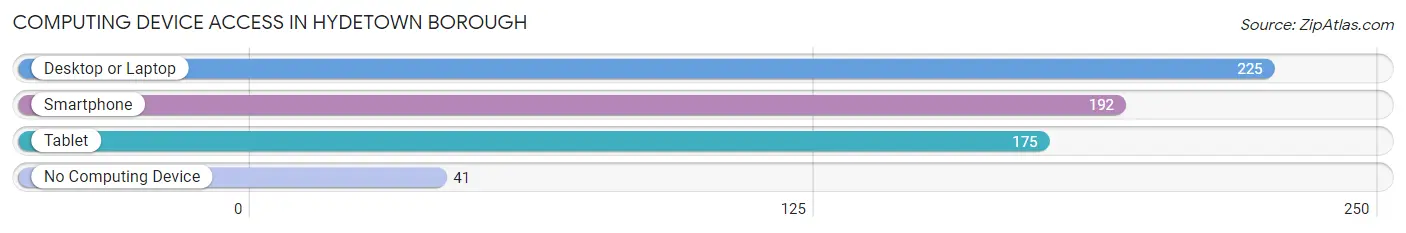
| Device Type | # Households | % Households |
| Desktop or Laptop | 225 | 78.7% |
| Smartphone | 192 | 67.1% |
| Tablet | 175 | 61.2% |
| No Computing Device | 41 | 14.3% |
| Total | 286 | 100.0% |
Internet Access in Hydetown borough
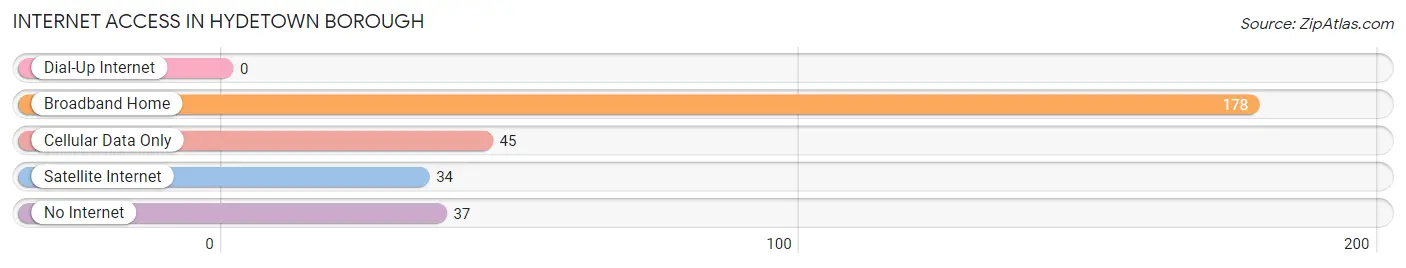
| Internet Type | # Households | % Households |
| Dial-Up Internet | 0 | 0.0% |
| Broadband Home | 178 | 62.2% |
| Cellular Data Only | 45 | 15.7% |
| Satellite Internet | 34 | 11.9% |
| No Internet | 37 | 12.9% |
| Total | 286 | 100.0% |
Hydetown borough Summary
History
Hydetown Borough is a small borough located in Crawford County, Pennsylvania. It is situated in the northwestern corner of the state, just south of the city of Erie. The borough was founded in 1876 and was named after the nearby Hydetown Creek. The creek was named after the Hydetown Indians, a Native American tribe that once lived in the area.
The first settlers of Hydetown were mostly of German and Irish descent. They were attracted to the area due to its abundance of natural resources, including timber, coal, and iron ore. The settlers quickly established a thriving community, with a variety of businesses, churches, and schools.
The borough was officially incorporated in 1876 and was named after the nearby Hydetown Creek. The creek was named after the Hydetown Indians, a Native American tribe that once lived in the area.
Geography
Hydetown Borough is located in the northwestern corner of Crawford County, Pennsylvania. It is situated just south of the city of Erie. The borough is bordered by the townships of Sparta, Hayfield, and West Fallowfield.
The borough is situated on a plateau, with an elevation of 1,000 feet above sea level. The terrain is mostly flat, with some rolling hills. The borough is located in the glaciated Allegheny Plateau region of Pennsylvania.
The borough is located in the humid continental climate zone, with cold winters and warm summers. The average annual temperature is around 50 degrees Fahrenheit. The average annual precipitation is around 40 inches.
Economy
The economy of Hydetown Borough is largely based on agriculture and manufacturing. The borough is home to several small businesses, including a lumber mill, a dairy farm, and a furniture factory.
The borough is also home to several large employers, including a steel mill, a plastics factory, and a paper mill. These businesses provide employment for many of the borough’s residents.
Demographics
As of the 2010 census, the population of Hydetown Borough was 1,845. The racial makeup of the borough was 97.3% White, 0.7% African American, 0.2% Native American, 0.3% Asian, and 1.5% from other races.
The median household income in the borough was $37,917, and the median family income was $45,938. The per capita income was $19,945. About 11.3% of the population was below the poverty line.
Conclusion
Hydetown Borough is a small borough located in Crawford County, Pennsylvania. It was founded in 1876 and was named after the nearby Hydetown Creek. The borough is situated on a plateau, with an elevation of 1,000 feet above sea level. The economy of Hydetown Borough is largely based on agriculture and manufacturing. As of the 2010 census, the population of Hydetown Borough was 1,845. The racial makeup of the borough was 97.3% White, 0.7% African American, 0.2% Native American, 0.3% Asian, and 1.5% from other races. The median household income in the borough was $37,917, and the median family income was $45,938. The per capita income was $19,945. About 11.3% of the population was below the poverty line.
Common Questions
What is the Total Population of Hydetown borough?
Total Population of Hydetown borough is 647.
What is the Total Male Population of Hydetown borough?
Total Male Population of Hydetown borough is 300.
What is the Total Female Population of Hydetown borough?
Total Female Population of Hydetown borough is 347.
What is the Ratio of Males per 100 Females in Hydetown borough?
There are 86.46 Males per 100 Females in Hydetown borough.
What is the Ratio of Females per 100 Males in Hydetown borough?
There are 115.67 Females per 100 Males in Hydetown borough.
What is the Median Population Age in Hydetown borough?
Median Population Age in Hydetown borough is 50.2 Years.
What is the Average Family Size in Hydetown borough
Average Family Size in Hydetown borough is 2.8 People.
What is the Average Household Size in Hydetown borough
Average Household Size in Hydetown borough is 2.3 People.
What is Per Capita Income in Hydetown borough?
Per Capita income in Hydetown borough is $27,076.
What is the Median Family Income in Hydetown borough?
Median Family Income in Hydetown borough is $57,750.
What is the Median Household income in Hydetown borough?
Median Household Income in Hydetown borough is $45,179.
What is Income or Wage Gap in Hydetown borough?
Income or Wage Gap in Hydetown borough is 37.4%.
Women in Hydetown borough earn 62.6 cents for every dollar earned by a man.
What is Inequality or Gini Index in Hydetown borough?
Inequality or Gini Index in Hydetown borough is 0.39.
How Large is the Labor Force in Hydetown borough?
There are 274 People in the Labor Forcein in Hydetown borough.
What is the Percentage of People in the Labor Force in Hydetown borough?
49.9% of People are in the Labor Force in Hydetown borough.
What is the Unemployment Rate in Hydetown borough?
Unemployment Rate in Hydetown borough is 7.7%.