Duquesne, PA
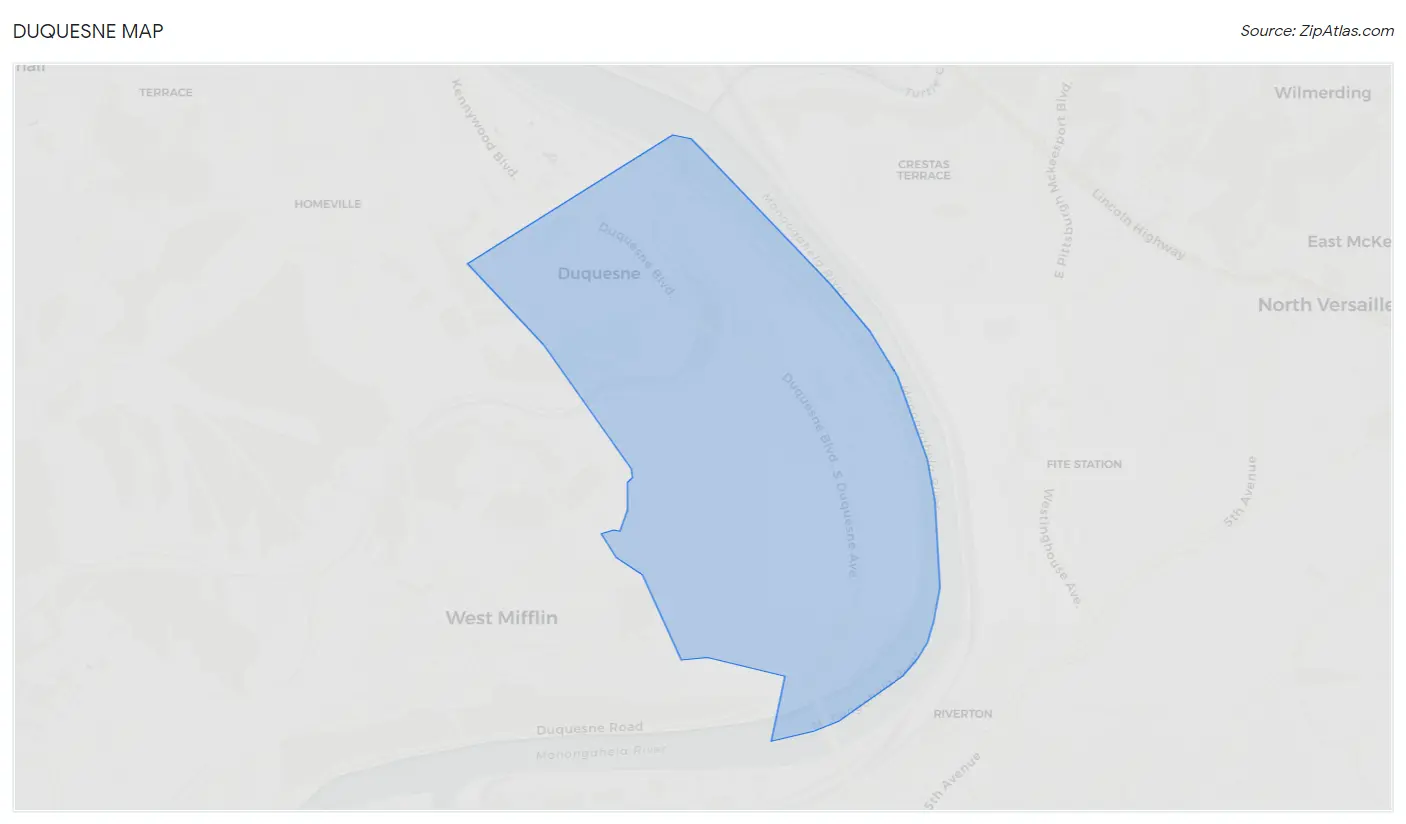
Duquesne Map
Duquesne Overview
5,241
TOTAL POPULATION
2,533
MALE POPULATION
2,708
FEMALE POPULATION
93.54
MALES / 100 FEMALES
106.91
FEMALES / 100 MALES
36.5
MEDIAN AGE
3.7
AVG FAMILY SIZE
2.5
AVG HOUSEHOLD SIZE
$24,342
PER CAPITA INCOME
$48,333
AVG FAMILY INCOME
$40,969
AVG HOUSEHOLD INCOME
19.3%
WAGE / INCOME GAP [ % ]
80.7¢/ $1
WAGE / INCOME GAP [ $ ]
$17,169
FAMILY INCOME DEFICIT
0.49
INEQUALITY / GINI INDEX
2,466
LABOR FORCE [ PEOPLE ]
62.3%
PERCENT IN LABOR FORCE
7.8%
UNEMPLOYMENT RATE
Duquesne Zip Codes
Duquesne Area Codes
Race in Duquesne
The most populous races in Duquesne are Black / African American (2,341 | 44.7%), White / Caucasian (2,008 | 38.3%), and Two or more Races (824 | 15.7%).
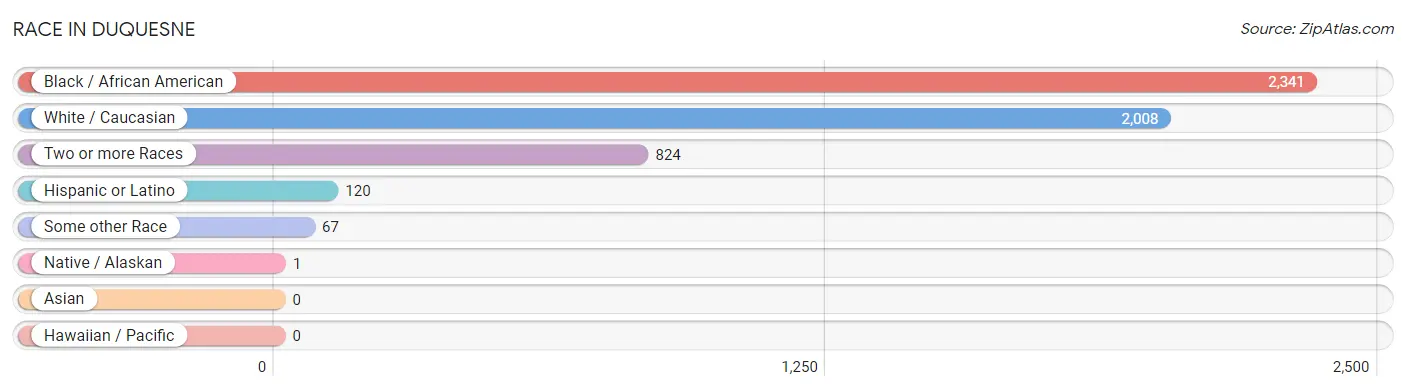
| Race | # Population | % Population |
| Asian | 0 | 0.0% |
| Black / African American | 2,341 | 44.7% |
| Hawaiian / Pacific | 0 | 0.0% |
| Hispanic or Latino | 120 | 2.3% |
| Native / Alaskan | 1 | 0.0% |
| White / Caucasian | 2,008 | 38.3% |
| Two or more Races | 824 | 15.7% |
| Some other Race | 67 | 1.3% |
| Total | 5,241 | 100.0% |
Ancestry in Duquesne
The most populous ancestries reported in Duquesne are German (686 | 13.1%), Subsaharan African (443 | 8.5%), African (376 | 7.2%), Irish (367 | 7.0%), and Slovak (161 | 3.1%), together accounting for 38.8% of all Duquesne residents.
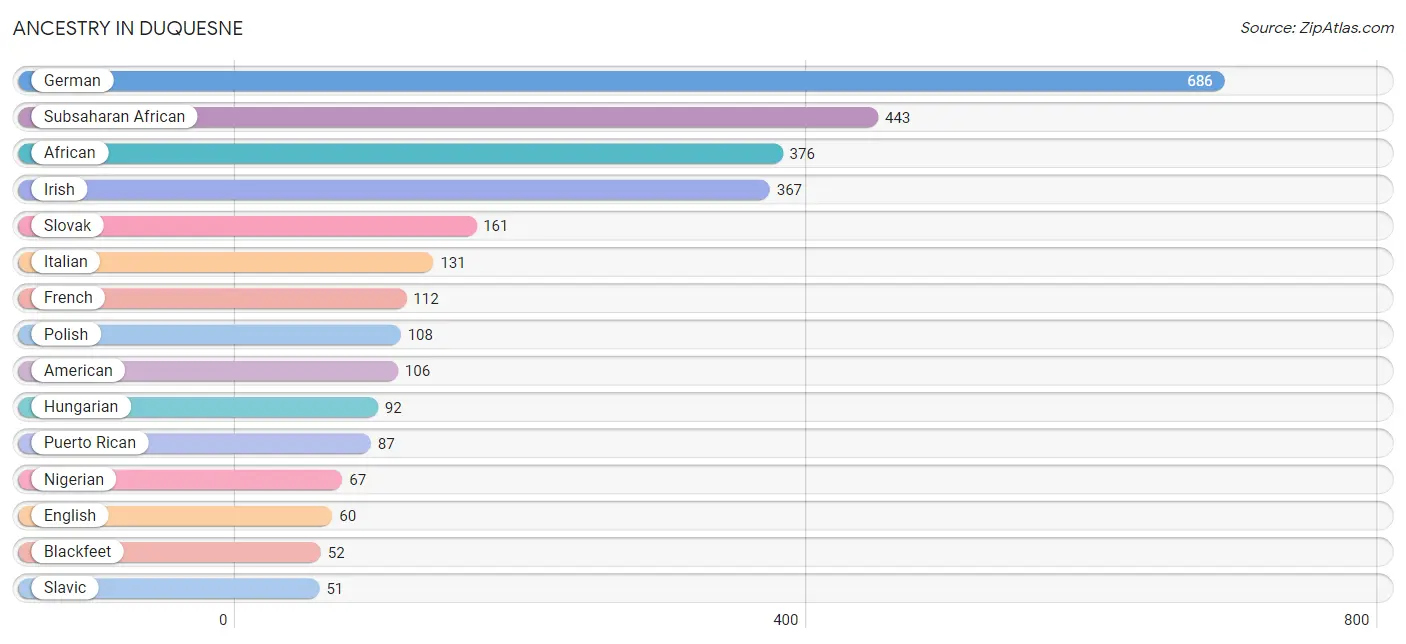
| Ancestry | # Population | % Population |
| African | 376 | 7.2% |
| American | 106 | 2.0% |
| Arab | 4 | 0.1% |
| Blackfeet | 52 | 1.0% |
| British | 10 | 0.2% |
| Croatian | 9 | 0.2% |
| Czech | 10 | 0.2% |
| Czechoslovakian | 13 | 0.3% |
| Dominican | 32 | 0.6% |
| Eastern European | 11 | 0.2% |
| English | 60 | 1.1% |
| French | 112 | 2.1% |
| German | 686 | 13.1% |
| Ghanaian | 13 | 0.3% |
| Hungarian | 92 | 1.8% |
| Irish | 367 | 7.0% |
| Italian | 131 | 2.5% |
| Mexican | 1 | 0.0% |
| Native Hawaiian | 25 | 0.5% |
| Nigerian | 67 | 1.3% |
| Polish | 108 | 2.1% |
| Puerto Rican | 87 | 1.7% |
| Scotch-Irish | 31 | 0.6% |
| Scottish | 12 | 0.2% |
| Serbian | 29 | 0.5% |
| Slavic | 51 | 1.0% |
| Slovak | 161 | 3.1% |
| Subsaharan African | 443 | 8.5% |
| Swedish | 4 | 0.1% |
| Swiss | 12 | 0.2% |
| Syrian | 4 | 0.1% |
| Welsh | 12 | 0.2% | View All 32 Rows |
Immigrants in Duquesne
The most numerous immigrant groups reported in Duquesne came from Latin America (32 | 0.6%), Caribbean (19 | 0.4%), Dominican Republic (19 | 0.4%), Africa (13 | 0.3%), and Ghana (13 | 0.3%), together accounting for 1.8% of all Duquesne residents.
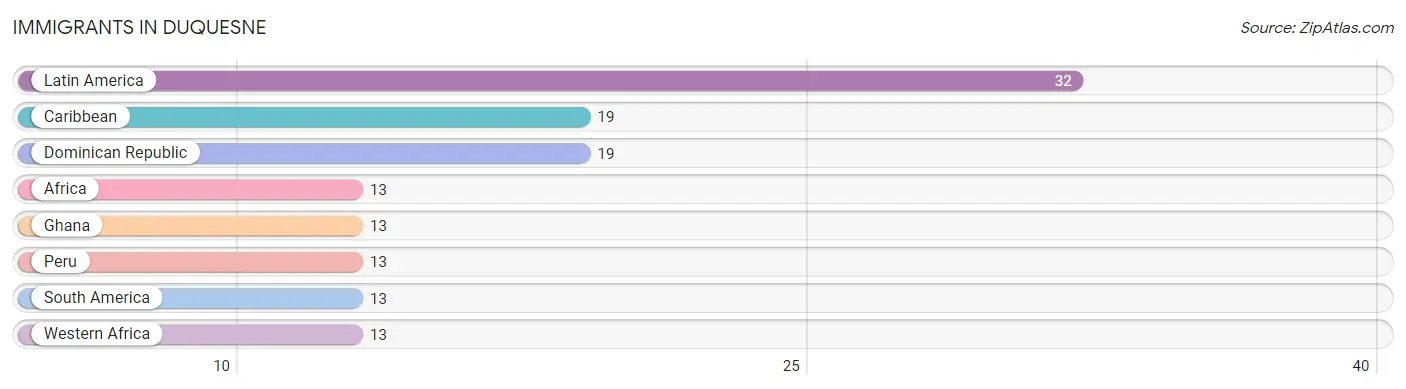
| Immigration Origin | # Population | % Population |
| Africa | 13 | 0.3% |
| Caribbean | 19 | 0.4% |
| Dominican Republic | 19 | 0.4% |
| Ghana | 13 | 0.3% |
| Latin America | 32 | 0.6% |
| Peru | 13 | 0.3% |
| South America | 13 | 0.3% |
| Western Africa | 13 | 0.3% | View All 8 Rows |
Sex and Age in Duquesne
Sex and Age in Duquesne
The most populous age groups in Duquesne are 10 to 14 Years (279 | 11.0%) for men and 15 to 19 Years (391 | 14.4%) for women.
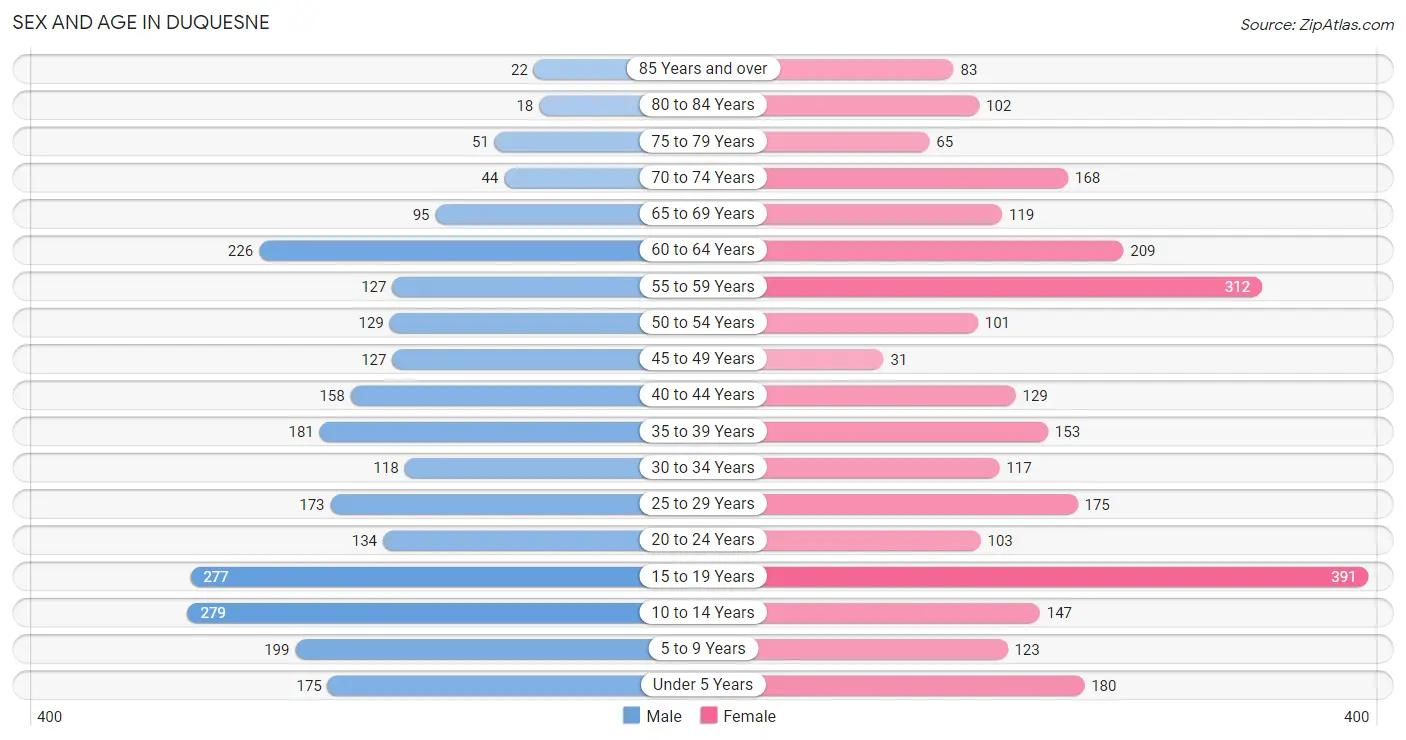
| Age Bracket | Male | Female |
| Under 5 Years | 175 (6.9%) | 180 (6.7%) |
| 5 to 9 Years | 199 (7.9%) | 123 (4.5%) |
| 10 to 14 Years | 279 (11.0%) | 147 (5.4%) |
| 15 to 19 Years | 277 (10.9%) | 391 (14.4%) |
| 20 to 24 Years | 134 (5.3%) | 103 (3.8%) |
| 25 to 29 Years | 173 (6.8%) | 175 (6.5%) |
| 30 to 34 Years | 118 (4.7%) | 117 (4.3%) |
| 35 to 39 Years | 181 (7.1%) | 153 (5.7%) |
| 40 to 44 Years | 158 (6.2%) | 129 (4.8%) |
| 45 to 49 Years | 127 (5.0%) | 31 (1.1%) |
| 50 to 54 Years | 129 (5.1%) | 101 (3.7%) |
| 55 to 59 Years | 127 (5.0%) | 312 (11.5%) |
| 60 to 64 Years | 226 (8.9%) | 209 (7.7%) |
| 65 to 69 Years | 95 (3.7%) | 119 (4.4%) |
| 70 to 74 Years | 44 (1.7%) | 168 (6.2%) |
| 75 to 79 Years | 51 (2.0%) | 65 (2.4%) |
| 80 to 84 Years | 18 (0.7%) | 102 (3.8%) |
| 85 Years and over | 22 (0.9%) | 83 (3.1%) |
| Total | 2,533 (100.0%) | 2,708 (100.0%) |
Families and Households in Duquesne
Median Family Size in Duquesne
The median family size in Duquesne is 3.72 persons per family, with single female/mother families (605 | 56.9%) accounting for the largest median family size of 4 persons per family. On the other hand, single male/father families (77 | 7.2%) represent the smallest median family size with 2.95 persons per family.
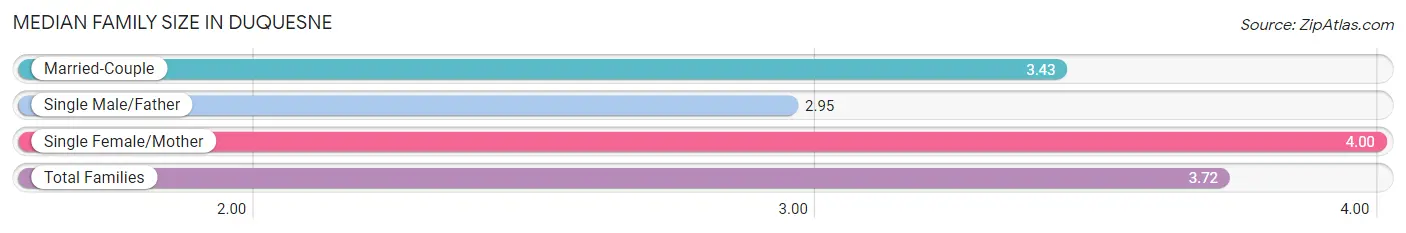
| Family Type | # Families | Family Size |
| Married-Couple | 382 (35.9%) | 3.43 |
| Single Male/Father | 77 (7.2%) | 2.95 |
| Single Female/Mother | 605 (56.9%) | 4.00 |
| Total Families | 1,064 (100.0%) | 3.72 |
Median Household Size in Duquesne
The median household size in Duquesne is 2.49 persons per household, with single female/mother households (605 | 29.0%) accounting for the largest median household size of 4.05 persons per household. non-family households (1,019 | 48.9%) represent the smallest median household size with 1.13 persons per household.
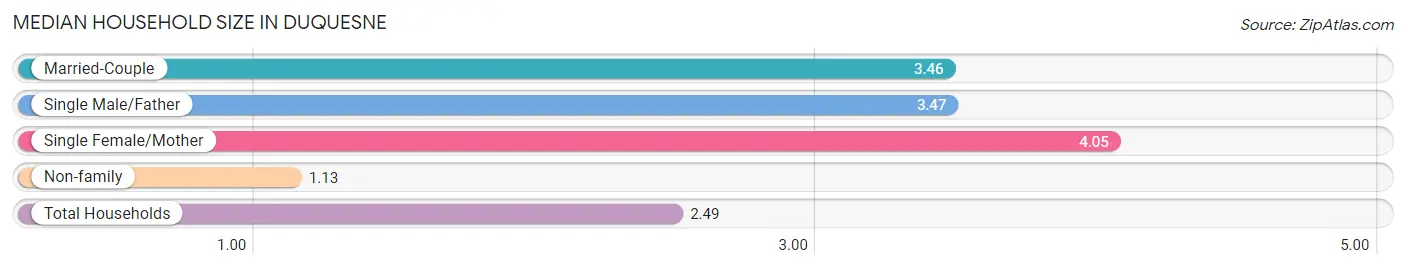
| Household Type | # Households | Household Size |
| Married-Couple | 382 (18.3%) | 3.46 |
| Single Male/Father | 77 (3.7%) | 3.47 |
| Single Female/Mother | 605 (29.0%) | 4.05 |
| Non-family | 1,019 (48.9%) | 1.13 |
| Total Households | 2,083 (100.0%) | 2.49 |
Household Size by Marriage Status in Duquesne
Out of a total of 2,083 households in Duquesne, 1,064 (51.1%) are family households, while 1,019 (48.9%) are nonfamily households. The most numerous type of family households are 2-person households, comprising 437, and the most common type of nonfamily households are 1-person households, comprising 903.
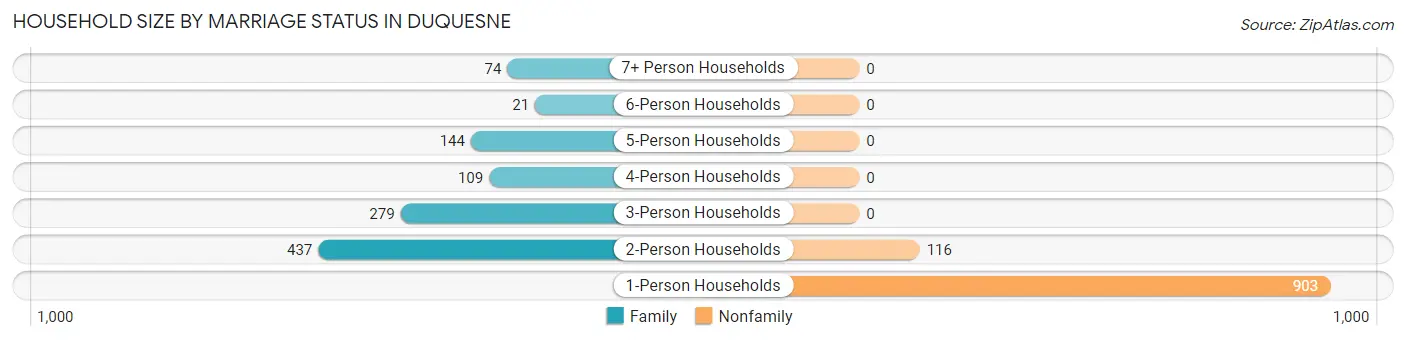
| Household Size | Family Households | Nonfamily Households |
| 1-Person Households | - | 903 (43.3%) |
| 2-Person Households | 437 (21.0%) | 116 (5.6%) |
| 3-Person Households | 279 (13.4%) | 0 (0.0%) |
| 4-Person Households | 109 (5.2%) | 0 (0.0%) |
| 5-Person Households | 144 (6.9%) | 0 (0.0%) |
| 6-Person Households | 21 (1.0%) | 0 (0.0%) |
| 7+ Person Households | 74 (3.5%) | 0 (0.0%) |
| Total | 1,064 (51.1%) | 1,019 (48.9%) |
Female Fertility in Duquesne
Fertility by Age in Duquesne
Average fertility rate in Duquesne is 34.0 births per 1,000 women. Women in the age bracket of 20 to 34 years have the highest fertility rate with 53.0 births per 1,000 women. Women in the age bracket of 20 to 34 years acount for 55.3% of all women with births.
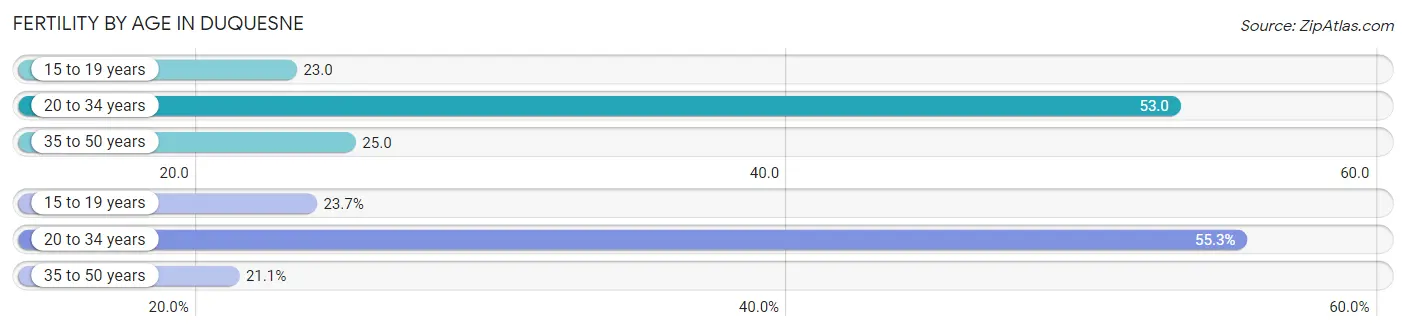
| Age Bracket | Women with Births | Births / 1,000 Women |
| 15 to 19 years | 9 (23.7%) | 23.0 |
| 20 to 34 years | 21 (55.3%) | 53.0 |
| 35 to 50 years | 8 (21.0%) | 25.0 |
| Total | 38 (100.0%) | 34.0 |
Fertility by Age by Marriage Status in Duquesne
21.1% of women with births (38) in Duquesne are married. The highest percentage of unmarried women with births falls into 15 to 19 years age bracket with 100.0% of them unmarried at the time of birth, while the lowest percentage of unmarried women with births belong to 35 to 50 years age bracket with 0.0% of them unmarried.
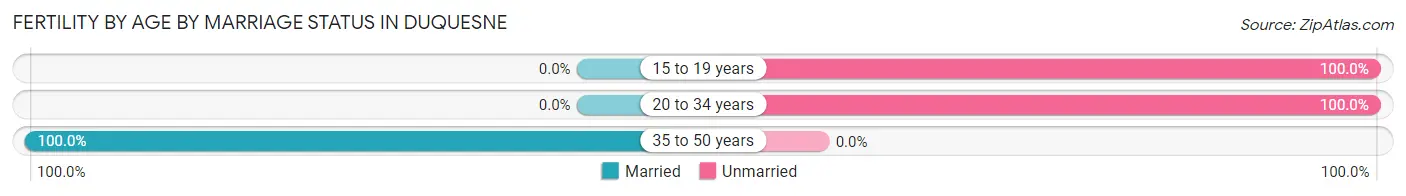
| Age Bracket | Married | Unmarried |
| 15 to 19 years | 0 (0.0%) | 9 (100.0%) |
| 20 to 34 years | 0 (0.0%) | 21 (100.0%) |
| 35 to 50 years | 8 (100.0%) | 0 (0.0%) |
| Total | 8 (21.0%) | 30 (78.9%) |
Fertility by Education in Duquesne
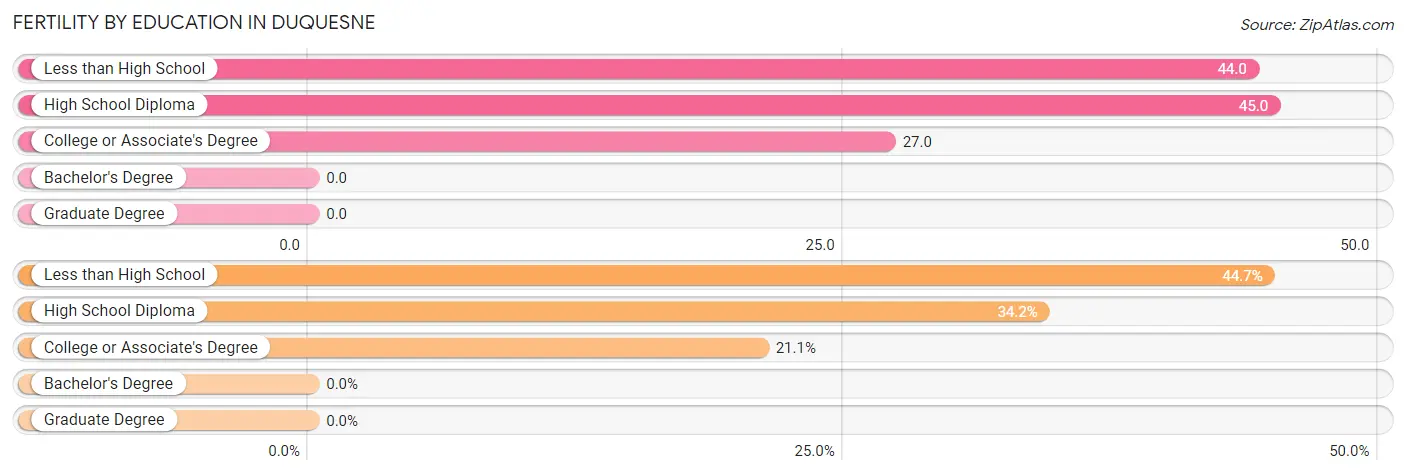
| Educational Attainment | Women with Births | Births / 1,000 Women |
| Less than High School | 17 (44.7%) | 44.0 |
| High School Diploma | 13 (34.2%) | 45.0 |
| College or Associate's Degree | 8 (21.0%) | 27.0 |
| Bachelor's Degree | 0 (0.0%) | 0.0 |
| Graduate Degree | 0 (0.0%) | 0.0 |
| Total | 38 (100.0%) | 34.0 |
Fertility by Education by Marriage Status in Duquesne
78.9% of women with births in Duquesne are unmarried. Women with the educational attainment of college or associate's degree are most likely to be married with 100.0% of them married at childbirth, while women with the educational attainment of less than high school are least likely to be married with 100.0% of them unmarried at childbirth.
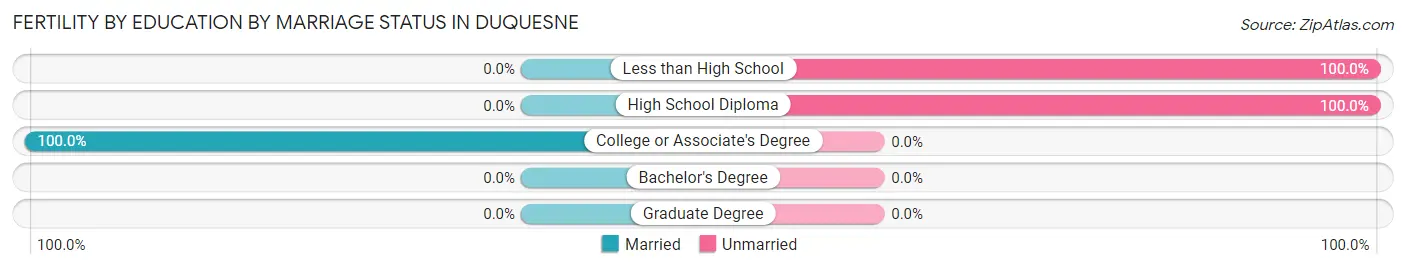
| Educational Attainment | Married | Unmarried |
| Less than High School | 0 (0.0%) | 17 (100.0%) |
| High School Diploma | 0 (0.0%) | 13 (100.0%) |
| College or Associate's Degree | 8 (100.0%) | 0 (0.0%) |
| Bachelor's Degree | 0 (0.0%) | 0 (0.0%) |
| Graduate Degree | 0 (0.0%) | 0 (0.0%) |
| Total | 8 (21.0%) | 30 (78.9%) |
Income in Duquesne
Income Overview in Duquesne
Per Capita Income in Duquesne is $24,342, while median incomes of families and households are $48,333 and $40,969 respectively.
| Characteristic | Number | Measure |
| Per Capita Income | 5,241 | $24,342 |
| Median Family Income | 1,064 | $48,333 |
| Mean Family Income | 1,064 | $67,757 |
| Median Household Income | 2,083 | $40,969 |
| Mean Household Income | 2,083 | $57,881 |
| Income Deficit | 1,064 | $17,169 |
| Wage / Income Gap (%) | 5,241 | 19.27% |
| Wage / Income Gap ($) | 5,241 | 80.73¢ per $1 |
| Gini / Inequality Index | 5,241 | 0.49 |
Earnings by Sex in Duquesne
Average Earnings in Duquesne are $23,881, $22,069 for men and $27,337 for women, a difference of 19.3%.
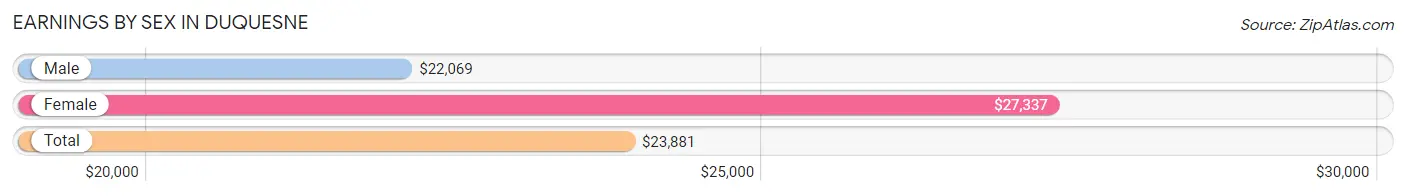
| Sex | Number | Average Earnings |
| Male | 1,165 (45.7%) | $22,069 |
| Female | 1,384 (54.3%) | $27,337 |
| Total | 2,549 (100.0%) | $23,881 |
Earnings by Sex by Income Bracket in Duquesne
The most common earnings brackets in Duquesne are $7,500 to $9,999 for men (167 | 14.3%) and $40,000 to $44,999 for women (181 | 13.1%).
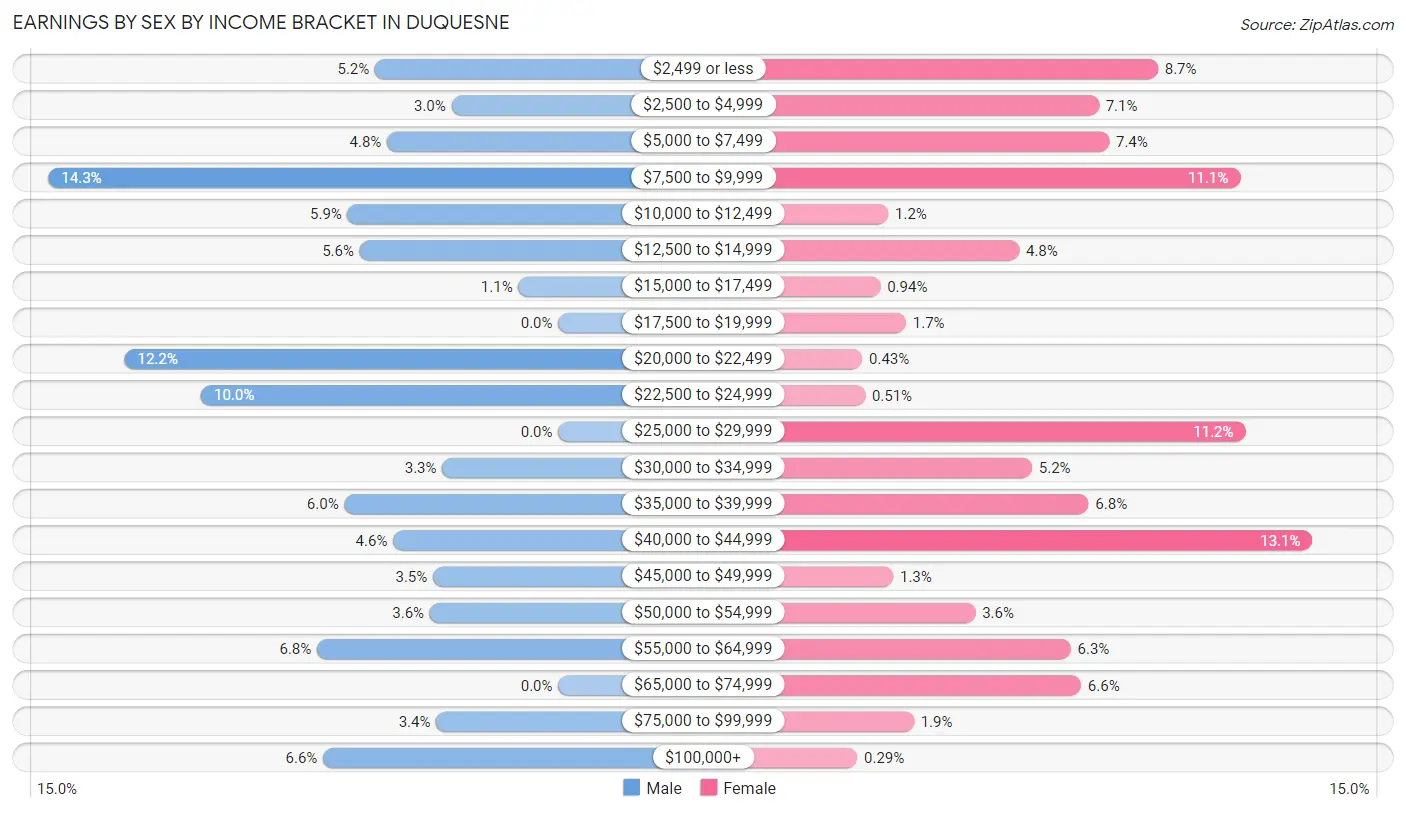
| Income | Male | Female |
| $2,499 or less | 60 (5.1%) | 121 (8.7%) |
| $2,500 to $4,999 | 35 (3.0%) | 98 (7.1%) |
| $5,000 to $7,499 | 56 (4.8%) | 102 (7.4%) |
| $7,500 to $9,999 | 167 (14.3%) | 153 (11.1%) |
| $10,000 to $12,499 | 69 (5.9%) | 16 (1.2%) |
| $12,500 to $14,999 | 65 (5.6%) | 67 (4.8%) |
| $15,000 to $17,499 | 13 (1.1%) | 13 (0.9%) |
| $17,500 to $19,999 | 0 (0.0%) | 23 (1.7%) |
| $20,000 to $22,499 | 142 (12.2%) | 6 (0.4%) |
| $22,500 to $24,999 | 117 (10.0%) | 7 (0.5%) |
| $25,000 to $29,999 | 0 (0.0%) | 155 (11.2%) |
| $30,000 to $34,999 | 38 (3.3%) | 72 (5.2%) |
| $35,000 to $39,999 | 70 (6.0%) | 94 (6.8%) |
| $40,000 to $44,999 | 54 (4.6%) | 181 (13.1%) |
| $45,000 to $49,999 | 41 (3.5%) | 18 (1.3%) |
| $50,000 to $54,999 | 42 (3.6%) | 50 (3.6%) |
| $55,000 to $64,999 | 79 (6.8%) | 87 (6.3%) |
| $65,000 to $74,999 | 0 (0.0%) | 91 (6.6%) |
| $75,000 to $99,999 | 40 (3.4%) | 26 (1.9%) |
| $100,000+ | 77 (6.6%) | 4 (0.3%) |
| Total | 1,165 (100.0%) | 1,384 (100.0%) |
Earnings by Sex by Educational Attainment in Duquesne
Average earnings in Duquesne are $21,725 for men and $37,979 for women, a difference of 42.8%. Men with an educational attainment of bachelor's degree enjoy the highest average annual earnings of $47,857, while those with high school diploma education earn the least with $20,404. Women with an educational attainment of bachelor's degree earn the most with the average annual earnings of $43,371, while those with less than high school education have the smallest earnings of $27,111.
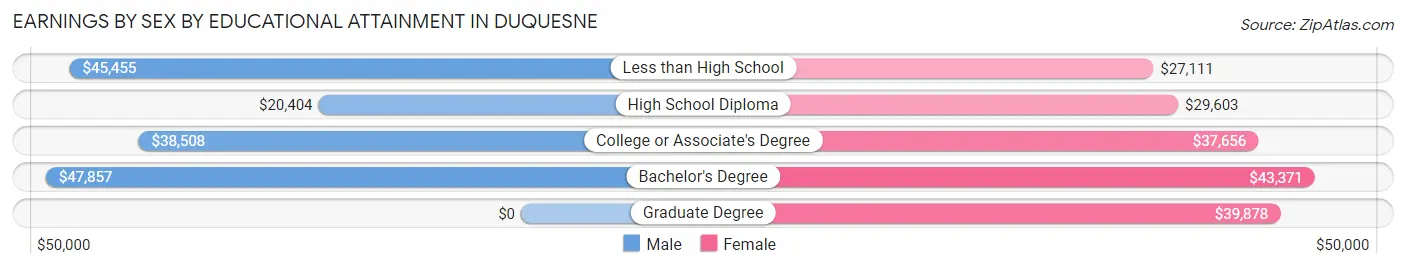
| Educational Attainment | Male Income | Female Income |
| Less than High School | $45,455 | $27,111 |
| High School Diploma | $20,404 | $29,603 |
| College or Associate's Degree | $38,508 | $37,656 |
| Bachelor's Degree | $47,857 | $43,371 |
| Graduate Degree | - | - |
| Total | $21,725 | $37,979 |
Family Income in Duquesne
Family Income Brackets in Duquesne
According to the Duquesne family income data, there are 242 families falling into the $50,000 to $74,999 income range, which is the most common income bracket and makes up 22.7% of all families. Conversely, the $150,000 to $199,999 income bracket is the least frequent group with only 15 families (1.4%) belonging to this category.
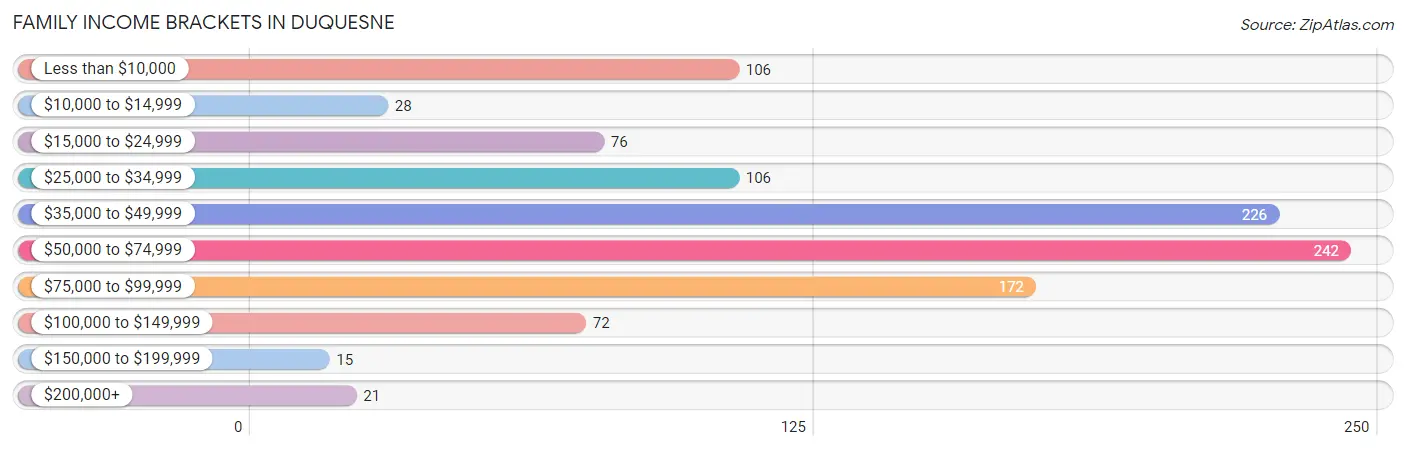
| Income Bracket | # Families | % Families |
| Less than $10,000 | 106 | 10.0% |
| $10,000 to $14,999 | 28 | 2.6% |
| $15,000 to $24,999 | 76 | 7.1% |
| $25,000 to $34,999 | 106 | 10.0% |
| $35,000 to $49,999 | 226 | 21.2% |
| $50,000 to $74,999 | 242 | 22.7% |
| $75,000 to $99,999 | 172 | 16.2% |
| $100,000 to $149,999 | 72 | 6.8% |
| $150,000 to $199,999 | 15 | 1.4% |
| $200,000+ | 21 | 2.0% |
Family Income by Famaliy Size in Duquesne
5-person families (123 | 11.6%) account for the highest median family income in Duquesne with $60,972 per family, while 2-person families (497 | 46.7%) have the highest median income of $22,585 per family member.
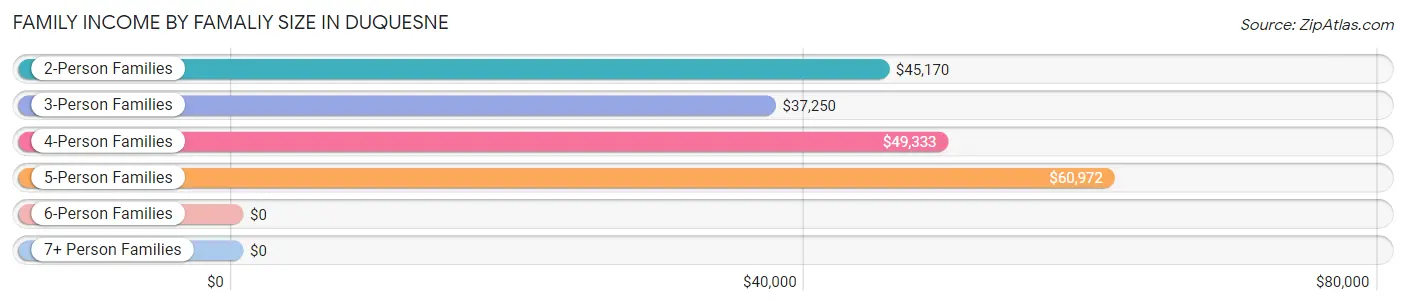
| Income Bracket | # Families | Median Income |
| 2-Person Families | 497 (46.7%) | $45,170 |
| 3-Person Families | 219 (20.6%) | $37,250 |
| 4-Person Families | 130 (12.2%) | $49,333 |
| 5-Person Families | 123 (11.6%) | $60,972 |
| 6-Person Families | 21 (2.0%) | $0 |
| 7+ Person Families | 74 (7.0%) | $0 |
| Total | 1,064 (100.0%) | $48,333 |
Family Income by Number of Earners in Duquesne
The median family income in Duquesne is $48,333, with families comprising 2 earners (201) having the highest median family income of $92,566, while families with no earners (137) have the lowest median family income of $21,910, accounting for 18.9% and 12.9% of families, respectively.
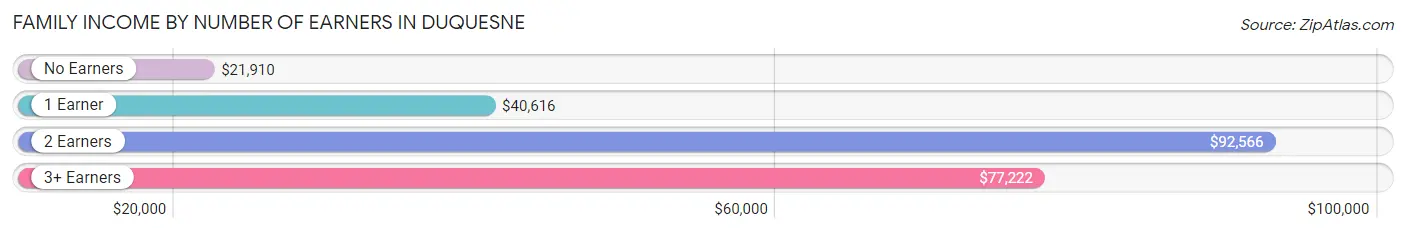
| Number of Earners | # Families | Median Income |
| No Earners | 137 (12.9%) | $21,910 |
| 1 Earner | 516 (48.5%) | $40,616 |
| 2 Earners | 201 (18.9%) | $92,566 |
| 3+ Earners | 210 (19.7%) | $77,222 |
| Total | 1,064 (100.0%) | $48,333 |
Household Income in Duquesne
Household Income Brackets in Duquesne
With 462 households falling in the category, the $35,000 to $49,999 income range is the most frequent in Duquesne, accounting for 22.2% of all households. In contrast, only 15 households (0.7%) fall into the $150,000 to $199,999 income bracket, making it the least populous group.
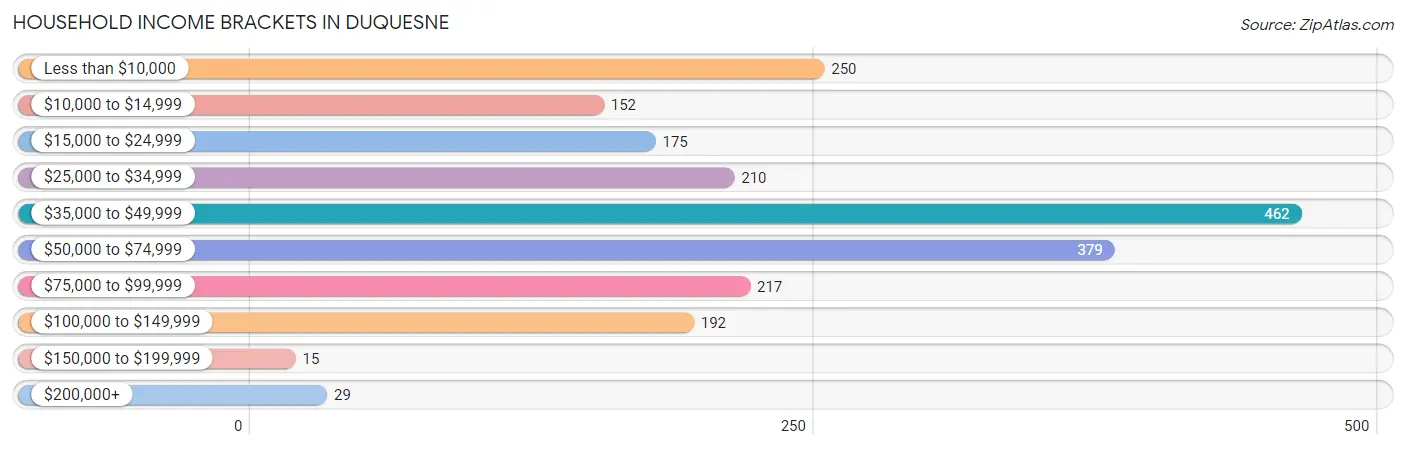
| Income Bracket | # Households | % Households |
| Less than $10,000 | 250 | 12.0% |
| $10,000 to $14,999 | 152 | 7.3% |
| $15,000 to $24,999 | 175 | 8.4% |
| $25,000 to $34,999 | 210 | 10.1% |
| $35,000 to $49,999 | 462 | 22.2% |
| $50,000 to $74,999 | 379 | 18.2% |
| $75,000 to $99,999 | 217 | 10.4% |
| $100,000 to $149,999 | 192 | 9.2% |
| $150,000 to $199,999 | 15 | 0.7% |
| $200,000+ | 29 | 1.4% |
Household Income by Householder Age in Duquesne
The median household income in Duquesne is $40,969, with the highest median household income of $43,208 found in the 45 to 64 years age bracket for the primary householder. A total of 838 households (40.2%) fall into this category. Meanwhile, the 15 to 24 years age bracket for the primary householder has the lowest median household income of $0, with 149 households (7.1%) in this group.
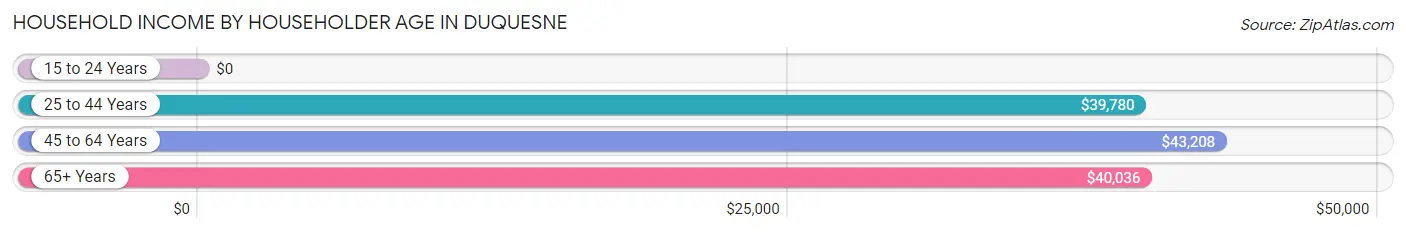
| Income Bracket | # Households | Median Income |
| 15 to 24 Years | 149 (7.1%) | $0 |
| 25 to 44 Years | 521 (25.0%) | $39,780 |
| 45 to 64 Years | 838 (40.2%) | $43,208 |
| 65+ Years | 575 (27.6%) | $40,036 |
| Total | 2,083 (100.0%) | $40,969 |
Poverty in Duquesne
Income Below Poverty by Sex and Age in Duquesne
With 28.3% poverty level for males and 23.5% for females among the residents of Duquesne, 6 to 11 year old males and under 5 year old females are the most vulnerable to poverty, with 149 males (82.3%) and 143 females (79.4%) in their respective age groups living below the poverty level.
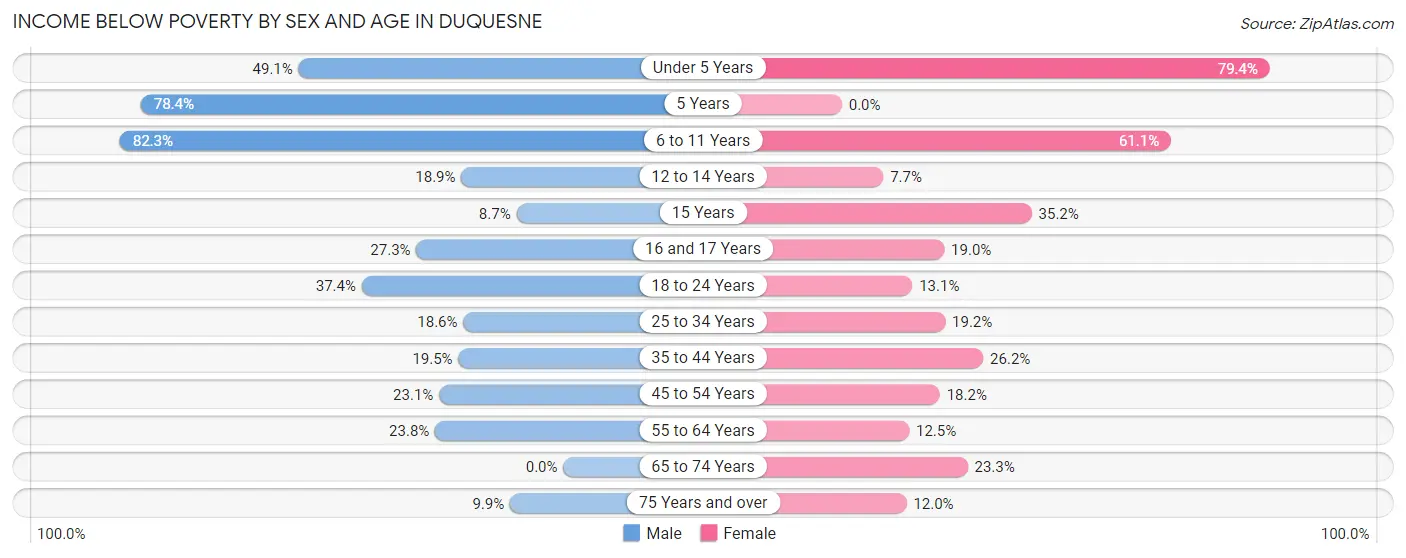
| Age Bracket | Male | Female |
| Under 5 Years | 86 (49.1%) | 143 (79.4%) |
| 5 Years | 40 (78.4%) | 0 (0.0%) |
| 6 to 11 Years | 149 (82.3%) | 77 (61.1%) |
| 12 to 14 Years | 46 (18.9%) | 10 (7.7%) |
| 15 Years | 8 (8.7%) | 31 (35.2%) |
| 16 and 17 Years | 9 (27.3%) | 19 (19.0%) |
| 18 to 24 Years | 107 (37.4%) | 40 (13.1%) |
| 25 to 34 Years | 54 (18.6%) | 56 (19.2%) |
| 35 to 44 Years | 66 (19.5%) | 74 (26.2%) |
| 45 to 54 Years | 59 (23.1%) | 24 (18.2%) |
| 55 to 64 Years | 84 (23.8%) | 65 (12.5%) |
| 65 to 74 Years | 0 (0.0%) | 67 (23.3%) |
| 75 Years and over | 9 (9.9%) | 30 (12.0%) |
| Total | 717 (28.3%) | 636 (23.5%) |
Income Above Poverty by Sex and Age in Duquesne
According to the poverty statistics in Duquesne, males aged 65 to 74 years and females aged 5 years are the age groups that are most secure financially, with 100.0% of males and 100.0% of females in these age groups living above the poverty line.
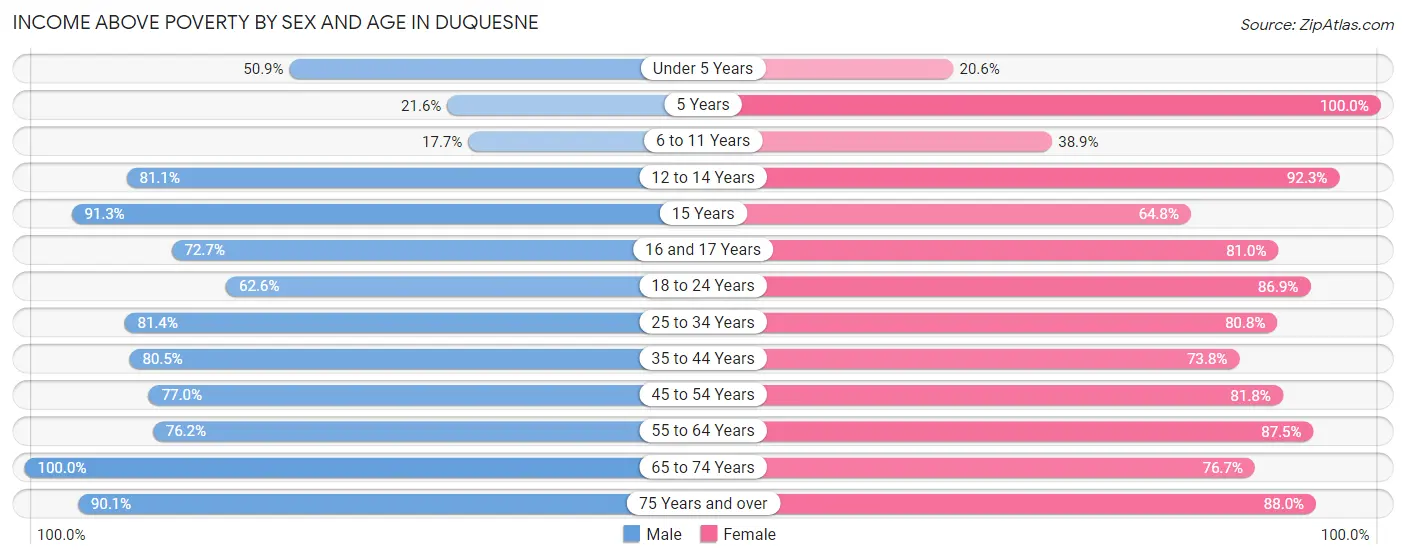
| Age Bracket | Male | Female |
| Under 5 Years | 89 (50.9%) | 37 (20.6%) |
| 5 Years | 11 (21.6%) | 14 (100.0%) |
| 6 to 11 Years | 32 (17.7%) | 49 (38.9%) |
| 12 to 14 Years | 197 (81.1%) | 120 (92.3%) |
| 15 Years | 84 (91.3%) | 57 (64.8%) |
| 16 and 17 Years | 24 (72.7%) | 81 (81.0%) |
| 18 to 24 Years | 179 (62.6%) | 266 (86.9%) |
| 25 to 34 Years | 237 (81.4%) | 236 (80.8%) |
| 35 to 44 Years | 273 (80.5%) | 208 (73.8%) |
| 45 to 54 Years | 197 (76.9%) | 108 (81.8%) |
| 55 to 64 Years | 269 (76.2%) | 456 (87.5%) |
| 65 to 74 Years | 139 (100.0%) | 220 (76.7%) |
| 75 Years and over | 82 (90.1%) | 220 (88.0%) |
| Total | 1,813 (71.7%) | 2,072 (76.5%) |
Income Below Poverty Among Married-Couple Families in Duquesne
The poverty statistics for married-couple families in Duquesne show that 15.4% or 59 of the total 382 families live below the poverty line. Families with 5 or more children have the highest poverty rate of 100.0%, comprising of 31 families. On the other hand, families with 3 or 4 children have the lowest poverty rate of 0.0%, which includes 0 families.
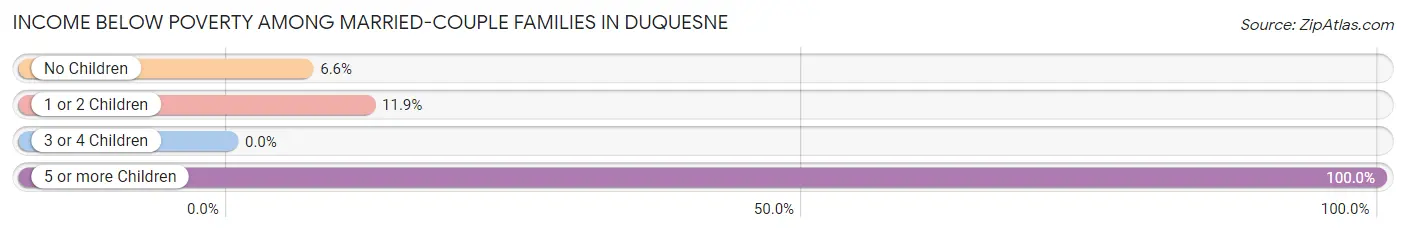
| Children | Above Poverty | Below Poverty |
| No Children | 214 (93.4%) | 15 (6.6%) |
| 1 or 2 Children | 96 (88.1%) | 13 (11.9%) |
| 3 or 4 Children | 13 (100.0%) | 0 (0.0%) |
| 5 or more Children | 0 (0.0%) | 31 (100.0%) |
| Total | 323 (84.6%) | 59 (15.4%) |
Income Below Poverty Among Single-Parent Households in Duquesne
According to the poverty data in Duquesne, 46.8% or 36 single-father households and 19.5% or 118 single-mother households are living below the poverty line. Among single-father households, those with 3 or 4 children have the highest poverty rate, with 24 households (100.0%) experiencing poverty. Likewise, among single-mother households, those with 3 or 4 children have the highest poverty rate, with 17 households (100.0%) falling below the poverty line.
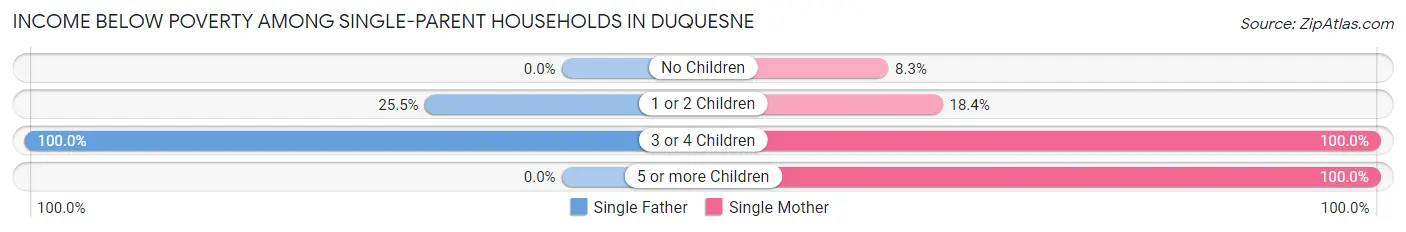
| Children | Single Father | Single Mother |
| No Children | 0 (0.0%) | 16 (8.3%) |
| 1 or 2 Children | 12 (25.5%) | 70 (18.4%) |
| 3 or 4 Children | 24 (100.0%) | 17 (100.0%) |
| 5 or more Children | 0 (0.0%) | 15 (100.0%) |
| Total | 36 (46.8%) | 118 (19.5%) |
Income Below Poverty Among Married-Couple vs Single-Parent Households in Duquesne
The poverty data for Duquesne shows that 59 of the married-couple family households (15.4%) and 154 of the single-parent households (22.6%) are living below the poverty level. Within the married-couple family households, those with 5 or more children have the highest poverty rate, with 31 households (100.0%) falling below the poverty line. Among the single-parent households, those with 3 or 4 children have the highest poverty rate, with 41 household (100.0%) living below poverty.
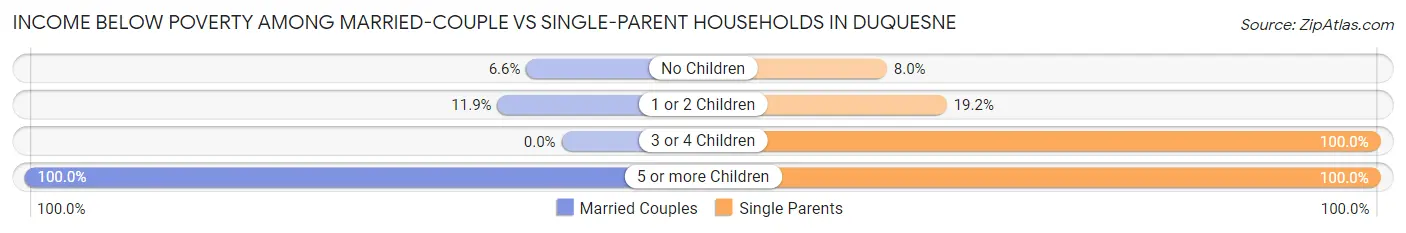
| Children | Married-Couple Families | Single-Parent Households |
| No Children | 15 (6.6%) | 16 (8.0%) |
| 1 or 2 Children | 13 (11.9%) | 82 (19.2%) |
| 3 or 4 Children | 0 (0.0%) | 41 (100.0%) |
| 5 or more Children | 31 (100.0%) | 15 (100.0%) |
| Total | 59 (15.4%) | 154 (22.6%) |
Employment Characteristics in Duquesne
Employment by Class of Employer in Duquesne
Among the 2,255 employed individuals in Duquesne, private company employees (1,331 | 59.0%), not-for-profit organizations (537 | 23.8%), and local government employees (230 | 10.2%) make up the most common classes of employment.
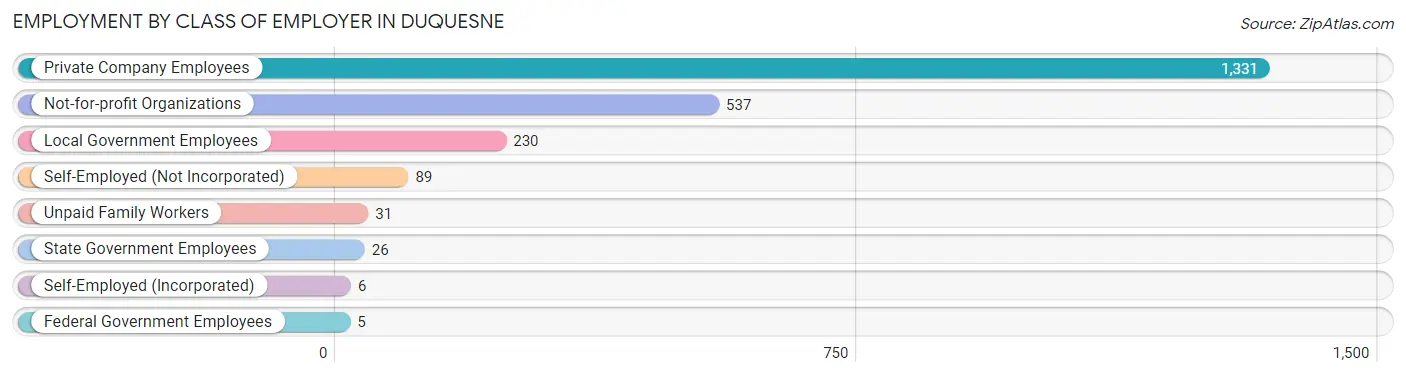
| Employer Class | # Employees | % Employees |
| Private Company Employees | 1,331 | 59.0% |
| Self-Employed (Incorporated) | 6 | 0.3% |
| Self-Employed (Not Incorporated) | 89 | 4.0% |
| Not-for-profit Organizations | 537 | 23.8% |
| Local Government Employees | 230 | 10.2% |
| State Government Employees | 26 | 1.1% |
| Federal Government Employees | 5 | 0.2% |
| Unpaid Family Workers | 31 | 1.4% |
| Total | 2,255 | 100.0% |
Employment Status by Age in Duquesne
According to the labor force statistics for Duquesne, out of the total population over 16 years of age (3,958), 62.3% or 2,466 individuals are in the labor force, with 7.8% or 192 of them unemployed. The age group with the highest labor force participation rate is 25 to 29 years, with 98.9% or 344 individuals in the labor force. Within the labor force, the 35 to 44 years age range has the highest percentage of unemployed individuals, with 18.9% or 98 of them being unemployed.
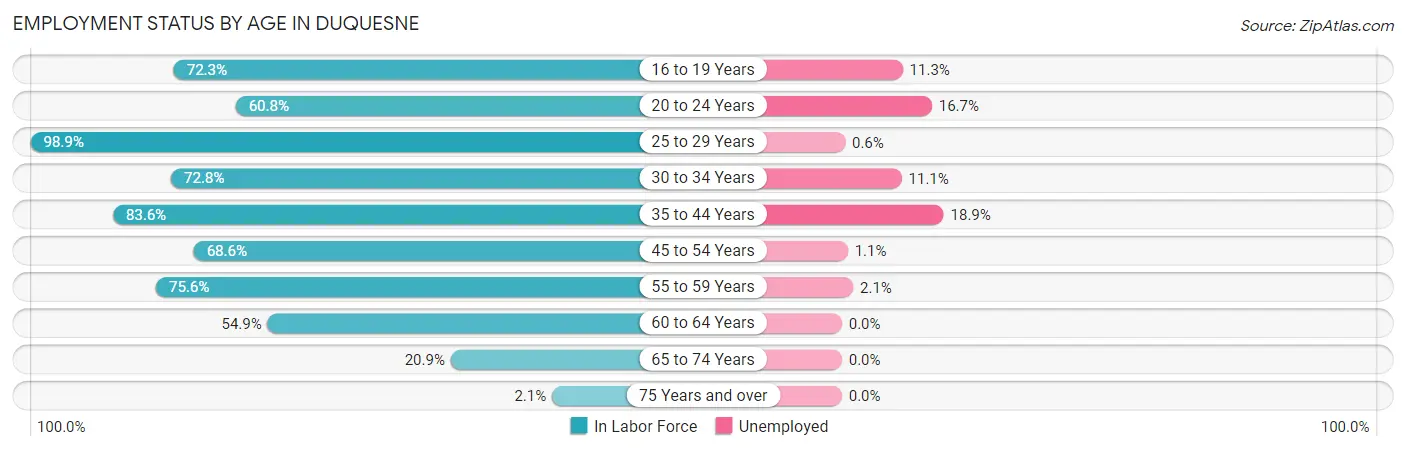
| Age Bracket | In Labor Force | Unemployed |
| 16 to 19 Years | 353 (72.3%) | 40 (11.3%) |
| 20 to 24 Years | 144 (60.8%) | 24 (16.7%) |
| 25 to 29 Years | 344 (98.9%) | 2 (0.6%) |
| 30 to 34 Years | 171 (72.8%) | 19 (11.1%) |
| 35 to 44 Years | 519 (83.6%) | 98 (18.9%) |
| 45 to 54 Years | 266 (68.6%) | 3 (1.1%) |
| 55 to 59 Years | 332 (75.6%) | 7 (2.1%) |
| 60 to 64 Years | 239 (54.9%) | 0 (0.0%) |
| 65 to 74 Years | 89 (20.9%) | 0 (0.0%) |
| 75 Years and over | 7 (2.1%) | 0 (0.0%) |
| Total | 2,466 (62.3%) | 192 (7.8%) |
Employment Status by Educational Attainment in Duquesne
According to labor force statistics for Duquesne, 75.9% of individuals (1,872) out of the total population between 25 and 64 years of age (2,466) are in the labor force, with 6.9% or 129 of them being unemployed. The group with the highest labor force participation rate are those with the educational attainment of bachelor's degree or higher, with 88.1% or 229 individuals in the labor force. Within the labor force, individuals with college / associate degree education have the highest percentage of unemployment, with 8.4% or 51 of them being unemployed.
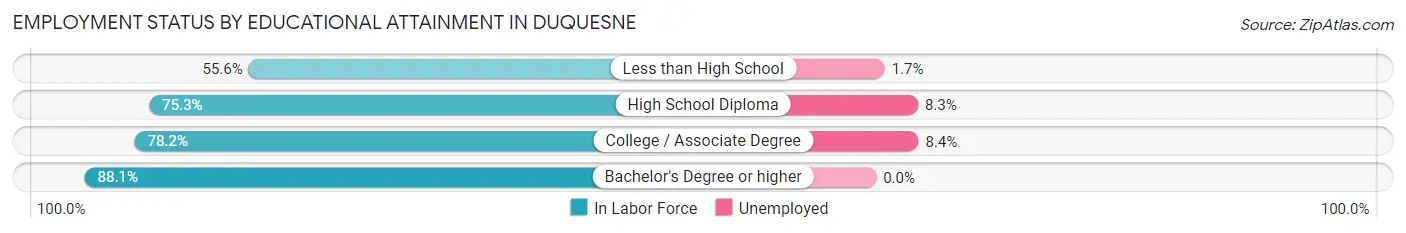
| Educational Attainment | In Labor Force | Unemployed |
| Less than High School | 119 (55.6%) | 4 (1.7%) |
| High School Diploma | 919 (75.3%) | 101 (8.3%) |
| College / Associate Degree | 604 (78.2%) | 65 (8.4%) |
| Bachelor's Degree or higher | 229 (88.1%) | 0 (0.0%) |
| Total | 1,872 (75.9%) | 170 (6.9%) |
Employment Occupations by Sex in Duquesne
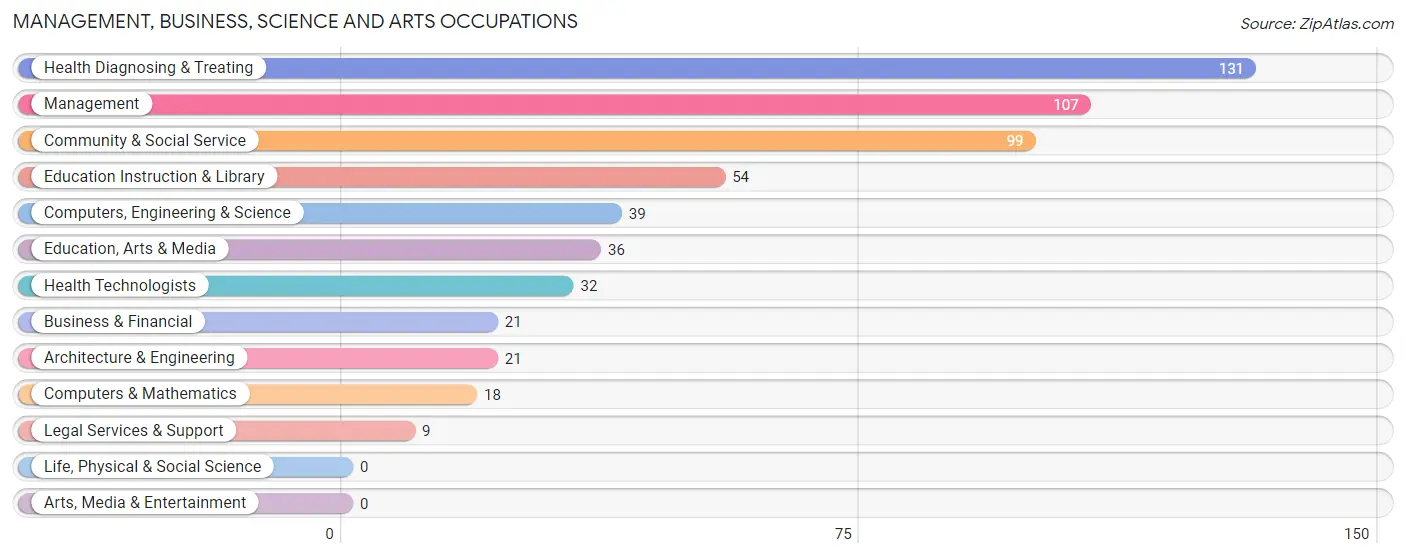
Management, Business, Science and Arts Occupations
The most common Management, Business, Science and Arts occupations in Duquesne are Health Diagnosing & Treating (131 | 5.8%), Management (107 | 4.7%), Community & Social Service (99 | 4.4%), Education Instruction & Library (54 | 2.4%), and Computers, Engineering & Science (39 | 1.7%).
Management, Business, Science and Arts Occupations by Sex
Within the Management, Business, Science and Arts occupations in Duquesne, the most male-oriented occupations are Architecture & Engineering (100.0%), Legal Services & Support (100.0%), and Computers, Engineering & Science (87.2%), while the most female-oriented occupations are Education Instruction & Library (100.0%), Health Diagnosing & Treating (100.0%), and Health Technologists (100.0%).
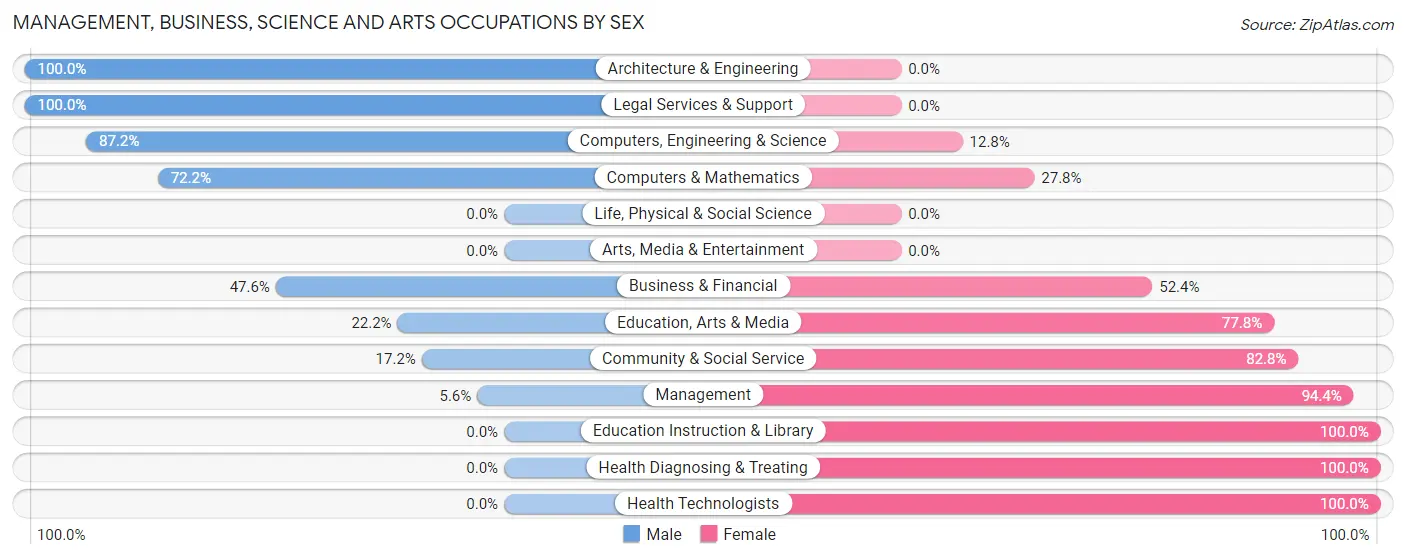
| Occupation | Male | Female |
| Management | 6 (5.6%) | 101 (94.4%) |
| Business & Financial | 10 (47.6%) | 11 (52.4%) |
| Computers, Engineering & Science | 34 (87.2%) | 5 (12.8%) |
| Computers & Mathematics | 13 (72.2%) | 5 (27.8%) |
| Architecture & Engineering | 21 (100.0%) | 0 (0.0%) |
| Life, Physical & Social Science | 0 (0.0%) | 0 (0.0%) |
| Community & Social Service | 17 (17.2%) | 82 (82.8%) |
| Education, Arts & Media | 8 (22.2%) | 28 (77.8%) |
| Legal Services & Support | 9 (100.0%) | 0 (0.0%) |
| Education Instruction & Library | 0 (0.0%) | 54 (100.0%) |
| Arts, Media & Entertainment | 0 (0.0%) | 0 (0.0%) |
| Health Diagnosing & Treating | 0 (0.0%) | 131 (100.0%) |
| Health Technologists | 0 (0.0%) | 32 (100.0%) |
| Total (Category) | 67 (16.9%) | 330 (83.1%) |
| Total (Overall) | 1,008 (44.4%) | 1,263 (55.6%) |
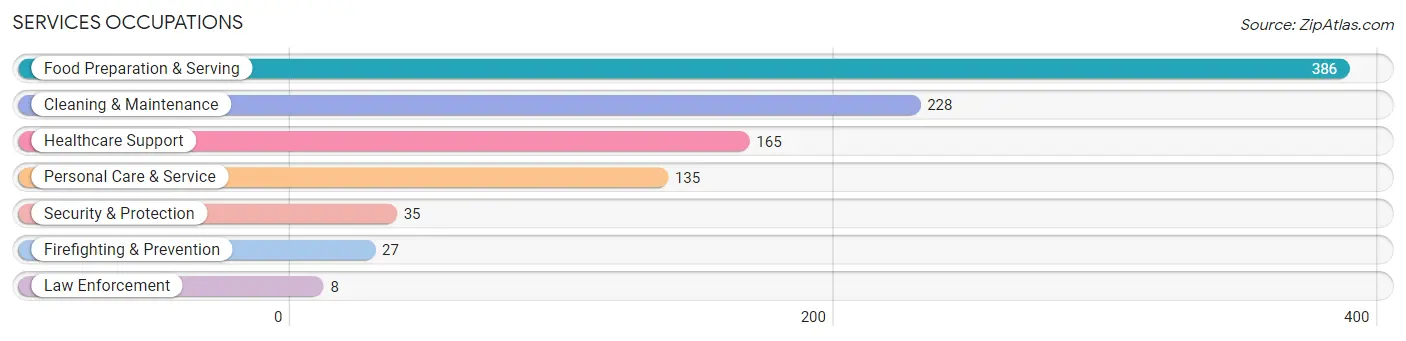
Services Occupations
The most common Services occupations in Duquesne are Food Preparation & Serving (386 | 17.0%), Cleaning & Maintenance (228 | 10.0%), Healthcare Support (165 | 7.3%), Personal Care & Service (135 | 5.9%), and Security & Protection (35 | 1.5%).
Services Occupations by Sex
Within the Services occupations in Duquesne, the most male-oriented occupations are Cleaning & Maintenance (89.0%), Law Enforcement (62.5%), and Food Preparation & Serving (43.5%), while the most female-oriented occupations are Healthcare Support (87.3%), Firefighting & Prevention (70.4%), and Security & Protection (62.9%).
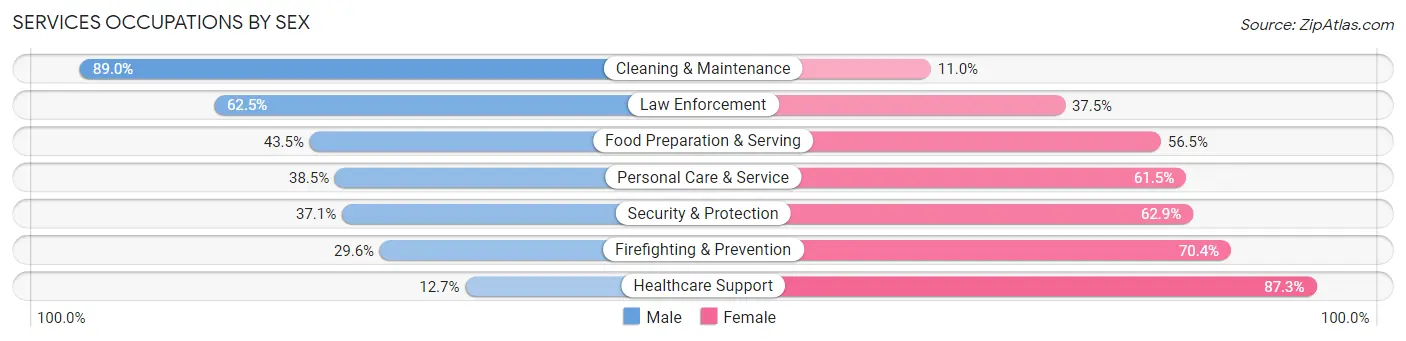
| Occupation | Male | Female |
| Healthcare Support | 21 (12.7%) | 144 (87.3%) |
| Security & Protection | 13 (37.1%) | 22 (62.9%) |
| Firefighting & Prevention | 8 (29.6%) | 19 (70.4%) |
| Law Enforcement | 5 (62.5%) | 3 (37.5%) |
| Food Preparation & Serving | 168 (43.5%) | 218 (56.5%) |
| Cleaning & Maintenance | 203 (89.0%) | 25 (11.0%) |
| Personal Care & Service | 52 (38.5%) | 83 (61.5%) |
| Total (Category) | 457 (48.2%) | 492 (51.8%) |
| Total (Overall) | 1,008 (44.4%) | 1,263 (55.6%) |
Sales and Office Occupations
The most common Sales and Office occupations in Duquesne are Sales & Related (231 | 10.2%), and Office & Administration (200 | 8.8%).

Sales and Office Occupations by Sex
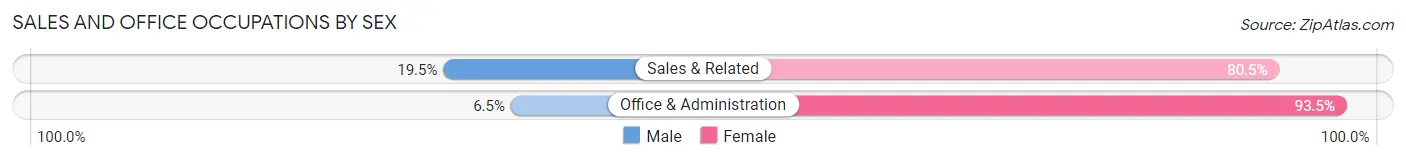
| Occupation | Male | Female |
| Sales & Related | 45 (19.5%) | 186 (80.5%) |
| Office & Administration | 13 (6.5%) | 187 (93.5%) |
| Total (Category) | 58 (13.5%) | 373 (86.5%) |
| Total (Overall) | 1,008 (44.4%) | 1,263 (55.6%) |
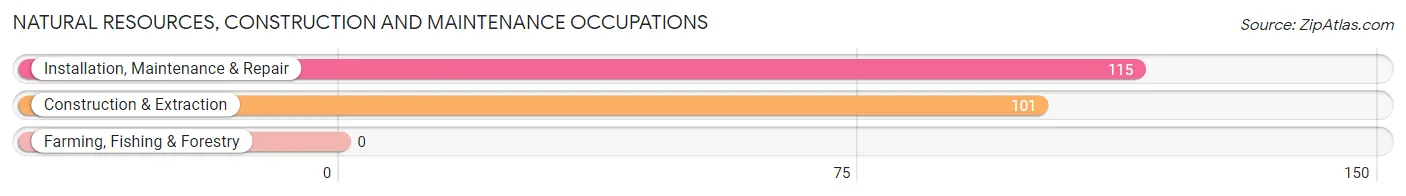
Natural Resources, Construction and Maintenance Occupations
The most common Natural Resources, Construction and Maintenance occupations in Duquesne are Installation, Maintenance & Repair (115 | 5.1%), and Construction & Extraction (101 | 4.4%).
Natural Resources, Construction and Maintenance Occupations by Sex
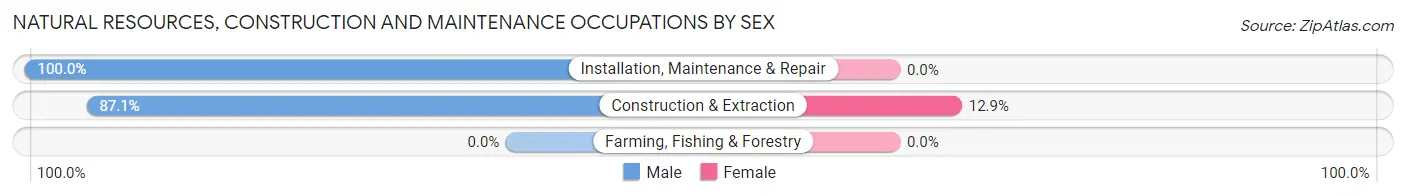
| Occupation | Male | Female |
| Farming, Fishing & Forestry | 0 (0.0%) | 0 (0.0%) |
| Construction & Extraction | 88 (87.1%) | 13 (12.9%) |
| Installation, Maintenance & Repair | 115 (100.0%) | 0 (0.0%) |
| Total (Category) | 203 (94.0%) | 13 (6.0%) |
| Total (Overall) | 1,008 (44.4%) | 1,263 (55.6%) |
Production, Transportation and Moving Occupations
The most common Production, Transportation and Moving occupations in Duquesne are Material Moving (154 | 6.8%), Production (92 | 4.1%), and Transportation (32 | 1.4%).
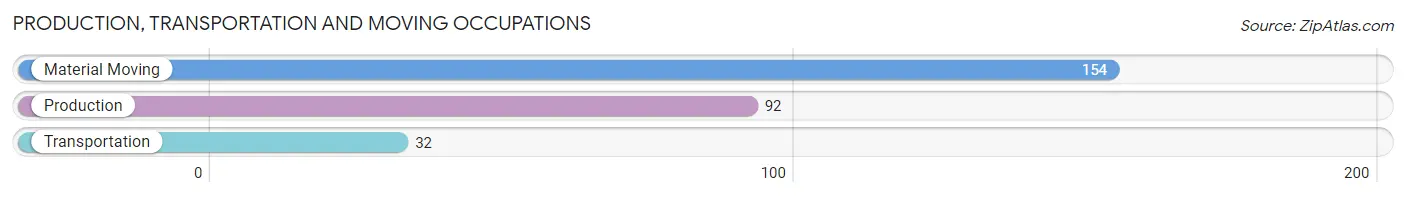
Production, Transportation and Moving Occupations by Sex
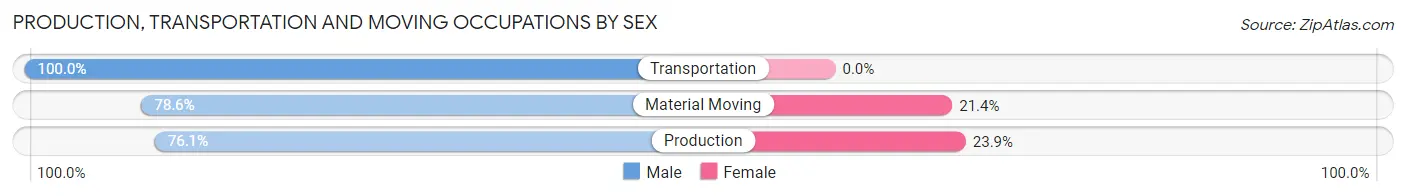
| Occupation | Male | Female |
| Production | 70 (76.1%) | 22 (23.9%) |
| Transportation | 32 (100.0%) | 0 (0.0%) |
| Material Moving | 121 (78.6%) | 33 (21.4%) |
| Total (Category) | 223 (80.2%) | 55 (19.8%) |
| Total (Overall) | 1,008 (44.4%) | 1,263 (55.6%) |
Employment Industries by Sex in Duquesne
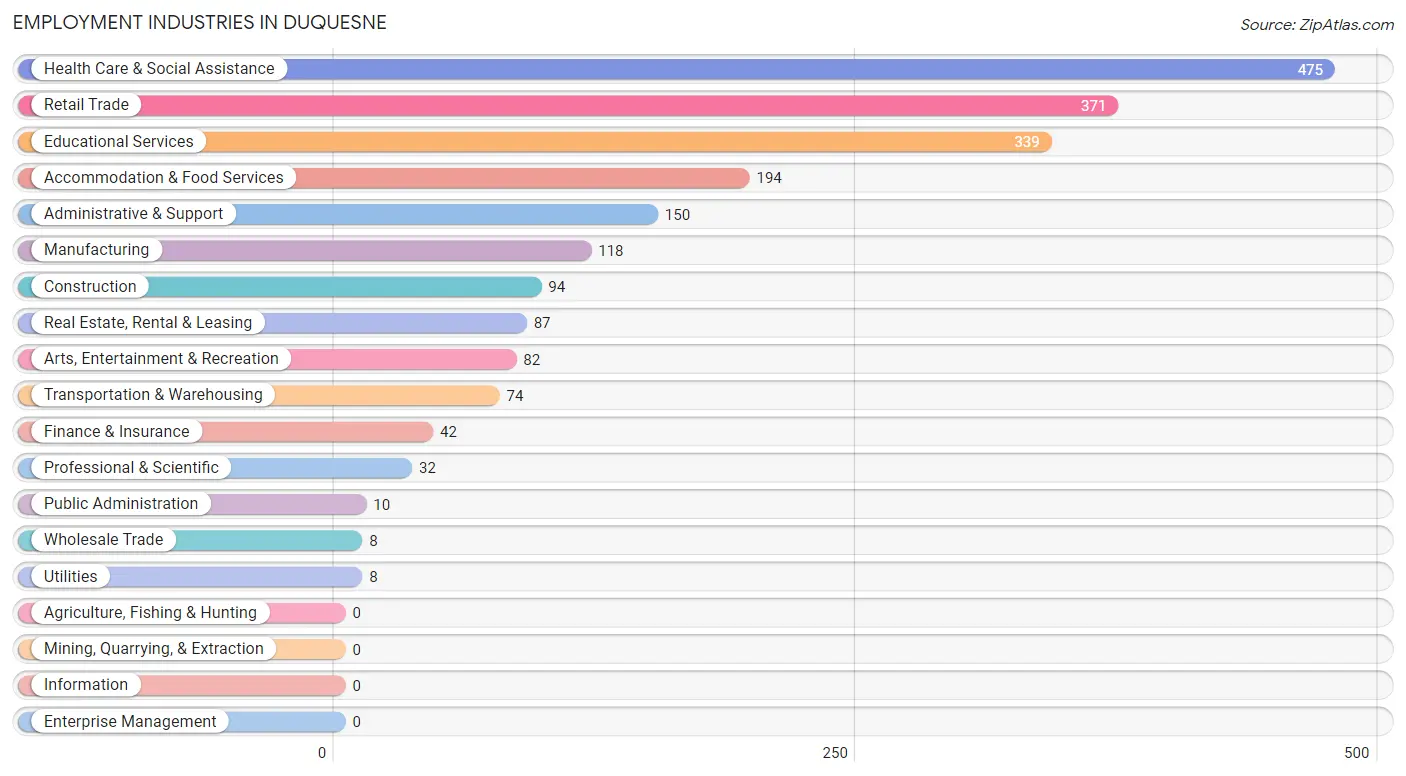
Employment Industries in Duquesne
The major employment industries in Duquesne include Health Care & Social Assistance (475 | 20.9%), Retail Trade (371 | 16.3%), Educational Services (339 | 14.9%), Accommodation & Food Services (194 | 8.5%), and Administrative & Support (150 | 6.6%).
Employment Industries by Sex in Duquesne
The Duquesne industries that see more men than women are Utilities (100.0%), Manufacturing (89.0%), and Construction (86.2%), whereas the industries that tend to have a higher number of women are Finance & Insurance (100.0%), Public Administration (100.0%), and Health Care & Social Assistance (79.2%).
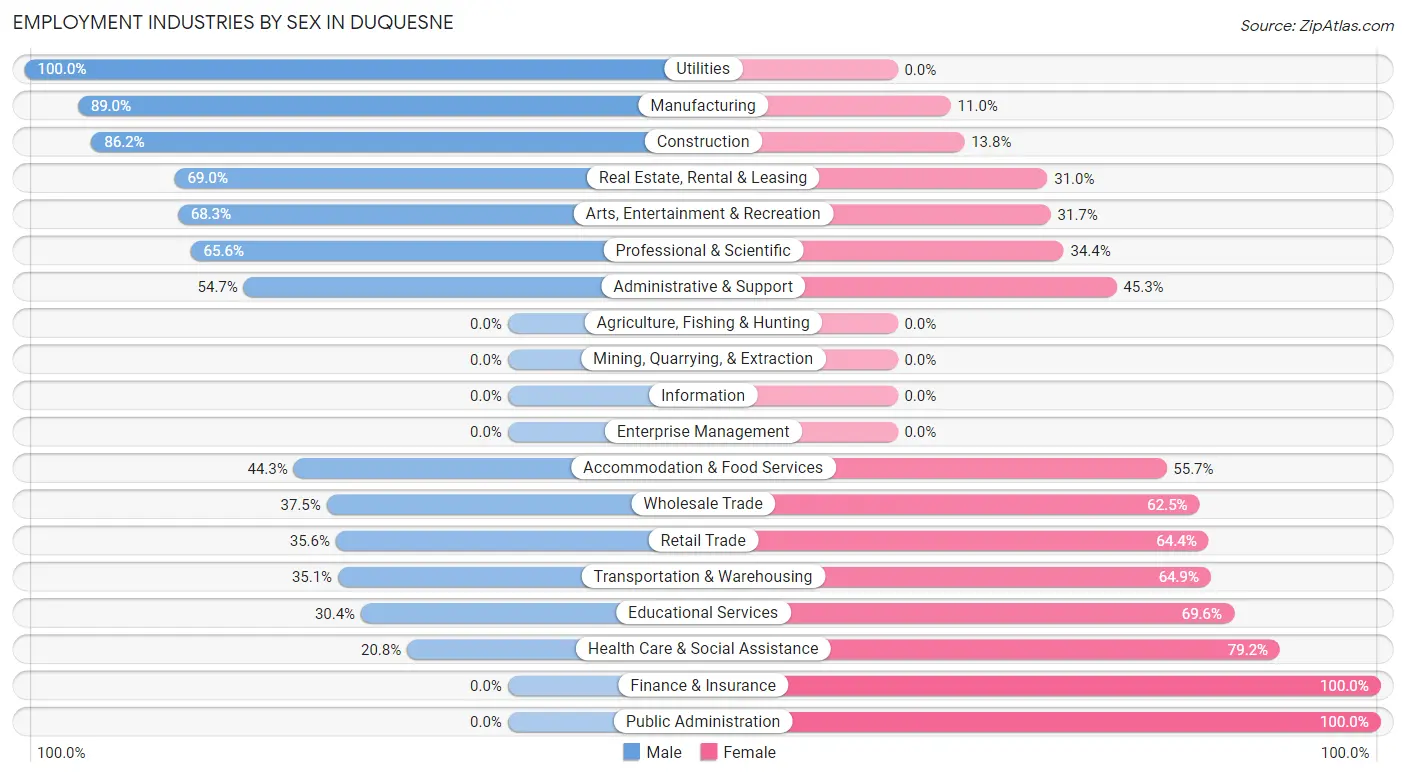
| Industry | Male | Female |
| Agriculture, Fishing & Hunting | 0 (0.0%) | 0 (0.0%) |
| Mining, Quarrying, & Extraction | 0 (0.0%) | 0 (0.0%) |
| Construction | 81 (86.2%) | 13 (13.8%) |
| Manufacturing | 105 (89.0%) | 13 (11.0%) |
| Wholesale Trade | 3 (37.5%) | 5 (62.5%) |
| Retail Trade | 132 (35.6%) | 239 (64.4%) |
| Transportation & Warehousing | 26 (35.1%) | 48 (64.9%) |
| Utilities | 8 (100.0%) | 0 (0.0%) |
| Information | 0 (0.0%) | 0 (0.0%) |
| Finance & Insurance | 0 (0.0%) | 42 (100.0%) |
| Real Estate, Rental & Leasing | 60 (69.0%) | 27 (31.0%) |
| Professional & Scientific | 21 (65.6%) | 11 (34.4%) |
| Enterprise Management | 0 (0.0%) | 0 (0.0%) |
| Administrative & Support | 82 (54.7%) | 68 (45.3%) |
| Educational Services | 103 (30.4%) | 236 (69.6%) |
| Health Care & Social Assistance | 99 (20.8%) | 376 (79.2%) |
| Arts, Entertainment & Recreation | 56 (68.3%) | 26 (31.7%) |
| Accommodation & Food Services | 86 (44.3%) | 108 (55.7%) |
| Public Administration | 0 (0.0%) | 10 (100.0%) |
| Total | 1,008 (44.4%) | 1,263 (55.6%) |
Education in Duquesne
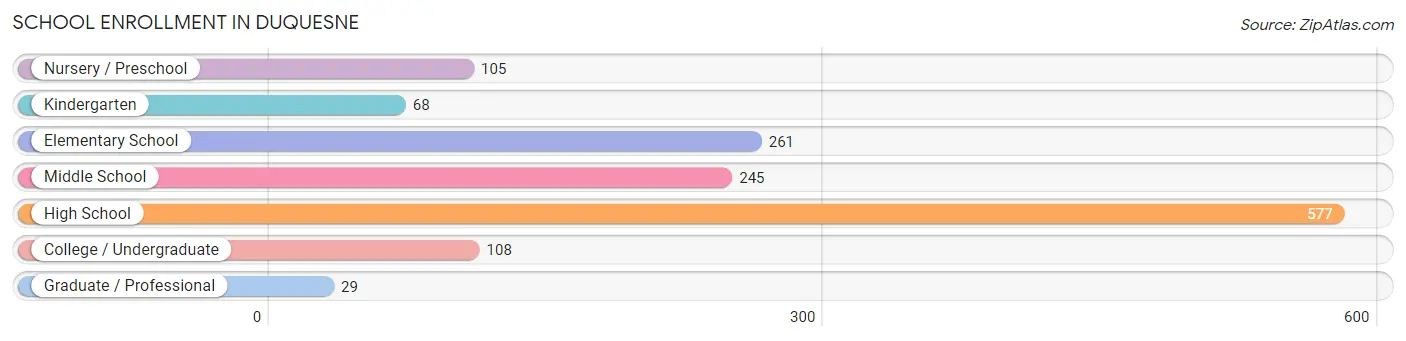
School Enrollment in Duquesne
The most common levels of schooling among the 1,393 students in Duquesne are high school (577 | 41.4%), elementary school (261 | 18.7%), and middle school (245 | 17.6%).
| School Level | # Students | % Students |
| Nursery / Preschool | 105 | 7.5% |
| Kindergarten | 68 | 4.9% |
| Elementary School | 261 | 18.7% |
| Middle School | 245 | 17.6% |
| High School | 577 | 41.4% |
| College / Undergraduate | 108 | 7.7% |
| Graduate / Professional | 29 | 2.1% |
| Total | 1,393 | 100.0% |
School Enrollment by Age by Funding Source in Duquesne
Out of a total of 1,393 students who are enrolled in schools in Duquesne, 120 (8.6%) attend a private institution, while the remaining 1,273 (91.4%) are enrolled in public schools. The age group of 20 to 24 year olds has the highest likelihood of being enrolled in private schools, with 6 (60.0% in the age bracket) enrolled. Conversely, the age group of 3 to 4 year olds has the lowest likelihood of being enrolled in a private school, with 90 (100.0% in the age bracket) attending a public institution.
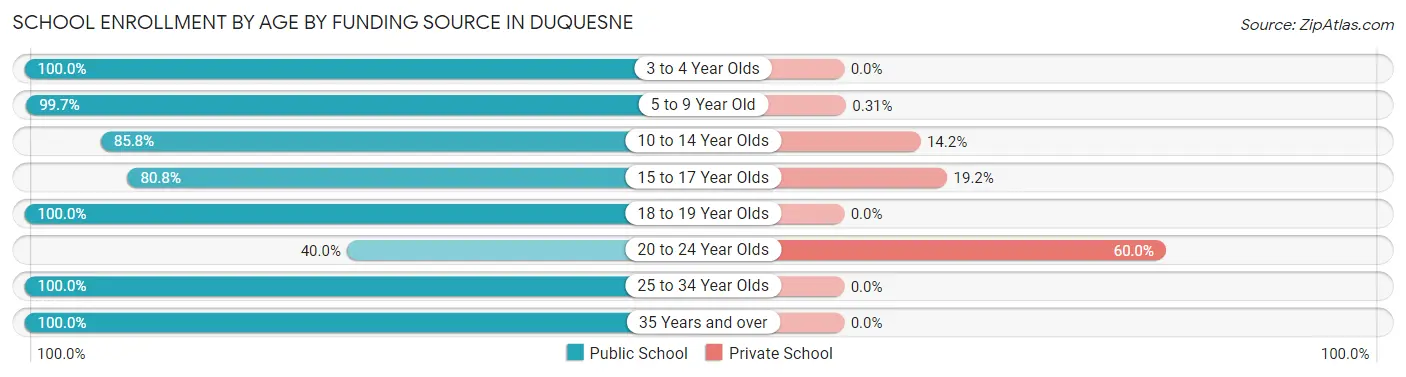
| Age Bracket | Public School | Private School |
| 3 to 4 Year Olds | 90 (100.0%) | 0 (0.0%) |
| 5 to 9 Year Old | 321 (99.7%) | 1 (0.3%) |
| 10 to 14 Year Olds | 320 (85.8%) | 53 (14.2%) |
| 15 to 17 Year Olds | 253 (80.8%) | 60 (19.2%) |
| 18 to 19 Year Olds | 200 (100.0%) | 0 (0.0%) |
| 20 to 24 Year Olds | 4 (40.0%) | 6 (60.0%) |
| 25 to 34 Year Olds | 61 (100.0%) | 0 (0.0%) |
| 35 Years and over | 24 (100.0%) | 0 (0.0%) |
| Total | 1,273 (91.4%) | 120 (8.6%) |
Educational Attainment by Field of Study in Duquesne
Arts & humanities (82 | 21.7%), science & technology (52 | 13.8%), business (51 | 13.5%), computers & mathematics (37 | 9.8%), and education (32 | 8.5%) are the most common fields of study among 378 individuals in Duquesne who have obtained a bachelor's degree or higher.
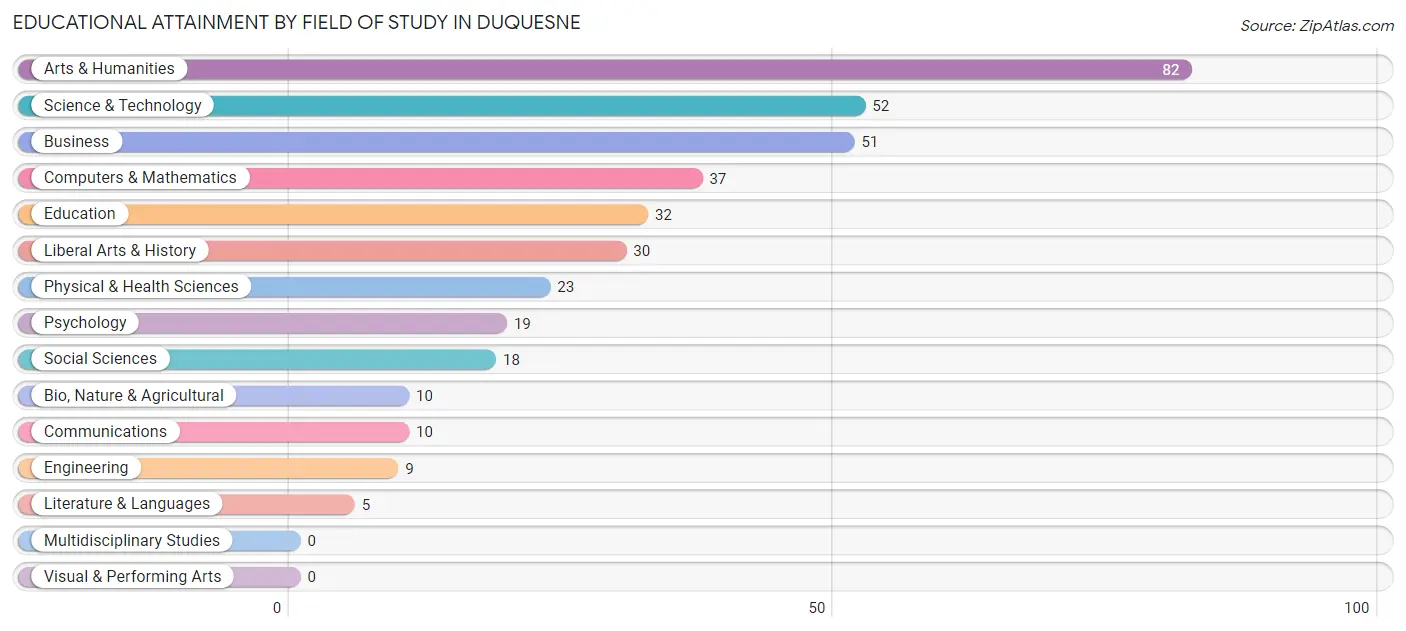
| Field of Study | # Graduates | % Graduates |
| Computers & Mathematics | 37 | 9.8% |
| Bio, Nature & Agricultural | 10 | 2.6% |
| Physical & Health Sciences | 23 | 6.1% |
| Psychology | 19 | 5.0% |
| Social Sciences | 18 | 4.8% |
| Engineering | 9 | 2.4% |
| Multidisciplinary Studies | 0 | 0.0% |
| Science & Technology | 52 | 13.8% |
| Business | 51 | 13.5% |
| Education | 32 | 8.5% |
| Literature & Languages | 5 | 1.3% |
| Liberal Arts & History | 30 | 7.9% |
| Visual & Performing Arts | 0 | 0.0% |
| Communications | 10 | 2.6% |
| Arts & Humanities | 82 | 21.7% |
| Total | 378 | 100.0% |
Transportation & Commute in Duquesne
Vehicle Availability by Sex in Duquesne
The most prevalent vehicle ownership categories in Duquesne are males with no vehicle (416, accounting for 42.2%) and females with no vehicle (374, making up 33.3%).
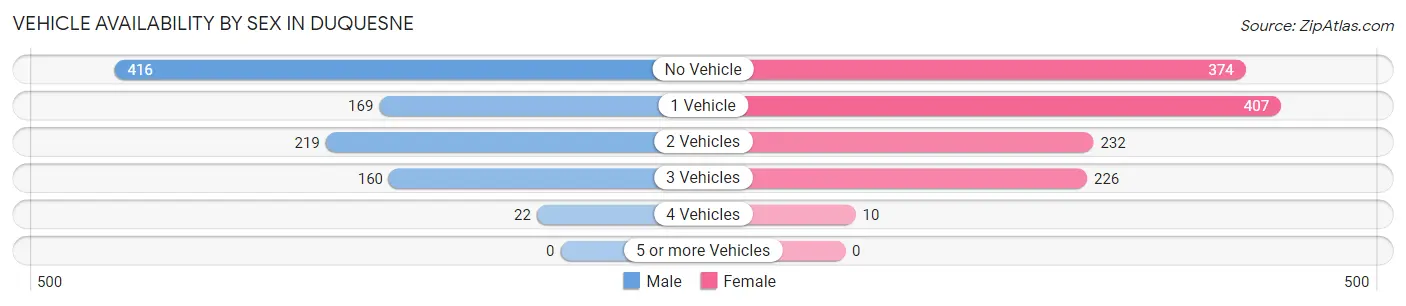
| Vehicles Available | Male | Female |
| No Vehicle | 416 (42.2%) | 374 (29.9%) |
| 1 Vehicle | 169 (17.1%) | 407 (32.6%) |
| 2 Vehicles | 219 (22.2%) | 232 (18.6%) |
| 3 Vehicles | 160 (16.2%) | 226 (18.1%) |
| 4 Vehicles | 22 (2.2%) | 10 (0.8%) |
| 5 or more Vehicles | 0 (0.0%) | 0 (0.0%) |
| Total | 986 (100.0%) | 1,249 (100.0%) |
Commute Time in Duquesne
The most frequently occuring commute durations in Duquesne are 60 to 89 minutes (336 commuters, 17.7%), 15 to 19 minutes (237 commuters, 12.5%), and 30 to 34 minutes (228 commuters, 12.0%).
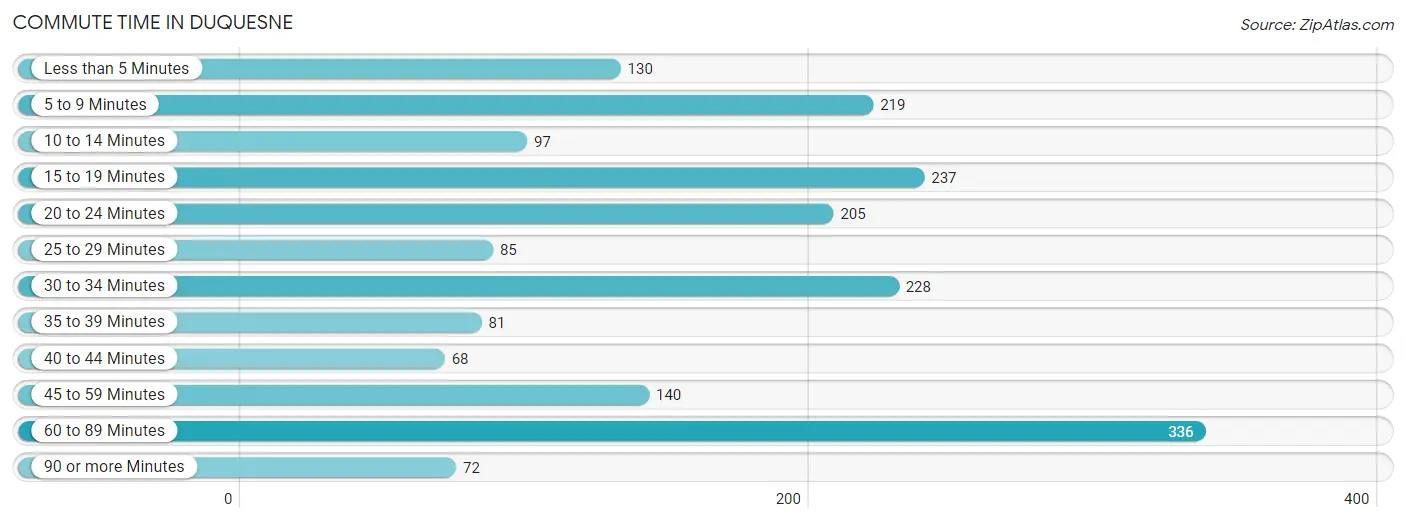
| Commute Time | # Commuters | % Commuters |
| Less than 5 Minutes | 130 | 6.9% |
| 5 to 9 Minutes | 219 | 11.5% |
| 10 to 14 Minutes | 97 | 5.1% |
| 15 to 19 Minutes | 237 | 12.5% |
| 20 to 24 Minutes | 205 | 10.8% |
| 25 to 29 Minutes | 85 | 4.5% |
| 30 to 34 Minutes | 228 | 12.0% |
| 35 to 39 Minutes | 81 | 4.3% |
| 40 to 44 Minutes | 68 | 3.6% |
| 45 to 59 Minutes | 140 | 7.4% |
| 60 to 89 Minutes | 336 | 17.7% |
| 90 or more Minutes | 72 | 3.8% |
Commute Time by Sex in Duquesne
The most common commute times in Duquesne are 60 to 89 minutes (192 commuters, 21.5%) for males and 15 to 19 minutes (164 commuters, 16.3%) for females.
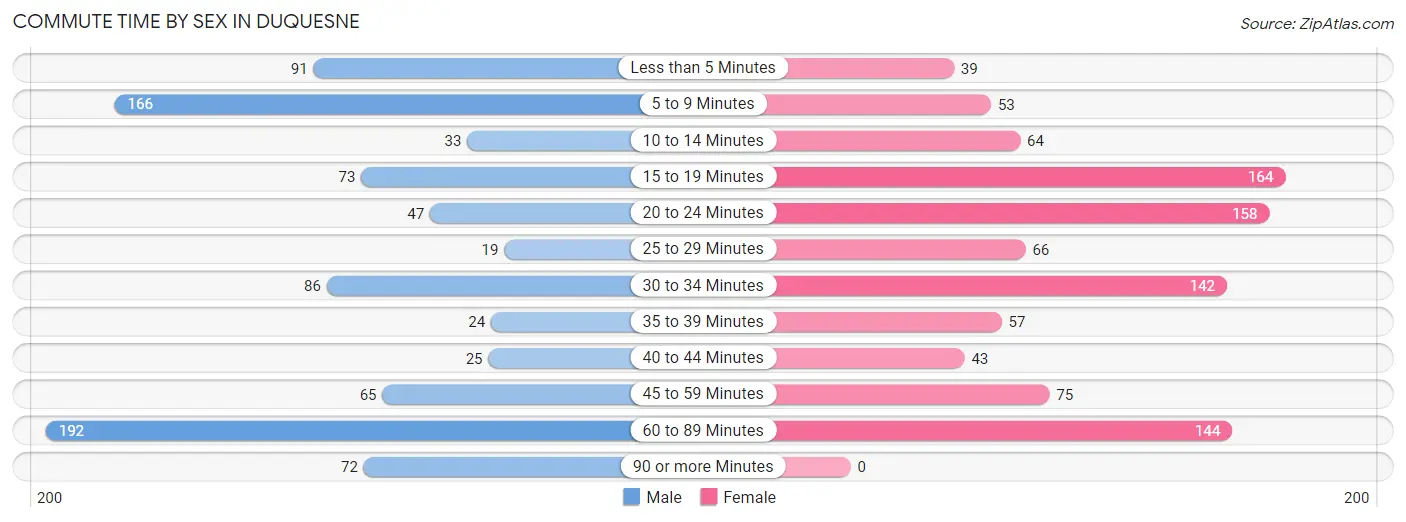
| Commute Time | Male | Female |
| Less than 5 Minutes | 91 (10.2%) | 39 (3.9%) |
| 5 to 9 Minutes | 166 (18.6%) | 53 (5.3%) |
| 10 to 14 Minutes | 33 (3.7%) | 64 (6.4%) |
| 15 to 19 Minutes | 73 (8.2%) | 164 (16.3%) |
| 20 to 24 Minutes | 47 (5.3%) | 158 (15.7%) |
| 25 to 29 Minutes | 19 (2.1%) | 66 (6.6%) |
| 30 to 34 Minutes | 86 (9.6%) | 142 (14.1%) |
| 35 to 39 Minutes | 24 (2.7%) | 57 (5.7%) |
| 40 to 44 Minutes | 25 (2.8%) | 43 (4.3%) |
| 45 to 59 Minutes | 65 (7.3%) | 75 (7.5%) |
| 60 to 89 Minutes | 192 (21.5%) | 144 (14.3%) |
| 90 or more Minutes | 72 (8.1%) | 0 (0.0%) |
Time of Departure to Work by Sex in Duquesne
The most frequent times of departure to work in Duquesne are 12:00 PM to 3:59 PM (151, 16.9%) for males and 6:00 AM to 6:29 AM (169, 16.8%) for females.
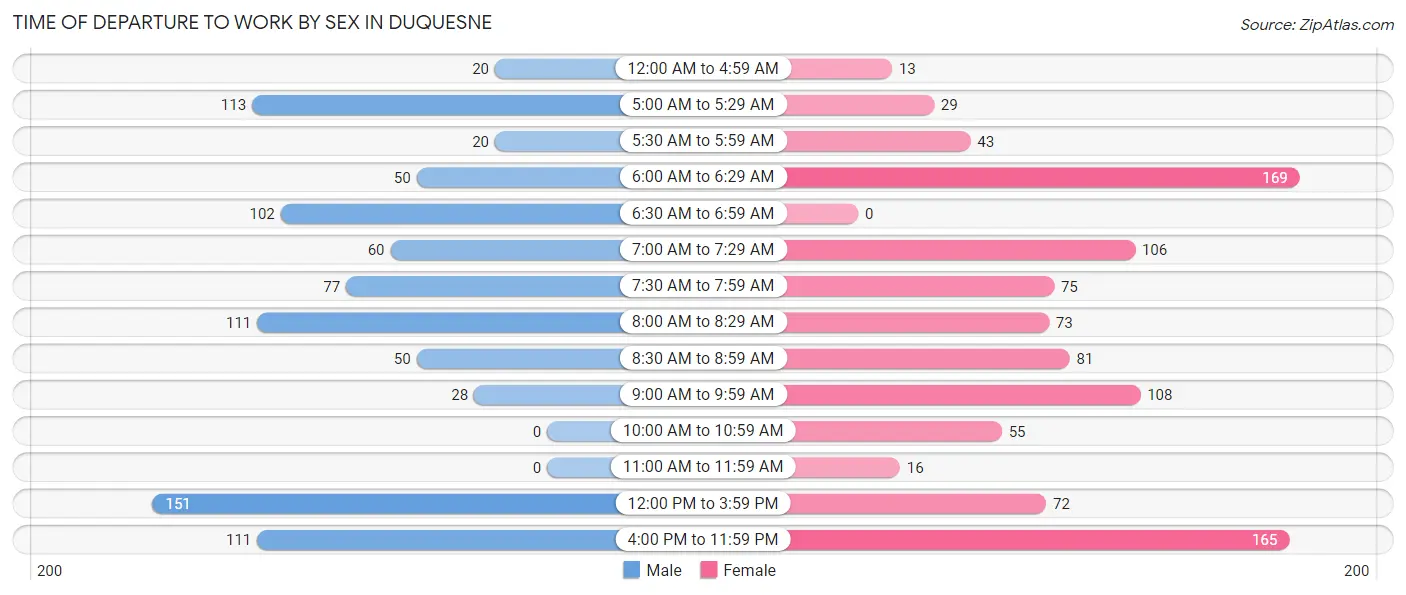
| Time of Departure | Male | Female |
| 12:00 AM to 4:59 AM | 20 (2.2%) | 13 (1.3%) |
| 5:00 AM to 5:29 AM | 113 (12.7%) | 29 (2.9%) |
| 5:30 AM to 5:59 AM | 20 (2.2%) | 43 (4.3%) |
| 6:00 AM to 6:29 AM | 50 (5.6%) | 169 (16.8%) |
| 6:30 AM to 6:59 AM | 102 (11.4%) | 0 (0.0%) |
| 7:00 AM to 7:29 AM | 60 (6.7%) | 106 (10.5%) |
| 7:30 AM to 7:59 AM | 77 (8.6%) | 75 (7.5%) |
| 8:00 AM to 8:29 AM | 111 (12.4%) | 73 (7.3%) |
| 8:30 AM to 8:59 AM | 50 (5.6%) | 81 (8.1%) |
| 9:00 AM to 9:59 AM | 28 (3.1%) | 108 (10.7%) |
| 10:00 AM to 10:59 AM | 0 (0.0%) | 55 (5.5%) |
| 11:00 AM to 11:59 AM | 0 (0.0%) | 16 (1.6%) |
| 12:00 PM to 3:59 PM | 151 (16.9%) | 72 (7.2%) |
| 4:00 PM to 11:59 PM | 111 (12.4%) | 165 (16.4%) |
| Total | 893 (100.0%) | 1,005 (100.0%) |
Housing Occupancy in Duquesne
Occupancy by Ownership in Duquesne
Of the total 2,083 dwellings in Duquesne, owner-occupied units account for 929 (44.6%), while renter-occupied units make up 1,154 (55.4%).
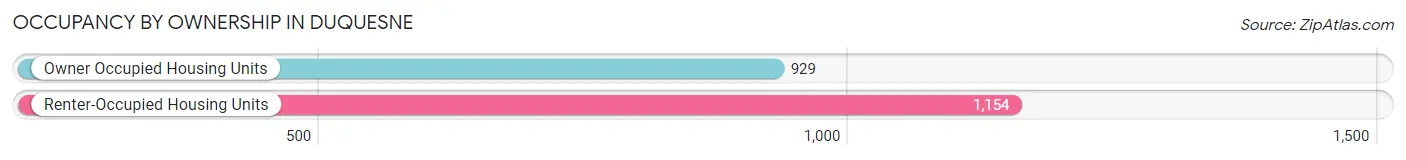
| Occupancy | # Housing Units | % Housing Units |
| Owner Occupied Housing Units | 929 | 44.6% |
| Renter-Occupied Housing Units | 1,154 | 55.4% |
| Total Occupied Housing Units | 2,083 | 100.0% |
Occupancy by Household Size in Duquesne
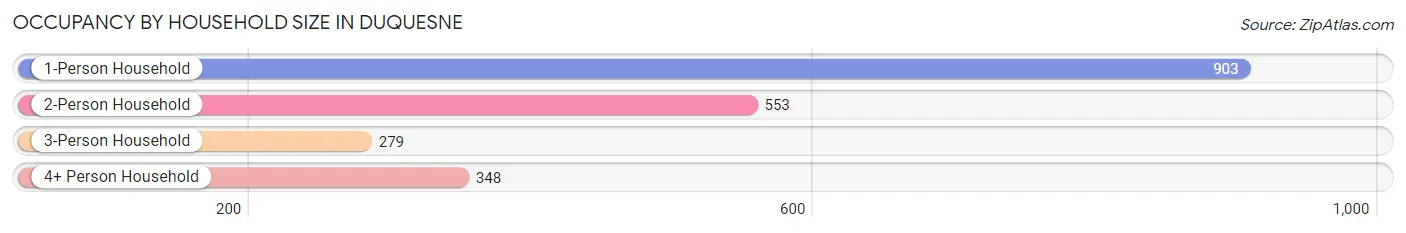
| Household Size | # Housing Units | % Housing Units |
| 1-Person Household | 903 | 43.3% |
| 2-Person Household | 553 | 26.6% |
| 3-Person Household | 279 | 13.4% |
| 4+ Person Household | 348 | 16.7% |
| Total Housing Units | 2,083 | 100.0% |
Occupancy by Ownership by Household Size in Duquesne
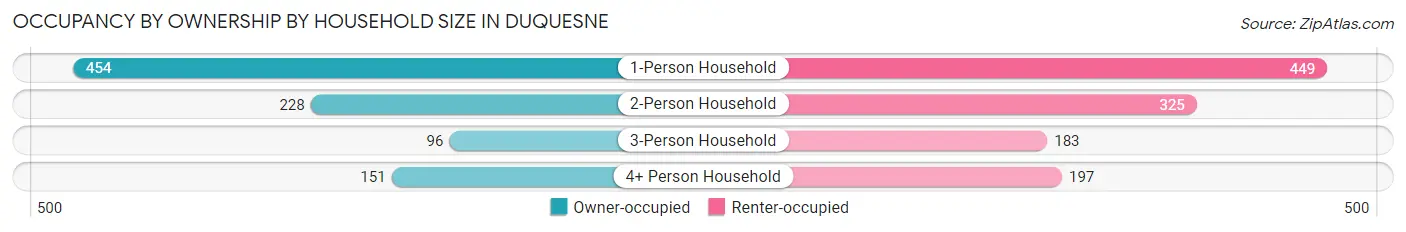
| Household Size | Owner-occupied | Renter-occupied |
| 1-Person Household | 454 (50.3%) | 449 (49.7%) |
| 2-Person Household | 228 (41.2%) | 325 (58.8%) |
| 3-Person Household | 96 (34.4%) | 183 (65.6%) |
| 4+ Person Household | 151 (43.4%) | 197 (56.6%) |
| Total Housing Units | 929 (44.6%) | 1,154 (55.4%) |
Occupancy by Educational Attainment in Duquesne
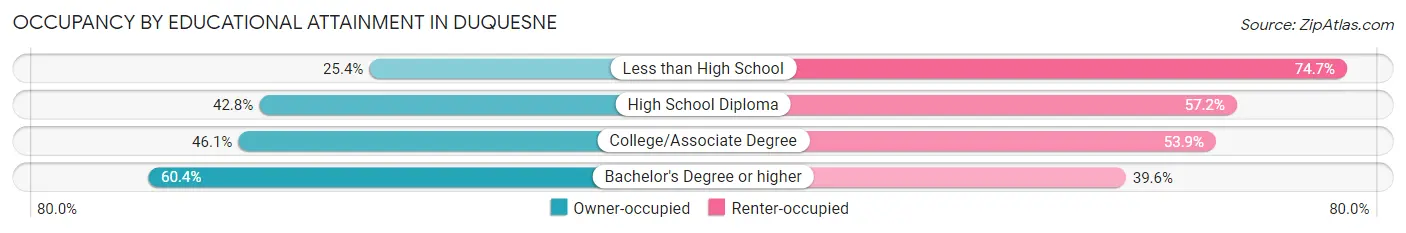
| Household Size | Owner-occupied | Renter-occupied |
| Less than High School | 55 (25.4%) | 162 (74.7%) |
| High School Diploma | 369 (42.8%) | 493 (57.2%) |
| College/Associate Degree | 328 (46.1%) | 383 (53.9%) |
| Bachelor's Degree or higher | 177 (60.4%) | 116 (39.6%) |
Occupancy by Age of Householder in Duquesne
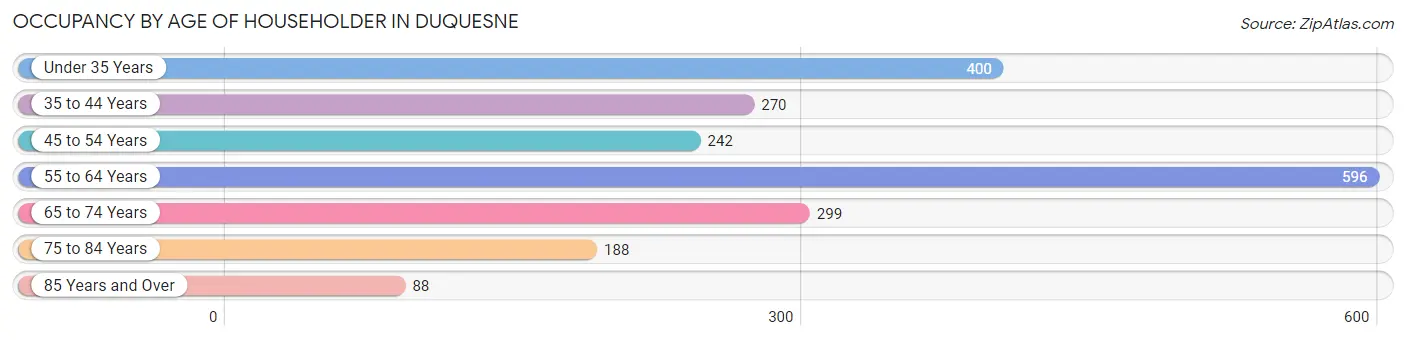
| Age Bracket | # Households | % Households |
| Under 35 Years | 400 | 19.2% |
| 35 to 44 Years | 270 | 13.0% |
| 45 to 54 Years | 242 | 11.6% |
| 55 to 64 Years | 596 | 28.6% |
| 65 to 74 Years | 299 | 14.3% |
| 75 to 84 Years | 188 | 9.0% |
| 85 Years and Over | 88 | 4.2% |
| Total | 2,083 | 100.0% |
Housing Finances in Duquesne
Median Income by Occupancy in Duquesne
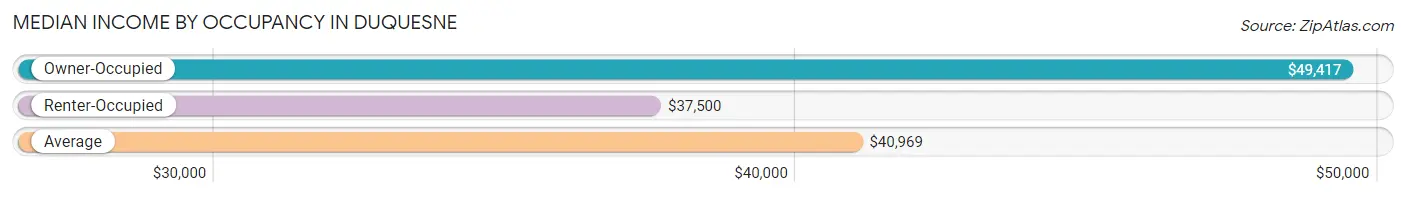
| Occupancy Type | # Households | Median Income |
| Owner-Occupied | 929 (44.6%) | $49,417 |
| Renter-Occupied | 1,154 (55.4%) | $37,500 |
| Average | 2,083 (100.0%) | $40,969 |
Occupancy by Householder Income Bracket in Duquesne
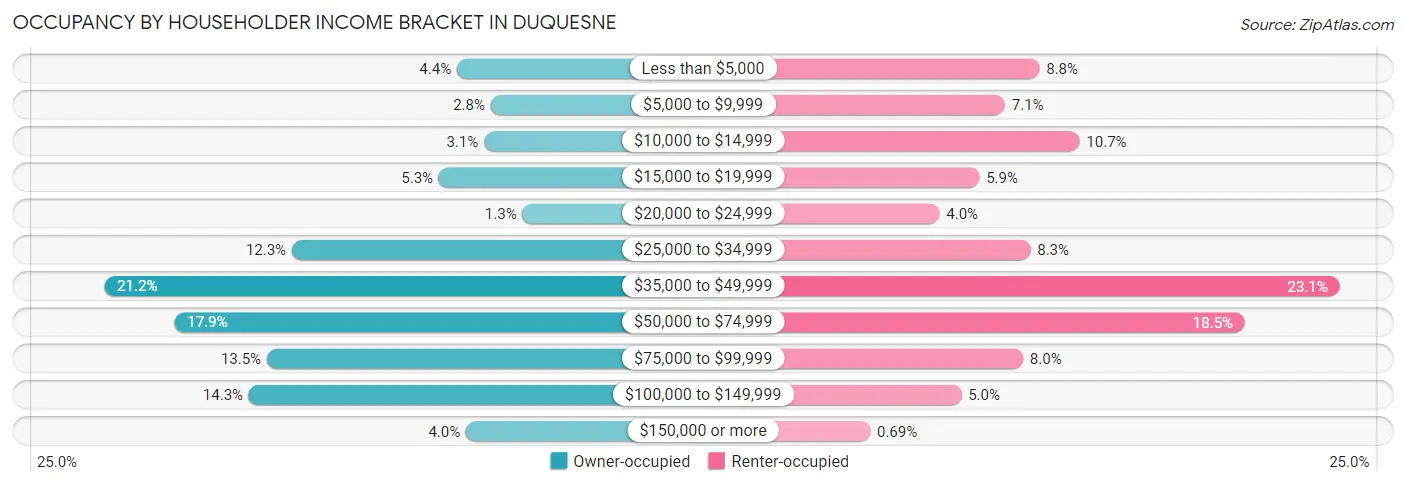
| Income Bracket | Owner-occupied | Renter-occupied |
| Less than $5,000 | 41 (4.4%) | 101 (8.7%) |
| $5,000 to $9,999 | 26 (2.8%) | 82 (7.1%) |
| $10,000 to $14,999 | 29 (3.1%) | 123 (10.7%) |
| $15,000 to $19,999 | 49 (5.3%) | 68 (5.9%) |
| $20,000 to $24,999 | 12 (1.3%) | 46 (4.0%) |
| $25,000 to $34,999 | 114 (12.3%) | 96 (8.3%) |
| $35,000 to $49,999 | 197 (21.2%) | 266 (23.1%) |
| $50,000 to $74,999 | 166 (17.9%) | 214 (18.5%) |
| $75,000 to $99,999 | 125 (13.5%) | 92 (8.0%) |
| $100,000 to $149,999 | 133 (14.3%) | 58 (5.0%) |
| $150,000 or more | 37 (4.0%) | 8 (0.7%) |
| Total | 929 (100.0%) | 1,154 (100.0%) |
Monthly Housing Cost Tiers in Duquesne
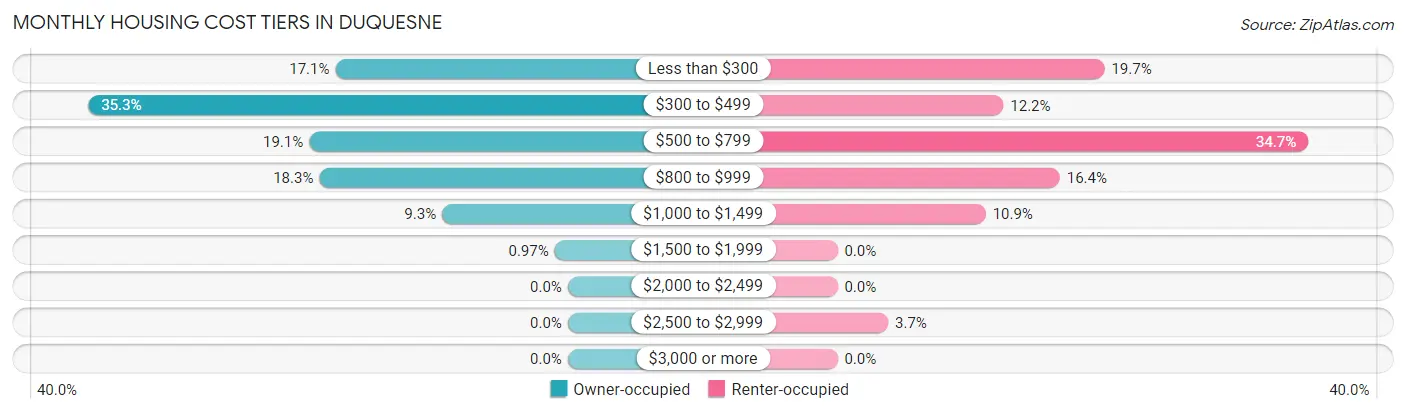
| Monthly Cost | Owner-occupied | Renter-occupied |
| Less than $300 | 159 (17.1%) | 227 (19.7%) |
| $300 to $499 | 328 (35.3%) | 141 (12.2%) |
| $500 to $799 | 177 (19.1%) | 400 (34.7%) |
| $800 to $999 | 170 (18.3%) | 189 (16.4%) |
| $1,000 to $1,499 | 86 (9.3%) | 126 (10.9%) |
| $1,500 to $1,999 | 9 (1.0%) | 0 (0.0%) |
| $2,000 to $2,499 | 0 (0.0%) | 0 (0.0%) |
| $2,500 to $2,999 | 0 (0.0%) | 43 (3.7%) |
| $3,000 or more | 0 (0.0%) | 0 (0.0%) |
| Total | 929 (100.0%) | 1,154 (100.0%) |
Physical Housing Characteristics in Duquesne
Housing Structures in Duquesne
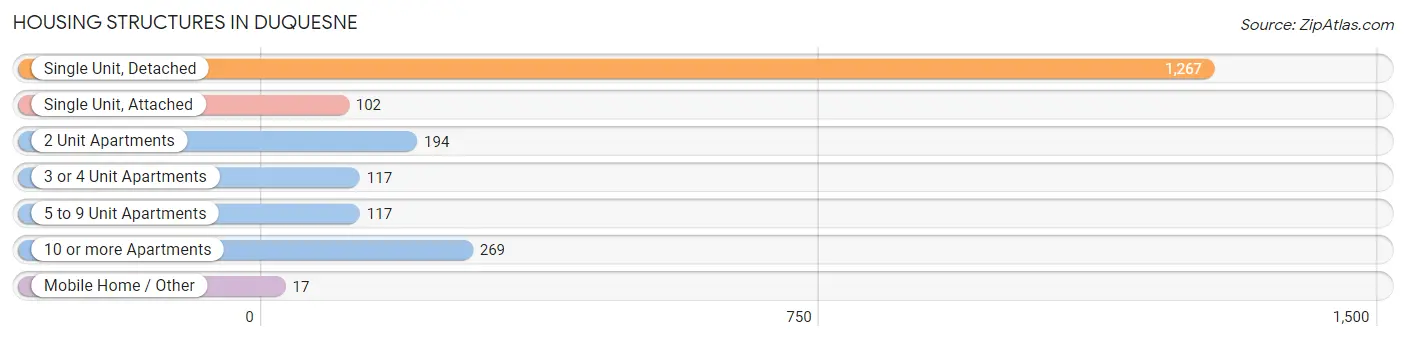
| Structure Type | # Housing Units | % Housing Units |
| Single Unit, Detached | 1,267 | 60.8% |
| Single Unit, Attached | 102 | 4.9% |
| 2 Unit Apartments | 194 | 9.3% |
| 3 or 4 Unit Apartments | 117 | 5.6% |
| 5 to 9 Unit Apartments | 117 | 5.6% |
| 10 or more Apartments | 269 | 12.9% |
| Mobile Home / Other | 17 | 0.8% |
| Total | 2,083 | 100.0% |
Housing Structures by Occupancy in Duquesne
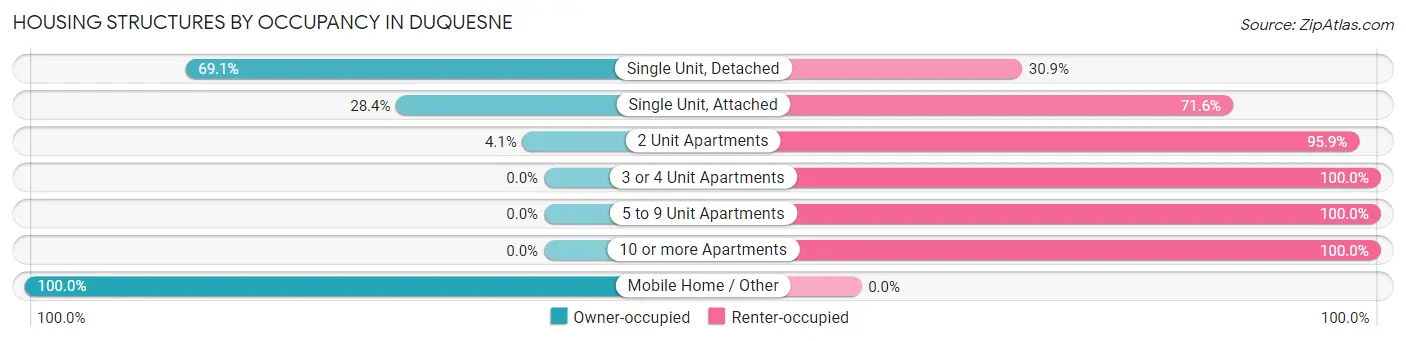
| Structure Type | Owner-occupied | Renter-occupied |
| Single Unit, Detached | 875 (69.1%) | 392 (30.9%) |
| Single Unit, Attached | 29 (28.4%) | 73 (71.6%) |
| 2 Unit Apartments | 8 (4.1%) | 186 (95.9%) |
| 3 or 4 Unit Apartments | 0 (0.0%) | 117 (100.0%) |
| 5 to 9 Unit Apartments | 0 (0.0%) | 117 (100.0%) |
| 10 or more Apartments | 0 (0.0%) | 269 (100.0%) |
| Mobile Home / Other | 17 (100.0%) | 0 (0.0%) |
| Total | 929 (44.6%) | 1,154 (55.4%) |
Housing Structures by Number of Rooms in Duquesne
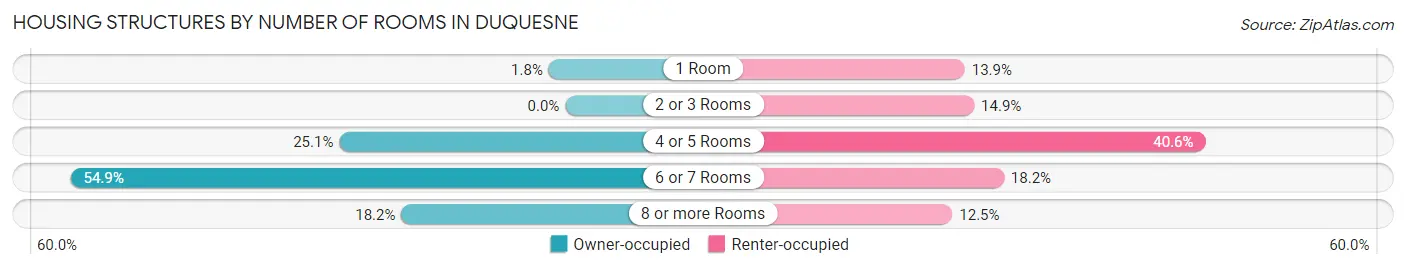
| Number of Rooms | Owner-occupied | Renter-occupied |
| 1 Room | 17 (1.8%) | 160 (13.9%) |
| 2 or 3 Rooms | 0 (0.0%) | 172 (14.9%) |
| 4 or 5 Rooms | 233 (25.1%) | 468 (40.6%) |
| 6 or 7 Rooms | 510 (54.9%) | 210 (18.2%) |
| 8 or more Rooms | 169 (18.2%) | 144 (12.5%) |
| Total | 929 (100.0%) | 1,154 (100.0%) |
Housing Structure by Heating Type in Duquesne
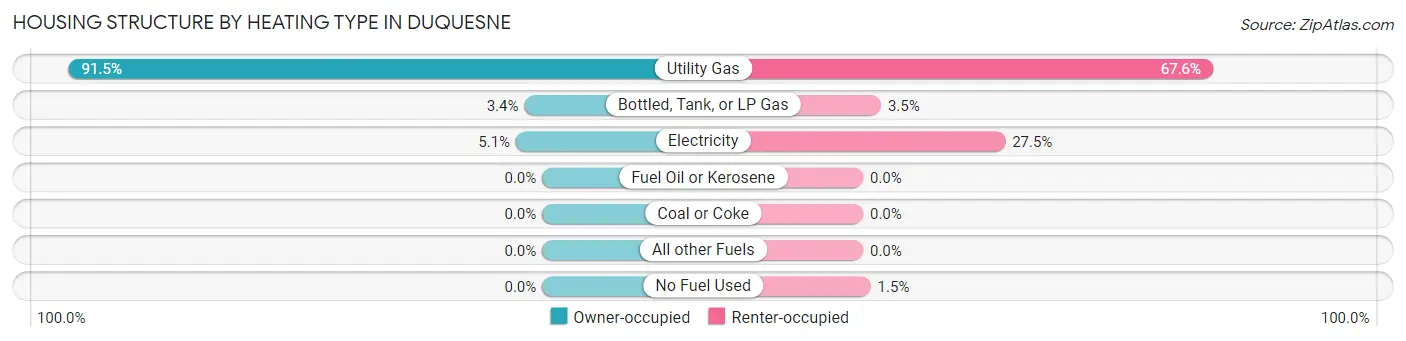
| Heating Type | Owner-occupied | Renter-occupied |
| Utility Gas | 850 (91.5%) | 780 (67.6%) |
| Bottled, Tank, or LP Gas | 32 (3.4%) | 40 (3.5%) |
| Electricity | 47 (5.1%) | 317 (27.5%) |
| Fuel Oil or Kerosene | 0 (0.0%) | 0 (0.0%) |
| Coal or Coke | 0 (0.0%) | 0 (0.0%) |
| All other Fuels | 0 (0.0%) | 0 (0.0%) |
| No Fuel Used | 0 (0.0%) | 17 (1.5%) |
| Total | 929 (100.0%) | 1,154 (100.0%) |
Household Vehicle Usage in Duquesne
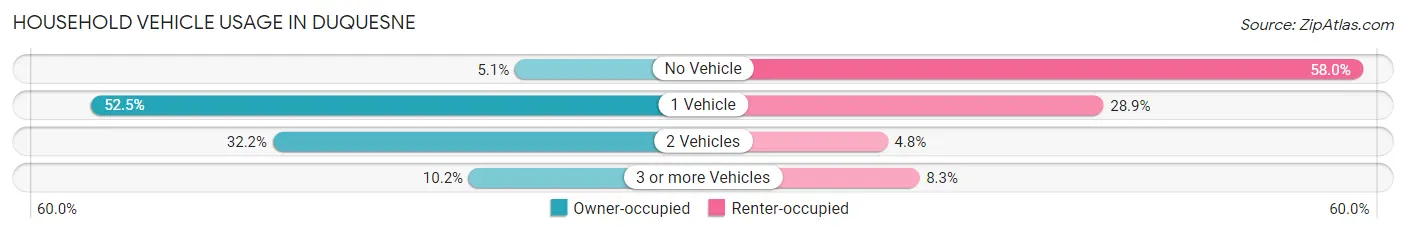
| Vehicles per Household | Owner-occupied | Renter-occupied |
| No Vehicle | 47 (5.1%) | 669 (58.0%) |
| 1 Vehicle | 488 (52.5%) | 334 (28.9%) |
| 2 Vehicles | 299 (32.2%) | 55 (4.8%) |
| 3 or more Vehicles | 95 (10.2%) | 96 (8.3%) |
| Total | 929 (100.0%) | 1,154 (100.0%) |
Real Estate & Mortgages in Duquesne
Real Estate and Mortgage Overview in Duquesne
| Characteristic | Without Mortgage | With Mortgage |
| Housing Units | 580 | 349 |
| Median Property Value | $49,500 | $64,300 |
| Median Household Income | $50,625 | $0 |
| Monthly Housing Costs | $373 | $0 |
| Real Estate Taxes | $624 | $4 |
Property Value by Mortgage Status in Duquesne
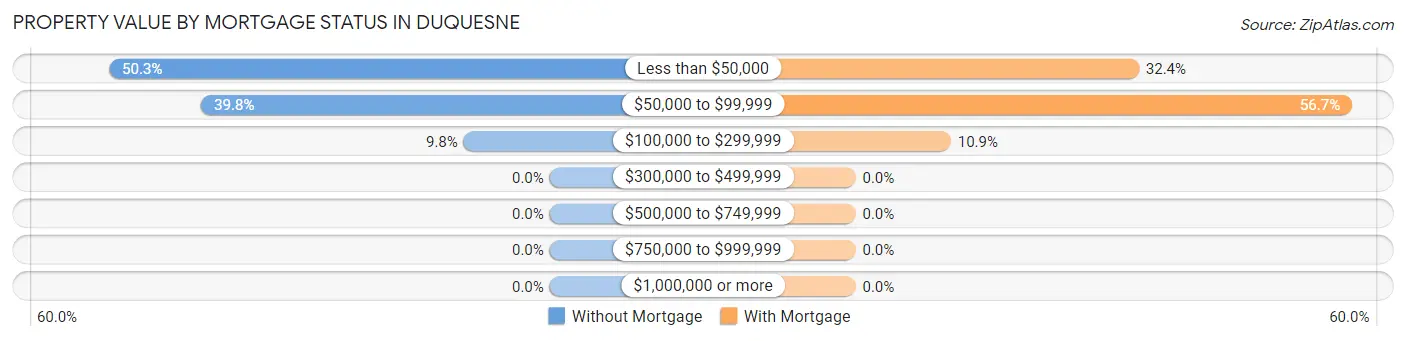
| Property Value | Without Mortgage | With Mortgage |
| Less than $50,000 | 292 (50.3%) | 113 (32.4%) |
| $50,000 to $99,999 | 231 (39.8%) | 198 (56.7%) |
| $100,000 to $299,999 | 57 (9.8%) | 38 (10.9%) |
| $300,000 to $499,999 | 0 (0.0%) | 0 (0.0%) |
| $500,000 to $749,999 | 0 (0.0%) | 0 (0.0%) |
| $750,000 to $999,999 | 0 (0.0%) | 0 (0.0%) |
| $1,000,000 or more | 0 (0.0%) | 0 (0.0%) |
| Total | 580 (100.0%) | 349 (100.0%) |
Household Income by Mortgage Status in Duquesne
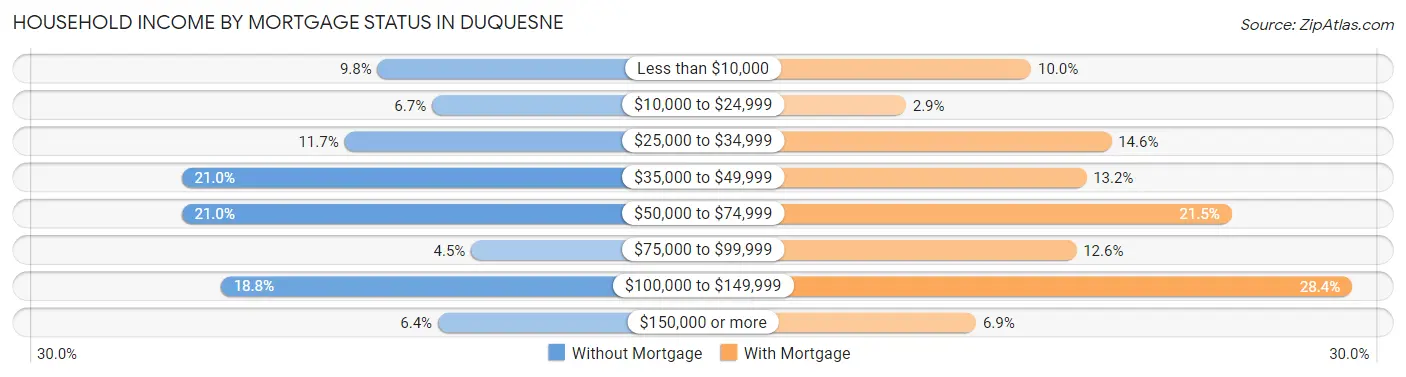
| Household Income | Without Mortgage | With Mortgage |
| Less than $10,000 | 57 (9.8%) | 35 (10.0%) |
| $10,000 to $24,999 | 39 (6.7%) | 10 (2.9%) |
| $25,000 to $34,999 | 68 (11.7%) | 51 (14.6%) |
| $35,000 to $49,999 | 122 (21.0%) | 46 (13.2%) |
| $50,000 to $74,999 | 122 (21.0%) | 75 (21.5%) |
| $75,000 to $99,999 | 26 (4.5%) | 44 (12.6%) |
| $100,000 to $149,999 | 109 (18.8%) | 99 (28.4%) |
| $150,000 or more | 37 (6.4%) | 24 (6.9%) |
| Total | 580 (100.0%) | 349 (100.0%) |
Property Value to Household Income Ratio in Duquesne
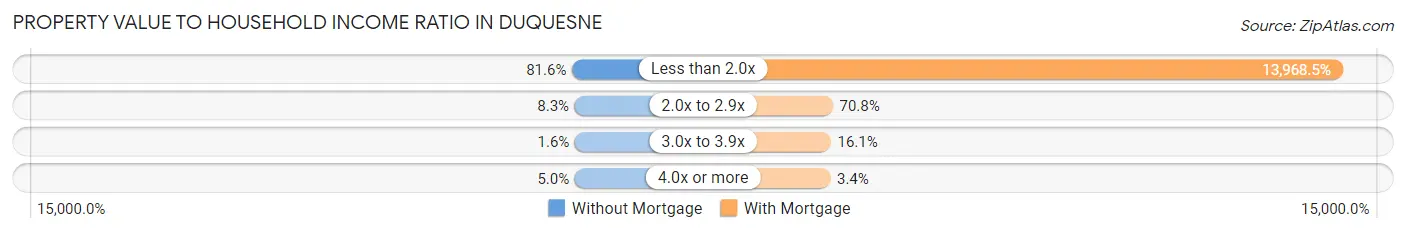
| Value-to-Income Ratio | Without Mortgage | With Mortgage |
| Less than 2.0x | 473 (81.6%) | 48,750 (13,968.5%) |
| 2.0x to 2.9x | 48 (8.3%) | 247 (70.8%) |
| 3.0x to 3.9x | 9 (1.5%) | 56 (16.1%) |
| 4.0x or more | 29 (5.0%) | 12 (3.4%) |
| Total | 580 (100.0%) | 349 (100.0%) |
Real Estate Taxes by Mortgage Status in Duquesne
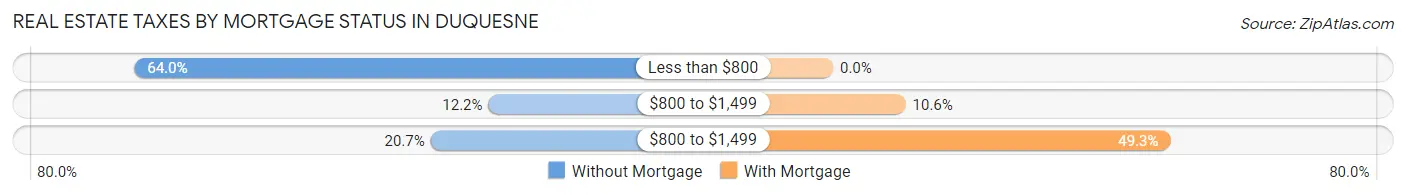
| Property Taxes | Without Mortgage | With Mortgage |
| Less than $800 | 371 (64.0%) | 0 (0.0%) |
| $800 to $1,499 | 71 (12.2%) | 37 (10.6%) |
| $800 to $1,499 | 120 (20.7%) | 172 (49.3%) |
| Total | 580 (100.0%) | 349 (100.0%) |
Health & Disability in Duquesne
Health Insurance Coverage by Age in Duquesne
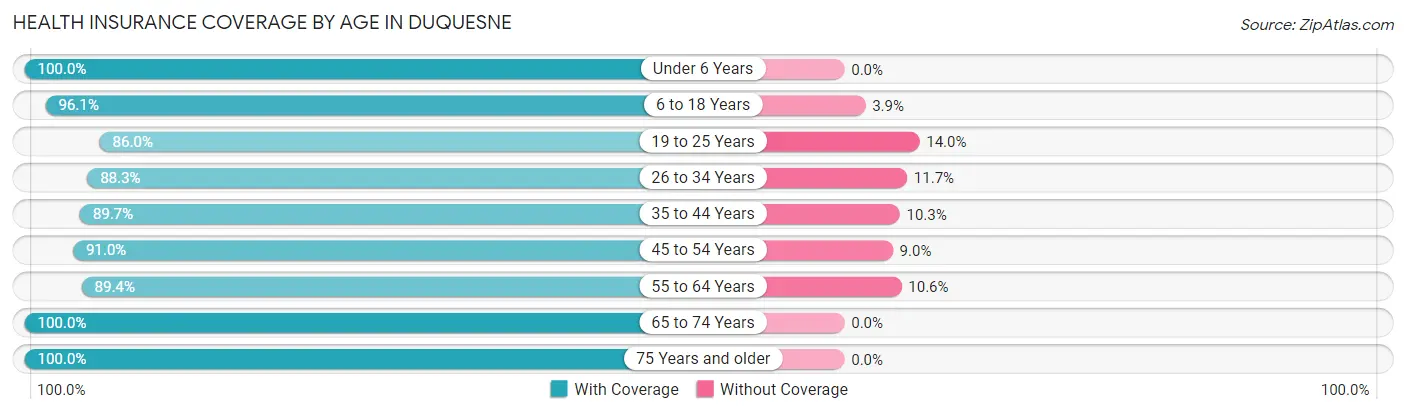
| Age Bracket | With Coverage | Without Coverage |
| Under 6 Years | 421 (100.0%) | 0 (0.0%) |
| 6 to 18 Years | 1,133 (96.1%) | 46 (3.9%) |
| 19 to 25 Years | 418 (86.0%) | 68 (14.0%) |
| 26 to 34 Years | 446 (88.3%) | 59 (11.7%) |
| 35 to 44 Years | 557 (89.7%) | 64 (10.3%) |
| 45 to 54 Years | 353 (91.0%) | 35 (9.0%) |
| 55 to 64 Years | 781 (89.4%) | 93 (10.6%) |
| 65 to 74 Years | 426 (100.0%) | 0 (0.0%) |
| 75 Years and older | 341 (100.0%) | 0 (0.0%) |
| Total | 4,876 (93.0%) | 365 (7.0%) |
Health Insurance Coverage by Citizenship Status in Duquesne
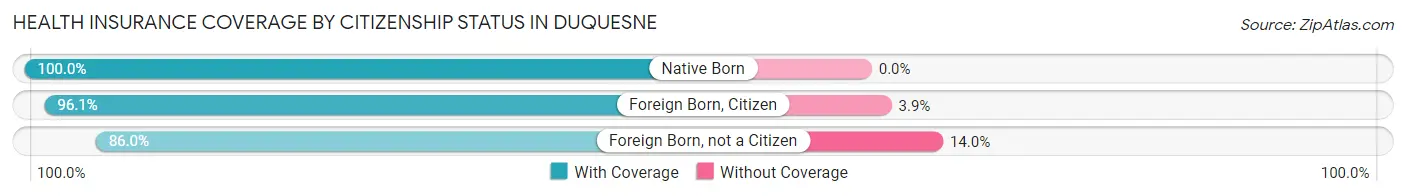
| Citizenship Status | With Coverage | Without Coverage |
| Native Born | 421 (100.0%) | 0 (0.0%) |
| Foreign Born, Citizen | 1,133 (96.1%) | 46 (3.9%) |
| Foreign Born, not a Citizen | 418 (86.0%) | 68 (14.0%) |
Health Insurance Coverage by Household Income in Duquesne
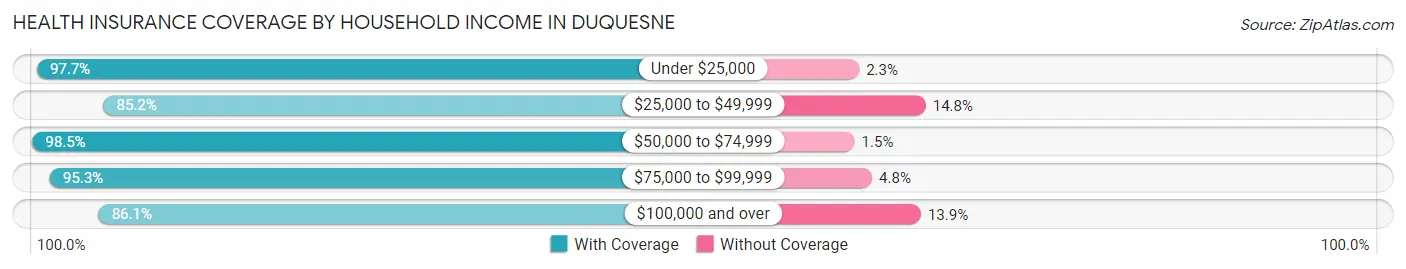
| Household Income | With Coverage | Without Coverage |
| Under $25,000 | 1,262 (97.7%) | 30 (2.3%) |
| $25,000 to $49,999 | 1,088 (85.2%) | 189 (14.8%) |
| $50,000 to $74,999 | 1,002 (98.5%) | 15 (1.5%) |
| $75,000 to $99,999 | 962 (95.3%) | 48 (4.8%) |
| $100,000 and over | 514 (86.1%) | 83 (13.9%) |
Public vs Private Health Insurance Coverage by Age in Duquesne
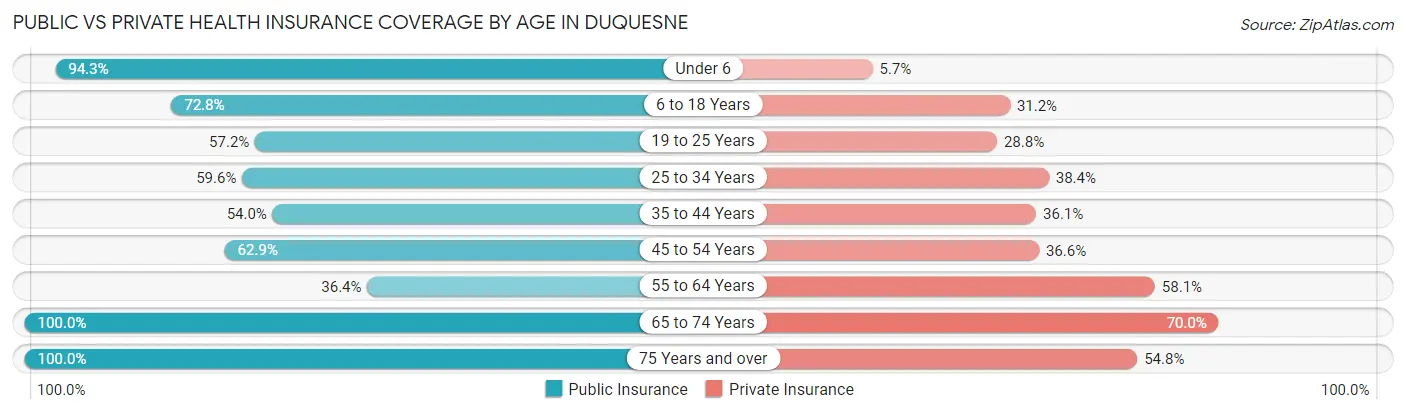
| Age Bracket | Public Insurance | Private Insurance |
| Under 6 | 397 (94.3%) | 24 (5.7%) |
| 6 to 18 Years | 858 (72.8%) | 368 (31.2%) |
| 19 to 25 Years | 278 (57.2%) | 140 (28.8%) |
| 25 to 34 Years | 301 (59.6%) | 194 (38.4%) |
| 35 to 44 Years | 335 (53.9%) | 224 (36.1%) |
| 45 to 54 Years | 244 (62.9%) | 142 (36.6%) |
| 55 to 64 Years | 318 (36.4%) | 508 (58.1%) |
| 65 to 74 Years | 426 (100.0%) | 298 (70.0%) |
| 75 Years and over | 341 (100.0%) | 187 (54.8%) |
| Total | 3,498 (66.7%) | 2,085 (39.8%) |
Disability Status by Sex by Age in Duquesne
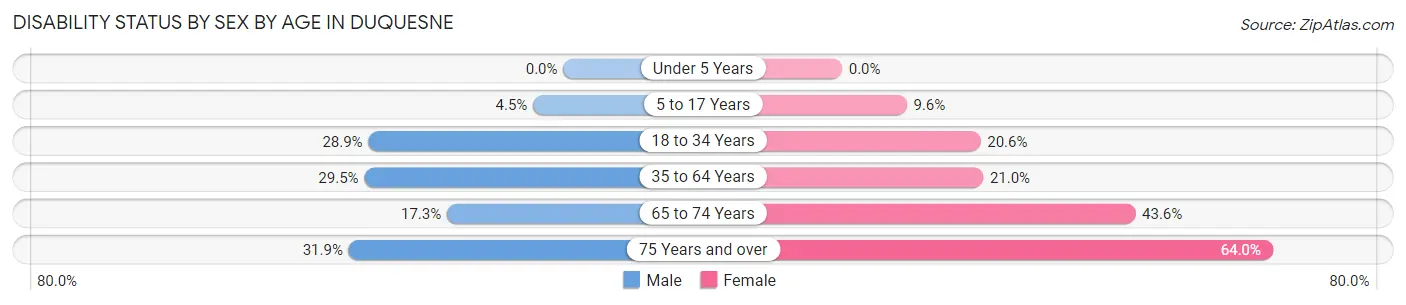
| Age Bracket | Male | Female |
| Under 5 Years | 0 (0.0%) | 0 (0.0%) |
| 5 to 17 Years | 27 (4.5%) | 44 (9.6%) |
| 18 to 34 Years | 167 (28.9%) | 123 (20.6%) |
| 35 to 64 Years | 280 (29.5%) | 196 (21.0%) |
| 65 to 74 Years | 24 (17.3%) | 125 (43.5%) |
| 75 Years and over | 29 (31.9%) | 160 (64.0%) |
Disability Class by Sex by Age in Duquesne
Disability Class: Hearing Difficulty
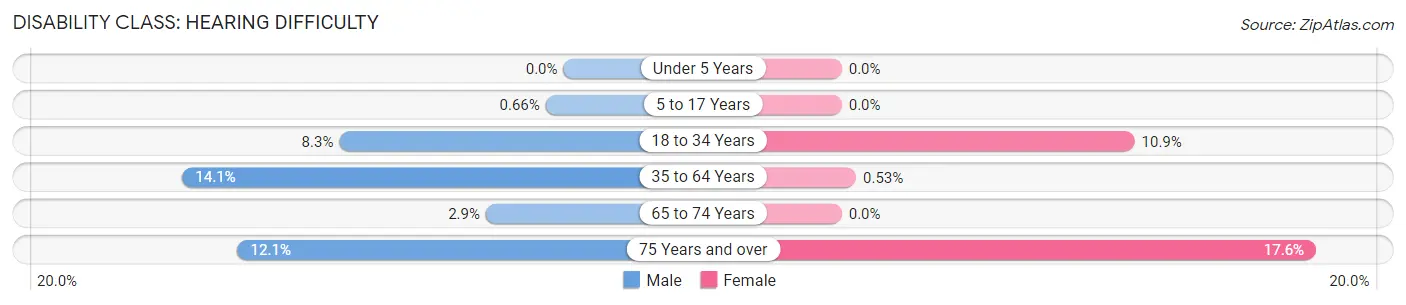
| Age Bracket | Male | Female |
| Under 5 Years | 0 (0.0%) | 0 (0.0%) |
| 5 to 17 Years | 4 (0.7%) | 0 (0.0%) |
| 18 to 34 Years | 48 (8.3%) | 65 (10.9%) |
| 35 to 64 Years | 134 (14.1%) | 5 (0.5%) |
| 65 to 74 Years | 4 (2.9%) | 0 (0.0%) |
| 75 Years and over | 11 (12.1%) | 44 (17.6%) |
Disability Class: Vision Difficulty
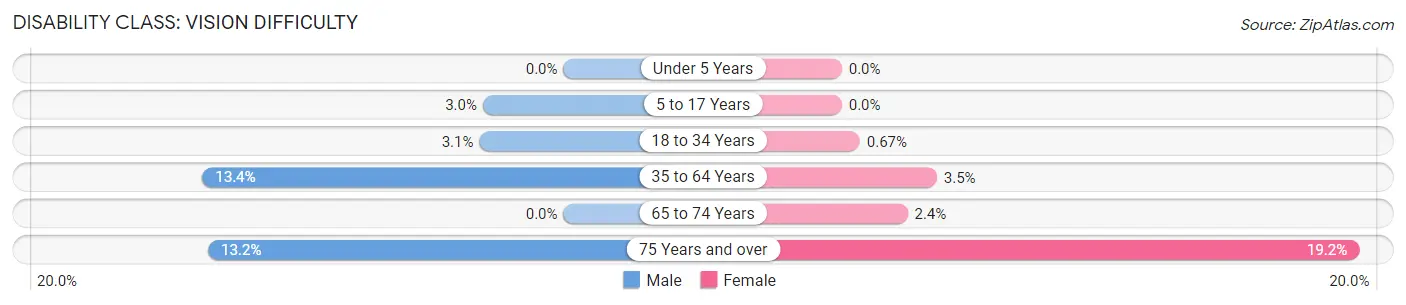
| Age Bracket | Male | Female |
| Under 5 Years | 0 (0.0%) | 0 (0.0%) |
| 5 to 17 Years | 18 (3.0%) | 0 (0.0%) |
| 18 to 34 Years | 18 (3.1%) | 4 (0.7%) |
| 35 to 64 Years | 127 (13.4%) | 33 (3.5%) |
| 65 to 74 Years | 0 (0.0%) | 7 (2.4%) |
| 75 Years and over | 12 (13.2%) | 48 (19.2%) |
Disability Class: Cognitive Difficulty
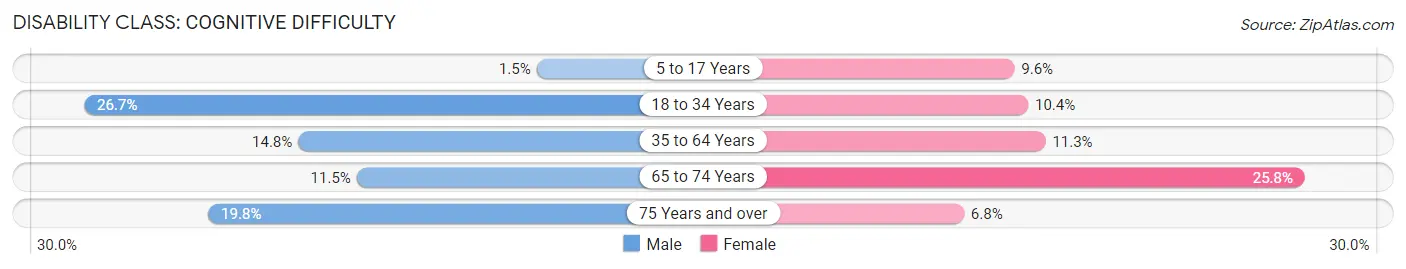
| Age Bracket | Male | Female |
| 5 to 17 Years | 9 (1.5%) | 44 (9.6%) |
| 18 to 34 Years | 154 (26.7%) | 62 (10.4%) |
| 35 to 64 Years | 140 (14.8%) | 106 (11.3%) |
| 65 to 74 Years | 16 (11.5%) | 74 (25.8%) |
| 75 Years and over | 18 (19.8%) | 17 (6.8%) |
Disability Class: Ambulatory Difficulty
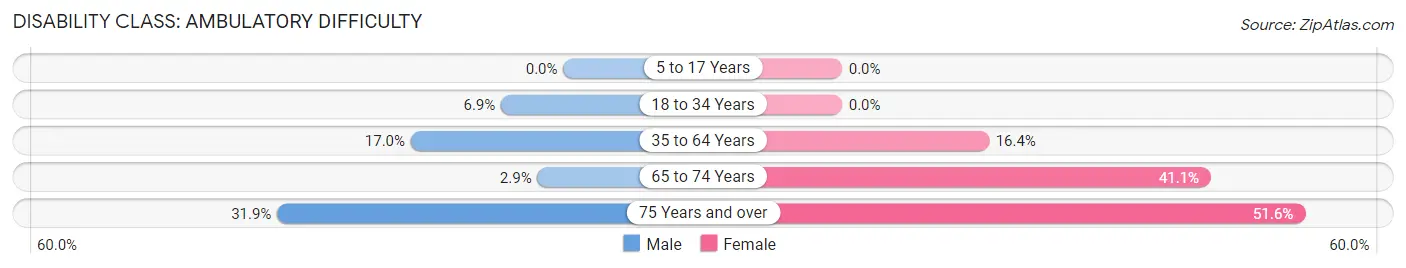
| Age Bracket | Male | Female |
| 5 to 17 Years | 0 (0.0%) | 0 (0.0%) |
| 18 to 34 Years | 40 (6.9%) | 0 (0.0%) |
| 35 to 64 Years | 161 (17.0%) | 153 (16.4%) |
| 65 to 74 Years | 4 (2.9%) | 118 (41.1%) |
| 75 Years and over | 29 (31.9%) | 129 (51.6%) |
Disability Class: Self-Care Difficulty
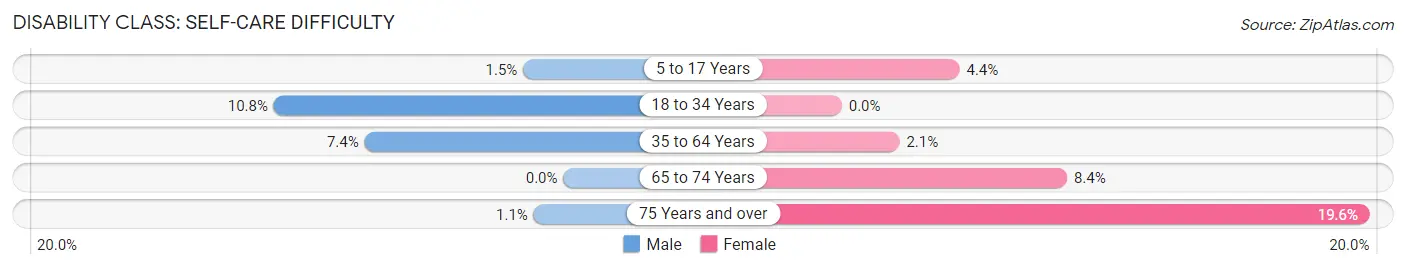
| Age Bracket | Male | Female |
| 5 to 17 Years | 9 (1.5%) | 20 (4.4%) |
| 18 to 34 Years | 62 (10.7%) | 0 (0.0%) |
| 35 to 64 Years | 70 (7.4%) | 20 (2.1%) |
| 65 to 74 Years | 0 (0.0%) | 24 (8.4%) |
| 75 Years and over | 1 (1.1%) | 49 (19.6%) |
Technology Access in Duquesne
Computing Device Access in Duquesne
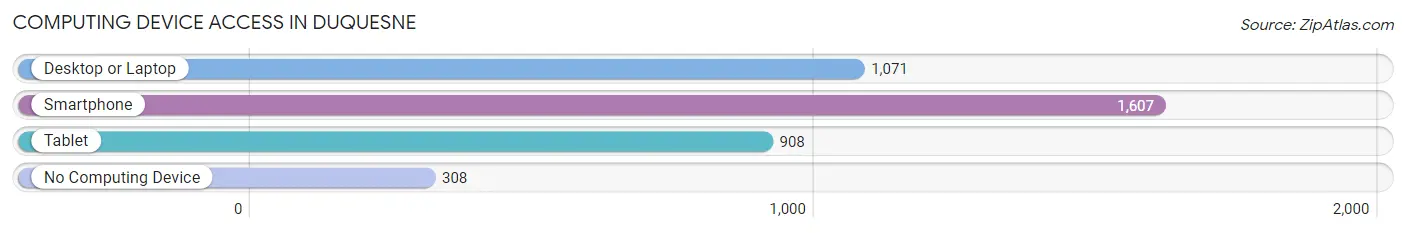
| Device Type | # Households | % Households |
| Desktop or Laptop | 1,071 | 51.4% |
| Smartphone | 1,607 | 77.1% |
| Tablet | 908 | 43.6% |
| No Computing Device | 308 | 14.8% |
| Total | 2,083 | 100.0% |
Internet Access in Duquesne
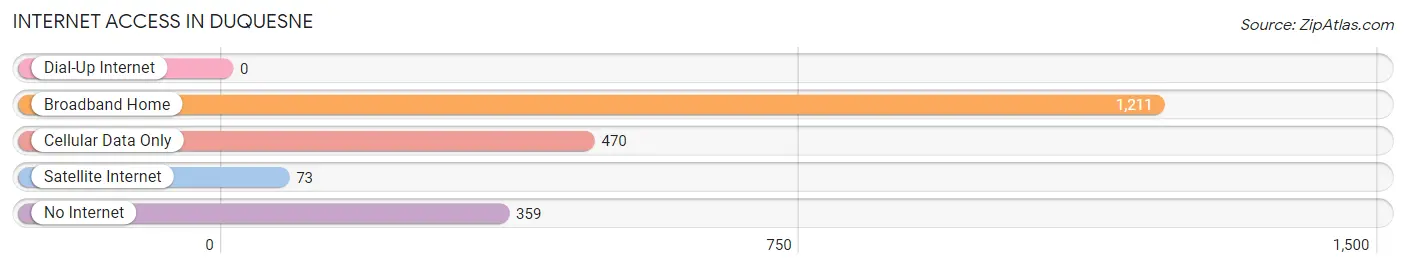
| Internet Type | # Households | % Households |
| Dial-Up Internet | 0 | 0.0% |
| Broadband Home | 1,211 | 58.1% |
| Cellular Data Only | 470 | 22.6% |
| Satellite Internet | 73 | 3.5% |
| No Internet | 359 | 17.2% |
| Total | 2,083 | 100.0% |
Duquesne Summary
Duquesne, Pennsylvania is a small city located in Allegheny County, just southeast of Pittsburgh. It is situated along the Monongahela River and is part of the Pittsburgh metropolitan area. The city has a population of 5,565 as of the 2010 census, making it the smallest city in Allegheny County.
History
Duquesne was founded in 1789 by French fur traders and named after the French explorer, Sieur Duquesne. The city was incorporated in 1891 and was a major steel-producing center in the early 20th century. The city was home to the Duquesne Steel Works, which was the largest steel mill in the world at the time. The mill closed in the late 1970s, and the city has since shifted its focus to other industries.
Geography
Duquesne is located at 40°22'17" North, 79°56'45" West (40.3714, -79.9459). The city has a total area of 1.2 square miles, all of which is land. The city is situated along the Monongahela River and is bordered by the cities of West Mifflin and McKeesport.
Economy
Duquesne’s economy is largely based on manufacturing and services. The city is home to several manufacturing companies, including the Duquesne Brewing Company, which produces beer and other beverages. The city is also home to several retail stores, restaurants, and other businesses.
Demographics
As of the 2010 census, there were 5,565 people, 2,093 households, and 1,323 families residing in the city. The population density was 4,637.3 people per square mile. The racial makeup of the city was 79.2% White, 16.2% African American, 0.2% Native American, 0.7% Asian, 0.1% Pacific Islander, 1.2% from other races, and 2.6% from two or more races. Hispanic or Latino of any race were 3.2% of the population.
The median income for a household in the city was $27,917, and the median income for a family was $35,938. About 17.2% of families and 20.2% of the population were below the poverty line, including 28.2% of those under age 18 and 11.2% of those age 65 or over.
Conclusion
Duquesne, Pennsylvania is a small city located in Allegheny County, just southeast of Pittsburgh. It has a population of 5,565 as of the 2010 census and is home to several manufacturing companies and other businesses. The city’s economy is largely based on manufacturing and services, and the median income for a household is $27,917. The racial makeup of the city is 79.2% White, 16.2% African American, 0.2% Native American, 0.7% Asian, 0.1% Pacific Islander, 1.2% from other races, and 2.6% from two or more races.
Common Questions
What is the Total Population of Duquesne?
Total Population of Duquesne is 5,241.
What is the Total Male Population of Duquesne?
Total Male Population of Duquesne is 2,533.
What is the Total Female Population of Duquesne?
Total Female Population of Duquesne is 2,708.
What is the Ratio of Males per 100 Females in Duquesne?
There are 93.54 Males per 100 Females in Duquesne.
What is the Ratio of Females per 100 Males in Duquesne?
There are 106.91 Females per 100 Males in Duquesne.
What is the Median Population Age in Duquesne?
Median Population Age in Duquesne is 36.5 Years.
What is the Average Family Size in Duquesne
Average Family Size in Duquesne is 3.7 People.
What is the Average Household Size in Duquesne
Average Household Size in Duquesne is 2.5 People.
What is Per Capita Income in Duquesne?
Per Capita income in Duquesne is $24,342.
What is the Median Family Income in Duquesne?
Median Family Income in Duquesne is $48,333.
What is the Median Household income in Duquesne?
Median Household Income in Duquesne is $40,969.
What is Income or Wage Gap in Duquesne?
Income or Wage Gap in Duquesne is 19.3%.
Women in Duquesne earn 80.7 cents for every dollar earned by a man.
What is Family Income Deficit in Duquesne?
Family Income Deficit in Duquesne is $17,169.
Families that are below poverty line in Duquesne earn $17,169 less on average than the poverty threshold level.
What is Inequality or Gini Index in Duquesne?
Inequality or Gini Index in Duquesne is 0.49.
How Large is the Labor Force in Duquesne?
There are 2,466 People in the Labor Forcein in Duquesne.
What is the Percentage of People in the Labor Force in Duquesne?
62.3% of People are in the Labor Force in Duquesne.
What is the Unemployment Rate in Duquesne?
Unemployment Rate in Duquesne is 7.8%.