Yorketown, NJ
Yorketown Map
Yorketown Overview
7,206
TOTAL POPULATION
3,509
MALE POPULATION
3,697
FEMALE POPULATION
94.91
MALES / 100 FEMALES
105.36
FEMALES / 100 MALES
37.0
MEDIAN AGE
3.6
AVG FAMILY SIZE
3.2
AVG HOUSEHOLD SIZE
$52,550
PER CAPITA INCOME
$169,076
AVG FAMILY INCOME
$156,838
AVG HOUSEHOLD INCOME
51.0%
WAGE / INCOME GAP [ % ]
49.0¢/ $1
WAGE / INCOME GAP [ $ ]
0.36
INEQUALITY / GINI INDEX
3,771
LABOR FORCE [ PEOPLE ]
69.3%
PERCENT IN LABOR FORCE
3.6%
UNEMPLOYMENT RATE
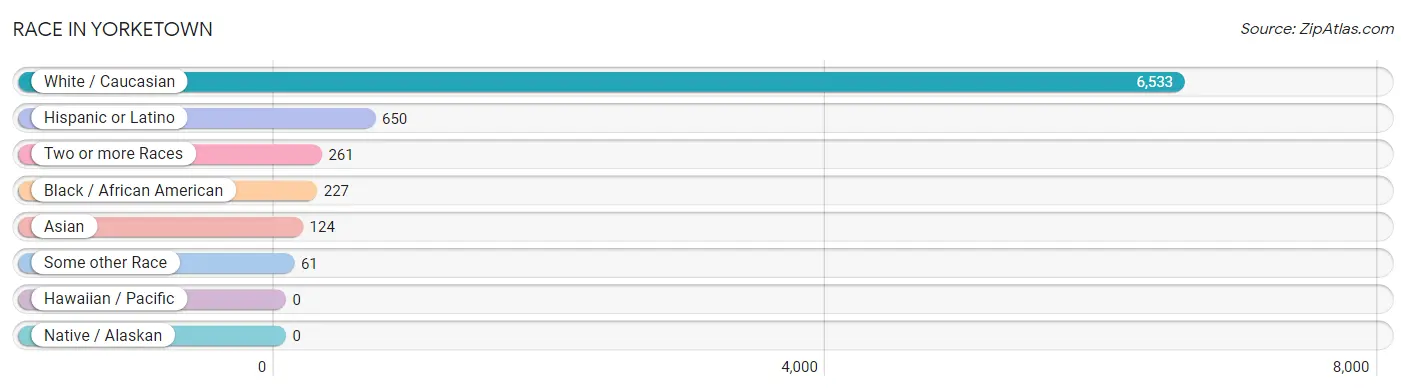
Race in Yorketown
The most populous races in Yorketown are White / Caucasian (6,533 | 90.7%), Hispanic or Latino (650 | 9.0%), and Two or more Races (261 | 3.6%).
| Race | # Population | % Population |
| Asian | 124 | 1.7% |
| Black / African American | 227 | 3.2% |
| Hawaiian / Pacific | 0 | 0.0% |
| Hispanic or Latino | 650 | 9.0% |
| Native / Alaskan | 0 | 0.0% |
| White / Caucasian | 6,533 | 90.7% |
| Two or more Races | 261 | 3.6% |
| Some other Race | 61 | 0.9% |
| Total | 7,206 | 100.0% |
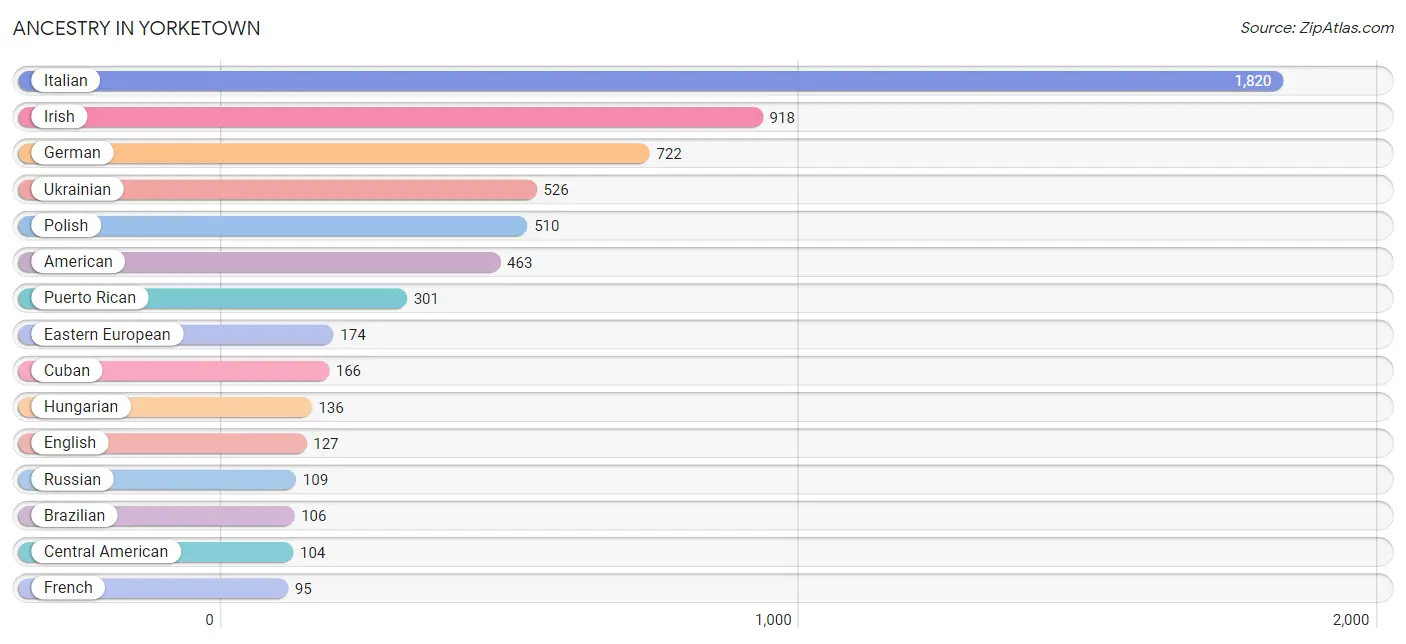
Ancestry in Yorketown
The most populous ancestries reported in Yorketown are Italian (1,820 | 25.3%), Irish (918 | 12.7%), German (722 | 10.0%), Ukrainian (526 | 7.3%), and Polish (510 | 7.1%), together accounting for 62.4% of all Yorketown residents.
| Ancestry | # Population | % Population |
| African | 18 | 0.3% |
| American | 463 | 6.4% |
| Arab | 25 | 0.4% |
| Argentinean | 26 | 0.4% |
| Armenian | 8 | 0.1% |
| Austrian | 47 | 0.6% |
| Brazilian | 106 | 1.5% |
| British | 35 | 0.5% |
| Burmese | 55 | 0.8% |
| Central American | 104 | 1.4% |
| Central American Indian | 15 | 0.2% |
| Colombian | 21 | 0.3% |
| Cuban | 166 | 2.3% |
| Cypriot | 18 | 0.3% |
| Czech | 34 | 0.5% |
| Danish | 6 | 0.1% |
| Dutch | 4 | 0.1% |
| Eastern European | 174 | 2.4% |
| English | 127 | 1.8% |
| European | 74 | 1.0% |
| Finnish | 8 | 0.1% |
| French | 95 | 1.3% |
| French Canadian | 44 | 0.6% |
| German | 722 | 10.0% |
| Greek | 21 | 0.3% |
| Guatemalan | 15 | 0.2% |
| Hungarian | 136 | 1.9% |
| Indian (Asian) | 2 | 0.0% |
| Iraqi | 25 | 0.4% |
| Irish | 918 | 12.7% |
| Israeli | 47 | 0.6% |
| Italian | 1,820 | 25.3% |
| Jamaican | 20 | 0.3% |
| Korean | 14 | 0.2% |
| Norwegian | 74 | 1.0% |
| Polish | 510 | 7.1% |
| Portuguese | 63 | 0.9% |
| Puerto Rican | 301 | 4.2% |
| Romanian | 71 | 1.0% |
| Russian | 109 | 1.5% |
| Salvadoran | 89 | 1.2% |
| Scandinavian | 8 | 0.1% |
| Scotch-Irish | 36 | 0.5% |
| Scottish | 77 | 1.1% |
| South American | 60 | 0.8% |
| Spaniard | 12 | 0.2% |
| Subsaharan African | 18 | 0.3% |
| Swedish | 34 | 0.5% |
| Thai | 60 | 0.8% |
| Trinidadian and Tobagonian | 7 | 0.1% |
| Ukrainian | 526 | 7.3% |
| Venezuelan | 13 | 0.2% |
| Welsh | 9 | 0.1% |
| West Indian | 4 | 0.1% | View All 54 Rows |
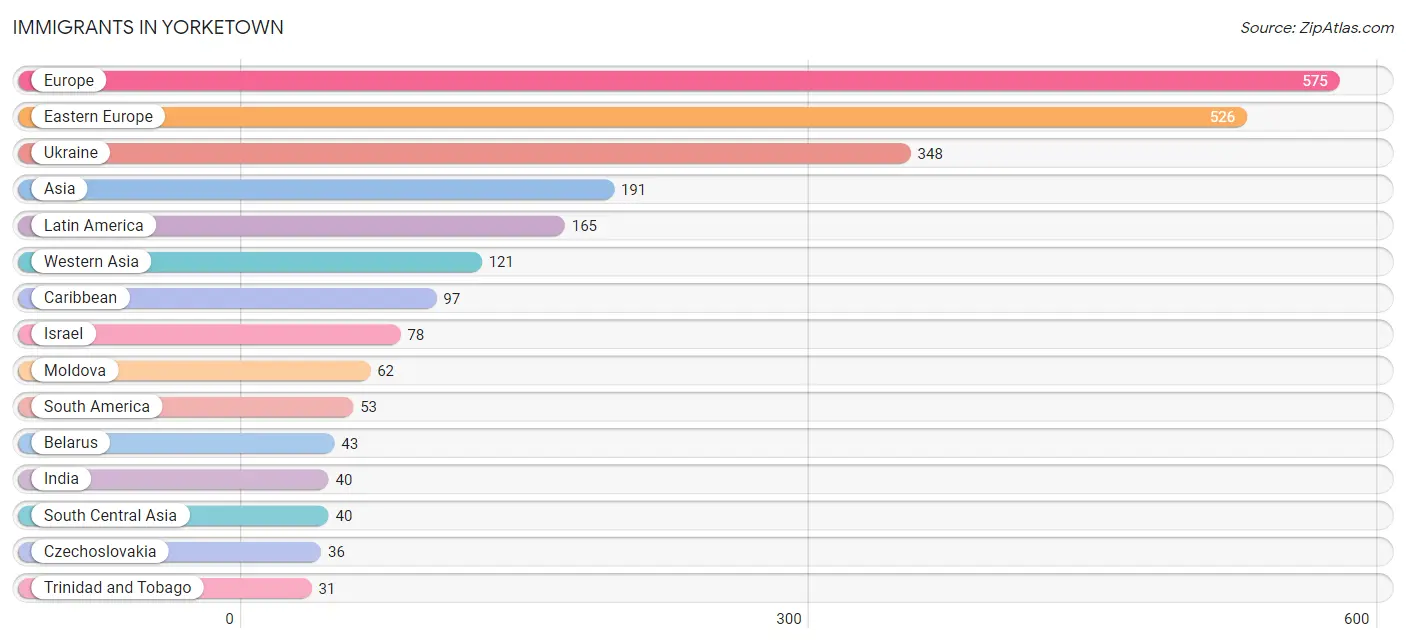
Immigrants in Yorketown
The most numerous immigrant groups reported in Yorketown came from Europe (575 | 8.0%), Eastern Europe (526 | 7.3%), Ukraine (348 | 4.8%), Asia (191 | 2.6%), and Latin America (165 | 2.3%), together accounting for 25.1% of all Yorketown residents.
| Immigration Origin | # Population | % Population |
| Argentina | 14 | 0.2% |
| Asia | 191 | 2.6% |
| Belarus | 43 | 0.6% |
| Brazil | 22 | 0.3% |
| Caribbean | 97 | 1.3% |
| Central America | 15 | 0.2% |
| Colombia | 6 | 0.1% |
| Cuba | 16 | 0.2% |
| Czechoslovakia | 36 | 0.5% |
| Eastern Asia | 23 | 0.3% |
| Eastern Europe | 526 | 7.3% |
| Europe | 575 | 8.0% |
| Germany | 30 | 0.4% |
| Guatemala | 15 | 0.2% |
| Hungary | 9 | 0.1% |
| India | 40 | 0.6% |
| Iraq | 25 | 0.4% |
| Israel | 78 | 1.1% |
| Italy | 7 | 0.1% |
| Jamaica | 20 | 0.3% |
| Korea | 23 | 0.3% |
| Latin America | 165 | 2.3% |
| Moldova | 62 | 0.9% |
| Philippines | 7 | 0.1% |
| Poland | 10 | 0.1% |
| Portugal | 12 | 0.2% |
| Russia | 18 | 0.3% |
| South America | 53 | 0.7% |
| South Central Asia | 40 | 0.6% |
| South Eastern Asia | 7 | 0.1% |
| Southern Europe | 19 | 0.3% |
| St. Vincent and the Grenadines | 30 | 0.4% |
| Trinidad and Tobago | 31 | 0.4% |
| Ukraine | 348 | 4.8% |
| Venezuela | 11 | 0.2% |
| Western Asia | 121 | 1.7% |
| Western Europe | 30 | 0.4% | View All 37 Rows |
Sex and Age in Yorketown
Sex and Age in Yorketown
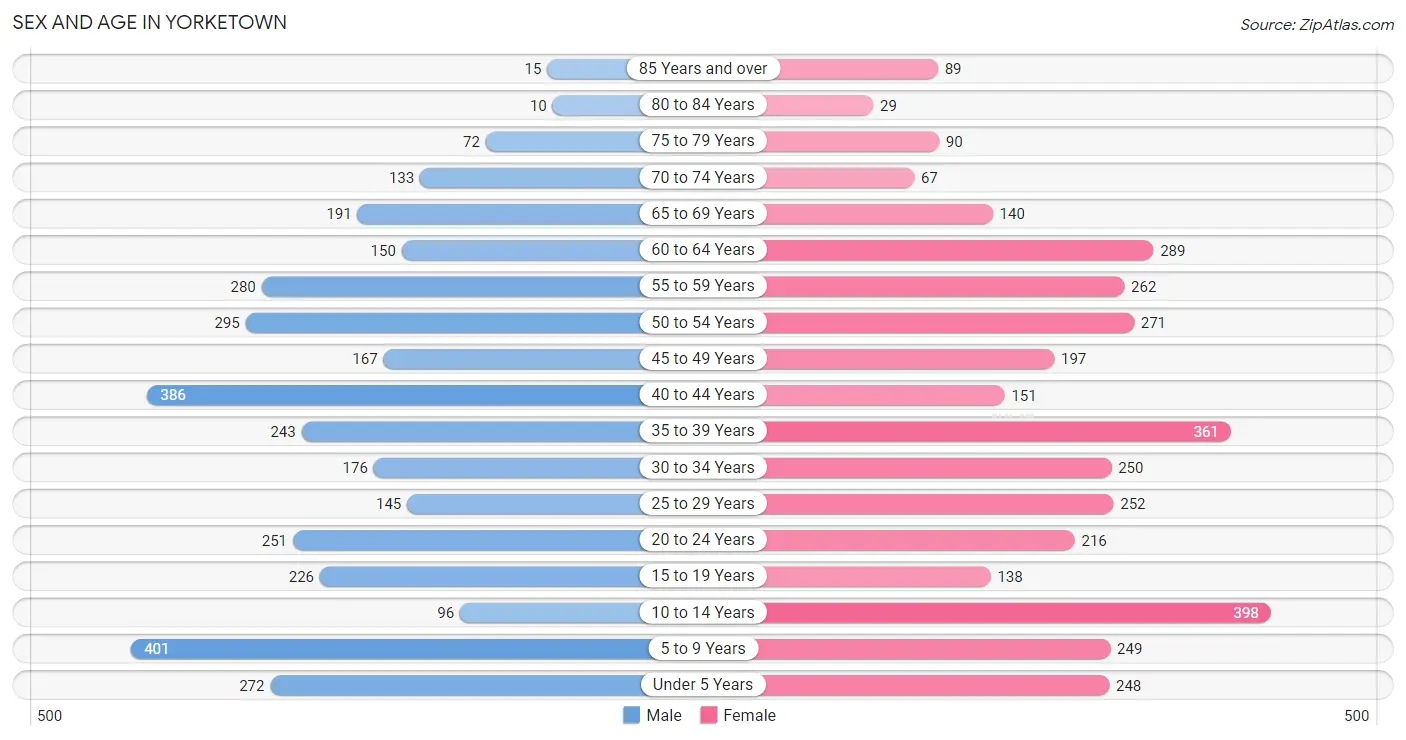
The most populous age groups in Yorketown are 5 to 9 Years (401 | 11.4%) for men and 10 to 14 Years (398 | 10.8%) for women.
| Age Bracket | Male | Female |
| Under 5 Years | 272 (7.7%) | 248 (6.7%) |
| 5 to 9 Years | 401 (11.4%) | 249 (6.7%) |
| 10 to 14 Years | 96 (2.7%) | 398 (10.8%) |
| 15 to 19 Years | 226 (6.4%) | 138 (3.7%) |
| 20 to 24 Years | 251 (7.1%) | 216 (5.8%) |
| 25 to 29 Years | 145 (4.1%) | 252 (6.8%) |
| 30 to 34 Years | 176 (5.0%) | 250 (6.8%) |
| 35 to 39 Years | 243 (6.9%) | 361 (9.8%) |
| 40 to 44 Years | 386 (11.0%) | 151 (4.1%) |
| 45 to 49 Years | 167 (4.8%) | 197 (5.3%) |
| 50 to 54 Years | 295 (8.4%) | 271 (7.3%) |
| 55 to 59 Years | 280 (8.0%) | 262 (7.1%) |
| 60 to 64 Years | 150 (4.3%) | 289 (7.8%) |
| 65 to 69 Years | 191 (5.4%) | 140 (3.8%) |
| 70 to 74 Years | 133 (3.8%) | 67 (1.8%) |
| 75 to 79 Years | 72 (2.1%) | 90 (2.4%) |
| 80 to 84 Years | 10 (0.3%) | 29 (0.8%) |
| 85 Years and over | 15 (0.4%) | 89 (2.4%) |
| Total | 3,509 (100.0%) | 3,697 (100.0%) |
Families and Households in Yorketown
Median Family Size in Yorketown
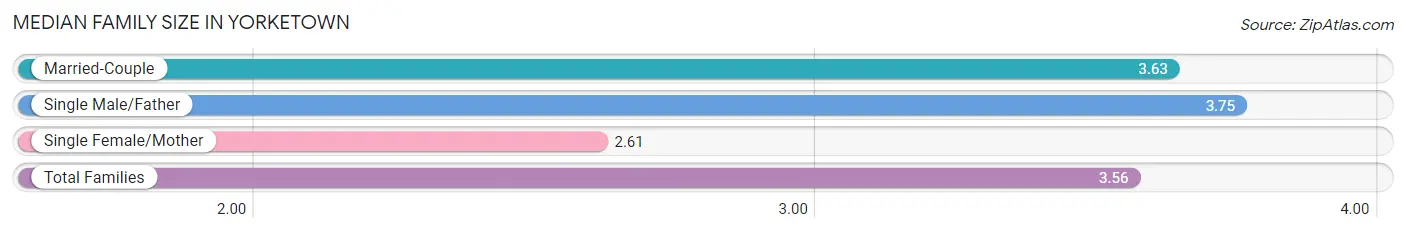
The median family size in Yorketown is 3.56 persons per family, with single male/father families (12 | 0.6%) accounting for the largest median family size of 3.75 persons per family. On the other hand, single female/mother families (125 | 6.7%) represent the smallest median family size with 2.61 persons per family.
| Family Type | # Families | Family Size |
| Married-Couple | 1,731 (92.7%) | 3.63 |
| Single Male/Father | 12 (0.6%) | 3.75 |
| Single Female/Mother | 125 (6.7%) | 2.61 |
| Total Families | 1,868 (100.0%) | 3.56 |
Median Household Size in Yorketown
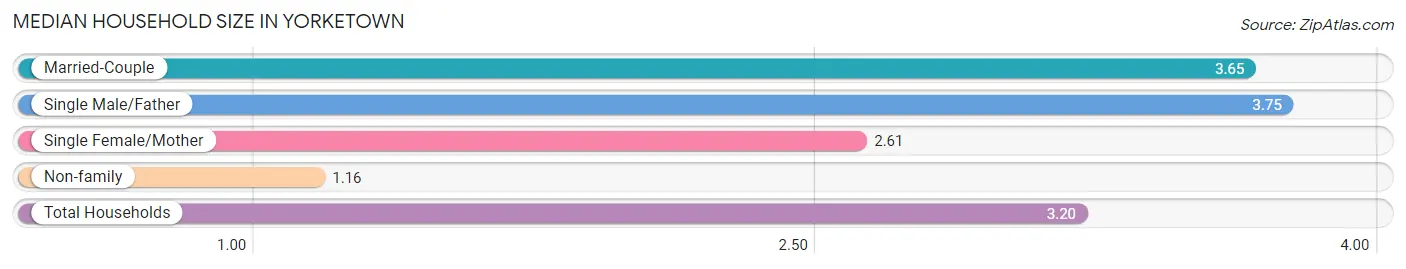
The median household size in Yorketown is 3.20 persons per household, with single male/father households (12 | 0.5%) accounting for the largest median household size of 3.75 persons per household. non-family households (347 | 15.7%) represent the smallest median household size with 1.16 persons per household.
| Household Type | # Households | Household Size |
| Married-Couple | 1,731 (78.1%) | 3.65 |
| Single Male/Father | 12 (0.5%) | 3.75 |
| Single Female/Mother | 125 (5.6%) | 2.61 |
| Non-family | 347 (15.7%) | 1.16 |
| Total Households | 2,215 (100.0%) | 3.20 |
Household Size by Marriage Status in Yorketown
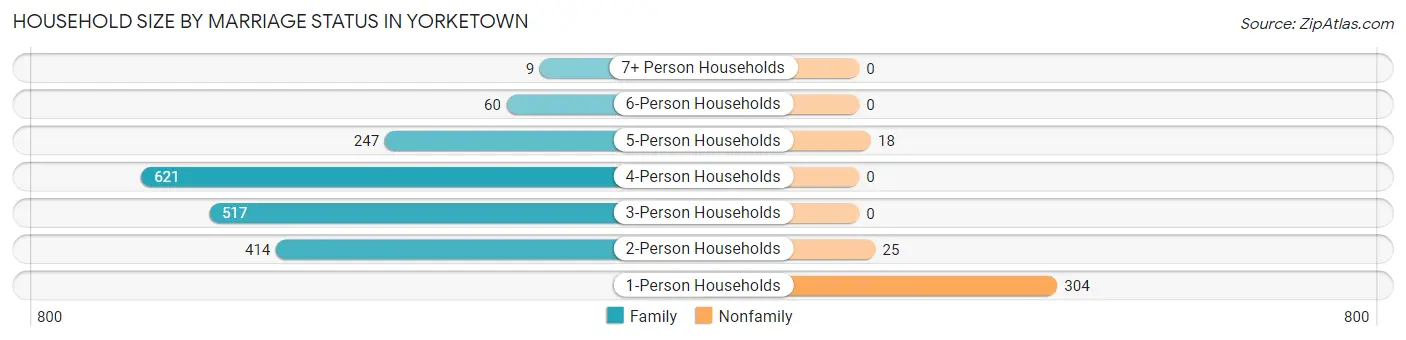
Out of a total of 2,215 households in Yorketown, 1,868 (84.3%) are family households, while 347 (15.7%) are nonfamily households. The most numerous type of family households are 4-person households, comprising 621, and the most common type of nonfamily households are 1-person households, comprising 304.
| Household Size | Family Households | Nonfamily Households |
| 1-Person Households | - | 304 (13.7%) |
| 2-Person Households | 414 (18.7%) | 25 (1.1%) |
| 3-Person Households | 517 (23.3%) | 0 (0.0%) |
| 4-Person Households | 621 (28.0%) | 0 (0.0%) |
| 5-Person Households | 247 (11.2%) | 18 (0.8%) |
| 6-Person Households | 60 (2.7%) | 0 (0.0%) |
| 7+ Person Households | 9 (0.4%) | 0 (0.0%) |
| Total | 1,868 (84.3%) | 347 (15.7%) |
Female Fertility in Yorketown
Fertility by Age in Yorketown
Average fertility rate in Yorketown is 56.0 births per 1,000 women. Women in the age bracket of 35 to 50 years have the highest fertility rate with 82.0 births per 1,000 women. Women in the age bracket of 35 to 50 years acount for 67.0% of all women with births.
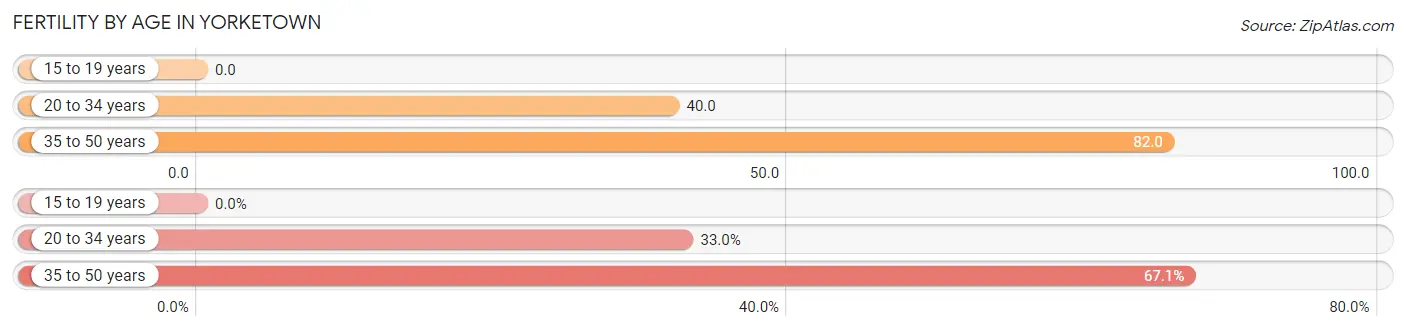
| Age Bracket | Women with Births | Births / 1,000 Women |
| 15 to 19 years | 0 (0.0%) | 0.0 |
| 20 to 34 years | 29 (33.0%) | 40.0 |
| 35 to 50 years | 59 (67.0%) | 82.0 |
| Total | 88 (100.0%) | 56.0 |
Fertility by Age by Marriage Status in Yorketown
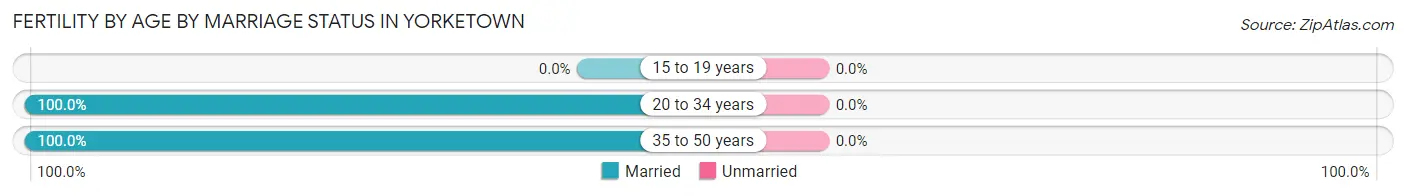
| Age Bracket | Married | Unmarried |
| 15 to 19 years | 0 (0.0%) | 0 (0.0%) |
| 20 to 34 years | 29 (100.0%) | 0 (0.0%) |
| 35 to 50 years | 59 (100.0%) | 0 (0.0%) |
| Total | 88 (100.0%) | 0 (0.0%) |
Fertility by Education in Yorketown
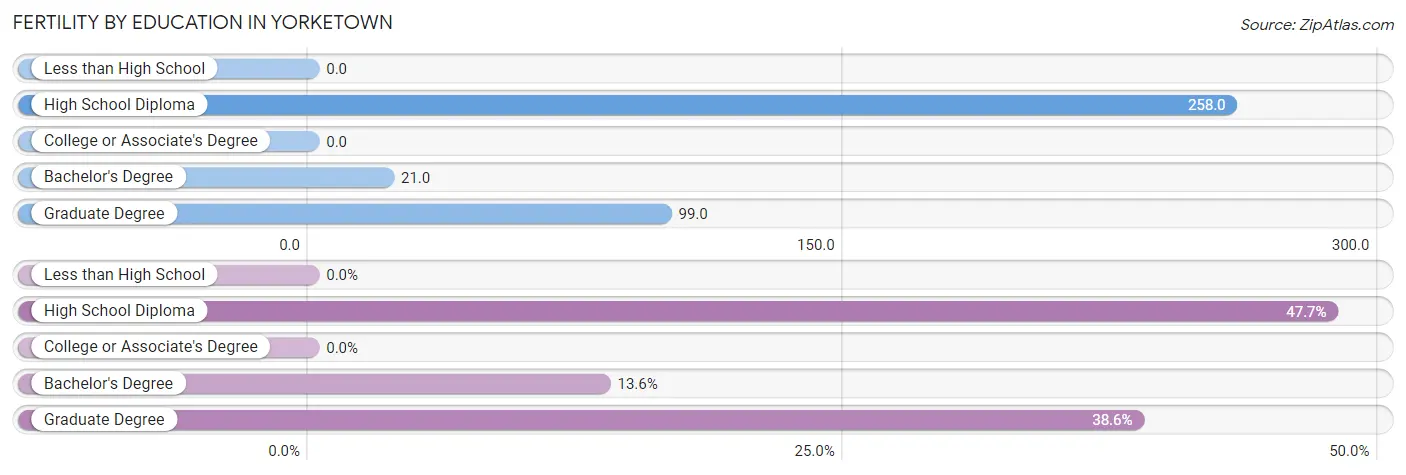
| Educational Attainment | Women with Births | Births / 1,000 Women |
| Less than High School | 0 (0.0%) | 0.0 |
| High School Diploma | 42 (47.7%) | 258.0 |
| College or Associate's Degree | 0 (0.0%) | 0.0 |
| Bachelor's Degree | 12 (13.6%) | 21.0 |
| Graduate Degree | 34 (38.6%) | 99.0 |
| Total | 88 (100.0%) | 56.0 |
Fertility by Education by Marriage Status in Yorketown
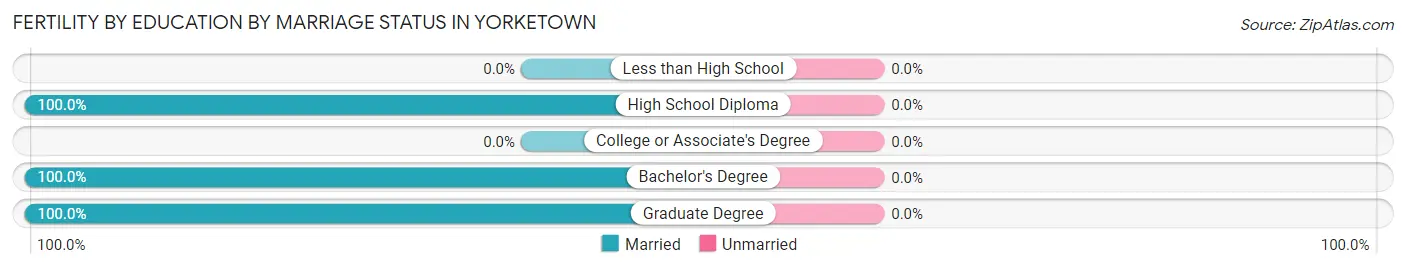
| Educational Attainment | Married | Unmarried |
| Less than High School | 0 (0.0%) | 0 (0.0%) |
| High School Diploma | 42 (100.0%) | 0 (0.0%) |
| College or Associate's Degree | 0 (0.0%) | 0 (0.0%) |
| Bachelor's Degree | 12 (100.0%) | 0 (0.0%) |
| Graduate Degree | 34 (100.0%) | 0 (0.0%) |
| Total | 88 (100.0%) | 0 (0.0%) |
Income in Yorketown
Income Overview in Yorketown
Per Capita Income in Yorketown is $52,550, while median incomes of families and households are $169,076 and $156,838 respectively.
| Characteristic | Number | Measure |
| Per Capita Income | 7,206 | $52,550 |
| Median Family Income | 1,868 | $169,076 |
| Mean Family Income | 1,868 | $186,134 |
| Median Household Income | 2,215 | $156,838 |
| Mean Household Income | 2,215 | $168,685 |
| Income Deficit | 1,868 | $0 |
| Wage / Income Gap (%) | 7,206 | 51.04% |
| Wage / Income Gap ($) | 7,206 | 48.96¢ per $1 |
| Gini / Inequality Index | 7,206 | 0.36 |
Earnings by Sex in Yorketown
Average Earnings in Yorketown are $70,613, $98,814 for men and $48,378 for women, a difference of 51.0%.
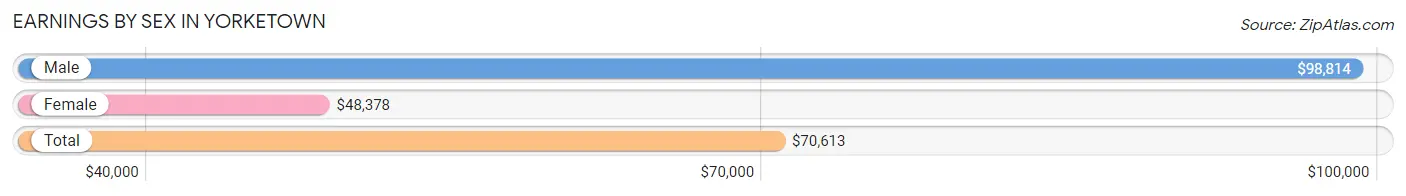
| Sex | Number | Average Earnings |
| Male | 2,091 (53.8%) | $98,814 |
| Female | 1,798 (46.2%) | $48,378 |
| Total | 3,889 (100.0%) | $70,613 |
Earnings by Sex by Income Bracket in Yorketown
The most common earnings brackets in Yorketown are $100,000+ for men (1,027 | 49.1%) and $75,000 to $99,999 for women (247 | 13.7%).
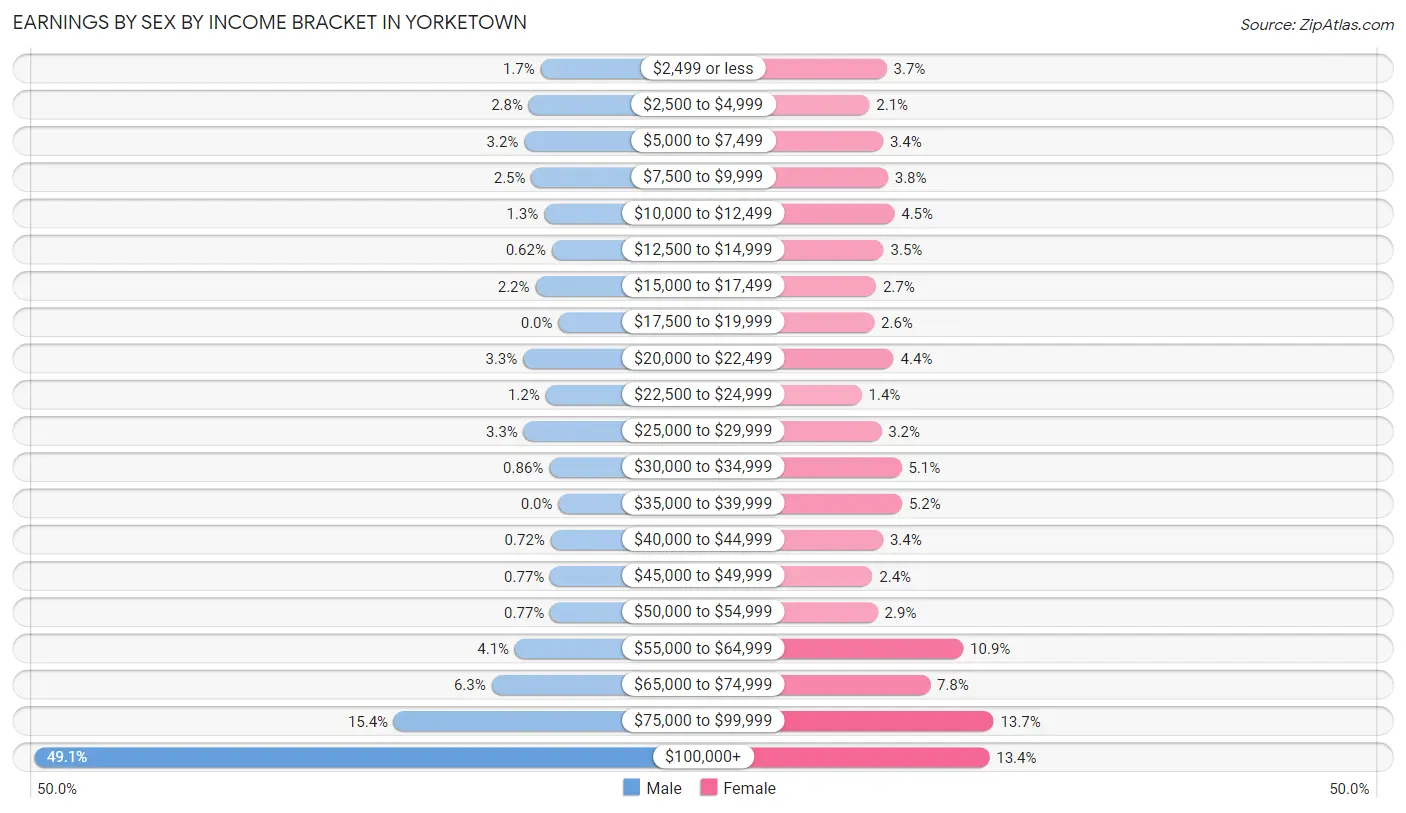
| Income | Male | Female |
| $2,499 or less | 35 (1.7%) | 67 (3.7%) |
| $2,500 to $4,999 | 58 (2.8%) | 38 (2.1%) |
| $5,000 to $7,499 | 67 (3.2%) | 61 (3.4%) |
| $7,500 to $9,999 | 53 (2.5%) | 69 (3.8%) |
| $10,000 to $12,499 | 28 (1.3%) | 80 (4.4%) |
| $12,500 to $14,999 | 13 (0.6%) | 62 (3.5%) |
| $15,000 to $17,499 | 45 (2.1%) | 49 (2.7%) |
| $17,500 to $19,999 | 0 (0.0%) | 46 (2.6%) |
| $20,000 to $22,499 | 69 (3.3%) | 79 (4.4%) |
| $22,500 to $24,999 | 25 (1.2%) | 25 (1.4%) |
| $25,000 to $29,999 | 68 (3.3%) | 58 (3.2%) |
| $30,000 to $34,999 | 18 (0.9%) | 92 (5.1%) |
| $35,000 to $39,999 | 0 (0.0%) | 93 (5.2%) |
| $40,000 to $44,999 | 15 (0.7%) | 61 (3.4%) |
| $45,000 to $49,999 | 16 (0.8%) | 43 (2.4%) |
| $50,000 to $54,999 | 16 (0.8%) | 52 (2.9%) |
| $55,000 to $64,999 | 85 (4.1%) | 196 (10.9%) |
| $65,000 to $74,999 | 131 (6.3%) | 140 (7.8%) |
| $75,000 to $99,999 | 322 (15.4%) | 247 (13.7%) |
| $100,000+ | 1,027 (49.1%) | 240 (13.4%) |
| Total | 2,091 (100.0%) | 1,798 (100.0%) |
Earnings by Sex by Educational Attainment in Yorketown
Average earnings in Yorketown are $116,611 for men and $59,048 for women, a difference of 49.4%. Men with an educational attainment of bachelor's degree enjoy the highest average annual earnings of $162,143, while those with high school diploma education earn the least with $91,964. Women with an educational attainment of graduate degree earn the most with the average annual earnings of $70,536, while those with college or associate's degree education have the smallest earnings of $32,031.
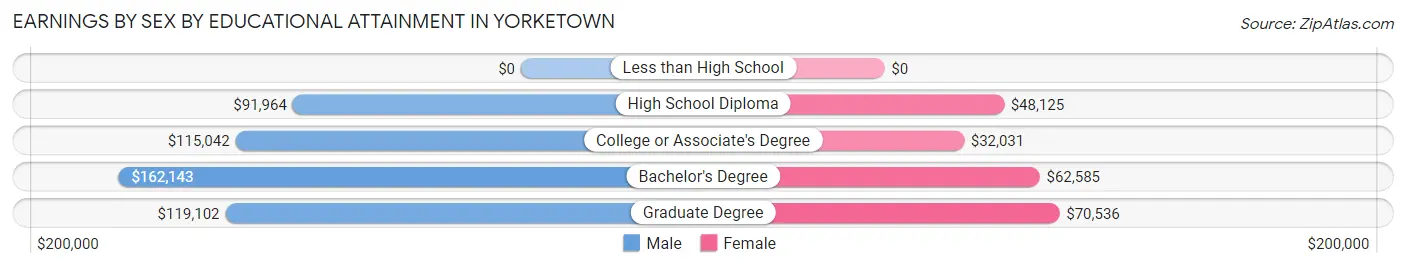
| Educational Attainment | Male Income | Female Income |
| Less than High School | - | - |
| High School Diploma | $91,964 | $48,125 |
| College or Associate's Degree | $115,042 | $32,031 |
| Bachelor's Degree | $162,143 | $62,585 |
| Graduate Degree | $119,102 | $70,536 |
| Total | $116,611 | $59,048 |
Family Income in Yorketown
Family Income Brackets in Yorketown
According to the Yorketown family income data, there are 618 families falling into the $200,000+ income range, which is the most common income bracket and makes up 33.1% of all families.
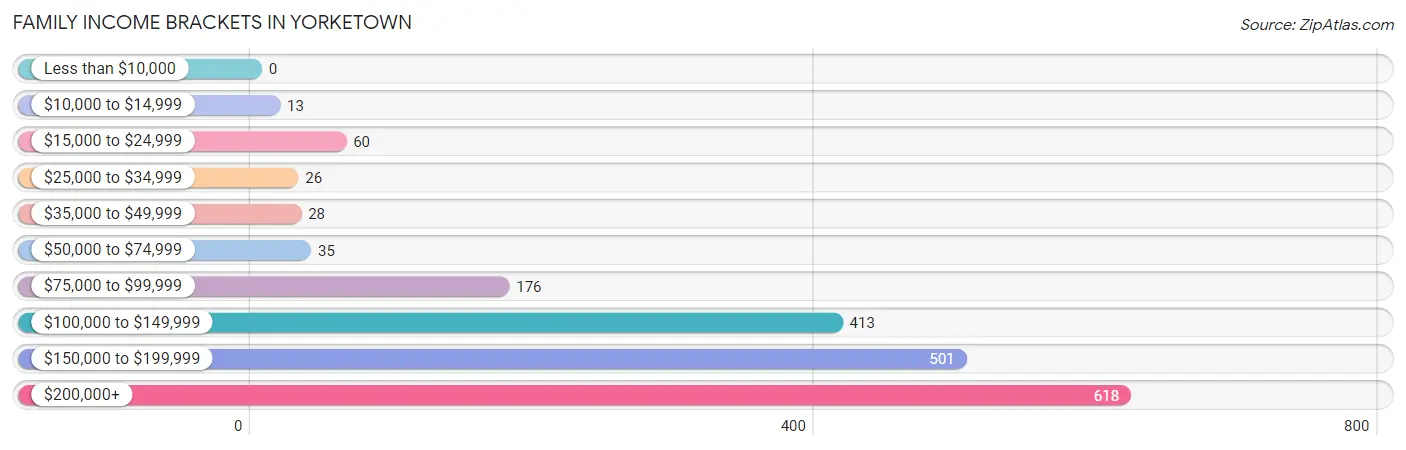
| Income Bracket | # Families | % Families |
| Less than $10,000 | 0 | 0.0% |
| $10,000 to $14,999 | 13 | 0.7% |
| $15,000 to $24,999 | 60 | 3.2% |
| $25,000 to $34,999 | 26 | 1.4% |
| $35,000 to $49,999 | 28 | 1.5% |
| $50,000 to $74,999 | 35 | 1.9% |
| $75,000 to $99,999 | 176 | 9.4% |
| $100,000 to $149,999 | 413 | 22.1% |
| $150,000 to $199,999 | 501 | 26.8% |
| $200,000+ | 618 | 33.1% |
Family Income by Famaliy Size in Yorketown
6-person families (38 | 2.0%) account for the highest median family income in Yorketown with $250,001 per family, while 2-person families (414 | 22.2%) have the highest median income of $65,625 per family member.
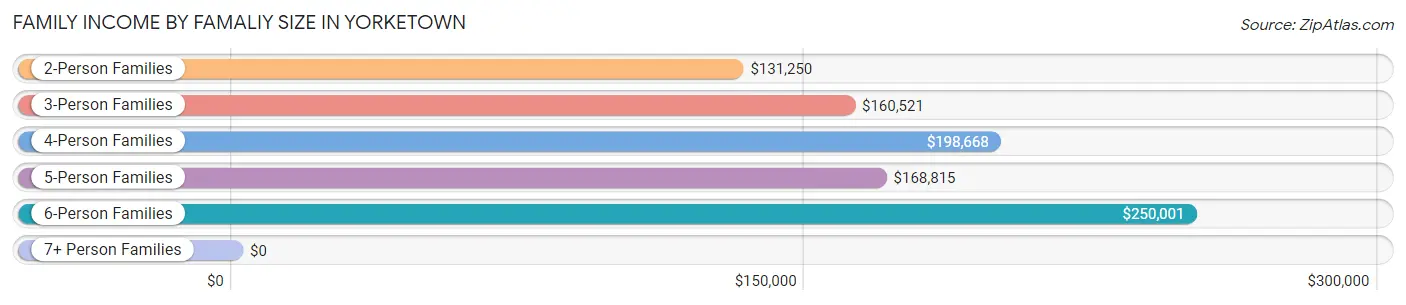
| Income Bracket | # Families | Median Income |
| 2-Person Families | 414 (22.2%) | $131,250 |
| 3-Person Families | 517 (27.7%) | $160,521 |
| 4-Person Families | 631 (33.8%) | $198,668 |
| 5-Person Families | 259 (13.9%) | $168,815 |
| 6-Person Families | 38 (2.0%) | $250,001 |
| 7+ Person Families | 9 (0.5%) | $0 |
| Total | 1,868 (100.0%) | $169,076 |
Family Income by Number of Earners in Yorketown
The median family income in Yorketown is $169,076, with families comprising 2 earners (809) having the highest median family income of $198,063, while families with no earners (121) have the lowest median family income of $87,969, accounting for 43.3% and 6.5% of families, respectively.
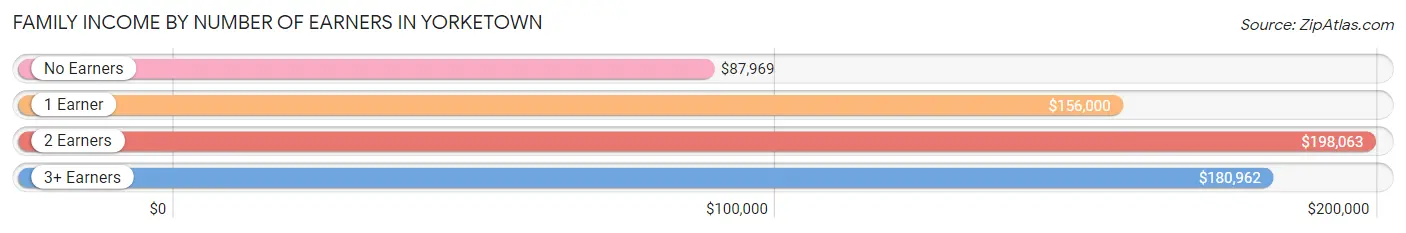
| Number of Earners | # Families | Median Income |
| No Earners | 121 (6.5%) | $87,969 |
| 1 Earner | 512 (27.4%) | $156,000 |
| 2 Earners | 809 (43.3%) | $198,063 |
| 3+ Earners | 426 (22.8%) | $180,962 |
| Total | 1,868 (100.0%) | $169,076 |
Household Income in Yorketown
Household Income Brackets in Yorketown
With 636 households falling in the category, the $200,000+ income range is the most frequent in Yorketown, accounting for 28.7% of all households. In contrast, only 13 households (0.6%) fall into the $10,000 to $14,999 income bracket, making it the least populous group.
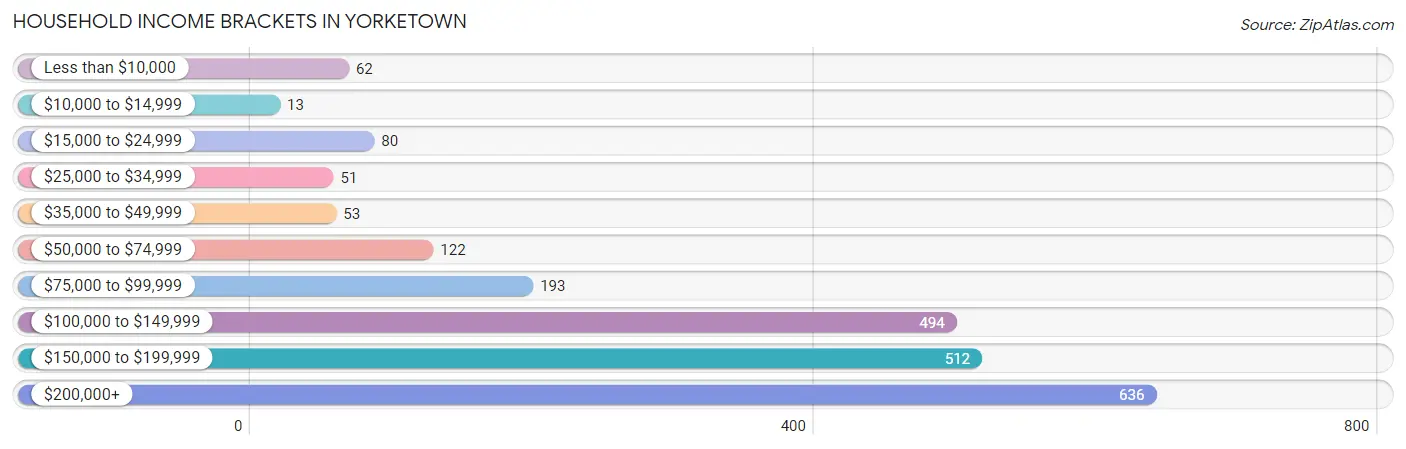
| Income Bracket | # Households | % Households |
| Less than $10,000 | 62 | 2.8% |
| $10,000 to $14,999 | 13 | 0.6% |
| $15,000 to $24,999 | 80 | 3.6% |
| $25,000 to $34,999 | 51 | 2.3% |
| $35,000 to $49,999 | 53 | 2.4% |
| $50,000 to $74,999 | 122 | 5.5% |
| $75,000 to $99,999 | 193 | 8.7% |
| $100,000 to $149,999 | 494 | 22.3% |
| $150,000 to $199,999 | 512 | 23.1% |
| $200,000+ | 636 | 28.7% |
Household Income by Householder Age in Yorketown
The median household income in Yorketown is $156,838, with the highest median household income of $174,306 found in the 25 to 44 years age bracket for the primary householder. A total of 755 households (34.1%) fall into this category. Meanwhile, the 15 to 24 years age bracket for the primary householder has the lowest median household income of $0, with 18 households (0.8%) in this group.
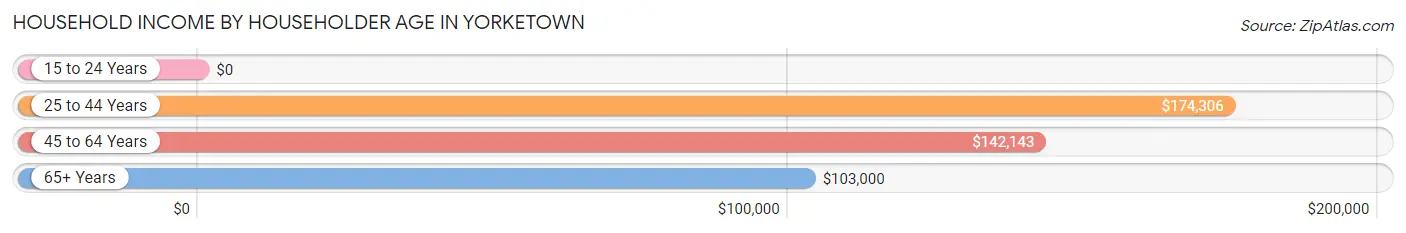
| Income Bracket | # Households | Median Income |
| 15 to 24 Years | 18 (0.8%) | $0 |
| 25 to 44 Years | 755 (34.1%) | $174,306 |
| 45 to 64 Years | 980 (44.2%) | $142,143 |
| 65+ Years | 462 (20.9%) | $103,000 |
| Total | 2,215 (100.0%) | $156,838 |
Poverty in Yorketown
Income Below Poverty by Sex and Age in Yorketown
With 3.7% poverty level for males and 3.3% for females among the residents of Yorketown, 15 year old males and 55 to 64 year old females are the most vulnerable to poverty, with 15 males (26.8%) and 45 females (8.4%) in their respective age groups living below the poverty level.
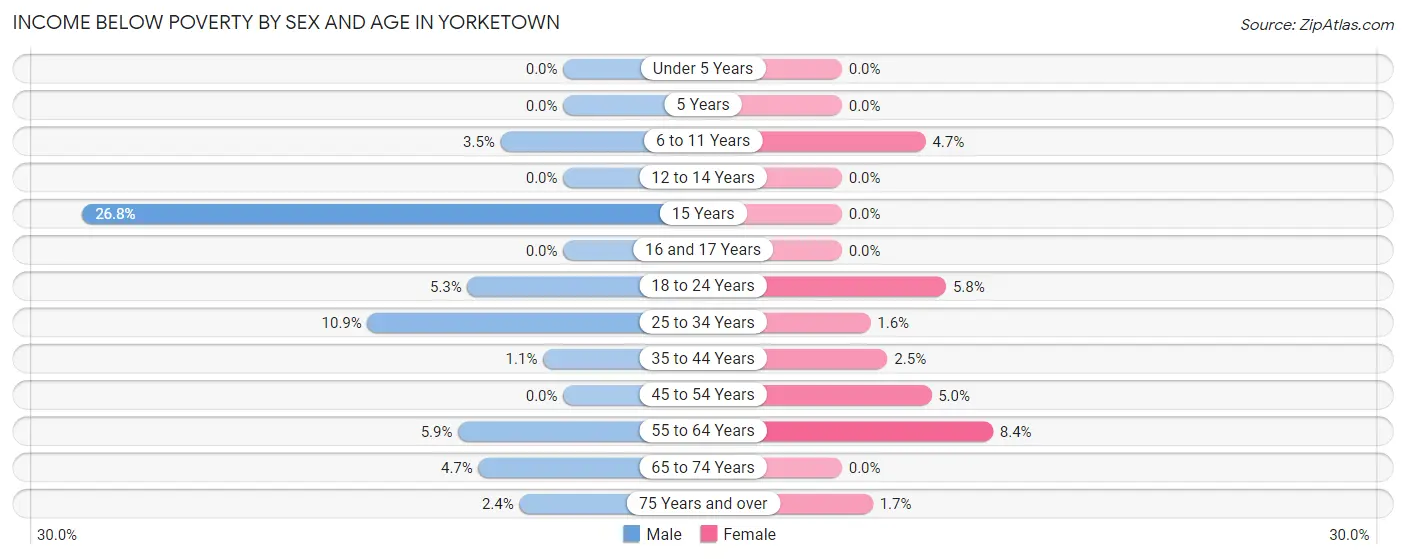
| Age Bracket | Male | Female |
| Under 5 Years | 0 (0.0%) | 0 (0.0%) |
| 5 Years | 0 (0.0%) | 0 (0.0%) |
| 6 to 11 Years | 13 (3.5%) | 13 (4.7%) |
| 12 to 14 Years | 0 (0.0%) | 0 (0.0%) |
| 15 Years | 15 (26.8%) | 0 (0.0%) |
| 16 and 17 Years | 0 (0.0%) | 0 (0.0%) |
| 18 to 24 Years | 18 (5.3%) | 16 (5.8%) |
| 25 to 34 Years | 35 (10.9%) | 8 (1.6%) |
| 35 to 44 Years | 7 (1.1%) | 13 (2.5%) |
| 45 to 54 Years | 0 (0.0%) | 23 (5.0%) |
| 55 to 64 Years | 25 (5.9%) | 45 (8.4%) |
| 65 to 74 Years | 15 (4.7%) | 0 (0.0%) |
| 75 Years and over | 2 (2.4%) | 3 (1.7%) |
| Total | 130 (3.7%) | 121 (3.3%) |
Income Above Poverty by Sex and Age in Yorketown
According to the poverty statistics in Yorketown, males aged under 5 years and females aged under 5 years are the age groups that are most secure financially, with 100.0% of males and 100.0% of females in these age groups living above the poverty line.
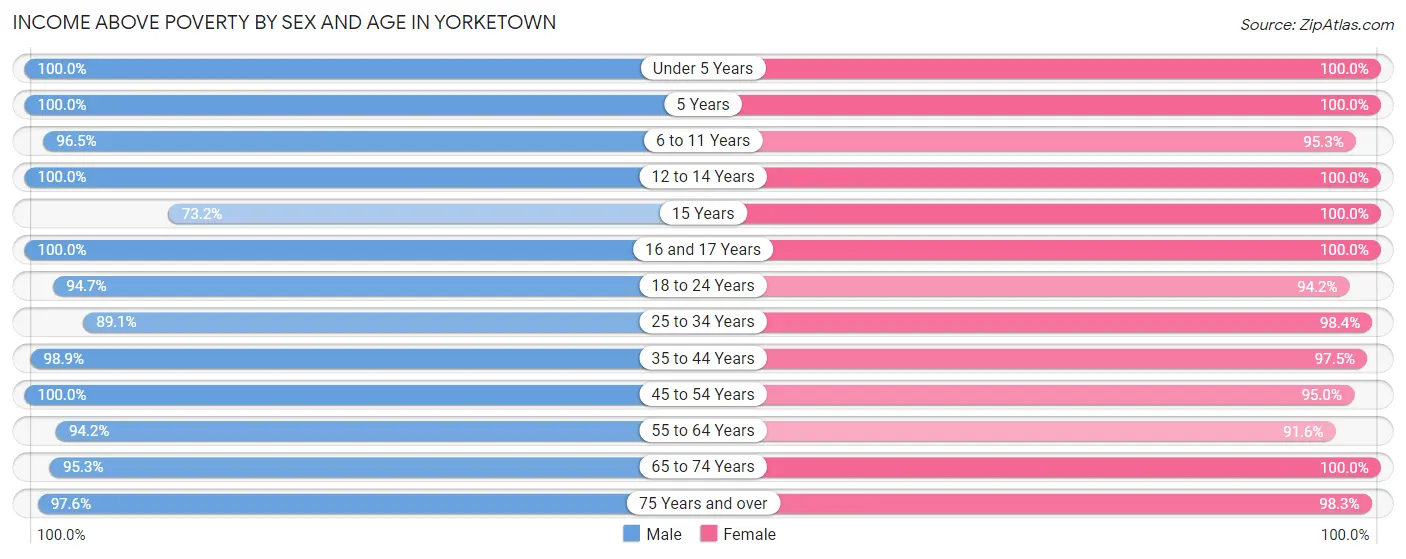
| Age Bracket | Male | Female |
| Under 5 Years | 272 (100.0%) | 248 (100.0%) |
| 5 Years | 45 (100.0%) | 79 (100.0%) |
| 6 to 11 Years | 360 (96.5%) | 266 (95.3%) |
| 12 to 14 Years | 79 (100.0%) | 289 (100.0%) |
| 15 Years | 41 (73.2%) | 44 (100.0%) |
| 16 and 17 Years | 83 (100.0%) | 34 (100.0%) |
| 18 to 24 Years | 320 (94.7%) | 260 (94.2%) |
| 25 to 34 Years | 286 (89.1%) | 494 (98.4%) |
| 35 to 44 Years | 618 (98.9%) | 499 (97.5%) |
| 45 to 54 Years | 460 (100.0%) | 439 (95.0%) |
| 55 to 64 Years | 402 (94.2%) | 490 (91.6%) |
| 65 to 74 Years | 303 (95.3%) | 189 (100.0%) |
| 75 Years and over | 80 (97.6%) | 171 (98.3%) |
| Total | 3,349 (96.3%) | 3,502 (96.7%) |
Income Below Poverty Among Married-Couple Families in Yorketown
The poverty statistics for married-couple families in Yorketown show that 1.8% or 32 of the total 1,731 families live below the poverty line. Families with no children have the highest poverty rate of 2.5%, comprising of 19 families. On the other hand, families with 3 or 4 children have the lowest poverty rate of 0.0%, which includes 0 families.
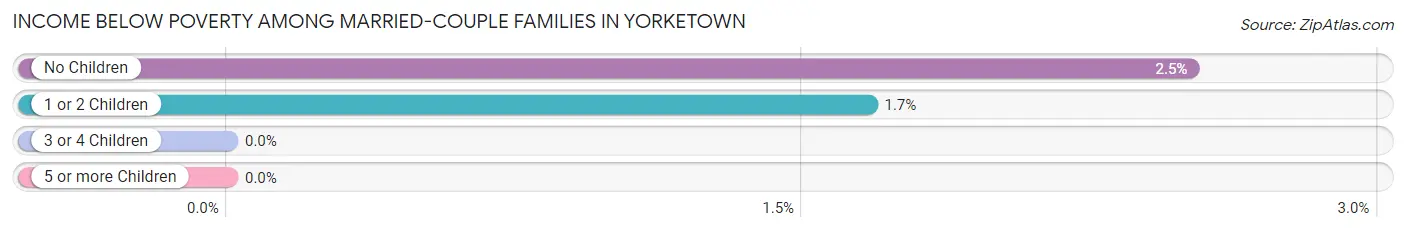
| Children | Above Poverty | Below Poverty |
| No Children | 739 (97.5%) | 19 (2.5%) |
| 1 or 2 Children | 766 (98.3%) | 13 (1.7%) |
| 3 or 4 Children | 194 (100.0%) | 0 (0.0%) |
| 5 or more Children | 0 (0.0%) | 0 (0.0%) |
| Total | 1,699 (98.2%) | 32 (1.8%) |
Income Below Poverty Among Single-Parent Households in Yorketown
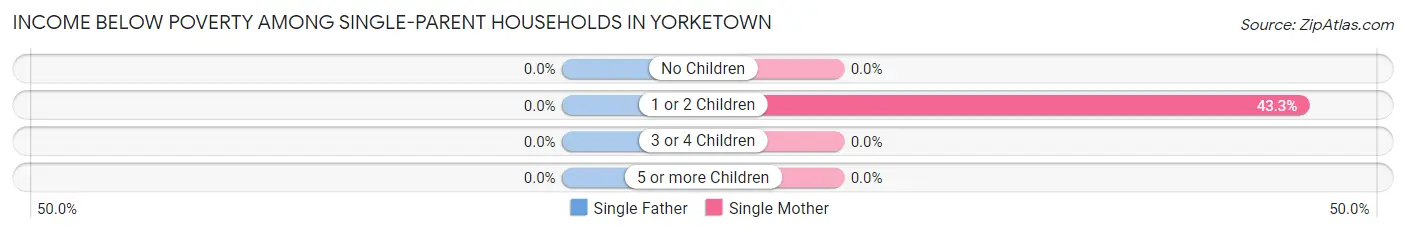
| Children | Single Father | Single Mother |
| No Children | 0 (0.0%) | 0 (0.0%) |
| 1 or 2 Children | 0 (0.0%) | 13 (43.3%) |
| 3 or 4 Children | 0 (0.0%) | 0 (0.0%) |
| 5 or more Children | 0 (0.0%) | 0 (0.0%) |
| Total | 0 (0.0%) | 13 (10.4%) |
Income Below Poverty Among Married-Couple vs Single-Parent Households in Yorketown
The poverty data for Yorketown shows that 32 of the married-couple family households (1.8%) and 13 of the single-parent households (9.5%) are living below the poverty level. Within the married-couple family households, those with no children have the highest poverty rate, with 19 households (2.5%) falling below the poverty line. Among the single-parent households, those with 1 or 2 children have the highest poverty rate, with 13 household (43.3%) living below poverty.
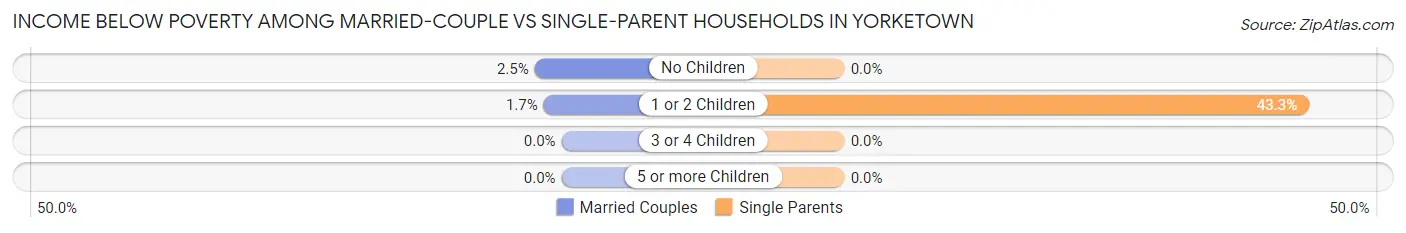
| Children | Married-Couple Families | Single-Parent Households |
| No Children | 19 (2.5%) | 0 (0.0%) |
| 1 or 2 Children | 13 (1.7%) | 13 (43.3%) |
| 3 or 4 Children | 0 (0.0%) | 0 (0.0%) |
| 5 or more Children | 0 (0.0%) | 0 (0.0%) |
| Total | 32 (1.8%) | 13 (9.5%) |
Employment Characteristics in Yorketown
Employment by Class of Employer in Yorketown
Among the 3,570 employed individuals in Yorketown, private company employees (2,451 | 68.7%), local government employees (485 | 13.6%), and not-for-profit organizations (305 | 8.5%) make up the most common classes of employment.
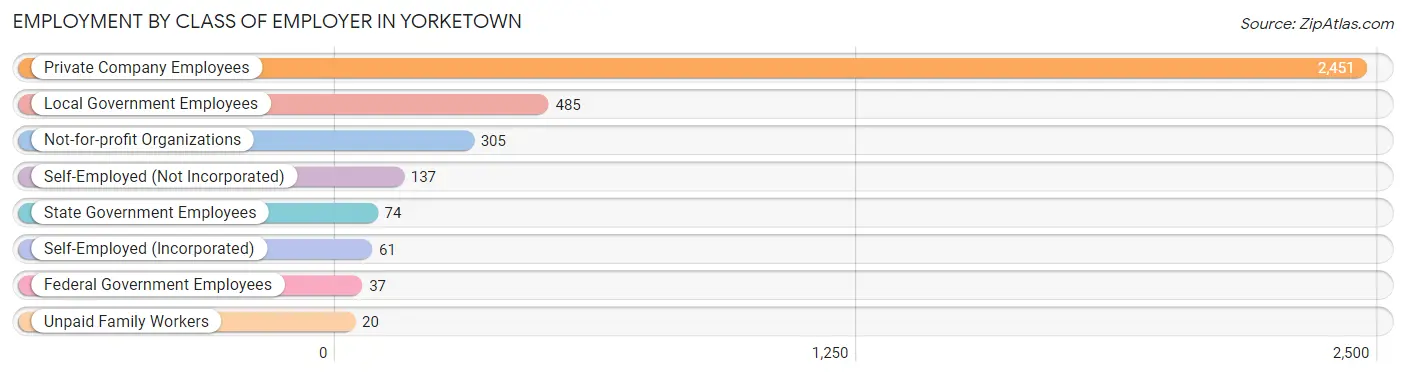
| Employer Class | # Employees | % Employees |
| Private Company Employees | 2,451 | 68.7% |
| Self-Employed (Incorporated) | 61 | 1.7% |
| Self-Employed (Not Incorporated) | 137 | 3.8% |
| Not-for-profit Organizations | 305 | 8.5% |
| Local Government Employees | 485 | 13.6% |
| State Government Employees | 74 | 2.1% |
| Federal Government Employees | 37 | 1.0% |
| Unpaid Family Workers | 20 | 0.6% |
| Total | 3,570 | 100.0% |
Employment Status by Age in Yorketown
According to the labor force statistics for Yorketown, out of the total population over 16 years of age (5,442), 69.3% or 3,771 individuals are in the labor force, with 3.6% or 136 of them unemployed. The age group with the highest labor force participation rate is 35 to 44 years, with 91.4% or 1,043 individuals in the labor force. Within the labor force, the 16 to 19 years age range has the highest percentage of unemployed individuals, with 24.1% or 28 of them being unemployed.
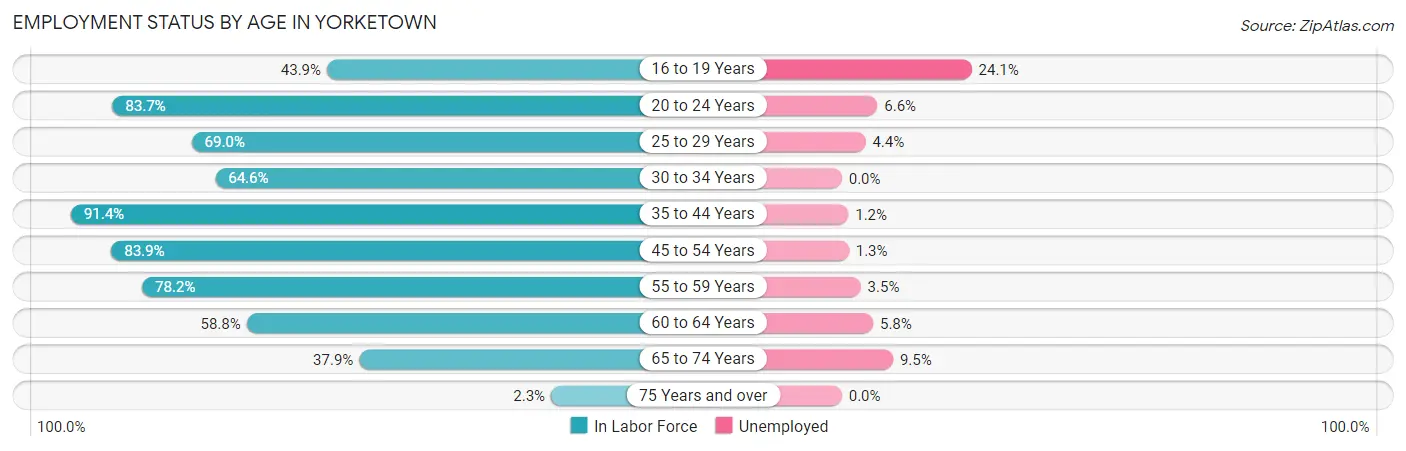
| Age Bracket | In Labor Force | Unemployed |
| 16 to 19 Years | 116 (43.9%) | 28 (24.1%) |
| 20 to 24 Years | 391 (83.7%) | 26 (6.6%) |
| 25 to 29 Years | 274 (69.0%) | 12 (4.4%) |
| 30 to 34 Years | 275 (64.6%) | 0 (0.0%) |
| 35 to 44 Years | 1,043 (91.4%) | 13 (1.2%) |
| 45 to 54 Years | 780 (83.9%) | 10 (1.3%) |
| 55 to 59 Years | 424 (78.2%) | 15 (3.5%) |
| 60 to 64 Years | 258 (58.8%) | 15 (5.8%) |
| 65 to 74 Years | 201 (37.9%) | 19 (9.5%) |
| 75 Years and over | 7 (2.3%) | 0 (0.0%) |
| Total | 3,771 (69.3%) | 136 (3.6%) |
Employment Status by Educational Attainment in Yorketown
According to labor force statistics for Yorketown, 78.8% of individuals (3,054) out of the total population between 25 and 64 years of age (3,875) are in the labor force, with 2.1% or 64 of them being unemployed. The group with the highest labor force participation rate are those with the educational attainment of bachelor's degree or higher, with 88.0% or 1,885 individuals in the labor force. Within the labor force, individuals with high school diploma education have the highest percentage of unemployment, with 5.4% or 24 of them being unemployed.
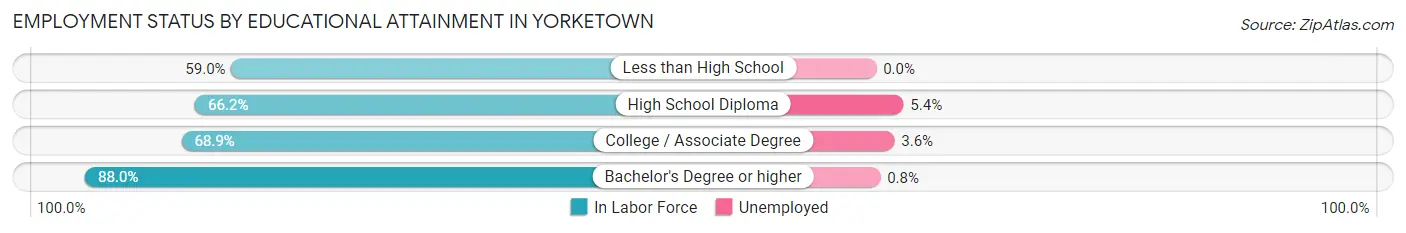
| Educational Attainment | In Labor Force | Unemployed |
| Less than High School | 36 (59.0%) | 0 (0.0%) |
| High School Diploma | 445 (66.2%) | 36 (5.4%) |
| College / Associate Degree | 689 (68.9%) | 36 (3.6%) |
| Bachelor's Degree or higher | 1,885 (88.0%) | 17 (0.8%) |
| Total | 3,054 (78.8%) | 81 (2.1%) |
Employment Occupations by Sex in Yorketown
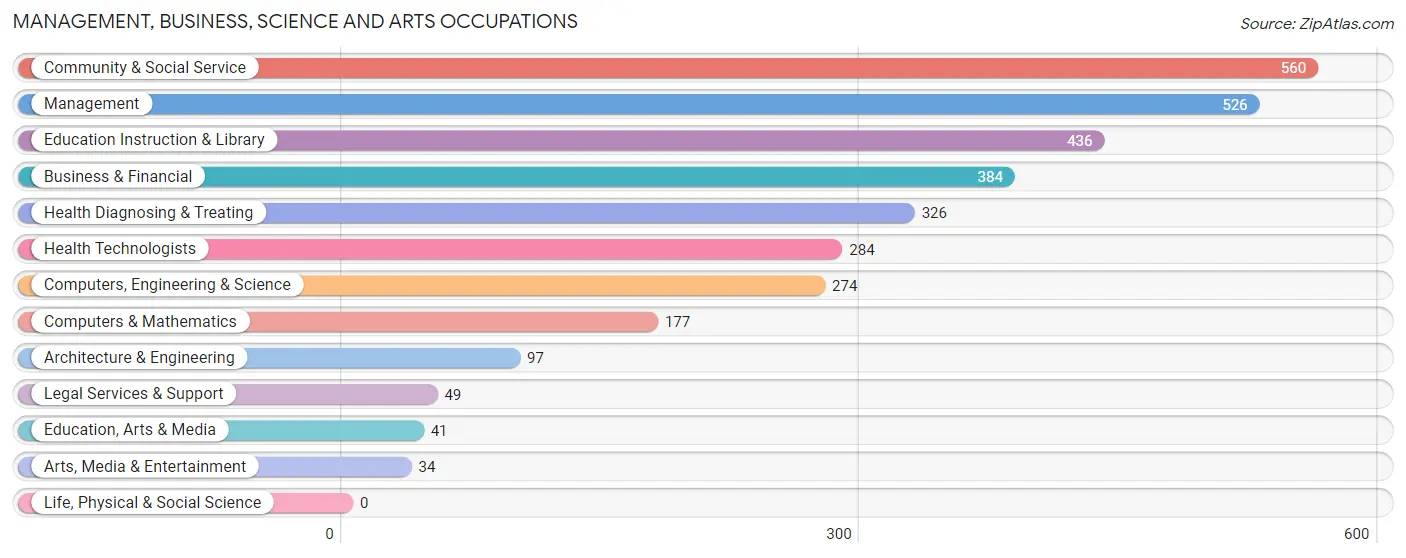
Management, Business, Science and Arts Occupations
The most common Management, Business, Science and Arts occupations in Yorketown are Community & Social Service (560 | 15.4%), Management (526 | 14.5%), Education Instruction & Library (436 | 12.0%), Business & Financial (384 | 10.6%), and Health Diagnosing & Treating (326 | 9.0%).
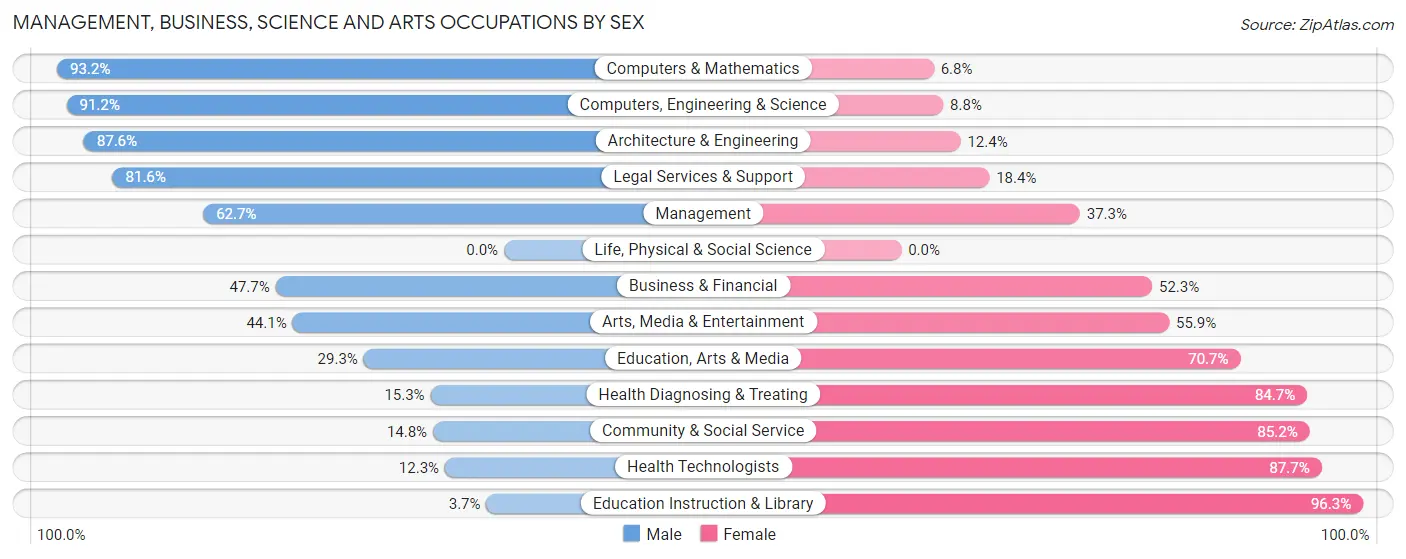
Management, Business, Science and Arts Occupations by Sex
Within the Management, Business, Science and Arts occupations in Yorketown, the most male-oriented occupations are Computers & Mathematics (93.2%), Computers, Engineering & Science (91.2%), and Architecture & Engineering (87.6%), while the most female-oriented occupations are Education Instruction & Library (96.3%), Health Technologists (87.7%), and Community & Social Service (85.2%).
| Occupation | Male | Female |
| Management | 330 (62.7%) | 196 (37.3%) |
| Business & Financial | 183 (47.7%) | 201 (52.3%) |
| Computers, Engineering & Science | 250 (91.2%) | 24 (8.8%) |
| Computers & Mathematics | 165 (93.2%) | 12 (6.8%) |
| Architecture & Engineering | 85 (87.6%) | 12 (12.4%) |
| Life, Physical & Social Science | 0 (0.0%) | 0 (0.0%) |
| Community & Social Service | 83 (14.8%) | 477 (85.2%) |
| Education, Arts & Media | 12 (29.3%) | 29 (70.7%) |
| Legal Services & Support | 40 (81.6%) | 9 (18.4%) |
| Education Instruction & Library | 16 (3.7%) | 420 (96.3%) |
| Arts, Media & Entertainment | 15 (44.1%) | 19 (55.9%) |
| Health Diagnosing & Treating | 50 (15.3%) | 276 (84.7%) |
| Health Technologists | 35 (12.3%) | 249 (87.7%) |
| Total (Category) | 896 (43.3%) | 1,174 (56.7%) |
| Total (Overall) | 1,958 (53.9%) | 1,674 (46.1%) |
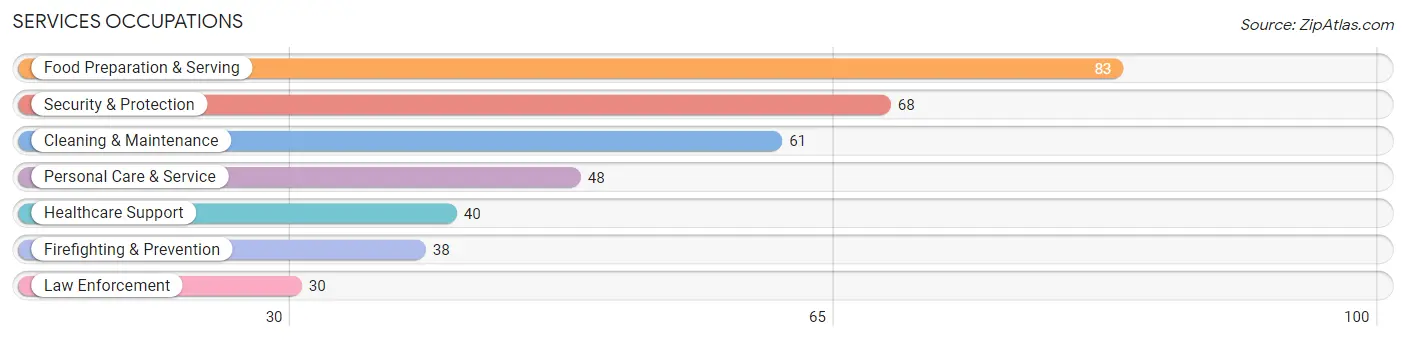
Services Occupations
The most common Services occupations in Yorketown are Food Preparation & Serving (83 | 2.3%), Security & Protection (68 | 1.9%), Cleaning & Maintenance (61 | 1.7%), Personal Care & Service (48 | 1.3%), and Healthcare Support (40 | 1.1%).
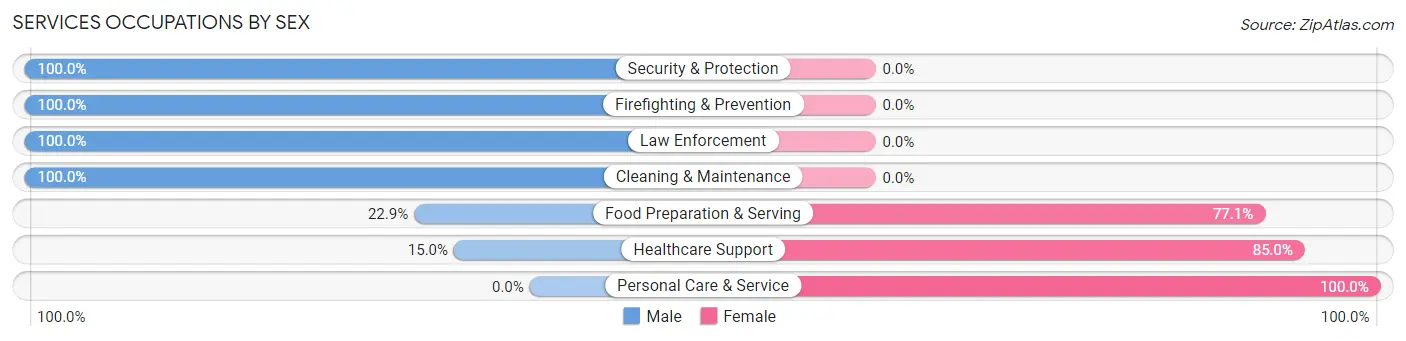
Services Occupations by Sex
Within the Services occupations in Yorketown, the most male-oriented occupations are Security & Protection (100.0%), Firefighting & Prevention (100.0%), and Law Enforcement (100.0%), while the most female-oriented occupations are Personal Care & Service (100.0%), Healthcare Support (85.0%), and Food Preparation & Serving (77.1%).
| Occupation | Male | Female |
| Healthcare Support | 6 (15.0%) | 34 (85.0%) |
| Security & Protection | 68 (100.0%) | 0 (0.0%) |
| Firefighting & Prevention | 38 (100.0%) | 0 (0.0%) |
| Law Enforcement | 30 (100.0%) | 0 (0.0%) |
| Food Preparation & Serving | 19 (22.9%) | 64 (77.1%) |
| Cleaning & Maintenance | 61 (100.0%) | 0 (0.0%) |
| Personal Care & Service | 0 (0.0%) | 48 (100.0%) |
| Total (Category) | 154 (51.3%) | 146 (48.7%) |
| Total (Overall) | 1,958 (53.9%) | 1,674 (46.1%) |
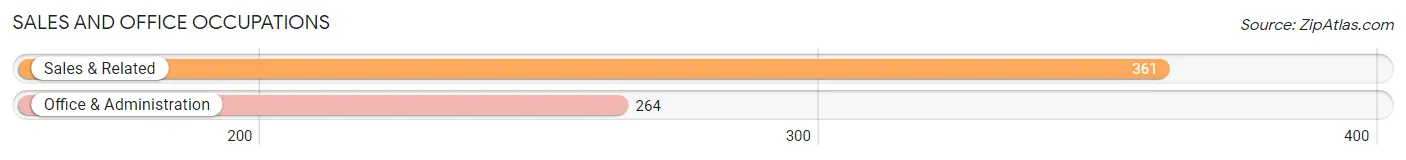
Sales and Office Occupations
The most common Sales and Office occupations in Yorketown are Sales & Related (361 | 9.9%), and Office & Administration (264 | 7.3%).
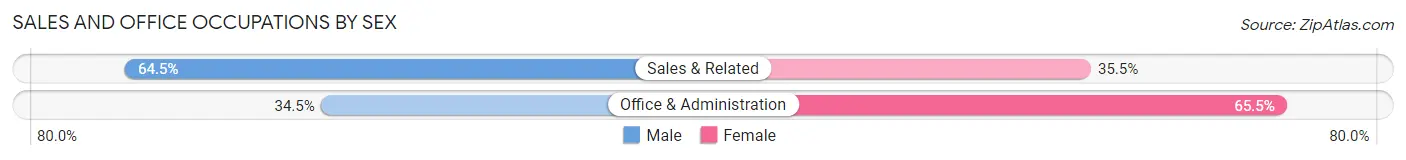
Sales and Office Occupations by Sex
| Occupation | Male | Female |
| Sales & Related | 233 (64.5%) | 128 (35.5%) |
| Office & Administration | 91 (34.5%) | 173 (65.5%) |
| Total (Category) | 324 (51.8%) | 301 (48.2%) |
| Total (Overall) | 1,958 (53.9%) | 1,674 (46.1%) |
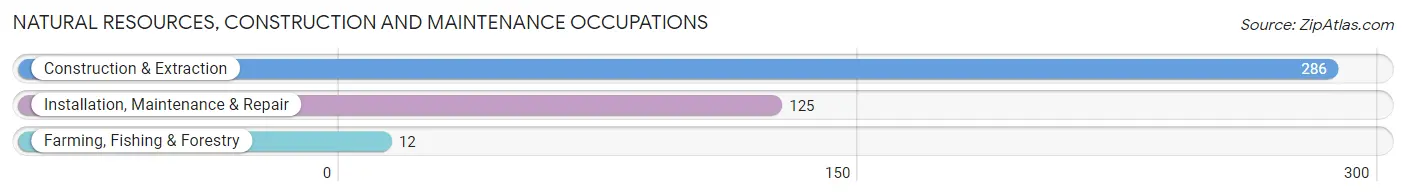
Natural Resources, Construction and Maintenance Occupations
The most common Natural Resources, Construction and Maintenance occupations in Yorketown are Construction & Extraction (286 | 7.9%), Installation, Maintenance & Repair (125 | 3.4%), and Farming, Fishing & Forestry (12 | 0.3%).
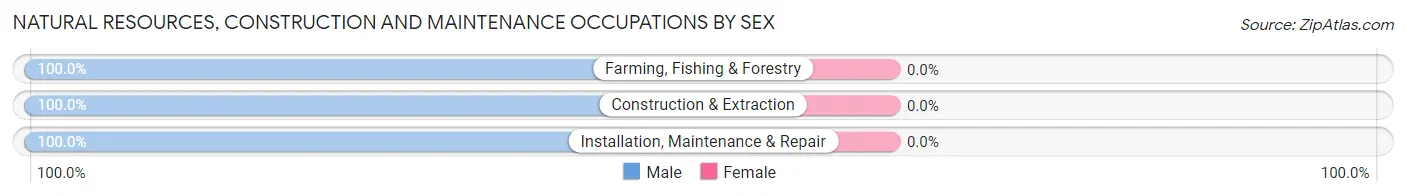
Natural Resources, Construction and Maintenance Occupations by Sex
| Occupation | Male | Female |
| Farming, Fishing & Forestry | 12 (100.0%) | 0 (0.0%) |
| Construction & Extraction | 286 (100.0%) | 0 (0.0%) |
| Installation, Maintenance & Repair | 125 (100.0%) | 0 (0.0%) |
| Total (Category) | 423 (100.0%) | 0 (0.0%) |
| Total (Overall) | 1,958 (53.9%) | 1,674 (46.1%) |
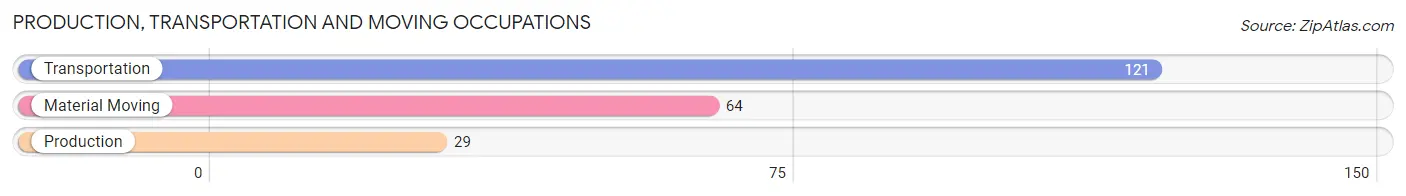
Production, Transportation and Moving Occupations
The most common Production, Transportation and Moving occupations in Yorketown are Transportation (121 | 3.3%), Material Moving (64 | 1.8%), and Production (29 | 0.8%).
Production, Transportation and Moving Occupations by Sex
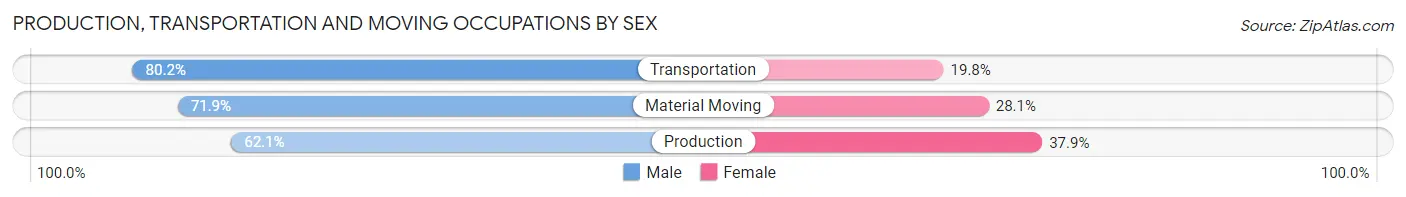
| Occupation | Male | Female |
| Production | 18 (62.1%) | 11 (37.9%) |
| Transportation | 97 (80.2%) | 24 (19.8%) |
| Material Moving | 46 (71.9%) | 18 (28.1%) |
| Total (Category) | 161 (75.2%) | 53 (24.8%) |
| Total (Overall) | 1,958 (53.9%) | 1,674 (46.1%) |
Employment Industries by Sex in Yorketown
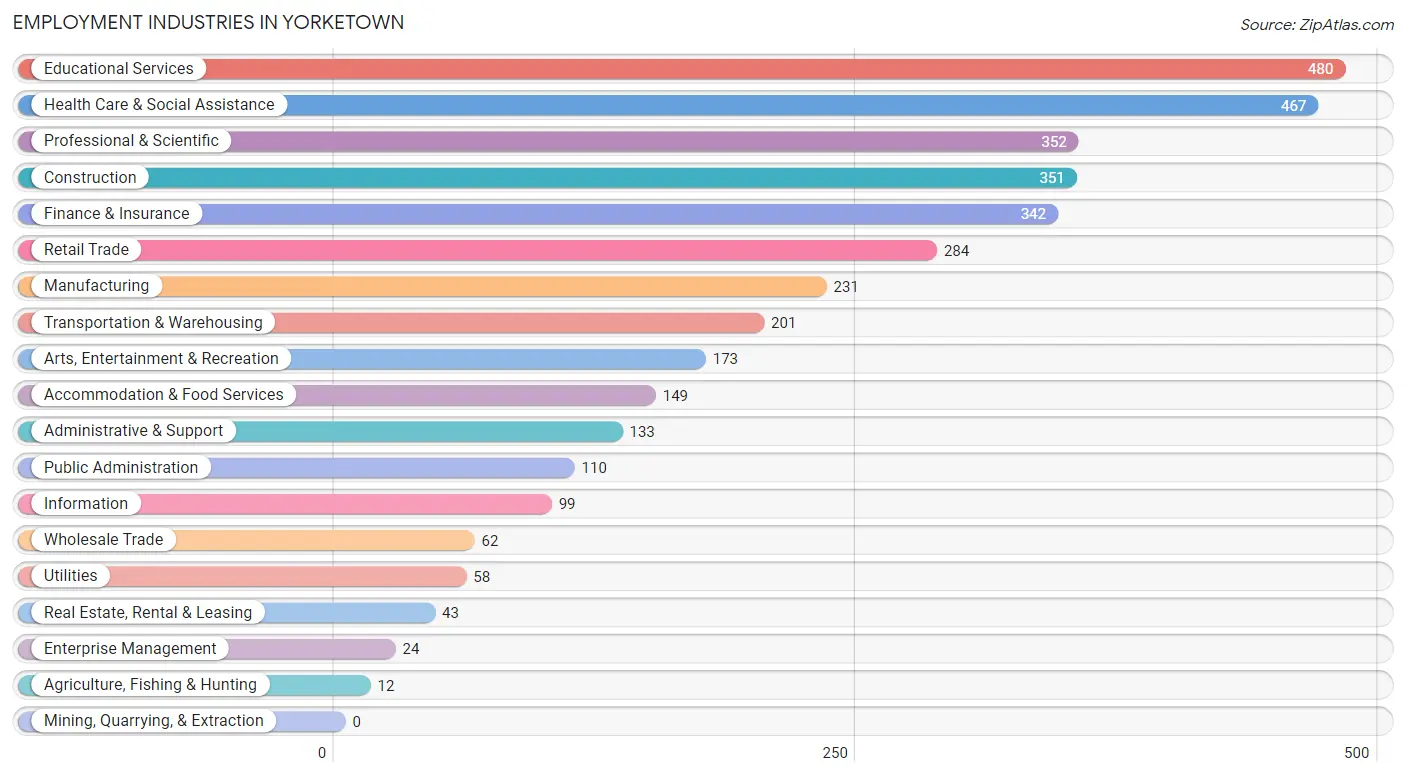
Employment Industries in Yorketown
The major employment industries in Yorketown include Educational Services (480 | 13.2%), Health Care & Social Assistance (467 | 12.9%), Professional & Scientific (352 | 9.7%), Construction (351 | 9.7%), and Finance & Insurance (342 | 9.4%).
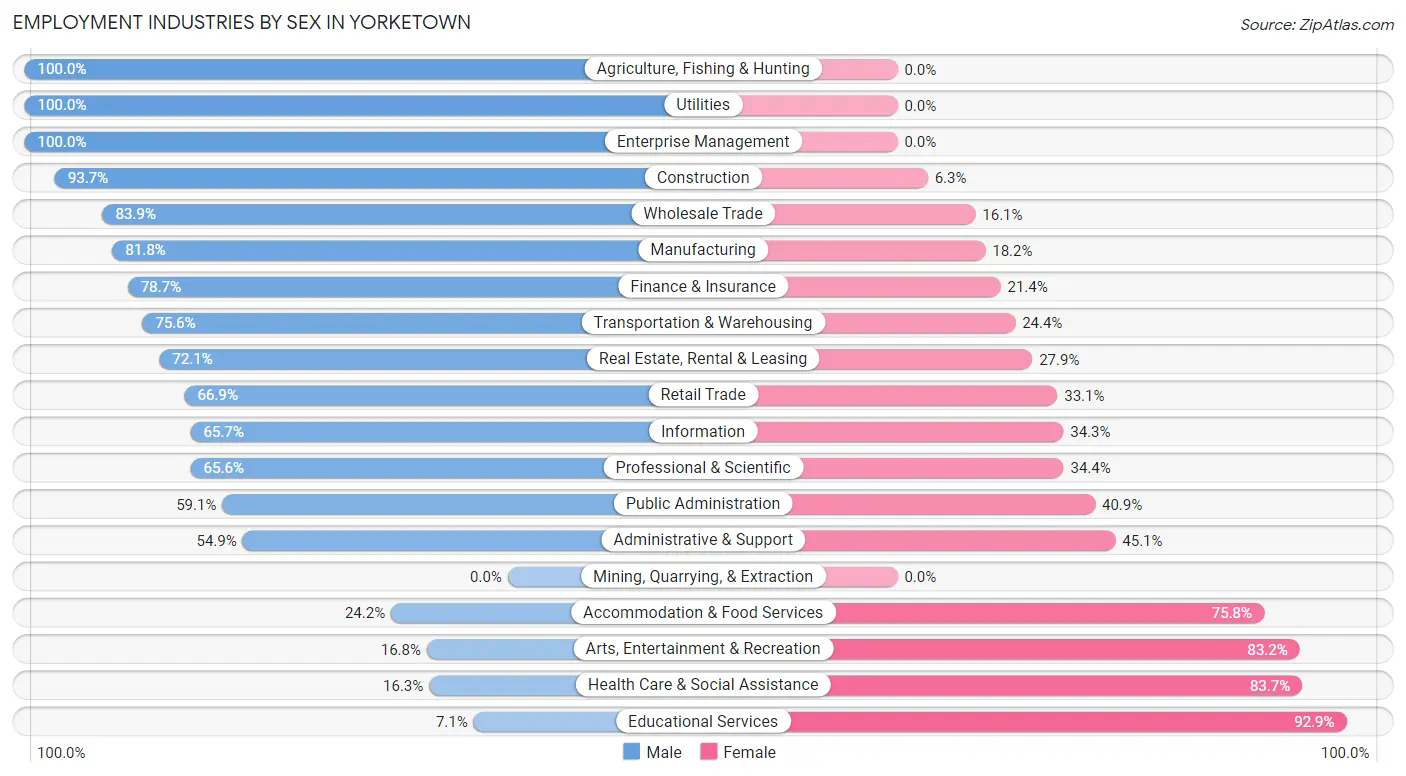
Employment Industries by Sex in Yorketown
The Yorketown industries that see more men than women are Agriculture, Fishing & Hunting (100.0%), Utilities (100.0%), and Enterprise Management (100.0%), whereas the industries that tend to have a higher number of women are Educational Services (92.9%), Health Care & Social Assistance (83.7%), and Arts, Entertainment & Recreation (83.2%).
| Industry | Male | Female |
| Agriculture, Fishing & Hunting | 12 (100.0%) | 0 (0.0%) |
| Mining, Quarrying, & Extraction | 0 (0.0%) | 0 (0.0%) |
| Construction | 329 (93.7%) | 22 (6.3%) |
| Manufacturing | 189 (81.8%) | 42 (18.2%) |
| Wholesale Trade | 52 (83.9%) | 10 (16.1%) |
| Retail Trade | 190 (66.9%) | 94 (33.1%) |
| Transportation & Warehousing | 152 (75.6%) | 49 (24.4%) |
| Utilities | 58 (100.0%) | 0 (0.0%) |
| Information | 65 (65.7%) | 34 (34.3%) |
| Finance & Insurance | 269 (78.6%) | 73 (21.3%) |
| Real Estate, Rental & Leasing | 31 (72.1%) | 12 (27.9%) |
| Professional & Scientific | 231 (65.6%) | 121 (34.4%) |
| Enterprise Management | 24 (100.0%) | 0 (0.0%) |
| Administrative & Support | 73 (54.9%) | 60 (45.1%) |
| Educational Services | 34 (7.1%) | 446 (92.9%) |
| Health Care & Social Assistance | 76 (16.3%) | 391 (83.7%) |
| Arts, Entertainment & Recreation | 29 (16.8%) | 144 (83.2%) |
| Accommodation & Food Services | 36 (24.2%) | 113 (75.8%) |
| Public Administration | 65 (59.1%) | 45 (40.9%) |
| Total | 1,958 (53.9%) | 1,674 (46.1%) |
Education in Yorketown
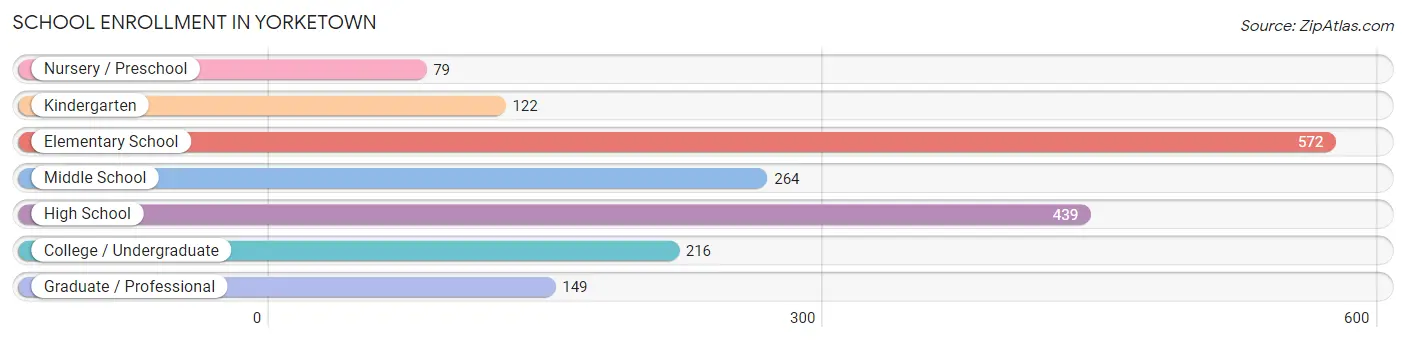
School Enrollment in Yorketown
The most common levels of schooling among the 1,841 students in Yorketown are elementary school (572 | 31.1%), high school (439 | 23.8%), and middle school (264 | 14.3%).
| School Level | # Students | % Students |
| Nursery / Preschool | 79 | 4.3% |
| Kindergarten | 122 | 6.6% |
| Elementary School | 572 | 31.1% |
| Middle School | 264 | 14.3% |
| High School | 439 | 23.8% |
| College / Undergraduate | 216 | 11.7% |
| Graduate / Professional | 149 | 8.1% |
| Total | 1,841 | 100.0% |
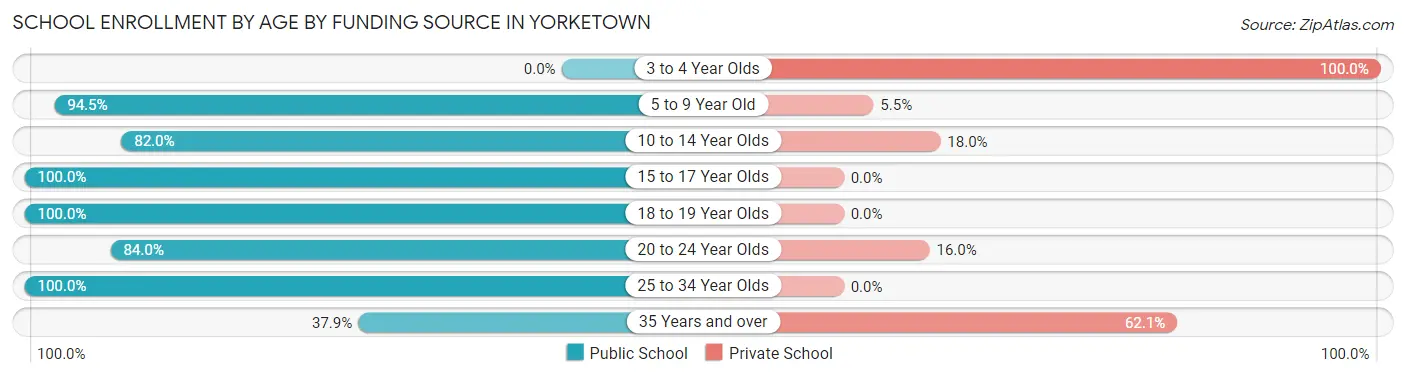
School Enrollment by Age by Funding Source in Yorketown
Out of a total of 1,841 students who are enrolled in schools in Yorketown, 250 (13.6%) attend a private institution, while the remaining 1,591 (86.4%) are enrolled in public schools. The age group of 3 to 4 year olds has the highest likelihood of being enrolled in private schools, with 43 (100.0% in the age bracket) enrolled. Conversely, the age group of 15 to 17 year olds has the lowest likelihood of being enrolled in a private school, with 217 (100.0% in the age bracket) attending a public institution.
| Age Bracket | Public School | Private School |
| 3 to 4 Year Olds | 0 (0.0%) | 43 (100.0%) |
| 5 to 9 Year Old | 614 (94.5%) | 36 (5.5%) |
| 10 to 14 Year Olds | 405 (82.0%) | 89 (18.0%) |
| 15 to 17 Year Olds | 217 (100.0%) | 0 (0.0%) |
| 18 to 19 Year Olds | 129 (100.0%) | 0 (0.0%) |
| 20 to 24 Year Olds | 126 (84.0%) | 24 (16.0%) |
| 25 to 34 Year Olds | 63 (100.0%) | 0 (0.0%) |
| 35 Years and over | 36 (37.9%) | 59 (62.1%) |
| Total | 1,591 (86.4%) | 250 (13.6%) |
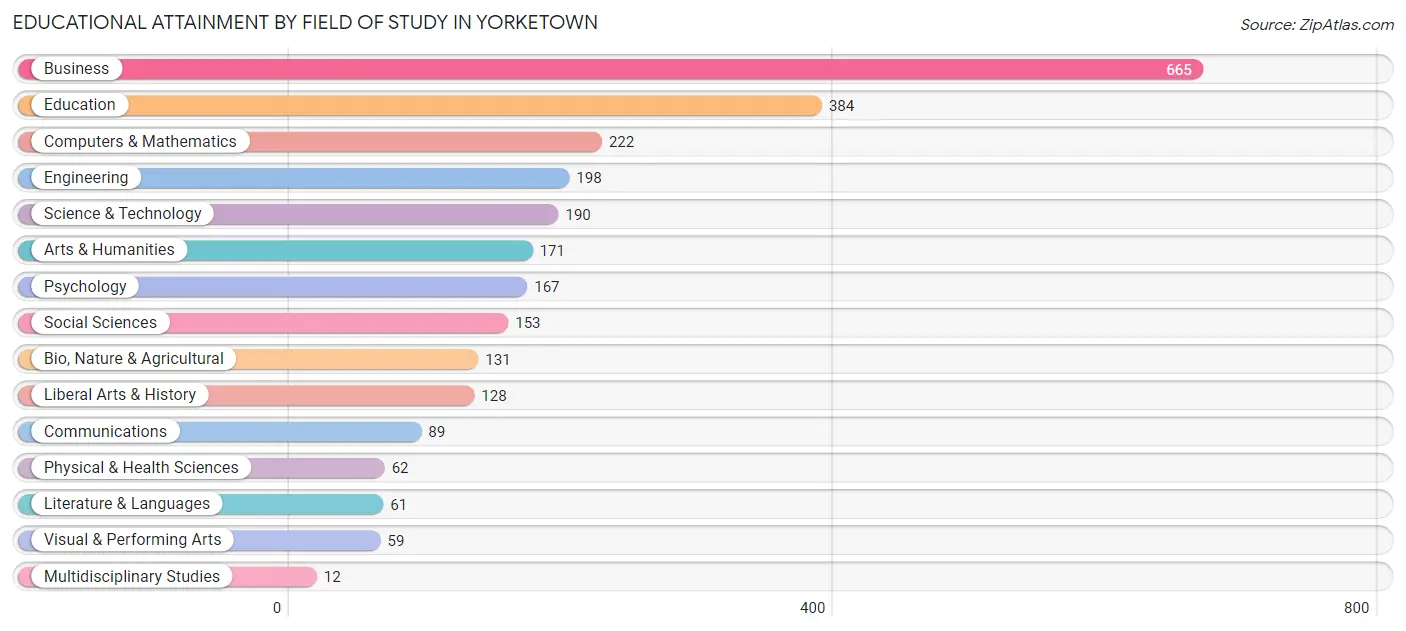
Educational Attainment by Field of Study in Yorketown
Business (665 | 24.7%), education (384 | 14.3%), computers & mathematics (222 | 8.3%), engineering (198 | 7.4%), and science & technology (190 | 7.1%) are the most common fields of study among 2,692 individuals in Yorketown who have obtained a bachelor's degree or higher.
| Field of Study | # Graduates | % Graduates |
| Computers & Mathematics | 222 | 8.3% |
| Bio, Nature & Agricultural | 131 | 4.9% |
| Physical & Health Sciences | 62 | 2.3% |
| Psychology | 167 | 6.2% |
| Social Sciences | 153 | 5.7% |
| Engineering | 198 | 7.4% |
| Multidisciplinary Studies | 12 | 0.4% |
| Science & Technology | 190 | 7.1% |
| Business | 665 | 24.7% |
| Education | 384 | 14.3% |
| Literature & Languages | 61 | 2.3% |
| Liberal Arts & History | 128 | 4.8% |
| Visual & Performing Arts | 59 | 2.2% |
| Communications | 89 | 3.3% |
| Arts & Humanities | 171 | 6.4% |
| Total | 2,692 | 100.0% |
Transportation & Commute in Yorketown
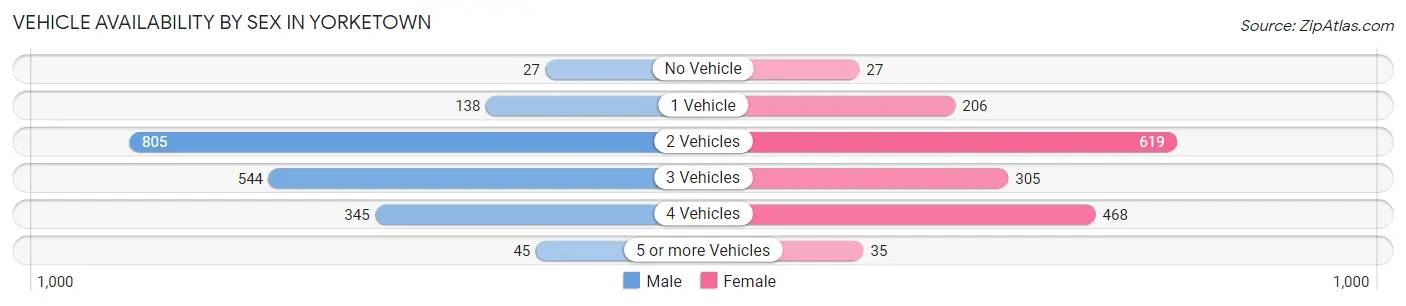
Vehicle Availability by Sex in Yorketown
The most prevalent vehicle ownership categories in Yorketown are males with 2 vehicles (805, accounting for 42.3%) and females with 2 vehicles (619, making up 48.5%).
| Vehicles Available | Male | Female |
| No Vehicle | 27 (1.4%) | 27 (1.6%) |
| 1 Vehicle | 138 (7.2%) | 206 (12.4%) |
| 2 Vehicles | 805 (42.3%) | 619 (37.3%) |
| 3 Vehicles | 544 (28.6%) | 305 (18.4%) |
| 4 Vehicles | 345 (18.1%) | 468 (28.2%) |
| 5 or more Vehicles | 45 (2.4%) | 35 (2.1%) |
| Total | 1,904 (100.0%) | 1,660 (100.0%) |
Commute Time in Yorketown
The most frequently occuring commute durations in Yorketown are 60 to 89 minutes (497 commuters, 17.0%), 45 to 59 minutes (420 commuters, 14.4%), and 20 to 24 minutes (360 commuters, 12.3%).
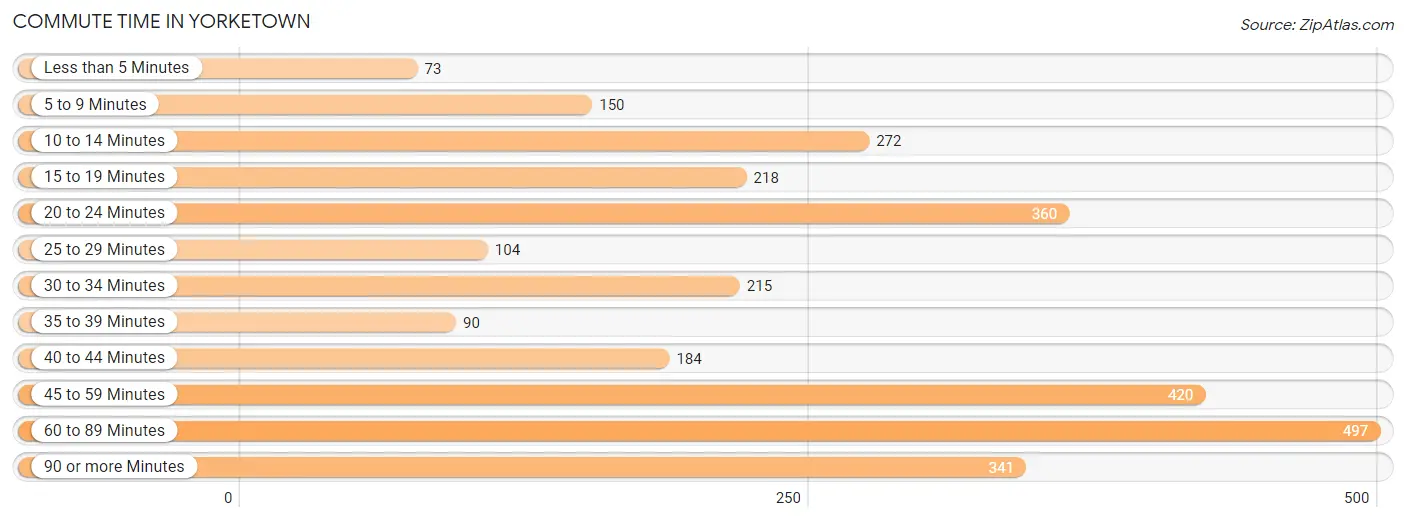
| Commute Time | # Commuters | % Commuters |
| Less than 5 Minutes | 73 | 2.5% |
| 5 to 9 Minutes | 150 | 5.1% |
| 10 to 14 Minutes | 272 | 9.3% |
| 15 to 19 Minutes | 218 | 7.5% |
| 20 to 24 Minutes | 360 | 12.3% |
| 25 to 29 Minutes | 104 | 3.6% |
| 30 to 34 Minutes | 215 | 7.3% |
| 35 to 39 Minutes | 90 | 3.1% |
| 40 to 44 Minutes | 184 | 6.3% |
| 45 to 59 Minutes | 420 | 14.4% |
| 60 to 89 Minutes | 497 | 17.0% |
| 90 or more Minutes | 341 | 11.7% |
Commute Time by Sex in Yorketown
The most common commute times in Yorketown are 60 to 89 minutes (401 commuters, 26.4%) for males and 20 to 24 minutes (239 commuters, 17.1%) for females.
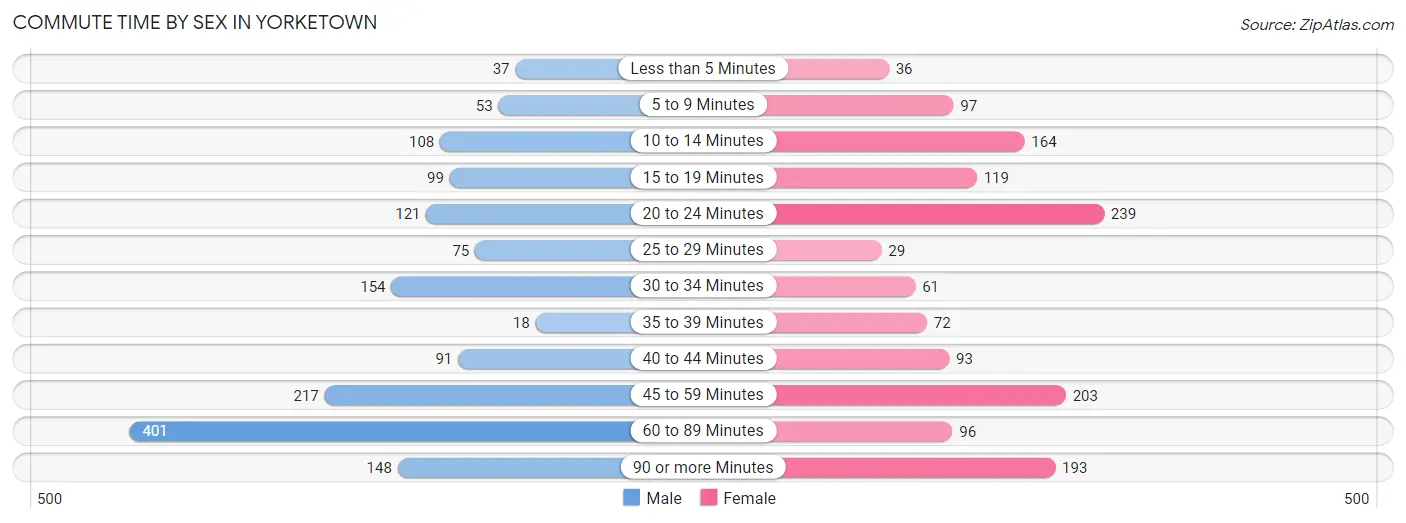
| Commute Time | Male | Female |
| Less than 5 Minutes | 37 (2.4%) | 36 (2.6%) |
| 5 to 9 Minutes | 53 (3.5%) | 97 (6.9%) |
| 10 to 14 Minutes | 108 (7.1%) | 164 (11.7%) |
| 15 to 19 Minutes | 99 (6.5%) | 119 (8.5%) |
| 20 to 24 Minutes | 121 (8.0%) | 239 (17.1%) |
| 25 to 29 Minutes | 75 (4.9%) | 29 (2.1%) |
| 30 to 34 Minutes | 154 (10.1%) | 61 (4.3%) |
| 35 to 39 Minutes | 18 (1.2%) | 72 (5.1%) |
| 40 to 44 Minutes | 91 (6.0%) | 93 (6.6%) |
| 45 to 59 Minutes | 217 (14.3%) | 203 (14.5%) |
| 60 to 89 Minutes | 401 (26.4%) | 96 (6.9%) |
| 90 or more Minutes | 148 (9.7%) | 193 (13.8%) |
Time of Departure to Work by Sex in Yorketown
The most frequent times of departure to work in Yorketown are 8:00 AM to 8:29 AM (237, 15.6%) for males and 8:00 AM to 8:29 AM (279, 19.9%) for females.
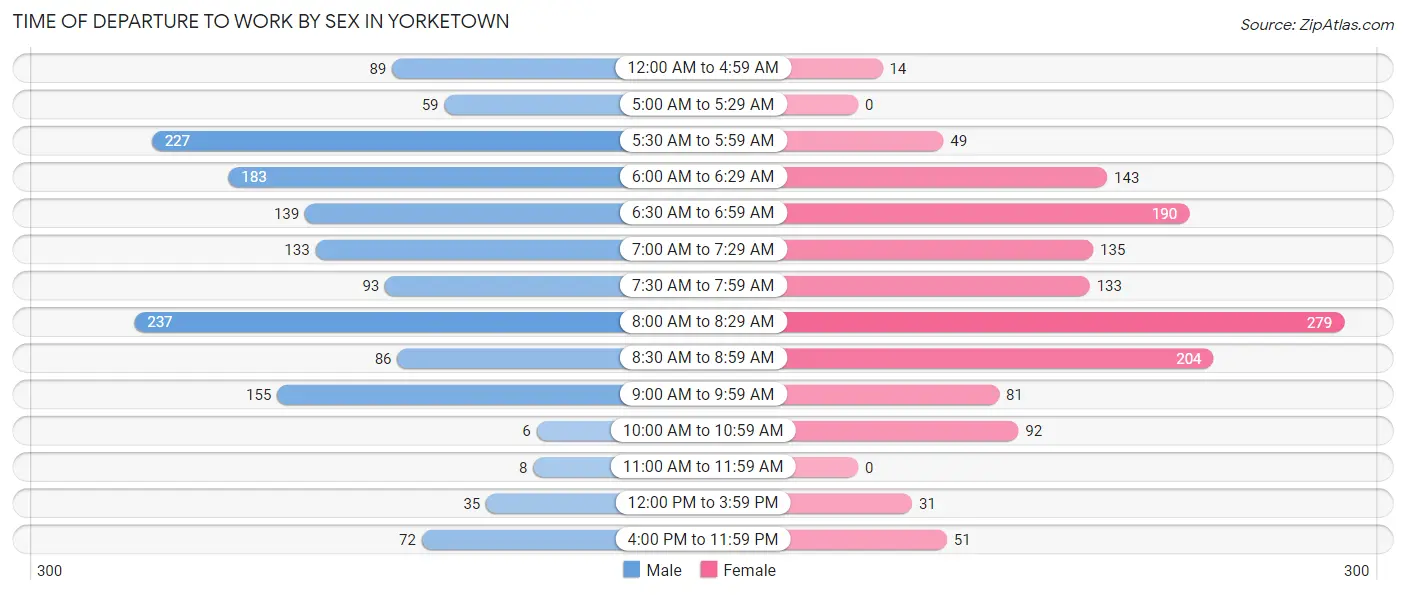
| Time of Departure | Male | Female |
| 12:00 AM to 4:59 AM | 89 (5.9%) | 14 (1.0%) |
| 5:00 AM to 5:29 AM | 59 (3.9%) | 0 (0.0%) |
| 5:30 AM to 5:59 AM | 227 (14.9%) | 49 (3.5%) |
| 6:00 AM to 6:29 AM | 183 (12.0%) | 143 (10.2%) |
| 6:30 AM to 6:59 AM | 139 (9.1%) | 190 (13.6%) |
| 7:00 AM to 7:29 AM | 133 (8.7%) | 135 (9.6%) |
| 7:30 AM to 7:59 AM | 93 (6.1%) | 133 (9.5%) |
| 8:00 AM to 8:29 AM | 237 (15.6%) | 279 (19.9%) |
| 8:30 AM to 8:59 AM | 86 (5.7%) | 204 (14.5%) |
| 9:00 AM to 9:59 AM | 155 (10.2%) | 81 (5.8%) |
| 10:00 AM to 10:59 AM | 6 (0.4%) | 92 (6.6%) |
| 11:00 AM to 11:59 AM | 8 (0.5%) | 0 (0.0%) |
| 12:00 PM to 3:59 PM | 35 (2.3%) | 31 (2.2%) |
| 4:00 PM to 11:59 PM | 72 (4.7%) | 51 (3.6%) |
| Total | 1,522 (100.0%) | 1,402 (100.0%) |
Housing Occupancy in Yorketown
Occupancy by Ownership in Yorketown
Of the total 2,215 dwellings in Yorketown, owner-occupied units account for 2,113 (95.4%), while renter-occupied units make up 102 (4.6%).
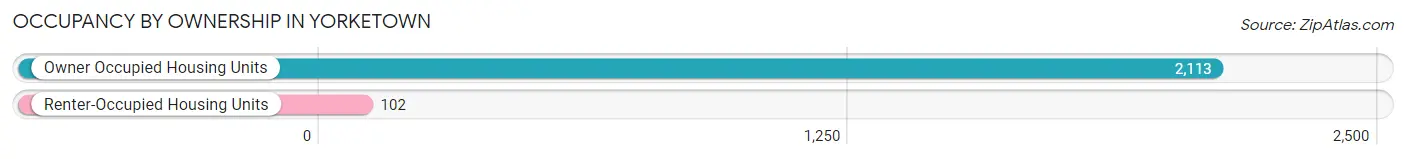
| Occupancy | # Housing Units | % Housing Units |
| Owner Occupied Housing Units | 2,113 | 95.4% |
| Renter-Occupied Housing Units | 102 | 4.6% |
| Total Occupied Housing Units | 2,215 | 100.0% |
Occupancy by Household Size in Yorketown
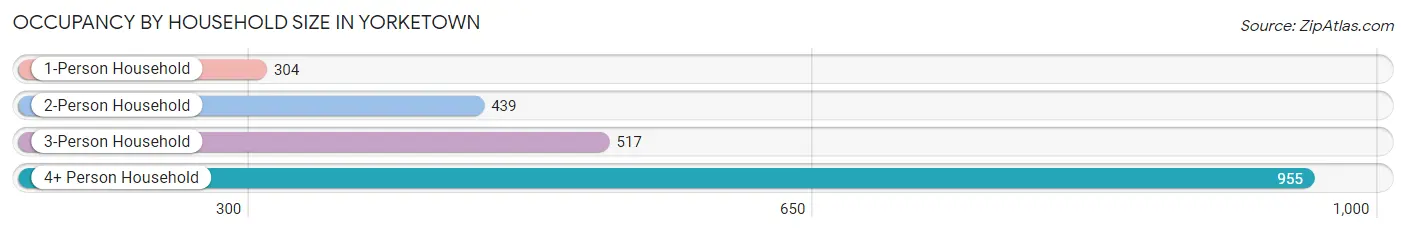
| Household Size | # Housing Units | % Housing Units |
| 1-Person Household | 304 | 13.7% |
| 2-Person Household | 439 | 19.8% |
| 3-Person Household | 517 | 23.3% |
| 4+ Person Household | 955 | 43.1% |
| Total Housing Units | 2,215 | 100.0% |
Occupancy by Ownership by Household Size in Yorketown
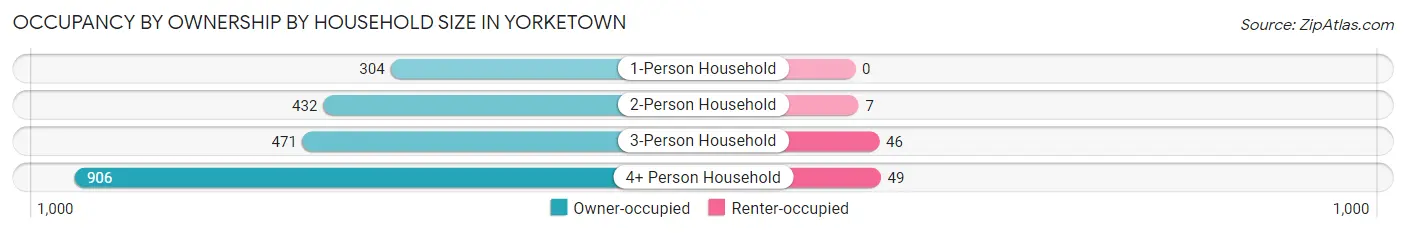
| Household Size | Owner-occupied | Renter-occupied |
| 1-Person Household | 304 (100.0%) | 0 (0.0%) |
| 2-Person Household | 432 (98.4%) | 7 (1.6%) |
| 3-Person Household | 471 (91.1%) | 46 (8.9%) |
| 4+ Person Household | 906 (94.9%) | 49 (5.1%) |
| Total Housing Units | 2,113 (95.4%) | 102 (4.6%) |
Occupancy by Educational Attainment in Yorketown
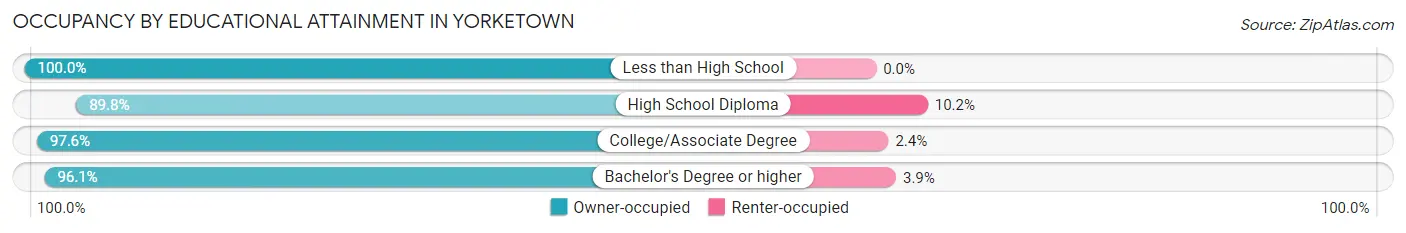
| Household Size | Owner-occupied | Renter-occupied |
| Less than High School | 48 (100.0%) | 0 (0.0%) |
| High School Diploma | 333 (89.8%) | 38 (10.2%) |
| College/Associate Degree | 440 (97.6%) | 11 (2.4%) |
| Bachelor's Degree or higher | 1,292 (96.1%) | 53 (3.9%) |
Occupancy by Age of Householder in Yorketown
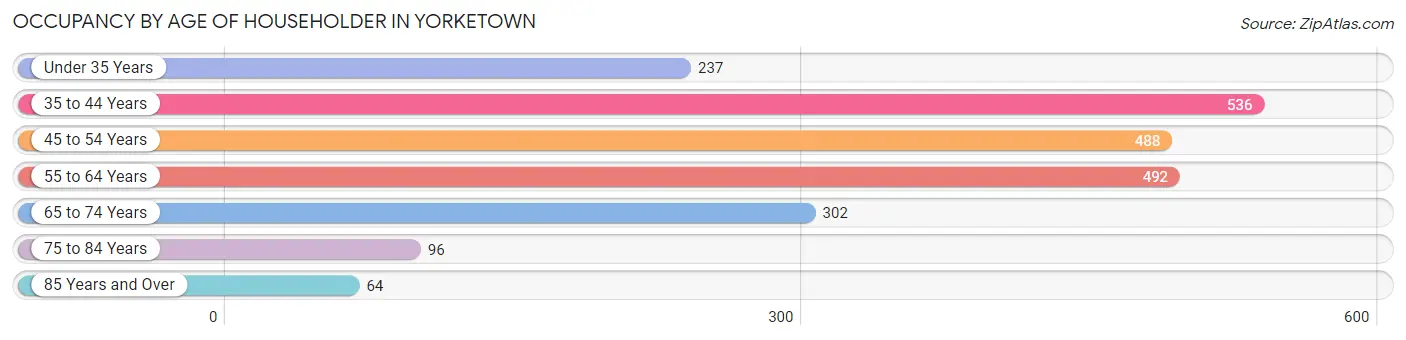
| Age Bracket | # Households | % Households |
| Under 35 Years | 237 | 10.7% |
| 35 to 44 Years | 536 | 24.2% |
| 45 to 54 Years | 488 | 22.0% |
| 55 to 64 Years | 492 | 22.2% |
| 65 to 74 Years | 302 | 13.6% |
| 75 to 84 Years | 96 | 4.3% |
| 85 Years and Over | 64 | 2.9% |
| Total | 2,215 | 100.0% |
Housing Finances in Yorketown
Median Income by Occupancy in Yorketown
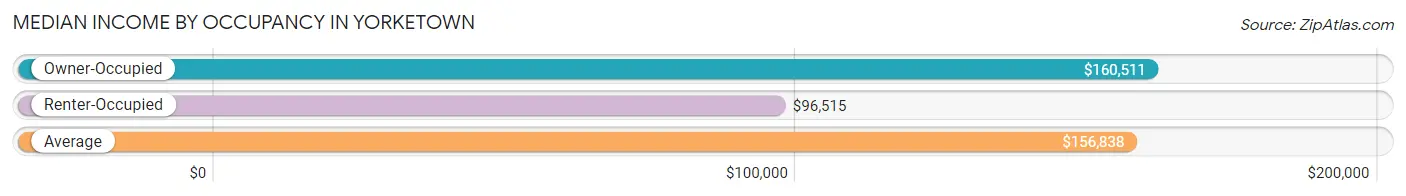
| Occupancy Type | # Households | Median Income |
| Owner-Occupied | 2,113 (95.4%) | $160,511 |
| Renter-Occupied | 102 (4.6%) | $96,515 |
| Average | 2,215 (100.0%) | $156,838 |
Occupancy by Householder Income Bracket in Yorketown
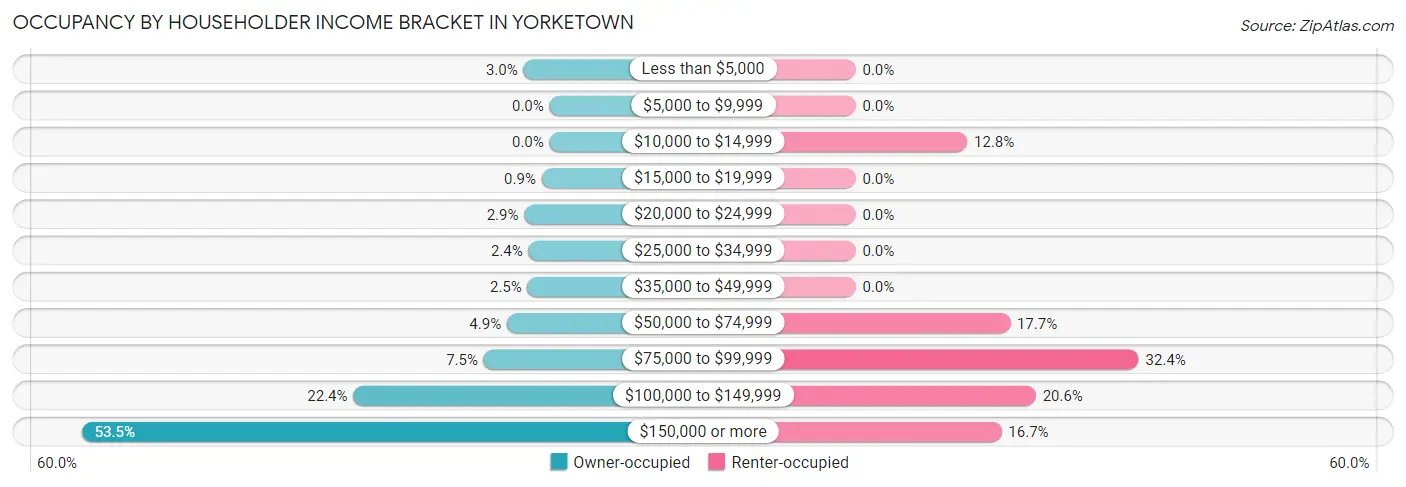
| Income Bracket | Owner-occupied | Renter-occupied |
| Less than $5,000 | 63 (3.0%) | 0 (0.0%) |
| $5,000 to $9,999 | 0 (0.0%) | 0 (0.0%) |
| $10,000 to $14,999 | 0 (0.0%) | 13 (12.8%) |
| $15,000 to $19,999 | 19 (0.9%) | 0 (0.0%) |
| $20,000 to $24,999 | 61 (2.9%) | 0 (0.0%) |
| $25,000 to $34,999 | 51 (2.4%) | 0 (0.0%) |
| $35,000 to $49,999 | 53 (2.5%) | 0 (0.0%) |
| $50,000 to $74,999 | 103 (4.9%) | 18 (17.6%) |
| $75,000 to $99,999 | 159 (7.5%) | 33 (32.4%) |
| $100,000 to $149,999 | 474 (22.4%) | 21 (20.6%) |
| $150,000 or more | 1,130 (53.5%) | 17 (16.7%) |
| Total | 2,113 (100.0%) | 102 (100.0%) |
Monthly Housing Cost Tiers in Yorketown
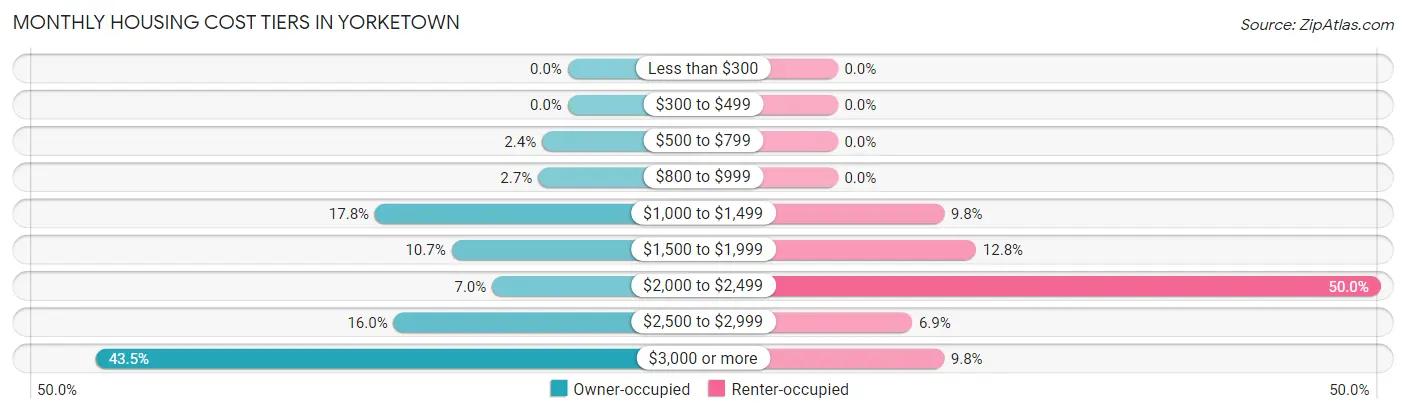
| Monthly Cost | Owner-occupied | Renter-occupied |
| Less than $300 | 0 (0.0%) | 0 (0.0%) |
| $300 to $499 | 0 (0.0%) | 0 (0.0%) |
| $500 to $799 | 50 (2.4%) | 0 (0.0%) |
| $800 to $999 | 58 (2.7%) | 0 (0.0%) |
| $1,000 to $1,499 | 375 (17.7%) | 10 (9.8%) |
| $1,500 to $1,999 | 226 (10.7%) | 13 (12.8%) |
| $2,000 to $2,499 | 147 (7.0%) | 51 (50.0%) |
| $2,500 to $2,999 | 339 (16.0%) | 7 (6.9%) |
| $3,000 or more | 918 (43.4%) | 10 (9.8%) |
| Total | 2,113 (100.0%) | 102 (100.0%) |
Physical Housing Characteristics in Yorketown
Housing Structures in Yorketown
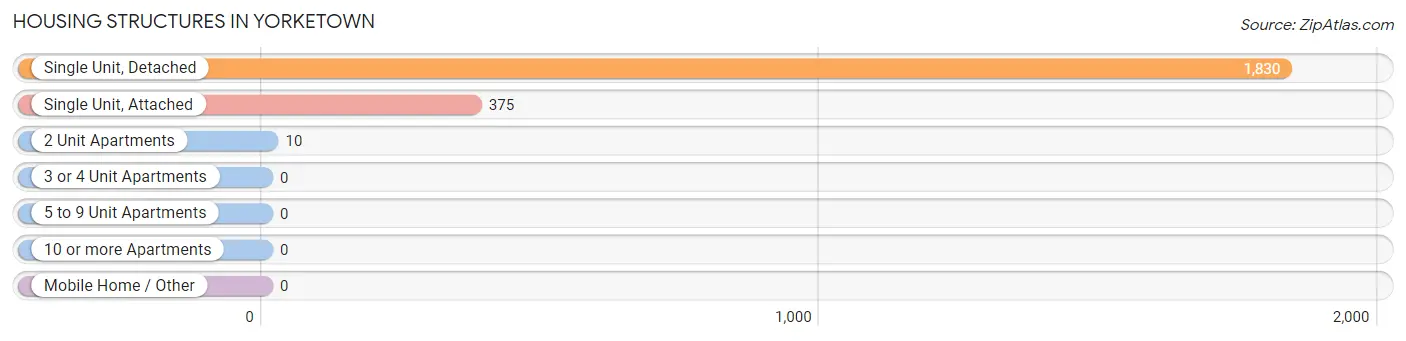
| Structure Type | # Housing Units | % Housing Units |
| Single Unit, Detached | 1,830 | 82.6% |
| Single Unit, Attached | 375 | 16.9% |
| 2 Unit Apartments | 10 | 0.4% |
| 3 or 4 Unit Apartments | 0 | 0.0% |
| 5 to 9 Unit Apartments | 0 | 0.0% |
| 10 or more Apartments | 0 | 0.0% |
| Mobile Home / Other | 0 | 0.0% |
| Total | 2,215 | 100.0% |
Housing Structures by Occupancy in Yorketown
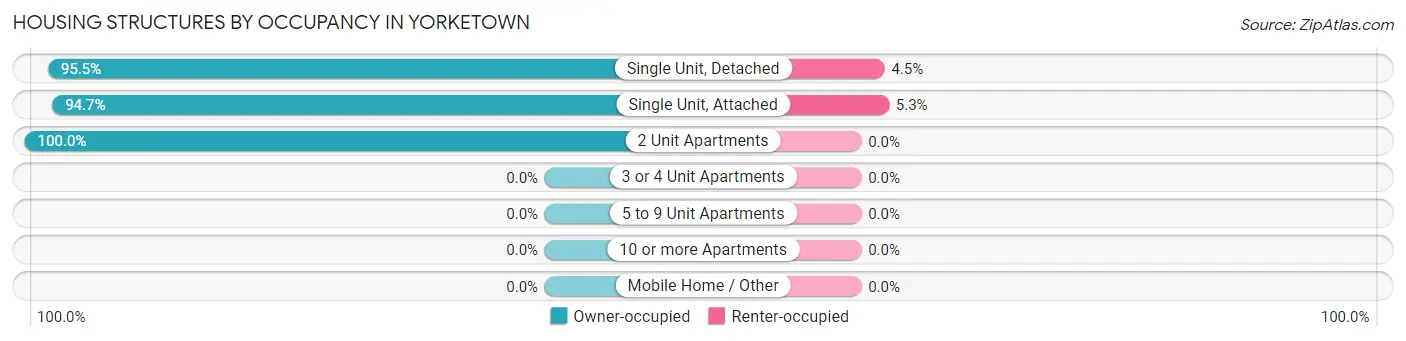
| Structure Type | Owner-occupied | Renter-occupied |
| Single Unit, Detached | 1,748 (95.5%) | 82 (4.5%) |
| Single Unit, Attached | 355 (94.7%) | 20 (5.3%) |
| 2 Unit Apartments | 10 (100.0%) | 0 (0.0%) |
| 3 or 4 Unit Apartments | 0 (0.0%) | 0 (0.0%) |
| 5 to 9 Unit Apartments | 0 (0.0%) | 0 (0.0%) |
| 10 or more Apartments | 0 (0.0%) | 0 (0.0%) |
| Mobile Home / Other | 0 (0.0%) | 0 (0.0%) |
| Total | 2,113 (95.4%) | 102 (4.6%) |
Housing Structures by Number of Rooms in Yorketown
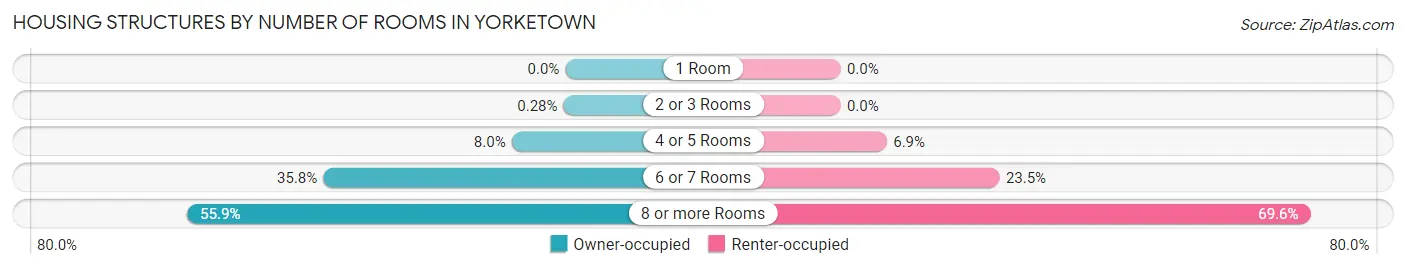
| Number of Rooms | Owner-occupied | Renter-occupied |
| 1 Room | 0 (0.0%) | 0 (0.0%) |
| 2 or 3 Rooms | 6 (0.3%) | 0 (0.0%) |
| 4 or 5 Rooms | 168 (8.0%) | 7 (6.9%) |
| 6 or 7 Rooms | 757 (35.8%) | 24 (23.5%) |
| 8 or more Rooms | 1,182 (55.9%) | 71 (69.6%) |
| Total | 2,113 (100.0%) | 102 (100.0%) |
Housing Structure by Heating Type in Yorketown
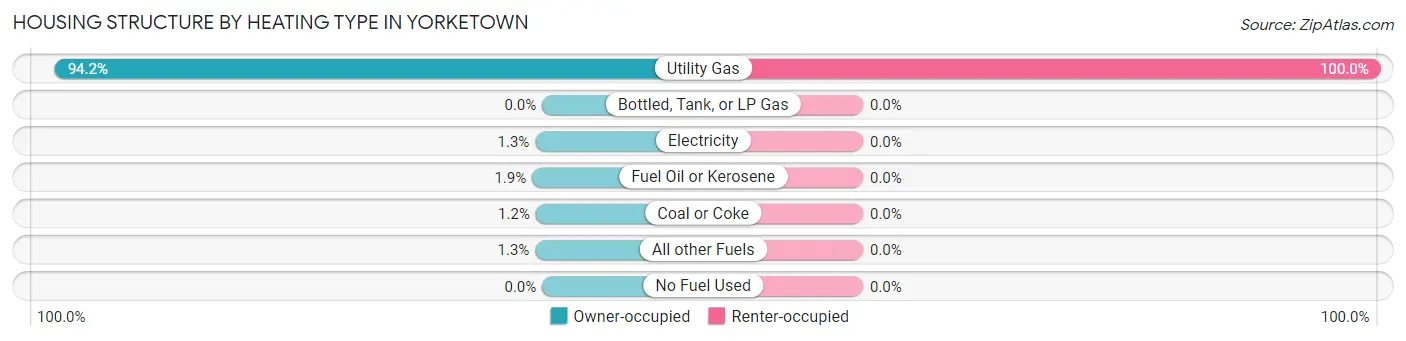
| Heating Type | Owner-occupied | Renter-occupied |
| Utility Gas | 1,990 (94.2%) | 102 (100.0%) |
| Bottled, Tank, or LP Gas | 0 (0.0%) | 0 (0.0%) |
| Electricity | 28 (1.3%) | 0 (0.0%) |
| Fuel Oil or Kerosene | 41 (1.9%) | 0 (0.0%) |
| Coal or Coke | 26 (1.2%) | 0 (0.0%) |
| All other Fuels | 28 (1.3%) | 0 (0.0%) |
| No Fuel Used | 0 (0.0%) | 0 (0.0%) |
| Total | 2,113 (100.0%) | 102 (100.0%) |
Household Vehicle Usage in Yorketown
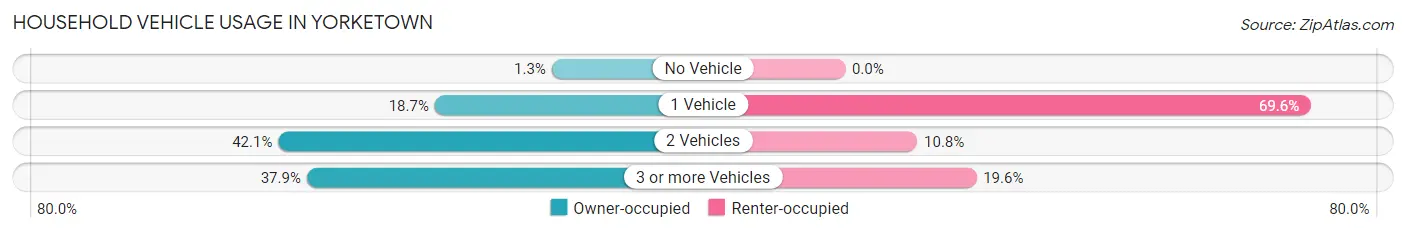
| Vehicles per Household | Owner-occupied | Renter-occupied |
| No Vehicle | 27 (1.3%) | 0 (0.0%) |
| 1 Vehicle | 396 (18.7%) | 71 (69.6%) |
| 2 Vehicles | 890 (42.1%) | 11 (10.8%) |
| 3 or more Vehicles | 800 (37.9%) | 20 (19.6%) |
| Total | 2,113 (100.0%) | 102 (100.0%) |
Real Estate & Mortgages in Yorketown
Real Estate and Mortgage Overview in Yorketown
| Characteristic | Without Mortgage | With Mortgage |
| Housing Units | 602 | 1,511 |
| Median Property Value | $484,700 | $539,400 |
| Median Household Income | $102,667 | $945 |
| Monthly Housing Costs | $1,267 | $918 |
| Real Estate Taxes | $9,632 | $6 |
Property Value by Mortgage Status in Yorketown
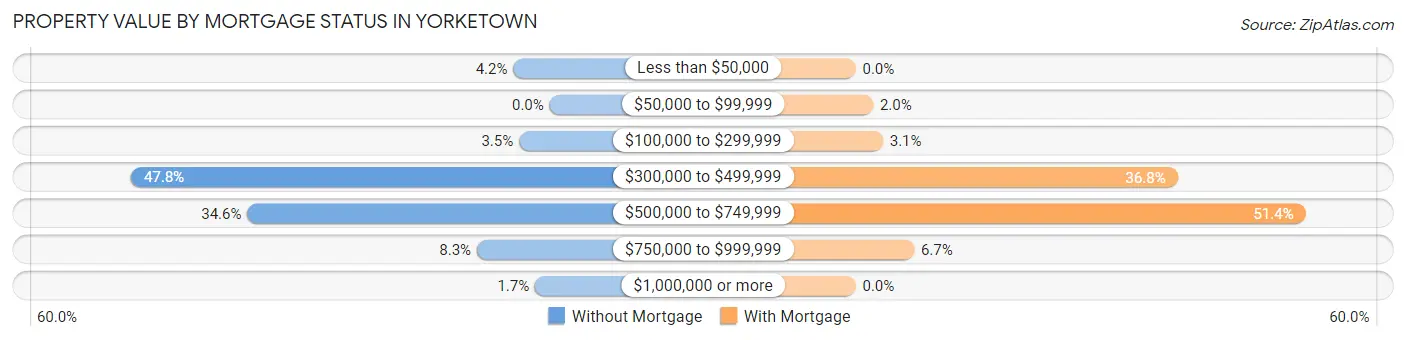
| Property Value | Without Mortgage | With Mortgage |
| Less than $50,000 | 25 (4.2%) | 0 (0.0%) |
| $50,000 to $99,999 | 0 (0.0%) | 30 (2.0%) |
| $100,000 to $299,999 | 21 (3.5%) | 47 (3.1%) |
| $300,000 to $499,999 | 288 (47.8%) | 556 (36.8%) |
| $500,000 to $749,999 | 208 (34.5%) | 777 (51.4%) |
| $750,000 to $999,999 | 50 (8.3%) | 101 (6.7%) |
| $1,000,000 or more | 10 (1.7%) | 0 (0.0%) |
| Total | 602 (100.0%) | 1,511 (100.0%) |
Household Income by Mortgage Status in Yorketown
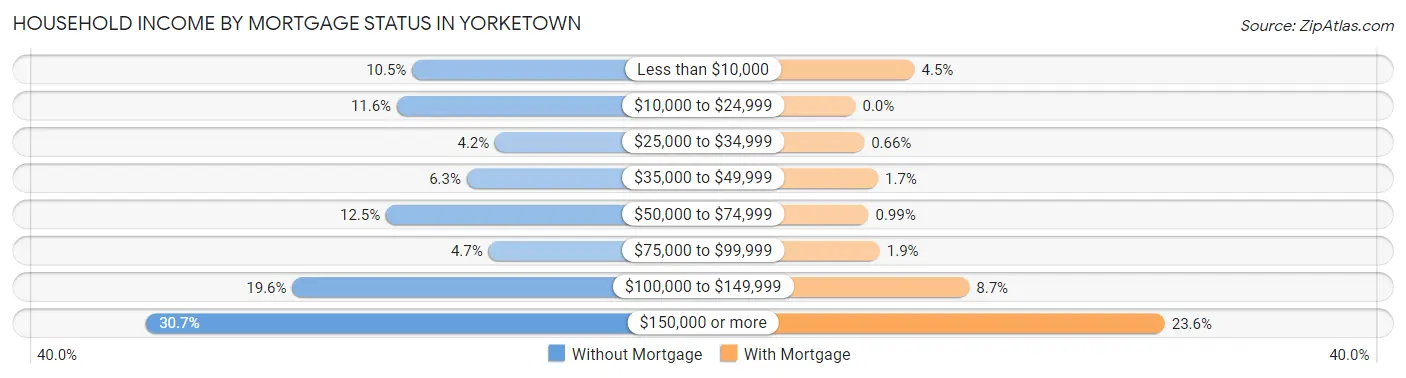
| Household Income | Without Mortgage | With Mortgage |
| Less than $10,000 | 63 (10.5%) | 68 (4.5%) |
| $10,000 to $24,999 | 70 (11.6%) | 0 (0.0%) |
| $25,000 to $34,999 | 25 (4.2%) | 10 (0.7%) |
| $35,000 to $49,999 | 38 (6.3%) | 26 (1.7%) |
| $50,000 to $74,999 | 75 (12.5%) | 15 (1.0%) |
| $75,000 to $99,999 | 28 (4.6%) | 28 (1.8%) |
| $100,000 to $149,999 | 118 (19.6%) | 131 (8.7%) |
| $150,000 or more | 185 (30.7%) | 356 (23.6%) |
| Total | 602 (100.0%) | 1,511 (100.0%) |
Property Value to Household Income Ratio in Yorketown
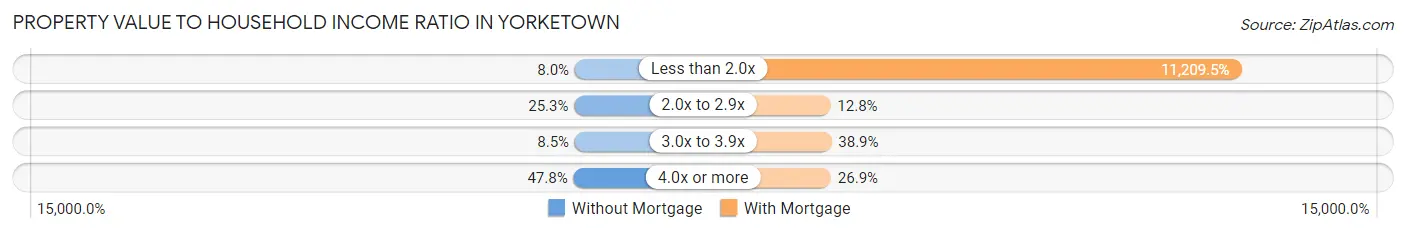
| Value-to-Income Ratio | Without Mortgage | With Mortgage |
| Less than 2.0x | 48 (8.0%) | 169,375 (11,209.5%) |
| 2.0x to 2.9x | 152 (25.3%) | 194 (12.8%) |
| 3.0x to 3.9x | 51 (8.5%) | 587 (38.9%) |
| 4.0x or more | 288 (47.8%) | 406 (26.9%) |
| Total | 602 (100.0%) | 1,511 (100.0%) |
Real Estate Taxes by Mortgage Status in Yorketown
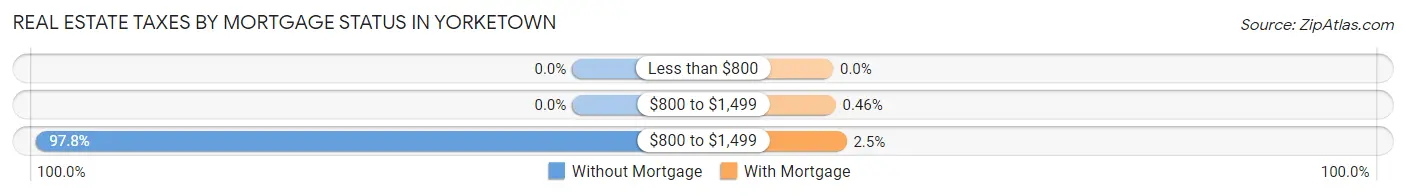
| Property Taxes | Without Mortgage | With Mortgage |
| Less than $800 | 0 (0.0%) | 0 (0.0%) |
| $800 to $1,499 | 0 (0.0%) | 7 (0.5%) |
| $800 to $1,499 | 589 (97.8%) | 37 (2.5%) |
| Total | 602 (100.0%) | 1,511 (100.0%) |
Health & Disability in Yorketown
Health Insurance Coverage by Age in Yorketown
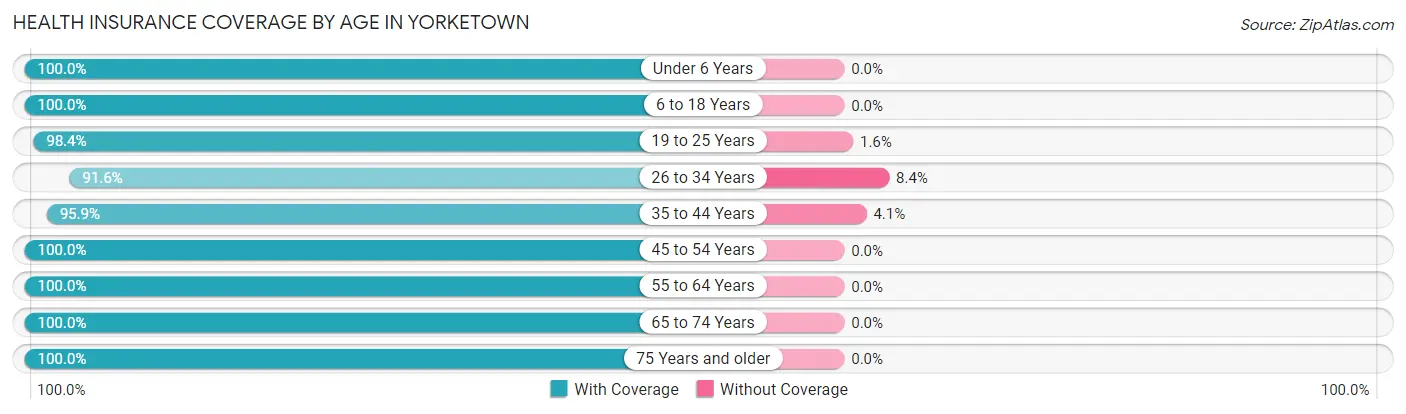
| Age Bracket | With Coverage | Without Coverage |
| Under 6 Years | 644 (100.0%) | 0 (0.0%) |
| 6 to 18 Years | 1,332 (100.0%) | 0 (0.0%) |
| 19 to 25 Years | 602 (98.4%) | 10 (1.6%) |
| 26 to 34 Years | 669 (91.6%) | 61 (8.4%) |
| 35 to 44 Years | 1,090 (95.9%) | 47 (4.1%) |
| 45 to 54 Years | 922 (100.0%) | 0 (0.0%) |
| 55 to 64 Years | 962 (100.0%) | 0 (0.0%) |
| 65 to 74 Years | 507 (100.0%) | 0 (0.0%) |
| 75 Years and older | 256 (100.0%) | 0 (0.0%) |
| Total | 6,984 (98.3%) | 118 (1.7%) |
Health Insurance Coverage by Citizenship Status in Yorketown
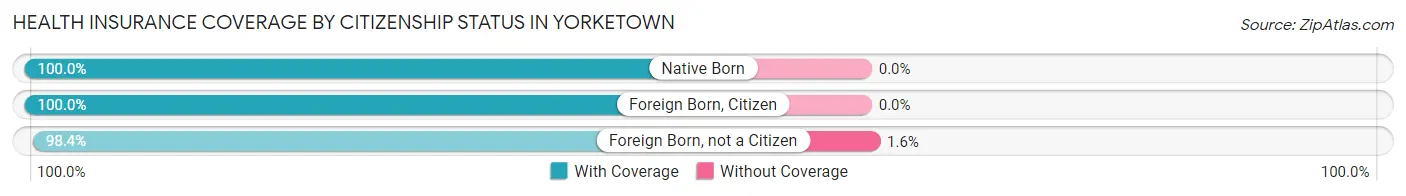
| Citizenship Status | With Coverage | Without Coverage |
| Native Born | 644 (100.0%) | 0 (0.0%) |
| Foreign Born, Citizen | 1,332 (100.0%) | 0 (0.0%) |
| Foreign Born, not a Citizen | 602 (98.4%) | 10 (1.6%) |
Health Insurance Coverage by Household Income in Yorketown
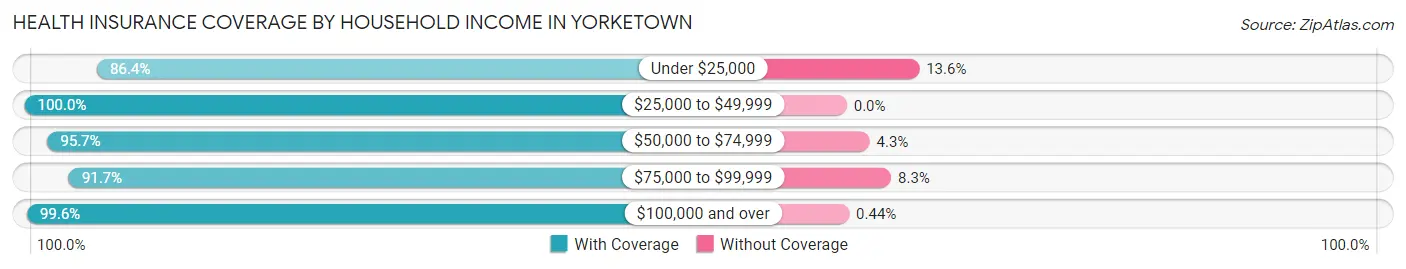
| Household Income | With Coverage | Without Coverage |
| Under $25,000 | 223 (86.4%) | 35 (13.6%) |
| $25,000 to $49,999 | 188 (100.0%) | 0 (0.0%) |
| $50,000 to $74,999 | 224 (95.7%) | 10 (4.3%) |
| $75,000 to $99,999 | 519 (91.7%) | 47 (8.3%) |
| $100,000 and over | 5,819 (99.6%) | 26 (0.4%) |
Public vs Private Health Insurance Coverage by Age in Yorketown
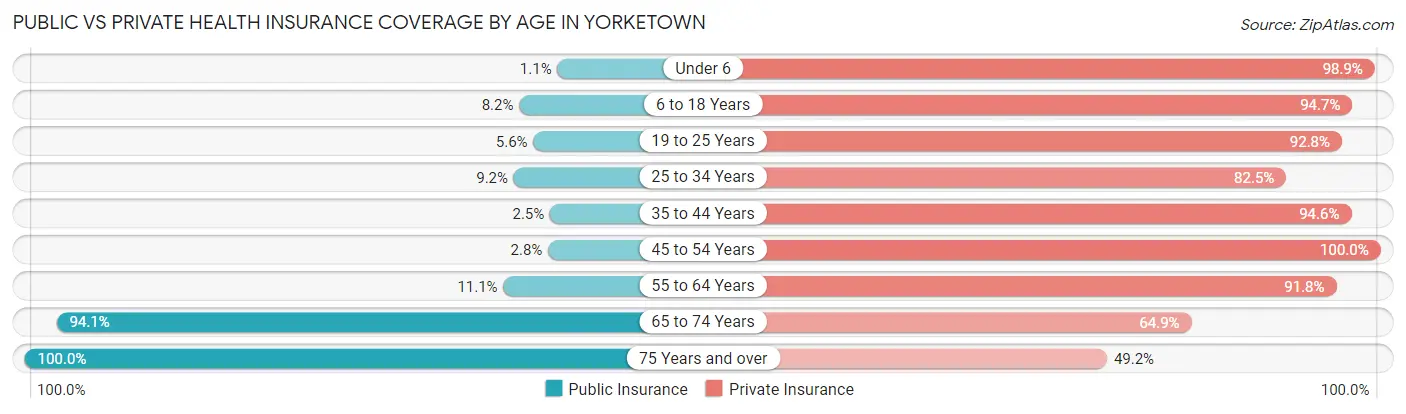
| Age Bracket | Public Insurance | Private Insurance |
| Under 6 | 7 (1.1%) | 637 (98.9%) |
| 6 to 18 Years | 109 (8.2%) | 1,262 (94.7%) |
| 19 to 25 Years | 34 (5.6%) | 568 (92.8%) |
| 25 to 34 Years | 67 (9.2%) | 602 (82.5%) |
| 35 to 44 Years | 28 (2.5%) | 1,075 (94.6%) |
| 45 to 54 Years | 26 (2.8%) | 922 (100.0%) |
| 55 to 64 Years | 107 (11.1%) | 883 (91.8%) |
| 65 to 74 Years | 477 (94.1%) | 329 (64.9%) |
| 75 Years and over | 256 (100.0%) | 126 (49.2%) |
| Total | 1,111 (15.6%) | 6,404 (90.2%) |
Disability Status by Sex by Age in Yorketown
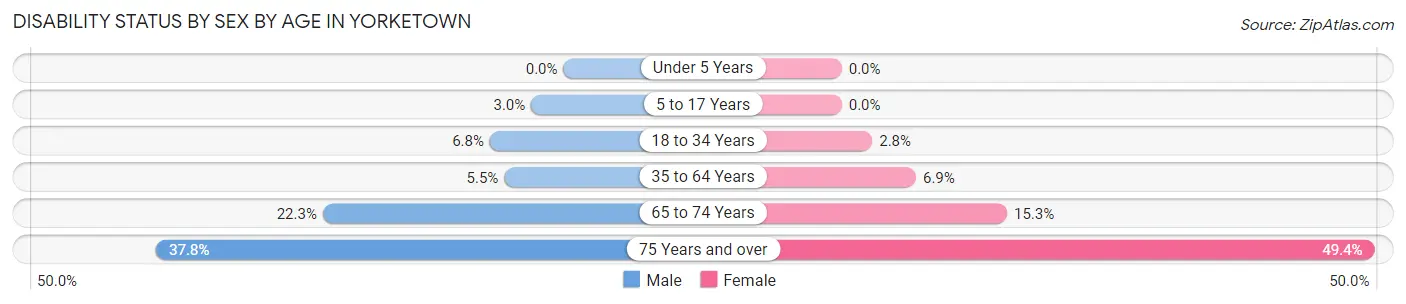
| Age Bracket | Male | Female |
| Under 5 Years | 0 (0.0%) | 0 (0.0%) |
| 5 to 17 Years | 19 (3.0%) | 0 (0.0%) |
| 18 to 34 Years | 45 (6.8%) | 22 (2.8%) |
| 35 to 64 Years | 83 (5.5%) | 104 (6.9%) |
| 65 to 74 Years | 71 (22.3%) | 29 (15.3%) |
| 75 Years and over | 31 (37.8%) | 86 (49.4%) |
Disability Class by Sex by Age in Yorketown
Disability Class: Hearing Difficulty
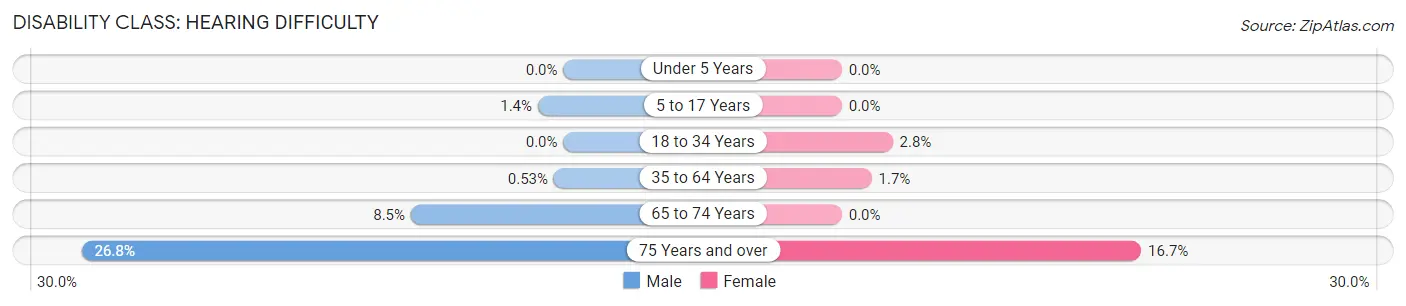
| Age Bracket | Male | Female |
| Under 5 Years | 0 (0.0%) | 0 (0.0%) |
| 5 to 17 Years | 9 (1.4%) | 0 (0.0%) |
| 18 to 34 Years | 0 (0.0%) | 22 (2.8%) |
| 35 to 64 Years | 8 (0.5%) | 25 (1.7%) |
| 65 to 74 Years | 27 (8.5%) | 0 (0.0%) |
| 75 Years and over | 22 (26.8%) | 29 (16.7%) |
Disability Class: Vision Difficulty
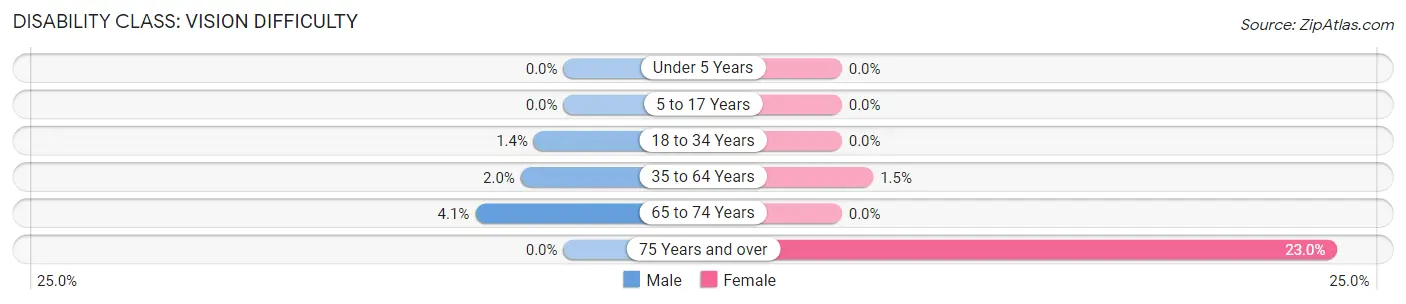
| Age Bracket | Male | Female |
| Under 5 Years | 0 (0.0%) | 0 (0.0%) |
| 5 to 17 Years | 0 (0.0%) | 0 (0.0%) |
| 18 to 34 Years | 9 (1.4%) | 0 (0.0%) |
| 35 to 64 Years | 30 (2.0%) | 22 (1.5%) |
| 65 to 74 Years | 13 (4.1%) | 0 (0.0%) |
| 75 Years and over | 0 (0.0%) | 40 (23.0%) |
Disability Class: Cognitive Difficulty
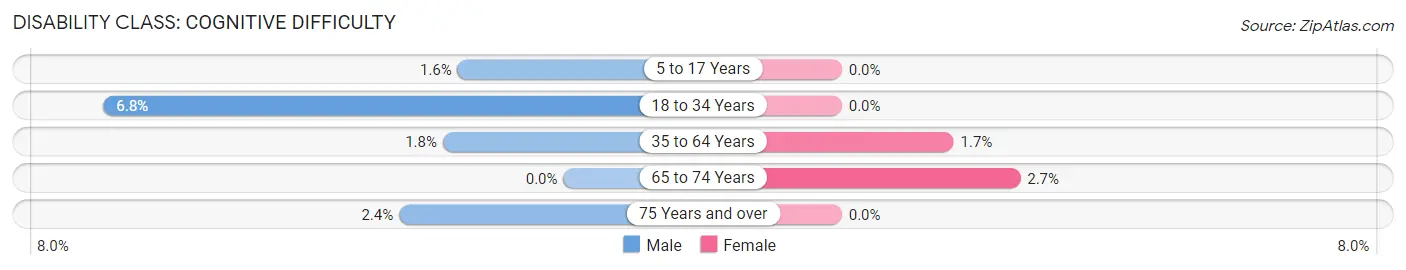
| Age Bracket | Male | Female |
| 5 to 17 Years | 10 (1.6%) | 0 (0.0%) |
| 18 to 34 Years | 45 (6.8%) | 0 (0.0%) |
| 35 to 64 Years | 27 (1.8%) | 25 (1.7%) |
| 65 to 74 Years | 0 (0.0%) | 5 (2.6%) |
| 75 Years and over | 2 (2.4%) | 0 (0.0%) |
Disability Class: Ambulatory Difficulty
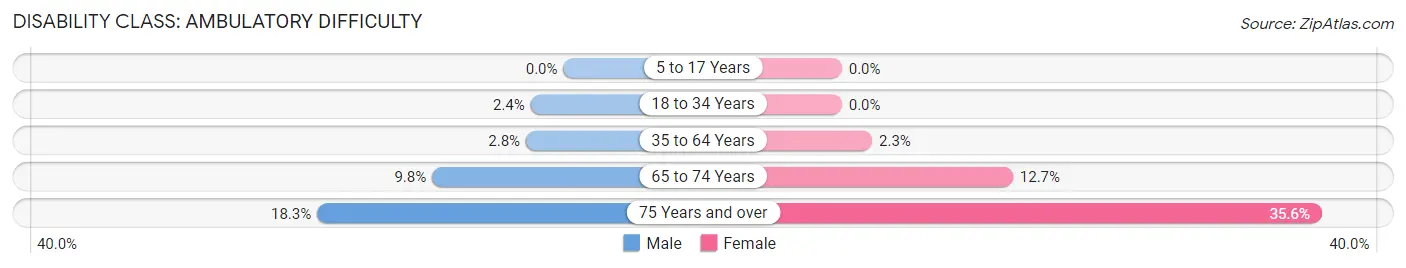
| Age Bracket | Male | Female |
| 5 to 17 Years | 0 (0.0%) | 0 (0.0%) |
| 18 to 34 Years | 16 (2.4%) | 0 (0.0%) |
| 35 to 64 Years | 42 (2.8%) | 34 (2.2%) |
| 65 to 74 Years | 31 (9.8%) | 24 (12.7%) |
| 75 Years and over | 15 (18.3%) | 62 (35.6%) |
Disability Class: Self-Care Difficulty
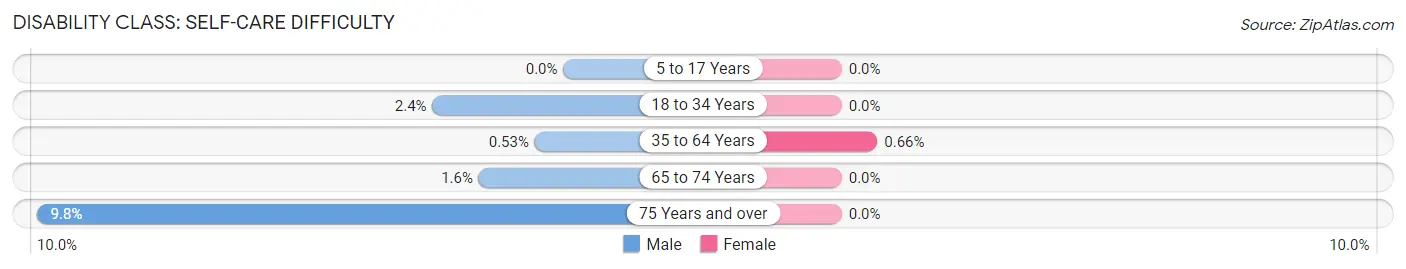
| Age Bracket | Male | Female |
| 5 to 17 Years | 0 (0.0%) | 0 (0.0%) |
| 18 to 34 Years | 16 (2.4%) | 0 (0.0%) |
| 35 to 64 Years | 8 (0.5%) | 10 (0.7%) |
| 65 to 74 Years | 5 (1.6%) | 0 (0.0%) |
| 75 Years and over | 8 (9.8%) | 0 (0.0%) |
Technology Access in Yorketown
Computing Device Access in Yorketown
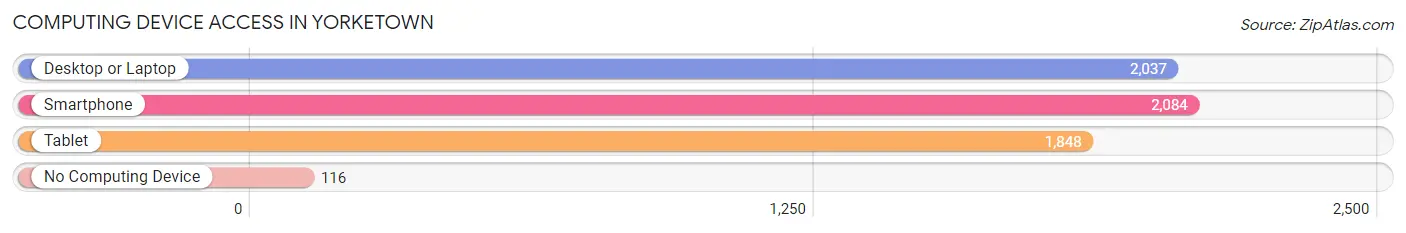
| Device Type | # Households | % Households |
| Desktop or Laptop | 2,037 | 92.0% |
| Smartphone | 2,084 | 94.1% |
| Tablet | 1,848 | 83.4% |
| No Computing Device | 116 | 5.2% |
| Total | 2,215 | 100.0% |
Internet Access in Yorketown
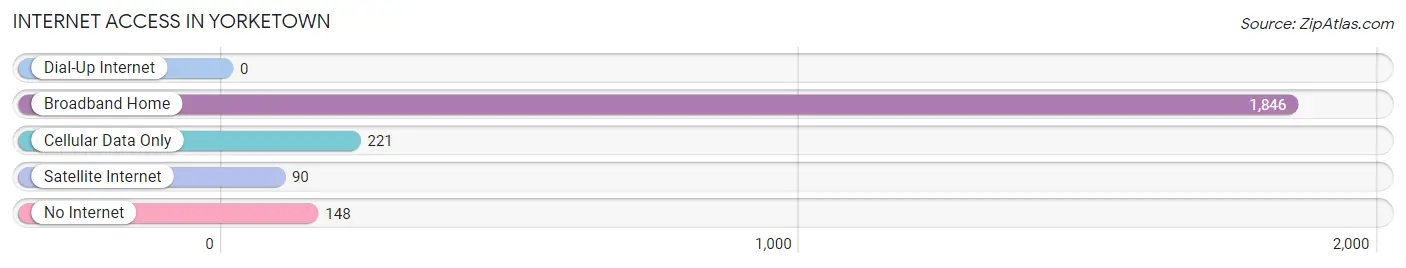
| Internet Type | # Households | % Households |
| Dial-Up Internet | 0 | 0.0% |
| Broadband Home | 1,846 | 83.3% |
| Cellular Data Only | 221 | 10.0% |
| Satellite Internet | 90 | 4.1% |
| No Internet | 148 | 6.7% |
| Total | 2,215 | 100.0% |
Yorketown Summary
History
Yorketown, NJ is a small town located in Morris County, New Jersey. It was originally settled in 1720 by a group of Dutch settlers who named it after their hometown of Yorketown, Holland. The town was officially incorporated in 1845 and has since grown to a population of approximately 4,000 people.
The town has a rich history of industry and agriculture. In the early 19th century, the town was home to a number of mills, including a paper mill, a grist mill, and a saw mill. These mills provided employment for many of the town’s residents and helped to fuel the local economy.
In the late 19th century, the town began to transition from an agricultural economy to a more industrial one. The town was home to a number of factories, including a silk mill, a shoe factory, and a hat factory. These factories provided employment for many of the town’s residents and helped to fuel the local economy.
The town also had a thriving dairy industry. In the early 20th century, the town was home to a number of dairy farms, which provided milk and other dairy products to the local population.
Geography
Yorketown, NJ is located in Morris County, New Jersey. It is situated in the northern part of the state, approximately 40 miles from New York City. The town is bordered by the towns of Randolph, Mendham, and Chester.
The town is situated on the banks of the Passaic River, which provides a natural border between Morris County and Essex County. The town is also located near the Great Swamp National Wildlife Refuge, which is a popular destination for birdwatchers and nature lovers.
The town is located in a region of rolling hills and valleys, with the highest point in the town being the summit of Mount Pleasant, which is approximately 1,000 feet above sea level. The town is also home to a number of lakes, including Lake Hopatcong, which is the largest lake in the state.
Economy
Yorketown, NJ has a diverse economy that is largely driven by the service sector. The town is home to a number of small businesses, including restaurants, retail stores, and professional services. The town is also home to a number of larger employers, including a hospital, a college, and a number of manufacturing companies.
The town is also home to a number of tourist attractions, including the Great Swamp National Wildlife Refuge, which attracts visitors from all over the country. The town is also home to a number of historic sites, including the Morris County Courthouse, which was built in 1790.
Demographics
As of the 2010 census, the population of Yorketown, NJ was 4,039. The town has a population that is largely white (90.2%), with a small percentage of African Americans (3.2%), Asians (2.2%), and Hispanics (2.2%). The median household income in the town is $76,945, which is higher than the state average of $68,342.
The town has a higher than average rate of homeownership, with approximately 75% of the population owning their own homes. The town also has a higher than average rate of college graduates, with approximately 40% of the population having a bachelor’s degree or higher.
Conclusion
Yorketown, NJ is a small town located in Morris County, New Jersey. It has a rich history of industry and agriculture, and is now home to a diverse economy that is largely driven by the service sector. The town has a population that is largely white, with a median household income that is higher than the state average. The town also has a higher than average rate of homeownership and college graduates.
Common Questions
What is the Total Population of Yorketown?
Total Population of Yorketown is 7,206.
What is the Total Male Population of Yorketown?
Total Male Population of Yorketown is 3,509.
What is the Total Female Population of Yorketown?
Total Female Population of Yorketown is 3,697.
What is the Ratio of Males per 100 Females in Yorketown?
There are 94.91 Males per 100 Females in Yorketown.
What is the Ratio of Females per 100 Males in Yorketown?
There are 105.36 Females per 100 Males in Yorketown.
What is the Median Population Age in Yorketown?
Median Population Age in Yorketown is 37.0 Years.
What is the Average Family Size in Yorketown
Average Family Size in Yorketown is 3.6 People.
What is the Average Household Size in Yorketown
Average Household Size in Yorketown is 3.2 People.
What is Per Capita Income in Yorketown?
Per Capita income in Yorketown is $52,550.
What is the Median Family Income in Yorketown?
Median Family Income in Yorketown is $169,076.
What is the Median Household income in Yorketown?
Median Household Income in Yorketown is $156,838.
What is Income or Wage Gap in Yorketown?
Income or Wage Gap in Yorketown is 51.0%.
Women in Yorketown earn 49.0 cents for every dollar earned by a man.
What is Inequality or Gini Index in Yorketown?
Inequality or Gini Index in Yorketown is 0.36.
How Large is the Labor Force in Yorketown?
There are 3,771 People in the Labor Forcein in Yorketown.
What is the Percentage of People in the Labor Force in Yorketown?
69.3% of People are in the Labor Force in Yorketown.
What is the Unemployment Rate in Yorketown?
Unemployment Rate in Yorketown is 3.6%.