Rumson borough, NJ
Rumson borough Overview
7,285
TOTAL POPULATION
3,927
MALE POPULATION
3,358
FEMALE POPULATION
116.94
MALES / 100 FEMALES
85.51
FEMALES / 100 MALES
43.1
MEDIAN AGE
3.5
AVG FAMILY SIZE
3.2
AVG HOUSEHOLD SIZE
$136,277
PER CAPITA INCOME
$250,001
AVG FAMILY INCOME
$250,001
AVG HOUSEHOLD INCOME
71.9%
WAGE / INCOME GAP [ % ]
28.1¢/ $1
WAGE / INCOME GAP [ $ ]
0.52
INEQUALITY / GINI INDEX
3,448
LABOR FORCE [ PEOPLE ]
62.1%
PERCENT IN LABOR FORCE
5.2%
UNEMPLOYMENT RATE
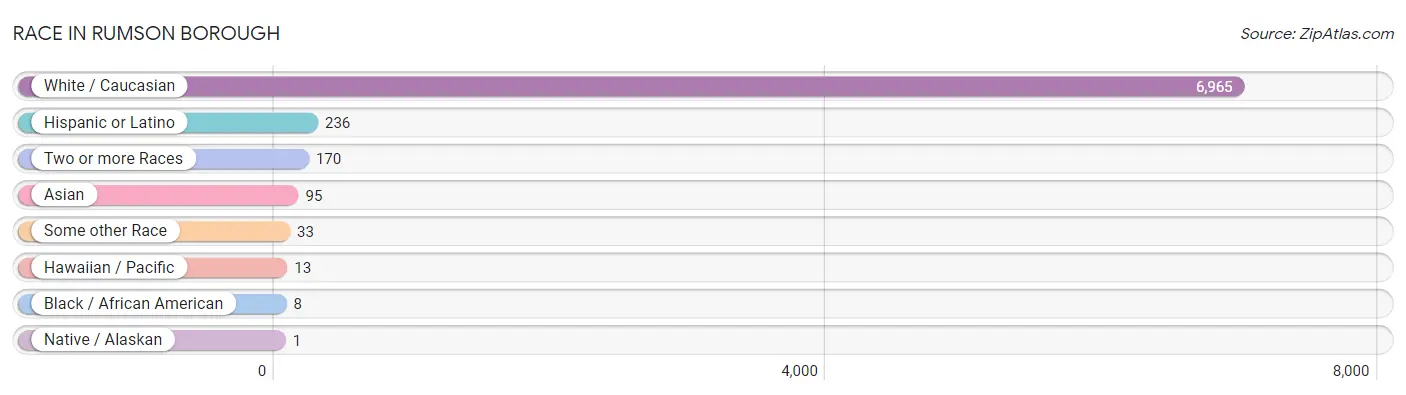
Race in Rumson borough
The most populous races in Rumson borough are White / Caucasian (6,965 | 95.6%), Hispanic or Latino (236 | 3.2%), and Two or more Races (170 | 2.3%).
| Race | # Population | % Population |
| Asian | 95 | 1.3% |
| Black / African American | 8 | 0.1% |
| Hawaiian / Pacific | 13 | 0.2% |
| Hispanic or Latino | 236 | 3.2% |
| Native / Alaskan | 1 | 0.0% |
| White / Caucasian | 6,965 | 95.6% |
| Two or more Races | 170 | 2.3% |
| Some other Race | 33 | 0.4% |
| Total | 7,285 | 100.0% |
Ancestry in Rumson borough
The most populous ancestries reported in Rumson borough are Italian (2,067 | 28.4%), Irish (1,712 | 23.5%), German (947 | 13.0%), American (641 | 8.8%), and English (376 | 5.2%), together accounting for 78.8% of all Rumson borough residents.

| Ancestry | # Population | % Population |
| Albanian | 32 | 0.4% |
| American | 641 | 8.8% |
| Arab | 176 | 2.4% |
| Armenian | 93 | 1.3% |
| Austrian | 80 | 1.1% |
| Belgian | 9 | 0.1% |
| British | 77 | 1.1% |
| Burmese | 38 | 0.5% |
| Canadian | 7 | 0.1% |
| Chilean | 21 | 0.3% |
| Colombian | 100 | 1.4% |
| Croatian | 32 | 0.4% |
| Czech | 115 | 1.6% |
| Czechoslovakian | 21 | 0.3% |
| Danish | 7 | 0.1% |
| Dominican | 1 | 0.0% |
| Dutch | 36 | 0.5% |
| Eastern European | 42 | 0.6% |
| English | 376 | 5.2% |
| European | 84 | 1.1% |
| Finnish | 8 | 0.1% |
| French | 124 | 1.7% |
| German | 947 | 13.0% |
| Greek | 74 | 1.0% |
| Guamanian / Chamorro | 13 | 0.2% |
| Hungarian | 216 | 3.0% |
| Indian (Asian) | 89 | 1.2% |
| Iranian | 7 | 0.1% |
| Iraqi | 134 | 1.8% |
| Irish | 1,712 | 23.5% |
| Israeli | 10 | 0.1% |
| Italian | 2,067 | 28.4% |
| Lebanese | 166 | 2.3% |
| Lithuanian | 20 | 0.3% |
| Mexican | 56 | 0.8% |
| Northern European | 105 | 1.4% |
| Norwegian | 31 | 0.4% |
| Pakistani | 31 | 0.4% |
| Polish | 290 | 4.0% |
| Portuguese | 6 | 0.1% |
| Puerto Rican | 36 | 0.5% |
| Romanian | 17 | 0.2% |
| Russian | 96 | 1.3% |
| Scotch-Irish | 21 | 0.3% |
| Scottish | 96 | 1.3% |
| Slavic | 11 | 0.2% |
| South American | 135 | 1.8% |
| Swedish | 68 | 0.9% |
| Thai | 44 | 0.6% |
| Ukrainian | 51 | 0.7% |
| Venezuelan | 14 | 0.2% |
| Welsh | 9 | 0.1% |
| West Indian | 9 | 0.1% |
| Yugoslavian | 11 | 0.2% | View All 54 Rows |
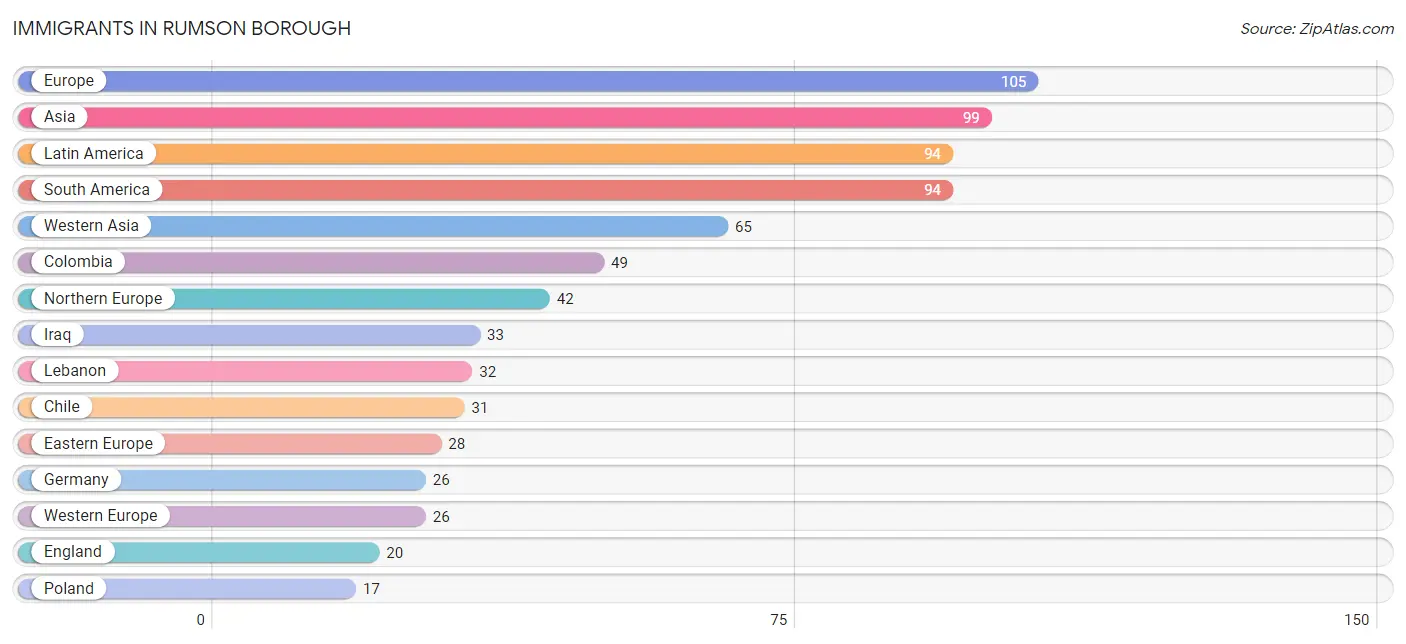
Immigrants in Rumson borough
The most numerous immigrant groups reported in Rumson borough came from Europe (105 | 1.4%), Asia (99 | 1.4%), Latin America (94 | 1.3%), South America (94 | 1.3%), and Western Asia (65 | 0.9%), together accounting for 6.3% of all Rumson borough residents.
| Immigration Origin | # Population | % Population |
| Africa | 12 | 0.2% |
| Asia | 99 | 1.4% |
| Canada | 11 | 0.2% |
| Chile | 31 | 0.4% |
| China | 7 | 0.1% |
| Colombia | 49 | 0.7% |
| Eastern Africa | 2 | 0.0% |
| Eastern Asia | 13 | 0.2% |
| Eastern Europe | 28 | 0.4% |
| Egypt | 10 | 0.1% |
| England | 20 | 0.3% |
| Europe | 105 | 1.4% |
| Germany | 26 | 0.4% |
| Iran | 11 | 0.2% |
| Iraq | 33 | 0.4% |
| Ireland | 11 | 0.2% |
| Italy | 9 | 0.1% |
| Korea | 6 | 0.1% |
| Latin America | 94 | 1.3% |
| Lebanon | 32 | 0.4% |
| Northern Africa | 10 | 0.1% |
| Northern Europe | 42 | 0.6% |
| Poland | 17 | 0.2% |
| Romania | 11 | 0.2% |
| Scotland | 9 | 0.1% |
| South America | 94 | 1.3% |
| South Central Asia | 11 | 0.2% |
| South Eastern Asia | 10 | 0.1% |
| Southern Europe | 9 | 0.1% |
| Thailand | 10 | 0.1% |
| Venezuela | 14 | 0.2% |
| Western Asia | 65 | 0.9% |
| Western Europe | 26 | 0.4% |
| Zimbabwe | 2 | 0.0% | View All 34 Rows |
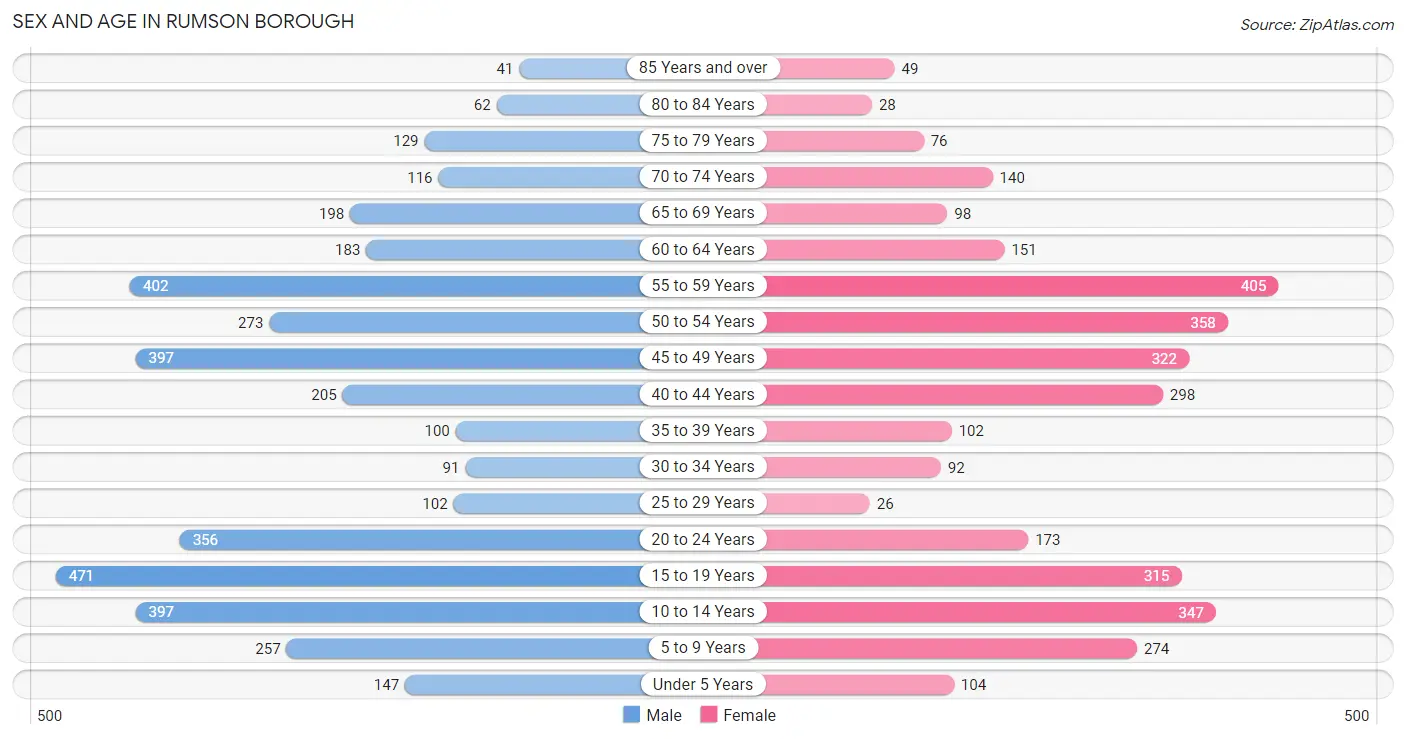
Sex and Age in Rumson borough
Sex and Age in Rumson borough
The most populous age groups in Rumson borough are 15 to 19 Years (471 | 12.0%) for men and 55 to 59 Years (405 | 12.1%) for women.
| Age Bracket | Male | Female |
| Under 5 Years | 147 (3.7%) | 104 (3.1%) |
| 5 to 9 Years | 257 (6.5%) | 274 (8.2%) |
| 10 to 14 Years | 397 (10.1%) | 347 (10.3%) |
| 15 to 19 Years | 471 (12.0%) | 315 (9.4%) |
| 20 to 24 Years | 356 (9.1%) | 173 (5.1%) |
| 25 to 29 Years | 102 (2.6%) | 26 (0.8%) |
| 30 to 34 Years | 91 (2.3%) | 92 (2.7%) |
| 35 to 39 Years | 100 (2.5%) | 102 (3.0%) |
| 40 to 44 Years | 205 (5.2%) | 298 (8.9%) |
| 45 to 49 Years | 397 (10.1%) | 322 (9.6%) |
| 50 to 54 Years | 273 (7.0%) | 358 (10.7%) |
| 55 to 59 Years | 402 (10.2%) | 405 (12.1%) |
| 60 to 64 Years | 183 (4.7%) | 151 (4.5%) |
| 65 to 69 Years | 198 (5.0%) | 98 (2.9%) |
| 70 to 74 Years | 116 (2.9%) | 140 (4.2%) |
| 75 to 79 Years | 129 (3.3%) | 76 (2.3%) |
| 80 to 84 Years | 62 (1.6%) | 28 (0.8%) |
| 85 Years and over | 41 (1.0%) | 49 (1.5%) |
| Total | 3,927 (100.0%) | 3,358 (100.0%) |
Families and Households in Rumson borough
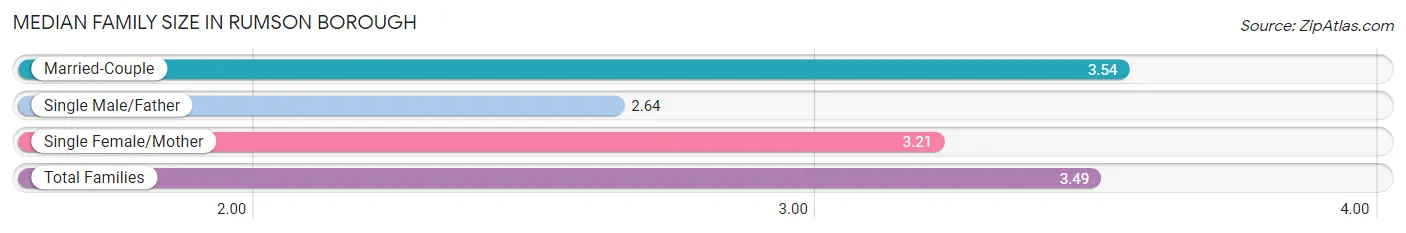
Median Family Size in Rumson borough
The median family size in Rumson borough is 3.49 persons per family, with married-couple families (1,700 | 89.1%) accounting for the largest median family size of 3.54 persons per family. On the other hand, single male/father families (66 | 3.5%) represent the smallest median family size with 2.64 persons per family.
| Family Type | # Families | Family Size |
| Married-Couple | 1,700 (89.1%) | 3.54 |
| Single Male/Father | 66 (3.5%) | 2.64 |
| Single Female/Mother | 141 (7.4%) | 3.21 |
| Total Families | 1,907 (100.0%) | 3.49 |
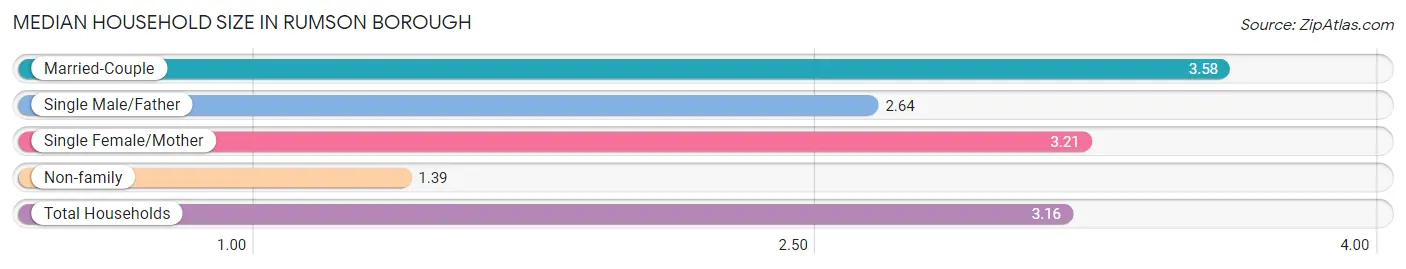
Median Household Size in Rumson borough
The median household size in Rumson borough is 3.16 persons per household, with married-couple households (1,700 | 73.8%) accounting for the largest median household size of 3.58 persons per household. non-family households (396 | 17.2%) represent the smallest median household size with 1.39 persons per household.
| Household Type | # Households | Household Size |
| Married-Couple | 1,700 (73.8%) | 3.58 |
| Single Male/Father | 66 (2.9%) | 2.64 |
| Single Female/Mother | 141 (6.1%) | 3.21 |
| Non-family | 396 (17.2%) | 1.39 |
| Total Households | 2,303 (100.0%) | 3.16 |
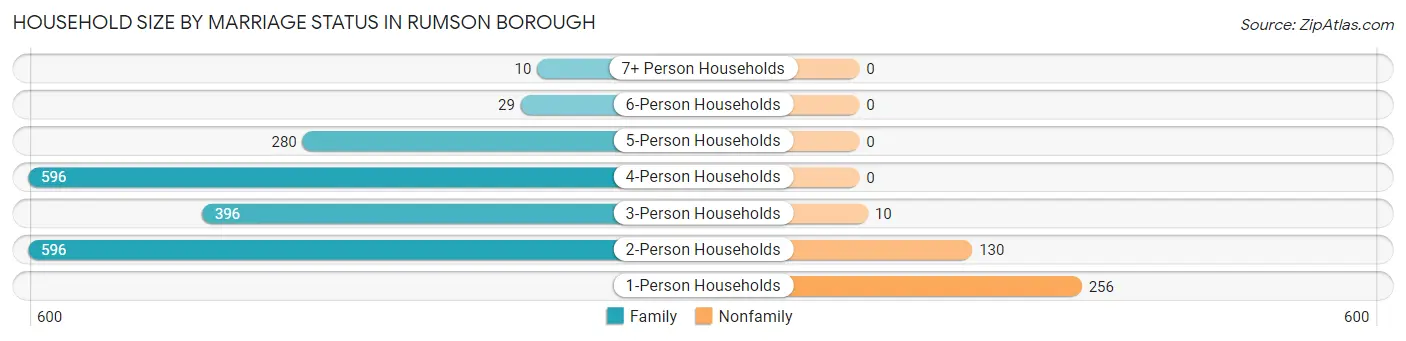
Household Size by Marriage Status in Rumson borough
Out of a total of 2,303 households in Rumson borough, 1,907 (82.8%) are family households, while 396 (17.2%) are nonfamily households. The most numerous type of family households are 2-person households, comprising 596, and the most common type of nonfamily households are 1-person households, comprising 256.
| Household Size | Family Households | Nonfamily Households |
| 1-Person Households | - | 256 (11.1%) |
| 2-Person Households | 596 (25.9%) | 130 (5.6%) |
| 3-Person Households | 396 (17.2%) | 10 (0.4%) |
| 4-Person Households | 596 (25.9%) | 0 (0.0%) |
| 5-Person Households | 280 (12.2%) | 0 (0.0%) |
| 6-Person Households | 29 (1.3%) | 0 (0.0%) |
| 7+ Person Households | 10 (0.4%) | 0 (0.0%) |
| Total | 1,907 (82.8%) | 396 (17.2%) |
Female Fertility in Rumson borough
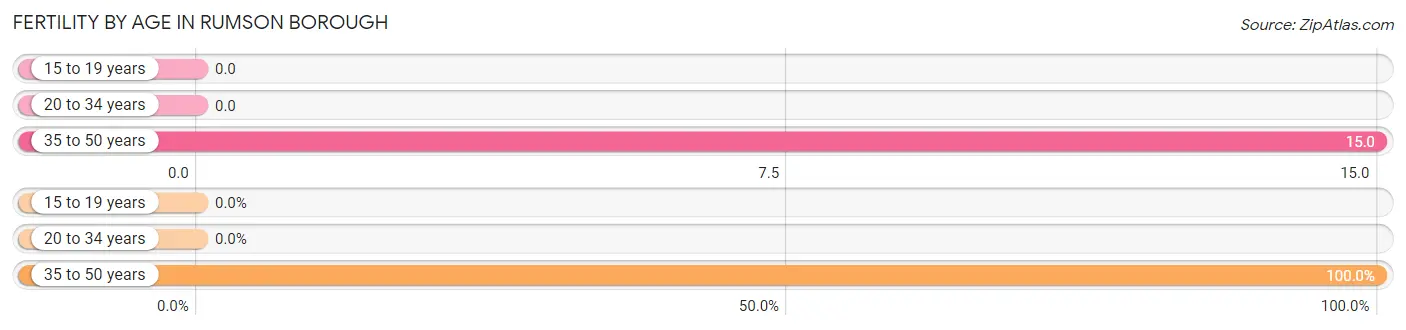
Fertility by Age in Rumson borough
Average fertility rate in Rumson borough is 8.0 births per 1,000 women. Women in the age bracket of 35 to 50 years have the highest fertility rate with 15.0 births per 1,000 women. Women in the age bracket of 35 to 50 years acount for 100.0% of all women with births.
| Age Bracket | Women with Births | Births / 1,000 Women |
| 15 to 19 years | 0 (0.0%) | 0.0 |
| 20 to 34 years | 0 (0.0%) | 0.0 |
| 35 to 50 years | 11 (100.0%) | 15.0 |
| Total | 11 (100.0%) | 8.0 |
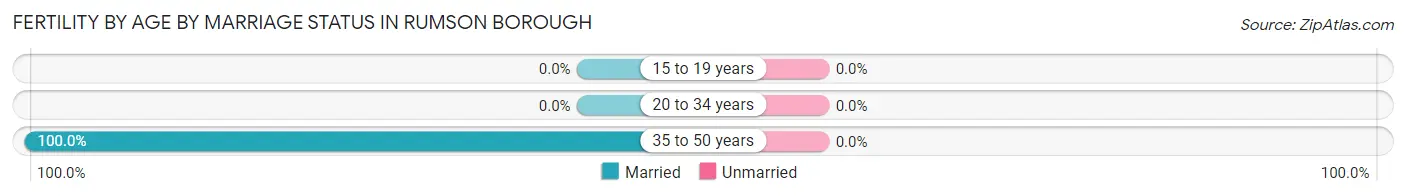
Fertility by Age by Marriage Status in Rumson borough
| Age Bracket | Married | Unmarried |
| 15 to 19 years | 0 (0.0%) | 0 (0.0%) |
| 20 to 34 years | 0 (0.0%) | 0 (0.0%) |
| 35 to 50 years | 11 (100.0%) | 0 (0.0%) |
| Total | 11 (100.0%) | 0 (0.0%) |
Fertility by Education in Rumson borough
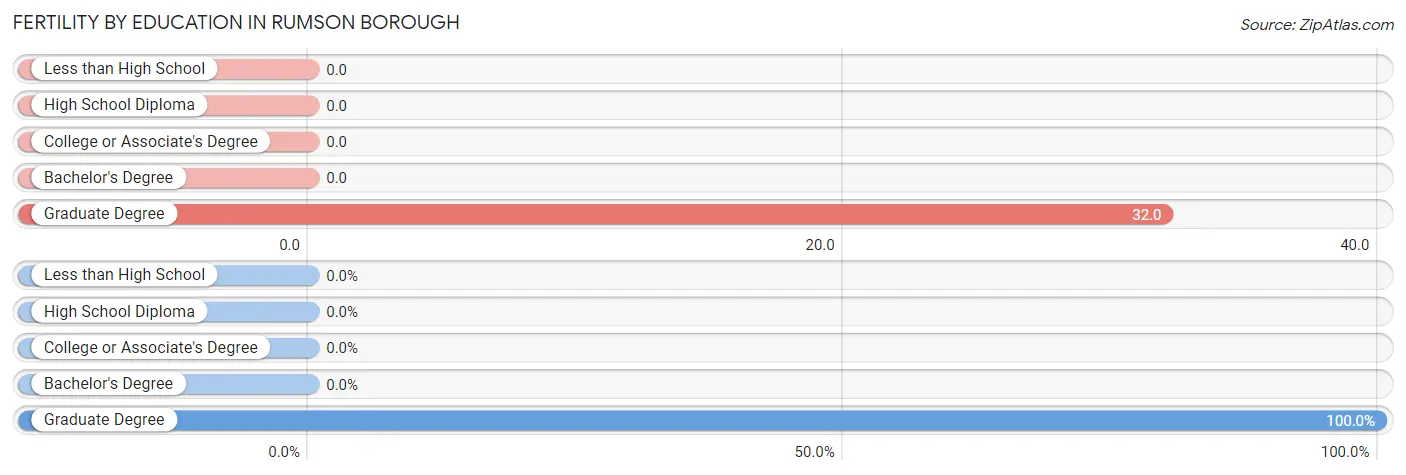
| Educational Attainment | Women with Births | Births / 1,000 Women |
| Less than High School | 0 (0.0%) | 0.0 |
| High School Diploma | 0 (0.0%) | 0.0 |
| College or Associate's Degree | 0 (0.0%) | 0.0 |
| Bachelor's Degree | 0 (0.0%) | 0.0 |
| Graduate Degree | 11 (100.0%) | 32.0 |
| Total | 11 (100.0%) | 8.0 |
Fertility by Education by Marriage Status in Rumson borough
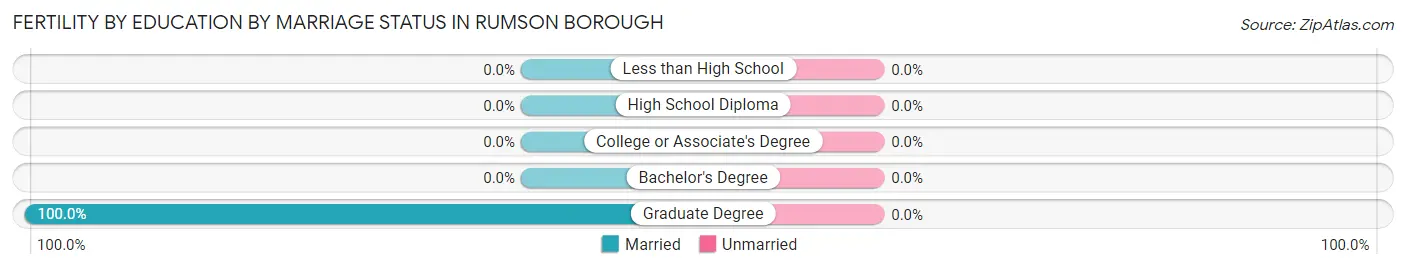
| Educational Attainment | Married | Unmarried |
| Less than High School | 0 (0.0%) | 0 (0.0%) |
| High School Diploma | 0 (0.0%) | 0 (0.0%) |
| College or Associate's Degree | 0 (0.0%) | 0 (0.0%) |
| Bachelor's Degree | 0 (0.0%) | 0 (0.0%) |
| Graduate Degree | 11 (100.0%) | 0 (0.0%) |
| Total | 11 (100.0%) | 0 (0.0%) |
Income in Rumson borough
Income Overview in Rumson borough
Per Capita Income in Rumson borough is $136,277, while median incomes of families and households are $250,001 and $250,001 respectively.
| Characteristic | Number | Measure |
| Per Capita Income | 7,285 | $136,277 |
| Median Family Income | 1,907 | $250,001 |
| Mean Family Income | 1,907 | $489,500 |
| Median Household Income | 2,303 | $250,001 |
| Mean Household Income | 2,303 | $424,834 |
| Income Deficit | 1,907 | $0 |
| Wage / Income Gap (%) | 7,285 | 71.93% |
| Wage / Income Gap ($) | 7,285 | 28.07¢ per $1 |
| Gini / Inequality Index | 7,285 | 0.52 |
Earnings by Sex in Rumson borough
Average Earnings in Rumson borough are $104,883, $170,133 for men and $47,759 for women, a difference of 71.9%.
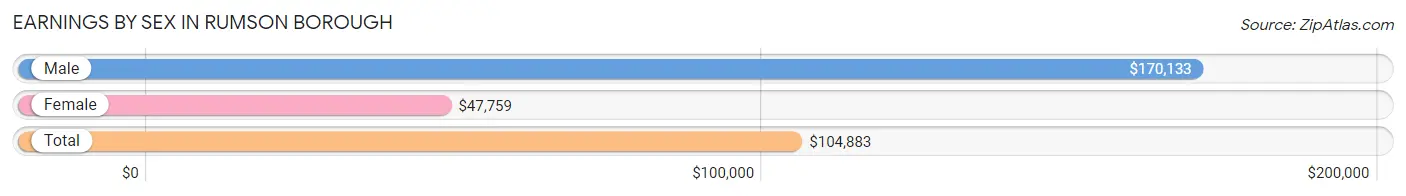
| Sex | Number | Average Earnings |
| Male | 2,295 (61.7%) | $170,133 |
| Female | 1,422 (38.3%) | $47,759 |
| Total | 3,717 (100.0%) | $104,883 |
Earnings by Sex by Income Bracket in Rumson borough
The most common earnings brackets in Rumson borough are $100,000+ for men (1,477 | 64.4%) and $100,000+ for women (423 | 29.7%).
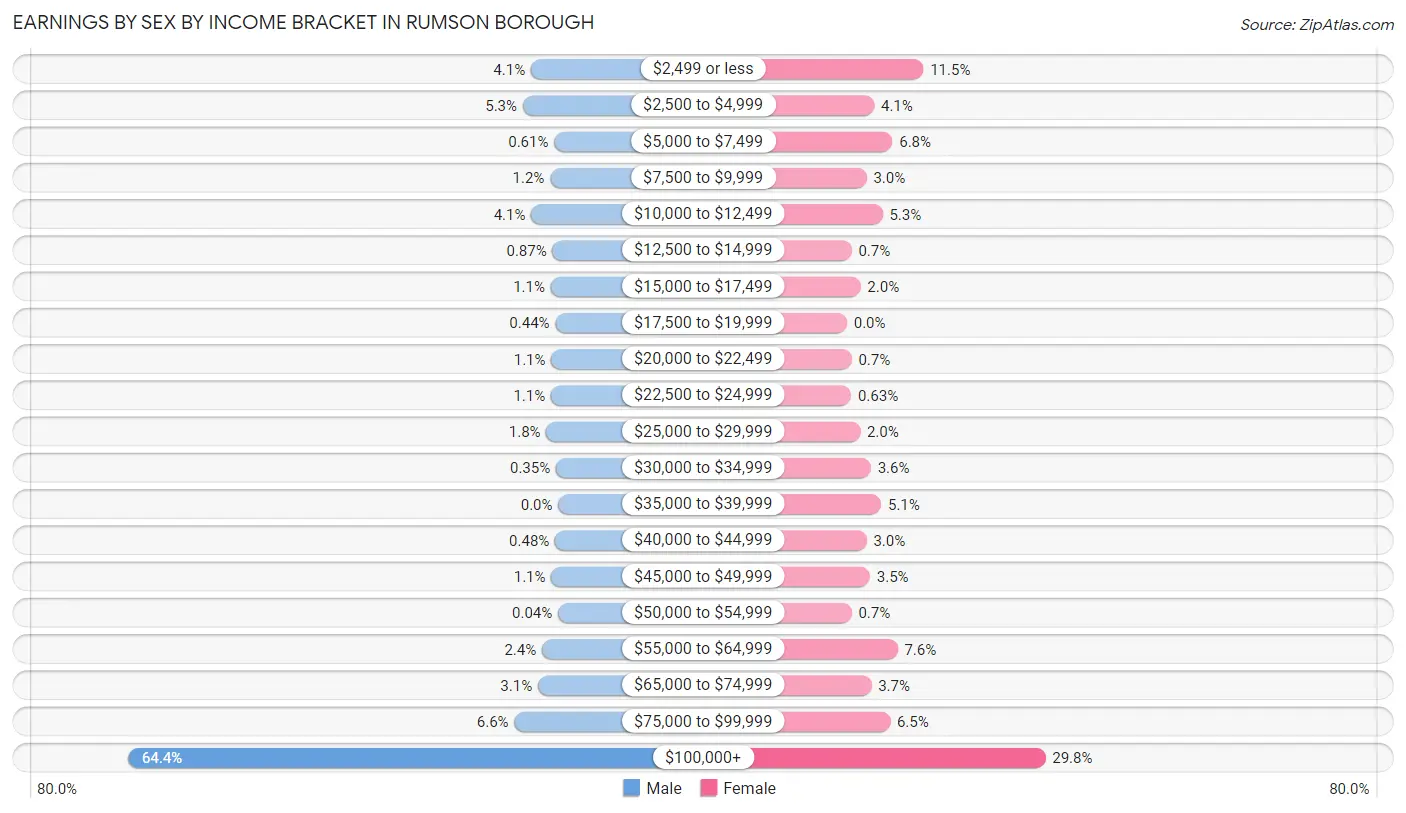
| Income | Male | Female |
| $2,499 or less | 94 (4.1%) | 163 (11.5%) |
| $2,500 to $4,999 | 122 (5.3%) | 58 (4.1%) |
| $5,000 to $7,499 | 14 (0.6%) | 97 (6.8%) |
| $7,500 to $9,999 | 28 (1.2%) | 42 (2.9%) |
| $10,000 to $12,499 | 93 (4.1%) | 76 (5.3%) |
| $12,500 to $14,999 | 20 (0.9%) | 10 (0.7%) |
| $15,000 to $17,499 | 26 (1.1%) | 29 (2.0%) |
| $17,500 to $19,999 | 10 (0.4%) | 0 (0.0%) |
| $20,000 to $22,499 | 24 (1.1%) | 10 (0.7%) |
| $22,500 to $24,999 | 25 (1.1%) | 9 (0.6%) |
| $25,000 to $29,999 | 41 (1.8%) | 28 (2.0%) |
| $30,000 to $34,999 | 8 (0.4%) | 51 (3.6%) |
| $35,000 to $39,999 | 0 (0.0%) | 73 (5.1%) |
| $40,000 to $44,999 | 11 (0.5%) | 42 (2.9%) |
| $45,000 to $49,999 | 24 (1.1%) | 49 (3.5%) |
| $50,000 to $54,999 | 1 (0.0%) | 10 (0.7%) |
| $55,000 to $64,999 | 56 (2.4%) | 108 (7.6%) |
| $65,000 to $74,999 | 70 (3.0%) | 52 (3.7%) |
| $75,000 to $99,999 | 151 (6.6%) | 92 (6.5%) |
| $100,000+ | 1,477 (64.4%) | 423 (29.7%) |
| Total | 2,295 (100.0%) | 1,422 (100.0%) |
Earnings by Sex by Educational Attainment in Rumson borough
Average earnings in Rumson borough are $207,644 for men and $65,066 for women, a difference of 68.7%. Men with an educational attainment of graduate degree enjoy the highest average annual earnings of $250,001, while those with high school diploma education earn the least with $73,333. Women with an educational attainment of graduate degree earn the most with the average annual earnings of $90,909, while those with bachelor's degree education have the smallest earnings of $55,197.
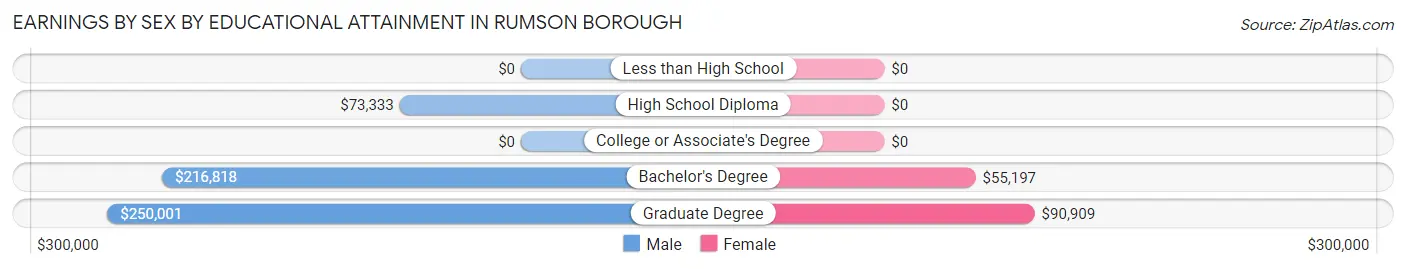
| Educational Attainment | Male Income | Female Income |
| Less than High School | - | - |
| High School Diploma | $73,333 | $0 |
| College or Associate's Degree | - | - |
| Bachelor's Degree | $216,818 | $55,197 |
| Graduate Degree | $250,001 | $90,909 |
| Total | $207,644 | $65,066 |
Family Income in Rumson borough
Family Income Brackets in Rumson borough
According to the Rumson borough family income data, there are 1,306 families falling into the $200,000+ income range, which is the most common income bracket and makes up 68.5% of all families.
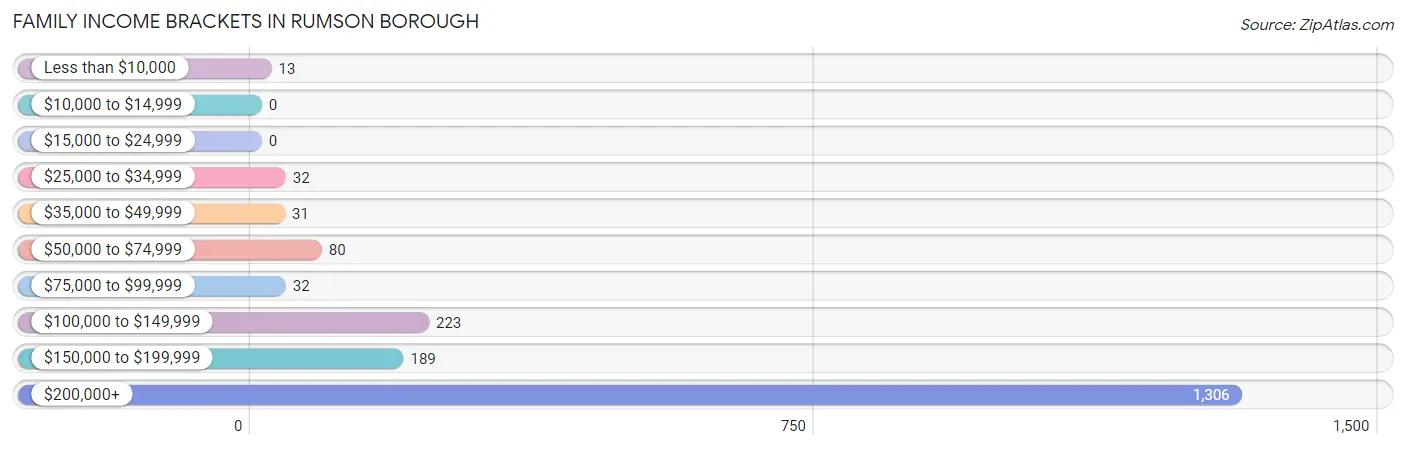
| Income Bracket | # Families | % Families |
| Less than $10,000 | 13 | 0.7% |
| $10,000 to $14,999 | 0 | 0.0% |
| $15,000 to $24,999 | 0 | 0.0% |
| $25,000 to $34,999 | 32 | 1.7% |
| $35,000 to $49,999 | 31 | 1.6% |
| $50,000 to $74,999 | 80 | 4.2% |
| $75,000 to $99,999 | 32 | 1.7% |
| $100,000 to $149,999 | 223 | 11.7% |
| $150,000 to $199,999 | 189 | 9.9% |
| $200,000+ | 1,306 | 68.5% |
Family Income by Famaliy Size in Rumson borough
4-person families (612 | 32.1%) account for the highest median family income in Rumson borough with $250,001 per family, while 2-person families (596 | 31.2%) have the highest median income of $100,312 per family member.
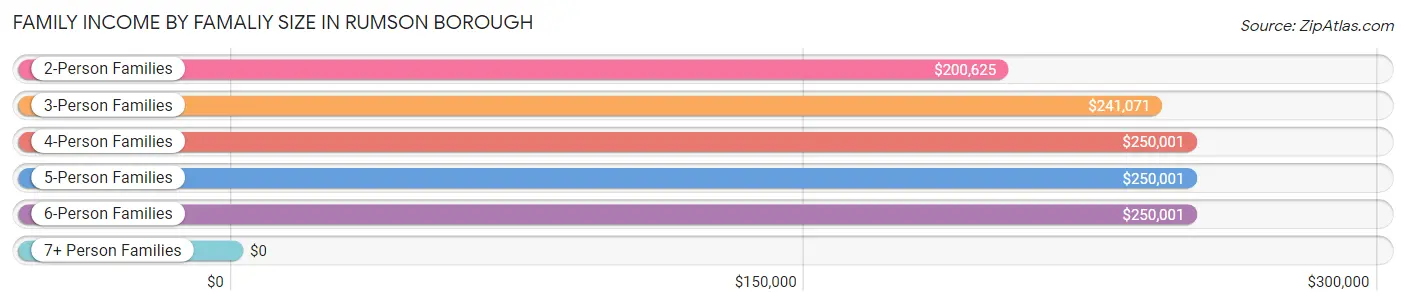
| Income Bracket | # Families | Median Income |
| 2-Person Families | 596 (31.2%) | $200,625 |
| 3-Person Families | 396 (20.8%) | $241,071 |
| 4-Person Families | 612 (32.1%) | $250,001 |
| 5-Person Families | 280 (14.7%) | $250,001 |
| 6-Person Families | 23 (1.2%) | $250,001 |
| 7+ Person Families | 0 (0.0%) | $0 |
| Total | 1,907 (100.0%) | $250,001 |
Family Income by Number of Earners in Rumson borough
The median family income in Rumson borough is $250,001, with families comprising 1 earner (697) having the highest median family income of $250,001, while families with no earners (185) have the lowest median family income of $137,375, accounting for 36.5% and 9.7% of families, respectively.
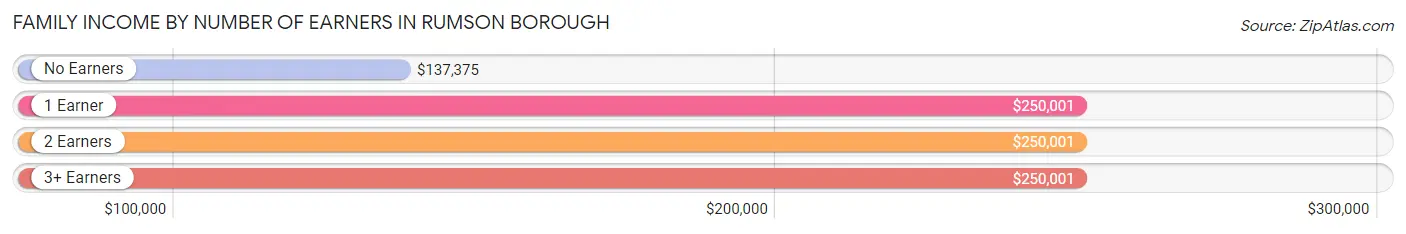
| Number of Earners | # Families | Median Income |
| No Earners | 185 (9.7%) | $137,375 |
| 1 Earner | 697 (36.5%) | $250,001 |
| 2 Earners | 739 (38.8%) | $250,001 |
| 3+ Earners | 286 (15.0%) | $250,001 |
| Total | 1,907 (100.0%) | $250,001 |
Household Income in Rumson borough
Household Income Brackets in Rumson borough
With 1,368 households falling in the category, the $200,000+ income range is the most frequent in Rumson borough, accounting for 59.4% of all households. In contrast, only 32 households (1.4%) fall into the less than $10,000 income bracket, making it the least populous group.
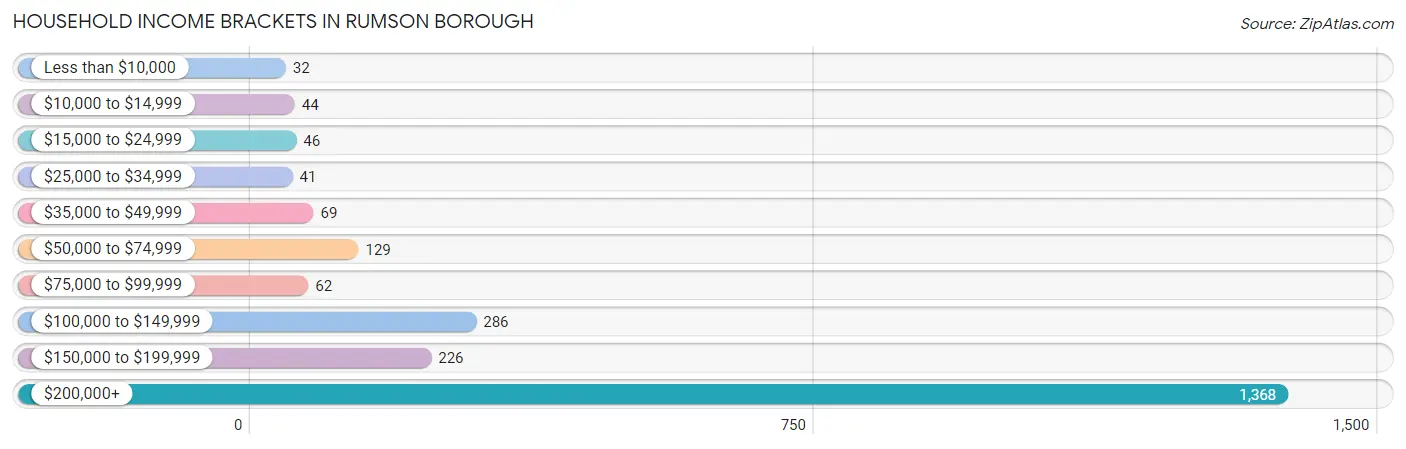
| Income Bracket | # Households | % Households |
| Less than $10,000 | 32 | 1.4% |
| $10,000 to $14,999 | 44 | 1.9% |
| $15,000 to $24,999 | 46 | 2.0% |
| $25,000 to $34,999 | 41 | 1.8% |
| $35,000 to $49,999 | 69 | 3.0% |
| $50,000 to $74,999 | 129 | 5.6% |
| $75,000 to $99,999 | 62 | 2.7% |
| $100,000 to $149,999 | 286 | 12.4% |
| $150,000 to $199,999 | 226 | 9.8% |
| $200,000+ | 1,368 | 59.4% |
Household Income by Householder Age in Rumson borough
The median household income in Rumson borough is $250,001, with the highest median household income of $250,001 found in the 25 to 44 years age bracket for the primary householder. A total of 387 households (16.8%) fall into this category. Meanwhile, the 15 to 24 years age bracket for the primary householder has the lowest median household income of $0, with 9 households (0.4%) in this group.
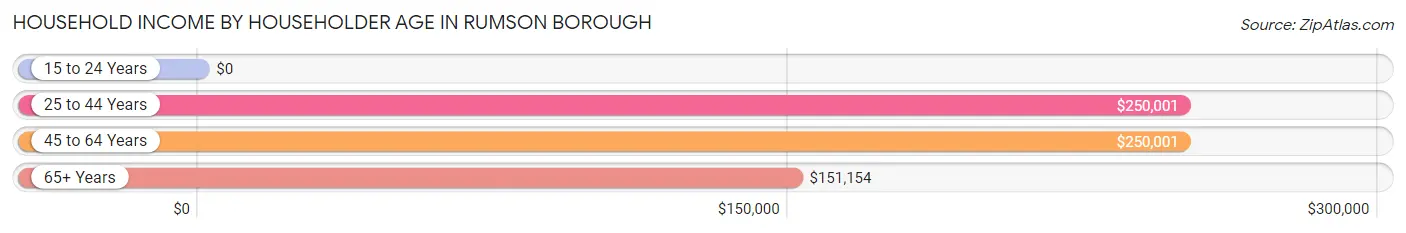
| Income Bracket | # Households | Median Income |
| 15 to 24 Years | 9 (0.4%) | $0 |
| 25 to 44 Years | 387 (16.8%) | $250,001 |
| 45 to 64 Years | 1,357 (58.9%) | $250,001 |
| 65+ Years | 550 (23.9%) | $151,154 |
| Total | 2,303 (100.0%) | $250,001 |
Poverty in Rumson borough
Income Below Poverty by Sex and Age in Rumson borough
With 4.2% poverty level for males and 2.9% for females among the residents of Rumson borough, 25 to 34 year old males and 25 to 34 year old females are the most vulnerable to poverty, with 27 males (14.0%) and 46 females (39.0%) in their respective age groups living below the poverty level.
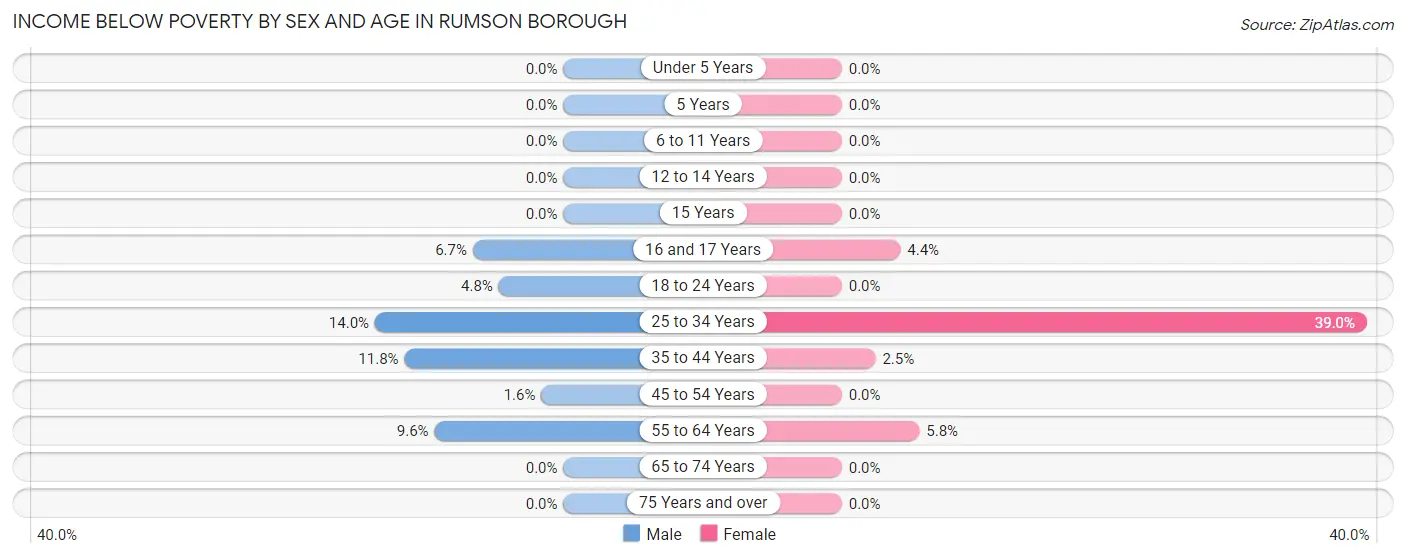
| Age Bracket | Male | Female |
| Under 5 Years | 0 (0.0%) | 0 (0.0%) |
| 5 Years | 0 (0.0%) | 0 (0.0%) |
| 6 to 11 Years | 0 (0.0%) | 0 (0.0%) |
| 12 to 14 Years | 0 (0.0%) | 0 (0.0%) |
| 15 Years | 0 (0.0%) | 0 (0.0%) |
| 16 and 17 Years | 8 (6.7%) | 9 (4.3%) |
| 18 to 24 Years | 27 (4.8%) | 0 (0.0%) |
| 25 to 34 Years | 27 (14.0%) | 46 (39.0%) |
| 35 to 44 Years | 36 (11.8%) | 10 (2.5%) |
| 45 to 54 Years | 11 (1.6%) | 0 (0.0%) |
| 55 to 64 Years | 56 (9.6%) | 32 (5.8%) |
| 65 to 74 Years | 0 (0.0%) | 0 (0.0%) |
| 75 Years and over | 0 (0.0%) | 0 (0.0%) |
| Total | 165 (4.2%) | 97 (2.9%) |
Income Above Poverty by Sex and Age in Rumson borough
According to the poverty statistics in Rumson borough, males aged under 5 years and females aged under 5 years are the age groups that are most secure financially, with 100.0% of males and 100.0% of females in these age groups living above the poverty line.
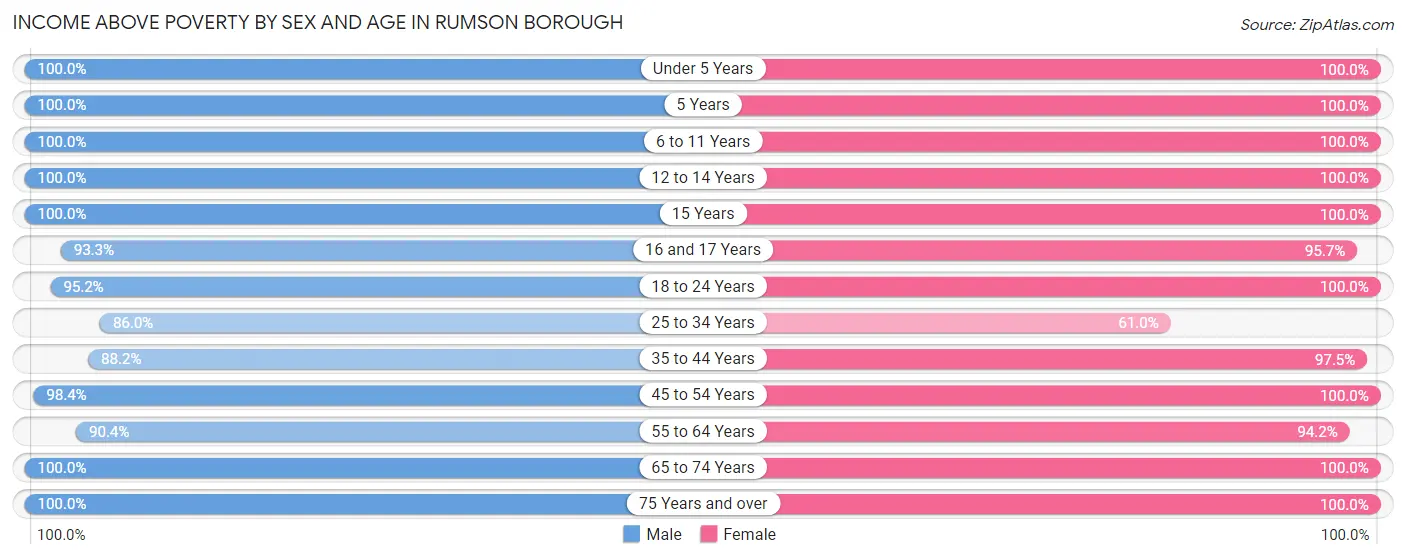
| Age Bracket | Male | Female |
| Under 5 Years | 109 (100.0%) | 104 (100.0%) |
| 5 Years | 36 (100.0%) | 81 (100.0%) |
| 6 to 11 Years | 355 (100.0%) | 297 (100.0%) |
| 12 to 14 Years | 263 (100.0%) | 243 (100.0%) |
| 15 Years | 146 (100.0%) | 61 (100.0%) |
| 16 and 17 Years | 111 (93.3%) | 198 (95.7%) |
| 18 to 24 Years | 535 (95.2%) | 220 (100.0%) |
| 25 to 34 Years | 166 (86.0%) | 72 (61.0%) |
| 35 to 44 Years | 269 (88.2%) | 390 (97.5%) |
| 45 to 54 Years | 659 (98.4%) | 680 (100.0%) |
| 55 to 64 Years | 529 (90.4%) | 524 (94.2%) |
| 65 to 74 Years | 314 (100.0%) | 238 (100.0%) |
| 75 Years and over | 232 (100.0%) | 153 (100.0%) |
| Total | 3,724 (95.8%) | 3,261 (97.1%) |
Income Below Poverty Among Married-Couple Families in Rumson borough
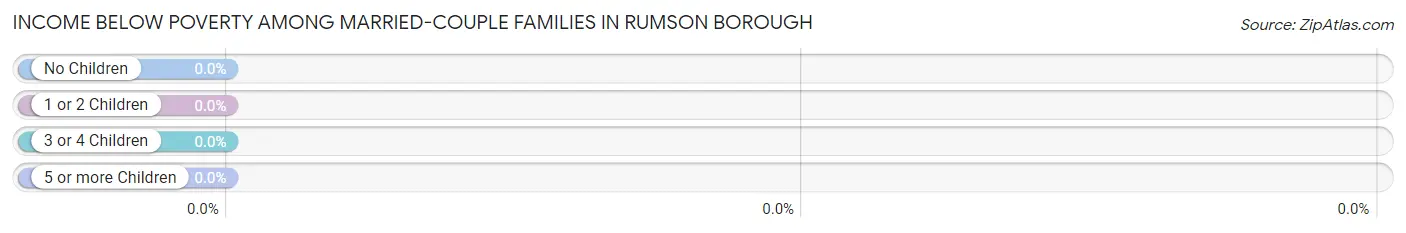
| Children | Above Poverty | Below Poverty |
| No Children | 779 (100.0%) | 0 (0.0%) |
| 1 or 2 Children | 715 (100.0%) | 0 (0.0%) |
| 3 or 4 Children | 206 (100.0%) | 0 (0.0%) |
| 5 or more Children | 0 (0.0%) | 0 (0.0%) |
| Total | 1,700 (100.0%) | 0 (0.0%) |
Income Below Poverty Among Single-Parent Households in Rumson borough
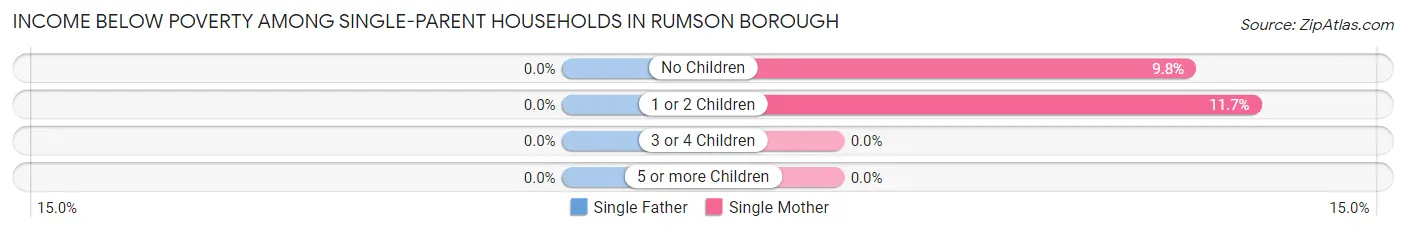
| Children | Single Father | Single Mother |
| No Children | 0 (0.0%) | 6 (9.8%) |
| 1 or 2 Children | 0 (0.0%) | 7 (11.7%) |
| 3 or 4 Children | 0 (0.0%) | 0 (0.0%) |
| 5 or more Children | 0 (0.0%) | 0 (0.0%) |
| Total | 0 (0.0%) | 13 (9.2%) |
Income Below Poverty Among Married-Couple vs Single-Parent Households in Rumson borough
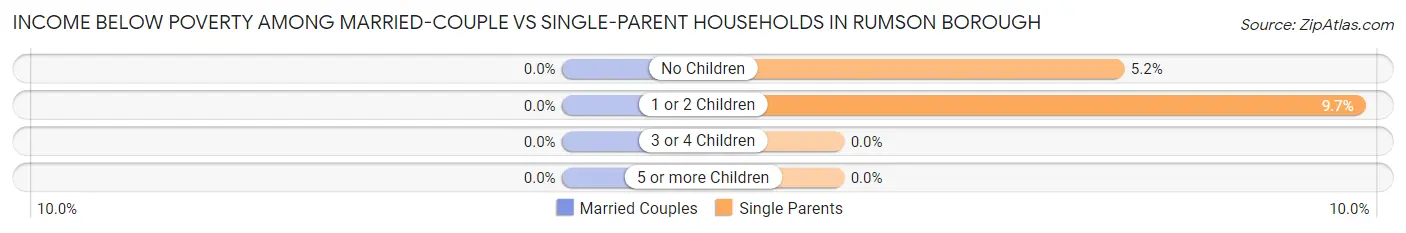
| Children | Married-Couple Families | Single-Parent Households |
| No Children | 0 (0.0%) | 6 (5.2%) |
| 1 or 2 Children | 0 (0.0%) | 7 (9.7%) |
| 3 or 4 Children | 0 (0.0%) | 0 (0.0%) |
| 5 or more Children | 0 (0.0%) | 0 (0.0%) |
| Total | 0 (0.0%) | 13 (6.3%) |
Employment Characteristics in Rumson borough
Employment by Class of Employer in Rumson borough
Among the 3,218 employed individuals in Rumson borough, private company employees (2,079 | 64.6%), local government employees (273 | 8.5%), and self-employed (incorporated) (259 | 8.1%) make up the most common classes of employment.
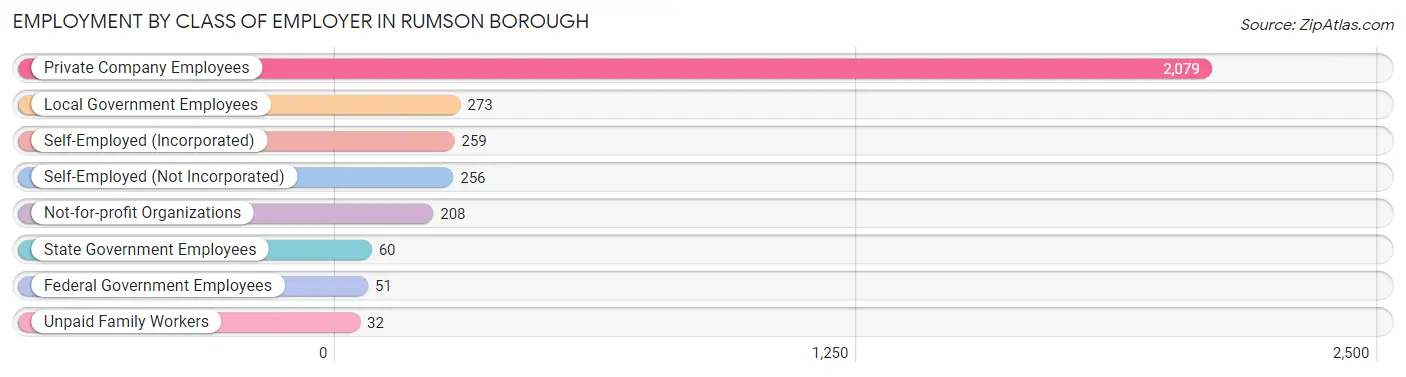
| Employer Class | # Employees | % Employees |
| Private Company Employees | 2,079 | 64.6% |
| Self-Employed (Incorporated) | 259 | 8.1% |
| Self-Employed (Not Incorporated) | 256 | 8.0% |
| Not-for-profit Organizations | 208 | 6.5% |
| Local Government Employees | 273 | 8.5% |
| State Government Employees | 60 | 1.9% |
| Federal Government Employees | 51 | 1.6% |
| Unpaid Family Workers | 32 | 1.0% |
| Total | 3,218 | 100.0% |
Employment Status by Age in Rumson borough
According to the labor force statistics for Rumson borough, out of the total population over 16 years of age (5,552), 62.1% or 3,448 individuals are in the labor force, with 5.2% or 179 of them unemployed. The age group with the highest labor force participation rate is 25 to 29 years, with 93.0% or 119 individuals in the labor force. Within the labor force, the 20 to 24 years age range has the highest percentage of unemployed individuals, with 23.0% or 62 of them being unemployed.
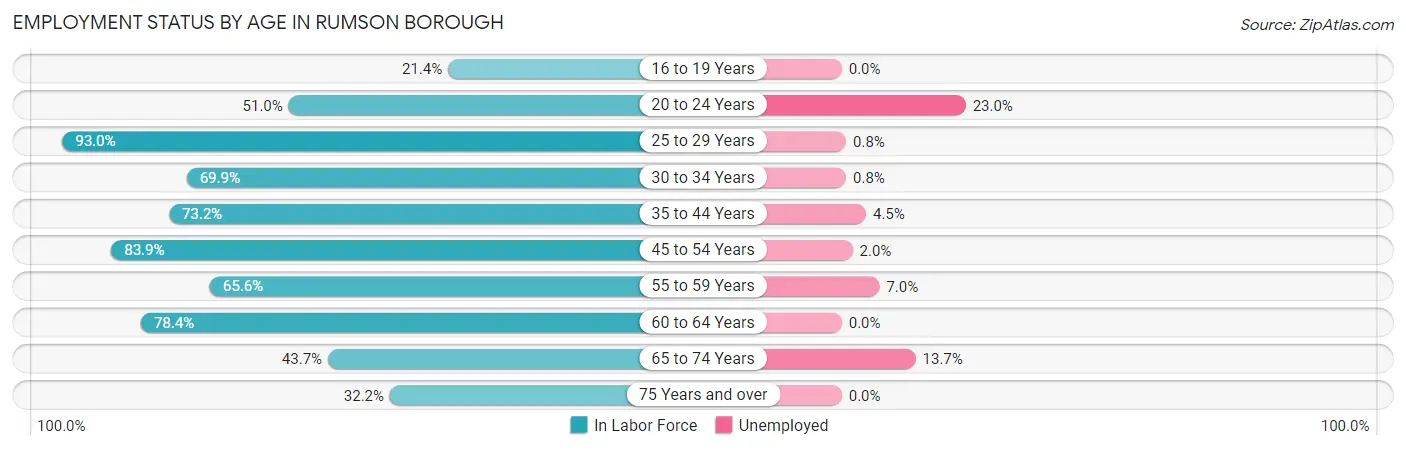
| Age Bracket | In Labor Force | Unemployed |
| 16 to 19 Years | 124 (21.4%) | 0 (0.0%) |
| 20 to 24 Years | 270 (51.0%) | 62 (23.0%) |
| 25 to 29 Years | 119 (93.0%) | 1 (0.8%) |
| 30 to 34 Years | 128 (69.9%) | 1 (0.8%) |
| 35 to 44 Years | 516 (73.2%) | 23 (4.5%) |
| 45 to 54 Years | 1,133 (83.9%) | 23 (2.0%) |
| 55 to 59 Years | 529 (65.6%) | 37 (7.0%) |
| 60 to 64 Years | 262 (78.4%) | 0 (0.0%) |
| 65 to 74 Years | 241 (43.7%) | 33 (13.7%) |
| 75 Years and over | 124 (32.2%) | 0 (0.0%) |
| Total | 3,448 (62.1%) | 179 (5.2%) |
Employment Status by Educational Attainment in Rumson borough
According to labor force statistics for Rumson borough, 76.6% of individuals (2,686) out of the total population between 25 and 64 years of age (3,507) are in the labor force, with 3.2% or 86 of them being unemployed. The group with the highest labor force participation rate are those with the educational attainment of less than high school, with 100.0% or 34 individuals in the labor force. Within the labor force, individuals with less than high school education have the highest percentage of unemployment, with 35.3% or 12 of them being unemployed.
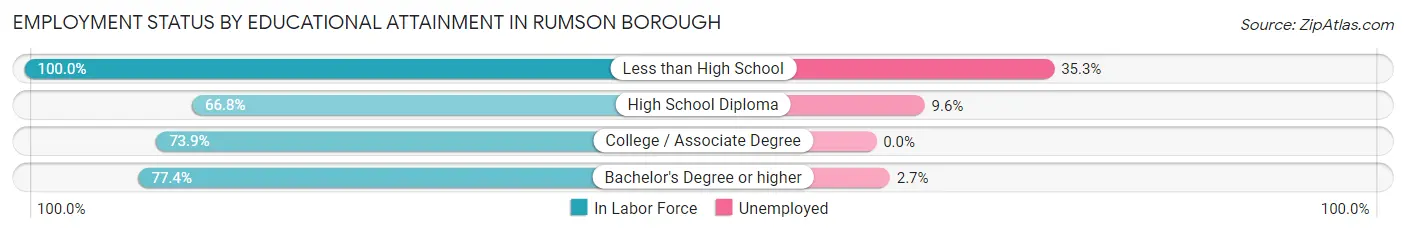
| Educational Attainment | In Labor Force | Unemployed |
| Less than High School | 34 (100.0%) | 12 (35.3%) |
| High School Diploma | 135 (66.8%) | 19 (9.6%) |
| College / Associate Degree | 315 (73.9%) | 0 (0.0%) |
| Bachelor's Degree or higher | 2,202 (77.4%) | 77 (2.7%) |
| Total | 2,686 (76.6%) | 112 (3.2%) |
Employment Occupations by Sex in Rumson borough
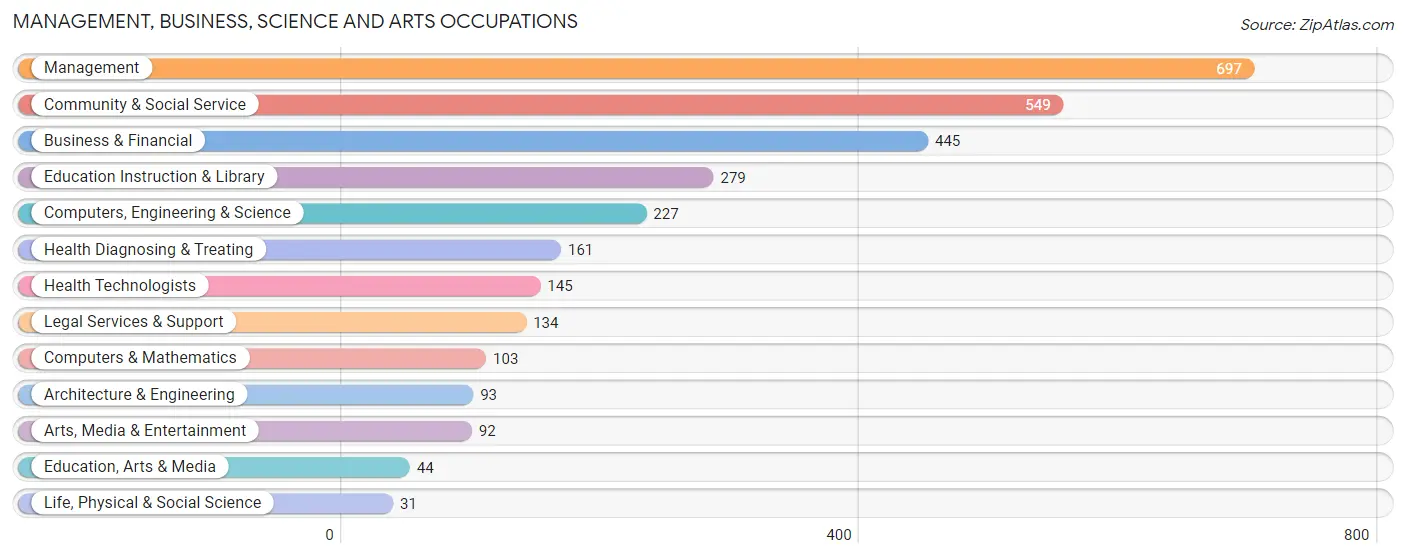
Management, Business, Science and Arts Occupations
The most common Management, Business, Science and Arts occupations in Rumson borough are Management (697 | 21.3%), Community & Social Service (549 | 16.8%), Business & Financial (445 | 13.6%), Education Instruction & Library (279 | 8.5%), and Computers, Engineering & Science (227 | 7.0%).
Management, Business, Science and Arts Occupations by Sex
Within the Management, Business, Science and Arts occupations in Rumson borough, the most male-oriented occupations are Architecture & Engineering (89.2%), Legal Services & Support (80.6%), and Computers, Engineering & Science (79.3%), while the most female-oriented occupations are Education, Arts & Media (72.7%), Education Instruction & Library (60.6%), and Arts, Media & Entertainment (57.6%).
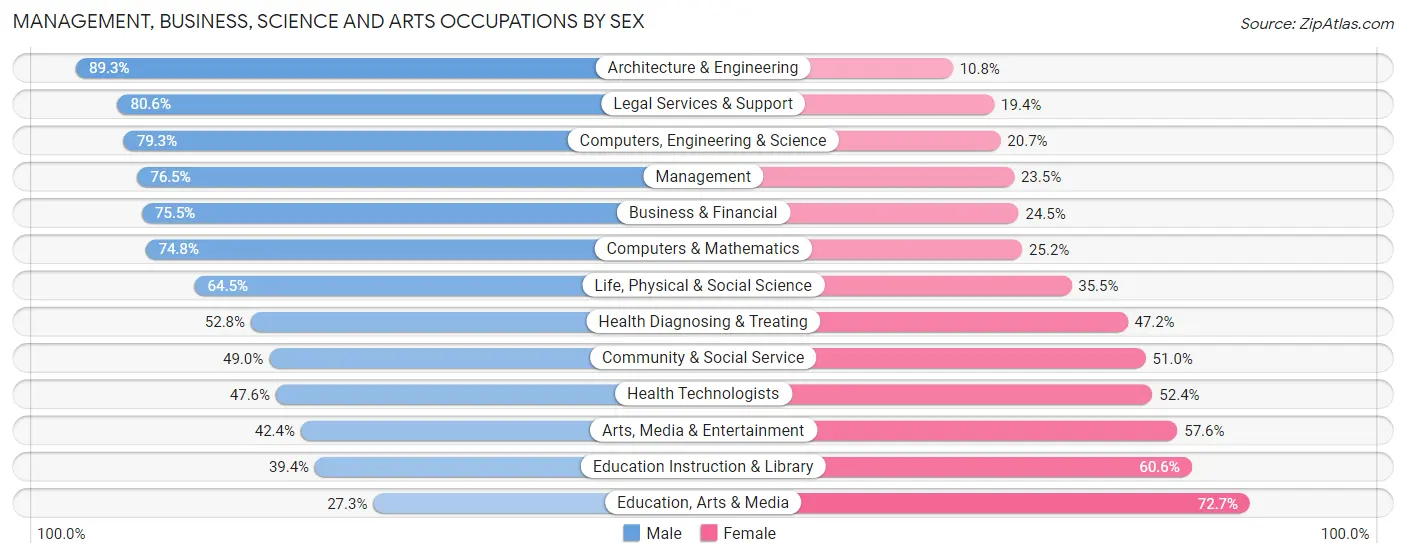
| Occupation | Male | Female |
| Management | 533 (76.5%) | 164 (23.5%) |
| Business & Financial | 336 (75.5%) | 109 (24.5%) |
| Computers, Engineering & Science | 180 (79.3%) | 47 (20.7%) |
| Computers & Mathematics | 77 (74.8%) | 26 (25.2%) |
| Architecture & Engineering | 83 (89.2%) | 10 (10.7%) |
| Life, Physical & Social Science | 20 (64.5%) | 11 (35.5%) |
| Community & Social Service | 269 (49.0%) | 280 (51.0%) |
| Education, Arts & Media | 12 (27.3%) | 32 (72.7%) |
| Legal Services & Support | 108 (80.6%) | 26 (19.4%) |
| Education Instruction & Library | 110 (39.4%) | 169 (60.6%) |
| Arts, Media & Entertainment | 39 (42.4%) | 53 (57.6%) |
| Health Diagnosing & Treating | 85 (52.8%) | 76 (47.2%) |
| Health Technologists | 69 (47.6%) | 76 (52.4%) |
| Total (Category) | 1,403 (67.5%) | 676 (32.5%) |
| Total (Overall) | 2,024 (62.0%) | 1,242 (38.0%) |
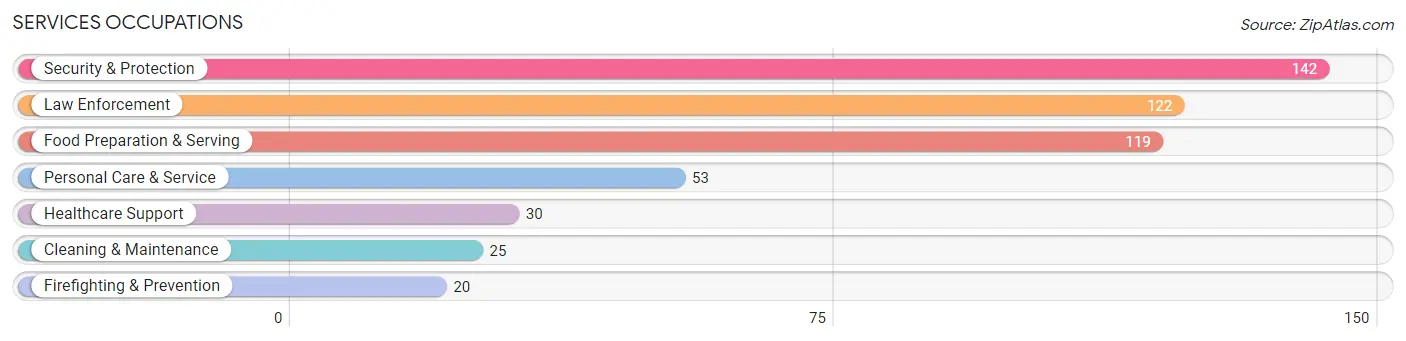
Services Occupations
The most common Services occupations in Rumson borough are Security & Protection (142 | 4.3%), Law Enforcement (122 | 3.7%), Food Preparation & Serving (119 | 3.6%), Personal Care & Service (53 | 1.6%), and Healthcare Support (30 | 0.9%).
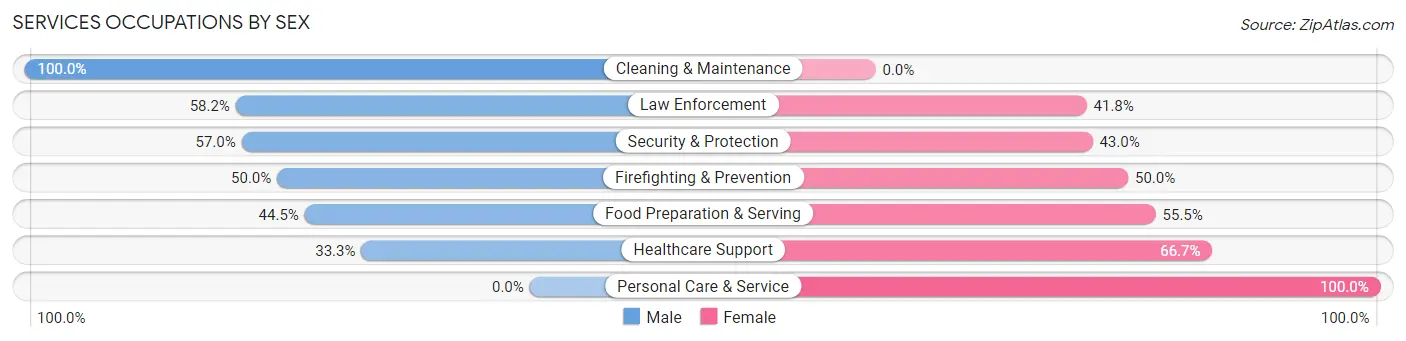
Services Occupations by Sex
Within the Services occupations in Rumson borough, the most male-oriented occupations are Cleaning & Maintenance (100.0%), Law Enforcement (58.2%), and Security & Protection (57.0%), while the most female-oriented occupations are Personal Care & Service (100.0%), Healthcare Support (66.7%), and Food Preparation & Serving (55.5%).
| Occupation | Male | Female |
| Healthcare Support | 10 (33.3%) | 20 (66.7%) |
| Security & Protection | 81 (57.0%) | 61 (43.0%) |
| Firefighting & Prevention | 10 (50.0%) | 10 (50.0%) |
| Law Enforcement | 71 (58.2%) | 51 (41.8%) |
| Food Preparation & Serving | 53 (44.5%) | 66 (55.5%) |
| Cleaning & Maintenance | 25 (100.0%) | 0 (0.0%) |
| Personal Care & Service | 0 (0.0%) | 53 (100.0%) |
| Total (Category) | 169 (45.8%) | 200 (54.2%) |
| Total (Overall) | 2,024 (62.0%) | 1,242 (38.0%) |
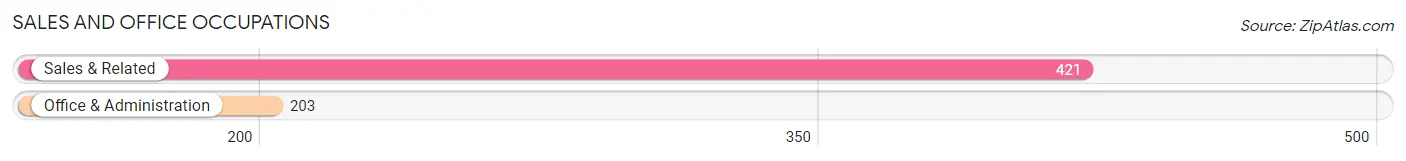
Sales and Office Occupations
The most common Sales and Office occupations in Rumson borough are Sales & Related (421 | 12.9%), and Office & Administration (203 | 6.2%).
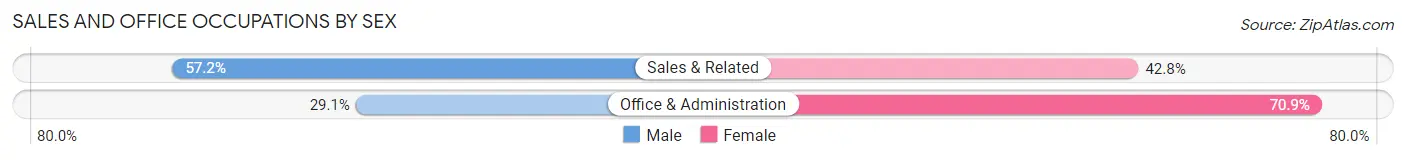
Sales and Office Occupations by Sex
| Occupation | Male | Female |
| Sales & Related | 241 (57.2%) | 180 (42.8%) |
| Office & Administration | 59 (29.1%) | 144 (70.9%) |
| Total (Category) | 300 (48.1%) | 324 (51.9%) |
| Total (Overall) | 2,024 (62.0%) | 1,242 (38.0%) |
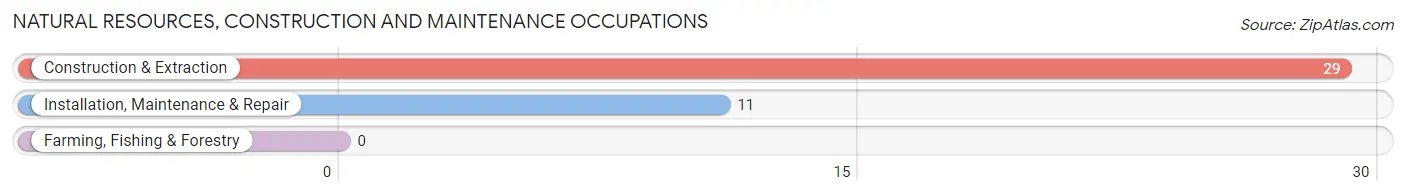
Natural Resources, Construction and Maintenance Occupations
The most common Natural Resources, Construction and Maintenance occupations in Rumson borough are Construction & Extraction (29 | 0.9%), and Installation, Maintenance & Repair (11 | 0.3%).
Natural Resources, Construction and Maintenance Occupations by Sex
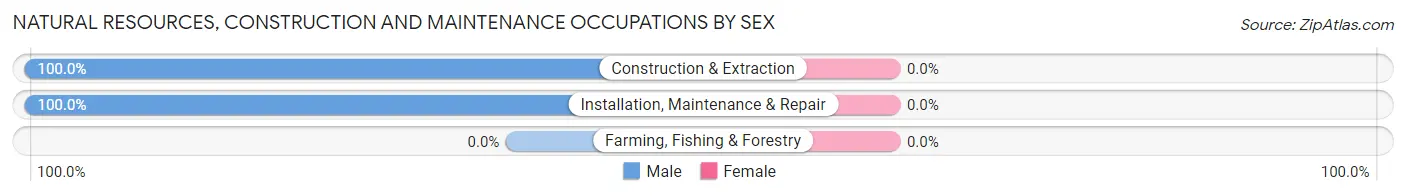
| Occupation | Male | Female |
| Farming, Fishing & Forestry | 0 (0.0%) | 0 (0.0%) |
| Construction & Extraction | 29 (100.0%) | 0 (0.0%) |
| Installation, Maintenance & Repair | 11 (100.0%) | 0 (0.0%) |
| Total (Category) | 40 (100.0%) | 0 (0.0%) |
| Total (Overall) | 2,024 (62.0%) | 1,242 (38.0%) |
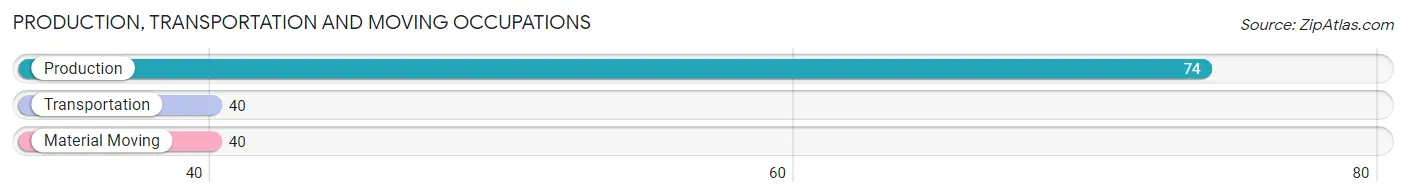
Production, Transportation and Moving Occupations
The most common Production, Transportation and Moving occupations in Rumson borough are Production (74 | 2.3%), Transportation (40 | 1.2%), and Material Moving (40 | 1.2%).
Production, Transportation and Moving Occupations by Sex
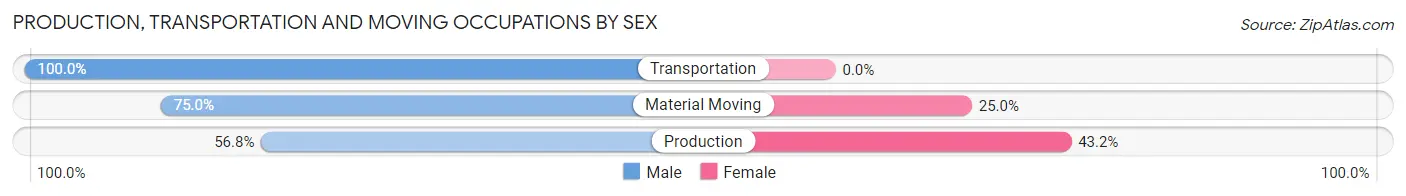
| Occupation | Male | Female |
| Production | 42 (56.8%) | 32 (43.2%) |
| Transportation | 40 (100.0%) | 0 (0.0%) |
| Material Moving | 30 (75.0%) | 10 (25.0%) |
| Total (Category) | 112 (72.7%) | 42 (27.3%) |
| Total (Overall) | 2,024 (62.0%) | 1,242 (38.0%) |
Employment Industries by Sex in Rumson borough
Employment Industries in Rumson borough
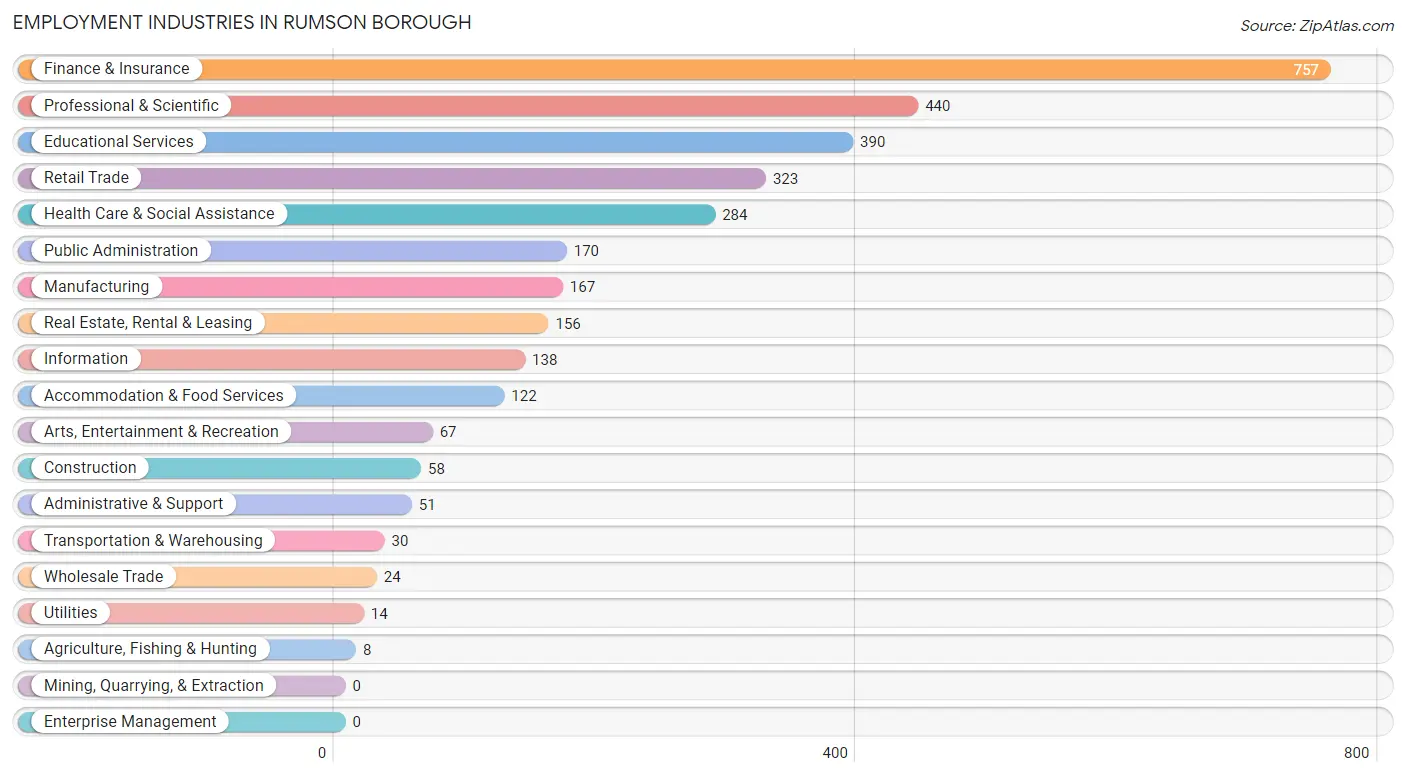
The major employment industries in Rumson borough include Finance & Insurance (757 | 23.2%), Professional & Scientific (440 | 13.5%), Educational Services (390 | 11.9%), Retail Trade (323 | 9.9%), and Health Care & Social Assistance (284 | 8.7%).
Employment Industries by Sex in Rumson borough
The Rumson borough industries that see more men than women are Agriculture, Fishing & Hunting (100.0%), Construction (100.0%), and Transportation & Warehousing (100.0%), whereas the industries that tend to have a higher number of women are Arts, Entertainment & Recreation (59.7%), Health Care & Social Assistance (59.2%), and Wholesale Trade (58.3%).
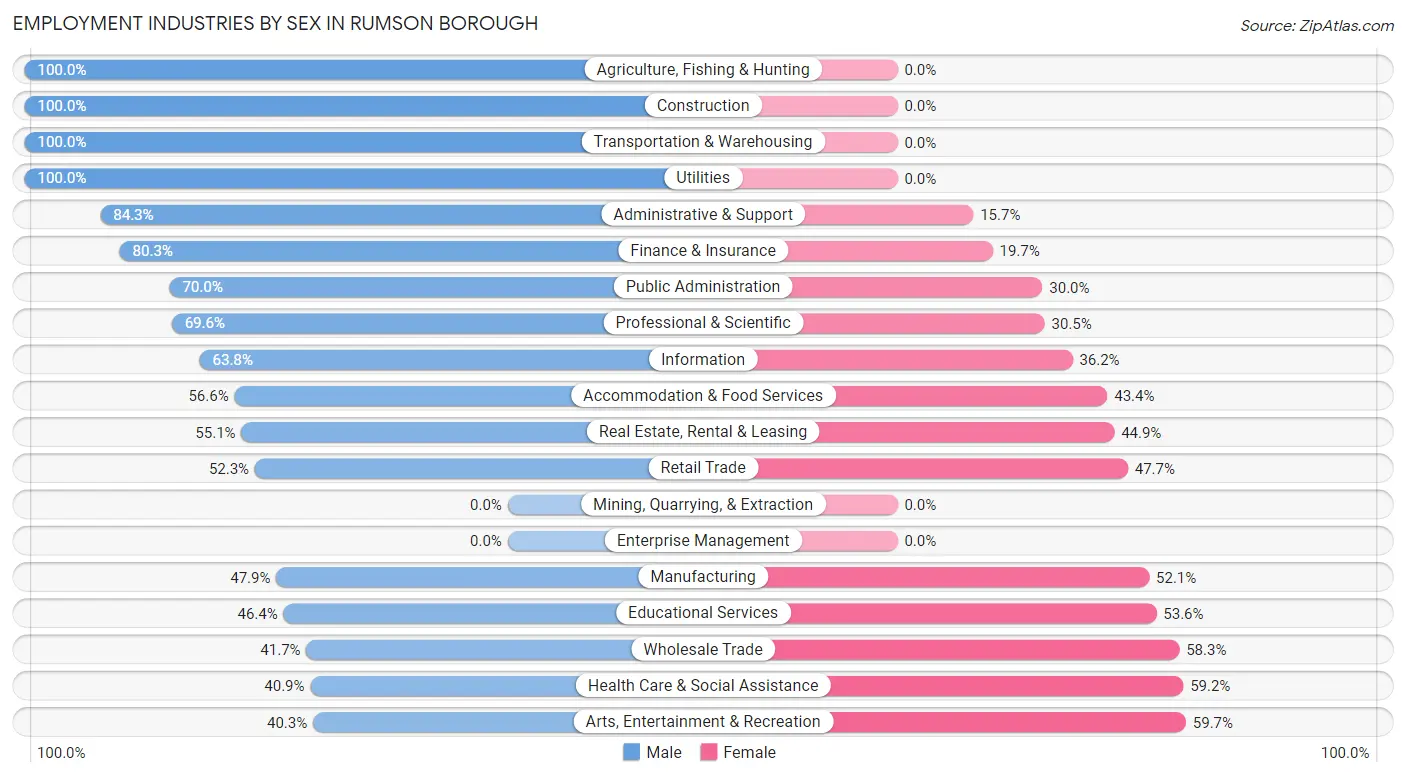
| Industry | Male | Female |
| Agriculture, Fishing & Hunting | 8 (100.0%) | 0 (0.0%) |
| Mining, Quarrying, & Extraction | 0 (0.0%) | 0 (0.0%) |
| Construction | 58 (100.0%) | 0 (0.0%) |
| Manufacturing | 80 (47.9%) | 87 (52.1%) |
| Wholesale Trade | 10 (41.7%) | 14 (58.3%) |
| Retail Trade | 169 (52.3%) | 154 (47.7%) |
| Transportation & Warehousing | 30 (100.0%) | 0 (0.0%) |
| Utilities | 14 (100.0%) | 0 (0.0%) |
| Information | 88 (63.8%) | 50 (36.2%) |
| Finance & Insurance | 608 (80.3%) | 149 (19.7%) |
| Real Estate, Rental & Leasing | 86 (55.1%) | 70 (44.9%) |
| Professional & Scientific | 306 (69.6%) | 134 (30.4%) |
| Enterprise Management | 0 (0.0%) | 0 (0.0%) |
| Administrative & Support | 43 (84.3%) | 8 (15.7%) |
| Educational Services | 181 (46.4%) | 209 (53.6%) |
| Health Care & Social Assistance | 116 (40.8%) | 168 (59.2%) |
| Arts, Entertainment & Recreation | 27 (40.3%) | 40 (59.7%) |
| Accommodation & Food Services | 69 (56.6%) | 53 (43.4%) |
| Public Administration | 119 (70.0%) | 51 (30.0%) |
| Total | 2,024 (62.0%) | 1,242 (38.0%) |
Education in Rumson borough
School Enrollment in Rumson borough
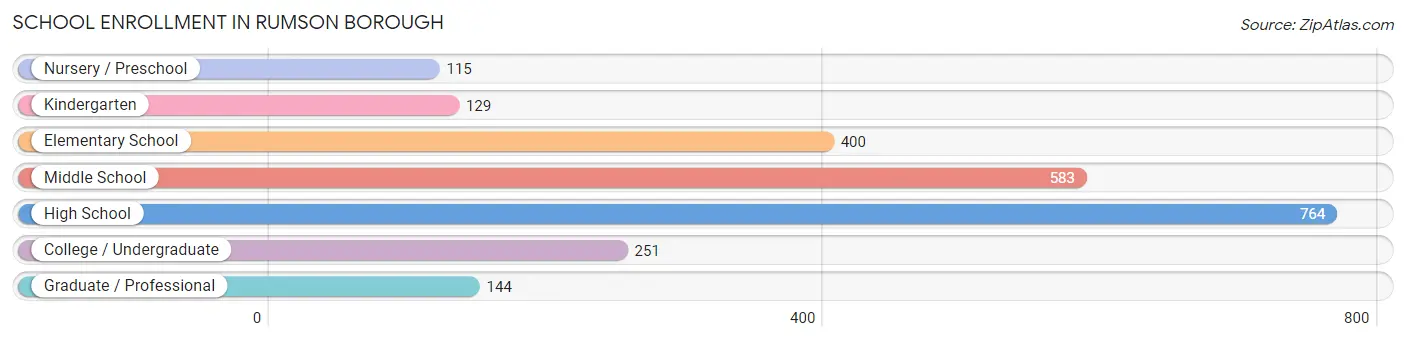
The most common levels of schooling among the 2,386 students in Rumson borough are high school (764 | 32.0%), middle school (583 | 24.4%), and elementary school (400 | 16.8%).
| School Level | # Students | % Students |
| Nursery / Preschool | 115 | 4.8% |
| Kindergarten | 129 | 5.4% |
| Elementary School | 400 | 16.8% |
| Middle School | 583 | 24.4% |
| High School | 764 | 32.0% |
| College / Undergraduate | 251 | 10.5% |
| Graduate / Professional | 144 | 6.0% |
| Total | 2,386 | 100.0% |
School Enrollment by Age by Funding Source in Rumson borough
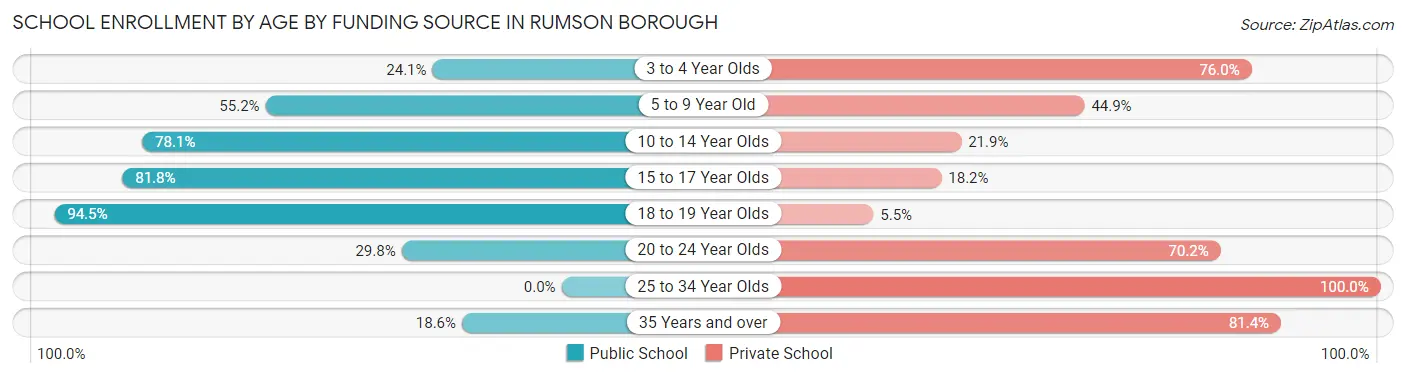
Out of a total of 2,386 students who are enrolled in schools in Rumson borough, 811 (34.0%) attend a private institution, while the remaining 1,575 (66.0%) are enrolled in public schools. The age group of 25 to 34 year olds has the highest likelihood of being enrolled in private schools, with 75 (100.0% in the age bracket) enrolled. Conversely, the age group of 18 to 19 year olds has the lowest likelihood of being enrolled in a private school, with 239 (94.5% in the age bracket) attending a public institution.
| Age Bracket | Public School | Private School |
| 3 to 4 Year Olds | 19 (24.0%) | 60 (75.9%) |
| 5 to 9 Year Old | 284 (55.1%) | 231 (44.9%) |
| 10 to 14 Year Olds | 542 (78.1%) | 152 (21.9%) |
| 15 to 17 Year Olds | 427 (81.8%) | 95 (18.2%) |
| 18 to 19 Year Olds | 239 (94.5%) | 14 (5.5%) |
| 20 to 24 Year Olds | 45 (29.8%) | 106 (70.2%) |
| 25 to 34 Year Olds | 0 (0.0%) | 75 (100.0%) |
| 35 Years and over | 18 (18.6%) | 79 (81.4%) |
| Total | 1,575 (66.0%) | 811 (34.0%) |
Educational Attainment by Field of Study in Rumson borough
Business (1,051 | 27.4%), social sciences (538 | 14.0%), education (286 | 7.4%), liberal arts & history (276 | 7.2%), and literature & languages (264 | 6.9%) are the most common fields of study among 3,842 individuals in Rumson borough who have obtained a bachelor's degree or higher.
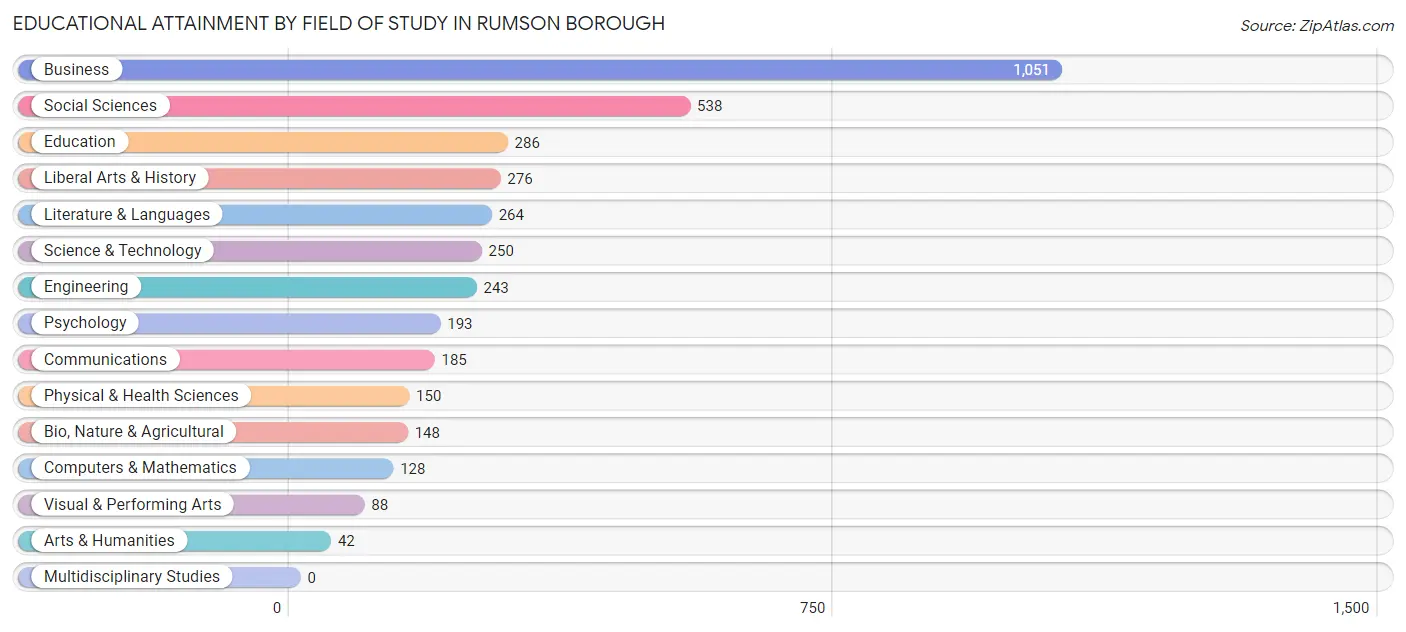
| Field of Study | # Graduates | % Graduates |
| Computers & Mathematics | 128 | 3.3% |
| Bio, Nature & Agricultural | 148 | 3.8% |
| Physical & Health Sciences | 150 | 3.9% |
| Psychology | 193 | 5.0% |
| Social Sciences | 538 | 14.0% |
| Engineering | 243 | 6.3% |
| Multidisciplinary Studies | 0 | 0.0% |
| Science & Technology | 250 | 6.5% |
| Business | 1,051 | 27.4% |
| Education | 286 | 7.4% |
| Literature & Languages | 264 | 6.9% |
| Liberal Arts & History | 276 | 7.2% |
| Visual & Performing Arts | 88 | 2.3% |
| Communications | 185 | 4.8% |
| Arts & Humanities | 42 | 1.1% |
| Total | 3,842 | 100.0% |
Transportation & Commute in Rumson borough
Vehicle Availability by Sex in Rumson borough
The most prevalent vehicle ownership categories in Rumson borough are males with 2 vehicles (882, accounting for 43.9%) and females with 2 vehicles (456, making up 73.4%).
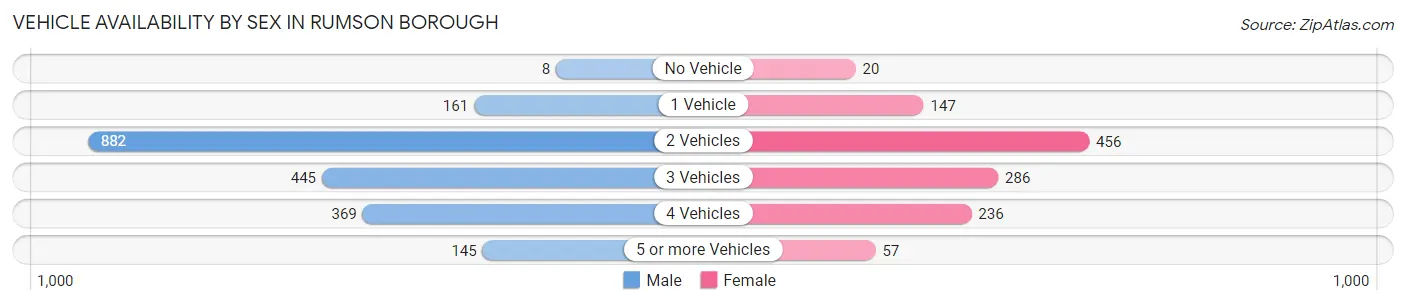
| Vehicles Available | Male | Female |
| No Vehicle | 8 (0.4%) | 20 (1.7%) |
| 1 Vehicle | 161 (8.0%) | 147 (12.2%) |
| 2 Vehicles | 882 (43.9%) | 456 (37.9%) |
| 3 Vehicles | 445 (22.1%) | 286 (23.8%) |
| 4 Vehicles | 369 (18.4%) | 236 (19.6%) |
| 5 or more Vehicles | 145 (7.2%) | 57 (4.7%) |
| Total | 2,010 (100.0%) | 1,202 (100.0%) |
Commute Time in Rumson borough
The most frequently occuring commute durations in Rumson borough are 60 to 89 minutes (501 commuters, 20.8%), 90 or more minutes (439 commuters, 18.2%), and 15 to 19 minutes (382 commuters, 15.8%).
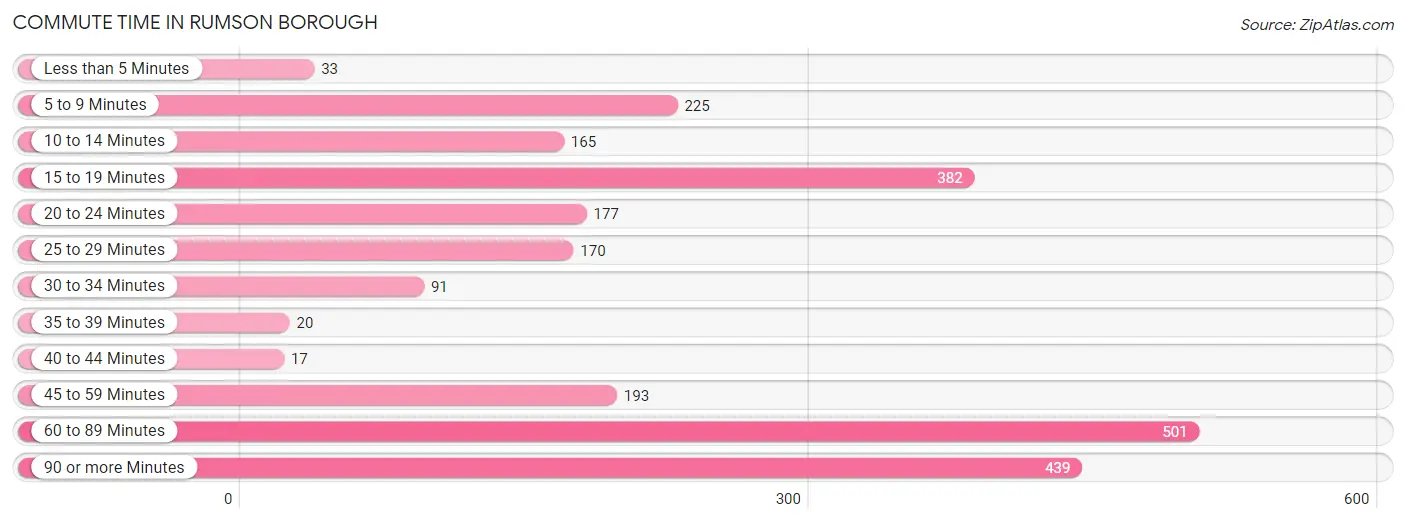
| Commute Time | # Commuters | % Commuters |
| Less than 5 Minutes | 33 | 1.4% |
| 5 to 9 Minutes | 225 | 9.3% |
| 10 to 14 Minutes | 165 | 6.8% |
| 15 to 19 Minutes | 382 | 15.8% |
| 20 to 24 Minutes | 177 | 7.3% |
| 25 to 29 Minutes | 170 | 7.0% |
| 30 to 34 Minutes | 91 | 3.8% |
| 35 to 39 Minutes | 20 | 0.8% |
| 40 to 44 Minutes | 17 | 0.7% |
| 45 to 59 Minutes | 193 | 8.0% |
| 60 to 89 Minutes | 501 | 20.8% |
| 90 or more Minutes | 439 | 18.2% |
Commute Time by Sex in Rumson borough
The most common commute times in Rumson borough are 60 to 89 minutes (378 commuters, 24.8%) for males and 15 to 19 minutes (232 commuters, 26.1%) for females.
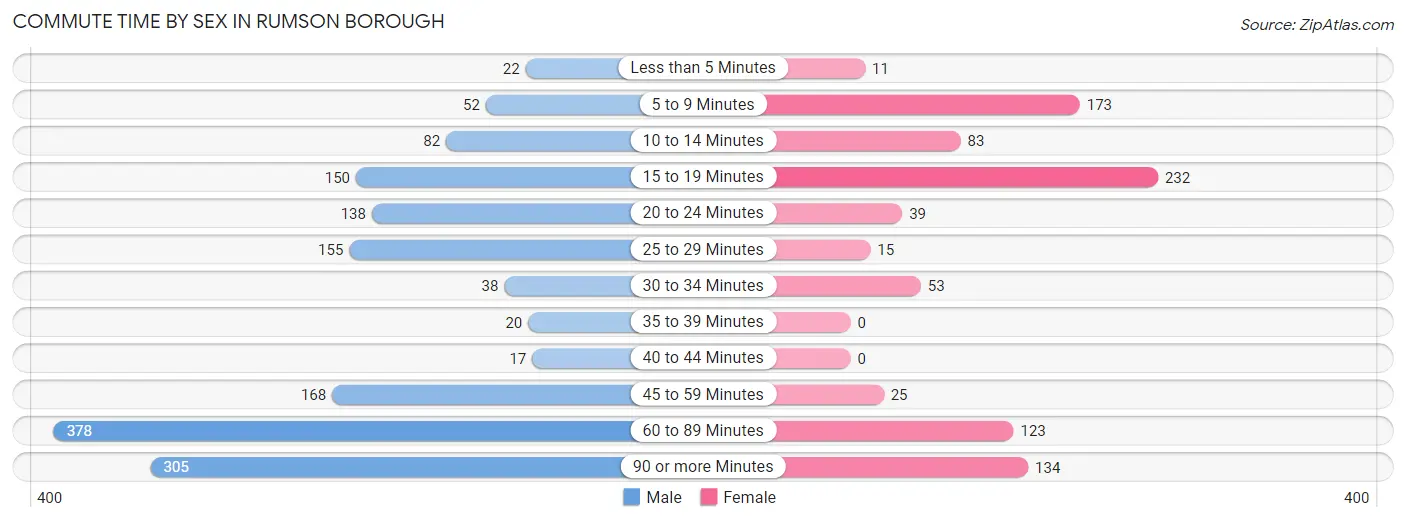
| Commute Time | Male | Female |
| Less than 5 Minutes | 22 (1.4%) | 11 (1.2%) |
| 5 to 9 Minutes | 52 (3.4%) | 173 (19.5%) |
| 10 to 14 Minutes | 82 (5.4%) | 83 (9.3%) |
| 15 to 19 Minutes | 150 (9.8%) | 232 (26.1%) |
| 20 to 24 Minutes | 138 (9.0%) | 39 (4.4%) |
| 25 to 29 Minutes | 155 (10.2%) | 15 (1.7%) |
| 30 to 34 Minutes | 38 (2.5%) | 53 (6.0%) |
| 35 to 39 Minutes | 20 (1.3%) | 0 (0.0%) |
| 40 to 44 Minutes | 17 (1.1%) | 0 (0.0%) |
| 45 to 59 Minutes | 168 (11.0%) | 25 (2.8%) |
| 60 to 89 Minutes | 378 (24.8%) | 123 (13.9%) |
| 90 or more Minutes | 305 (20.0%) | 134 (15.1%) |
Time of Departure to Work by Sex in Rumson borough
The most frequent times of departure to work in Rumson borough are 6:30 AM to 6:59 AM (221, 14.5%) for males and 7:30 AM to 7:59 AM (162, 18.2%) for females.
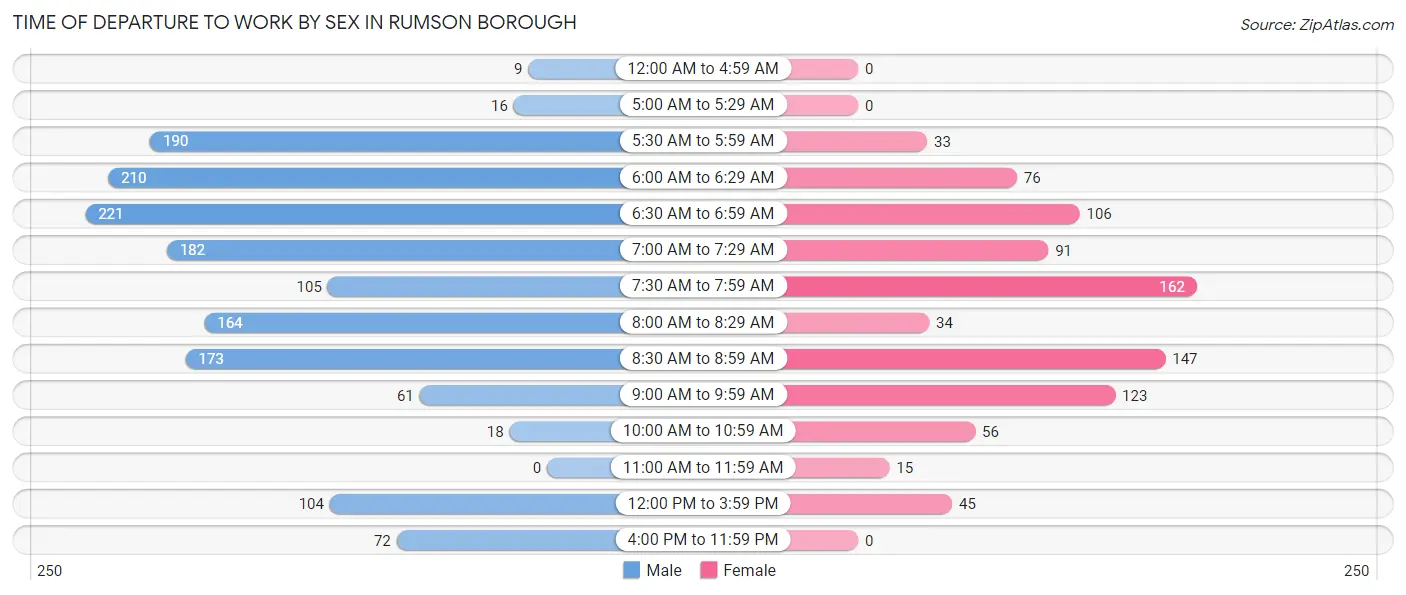
| Time of Departure | Male | Female |
| 12:00 AM to 4:59 AM | 9 (0.6%) | 0 (0.0%) |
| 5:00 AM to 5:29 AM | 16 (1.1%) | 0 (0.0%) |
| 5:30 AM to 5:59 AM | 190 (12.5%) | 33 (3.7%) |
| 6:00 AM to 6:29 AM | 210 (13.8%) | 76 (8.6%) |
| 6:30 AM to 6:59 AM | 221 (14.5%) | 106 (11.9%) |
| 7:00 AM to 7:29 AM | 182 (11.9%) | 91 (10.2%) |
| 7:30 AM to 7:59 AM | 105 (6.9%) | 162 (18.2%) |
| 8:00 AM to 8:29 AM | 164 (10.7%) | 34 (3.8%) |
| 8:30 AM to 8:59 AM | 173 (11.3%) | 147 (16.6%) |
| 9:00 AM to 9:59 AM | 61 (4.0%) | 123 (13.9%) |
| 10:00 AM to 10:59 AM | 18 (1.2%) | 56 (6.3%) |
| 11:00 AM to 11:59 AM | 0 (0.0%) | 15 (1.7%) |
| 12:00 PM to 3:59 PM | 104 (6.8%) | 45 (5.1%) |
| 4:00 PM to 11:59 PM | 72 (4.7%) | 0 (0.0%) |
| Total | 1,525 (100.0%) | 888 (100.0%) |
Housing Occupancy in Rumson borough
Occupancy by Ownership in Rumson borough
Of the total 2,303 dwellings in Rumson borough, owner-occupied units account for 2,136 (92.7%), while renter-occupied units make up 167 (7.2%).
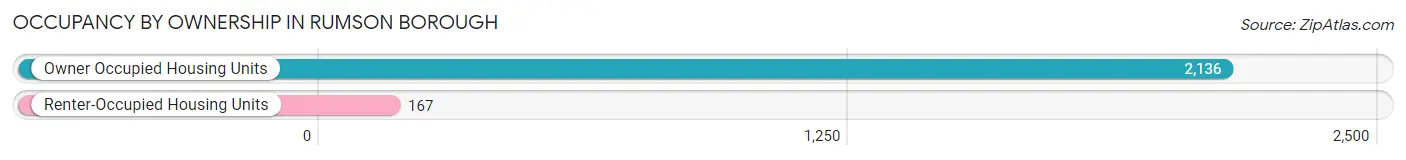
| Occupancy | # Housing Units | % Housing Units |
| Owner Occupied Housing Units | 2,136 | 92.7% |
| Renter-Occupied Housing Units | 167 | 7.2% |
| Total Occupied Housing Units | 2,303 | 100.0% |
Occupancy by Household Size in Rumson borough
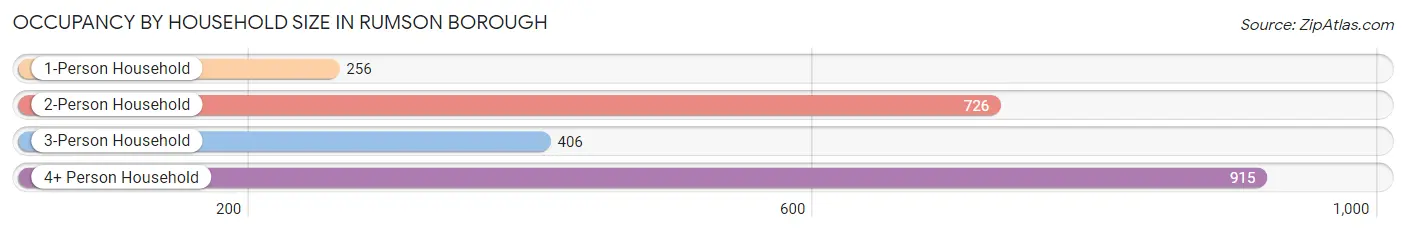
| Household Size | # Housing Units | % Housing Units |
| 1-Person Household | 256 | 11.1% |
| 2-Person Household | 726 | 31.5% |
| 3-Person Household | 406 | 17.6% |
| 4+ Person Household | 915 | 39.7% |
| Total Housing Units | 2,303 | 100.0% |
Occupancy by Ownership by Household Size in Rumson borough
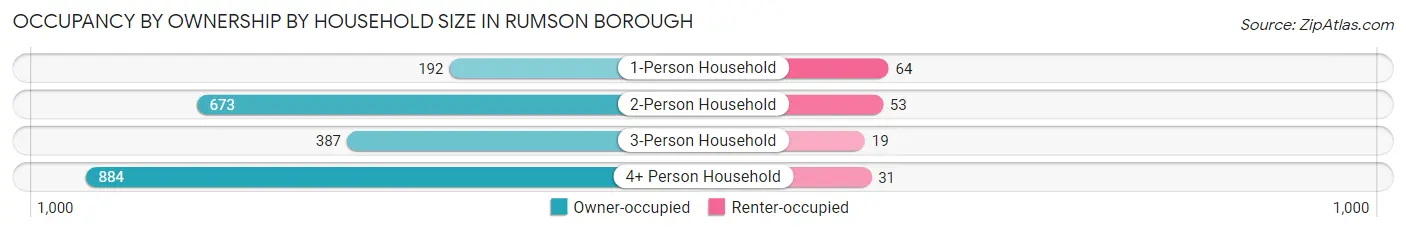
| Household Size | Owner-occupied | Renter-occupied |
| 1-Person Household | 192 (75.0%) | 64 (25.0%) |
| 2-Person Household | 673 (92.7%) | 53 (7.3%) |
| 3-Person Household | 387 (95.3%) | 19 (4.7%) |
| 4+ Person Household | 884 (96.6%) | 31 (3.4%) |
| Total Housing Units | 2,136 (92.7%) | 167 (7.2%) |
Occupancy by Educational Attainment in Rumson borough
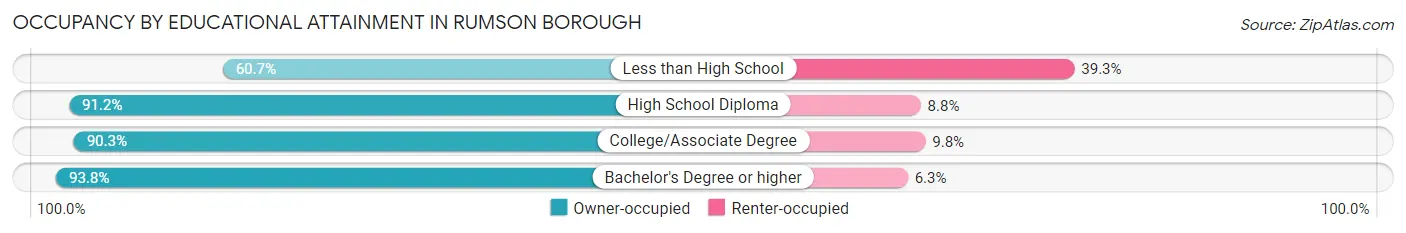
| Household Size | Owner-occupied | Renter-occupied |
| Less than High School | 17 (60.7%) | 11 (39.3%) |
| High School Diploma | 93 (91.2%) | 9 (8.8%) |
| College/Associate Degree | 287 (90.2%) | 31 (9.8%) |
| Bachelor's Degree or higher | 1,739 (93.8%) | 116 (6.2%) |
Occupancy by Age of Householder in Rumson borough
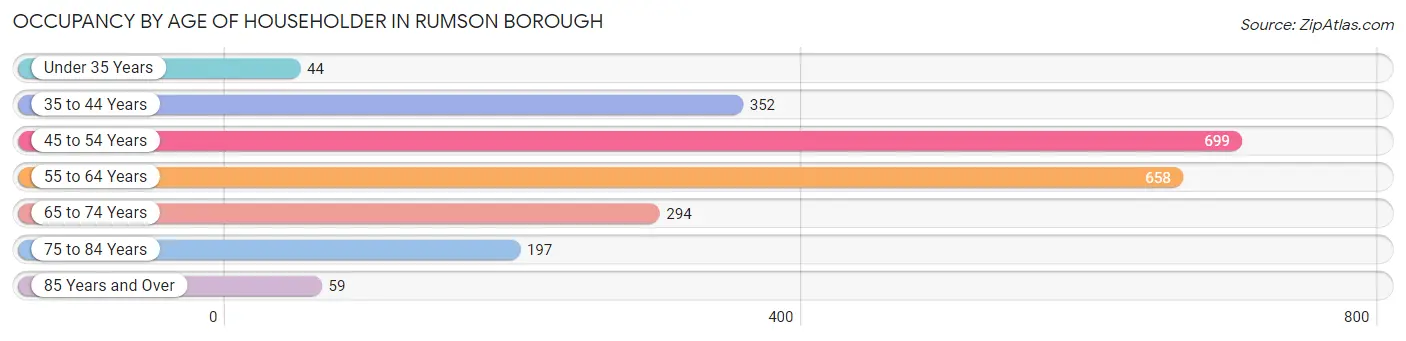
| Age Bracket | # Households | % Households |
| Under 35 Years | 44 | 1.9% |
| 35 to 44 Years | 352 | 15.3% |
| 45 to 54 Years | 699 | 30.3% |
| 55 to 64 Years | 658 | 28.6% |
| 65 to 74 Years | 294 | 12.8% |
| 75 to 84 Years | 197 | 8.6% |
| 85 Years and Over | 59 | 2.6% |
| Total | 2,303 | 100.0% |
Housing Finances in Rumson borough
Median Income by Occupancy in Rumson borough
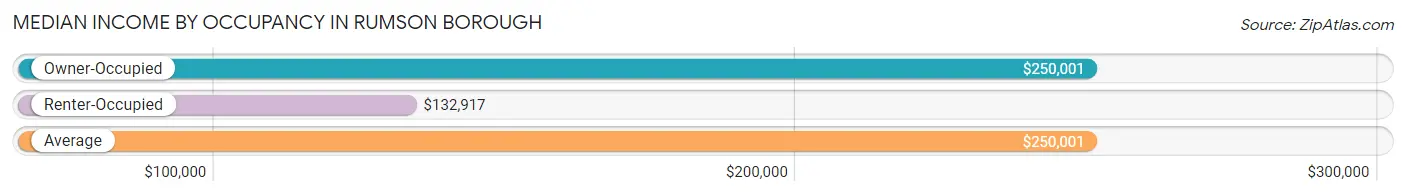
| Occupancy Type | # Households | Median Income |
| Owner-Occupied | 2,136 (92.7%) | $250,001 |
| Renter-Occupied | 167 (7.2%) | $132,917 |
| Average | 2,303 (100.0%) | $250,001 |
Occupancy by Householder Income Bracket in Rumson borough
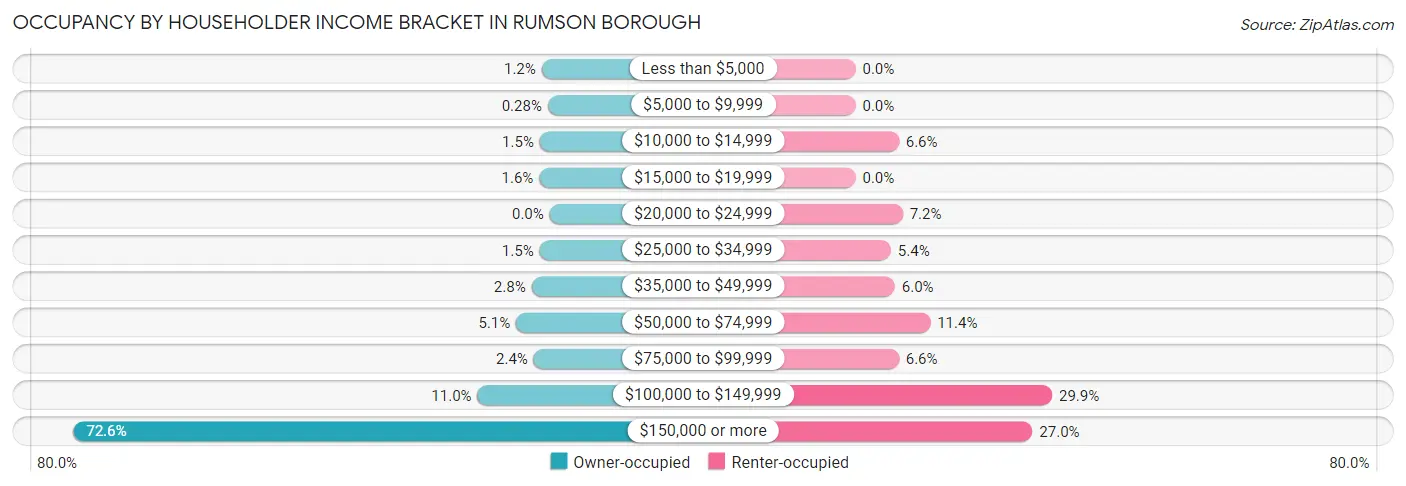
| Income Bracket | Owner-occupied | Renter-occupied |
| Less than $5,000 | 26 (1.2%) | 0 (0.0%) |
| $5,000 to $9,999 | 6 (0.3%) | 0 (0.0%) |
| $10,000 to $14,999 | 32 (1.5%) | 11 (6.6%) |
| $15,000 to $19,999 | 34 (1.6%) | 0 (0.0%) |
| $20,000 to $24,999 | 0 (0.0%) | 12 (7.2%) |
| $25,000 to $34,999 | 33 (1.5%) | 9 (5.4%) |
| $35,000 to $49,999 | 59 (2.8%) | 10 (6.0%) |
| $50,000 to $74,999 | 109 (5.1%) | 19 (11.4%) |
| $75,000 to $99,999 | 52 (2.4%) | 11 (6.6%) |
| $100,000 to $149,999 | 235 (11.0%) | 50 (29.9%) |
| $150,000 or more | 1,550 (72.6%) | 45 (27.0%) |
| Total | 2,136 (100.0%) | 167 (100.0%) |
Monthly Housing Cost Tiers in Rumson borough
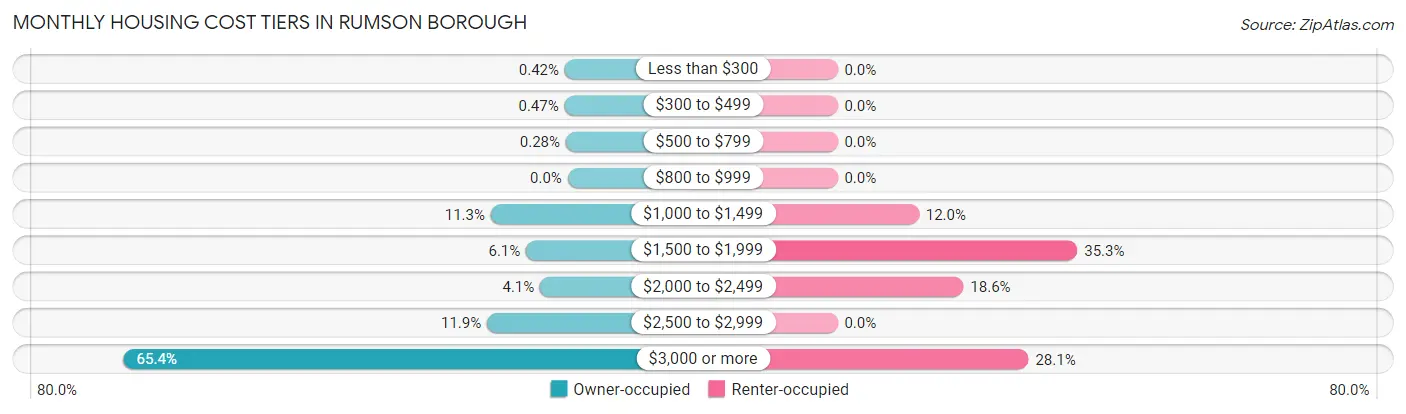
| Monthly Cost | Owner-occupied | Renter-occupied |
| Less than $300 | 9 (0.4%) | 0 (0.0%) |
| $300 to $499 | 10 (0.5%) | 0 (0.0%) |
| $500 to $799 | 6 (0.3%) | 0 (0.0%) |
| $800 to $999 | 0 (0.0%) | 0 (0.0%) |
| $1,000 to $1,499 | 242 (11.3%) | 20 (12.0%) |
| $1,500 to $1,999 | 131 (6.1%) | 59 (35.3%) |
| $2,000 to $2,499 | 87 (4.1%) | 31 (18.6%) |
| $2,500 to $2,999 | 254 (11.9%) | 0 (0.0%) |
| $3,000 or more | 1,397 (65.4%) | 47 (28.1%) |
| Total | 2,136 (100.0%) | 167 (100.0%) |
Physical Housing Characteristics in Rumson borough
Housing Structures in Rumson borough
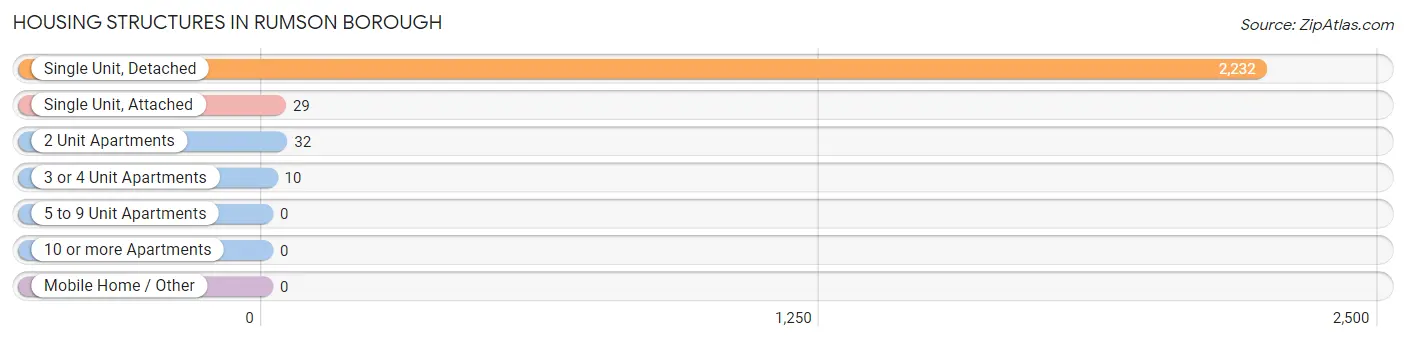
| Structure Type | # Housing Units | % Housing Units |
| Single Unit, Detached | 2,232 | 96.9% |
| Single Unit, Attached | 29 | 1.3% |
| 2 Unit Apartments | 32 | 1.4% |
| 3 or 4 Unit Apartments | 10 | 0.4% |
| 5 to 9 Unit Apartments | 0 | 0.0% |
| 10 or more Apartments | 0 | 0.0% |
| Mobile Home / Other | 0 | 0.0% |
| Total | 2,303 | 100.0% |
Housing Structures by Occupancy in Rumson borough
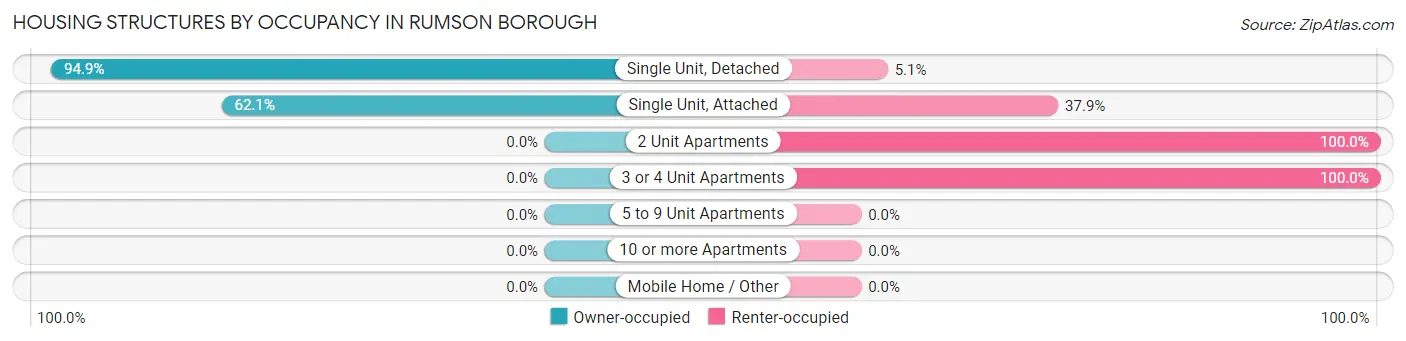
| Structure Type | Owner-occupied | Renter-occupied |
| Single Unit, Detached | 2,118 (94.9%) | 114 (5.1%) |
| Single Unit, Attached | 18 (62.1%) | 11 (37.9%) |
| 2 Unit Apartments | 0 (0.0%) | 32 (100.0%) |
| 3 or 4 Unit Apartments | 0 (0.0%) | 10 (100.0%) |
| 5 to 9 Unit Apartments | 0 (0.0%) | 0 (0.0%) |
| 10 or more Apartments | 0 (0.0%) | 0 (0.0%) |
| Mobile Home / Other | 0 (0.0%) | 0 (0.0%) |
| Total | 2,136 (92.7%) | 167 (7.2%) |
Housing Structures by Number of Rooms in Rumson borough
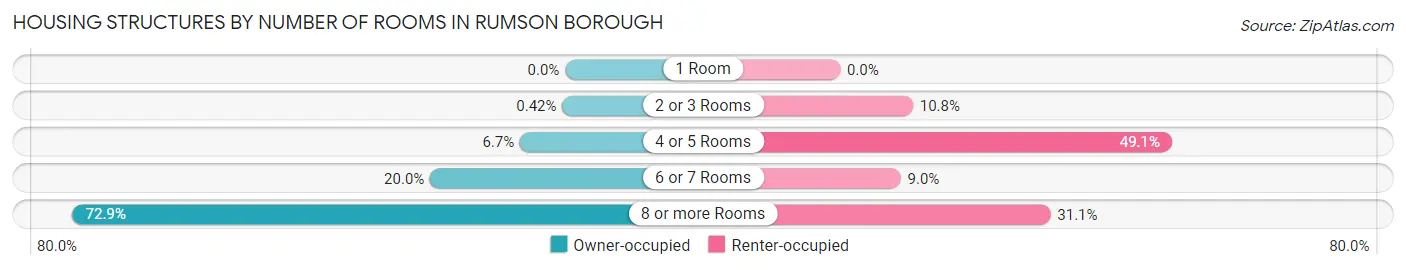
| Number of Rooms | Owner-occupied | Renter-occupied |
| 1 Room | 0 (0.0%) | 0 (0.0%) |
| 2 or 3 Rooms | 9 (0.4%) | 18 (10.8%) |
| 4 or 5 Rooms | 143 (6.7%) | 82 (49.1%) |
| 6 or 7 Rooms | 427 (20.0%) | 15 (9.0%) |
| 8 or more Rooms | 1,557 (72.9%) | 52 (31.1%) |
| Total | 2,136 (100.0%) | 167 (100.0%) |
Housing Structure by Heating Type in Rumson borough
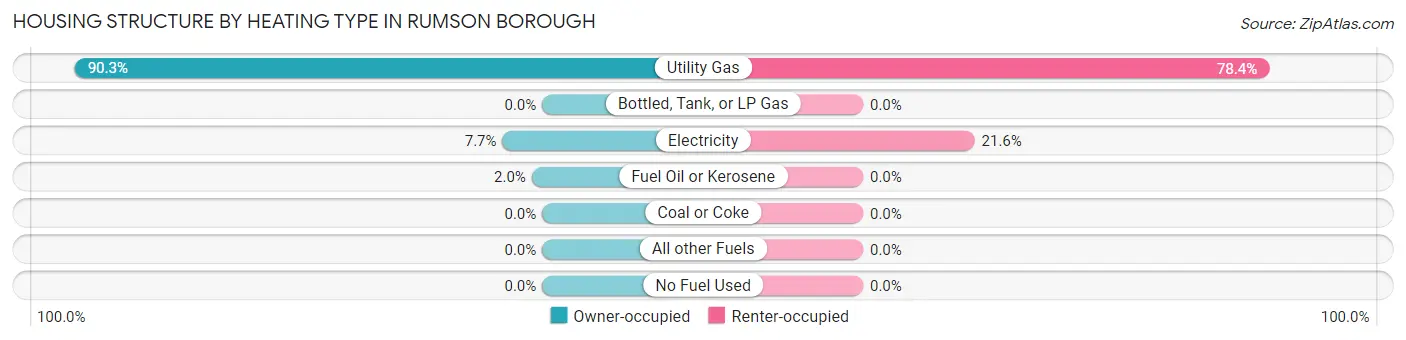
| Heating Type | Owner-occupied | Renter-occupied |
| Utility Gas | 1,929 (90.3%) | 131 (78.4%) |
| Bottled, Tank, or LP Gas | 0 (0.0%) | 0 (0.0%) |
| Electricity | 164 (7.7%) | 36 (21.6%) |
| Fuel Oil or Kerosene | 43 (2.0%) | 0 (0.0%) |
| Coal or Coke | 0 (0.0%) | 0 (0.0%) |
| All other Fuels | 0 (0.0%) | 0 (0.0%) |
| No Fuel Used | 0 (0.0%) | 0 (0.0%) |
| Total | 2,136 (100.0%) | 167 (100.0%) |
Household Vehicle Usage in Rumson borough
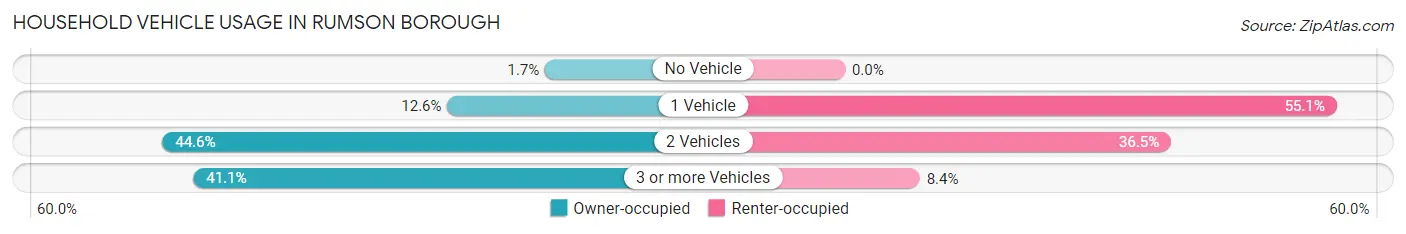
| Vehicles per Household | Owner-occupied | Renter-occupied |
| No Vehicle | 36 (1.7%) | 0 (0.0%) |
| 1 Vehicle | 270 (12.6%) | 92 (55.1%) |
| 2 Vehicles | 952 (44.6%) | 61 (36.5%) |
| 3 or more Vehicles | 878 (41.1%) | 14 (8.4%) |
| Total | 2,136 (100.0%) | 167 (100.0%) |
Real Estate & Mortgages in Rumson borough
Real Estate and Mortgage Overview in Rumson borough
| Characteristic | Without Mortgage | With Mortgage |
| Housing Units | 748 | 1,388 |
| Median Property Value | $1,418,600 | $1,574,600 |
| Median Household Income | $159,688 | $1,153 |
| Monthly Housing Costs | $1,501 | $1,206 |
| Real Estate Taxes | $10,001 | $0 |
Property Value by Mortgage Status in Rumson borough
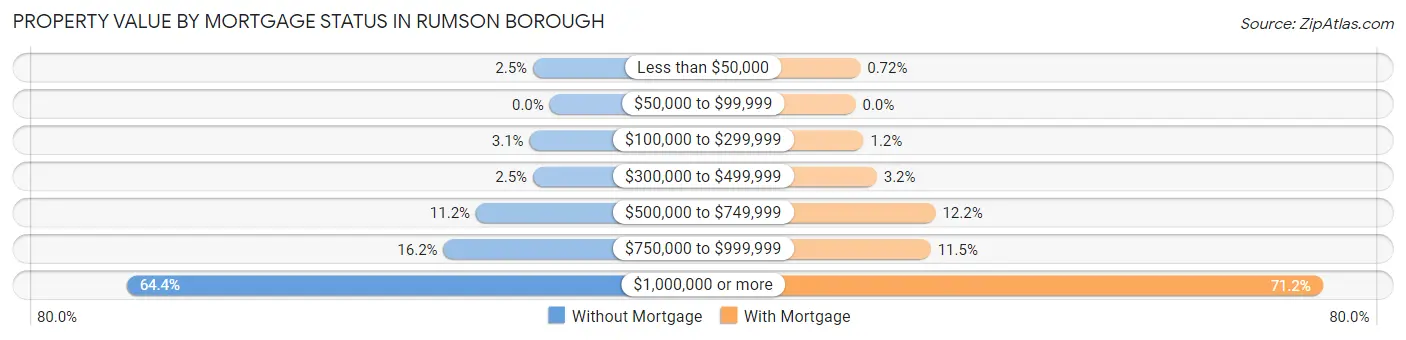
| Property Value | Without Mortgage | With Mortgage |
| Less than $50,000 | 19 (2.5%) | 10 (0.7%) |
| $50,000 to $99,999 | 0 (0.0%) | 0 (0.0%) |
| $100,000 to $299,999 | 23 (3.1%) | 17 (1.2%) |
| $300,000 to $499,999 | 19 (2.5%) | 45 (3.2%) |
| $500,000 to $749,999 | 84 (11.2%) | 169 (12.2%) |
| $750,000 to $999,999 | 121 (16.2%) | 159 (11.5%) |
| $1,000,000 or more | 482 (64.4%) | 988 (71.2%) |
| Total | 748 (100.0%) | 1,388 (100.0%) |
Household Income by Mortgage Status in Rumson borough
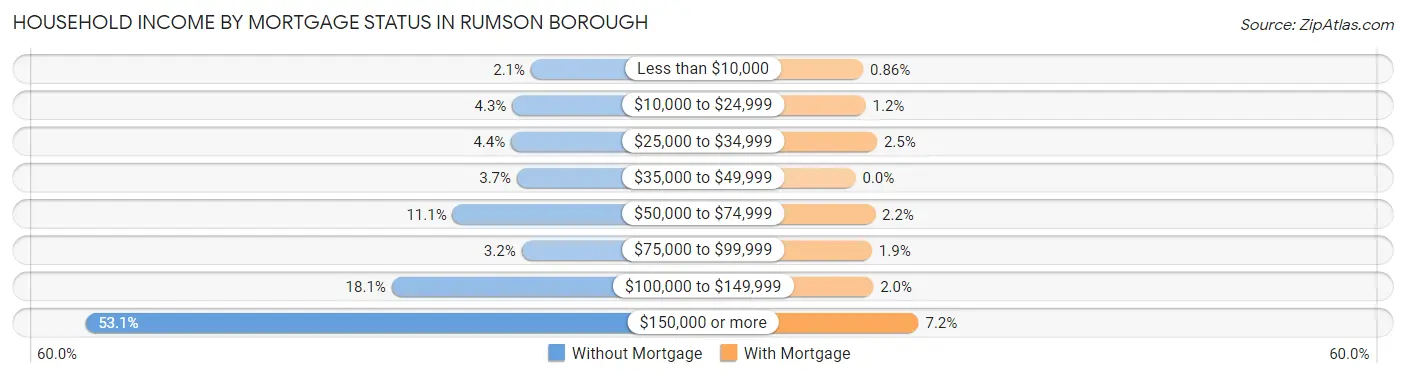
| Household Income | Without Mortgage | With Mortgage |
| Less than $10,000 | 16 (2.1%) | 12 (0.9%) |
| $10,000 to $24,999 | 32 (4.3%) | 16 (1.1%) |
| $25,000 to $34,999 | 33 (4.4%) | 34 (2.5%) |
| $35,000 to $49,999 | 28 (3.7%) | 0 (0.0%) |
| $50,000 to $74,999 | 83 (11.1%) | 31 (2.2%) |
| $75,000 to $99,999 | 24 (3.2%) | 26 (1.9%) |
| $100,000 to $149,999 | 135 (18.0%) | 28 (2.0%) |
| $150,000 or more | 397 (53.1%) | 100 (7.2%) |
| Total | 748 (100.0%) | 1,388 (100.0%) |
Property Value to Household Income Ratio in Rumson borough
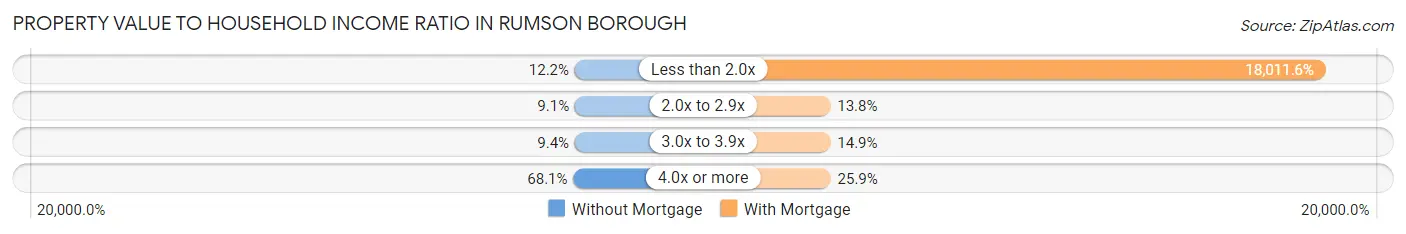
| Value-to-Income Ratio | Without Mortgage | With Mortgage |
| Less than 2.0x | 91 (12.2%) | 250,001 (18,011.6%) |
| 2.0x to 2.9x | 68 (9.1%) | 191 (13.8%) |
| 3.0x to 3.9x | 70 (9.4%) | 207 (14.9%) |
| 4.0x or more | 509 (68.0%) | 359 (25.9%) |
| Total | 748 (100.0%) | 1,388 (100.0%) |
Real Estate Taxes by Mortgage Status in Rumson borough
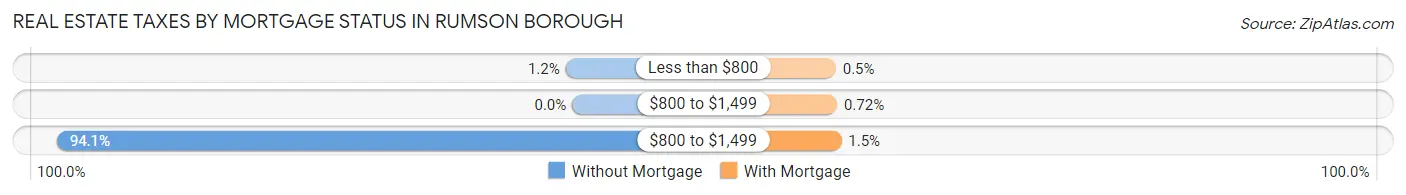
| Property Taxes | Without Mortgage | With Mortgage |
| Less than $800 | 9 (1.2%) | 7 (0.5%) |
| $800 to $1,499 | 0 (0.0%) | 10 (0.7%) |
| $800 to $1,499 | 704 (94.1%) | 21 (1.5%) |
| Total | 748 (100.0%) | 1,388 (100.0%) |
Health & Disability in Rumson borough
Health Insurance Coverage by Age in Rumson borough
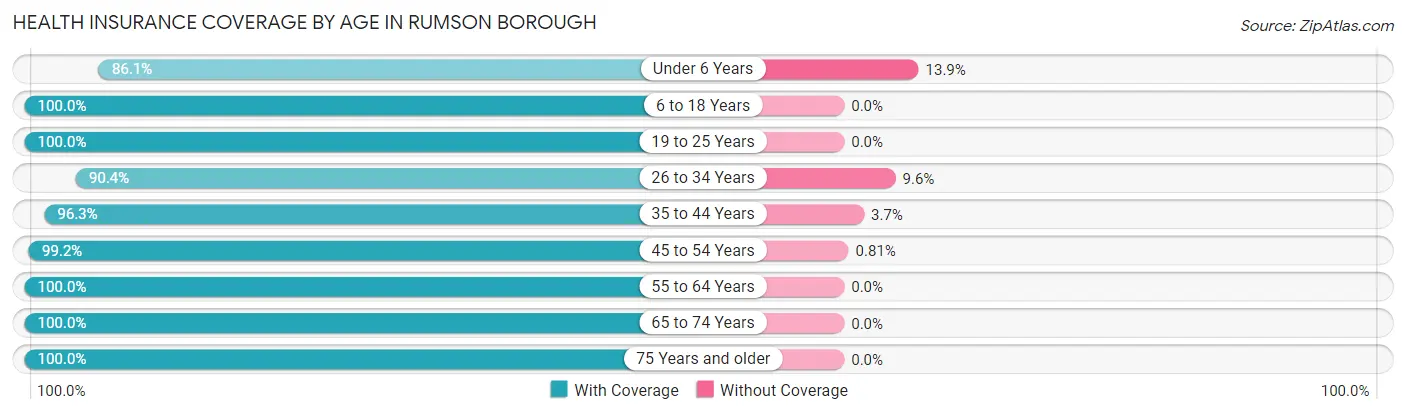
| Age Bracket | With Coverage | Without Coverage |
| Under 6 Years | 317 (86.1%) | 51 (13.9%) |
| 6 to 18 Years | 1,857 (100.0%) | 0 (0.0%) |
| 19 to 25 Years | 645 (100.0%) | 0 (0.0%) |
| 26 to 34 Years | 255 (90.4%) | 27 (9.6%) |
| 35 to 44 Years | 679 (96.3%) | 26 (3.7%) |
| 45 to 54 Years | 1,339 (99.2%) | 11 (0.8%) |
| 55 to 64 Years | 1,141 (100.0%) | 0 (0.0%) |
| 65 to 74 Years | 552 (100.0%) | 0 (0.0%) |
| 75 Years and older | 385 (100.0%) | 0 (0.0%) |
| Total | 7,170 (98.4%) | 115 (1.6%) |
Health Insurance Coverage by Citizenship Status in Rumson borough
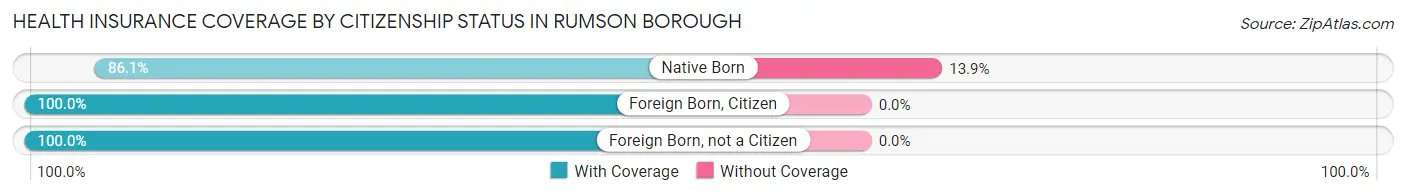
| Citizenship Status | With Coverage | Without Coverage |
| Native Born | 317 (86.1%) | 51 (13.9%) |
| Foreign Born, Citizen | 1,857 (100.0%) | 0 (0.0%) |
| Foreign Born, not a Citizen | 645 (100.0%) | 0 (0.0%) |
Health Insurance Coverage by Household Income in Rumson borough
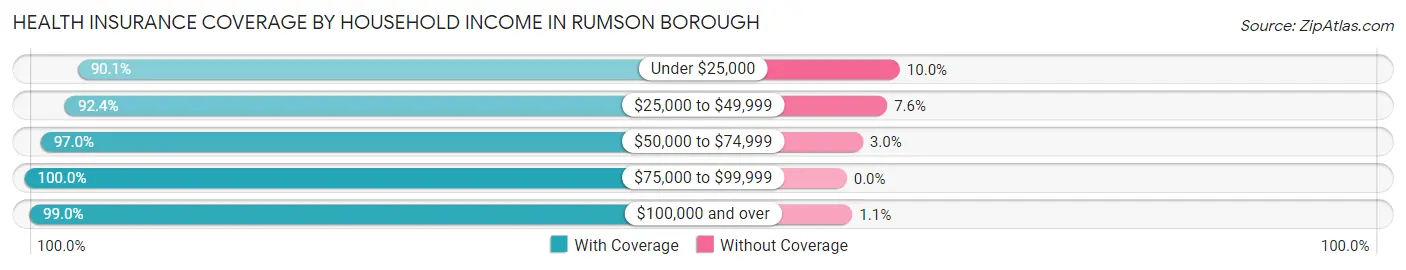
| Household Income | With Coverage | Without Coverage |
| Under $25,000 | 190 (90.0%) | 21 (10.0%) |
| $25,000 to $49,999 | 195 (92.4%) | 16 (7.6%) |
| $50,000 to $74,999 | 257 (97.0%) | 8 (3.0%) |
| $75,000 to $99,999 | 117 (100.0%) | 0 (0.0%) |
| $100,000 and over | 6,397 (99.0%) | 68 (1.1%) |
Public vs Private Health Insurance Coverage by Age in Rumson borough
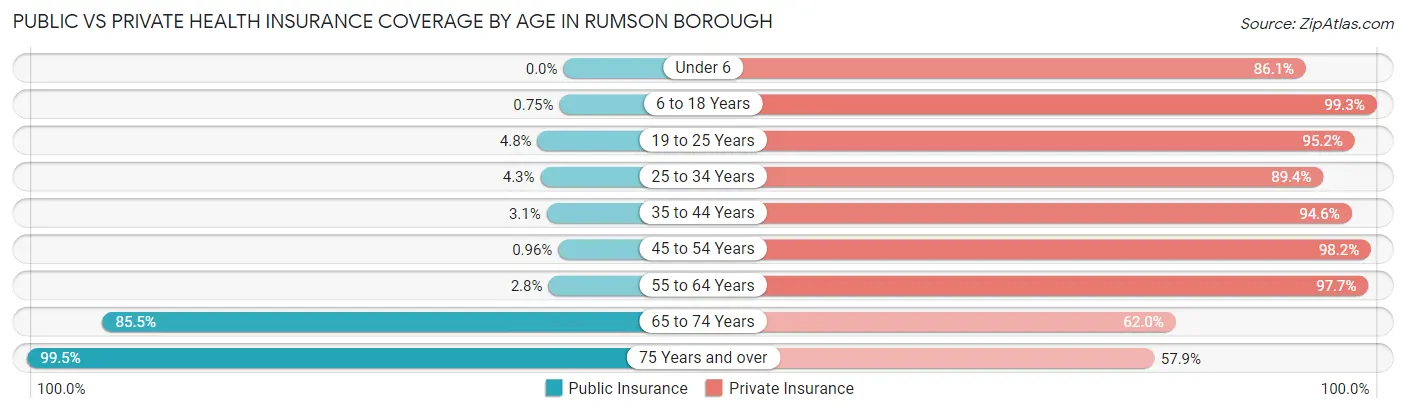
| Age Bracket | Public Insurance | Private Insurance |
| Under 6 | 0 (0.0%) | 317 (86.1%) |
| 6 to 18 Years | 14 (0.7%) | 1,843 (99.3%) |
| 19 to 25 Years | 31 (4.8%) | 614 (95.2%) |
| 25 to 34 Years | 12 (4.3%) | 252 (89.4%) |
| 35 to 44 Years | 22 (3.1%) | 667 (94.6%) |
| 45 to 54 Years | 13 (1.0%) | 1,326 (98.2%) |
| 55 to 64 Years | 32 (2.8%) | 1,115 (97.7%) |
| 65 to 74 Years | 472 (85.5%) | 342 (62.0%) |
| 75 Years and over | 383 (99.5%) | 223 (57.9%) |
| Total | 979 (13.4%) | 6,699 (92.0%) |
Disability Status by Sex by Age in Rumson borough
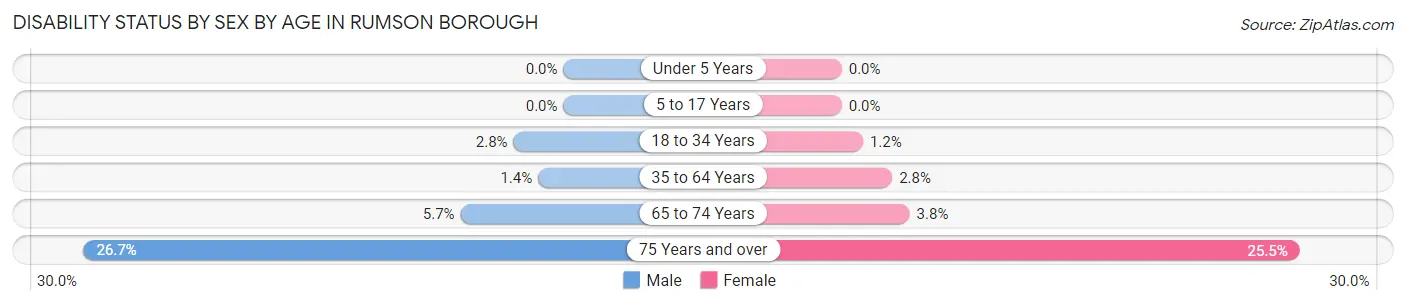
| Age Bracket | Male | Female |
| Under 5 Years | 0 (0.0%) | 0 (0.0%) |
| 5 to 17 Years | 0 (0.0%) | 0 (0.0%) |
| 18 to 34 Years | 21 (2.8%) | 4 (1.2%) |
| 35 to 64 Years | 22 (1.4%) | 46 (2.8%) |
| 65 to 74 Years | 18 (5.7%) | 9 (3.8%) |
| 75 Years and over | 62 (26.7%) | 39 (25.5%) |
Disability Class by Sex by Age in Rumson borough
Disability Class: Hearing Difficulty
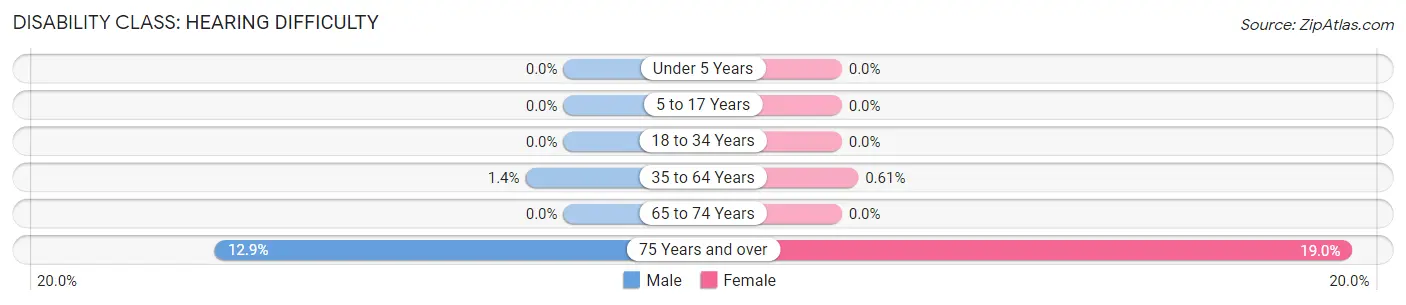
| Age Bracket | Male | Female |
| Under 5 Years | 0 (0.0%) | 0 (0.0%) |
| 5 to 17 Years | 0 (0.0%) | 0 (0.0%) |
| 18 to 34 Years | 0 (0.0%) | 0 (0.0%) |
| 35 to 64 Years | 22 (1.4%) | 10 (0.6%) |
| 65 to 74 Years | 0 (0.0%) | 0 (0.0%) |
| 75 Years and over | 30 (12.9%) | 29 (19.0%) |
Disability Class: Vision Difficulty
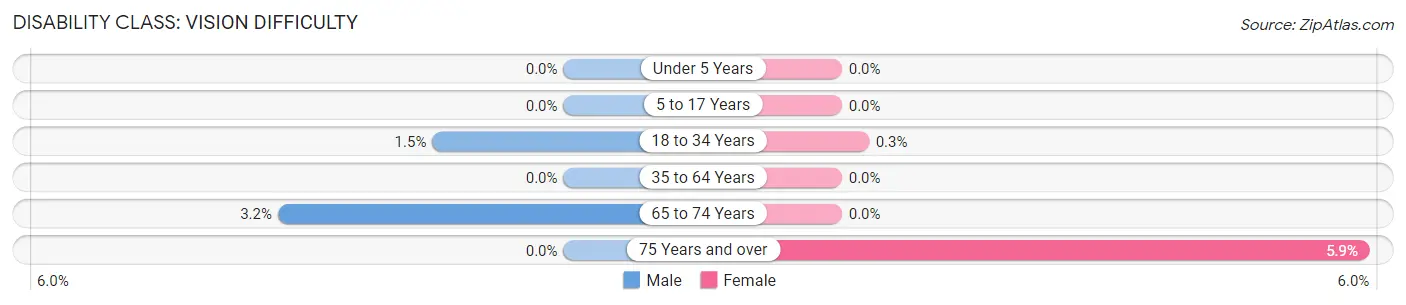
| Age Bracket | Male | Female |
| Under 5 Years | 0 (0.0%) | 0 (0.0%) |
| 5 to 17 Years | 0 (0.0%) | 0 (0.0%) |
| 18 to 34 Years | 11 (1.5%) | 1 (0.3%) |
| 35 to 64 Years | 0 (0.0%) | 0 (0.0%) |
| 65 to 74 Years | 10 (3.2%) | 0 (0.0%) |
| 75 Years and over | 0 (0.0%) | 9 (5.9%) |
Disability Class: Cognitive Difficulty
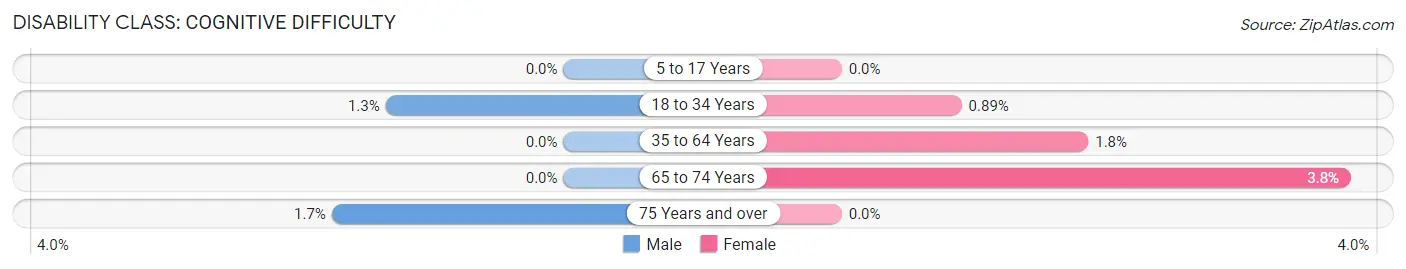
| Age Bracket | Male | Female |
| 5 to 17 Years | 0 (0.0%) | 0 (0.0%) |
| 18 to 34 Years | 10 (1.3%) | 3 (0.9%) |
| 35 to 64 Years | 0 (0.0%) | 30 (1.8%) |
| 65 to 74 Years | 0 (0.0%) | 9 (3.8%) |
| 75 Years and over | 4 (1.7%) | 0 (0.0%) |
Disability Class: Ambulatory Difficulty
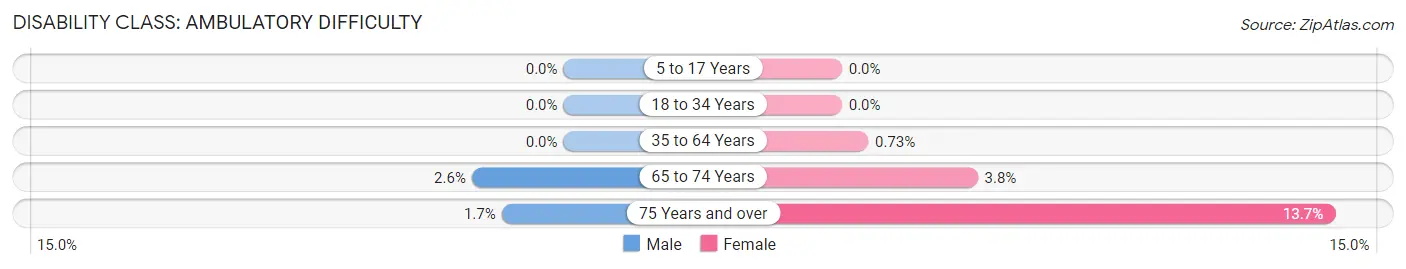
| Age Bracket | Male | Female |
| 5 to 17 Years | 0 (0.0%) | 0 (0.0%) |
| 18 to 34 Years | 0 (0.0%) | 0 (0.0%) |
| 35 to 64 Years | 0 (0.0%) | 12 (0.7%) |
| 65 to 74 Years | 8 (2.5%) | 9 (3.8%) |
| 75 Years and over | 4 (1.7%) | 21 (13.7%) |
Disability Class: Self-Care Difficulty
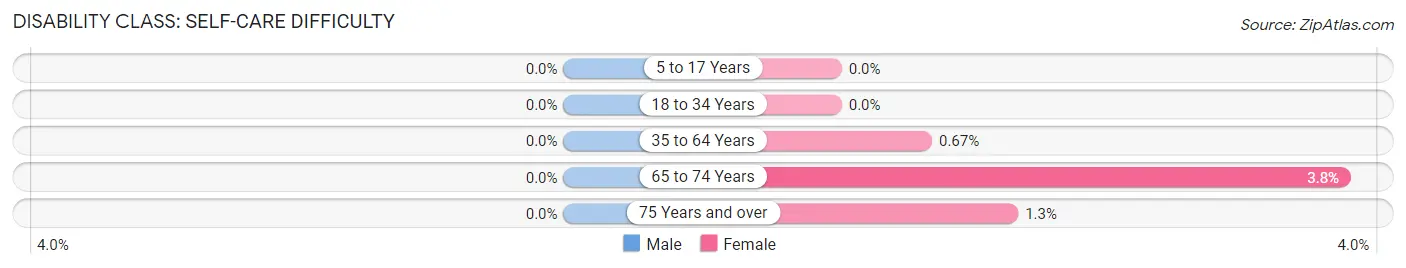
| Age Bracket | Male | Female |
| 5 to 17 Years | 0 (0.0%) | 0 (0.0%) |
| 18 to 34 Years | 0 (0.0%) | 0 (0.0%) |
| 35 to 64 Years | 0 (0.0%) | 11 (0.7%) |
| 65 to 74 Years | 0 (0.0%) | 9 (3.8%) |
| 75 Years and over | 0 (0.0%) | 2 (1.3%) |
Technology Access in Rumson borough
Computing Device Access in Rumson borough
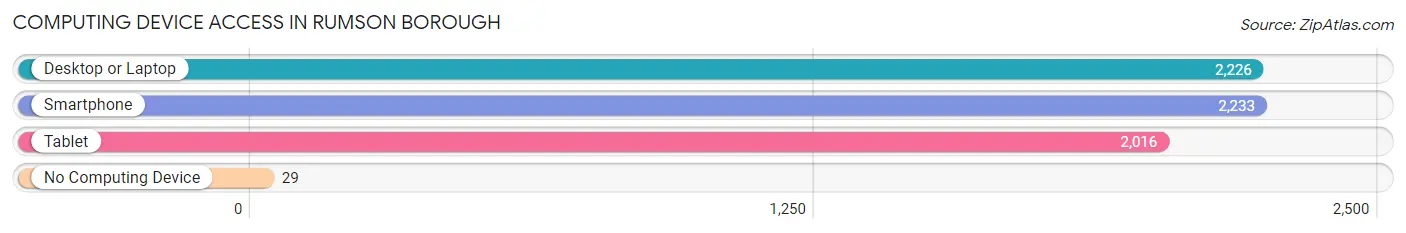
| Device Type | # Households | % Households |
| Desktop or Laptop | 2,226 | 96.7% |
| Smartphone | 2,233 | 97.0% |
| Tablet | 2,016 | 87.5% |
| No Computing Device | 29 | 1.3% |
| Total | 2,303 | 100.0% |
Internet Access in Rumson borough
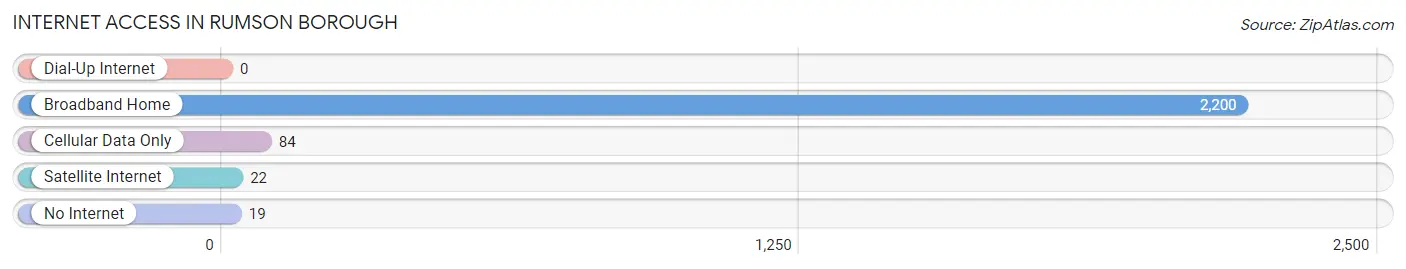
| Internet Type | # Households | % Households |
| Dial-Up Internet | 0 | 0.0% |
| Broadband Home | 2,200 | 95.5% |
| Cellular Data Only | 84 | 3.6% |
| Satellite Internet | 22 | 1.0% |
| No Internet | 19 | 0.8% |
| Total | 2,303 | 100.0% |
Rumson borough Summary
Rumson Borough is a small borough located in Monmouth County, New Jersey. It is situated on the Navesink River, and is bordered by the towns of Fair Haven, Little Silver, and Sea Bright. The borough has a population of 7,122 as of the 2010 census, and is part of the larger New York metropolitan area.
History
The area that is now Rumson Borough was originally inhabited by the Lenape Native Americans. The first European settlers arrived in the area in the late 17th century, and the area was officially incorporated as a borough in 1907. The name “Rumson” is derived from the Dutch word “Rumsen”, which means “place of wild roses”.
The borough was originally a farming community, and the area was known for its production of cranberries and blueberries. In the late 19th century, the area began to develop as a summer resort destination, and many wealthy New Yorkers built large estates in the area. The borough was also home to a number of prominent figures, including the Vanderbilts, the Astors, and the Rockefellers.
Geography
Rumson Borough is located at 40°22′N 74°02′W (40.3667, -74.0333). It is situated on the Navesink River, and is bordered by the towns of Fair Haven, Little Silver, and Sea Bright. The borough has a total area of 4.2 square miles, of which 4.1 square miles is land and 0.1 square miles is water.
The borough is located in a temperate climate zone, and has an average annual temperature of 54.3°F. The average annual precipitation is 46.3 inches, and the average annual snowfall is 22.3 inches.
Economy
The economy of Rumson Borough is largely based on tourism and retail. The borough is home to a number of restaurants, shops, and other businesses, as well as a number of marinas and yacht clubs. The borough is also home to a number of financial services firms, including banks, insurance companies, and investment firms.
Demographics
As of the 2010 census, there were 7,122 people, 2,717 households, and 2,092 families residing in the borough. The population density was 1,717.2 people per square mile. The racial makeup of the borough was 94.2% White, 1.3% African American, 0.2% Native American, 2.7% Asian, 0.1% Pacific Islander, 0.7% from other races, and 0.9% from two or more races. Hispanic or Latino of any race were 3.2% of the population.
The median income for a household in the borough was $125,917, and the median income for a family was $150,917. The per capita income for the borough was $68,917. About 2.2% of families and 3.2% of the population were below the poverty line, including 3.2% of those under age 18 and 3.2% of those age 65 or over.
Common Questions
What is the Total Population of Rumson borough?
Total Population of Rumson borough is 7,285.
What is the Total Male Population of Rumson borough?
Total Male Population of Rumson borough is 3,927.
What is the Total Female Population of Rumson borough?
Total Female Population of Rumson borough is 3,358.
What is the Ratio of Males per 100 Females in Rumson borough?
There are 116.94 Males per 100 Females in Rumson borough.
What is the Ratio of Females per 100 Males in Rumson borough?
There are 85.51 Females per 100 Males in Rumson borough.
What is the Median Population Age in Rumson borough?
Median Population Age in Rumson borough is 43.1 Years.
What is the Average Family Size in Rumson borough
Average Family Size in Rumson borough is 3.5 People.
What is the Average Household Size in Rumson borough
Average Household Size in Rumson borough is 3.2 People.
What is Per Capita Income in Rumson borough?
Per Capita income in Rumson borough is $136,277.
What is the Median Family Income in Rumson borough?
Median Family Income in Rumson borough is $250,001.
What is the Median Household income in Rumson borough?
Median Household Income in Rumson borough is $250,001.
What is Income or Wage Gap in Rumson borough?
Income or Wage Gap in Rumson borough is 71.9%.
Women in Rumson borough earn 28.1 cents for every dollar earned by a man.
What is Inequality or Gini Index in Rumson borough?
Inequality or Gini Index in Rumson borough is 0.52.
How Large is the Labor Force in Rumson borough?
There are 3,448 People in the Labor Forcein in Rumson borough.
What is the Percentage of People in the Labor Force in Rumson borough?
62.1% of People are in the Labor Force in Rumson borough.
What is the Unemployment Rate in Rumson borough?
Unemployment Rate in Rumson borough is 5.2%.