Highlands borough, NJ
Highlands borough Overview
4,646
TOTAL POPULATION
2,480
MALE POPULATION
2,166
FEMALE POPULATION
114.50
MALES / 100 FEMALES
87.34
FEMALES / 100 MALES
47.0
MEDIAN AGE
2.6
AVG FAMILY SIZE
1.9
AVG HOUSEHOLD SIZE
$72,422
PER CAPITA INCOME
$145,214
AVG FAMILY INCOME
$86,901
AVG HOUSEHOLD INCOME
38.0%
WAGE / INCOME GAP [ % ]
62.0¢/ $1
WAGE / INCOME GAP [ $ ]
0.49
INEQUALITY / GINI INDEX
2,684
LABOR FORCE [ PEOPLE ]
65.7%
PERCENT IN LABOR FORCE
6.3%
UNEMPLOYMENT RATE
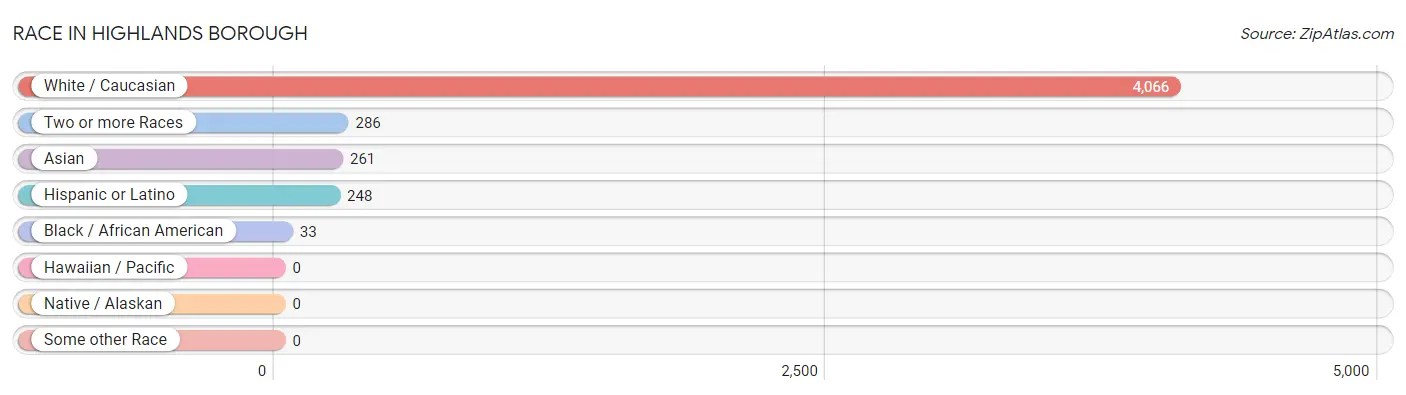
Race in Highlands borough
The most populous races in Highlands borough are White / Caucasian (4,066 | 87.5%), Two or more Races (286 | 6.2%), and Asian (261 | 5.6%).
| Race | # Population | % Population |
| Asian | 261 | 5.6% |
| Black / African American | 33 | 0.7% |
| Hawaiian / Pacific | 0 | 0.0% |
| Hispanic or Latino | 248 | 5.3% |
| Native / Alaskan | 0 | 0.0% |
| White / Caucasian | 4,066 | 87.5% |
| Two or more Races | 286 | 6.2% |
| Some other Race | 0 | 0.0% |
| Total | 4,646 | 100.0% |
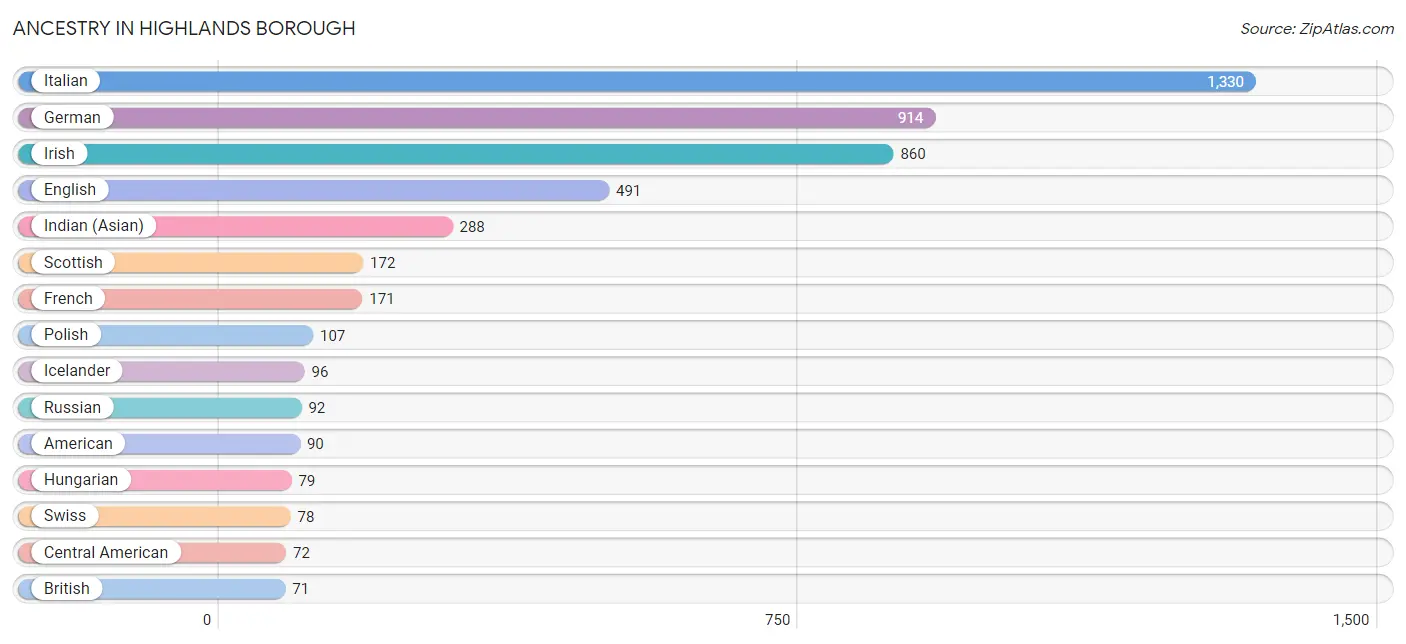
Ancestry in Highlands borough
The most populous ancestries reported in Highlands borough are Italian (1,330 | 28.6%), German (914 | 19.7%), Irish (860 | 18.5%), English (491 | 10.6%), and Indian (Asian) (288 | 6.2%), together accounting for 83.6% of all Highlands borough residents.
| Ancestry | # Population | % Population |
| African | 15 | 0.3% |
| American | 90 | 1.9% |
| Arab | 36 | 0.8% |
| Austrian | 17 | 0.4% |
| Belgian | 45 | 1.0% |
| Brazilian | 47 | 1.0% |
| British | 71 | 1.5% |
| Canadian | 16 | 0.3% |
| Central American | 72 | 1.5% |
| Chilean | 17 | 0.4% |
| Cuban | 20 | 0.4% |
| Czechoslovakian | 35 | 0.7% |
| Delaware | 21 | 0.4% |
| Dutch | 43 | 0.9% |
| Eastern European | 43 | 0.9% |
| English | 491 | 10.6% |
| European | 62 | 1.3% |
| French | 171 | 3.7% |
| German | 914 | 19.7% |
| German Russian | 32 | 0.7% |
| Hungarian | 79 | 1.7% |
| Icelander | 96 | 2.1% |
| Indian (Asian) | 288 | 6.2% |
| Irish | 860 | 18.5% |
| Italian | 1,330 | 28.6% |
| Lebanese | 18 | 0.4% |
| Mexican | 12 | 0.3% |
| Mexican American Indian | 12 | 0.3% |
| Moroccan | 18 | 0.4% |
| Nicaraguan | 10 | 0.2% |
| Norwegian | 35 | 0.7% |
| Peruvian | 36 | 0.8% |
| Polish | 107 | 2.3% |
| Puerto Rican | 44 | 0.9% |
| Romanian | 30 | 0.6% |
| Russian | 92 | 2.0% |
| Salvadoran | 62 | 1.3% |
| Scottish | 172 | 3.7% |
| South American | 53 | 1.1% |
| Spaniard | 23 | 0.5% |
| Spanish | 6 | 0.1% |
| Sri Lankan | 32 | 0.7% |
| Subsaharan African | 15 | 0.3% |
| Swedish | 42 | 0.9% |
| Swiss | 78 | 1.7% |
| Ukrainian | 5 | 0.1% |
| Welsh | 55 | 1.2% | View All 47 Rows |
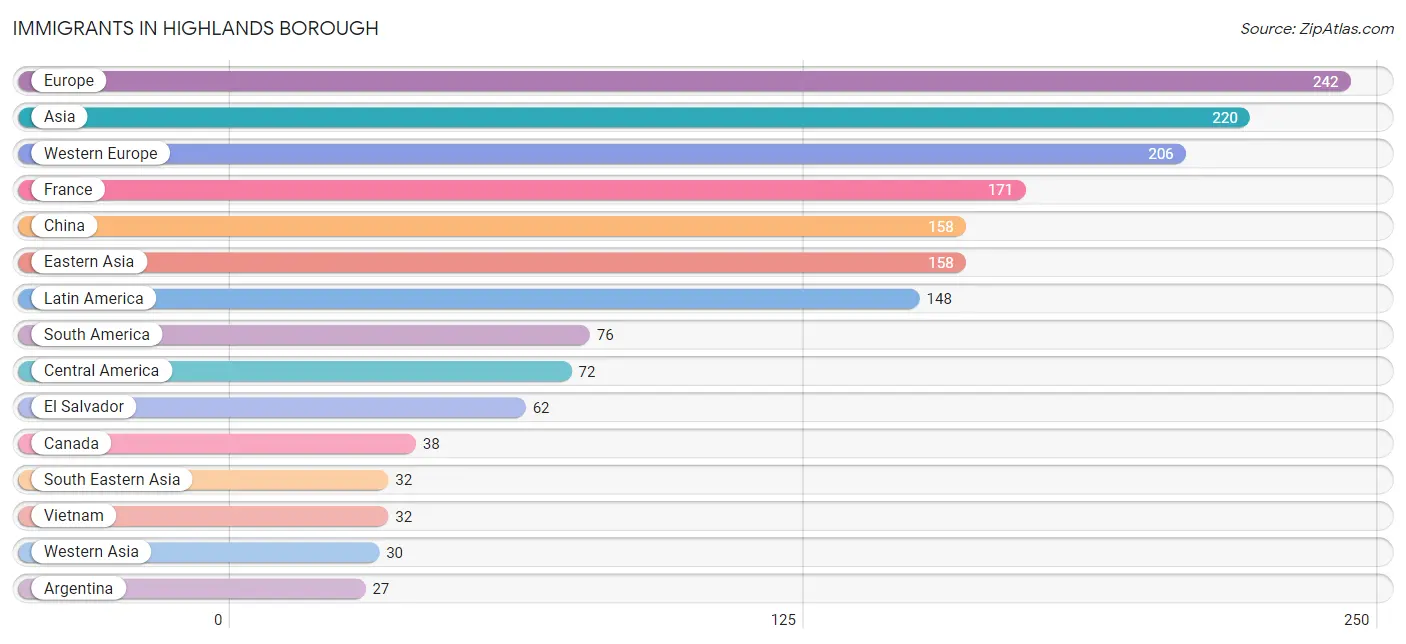
Immigrants in Highlands borough
The most numerous immigrant groups reported in Highlands borough came from Europe (242 | 5.2%), Asia (220 | 4.7%), Western Europe (206 | 4.4%), France (171 | 3.7%), and China (158 | 3.4%), together accounting for 21.5% of all Highlands borough residents.
| Immigration Origin | # Population | % Population |
| Argentina | 27 | 0.6% |
| Asia | 220 | 4.7% |
| Belgium | 25 | 0.5% |
| Brazil | 26 | 0.6% |
| Canada | 38 | 0.8% |
| Central America | 72 | 1.5% |
| China | 158 | 3.4% |
| Colombia | 23 | 0.5% |
| Eastern Asia | 158 | 3.4% |
| El Salvador | 62 | 1.3% |
| Europe | 242 | 5.2% |
| France | 171 | 3.7% |
| Germany | 10 | 0.2% |
| Italy | 18 | 0.4% |
| Latin America | 148 | 3.2% |
| Lebanon | 12 | 0.3% |
| Nicaragua | 10 | 0.2% |
| Northern Europe | 18 | 0.4% |
| South America | 76 | 1.6% |
| South Eastern Asia | 32 | 0.7% |
| Southern Europe | 18 | 0.4% |
| Turkey | 18 | 0.4% |
| Vietnam | 32 | 0.7% |
| Western Asia | 30 | 0.6% |
| Western Europe | 206 | 4.4% | View All 25 Rows |
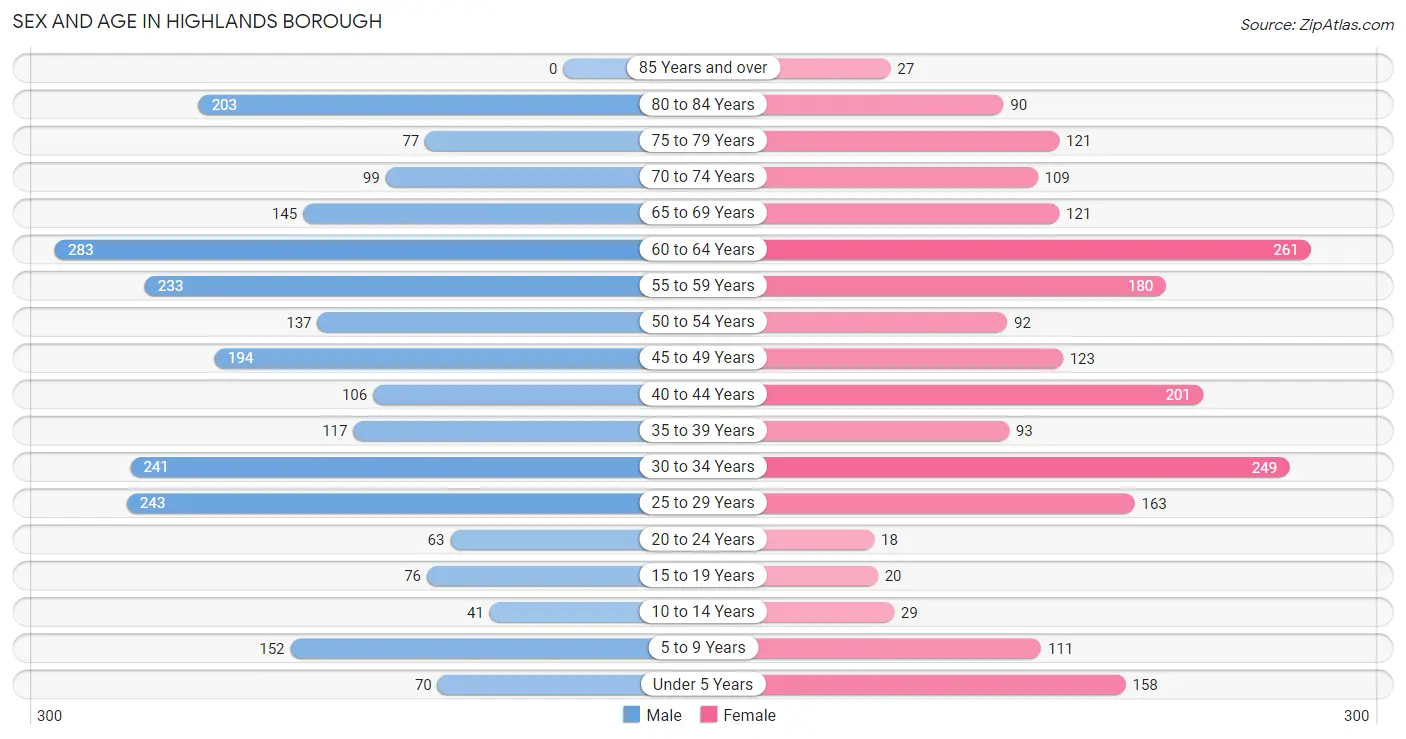
Sex and Age in Highlands borough
Sex and Age in Highlands borough
The most populous age groups in Highlands borough are 60 to 64 Years (283 | 11.4%) for men and 60 to 64 Years (261 | 12.0%) for women.
| Age Bracket | Male | Female |
| Under 5 Years | 70 (2.8%) | 158 (7.3%) |
| 5 to 9 Years | 152 (6.1%) | 111 (5.1%) |
| 10 to 14 Years | 41 (1.7%) | 29 (1.3%) |
| 15 to 19 Years | 76 (3.1%) | 20 (0.9%) |
| 20 to 24 Years | 63 (2.5%) | 18 (0.8%) |
| 25 to 29 Years | 243 (9.8%) | 163 (7.5%) |
| 30 to 34 Years | 241 (9.7%) | 249 (11.5%) |
| 35 to 39 Years | 117 (4.7%) | 93 (4.3%) |
| 40 to 44 Years | 106 (4.3%) | 201 (9.3%) |
| 45 to 49 Years | 194 (7.8%) | 123 (5.7%) |
| 50 to 54 Years | 137 (5.5%) | 92 (4.3%) |
| 55 to 59 Years | 233 (9.4%) | 180 (8.3%) |
| 60 to 64 Years | 283 (11.4%) | 261 (12.0%) |
| 65 to 69 Years | 145 (5.9%) | 121 (5.6%) |
| 70 to 74 Years | 99 (4.0%) | 109 (5.0%) |
| 75 to 79 Years | 77 (3.1%) | 121 (5.6%) |
| 80 to 84 Years | 203 (8.2%) | 90 (4.2%) |
| 85 Years and over | 0 (0.0%) | 27 (1.3%) |
| Total | 2,480 (100.0%) | 2,166 (100.0%) |
Families and Households in Highlands borough
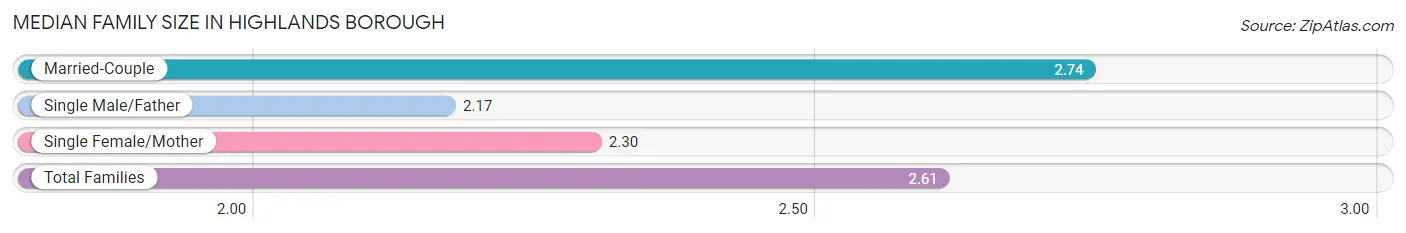
Median Family Size in Highlands borough
The median family size in Highlands borough is 2.61 persons per family, with married-couple families (900 | 74.0%) accounting for the largest median family size of 2.74 persons per family. On the other hand, single male/father families (166 | 13.7%) represent the smallest median family size with 2.17 persons per family.
| Family Type | # Families | Family Size |
| Married-Couple | 900 (74.0%) | 2.74 |
| Single Male/Father | 166 (13.7%) | 2.17 |
| Single Female/Mother | 150 (12.3%) | 2.30 |
| Total Families | 1,216 (100.0%) | 2.61 |
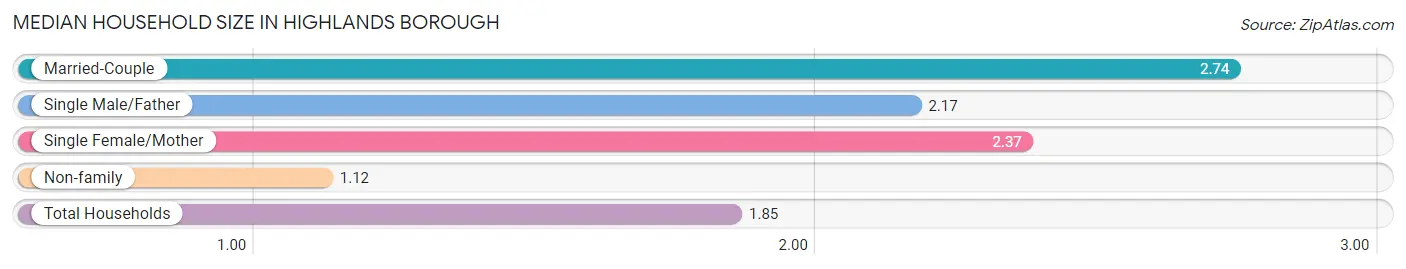
Median Household Size in Highlands borough
The median household size in Highlands borough is 1.85 persons per household, with married-couple households (900 | 35.8%) accounting for the largest median household size of 2.74 persons per household. non-family households (1,299 | 51.6%) represent the smallest median household size with 1.12 persons per household.
| Household Type | # Households | Household Size |
| Married-Couple | 900 (35.8%) | 2.74 |
| Single Male/Father | 166 (6.6%) | 2.17 |
| Single Female/Mother | 150 (6.0%) | 2.37 |
| Non-family | 1,299 (51.6%) | 1.12 |
| Total Households | 2,515 (100.0%) | 1.85 |
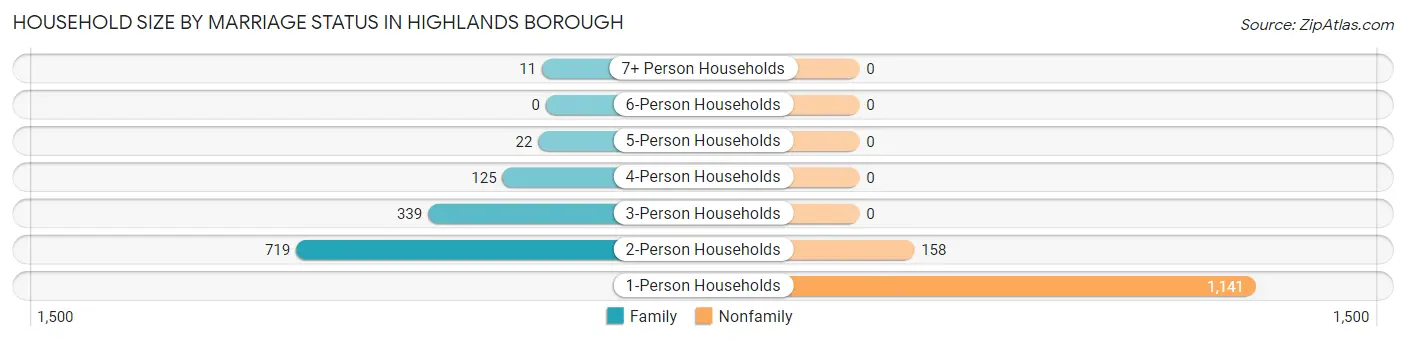
Household Size by Marriage Status in Highlands borough
Out of a total of 2,515 households in Highlands borough, 1,216 (48.3%) are family households, while 1,299 (51.6%) are nonfamily households. The most numerous type of family households are 2-person households, comprising 719, and the most common type of nonfamily households are 1-person households, comprising 1,141.
| Household Size | Family Households | Nonfamily Households |
| 1-Person Households | - | 1,141 (45.4%) |
| 2-Person Households | 719 (28.6%) | 158 (6.3%) |
| 3-Person Households | 339 (13.5%) | 0 (0.0%) |
| 4-Person Households | 125 (5.0%) | 0 (0.0%) |
| 5-Person Households | 22 (0.9%) | 0 (0.0%) |
| 6-Person Households | 0 (0.0%) | 0 (0.0%) |
| 7+ Person Households | 11 (0.4%) | 0 (0.0%) |
| Total | 1,216 (48.3%) | 1,299 (51.6%) |
Female Fertility in Highlands borough
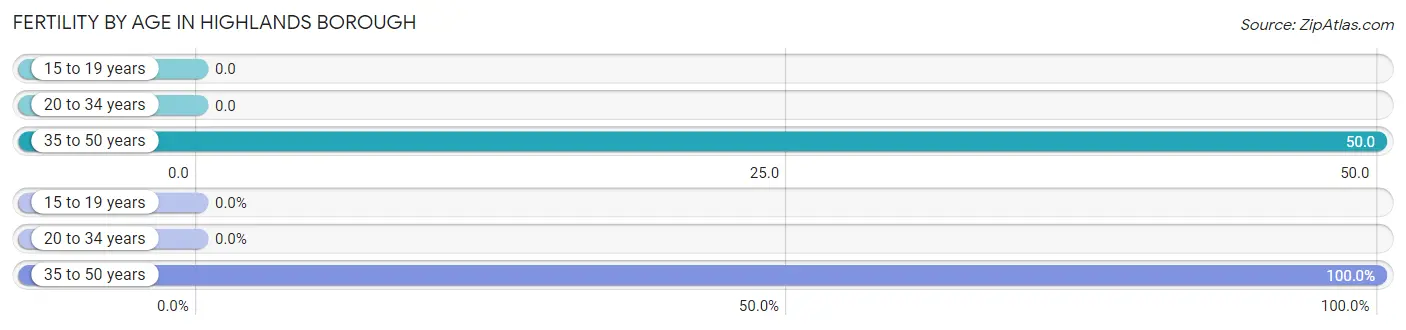
Fertility by Age in Highlands borough
Average fertility rate in Highlands borough is 24.0 births per 1,000 women. Women in the age bracket of 35 to 50 years have the highest fertility rate with 50.0 births per 1,000 women. Women in the age bracket of 35 to 50 years acount for 100.0% of all women with births.
| Age Bracket | Women with Births | Births / 1,000 Women |
| 15 to 19 years | 0 (0.0%) | 0.0 |
| 20 to 34 years | 0 (0.0%) | 0.0 |
| 35 to 50 years | 21 (100.0%) | 50.0 |
| Total | 21 (100.0%) | 24.0 |
Fertility by Age by Marriage Status in Highlands borough
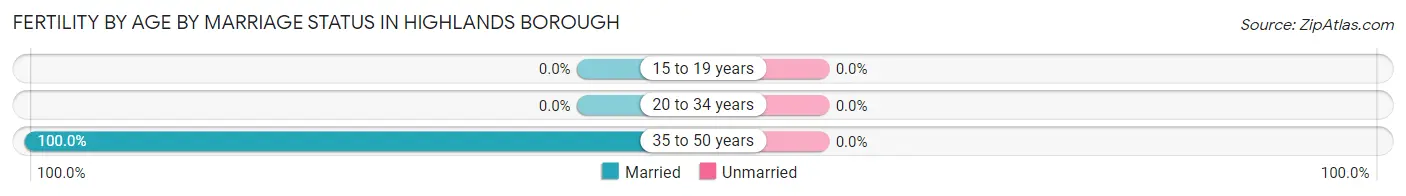
| Age Bracket | Married | Unmarried |
| 15 to 19 years | 0 (0.0%) | 0 (0.0%) |
| 20 to 34 years | 0 (0.0%) | 0 (0.0%) |
| 35 to 50 years | 21 (100.0%) | 0 (0.0%) |
| Total | 21 (100.0%) | 0 (0.0%) |
Fertility by Education in Highlands borough
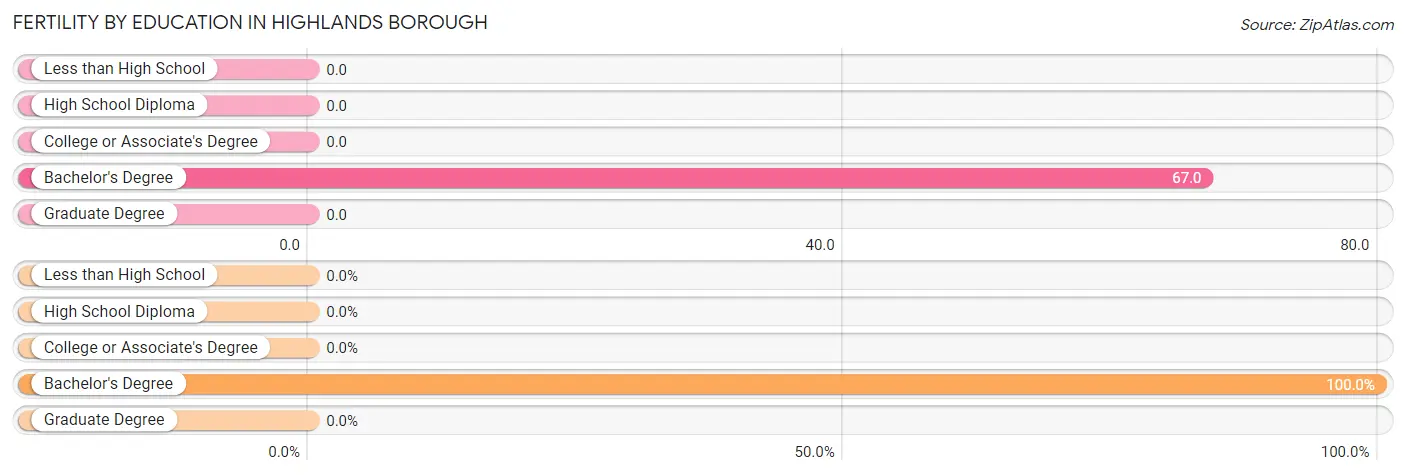
| Educational Attainment | Women with Births | Births / 1,000 Women |
| Less than High School | 0 (0.0%) | 0.0 |
| High School Diploma | 0 (0.0%) | 0.0 |
| College or Associate's Degree | 0 (0.0%) | 0.0 |
| Bachelor's Degree | 21 (100.0%) | 67.0 |
| Graduate Degree | 0 (0.0%) | 0.0 |
| Total | 21 (100.0%) | 24.0 |
Fertility by Education by Marriage Status in Highlands borough
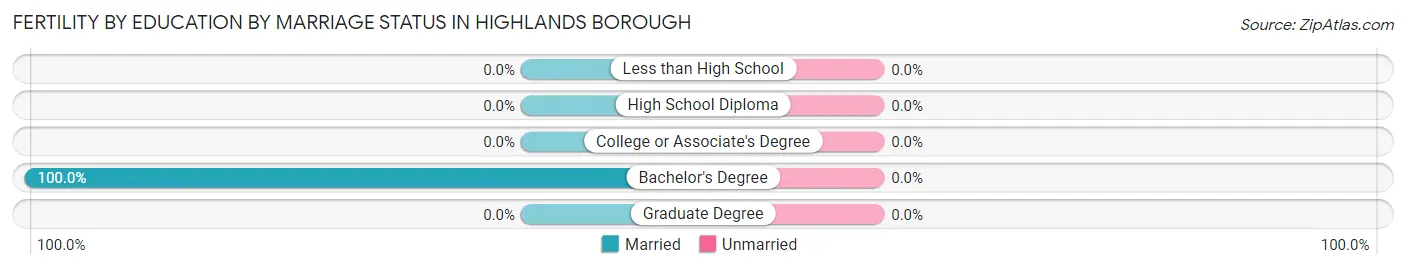
| Educational Attainment | Married | Unmarried |
| Less than High School | 0 (0.0%) | 0 (0.0%) |
| High School Diploma | 0 (0.0%) | 0 (0.0%) |
| College or Associate's Degree | 0 (0.0%) | 0 (0.0%) |
| Bachelor's Degree | 21 (100.0%) | 0 (0.0%) |
| Graduate Degree | 0 (0.0%) | 0 (0.0%) |
| Total | 21 (100.0%) | 0 (0.0%) |
Income in Highlands borough
Income Overview in Highlands borough
Per Capita Income in Highlands borough is $72,422, while median incomes of families and households are $145,214 and $86,901 respectively.
| Characteristic | Number | Measure |
| Per Capita Income | 4,646 | $72,422 |
| Median Family Income | 1,216 | $145,214 |
| Mean Family Income | 1,216 | $170,016 |
| Median Household Income | 2,515 | $86,901 |
| Mean Household Income | 2,515 | $132,198 |
| Income Deficit | 1,216 | $0 |
| Wage / Income Gap (%) | 4,646 | 38.01% |
| Wage / Income Gap ($) | 4,646 | 61.99¢ per $1 |
| Gini / Inequality Index | 4,646 | 0.49 |
Earnings by Sex in Highlands borough
Average Earnings in Highlands borough are $61,064, $72,591 for men and $45,000 for women, a difference of 38.0%.
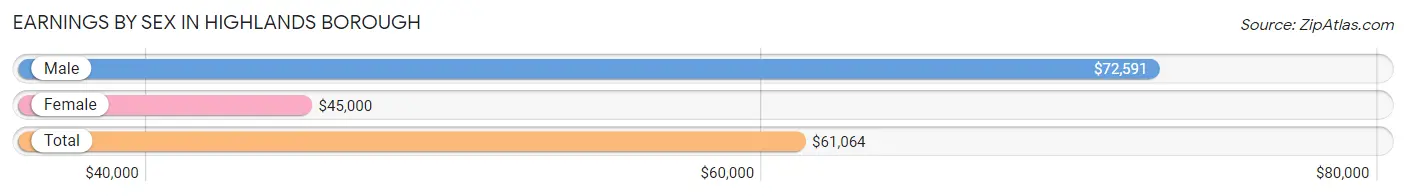
| Sex | Number | Average Earnings |
| Male | 1,608 (57.8%) | $72,591 |
| Female | 1,174 (42.2%) | $45,000 |
| Total | 2,782 (100.0%) | $61,064 |
Earnings by Sex by Income Bracket in Highlands borough
The most common earnings brackets in Highlands borough are $100,000+ for men (528 | 32.8%) and $100,000+ for women (325 | 27.7%).
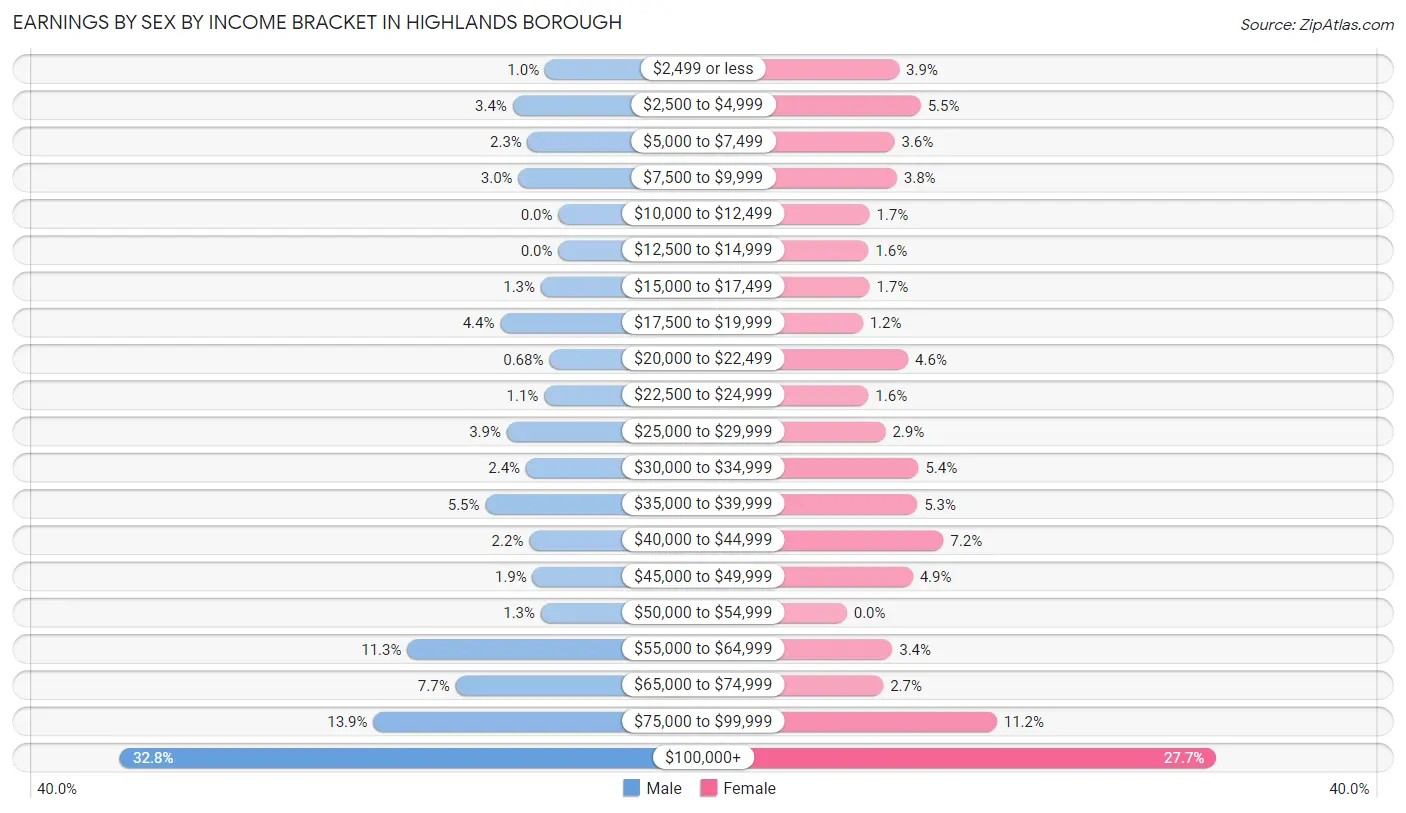
| Income | Male | Female |
| $2,499 or less | 16 (1.0%) | 46 (3.9%) |
| $2,500 to $4,999 | 55 (3.4%) | 65 (5.5%) |
| $5,000 to $7,499 | 37 (2.3%) | 42 (3.6%) |
| $7,500 to $9,999 | 48 (3.0%) | 44 (3.7%) |
| $10,000 to $12,499 | 0 (0.0%) | 20 (1.7%) |
| $12,500 to $14,999 | 0 (0.0%) | 19 (1.6%) |
| $15,000 to $17,499 | 21 (1.3%) | 20 (1.7%) |
| $17,500 to $19,999 | 70 (4.3%) | 14 (1.2%) |
| $20,000 to $22,499 | 11 (0.7%) | 54 (4.6%) |
| $22,500 to $24,999 | 17 (1.1%) | 19 (1.6%) |
| $25,000 to $29,999 | 62 (3.9%) | 34 (2.9%) |
| $30,000 to $34,999 | 39 (2.4%) | 63 (5.4%) |
| $35,000 to $39,999 | 88 (5.5%) | 62 (5.3%) |
| $40,000 to $44,999 | 35 (2.2%) | 85 (7.2%) |
| $45,000 to $49,999 | 31 (1.9%) | 58 (4.9%) |
| $50,000 to $54,999 | 21 (1.3%) | 0 (0.0%) |
| $55,000 to $64,999 | 182 (11.3%) | 40 (3.4%) |
| $65,000 to $74,999 | 124 (7.7%) | 32 (2.7%) |
| $75,000 to $99,999 | 223 (13.9%) | 132 (11.2%) |
| $100,000+ | 528 (32.8%) | 325 (27.7%) |
| Total | 1,608 (100.0%) | 1,174 (100.0%) |
Earnings by Sex by Educational Attainment in Highlands borough
Average earnings in Highlands borough are $73,886 for men and $45,819 for women, a difference of 38.0%. Men with an educational attainment of graduate degree enjoy the highest average annual earnings of $91,776, while those with high school diploma education earn the least with $45,859. Women with an educational attainment of bachelor's degree earn the most with the average annual earnings of $100,294, while those with college or associate's degree education have the smallest earnings of $34,438.
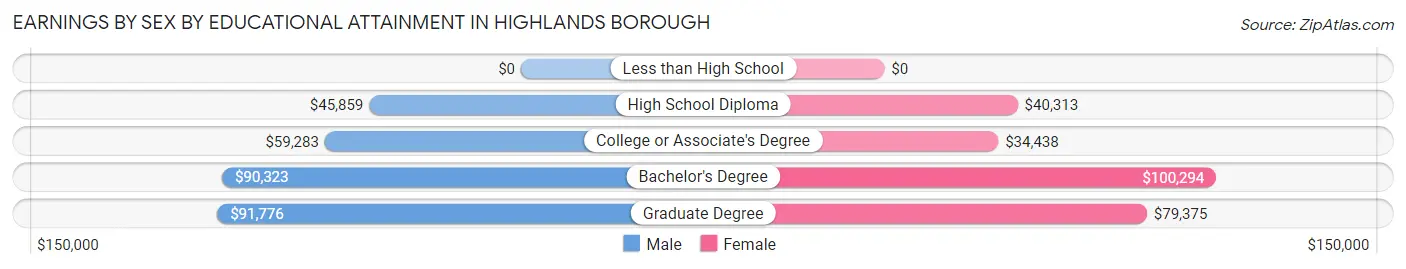
| Educational Attainment | Male Income | Female Income |
| Less than High School | - | - |
| High School Diploma | $45,859 | $40,313 |
| College or Associate's Degree | $59,283 | $34,438 |
| Bachelor's Degree | $90,323 | $100,294 |
| Graduate Degree | $91,776 | $79,375 |
| Total | $73,886 | $45,819 |
Family Income in Highlands borough
Family Income Brackets in Highlands borough
According to the Highlands borough family income data, there are 351 families falling into the $200,000+ income range, which is the most common income bracket and makes up 28.9% of all families.
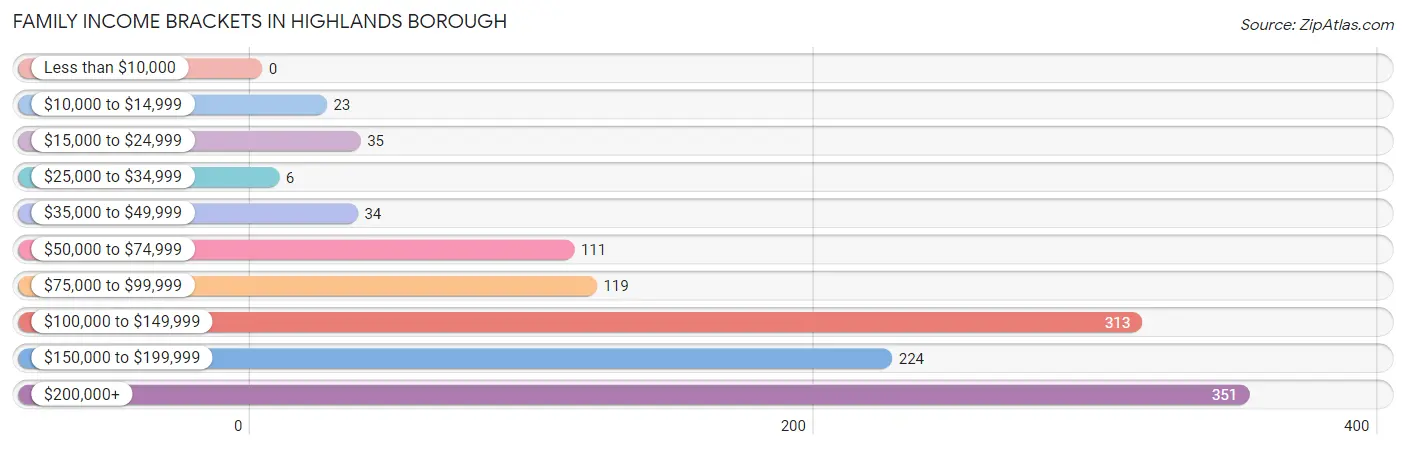
| Income Bracket | # Families | % Families |
| Less than $10,000 | 0 | 0.0% |
| $10,000 to $14,999 | 23 | 1.9% |
| $15,000 to $24,999 | 35 | 2.9% |
| $25,000 to $34,999 | 6 | 0.5% |
| $35,000 to $49,999 | 34 | 2.8% |
| $50,000 to $74,999 | 111 | 9.1% |
| $75,000 to $99,999 | 119 | 9.8% |
| $100,000 to $149,999 | 313 | 25.7% |
| $150,000 to $199,999 | 224 | 18.4% |
| $200,000+ | 351 | 28.9% |
Family Income by Famaliy Size in Highlands borough
3-person families (327 | 26.9%) account for the highest median family income in Highlands borough with $190,943 per family, while 3-person families (327 | 26.9%) have the highest median income of $63,648 per family member.
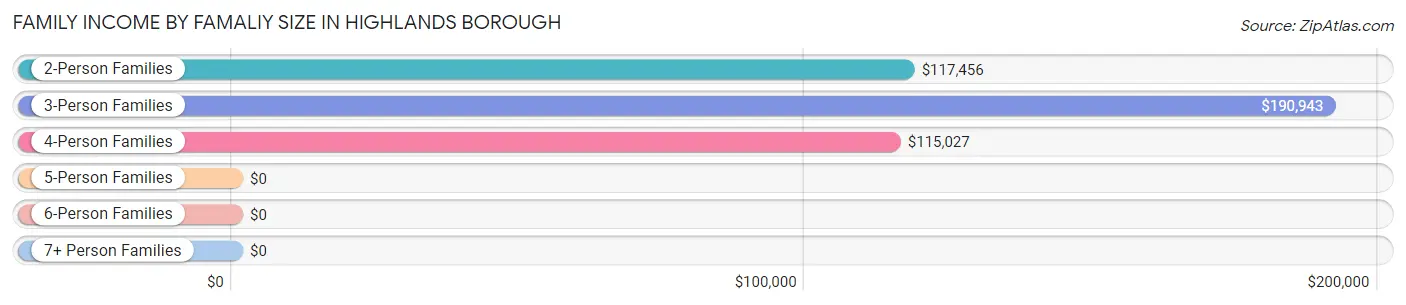
| Income Bracket | # Families | Median Income |
| 2-Person Families | 731 (60.1%) | $117,456 |
| 3-Person Families | 327 (26.9%) | $190,943 |
| 4-Person Families | 125 (10.3%) | $115,027 |
| 5-Person Families | 22 (1.8%) | $0 |
| 6-Person Families | 0 (0.0%) | $0 |
| 7+ Person Families | 11 (0.9%) | $0 |
| Total | 1,216 (100.0%) | $145,214 |
Family Income by Number of Earners in Highlands borough
The median family income in Highlands borough is $145,214, with families comprising 2 earners (722) having the highest median family income of $176,806, while families with no earners (94) have the lowest median family income of $52,222, accounting for 59.4% and 7.7% of families, respectively.
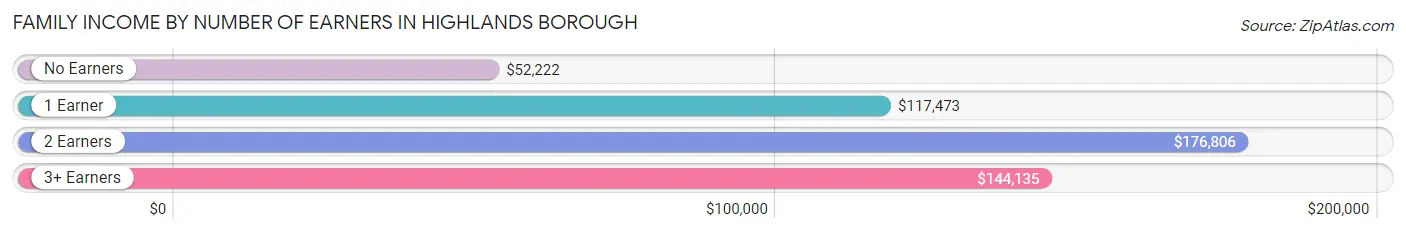
| Number of Earners | # Families | Median Income |
| No Earners | 94 (7.7%) | $52,222 |
| 1 Earner | 355 (29.2%) | $117,473 |
| 2 Earners | 722 (59.4%) | $176,806 |
| 3+ Earners | 45 (3.7%) | $144,135 |
| Total | 1,216 (100.0%) | $145,214 |
Household Income in Highlands borough
Household Income Brackets in Highlands borough
With 455 households falling in the category, the $200,000+ income range is the most frequent in Highlands borough, accounting for 18.1% of all households. In contrast, only 40 households (1.6%) fall into the $10,000 to $14,999 income bracket, making it the least populous group.
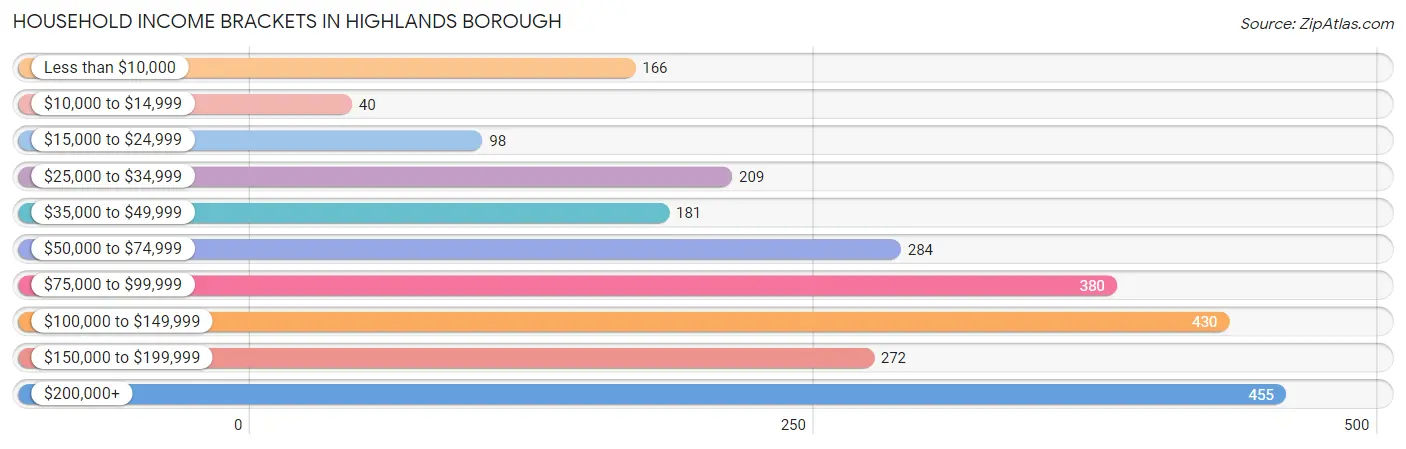
| Income Bracket | # Households | % Households |
| Less than $10,000 | 166 | 6.6% |
| $10,000 to $14,999 | 40 | 1.6% |
| $15,000 to $24,999 | 98 | 3.9% |
| $25,000 to $34,999 | 209 | 8.3% |
| $35,000 to $49,999 | 181 | 7.2% |
| $50,000 to $74,999 | 284 | 11.3% |
| $75,000 to $99,999 | 380 | 15.1% |
| $100,000 to $149,999 | 430 | 17.1% |
| $150,000 to $199,999 | 272 | 10.8% |
| $200,000+ | 455 | 18.1% |
Household Income by Householder Age in Highlands borough
The median household income in Highlands borough is $86,901, with the highest median household income of $116,004 found in the 25 to 44 years age bracket for the primary householder. A total of 798 households (31.7%) fall into this category.
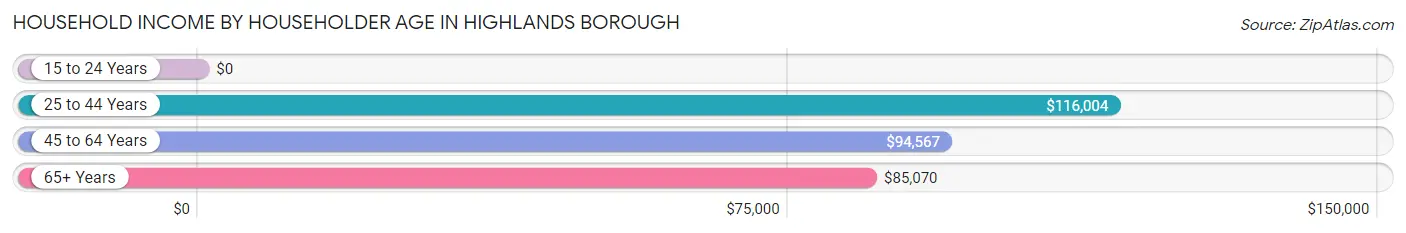
| Income Bracket | # Households | Median Income |
| 15 to 24 Years | 0 (0.0%) | $0 |
| 25 to 44 Years | 798 (31.7%) | $116,004 |
| 45 to 64 Years | 967 (38.5%) | $94,567 |
| 65+ Years | 750 (29.8%) | $85,070 |
| Total | 2,515 (100.0%) | $86,901 |
Poverty in Highlands borough
Income Below Poverty by Sex and Age in Highlands borough
With 5.9% poverty level for males and 6.3% for females among the residents of Highlands borough, 55 to 64 year old males and 25 to 34 year old females are the most vulnerable to poverty, with 88 males (17.1%) and 71 females (17.2%) in their respective age groups living below the poverty level.
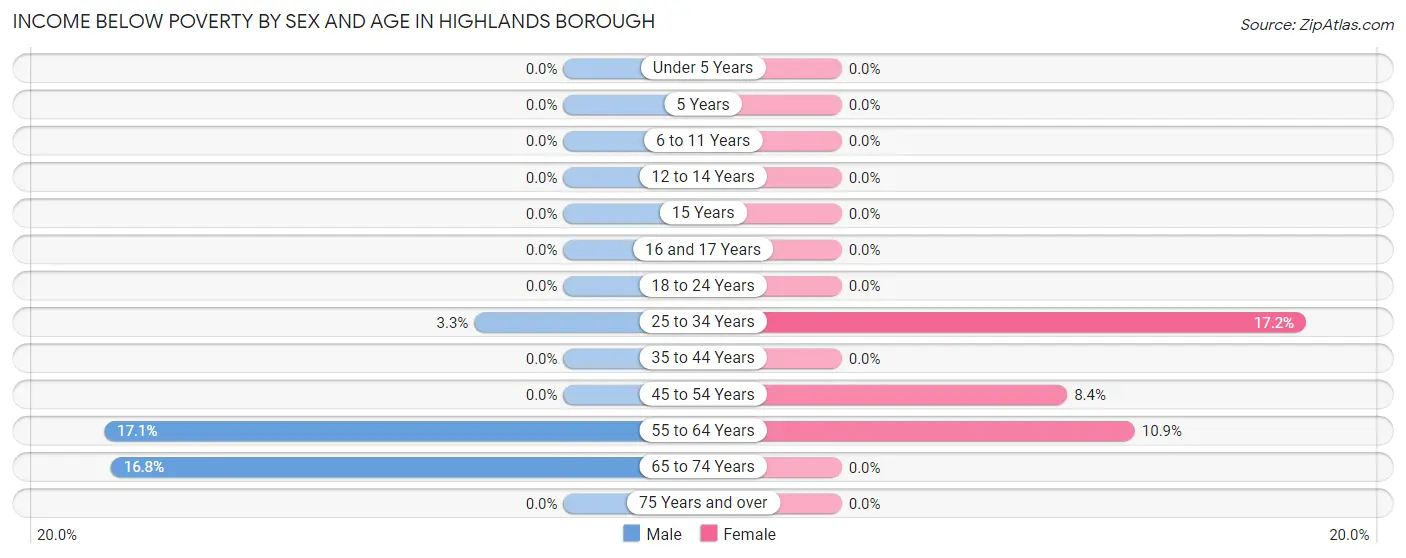
| Age Bracket | Male | Female |
| Under 5 Years | 0 (0.0%) | 0 (0.0%) |
| 5 Years | 0 (0.0%) | 0 (0.0%) |
| 6 to 11 Years | 0 (0.0%) | 0 (0.0%) |
| 12 to 14 Years | 0 (0.0%) | 0 (0.0%) |
| 15 Years | 0 (0.0%) | 0 (0.0%) |
| 16 and 17 Years | 0 (0.0%) | 0 (0.0%) |
| 18 to 24 Years | 0 (0.0%) | 0 (0.0%) |
| 25 to 34 Years | 16 (3.3%) | 71 (17.2%) |
| 35 to 44 Years | 0 (0.0%) | 0 (0.0%) |
| 45 to 54 Years | 0 (0.0%) | 18 (8.4%) |
| 55 to 64 Years | 88 (17.1%) | 48 (10.9%) |
| 65 to 74 Years | 41 (16.8%) | 0 (0.0%) |
| 75 Years and over | 0 (0.0%) | 0 (0.0%) |
| Total | 145 (5.9%) | 137 (6.3%) |
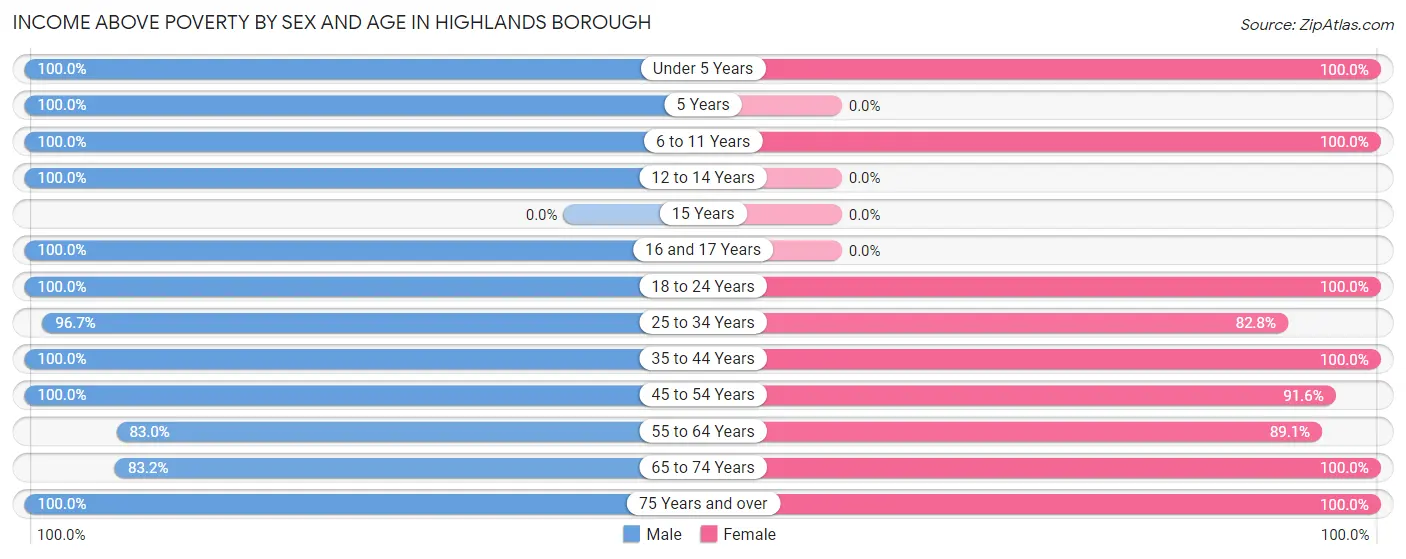
Income Above Poverty by Sex and Age in Highlands borough
According to the poverty statistics in Highlands borough, males aged under 5 years and females aged under 5 years are the age groups that are most secure financially, with 100.0% of males and 100.0% of females in these age groups living above the poverty line.
| Age Bracket | Male | Female |
| Under 5 Years | 70 (100.0%) | 158 (100.0%) |
| 5 Years | 11 (100.0%) | 0 (0.0%) |
| 6 to 11 Years | 162 (100.0%) | 140 (100.0%) |
| 12 to 14 Years | 20 (100.0%) | 0 (0.0%) |
| 15 Years | 0 (0.0%) | 0 (0.0%) |
| 16 and 17 Years | 76 (100.0%) | 0 (0.0%) |
| 18 to 24 Years | 63 (100.0%) | 38 (100.0%) |
| 25 to 34 Years | 468 (96.7%) | 341 (82.8%) |
| 35 to 44 Years | 223 (100.0%) | 294 (100.0%) |
| 45 to 54 Years | 331 (100.0%) | 197 (91.6%) |
| 55 to 64 Years | 428 (83.0%) | 393 (89.1%) |
| 65 to 74 Years | 203 (83.2%) | 230 (100.0%) |
| 75 Years and over | 280 (100.0%) | 238 (100.0%) |
| Total | 2,335 (94.2%) | 2,029 (93.7%) |
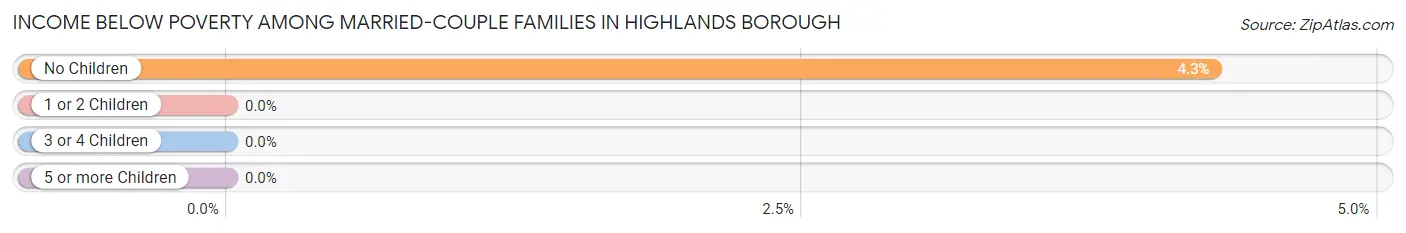
Income Below Poverty Among Married-Couple Families in Highlands borough
The poverty statistics for married-couple families in Highlands borough show that 2.6% or 23 of the total 900 families live below the poverty line. Families with no children have the highest poverty rate of 4.3%, comprising of 23 families. On the other hand, families with 1 or 2 children have the lowest poverty rate of 0.0%, which includes 0 families.
| Children | Above Poverty | Below Poverty |
| No Children | 514 (95.7%) | 23 (4.3%) |
| 1 or 2 Children | 343 (100.0%) | 0 (0.0%) |
| 3 or 4 Children | 20 (100.0%) | 0 (0.0%) |
| 5 or more Children | 0 (0.0%) | 0 (0.0%) |
| Total | 877 (97.4%) | 23 (2.6%) |
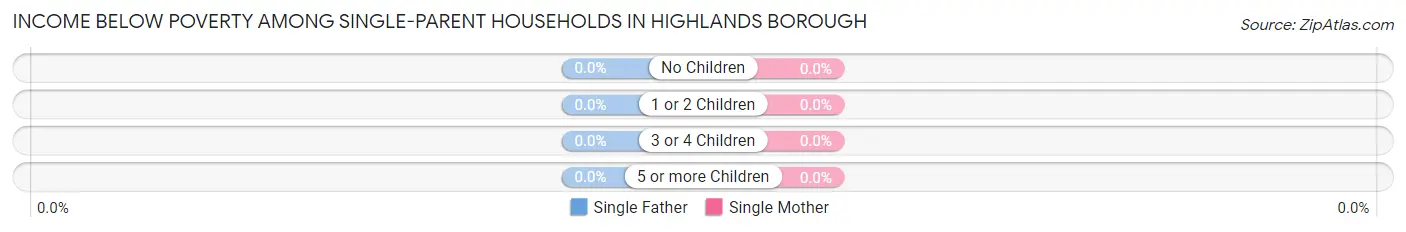
Income Below Poverty Among Single-Parent Households in Highlands borough
| Children | Single Father | Single Mother |
| No Children | 0 (0.0%) | 0 (0.0%) |
| 1 or 2 Children | 0 (0.0%) | 0 (0.0%) |
| 3 or 4 Children | 0 (0.0%) | 0 (0.0%) |
| 5 or more Children | 0 (0.0%) | 0 (0.0%) |
| Total | 0 (0.0%) | 0 (0.0%) |
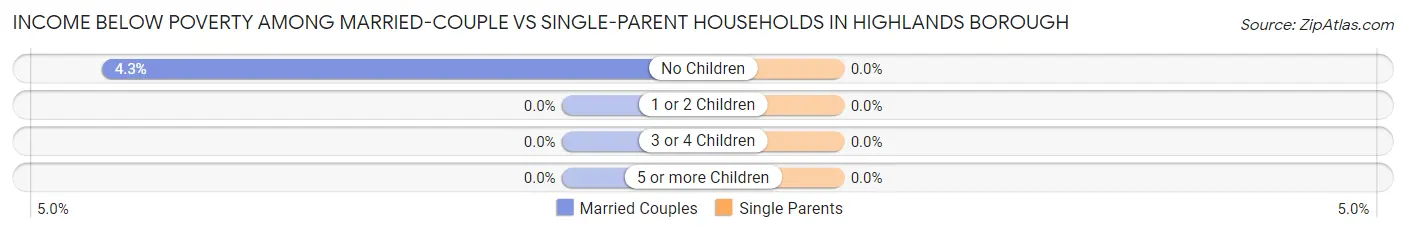
Income Below Poverty Among Married-Couple vs Single-Parent Households in Highlands borough
| Children | Married-Couple Families | Single-Parent Households |
| No Children | 23 (4.3%) | 0 (0.0%) |
| 1 or 2 Children | 0 (0.0%) | 0 (0.0%) |
| 3 or 4 Children | 0 (0.0%) | 0 (0.0%) |
| 5 or more Children | 0 (0.0%) | 0 (0.0%) |
| Total | 23 (2.6%) | 0 (0.0%) |
Employment Characteristics in Highlands borough
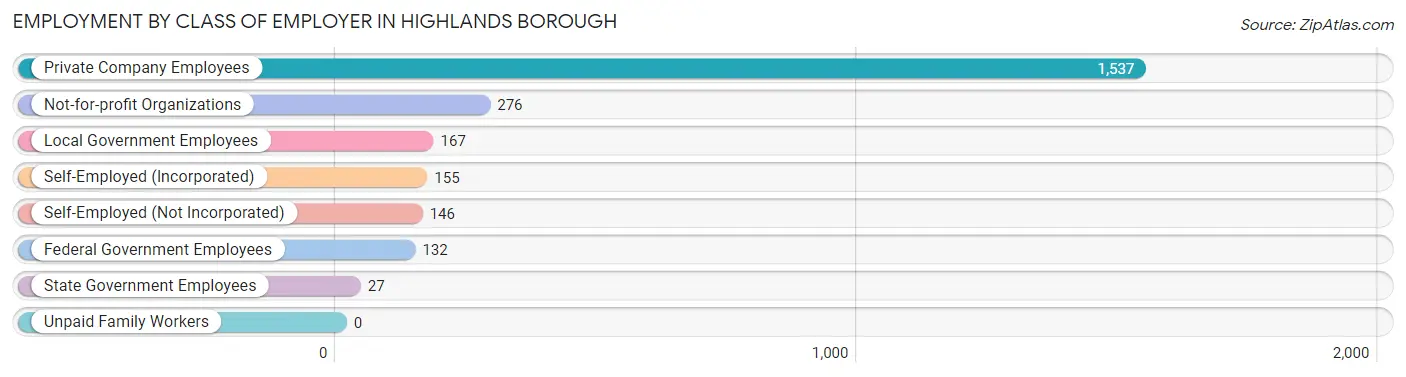
Employment by Class of Employer in Highlands borough
Among the 2,440 employed individuals in Highlands borough, private company employees (1,537 | 63.0%), not-for-profit organizations (276 | 11.3%), and local government employees (167 | 6.8%) make up the most common classes of employment.
| Employer Class | # Employees | % Employees |
| Private Company Employees | 1,537 | 63.0% |
| Self-Employed (Incorporated) | 155 | 6.4% |
| Self-Employed (Not Incorporated) | 146 | 6.0% |
| Not-for-profit Organizations | 276 | 11.3% |
| Local Government Employees | 167 | 6.8% |
| State Government Employees | 27 | 1.1% |
| Federal Government Employees | 132 | 5.4% |
| Unpaid Family Workers | 0 | 0.0% |
| Total | 2,440 | 100.0% |
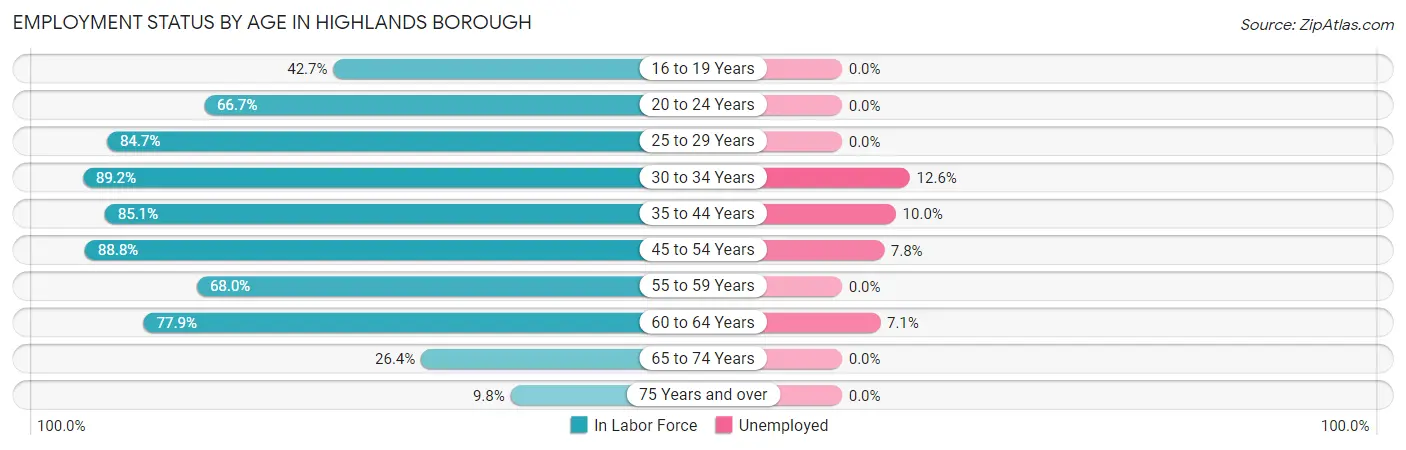
Employment Status by Age in Highlands borough
According to the labor force statistics for Highlands borough, out of the total population over 16 years of age (4,085), 65.7% or 2,684 individuals are in the labor force, with 6.3% or 169 of them unemployed. The age group with the highest labor force participation rate is 30 to 34 years, with 89.2% or 437 individuals in the labor force. Within the labor force, the 30 to 34 years age range has the highest percentage of unemployed individuals, with 12.6% or 55 of them being unemployed.
| Age Bracket | In Labor Force | Unemployed |
| 16 to 19 Years | 41 (42.7%) | 0 (0.0%) |
| 20 to 24 Years | 54 (66.7%) | 0 (0.0%) |
| 25 to 29 Years | 344 (84.7%) | 0 (0.0%) |
| 30 to 34 Years | 437 (89.2%) | 55 (12.6%) |
| 35 to 44 Years | 440 (85.1%) | 44 (10.0%) |
| 45 to 54 Years | 485 (88.8%) | 38 (7.8%) |
| 55 to 59 Years | 281 (68.0%) | 0 (0.0%) |
| 60 to 64 Years | 424 (77.9%) | 30 (7.1%) |
| 65 to 74 Years | 125 (26.4%) | 0 (0.0%) |
| 75 Years and over | 51 (9.8%) | 0 (0.0%) |
| Total | 2,684 (65.7%) | 169 (6.3%) |
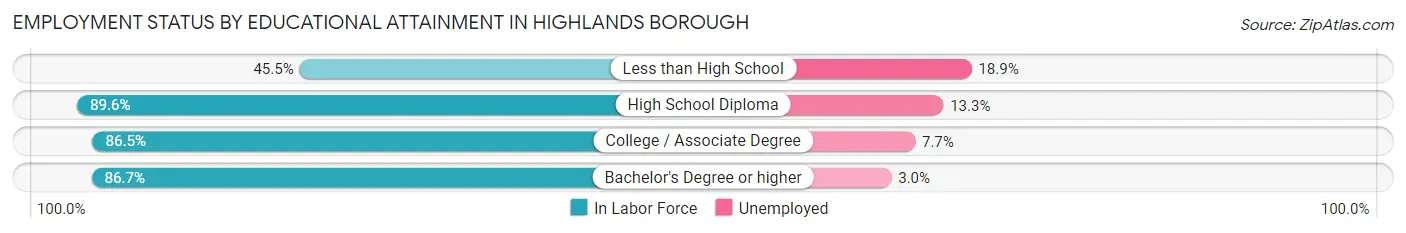
Employment Status by Educational Attainment in Highlands borough
According to labor force statistics for Highlands borough, 82.7% of individuals (2,412) out of the total population between 25 and 64 years of age (2,916) are in the labor force, with 7.1% or 171 of them being unemployed. The group with the highest labor force participation rate are those with the educational attainment of high school diploma, with 89.6% or 430 individuals in the labor force. Within the labor force, individuals with less than high school education have the highest percentage of unemployment, with 18.9% or 27 of them being unemployed.
| Educational Attainment | In Labor Force | Unemployed |
| Less than High School | 143 (45.5%) | 59 (18.9%) |
| High School Diploma | 430 (89.6%) | 64 (13.3%) |
| College / Associate Degree | 637 (86.5%) | 57 (7.7%) |
| Bachelor's Degree or higher | 1,202 (86.7%) | 42 (3.0%) |
| Total | 2,412 (82.7%) | 207 (7.1%) |
Employment Occupations by Sex in Highlands borough
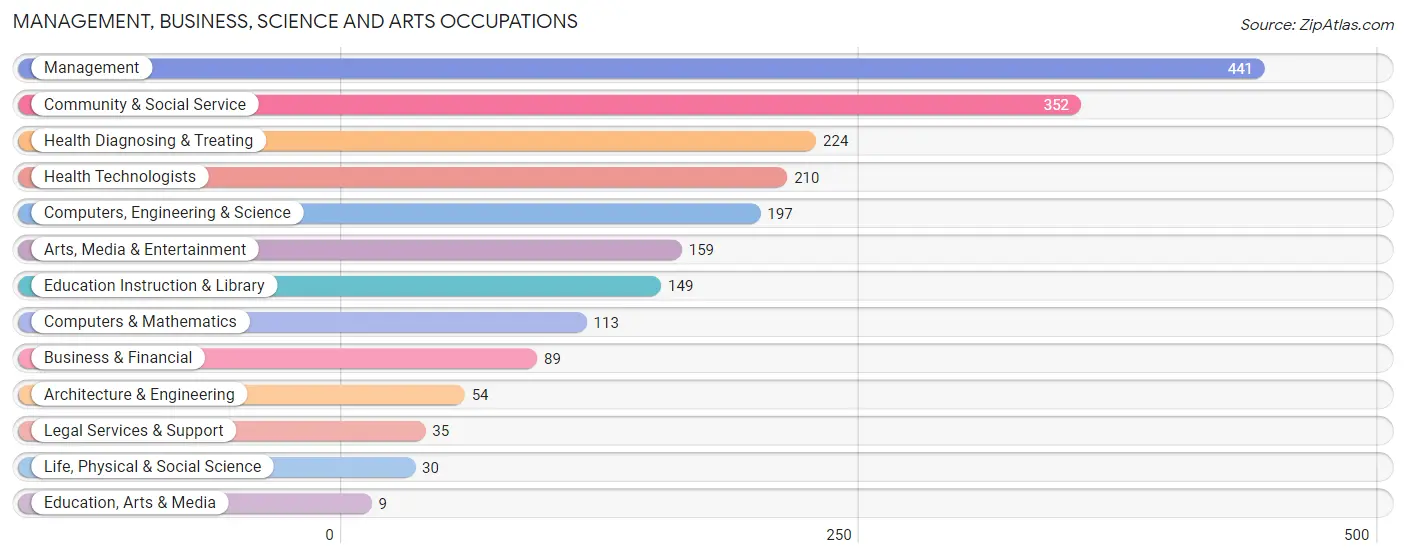
Management, Business, Science and Arts Occupations
The most common Management, Business, Science and Arts occupations in Highlands borough are Management (441 | 17.9%), Community & Social Service (352 | 14.3%), Health Diagnosing & Treating (224 | 9.1%), Health Technologists (210 | 8.5%), and Computers, Engineering & Science (197 | 8.0%).
Management, Business, Science and Arts Occupations by Sex
Within the Management, Business, Science and Arts occupations in Highlands borough, the most male-oriented occupations are Computers & Mathematics (100.0%), Architecture & Engineering (100.0%), and Computers, Engineering & Science (84.8%), while the most female-oriented occupations are Life, Physical & Social Science (100.0%), Education, Arts & Media (100.0%), and Health Diagnosing & Treating (74.6%).
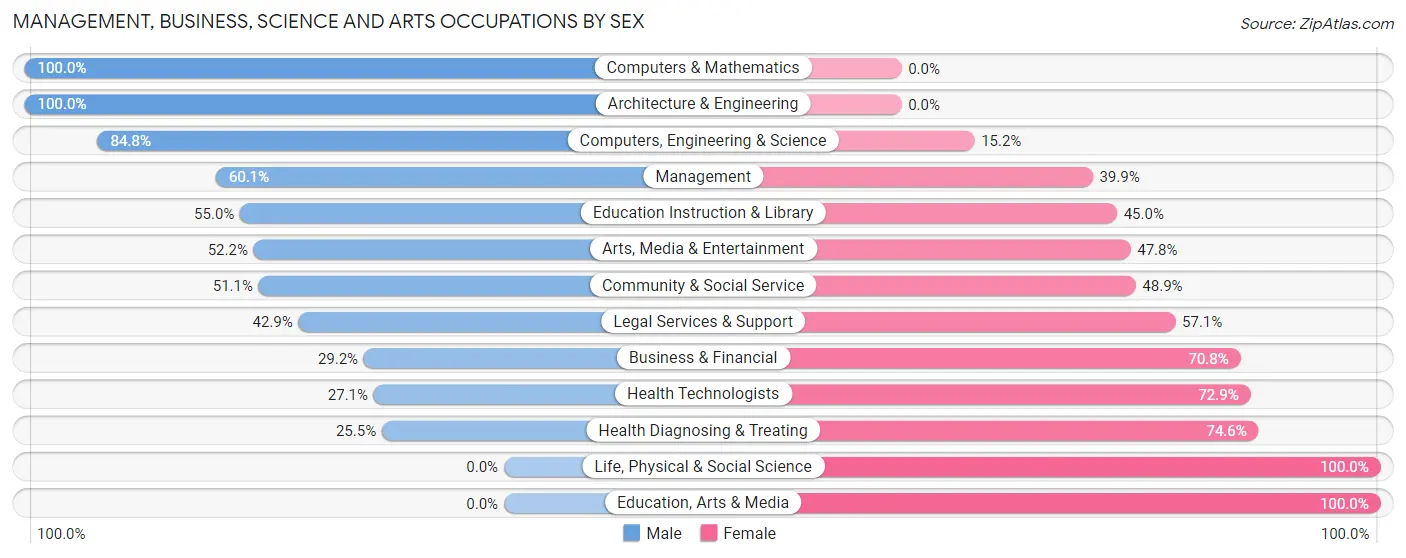
| Occupation | Male | Female |
| Management | 265 (60.1%) | 176 (39.9%) |
| Business & Financial | 26 (29.2%) | 63 (70.8%) |
| Computers, Engineering & Science | 167 (84.8%) | 30 (15.2%) |
| Computers & Mathematics | 113 (100.0%) | 0 (0.0%) |
| Architecture & Engineering | 54 (100.0%) | 0 (0.0%) |
| Life, Physical & Social Science | 0 (0.0%) | 30 (100.0%) |
| Community & Social Service | 180 (51.1%) | 172 (48.9%) |
| Education, Arts & Media | 0 (0.0%) | 9 (100.0%) |
| Legal Services & Support | 15 (42.9%) | 20 (57.1%) |
| Education Instruction & Library | 82 (55.0%) | 67 (45.0%) |
| Arts, Media & Entertainment | 83 (52.2%) | 76 (47.8%) |
| Health Diagnosing & Treating | 57 (25.5%) | 167 (74.6%) |
| Health Technologists | 57 (27.1%) | 153 (72.9%) |
| Total (Category) | 695 (53.3%) | 608 (46.7%) |
| Total (Overall) | 1,412 (57.3%) | 1,051 (42.7%) |
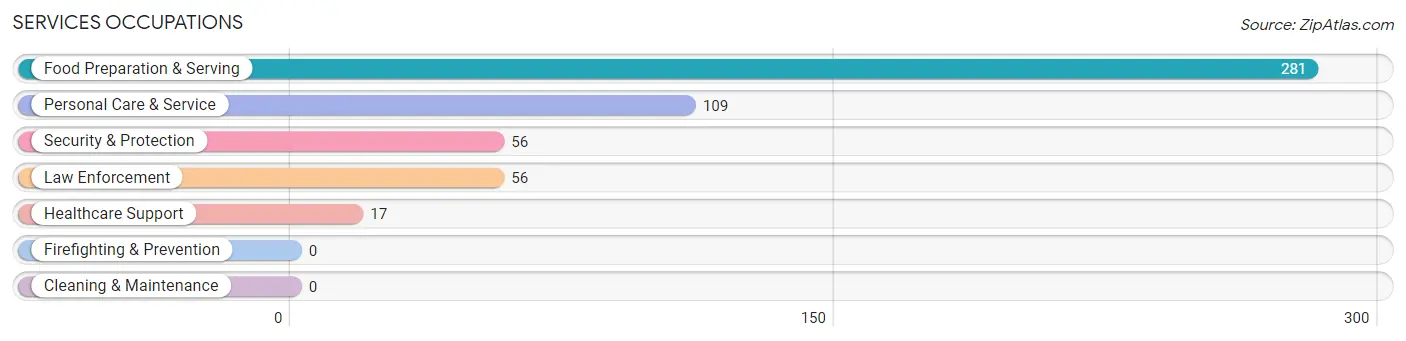
Services Occupations
The most common Services occupations in Highlands borough are Food Preparation & Serving (281 | 11.4%), Personal Care & Service (109 | 4.4%), Security & Protection (56 | 2.3%), Law Enforcement (56 | 2.3%), and Healthcare Support (17 | 0.7%).
Services Occupations by Sex
Within the Services occupations in Highlands borough, the most male-oriented occupations are Healthcare Support (100.0%), Security & Protection (78.6%), and Law Enforcement (78.6%), while the most female-oriented occupations are Personal Care & Service (86.2%), Food Preparation & Serving (48.7%), and Security & Protection (21.4%).
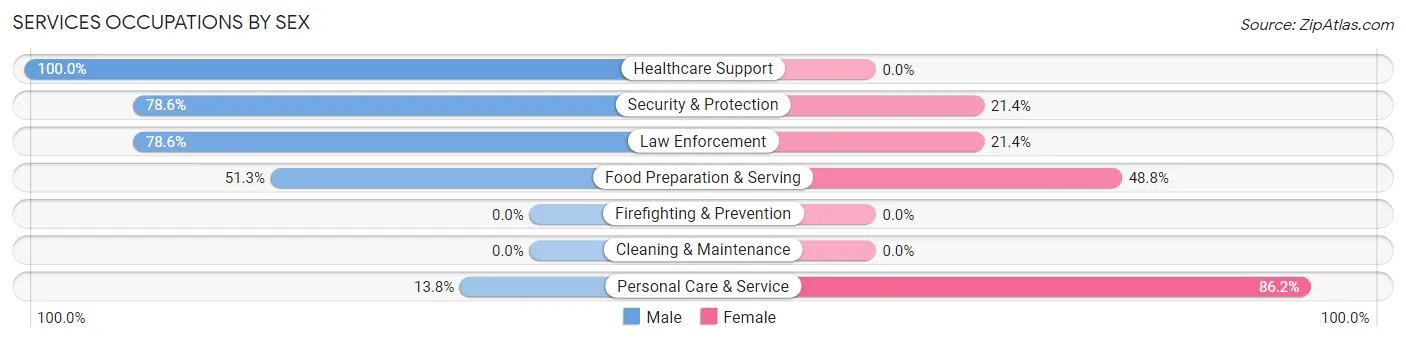
| Occupation | Male | Female |
| Healthcare Support | 17 (100.0%) | 0 (0.0%) |
| Security & Protection | 44 (78.6%) | 12 (21.4%) |
| Firefighting & Prevention | 0 (0.0%) | 0 (0.0%) |
| Law Enforcement | 44 (78.6%) | 12 (21.4%) |
| Food Preparation & Serving | 144 (51.2%) | 137 (48.7%) |
| Cleaning & Maintenance | 0 (0.0%) | 0 (0.0%) |
| Personal Care & Service | 15 (13.8%) | 94 (86.2%) |
| Total (Category) | 220 (47.5%) | 243 (52.5%) |
| Total (Overall) | 1,412 (57.3%) | 1,051 (42.7%) |
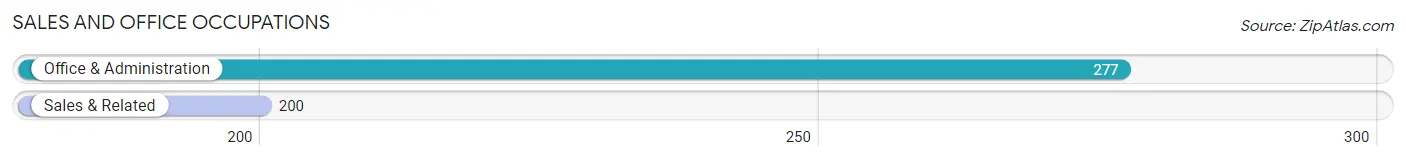
Sales and Office Occupations
The most common Sales and Office occupations in Highlands borough are Office & Administration (277 | 11.3%), and Sales & Related (200 | 8.1%).
Sales and Office Occupations by Sex
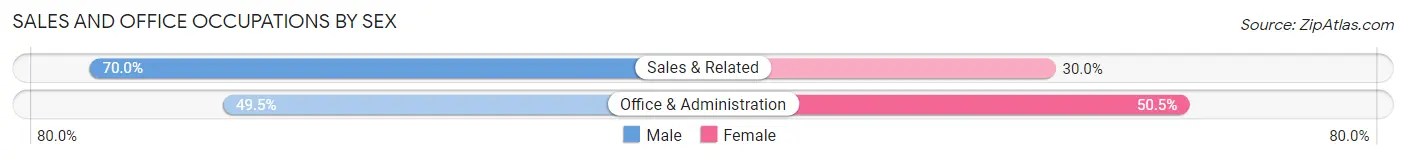
| Occupation | Male | Female |
| Sales & Related | 140 (70.0%) | 60 (30.0%) |
| Office & Administration | 137 (49.5%) | 140 (50.5%) |
| Total (Category) | 277 (58.1%) | 200 (41.9%) |
| Total (Overall) | 1,412 (57.3%) | 1,051 (42.7%) |
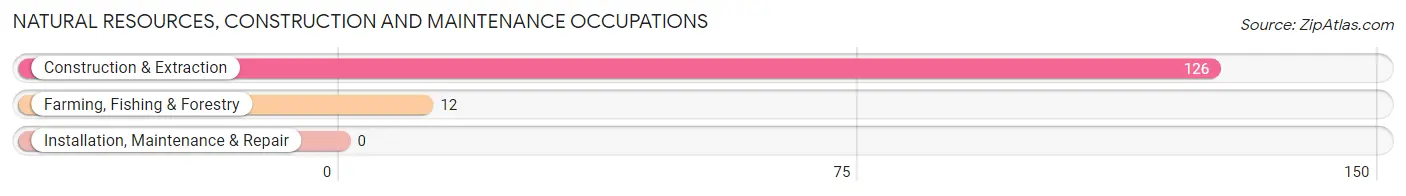
Natural Resources, Construction and Maintenance Occupations
The most common Natural Resources, Construction and Maintenance occupations in Highlands borough are Construction & Extraction (126 | 5.1%), and Farming, Fishing & Forestry (12 | 0.5%).
Natural Resources, Construction and Maintenance Occupations by Sex
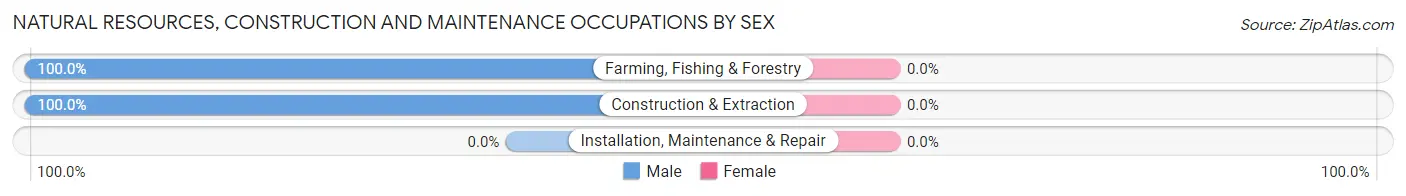
| Occupation | Male | Female |
| Farming, Fishing & Forestry | 12 (100.0%) | 0 (0.0%) |
| Construction & Extraction | 126 (100.0%) | 0 (0.0%) |
| Installation, Maintenance & Repair | 0 (0.0%) | 0 (0.0%) |
| Total (Category) | 138 (100.0%) | 0 (0.0%) |
| Total (Overall) | 1,412 (57.3%) | 1,051 (42.7%) |
Production, Transportation and Moving Occupations
The most common Production, Transportation and Moving occupations in Highlands borough are Material Moving (75 | 3.0%), and Transportation (7 | 0.3%).
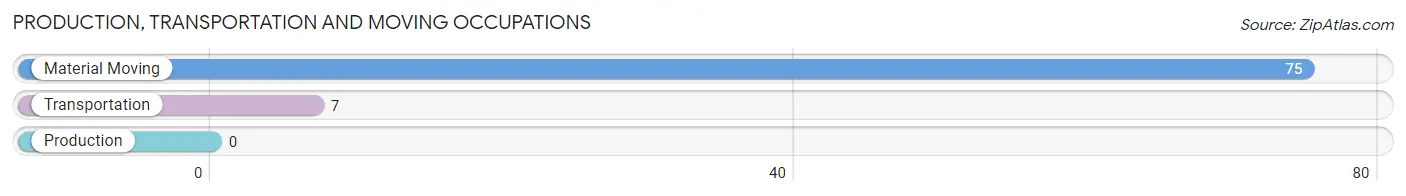
Production, Transportation and Moving Occupations by Sex
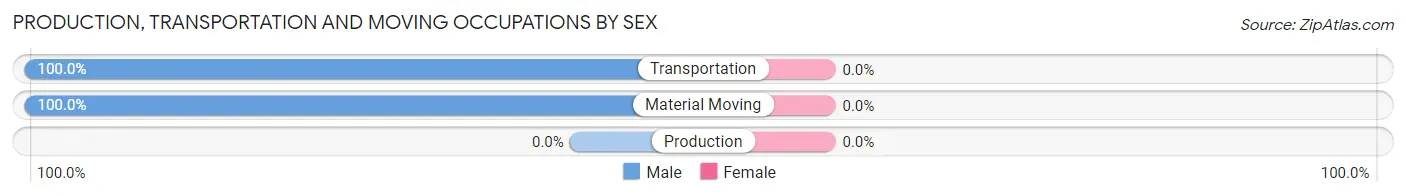
| Occupation | Male | Female |
| Production | 0 (0.0%) | 0 (0.0%) |
| Transportation | 7 (100.0%) | 0 (0.0%) |
| Material Moving | 75 (100.0%) | 0 (0.0%) |
| Total (Category) | 82 (100.0%) | 0 (0.0%) |
| Total (Overall) | 1,412 (57.3%) | 1,051 (42.7%) |
Employment Industries by Sex in Highlands borough
Employment Industries in Highlands borough
The major employment industries in Highlands borough include Professional & Scientific (388 | 15.8%), Health Care & Social Assistance (375 | 15.2%), Retail Trade (254 | 10.3%), Accommodation & Food Services (247 | 10.0%), and Arts, Entertainment & Recreation (175 | 7.1%).

Employment Industries by Sex in Highlands borough
The Highlands borough industries that see more men than women are Agriculture, Fishing & Hunting (100.0%), Construction (100.0%), and Manufacturing (100.0%), whereas the industries that tend to have a higher number of women are Real Estate, Rental & Leasing (100.0%), Health Care & Social Assistance (74.1%), and Information (69.3%).
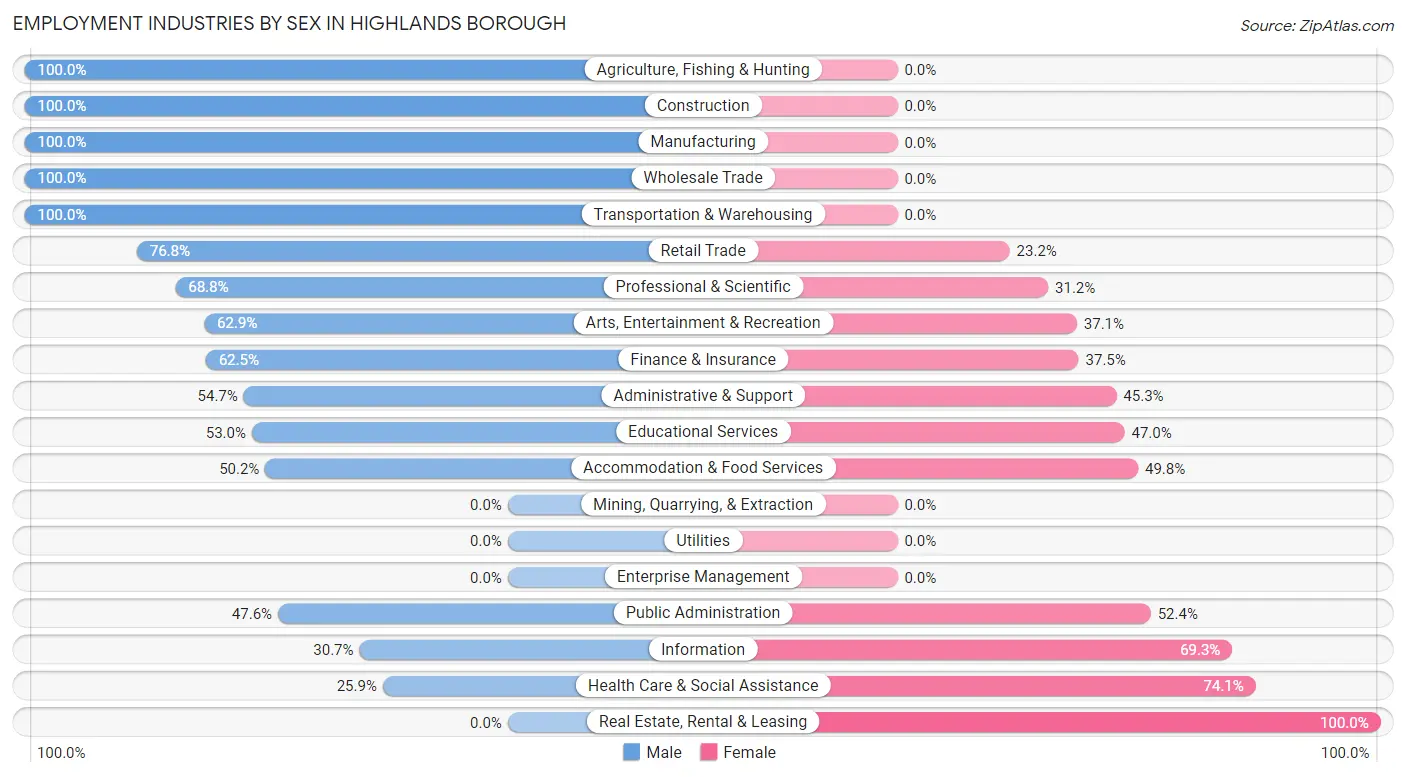
| Industry | Male | Female |
| Agriculture, Fishing & Hunting | 36 (100.0%) | 0 (0.0%) |
| Mining, Quarrying, & Extraction | 0 (0.0%) | 0 (0.0%) |
| Construction | 152 (100.0%) | 0 (0.0%) |
| Manufacturing | 59 (100.0%) | 0 (0.0%) |
| Wholesale Trade | 13 (100.0%) | 0 (0.0%) |
| Retail Trade | 195 (76.8%) | 59 (23.2%) |
| Transportation & Warehousing | 41 (100.0%) | 0 (0.0%) |
| Utilities | 0 (0.0%) | 0 (0.0%) |
| Information | 39 (30.7%) | 88 (69.3%) |
| Finance & Insurance | 80 (62.5%) | 48 (37.5%) |
| Real Estate, Rental & Leasing | 0 (0.0%) | 33 (100.0%) |
| Professional & Scientific | 267 (68.8%) | 121 (31.2%) |
| Enterprise Management | 0 (0.0%) | 0 (0.0%) |
| Administrative & Support | 41 (54.7%) | 34 (45.3%) |
| Educational Services | 89 (53.0%) | 79 (47.0%) |
| Health Care & Social Assistance | 97 (25.9%) | 278 (74.1%) |
| Arts, Entertainment & Recreation | 110 (62.9%) | 65 (37.1%) |
| Accommodation & Food Services | 124 (50.2%) | 123 (49.8%) |
| Public Administration | 49 (47.6%) | 54 (52.4%) |
| Total | 1,412 (57.3%) | 1,051 (42.7%) |
Education in Highlands borough
School Enrollment in Highlands borough
The most common levels of schooling among the 611 students in Highlands borough are elementary school (262 | 42.9%), nursery / preschool (107 | 17.5%), and high school (76 | 12.4%).
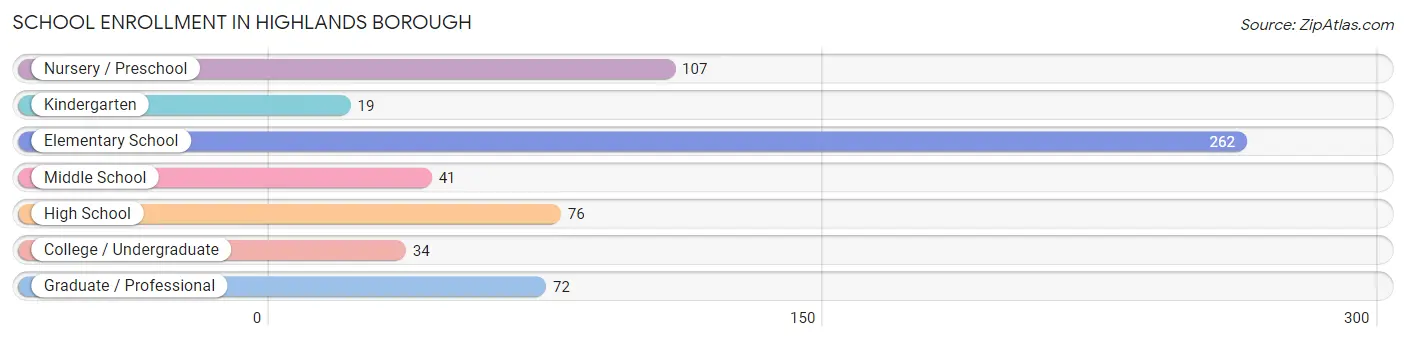
| School Level | # Students | % Students |
| Nursery / Preschool | 107 | 17.5% |
| Kindergarten | 19 | 3.1% |
| Elementary School | 262 | 42.9% |
| Middle School | 41 | 6.7% |
| High School | 76 | 12.4% |
| College / Undergraduate | 34 | 5.6% |
| Graduate / Professional | 72 | 11.8% |
| Total | 611 | 100.0% |
School Enrollment by Age by Funding Source in Highlands borough
Out of a total of 611 students who are enrolled in schools in Highlands borough, 149 (24.4%) attend a private institution, while the remaining 462 (75.6%) are enrolled in public schools. The age group of 3 to 4 year olds has the highest likelihood of being enrolled in private schools, with 96 (100.0% in the age bracket) enrolled. Conversely, the age group of 5 to 9 year old has the lowest likelihood of being enrolled in a private school, with 263 (100.0% in the age bracket) attending a public institution.
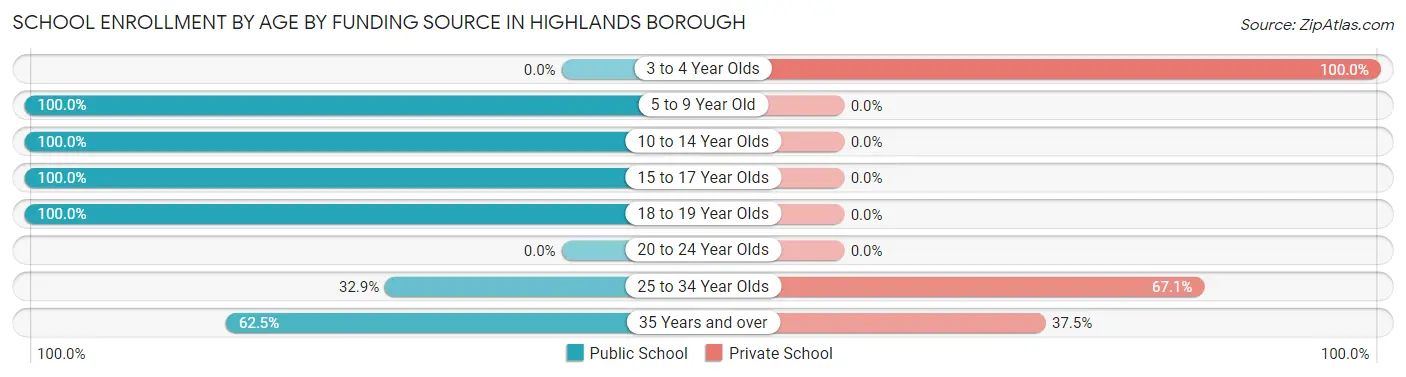
| Age Bracket | Public School | Private School |
| 3 to 4 Year Olds | 0 (0.0%) | 96 (100.0%) |
| 5 to 9 Year Old | 263 (100.0%) | 0 (0.0%) |
| 10 to 14 Year Olds | 70 (100.0%) | 0 (0.0%) |
| 15 to 17 Year Olds | 76 (100.0%) | 0 (0.0%) |
| 18 to 19 Year Olds | 20 (100.0%) | 0 (0.0%) |
| 20 to 24 Year Olds | 0 (0.0%) | 0 (0.0%) |
| 25 to 34 Year Olds | 23 (32.9%) | 47 (67.1%) |
| 35 Years and over | 10 (62.5%) | 6 (37.5%) |
| Total | 462 (75.6%) | 149 (24.4%) |
Educational Attainment by Field of Study in Highlands borough
Engineering (325 | 15.6%), business (277 | 13.3%), literature & languages (260 | 12.5%), arts & humanities (187 | 9.0%), and social sciences (180 | 8.7%) are the most common fields of study among 2,079 individuals in Highlands borough who have obtained a bachelor's degree or higher.
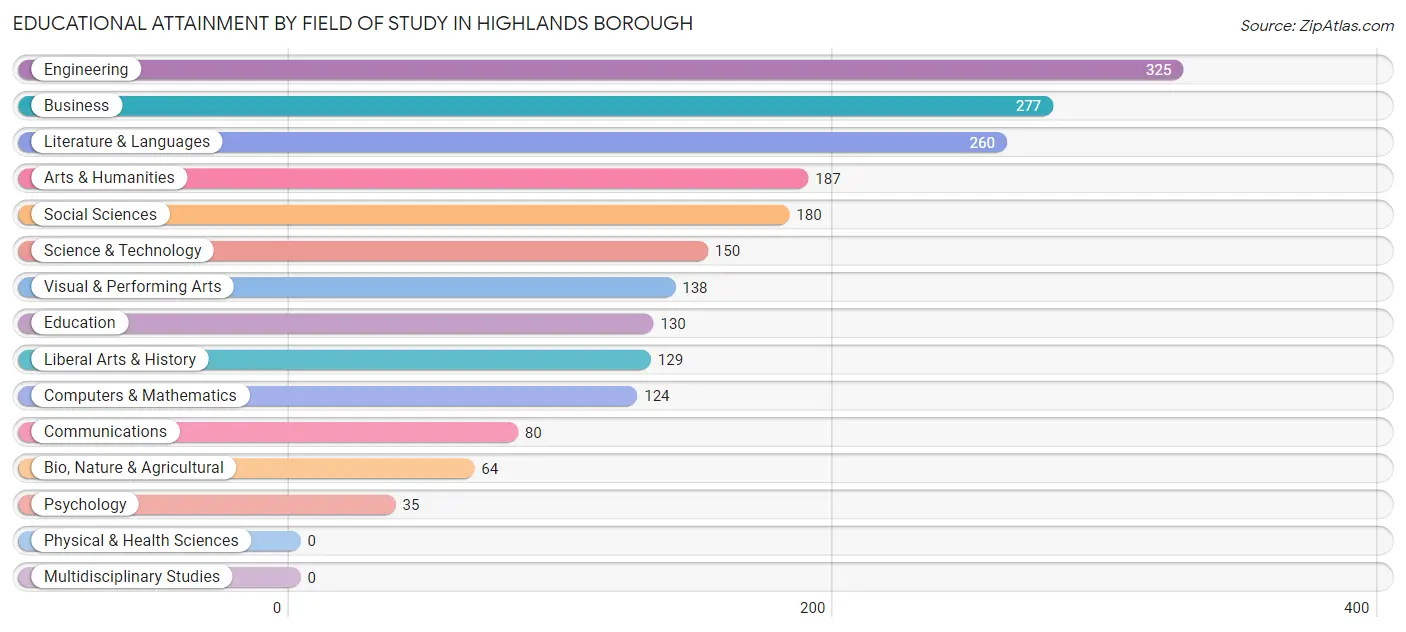
| Field of Study | # Graduates | % Graduates |
| Computers & Mathematics | 124 | 6.0% |
| Bio, Nature & Agricultural | 64 | 3.1% |
| Physical & Health Sciences | 0 | 0.0% |
| Psychology | 35 | 1.7% |
| Social Sciences | 180 | 8.7% |
| Engineering | 325 | 15.6% |
| Multidisciplinary Studies | 0 | 0.0% |
| Science & Technology | 150 | 7.2% |
| Business | 277 | 13.3% |
| Education | 130 | 6.2% |
| Literature & Languages | 260 | 12.5% |
| Liberal Arts & History | 129 | 6.2% |
| Visual & Performing Arts | 138 | 6.6% |
| Communications | 80 | 3.8% |
| Arts & Humanities | 187 | 9.0% |
| Total | 2,079 | 100.0% |
Transportation & Commute in Highlands borough
Vehicle Availability by Sex in Highlands borough
The most prevalent vehicle ownership categories in Highlands borough are males with 2 vehicles (804, accounting for 56.5%) and females with 2 vehicles (647, making up 79.1%).
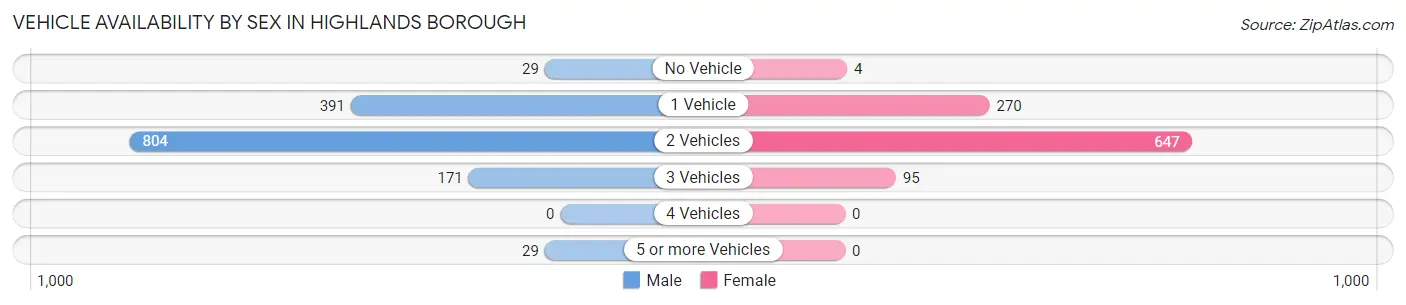
| Vehicles Available | Male | Female |
| No Vehicle | 29 (2.0%) | 4 (0.4%) |
| 1 Vehicle | 391 (27.5%) | 270 (26.6%) |
| 2 Vehicles | 804 (56.5%) | 647 (63.7%) |
| 3 Vehicles | 171 (12.0%) | 95 (9.3%) |
| 4 Vehicles | 0 (0.0%) | 0 (0.0%) |
| 5 or more Vehicles | 29 (2.0%) | 0 (0.0%) |
| Total | 1,424 (100.0%) | 1,016 (100.0%) |
Commute Time in Highlands borough
The most frequently occuring commute durations in Highlands borough are 15 to 19 minutes (328 commuters, 16.2%), 60 to 89 minutes (327 commuters, 16.2%), and 30 to 34 minutes (264 commuters, 13.0%).
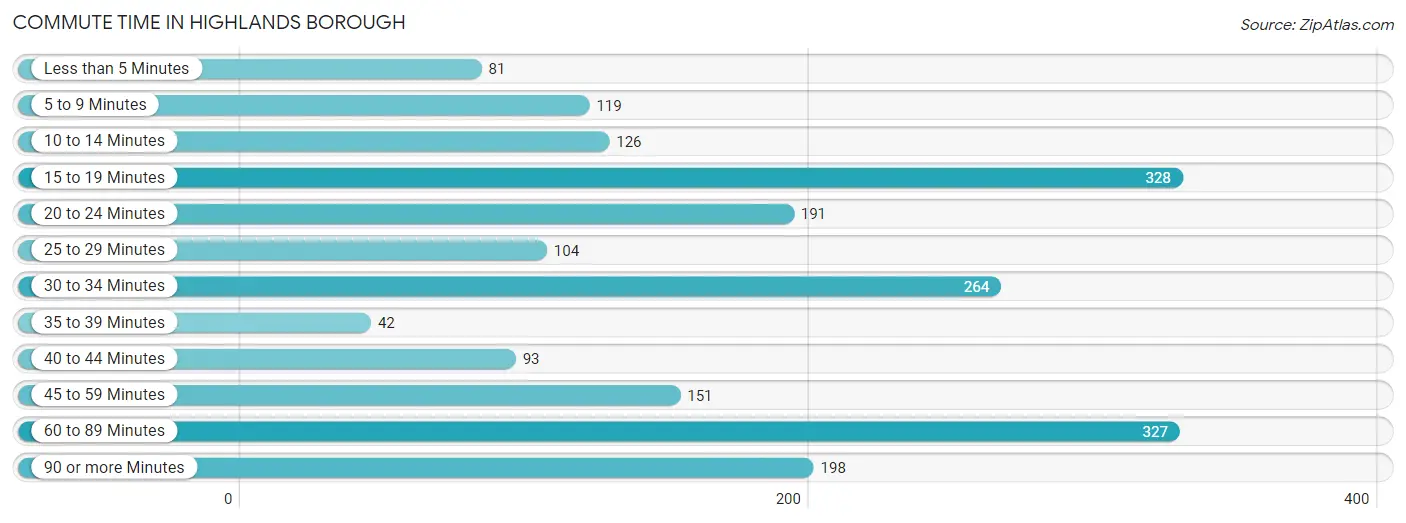
| Commute Time | # Commuters | % Commuters |
| Less than 5 Minutes | 81 | 4.0% |
| 5 to 9 Minutes | 119 | 5.9% |
| 10 to 14 Minutes | 126 | 6.2% |
| 15 to 19 Minutes | 328 | 16.2% |
| 20 to 24 Minutes | 191 | 9.4% |
| 25 to 29 Minutes | 104 | 5.1% |
| 30 to 34 Minutes | 264 | 13.0% |
| 35 to 39 Minutes | 42 | 2.1% |
| 40 to 44 Minutes | 93 | 4.6% |
| 45 to 59 Minutes | 151 | 7.5% |
| 60 to 89 Minutes | 327 | 16.2% |
| 90 or more Minutes | 198 | 9.8% |
Commute Time by Sex in Highlands borough
The most common commute times in Highlands borough are 60 to 89 minutes (272 commuters, 22.3%) for males and 15 to 19 minutes (174 commuters, 21.6%) for females.
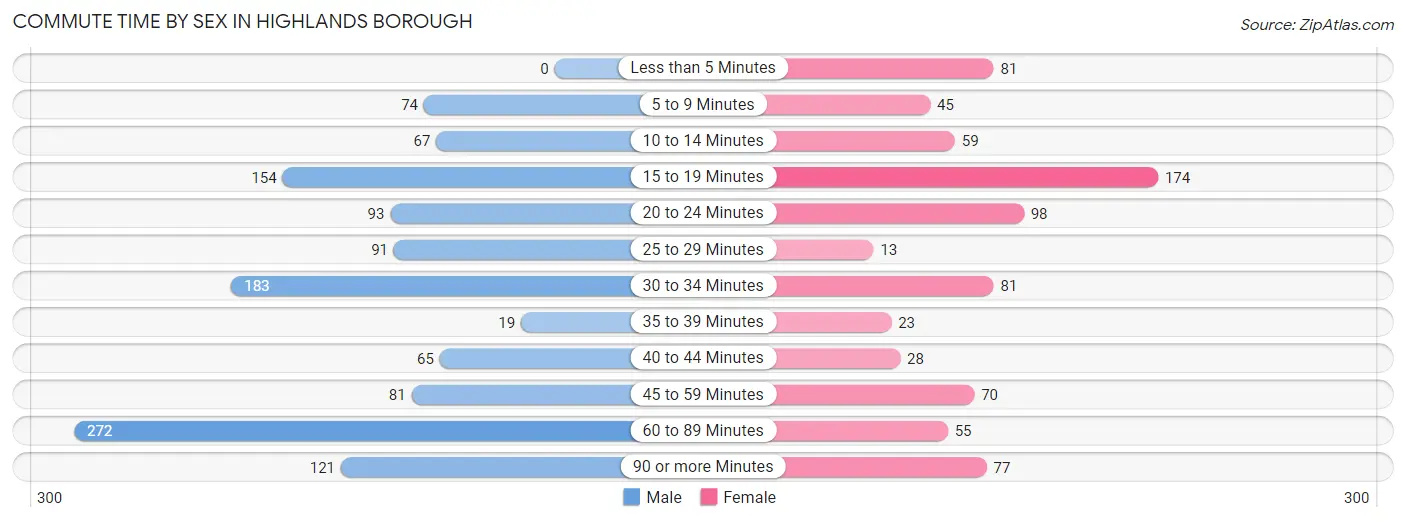
| Commute Time | Male | Female |
| Less than 5 Minutes | 0 (0.0%) | 81 (10.1%) |
| 5 to 9 Minutes | 74 (6.1%) | 45 (5.6%) |
| 10 to 14 Minutes | 67 (5.5%) | 59 (7.3%) |
| 15 to 19 Minutes | 154 (12.6%) | 174 (21.6%) |
| 20 to 24 Minutes | 93 (7.6%) | 98 (12.2%) |
| 25 to 29 Minutes | 91 (7.5%) | 13 (1.6%) |
| 30 to 34 Minutes | 183 (15.0%) | 81 (10.1%) |
| 35 to 39 Minutes | 19 (1.6%) | 23 (2.9%) |
| 40 to 44 Minutes | 65 (5.3%) | 28 (3.5%) |
| 45 to 59 Minutes | 81 (6.6%) | 70 (8.7%) |
| 60 to 89 Minutes | 272 (22.3%) | 55 (6.8%) |
| 90 or more Minutes | 121 (9.9%) | 77 (9.6%) |
Time of Departure to Work by Sex in Highlands borough
The most frequent times of departure to work in Highlands borough are 6:00 AM to 6:29 AM (321, 26.3%) for males and 7:00 AM to 7:29 AM (170, 21.1%) for females.
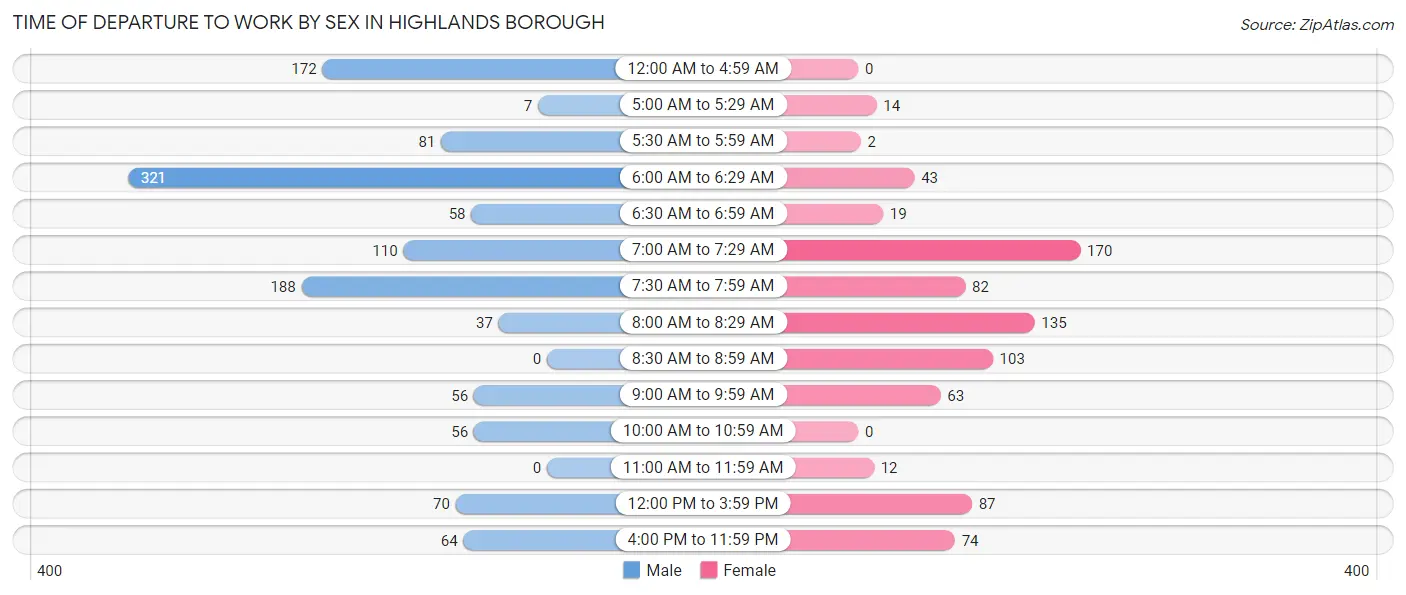
| Time of Departure | Male | Female |
| 12:00 AM to 4:59 AM | 172 (14.1%) | 0 (0.0%) |
| 5:00 AM to 5:29 AM | 7 (0.6%) | 14 (1.7%) |
| 5:30 AM to 5:59 AM | 81 (6.6%) | 2 (0.3%) |
| 6:00 AM to 6:29 AM | 321 (26.3%) | 43 (5.3%) |
| 6:30 AM to 6:59 AM | 58 (4.8%) | 19 (2.4%) |
| 7:00 AM to 7:29 AM | 110 (9.0%) | 170 (21.1%) |
| 7:30 AM to 7:59 AM | 188 (15.4%) | 82 (10.2%) |
| 8:00 AM to 8:29 AM | 37 (3.0%) | 135 (16.8%) |
| 8:30 AM to 8:59 AM | 0 (0.0%) | 103 (12.8%) |
| 9:00 AM to 9:59 AM | 56 (4.6%) | 63 (7.8%) |
| 10:00 AM to 10:59 AM | 56 (4.6%) | 0 (0.0%) |
| 11:00 AM to 11:59 AM | 0 (0.0%) | 12 (1.5%) |
| 12:00 PM to 3:59 PM | 70 (5.7%) | 87 (10.8%) |
| 4:00 PM to 11:59 PM | 64 (5.2%) | 74 (9.2%) |
| Total | 1,220 (100.0%) | 804 (100.0%) |
Housing Occupancy in Highlands borough
Occupancy by Ownership in Highlands borough
Of the total 2,515 dwellings in Highlands borough, owner-occupied units account for 1,684 (67.0%), while renter-occupied units make up 831 (33.0%).
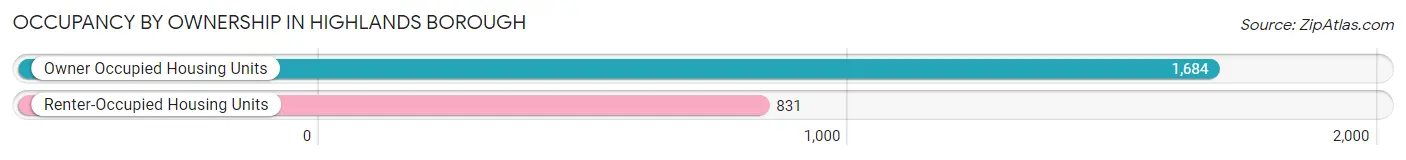
| Occupancy | # Housing Units | % Housing Units |
| Owner Occupied Housing Units | 1,684 | 67.0% |
| Renter-Occupied Housing Units | 831 | 33.0% |
| Total Occupied Housing Units | 2,515 | 100.0% |
Occupancy by Household Size in Highlands borough
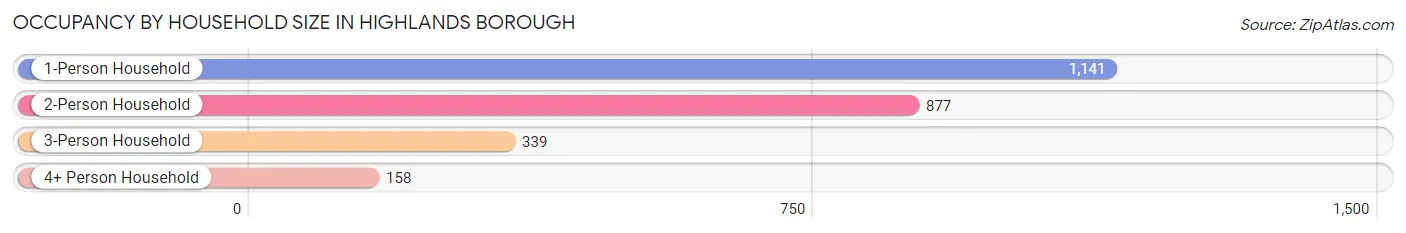
| Household Size | # Housing Units | % Housing Units |
| 1-Person Household | 1,141 | 45.4% |
| 2-Person Household | 877 | 34.9% |
| 3-Person Household | 339 | 13.5% |
| 4+ Person Household | 158 | 6.3% |
| Total Housing Units | 2,515 | 100.0% |
Occupancy by Ownership by Household Size in Highlands borough
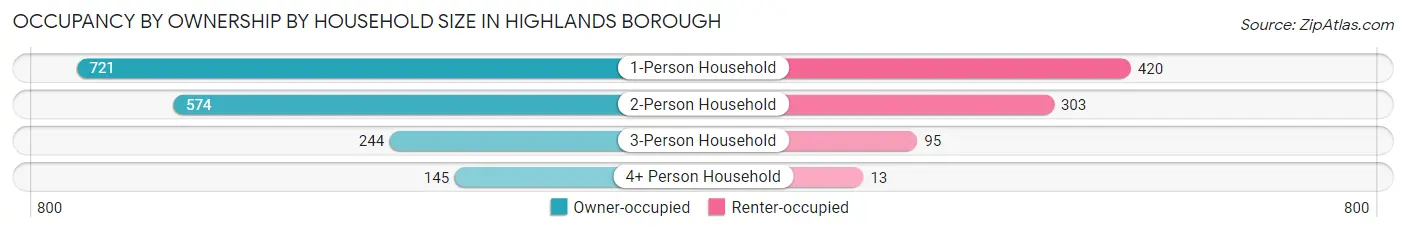
| Household Size | Owner-occupied | Renter-occupied |
| 1-Person Household | 721 (63.2%) | 420 (36.8%) |
| 2-Person Household | 574 (65.4%) | 303 (34.5%) |
| 3-Person Household | 244 (72.0%) | 95 (28.0%) |
| 4+ Person Household | 145 (91.8%) | 13 (8.2%) |
| Total Housing Units | 1,684 (67.0%) | 831 (33.0%) |
Occupancy by Educational Attainment in Highlands borough
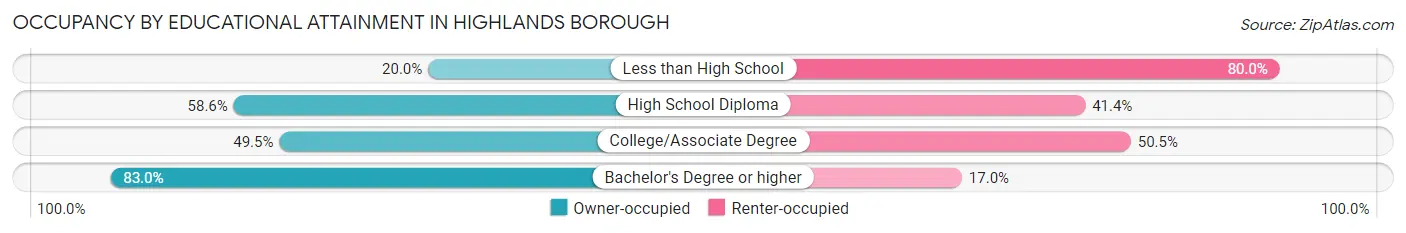
| Household Size | Owner-occupied | Renter-occupied |
| Less than High School | 43 (20.0%) | 172 (80.0%) |
| High School Diploma | 154 (58.6%) | 109 (41.4%) |
| College/Associate Degree | 301 (49.5%) | 307 (50.5%) |
| Bachelor's Degree or higher | 1,186 (83.0%) | 243 (17.0%) |
Occupancy by Age of Householder in Highlands borough
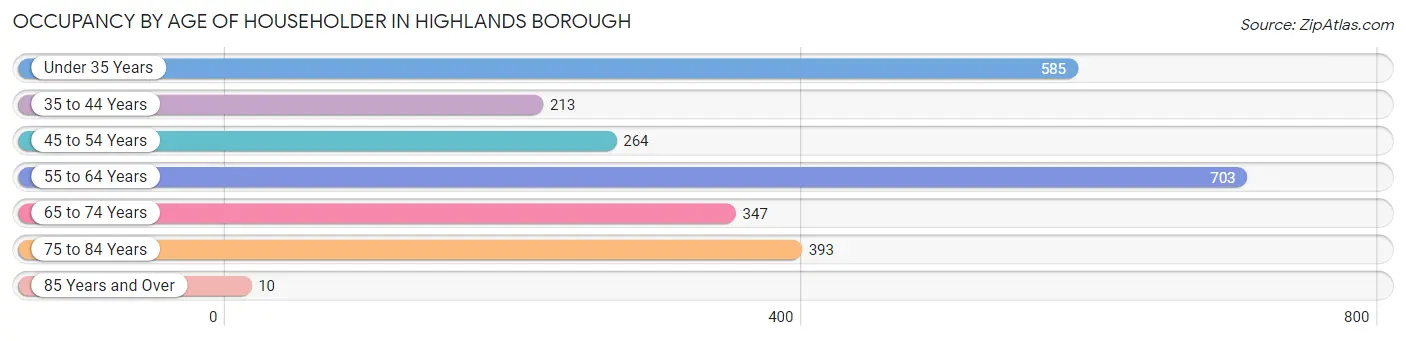
| Age Bracket | # Households | % Households |
| Under 35 Years | 585 | 23.3% |
| 35 to 44 Years | 213 | 8.5% |
| 45 to 54 Years | 264 | 10.5% |
| 55 to 64 Years | 703 | 28.0% |
| 65 to 74 Years | 347 | 13.8% |
| 75 to 84 Years | 393 | 15.6% |
| 85 Years and Over | 10 | 0.4% |
| Total | 2,515 | 100.0% |
Housing Finances in Highlands borough
Median Income by Occupancy in Highlands borough
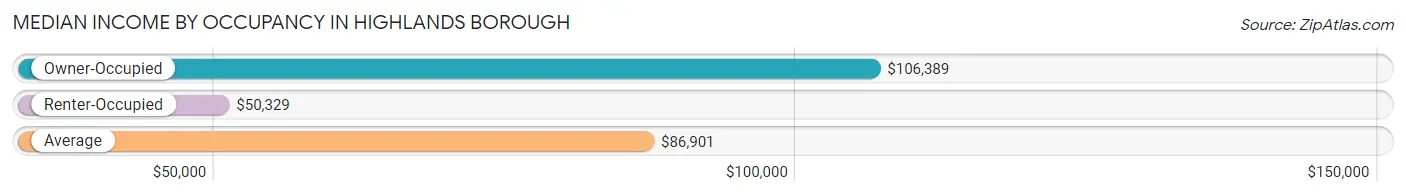
| Occupancy Type | # Households | Median Income |
| Owner-Occupied | 1,684 (67.0%) | $106,389 |
| Renter-Occupied | 831 (33.0%) | $50,329 |
| Average | 2,515 (100.0%) | $86,901 |
Occupancy by Householder Income Bracket in Highlands borough
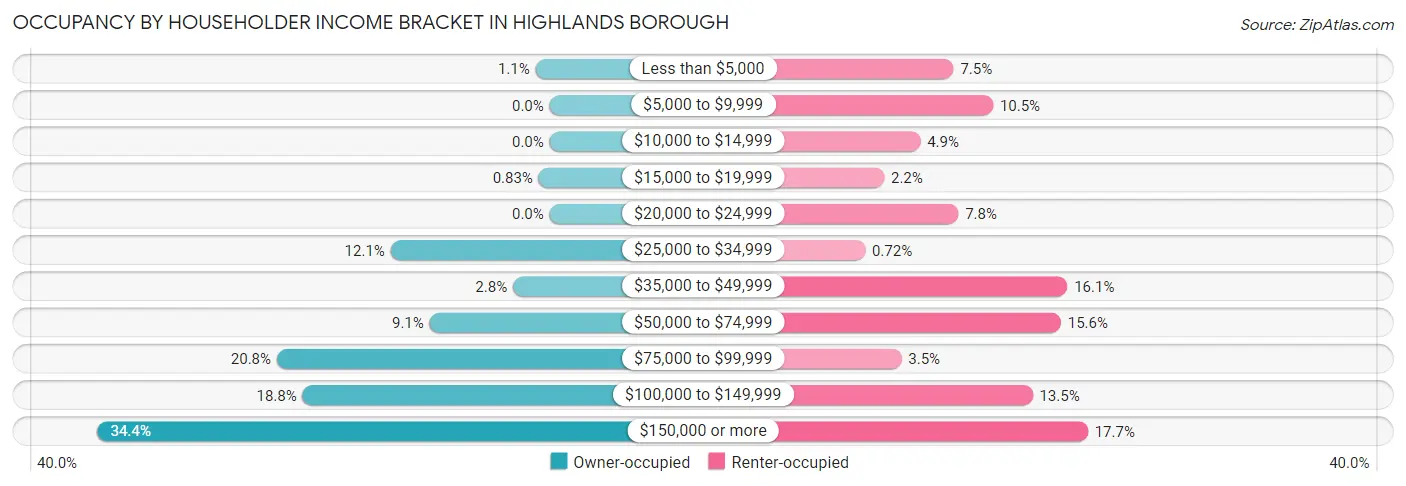
| Income Bracket | Owner-occupied | Renter-occupied |
| Less than $5,000 | 18 (1.1%) | 62 (7.5%) |
| $5,000 to $9,999 | 0 (0.0%) | 87 (10.5%) |
| $10,000 to $14,999 | 0 (0.0%) | 41 (4.9%) |
| $15,000 to $19,999 | 14 (0.8%) | 18 (2.2%) |
| $20,000 to $24,999 | 0 (0.0%) | 65 (7.8%) |
| $25,000 to $34,999 | 204 (12.1%) | 6 (0.7%) |
| $35,000 to $49,999 | 47 (2.8%) | 134 (16.1%) |
| $50,000 to $74,999 | 154 (9.1%) | 130 (15.6%) |
| $75,000 to $99,999 | 350 (20.8%) | 29 (3.5%) |
| $100,000 to $149,999 | 317 (18.8%) | 112 (13.5%) |
| $150,000 or more | 580 (34.4%) | 147 (17.7%) |
| Total | 1,684 (100.0%) | 831 (100.0%) |
Monthly Housing Cost Tiers in Highlands borough
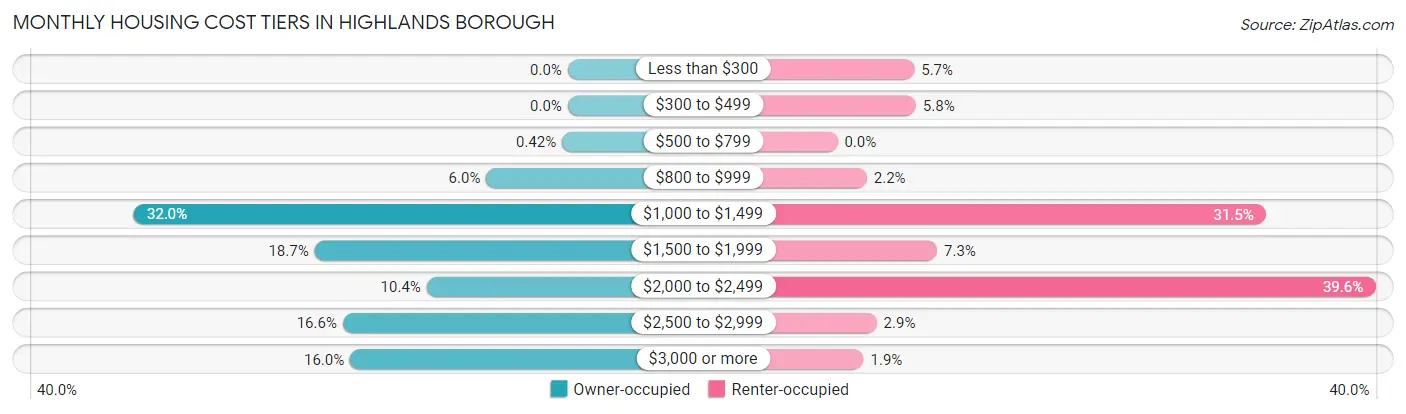
| Monthly Cost | Owner-occupied | Renter-occupied |
| Less than $300 | 0 (0.0%) | 47 (5.7%) |
| $300 to $499 | 0 (0.0%) | 48 (5.8%) |
| $500 to $799 | 7 (0.4%) | 0 (0.0%) |
| $800 to $999 | 101 (6.0%) | 18 (2.2%) |
| $1,000 to $1,499 | 538 (32.0%) | 262 (31.5%) |
| $1,500 to $1,999 | 314 (18.6%) | 61 (7.3%) |
| $2,000 to $2,499 | 175 (10.4%) | 329 (39.6%) |
| $2,500 to $2,999 | 279 (16.6%) | 24 (2.9%) |
| $3,000 or more | 270 (16.0%) | 16 (1.9%) |
| Total | 1,684 (100.0%) | 831 (100.0%) |
Physical Housing Characteristics in Highlands borough
Housing Structures in Highlands borough
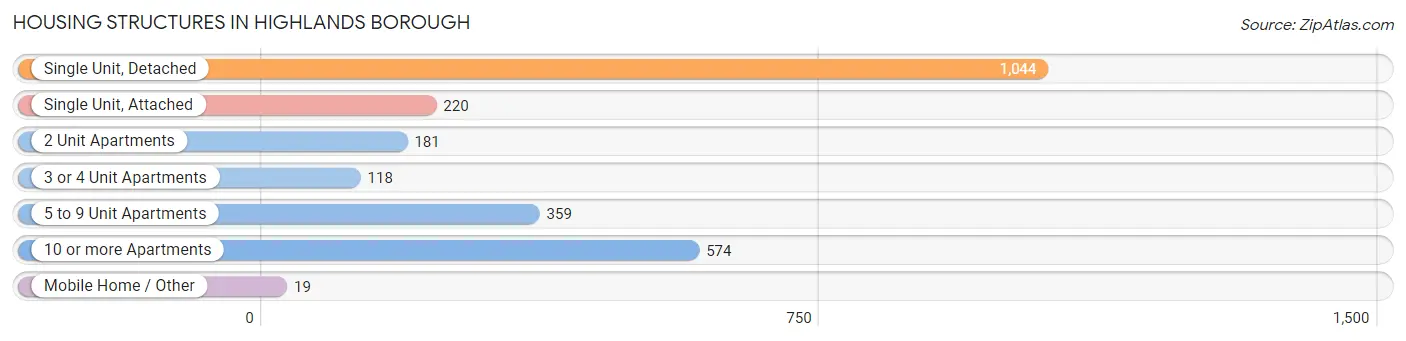
| Structure Type | # Housing Units | % Housing Units |
| Single Unit, Detached | 1,044 | 41.5% |
| Single Unit, Attached | 220 | 8.7% |
| 2 Unit Apartments | 181 | 7.2% |
| 3 or 4 Unit Apartments | 118 | 4.7% |
| 5 to 9 Unit Apartments | 359 | 14.3% |
| 10 or more Apartments | 574 | 22.8% |
| Mobile Home / Other | 19 | 0.8% |
| Total | 2,515 | 100.0% |
Housing Structures by Occupancy in Highlands borough
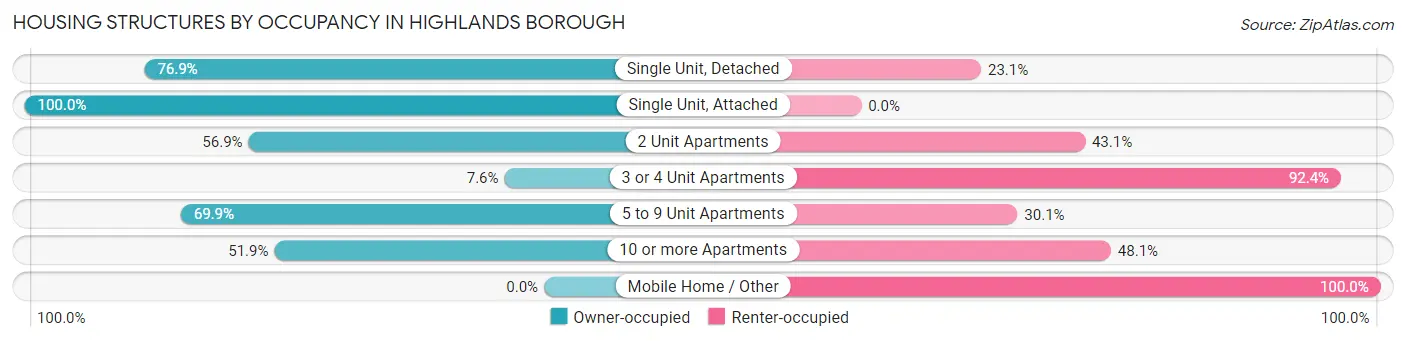
| Structure Type | Owner-occupied | Renter-occupied |
| Single Unit, Detached | 803 (76.9%) | 241 (23.1%) |
| Single Unit, Attached | 220 (100.0%) | 0 (0.0%) |
| 2 Unit Apartments | 103 (56.9%) | 78 (43.1%) |
| 3 or 4 Unit Apartments | 9 (7.6%) | 109 (92.4%) |
| 5 to 9 Unit Apartments | 251 (69.9%) | 108 (30.1%) |
| 10 or more Apartments | 298 (51.9%) | 276 (48.1%) |
| Mobile Home / Other | 0 (0.0%) | 19 (100.0%) |
| Total | 1,684 (67.0%) | 831 (33.0%) |
Housing Structures by Number of Rooms in Highlands borough
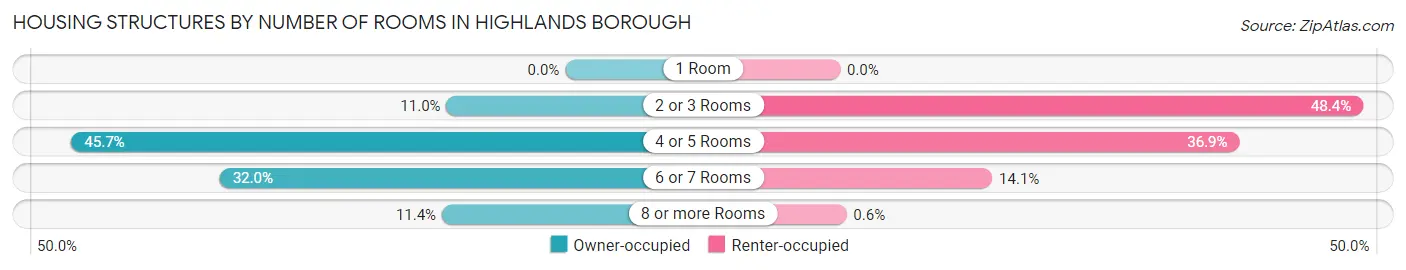
| Number of Rooms | Owner-occupied | Renter-occupied |
| 1 Room | 0 (0.0%) | 0 (0.0%) |
| 2 or 3 Rooms | 185 (11.0%) | 402 (48.4%) |
| 4 or 5 Rooms | 769 (45.7%) | 307 (36.9%) |
| 6 or 7 Rooms | 538 (32.0%) | 117 (14.1%) |
| 8 or more Rooms | 192 (11.4%) | 5 (0.6%) |
| Total | 1,684 (100.0%) | 831 (100.0%) |
Housing Structure by Heating Type in Highlands borough
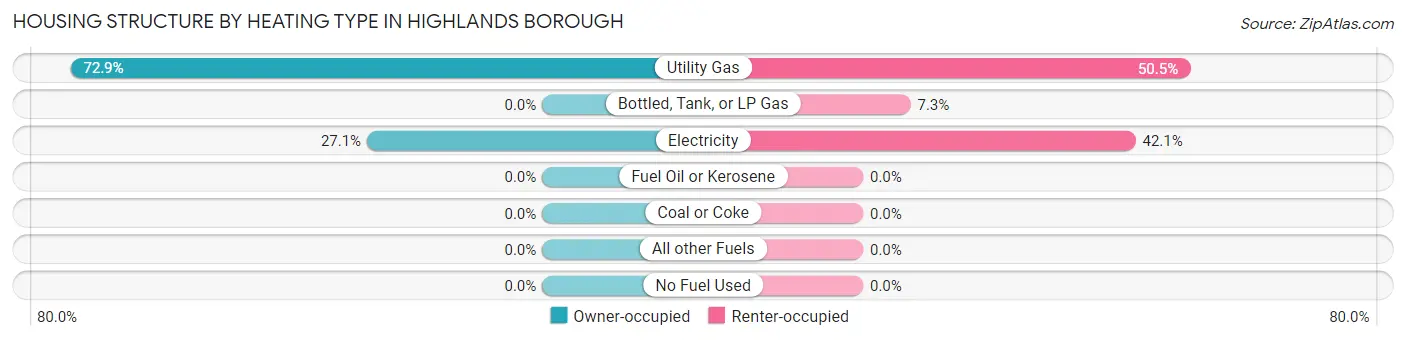
| Heating Type | Owner-occupied | Renter-occupied |
| Utility Gas | 1,228 (72.9%) | 420 (50.5%) |
| Bottled, Tank, or LP Gas | 0 (0.0%) | 61 (7.3%) |
| Electricity | 456 (27.1%) | 350 (42.1%) |
| Fuel Oil or Kerosene | 0 (0.0%) | 0 (0.0%) |
| Coal or Coke | 0 (0.0%) | 0 (0.0%) |
| All other Fuels | 0 (0.0%) | 0 (0.0%) |
| No Fuel Used | 0 (0.0%) | 0 (0.0%) |
| Total | 1,684 (100.0%) | 831 (100.0%) |
Household Vehicle Usage in Highlands borough
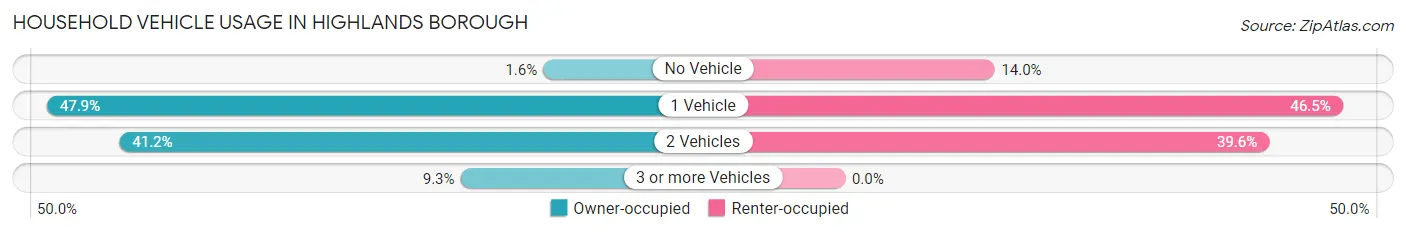
| Vehicles per Household | Owner-occupied | Renter-occupied |
| No Vehicle | 27 (1.6%) | 116 (14.0%) |
| 1 Vehicle | 807 (47.9%) | 386 (46.5%) |
| 2 Vehicles | 693 (41.1%) | 329 (39.6%) |
| 3 or more Vehicles | 157 (9.3%) | 0 (0.0%) |
| Total | 1,684 (100.0%) | 831 (100.0%) |
Real Estate & Mortgages in Highlands borough
Real Estate and Mortgage Overview in Highlands borough
| Characteristic | Without Mortgage | With Mortgage |
| Housing Units | 825 | 859 |
| Median Property Value | $377,300 | $430,600 |
| Median Household Income | $85,485 | $433 |
| Monthly Housing Costs | $1,169 | $270 |
| Real Estate Taxes | $7,800 | $0 |
Property Value by Mortgage Status in Highlands borough
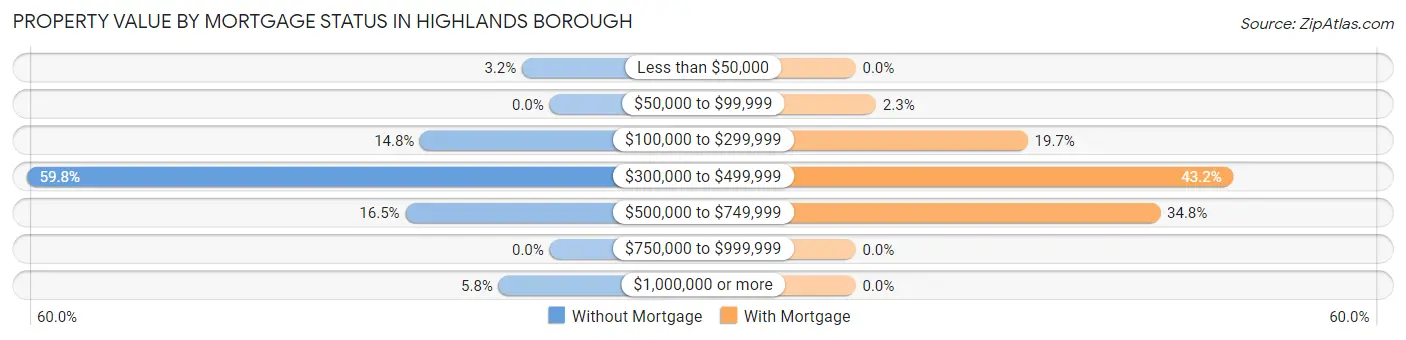
| Property Value | Without Mortgage | With Mortgage |
| Less than $50,000 | 26 (3.2%) | 0 (0.0%) |
| $50,000 to $99,999 | 0 (0.0%) | 20 (2.3%) |
| $100,000 to $299,999 | 122 (14.8%) | 169 (19.7%) |
| $300,000 to $499,999 | 493 (59.8%) | 371 (43.2%) |
| $500,000 to $749,999 | 136 (16.5%) | 299 (34.8%) |
| $750,000 to $999,999 | 0 (0.0%) | 0 (0.0%) |
| $1,000,000 or more | 48 (5.8%) | 0 (0.0%) |
| Total | 825 (100.0%) | 859 (100.0%) |
Household Income by Mortgage Status in Highlands borough
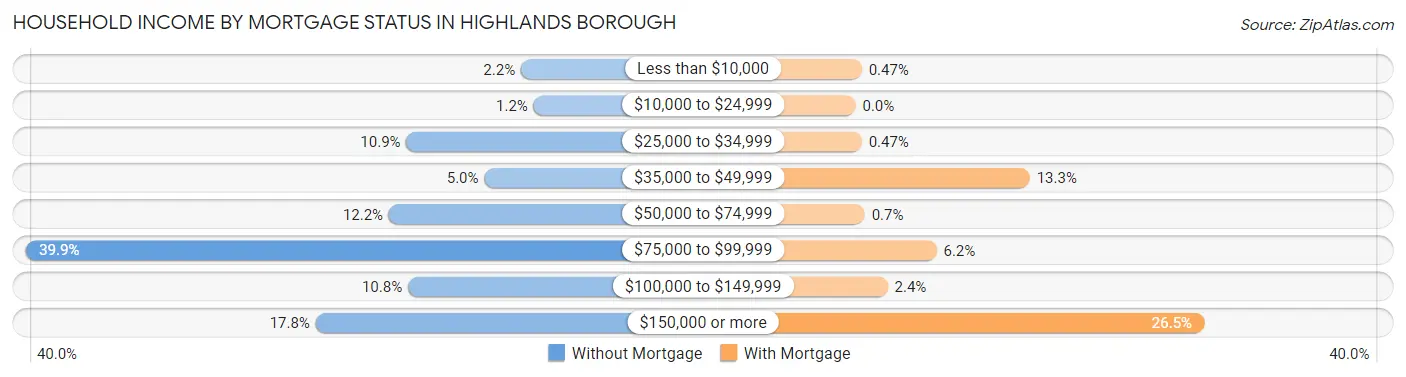
| Household Income | Without Mortgage | With Mortgage |
| Less than $10,000 | 18 (2.2%) | 4 (0.5%) |
| $10,000 to $24,999 | 10 (1.2%) | 0 (0.0%) |
| $25,000 to $34,999 | 90 (10.9%) | 4 (0.5%) |
| $35,000 to $49,999 | 41 (5.0%) | 114 (13.3%) |
| $50,000 to $74,999 | 101 (12.2%) | 6 (0.7%) |
| $75,000 to $99,999 | 329 (39.9%) | 53 (6.2%) |
| $100,000 to $149,999 | 89 (10.8%) | 21 (2.4%) |
| $150,000 or more | 147 (17.8%) | 228 (26.5%) |
| Total | 825 (100.0%) | 859 (100.0%) |
Property Value to Household Income Ratio in Highlands borough
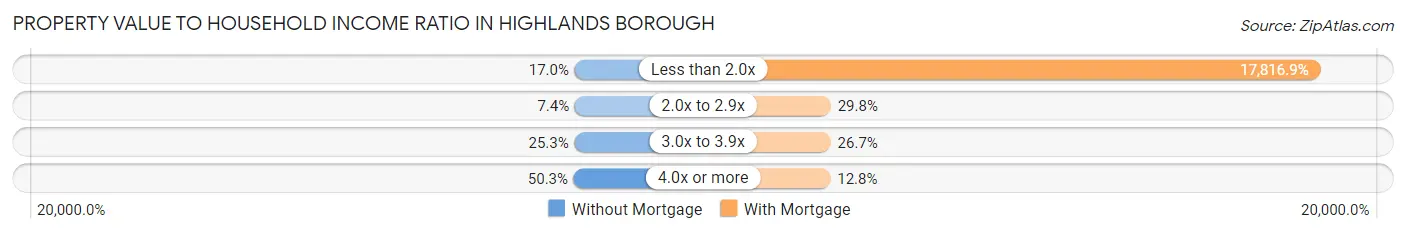
| Value-to-Income Ratio | Without Mortgage | With Mortgage |
| Less than 2.0x | 140 (17.0%) | 153,047 (17,816.9%) |
| 2.0x to 2.9x | 61 (7.4%) | 256 (29.8%) |
| 3.0x to 3.9x | 209 (25.3%) | 229 (26.7%) |
| 4.0x or more | 415 (50.3%) | 110 (12.8%) |
| Total | 825 (100.0%) | 859 (100.0%) |
Real Estate Taxes by Mortgage Status in Highlands borough
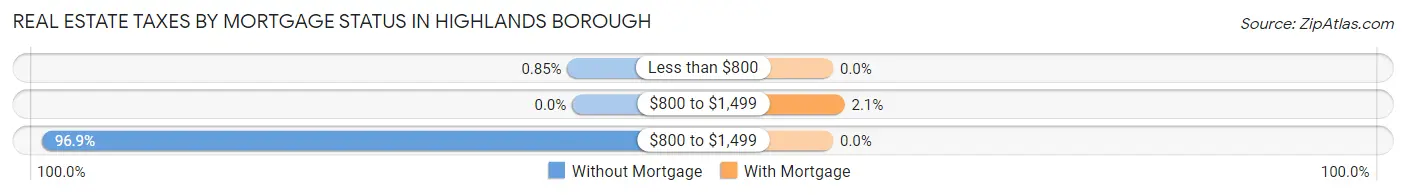
| Property Taxes | Without Mortgage | With Mortgage |
| Less than $800 | 7 (0.9%) | 0 (0.0%) |
| $800 to $1,499 | 0 (0.0%) | 18 (2.1%) |
| $800 to $1,499 | 799 (96.9%) | 0 (0.0%) |
| Total | 825 (100.0%) | 859 (100.0%) |
Health & Disability in Highlands borough
Health Insurance Coverage by Age in Highlands borough
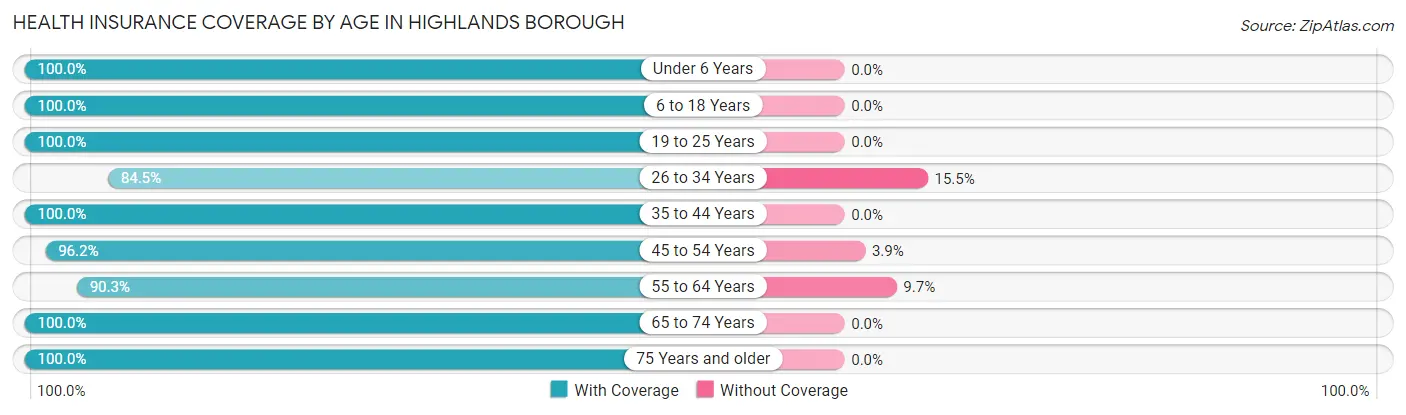
| Age Bracket | With Coverage | Without Coverage |
| Under 6 Years | 239 (100.0%) | 0 (0.0%) |
| 6 to 18 Years | 418 (100.0%) | 0 (0.0%) |
| 19 to 25 Years | 133 (100.0%) | 0 (0.0%) |
| 26 to 34 Years | 669 (84.5%) | 123 (15.5%) |
| 35 to 44 Years | 517 (100.0%) | 0 (0.0%) |
| 45 to 54 Years | 525 (96.2%) | 21 (3.8%) |
| 55 to 64 Years | 864 (90.3%) | 93 (9.7%) |
| 65 to 74 Years | 474 (100.0%) | 0 (0.0%) |
| 75 Years and older | 518 (100.0%) | 0 (0.0%) |
| Total | 4,357 (94.8%) | 237 (5.2%) |
Health Insurance Coverage by Citizenship Status in Highlands borough
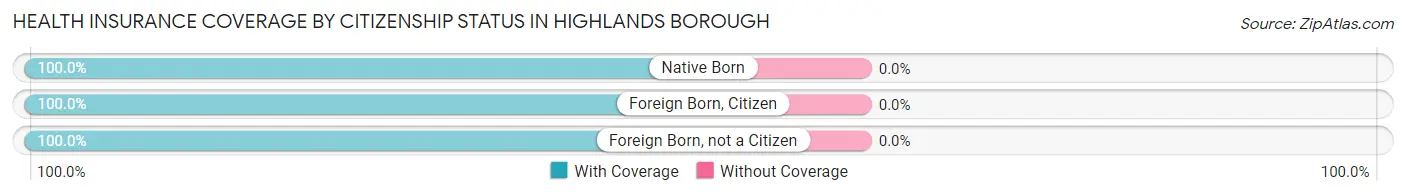
| Citizenship Status | With Coverage | Without Coverage |
| Native Born | 239 (100.0%) | 0 (0.0%) |
| Foreign Born, Citizen | 418 (100.0%) | 0 (0.0%) |
| Foreign Born, not a Citizen | 133 (100.0%) | 0 (0.0%) |
Health Insurance Coverage by Household Income in Highlands borough
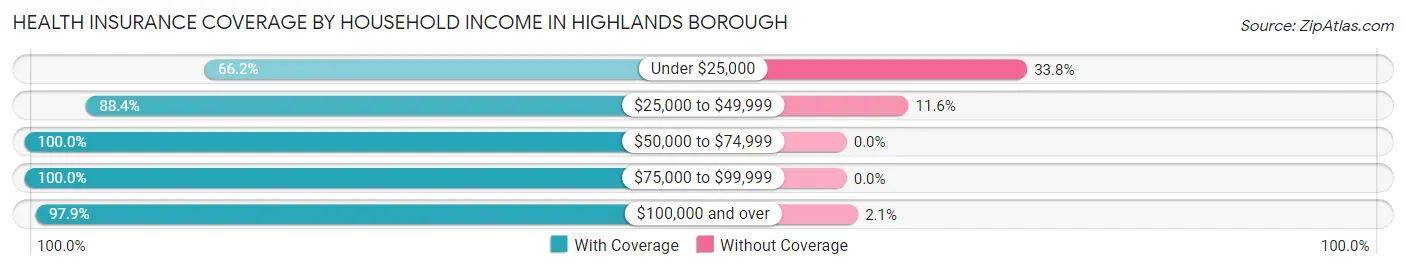
| Household Income | With Coverage | Without Coverage |
| Under $25,000 | 231 (66.2%) | 118 (33.8%) |
| $25,000 to $49,999 | 443 (88.4%) | 58 (11.6%) |
| $50,000 to $74,999 | 428 (100.0%) | 0 (0.0%) |
| $75,000 to $99,999 | 468 (100.0%) | 0 (0.0%) |
| $100,000 and over | 2,787 (97.9%) | 61 (2.1%) |
Public vs Private Health Insurance Coverage by Age in Highlands borough
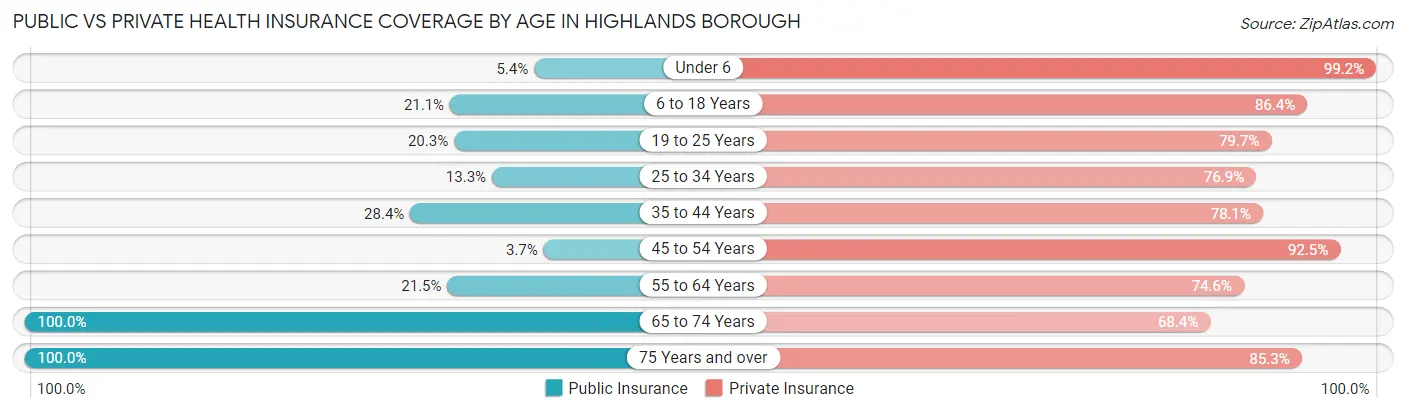
| Age Bracket | Public Insurance | Private Insurance |
| Under 6 | 13 (5.4%) | 237 (99.2%) |
| 6 to 18 Years | 88 (21.0%) | 361 (86.4%) |
| 19 to 25 Years | 27 (20.3%) | 106 (79.7%) |
| 25 to 34 Years | 105 (13.3%) | 609 (76.9%) |
| 35 to 44 Years | 147 (28.4%) | 404 (78.1%) |
| 45 to 54 Years | 20 (3.7%) | 505 (92.5%) |
| 55 to 64 Years | 206 (21.5%) | 714 (74.6%) |
| 65 to 74 Years | 474 (100.0%) | 324 (68.3%) |
| 75 Years and over | 518 (100.0%) | 442 (85.3%) |
| Total | 1,598 (34.8%) | 3,702 (80.6%) |
Disability Status by Sex by Age in Highlands borough
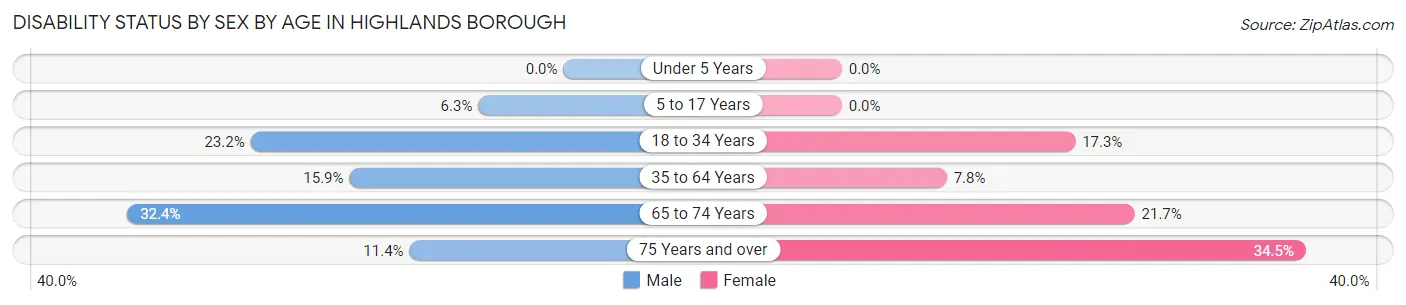
| Age Bracket | Male | Female |
| Under 5 Years | 0 (0.0%) | 0 (0.0%) |
| 5 to 17 Years | 17 (6.3%) | 0 (0.0%) |
| 18 to 34 Years | 115 (23.2%) | 78 (17.3%) |
| 35 to 64 Years | 170 (15.9%) | 74 (7.8%) |
| 65 to 74 Years | 79 (32.4%) | 50 (21.7%) |
| 75 Years and over | 32 (11.4%) | 82 (34.4%) |
Disability Class by Sex by Age in Highlands borough
Disability Class: Hearing Difficulty
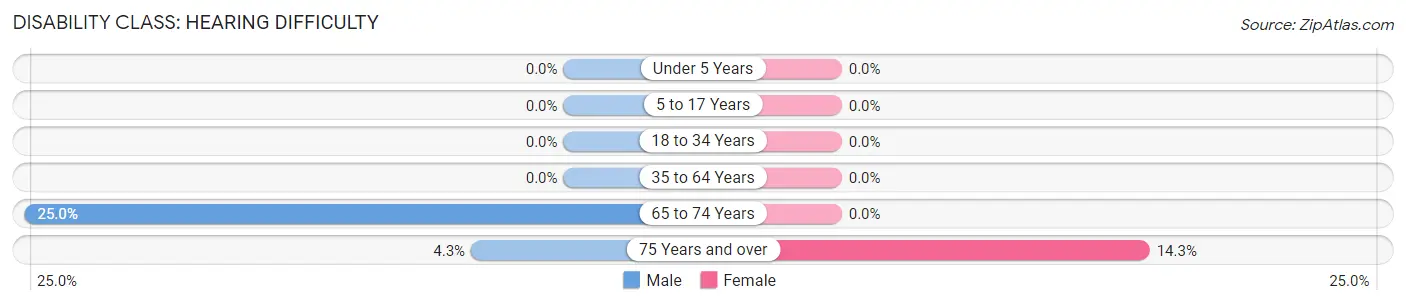
| Age Bracket | Male | Female |
| Under 5 Years | 0 (0.0%) | 0 (0.0%) |
| 5 to 17 Years | 0 (0.0%) | 0 (0.0%) |
| 18 to 34 Years | 0 (0.0%) | 0 (0.0%) |
| 35 to 64 Years | 0 (0.0%) | 0 (0.0%) |
| 65 to 74 Years | 61 (25.0%) | 0 (0.0%) |
| 75 Years and over | 12 (4.3%) | 34 (14.3%) |
Disability Class: Vision Difficulty
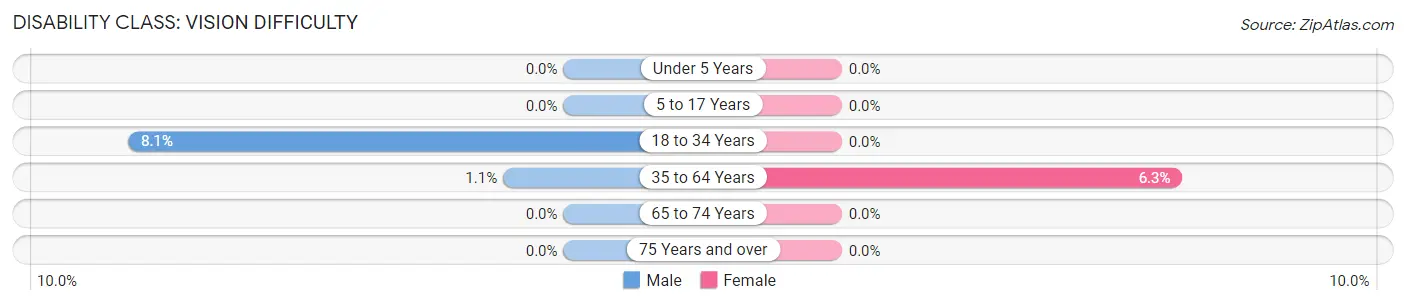
| Age Bracket | Male | Female |
| Under 5 Years | 0 (0.0%) | 0 (0.0%) |
| 5 to 17 Years | 0 (0.0%) | 0 (0.0%) |
| 18 to 34 Years | 40 (8.1%) | 0 (0.0%) |
| 35 to 64 Years | 12 (1.1%) | 60 (6.3%) |
| 65 to 74 Years | 0 (0.0%) | 0 (0.0%) |
| 75 Years and over | 0 (0.0%) | 0 (0.0%) |
Disability Class: Cognitive Difficulty
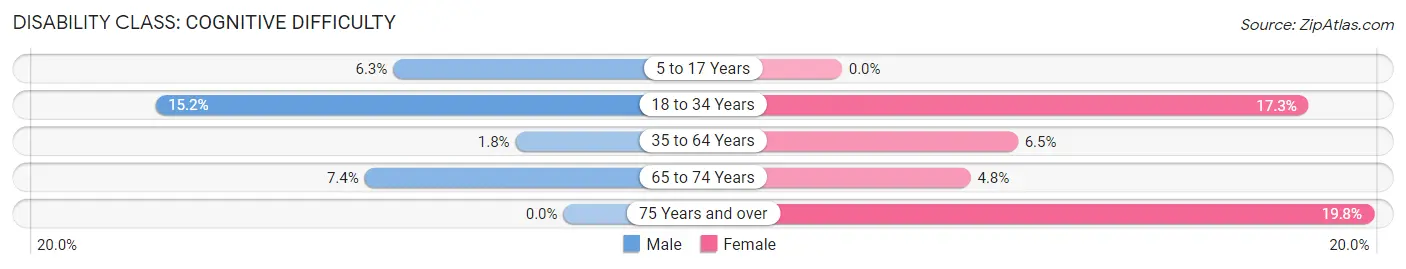
| Age Bracket | Male | Female |
| 5 to 17 Years | 17 (6.3%) | 0 (0.0%) |
| 18 to 34 Years | 75 (15.1%) | 78 (17.3%) |
| 35 to 64 Years | 19 (1.8%) | 62 (6.5%) |
| 65 to 74 Years | 18 (7.4%) | 11 (4.8%) |
| 75 Years and over | 0 (0.0%) | 47 (19.8%) |
Disability Class: Ambulatory Difficulty
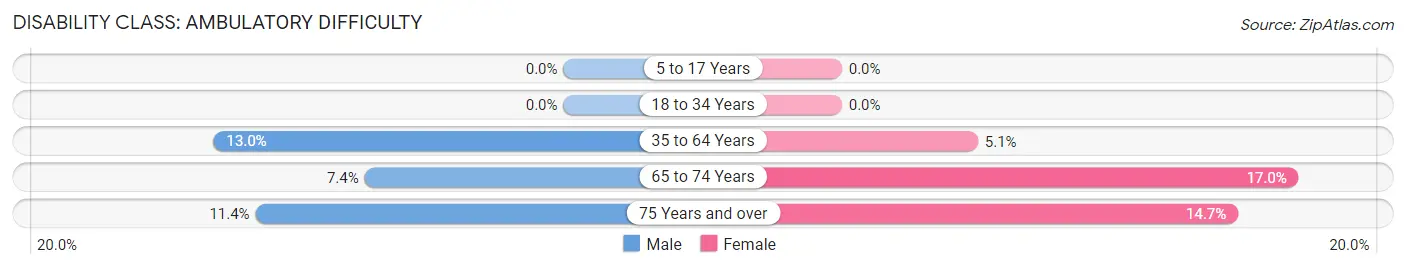
| Age Bracket | Male | Female |
| 5 to 17 Years | 0 (0.0%) | 0 (0.0%) |
| 18 to 34 Years | 0 (0.0%) | 0 (0.0%) |
| 35 to 64 Years | 139 (13.0%) | 48 (5.1%) |
| 65 to 74 Years | 18 (7.4%) | 39 (17.0%) |
| 75 Years and over | 32 (11.4%) | 35 (14.7%) |
Disability Class: Self-Care Difficulty
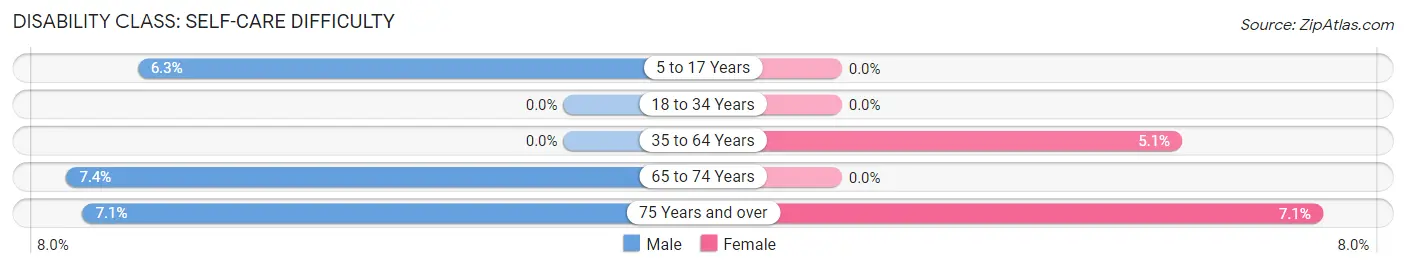
| Age Bracket | Male | Female |
| 5 to 17 Years | 17 (6.3%) | 0 (0.0%) |
| 18 to 34 Years | 0 (0.0%) | 0 (0.0%) |
| 35 to 64 Years | 0 (0.0%) | 48 (5.1%) |
| 65 to 74 Years | 18 (7.4%) | 0 (0.0%) |
| 75 Years and over | 20 (7.1%) | 17 (7.1%) |
Technology Access in Highlands borough
Computing Device Access in Highlands borough
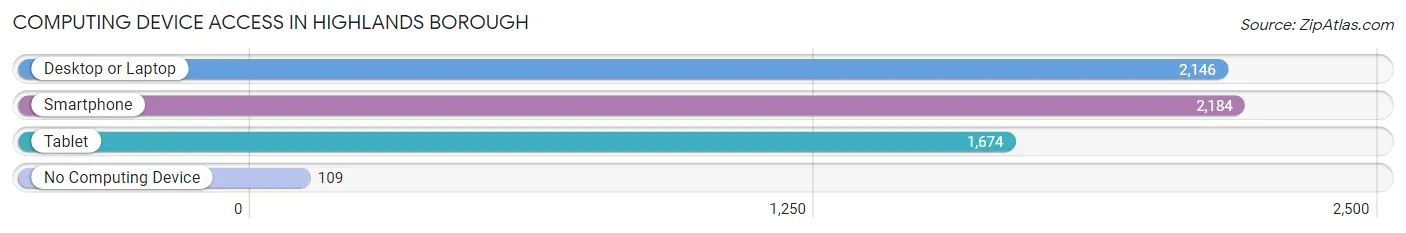
| Device Type | # Households | % Households |
| Desktop or Laptop | 2,146 | 85.3% |
| Smartphone | 2,184 | 86.8% |
| Tablet | 1,674 | 66.6% |
| No Computing Device | 109 | 4.3% |
| Total | 2,515 | 100.0% |
Internet Access in Highlands borough
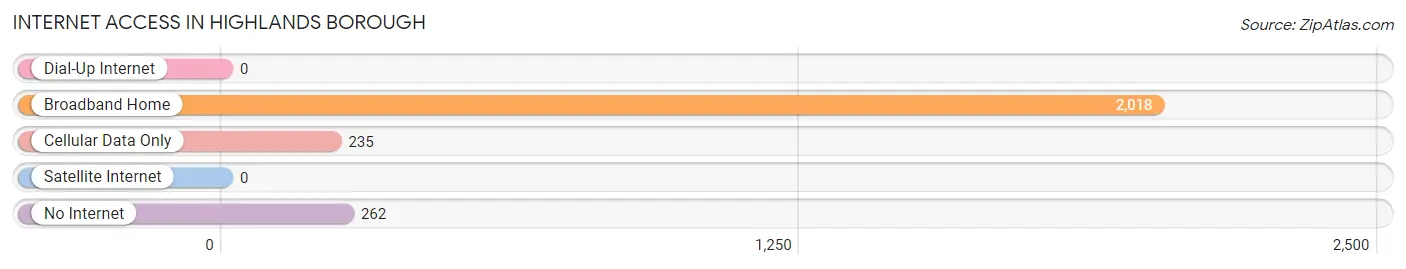
| Internet Type | # Households | % Households |
| Dial-Up Internet | 0 | 0.0% |
| Broadband Home | 2,018 | 80.2% |
| Cellular Data Only | 235 | 9.3% |
| Satellite Internet | 0 | 0.0% |
| No Internet | 262 | 10.4% |
| Total | 2,515 | 100.0% |
Highlands borough Summary
Highlands Borough is a small borough located in Monmouth County, New Jersey. It is situated on the northern tip of the Raritan Bay, and is bordered by the Atlantic Ocean to the east, Sandy Hook Bay to the south, and the Navesink River to the west. The borough is home to a population of approximately 5,000 people, and is a popular destination for tourists and vacationers.
Geography
Highlands Borough is located in the northern part of Monmouth County, New Jersey. It is situated on the northern tip of the Raritan Bay, and is bordered by the Atlantic Ocean to the east, Sandy Hook Bay to the south, and the Navesink River to the west. The borough is approximately 2.5 square miles in size, and is home to a population of approximately 5,000 people. The borough is located in a temperate climate zone, and experiences mild winters and hot summers.
History
Highlands Borough was originally inhabited by the Lenape Native Americans, who lived in the area for centuries before the arrival of European settlers. The first European settlers arrived in the area in the late 1600s, and the borough was officially incorporated in 1897. The borough was originally a fishing and farming community, and was known for its oyster beds and cranberry bogs. In the late 1800s, the borough began to develop as a resort town, and many wealthy New Yorkers began to build summer homes in the area. The borough was also home to a number of military installations during World War II, and was the site of a major naval battle in 1945.
Economy
Highlands Borough is a popular destination for tourists and vacationers, and the local economy is largely dependent on the tourism industry. The borough is home to a number of restaurants, bars, and shops, as well as a number of hotels and motels. The borough is also home to a number of marinas, which provide services to boaters and fishermen. The borough is also home to a number of small businesses, including a number of art galleries, antique stores, and specialty shops.
Demographics
As of the 2010 census, the population of Highlands Borough was 5,005. The racial makeup of the borough was 94.3% White, 2.2% African American, 0.3% Native American, 0.9% Asian, 0.1% Pacific Islander, 0.9% from other races, and 1.3% from two or more races. Hispanic or Latino of any race were 4.2% of the population. The median household income in the borough was $62,813, and the median family income was $76,944. The per capita income in the borough was $32,917.
Conclusion
Highlands Borough is a small borough located in Monmouth County, New Jersey. It is situated on the northern tip of the Raritan Bay, and is bordered by the Atlantic Ocean to the east, Sandy Hook Bay to the south, and the Navesink River to the west. The borough is home to a population of approximately 5,000 people, and is a popular destination for tourists and vacationers. The local economy is largely dependent on the tourism industry, and the borough is home to a number of restaurants, bars, and shops, as well as a number of hotels and motels. The racial makeup of the borough is predominantly white, with a small percentage of African American, Native American, Asian, and Pacific Islander residents. The median household income in the borough is $62,813, and the median family income is $76,944.
Common Questions
What is the Total Population of Highlands borough?
Total Population of Highlands borough is 4,646.
What is the Total Male Population of Highlands borough?
Total Male Population of Highlands borough is 2,480.
What is the Total Female Population of Highlands borough?
Total Female Population of Highlands borough is 2,166.
What is the Ratio of Males per 100 Females in Highlands borough?
There are 114.50 Males per 100 Females in Highlands borough.
What is the Ratio of Females per 100 Males in Highlands borough?
There are 87.34 Females per 100 Males in Highlands borough.
What is the Median Population Age in Highlands borough?
Median Population Age in Highlands borough is 47.0 Years.
What is the Average Family Size in Highlands borough
Average Family Size in Highlands borough is 2.6 People.
What is the Average Household Size in Highlands borough
Average Household Size in Highlands borough is 1.9 People.
What is Per Capita Income in Highlands borough?
Per Capita income in Highlands borough is $72,422.
What is the Median Family Income in Highlands borough?
Median Family Income in Highlands borough is $145,214.
What is the Median Household income in Highlands borough?
Median Household Income in Highlands borough is $86,901.
What is Income or Wage Gap in Highlands borough?
Income or Wage Gap in Highlands borough is 38.0%.
Women in Highlands borough earn 62.0 cents for every dollar earned by a man.
What is Inequality or Gini Index in Highlands borough?
Inequality or Gini Index in Highlands borough is 0.49.
How Large is the Labor Force in Highlands borough?
There are 2,684 People in the Labor Forcein in Highlands borough.
What is the Percentage of People in the Labor Force in Highlands borough?
65.7% of People are in the Labor Force in Highlands borough.
What is the Unemployment Rate in Highlands borough?
Unemployment Rate in Highlands borough is 6.3%.