West Long Branch borough, NJ
West Long Branch borough Overview
8,547
TOTAL POPULATION
3,876
MALE POPULATION
4,671
FEMALE POPULATION
82.98
MALES / 100 FEMALES
120.51
FEMALES / 100 MALES
31.4
MEDIAN AGE
3.2
AVG FAMILY SIZE
2.6
AVG HOUSEHOLD SIZE
$49,295
PER CAPITA INCOME
$153,352
AVG FAMILY INCOME
$114,036
AVG HOUSEHOLD INCOME
27.9%
WAGE / INCOME GAP [ % ]
72.1¢/ $1
WAGE / INCOME GAP [ $ ]
$15,947
FAMILY INCOME DEFICIT
0.47
INEQUALITY / GINI INDEX
4,523
LABOR FORCE [ PEOPLE ]
63.8%
PERCENT IN LABOR FORCE
7.5%
UNEMPLOYMENT RATE
Race in West Long Branch borough
The most populous races in West Long Branch borough are White / Caucasian (7,431 | 86.9%), Hispanic or Latino (511 | 6.0%), and Black / African American (474 | 5.6%).
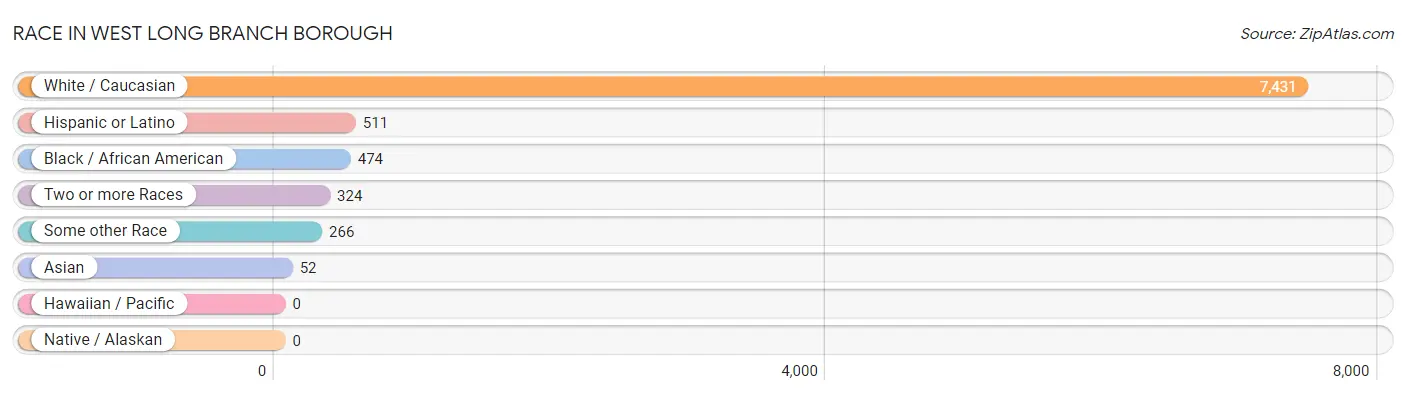
| Race | # Population | % Population |
| Asian | 52 | 0.6% |
| Black / African American | 474 | 5.6% |
| Hawaiian / Pacific | 0 | 0.0% |
| Hispanic or Latino | 511 | 6.0% |
| Native / Alaskan | 0 | 0.0% |
| White / Caucasian | 7,431 | 86.9% |
| Two or more Races | 324 | 3.8% |
| Some other Race | 266 | 3.1% |
| Total | 8,547 | 100.0% |
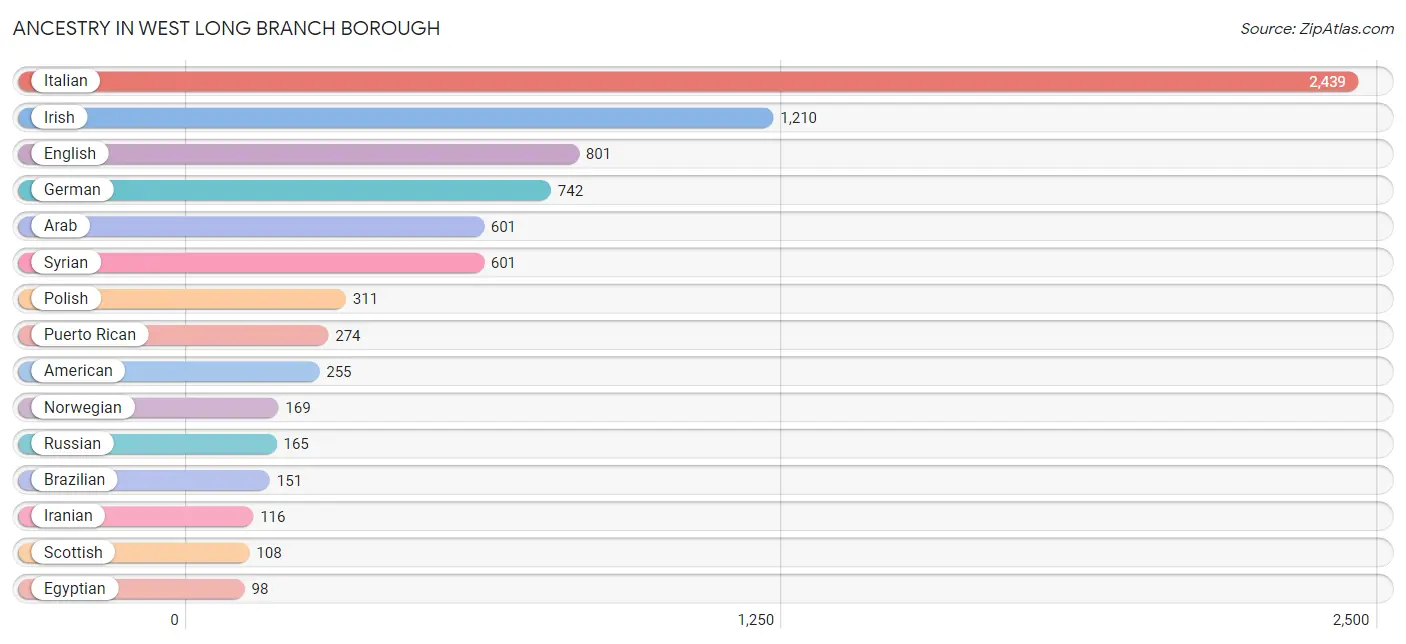
Ancestry in West Long Branch borough
The most populous ancestries reported in West Long Branch borough are Italian (2,439 | 28.5%), Irish (1,210 | 14.2%), English (801 | 9.4%), German (742 | 8.7%), and Arab (601 | 7.0%), together accounting for 67.8% of all West Long Branch borough residents.
| Ancestry | # Population | % Population |
| American | 255 | 3.0% |
| Arab | 601 | 7.0% |
| Bhutanese | 31 | 0.4% |
| Brazilian | 151 | 1.8% |
| British | 14 | 0.2% |
| Burmese | 8 | 0.1% |
| Canadian | 8 | 0.1% |
| Cherokee | 24 | 0.3% |
| Colombian | 45 | 0.5% |
| Croatian | 44 | 0.5% |
| Danish | 32 | 0.4% |
| Dominican | 11 | 0.1% |
| Dutch | 56 | 0.7% |
| Eastern European | 58 | 0.7% |
| Egyptian | 98 | 1.1% |
| English | 801 | 9.4% |
| European | 64 | 0.7% |
| French | 71 | 0.8% |
| German | 742 | 8.7% |
| Greek | 51 | 0.6% |
| Hungarian | 8 | 0.1% |
| Indian (Asian) | 30 | 0.4% |
| Iranian | 116 | 1.4% |
| Irish | 1,210 | 14.2% |
| Israeli | 8 | 0.1% |
| Italian | 2,439 | 28.5% |
| Jamaican | 17 | 0.2% |
| Lebanese | 35 | 0.4% |
| Mexican | 60 | 0.7% |
| Northern European | 6 | 0.1% |
| Norwegian | 169 | 2.0% |
| Polish | 311 | 3.6% |
| Portuguese | 84 | 1.0% |
| Puerto Rican | 274 | 3.2% |
| Russian | 165 | 1.9% |
| Scotch-Irish | 7 | 0.1% |
| Scottish | 108 | 1.3% |
| Serbian | 11 | 0.1% |
| Slovak | 30 | 0.4% |
| Slovene | 9 | 0.1% |
| South American | 53 | 0.6% |
| Spaniard | 10 | 0.1% |
| Spanish | 10 | 0.1% |
| Swedish | 84 | 1.0% |
| Syrian | 601 | 7.0% |
| Thai | 8 | 0.1% |
| Turkish | 10 | 0.1% |
| Ukrainian | 9 | 0.1% |
| Uruguayan | 8 | 0.1% |
| Welsh | 24 | 0.3% | View All 50 Rows |
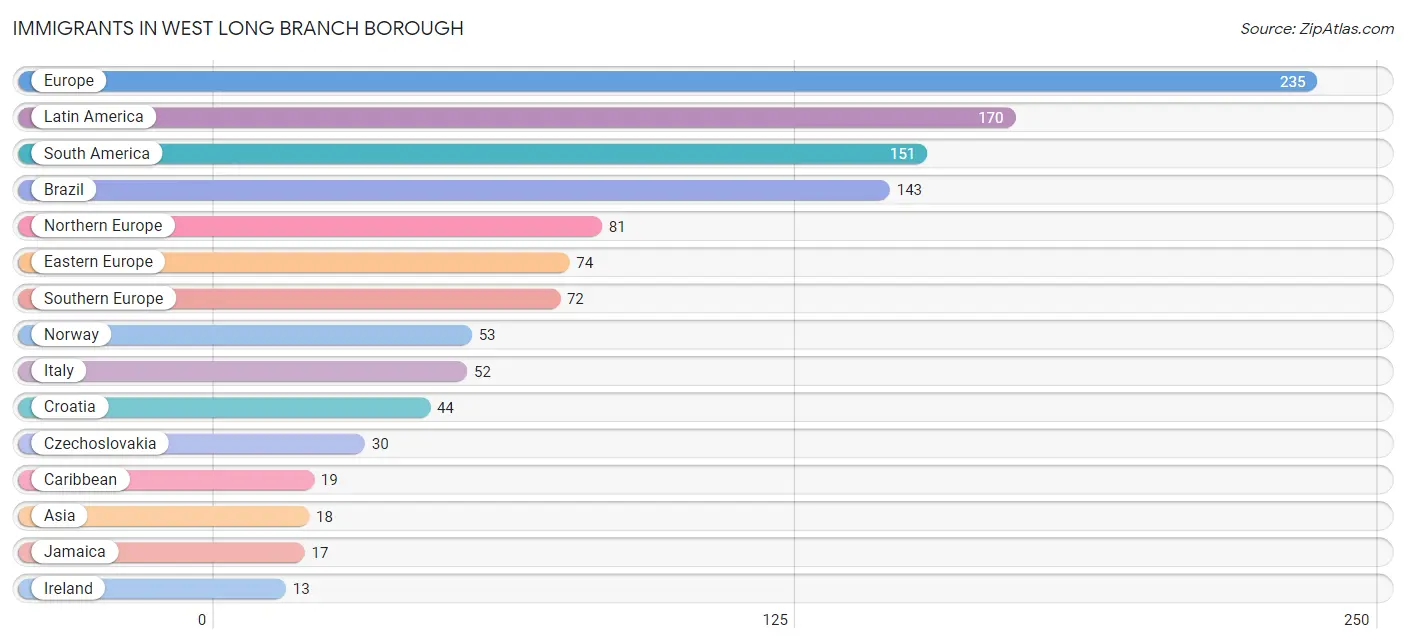
Immigrants in West Long Branch borough
The most numerous immigrant groups reported in West Long Branch borough came from Europe (235 | 2.8%), Latin America (170 | 2.0%), South America (151 | 1.8%), Brazil (143 | 1.7%), and Northern Europe (81 | 0.9%), together accounting for 9.1% of all West Long Branch borough residents.
| Immigration Origin | # Population | % Population |
| Africa | 9 | 0.1% |
| Asia | 18 | 0.2% |
| Brazil | 143 | 1.7% |
| Canada | 10 | 0.1% |
| Caribbean | 19 | 0.2% |
| China | 3 | 0.0% |
| Croatia | 44 | 0.5% |
| Czechoslovakia | 30 | 0.4% |
| Dominica | 2 | 0.0% |
| Eastern Asia | 11 | 0.1% |
| Eastern Europe | 74 | 0.9% |
| Egypt | 9 | 0.1% |
| England | 12 | 0.1% |
| Europe | 235 | 2.8% |
| Germany | 8 | 0.1% |
| Greece | 7 | 0.1% |
| Ireland | 13 | 0.2% |
| Israel | 3 | 0.0% |
| Italy | 52 | 0.6% |
| Jamaica | 17 | 0.2% |
| Korea | 8 | 0.1% |
| Latin America | 170 | 2.0% |
| Lebanon | 4 | 0.1% |
| Northern Africa | 9 | 0.1% |
| Northern Europe | 81 | 0.9% |
| Norway | 53 | 0.6% |
| Portugal | 11 | 0.1% |
| South America | 151 | 1.8% |
| Southern Europe | 72 | 0.8% |
| Spain | 2 | 0.0% |
| Uruguay | 8 | 0.1% |
| Western Asia | 7 | 0.1% |
| Western Europe | 8 | 0.1% | View All 33 Rows |
Sex and Age in West Long Branch borough
Sex and Age in West Long Branch borough
The most populous age groups in West Long Branch borough are 20 to 24 Years (558 | 14.4%) for men and 15 to 19 Years (852 | 18.2%) for women.
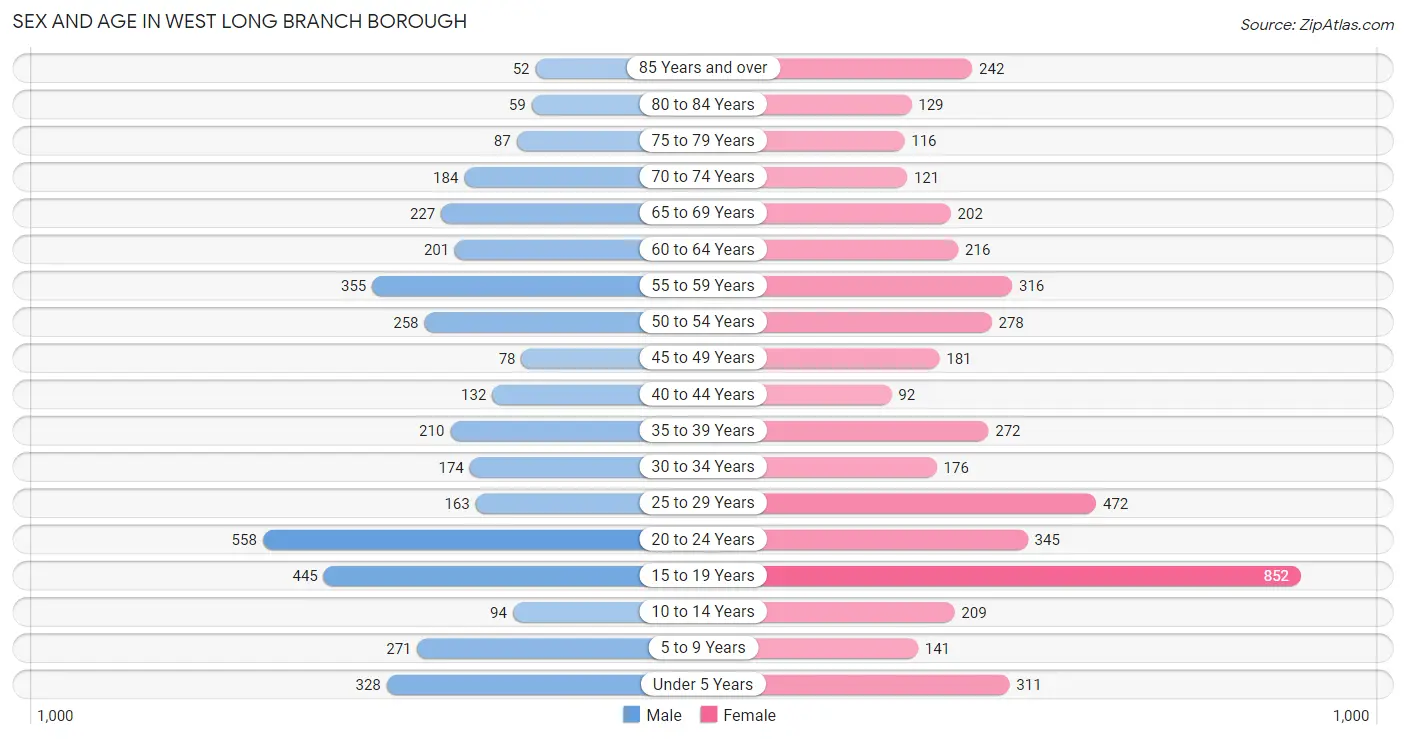
| Age Bracket | Male | Female |
| Under 5 Years | 328 (8.5%) | 311 (6.7%) |
| 5 to 9 Years | 271 (7.0%) | 141 (3.0%) |
| 10 to 14 Years | 94 (2.4%) | 209 (4.5%) |
| 15 to 19 Years | 445 (11.5%) | 852 (18.2%) |
| 20 to 24 Years | 558 (14.4%) | 345 (7.4%) |
| 25 to 29 Years | 163 (4.2%) | 472 (10.1%) |
| 30 to 34 Years | 174 (4.5%) | 176 (3.8%) |
| 35 to 39 Years | 210 (5.4%) | 272 (5.8%) |
| 40 to 44 Years | 132 (3.4%) | 92 (2.0%) |
| 45 to 49 Years | 78 (2.0%) | 181 (3.9%) |
| 50 to 54 Years | 258 (6.7%) | 278 (5.9%) |
| 55 to 59 Years | 355 (9.2%) | 316 (6.8%) |
| 60 to 64 Years | 201 (5.2%) | 216 (4.6%) |
| 65 to 69 Years | 227 (5.9%) | 202 (4.3%) |
| 70 to 74 Years | 184 (4.8%) | 121 (2.6%) |
| 75 to 79 Years | 87 (2.2%) | 116 (2.5%) |
| 80 to 84 Years | 59 (1.5%) | 129 (2.8%) |
| 85 Years and over | 52 (1.3%) | 242 (5.2%) |
| Total | 3,876 (100.0%) | 4,671 (100.0%) |
Families and Households in West Long Branch borough
Median Family Size in West Long Branch borough
The median family size in West Long Branch borough is 3.21 persons per family, with married-couple families (1,691 | 86.8%) accounting for the largest median family size of 3.31 persons per family. On the other hand, single male/father families (44 | 2.3%) represent the smallest median family size with 2.27 persons per family.
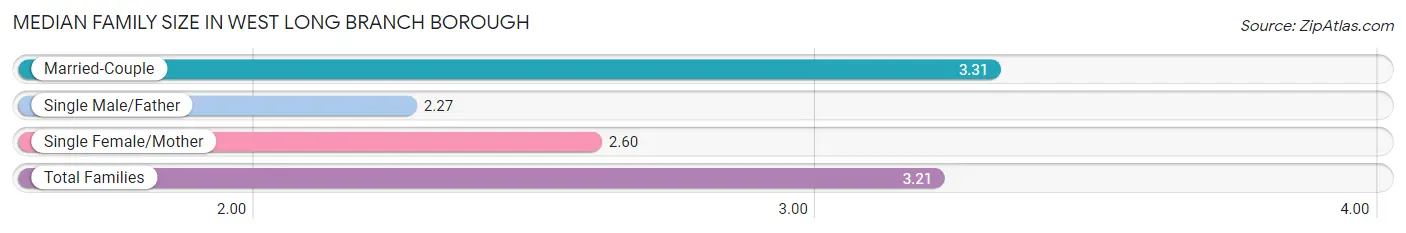
| Family Type | # Families | Family Size |
| Married-Couple | 1,691 (86.8%) | 3.31 |
| Single Male/Father | 44 (2.3%) | 2.27 |
| Single Female/Mother | 213 (10.9%) | 2.60 |
| Total Families | 1,948 (100.0%) | 3.21 |
Median Household Size in West Long Branch borough
The median household size in West Long Branch borough is 2.61 persons per household, with married-couple households (1,691 | 61.6%) accounting for the largest median household size of 3.32 persons per household. non-family households (799 | 29.1%) represent the smallest median household size with 1.13 persons per household.
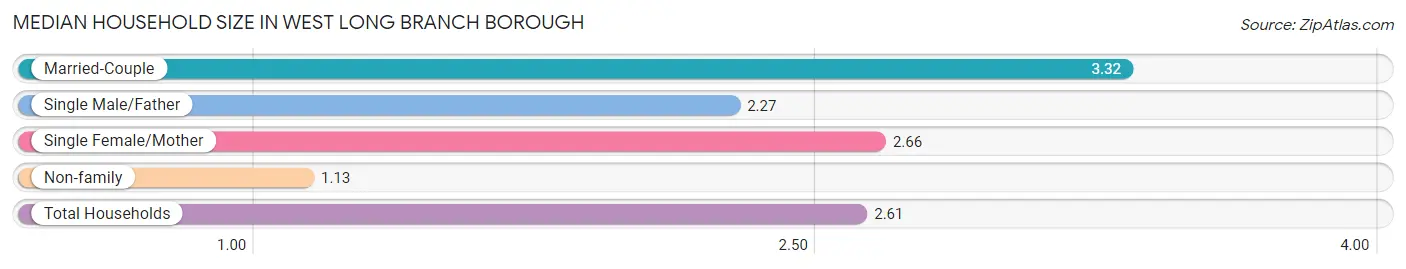
| Household Type | # Households | Household Size |
| Married-Couple | 1,691 (61.6%) | 3.32 |
| Single Male/Father | 44 (1.6%) | 2.27 |
| Single Female/Mother | 213 (7.7%) | 2.66 |
| Non-family | 799 (29.1%) | 1.13 |
| Total Households | 2,747 (100.0%) | 2.61 |
Household Size by Marriage Status in West Long Branch borough
Out of a total of 2,747 households in West Long Branch borough, 1,948 (70.9%) are family households, while 799 (29.1%) are nonfamily households. The most numerous type of family households are 2-person households, comprising 694, and the most common type of nonfamily households are 1-person households, comprising 697.
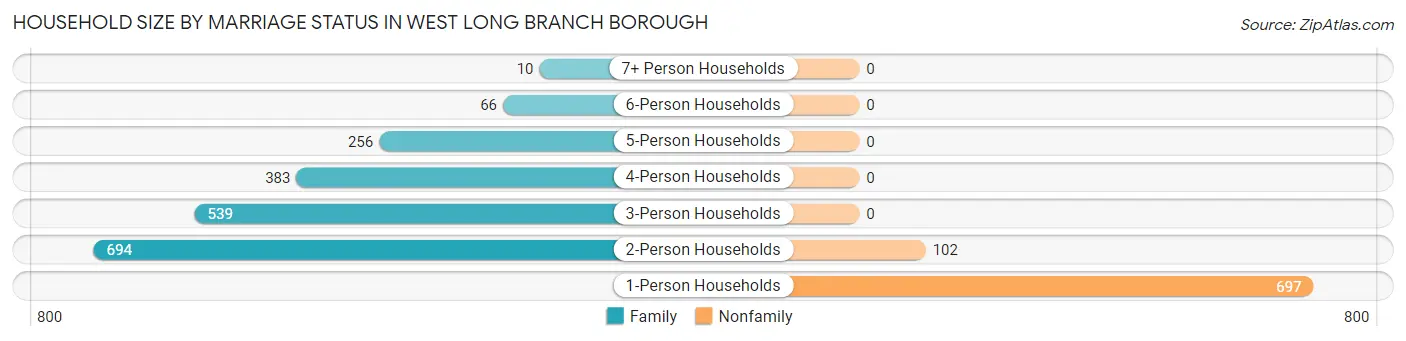
| Household Size | Family Households | Nonfamily Households |
| 1-Person Households | - | 697 (25.4%) |
| 2-Person Households | 694 (25.3%) | 102 (3.7%) |
| 3-Person Households | 539 (19.6%) | 0 (0.0%) |
| 4-Person Households | 383 (13.9%) | 0 (0.0%) |
| 5-Person Households | 256 (9.3%) | 0 (0.0%) |
| 6-Person Households | 66 (2.4%) | 0 (0.0%) |
| 7+ Person Households | 10 (0.4%) | 0 (0.0%) |
| Total | 1,948 (70.9%) | 799 (29.1%) |
Female Fertility in West Long Branch borough
Fertility by Age in West Long Branch borough
Average fertility rate in West Long Branch borough is 57.0 births per 1,000 women. Women in the age bracket of 20 to 34 years have the highest fertility rate with 115.0 births per 1,000 women. Women in the age bracket of 20 to 34 years acount for 83.2% of all women with births.
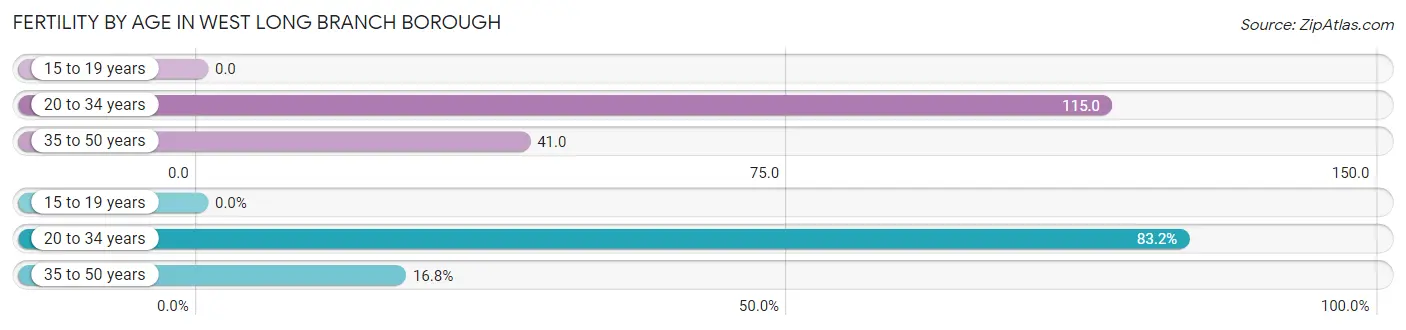
| Age Bracket | Women with Births | Births / 1,000 Women |
| 15 to 19 years | 0 (0.0%) | 0.0 |
| 20 to 34 years | 114 (83.2%) | 115.0 |
| 35 to 50 years | 23 (16.8%) | 41.0 |
| Total | 137 (100.0%) | 57.0 |
Fertility by Age by Marriage Status in West Long Branch borough
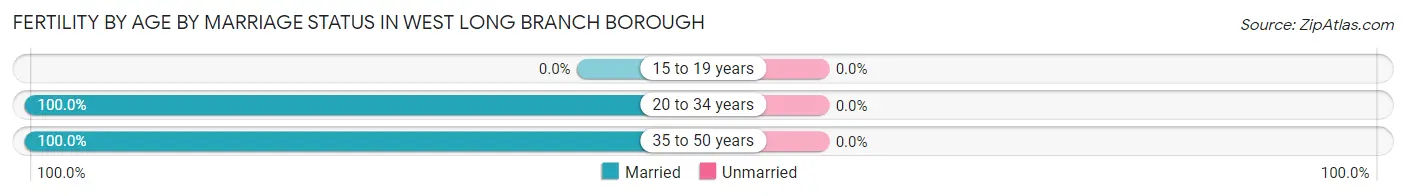
| Age Bracket | Married | Unmarried |
| 15 to 19 years | 0 (0.0%) | 0 (0.0%) |
| 20 to 34 years | 114 (100.0%) | 0 (0.0%) |
| 35 to 50 years | 23 (100.0%) | 0 (0.0%) |
| Total | 137 (100.0%) | 0 (0.0%) |
Fertility by Education in West Long Branch borough
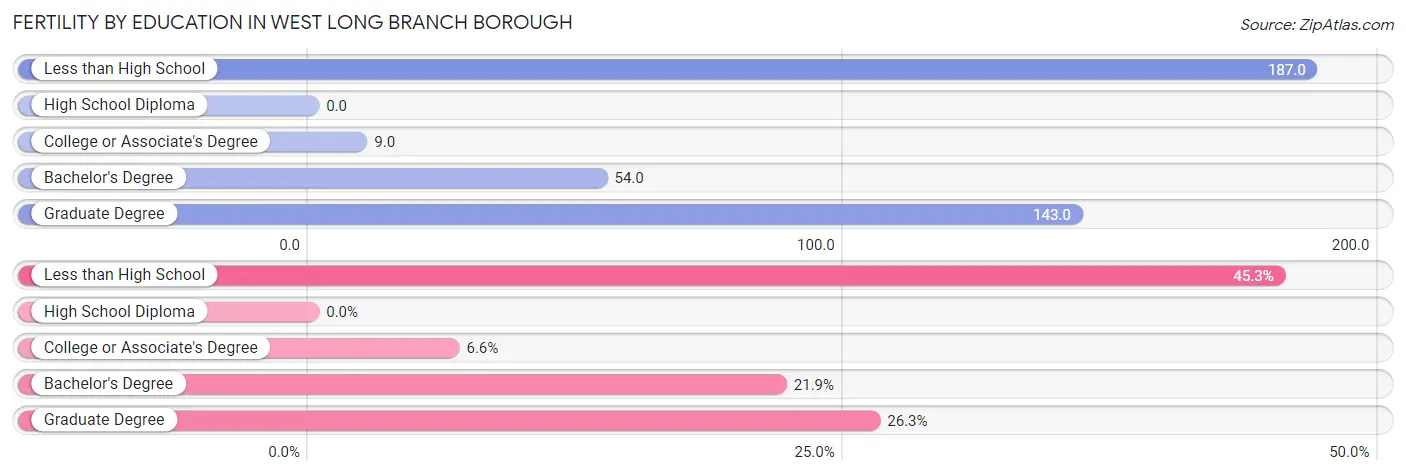
| Educational Attainment | Women with Births | Births / 1,000 Women |
| Less than High School | 62 (45.3%) | 187.0 |
| High School Diploma | 0 (0.0%) | 0.0 |
| College or Associate's Degree | 9 (6.6%) | 9.0 |
| Bachelor's Degree | 30 (21.9%) | 54.0 |
| Graduate Degree | 36 (26.3%) | 143.0 |
| Total | 137 (100.0%) | 57.0 |
Fertility by Education by Marriage Status in West Long Branch borough
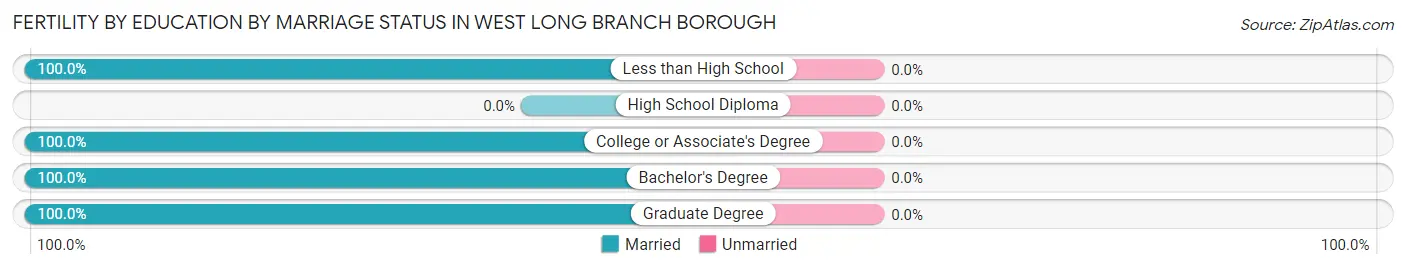
| Educational Attainment | Married | Unmarried |
| Less than High School | 62 (100.0%) | 0 (0.0%) |
| High School Diploma | 0 (0.0%) | 0 (0.0%) |
| College or Associate's Degree | 9 (100.0%) | 0 (0.0%) |
| Bachelor's Degree | 30 (100.0%) | 0 (0.0%) |
| Graduate Degree | 36 (100.0%) | 0 (0.0%) |
| Total | 137 (100.0%) | 0 (0.0%) |
Income in West Long Branch borough
Income Overview in West Long Branch borough
Per Capita Income in West Long Branch borough is $49,295, while median incomes of families and households are $153,352 and $114,036 respectively.
| Characteristic | Number | Measure |
| Per Capita Income | 8,547 | $49,295 |
| Median Family Income | 1,948 | $153,352 |
| Mean Family Income | 1,948 | $185,037 |
| Median Household Income | 2,747 | $114,036 |
| Mean Household Income | 2,747 | $150,923 |
| Income Deficit | 1,948 | $15,947 |
| Wage / Income Gap (%) | 8,547 | 27.93% |
| Wage / Income Gap ($) | 8,547 | 72.07¢ per $1 |
| Gini / Inequality Index | 8,547 | 0.47 |
Earnings by Sex in West Long Branch borough
Average Earnings in West Long Branch borough are $38,750, $45,307 for men and $32,653 for women, a difference of 27.9%.
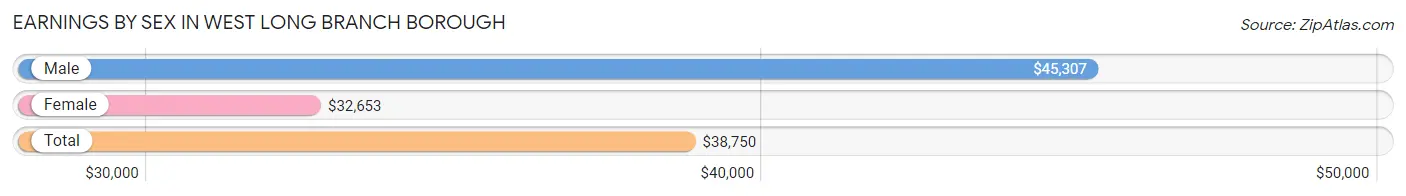
| Sex | Number | Average Earnings |
| Male | 2,476 (50.1%) | $45,307 |
| Female | 2,470 (49.9%) | $32,653 |
| Total | 4,946 (100.0%) | $38,750 |
Earnings by Sex by Income Bracket in West Long Branch borough
The most common earnings brackets in West Long Branch borough are $100,000+ for men (765 | 30.9%) and $2,499 or less for women (394 | 16.0%).
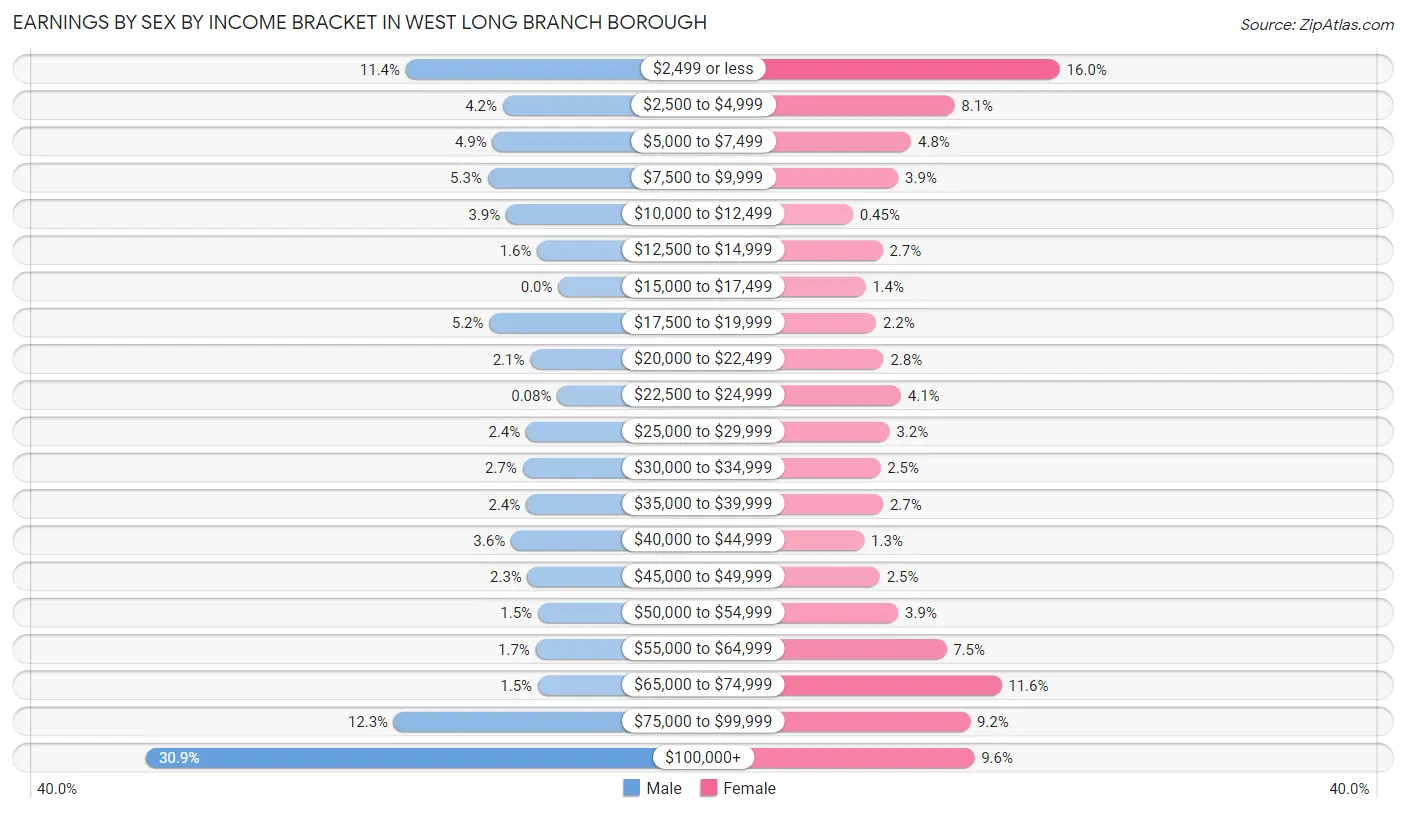
| Income | Male | Female |
| $2,499 or less | 283 (11.4%) | 394 (16.0%) |
| $2,500 to $4,999 | 103 (4.2%) | 199 (8.1%) |
| $5,000 to $7,499 | 122 (4.9%) | 119 (4.8%) |
| $7,500 to $9,999 | 131 (5.3%) | 95 (3.8%) |
| $10,000 to $12,499 | 97 (3.9%) | 11 (0.4%) |
| $12,500 to $14,999 | 39 (1.6%) | 66 (2.7%) |
| $15,000 to $17,499 | 0 (0.0%) | 34 (1.4%) |
| $17,500 to $19,999 | 128 (5.2%) | 54 (2.2%) |
| $20,000 to $22,499 | 52 (2.1%) | 68 (2.8%) |
| $22,500 to $24,999 | 2 (0.1%) | 100 (4.1%) |
| $25,000 to $29,999 | 60 (2.4%) | 79 (3.2%) |
| $30,000 to $34,999 | 66 (2.7%) | 62 (2.5%) |
| $35,000 to $39,999 | 60 (2.4%) | 67 (2.7%) |
| $40,000 to $44,999 | 88 (3.5%) | 32 (1.3%) |
| $45,000 to $49,999 | 57 (2.3%) | 61 (2.5%) |
| $50,000 to $54,999 | 38 (1.5%) | 95 (3.8%) |
| $55,000 to $64,999 | 42 (1.7%) | 184 (7.4%) |
| $65,000 to $74,999 | 38 (1.5%) | 286 (11.6%) |
| $75,000 to $99,999 | 305 (12.3%) | 228 (9.2%) |
| $100,000+ | 765 (30.9%) | 236 (9.6%) |
| Total | 2,476 (100.0%) | 2,470 (100.0%) |
Earnings by Sex by Educational Attainment in West Long Branch borough
Average earnings in West Long Branch borough are $87,635 for men and $60,919 for women, a difference of 30.5%. Men with an educational attainment of graduate degree enjoy the highest average annual earnings of $175,417, while those with college or associate's degree education earn the least with $46,838. Women with an educational attainment of bachelor's degree earn the most with the average annual earnings of $69,016, while those with high school diploma education have the smallest earnings of $32,760.
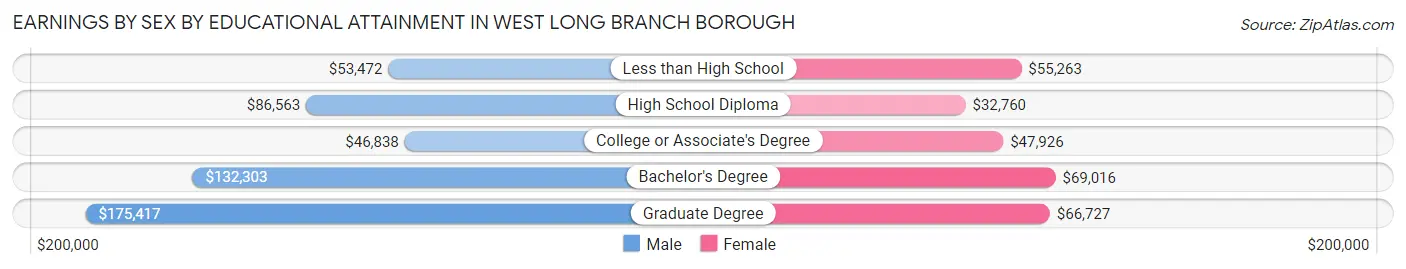
| Educational Attainment | Male Income | Female Income |
| Less than High School | $53,472 | $55,263 |
| High School Diploma | $86,563 | $32,760 |
| College or Associate's Degree | $46,838 | $47,926 |
| Bachelor's Degree | $132,303 | $69,016 |
| Graduate Degree | $175,417 | $66,727 |
| Total | $87,635 | $60,919 |
Family Income in West Long Branch borough
Family Income Brackets in West Long Branch borough
According to the West Long Branch borough family income data, there are 616 families falling into the $200,000+ income range, which is the most common income bracket and makes up 31.6% of all families. Conversely, the less than $10,000 income bracket is the least frequent group with only 4 families (0.2%) belonging to this category.
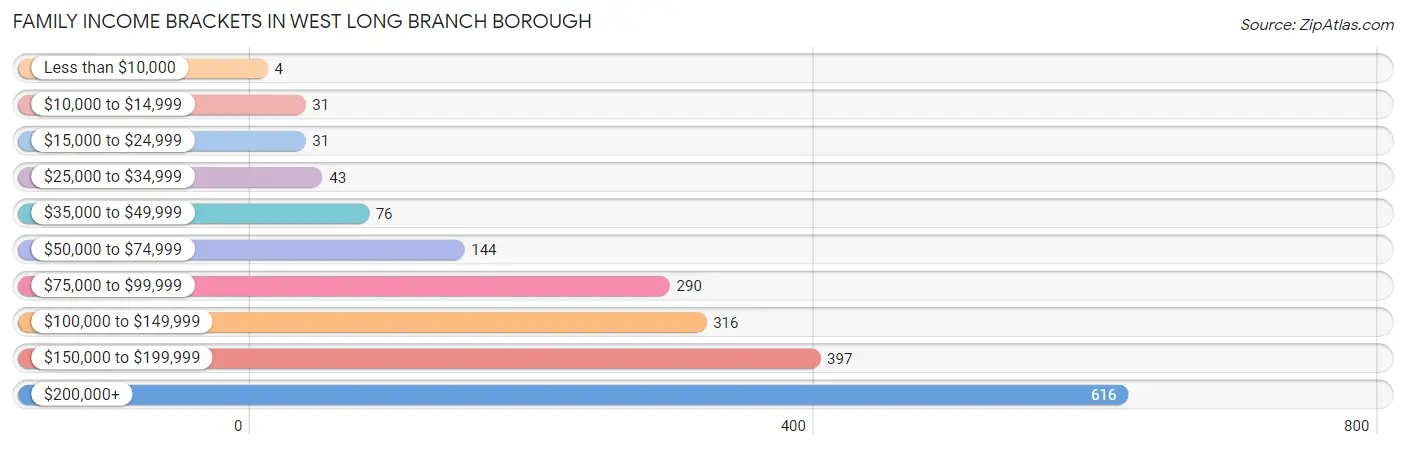
| Income Bracket | # Families | % Families |
| Less than $10,000 | 4 | 0.2% |
| $10,000 to $14,999 | 31 | 1.6% |
| $15,000 to $24,999 | 31 | 1.6% |
| $25,000 to $34,999 | 43 | 2.2% |
| $35,000 to $49,999 | 76 | 3.9% |
| $50,000 to $74,999 | 144 | 7.4% |
| $75,000 to $99,999 | 290 | 14.9% |
| $100,000 to $149,999 | 316 | 16.2% |
| $150,000 to $199,999 | 397 | 20.4% |
| $200,000+ | 616 | 31.6% |
Family Income by Famaliy Size in West Long Branch borough
3-person families (541 | 27.8%) account for the highest median family income in West Long Branch borough with $186,103 per family, while 3-person families (541 | 27.8%) have the highest median income of $62,034 per family member.
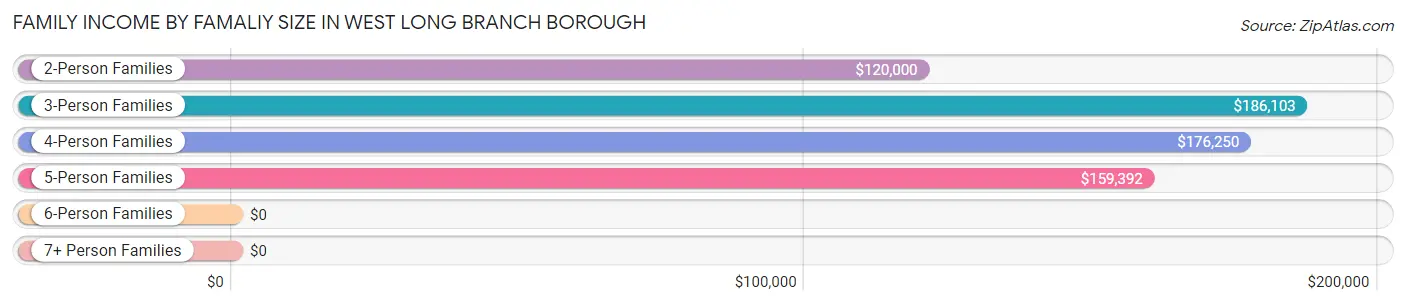
| Income Bracket | # Families | Median Income |
| 2-Person Families | 704 (36.1%) | $120,000 |
| 3-Person Families | 541 (27.8%) | $186,103 |
| 4-Person Families | 377 (19.4%) | $176,250 |
| 5-Person Families | 250 (12.8%) | $159,392 |
| 6-Person Families | 66 (3.4%) | $0 |
| 7+ Person Families | 10 (0.5%) | $0 |
| Total | 1,948 (100.0%) | $153,352 |
Family Income by Number of Earners in West Long Branch borough
The median family income in West Long Branch borough is $153,352, with families comprising 3+ earners (391) having the highest median family income of $213,793, while families with 1 earner (680) have the lowest median family income of $92,857, accounting for 20.1% and 34.9% of families, respectively.
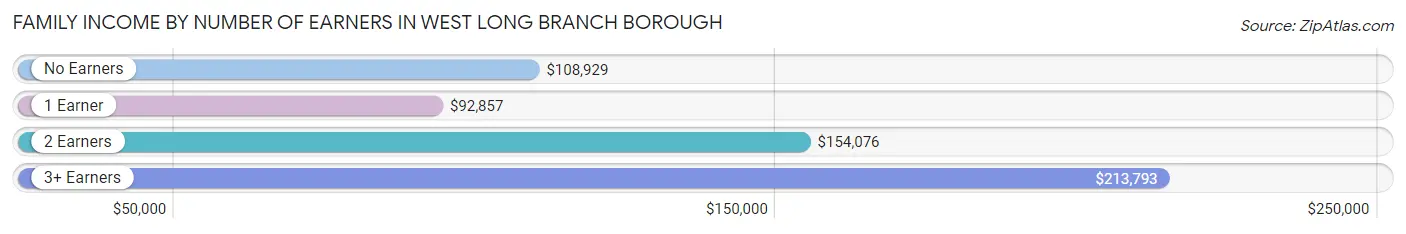
| Number of Earners | # Families | Median Income |
| No Earners | 134 (6.9%) | $108,929 |
| 1 Earner | 680 (34.9%) | $92,857 |
| 2 Earners | 743 (38.1%) | $154,076 |
| 3+ Earners | 391 (20.1%) | $213,793 |
| Total | 1,948 (100.0%) | $153,352 |
Household Income in West Long Branch borough
Household Income Brackets in West Long Branch borough
With 648 households falling in the category, the $200,000+ income range is the most frequent in West Long Branch borough, accounting for 23.6% of all households. In contrast, only 63 households (2.3%) fall into the $25,000 to $34,999 income bracket, making it the least populous group.
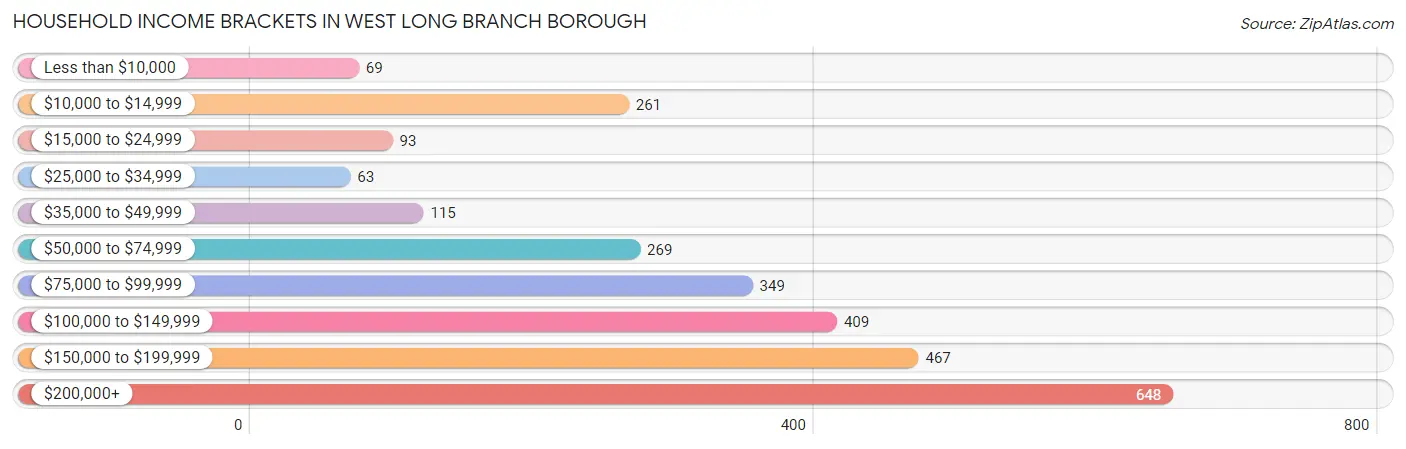
| Income Bracket | # Households | % Households |
| Less than $10,000 | 69 | 2.5% |
| $10,000 to $14,999 | 261 | 9.5% |
| $15,000 to $24,999 | 93 | 3.4% |
| $25,000 to $34,999 | 63 | 2.3% |
| $35,000 to $49,999 | 115 | 4.2% |
| $50,000 to $74,999 | 269 | 9.8% |
| $75,000 to $99,999 | 349 | 12.7% |
| $100,000 to $149,999 | 409 | 14.9% |
| $150,000 to $199,999 | 467 | 17.0% |
| $200,000+ | 648 | 23.6% |
Household Income by Householder Age in West Long Branch borough
The median household income in West Long Branch borough is $114,036, with the highest median household income of $173,750 found in the 45 to 64 years age bracket for the primary householder. A total of 968 households (35.2%) fall into this category. Meanwhile, the 15 to 24 years age bracket for the primary householder has the lowest median household income of $0, with 61 households (2.2%) in this group.
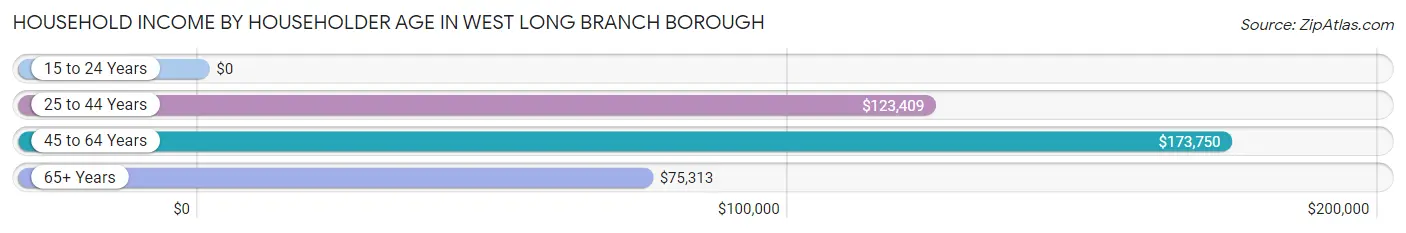
| Income Bracket | # Households | Median Income |
| 15 to 24 Years | 61 (2.2%) | $0 |
| 25 to 44 Years | 664 (24.2%) | $123,409 |
| 45 to 64 Years | 968 (35.2%) | $173,750 |
| 65+ Years | 1,054 (38.4%) | $75,313 |
| Total | 2,747 (100.0%) | $114,036 |
Poverty in West Long Branch borough
Income Below Poverty by Sex and Age in West Long Branch borough
With 6.3% poverty level for males and 6.0% for females among the residents of West Long Branch borough, 12 to 14 year old males and 16 and 17 year old females are the most vulnerable to poverty, with 33 males (47.1%) and 33 females (28.2%) in their respective age groups living below the poverty level.
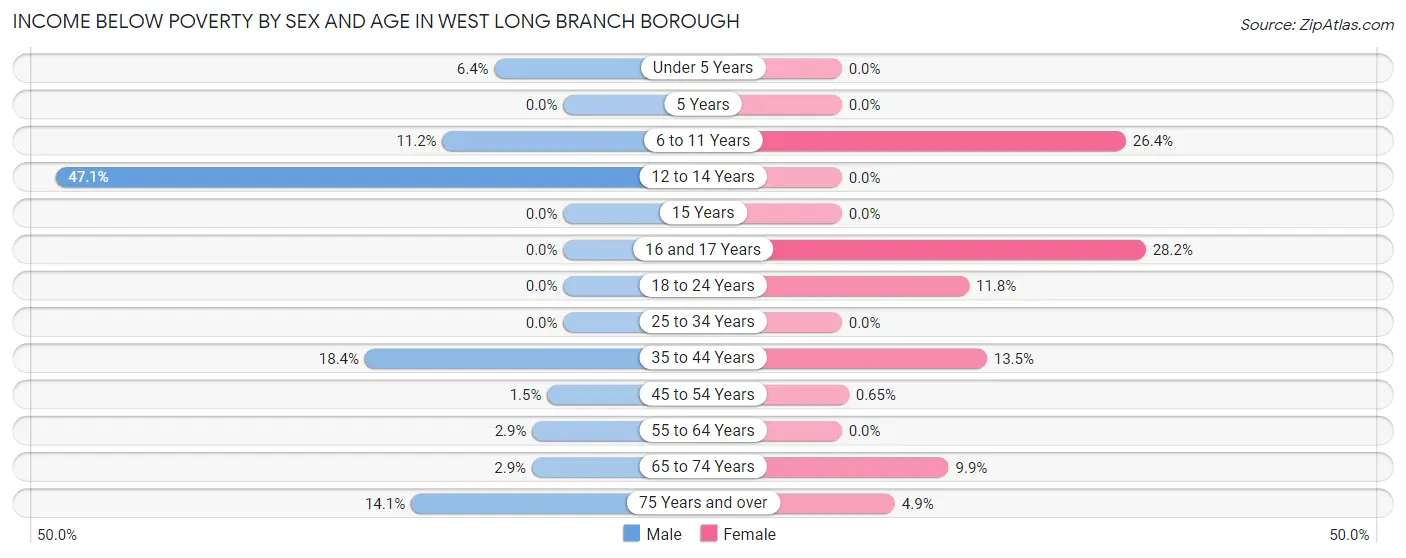
| Age Bracket | Male | Female |
| Under 5 Years | 21 (6.4%) | 0 (0.0%) |
| 5 Years | 0 (0.0%) | 0 (0.0%) |
| 6 to 11 Years | 23 (11.2%) | 53 (26.4%) |
| 12 to 14 Years | 33 (47.1%) | 0 (0.0%) |
| 15 Years | 0 (0.0%) | 0 (0.0%) |
| 16 and 17 Years | 0 (0.0%) | 33 (28.2%) |
| 18 to 24 Years | 0 (0.0%) | 45 (11.8%) |
| 25 to 34 Years | 0 (0.0%) | 0 (0.0%) |
| 35 to 44 Years | 63 (18.4%) | 49 (13.5%) |
| 45 to 54 Years | 5 (1.5%) | 3 (0.6%) |
| 55 to 64 Years | 16 (2.9%) | 0 (0.0%) |
| 65 to 74 Years | 12 (2.9%) | 32 (9.9%) |
| 75 Years and over | 28 (14.1%) | 24 (4.9%) |
| Total | 201 (6.3%) | 239 (6.0%) |
Income Above Poverty by Sex and Age in West Long Branch borough
According to the poverty statistics in West Long Branch borough, males aged 5 years and females aged under 5 years are the age groups that are most secure financially, with 100.0% of males and 100.0% of females in these age groups living above the poverty line.
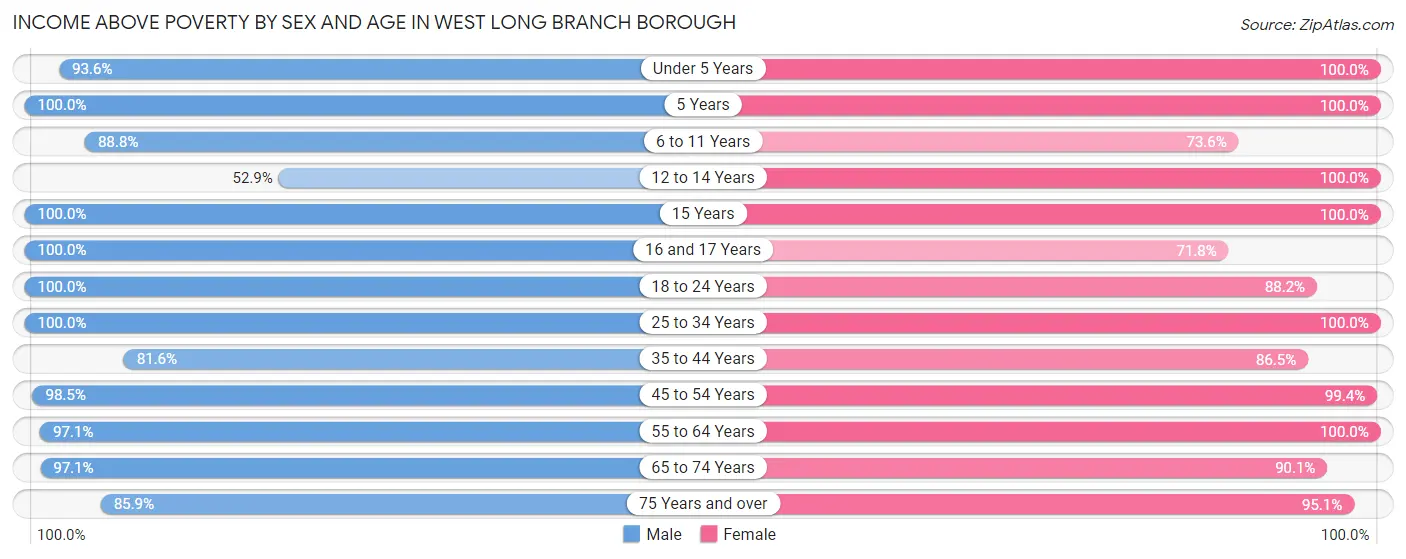
| Age Bracket | Male | Female |
| Under 5 Years | 307 (93.6%) | 311 (100.0%) |
| 5 Years | 90 (100.0%) | 19 (100.0%) |
| 6 to 11 Years | 182 (88.8%) | 148 (73.6%) |
| 12 to 14 Years | 37 (52.9%) | 119 (100.0%) |
| 15 Years | 55 (100.0%) | 48 (100.0%) |
| 16 and 17 Years | 57 (100.0%) | 84 (71.8%) |
| 18 to 24 Years | 219 (100.0%) | 336 (88.2%) |
| 25 to 34 Years | 337 (100.0%) | 610 (100.0%) |
| 35 to 44 Years | 279 (81.6%) | 315 (86.5%) |
| 45 to 54 Years | 331 (98.5%) | 456 (99.4%) |
| 55 to 64 Years | 540 (97.1%) | 532 (100.0%) |
| 65 to 74 Years | 399 (97.1%) | 291 (90.1%) |
| 75 Years and over | 170 (85.9%) | 463 (95.1%) |
| Total | 3,003 (93.7%) | 3,732 (94.0%) |
Income Below Poverty Among Married-Couple Families in West Long Branch borough
The poverty statistics for married-couple families in West Long Branch borough show that 3.1% or 53 of the total 1,691 families live below the poverty line. Families with 3 or 4 children have the highest poverty rate of 21.1%, comprising of 49 families. On the other hand, families with 1 or 2 children have the lowest poverty rate of 0.0%, which includes 0 families.
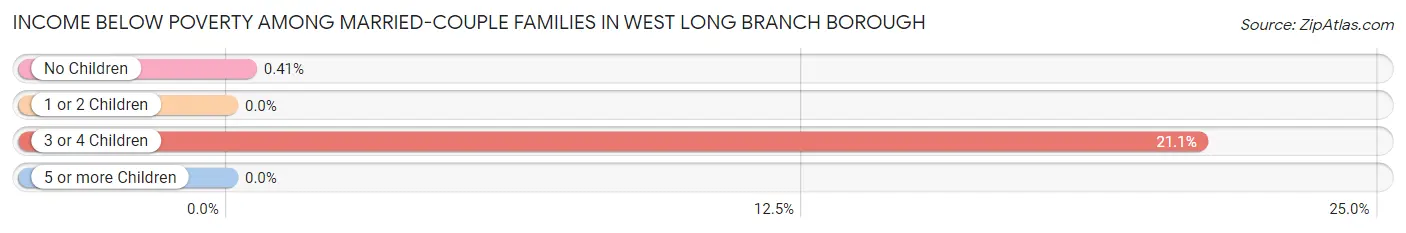
| Children | Above Poverty | Below Poverty |
| No Children | 972 (99.6%) | 4 (0.4%) |
| 1 or 2 Children | 483 (100.0%) | 0 (0.0%) |
| 3 or 4 Children | 183 (78.9%) | 49 (21.1%) |
| 5 or more Children | 0 (0.0%) | 0 (0.0%) |
| Total | 1,638 (96.9%) | 53 (3.1%) |
Income Below Poverty Among Single-Parent Households in West Long Branch borough
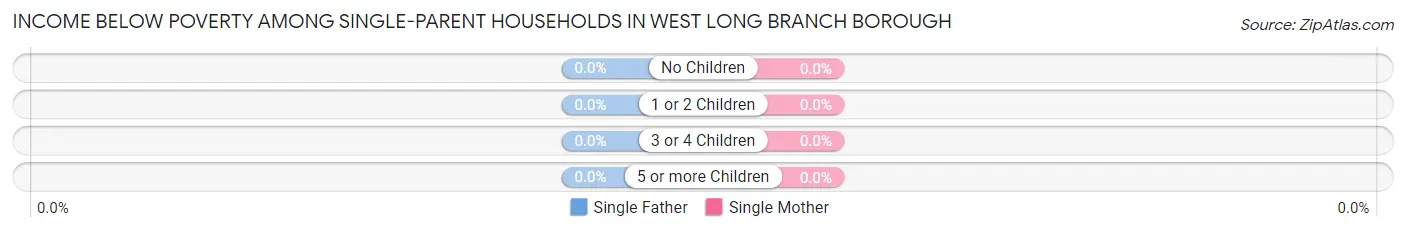
| Children | Single Father | Single Mother |
| No Children | 0 (0.0%) | 0 (0.0%) |
| 1 or 2 Children | 0 (0.0%) | 0 (0.0%) |
| 3 or 4 Children | 0 (0.0%) | 0 (0.0%) |
| 5 or more Children | 0 (0.0%) | 0 (0.0%) |
| Total | 0 (0.0%) | 0 (0.0%) |
Income Below Poverty Among Married-Couple vs Single-Parent Households in West Long Branch borough
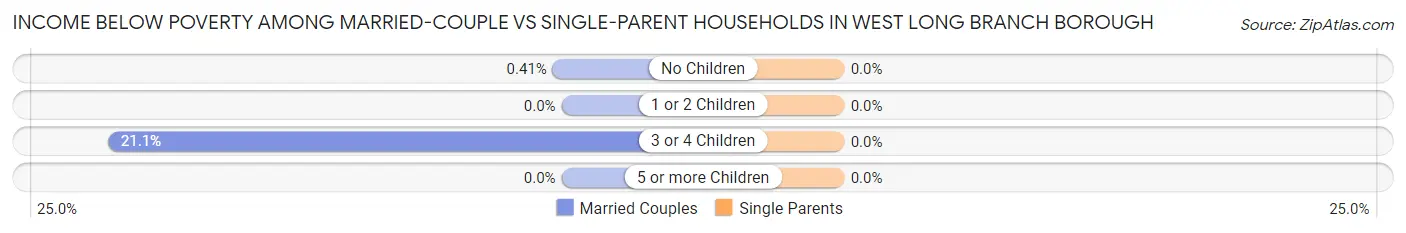
| Children | Married-Couple Families | Single-Parent Households |
| No Children | 4 (0.4%) | 0 (0.0%) |
| 1 or 2 Children | 0 (0.0%) | 0 (0.0%) |
| 3 or 4 Children | 49 (21.1%) | 0 (0.0%) |
| 5 or more Children | 0 (0.0%) | 0 (0.0%) |
| Total | 53 (3.1%) | 0 (0.0%) |
Employment Characteristics in West Long Branch borough
Employment by Class of Employer in West Long Branch borough
Among the 3,800 employed individuals in West Long Branch borough, private company employees (2,442 | 64.3%), not-for-profit organizations (412 | 10.8%), and local government employees (265 | 7.0%) make up the most common classes of employment.
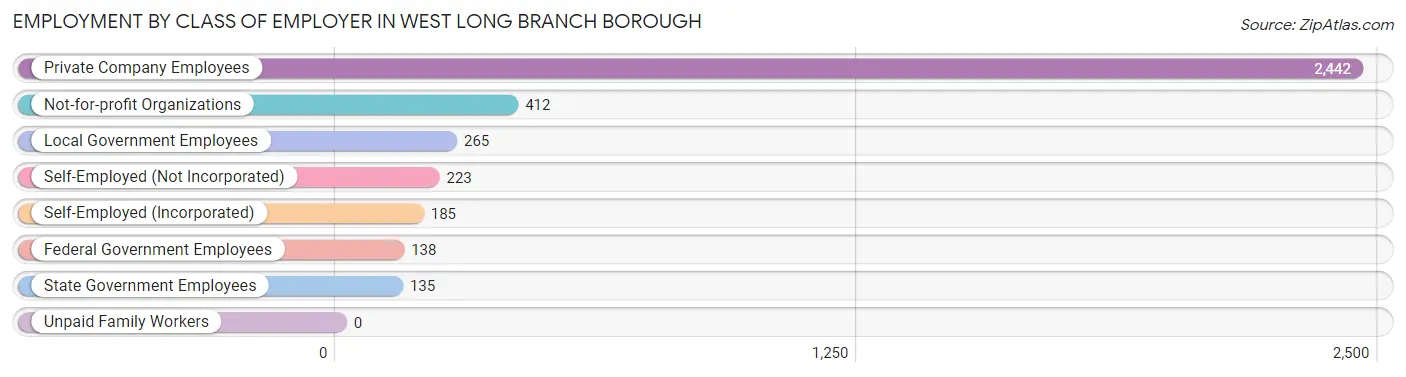
| Employer Class | # Employees | % Employees |
| Private Company Employees | 2,442 | 64.3% |
| Self-Employed (Incorporated) | 185 | 4.9% |
| Self-Employed (Not Incorporated) | 223 | 5.9% |
| Not-for-profit Organizations | 412 | 10.8% |
| Local Government Employees | 265 | 7.0% |
| State Government Employees | 135 | 3.5% |
| Federal Government Employees | 138 | 3.6% |
| Unpaid Family Workers | 0 | 0.0% |
| Total | 3,800 | 100.0% |
Employment Status by Age in West Long Branch borough
According to the labor force statistics for West Long Branch borough, out of the total population over 16 years of age (7,090), 63.8% or 4,523 individuals are in the labor force, with 7.5% or 339 of them unemployed. The age group with the highest labor force participation rate is 55 to 59 years, with 90.2% or 605 individuals in the labor force. Within the labor force, the 55 to 59 years age range has the highest percentage of unemployed individuals, with 19.3% or 117 of them being unemployed.
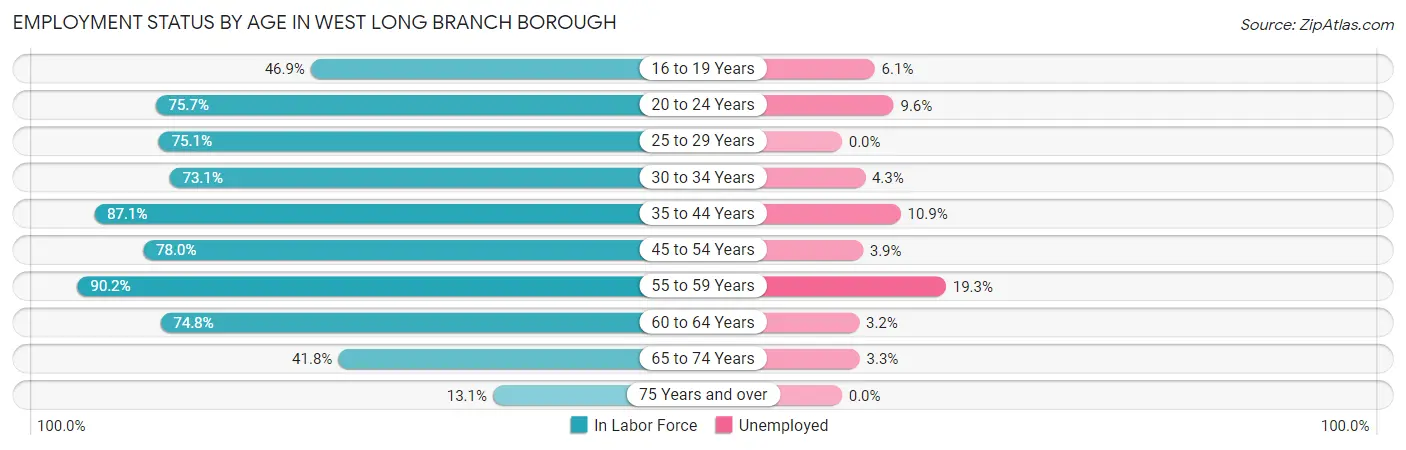
| Age Bracket | In Labor Force | Unemployed |
| 16 to 19 Years | 560 (46.9%) | 34 (6.1%) |
| 20 to 24 Years | 684 (75.7%) | 66 (9.6%) |
| 25 to 29 Years | 477 (75.1%) | 0 (0.0%) |
| 30 to 34 Years | 256 (73.1%) | 11 (4.3%) |
| 35 to 44 Years | 615 (87.1%) | 67 (10.9%) |
| 45 to 54 Years | 620 (78.0%) | 24 (3.9%) |
| 55 to 59 Years | 605 (90.2%) | 117 (19.3%) |
| 60 to 64 Years | 312 (74.8%) | 10 (3.2%) |
| 65 to 74 Years | 307 (41.8%) | 10 (3.3%) |
| 75 Years and over | 90 (13.1%) | 0 (0.0%) |
| Total | 4,523 (63.8%) | 339 (7.5%) |
Employment Status by Educational Attainment in West Long Branch borough
According to labor force statistics for West Long Branch borough, 80.7% of individuals (2,884) out of the total population between 25 and 64 years of age (3,574) are in the labor force, with 7.9% or 228 of them being unemployed. The group with the highest labor force participation rate are those with the educational attainment of bachelor's degree or higher, with 84.7% or 1,478 individuals in the labor force. Within the labor force, individuals with college / associate degree education have the highest percentage of unemployment, with 19.4% or 150 of them being unemployed.
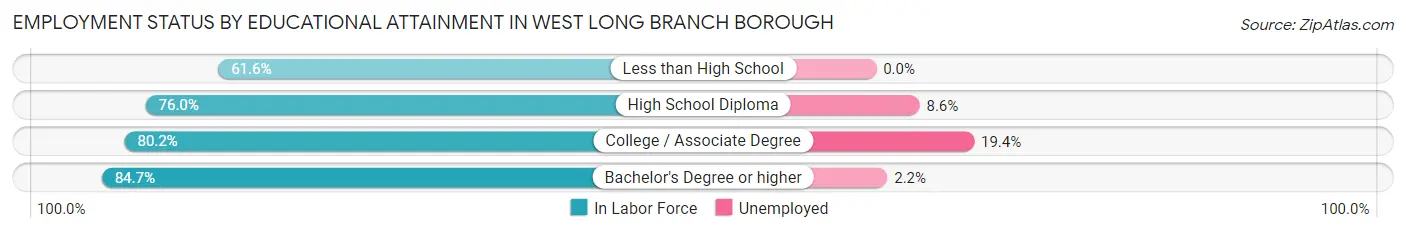
| Educational Attainment | In Labor Force | Unemployed |
| Less than High School | 101 (61.6%) | 0 (0.0%) |
| High School Diploma | 534 (76.0%) | 60 (8.6%) |
| College / Associate Degree | 772 (80.2%) | 187 (19.4%) |
| Bachelor's Degree or higher | 1,478 (84.7%) | 38 (2.2%) |
| Total | 2,884 (80.7%) | 282 (7.9%) |
Employment Occupations by Sex in West Long Branch borough
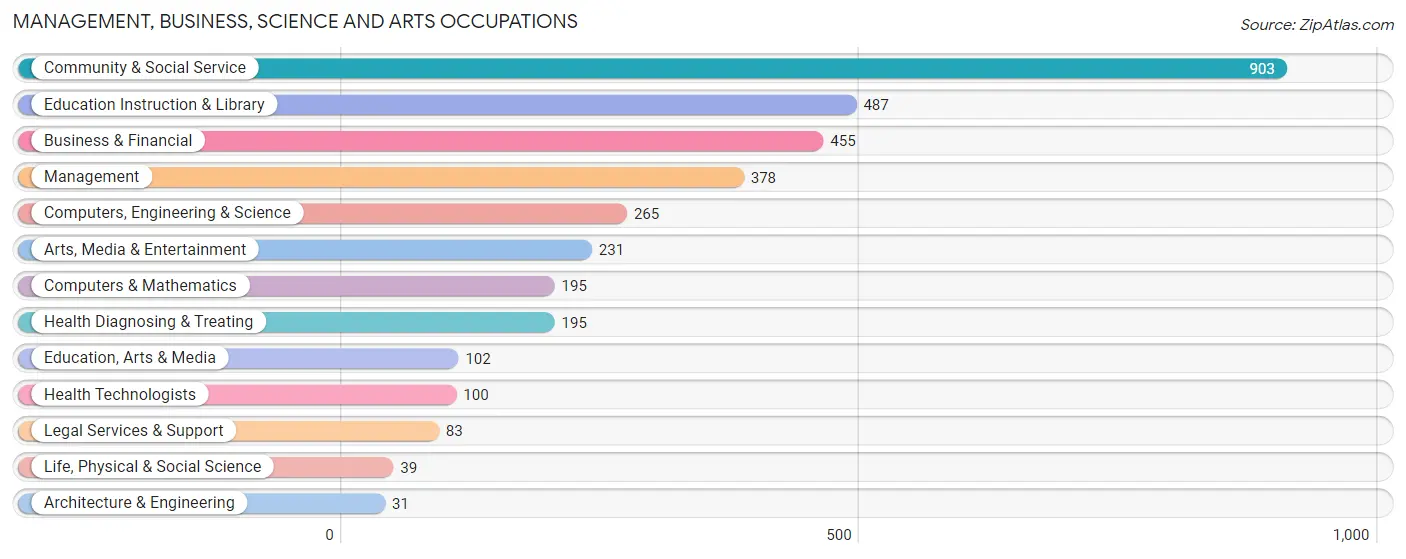
Management, Business, Science and Arts Occupations
The most common Management, Business, Science and Arts occupations in West Long Branch borough are Community & Social Service (903 | 21.6%), Education Instruction & Library (487 | 11.6%), Business & Financial (455 | 10.9%), Management (378 | 9.0%), and Computers, Engineering & Science (265 | 6.3%).
Management, Business, Science and Arts Occupations by Sex
Within the Management, Business, Science and Arts occupations in West Long Branch borough, the most male-oriented occupations are Computers & Mathematics (88.7%), Computers, Engineering & Science (79.6%), and Legal Services & Support (72.3%), while the most female-oriented occupations are Education, Arts & Media (95.1%), Arts, Media & Entertainment (94.8%), and Health Diagnosing & Treating (74.4%).
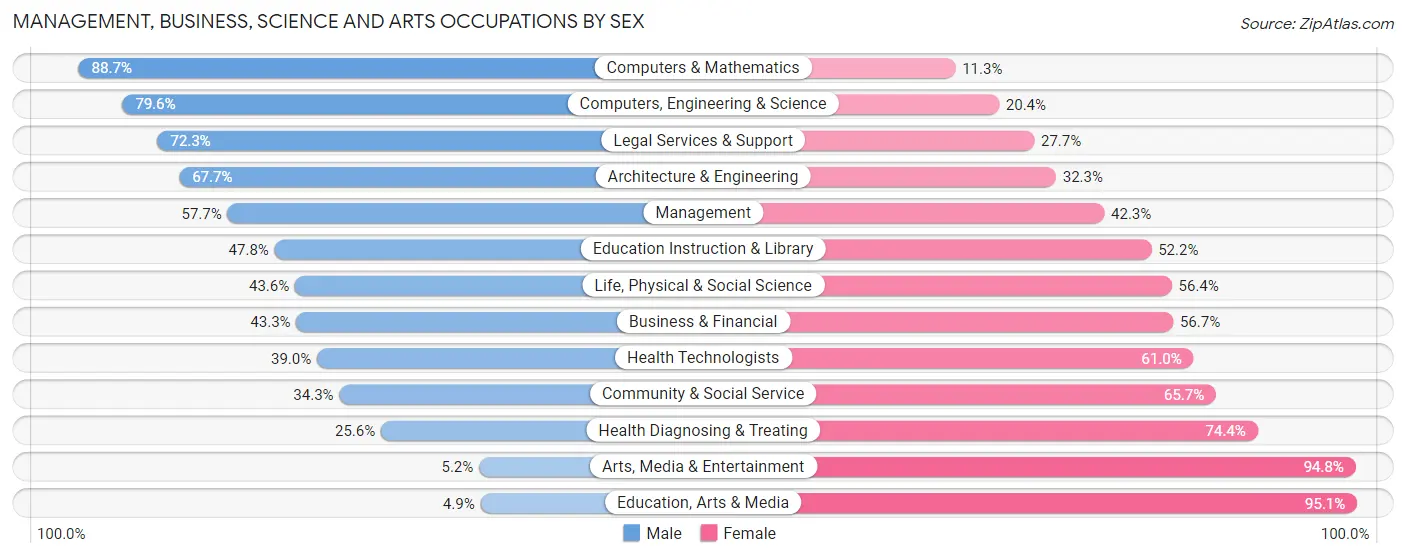
| Occupation | Male | Female |
| Management | 218 (57.7%) | 160 (42.3%) |
| Business & Financial | 197 (43.3%) | 258 (56.7%) |
| Computers, Engineering & Science | 211 (79.6%) | 54 (20.4%) |
| Computers & Mathematics | 173 (88.7%) | 22 (11.3%) |
| Architecture & Engineering | 21 (67.7%) | 10 (32.3%) |
| Life, Physical & Social Science | 17 (43.6%) | 22 (56.4%) |
| Community & Social Service | 310 (34.3%) | 593 (65.7%) |
| Education, Arts & Media | 5 (4.9%) | 97 (95.1%) |
| Legal Services & Support | 60 (72.3%) | 23 (27.7%) |
| Education Instruction & Library | 233 (47.8%) | 254 (52.2%) |
| Arts, Media & Entertainment | 12 (5.2%) | 219 (94.8%) |
| Health Diagnosing & Treating | 50 (25.6%) | 145 (74.4%) |
| Health Technologists | 39 (39.0%) | 61 (61.0%) |
| Total (Category) | 986 (44.9%) | 1,210 (55.1%) |
| Total (Overall) | 2,113 (50.5%) | 2,074 (49.5%) |
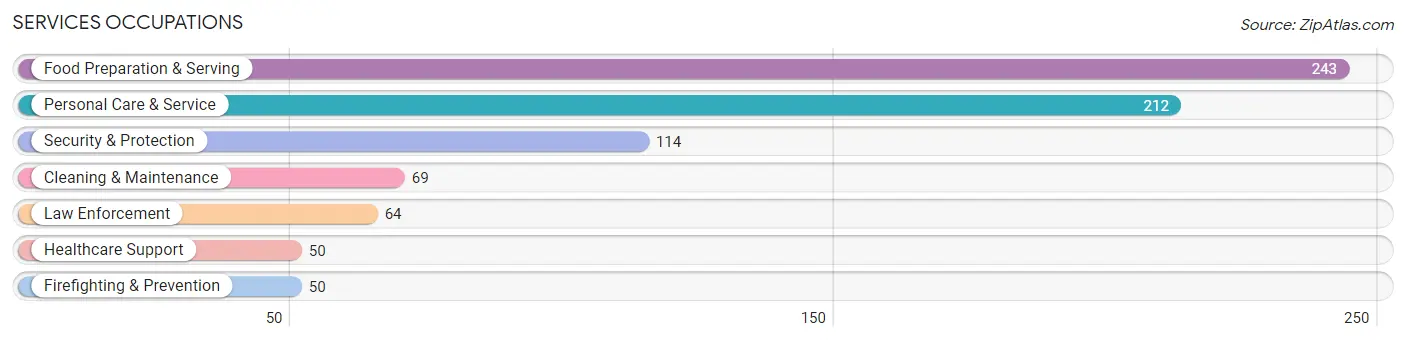
Services Occupations
The most common Services occupations in West Long Branch borough are Food Preparation & Serving (243 | 5.8%), Personal Care & Service (212 | 5.1%), Security & Protection (114 | 2.7%), Cleaning & Maintenance (69 | 1.7%), and Law Enforcement (64 | 1.5%).
Services Occupations by Sex
Within the Services occupations in West Long Branch borough, the most male-oriented occupations are Security & Protection (100.0%), Firefighting & Prevention (100.0%), and Law Enforcement (100.0%), while the most female-oriented occupations are Healthcare Support (86.0%), Personal Care & Service (65.1%), and Food Preparation & Serving (49.0%).
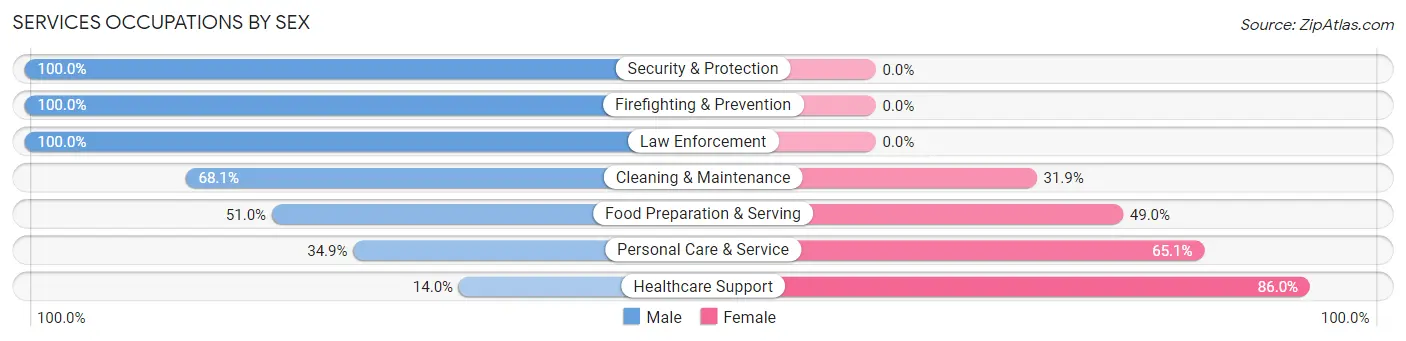
| Occupation | Male | Female |
| Healthcare Support | 7 (14.0%) | 43 (86.0%) |
| Security & Protection | 114 (100.0%) | 0 (0.0%) |
| Firefighting & Prevention | 50 (100.0%) | 0 (0.0%) |
| Law Enforcement | 64 (100.0%) | 0 (0.0%) |
| Food Preparation & Serving | 124 (51.0%) | 119 (49.0%) |
| Cleaning & Maintenance | 47 (68.1%) | 22 (31.9%) |
| Personal Care & Service | 74 (34.9%) | 138 (65.1%) |
| Total (Category) | 366 (53.2%) | 322 (46.8%) |
| Total (Overall) | 2,113 (50.5%) | 2,074 (49.5%) |
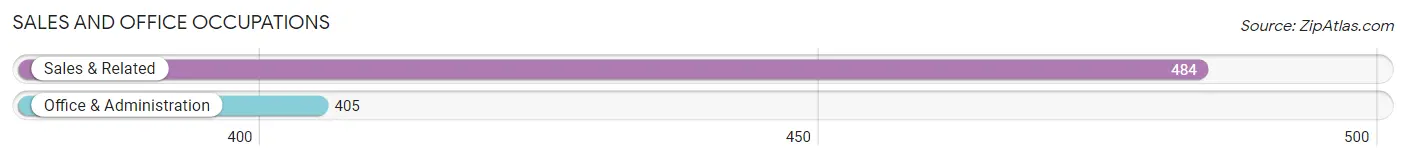
Sales and Office Occupations
The most common Sales and Office occupations in West Long Branch borough are Sales & Related (484 | 11.6%), and Office & Administration (405 | 9.7%).
Sales and Office Occupations by Sex
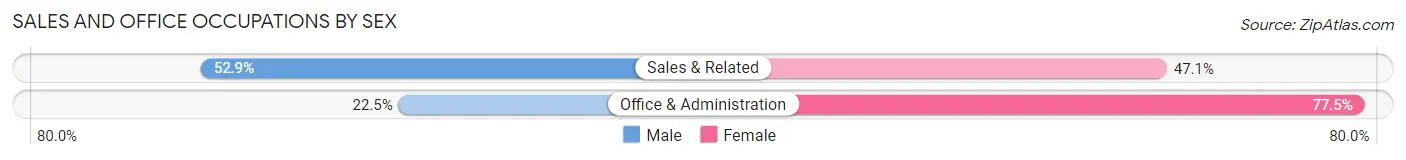
| Occupation | Male | Female |
| Sales & Related | 256 (52.9%) | 228 (47.1%) |
| Office & Administration | 91 (22.5%) | 314 (77.5%) |
| Total (Category) | 347 (39.0%) | 542 (61.0%) |
| Total (Overall) | 2,113 (50.5%) | 2,074 (49.5%) |
Natural Resources, Construction and Maintenance Occupations
The most common Natural Resources, Construction and Maintenance occupations in West Long Branch borough are Construction & Extraction (167 | 4.0%), and Installation, Maintenance & Repair (90 | 2.1%).
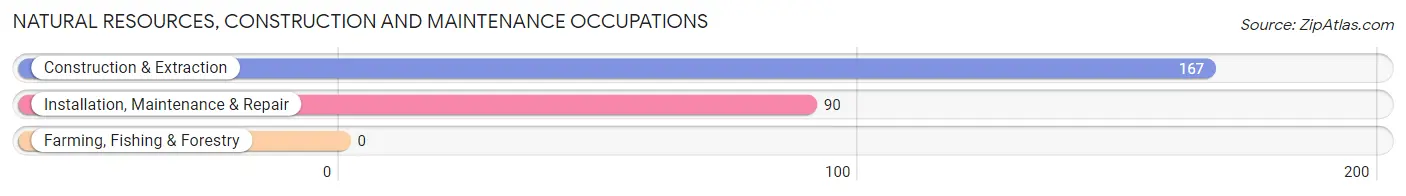
Natural Resources, Construction and Maintenance Occupations by Sex
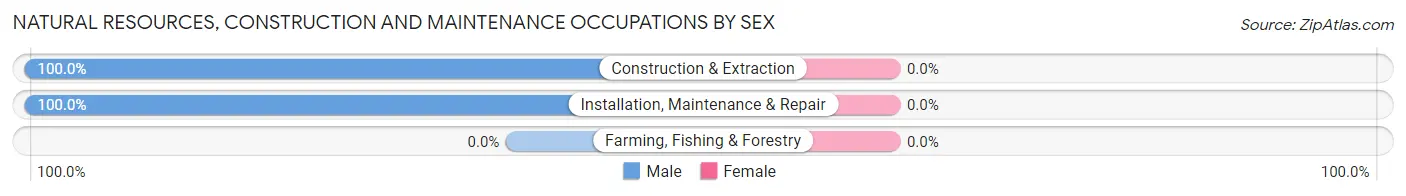
| Occupation | Male | Female |
| Farming, Fishing & Forestry | 0 (0.0%) | 0 (0.0%) |
| Construction & Extraction | 167 (100.0%) | 0 (0.0%) |
| Installation, Maintenance & Repair | 90 (100.0%) | 0 (0.0%) |
| Total (Category) | 257 (100.0%) | 0 (0.0%) |
| Total (Overall) | 2,113 (50.5%) | 2,074 (49.5%) |
Production, Transportation and Moving Occupations
The most common Production, Transportation and Moving occupations in West Long Branch borough are Material Moving (88 | 2.1%), Production (52 | 1.2%), and Transportation (17 | 0.4%).
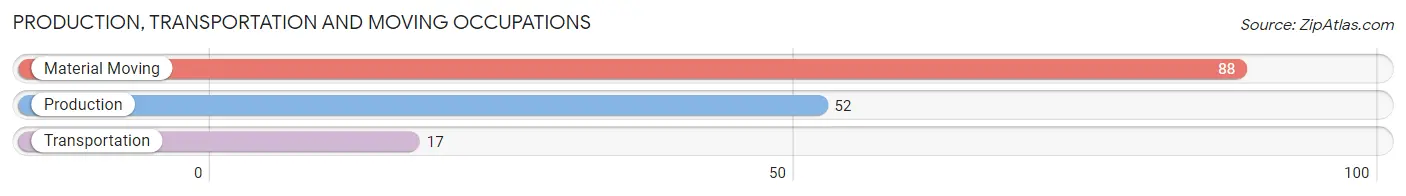
Production, Transportation and Moving Occupations by Sex
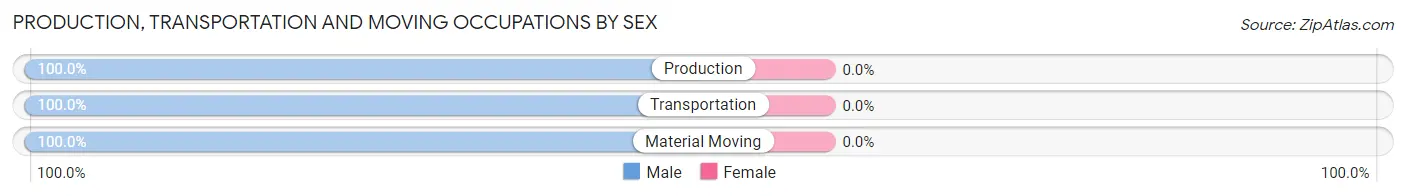
| Occupation | Male | Female |
| Production | 52 (100.0%) | 0 (0.0%) |
| Transportation | 17 (100.0%) | 0 (0.0%) |
| Material Moving | 88 (100.0%) | 0 (0.0%) |
| Total (Category) | 157 (100.0%) | 0 (0.0%) |
| Total (Overall) | 2,113 (50.5%) | 2,074 (49.5%) |
Employment Industries by Sex in West Long Branch borough
Employment Industries in West Long Branch borough
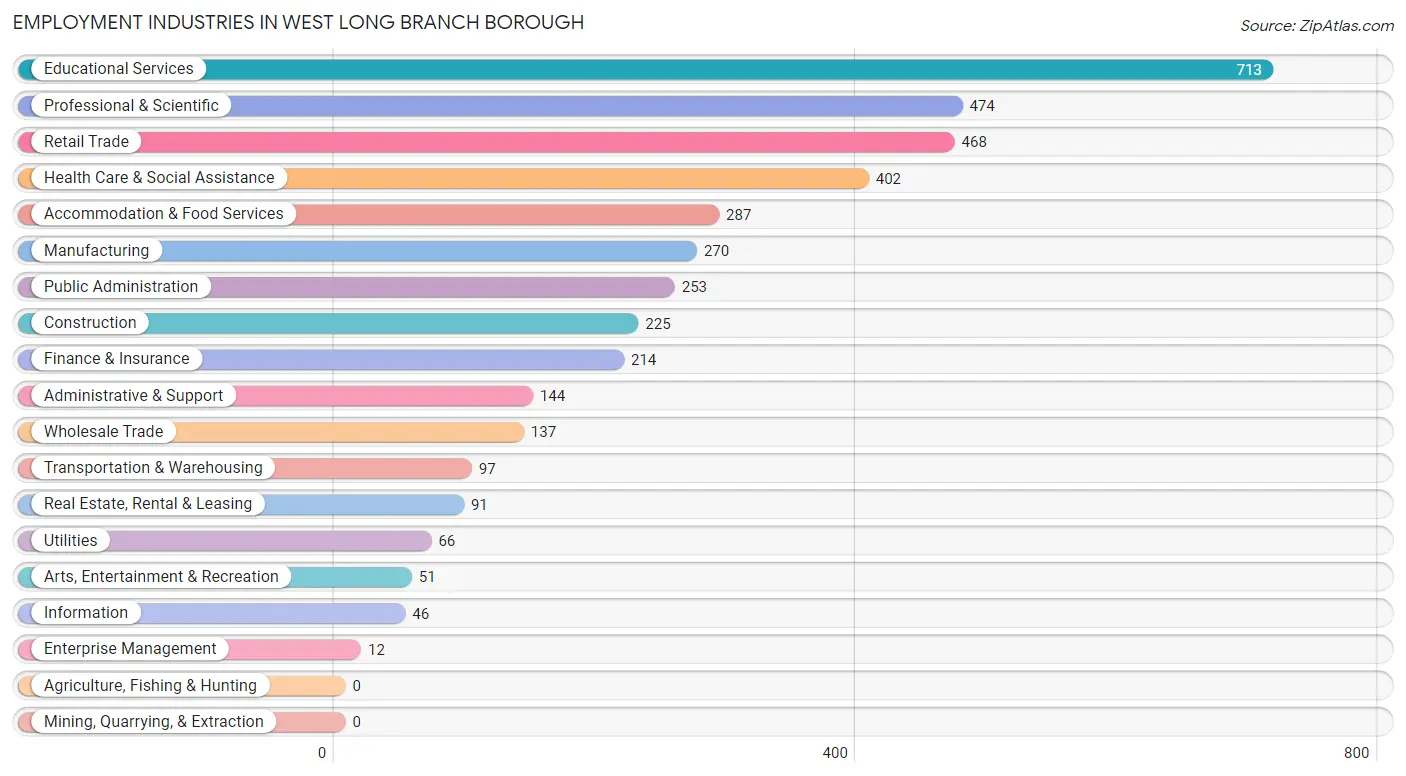
The major employment industries in West Long Branch borough include Educational Services (713 | 17.0%), Professional & Scientific (474 | 11.3%), Retail Trade (468 | 11.2%), Health Care & Social Assistance (402 | 9.6%), and Accommodation & Food Services (287 | 6.9%).
Employment Industries by Sex in West Long Branch borough
The West Long Branch borough industries that see more men than women are Utilities (100.0%), Information (100.0%), and Construction (86.7%), whereas the industries that tend to have a higher number of women are Enterprise Management (100.0%), Retail Trade (68.6%), and Health Care & Social Assistance (64.4%).
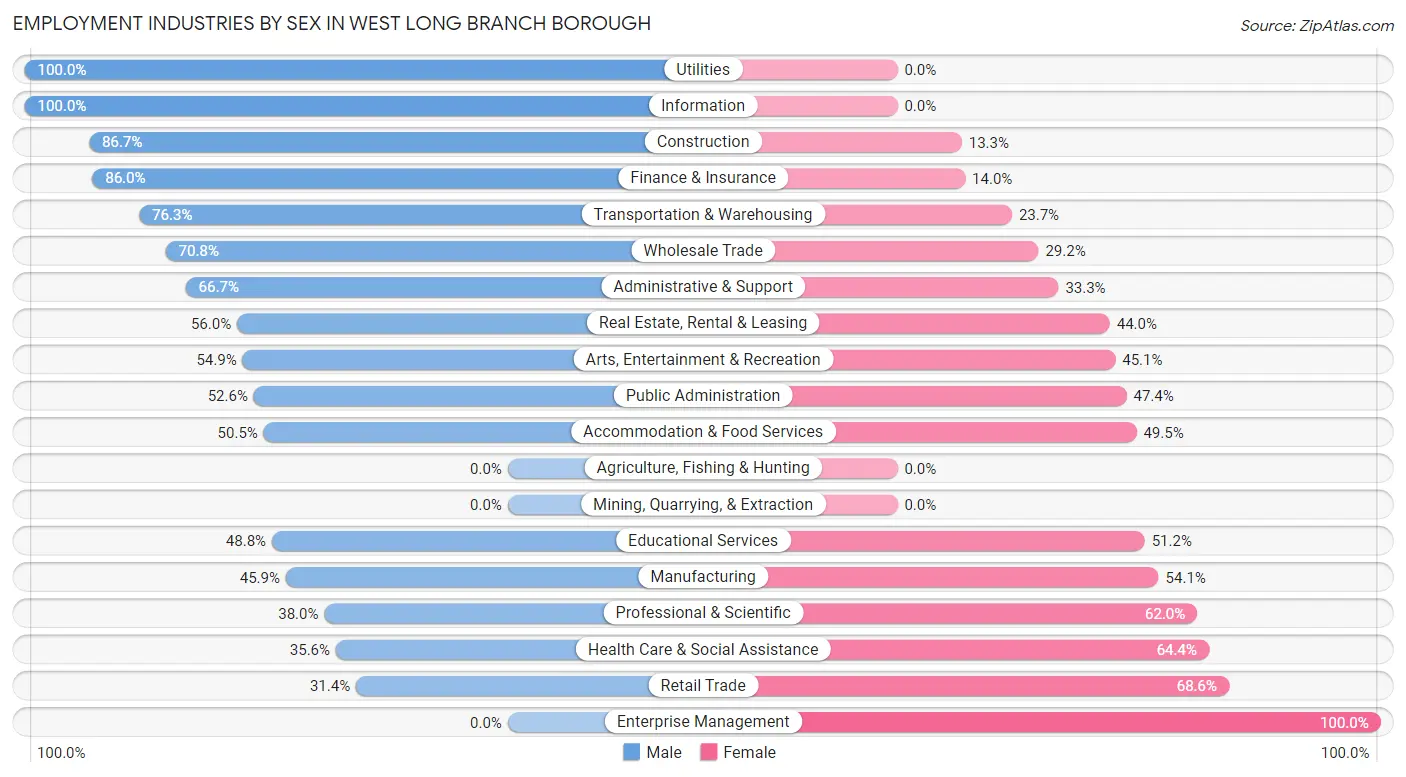
| Industry | Male | Female |
| Agriculture, Fishing & Hunting | 0 (0.0%) | 0 (0.0%) |
| Mining, Quarrying, & Extraction | 0 (0.0%) | 0 (0.0%) |
| Construction | 195 (86.7%) | 30 (13.3%) |
| Manufacturing | 124 (45.9%) | 146 (54.1%) |
| Wholesale Trade | 97 (70.8%) | 40 (29.2%) |
| Retail Trade | 147 (31.4%) | 321 (68.6%) |
| Transportation & Warehousing | 74 (76.3%) | 23 (23.7%) |
| Utilities | 66 (100.0%) | 0 (0.0%) |
| Information | 46 (100.0%) | 0 (0.0%) |
| Finance & Insurance | 184 (86.0%) | 30 (14.0%) |
| Real Estate, Rental & Leasing | 51 (56.0%) | 40 (44.0%) |
| Professional & Scientific | 180 (38.0%) | 294 (62.0%) |
| Enterprise Management | 0 (0.0%) | 12 (100.0%) |
| Administrative & Support | 96 (66.7%) | 48 (33.3%) |
| Educational Services | 348 (48.8%) | 365 (51.2%) |
| Health Care & Social Assistance | 143 (35.6%) | 259 (64.4%) |
| Arts, Entertainment & Recreation | 28 (54.9%) | 23 (45.1%) |
| Accommodation & Food Services | 145 (50.5%) | 142 (49.5%) |
| Public Administration | 133 (52.6%) | 120 (47.4%) |
| Total | 2,113 (50.5%) | 2,074 (49.5%) |
Education in West Long Branch borough
School Enrollment in West Long Branch borough
The most common levels of schooling among the 3,016 students in West Long Branch borough are college / undergraduate (1,569 | 52.0%), high school (439 | 14.6%), and nursery / preschool (272 | 9.0%).
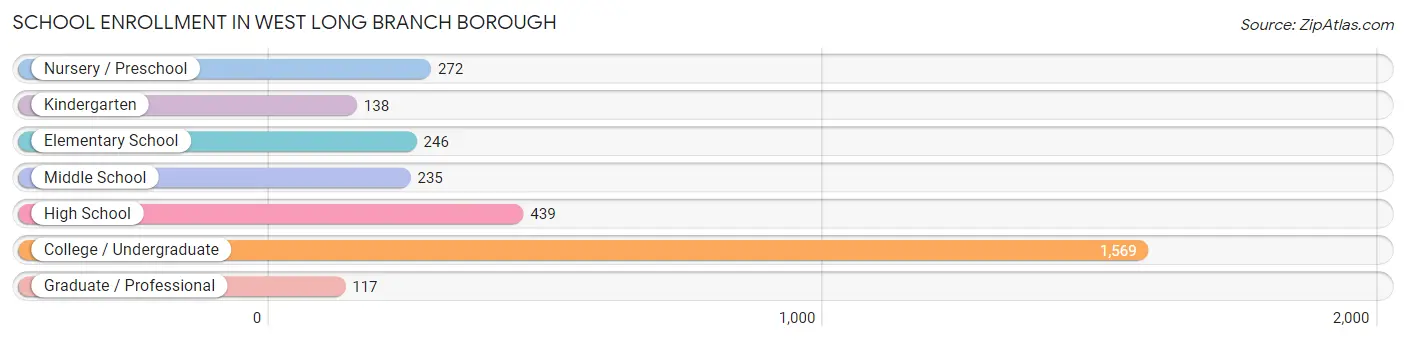
| School Level | # Students | % Students |
| Nursery / Preschool | 272 | 9.0% |
| Kindergarten | 138 | 4.6% |
| Elementary School | 246 | 8.2% |
| Middle School | 235 | 7.8% |
| High School | 439 | 14.6% |
| College / Undergraduate | 1,569 | 52.0% |
| Graduate / Professional | 117 | 3.9% |
| Total | 3,016 | 100.0% |
School Enrollment by Age by Funding Source in West Long Branch borough
Out of a total of 3,016 students who are enrolled in schools in West Long Branch borough, 1,957 (64.9%) attend a private institution, while the remaining 1,059 (35.1%) are enrolled in public schools. The age group of 20 to 24 year olds has the highest likelihood of being enrolled in private schools, with 614 (92.7% in the age bracket) enrolled. Conversely, the age group of 5 to 9 year old has the lowest likelihood of being enrolled in a private school, with 345 (83.7% in the age bracket) attending a public institution.
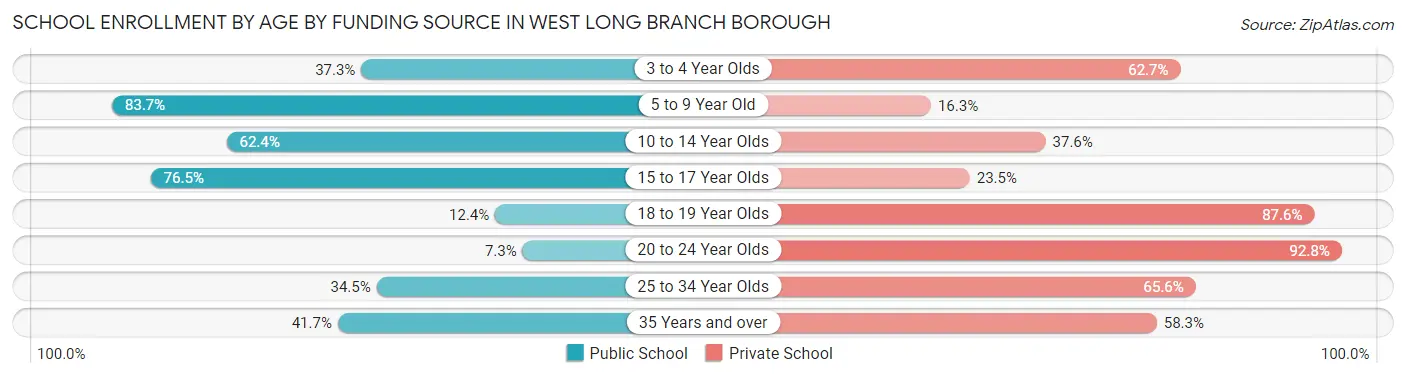
| Age Bracket | Public School | Private School |
| 3 to 4 Year Olds | 91 (37.3%) | 153 (62.7%) |
| 5 to 9 Year Old | 345 (83.7%) | 67 (16.3%) |
| 10 to 14 Year Olds | 189 (62.4%) | 114 (37.6%) |
| 15 to 17 Year Olds | 215 (76.5%) | 66 (23.5%) |
| 18 to 19 Year Olds | 120 (12.4%) | 851 (87.6%) |
| 20 to 24 Year Olds | 48 (7.2%) | 614 (92.7%) |
| 25 to 34 Year Olds | 41 (34.4%) | 78 (65.5%) |
| 35 Years and over | 10 (41.7%) | 14 (58.3%) |
| Total | 1,059 (35.1%) | 1,957 (64.9%) |
Educational Attainment by Field of Study in West Long Branch borough
Business (652 | 26.6%), education (263 | 10.7%), science & technology (259 | 10.6%), arts & humanities (240 | 9.8%), and psychology (204 | 8.3%) are the most common fields of study among 2,452 individuals in West Long Branch borough who have obtained a bachelor's degree or higher.
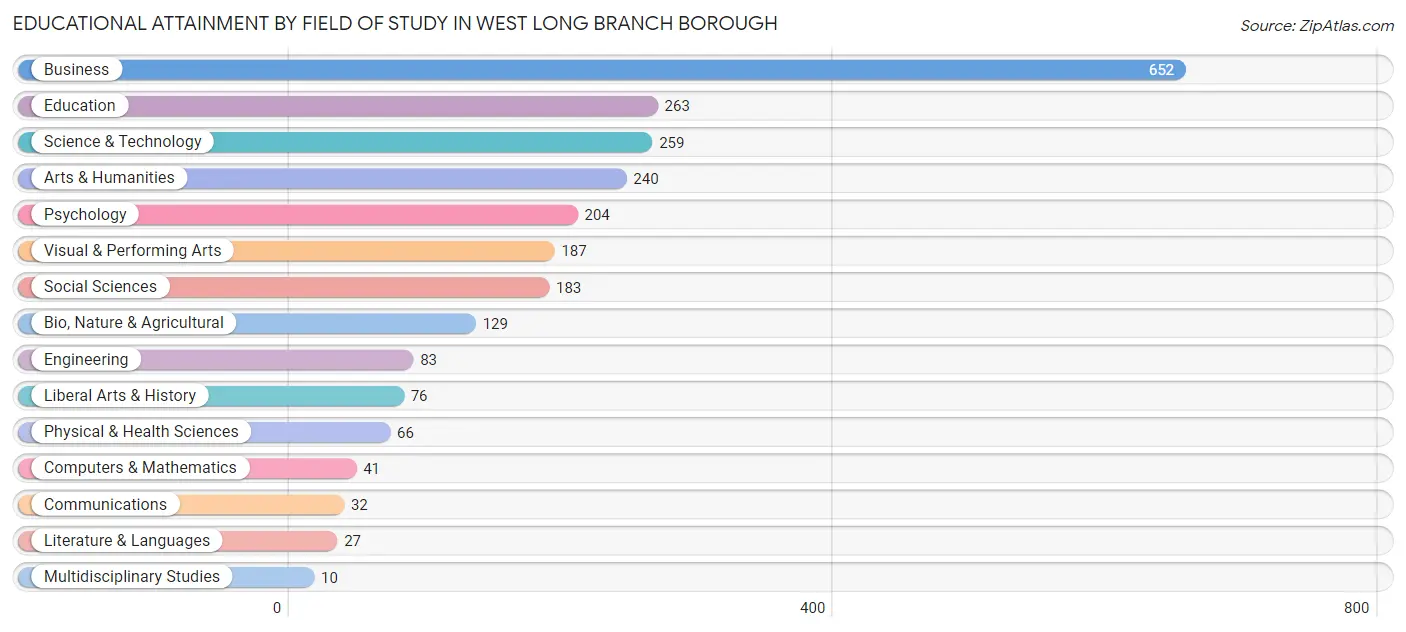
| Field of Study | # Graduates | % Graduates |
| Computers & Mathematics | 41 | 1.7% |
| Bio, Nature & Agricultural | 129 | 5.3% |
| Physical & Health Sciences | 66 | 2.7% |
| Psychology | 204 | 8.3% |
| Social Sciences | 183 | 7.5% |
| Engineering | 83 | 3.4% |
| Multidisciplinary Studies | 10 | 0.4% |
| Science & Technology | 259 | 10.6% |
| Business | 652 | 26.6% |
| Education | 263 | 10.7% |
| Literature & Languages | 27 | 1.1% |
| Liberal Arts & History | 76 | 3.1% |
| Visual & Performing Arts | 187 | 7.6% |
| Communications | 32 | 1.3% |
| Arts & Humanities | 240 | 9.8% |
| Total | 2,452 | 100.0% |
Transportation & Commute in West Long Branch borough
Vehicle Availability by Sex in West Long Branch borough
The most prevalent vehicle ownership categories in West Long Branch borough are males with 2 vehicles (724, accounting for 44.7%) and females with 2 vehicles (561, making up 42.5%).
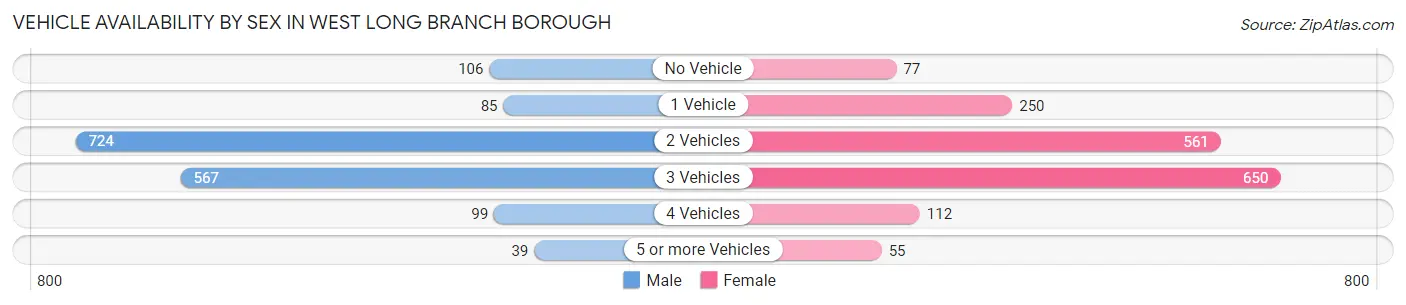
| Vehicles Available | Male | Female |
| No Vehicle | 106 (6.5%) | 77 (4.5%) |
| 1 Vehicle | 85 (5.2%) | 250 (14.7%) |
| 2 Vehicles | 724 (44.7%) | 561 (32.9%) |
| 3 Vehicles | 567 (35.0%) | 650 (38.1%) |
| 4 Vehicles | 99 (6.1%) | 112 (6.6%) |
| 5 or more Vehicles | 39 (2.4%) | 55 (3.2%) |
| Total | 1,620 (100.0%) | 1,705 (100.0%) |
Commute Time in West Long Branch borough
The most frequently occuring commute durations in West Long Branch borough are 10 to 14 minutes (595 commuters, 20.0%), 5 to 9 minutes (584 commuters, 19.6%), and 15 to 19 minutes (325 commuters, 10.9%).
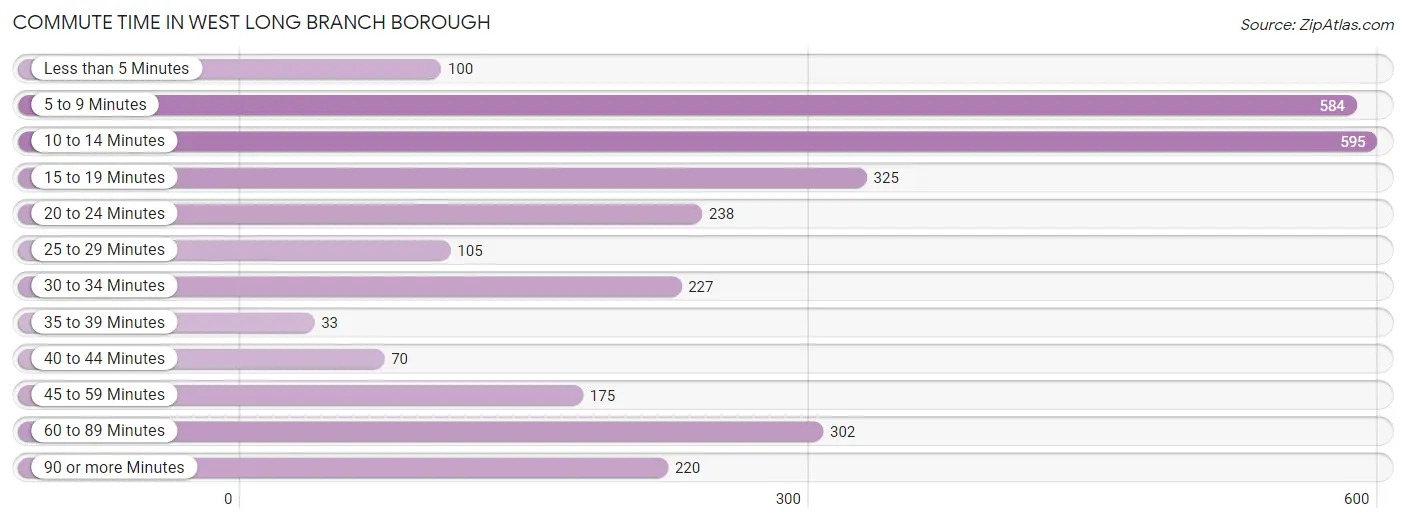
| Commute Time | # Commuters | % Commuters |
| Less than 5 Minutes | 100 | 3.4% |
| 5 to 9 Minutes | 584 | 19.6% |
| 10 to 14 Minutes | 595 | 20.0% |
| 15 to 19 Minutes | 325 | 10.9% |
| 20 to 24 Minutes | 238 | 8.0% |
| 25 to 29 Minutes | 105 | 3.5% |
| 30 to 34 Minutes | 227 | 7.6% |
| 35 to 39 Minutes | 33 | 1.1% |
| 40 to 44 Minutes | 70 | 2.4% |
| 45 to 59 Minutes | 175 | 5.9% |
| 60 to 89 Minutes | 302 | 10.2% |
| 90 or more Minutes | 220 | 7.4% |
Commute Time by Sex in West Long Branch borough
The most common commute times in West Long Branch borough are 5 to 9 minutes (314 commuters, 20.3%) for males and 10 to 14 minutes (301 commuters, 21.0%) for females.
| Commute Time | Male | Female |
| Less than 5 Minutes | 13 (0.8%) | 87 (6.1%) |
| 5 to 9 Minutes | 314 (20.3%) | 270 (18.9%) |
| 10 to 14 Minutes | 294 (19.0%) | 301 (21.0%) |
| 15 to 19 Minutes | 129 (8.4%) | 196 (13.7%) |
| 20 to 24 Minutes | 103 (6.7%) | 135 (9.4%) |
| 25 to 29 Minutes | 38 (2.5%) | 67 (4.7%) |
| 30 to 34 Minutes | 137 (8.9%) | 90 (6.3%) |
| 35 to 39 Minutes | 0 (0.0%) | 33 (2.3%) |
| 40 to 44 Minutes | 50 (3.2%) | 20 (1.4%) |
| 45 to 59 Minutes | 102 (6.6%) | 73 (5.1%) |
| 60 to 89 Minutes | 196 (12.7%) | 106 (7.4%) |
| 90 or more Minutes | 168 (10.9%) | 52 (3.6%) |
Time of Departure to Work by Sex in West Long Branch borough
The most frequent times of departure to work in West Long Branch borough are 7:00 AM to 7:29 AM (236, 15.3%) for males and 7:30 AM to 7:59 AM (220, 15.4%) for females.
| Time of Departure | Male | Female |
| 12:00 AM to 4:59 AM | 42 (2.7%) | 30 (2.1%) |
| 5:00 AM to 5:29 AM | 47 (3.0%) | 43 (3.0%) |
| 5:30 AM to 5:59 AM | 74 (4.8%) | 134 (9.4%) |
| 6:00 AM to 6:29 AM | 108 (7.0%) | 43 (3.0%) |
| 6:30 AM to 6:59 AM | 138 (8.9%) | 24 (1.7%) |
| 7:00 AM to 7:29 AM | 236 (15.3%) | 198 (13.9%) |
| 7:30 AM to 7:59 AM | 175 (11.3%) | 220 (15.4%) |
| 8:00 AM to 8:29 AM | 167 (10.8%) | 164 (11.5%) |
| 8:30 AM to 8:59 AM | 122 (7.9%) | 137 (9.6%) |
| 9:00 AM to 9:59 AM | 76 (4.9%) | 67 (4.7%) |
| 10:00 AM to 10:59 AM | 112 (7.2%) | 95 (6.6%) |
| 11:00 AM to 11:59 AM | 1 (0.1%) | 59 (4.1%) |
| 12:00 PM to 3:59 PM | 131 (8.5%) | 137 (9.6%) |
| 4:00 PM to 11:59 PM | 115 (7.4%) | 79 (5.5%) |
| Total | 1,544 (100.0%) | 1,430 (100.0%) |
Housing Occupancy in West Long Branch borough
Occupancy by Ownership in West Long Branch borough
Of the total 2,747 dwellings in West Long Branch borough, owner-occupied units account for 2,008 (73.1%), while renter-occupied units make up 739 (26.9%).
| Occupancy | # Housing Units | % Housing Units |
| Owner Occupied Housing Units | 2,008 | 73.1% |
| Renter-Occupied Housing Units | 739 | 26.9% |
| Total Occupied Housing Units | 2,747 | 100.0% |
Occupancy by Household Size in West Long Branch borough
| Household Size | # Housing Units | % Housing Units |
| 1-Person Household | 697 | 25.4% |
| 2-Person Household | 796 | 29.0% |
| 3-Person Household | 539 | 19.6% |
| 4+ Person Household | 715 | 26.0% |
| Total Housing Units | 2,747 | 100.0% |
Occupancy by Ownership by Household Size in West Long Branch borough
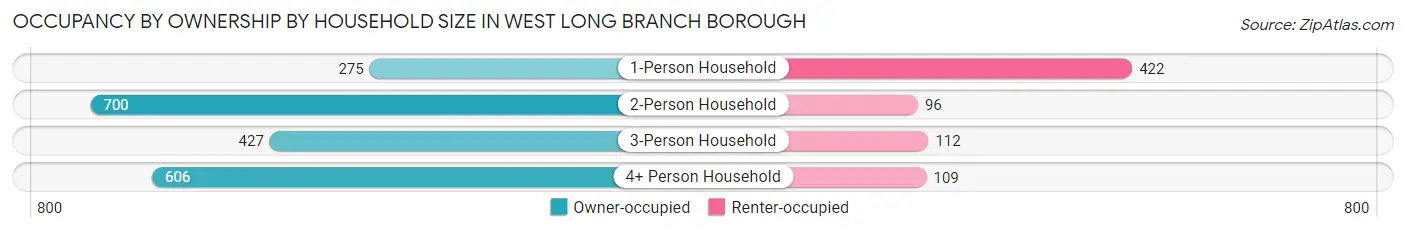
| Household Size | Owner-occupied | Renter-occupied |
| 1-Person Household | 275 (39.5%) | 422 (60.6%) |
| 2-Person Household | 700 (87.9%) | 96 (12.1%) |
| 3-Person Household | 427 (79.2%) | 112 (20.8%) |
| 4+ Person Household | 606 (84.8%) | 109 (15.2%) |
| Total Housing Units | 2,008 (73.1%) | 739 (26.9%) |
Occupancy by Educational Attainment in West Long Branch borough
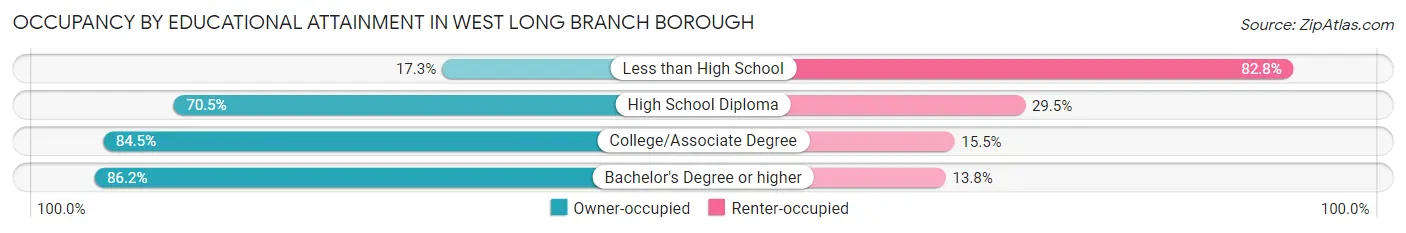
| Household Size | Owner-occupied | Renter-occupied |
| Less than High School | 64 (17.2%) | 307 (82.8%) |
| High School Diploma | 411 (70.5%) | 172 (29.5%) |
| College/Associate Degree | 643 (84.5%) | 118 (15.5%) |
| Bachelor's Degree or higher | 890 (86.2%) | 142 (13.8%) |
Occupancy by Age of Householder in West Long Branch borough
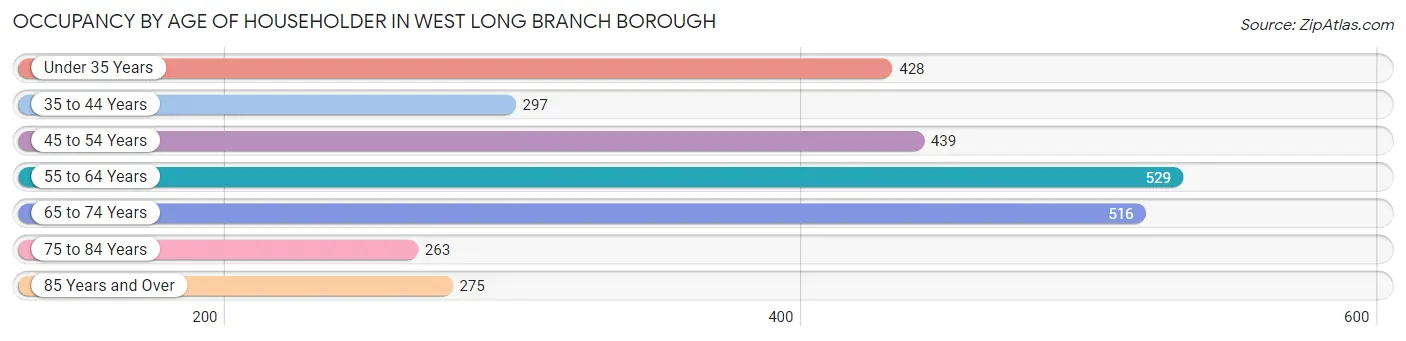
| Age Bracket | # Households | % Households |
| Under 35 Years | 428 | 15.6% |
| 35 to 44 Years | 297 | 10.8% |
| 45 to 54 Years | 439 | 16.0% |
| 55 to 64 Years | 529 | 19.3% |
| 65 to 74 Years | 516 | 18.8% |
| 75 to 84 Years | 263 | 9.6% |
| 85 Years and Over | 275 | 10.0% |
| Total | 2,747 | 100.0% |
Housing Finances in West Long Branch borough
Median Income by Occupancy in West Long Branch borough
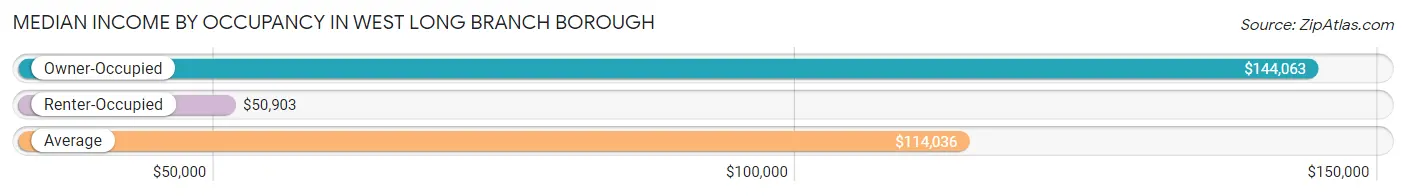
| Occupancy Type | # Households | Median Income |
| Owner-Occupied | 2,008 (73.1%) | $144,063 |
| Renter-Occupied | 739 (26.9%) | $50,903 |
| Average | 2,747 (100.0%) | $114,036 |
Occupancy by Householder Income Bracket in West Long Branch borough
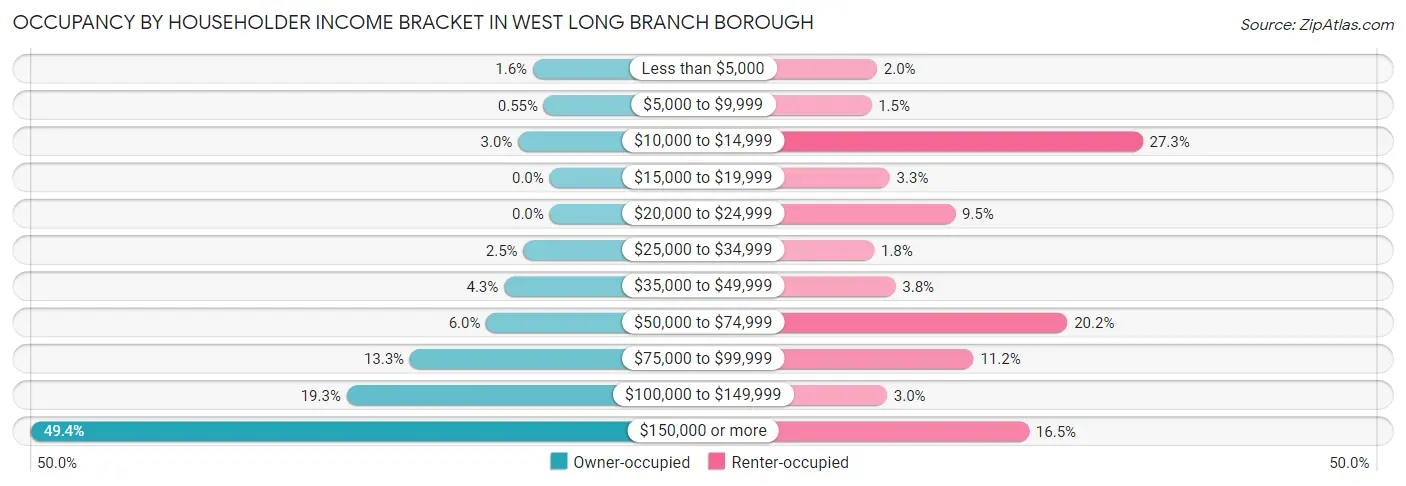
| Income Bracket | Owner-occupied | Renter-occupied |
| Less than $5,000 | 32 (1.6%) | 15 (2.0%) |
| $5,000 to $9,999 | 11 (0.5%) | 11 (1.5%) |
| $10,000 to $14,999 | 60 (3.0%) | 202 (27.3%) |
| $15,000 to $19,999 | 0 (0.0%) | 24 (3.3%) |
| $20,000 to $24,999 | 0 (0.0%) | 70 (9.5%) |
| $25,000 to $34,999 | 50 (2.5%) | 13 (1.8%) |
| $35,000 to $49,999 | 87 (4.3%) | 28 (3.8%) |
| $50,000 to $74,999 | 121 (6.0%) | 149 (20.2%) |
| $75,000 to $99,999 | 267 (13.3%) | 83 (11.2%) |
| $100,000 to $149,999 | 388 (19.3%) | 22 (3.0%) |
| $150,000 or more | 992 (49.4%) | 122 (16.5%) |
| Total | 2,008 (100.0%) | 739 (100.0%) |
Monthly Housing Cost Tiers in West Long Branch borough
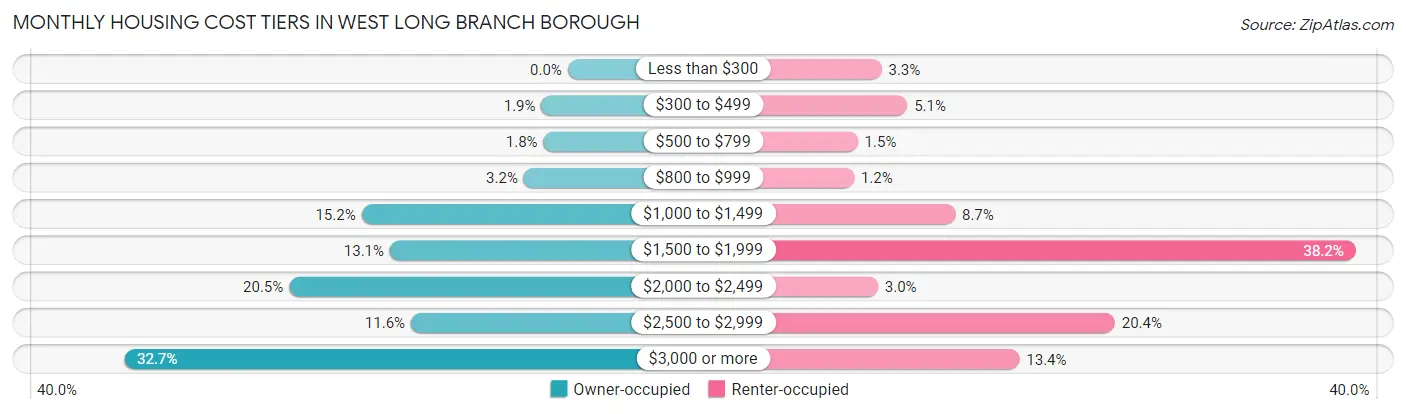
| Monthly Cost | Owner-occupied | Renter-occupied |
| Less than $300 | 0 (0.0%) | 24 (3.3%) |
| $300 to $499 | 39 (1.9%) | 38 (5.1%) |
| $500 to $799 | 36 (1.8%) | 11 (1.5%) |
| $800 to $999 | 65 (3.2%) | 9 (1.2%) |
| $1,000 to $1,499 | 305 (15.2%) | 64 (8.7%) |
| $1,500 to $1,999 | 263 (13.1%) | 282 (38.2%) |
| $2,000 to $2,499 | 412 (20.5%) | 22 (3.0%) |
| $2,500 to $2,999 | 232 (11.6%) | 151 (20.4%) |
| $3,000 or more | 656 (32.7%) | 99 (13.4%) |
| Total | 2,008 (100.0%) | 739 (100.0%) |
Physical Housing Characteristics in West Long Branch borough
Housing Structures in West Long Branch borough
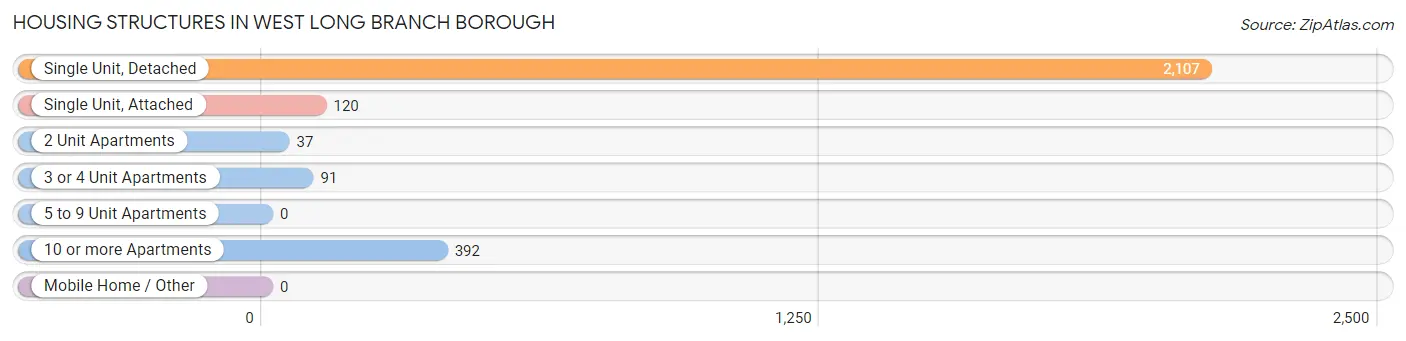
| Structure Type | # Housing Units | % Housing Units |
| Single Unit, Detached | 2,107 | 76.7% |
| Single Unit, Attached | 120 | 4.4% |
| 2 Unit Apartments | 37 | 1.3% |
| 3 or 4 Unit Apartments | 91 | 3.3% |
| 5 to 9 Unit Apartments | 0 | 0.0% |
| 10 or more Apartments | 392 | 14.3% |
| Mobile Home / Other | 0 | 0.0% |
| Total | 2,747 | 100.0% |
Housing Structures by Occupancy in West Long Branch borough
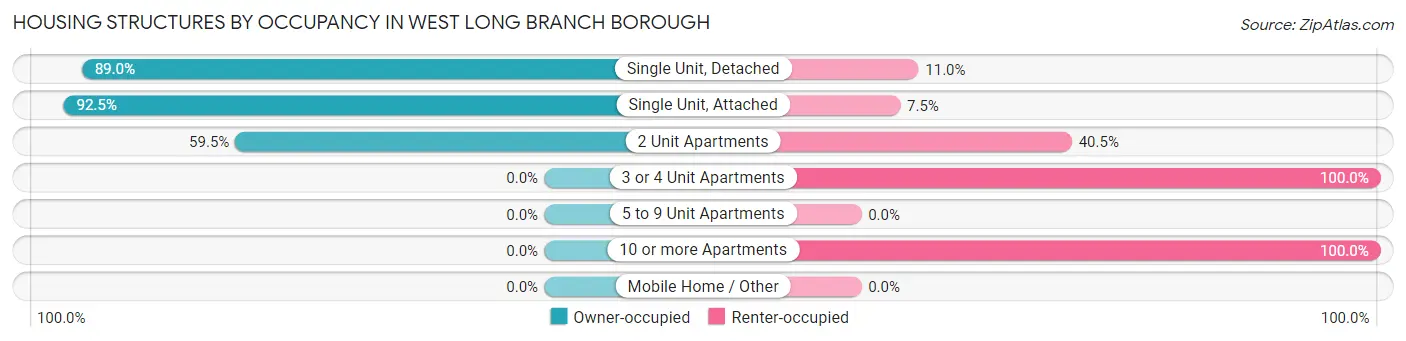
| Structure Type | Owner-occupied | Renter-occupied |
| Single Unit, Detached | 1,875 (89.0%) | 232 (11.0%) |
| Single Unit, Attached | 111 (92.5%) | 9 (7.5%) |
| 2 Unit Apartments | 22 (59.5%) | 15 (40.5%) |
| 3 or 4 Unit Apartments | 0 (0.0%) | 91 (100.0%) |
| 5 to 9 Unit Apartments | 0 (0.0%) | 0 (0.0%) |
| 10 or more Apartments | 0 (0.0%) | 392 (100.0%) |
| Mobile Home / Other | 0 (0.0%) | 0 (0.0%) |
| Total | 2,008 (73.1%) | 739 (26.9%) |
Housing Structures by Number of Rooms in West Long Branch borough
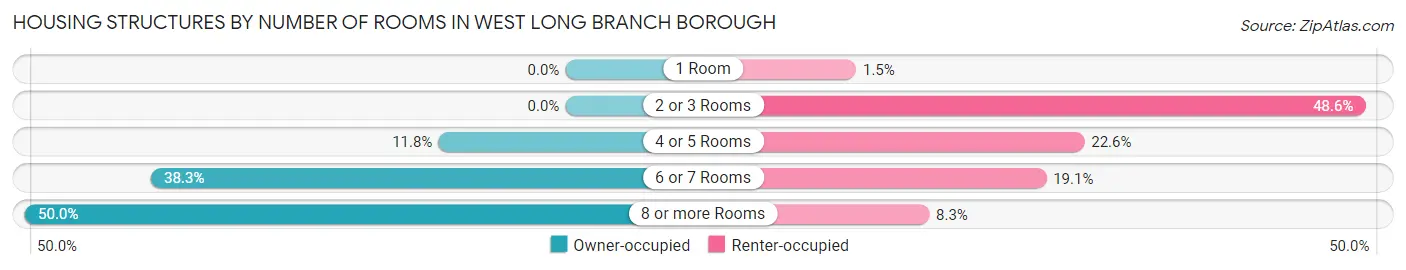
| Number of Rooms | Owner-occupied | Renter-occupied |
| 1 Room | 0 (0.0%) | 11 (1.5%) |
| 2 or 3 Rooms | 0 (0.0%) | 359 (48.6%) |
| 4 or 5 Rooms | 236 (11.7%) | 167 (22.6%) |
| 6 or 7 Rooms | 769 (38.3%) | 141 (19.1%) |
| 8 or more Rooms | 1,003 (49.9%) | 61 (8.3%) |
| Total | 2,008 (100.0%) | 739 (100.0%) |
Housing Structure by Heating Type in West Long Branch borough
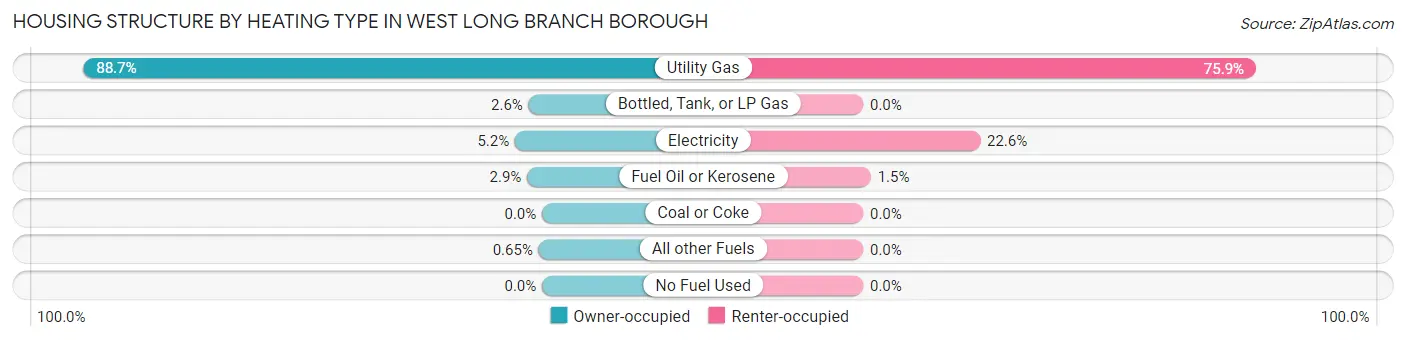
| Heating Type | Owner-occupied | Renter-occupied |
| Utility Gas | 1,780 (88.6%) | 561 (75.9%) |
| Bottled, Tank, or LP Gas | 52 (2.6%) | 0 (0.0%) |
| Electricity | 105 (5.2%) | 167 (22.6%) |
| Fuel Oil or Kerosene | 58 (2.9%) | 11 (1.5%) |
| Coal or Coke | 0 (0.0%) | 0 (0.0%) |
| All other Fuels | 13 (0.6%) | 0 (0.0%) |
| No Fuel Used | 0 (0.0%) | 0 (0.0%) |
| Total | 2,008 (100.0%) | 739 (100.0%) |
Household Vehicle Usage in West Long Branch borough
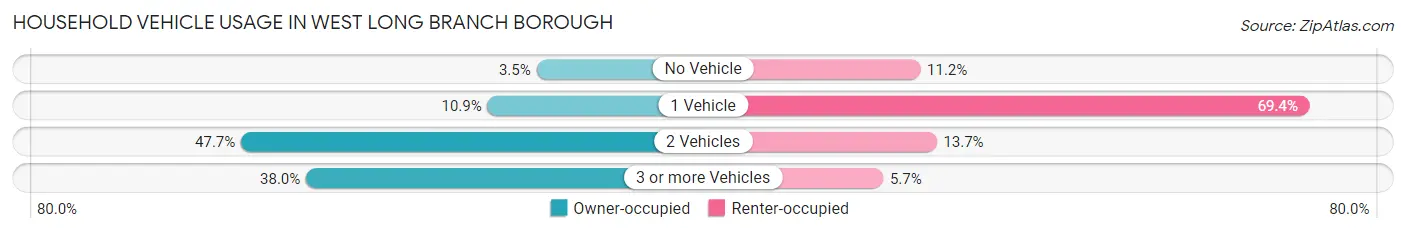
| Vehicles per Household | Owner-occupied | Renter-occupied |
| No Vehicle | 71 (3.5%) | 83 (11.2%) |
| 1 Vehicle | 218 (10.9%) | 513 (69.4%) |
| 2 Vehicles | 957 (47.7%) | 101 (13.7%) |
| 3 or more Vehicles | 762 (38.0%) | 42 (5.7%) |
| Total | 2,008 (100.0%) | 739 (100.0%) |
Real Estate & Mortgages in West Long Branch borough
Real Estate and Mortgage Overview in West Long Branch borough
| Characteristic | Without Mortgage | With Mortgage |
| Housing Units | 620 | 1,388 |
| Median Property Value | $592,000 | $617,200 |
| Median Household Income | $91,786 | $876 |
| Monthly Housing Costs | $1,316 | $656 |
| Real Estate Taxes | $10,001 | $10 |
Property Value by Mortgage Status in West Long Branch borough
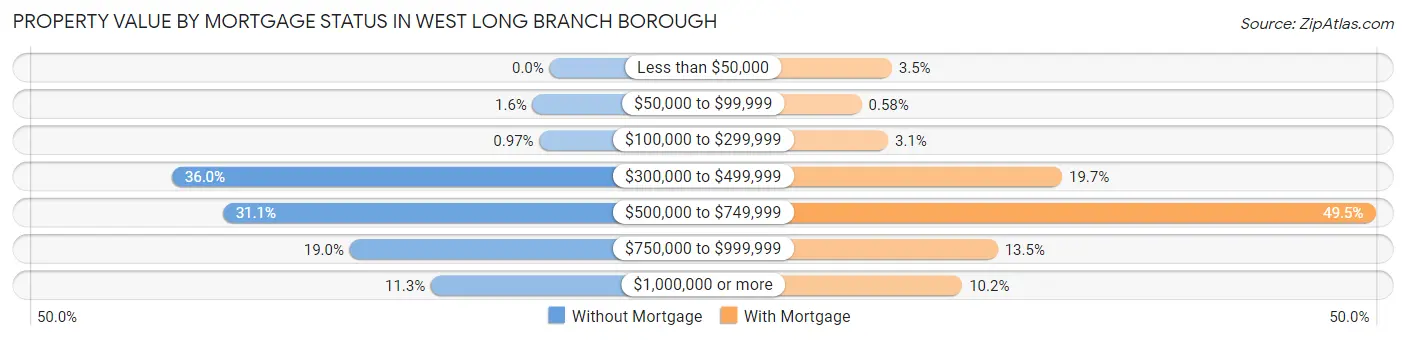
| Property Value | Without Mortgage | With Mortgage |
| Less than $50,000 | 0 (0.0%) | 48 (3.5%) |
| $50,000 to $99,999 | 10 (1.6%) | 8 (0.6%) |
| $100,000 to $299,999 | 6 (1.0%) | 43 (3.1%) |
| $300,000 to $499,999 | 223 (36.0%) | 273 (19.7%) |
| $500,000 to $749,999 | 193 (31.1%) | 687 (49.5%) |
| $750,000 to $999,999 | 118 (19.0%) | 188 (13.5%) |
| $1,000,000 or more | 70 (11.3%) | 141 (10.2%) |
| Total | 620 (100.0%) | 1,388 (100.0%) |
Household Income by Mortgage Status in West Long Branch borough
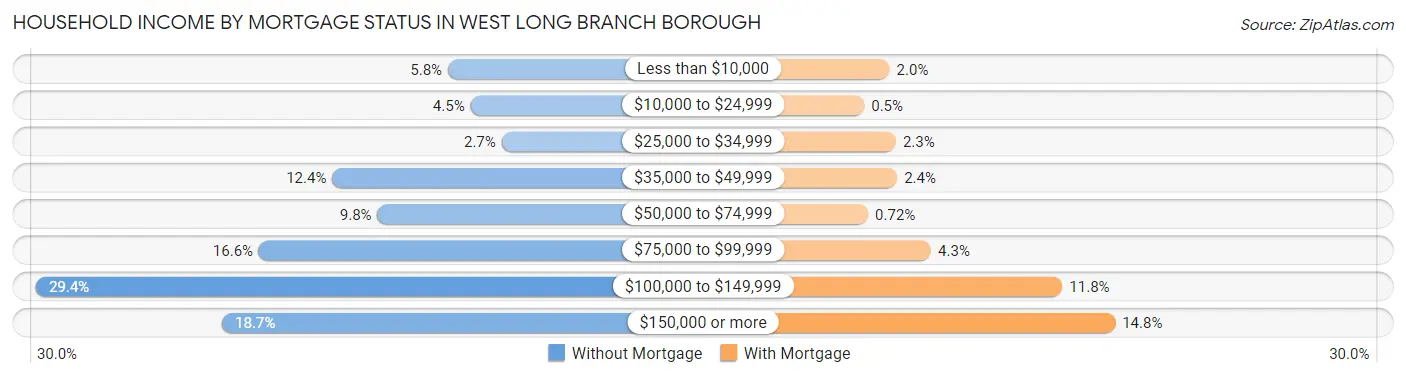
| Household Income | Without Mortgage | With Mortgage |
| Less than $10,000 | 36 (5.8%) | 27 (1.9%) |
| $10,000 to $24,999 | 28 (4.5%) | 7 (0.5%) |
| $25,000 to $34,999 | 17 (2.7%) | 32 (2.3%) |
| $35,000 to $49,999 | 77 (12.4%) | 33 (2.4%) |
| $50,000 to $74,999 | 61 (9.8%) | 10 (0.7%) |
| $75,000 to $99,999 | 103 (16.6%) | 60 (4.3%) |
| $100,000 to $149,999 | 182 (29.3%) | 164 (11.8%) |
| $150,000 or more | 116 (18.7%) | 206 (14.8%) |
| Total | 620 (100.0%) | 1,388 (100.0%) |
Property Value to Household Income Ratio in West Long Branch borough
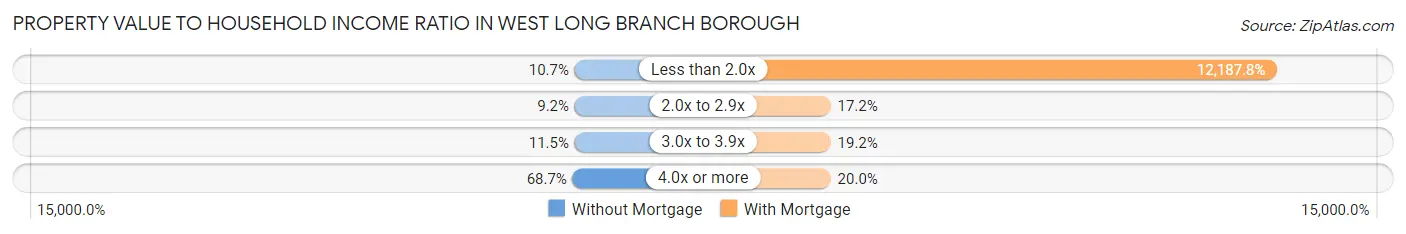
| Value-to-Income Ratio | Without Mortgage | With Mortgage |
| Less than 2.0x | 66 (10.6%) | 169,167 (12,187.8%) |
| 2.0x to 2.9x | 57 (9.2%) | 238 (17.2%) |
| 3.0x to 3.9x | 71 (11.5%) | 267 (19.2%) |
| 4.0x or more | 426 (68.7%) | 278 (20.0%) |
| Total | 620 (100.0%) | 1,388 (100.0%) |
Real Estate Taxes by Mortgage Status in West Long Branch borough
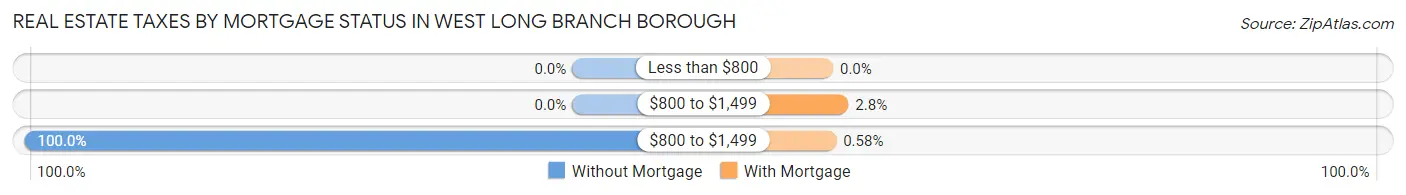
| Property Taxes | Without Mortgage | With Mortgage |
| Less than $800 | 0 (0.0%) | 0 (0.0%) |
| $800 to $1,499 | 0 (0.0%) | 39 (2.8%) |
| $800 to $1,499 | 620 (100.0%) | 8 (0.6%) |
| Total | 620 (100.0%) | 1,388 (100.0%) |
Health & Disability in West Long Branch borough
Health Insurance Coverage by Age in West Long Branch borough
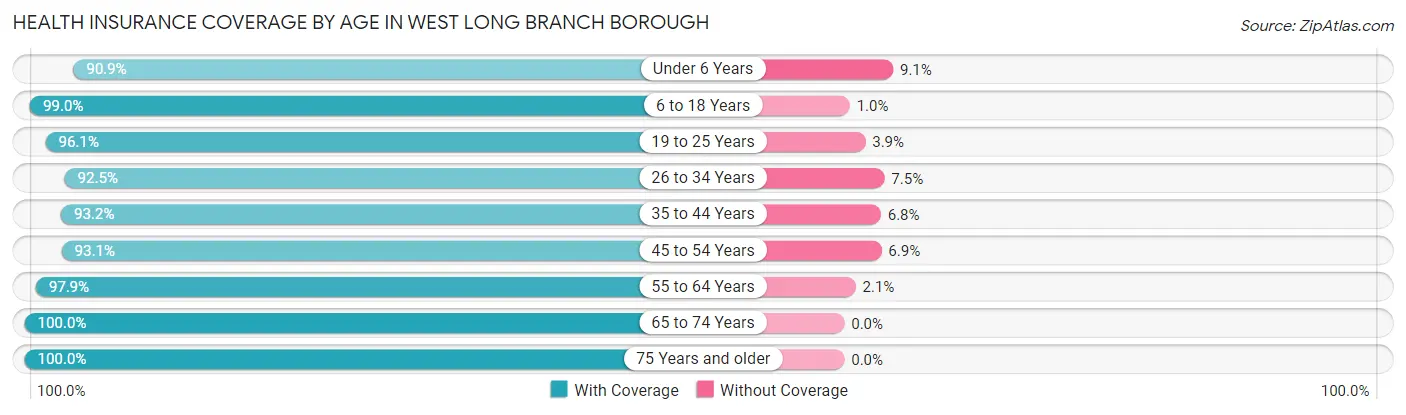
| Age Bracket | With Coverage | Without Coverage |
| Under 6 Years | 680 (90.9%) | 68 (9.1%) |
| 6 to 18 Years | 1,372 (99.0%) | 14 (1.0%) |
| 19 to 25 Years | 1,399 (96.1%) | 57 (3.9%) |
| 26 to 34 Years | 878 (92.5%) | 71 (7.5%) |
| 35 to 44 Years | 658 (93.2%) | 48 (6.8%) |
| 45 to 54 Years | 740 (93.1%) | 55 (6.9%) |
| 55 to 64 Years | 1,065 (97.9%) | 23 (2.1%) |
| 65 to 74 Years | 734 (100.0%) | 0 (0.0%) |
| 75 Years and older | 685 (100.0%) | 0 (0.0%) |
| Total | 8,211 (96.1%) | 336 (3.9%) |
Health Insurance Coverage by Citizenship Status in West Long Branch borough
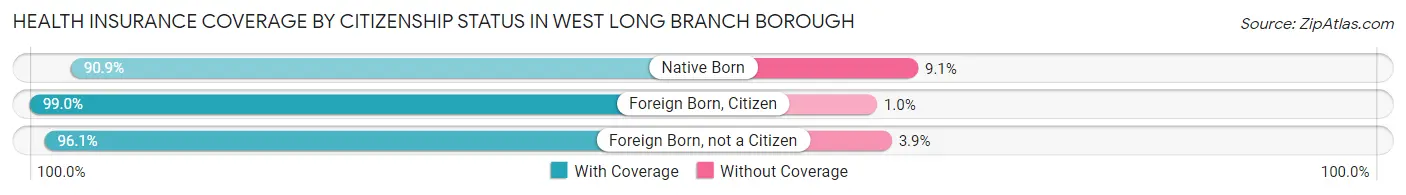
| Citizenship Status | With Coverage | Without Coverage |
| Native Born | 680 (90.9%) | 68 (9.1%) |
| Foreign Born, Citizen | 1,372 (99.0%) | 14 (1.0%) |
| Foreign Born, not a Citizen | 1,399 (96.1%) | 57 (3.9%) |
Health Insurance Coverage by Household Income in West Long Branch borough
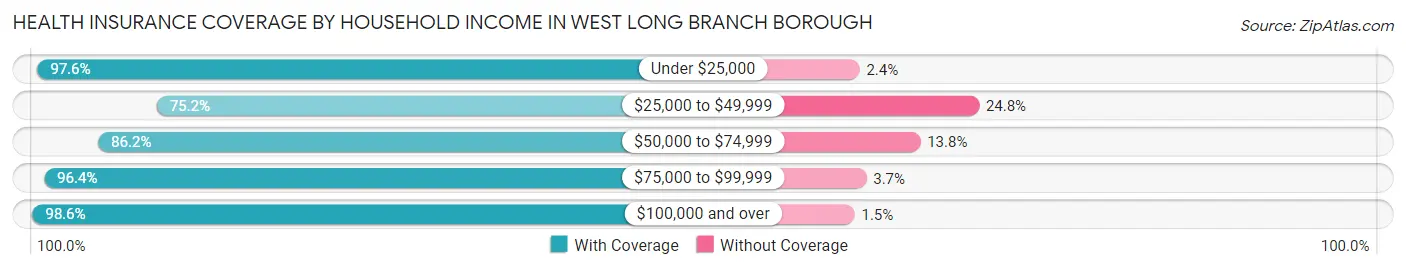
| Household Income | With Coverage | Without Coverage |
| Under $25,000 | 614 (97.6%) | 15 (2.4%) |
| $25,000 to $49,999 | 386 (75.2%) | 127 (24.8%) |
| $50,000 to $74,999 | 489 (86.2%) | 78 (13.8%) |
| $75,000 to $99,999 | 818 (96.4%) | 31 (3.6%) |
| $100,000 and over | 4,556 (98.6%) | 67 (1.5%) |
Public vs Private Health Insurance Coverage by Age in West Long Branch borough
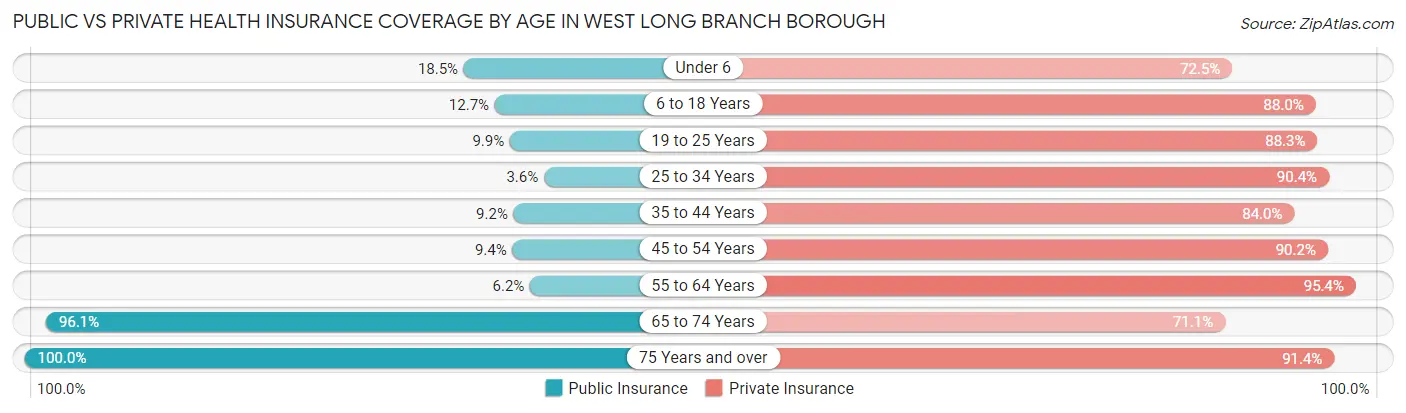
| Age Bracket | Public Insurance | Private Insurance |
| Under 6 | 138 (18.4%) | 542 (72.5%) |
| 6 to 18 Years | 176 (12.7%) | 1,219 (87.9%) |
| 19 to 25 Years | 144 (9.9%) | 1,285 (88.3%) |
| 25 to 34 Years | 34 (3.6%) | 858 (90.4%) |
| 35 to 44 Years | 65 (9.2%) | 593 (84.0%) |
| 45 to 54 Years | 75 (9.4%) | 717 (90.2%) |
| 55 to 64 Years | 67 (6.2%) | 1,038 (95.4%) |
| 65 to 74 Years | 705 (96.1%) | 522 (71.1%) |
| 75 Years and over | 685 (100.0%) | 626 (91.4%) |
| Total | 2,089 (24.4%) | 7,400 (86.6%) |
Disability Status by Sex by Age in West Long Branch borough
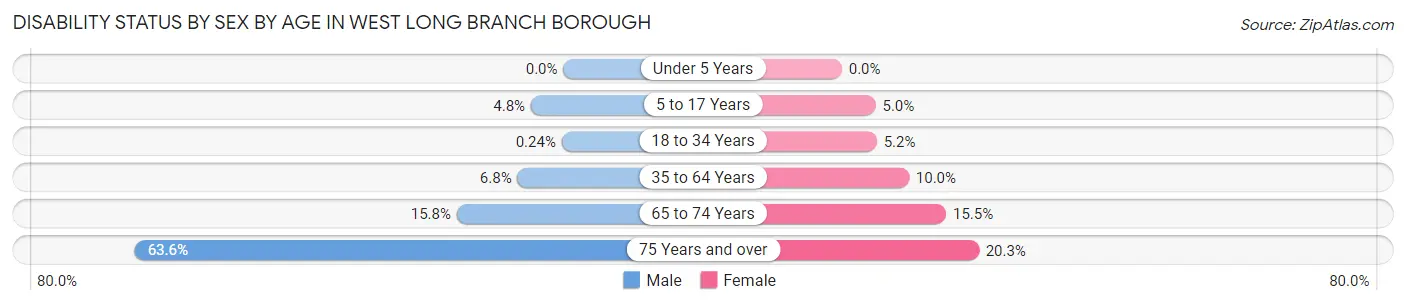
| Age Bracket | Male | Female |
| Under 5 Years | 0 (0.0%) | 0 (0.0%) |
| 5 to 17 Years | 23 (4.8%) | 26 (5.0%) |
| 18 to 34 Years | 3 (0.2%) | 87 (5.2%) |
| 35 to 64 Years | 84 (6.8%) | 135 (10.0%) |
| 65 to 74 Years | 65 (15.8%) | 50 (15.5%) |
| 75 Years and over | 126 (63.6%) | 99 (20.3%) |
Disability Class by Sex by Age in West Long Branch borough
Disability Class: Hearing Difficulty
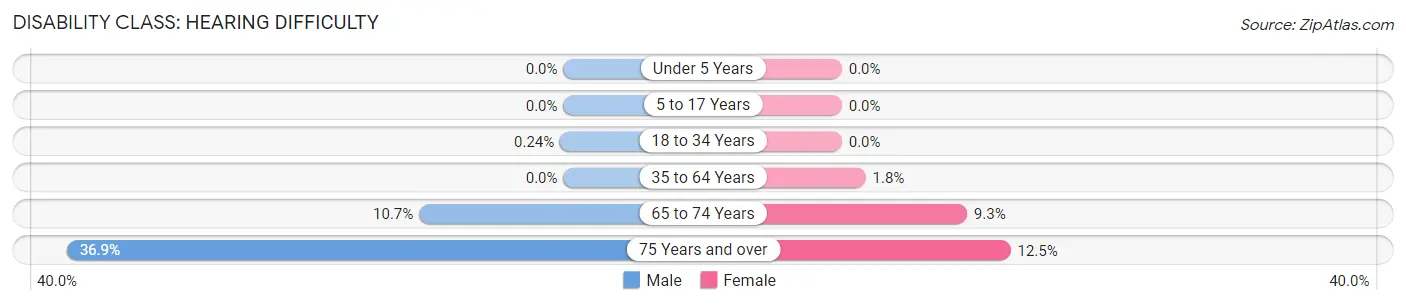
| Age Bracket | Male | Female |
| Under 5 Years | 0 (0.0%) | 0 (0.0%) |
| 5 to 17 Years | 0 (0.0%) | 0 (0.0%) |
| 18 to 34 Years | 3 (0.2%) | 0 (0.0%) |
| 35 to 64 Years | 0 (0.0%) | 24 (1.8%) |
| 65 to 74 Years | 44 (10.7%) | 30 (9.3%) |
| 75 Years and over | 73 (36.9%) | 61 (12.5%) |
Disability Class: Vision Difficulty
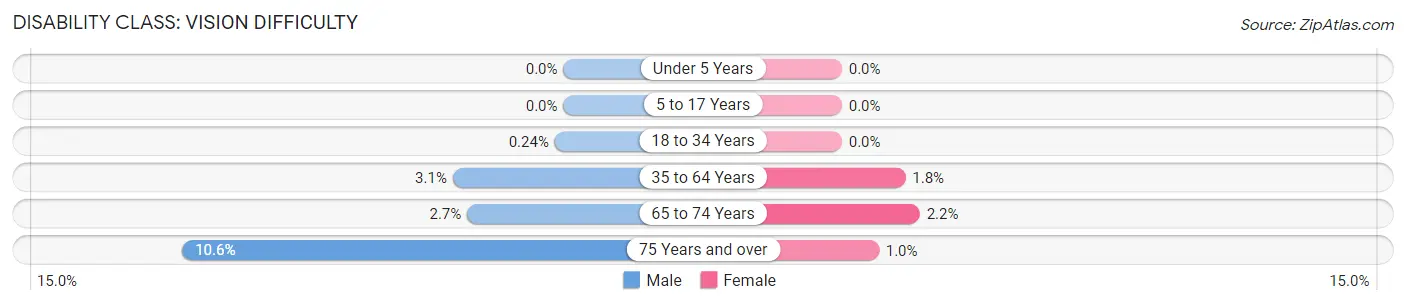
| Age Bracket | Male | Female |
| Under 5 Years | 0 (0.0%) | 0 (0.0%) |
| 5 to 17 Years | 0 (0.0%) | 0 (0.0%) |
| 18 to 34 Years | 3 (0.2%) | 0 (0.0%) |
| 35 to 64 Years | 38 (3.1%) | 24 (1.8%) |
| 65 to 74 Years | 11 (2.7%) | 7 (2.2%) |
| 75 Years and over | 21 (10.6%) | 5 (1.0%) |
Disability Class: Cognitive Difficulty
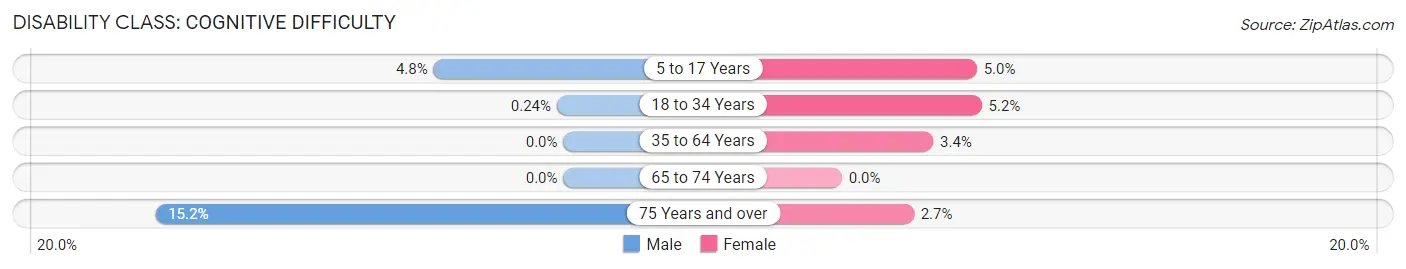
| Age Bracket | Male | Female |
| 5 to 17 Years | 23 (4.8%) | 26 (5.0%) |
| 18 to 34 Years | 3 (0.2%) | 87 (5.2%) |
| 35 to 64 Years | 0 (0.0%) | 46 (3.4%) |
| 65 to 74 Years | 0 (0.0%) | 0 (0.0%) |
| 75 Years and over | 30 (15.1%) | 13 (2.7%) |
Disability Class: Ambulatory Difficulty
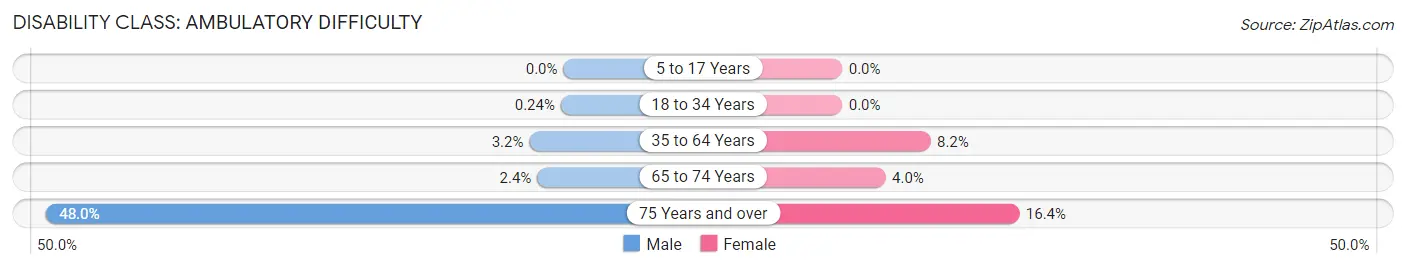
| Age Bracket | Male | Female |
| 5 to 17 Years | 0 (0.0%) | 0 (0.0%) |
| 18 to 34 Years | 3 (0.2%) | 0 (0.0%) |
| 35 to 64 Years | 39 (3.2%) | 111 (8.2%) |
| 65 to 74 Years | 10 (2.4%) | 13 (4.0%) |
| 75 Years and over | 95 (48.0%) | 80 (16.4%) |
Disability Class: Self-Care Difficulty
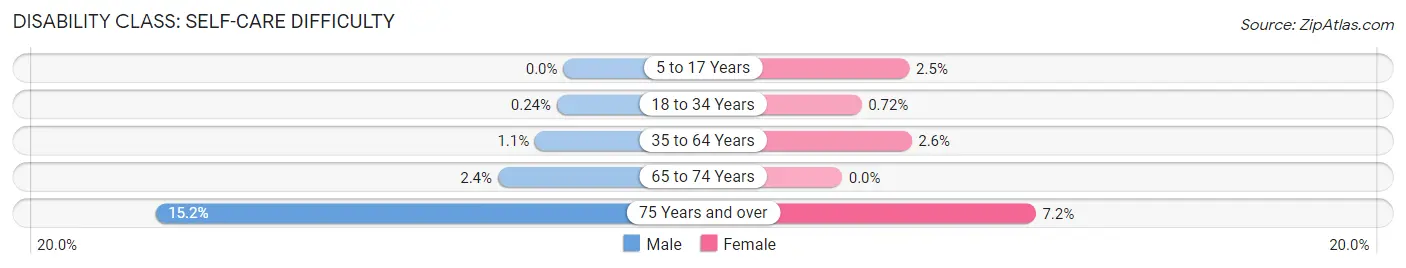
| Age Bracket | Male | Female |
| 5 to 17 Years | 0 (0.0%) | 13 (2.5%) |
| 18 to 34 Years | 3 (0.2%) | 12 (0.7%) |
| 35 to 64 Years | 13 (1.1%) | 35 (2.6%) |
| 65 to 74 Years | 10 (2.4%) | 0 (0.0%) |
| 75 Years and over | 30 (15.1%) | 35 (7.2%) |
Technology Access in West Long Branch borough
Computing Device Access in West Long Branch borough
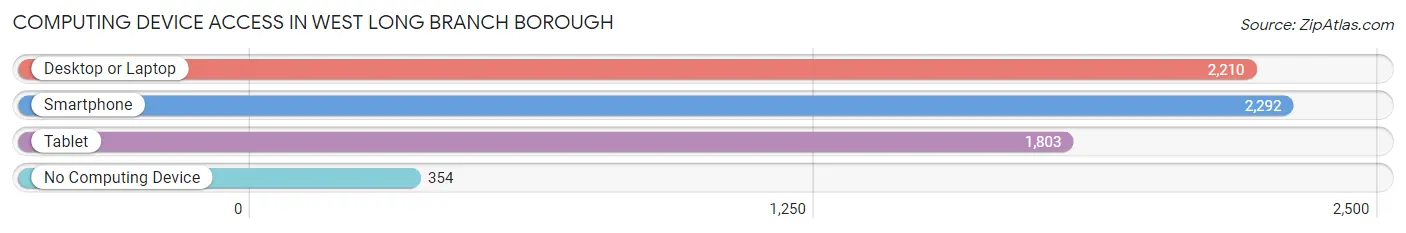
| Device Type | # Households | % Households |
| Desktop or Laptop | 2,210 | 80.4% |
| Smartphone | 2,292 | 83.4% |
| Tablet | 1,803 | 65.6% |
| No Computing Device | 354 | 12.9% |
| Total | 2,747 | 100.0% |
Internet Access in West Long Branch borough
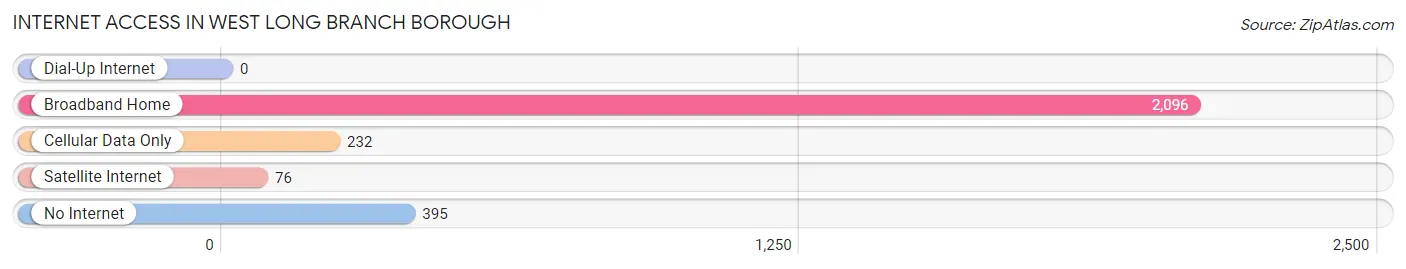
| Internet Type | # Households | % Households |
| Dial-Up Internet | 0 | 0.0% |
| Broadband Home | 2,096 | 76.3% |
| Cellular Data Only | 232 | 8.5% |
| Satellite Internet | 76 | 2.8% |
| No Internet | 395 | 14.4% |
| Total | 2,747 | 100.0% |
West Long Branch borough Summary
Long Branch Borough is a small borough located in Monmouth County, New Jersey. It is situated on the Atlantic Ocean, just south of the city of Long Branch. The borough is bordered by Oceanport to the north, West Long Branch to the east, and Eatontown to the south. The borough has a total area of 1.3 square miles, all of which is land.
History
Long Branch was originally inhabited by the Lenni Lenape Native Americans. The first European settlers arrived in the area in the late 1600s. The area was originally known as Branchport, and was part of Shrewsbury Township. In 1867, the area was incorporated as the Borough of Long Branch.
Geography
Long Branch is located at 40°19'25" North, 74°00'45" West (40.323, -74.012). The borough is situated on the Atlantic Ocean, just south of the city of Long Branch. The borough is bordered by Oceanport to the north, West Long Branch to the east, and Eatontown to the south. The borough has a total area of 1.3 square miles, all of which is land.
Economy
Long Branch is a small borough with a population of just over 8,000 people. The borough is home to a variety of businesses, including retail stores, restaurants, and professional services. The borough is also home to several corporate headquarters, including the headquarters of the Monmouth County Board of Realtors.
Demographics
As of the 2010 United States Census, there were 8,092 people, 3,541 households, and 2,072 families residing in the borough. The population density was 6,093.3 people per square mile. The racial makeup of the borough was 79.2% White, 8.3% African American, 0.3% Native American, 5.2% Asian, 0.1% Pacific Islander, 4.2% from other races, and 2.7% from two or more races. Hispanic or Latino of any race were 11.7% of the population.
The median income for a household in the borough was $60,972, and the median income for a family was $76,945. Males had a median income of $51,945 versus $41,945 for females. The per capita income for the borough was $30,945. About 4.2% of families and 6.3% of the population were below the poverty line, including 8.2% of those under age 18 and 5.2% of those age 65 or over.
Conclusion
Long Branch Borough is a small borough located in Monmouth County, New Jersey. It is situated on the Atlantic Ocean, just south of the city of Long Branch. The borough is bordered by Oceanport to the north, West Long Branch to the east, and Eatontown to the south. The borough has a total area of 1.3 square miles, all of which is land. Long Branch has a population of just over 8,000 people and is home to a variety of businesses, including retail stores, restaurants, and professional services. The median income for a household in the borough was $60,972, and the median income for a family was $76,945. Long Branch is a diverse community with a variety of cultures and backgrounds.
Common Questions
What is the Total Population of West Long Branch borough?
Total Population of West Long Branch borough is 8,547.
What is the Total Male Population of West Long Branch borough?
Total Male Population of West Long Branch borough is 3,876.
What is the Total Female Population of West Long Branch borough?
Total Female Population of West Long Branch borough is 4,671.
What is the Ratio of Males per 100 Females in West Long Branch borough?
There are 82.98 Males per 100 Females in West Long Branch borough.
What is the Ratio of Females per 100 Males in West Long Branch borough?
There are 120.51 Females per 100 Males in West Long Branch borough.
What is the Median Population Age in West Long Branch borough?
Median Population Age in West Long Branch borough is 31.4 Years.
What is the Average Family Size in West Long Branch borough
Average Family Size in West Long Branch borough is 3.2 People.
What is the Average Household Size in West Long Branch borough
Average Household Size in West Long Branch borough is 2.6 People.
What is Per Capita Income in West Long Branch borough?
Per Capita income in West Long Branch borough is $49,295.
What is the Median Family Income in West Long Branch borough?
Median Family Income in West Long Branch borough is $153,352.
What is the Median Household income in West Long Branch borough?
Median Household Income in West Long Branch borough is $114,036.
What is Income or Wage Gap in West Long Branch borough?
Income or Wage Gap in West Long Branch borough is 27.9%.
Women in West Long Branch borough earn 72.1 cents for every dollar earned by a man.
What is Family Income Deficit in West Long Branch borough?
Family Income Deficit in West Long Branch borough is $15,947.
Families that are below poverty line in West Long Branch borough earn $15,947 less on average than the poverty threshold level.
What is Inequality or Gini Index in West Long Branch borough?
Inequality or Gini Index in West Long Branch borough is 0.47.
How Large is the Labor Force in West Long Branch borough?
There are 4,523 People in the Labor Forcein in West Long Branch borough.
What is the Percentage of People in the Labor Force in West Long Branch borough?
63.8% of People are in the Labor Force in West Long Branch borough.
What is the Unemployment Rate in West Long Branch borough?
Unemployment Rate in West Long Branch borough is 7.5%.