Sharpsburg, NC
Sharpsburg Map
Sharpsburg Overview
1,504
TOTAL POPULATION
672
MALE POPULATION
832
FEMALE POPULATION
80.77
MALES / 100 FEMALES
123.81
FEMALES / 100 MALES
38.2
MEDIAN AGE
3.1
AVG FAMILY SIZE
2.4
AVG HOUSEHOLD SIZE
$19,612
PER CAPITA INCOME
$40,938
AVG FAMILY INCOME
$35,521
AVG HOUSEHOLD INCOME
3.6%
WAGE / INCOME GAP [ % ]
96.4¢/ $1
WAGE / INCOME GAP [ $ ]
0.42
INEQUALITY / GINI INDEX
628
LABOR FORCE [ PEOPLE ]
57.1%
PERCENT IN LABOR FORCE
0.5%
UNEMPLOYMENT RATE
Sharpsburg Zip Codes
Sharpsburg Area Codes
Race in Sharpsburg
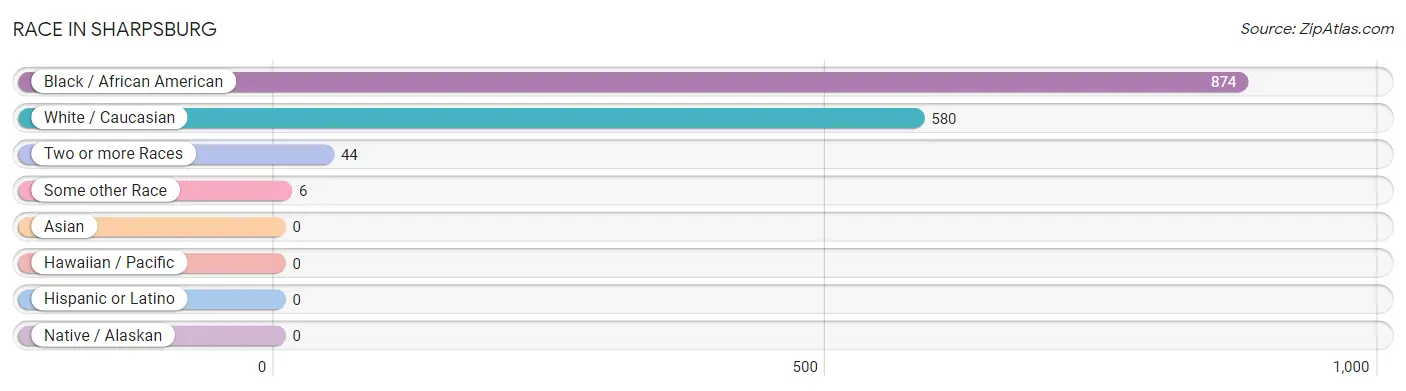
The most populous races in Sharpsburg are Black / African American (874 | 58.1%), White / Caucasian (580 | 38.6%), and Two or more Races (44 | 2.9%).
| Race | # Population | % Population |
| Asian | 0 | 0.0% |
| Black / African American | 874 | 58.1% |
| Hawaiian / Pacific | 0 | 0.0% |
| Hispanic or Latino | 0 | 0.0% |
| Native / Alaskan | 0 | 0.0% |
| White / Caucasian | 580 | 38.6% |
| Two or more Races | 44 | 2.9% |
| Some other Race | 6 | 0.4% |
| Total | 1,504 | 100.0% |
Ancestry in Sharpsburg
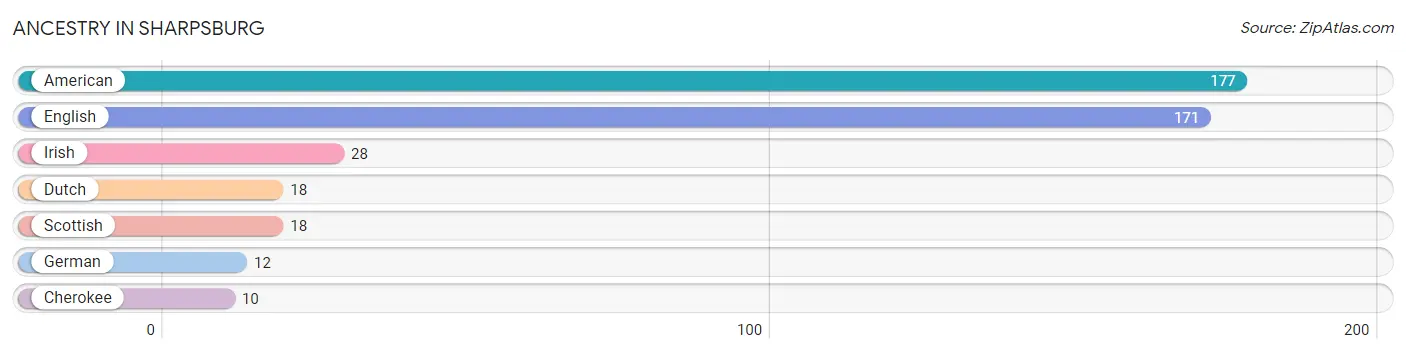
The most populous ancestries reported in Sharpsburg are American (177 | 11.8%), English (171 | 11.4%), Irish (28 | 1.9%), Dutch (18 | 1.2%), and Scottish (18 | 1.2%), together accounting for 27.4% of all Sharpsburg residents.
| Ancestry | # Population | % Population |
| American | 177 | 11.8% |
| Cherokee | 10 | 0.7% |
| Dutch | 18 | 1.2% |
| English | 171 | 11.4% |
| German | 12 | 0.8% |
| Irish | 28 | 1.9% |
| Scottish | 18 | 1.2% | View All 7 Rows |
Immigrants in Sharpsburg

| Immigration Origin | # Population | % Population | View All 0 Rows |
Sex and Age in Sharpsburg
Sex and Age in Sharpsburg
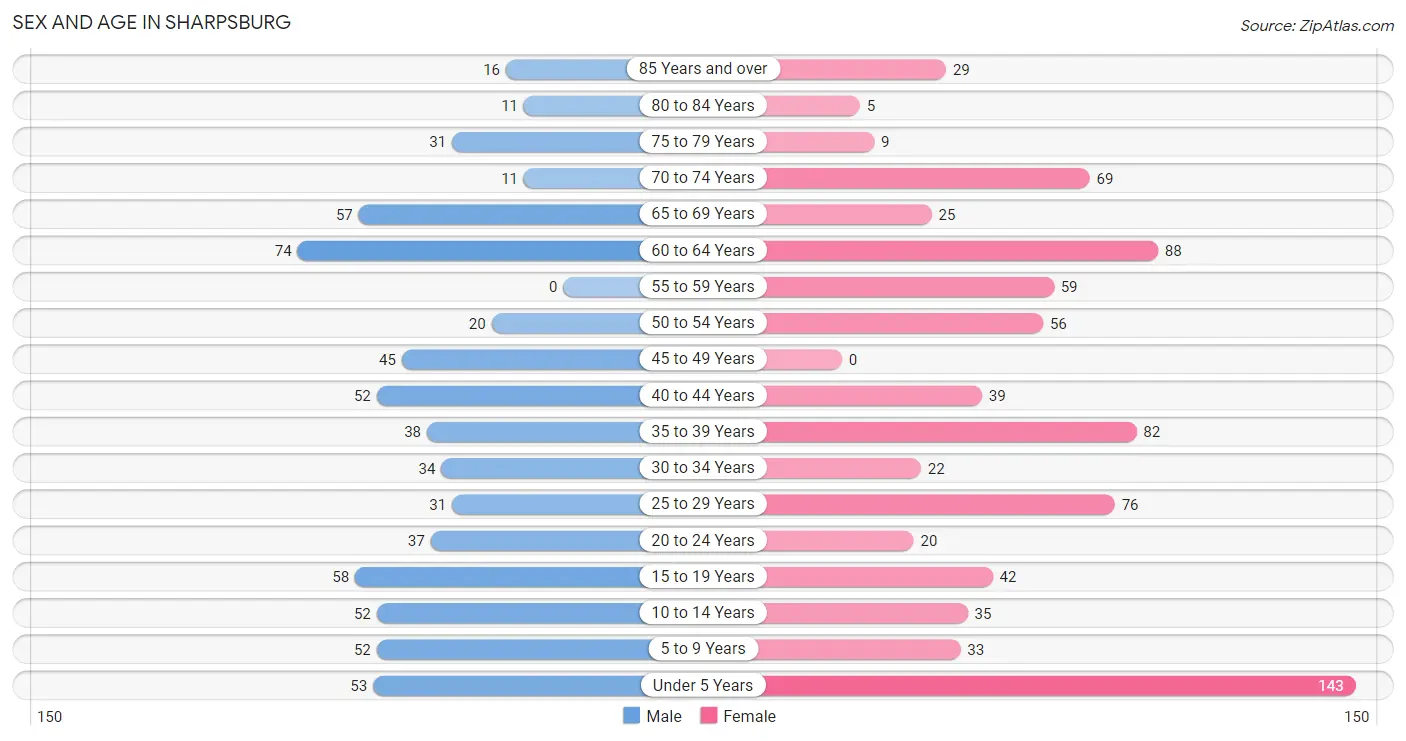
The most populous age groups in Sharpsburg are 60 to 64 Years (74 | 11.0%) for men and Under 5 Years (143 | 17.2%) for women.
| Age Bracket | Male | Female |
| Under 5 Years | 53 (7.9%) | 143 (17.2%) |
| 5 to 9 Years | 52 (7.7%) | 33 (4.0%) |
| 10 to 14 Years | 52 (7.7%) | 35 (4.2%) |
| 15 to 19 Years | 58 (8.6%) | 42 (5.1%) |
| 20 to 24 Years | 37 (5.5%) | 20 (2.4%) |
| 25 to 29 Years | 31 (4.6%) | 76 (9.1%) |
| 30 to 34 Years | 34 (5.1%) | 22 (2.6%) |
| 35 to 39 Years | 38 (5.7%) | 82 (9.9%) |
| 40 to 44 Years | 52 (7.7%) | 39 (4.7%) |
| 45 to 49 Years | 45 (6.7%) | 0 (0.0%) |
| 50 to 54 Years | 20 (3.0%) | 56 (6.7%) |
| 55 to 59 Years | 0 (0.0%) | 59 (7.1%) |
| 60 to 64 Years | 74 (11.0%) | 88 (10.6%) |
| 65 to 69 Years | 57 (8.5%) | 25 (3.0%) |
| 70 to 74 Years | 11 (1.6%) | 69 (8.3%) |
| 75 to 79 Years | 31 (4.6%) | 9 (1.1%) |
| 80 to 84 Years | 11 (1.6%) | 5 (0.6%) |
| 85 Years and over | 16 (2.4%) | 29 (3.5%) |
| Total | 672 (100.0%) | 832 (100.0%) |
Families and Households in Sharpsburg
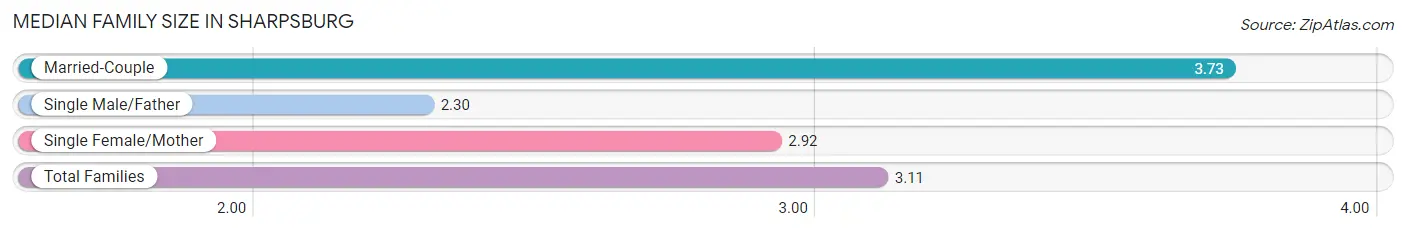
Median Family Size in Sharpsburg
The median family size in Sharpsburg is 3.11 persons per family, with married-couple families (139 | 37.7%) accounting for the largest median family size of 3.73 persons per family. On the other hand, single male/father families (67 | 18.2%) represent the smallest median family size with 2.30 persons per family.
| Family Type | # Families | Family Size |
| Married-Couple | 139 (37.7%) | 3.73 |
| Single Male/Father | 67 (18.2%) | 2.30 |
| Single Female/Mother | 163 (44.2%) | 2.92 |
| Total Families | 369 (100.0%) | 3.11 |
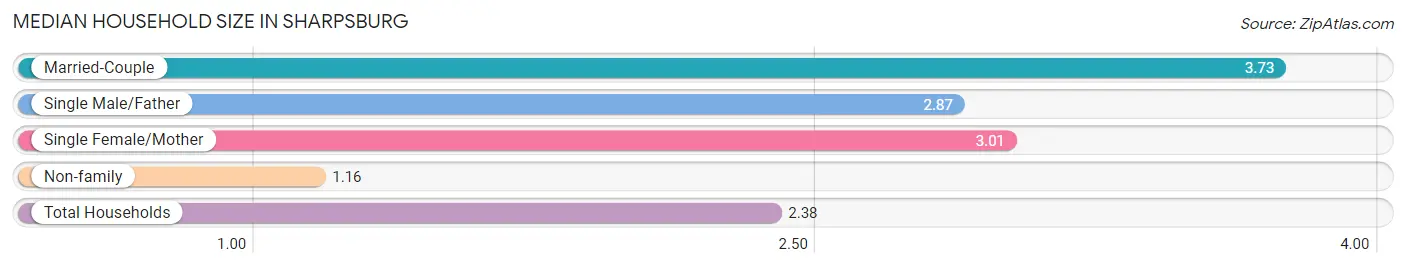
Median Household Size in Sharpsburg
The median household size in Sharpsburg is 2.38 persons per household, with married-couple households (139 | 22.0%) accounting for the largest median household size of 3.73 persons per household. non-family households (263 | 41.6%) represent the smallest median household size with 1.16 persons per household.
| Household Type | # Households | Household Size |
| Married-Couple | 139 (22.0%) | 3.73 |
| Single Male/Father | 67 (10.6%) | 2.87 |
| Single Female/Mother | 163 (25.8%) | 3.01 |
| Non-family | 263 (41.6%) | 1.16 |
| Total Households | 632 (100.0%) | 2.38 |
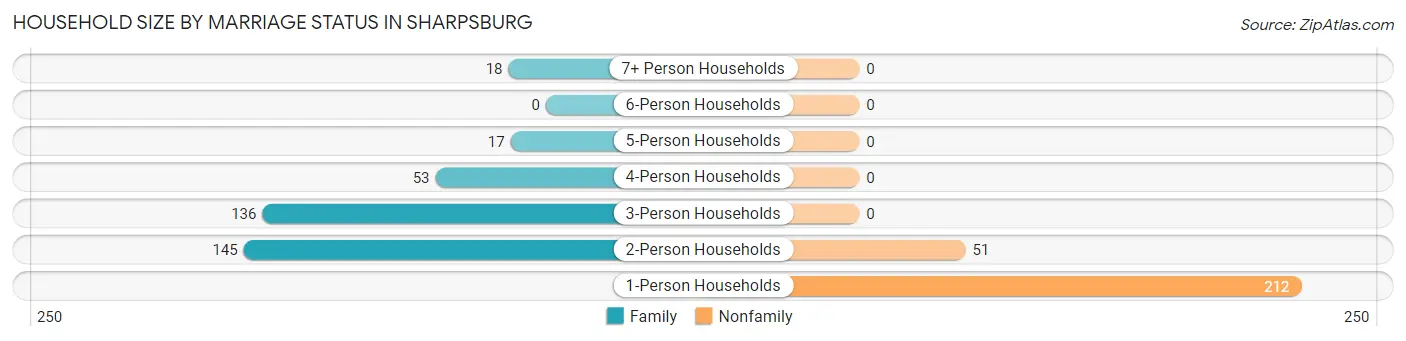
Household Size by Marriage Status in Sharpsburg
Out of a total of 632 households in Sharpsburg, 369 (58.4%) are family households, while 263 (41.6%) are nonfamily households. The most numerous type of family households are 2-person households, comprising 145, and the most common type of nonfamily households are 1-person households, comprising 212.
| Household Size | Family Households | Nonfamily Households |
| 1-Person Households | - | 212 (33.5%) |
| 2-Person Households | 145 (22.9%) | 51 (8.1%) |
| 3-Person Households | 136 (21.5%) | 0 (0.0%) |
| 4-Person Households | 53 (8.4%) | 0 (0.0%) |
| 5-Person Households | 17 (2.7%) | 0 (0.0%) |
| 6-Person Households | 0 (0.0%) | 0 (0.0%) |
| 7+ Person Households | 18 (2.9%) | 0 (0.0%) |
| Total | 369 (58.4%) | 263 (41.6%) |
Female Fertility in Sharpsburg
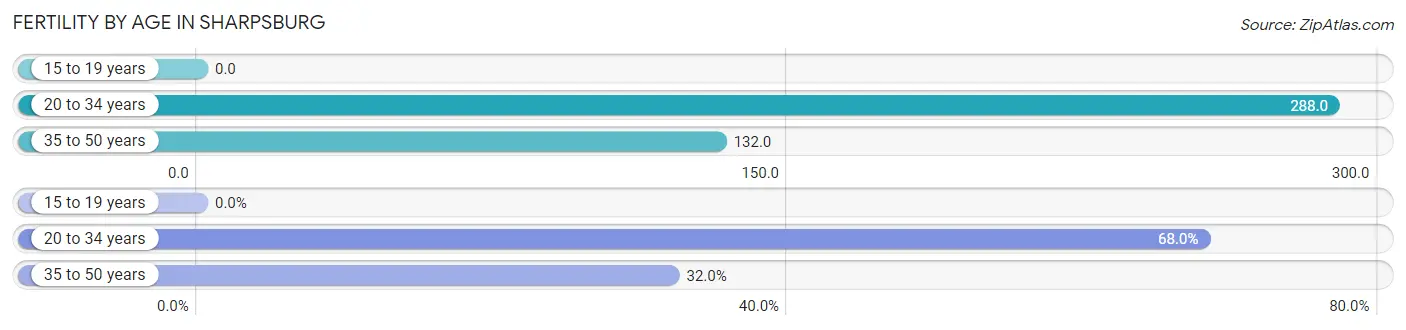
Fertility by Age in Sharpsburg
Average fertility rate in Sharpsburg is 178.0 births per 1,000 women. Women in the age bracket of 20 to 34 years have the highest fertility rate with 288.0 births per 1,000 women. Women in the age bracket of 20 to 34 years acount for 68.0% of all women with births.
| Age Bracket | Women with Births | Births / 1,000 Women |
| 15 to 19 years | 0 (0.0%) | 0.0 |
| 20 to 34 years | 34 (68.0%) | 288.0 |
| 35 to 50 years | 16 (32.0%) | 132.0 |
| Total | 50 (100.0%) | 178.0 |
Fertility by Age by Marriage Status in Sharpsburg
64.0% of women with births (50) in Sharpsburg are married. The highest percentage of unmarried women with births falls into 20 to 34 years age bracket with 52.9% of them unmarried at the time of birth, while the lowest percentage of unmarried women with births belong to 35 to 50 years age bracket with 0.0% of them unmarried.
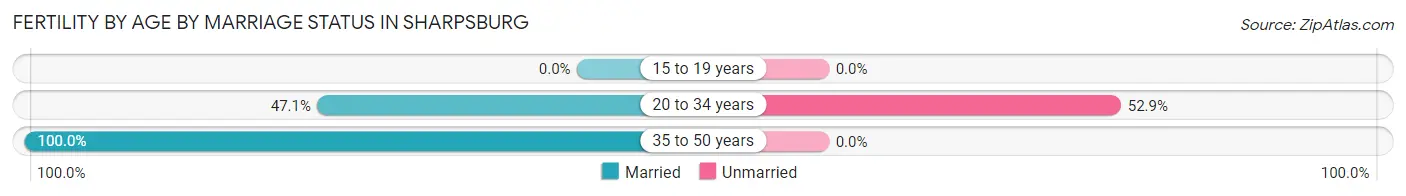
| Age Bracket | Married | Unmarried |
| 15 to 19 years | 0 (0.0%) | 0 (0.0%) |
| 20 to 34 years | 16 (47.1%) | 18 (52.9%) |
| 35 to 50 years | 16 (100.0%) | 0 (0.0%) |
| Total | 32 (64.0%) | 18 (36.0%) |
Fertility by Education in Sharpsburg
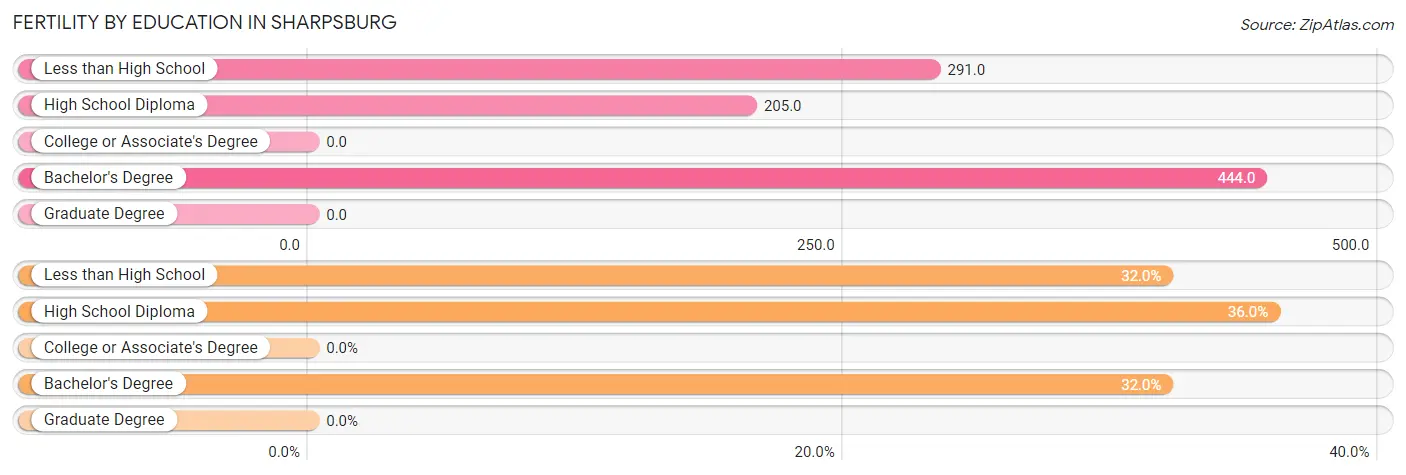
| Educational Attainment | Women with Births | Births / 1,000 Women |
| Less than High School | 16 (32.0%) | 291.0 |
| High School Diploma | 18 (36.0%) | 205.0 |
| College or Associate's Degree | 0 (0.0%) | 0.0 |
| Bachelor's Degree | 16 (32.0%) | 444.0 |
| Graduate Degree | 0 (0.0%) | 0.0 |
| Total | 50 (100.0%) | 178.0 |
Fertility by Education by Marriage Status in Sharpsburg
36.0% of women with births in Sharpsburg are unmarried. Women with the educational attainment of less than high school are most likely to be married with 100.0% of them married at childbirth, while women with the educational attainment of high school diploma are least likely to be married with 100.0% of them unmarried at childbirth.
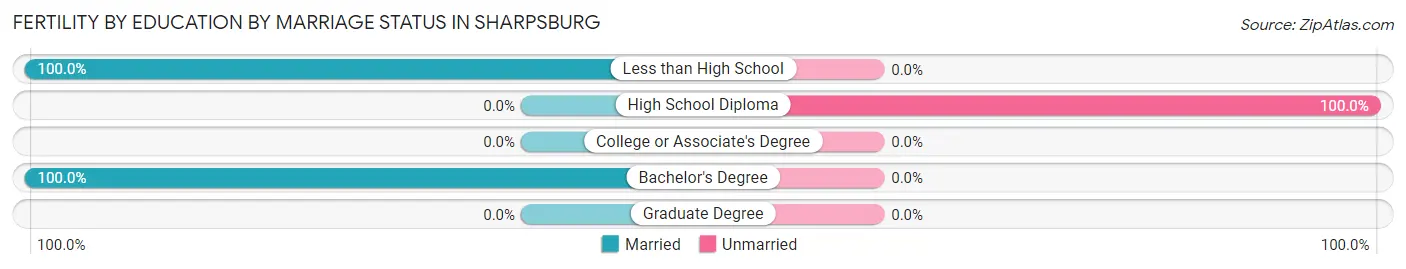
| Educational Attainment | Married | Unmarried |
| Less than High School | 16 (100.0%) | 0 (0.0%) |
| High School Diploma | 0 (0.0%) | 18 (100.0%) |
| College or Associate's Degree | 0 (0.0%) | 0 (0.0%) |
| Bachelor's Degree | 16 (100.0%) | 0 (0.0%) |
| Graduate Degree | 0 (0.0%) | 0 (0.0%) |
| Total | 32 (64.0%) | 18 (36.0%) |
Income in Sharpsburg
Income Overview in Sharpsburg
Per Capita Income in Sharpsburg is $19,612, while median incomes of families and households are $40,938 and $35,521 respectively.
| Characteristic | Number | Measure |
| Per Capita Income | 1,504 | $19,612 |
| Median Family Income | 369 | $40,938 |
| Mean Family Income | 369 | $55,830 |
| Median Household Income | 632 | $35,521 |
| Mean Household Income | 632 | $46,093 |
| Income Deficit | 369 | $0 |
| Wage / Income Gap (%) | 1,504 | 3.55% |
| Wage / Income Gap ($) | 1,504 | 96.45¢ per $1 |
| Gini / Inequality Index | 1,504 | 0.42 |
Earnings by Sex in Sharpsburg
Average Earnings in Sharpsburg are $29,742, $29,336 for men and $30,417 for women, a difference of 3.5%.
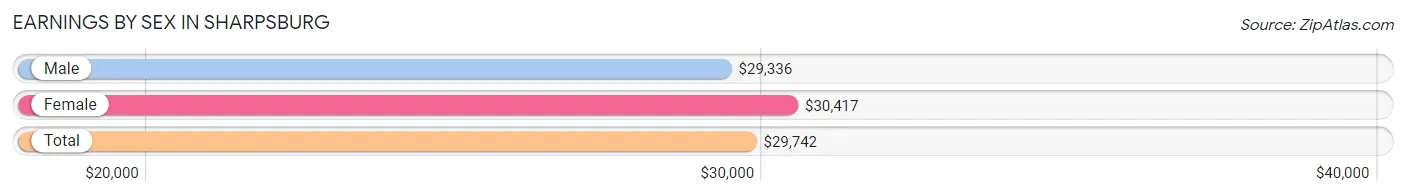
| Sex | Number | Average Earnings |
| Male | 315 (48.5%) | $29,336 |
| Female | 334 (51.5%) | $30,417 |
| Total | 649 (100.0%) | $29,742 |
Earnings by Sex by Income Bracket in Sharpsburg
The most common earnings brackets in Sharpsburg are $2,499 or less for men (56 | 17.8%) and $30,000 to $34,999 for women (65 | 19.5%).
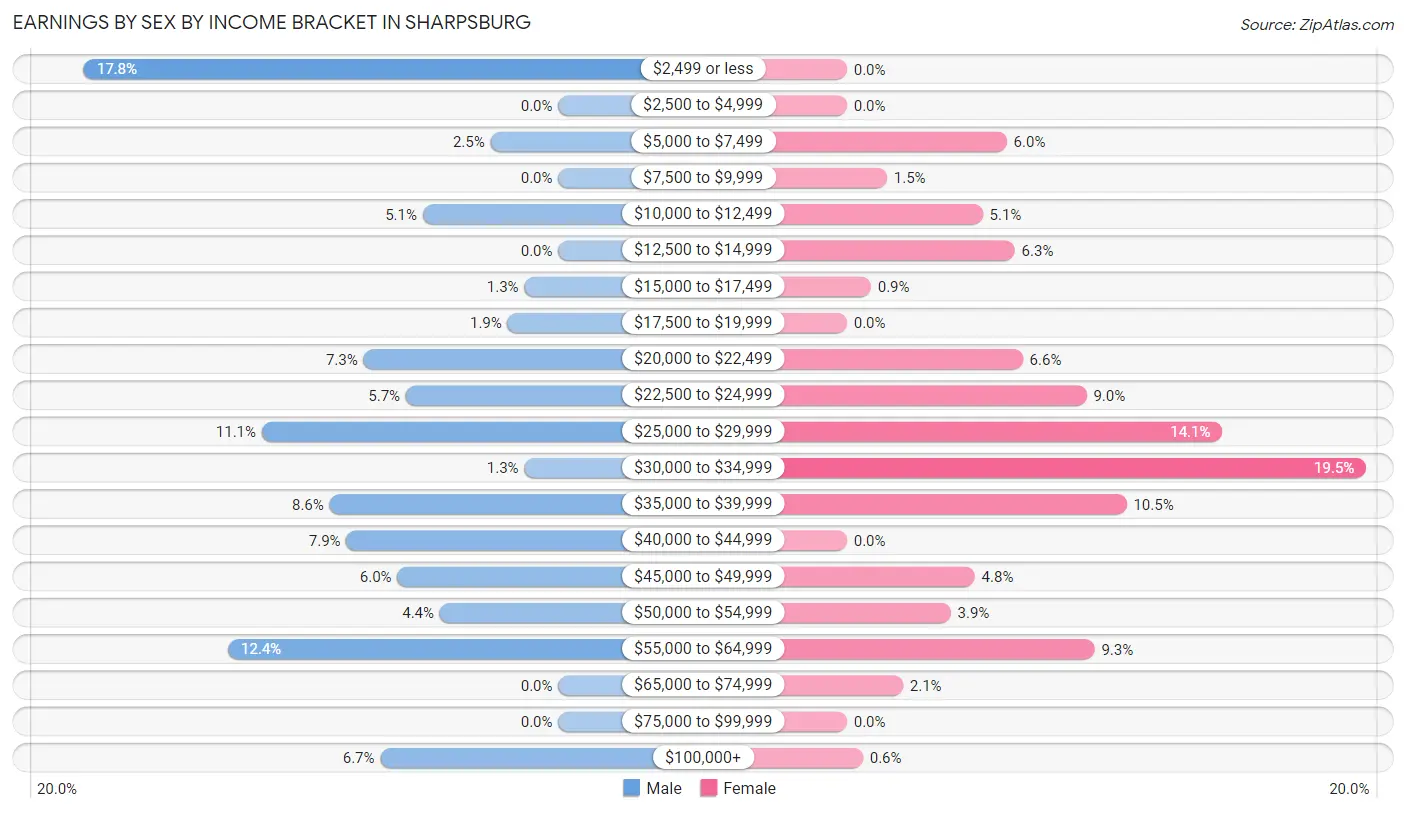
| Income | Male | Female |
| $2,499 or less | 56 (17.8%) | 0 (0.0%) |
| $2,500 to $4,999 | 0 (0.0%) | 0 (0.0%) |
| $5,000 to $7,499 | 8 (2.5%) | 20 (6.0%) |
| $7,500 to $9,999 | 0 (0.0%) | 5 (1.5%) |
| $10,000 to $12,499 | 16 (5.1%) | 17 (5.1%) |
| $12,500 to $14,999 | 0 (0.0%) | 21 (6.3%) |
| $15,000 to $17,499 | 4 (1.3%) | 3 (0.9%) |
| $17,500 to $19,999 | 6 (1.9%) | 0 (0.0%) |
| $20,000 to $22,499 | 23 (7.3%) | 22 (6.6%) |
| $22,500 to $24,999 | 18 (5.7%) | 30 (9.0%) |
| $25,000 to $29,999 | 35 (11.1%) | 47 (14.1%) |
| $30,000 to $34,999 | 4 (1.3%) | 65 (19.5%) |
| $35,000 to $39,999 | 27 (8.6%) | 35 (10.5%) |
| $40,000 to $44,999 | 25 (7.9%) | 0 (0.0%) |
| $45,000 to $49,999 | 19 (6.0%) | 16 (4.8%) |
| $50,000 to $54,999 | 14 (4.4%) | 13 (3.9%) |
| $55,000 to $64,999 | 39 (12.4%) | 31 (9.3%) |
| $65,000 to $74,999 | 0 (0.0%) | 7 (2.1%) |
| $75,000 to $99,999 | 0 (0.0%) | 0 (0.0%) |
| $100,000+ | 21 (6.7%) | 2 (0.6%) |
| Total | 315 (100.0%) | 334 (100.0%) |
Earnings by Sex by Educational Attainment in Sharpsburg
Average earnings in Sharpsburg are $36,574 for men and $29,597 for women, a difference of 19.1%. Men with an educational attainment of high school diploma enjoy the highest average annual earnings of $36,806, while those with high school diploma education earn the least with $36,806. Women with an educational attainment of bachelor's degree earn the most with the average annual earnings of $37,167, while those with high school diploma education have the smallest earnings of $21,818.
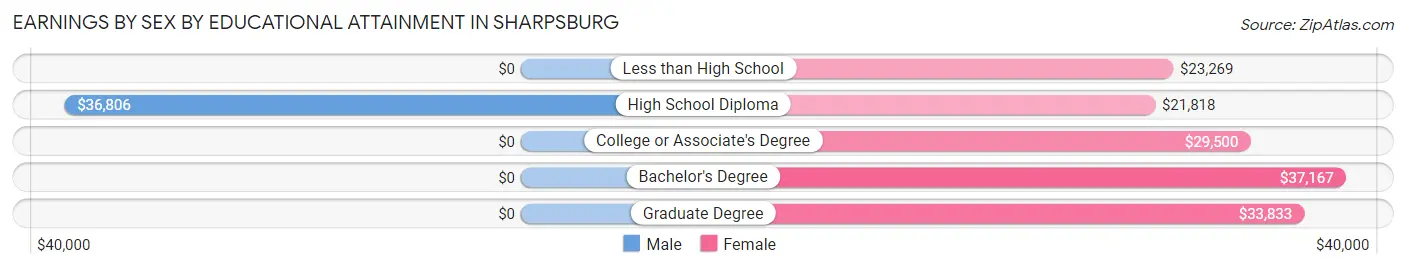
| Educational Attainment | Male Income | Female Income |
| Less than High School | - | - |
| High School Diploma | $36,806 | $21,818 |
| College or Associate's Degree | - | - |
| Bachelor's Degree | - | - |
| Graduate Degree | - | - |
| Total | $36,574 | $29,597 |
Family Income in Sharpsburg
Family Income Brackets in Sharpsburg
According to the Sharpsburg family income data, there are 86 families falling into the $50,000 to $74,999 income range, which is the most common income bracket and makes up 23.3% of all families. Conversely, the $10,000 to $14,999 income bracket is the least frequent group with only 2 families (0.5%) belonging to this category.
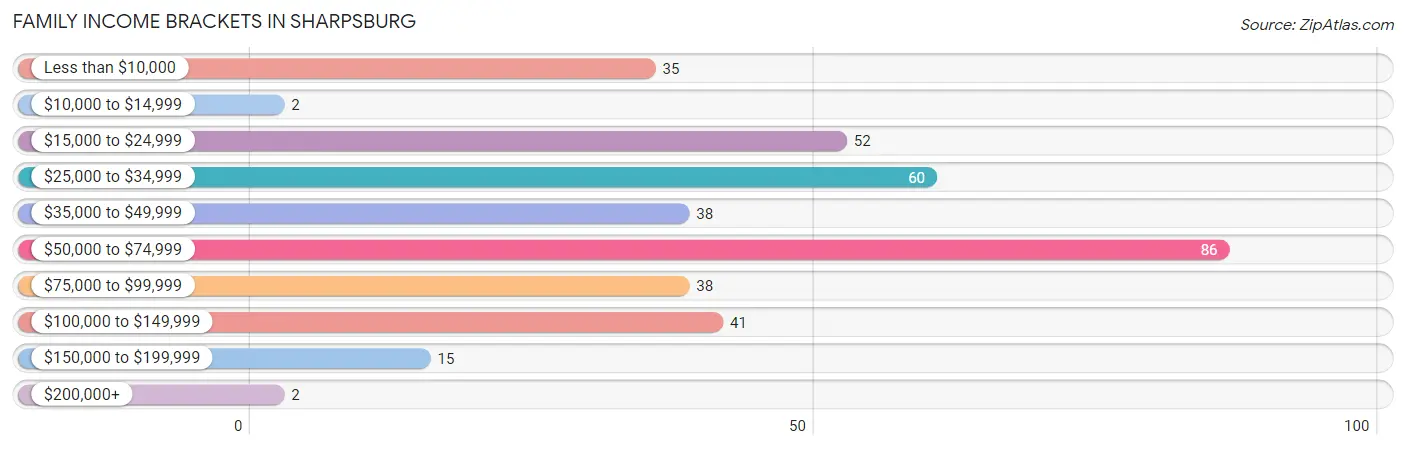
| Income Bracket | # Families | % Families |
| Less than $10,000 | 35 | 9.5% |
| $10,000 to $14,999 | 2 | 0.5% |
| $15,000 to $24,999 | 52 | 14.1% |
| $25,000 to $34,999 | 60 | 16.3% |
| $35,000 to $49,999 | 38 | 10.3% |
| $50,000 to $74,999 | 86 | 23.3% |
| $75,000 to $99,999 | 38 | 10.3% |
| $100,000 to $149,999 | 41 | 11.1% |
| $150,000 to $199,999 | 15 | 4.1% |
| $200,000+ | 2 | 0.5% |
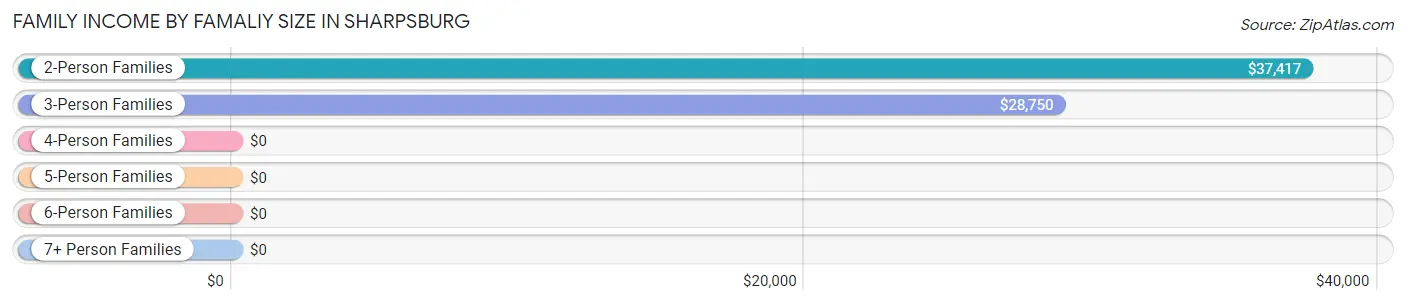
Family Income by Famaliy Size in Sharpsburg
2-person families (174 | 47.1%) account for the highest median family income in Sharpsburg with $37,417 per family, while 2-person families (174 | 47.1%) have the highest median income of $18,708 per family member.
| Income Bracket | # Families | Median Income |
| 2-Person Families | 174 (47.1%) | $37,417 |
| 3-Person Families | 138 (37.4%) | $28,750 |
| 4-Person Families | 22 (6.0%) | $0 |
| 5-Person Families | 17 (4.6%) | $0 |
| 6-Person Families | 0 (0.0%) | $0 |
| 7+ Person Families | 18 (4.9%) | $0 |
| Total | 369 (100.0%) | $40,938 |
Family Income by Number of Earners in Sharpsburg
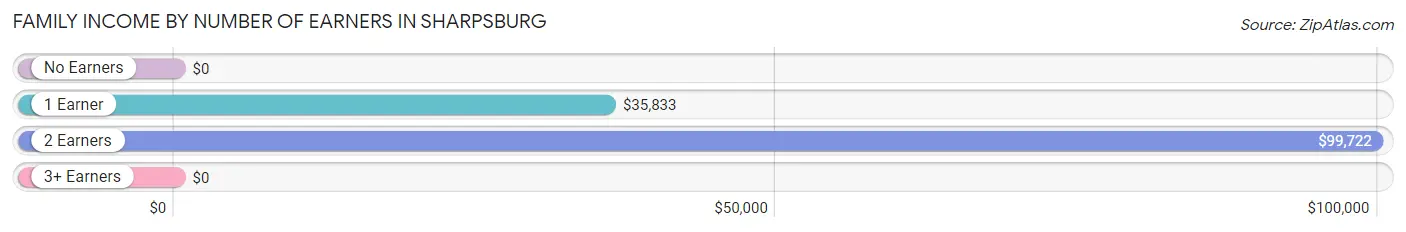
| Number of Earners | # Families | Median Income |
| No Earners | 43 (11.7%) | $0 |
| 1 Earner | 228 (61.8%) | $35,833 |
| 2 Earners | 50 (13.6%) | $99,722 |
| 3+ Earners | 48 (13.0%) | $0 |
| Total | 369 (100.0%) | $40,938 |
Household Income in Sharpsburg
Household Income Brackets in Sharpsburg
With 153 households falling in the category, the $50,000 to $74,999 income range is the most frequent in Sharpsburg, accounting for 24.2% of all households. In contrast, only 2 households (0.3%) fall into the $200,000+ income bracket, making it the least populous group.
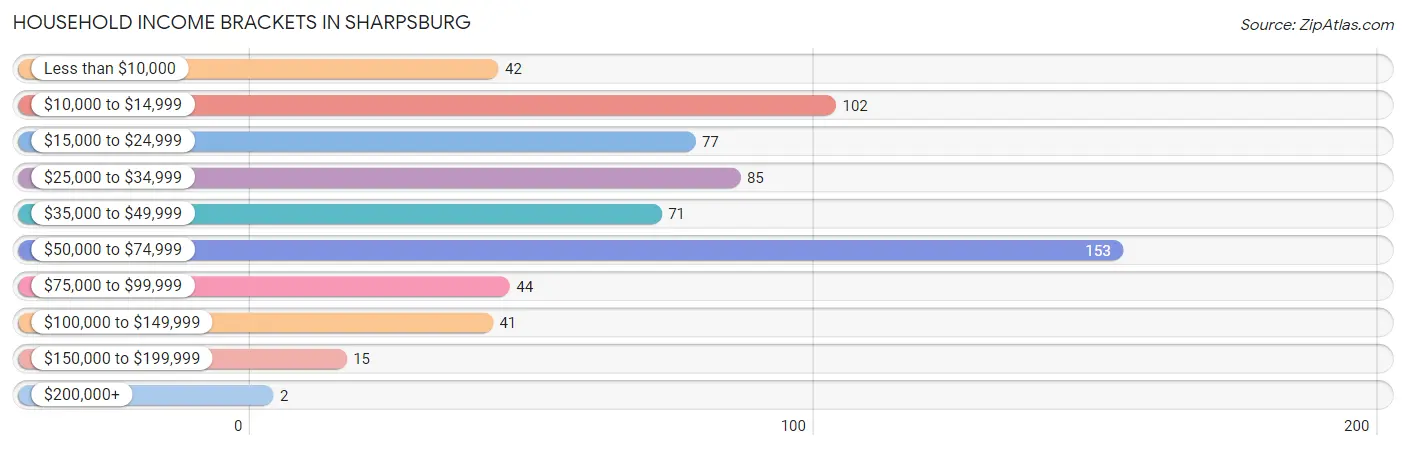
| Income Bracket | # Households | % Households |
| Less than $10,000 | 42 | 6.6% |
| $10,000 to $14,999 | 102 | 16.1% |
| $15,000 to $24,999 | 77 | 12.2% |
| $25,000 to $34,999 | 85 | 13.4% |
| $35,000 to $49,999 | 71 | 11.2% |
| $50,000 to $74,999 | 153 | 24.2% |
| $75,000 to $99,999 | 44 | 7.0% |
| $100,000 to $149,999 | 41 | 6.5% |
| $150,000 to $199,999 | 15 | 2.4% |
| $200,000+ | 2 | 0.3% |
Household Income by Householder Age in Sharpsburg
The median household income in Sharpsburg is $35,521, with the highest median household income of $51,932 found in the 45 to 64 years age bracket for the primary householder. A total of 197 households (31.2%) fall into this category. Meanwhile, the 15 to 24 years age bracket for the primary householder has the lowest median household income of $0, with 25 households (4.0%) in this group.
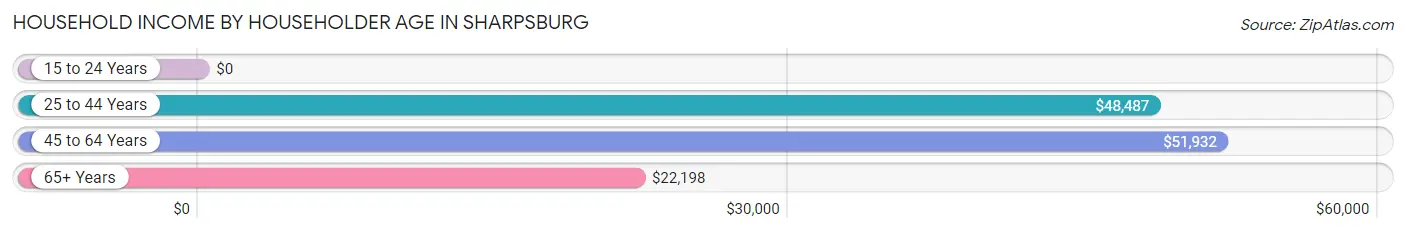
| Income Bracket | # Households | Median Income |
| 15 to 24 Years | 25 (4.0%) | $0 |
| 25 to 44 Years | 199 (31.5%) | $48,487 |
| 45 to 64 Years | 197 (31.2%) | $51,932 |
| 65+ Years | 211 (33.4%) | $22,198 |
| Total | 632 (100.0%) | $35,521 |
Poverty in Sharpsburg
Income Below Poverty by Sex and Age in Sharpsburg
With 17.4% poverty level for males and 16.8% for females among the residents of Sharpsburg, under 5 year old males and 75 year old and over females are the most vulnerable to poverty, with 36 males (67.9%) and 38 females (88.4%) in their respective age groups living below the poverty level.
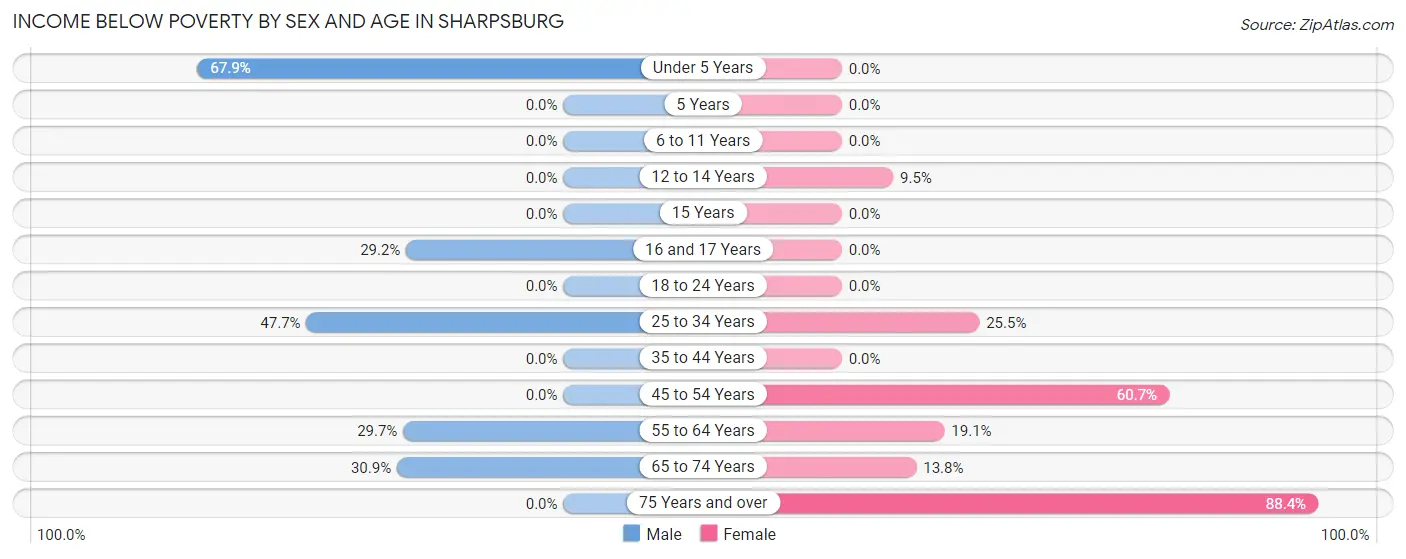
| Age Bracket | Male | Female |
| Under 5 Years | 36 (67.9%) | 0 (0.0%) |
| 5 Years | 0 (0.0%) | 0 (0.0%) |
| 6 to 11 Years | 0 (0.0%) | 0 (0.0%) |
| 12 to 14 Years | 0 (0.0%) | 2 (9.5%) |
| 15 Years | 0 (0.0%) | 0 (0.0%) |
| 16 and 17 Years | 7 (29.2%) | 0 (0.0%) |
| 18 to 24 Years | 0 (0.0%) | 0 (0.0%) |
| 25 to 34 Years | 31 (47.7%) | 25 (25.5%) |
| 35 to 44 Years | 0 (0.0%) | 0 (0.0%) |
| 45 to 54 Years | 0 (0.0%) | 34 (60.7%) |
| 55 to 64 Years | 22 (29.7%) | 28 (19.1%) |
| 65 to 74 Years | 21 (30.9%) | 13 (13.8%) |
| 75 Years and over | 0 (0.0%) | 38 (88.4%) |
| Total | 117 (17.4%) | 140 (16.8%) |
Income Above Poverty by Sex and Age in Sharpsburg
According to the poverty statistics in Sharpsburg, males aged 6 to 11 years and females aged under 5 years are the age groups that are most secure financially, with 100.0% of males and 100.0% of females in these age groups living above the poverty line.
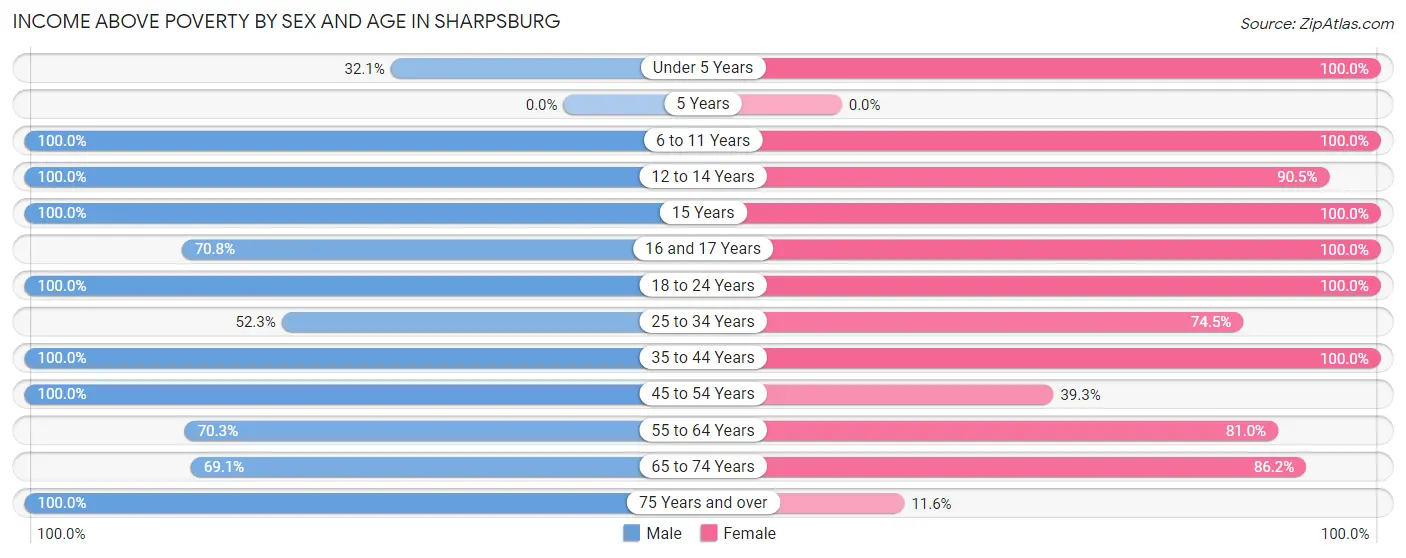
| Age Bracket | Male | Female |
| Under 5 Years | 17 (32.1%) | 143 (100.0%) |
| 5 Years | 0 (0.0%) | 0 (0.0%) |
| 6 to 11 Years | 83 (100.0%) | 47 (100.0%) |
| 12 to 14 Years | 21 (100.0%) | 19 (90.5%) |
| 15 Years | 16 (100.0%) | 21 (100.0%) |
| 16 and 17 Years | 17 (70.8%) | 15 (100.0%) |
| 18 to 24 Years | 55 (100.0%) | 26 (100.0%) |
| 25 to 34 Years | 34 (52.3%) | 73 (74.5%) |
| 35 to 44 Years | 90 (100.0%) | 121 (100.0%) |
| 45 to 54 Years | 65 (100.0%) | 22 (39.3%) |
| 55 to 64 Years | 52 (70.3%) | 119 (80.9%) |
| 65 to 74 Years | 47 (69.1%) | 81 (86.2%) |
| 75 Years and over | 58 (100.0%) | 5 (11.6%) |
| Total | 555 (82.6%) | 692 (83.2%) |
Income Below Poverty Among Married-Couple Families in Sharpsburg
The poverty statistics for married-couple families in Sharpsburg show that 1.4% or 2 of the total 139 families live below the poverty line. Families with no children have the highest poverty rate of 2.1%, comprising of 2 families. On the other hand, families with 1 or 2 children have the lowest poverty rate of 0.0%, which includes 0 families.
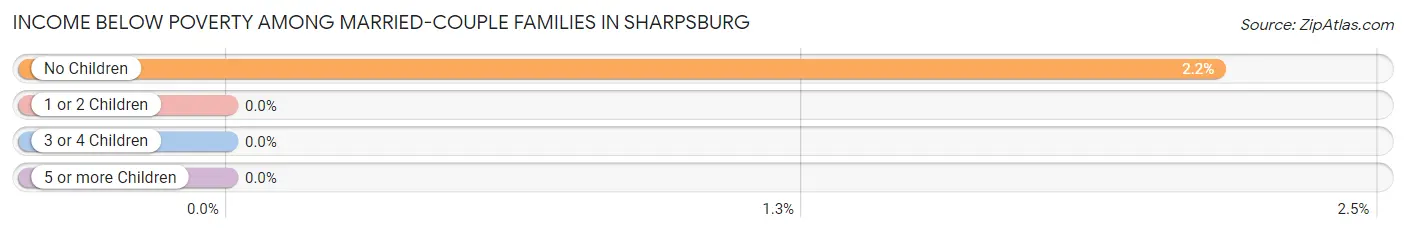
| Children | Above Poverty | Below Poverty |
| No Children | 91 (97.9%) | 2 (2.1%) |
| 1 or 2 Children | 31 (100.0%) | 0 (0.0%) |
| 3 or 4 Children | 0 (0.0%) | 0 (0.0%) |
| 5 or more Children | 15 (100.0%) | 0 (0.0%) |
| Total | 137 (98.6%) | 2 (1.4%) |
Income Below Poverty Among Single-Parent Households in Sharpsburg
According to the poverty data in Sharpsburg, 46.3% or 31 single-father households and 8.0% or 13 single-mother households are living below the poverty line. Among single-father households, those with 1 or 2 children have the highest poverty rate, with 31 households (46.3%) experiencing poverty. Likewise, among single-mother households, those with no children have the highest poverty rate, with 9 households (12.9%) falling below the poverty line.
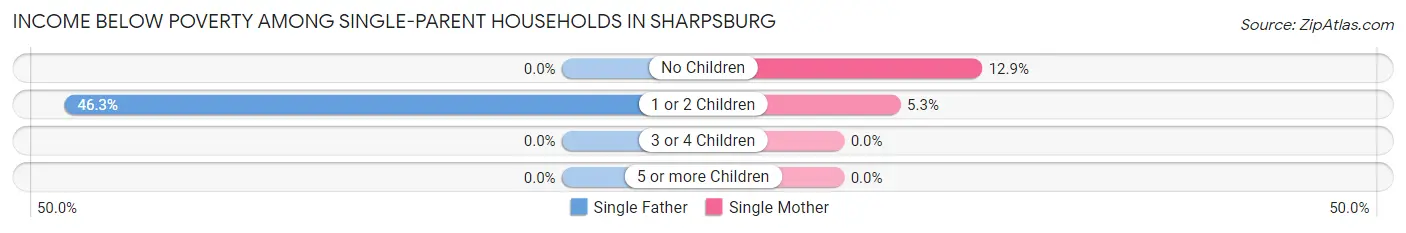
| Children | Single Father | Single Mother |
| No Children | 0 (0.0%) | 9 (12.9%) |
| 1 or 2 Children | 31 (46.3%) | 4 (5.3%) |
| 3 or 4 Children | 0 (0.0%) | 0 (0.0%) |
| 5 or more Children | 0 (0.0%) | 0 (0.0%) |
| Total | 31 (46.3%) | 13 (8.0%) |
Income Below Poverty Among Married-Couple vs Single-Parent Households in Sharpsburg
The poverty data for Sharpsburg shows that 2 of the married-couple family households (1.4%) and 44 of the single-parent households (19.1%) are living below the poverty level. Within the married-couple family households, those with no children have the highest poverty rate, with 2 households (2.1%) falling below the poverty line. Among the single-parent households, those with 1 or 2 children have the highest poverty rate, with 35 household (24.5%) living below poverty.
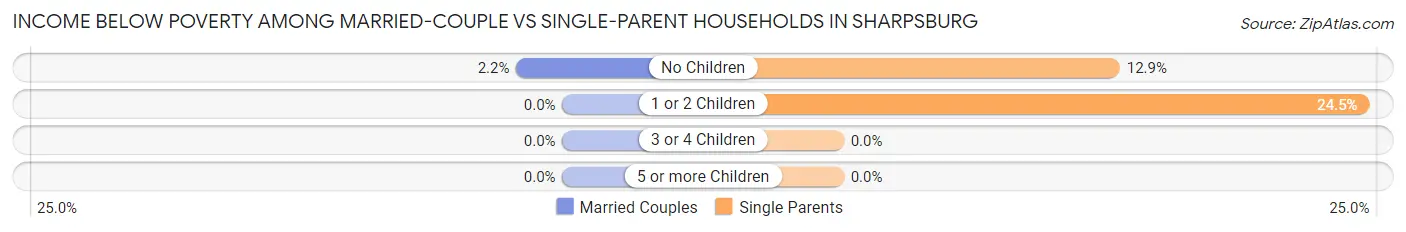
| Children | Married-Couple Families | Single-Parent Households |
| No Children | 2 (2.1%) | 9 (12.9%) |
| 1 or 2 Children | 0 (0.0%) | 35 (24.5%) |
| 3 or 4 Children | 0 (0.0%) | 0 (0.0%) |
| 5 or more Children | 0 (0.0%) | 0 (0.0%) |
| Total | 2 (1.4%) | 44 (19.1%) |
Employment Characteristics in Sharpsburg
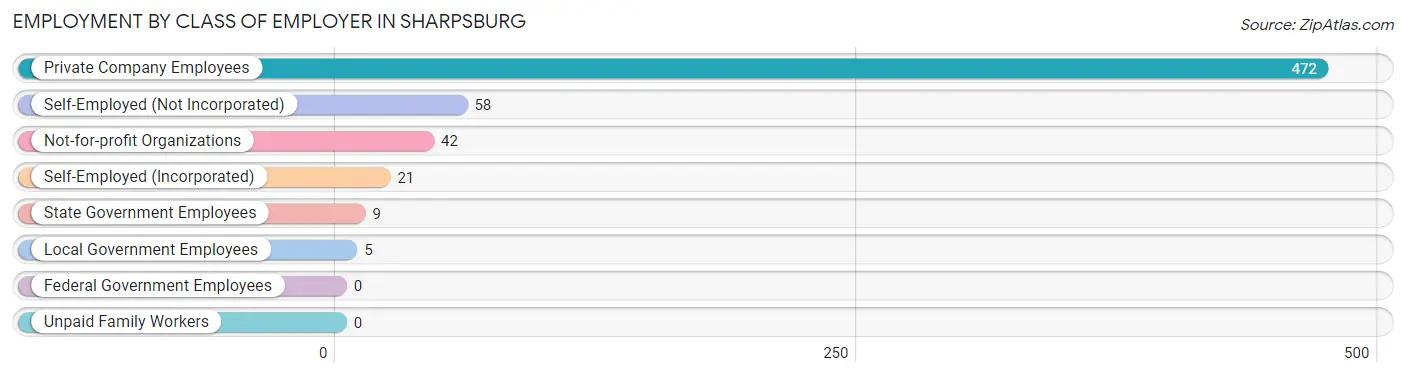
Employment by Class of Employer in Sharpsburg
Among the 607 employed individuals in Sharpsburg, private company employees (472 | 77.8%), self-employed (not incorporated) (58 | 9.6%), and not-for-profit organizations (42 | 6.9%) make up the most common classes of employment.
| Employer Class | # Employees | % Employees |
| Private Company Employees | 472 | 77.8% |
| Self-Employed (Incorporated) | 21 | 3.5% |
| Self-Employed (Not Incorporated) | 58 | 9.6% |
| Not-for-profit Organizations | 42 | 6.9% |
| Local Government Employees | 5 | 0.8% |
| State Government Employees | 9 | 1.5% |
| Federal Government Employees | 0 | 0.0% |
| Unpaid Family Workers | 0 | 0.0% |
| Total | 607 | 100.0% |
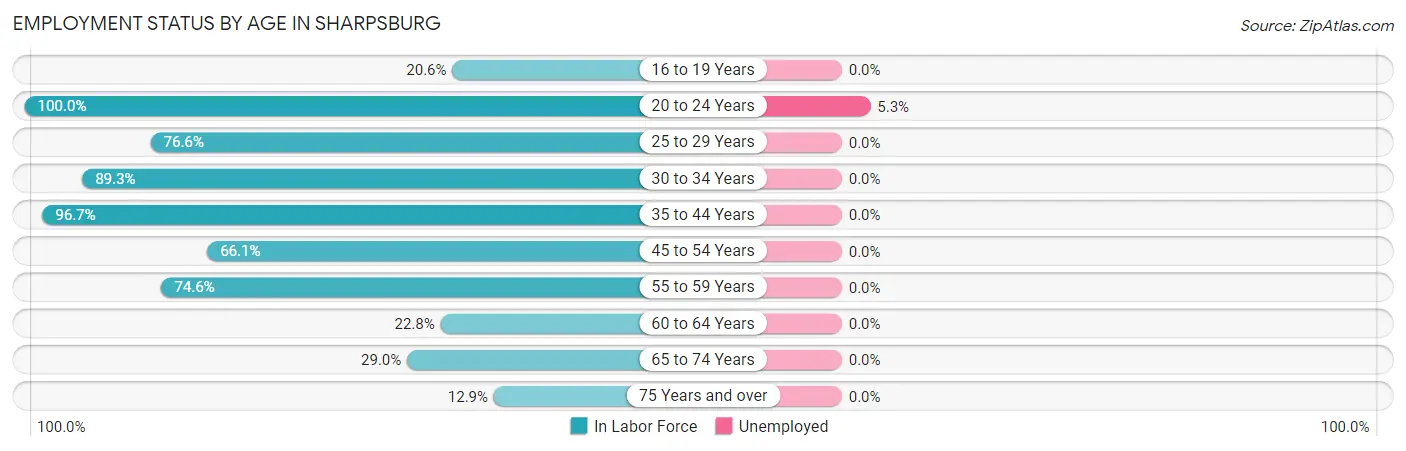
Employment Status by Age in Sharpsburg
According to the labor force statistics for Sharpsburg, out of the total population over 16 years of age (1,099), 57.1% or 628 individuals are in the labor force, with 0.5% or 3 of them unemployed. The age group with the highest labor force participation rate is 20 to 24 years, with 100.0% or 57 individuals in the labor force. Within the labor force, the 20 to 24 years age range has the highest percentage of unemployed individuals, with 5.3% or 3 of them being unemployed.
| Age Bracket | In Labor Force | Unemployed |
| 16 to 19 Years | 13 (20.6%) | 0 (0.0%) |
| 20 to 24 Years | 57 (100.0%) | 3 (5.3%) |
| 25 to 29 Years | 82 (76.6%) | 0 (0.0%) |
| 30 to 34 Years | 50 (89.3%) | 0 (0.0%) |
| 35 to 44 Years | 204 (96.7%) | 0 (0.0%) |
| 45 to 54 Years | 80 (66.1%) | 0 (0.0%) |
| 55 to 59 Years | 44 (74.6%) | 0 (0.0%) |
| 60 to 64 Years | 37 (22.8%) | 0 (0.0%) |
| 65 to 74 Years | 47 (29.0%) | 0 (0.0%) |
| 75 Years and over | 13 (12.9%) | 0 (0.0%) |
| Total | 628 (57.1%) | 3 (0.5%) |
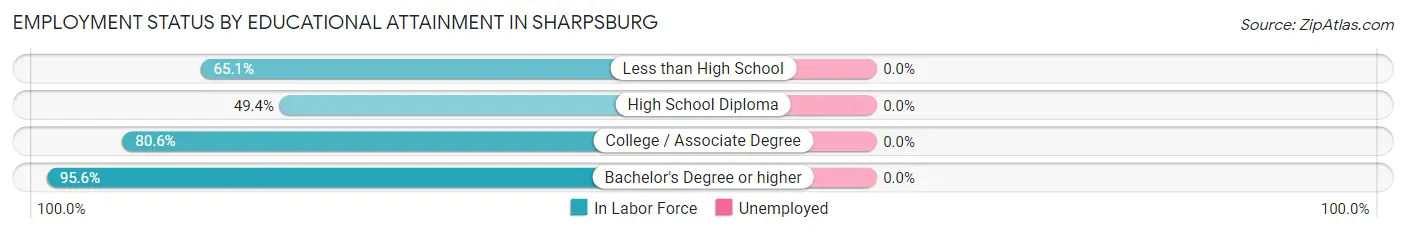
Employment Status by Educational Attainment in Sharpsburg
| Educational Attainment | In Labor Force | Unemployed |
| Less than High School | 99 (65.1%) | 0 (0.0%) |
| High School Diploma | 116 (49.4%) | 0 (0.0%) |
| College / Associate Degree | 174 (80.6%) | 0 (0.0%) |
| Bachelor's Degree or higher | 108 (95.6%) | 0 (0.0%) |
| Total | 497 (69.4%) | 0 (0.0%) |
Employment Occupations by Sex in Sharpsburg
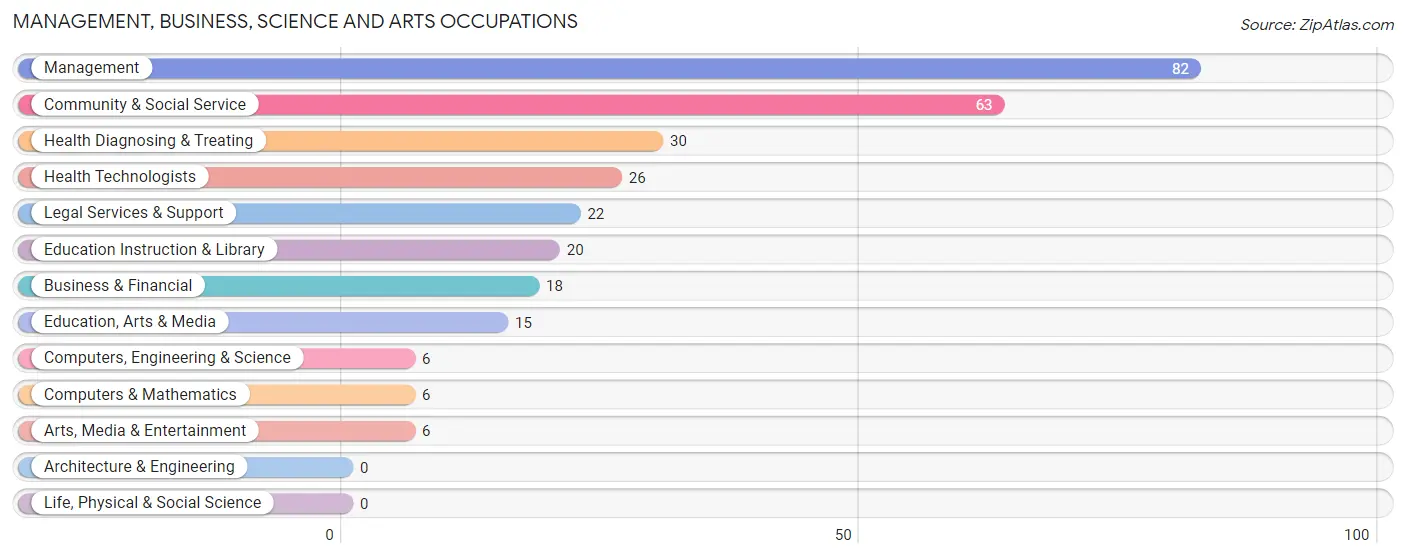
Management, Business, Science and Arts Occupations
The most common Management, Business, Science and Arts occupations in Sharpsburg are Management (82 | 13.1%), Community & Social Service (63 | 10.1%), Health Diagnosing & Treating (30 | 4.8%), Health Technologists (26 | 4.2%), and Legal Services & Support (22 | 3.5%).
Management, Business, Science and Arts Occupations by Sex
Within the Management, Business, Science and Arts occupations in Sharpsburg, the most male-oriented occupations are Computers, Engineering & Science (100.0%), Computers & Mathematics (100.0%), and Legal Services & Support (100.0%), while the most female-oriented occupations are Business & Financial (100.0%), Education, Arts & Media (100.0%), and Health Diagnosing & Treating (100.0%).
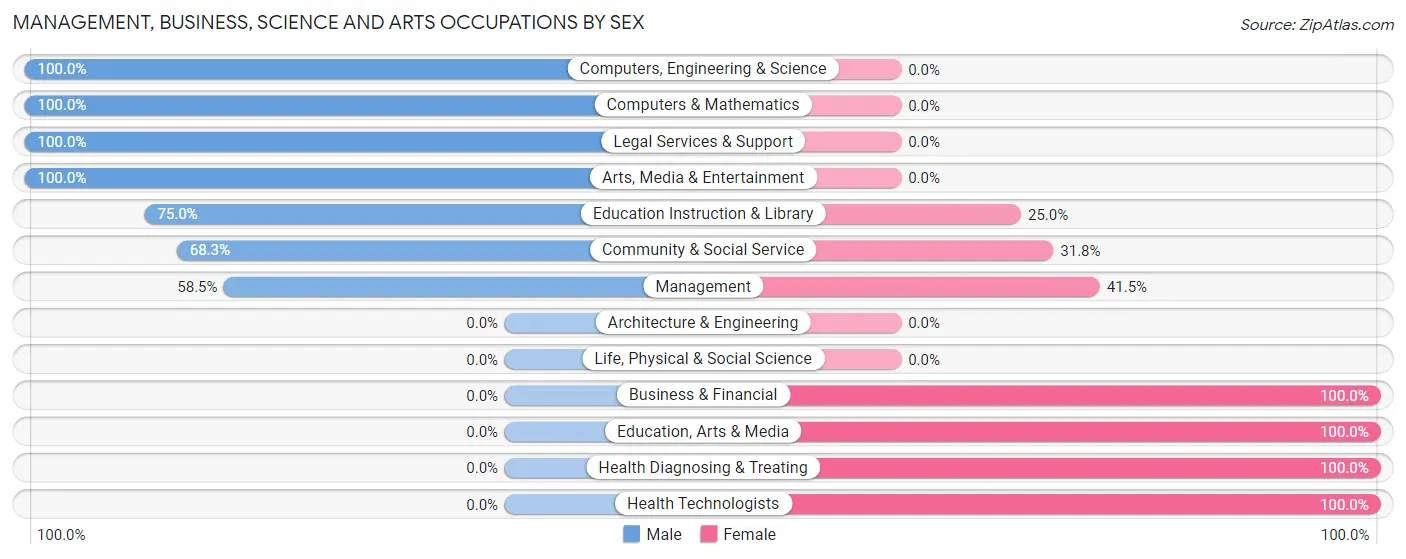
| Occupation | Male | Female |
| Management | 48 (58.5%) | 34 (41.5%) |
| Business & Financial | 0 (0.0%) | 18 (100.0%) |
| Computers, Engineering & Science | 6 (100.0%) | 0 (0.0%) |
| Computers & Mathematics | 6 (100.0%) | 0 (0.0%) |
| Architecture & Engineering | 0 (0.0%) | 0 (0.0%) |
| Life, Physical & Social Science | 0 (0.0%) | 0 (0.0%) |
| Community & Social Service | 43 (68.2%) | 20 (31.8%) |
| Education, Arts & Media | 0 (0.0%) | 15 (100.0%) |
| Legal Services & Support | 22 (100.0%) | 0 (0.0%) |
| Education Instruction & Library | 15 (75.0%) | 5 (25.0%) |
| Arts, Media & Entertainment | 6 (100.0%) | 0 (0.0%) |
| Health Diagnosing & Treating | 0 (0.0%) | 30 (100.0%) |
| Health Technologists | 0 (0.0%) | 26 (100.0%) |
| Total (Category) | 97 (48.7%) | 102 (51.3%) |
| Total (Overall) | 290 (46.5%) | 334 (53.5%) |
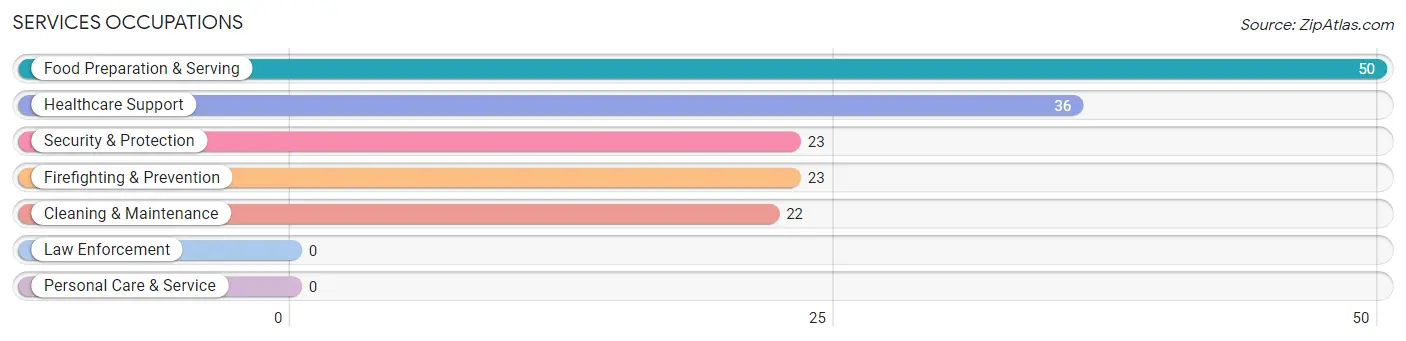
Services Occupations
The most common Services occupations in Sharpsburg are Food Preparation & Serving (50 | 8.0%), Healthcare Support (36 | 5.8%), Security & Protection (23 | 3.7%), Firefighting & Prevention (23 | 3.7%), and Cleaning & Maintenance (22 | 3.5%).
Services Occupations by Sex
Within the Services occupations in Sharpsburg, the most male-oriented occupations are Food Preparation & Serving (32.0%), and Cleaning & Maintenance (18.2%), while the most female-oriented occupations are Healthcare Support (100.0%), Security & Protection (100.0%), and Firefighting & Prevention (100.0%).
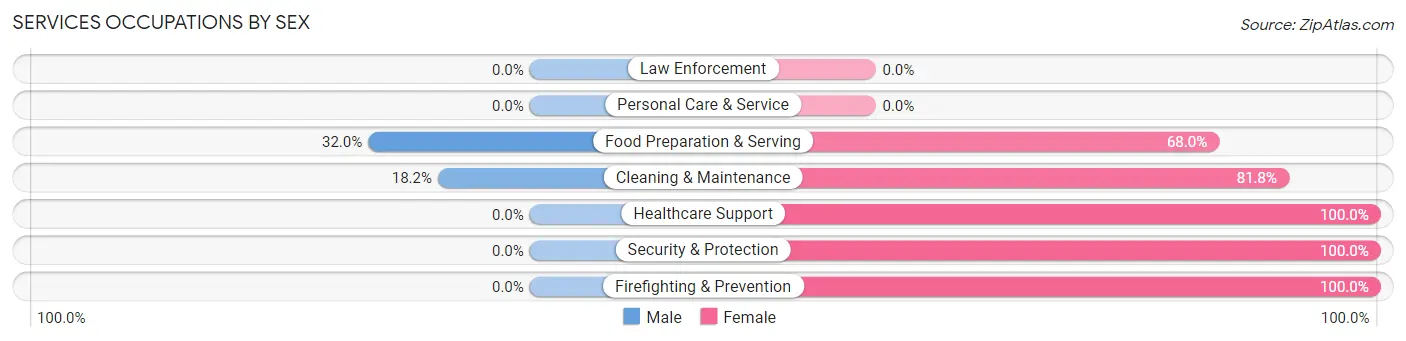
| Occupation | Male | Female |
| Healthcare Support | 0 (0.0%) | 36 (100.0%) |
| Security & Protection | 0 (0.0%) | 23 (100.0%) |
| Firefighting & Prevention | 0 (0.0%) | 23 (100.0%) |
| Law Enforcement | 0 (0.0%) | 0 (0.0%) |
| Food Preparation & Serving | 16 (32.0%) | 34 (68.0%) |
| Cleaning & Maintenance | 4 (18.2%) | 18 (81.8%) |
| Personal Care & Service | 0 (0.0%) | 0 (0.0%) |
| Total (Category) | 20 (15.3%) | 111 (84.7%) |
| Total (Overall) | 290 (46.5%) | 334 (53.5%) |
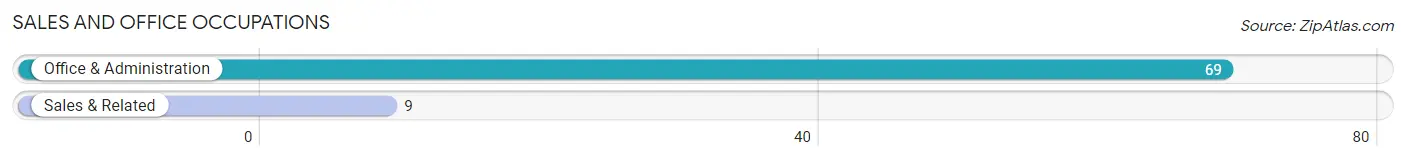
Sales and Office Occupations
The most common Sales and Office occupations in Sharpsburg are Office & Administration (69 | 11.1%), and Sales & Related (9 | 1.4%).
Sales and Office Occupations by Sex
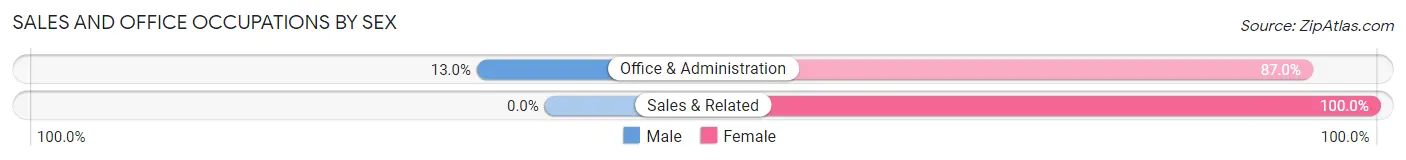
| Occupation | Male | Female |
| Sales & Related | 0 (0.0%) | 9 (100.0%) |
| Office & Administration | 9 (13.0%) | 60 (87.0%) |
| Total (Category) | 9 (11.5%) | 69 (88.5%) |
| Total (Overall) | 290 (46.5%) | 334 (53.5%) |
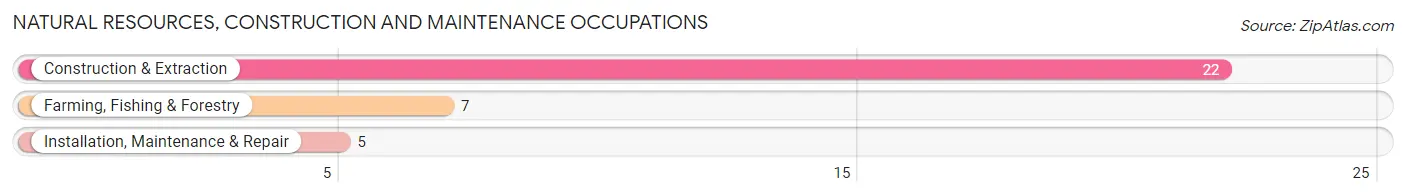
Natural Resources, Construction and Maintenance Occupations
The most common Natural Resources, Construction and Maintenance occupations in Sharpsburg are Construction & Extraction (22 | 3.5%), Farming, Fishing & Forestry (7 | 1.1%), and Installation, Maintenance & Repair (5 | 0.8%).
Natural Resources, Construction and Maintenance Occupations by Sex
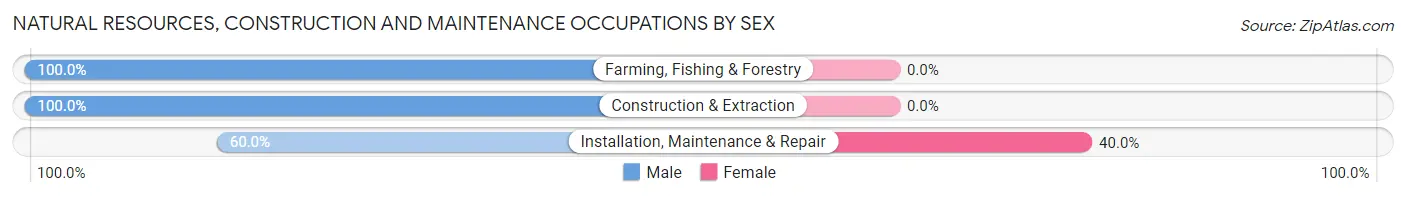
| Occupation | Male | Female |
| Farming, Fishing & Forestry | 7 (100.0%) | 0 (0.0%) |
| Construction & Extraction | 22 (100.0%) | 0 (0.0%) |
| Installation, Maintenance & Repair | 3 (60.0%) | 2 (40.0%) |
| Total (Category) | 32 (94.1%) | 2 (5.9%) |
| Total (Overall) | 290 (46.5%) | 334 (53.5%) |
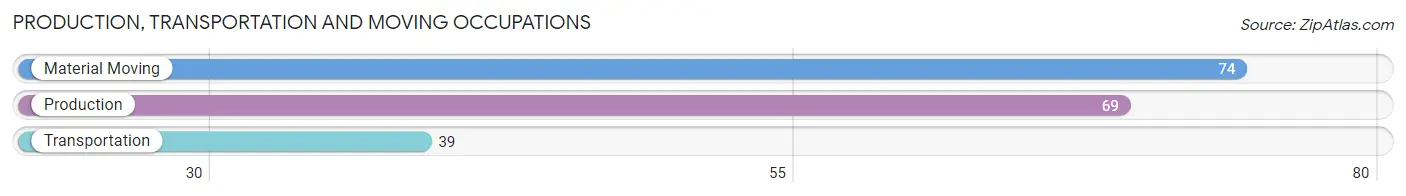
Production, Transportation and Moving Occupations
The most common Production, Transportation and Moving occupations in Sharpsburg are Material Moving (74 | 11.9%), Production (69 | 11.1%), and Transportation (39 | 6.2%).
Production, Transportation and Moving Occupations by Sex
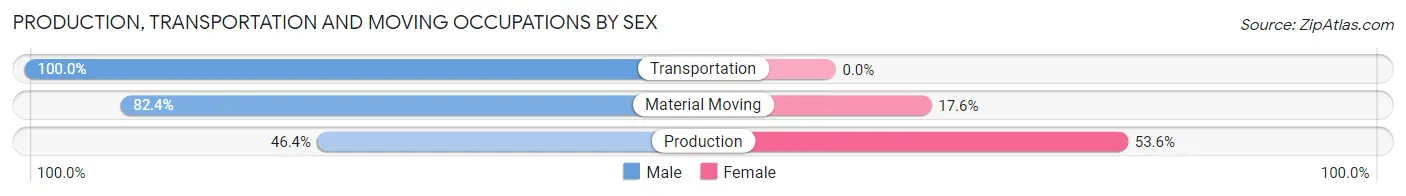
| Occupation | Male | Female |
| Production | 32 (46.4%) | 37 (53.6%) |
| Transportation | 39 (100.0%) | 0 (0.0%) |
| Material Moving | 61 (82.4%) | 13 (17.6%) |
| Total (Category) | 132 (72.5%) | 50 (27.5%) |
| Total (Overall) | 290 (46.5%) | 334 (53.5%) |
Employment Industries by Sex in Sharpsburg
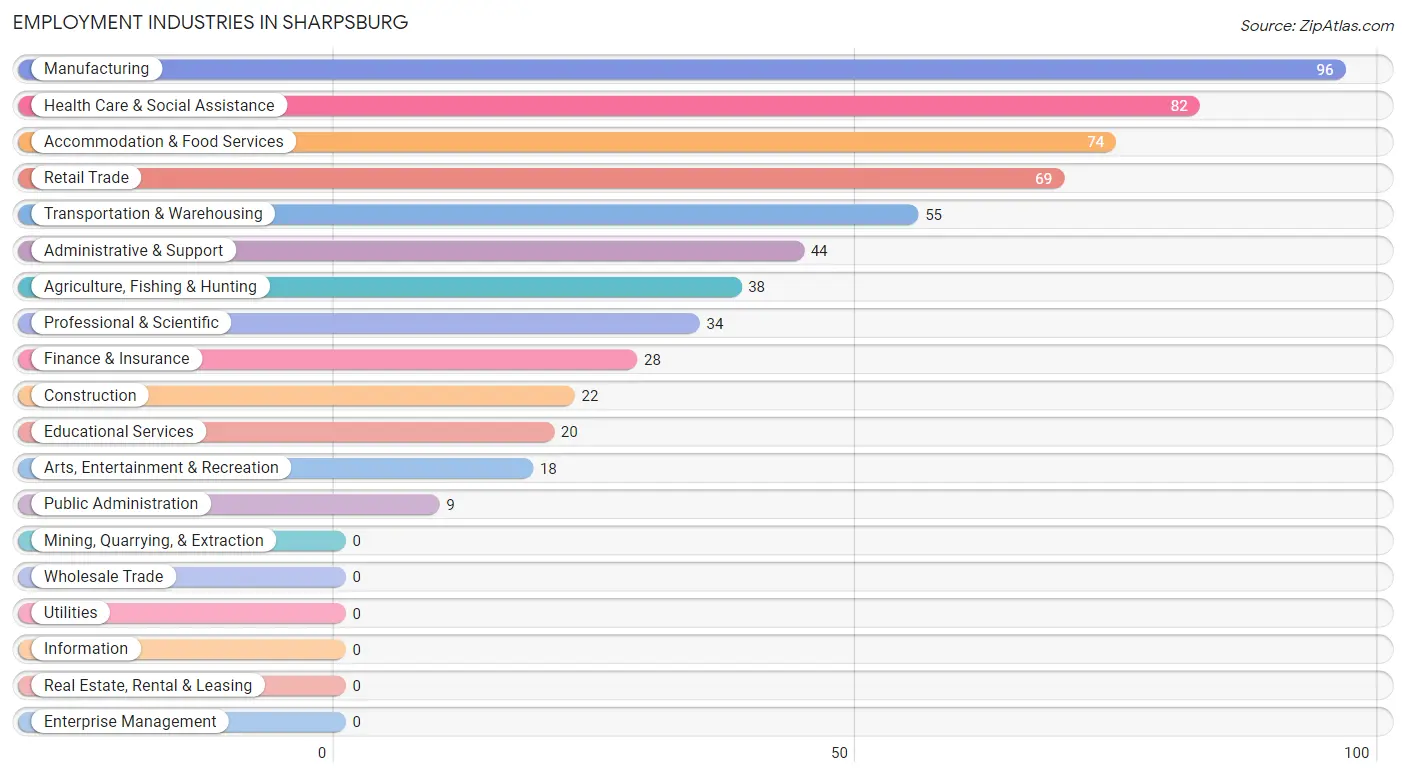
Employment Industries in Sharpsburg
The major employment industries in Sharpsburg include Manufacturing (96 | 15.4%), Health Care & Social Assistance (82 | 13.1%), Accommodation & Food Services (74 | 11.9%), Retail Trade (69 | 11.1%), and Transportation & Warehousing (55 | 8.8%).
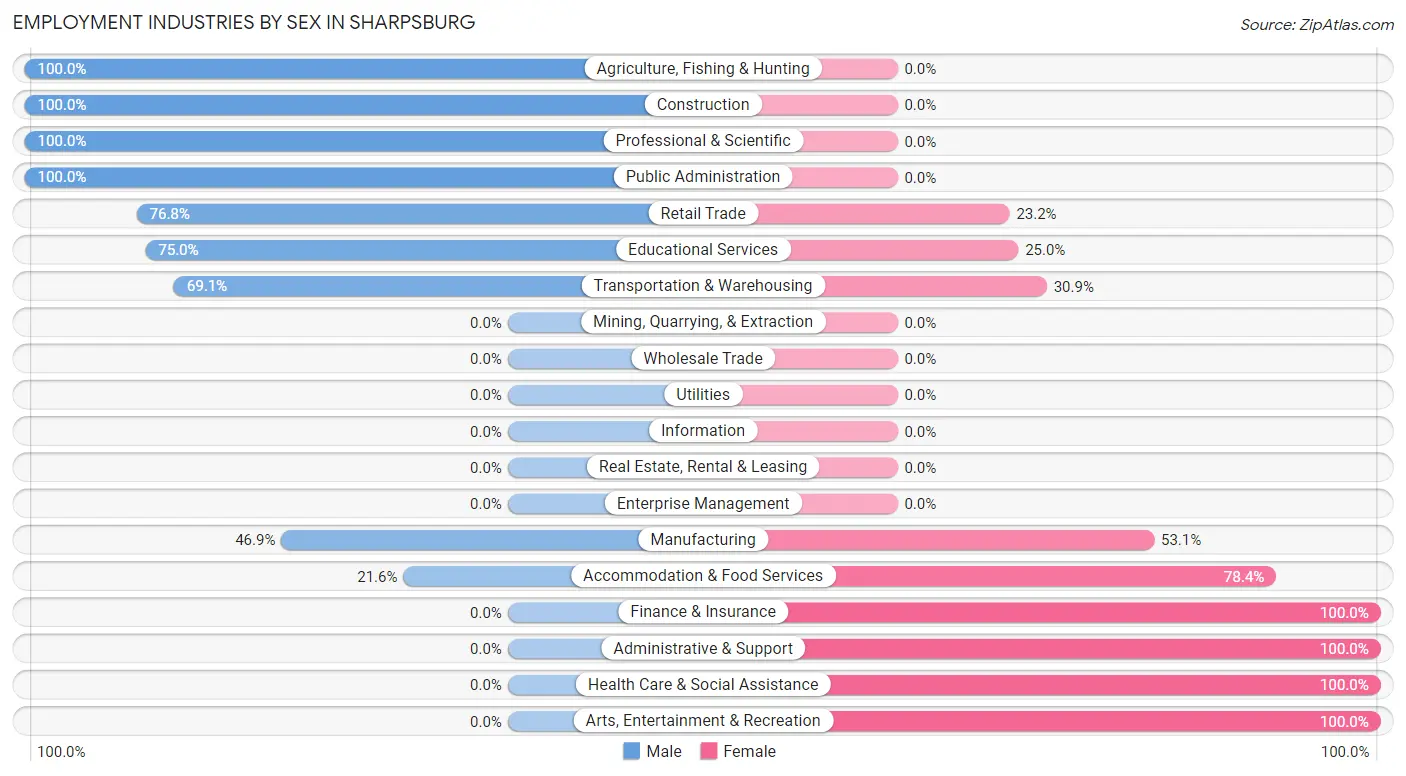
Employment Industries by Sex in Sharpsburg
The Sharpsburg industries that see more men than women are Agriculture, Fishing & Hunting (100.0%), Construction (100.0%), and Professional & Scientific (100.0%), whereas the industries that tend to have a higher number of women are Finance & Insurance (100.0%), Administrative & Support (100.0%), and Health Care & Social Assistance (100.0%).
| Industry | Male | Female |
| Agriculture, Fishing & Hunting | 38 (100.0%) | 0 (0.0%) |
| Mining, Quarrying, & Extraction | 0 (0.0%) | 0 (0.0%) |
| Construction | 22 (100.0%) | 0 (0.0%) |
| Manufacturing | 45 (46.9%) | 51 (53.1%) |
| Wholesale Trade | 0 (0.0%) | 0 (0.0%) |
| Retail Trade | 53 (76.8%) | 16 (23.2%) |
| Transportation & Warehousing | 38 (69.1%) | 17 (30.9%) |
| Utilities | 0 (0.0%) | 0 (0.0%) |
| Information | 0 (0.0%) | 0 (0.0%) |
| Finance & Insurance | 0 (0.0%) | 28 (100.0%) |
| Real Estate, Rental & Leasing | 0 (0.0%) | 0 (0.0%) |
| Professional & Scientific | 34 (100.0%) | 0 (0.0%) |
| Enterprise Management | 0 (0.0%) | 0 (0.0%) |
| Administrative & Support | 0 (0.0%) | 44 (100.0%) |
| Educational Services | 15 (75.0%) | 5 (25.0%) |
| Health Care & Social Assistance | 0 (0.0%) | 82 (100.0%) |
| Arts, Entertainment & Recreation | 0 (0.0%) | 18 (100.0%) |
| Accommodation & Food Services | 16 (21.6%) | 58 (78.4%) |
| Public Administration | 9 (100.0%) | 0 (0.0%) |
| Total | 290 (46.5%) | 334 (53.5%) |
Education in Sharpsburg
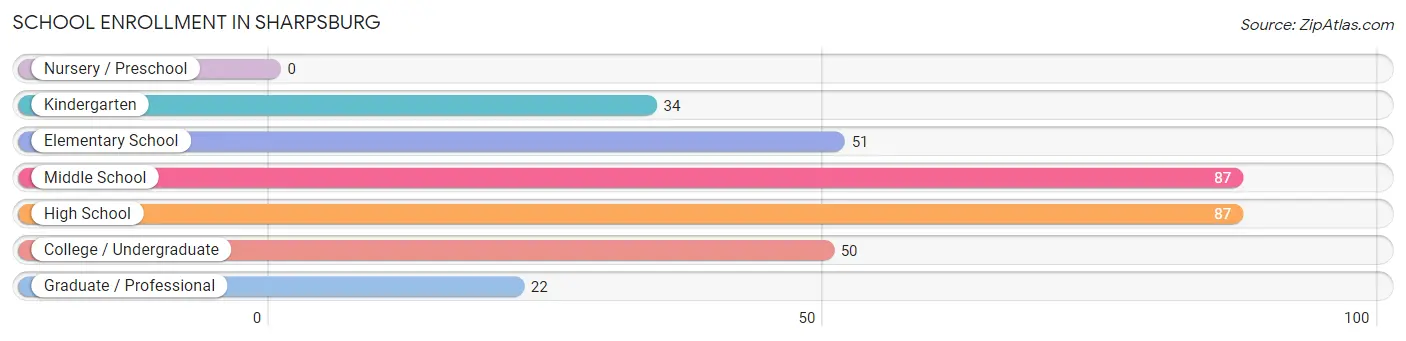
School Enrollment in Sharpsburg
The most common levels of schooling among the 331 students in Sharpsburg are middle school (87 | 26.3%), high school (87 | 26.3%), and elementary school (51 | 15.4%).
| School Level | # Students | % Students |
| Nursery / Preschool | 0 | 0.0% |
| Kindergarten | 34 | 10.3% |
| Elementary School | 51 | 15.4% |
| Middle School | 87 | 26.3% |
| High School | 87 | 26.3% |
| College / Undergraduate | 50 | 15.1% |
| Graduate / Professional | 22 | 6.7% |
| Total | 331 | 100.0% |
School Enrollment by Age by Funding Source in Sharpsburg
Out of a total of 331 students who are enrolled in schools in Sharpsburg, 17 (5.1%) attend a private institution, while the remaining 314 (94.9%) are enrolled in public schools. The age group of 10 to 14 year olds has the highest likelihood of being enrolled in private schools, with 17 (19.5% in the age bracket) enrolled. Conversely, the age group of 5 to 9 year old has the lowest likelihood of being enrolled in a private school, with 85 (100.0% in the age bracket) attending a public institution.
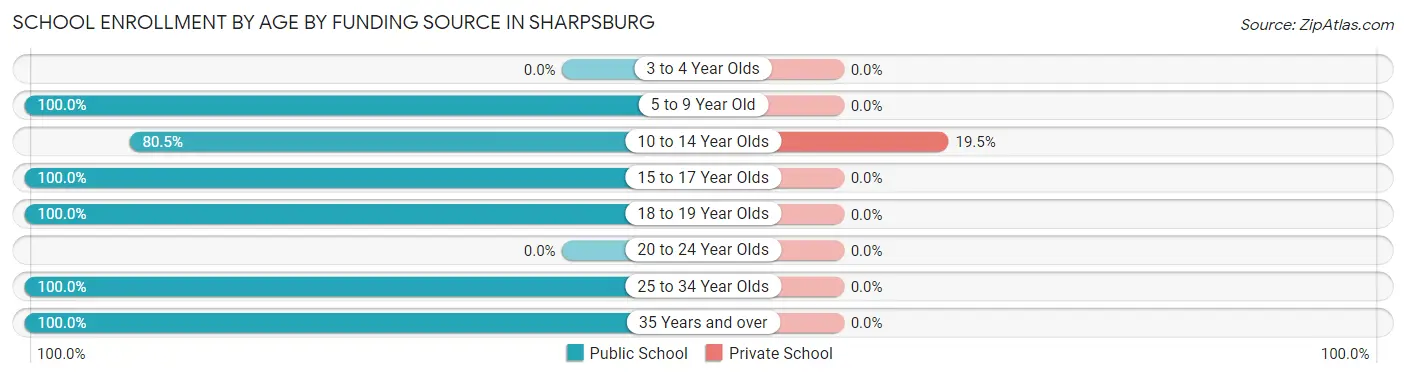
| Age Bracket | Public School | Private School |
| 3 to 4 Year Olds | 0 (0.0%) | 0 (0.0%) |
| 5 to 9 Year Old | 85 (100.0%) | 0 (0.0%) |
| 10 to 14 Year Olds | 70 (80.5%) | 17 (19.5%) |
| 15 to 17 Year Olds | 69 (100.0%) | 0 (0.0%) |
| 18 to 19 Year Olds | 18 (100.0%) | 0 (0.0%) |
| 20 to 24 Year Olds | 0 (0.0%) | 0 (0.0%) |
| 25 to 34 Year Olds | 39 (100.0%) | 0 (0.0%) |
| 35 Years and over | 33 (100.0%) | 0 (0.0%) |
| Total | 314 (94.9%) | 17 (5.1%) |
Educational Attainment by Field of Study in Sharpsburg
Arts & humanities (37 | 27.2%), bio, nature & agricultural (31 | 22.8%), education (30 | 22.1%), liberal arts & history (15 | 11.0%), and business (13 | 9.6%) are the most common fields of study among 136 individuals in Sharpsburg who have obtained a bachelor's degree or higher.
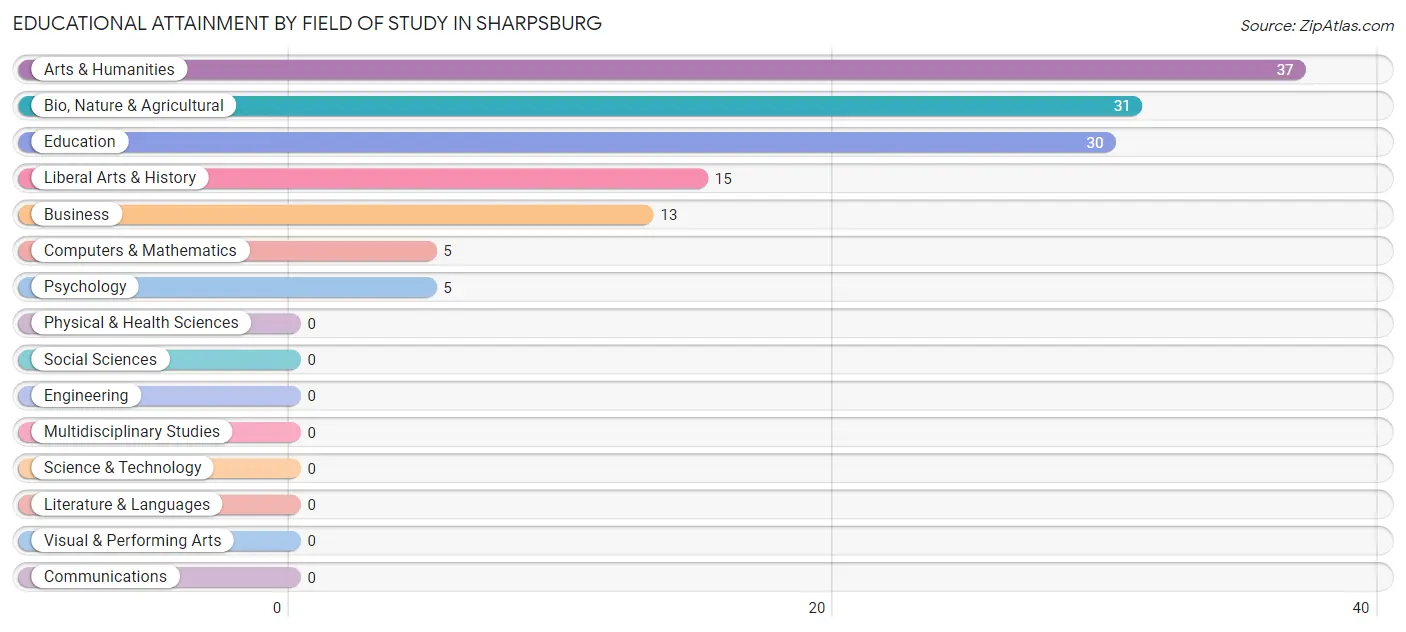
| Field of Study | # Graduates | % Graduates |
| Computers & Mathematics | 5 | 3.7% |
| Bio, Nature & Agricultural | 31 | 22.8% |
| Physical & Health Sciences | 0 | 0.0% |
| Psychology | 5 | 3.7% |
| Social Sciences | 0 | 0.0% |
| Engineering | 0 | 0.0% |
| Multidisciplinary Studies | 0 | 0.0% |
| Science & Technology | 0 | 0.0% |
| Business | 13 | 9.6% |
| Education | 30 | 22.1% |
| Literature & Languages | 0 | 0.0% |
| Liberal Arts & History | 15 | 11.0% |
| Visual & Performing Arts | 0 | 0.0% |
| Communications | 0 | 0.0% |
| Arts & Humanities | 37 | 27.2% |
| Total | 136 | 100.0% |
Transportation & Commute in Sharpsburg
Vehicle Availability by Sex in Sharpsburg
The most prevalent vehicle ownership categories in Sharpsburg are males with 2 vehicles (135, accounting for 46.6%) and females with 2 vehicles (169, making up 42.6%).
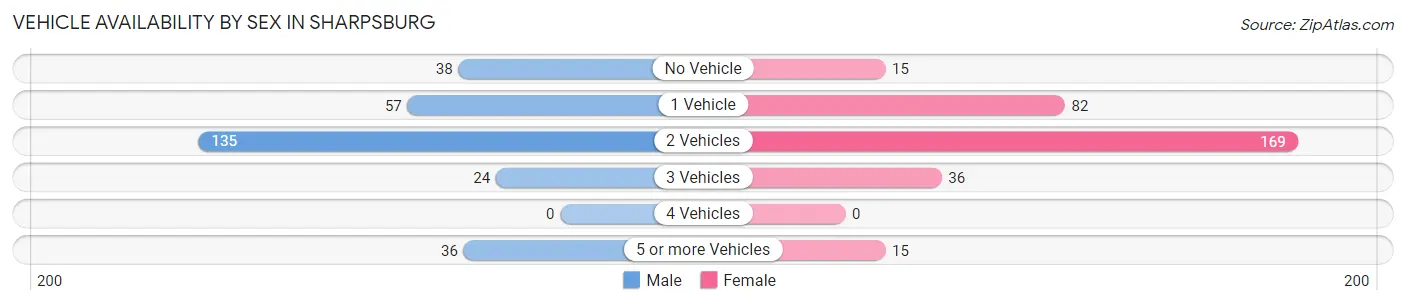
| Vehicles Available | Male | Female |
| No Vehicle | 38 (13.1%) | 15 (4.7%) |
| 1 Vehicle | 57 (19.7%) | 82 (25.9%) |
| 2 Vehicles | 135 (46.6%) | 169 (53.3%) |
| 3 Vehicles | 24 (8.3%) | 36 (11.4%) |
| 4 Vehicles | 0 (0.0%) | 0 (0.0%) |
| 5 or more Vehicles | 36 (12.4%) | 15 (4.7%) |
| Total | 290 (100.0%) | 317 (100.0%) |
Commute Time in Sharpsburg
The most frequently occuring commute durations in Sharpsburg are 30 to 34 minutes (150 commuters, 27.0%), 20 to 24 minutes (98 commuters, 17.6%), and 60 to 89 minutes (81 commuters, 14.6%).
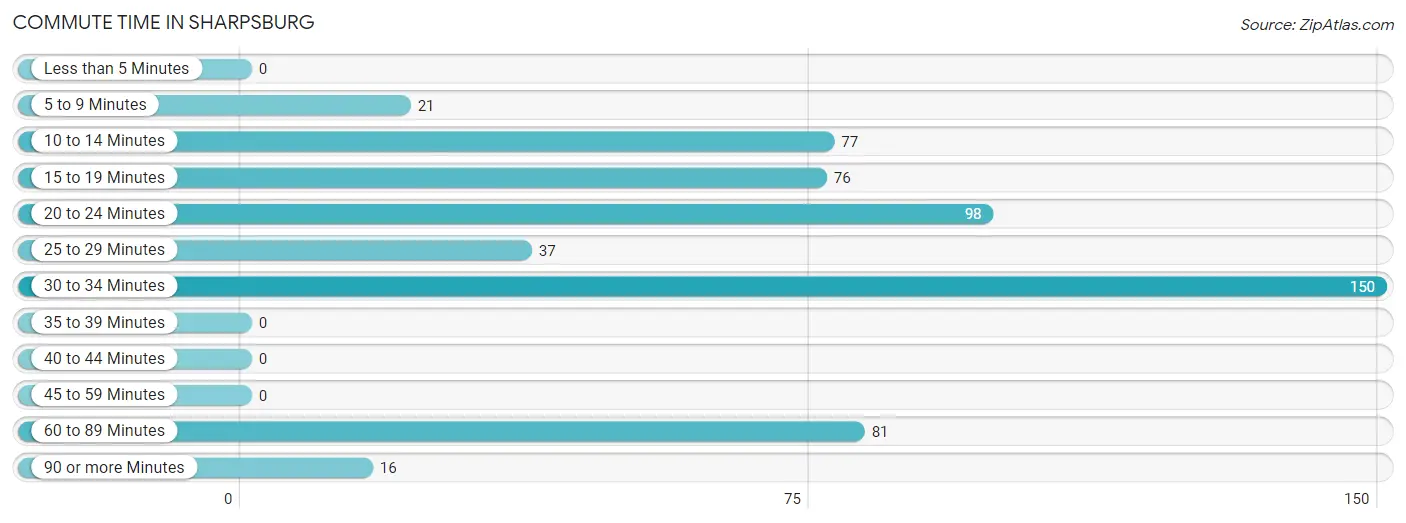
| Commute Time | # Commuters | % Commuters |
| Less than 5 Minutes | 0 | 0.0% |
| 5 to 9 Minutes | 21 | 3.8% |
| 10 to 14 Minutes | 77 | 13.9% |
| 15 to 19 Minutes | 76 | 13.7% |
| 20 to 24 Minutes | 98 | 17.6% |
| 25 to 29 Minutes | 37 | 6.7% |
| 30 to 34 Minutes | 150 | 27.0% |
| 35 to 39 Minutes | 0 | 0.0% |
| 40 to 44 Minutes | 0 | 0.0% |
| 45 to 59 Minutes | 0 | 0.0% |
| 60 to 89 Minutes | 81 | 14.6% |
| 90 or more Minutes | 16 | 2.9% |
Commute Time by Sex in Sharpsburg
The most common commute times in Sharpsburg are 30 to 34 minutes (65 commuters, 23.5%) for males and 30 to 34 minutes (85 commuters, 30.4%) for females.
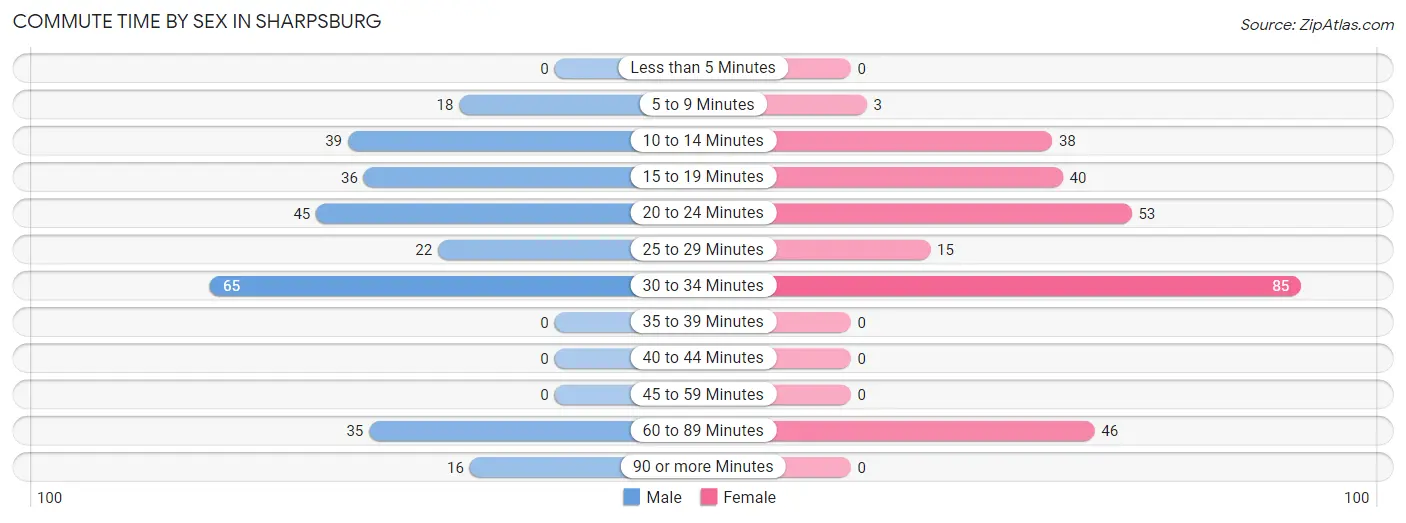
| Commute Time | Male | Female |
| Less than 5 Minutes | 0 (0.0%) | 0 (0.0%) |
| 5 to 9 Minutes | 18 (6.5%) | 3 (1.1%) |
| 10 to 14 Minutes | 39 (14.1%) | 38 (13.6%) |
| 15 to 19 Minutes | 36 (13.0%) | 40 (14.3%) |
| 20 to 24 Minutes | 45 (16.3%) | 53 (18.9%) |
| 25 to 29 Minutes | 22 (8.0%) | 15 (5.4%) |
| 30 to 34 Minutes | 65 (23.5%) | 85 (30.4%) |
| 35 to 39 Minutes | 0 (0.0%) | 0 (0.0%) |
| 40 to 44 Minutes | 0 (0.0%) | 0 (0.0%) |
| 45 to 59 Minutes | 0 (0.0%) | 0 (0.0%) |
| 60 to 89 Minutes | 35 (12.7%) | 46 (16.4%) |
| 90 or more Minutes | 16 (5.8%) | 0 (0.0%) |
Time of Departure to Work by Sex in Sharpsburg
The most frequent times of departure to work in Sharpsburg are 7:00 AM to 7:29 AM (53, 19.2%) for males and 7:30 AM to 7:59 AM (51, 18.2%) for females.
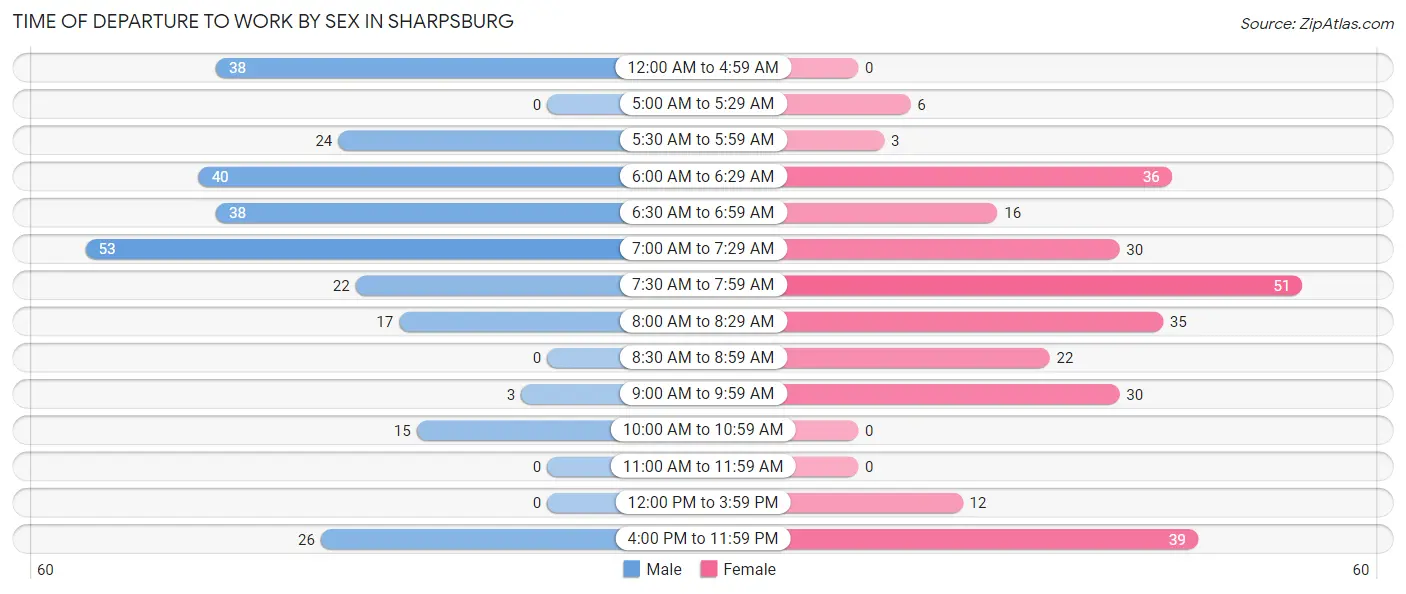
| Time of Departure | Male | Female |
| 12:00 AM to 4:59 AM | 38 (13.8%) | 0 (0.0%) |
| 5:00 AM to 5:29 AM | 0 (0.0%) | 6 (2.1%) |
| 5:30 AM to 5:59 AM | 24 (8.7%) | 3 (1.1%) |
| 6:00 AM to 6:29 AM | 40 (14.5%) | 36 (12.9%) |
| 6:30 AM to 6:59 AM | 38 (13.8%) | 16 (5.7%) |
| 7:00 AM to 7:29 AM | 53 (19.2%) | 30 (10.7%) |
| 7:30 AM to 7:59 AM | 22 (8.0%) | 51 (18.2%) |
| 8:00 AM to 8:29 AM | 17 (6.2%) | 35 (12.5%) |
| 8:30 AM to 8:59 AM | 0 (0.0%) | 22 (7.9%) |
| 9:00 AM to 9:59 AM | 3 (1.1%) | 30 (10.7%) |
| 10:00 AM to 10:59 AM | 15 (5.4%) | 0 (0.0%) |
| 11:00 AM to 11:59 AM | 0 (0.0%) | 0 (0.0%) |
| 12:00 PM to 3:59 PM | 0 (0.0%) | 12 (4.3%) |
| 4:00 PM to 11:59 PM | 26 (9.4%) | 39 (13.9%) |
| Total | 276 (100.0%) | 280 (100.0%) |
Housing Occupancy in Sharpsburg
Occupancy by Ownership in Sharpsburg
Of the total 632 dwellings in Sharpsburg, owner-occupied units account for 305 (48.3%), while renter-occupied units make up 327 (51.7%).
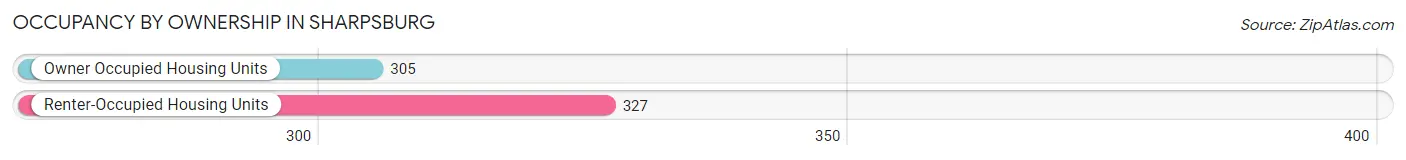
| Occupancy | # Housing Units | % Housing Units |
| Owner Occupied Housing Units | 305 | 48.3% |
| Renter-Occupied Housing Units | 327 | 51.7% |
| Total Occupied Housing Units | 632 | 100.0% |
Occupancy by Household Size in Sharpsburg
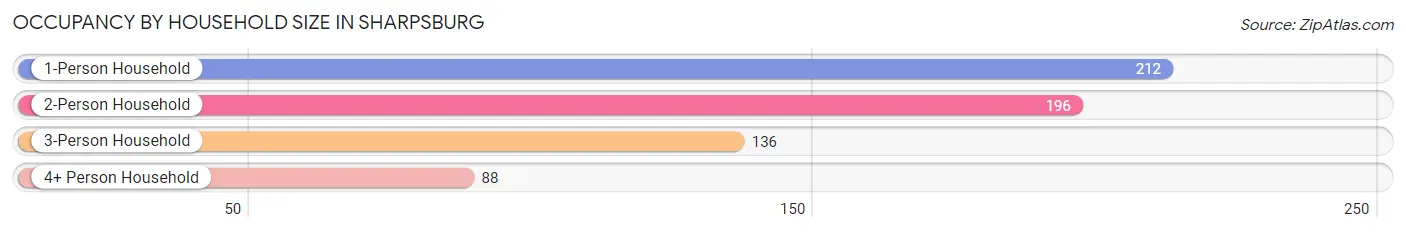
| Household Size | # Housing Units | % Housing Units |
| 1-Person Household | 212 | 33.5% |
| 2-Person Household | 196 | 31.0% |
| 3-Person Household | 136 | 21.5% |
| 4+ Person Household | 88 | 13.9% |
| Total Housing Units | 632 | 100.0% |
Occupancy by Ownership by Household Size in Sharpsburg
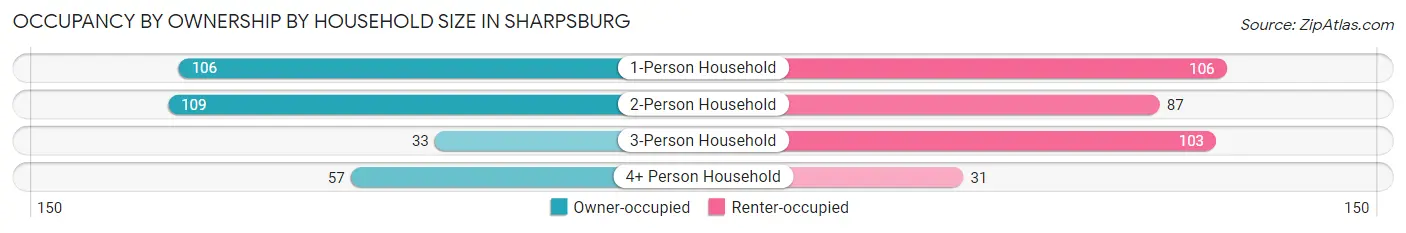
| Household Size | Owner-occupied | Renter-occupied |
| 1-Person Household | 106 (50.0%) | 106 (50.0%) |
| 2-Person Household | 109 (55.6%) | 87 (44.4%) |
| 3-Person Household | 33 (24.3%) | 103 (75.7%) |
| 4+ Person Household | 57 (64.8%) | 31 (35.2%) |
| Total Housing Units | 305 (48.3%) | 327 (51.7%) |
Occupancy by Educational Attainment in Sharpsburg
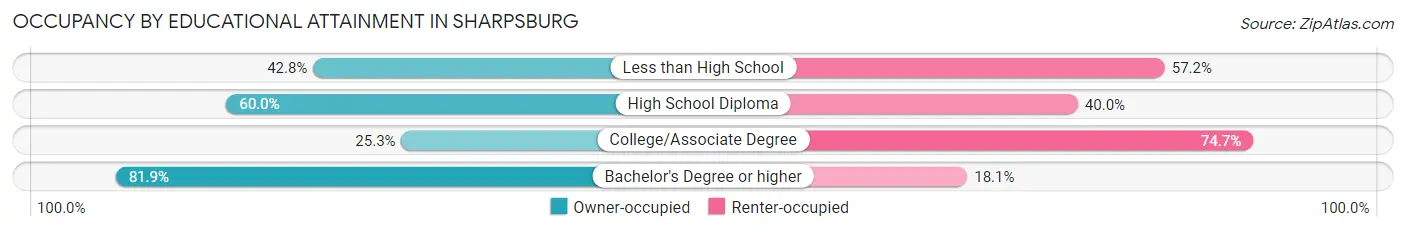
| Household Size | Owner-occupied | Renter-occupied |
| Less than High School | 83 (42.8%) | 111 (57.2%) |
| High School Diploma | 111 (60.0%) | 74 (40.0%) |
| College/Associate Degree | 43 (25.3%) | 127 (74.7%) |
| Bachelor's Degree or higher | 68 (81.9%) | 15 (18.1%) |
Occupancy by Age of Householder in Sharpsburg
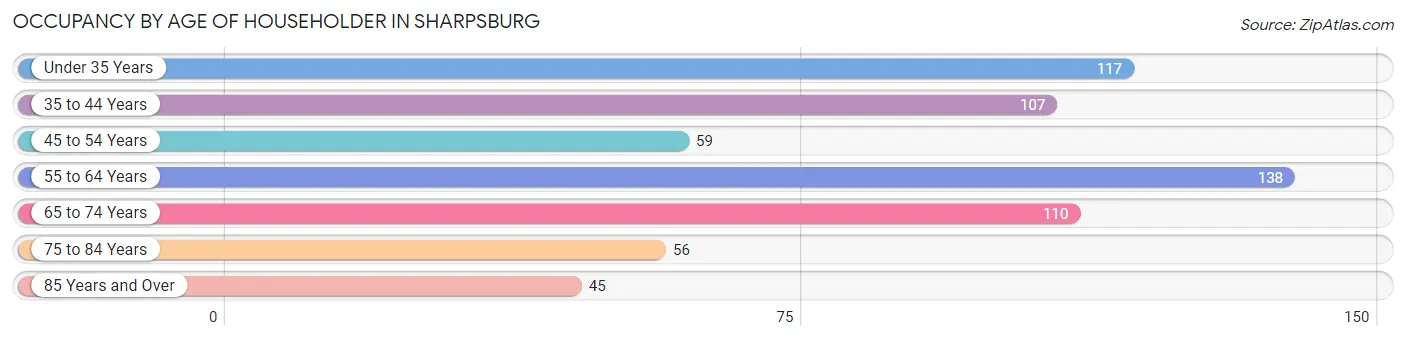
| Age Bracket | # Households | % Households |
| Under 35 Years | 117 | 18.5% |
| 35 to 44 Years | 107 | 16.9% |
| 45 to 54 Years | 59 | 9.3% |
| 55 to 64 Years | 138 | 21.8% |
| 65 to 74 Years | 110 | 17.4% |
| 75 to 84 Years | 56 | 8.9% |
| 85 Years and Over | 45 | 7.1% |
| Total | 632 | 100.0% |
Housing Finances in Sharpsburg
Median Income by Occupancy in Sharpsburg
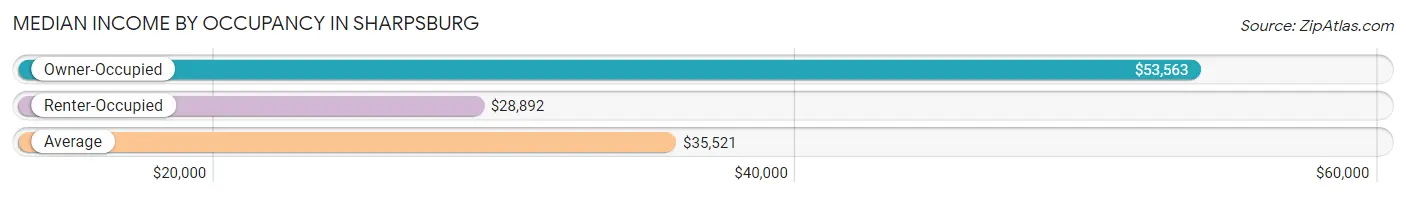
| Occupancy Type | # Households | Median Income |
| Owner-Occupied | 305 (48.3%) | $53,563 |
| Renter-Occupied | 327 (51.7%) | $28,892 |
| Average | 632 (100.0%) | $35,521 |
Occupancy by Householder Income Bracket in Sharpsburg
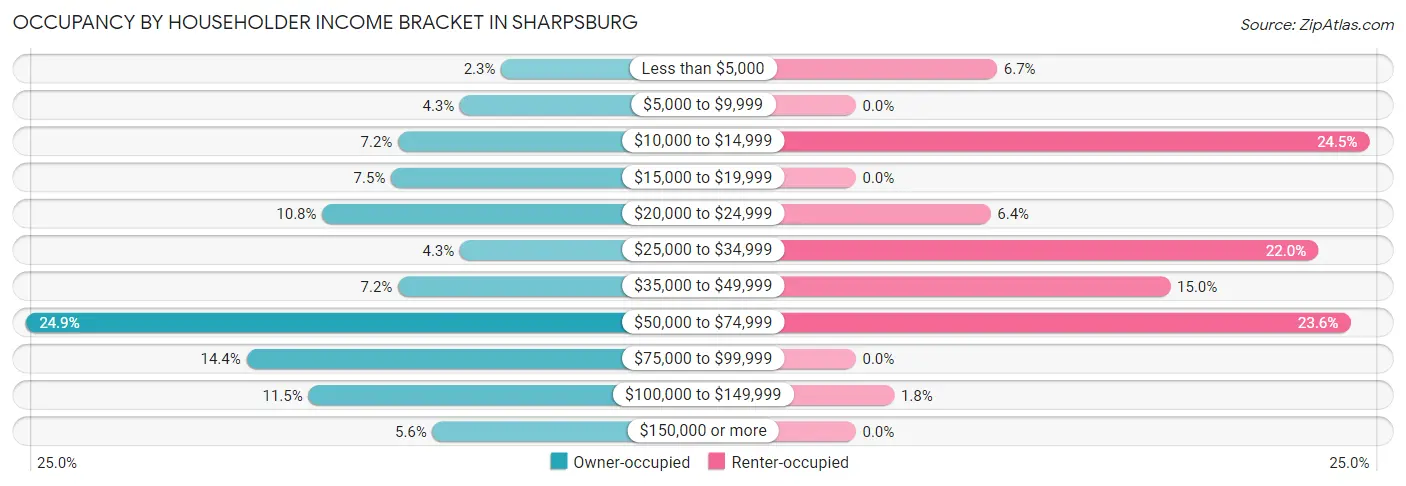
| Income Bracket | Owner-occupied | Renter-occupied |
| Less than $5,000 | 7 (2.3%) | 22 (6.7%) |
| $5,000 to $9,999 | 13 (4.3%) | 0 (0.0%) |
| $10,000 to $14,999 | 22 (7.2%) | 80 (24.5%) |
| $15,000 to $19,999 | 23 (7.5%) | 0 (0.0%) |
| $20,000 to $24,999 | 33 (10.8%) | 21 (6.4%) |
| $25,000 to $34,999 | 13 (4.3%) | 72 (22.0%) |
| $35,000 to $49,999 | 22 (7.2%) | 49 (15.0%) |
| $50,000 to $74,999 | 76 (24.9%) | 77 (23.5%) |
| $75,000 to $99,999 | 44 (14.4%) | 0 (0.0%) |
| $100,000 to $149,999 | 35 (11.5%) | 6 (1.8%) |
| $150,000 or more | 17 (5.6%) | 0 (0.0%) |
| Total | 305 (100.0%) | 327 (100.0%) |
Monthly Housing Cost Tiers in Sharpsburg
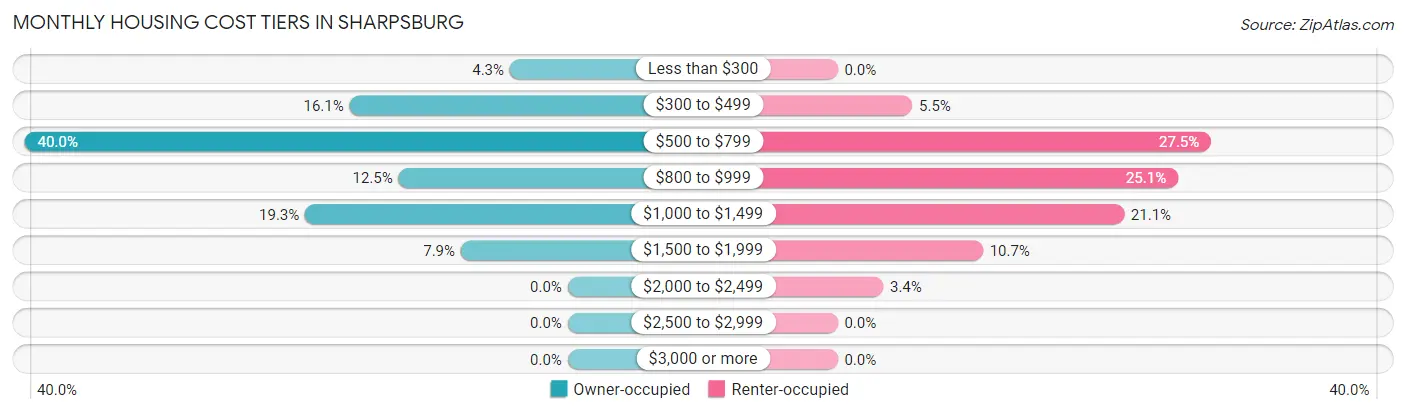
| Monthly Cost | Owner-occupied | Renter-occupied |
| Less than $300 | 13 (4.3%) | 0 (0.0%) |
| $300 to $499 | 49 (16.1%) | 18 (5.5%) |
| $500 to $799 | 122 (40.0%) | 90 (27.5%) |
| $800 to $999 | 38 (12.5%) | 82 (25.1%) |
| $1,000 to $1,499 | 59 (19.3%) | 69 (21.1%) |
| $1,500 to $1,999 | 24 (7.9%) | 35 (10.7%) |
| $2,000 to $2,499 | 0 (0.0%) | 11 (3.4%) |
| $2,500 to $2,999 | 0 (0.0%) | 0 (0.0%) |
| $3,000 or more | 0 (0.0%) | 0 (0.0%) |
| Total | 305 (100.0%) | 327 (100.0%) |
Physical Housing Characteristics in Sharpsburg
Housing Structures in Sharpsburg
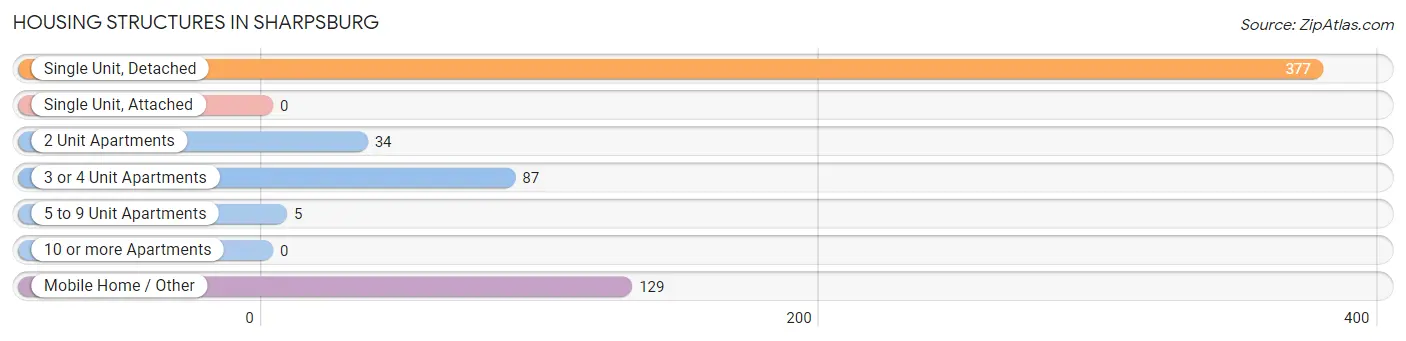
| Structure Type | # Housing Units | % Housing Units |
| Single Unit, Detached | 377 | 59.7% |
| Single Unit, Attached | 0 | 0.0% |
| 2 Unit Apartments | 34 | 5.4% |
| 3 or 4 Unit Apartments | 87 | 13.8% |
| 5 to 9 Unit Apartments | 5 | 0.8% |
| 10 or more Apartments | 0 | 0.0% |
| Mobile Home / Other | 129 | 20.4% |
| Total | 632 | 100.0% |
Housing Structures by Occupancy in Sharpsburg
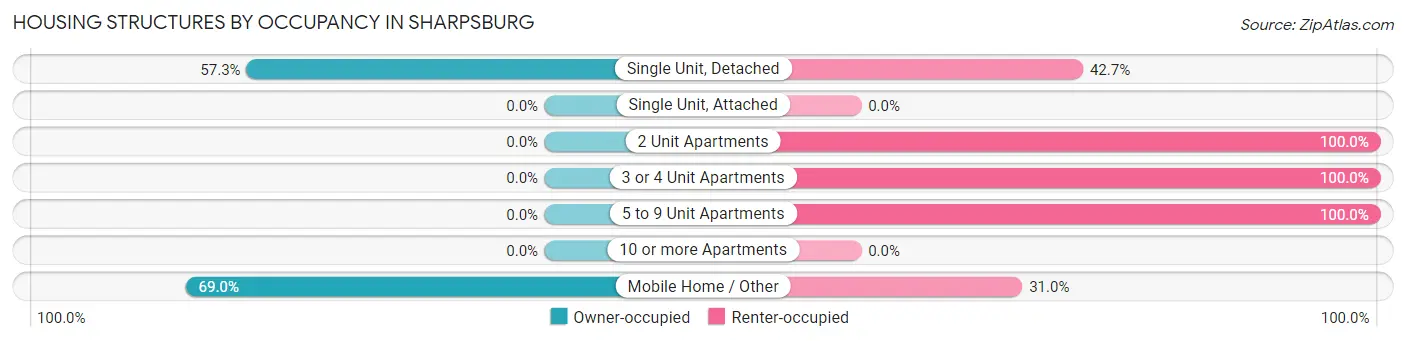
| Structure Type | Owner-occupied | Renter-occupied |
| Single Unit, Detached | 216 (57.3%) | 161 (42.7%) |
| Single Unit, Attached | 0 (0.0%) | 0 (0.0%) |
| 2 Unit Apartments | 0 (0.0%) | 34 (100.0%) |
| 3 or 4 Unit Apartments | 0 (0.0%) | 87 (100.0%) |
| 5 to 9 Unit Apartments | 0 (0.0%) | 5 (100.0%) |
| 10 or more Apartments | 0 (0.0%) | 0 (0.0%) |
| Mobile Home / Other | 89 (69.0%) | 40 (31.0%) |
| Total | 305 (48.3%) | 327 (51.7%) |
Housing Structures by Number of Rooms in Sharpsburg
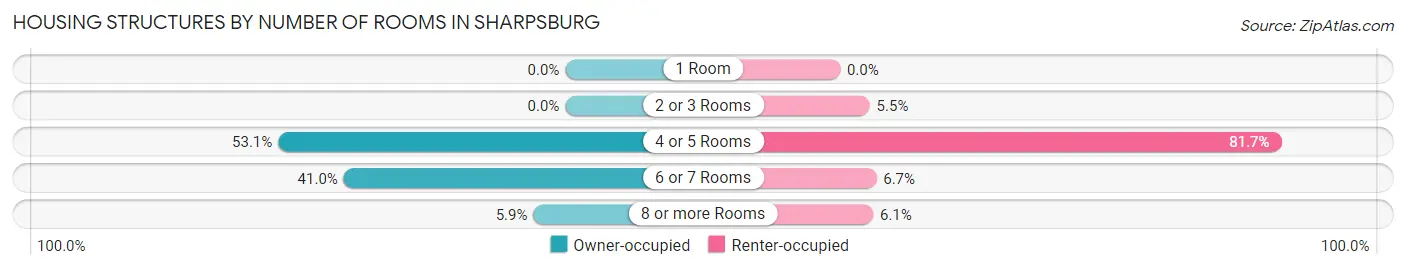
| Number of Rooms | Owner-occupied | Renter-occupied |
| 1 Room | 0 (0.0%) | 0 (0.0%) |
| 2 or 3 Rooms | 0 (0.0%) | 18 (5.5%) |
| 4 or 5 Rooms | 162 (53.1%) | 267 (81.7%) |
| 6 or 7 Rooms | 125 (41.0%) | 22 (6.7%) |
| 8 or more Rooms | 18 (5.9%) | 20 (6.1%) |
| Total | 305 (100.0%) | 327 (100.0%) |
Housing Structure by Heating Type in Sharpsburg
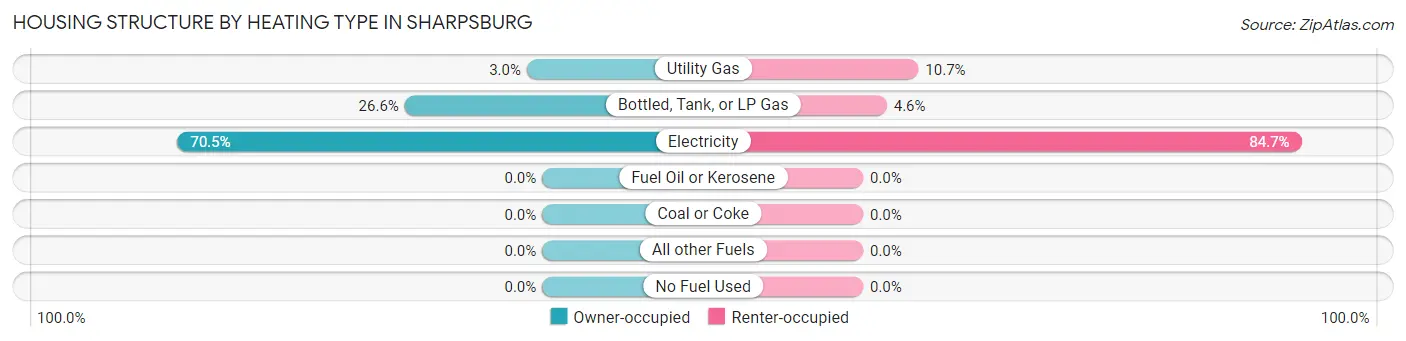
| Heating Type | Owner-occupied | Renter-occupied |
| Utility Gas | 9 (2.9%) | 35 (10.7%) |
| Bottled, Tank, or LP Gas | 81 (26.6%) | 15 (4.6%) |
| Electricity | 215 (70.5%) | 277 (84.7%) |
| Fuel Oil or Kerosene | 0 (0.0%) | 0 (0.0%) |
| Coal or Coke | 0 (0.0%) | 0 (0.0%) |
| All other Fuels | 0 (0.0%) | 0 (0.0%) |
| No Fuel Used | 0 (0.0%) | 0 (0.0%) |
| Total | 305 (100.0%) | 327 (100.0%) |
Household Vehicle Usage in Sharpsburg
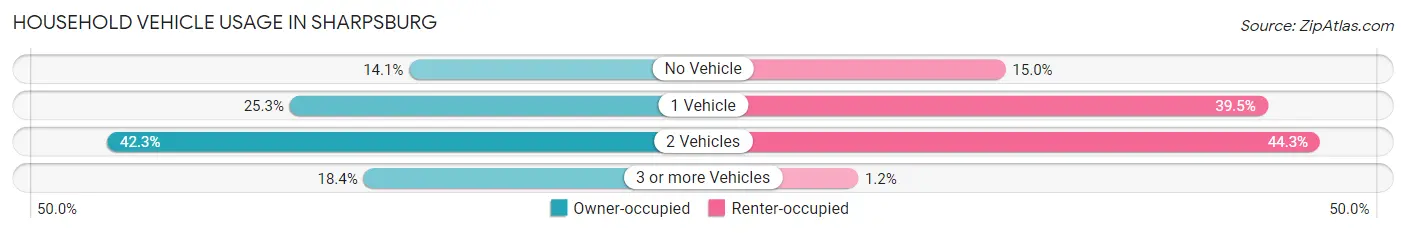
| Vehicles per Household | Owner-occupied | Renter-occupied |
| No Vehicle | 43 (14.1%) | 49 (15.0%) |
| 1 Vehicle | 77 (25.3%) | 129 (39.5%) |
| 2 Vehicles | 129 (42.3%) | 145 (44.3%) |
| 3 or more Vehicles | 56 (18.4%) | 4 (1.2%) |
| Total | 305 (100.0%) | 327 (100.0%) |
Real Estate & Mortgages in Sharpsburg
Real Estate and Mortgage Overview in Sharpsburg
| Characteristic | Without Mortgage | With Mortgage |
| Housing Units | 204 | 101 |
| Median Property Value | $103,600 | $121,100 |
| Median Household Income | $37,500 | $2 |
| Monthly Housing Costs | $587 | $0 |
| Real Estate Taxes | $895 | $0 |
Property Value by Mortgage Status in Sharpsburg
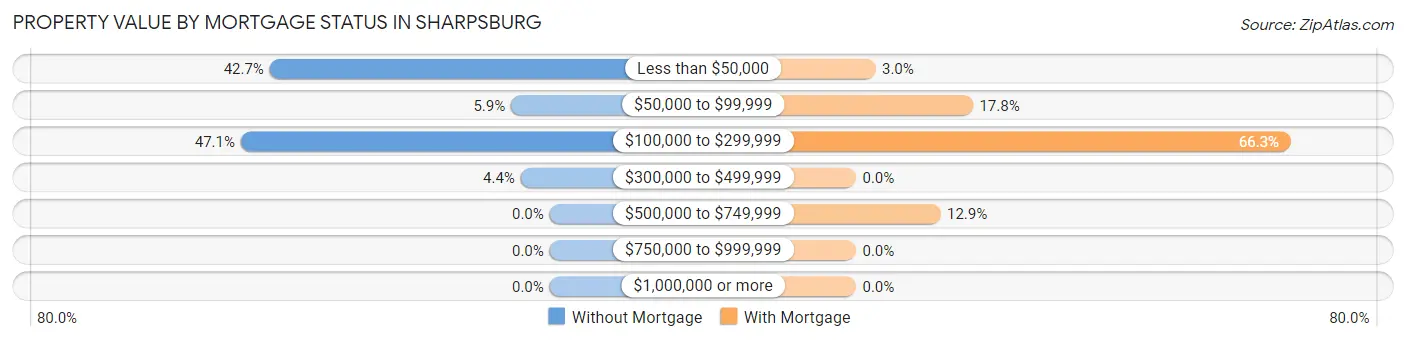
| Property Value | Without Mortgage | With Mortgage |
| Less than $50,000 | 87 (42.6%) | 3 (3.0%) |
| $50,000 to $99,999 | 12 (5.9%) | 18 (17.8%) |
| $100,000 to $299,999 | 96 (47.1%) | 67 (66.3%) |
| $300,000 to $499,999 | 9 (4.4%) | 0 (0.0%) |
| $500,000 to $749,999 | 0 (0.0%) | 13 (12.9%) |
| $750,000 to $999,999 | 0 (0.0%) | 0 (0.0%) |
| $1,000,000 or more | 0 (0.0%) | 0 (0.0%) |
| Total | 204 (100.0%) | 101 (100.0%) |
Household Income by Mortgage Status in Sharpsburg
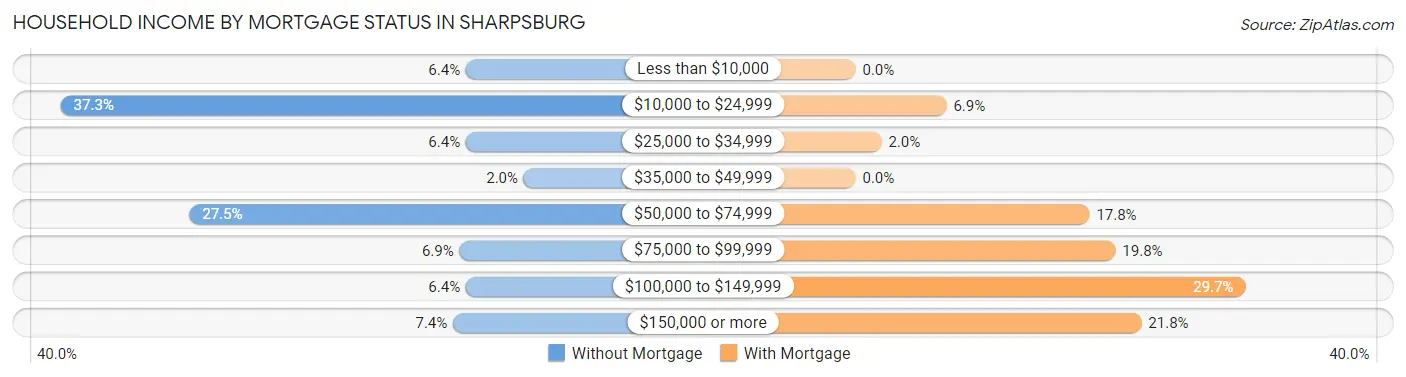
| Household Income | Without Mortgage | With Mortgage |
| Less than $10,000 | 13 (6.4%) | 0 (0.0%) |
| $10,000 to $24,999 | 76 (37.2%) | 7 (6.9%) |
| $25,000 to $34,999 | 13 (6.4%) | 2 (2.0%) |
| $35,000 to $49,999 | 4 (2.0%) | 0 (0.0%) |
| $50,000 to $74,999 | 56 (27.5%) | 18 (17.8%) |
| $75,000 to $99,999 | 14 (6.9%) | 20 (19.8%) |
| $100,000 to $149,999 | 13 (6.4%) | 30 (29.7%) |
| $150,000 or more | 15 (7.3%) | 22 (21.8%) |
| Total | 204 (100.0%) | 101 (100.0%) |
Property Value to Household Income Ratio in Sharpsburg
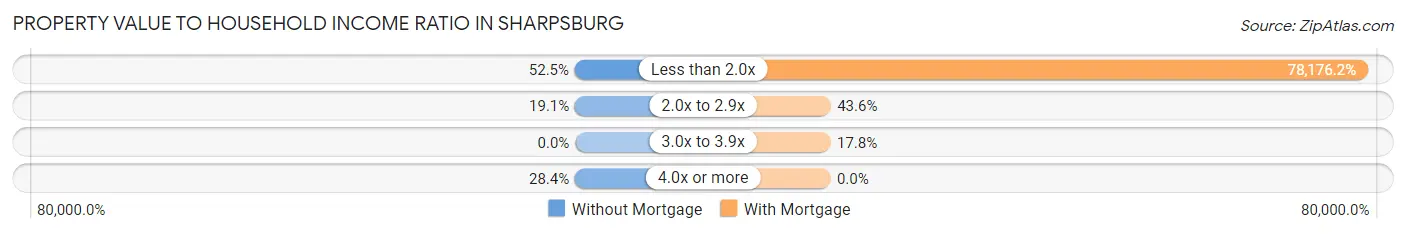
| Value-to-Income Ratio | Without Mortgage | With Mortgage |
| Less than 2.0x | 107 (52.4%) | 78,958 (78,176.2%) |
| 2.0x to 2.9x | 39 (19.1%) | 44 (43.6%) |
| 3.0x to 3.9x | 0 (0.0%) | 18 (17.8%) |
| 4.0x or more | 58 (28.4%) | 0 (0.0%) |
| Total | 204 (100.0%) | 101 (100.0%) |
Real Estate Taxes by Mortgage Status in Sharpsburg
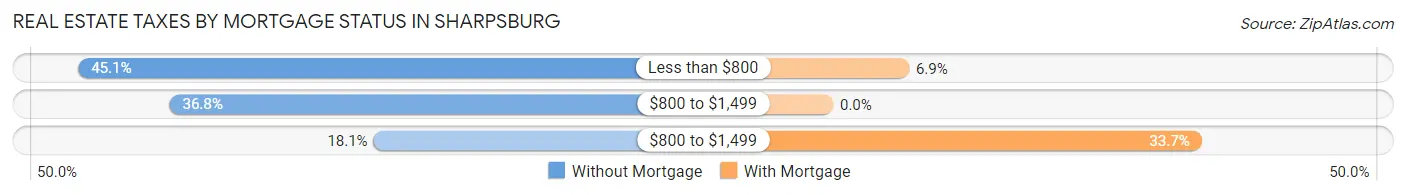
| Property Taxes | Without Mortgage | With Mortgage |
| Less than $800 | 92 (45.1%) | 7 (6.9%) |
| $800 to $1,499 | 75 (36.8%) | 0 (0.0%) |
| $800 to $1,499 | 37 (18.1%) | 34 (33.7%) |
| Total | 204 (100.0%) | 101 (100.0%) |
Health & Disability in Sharpsburg
Health Insurance Coverage by Age in Sharpsburg
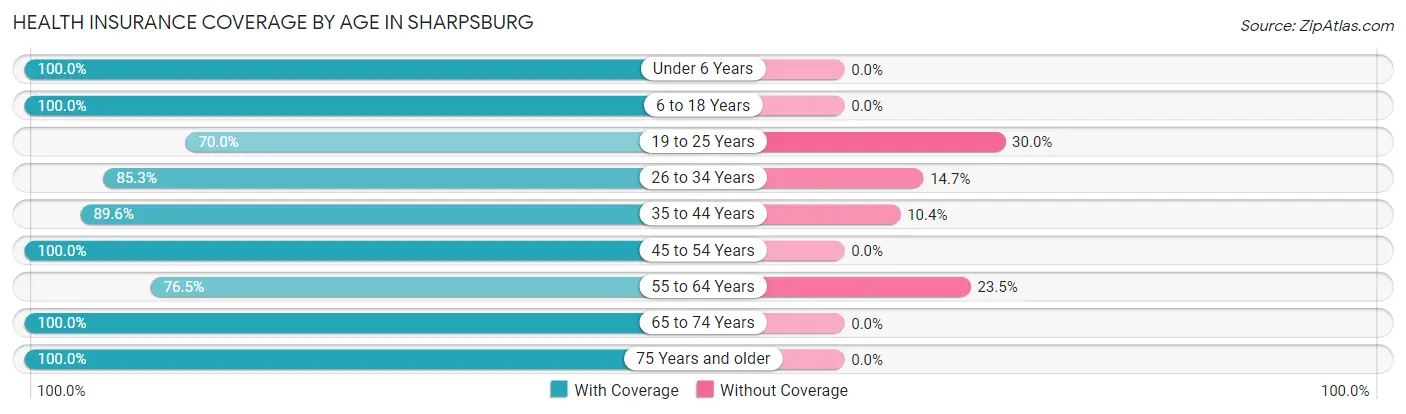
| Age Bracket | With Coverage | Without Coverage |
| Under 6 Years | 196 (100.0%) | 0 (0.0%) |
| 6 to 18 Years | 269 (100.0%) | 0 (0.0%) |
| 19 to 25 Years | 42 (70.0%) | 18 (30.0%) |
| 26 to 34 Years | 139 (85.3%) | 24 (14.7%) |
| 35 to 44 Years | 189 (89.6%) | 22 (10.4%) |
| 45 to 54 Years | 121 (100.0%) | 0 (0.0%) |
| 55 to 64 Years | 169 (76.5%) | 52 (23.5%) |
| 65 to 74 Years | 162 (100.0%) | 0 (0.0%) |
| 75 Years and older | 101 (100.0%) | 0 (0.0%) |
| Total | 1,388 (92.3%) | 116 (7.7%) |
Health Insurance Coverage by Citizenship Status in Sharpsburg
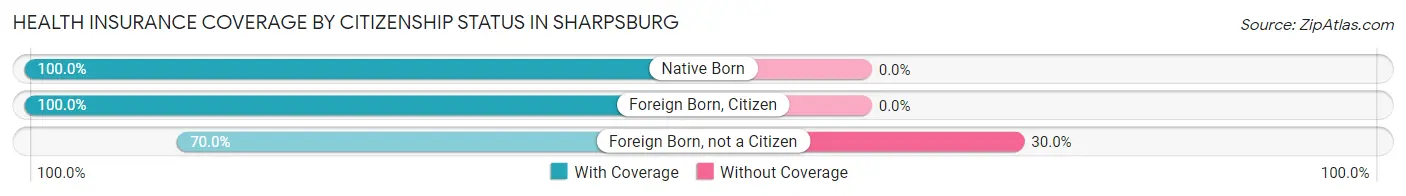
| Citizenship Status | With Coverage | Without Coverage |
| Native Born | 196 (100.0%) | 0 (0.0%) |
| Foreign Born, Citizen | 269 (100.0%) | 0 (0.0%) |
| Foreign Born, not a Citizen | 42 (70.0%) | 18 (30.0%) |
Health Insurance Coverage by Household Income in Sharpsburg
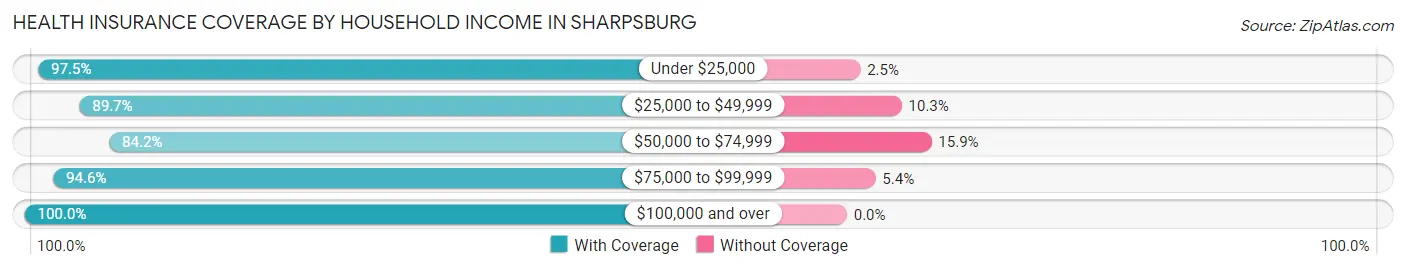
| Household Income | With Coverage | Without Coverage |
| Under $25,000 | 310 (97.5%) | 8 (2.5%) |
| $25,000 to $49,999 | 297 (89.7%) | 34 (10.3%) |
| $50,000 to $74,999 | 361 (84.2%) | 68 (15.9%) |
| $75,000 to $99,999 | 106 (94.6%) | 6 (5.4%) |
| $100,000 and over | 314 (100.0%) | 0 (0.0%) |
Public vs Private Health Insurance Coverage by Age in Sharpsburg
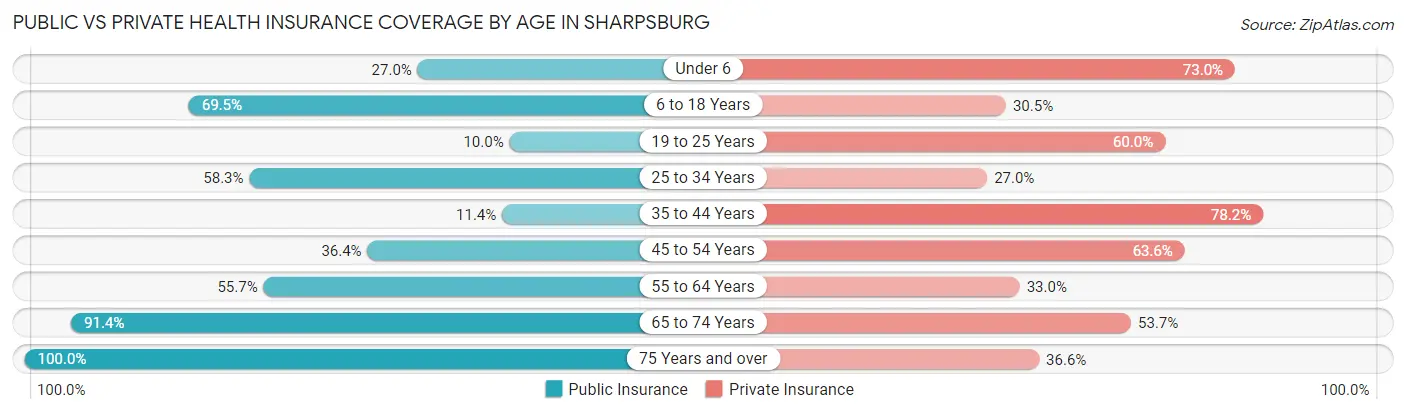
| Age Bracket | Public Insurance | Private Insurance |
| Under 6 | 53 (27.0%) | 143 (73.0%) |
| 6 to 18 Years | 187 (69.5%) | 82 (30.5%) |
| 19 to 25 Years | 6 (10.0%) | 36 (60.0%) |
| 25 to 34 Years | 95 (58.3%) | 44 (27.0%) |
| 35 to 44 Years | 24 (11.4%) | 165 (78.2%) |
| 45 to 54 Years | 44 (36.4%) | 77 (63.6%) |
| 55 to 64 Years | 123 (55.7%) | 73 (33.0%) |
| 65 to 74 Years | 148 (91.4%) | 87 (53.7%) |
| 75 Years and over | 101 (100.0%) | 37 (36.6%) |
| Total | 781 (51.9%) | 744 (49.5%) |
Disability Status by Sex by Age in Sharpsburg
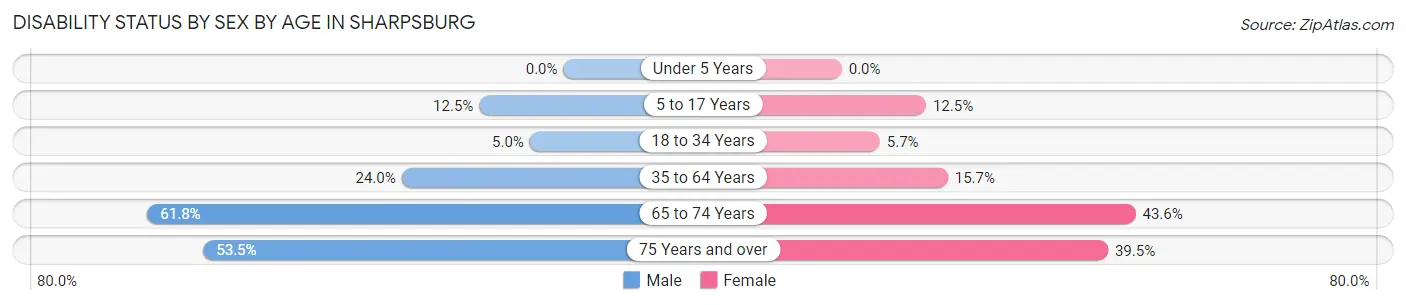
| Age Bracket | Male | Female |
| Under 5 Years | 0 (0.0%) | 0 (0.0%) |
| 5 to 17 Years | 18 (12.5%) | 13 (12.5%) |
| 18 to 34 Years | 6 (5.0%) | 7 (5.7%) |
| 35 to 64 Years | 55 (24.0%) | 51 (15.7%) |
| 65 to 74 Years | 42 (61.8%) | 41 (43.6%) |
| 75 Years and over | 31 (53.4%) | 17 (39.5%) |
Disability Class by Sex by Age in Sharpsburg
Disability Class: Hearing Difficulty
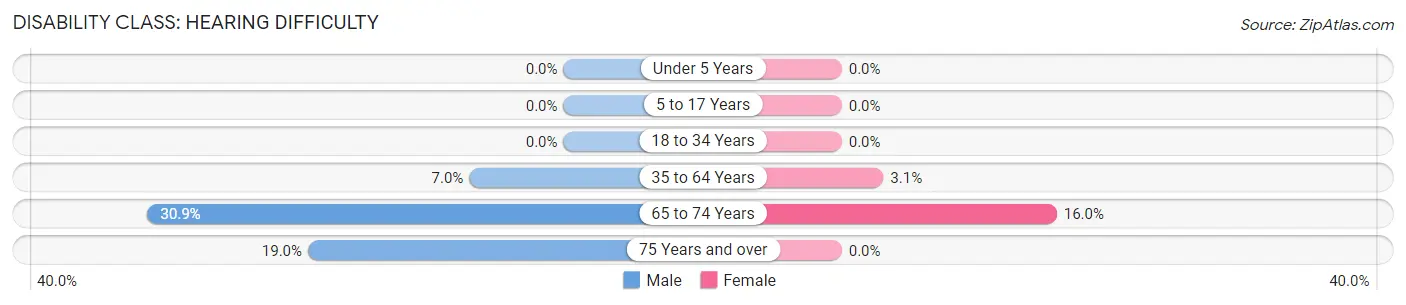
| Age Bracket | Male | Female |
| Under 5 Years | 0 (0.0%) | 0 (0.0%) |
| 5 to 17 Years | 0 (0.0%) | 0 (0.0%) |
| 18 to 34 Years | 0 (0.0%) | 0 (0.0%) |
| 35 to 64 Years | 16 (7.0%) | 10 (3.1%) |
| 65 to 74 Years | 21 (30.9%) | 15 (16.0%) |
| 75 Years and over | 11 (19.0%) | 0 (0.0%) |
Disability Class: Vision Difficulty
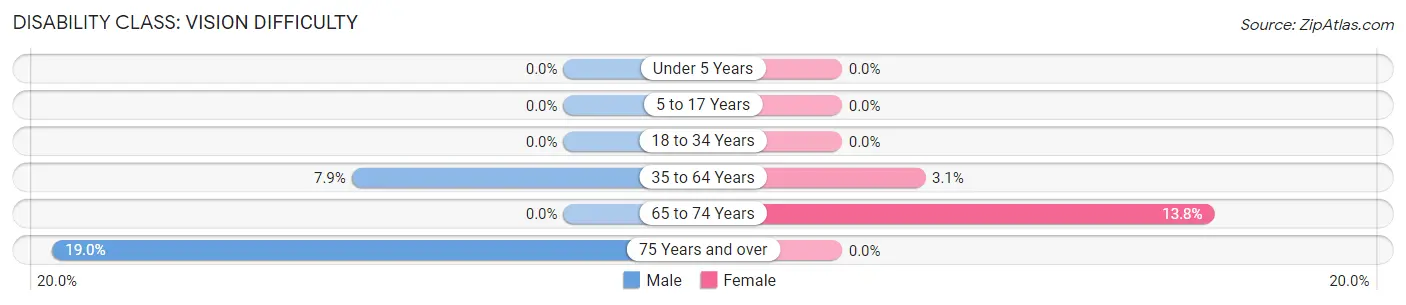
| Age Bracket | Male | Female |
| Under 5 Years | 0 (0.0%) | 0 (0.0%) |
| 5 to 17 Years | 0 (0.0%) | 0 (0.0%) |
| 18 to 34 Years | 0 (0.0%) | 0 (0.0%) |
| 35 to 64 Years | 18 (7.9%) | 10 (3.1%) |
| 65 to 74 Years | 0 (0.0%) | 13 (13.8%) |
| 75 Years and over | 11 (19.0%) | 0 (0.0%) |
Disability Class: Cognitive Difficulty
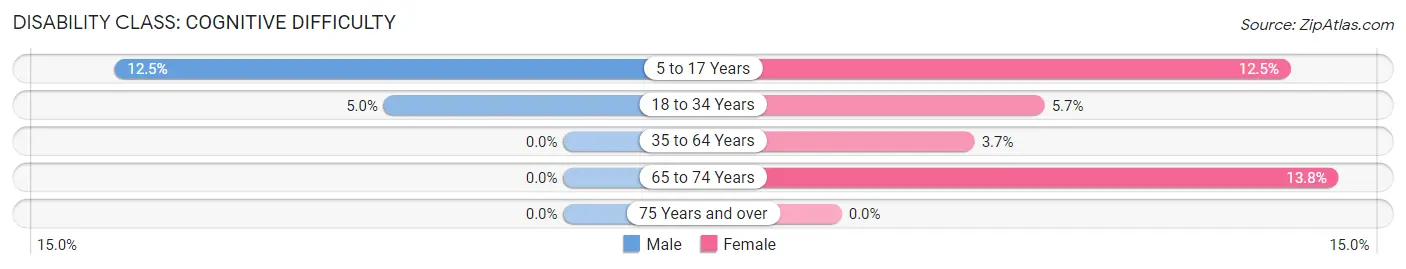
| Age Bracket | Male | Female |
| 5 to 17 Years | 18 (12.5%) | 13 (12.5%) |
| 18 to 34 Years | 6 (5.0%) | 7 (5.7%) |
| 35 to 64 Years | 0 (0.0%) | 12 (3.7%) |
| 65 to 74 Years | 0 (0.0%) | 13 (13.8%) |
| 75 Years and over | 0 (0.0%) | 0 (0.0%) |
Disability Class: Ambulatory Difficulty
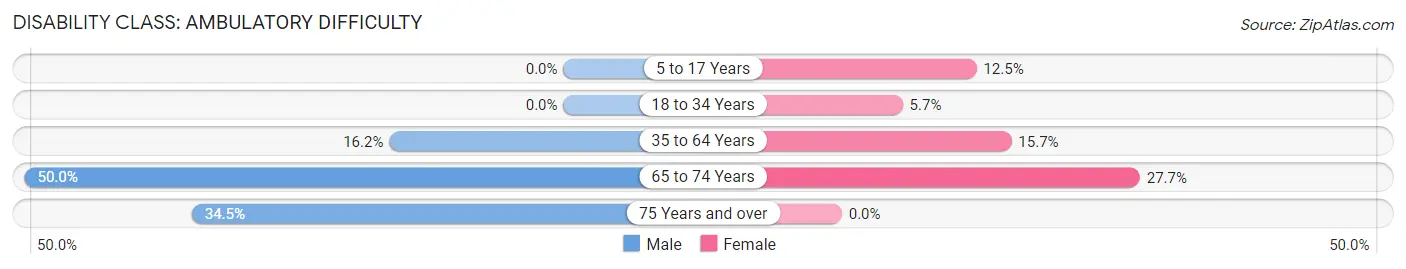
| Age Bracket | Male | Female |
| 5 to 17 Years | 0 (0.0%) | 13 (12.5%) |
| 18 to 34 Years | 0 (0.0%) | 7 (5.7%) |
| 35 to 64 Years | 37 (16.2%) | 51 (15.7%) |
| 65 to 74 Years | 34 (50.0%) | 26 (27.7%) |
| 75 Years and over | 20 (34.5%) | 0 (0.0%) |
Disability Class: Self-Care Difficulty
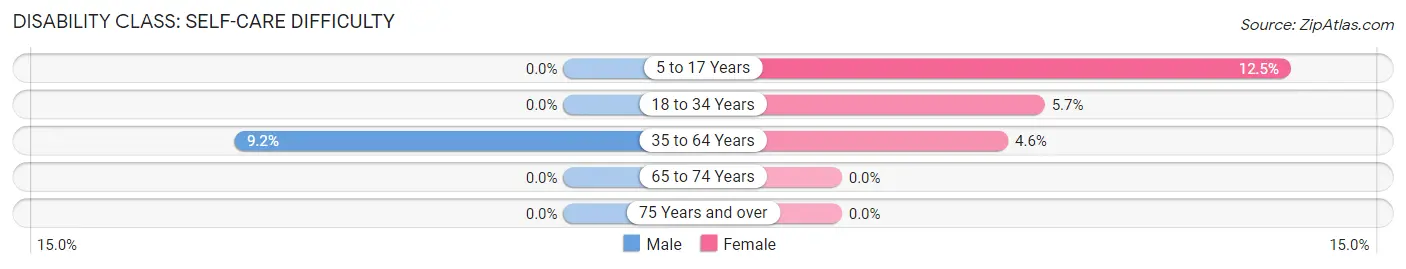
| Age Bracket | Male | Female |
| 5 to 17 Years | 0 (0.0%) | 13 (12.5%) |
| 18 to 34 Years | 0 (0.0%) | 7 (5.7%) |
| 35 to 64 Years | 21 (9.2%) | 15 (4.6%) |
| 65 to 74 Years | 0 (0.0%) | 0 (0.0%) |
| 75 Years and over | 0 (0.0%) | 0 (0.0%) |
Technology Access in Sharpsburg
Computing Device Access in Sharpsburg
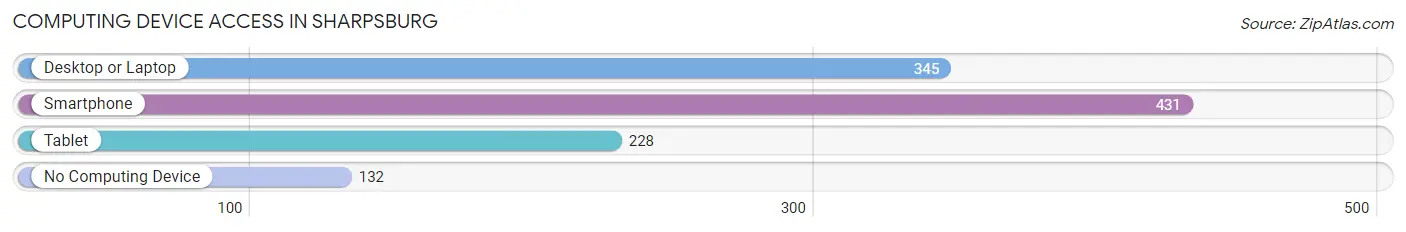
| Device Type | # Households | % Households |
| Desktop or Laptop | 345 | 54.6% |
| Smartphone | 431 | 68.2% |
| Tablet | 228 | 36.1% |
| No Computing Device | 132 | 20.9% |
| Total | 632 | 100.0% |
Internet Access in Sharpsburg
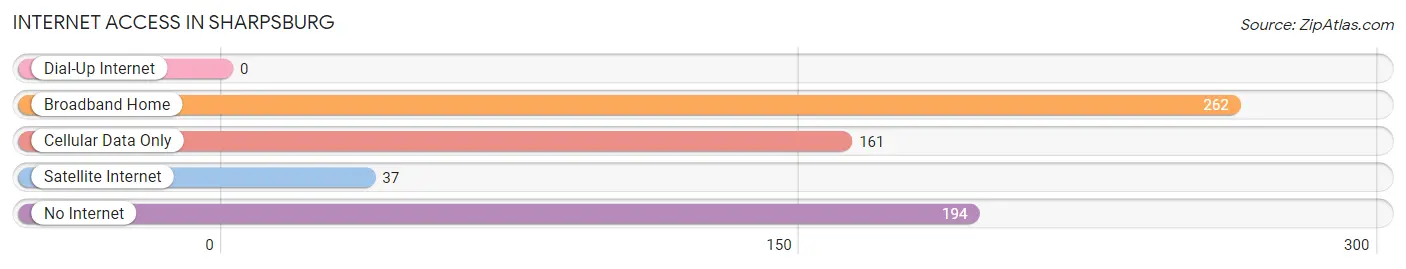
| Internet Type | # Households | % Households |
| Dial-Up Internet | 0 | 0.0% |
| Broadband Home | 262 | 41.5% |
| Cellular Data Only | 161 | 25.5% |
| Satellite Internet | 37 | 5.9% |
| No Internet | 194 | 30.7% |
| Total | 632 | 100.0% |
Sharpsburg Summary
Sharpburg is a small town located in the eastern part of North Carolina, in the United States. It is situated in the county of Nash, and is part of the Rocky Mount Metropolitan Statistical Area. The town has a population of approximately 1,500 people, and is located about 25 miles east of Rocky Mount.
History
Sharpburg was founded in 1845 by a group of settlers from the nearby town of Tarboro. The town was named after the nearby Sharp's Creek, which was named after a local family. The town was originally a farming community, and the main crops grown were cotton, corn, and tobacco. The town was also home to a number of small businesses, including a general store, a blacksmith, and a sawmill.
In the late 19th century, the town began to grow and develop. The railroad was extended to Sharpburg in 1887, and this allowed the town to become a major shipping center for the surrounding area. The town also became a popular tourist destination, as it was located near several popular lakes and rivers.
Geography
Sharpburg is located in the eastern part of North Carolina, in the United States. It is situated in the county of Nash, and is part of the Rocky Mount Metropolitan Statistical Area. The town has a total area of 1.2 square miles, all of which is land. The town is located about 25 miles east of Rocky Mount.
The town is located in a rural area, and is surrounded by farmland and forests. The nearest major city is Rocky Mount, which is located about 25 miles to the west. The town is also located near several popular lakes and rivers, including Lake Gaston, Lake Mattamuskeet, and the Tar River.
Economy
The economy of Sharpburg is largely based on agriculture and tourism. The town is home to several farms, which produce a variety of crops, including cotton, corn, and tobacco. The town is also home to a number of small businesses, including a general store, a blacksmith, and a sawmill.
The town is also a popular tourist destination, as it is located near several popular lakes and rivers. The town is home to several campgrounds, as well as a number of recreational activities, such as fishing, boating, and swimming.
Demographics
As of the 2010 census, Sharpburg had a population of 1,500 people. The racial makeup of the town was 79.3% White, 17.3% African American, 0.7% Native American, 0.3% Asian, and 2.7% from other races. The median household income was $31,250, and the median family income was $37,500.
The town is home to a number of churches, including the Sharpburg Baptist Church, the Sharpburg Methodist Church, and the Sharpburg Presbyterian Church. The town is also home to a number of schools, including the Sharpburg Elementary School, the Sharpburg Middle School, and the Sharpburg High School.
Common Questions
What is the Total Population of Sharpsburg?
Total Population of Sharpsburg is 1,504.
What is the Total Male Population of Sharpsburg?
Total Male Population of Sharpsburg is 672.
What is the Total Female Population of Sharpsburg?
Total Female Population of Sharpsburg is 832.
What is the Ratio of Males per 100 Females in Sharpsburg?
There are 80.77 Males per 100 Females in Sharpsburg.
What is the Ratio of Females per 100 Males in Sharpsburg?
There are 123.81 Females per 100 Males in Sharpsburg.
What is the Median Population Age in Sharpsburg?
Median Population Age in Sharpsburg is 38.2 Years.
What is the Average Family Size in Sharpsburg
Average Family Size in Sharpsburg is 3.1 People.
What is the Average Household Size in Sharpsburg
Average Household Size in Sharpsburg is 2.4 People.
What is Per Capita Income in Sharpsburg?
Per Capita income in Sharpsburg is $19,612.
What is the Median Family Income in Sharpsburg?
Median Family Income in Sharpsburg is $40,938.
What is the Median Household income in Sharpsburg?
Median Household Income in Sharpsburg is $35,521.
What is Income or Wage Gap in Sharpsburg?
Income or Wage Gap in Sharpsburg is 3.6%.
Women in Sharpsburg earn 96.4 cents for every dollar earned by a man.
What is Inequality or Gini Index in Sharpsburg?
Inequality or Gini Index in Sharpsburg is 0.42.
How Large is the Labor Force in Sharpsburg?
There are 628 People in the Labor Forcein in Sharpsburg.
What is the Percentage of People in the Labor Force in Sharpsburg?
57.1% of People are in the Labor Force in Sharpsburg.
What is the Unemployment Rate in Sharpsburg?
Unemployment Rate in Sharpsburg is 0.5%.