Taylortown, NC
Taylortown Map
Taylortown Overview
820
TOTAL POPULATION
435
MALE POPULATION
385
FEMALE POPULATION
112.99
MALES / 100 FEMALES
88.51
FEMALES / 100 MALES
47.3
MEDIAN AGE
3.1
AVG FAMILY SIZE
2.5
AVG HOUSEHOLD SIZE
$29,518
PER CAPITA INCOME
$59,306
AVG FAMILY INCOME
$47,431
AVG HOUSEHOLD INCOME
23.6%
WAGE / INCOME GAP [ % ]
76.4¢/ $1
WAGE / INCOME GAP [ $ ]
0.39
INEQUALITY / GINI INDEX
418
LABOR FORCE [ PEOPLE ]
61.5%
PERCENT IN LABOR FORCE
5.1%
UNEMPLOYMENT RATE
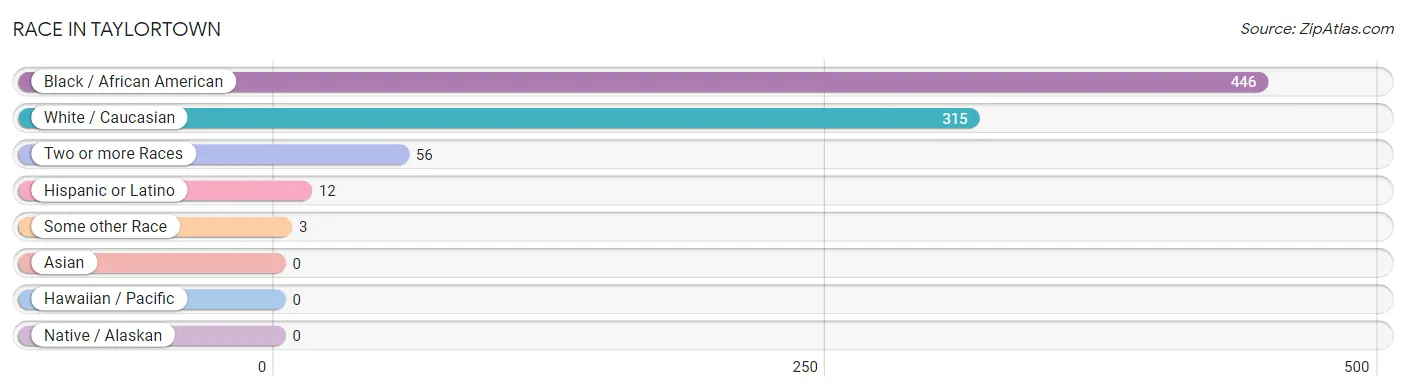
Race in Taylortown
The most populous races in Taylortown are Black / African American (446 | 54.4%), White / Caucasian (315 | 38.4%), and Two or more Races (56 | 6.8%).
| Race | # Population | % Population |
| Asian | 0 | 0.0% |
| Black / African American | 446 | 54.4% |
| Hawaiian / Pacific | 0 | 0.0% |
| Hispanic or Latino | 12 | 1.5% |
| Native / Alaskan | 0 | 0.0% |
| White / Caucasian | 315 | 38.4% |
| Two or more Races | 56 | 6.8% |
| Some other Race | 3 | 0.4% |
| Total | 820 | 100.0% |
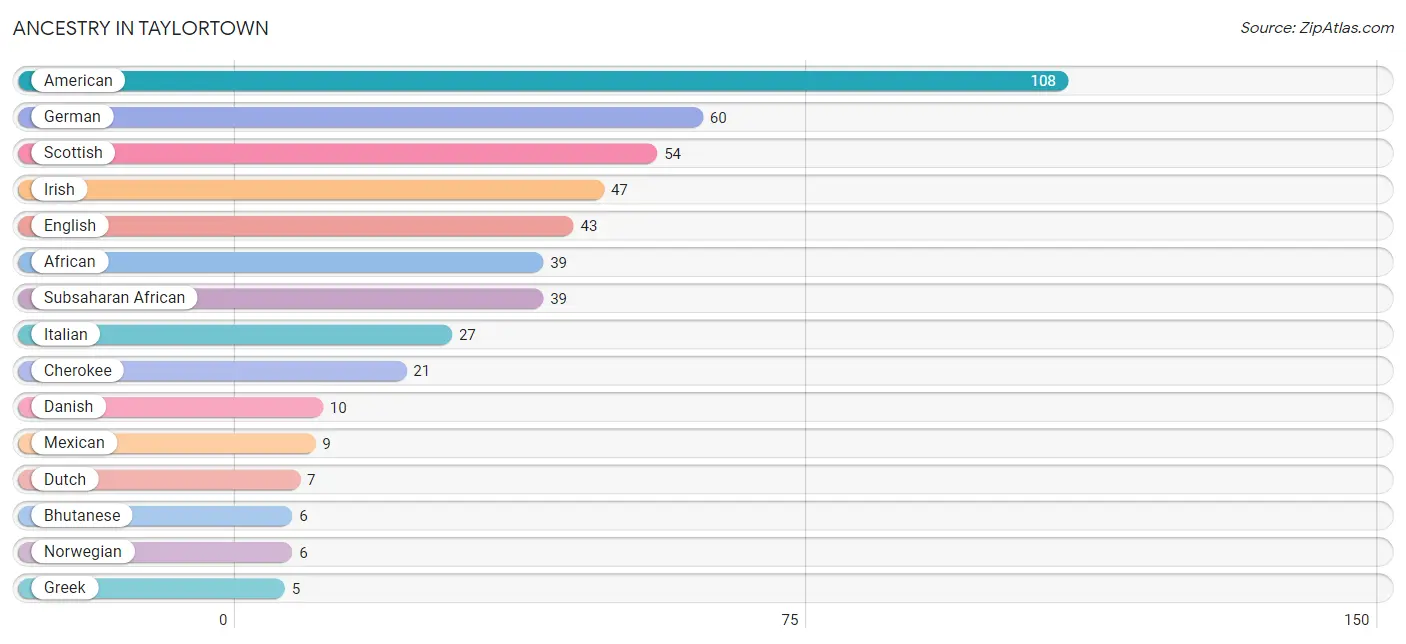
Ancestry in Taylortown
The most populous ancestries reported in Taylortown are American (108 | 13.2%), German (60 | 7.3%), Scottish (54 | 6.6%), Irish (47 | 5.7%), and English (43 | 5.2%), together accounting for 38.1% of all Taylortown residents.
| Ancestry | # Population | % Population |
| African | 39 | 4.8% |
| American | 108 | 13.2% |
| Australian | 2 | 0.2% |
| Bhutanese | 6 | 0.7% |
| Cherokee | 21 | 2.6% |
| Colombian | 3 | 0.4% |
| Danish | 10 | 1.2% |
| Dutch | 7 | 0.9% |
| English | 43 | 5.2% |
| French Canadian | 2 | 0.2% |
| German | 60 | 7.3% |
| Greek | 5 | 0.6% |
| Hungarian | 2 | 0.2% |
| Irish | 47 | 5.7% |
| Italian | 27 | 3.3% |
| Jamaican | 4 | 0.5% |
| Mexican | 9 | 1.1% |
| Norwegian | 6 | 0.7% |
| Scottish | 54 | 6.6% |
| Sioux | 2 | 0.2% |
| South American | 3 | 0.4% |
| Subsaharan African | 39 | 4.8% |
| Welsh | 2 | 0.2% |
| Yugoslavian | 5 | 0.6% | View All 24 Rows |
Immigrants in Taylortown

| Immigration Origin | # Population | % Population | View All 0 Rows |
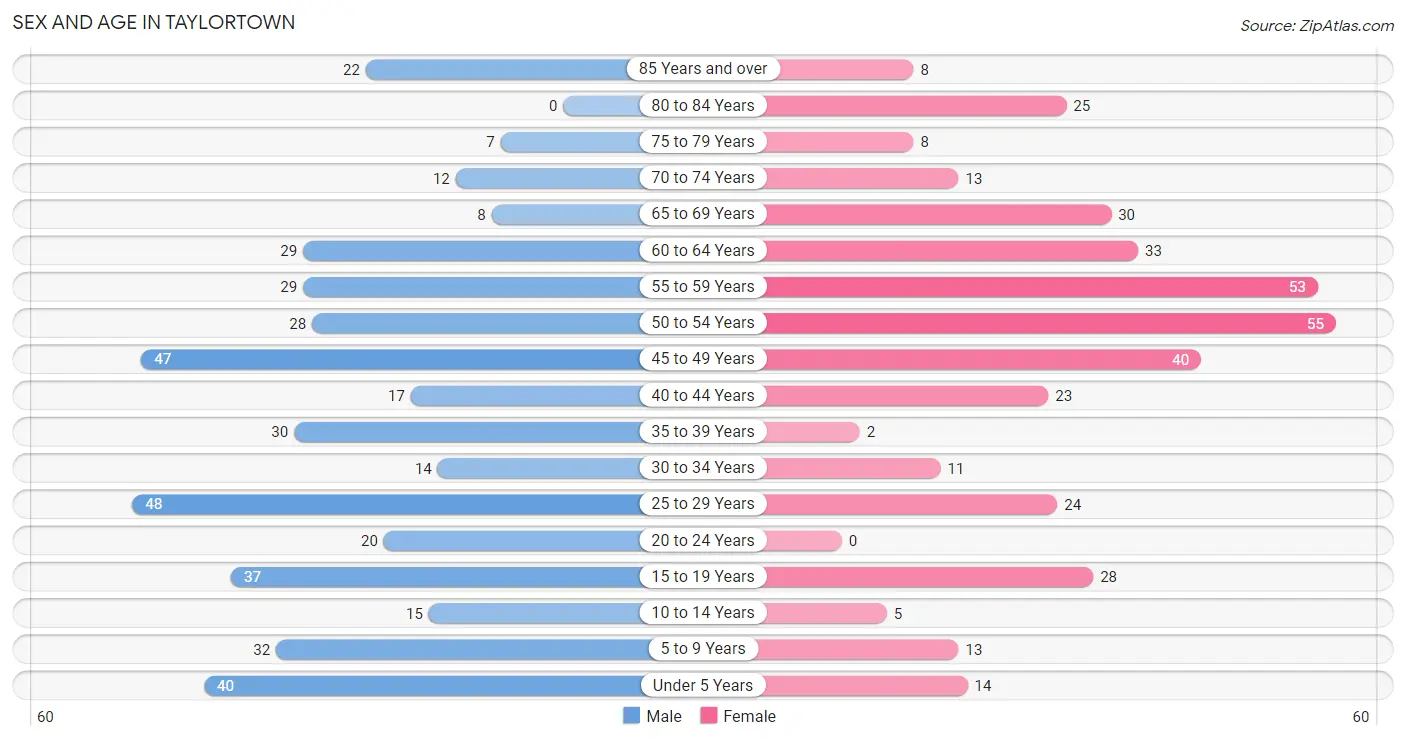
Sex and Age in Taylortown
Sex and Age in Taylortown
The most populous age groups in Taylortown are 25 to 29 Years (48 | 11.0%) for men and 50 to 54 Years (55 | 14.3%) for women.
| Age Bracket | Male | Female |
| Under 5 Years | 40 (9.2%) | 14 (3.6%) |
| 5 to 9 Years | 32 (7.4%) | 13 (3.4%) |
| 10 to 14 Years | 15 (3.5%) | 5 (1.3%) |
| 15 to 19 Years | 37 (8.5%) | 28 (7.3%) |
| 20 to 24 Years | 20 (4.6%) | 0 (0.0%) |
| 25 to 29 Years | 48 (11.0%) | 24 (6.2%) |
| 30 to 34 Years | 14 (3.2%) | 11 (2.9%) |
| 35 to 39 Years | 30 (6.9%) | 2 (0.5%) |
| 40 to 44 Years | 17 (3.9%) | 23 (6.0%) |
| 45 to 49 Years | 47 (10.8%) | 40 (10.4%) |
| 50 to 54 Years | 28 (6.4%) | 55 (14.3%) |
| 55 to 59 Years | 29 (6.7%) | 53 (13.8%) |
| 60 to 64 Years | 29 (6.7%) | 33 (8.6%) |
| 65 to 69 Years | 8 (1.8%) | 30 (7.8%) |
| 70 to 74 Years | 12 (2.8%) | 13 (3.4%) |
| 75 to 79 Years | 7 (1.6%) | 8 (2.1%) |
| 80 to 84 Years | 0 (0.0%) | 25 (6.5%) |
| 85 Years and over | 22 (5.1%) | 8 (2.1%) |
| Total | 435 (100.0%) | 385 (100.0%) |
Families and Households in Taylortown
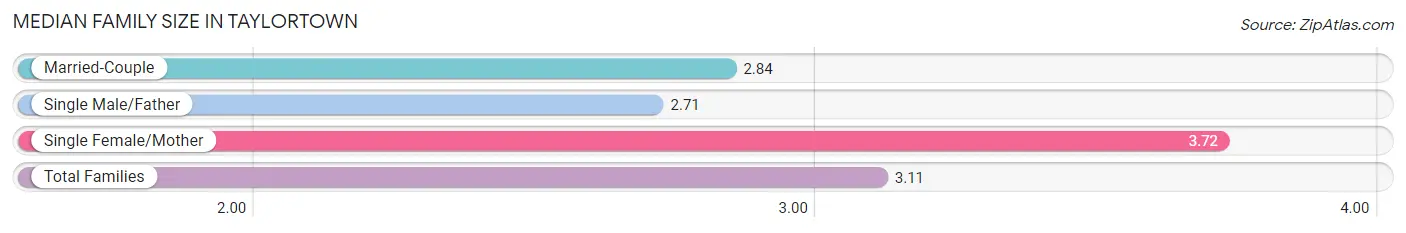
Median Family Size in Taylortown
The median family size in Taylortown is 3.11 persons per family, with single female/mother families (71 | 32.4%) accounting for the largest median family size of 3.72 persons per family. On the other hand, single male/father families (24 | 11.0%) represent the smallest median family size with 2.71 persons per family.
| Family Type | # Families | Family Size |
| Married-Couple | 124 (56.6%) | 2.84 |
| Single Male/Father | 24 (11.0%) | 2.71 |
| Single Female/Mother | 71 (32.4%) | 3.72 |
| Total Families | 219 (100.0%) | 3.11 |
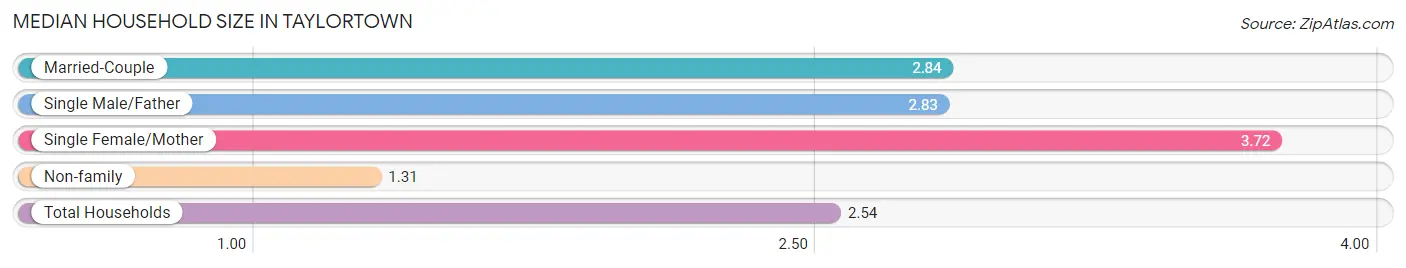
Median Household Size in Taylortown
The median household size in Taylortown is 2.54 persons per household, with single female/mother households (71 | 22.0%) accounting for the largest median household size of 3.72 persons per household. non-family households (104 | 32.2%) represent the smallest median household size with 1.31 persons per household.
| Household Type | # Households | Household Size |
| Married-Couple | 124 (38.4%) | 2.84 |
| Single Male/Father | 24 (7.4%) | 2.83 |
| Single Female/Mother | 71 (22.0%) | 3.72 |
| Non-family | 104 (32.2%) | 1.31 |
| Total Households | 323 (100.0%) | 2.54 |
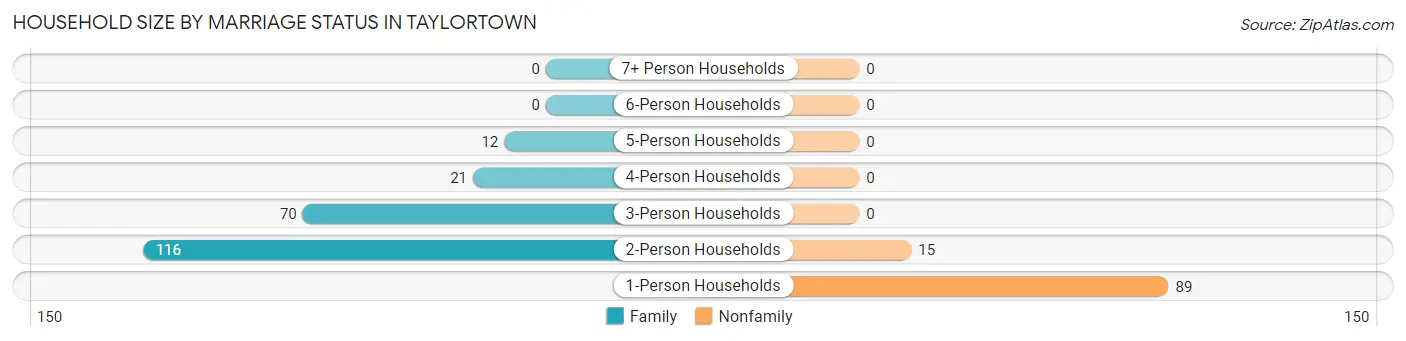
Household Size by Marriage Status in Taylortown
Out of a total of 323 households in Taylortown, 219 (67.8%) are family households, while 104 (32.2%) are nonfamily households. The most numerous type of family households are 2-person households, comprising 116, and the most common type of nonfamily households are 1-person households, comprising 89.
| Household Size | Family Households | Nonfamily Households |
| 1-Person Households | - | 89 (27.6%) |
| 2-Person Households | 116 (35.9%) | 15 (4.6%) |
| 3-Person Households | 70 (21.7%) | 0 (0.0%) |
| 4-Person Households | 21 (6.5%) | 0 (0.0%) |
| 5-Person Households | 12 (3.7%) | 0 (0.0%) |
| 6-Person Households | 0 (0.0%) | 0 (0.0%) |
| 7+ Person Households | 0 (0.0%) | 0 (0.0%) |
| Total | 219 (67.8%) | 104 (32.2%) |
Female Fertility in Taylortown
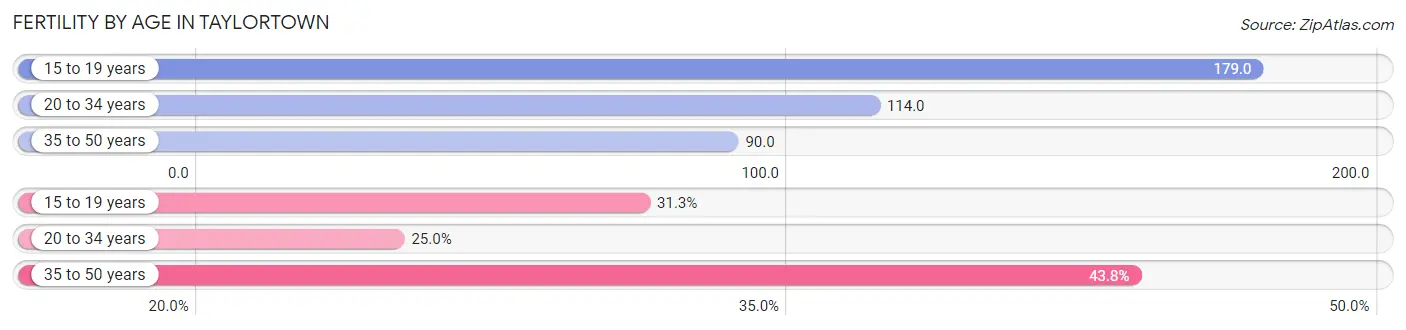
Fertility by Age in Taylortown
Average fertility rate in Taylortown is 113.0 births per 1,000 women. Women in the age bracket of 15 to 19 years have the highest fertility rate with 179.0 births per 1,000 women. Women in the age bracket of 35 to 50 years acount for 43.8% of all women with births.
| Age Bracket | Women with Births | Births / 1,000 Women |
| 15 to 19 years | 5 (31.2%) | 179.0 |
| 20 to 34 years | 4 (25.0%) | 114.0 |
| 35 to 50 years | 7 (43.8%) | 90.0 |
| Total | 16 (100.0%) | 113.0 |
Fertility by Age by Marriage Status in Taylortown
6.2% of women with births (16) in Taylortown are married. The highest percentage of unmarried women with births falls into 15 to 19 years age bracket with 100.0% of them unmarried at the time of birth, while the lowest percentage of unmarried women with births belong to 20 to 34 years age bracket with 75.0% of them unmarried.
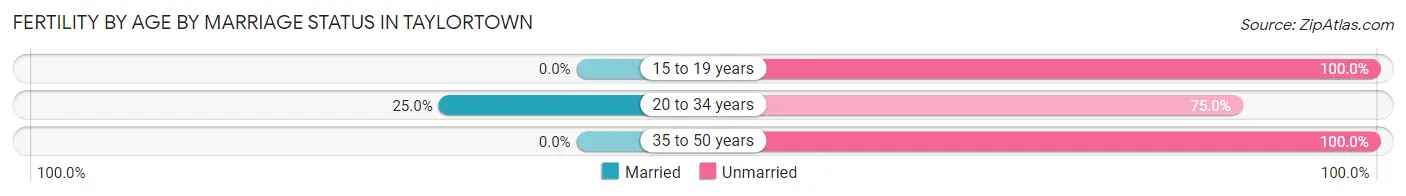
| Age Bracket | Married | Unmarried |
| 15 to 19 years | 0 (0.0%) | 5 (100.0%) |
| 20 to 34 years | 1 (25.0%) | 3 (75.0%) |
| 35 to 50 years | 0 (0.0%) | 7 (100.0%) |
| Total | 1 (6.2%) | 15 (93.8%) |
Fertility by Education in Taylortown
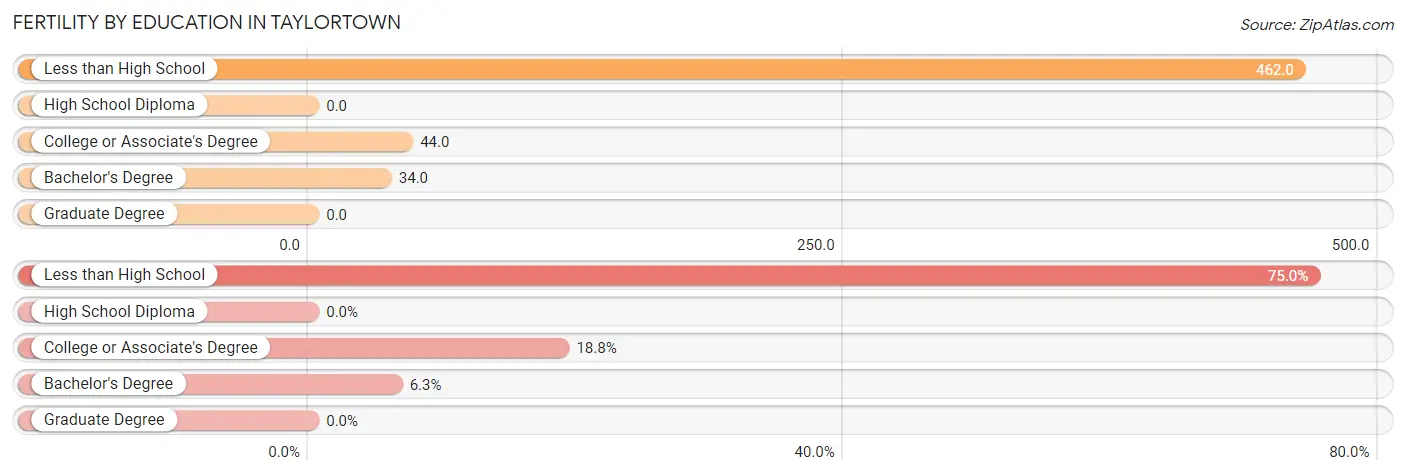
| Educational Attainment | Women with Births | Births / 1,000 Women |
| Less than High School | 12 (75.0%) | 462.0 |
| High School Diploma | 0 (0.0%) | 0.0 |
| College or Associate's Degree | 3 (18.8%) | 44.0 |
| Bachelor's Degree | 1 (6.2%) | 34.0 |
| Graduate Degree | 0 (0.0%) | 0.0 |
| Total | 16 (100.0%) | 113.0 |
Fertility by Education by Marriage Status in Taylortown
93.8% of women with births in Taylortown are unmarried. Women with the educational attainment of bachelor's degree are most likely to be married with 100.0% of them married at childbirth, while women with the educational attainment of less than high school are least likely to be married with 100.0% of them unmarried at childbirth.
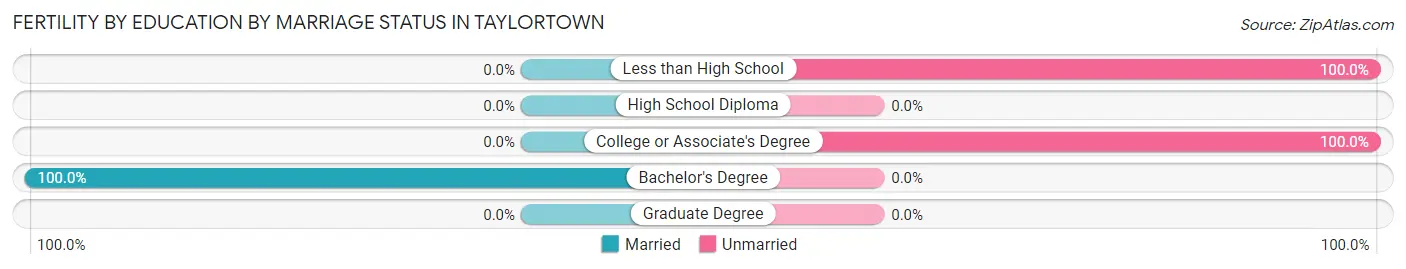
| Educational Attainment | Married | Unmarried |
| Less than High School | 0 (0.0%) | 12 (100.0%) |
| High School Diploma | 0 (0.0%) | 0 (0.0%) |
| College or Associate's Degree | 0 (0.0%) | 3 (100.0%) |
| Bachelor's Degree | 1 (100.0%) | 0 (0.0%) |
| Graduate Degree | 0 (0.0%) | 0 (0.0%) |
| Total | 1 (6.2%) | 15 (93.8%) |
Income in Taylortown
Income Overview in Taylortown
Per Capita Income in Taylortown is $29,518, while median incomes of families and households are $59,306 and $47,431 respectively.
| Characteristic | Number | Measure |
| Per Capita Income | 820 | $29,518 |
| Median Family Income | 219 | $59,306 |
| Mean Family Income | 219 | $77,628 |
| Median Household Income | 323 | $47,431 |
| Mean Household Income | 323 | $66,517 |
| Income Deficit | 219 | $0 |
| Wage / Income Gap (%) | 820 | 23.63% |
| Wage / Income Gap ($) | 820 | 76.37¢ per $1 |
| Gini / Inequality Index | 820 | 0.39 |
Earnings by Sex in Taylortown
Average Earnings in Taylortown are $35,870, $37,470 for men and $28,616 for women, a difference of 23.6%.
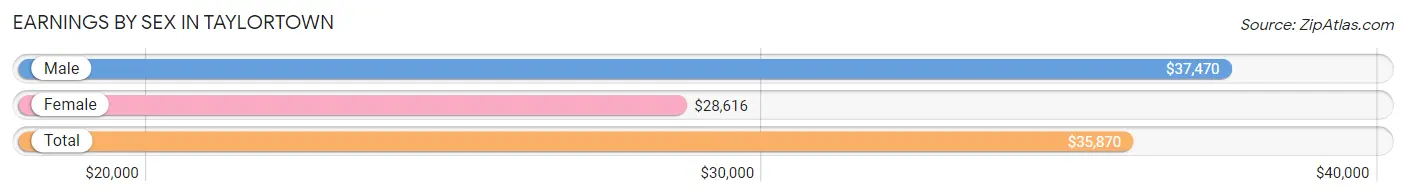
| Sex | Number | Average Earnings |
| Male | 217 (49.1%) | $37,470 |
| Female | 225 (50.9%) | $28,616 |
| Total | 442 (100.0%) | $35,870 |
Earnings by Sex by Income Bracket in Taylortown
The most common earnings brackets in Taylortown are $35,000 to $39,999 for men (50 | 23.0%) and $25,000 to $29,999 for women (40 | 17.8%).
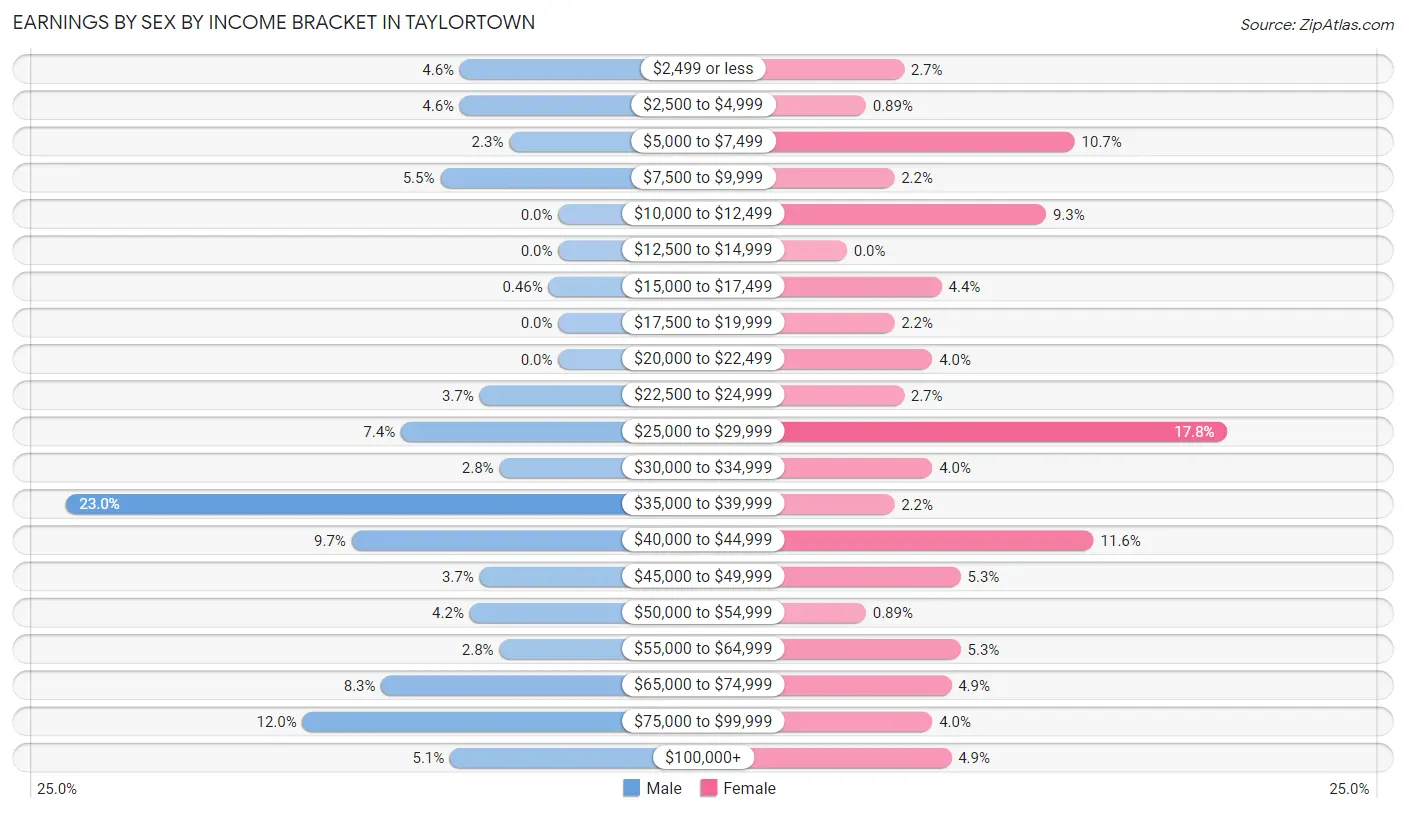
| Income | Male | Female |
| $2,499 or less | 10 (4.6%) | 6 (2.7%) |
| $2,500 to $4,999 | 10 (4.6%) | 2 (0.9%) |
| $5,000 to $7,499 | 5 (2.3%) | 24 (10.7%) |
| $7,500 to $9,999 | 12 (5.5%) | 5 (2.2%) |
| $10,000 to $12,499 | 0 (0.0%) | 21 (9.3%) |
| $12,500 to $14,999 | 0 (0.0%) | 0 (0.0%) |
| $15,000 to $17,499 | 1 (0.5%) | 10 (4.4%) |
| $17,500 to $19,999 | 0 (0.0%) | 5 (2.2%) |
| $20,000 to $22,499 | 0 (0.0%) | 9 (4.0%) |
| $22,500 to $24,999 | 8 (3.7%) | 6 (2.7%) |
| $25,000 to $29,999 | 16 (7.4%) | 40 (17.8%) |
| $30,000 to $34,999 | 6 (2.8%) | 9 (4.0%) |
| $35,000 to $39,999 | 50 (23.0%) | 5 (2.2%) |
| $40,000 to $44,999 | 21 (9.7%) | 26 (11.6%) |
| $45,000 to $49,999 | 8 (3.7%) | 12 (5.3%) |
| $50,000 to $54,999 | 9 (4.2%) | 2 (0.9%) |
| $55,000 to $64,999 | 6 (2.8%) | 12 (5.3%) |
| $65,000 to $74,999 | 18 (8.3%) | 11 (4.9%) |
| $75,000 to $99,999 | 26 (12.0%) | 9 (4.0%) |
| $100,000+ | 11 (5.1%) | 11 (4.9%) |
| Total | 217 (100.0%) | 225 (100.0%) |
Earnings by Sex by Educational Attainment in Taylortown
Average earnings in Taylortown are $41,176 for men and $29,152 for women, a difference of 29.2%. Men with an educational attainment of bachelor's degree enjoy the highest average annual earnings of $89,500, while those with college or associate's degree education earn the least with $36,829. Women with an educational attainment of bachelor's degree earn the most with the average annual earnings of $46,250, while those with high school diploma education have the smallest earnings of $20,000.
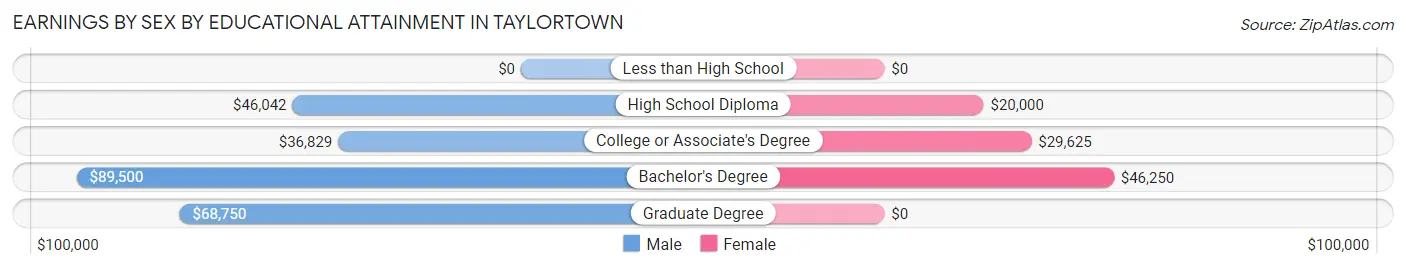
| Educational Attainment | Male Income | Female Income |
| Less than High School | - | - |
| High School Diploma | $46,042 | $20,000 |
| College or Associate's Degree | $36,829 | $29,625 |
| Bachelor's Degree | $89,500 | $46,250 |
| Graduate Degree | $68,750 | $0 |
| Total | $41,176 | $29,152 |
Family Income in Taylortown
Family Income Brackets in Taylortown
According to the Taylortown family income data, there are 58 families falling into the $35,000 to $49,999 income range, which is the most common income bracket and makes up 26.5% of all families.
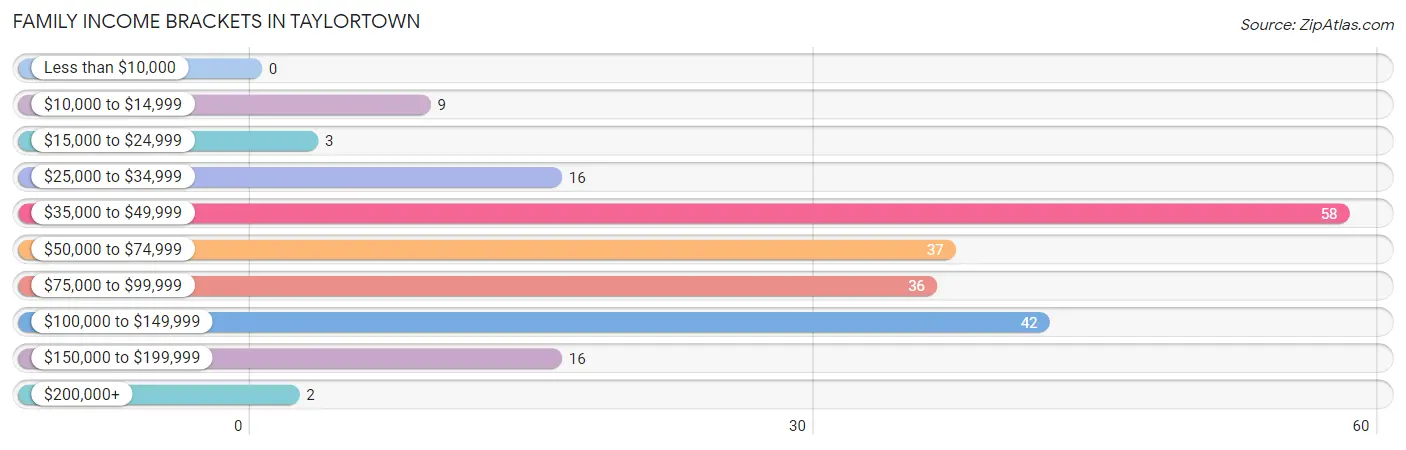
| Income Bracket | # Families | % Families |
| Less than $10,000 | 0 | 0.0% |
| $10,000 to $14,999 | 9 | 4.1% |
| $15,000 to $24,999 | 3 | 1.4% |
| $25,000 to $34,999 | 16 | 7.3% |
| $35,000 to $49,999 | 58 | 26.5% |
| $50,000 to $74,999 | 37 | 16.9% |
| $75,000 to $99,999 | 36 | 16.4% |
| $100,000 to $149,999 | 42 | 19.2% |
| $150,000 to $199,999 | 16 | 7.3% |
| $200,000+ | 2 | 0.9% |
Family Income by Famaliy Size in Taylortown
5-person families (12 | 5.5%) account for the highest median family income in Taylortown with $131,875 per family, while 4-person families (15 | 6.9%) have the highest median income of $28,476 per family member.
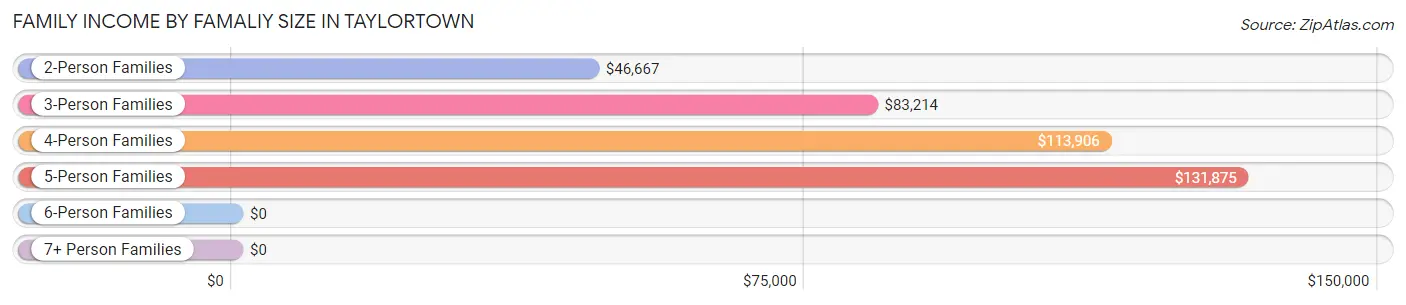
| Income Bracket | # Families | Median Income |
| 2-Person Families | 116 (53.0%) | $46,667 |
| 3-Person Families | 76 (34.7%) | $83,214 |
| 4-Person Families | 15 (6.9%) | $113,906 |
| 5-Person Families | 12 (5.5%) | $131,875 |
| 6-Person Families | 0 (0.0%) | $0 |
| 7+ Person Families | 0 (0.0%) | $0 |
| Total | 219 (100.0%) | $59,306 |
Family Income by Number of Earners in Taylortown
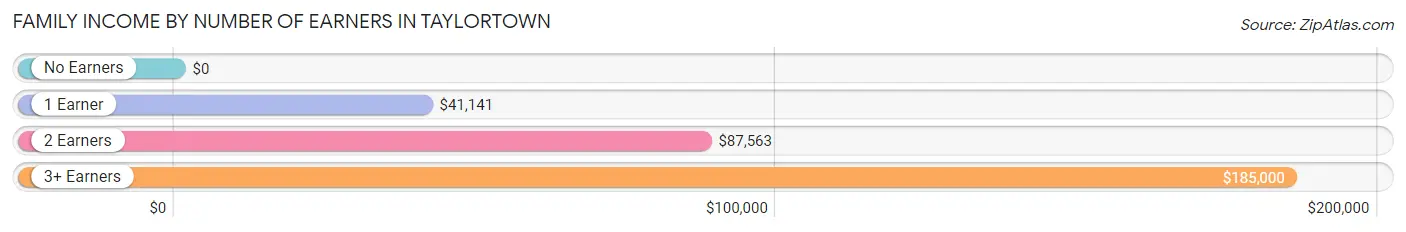
| Number of Earners | # Families | Median Income |
| No Earners | 31 (14.2%) | $0 |
| 1 Earner | 65 (29.7%) | $41,141 |
| 2 Earners | 103 (47.0%) | $87,563 |
| 3+ Earners | 20 (9.1%) | $185,000 |
| Total | 219 (100.0%) | $59,306 |
Household Income in Taylortown
Household Income Brackets in Taylortown
With 75 households falling in the category, the $35,000 to $49,999 income range is the most frequent in Taylortown, accounting for 23.2% of all households. In contrast, only 2 households (0.6%) fall into the $200,000+ income bracket, making it the least populous group.
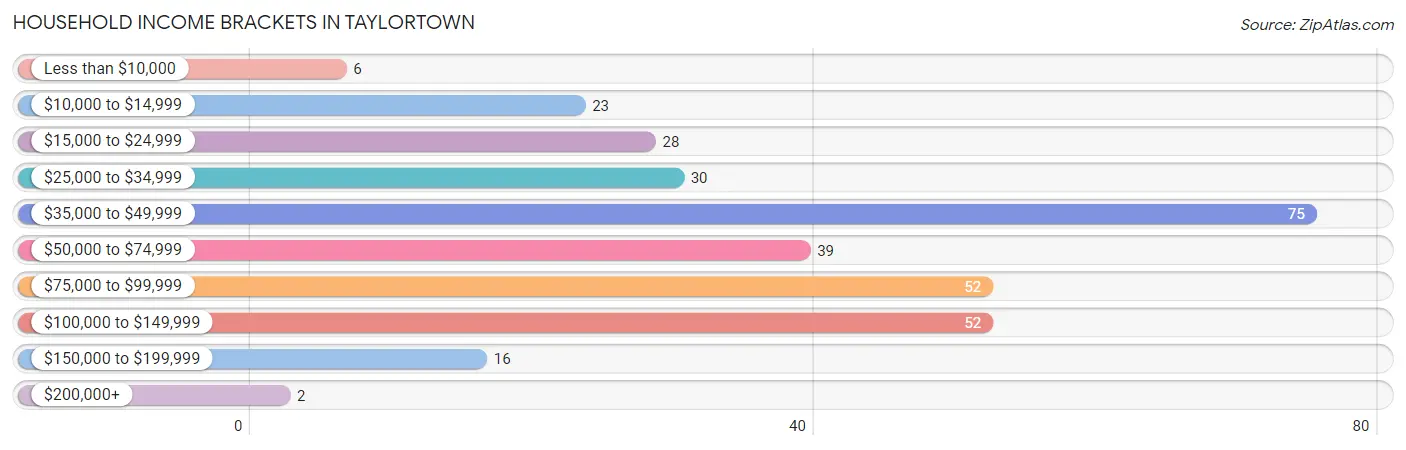
| Income Bracket | # Households | % Households |
| Less than $10,000 | 6 | 1.9% |
| $10,000 to $14,999 | 23 | 7.1% |
| $15,000 to $24,999 | 28 | 8.7% |
| $25,000 to $34,999 | 30 | 9.3% |
| $35,000 to $49,999 | 75 | 23.2% |
| $50,000 to $74,999 | 39 | 12.1% |
| $75,000 to $99,999 | 52 | 16.1% |
| $100,000 to $149,999 | 52 | 16.1% |
| $150,000 to $199,999 | 16 | 5.0% |
| $200,000+ | 2 | 0.6% |
Household Income by Householder Age in Taylortown
The median household income in Taylortown is $47,431, with the highest median household income of $62,500 found in the 45 to 64 years age bracket for the primary householder. A total of 148 households (45.8%) fall into this category.

| Income Bracket | # Households | Median Income |
| 15 to 24 Years | 0 (0.0%) | $0 |
| 25 to 44 Years | 73 (22.6%) | $58,750 |
| 45 to 64 Years | 148 (45.8%) | $62,500 |
| 65+ Years | 102 (31.6%) | $31,250 |
| Total | 323 (100.0%) | $47,431 |
Poverty in Taylortown
Income Below Poverty by Sex and Age in Taylortown
With 3.5% poverty level for males and 13.5% for females among the residents of Taylortown, 75 year old and over males and 16 and 17 year old females are the most vulnerable to poverty, with 6 males (20.7%) and 6 females (42.9%) in their respective age groups living below the poverty level.
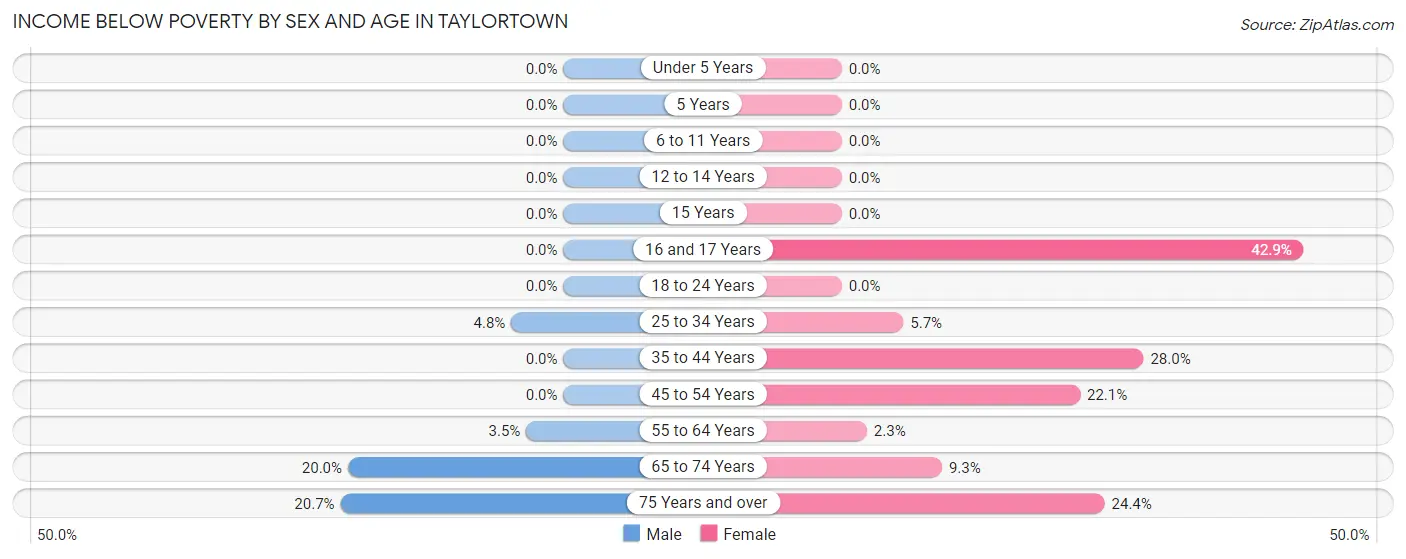
| Age Bracket | Male | Female |
| Under 5 Years | 0 (0.0%) | 0 (0.0%) |
| 5 Years | 0 (0.0%) | 0 (0.0%) |
| 6 to 11 Years | 0 (0.0%) | 0 (0.0%) |
| 12 to 14 Years | 0 (0.0%) | 0 (0.0%) |
| 15 Years | 0 (0.0%) | 0 (0.0%) |
| 16 and 17 Years | 0 (0.0%) | 6 (42.9%) |
| 18 to 24 Years | 0 (0.0%) | 0 (0.0%) |
| 25 to 34 Years | 3 (4.8%) | 2 (5.7%) |
| 35 to 44 Years | 0 (0.0%) | 7 (28.0%) |
| 45 to 54 Years | 0 (0.0%) | 21 (22.1%) |
| 55 to 64 Years | 2 (3.5%) | 2 (2.3%) |
| 65 to 74 Years | 4 (20.0%) | 4 (9.3%) |
| 75 Years and over | 6 (20.7%) | 10 (24.4%) |
| Total | 15 (3.5%) | 52 (13.5%) |
Income Above Poverty by Sex and Age in Taylortown
According to the poverty statistics in Taylortown, males aged under 5 years and females aged under 5 years are the age groups that are most secure financially, with 100.0% of males and 100.0% of females in these age groups living above the poverty line.
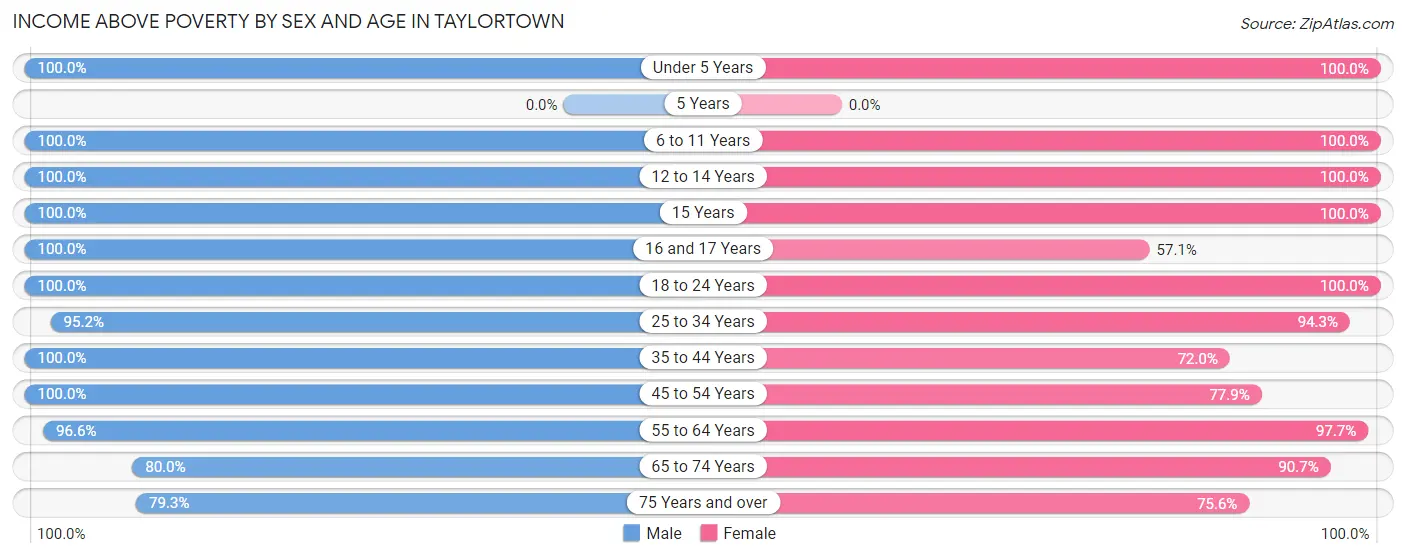
| Age Bracket | Male | Female |
| Under 5 Years | 40 (100.0%) | 14 (100.0%) |
| 5 Years | 0 (0.0%) | 0 (0.0%) |
| 6 to 11 Years | 41 (100.0%) | 13 (100.0%) |
| 12 to 14 Years | 6 (100.0%) | 5 (100.0%) |
| 15 Years | 19 (100.0%) | 2 (100.0%) |
| 16 and 17 Years | 8 (100.0%) | 8 (57.1%) |
| 18 to 24 Years | 30 (100.0%) | 12 (100.0%) |
| 25 to 34 Years | 59 (95.2%) | 33 (94.3%) |
| 35 to 44 Years | 47 (100.0%) | 18 (72.0%) |
| 45 to 54 Years | 75 (100.0%) | 74 (77.9%) |
| 55 to 64 Years | 56 (96.6%) | 84 (97.7%) |
| 65 to 74 Years | 16 (80.0%) | 39 (90.7%) |
| 75 Years and over | 23 (79.3%) | 31 (75.6%) |
| Total | 420 (96.6%) | 333 (86.5%) |
Income Below Poverty Among Married-Couple Families in Taylortown
The poverty statistics for married-couple families in Taylortown show that 1.6% or 2 of the total 124 families live below the poverty line. Families with no children have the highest poverty rate of 2.6%, comprising of 2 families. On the other hand, families with 1 or 2 children have the lowest poverty rate of 0.0%, which includes 0 families.
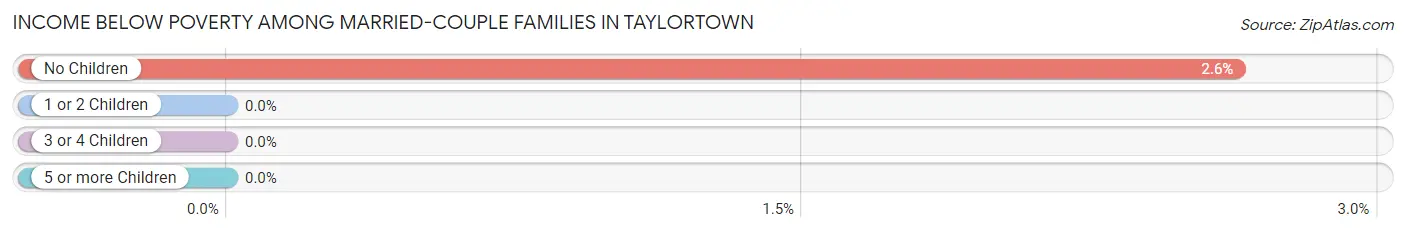
| Children | Above Poverty | Below Poverty |
| No Children | 74 (97.4%) | 2 (2.6%) |
| 1 or 2 Children | 44 (100.0%) | 0 (0.0%) |
| 3 or 4 Children | 4 (100.0%) | 0 (0.0%) |
| 5 or more Children | 0 (0.0%) | 0 (0.0%) |
| Total | 122 (98.4%) | 2 (1.6%) |
Income Below Poverty Among Single-Parent Households in Taylortown
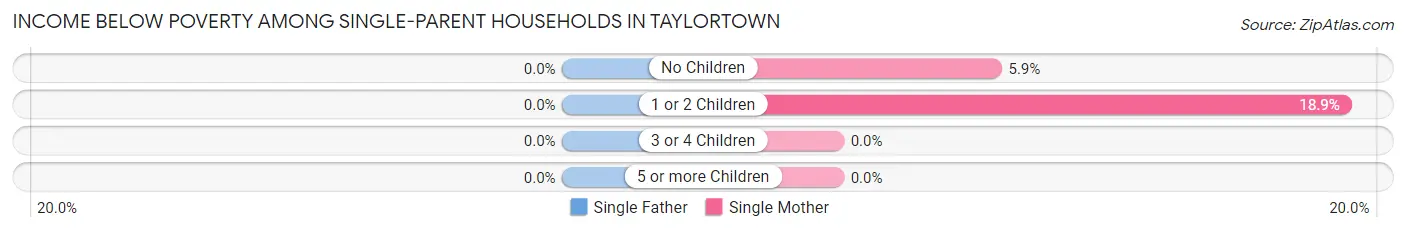
| Children | Single Father | Single Mother |
| No Children | 0 (0.0%) | 2 (5.9%) |
| 1 or 2 Children | 0 (0.0%) | 7 (18.9%) |
| 3 or 4 Children | 0 (0.0%) | 0 (0.0%) |
| 5 or more Children | 0 (0.0%) | 0 (0.0%) |
| Total | 0 (0.0%) | 9 (12.7%) |
Income Below Poverty Among Married-Couple vs Single-Parent Households in Taylortown
The poverty data for Taylortown shows that 2 of the married-couple family households (1.6%) and 9 of the single-parent households (9.5%) are living below the poverty level. Within the married-couple family households, those with no children have the highest poverty rate, with 2 households (2.6%) falling below the poverty line. Among the single-parent households, those with 1 or 2 children have the highest poverty rate, with 7 household (12.5%) living below poverty.
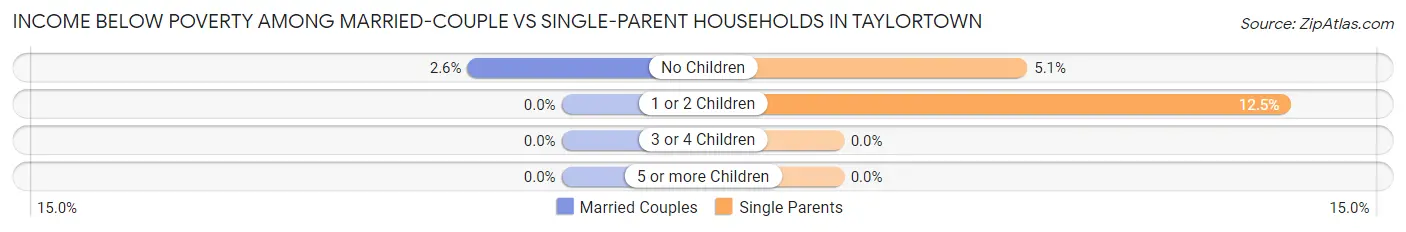
| Children | Married-Couple Families | Single-Parent Households |
| No Children | 2 (2.6%) | 2 (5.1%) |
| 1 or 2 Children | 0 (0.0%) | 7 (12.5%) |
| 3 or 4 Children | 0 (0.0%) | 0 (0.0%) |
| 5 or more Children | 0 (0.0%) | 0 (0.0%) |
| Total | 2 (1.6%) | 9 (9.5%) |
Employment Characteristics in Taylortown
Employment by Class of Employer in Taylortown
Among the 392 employed individuals in Taylortown, private company employees (224 | 57.1%), local government employees (46 | 11.7%), and state government employees (42 | 10.7%) make up the most common classes of employment.
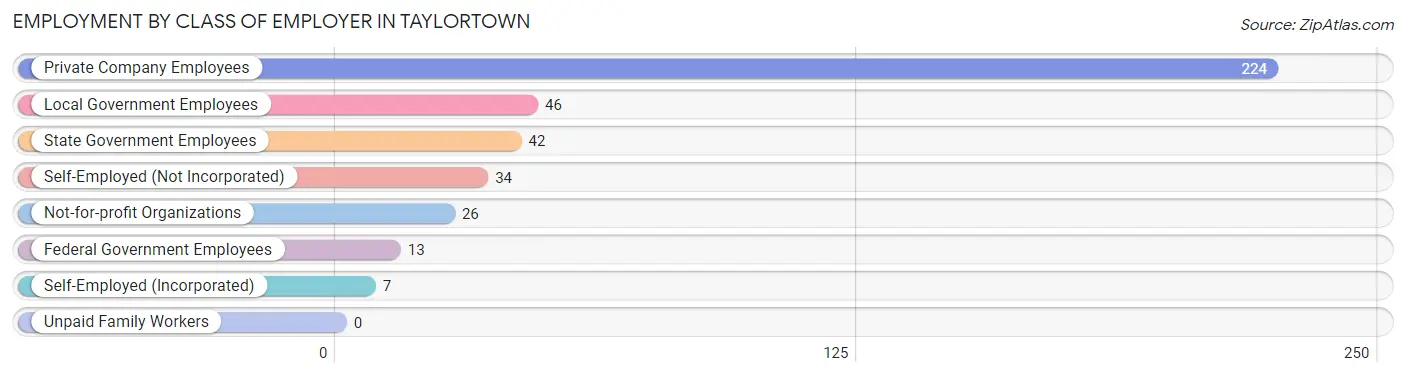
| Employer Class | # Employees | % Employees |
| Private Company Employees | 224 | 57.1% |
| Self-Employed (Incorporated) | 7 | 1.8% |
| Self-Employed (Not Incorporated) | 34 | 8.7% |
| Not-for-profit Organizations | 26 | 6.6% |
| Local Government Employees | 46 | 11.7% |
| State Government Employees | 42 | 10.7% |
| Federal Government Employees | 13 | 3.3% |
| Unpaid Family Workers | 0 | 0.0% |
| Total | 392 | 100.0% |
Employment Status by Age in Taylortown
According to the labor force statistics for Taylortown, out of the total population over 16 years of age (680), 61.5% or 418 individuals are in the labor force, with 5.1% or 21 of them unemployed. The age group with the highest labor force participation rate is 25 to 29 years, with 100.0% or 72 individuals in the labor force. Within the labor force, the 55 to 59 years age range has the highest percentage of unemployed individuals, with 15.5% or 11 of them being unemployed.
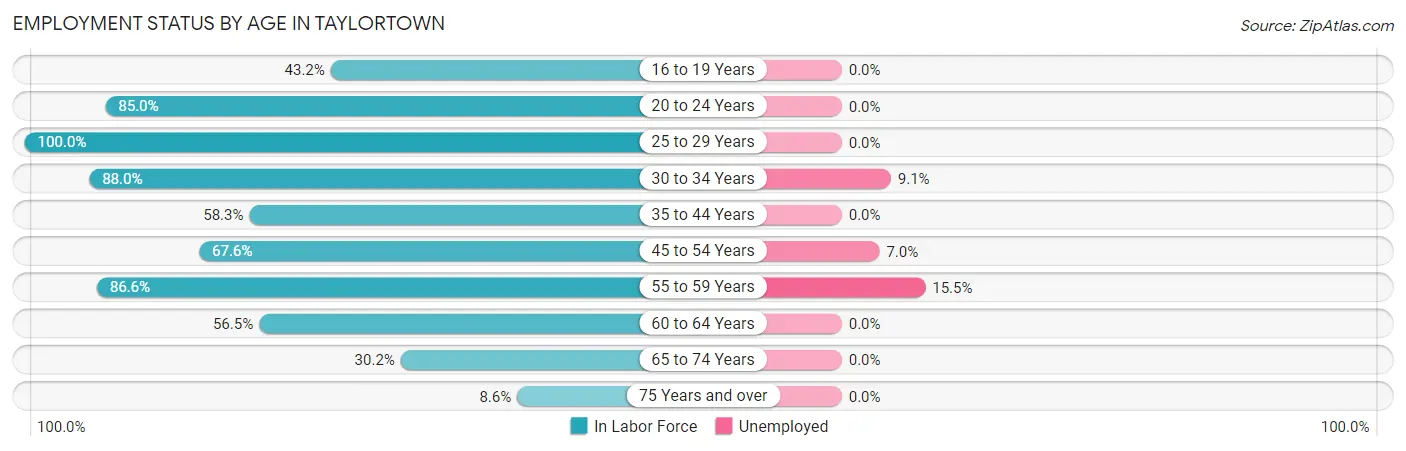
| Age Bracket | In Labor Force | Unemployed |
| 16 to 19 Years | 19 (43.2%) | 0 (0.0%) |
| 20 to 24 Years | 17 (85.0%) | 0 (0.0%) |
| 25 to 29 Years | 72 (100.0%) | 0 (0.0%) |
| 30 to 34 Years | 22 (88.0%) | 2 (9.1%) |
| 35 to 44 Years | 42 (58.3%) | 0 (0.0%) |
| 45 to 54 Years | 115 (67.6%) | 8 (7.0%) |
| 55 to 59 Years | 71 (86.6%) | 11 (15.5%) |
| 60 to 64 Years | 35 (56.5%) | 0 (0.0%) |
| 65 to 74 Years | 19 (30.2%) | 0 (0.0%) |
| 75 Years and over | 6 (8.6%) | 0 (0.0%) |
| Total | 418 (61.5%) | 21 (5.1%) |
Employment Status by Educational Attainment in Taylortown
According to labor force statistics for Taylortown, 73.9% of individuals (357) out of the total population between 25 and 64 years of age (483) are in the labor force, with 6.0% or 21 of them being unemployed. The group with the highest labor force participation rate are those with the educational attainment of college / associate degree, with 86.9% or 185 individuals in the labor force. Within the labor force, individuals with high school diploma education have the highest percentage of unemployment, with 19.4% or 22 of them being unemployed.
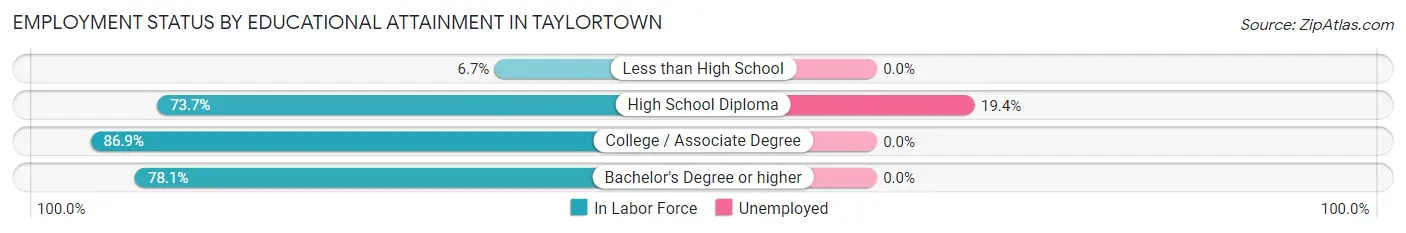
| Educational Attainment | In Labor Force | Unemployed |
| Less than High School | 3 (6.7%) | 0 (0.0%) |
| High School Diploma | 112 (73.7%) | 29 (19.4%) |
| College / Associate Degree | 185 (86.9%) | 0 (0.0%) |
| Bachelor's Degree or higher | 57 (78.1%) | 0 (0.0%) |
| Total | 357 (73.9%) | 29 (6.0%) |
Employment Occupations by Sex in Taylortown
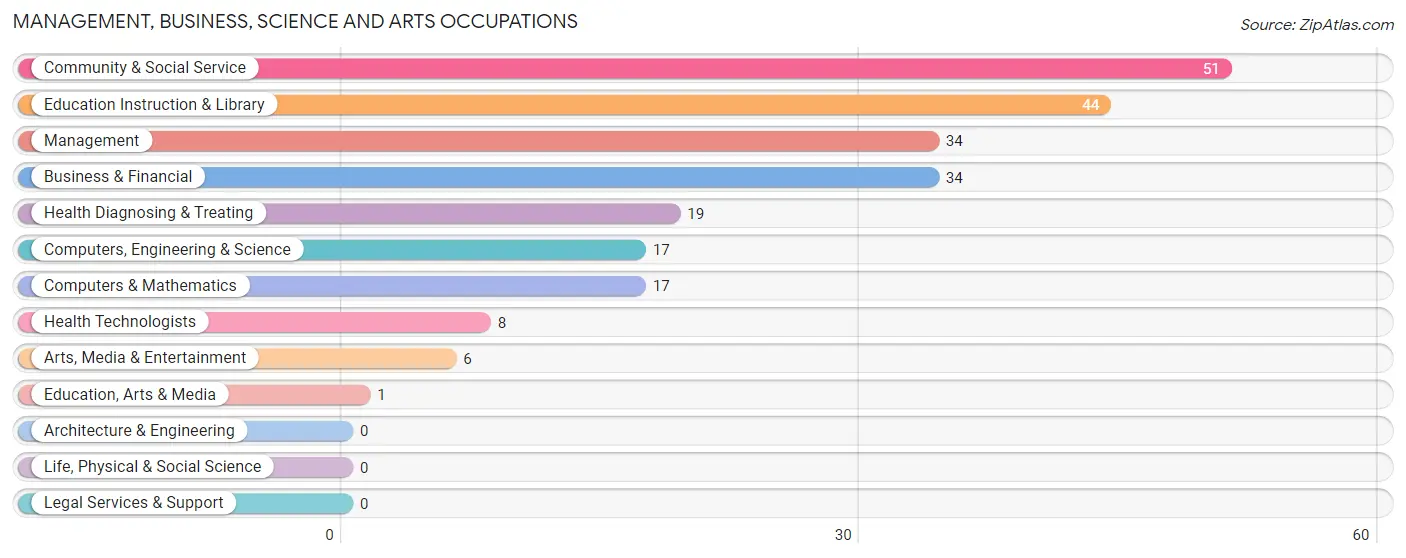
Management, Business, Science and Arts Occupations
The most common Management, Business, Science and Arts occupations in Taylortown are Community & Social Service (51 | 13.0%), Education Instruction & Library (44 | 11.3%), Management (34 | 8.7%), Business & Financial (34 | 8.7%), and Health Diagnosing & Treating (19 | 4.9%).
Management, Business, Science and Arts Occupations by Sex
Within the Management, Business, Science and Arts occupations in Taylortown, the most male-oriented occupations are Education, Arts & Media (100.0%), Arts, Media & Entertainment (100.0%), and Business & Financial (50.0%), while the most female-oriented occupations are Health Technologists (75.0%), Computers, Engineering & Science (64.7%), and Computers & Mathematics (64.7%).
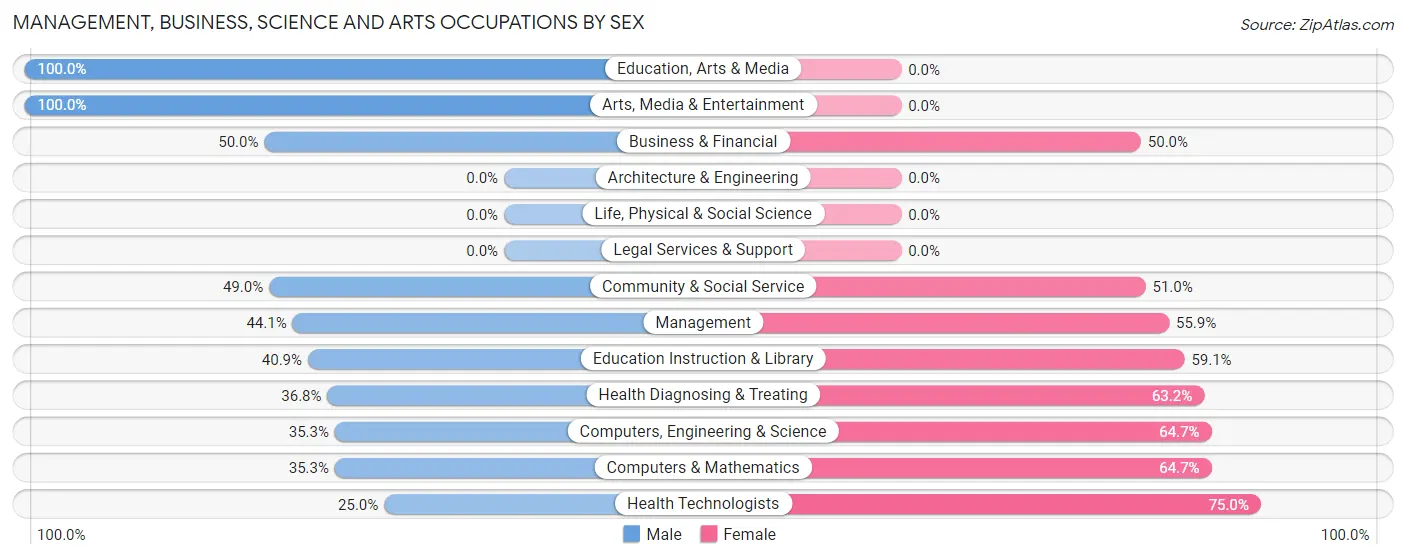
| Occupation | Male | Female |
| Management | 15 (44.1%) | 19 (55.9%) |
| Business & Financial | 17 (50.0%) | 17 (50.0%) |
| Computers, Engineering & Science | 6 (35.3%) | 11 (64.7%) |
| Computers & Mathematics | 6 (35.3%) | 11 (64.7%) |
| Architecture & Engineering | 0 (0.0%) | 0 (0.0%) |
| Life, Physical & Social Science | 0 (0.0%) | 0 (0.0%) |
| Community & Social Service | 25 (49.0%) | 26 (51.0%) |
| Education, Arts & Media | 1 (100.0%) | 0 (0.0%) |
| Legal Services & Support | 0 (0.0%) | 0 (0.0%) |
| Education Instruction & Library | 18 (40.9%) | 26 (59.1%) |
| Arts, Media & Entertainment | 6 (100.0%) | 0 (0.0%) |
| Health Diagnosing & Treating | 7 (36.8%) | 12 (63.2%) |
| Health Technologists | 2 (25.0%) | 6 (75.0%) |
| Total (Category) | 70 (45.2%) | 85 (54.8%) |
| Total (Overall) | 196 (50.1%) | 195 (49.9%) |
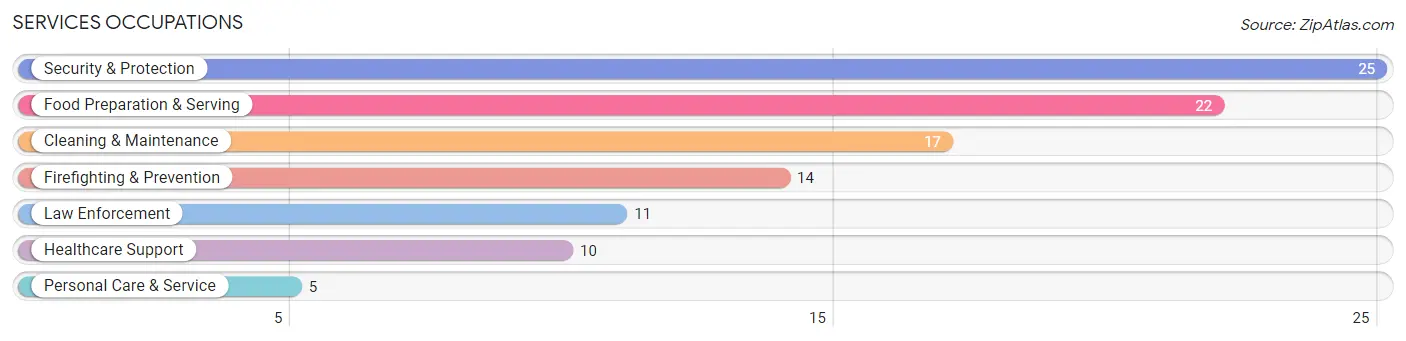
Services Occupations
The most common Services occupations in Taylortown are Security & Protection (25 | 6.4%), Food Preparation & Serving (22 | 5.6%), Cleaning & Maintenance (17 | 4.3%), Firefighting & Prevention (14 | 3.6%), and Law Enforcement (11 | 2.8%).
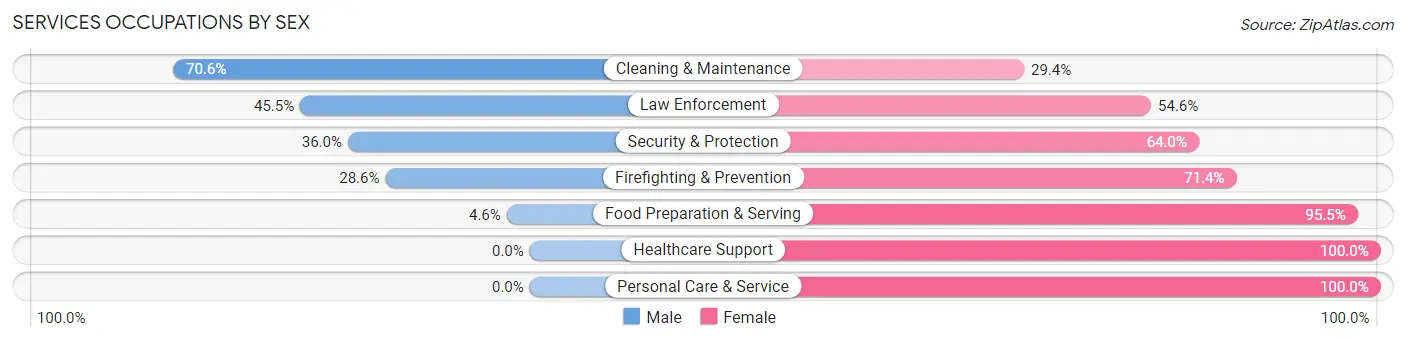
Services Occupations by Sex
Within the Services occupations in Taylortown, the most male-oriented occupations are Cleaning & Maintenance (70.6%), Law Enforcement (45.5%), and Security & Protection (36.0%), while the most female-oriented occupations are Healthcare Support (100.0%), Personal Care & Service (100.0%), and Food Preparation & Serving (95.5%).
| Occupation | Male | Female |
| Healthcare Support | 0 (0.0%) | 10 (100.0%) |
| Security & Protection | 9 (36.0%) | 16 (64.0%) |
| Firefighting & Prevention | 4 (28.6%) | 10 (71.4%) |
| Law Enforcement | 5 (45.5%) | 6 (54.5%) |
| Food Preparation & Serving | 1 (4.5%) | 21 (95.5%) |
| Cleaning & Maintenance | 12 (70.6%) | 5 (29.4%) |
| Personal Care & Service | 0 (0.0%) | 5 (100.0%) |
| Total (Category) | 22 (27.9%) | 57 (72.2%) |
| Total (Overall) | 196 (50.1%) | 195 (49.9%) |
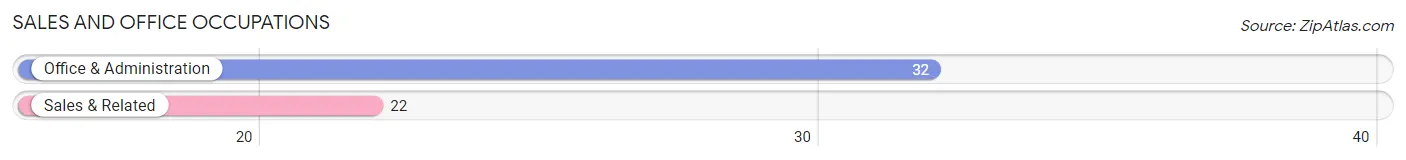
Sales and Office Occupations
The most common Sales and Office occupations in Taylortown are Office & Administration (32 | 8.2%), and Sales & Related (22 | 5.6%).
Sales and Office Occupations by Sex
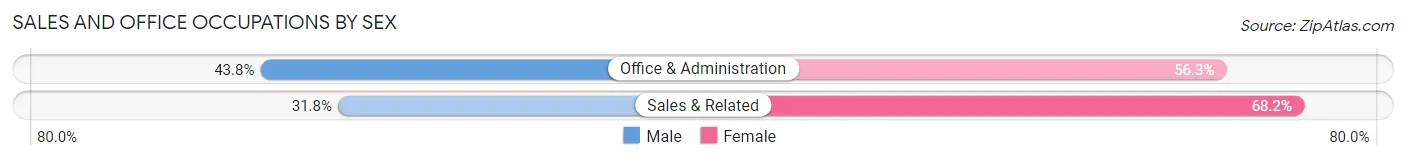
| Occupation | Male | Female |
| Sales & Related | 7 (31.8%) | 15 (68.2%) |
| Office & Administration | 14 (43.8%) | 18 (56.2%) |
| Total (Category) | 21 (38.9%) | 33 (61.1%) |
| Total (Overall) | 196 (50.1%) | 195 (49.9%) |
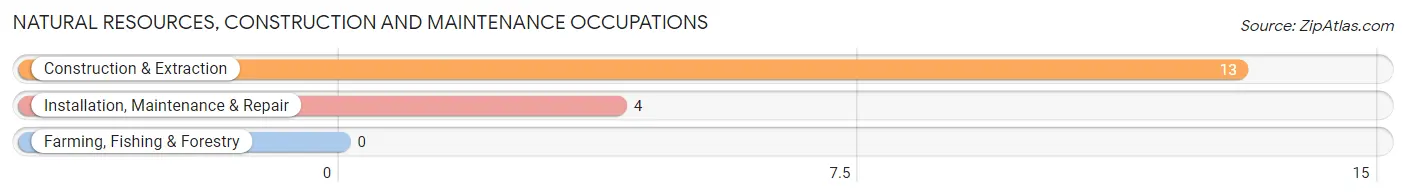
Natural Resources, Construction and Maintenance Occupations
The most common Natural Resources, Construction and Maintenance occupations in Taylortown are Construction & Extraction (13 | 3.3%), and Installation, Maintenance & Repair (4 | 1.0%).
Natural Resources, Construction and Maintenance Occupations by Sex
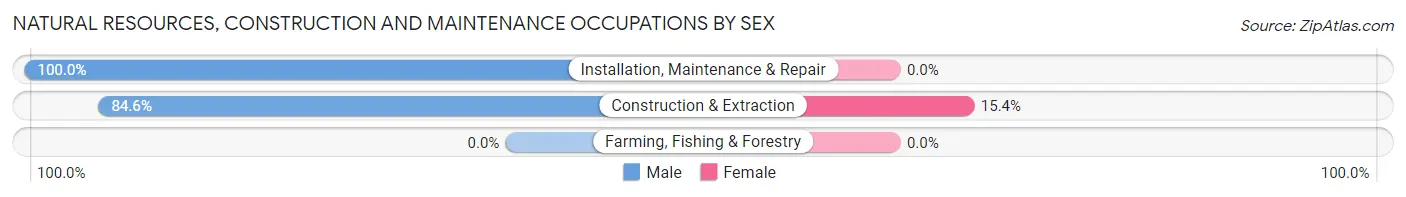
| Occupation | Male | Female |
| Farming, Fishing & Forestry | 0 (0.0%) | 0 (0.0%) |
| Construction & Extraction | 11 (84.6%) | 2 (15.4%) |
| Installation, Maintenance & Repair | 4 (100.0%) | 0 (0.0%) |
| Total (Category) | 15 (88.2%) | 2 (11.8%) |
| Total (Overall) | 196 (50.1%) | 195 (49.9%) |
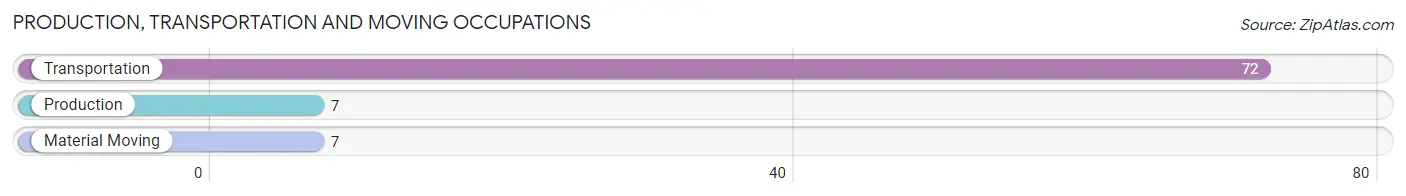
Production, Transportation and Moving Occupations
The most common Production, Transportation and Moving occupations in Taylortown are Transportation (72 | 18.4%), Production (7 | 1.8%), and Material Moving (7 | 1.8%).
Production, Transportation and Moving Occupations by Sex
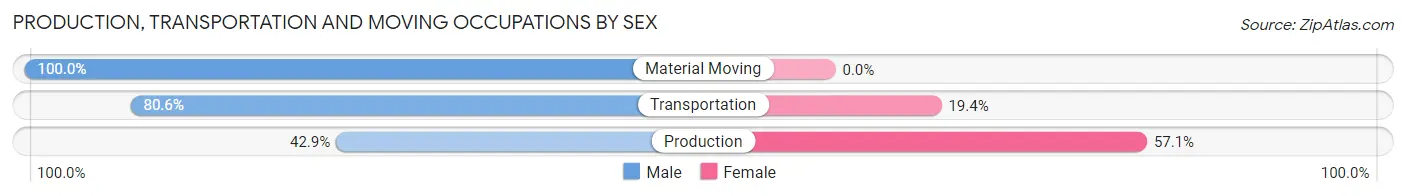
| Occupation | Male | Female |
| Production | 3 (42.9%) | 4 (57.1%) |
| Transportation | 58 (80.6%) | 14 (19.4%) |
| Material Moving | 7 (100.0%) | 0 (0.0%) |
| Total (Category) | 68 (79.1%) | 18 (20.9%) |
| Total (Overall) | 196 (50.1%) | 195 (49.9%) |
Employment Industries by Sex in Taylortown
Employment Industries in Taylortown
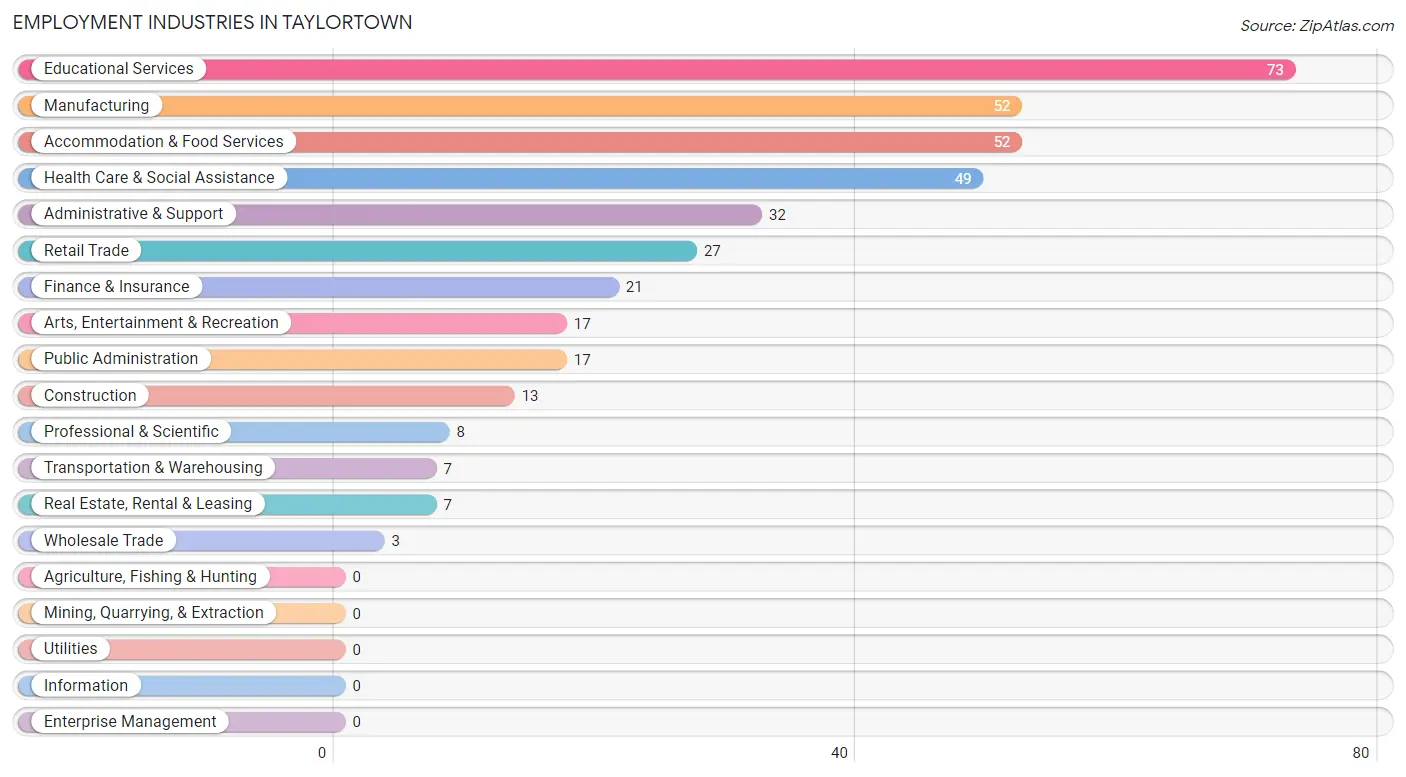
The major employment industries in Taylortown include Educational Services (73 | 18.7%), Manufacturing (52 | 13.3%), Accommodation & Food Services (52 | 13.3%), Health Care & Social Assistance (49 | 12.5%), and Administrative & Support (32 | 8.2%).
Employment Industries by Sex in Taylortown
The Taylortown industries that see more men than women are Wholesale Trade (100.0%), Real Estate, Rental & Leasing (100.0%), and Manufacturing (92.3%), whereas the industries that tend to have a higher number of women are Transportation & Warehousing (100.0%), Accommodation & Food Services (78.8%), and Educational Services (76.7%).
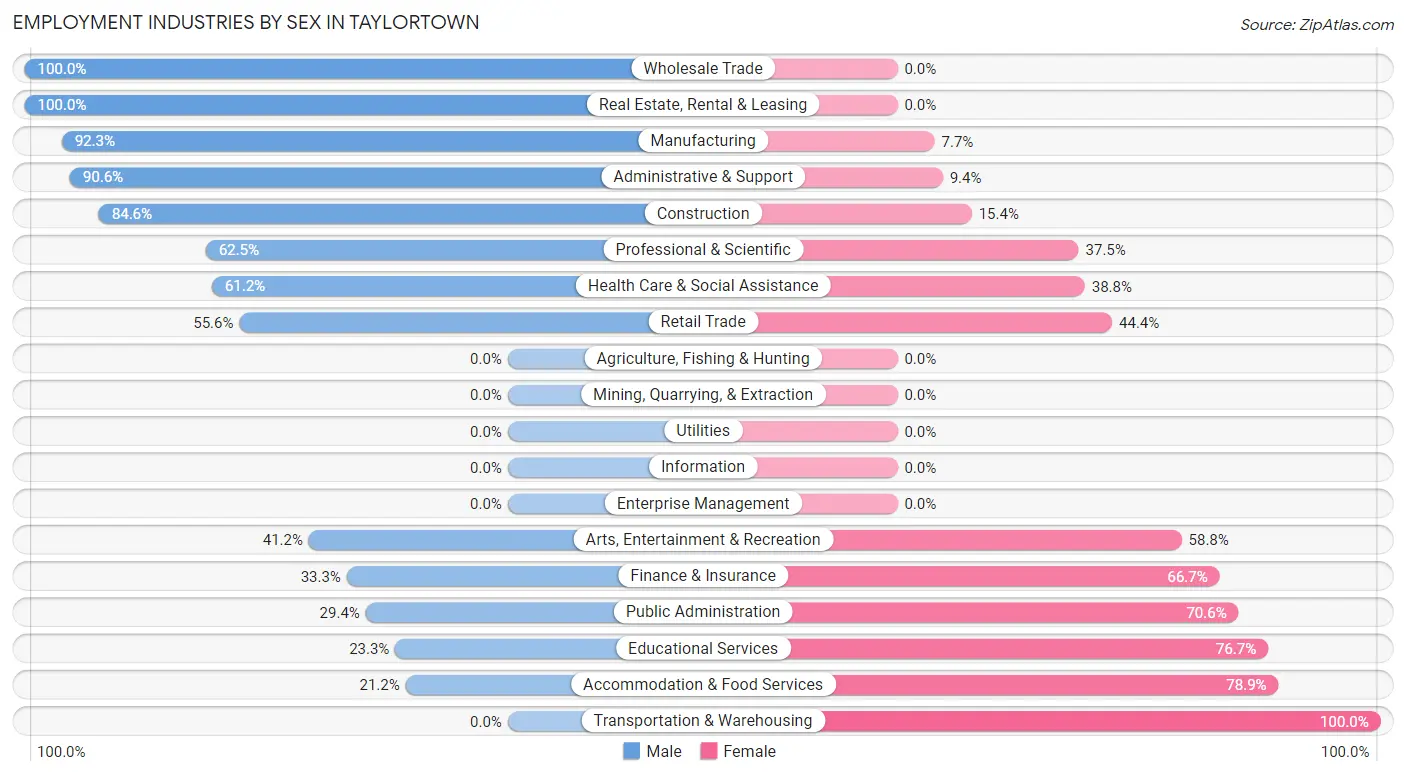
| Industry | Male | Female |
| Agriculture, Fishing & Hunting | 0 (0.0%) | 0 (0.0%) |
| Mining, Quarrying, & Extraction | 0 (0.0%) | 0 (0.0%) |
| Construction | 11 (84.6%) | 2 (15.4%) |
| Manufacturing | 48 (92.3%) | 4 (7.7%) |
| Wholesale Trade | 3 (100.0%) | 0 (0.0%) |
| Retail Trade | 15 (55.6%) | 12 (44.4%) |
| Transportation & Warehousing | 0 (0.0%) | 7 (100.0%) |
| Utilities | 0 (0.0%) | 0 (0.0%) |
| Information | 0 (0.0%) | 0 (0.0%) |
| Finance & Insurance | 7 (33.3%) | 14 (66.7%) |
| Real Estate, Rental & Leasing | 7 (100.0%) | 0 (0.0%) |
| Professional & Scientific | 5 (62.5%) | 3 (37.5%) |
| Enterprise Management | 0 (0.0%) | 0 (0.0%) |
| Administrative & Support | 29 (90.6%) | 3 (9.4%) |
| Educational Services | 17 (23.3%) | 56 (76.7%) |
| Health Care & Social Assistance | 30 (61.2%) | 19 (38.8%) |
| Arts, Entertainment & Recreation | 7 (41.2%) | 10 (58.8%) |
| Accommodation & Food Services | 11 (21.1%) | 41 (78.8%) |
| Public Administration | 5 (29.4%) | 12 (70.6%) |
| Total | 196 (50.1%) | 195 (49.9%) |
Education in Taylortown
School Enrollment in Taylortown
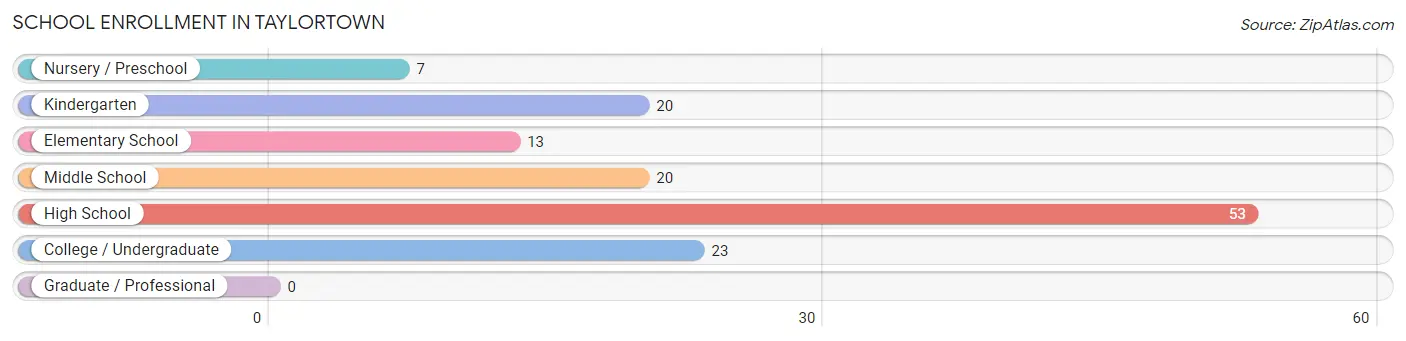
The most common levels of schooling among the 136 students in Taylortown are high school (53 | 39.0%), college / undergraduate (23 | 16.9%), and kindergarten (20 | 14.7%).
| School Level | # Students | % Students |
| Nursery / Preschool | 7 | 5.1% |
| Kindergarten | 20 | 14.7% |
| Elementary School | 13 | 9.6% |
| Middle School | 20 | 14.7% |
| High School | 53 | 39.0% |
| College / Undergraduate | 23 | 16.9% |
| Graduate / Professional | 0 | 0.0% |
| Total | 136 | 100.0% |
School Enrollment by Age by Funding Source in Taylortown
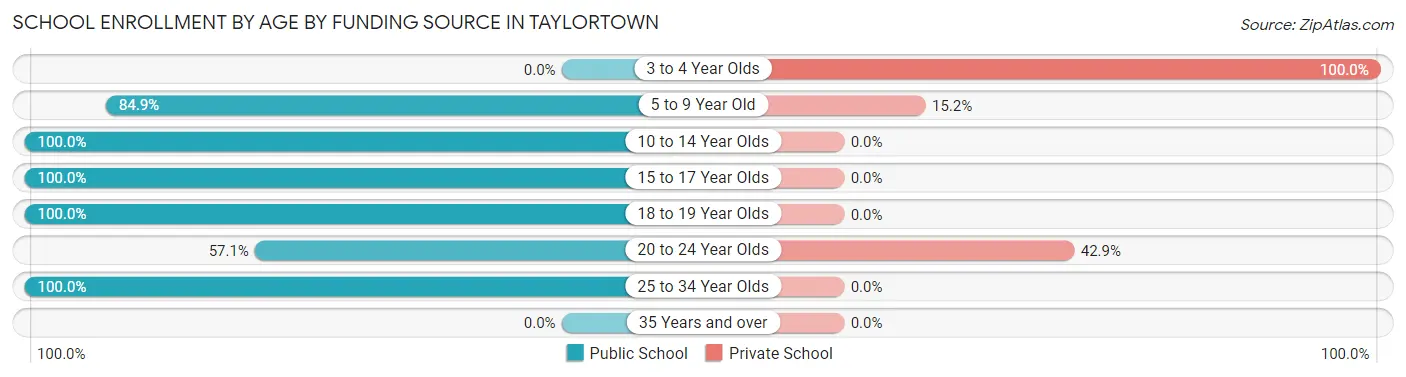
Out of a total of 136 students who are enrolled in schools in Taylortown, 15 (11.0%) attend a private institution, while the remaining 121 (89.0%) are enrolled in public schools. The age group of 3 to 4 year olds has the highest likelihood of being enrolled in private schools, with 7 (100.0% in the age bracket) enrolled. Conversely, the age group of 10 to 14 year olds has the lowest likelihood of being enrolled in a private school, with 20 (100.0% in the age bracket) attending a public institution.
| Age Bracket | Public School | Private School |
| 3 to 4 Year Olds | 0 (0.0%) | 7 (100.0%) |
| 5 to 9 Year Old | 28 (84.9%) | 5 (15.1%) |
| 10 to 14 Year Olds | 20 (100.0%) | 0 (0.0%) |
| 15 to 17 Year Olds | 43 (100.0%) | 0 (0.0%) |
| 18 to 19 Year Olds | 10 (100.0%) | 0 (0.0%) |
| 20 to 24 Year Olds | 4 (57.1%) | 3 (42.9%) |
| 25 to 34 Year Olds | 16 (100.0%) | 0 (0.0%) |
| 35 Years and over | 0 (0.0%) | 0 (0.0%) |
| Total | 121 (89.0%) | 15 (11.0%) |
Educational Attainment by Field of Study in Taylortown
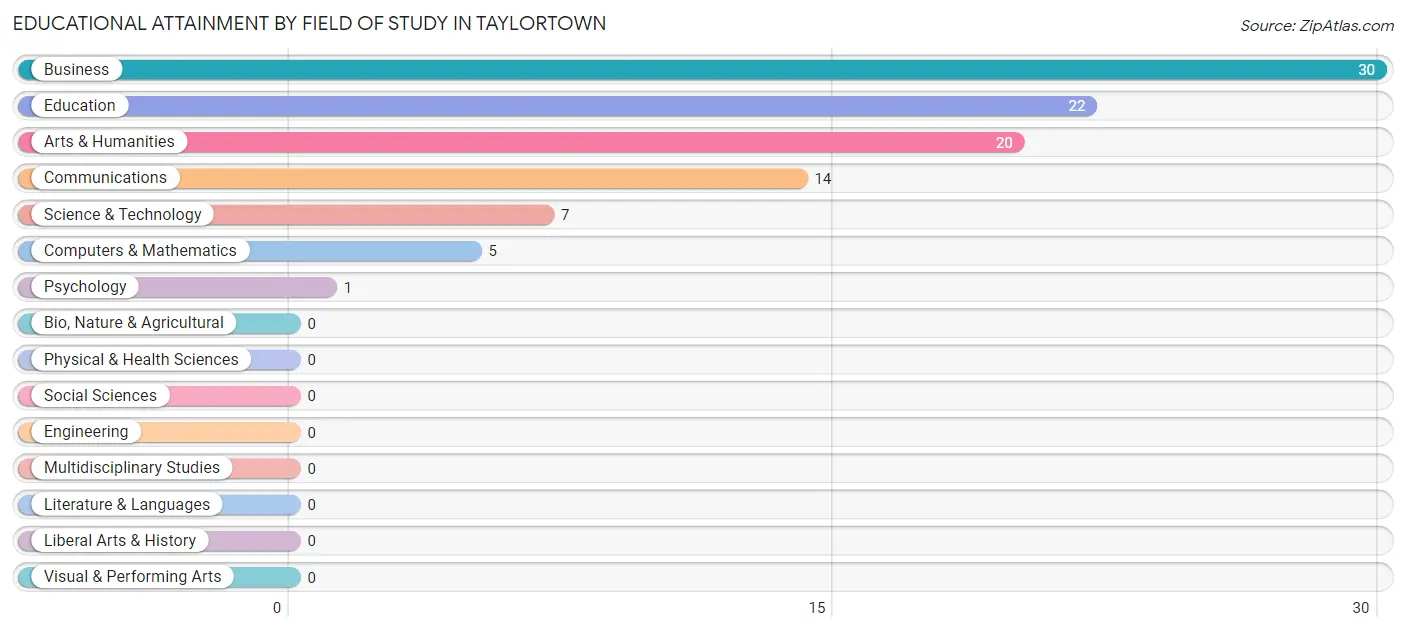
Business (30 | 30.3%), education (22 | 22.2%), arts & humanities (20 | 20.2%), communications (14 | 14.1%), and science & technology (7 | 7.1%) are the most common fields of study among 99 individuals in Taylortown who have obtained a bachelor's degree or higher.
| Field of Study | # Graduates | % Graduates |
| Computers & Mathematics | 5 | 5.1% |
| Bio, Nature & Agricultural | 0 | 0.0% |
| Physical & Health Sciences | 0 | 0.0% |
| Psychology | 1 | 1.0% |
| Social Sciences | 0 | 0.0% |
| Engineering | 0 | 0.0% |
| Multidisciplinary Studies | 0 | 0.0% |
| Science & Technology | 7 | 7.1% |
| Business | 30 | 30.3% |
| Education | 22 | 22.2% |
| Literature & Languages | 0 | 0.0% |
| Liberal Arts & History | 0 | 0.0% |
| Visual & Performing Arts | 0 | 0.0% |
| Communications | 14 | 14.1% |
| Arts & Humanities | 20 | 20.2% |
| Total | 99 | 100.0% |
Transportation & Commute in Taylortown
Vehicle Availability by Sex in Taylortown
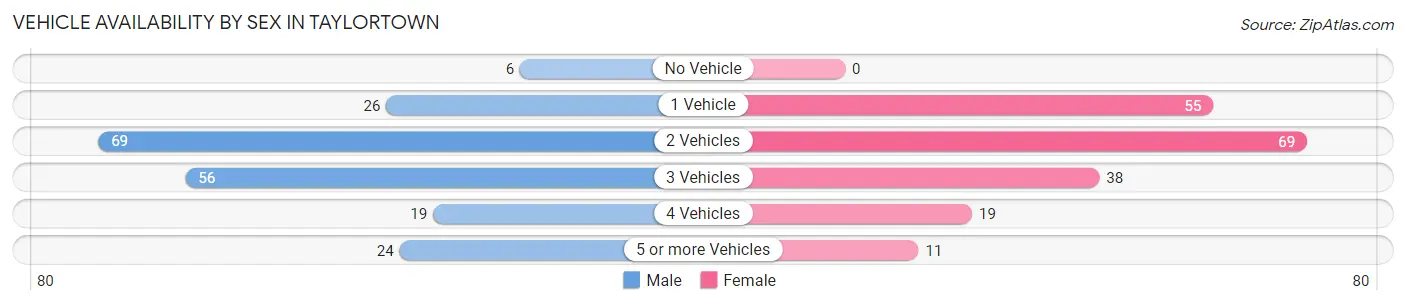
The most prevalent vehicle ownership categories in Taylortown are males with 2 vehicles (69, accounting for 34.5%) and females with 2 vehicles (69, making up 35.9%).
| Vehicles Available | Male | Female |
| No Vehicle | 6 (3.0%) | 0 (0.0%) |
| 1 Vehicle | 26 (13.0%) | 55 (28.6%) |
| 2 Vehicles | 69 (34.5%) | 69 (35.9%) |
| 3 Vehicles | 56 (28.0%) | 38 (19.8%) |
| 4 Vehicles | 19 (9.5%) | 19 (9.9%) |
| 5 or more Vehicles | 24 (12.0%) | 11 (5.7%) |
| Total | 200 (100.0%) | 192 (100.0%) |
Commute Time in Taylortown
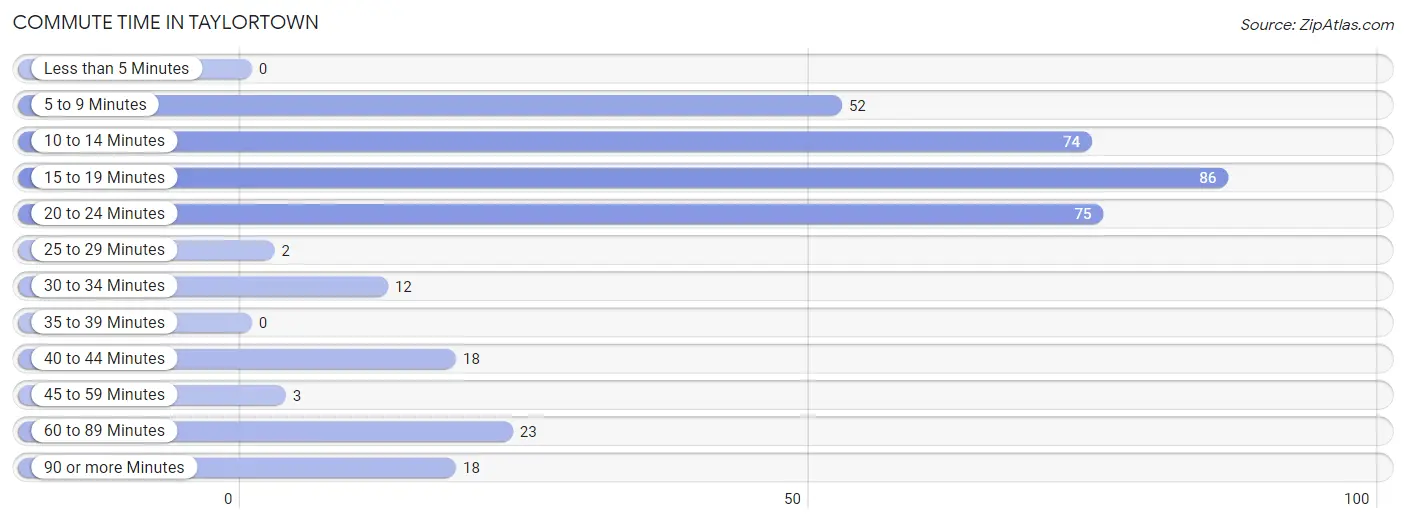
The most frequently occuring commute durations in Taylortown are 15 to 19 minutes (86 commuters, 23.7%), 20 to 24 minutes (75 commuters, 20.7%), and 10 to 14 minutes (74 commuters, 20.4%).
| Commute Time | # Commuters | % Commuters |
| Less than 5 Minutes | 0 | 0.0% |
| 5 to 9 Minutes | 52 | 14.3% |
| 10 to 14 Minutes | 74 | 20.4% |
| 15 to 19 Minutes | 86 | 23.7% |
| 20 to 24 Minutes | 75 | 20.7% |
| 25 to 29 Minutes | 2 | 0.5% |
| 30 to 34 Minutes | 12 | 3.3% |
| 35 to 39 Minutes | 0 | 0.0% |
| 40 to 44 Minutes | 18 | 5.0% |
| 45 to 59 Minutes | 3 | 0.8% |
| 60 to 89 Minutes | 23 | 6.3% |
| 90 or more Minutes | 18 | 5.0% |
Commute Time by Sex in Taylortown
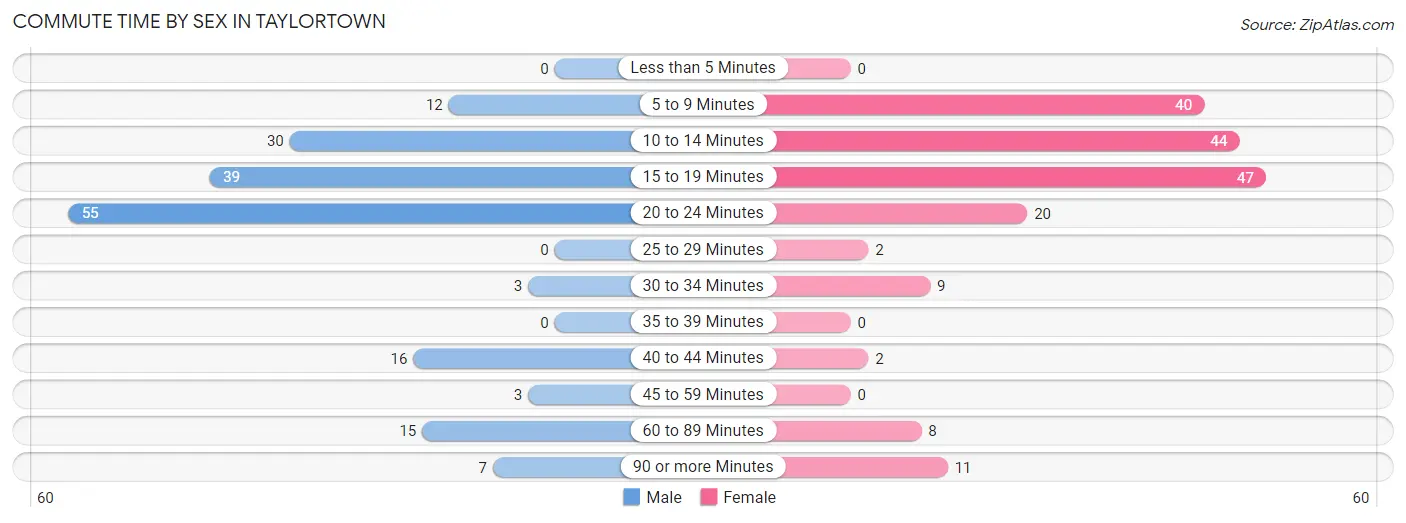
The most common commute times in Taylortown are 20 to 24 minutes (55 commuters, 30.6%) for males and 15 to 19 minutes (47 commuters, 25.7%) for females.
| Commute Time | Male | Female |
| Less than 5 Minutes | 0 (0.0%) | 0 (0.0%) |
| 5 to 9 Minutes | 12 (6.7%) | 40 (21.9%) |
| 10 to 14 Minutes | 30 (16.7%) | 44 (24.0%) |
| 15 to 19 Minutes | 39 (21.7%) | 47 (25.7%) |
| 20 to 24 Minutes | 55 (30.6%) | 20 (10.9%) |
| 25 to 29 Minutes | 0 (0.0%) | 2 (1.1%) |
| 30 to 34 Minutes | 3 (1.7%) | 9 (4.9%) |
| 35 to 39 Minutes | 0 (0.0%) | 0 (0.0%) |
| 40 to 44 Minutes | 16 (8.9%) | 2 (1.1%) |
| 45 to 59 Minutes | 3 (1.7%) | 0 (0.0%) |
| 60 to 89 Minutes | 15 (8.3%) | 8 (4.4%) |
| 90 or more Minutes | 7 (3.9%) | 11 (6.0%) |
Time of Departure to Work by Sex in Taylortown
The most frequent times of departure to work in Taylortown are 12:00 AM to 4:59 AM (35, 19.4%) for males and 7:30 AM to 7:59 AM (45, 24.6%) for females.
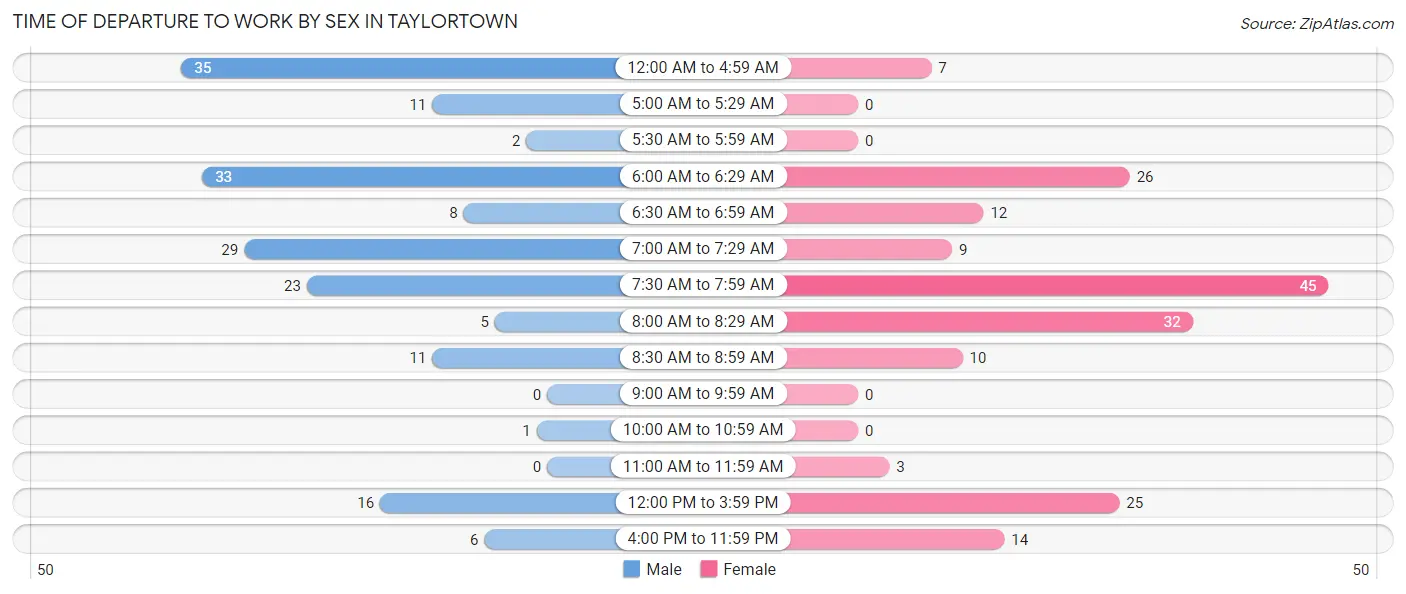
| Time of Departure | Male | Female |
| 12:00 AM to 4:59 AM | 35 (19.4%) | 7 (3.8%) |
| 5:00 AM to 5:29 AM | 11 (6.1%) | 0 (0.0%) |
| 5:30 AM to 5:59 AM | 2 (1.1%) | 0 (0.0%) |
| 6:00 AM to 6:29 AM | 33 (18.3%) | 26 (14.2%) |
| 6:30 AM to 6:59 AM | 8 (4.4%) | 12 (6.6%) |
| 7:00 AM to 7:29 AM | 29 (16.1%) | 9 (4.9%) |
| 7:30 AM to 7:59 AM | 23 (12.8%) | 45 (24.6%) |
| 8:00 AM to 8:29 AM | 5 (2.8%) | 32 (17.5%) |
| 8:30 AM to 8:59 AM | 11 (6.1%) | 10 (5.5%) |
| 9:00 AM to 9:59 AM | 0 (0.0%) | 0 (0.0%) |
| 10:00 AM to 10:59 AM | 1 (0.6%) | 0 (0.0%) |
| 11:00 AM to 11:59 AM | 0 (0.0%) | 3 (1.6%) |
| 12:00 PM to 3:59 PM | 16 (8.9%) | 25 (13.7%) |
| 4:00 PM to 11:59 PM | 6 (3.3%) | 14 (7.6%) |
| Total | 180 (100.0%) | 183 (100.0%) |
Housing Occupancy in Taylortown
Occupancy by Ownership in Taylortown
Of the total 323 dwellings in Taylortown, owner-occupied units account for 252 (78.0%), while renter-occupied units make up 71 (22.0%).
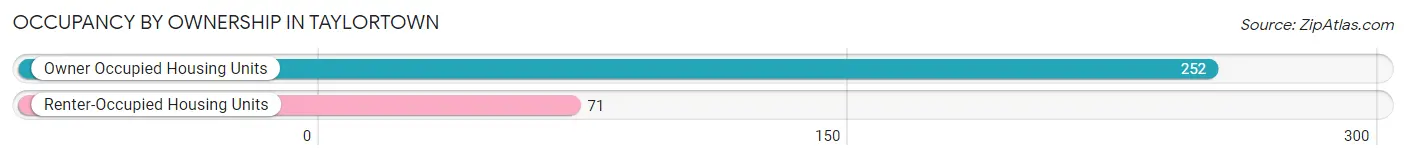
| Occupancy | # Housing Units | % Housing Units |
| Owner Occupied Housing Units | 252 | 78.0% |
| Renter-Occupied Housing Units | 71 | 22.0% |
| Total Occupied Housing Units | 323 | 100.0% |
Occupancy by Household Size in Taylortown
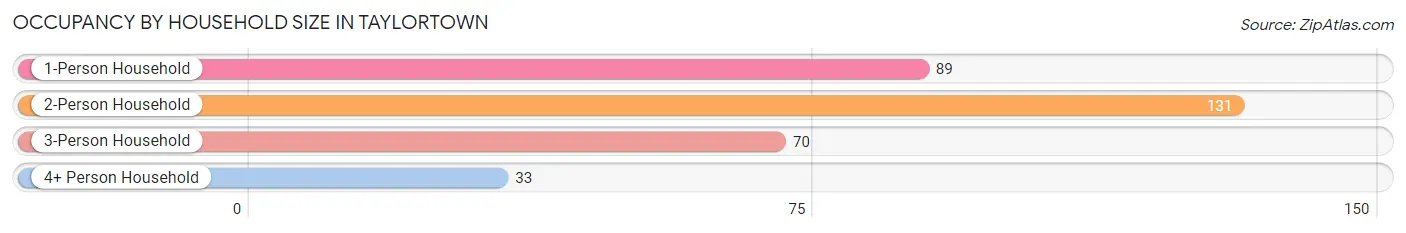
| Household Size | # Housing Units | % Housing Units |
| 1-Person Household | 89 | 27.6% |
| 2-Person Household | 131 | 40.6% |
| 3-Person Household | 70 | 21.7% |
| 4+ Person Household | 33 | 10.2% |
| Total Housing Units | 323 | 100.0% |
Occupancy by Ownership by Household Size in Taylortown
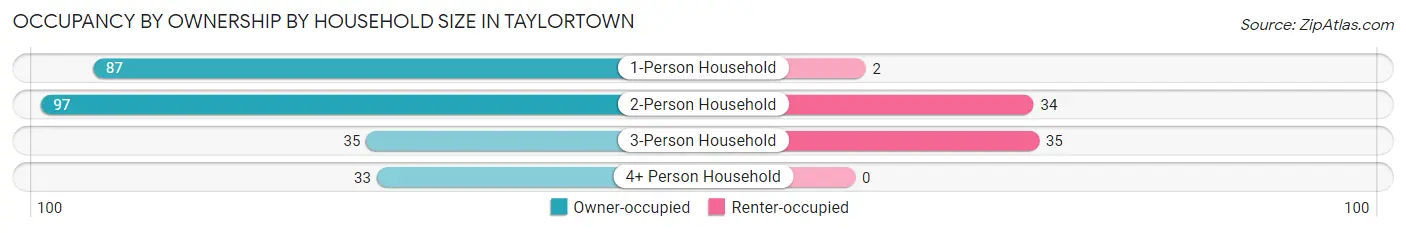
| Household Size | Owner-occupied | Renter-occupied |
| 1-Person Household | 87 (97.8%) | 2 (2.2%) |
| 2-Person Household | 97 (74.1%) | 34 (26.0%) |
| 3-Person Household | 35 (50.0%) | 35 (50.0%) |
| 4+ Person Household | 33 (100.0%) | 0 (0.0%) |
| Total Housing Units | 252 (78.0%) | 71 (22.0%) |
Occupancy by Educational Attainment in Taylortown
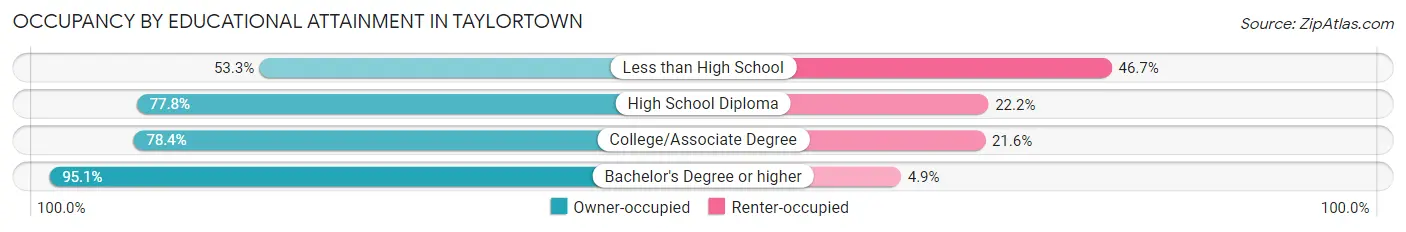
| Household Size | Owner-occupied | Renter-occupied |
| Less than High School | 16 (53.3%) | 14 (46.7%) |
| High School Diploma | 77 (77.8%) | 22 (22.2%) |
| College/Associate Degree | 120 (78.4%) | 33 (21.6%) |
| Bachelor's Degree or higher | 39 (95.1%) | 2 (4.9%) |
Occupancy by Age of Householder in Taylortown
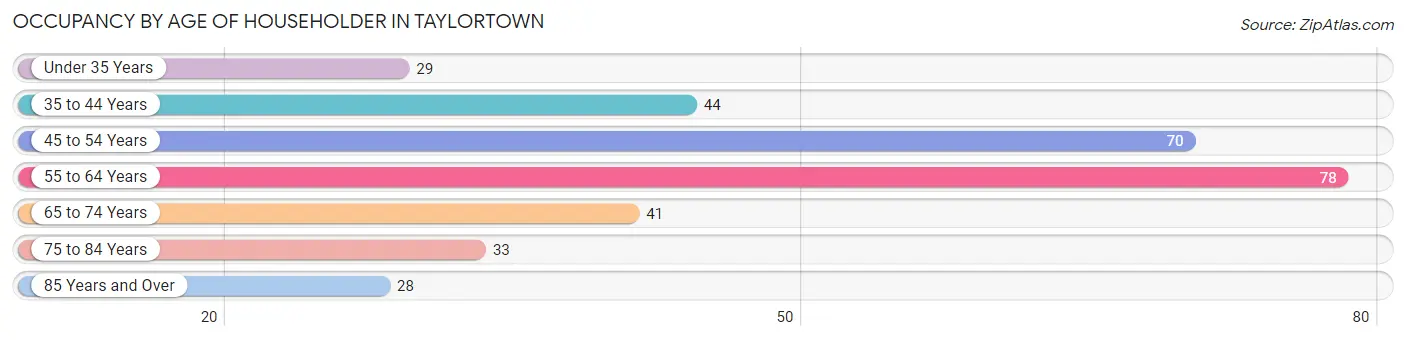
| Age Bracket | # Households | % Households |
| Under 35 Years | 29 | 9.0% |
| 35 to 44 Years | 44 | 13.6% |
| 45 to 54 Years | 70 | 21.7% |
| 55 to 64 Years | 78 | 24.1% |
| 65 to 74 Years | 41 | 12.7% |
| 75 to 84 Years | 33 | 10.2% |
| 85 Years and Over | 28 | 8.7% |
| Total | 323 | 100.0% |
Housing Finances in Taylortown
Median Income by Occupancy in Taylortown
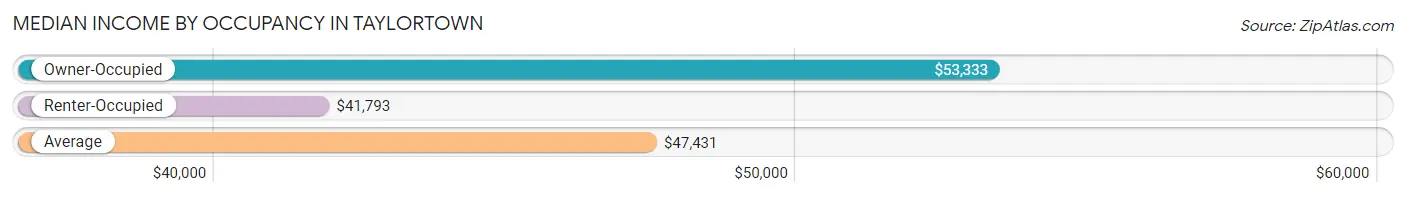
| Occupancy Type | # Households | Median Income |
| Owner-Occupied | 252 (78.0%) | $53,333 |
| Renter-Occupied | 71 (22.0%) | $41,793 |
| Average | 323 (100.0%) | $47,431 |
Occupancy by Householder Income Bracket in Taylortown
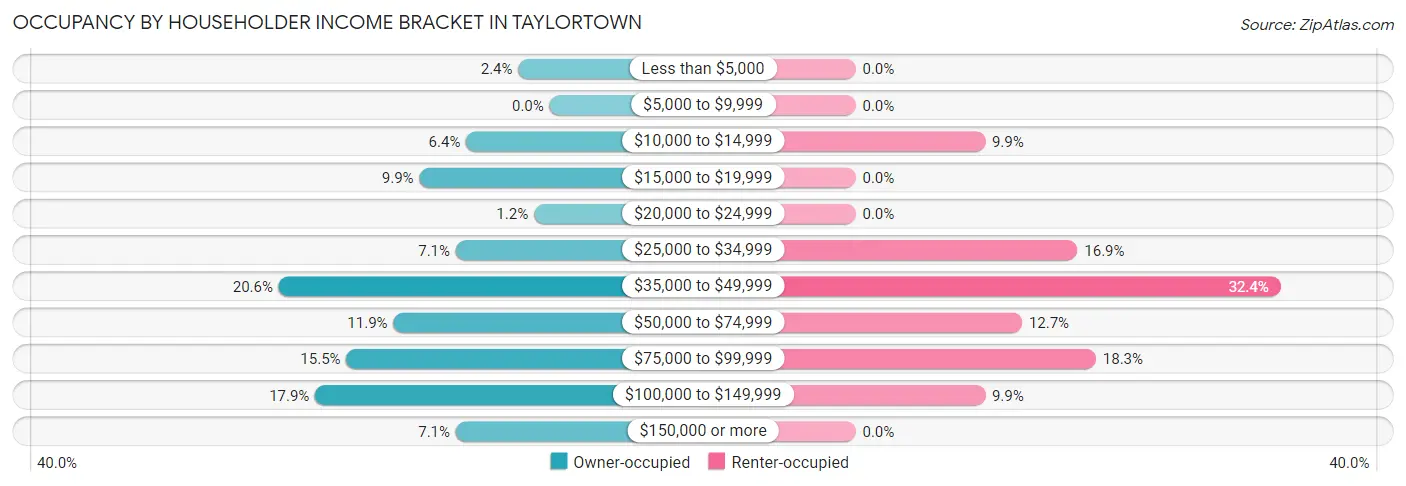
| Income Bracket | Owner-occupied | Renter-occupied |
| Less than $5,000 | 6 (2.4%) | 0 (0.0%) |
| $5,000 to $9,999 | 0 (0.0%) | 0 (0.0%) |
| $10,000 to $14,999 | 16 (6.4%) | 7 (9.9%) |
| $15,000 to $19,999 | 25 (9.9%) | 0 (0.0%) |
| $20,000 to $24,999 | 3 (1.2%) | 0 (0.0%) |
| $25,000 to $34,999 | 18 (7.1%) | 12 (16.9%) |
| $35,000 to $49,999 | 52 (20.6%) | 23 (32.4%) |
| $50,000 to $74,999 | 30 (11.9%) | 9 (12.7%) |
| $75,000 to $99,999 | 39 (15.5%) | 13 (18.3%) |
| $100,000 to $149,999 | 45 (17.9%) | 7 (9.9%) |
| $150,000 or more | 18 (7.1%) | 0 (0.0%) |
| Total | 252 (100.0%) | 71 (100.0%) |
Monthly Housing Cost Tiers in Taylortown
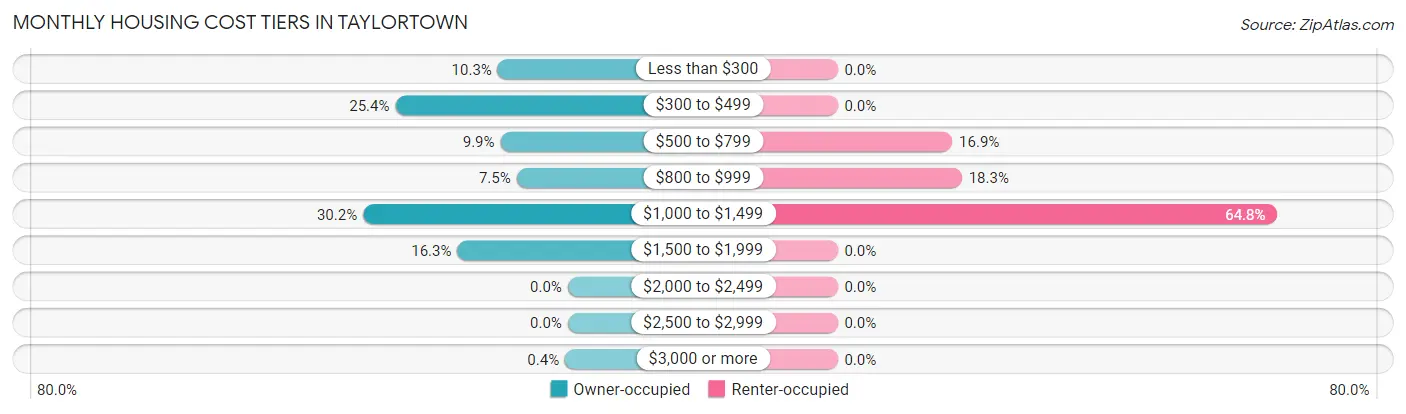
| Monthly Cost | Owner-occupied | Renter-occupied |
| Less than $300 | 26 (10.3%) | 0 (0.0%) |
| $300 to $499 | 64 (25.4%) | 0 (0.0%) |
| $500 to $799 | 25 (9.9%) | 12 (16.9%) |
| $800 to $999 | 19 (7.5%) | 13 (18.3%) |
| $1,000 to $1,499 | 76 (30.2%) | 46 (64.8%) |
| $1,500 to $1,999 | 41 (16.3%) | 0 (0.0%) |
| $2,000 to $2,499 | 0 (0.0%) | 0 (0.0%) |
| $2,500 to $2,999 | 0 (0.0%) | 0 (0.0%) |
| $3,000 or more | 1 (0.4%) | 0 (0.0%) |
| Total | 252 (100.0%) | 71 (100.0%) |
Physical Housing Characteristics in Taylortown
Housing Structures in Taylortown
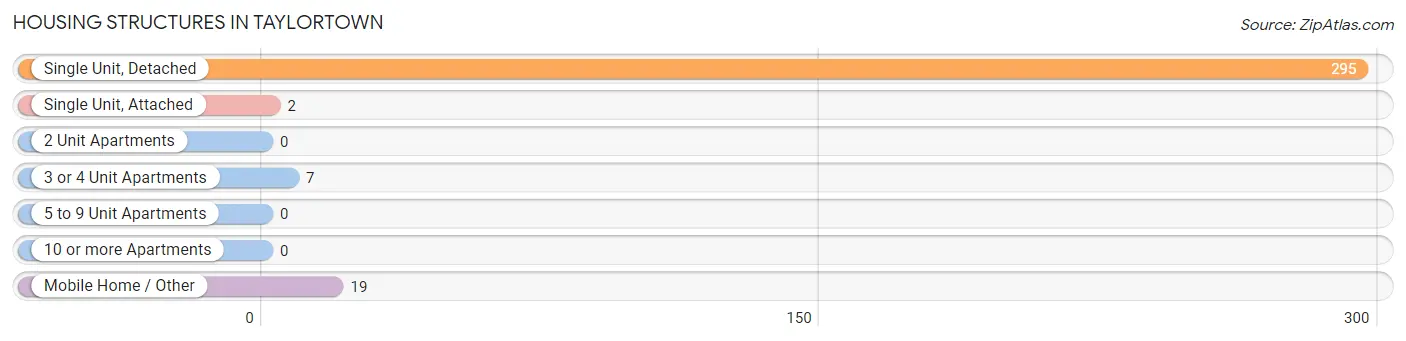
| Structure Type | # Housing Units | % Housing Units |
| Single Unit, Detached | 295 | 91.3% |
| Single Unit, Attached | 2 | 0.6% |
| 2 Unit Apartments | 0 | 0.0% |
| 3 or 4 Unit Apartments | 7 | 2.2% |
| 5 to 9 Unit Apartments | 0 | 0.0% |
| 10 or more Apartments | 0 | 0.0% |
| Mobile Home / Other | 19 | 5.9% |
| Total | 323 | 100.0% |
Housing Structures by Occupancy in Taylortown
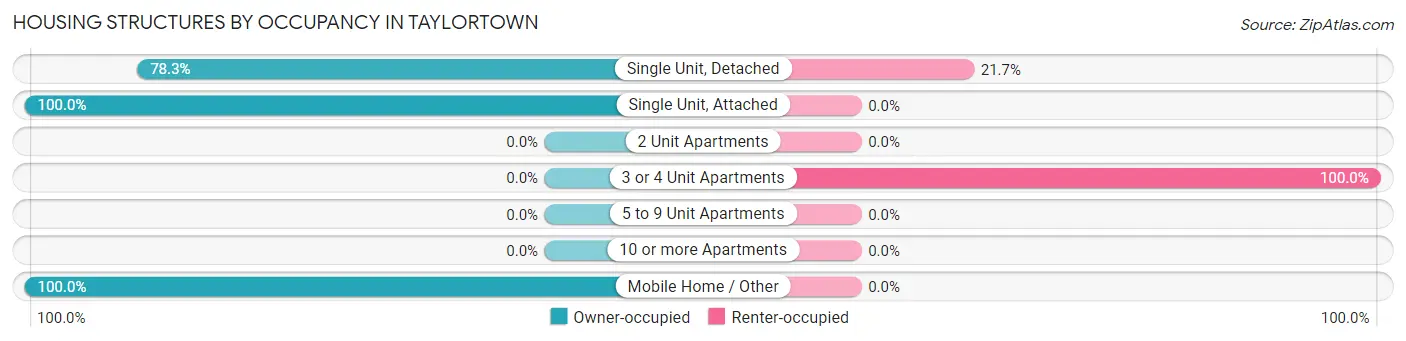
| Structure Type | Owner-occupied | Renter-occupied |
| Single Unit, Detached | 231 (78.3%) | 64 (21.7%) |
| Single Unit, Attached | 2 (100.0%) | 0 (0.0%) |
| 2 Unit Apartments | 0 (0.0%) | 0 (0.0%) |
| 3 or 4 Unit Apartments | 0 (0.0%) | 7 (100.0%) |
| 5 to 9 Unit Apartments | 0 (0.0%) | 0 (0.0%) |
| 10 or more Apartments | 0 (0.0%) | 0 (0.0%) |
| Mobile Home / Other | 19 (100.0%) | 0 (0.0%) |
| Total | 252 (78.0%) | 71 (22.0%) |
Housing Structures by Number of Rooms in Taylortown
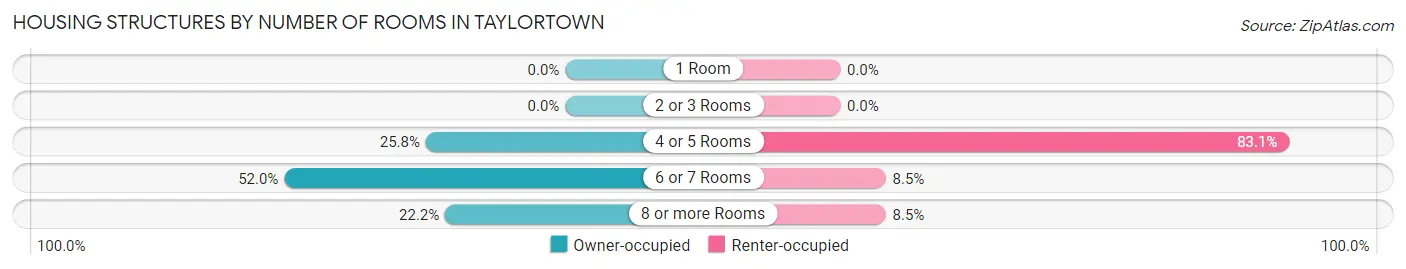
| Number of Rooms | Owner-occupied | Renter-occupied |
| 1 Room | 0 (0.0%) | 0 (0.0%) |
| 2 or 3 Rooms | 0 (0.0%) | 0 (0.0%) |
| 4 or 5 Rooms | 65 (25.8%) | 59 (83.1%) |
| 6 or 7 Rooms | 131 (52.0%) | 6 (8.5%) |
| 8 or more Rooms | 56 (22.2%) | 6 (8.5%) |
| Total | 252 (100.0%) | 71 (100.0%) |
Housing Structure by Heating Type in Taylortown
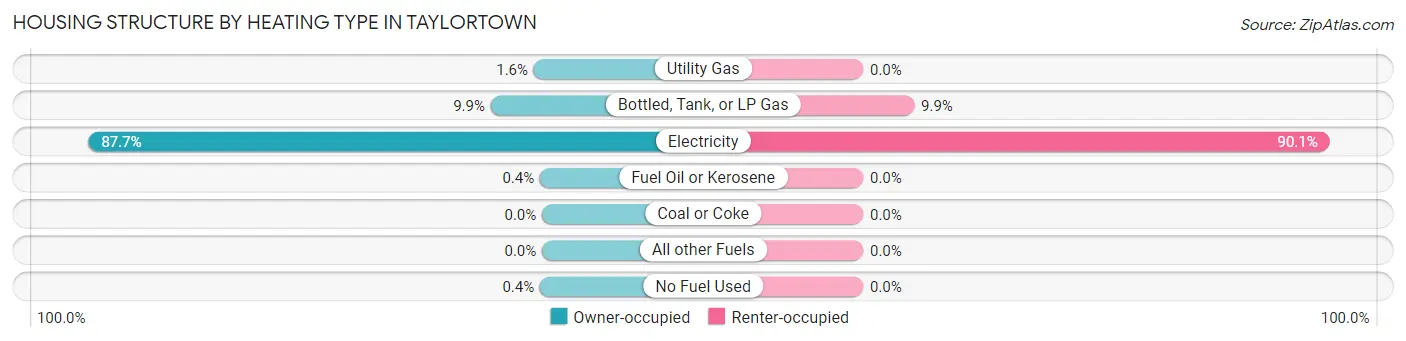
| Heating Type | Owner-occupied | Renter-occupied |
| Utility Gas | 4 (1.6%) | 0 (0.0%) |
| Bottled, Tank, or LP Gas | 25 (9.9%) | 7 (9.9%) |
| Electricity | 221 (87.7%) | 64 (90.1%) |
| Fuel Oil or Kerosene | 1 (0.4%) | 0 (0.0%) |
| Coal or Coke | 0 (0.0%) | 0 (0.0%) |
| All other Fuels | 0 (0.0%) | 0 (0.0%) |
| No Fuel Used | 1 (0.4%) | 0 (0.0%) |
| Total | 252 (100.0%) | 71 (100.0%) |
Household Vehicle Usage in Taylortown
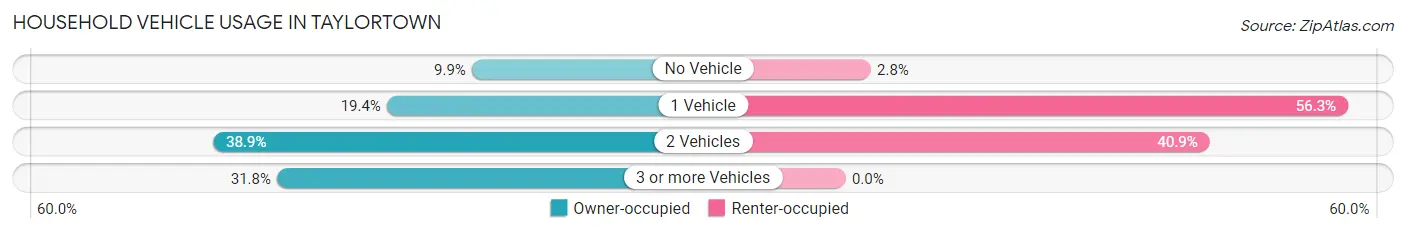
| Vehicles per Household | Owner-occupied | Renter-occupied |
| No Vehicle | 25 (9.9%) | 2 (2.8%) |
| 1 Vehicle | 49 (19.4%) | 40 (56.3%) |
| 2 Vehicles | 98 (38.9%) | 29 (40.8%) |
| 3 or more Vehicles | 80 (31.8%) | 0 (0.0%) |
| Total | 252 (100.0%) | 71 (100.0%) |
Real Estate & Mortgages in Taylortown
Real Estate and Mortgage Overview in Taylortown
| Characteristic | Without Mortgage | With Mortgage |
| Housing Units | 109 | 143 |
| Median Property Value | $122,300 | $196,300 |
| Median Household Income | $40,469 | $17 |
| Monthly Housing Costs | $420 | $1 |
| Real Estate Taxes | $904 | $0 |
Property Value by Mortgage Status in Taylortown
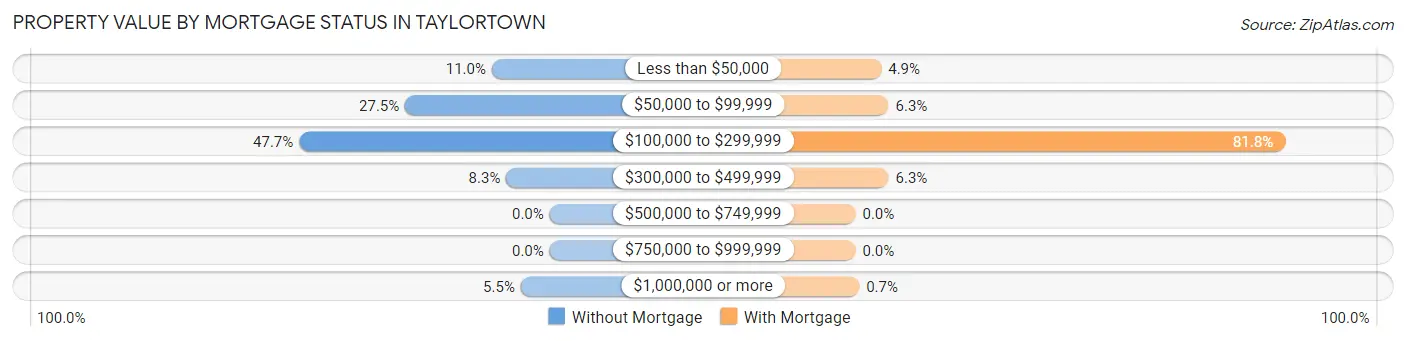
| Property Value | Without Mortgage | With Mortgage |
| Less than $50,000 | 12 (11.0%) | 7 (4.9%) |
| $50,000 to $99,999 | 30 (27.5%) | 9 (6.3%) |
| $100,000 to $299,999 | 52 (47.7%) | 117 (81.8%) |
| $300,000 to $499,999 | 9 (8.3%) | 9 (6.3%) |
| $500,000 to $749,999 | 0 (0.0%) | 0 (0.0%) |
| $750,000 to $999,999 | 0 (0.0%) | 0 (0.0%) |
| $1,000,000 or more | 6 (5.5%) | 1 (0.7%) |
| Total | 109 (100.0%) | 143 (100.0%) |
Household Income by Mortgage Status in Taylortown
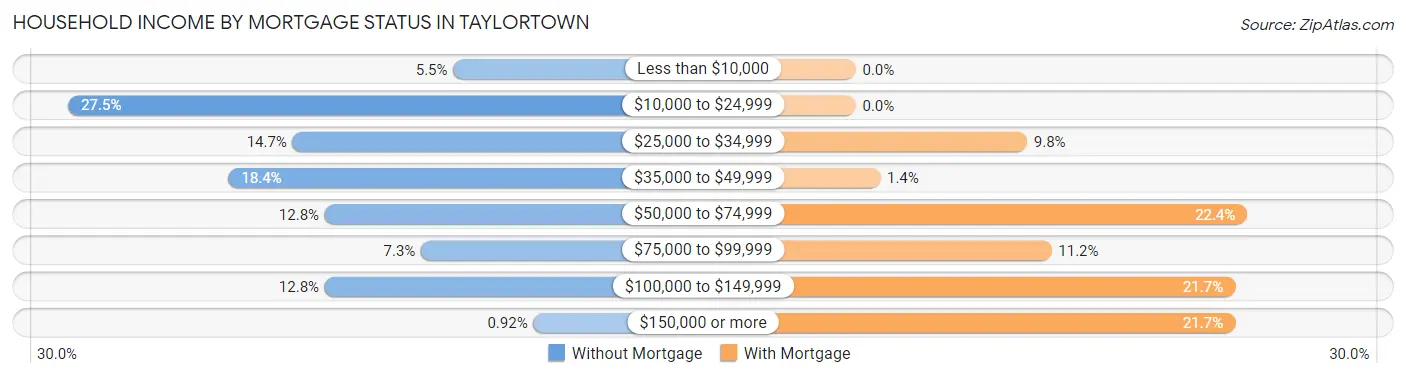
| Household Income | Without Mortgage | With Mortgage |
| Less than $10,000 | 6 (5.5%) | 0 (0.0%) |
| $10,000 to $24,999 | 30 (27.5%) | 0 (0.0%) |
| $25,000 to $34,999 | 16 (14.7%) | 14 (9.8%) |
| $35,000 to $49,999 | 20 (18.3%) | 2 (1.4%) |
| $50,000 to $74,999 | 14 (12.8%) | 32 (22.4%) |
| $75,000 to $99,999 | 8 (7.3%) | 16 (11.2%) |
| $100,000 to $149,999 | 14 (12.8%) | 31 (21.7%) |
| $150,000 or more | 1 (0.9%) | 31 (21.7%) |
| Total | 109 (100.0%) | 143 (100.0%) |
Property Value to Household Income Ratio in Taylortown
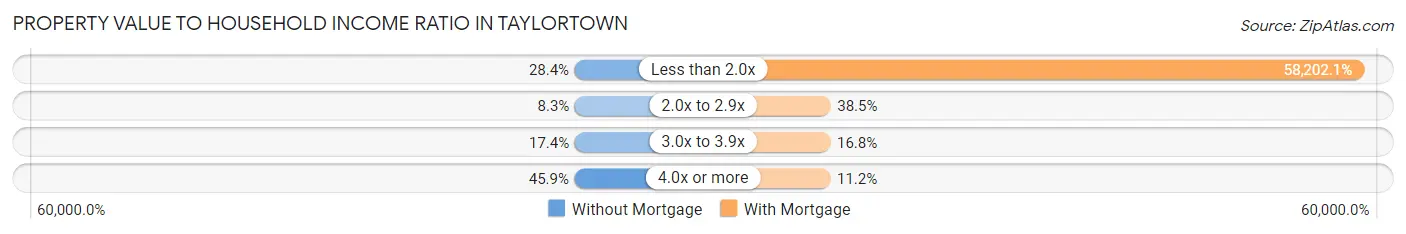
| Value-to-Income Ratio | Without Mortgage | With Mortgage |
| Less than 2.0x | 31 (28.4%) | 83,229 (58,202.1%) |
| 2.0x to 2.9x | 9 (8.3%) | 55 (38.5%) |
| 3.0x to 3.9x | 19 (17.4%) | 24 (16.8%) |
| 4.0x or more | 50 (45.9%) | 16 (11.2%) |
| Total | 109 (100.0%) | 143 (100.0%) |
Real Estate Taxes by Mortgage Status in Taylortown
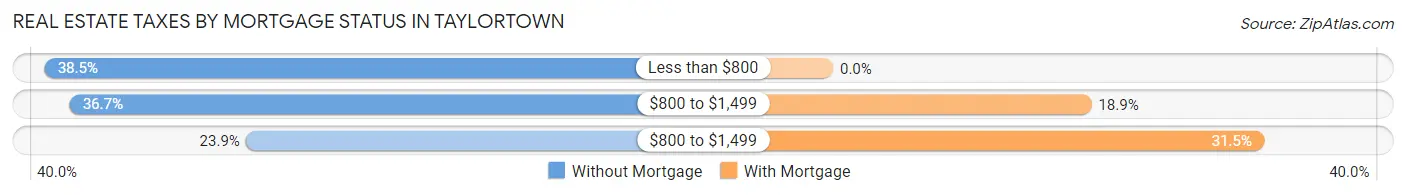
| Property Taxes | Without Mortgage | With Mortgage |
| Less than $800 | 42 (38.5%) | 0 (0.0%) |
| $800 to $1,499 | 40 (36.7%) | 27 (18.9%) |
| $800 to $1,499 | 26 (23.8%) | 45 (31.5%) |
| Total | 109 (100.0%) | 143 (100.0%) |
Health & Disability in Taylortown
Health Insurance Coverage by Age in Taylortown
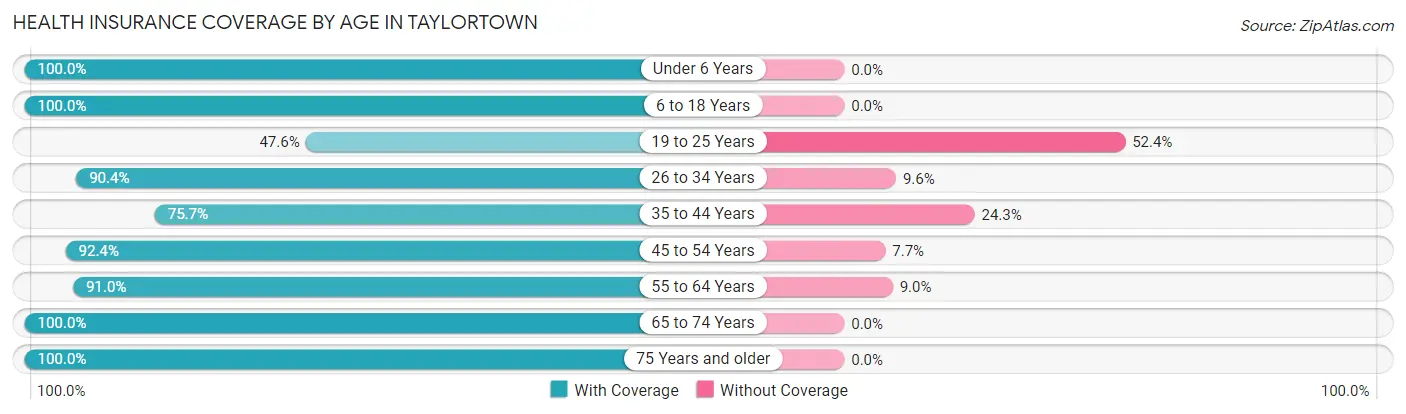
| Age Bracket | With Coverage | Without Coverage |
| Under 6 Years | 54 (100.0%) | 0 (0.0%) |
| 6 to 18 Years | 118 (100.0%) | 0 (0.0%) |
| 19 to 25 Years | 20 (47.6%) | 22 (52.4%) |
| 26 to 34 Years | 75 (90.4%) | 8 (9.6%) |
| 35 to 44 Years | 53 (75.7%) | 17 (24.3%) |
| 45 to 54 Years | 157 (92.3%) | 13 (7.6%) |
| 55 to 64 Years | 131 (91.0%) | 13 (9.0%) |
| 65 to 74 Years | 63 (100.0%) | 0 (0.0%) |
| 75 Years and older | 70 (100.0%) | 0 (0.0%) |
| Total | 741 (91.0%) | 73 (9.0%) |
Health Insurance Coverage by Citizenship Status in Taylortown
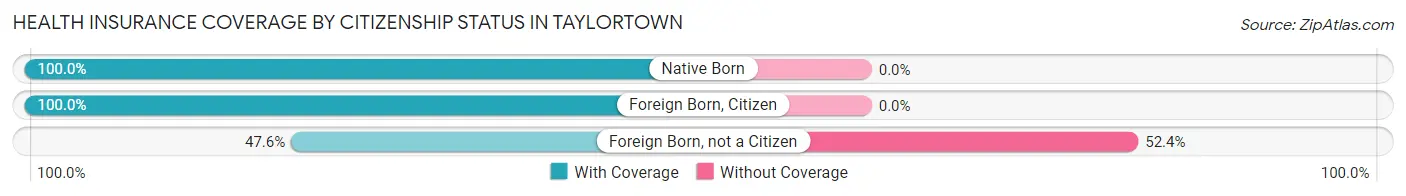
| Citizenship Status | With Coverage | Without Coverage |
| Native Born | 54 (100.0%) | 0 (0.0%) |
| Foreign Born, Citizen | 118 (100.0%) | 0 (0.0%) |
| Foreign Born, not a Citizen | 20 (47.6%) | 22 (52.4%) |
Health Insurance Coverage by Household Income in Taylortown
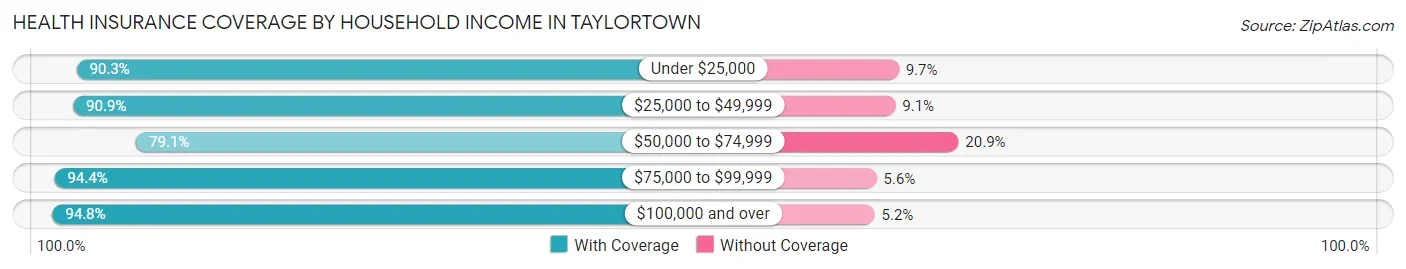
| Household Income | With Coverage | Without Coverage |
| Under $25,000 | 65 (90.3%) | 7 (9.7%) |
| $25,000 to $49,999 | 220 (90.9%) | 22 (9.1%) |
| $50,000 to $74,999 | 87 (79.1%) | 23 (20.9%) |
| $75,000 to $99,999 | 169 (94.4%) | 10 (5.6%) |
| $100,000 and over | 200 (94.8%) | 11 (5.2%) |
Public vs Private Health Insurance Coverage by Age in Taylortown
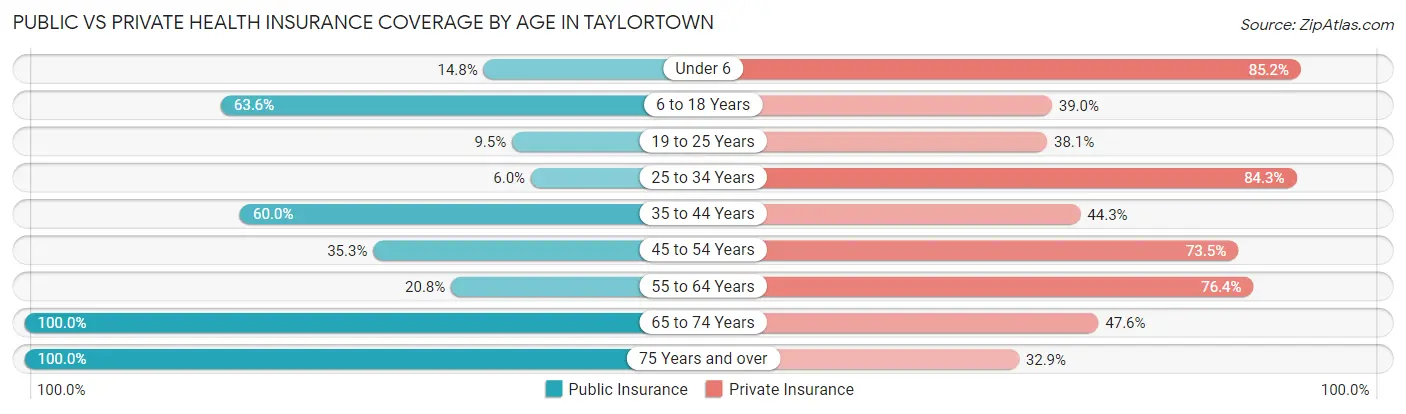
| Age Bracket | Public Insurance | Private Insurance |
| Under 6 | 8 (14.8%) | 46 (85.2%) |
| 6 to 18 Years | 75 (63.6%) | 46 (39.0%) |
| 19 to 25 Years | 4 (9.5%) | 16 (38.1%) |
| 25 to 34 Years | 5 (6.0%) | 70 (84.3%) |
| 35 to 44 Years | 42 (60.0%) | 31 (44.3%) |
| 45 to 54 Years | 60 (35.3%) | 125 (73.5%) |
| 55 to 64 Years | 30 (20.8%) | 110 (76.4%) |
| 65 to 74 Years | 63 (100.0%) | 30 (47.6%) |
| 75 Years and over | 70 (100.0%) | 23 (32.9%) |
| Total | 357 (43.9%) | 497 (61.1%) |
Disability Status by Sex by Age in Taylortown
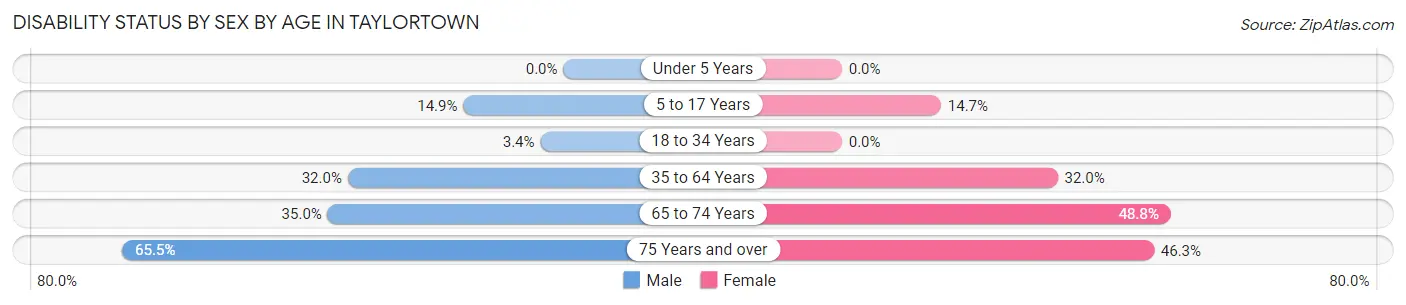
| Age Bracket | Male | Female |
| Under 5 Years | 0 (0.0%) | 0 (0.0%) |
| 5 to 17 Years | 11 (14.9%) | 5 (14.7%) |
| 18 to 34 Years | 3 (3.4%) | 0 (0.0%) |
| 35 to 64 Years | 57 (32.0%) | 66 (32.0%) |
| 65 to 74 Years | 7 (35.0%) | 21 (48.8%) |
| 75 Years and over | 19 (65.5%) | 19 (46.3%) |
Disability Class by Sex by Age in Taylortown
Disability Class: Hearing Difficulty
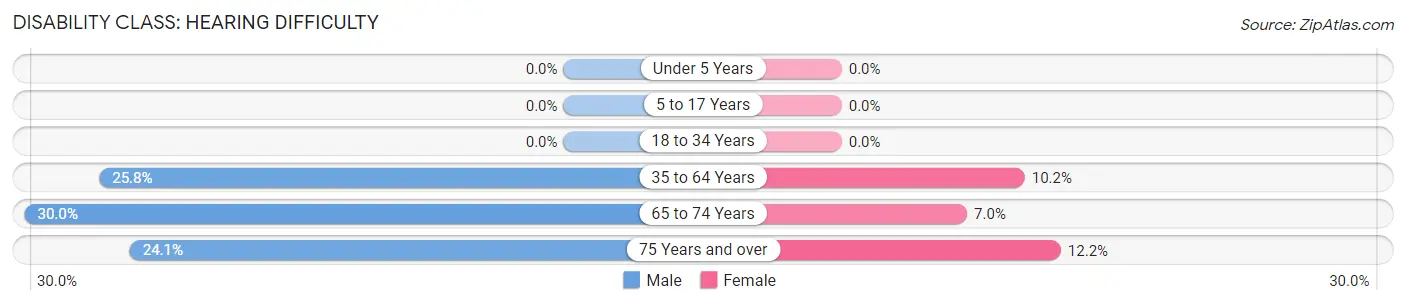
| Age Bracket | Male | Female |
| Under 5 Years | 0 (0.0%) | 0 (0.0%) |
| 5 to 17 Years | 0 (0.0%) | 0 (0.0%) |
| 18 to 34 Years | 0 (0.0%) | 0 (0.0%) |
| 35 to 64 Years | 46 (25.8%) | 21 (10.2%) |
| 65 to 74 Years | 6 (30.0%) | 3 (7.0%) |
| 75 Years and over | 7 (24.1%) | 5 (12.2%) |
Disability Class: Vision Difficulty
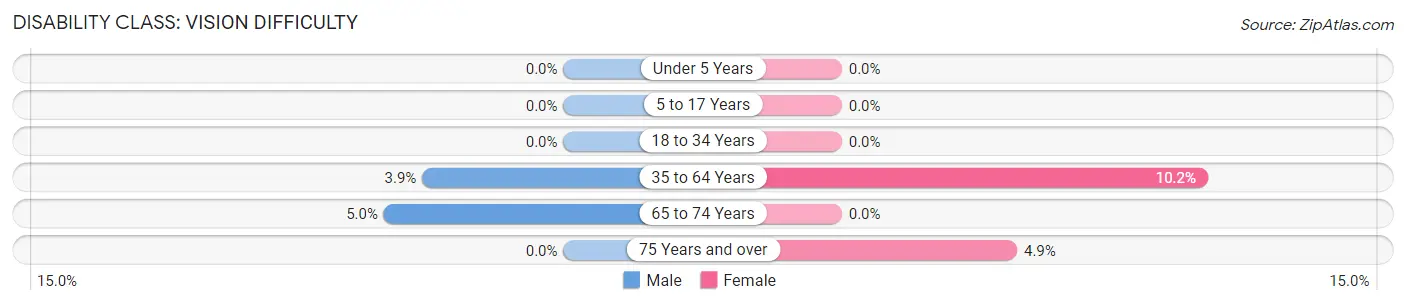
| Age Bracket | Male | Female |
| Under 5 Years | 0 (0.0%) | 0 (0.0%) |
| 5 to 17 Years | 0 (0.0%) | 0 (0.0%) |
| 18 to 34 Years | 0 (0.0%) | 0 (0.0%) |
| 35 to 64 Years | 7 (3.9%) | 21 (10.2%) |
| 65 to 74 Years | 1 (5.0%) | 0 (0.0%) |
| 75 Years and over | 0 (0.0%) | 2 (4.9%) |
Disability Class: Cognitive Difficulty
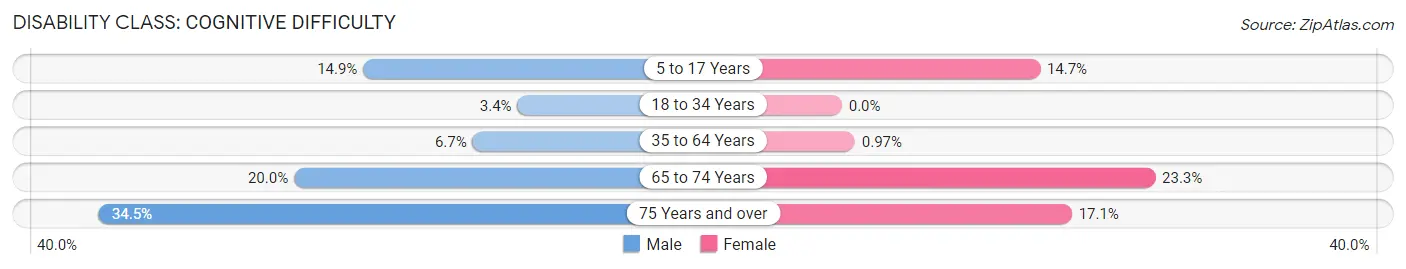
| Age Bracket | Male | Female |
| 5 to 17 Years | 11 (14.9%) | 5 (14.7%) |
| 18 to 34 Years | 3 (3.4%) | 0 (0.0%) |
| 35 to 64 Years | 12 (6.7%) | 2 (1.0%) |
| 65 to 74 Years | 4 (20.0%) | 10 (23.3%) |
| 75 Years and over | 10 (34.5%) | 7 (17.1%) |
Disability Class: Ambulatory Difficulty
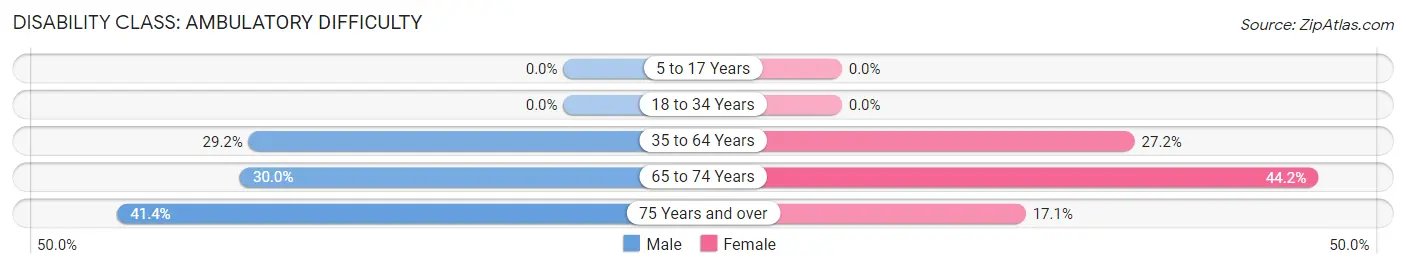
| Age Bracket | Male | Female |
| 5 to 17 Years | 0 (0.0%) | 0 (0.0%) |
| 18 to 34 Years | 0 (0.0%) | 0 (0.0%) |
| 35 to 64 Years | 52 (29.2%) | 56 (27.2%) |
| 65 to 74 Years | 6 (30.0%) | 19 (44.2%) |
| 75 Years and over | 12 (41.4%) | 7 (17.1%) |
Disability Class: Self-Care Difficulty
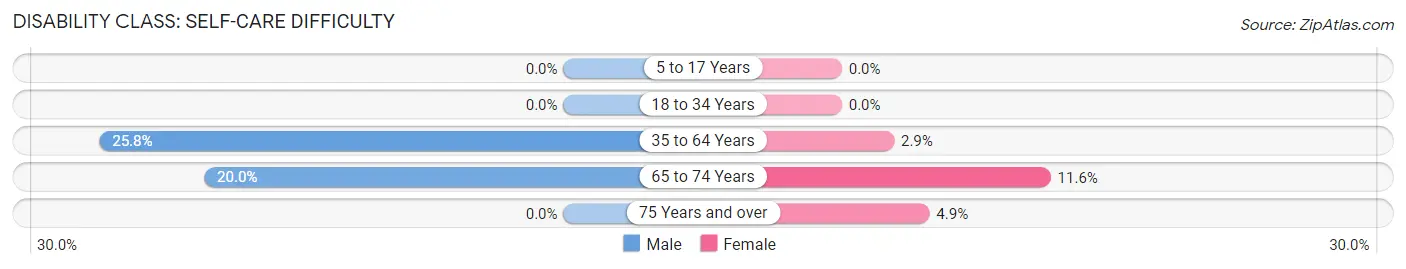
| Age Bracket | Male | Female |
| 5 to 17 Years | 0 (0.0%) | 0 (0.0%) |
| 18 to 34 Years | 0 (0.0%) | 0 (0.0%) |
| 35 to 64 Years | 46 (25.8%) | 6 (2.9%) |
| 65 to 74 Years | 4 (20.0%) | 5 (11.6%) |
| 75 Years and over | 0 (0.0%) | 2 (4.9%) |
Technology Access in Taylortown
Computing Device Access in Taylortown
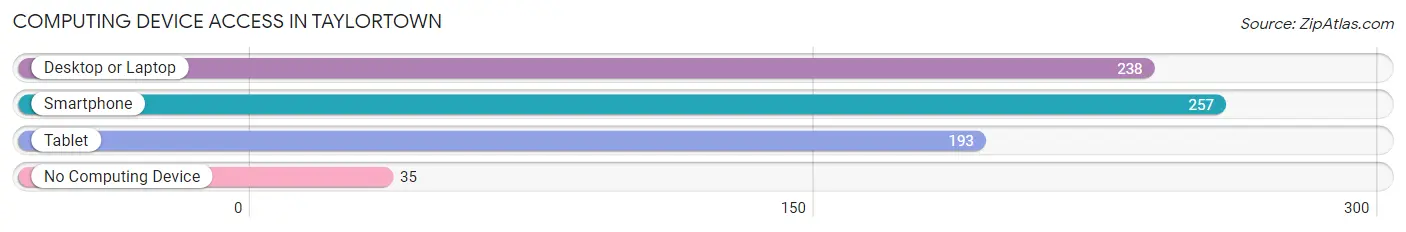
| Device Type | # Households | % Households |
| Desktop or Laptop | 238 | 73.7% |
| Smartphone | 257 | 79.6% |
| Tablet | 193 | 59.8% |
| No Computing Device | 35 | 10.8% |
| Total | 323 | 100.0% |
Internet Access in Taylortown
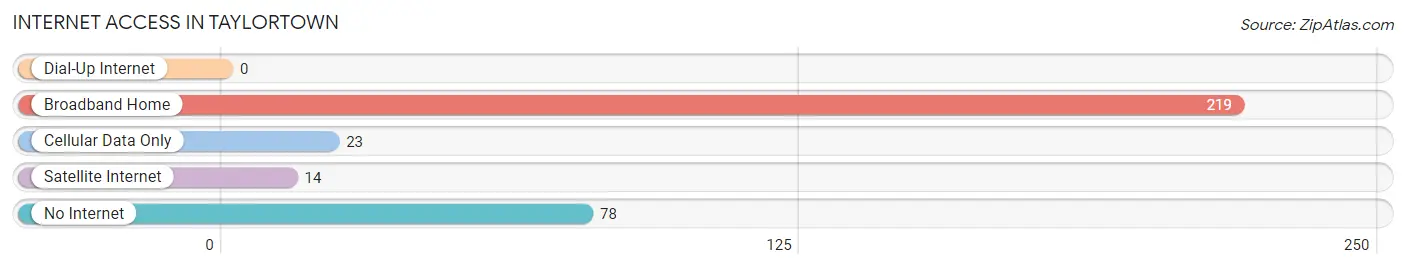
| Internet Type | # Households | % Households |
| Dial-Up Internet | 0 | 0.0% |
| Broadband Home | 219 | 67.8% |
| Cellular Data Only | 23 | 7.1% |
| Satellite Internet | 14 | 4.3% |
| No Internet | 78 | 24.1% |
| Total | 323 | 100.0% |
Taylortown Summary
Taylortown is a small town located in the state of North Carolina, United States. It is situated in the foothills of the Blue Ridge Mountains, in the western part of the state. The town is located in Wilkes County, and is part of the North Wilkesboro Micropolitan Statistical Area. The population of Taylortown was estimated to be 1,072 in the year 2020.
History
Taylortown was founded in 1845 by William Taylor, a local farmer. The town was named after him, and it was the first settlement in Wilkes County. The town was originally a small farming community, and it was home to a few small businesses. In the late 19th century, the town began to grow, and it became a popular destination for tourists. The town was also home to a number of churches, and it was a popular destination for religious retreats.
In the early 20th century, Taylortown began to experience a period of growth and prosperity. The town was home to a number of businesses, including a bank, a hotel, a general store, and a post office. The town also had a number of churches, and it was a popular destination for religious retreats.
In the late 20th century, Taylortown began to experience a period of decline. The town was hit hard by the Great Depression, and many of the businesses in the town closed. The town also experienced a decline in population, as many of the residents moved away in search of better opportunities.
Geography
Taylortown is located in the foothills of the Blue Ridge Mountains, in the western part of North Carolina. The town is situated in Wilkes County, and is part of the North Wilkesboro Micropolitan Statistical Area. The town is located at an elevation of 1,072 feet above sea level.
The town is located in a rural area, and it is surrounded by rolling hills and forests. The town is located near the Yadkin River, and it is also close to the Blue Ridge Parkway. The town is located about 30 miles from the city of Winston-Salem, and it is about 60 miles from the city of Charlotte.
Economy
Taylortown is a small town, and it does not have a large economy. The town is home to a few small businesses, including a general store, a post office, and a few restaurants. The town is also home to a few churches, and it is a popular destination for religious retreats.
The town is also home to a few small farms, and it is a popular destination for tourists. The town is located near the Yadkin River, and it is a popular destination for fishing and other outdoor activities.
Demographics
The population of Taylortown was estimated to be 1,072 in the year 2020. The town has a population that is predominantly white, with a small percentage of African Americans and Hispanics. The median age of the population is 44.7 years, and the median household income is $37,941. The town has a poverty rate of 17.3%, and the unemployment rate is 5.2%.
Conclusion
Taylortown is a small town located in the foothills of the Blue Ridge Mountains, in the western part of North Carolina. The town was founded in 1845 by William Taylor, and it was the first settlement in Wilkes County. The town was originally a small farming community, and it has since grown into a popular destination for tourists. The town is home to a few small businesses, and it is a popular destination for religious retreats. The population of Taylortown was estimated to be 1,072 in the year 2020, and the town has a predominantly white population. The town has a median household income of $37,941, and the unemployment rate is 5.2%.
Common Questions
What is the Total Population of Taylortown?
Total Population of Taylortown is 820.
What is the Total Male Population of Taylortown?
Total Male Population of Taylortown is 435.
What is the Total Female Population of Taylortown?
Total Female Population of Taylortown is 385.
What is the Ratio of Males per 100 Females in Taylortown?
There are 112.99 Males per 100 Females in Taylortown.
What is the Ratio of Females per 100 Males in Taylortown?
There are 88.51 Females per 100 Males in Taylortown.
What is the Median Population Age in Taylortown?
Median Population Age in Taylortown is 47.3 Years.
What is the Average Family Size in Taylortown
Average Family Size in Taylortown is 3.1 People.
What is the Average Household Size in Taylortown
Average Household Size in Taylortown is 2.5 People.
What is Per Capita Income in Taylortown?
Per Capita income in Taylortown is $29,518.
What is the Median Family Income in Taylortown?
Median Family Income in Taylortown is $59,306.
What is the Median Household income in Taylortown?
Median Household Income in Taylortown is $47,431.
What is Income or Wage Gap in Taylortown?
Income or Wage Gap in Taylortown is 23.6%.
Women in Taylortown earn 76.4 cents for every dollar earned by a man.
What is Inequality or Gini Index in Taylortown?
Inequality or Gini Index in Taylortown is 0.39.
How Large is the Labor Force in Taylortown?
There are 418 People in the Labor Forcein in Taylortown.
What is the Percentage of People in the Labor Force in Taylortown?
61.5% of People are in the Labor Force in Taylortown.
What is the Unemployment Rate in Taylortown?
Unemployment Rate in Taylortown is 5.1%.