Cities with the Lowest Poverty Level Among Married Couples in Mississippi
RELATED REPORTS & OPTIONS
Lowest Poverty | Married Couple
Mississippi
Compare Cities
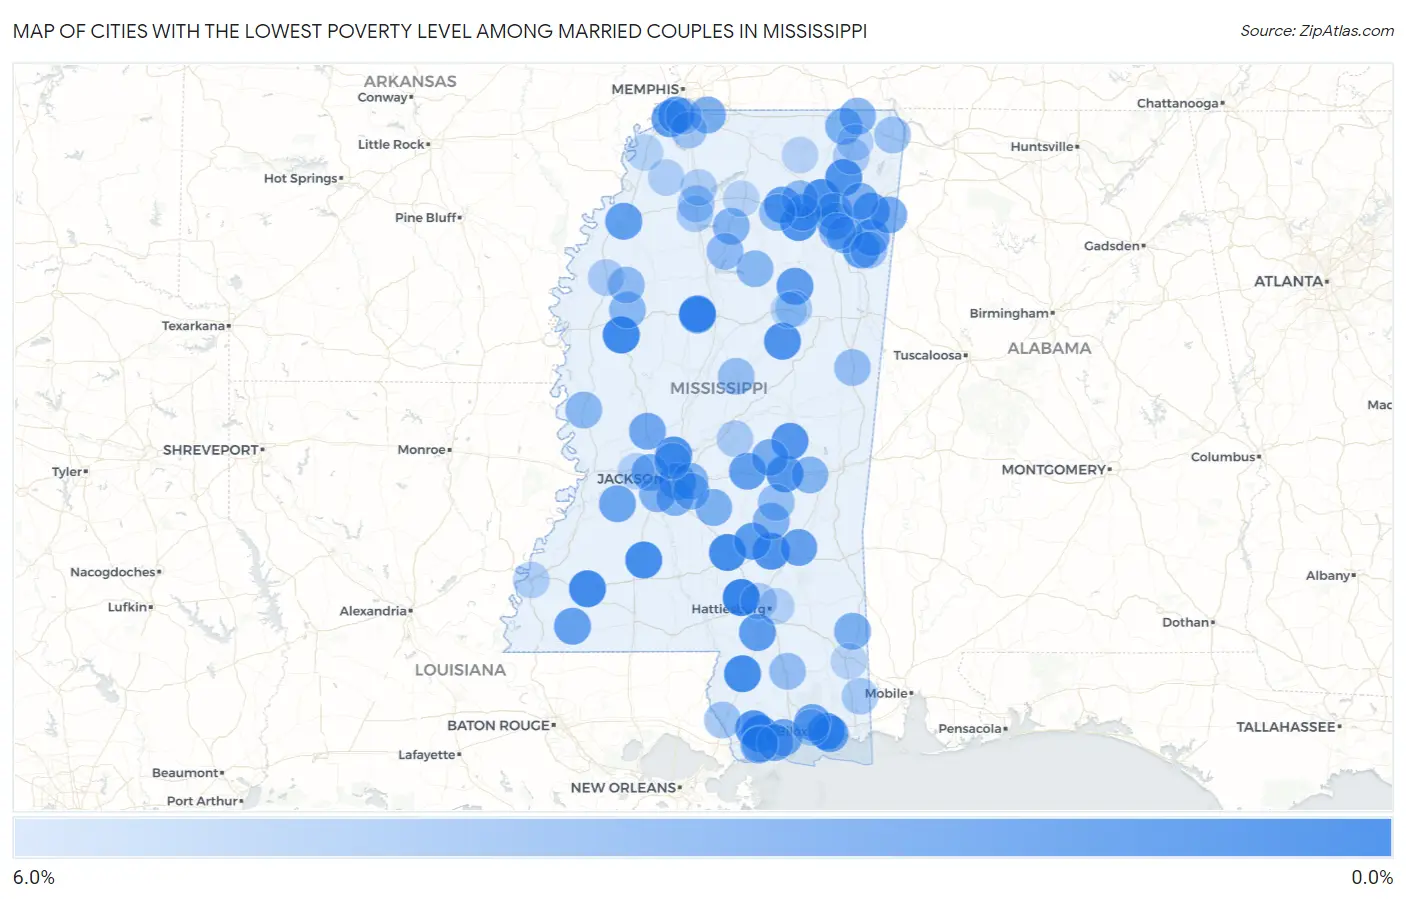
Map of Cities with the Lowest Poverty Level Among Married Couples in Mississippi
6.0%
0.0%
Cities with the Lowest Poverty Level Among Married Couples in Mississippi
| City | Married Couples Poverty | vs State | vs National | |
| 1. | Sumrall | 0.19% | 6.0%(-5.82)#1 | 4.5%(-4.27)#26 |
| 2. | Diamondhead | 0.56% | 6.0%(-5.44)#2 | 4.5%(-3.90)#328 |
| 3. | Inverness | 0.57% | 6.0%(-5.43)#3 | 4.5%(-3.89)#349 |
| 4. | Meadville | 0.68% | 6.0%(-5.33)#4 | 4.5%(-3.79)#489 |
| 5. | Poplarville | 0.72% | 6.0%(-5.28)#5 | 4.5%(-3.74)#568 |
| 6. | Mount Olive | 0.74% | 6.0%(-5.27)#6 | 4.5%(-3.72)#598 |
| 7. | Wesson | 0.78% | 6.0%(-5.22)#7 | 4.5%(-3.68)#698 |
| 8. | Ocean Springs | 0.90% | 6.0%(-5.11)#8 | 4.5%(-3.57)#945 |
| 9. | Sherman | 1.0% | 6.0%(-4.99)#9 | 4.5%(-3.45)#1,234 |
| 10. | Soso | 1.2% | 6.0%(-4.77)#10 | 4.5%(-3.23)#1,768 |
| 11. | Ackerman | 1.2% | 6.0%(-4.76)#11 | 4.5%(-3.22)#1,780 |
| 12. | Madison | 1.3% | 6.0%(-4.75)#12 | 4.5%(-3.21)#1,805 |
| 13. | Baldwyn | 1.3% | 6.0%(-4.74)#13 | 4.5%(-3.20)#1,817 |
| 14. | Algoma | 1.3% | 6.0%(-4.67)#14 | 4.5%(-3.13)#2,015 |
| 15. | Kiln | 1.4% | 6.0%(-4.63)#15 | 4.5%(-3.09)#2,118 |
| 16. | Newton | 1.4% | 6.0%(-4.61)#16 | 4.5%(-3.07)#2,196 |
| 17. | Union | 1.5% | 6.0%(-4.53)#17 | 4.5%(-2.99)#2,392 |
| 18. | Taylorsville | 1.7% | 6.0%(-4.27)#18 | 4.5%(-2.73)#3,109 |
| 19. | Walls | 1.7% | 6.0%(-4.26)#19 | 4.5%(-2.72)#3,127 |
| 20. | Purvis | 1.9% | 6.0%(-4.14)#20 | 4.5%(-2.59)#3,448 |
| 21. | Carrollton | 1.9% | 6.0%(-4.08)#21 | 4.5%(-2.54)#3,572 |
| 22. | Mantee | 1.9% | 6.0%(-4.06)#22 | 4.5%(-2.52)#3,605 |
| 23. | Lynchburg | 2.0% | 6.0%(-4.04)#23 | 4.5%(-2.50)#3,650 |
| 24. | Fulton | 2.0% | 6.0%(-4.01)#24 | 4.5%(-2.47)#3,748 |
| 25. | Clarksdale | 2.0% | 6.0%(-3.98)#25 | 4.5%(-2.44)#3,821 |
| 26. | Forest | 2.0% | 6.0%(-3.97)#26 | 4.5%(-2.43)#3,829 |
| 27. | Amory | 2.1% | 6.0%(-3.89)#27 | 4.5%(-2.35)#4,077 |
| 28. | Pearl | 2.1% | 6.0%(-3.88)#28 | 4.5%(-2.34)#4,086 |
| 29. | North Carrollton | 2.1% | 6.0%(-3.88)#29 | 4.5%(-2.33)#4,109 |
| 30. | Smithville | 2.2% | 6.0%(-3.85)#30 | 4.5%(-2.30)#4,192 |
| 31. | Gloster | 2.2% | 6.0%(-3.78)#31 | 4.5%(-2.24)#4,337 |
| 32. | Thaxton | 2.2% | 6.0%(-3.76)#32 | 4.5%(-2.21)#4,410 |
| 33. | Sandersville | 2.3% | 6.0%(-3.73)#33 | 4.5%(-2.19)#4,477 |
| 34. | Gulf Park Estates | 2.4% | 6.0%(-3.57)#34 | 4.5%(-2.03)#4,893 |
| 35. | Waveland | 2.4% | 6.0%(-3.57)#35 | 4.5%(-2.03)#4,902 |
| 36. | D Iberville | 2.5% | 6.0%(-3.51)#36 | 4.5%(-1.97)#5,047 |
| 37. | Long Beach | 2.6% | 6.0%(-3.45)#37 | 4.5%(-1.90)#5,210 |
| 38. | Utica | 2.6% | 6.0%(-3.44)#38 | 4.5%(-1.90)#5,226 |
| 39. | Verona | 2.7% | 6.0%(-3.30)#39 | 4.5%(-1.76)#5,559 |
| 40. | Bentonia | 2.7% | 6.0%(-3.30)#40 | 4.5%(-1.76)#5,580 |
| 41. | Clinton | 2.8% | 6.0%(-3.20)#41 | 4.5%(-1.66)#5,813 |
| 42. | Conehatta | 3.0% | 6.0%(-3.03)#42 | 4.5%(-1.48)#6,218 |
| 43. | Tupelo | 3.0% | 6.0%(-3.00)#43 | 4.5%(-1.46)#6,282 |
| 44. | Pass Christian | 3.0% | 6.0%(-3.00)#44 | 4.5%(-1.45)#6,293 |
| 45. | Tremont | 3.0% | 6.0%(-2.97)#45 | 4.5%(-1.43)#6,344 |
| 46. | Pontotoc | 3.0% | 6.0%(-2.96)#46 | 4.5%(-1.42)#6,372 |
| 47. | Olive Branch | 3.1% | 6.0%(-2.89)#47 | 4.5%(-1.35)#6,527 |
| 48. | Nettleton | 3.2% | 6.0%(-2.79)#48 | 4.5%(-1.25)#6,749 |
| 49. | Puckett | 3.2% | 6.0%(-2.78)#49 | 4.5%(-1.24)#6,778 |
| 50. | Kossuth | 3.2% | 6.0%(-2.78)#50 | 4.5%(-1.24)#6,795 |
| 51. | Leakesville | 3.3% | 6.0%(-2.72)#51 | 4.5%(-1.18)#6,915 |
| 52. | Florence | 3.4% | 6.0%(-2.65)#52 | 4.5%(-1.11)#7,071 |
| 53. | Mantachie | 3.4% | 6.0%(-2.62)#53 | 4.5%(-1.08)#7,141 |
| 54. | Byram | 3.4% | 6.0%(-2.56)#54 | 4.5%(-1.01)#7,250 |
| 55. | Bay Springs | 3.5% | 6.0%(-2.51)#55 | 4.5%(-0.968)#7,381 |
| 56. | Brandon | 3.5% | 6.0%(-2.48)#56 | 4.5%(-0.938)#7,452 |
| 57. | Water Valley | 3.6% | 6.0%(-2.37)#57 | 4.5%(-0.829)#7,675 |
| 58. | Chunky | 3.6% | 6.0%(-2.37)#58 | 4.5%(-0.826)#7,691 |
| 59. | Corinth | 3.6% | 6.0%(-2.35)#59 | 4.5%(-0.812)#7,718 |
| 60. | Robinhood | 3.8% | 6.0%(-2.16)#60 | 4.5%(-0.616)#8,105 |
| 61. | Sunflower | 3.8% | 6.0%(-2.16)#61 | 4.5%(-0.616)#8,106 |
| 62. | Cary | 3.8% | 6.0%(-2.16)#62 | 4.5%(-0.616)#8,121 |
| 63. | Big Creek | 3.8% | 6.0%(-2.16)#63 | 4.5%(-0.616)#8,135 |
| 64. | Ecru | 4.0% | 6.0%(-2.00)#64 | 4.5%(-0.462)#8,426 |
| 65. | Shannon | 4.1% | 6.0%(-1.93)#65 | 4.5%(-0.390)#8,571 |
| 66. | Coffeeville | 4.1% | 6.0%(-1.88)#66 | 4.5%(-0.338)#8,681 |
| 67. | Ruleville | 4.1% | 6.0%(-1.86)#67 | 4.5%(-0.317)#8,724 |
| 68. | Toccopola | 4.2% | 6.0%(-1.78)#68 | 4.5%(-0.237)#8,871 |
| 69. | Macon | 4.2% | 6.0%(-1.76)#69 | 4.5%(-0.213)#8,913 |
| 70. | Wiggins | 4.3% | 6.0%(-1.67)#70 | 4.5%(-0.124)#9,048 |
| 71. | Kosciusko | 4.3% | 6.0%(-1.66)#71 | 4.5%(-0.114)#9,059 |
| 72. | Montrose | 4.3% | 6.0%(-1.66)#72 | 4.5%(-0.114)#9,096 |
| 73. | Ridgeland | 4.4% | 6.0%(-1.63)#73 | 4.5%(-0.088)#9,134 |
| 74. | Victoria | 4.4% | 6.0%(-1.63)#74 | 4.5%(-0.087)#9,136 |
| 75. | Hatley | 4.5% | 6.0%(-1.49)#75 | 4.5%(+0.049)#9,362 |
| 76. | Iuka | 4.7% | 6.0%(-1.35)#76 | 4.5%(+0.198)#9,652 |
| 77. | Batesville | 4.7% | 6.0%(-1.34)#77 | 4.5%(+0.206)#9,669 |
| 78. | Nicholson | 4.7% | 6.0%(-1.33)#78 | 4.5%(+0.209)#9,673 |
| 79. | Hernando | 4.8% | 6.0%(-1.23)#79 | 4.5%(+0.310)#9,826 |
| 80. | Biloxi | 4.9% | 6.0%(-1.15)#80 | 4.5%(+0.391)#9,960 |
| 81. | Hurley | 5.0% | 6.0%(-1.00)#81 | 4.5%(+0.538)#10,180 |
| 82. | Maben | 5.0% | 6.0%(-1.00)#82 | 4.5%(+0.538)#10,182 |
| 83. | Booneville | 5.2% | 6.0%(-0.820)#83 | 4.5%(+0.723)#10,458 |
| 84. | Horn Lake | 5.2% | 6.0%(-0.810)#84 | 4.5%(+0.733)#10,479 |
| 85. | Bay St Louis | 5.2% | 6.0%(-0.800)#85 | 4.5%(+0.743)#10,488 |
| 86. | Rawls Springs | 5.3% | 6.0%(-0.754)#86 | 4.5%(+0.789)#10,546 |
| 87. | Renova | 5.3% | 6.0%(-0.742)#87 | 4.5%(+0.801)#10,559 |
| 88. | Courtland | 5.3% | 6.0%(-0.742)#88 | 4.5%(+0.801)#10,560 |
| 89. | Lena | 5.3% | 6.0%(-0.742)#89 | 4.5%(+0.801)#10,603 |
| 90. | Sardis | 5.4% | 6.0%(-0.628)#90 | 4.5%(+0.914)#10,765 |
| 91. | Crenshaw | 5.5% | 6.0%(-0.550)#91 | 4.5%(+0.993)#10,897 |
| 92. | Natchez | 5.5% | 6.0%(-0.527)#92 | 4.5%(+1.02)#10,938 |
| 93. | Rienzi | 5.6% | 6.0%(-0.449)#93 | 4.5%(+1.09)#11,051 |
| 94. | Petal | 5.6% | 6.0%(-0.421)#94 | 4.5%(+1.12)#11,105 |
| 95. | Bolton | 5.6% | 6.0%(-0.360)#95 | 4.5%(+1.18)#11,181 |
| 96. | Tunica | 5.7% | 6.0%(-0.335)#96 | 4.5%(+1.21)#11,210 |
| 97. | Lucedale | 5.8% | 6.0%(-0.246)#97 | 4.5%(+1.30)#11,331 |
| 98. | Mathiston | 5.8% | 6.0%(-0.236)#98 | 4.5%(+1.31)#11,351 |
| 99. | Blue Mountain | 5.8% | 6.0%(-0.220)#99 | 4.5%(+1.32)#11,371 |
| 100. | Oxford | 5.8% | 6.0%(-0.218)#100 | 4.5%(+1.33)#11,375 |
Common Questions
What are the Top 10 Cities with the Lowest Poverty Level Among Married Couples in Mississippi?
Top 10 Cities with the Lowest Poverty Level Among Married Couples in Mississippi are:
#1
0.19%
#2
0.56%
#3
0.57%
#4
0.68%
#5
0.72%
#6
0.74%
#7
0.78%
#8
0.90%
#9
1.0%
#10
1.2%
What city has the Lowest Poverty Level Among Married Couples in Mississippi?
Sumrall has the Lowest Poverty Level Among Married Couples in Mississippi with 0.19%.
What is the Poverty Level Among Married Couples in the State of Mississippi?
Poverty Level Among Married Couples in Mississippi is 6.0%.
What is the Poverty Level Among Married Couples in the United States?
Poverty Level Among Married Couples in the United States is 4.5%.