East Rockingham, NC
East Rockingham Map
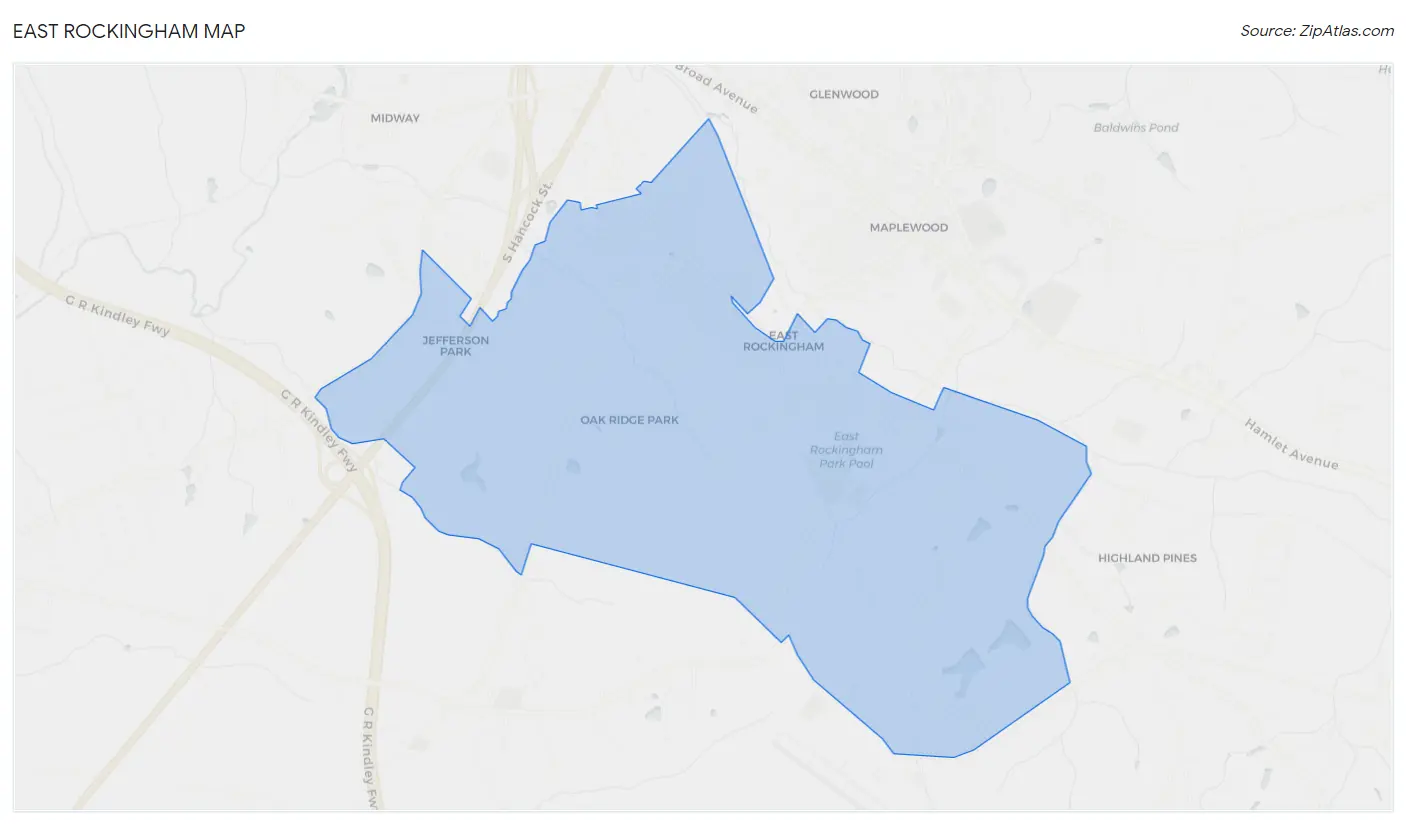
East Rockingham Overview
3,328
TOTAL POPULATION
1,688
MALE POPULATION
1,640
FEMALE POPULATION
102.93
MALES / 100 FEMALES
97.16
FEMALES / 100 MALES
35.8
MEDIAN AGE
3.3
AVG FAMILY SIZE
2.5
AVG HOUSEHOLD SIZE
$20,390
PER CAPITA INCOME
$32,566
AVG FAMILY INCOME
$31,475
AVG HOUSEHOLD INCOME
1.1%
WAGE / INCOME GAP [ % ]
98.9¢/ $1
WAGE / INCOME GAP [ $ ]
0.50
INEQUALITY / GINI INDEX
1,366
LABOR FORCE [ PEOPLE ]
57.2%
PERCENT IN LABOR FORCE
12.5%
UNEMPLOYMENT RATE
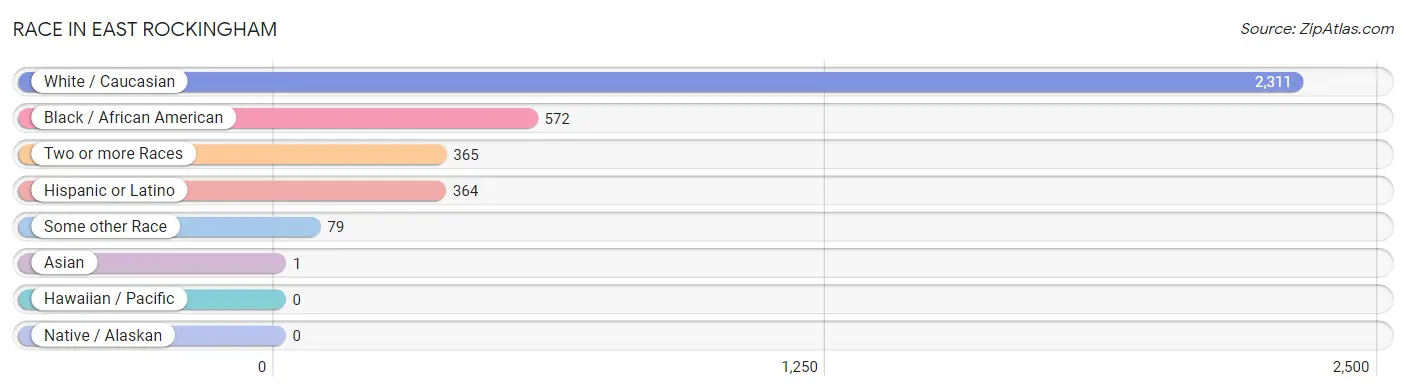
Race in East Rockingham
The most populous races in East Rockingham are White / Caucasian (2,311 | 69.4%), Black / African American (572 | 17.2%), and Two or more Races (365 | 11.0%).
| Race | # Population | % Population |
| Asian | 1 | 0.0% |
| Black / African American | 572 | 17.2% |
| Hawaiian / Pacific | 0 | 0.0% |
| Hispanic or Latino | 364 | 10.9% |
| Native / Alaskan | 0 | 0.0% |
| White / Caucasian | 2,311 | 69.4% |
| Two or more Races | 365 | 11.0% |
| Some other Race | 79 | 2.4% |
| Total | 3,328 | 100.0% |
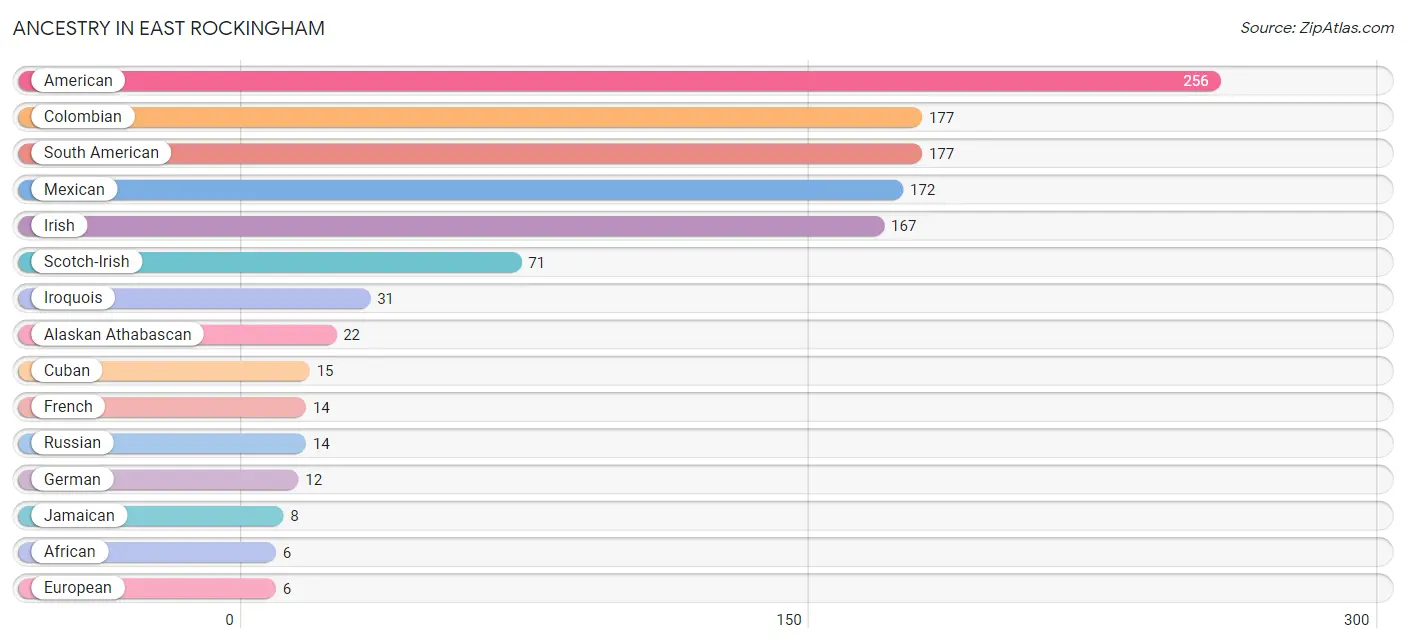
Ancestry in East Rockingham
The most populous ancestries reported in East Rockingham are American (256 | 7.7%), Colombian (177 | 5.3%), South American (177 | 5.3%), Mexican (172 | 5.2%), and Irish (167 | 5.0%), together accounting for 28.5% of all East Rockingham residents.
| Ancestry | # Population | % Population |
| African | 6 | 0.2% |
| Alaskan Athabascan | 22 | 0.7% |
| American | 256 | 7.7% |
| Cherokee | 2 | 0.1% |
| Colombian | 177 | 5.3% |
| Cuban | 15 | 0.4% |
| English | 5 | 0.2% |
| European | 6 | 0.2% |
| French | 14 | 0.4% |
| German | 12 | 0.4% |
| Indian (Asian) | 1 | 0.0% |
| Irish | 167 | 5.0% |
| Iroquois | 31 | 0.9% |
| Jamaican | 8 | 0.2% |
| Mexican | 172 | 5.2% |
| Polish | 1 | 0.0% |
| Russian | 14 | 0.4% |
| Scotch-Irish | 71 | 2.1% |
| South American | 177 | 5.3% |
| Subsaharan African | 6 | 0.2% | View All 20 Rows |
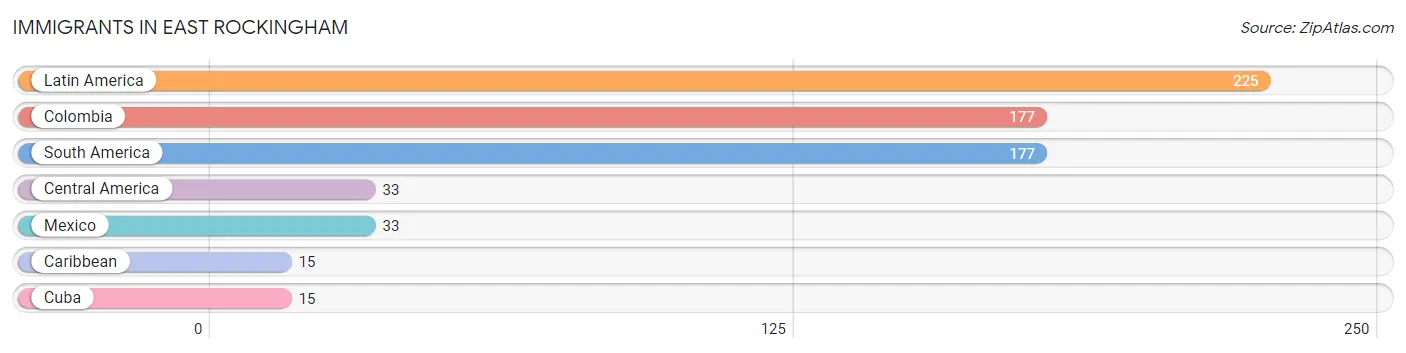
Immigrants in East Rockingham
The most numerous immigrant groups reported in East Rockingham came from Latin America (225 | 6.8%), Colombia (177 | 5.3%), South America (177 | 5.3%), Central America (33 | 1.0%), and Mexico (33 | 1.0%), together accounting for 19.4% of all East Rockingham residents.
| Immigration Origin | # Population | % Population |
| Caribbean | 15 | 0.4% |
| Central America | 33 | 1.0% |
| Colombia | 177 | 5.3% |
| Cuba | 15 | 0.4% |
| Latin America | 225 | 6.8% |
| Mexico | 33 | 1.0% |
| South America | 177 | 5.3% | View All 7 Rows |
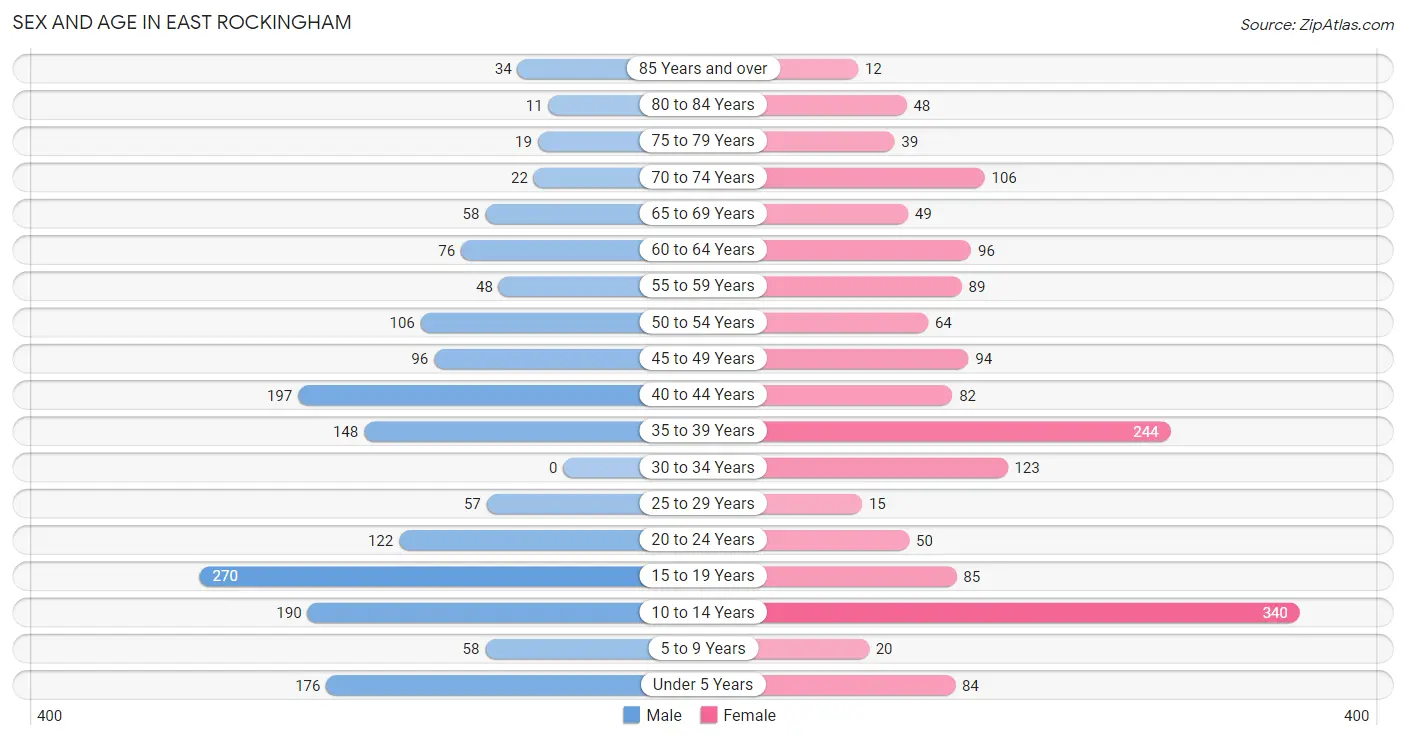
Sex and Age in East Rockingham
Sex and Age in East Rockingham
The most populous age groups in East Rockingham are 15 to 19 Years (270 | 16.0%) for men and 10 to 14 Years (340 | 20.7%) for women.
| Age Bracket | Male | Female |
| Under 5 Years | 176 (10.4%) | 84 (5.1%) |
| 5 to 9 Years | 58 (3.4%) | 20 (1.2%) |
| 10 to 14 Years | 190 (11.3%) | 340 (20.7%) |
| 15 to 19 Years | 270 (16.0%) | 85 (5.2%) |
| 20 to 24 Years | 122 (7.2%) | 50 (3.0%) |
| 25 to 29 Years | 57 (3.4%) | 15 (0.9%) |
| 30 to 34 Years | 0 (0.0%) | 123 (7.5%) |
| 35 to 39 Years | 148 (8.8%) | 244 (14.9%) |
| 40 to 44 Years | 197 (11.7%) | 82 (5.0%) |
| 45 to 49 Years | 96 (5.7%) | 94 (5.7%) |
| 50 to 54 Years | 106 (6.3%) | 64 (3.9%) |
| 55 to 59 Years | 48 (2.8%) | 89 (5.4%) |
| 60 to 64 Years | 76 (4.5%) | 96 (5.9%) |
| 65 to 69 Years | 58 (3.4%) | 49 (3.0%) |
| 70 to 74 Years | 22 (1.3%) | 106 (6.5%) |
| 75 to 79 Years | 19 (1.1%) | 39 (2.4%) |
| 80 to 84 Years | 11 (0.6%) | 48 (2.9%) |
| 85 Years and over | 34 (2.0%) | 12 (0.7%) |
| Total | 1,688 (100.0%) | 1,640 (100.0%) |
Families and Households in East Rockingham
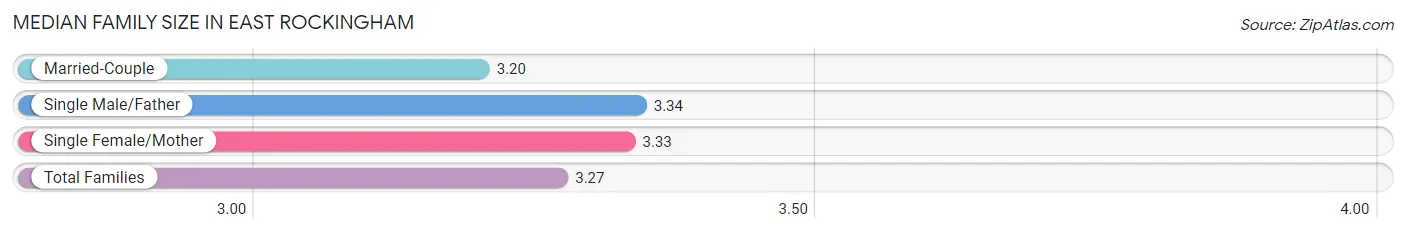
Median Family Size in East Rockingham
The median family size in East Rockingham is 3.27 persons per family, with single male/father families (134 | 16.4%) accounting for the largest median family size of 3.34 persons per family. On the other hand, married-couple families (369 | 45.1%) represent the smallest median family size with 3.20 persons per family.
| Family Type | # Families | Family Size |
| Married-Couple | 369 (45.1%) | 3.20 |
| Single Male/Father | 134 (16.4%) | 3.34 |
| Single Female/Mother | 316 (38.6%) | 3.33 |
| Total Families | 819 (100.0%) | 3.27 |
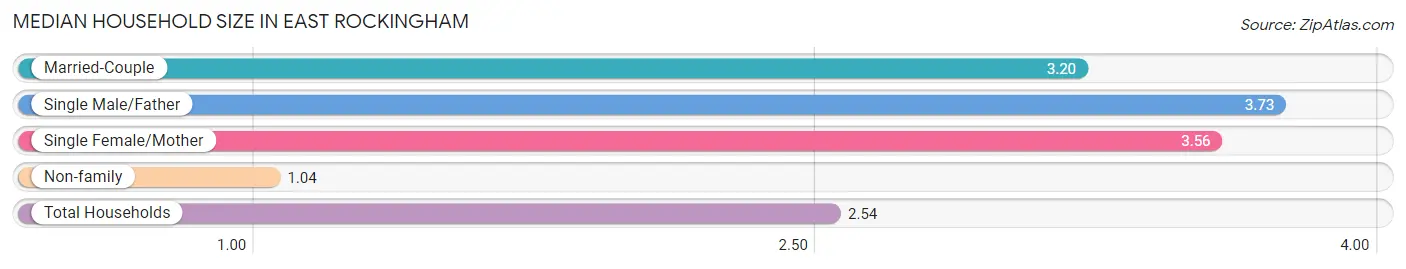
Median Household Size in East Rockingham
The median household size in East Rockingham is 2.54 persons per household, with single male/father households (134 | 10.3%) accounting for the largest median household size of 3.73 persons per household. non-family households (487 | 37.3%) represent the smallest median household size with 1.04 persons per household.
| Household Type | # Households | Household Size |
| Married-Couple | 369 (28.2%) | 3.20 |
| Single Male/Father | 134 (10.3%) | 3.73 |
| Single Female/Mother | 316 (24.2%) | 3.56 |
| Non-family | 487 (37.3%) | 1.04 |
| Total Households | 1,306 (100.0%) | 2.54 |
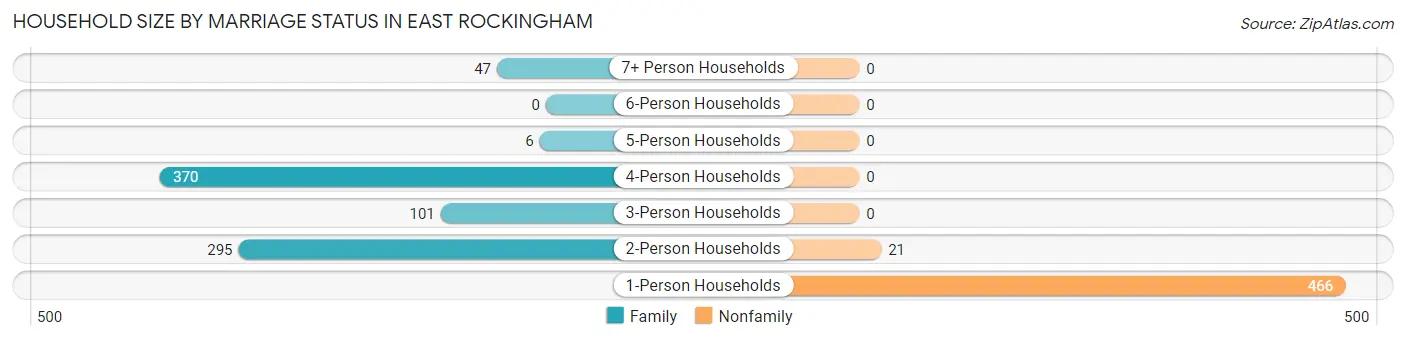
Household Size by Marriage Status in East Rockingham
Out of a total of 1,306 households in East Rockingham, 819 (62.7%) are family households, while 487 (37.3%) are nonfamily households. The most numerous type of family households are 4-person households, comprising 370, and the most common type of nonfamily households are 1-person households, comprising 466.
| Household Size | Family Households | Nonfamily Households |
| 1-Person Households | - | 466 (35.7%) |
| 2-Person Households | 295 (22.6%) | 21 (1.6%) |
| 3-Person Households | 101 (7.7%) | 0 (0.0%) |
| 4-Person Households | 370 (28.3%) | 0 (0.0%) |
| 5-Person Households | 6 (0.5%) | 0 (0.0%) |
| 6-Person Households | 0 (0.0%) | 0 (0.0%) |
| 7+ Person Households | 47 (3.6%) | 0 (0.0%) |
| Total | 819 (62.7%) | 487 (37.3%) |
Female Fertility in East Rockingham
Fertility by Age in East Rockingham
Average fertility rate in East Rockingham is 100.0 births per 1,000 women. Women in the age bracket of 15 to 19 years have the highest fertility rate with 376.0 births per 1,000 women. Women in the age bracket of 20 to 34 years acount for 54.3% of all women with births.
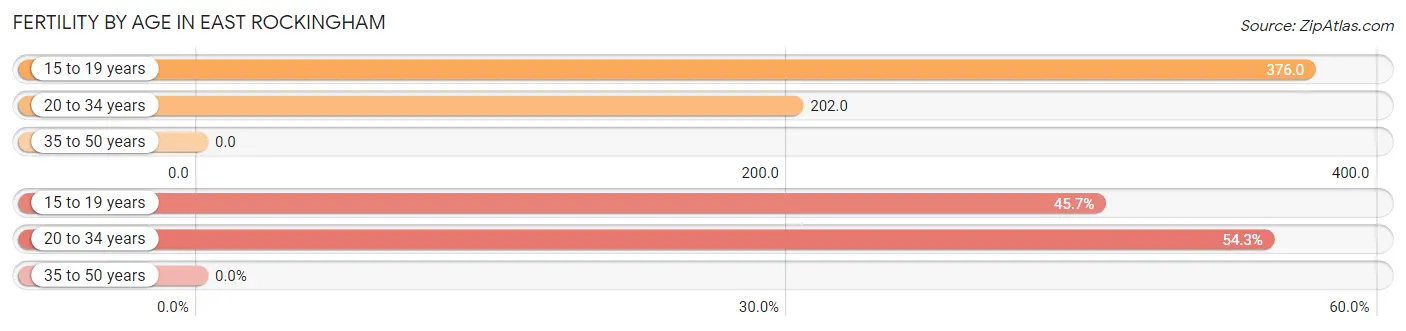
| Age Bracket | Women with Births | Births / 1,000 Women |
| 15 to 19 years | 32 (45.7%) | 376.0 |
| 20 to 34 years | 38 (54.3%) | 202.0 |
| 35 to 50 years | 0 (0.0%) | 0.0 |
| Total | 70 (100.0%) | 100.0 |
Fertility by Age by Marriage Status in East Rockingham
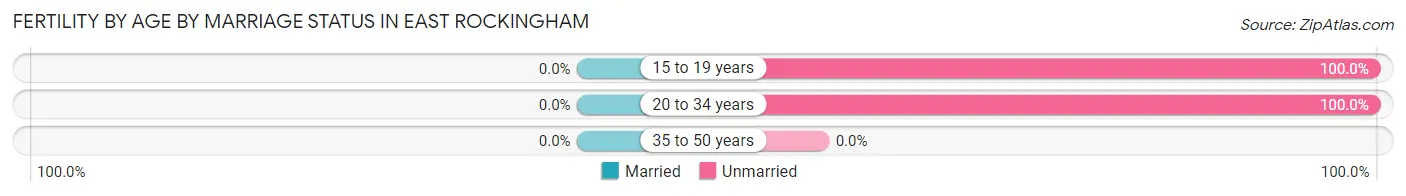
| Age Bracket | Married | Unmarried |
| 15 to 19 years | 0 (0.0%) | 32 (100.0%) |
| 20 to 34 years | 0 (0.0%) | 38 (100.0%) |
| 35 to 50 years | 0 (0.0%) | 0 (0.0%) |
| Total | 0 (0.0%) | 70 (100.0%) |
Fertility by Education in East Rockingham
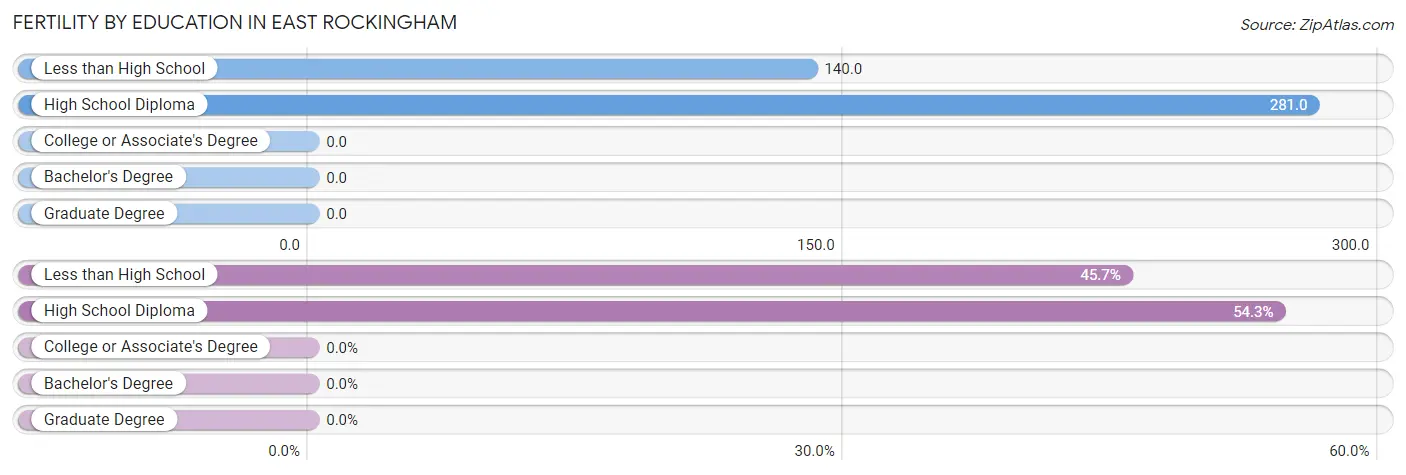
| Educational Attainment | Women with Births | Births / 1,000 Women |
| Less than High School | 32 (45.7%) | 140.0 |
| High School Diploma | 38 (54.3%) | 281.0 |
| College or Associate's Degree | 0 (0.0%) | 0.0 |
| Bachelor's Degree | 0 (0.0%) | 0.0 |
| Graduate Degree | 0 (0.0%) | 0.0 |
| Total | 70 (100.0%) | 100.0 |
Fertility by Education by Marriage Status in East Rockingham
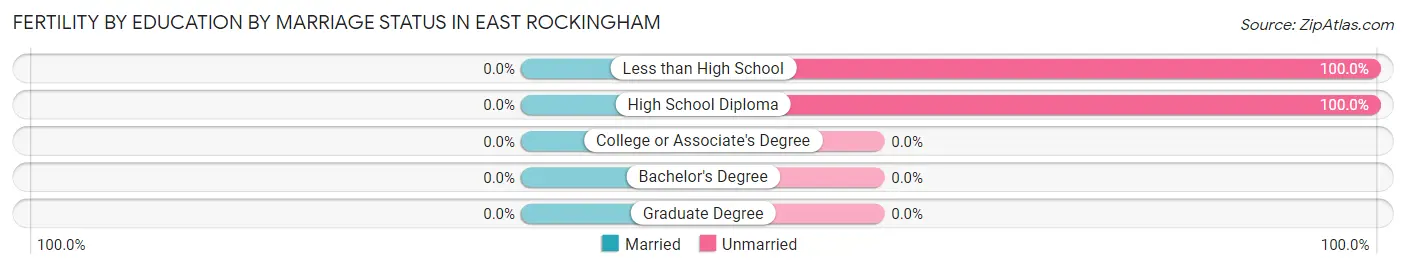
| Educational Attainment | Married | Unmarried |
| Less than High School | 0 (0.0%) | 32 (100.0%) |
| High School Diploma | 0 (0.0%) | 38 (100.0%) |
| College or Associate's Degree | 0 (0.0%) | 0 (0.0%) |
| Bachelor's Degree | 0 (0.0%) | 0 (0.0%) |
| Graduate Degree | 0 (0.0%) | 0 (0.0%) |
| Total | 0 (0.0%) | 70 (100.0%) |
Income in East Rockingham
Income Overview in East Rockingham
Per Capita Income in East Rockingham is $20,390, while median incomes of families and households are $32,566 and $31,475 respectively.
| Characteristic | Number | Measure |
| Per Capita Income | 3,328 | $20,390 |
| Median Family Income | 819 | $32,566 |
| Mean Family Income | 819 | $51,123 |
| Median Household Income | 1,306 | $31,475 |
| Mean Household Income | 1,306 | $51,331 |
| Income Deficit | 819 | $0 |
| Wage / Income Gap (%) | 3,328 | 1.12% |
| Wage / Income Gap ($) | 3,328 | 98.88¢ per $1 |
| Gini / Inequality Index | 3,328 | 0.50 |
Earnings by Sex in East Rockingham
Average Earnings in East Rockingham are $28,785, $28,901 for men and $28,577 for women, a difference of 1.1%.
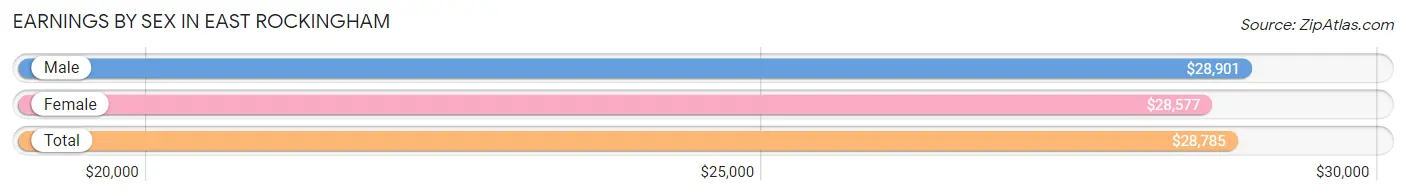
| Sex | Number | Average Earnings |
| Male | 806 (56.2%) | $28,901 |
| Female | 628 (43.8%) | $28,577 |
| Total | 1,434 (100.0%) | $28,785 |
Earnings by Sex by Income Bracket in East Rockingham
The most common earnings brackets in East Rockingham are $25,000 to $29,999 for men (139 | 17.2%) and $25,000 to $29,999 for women (127 | 20.2%).
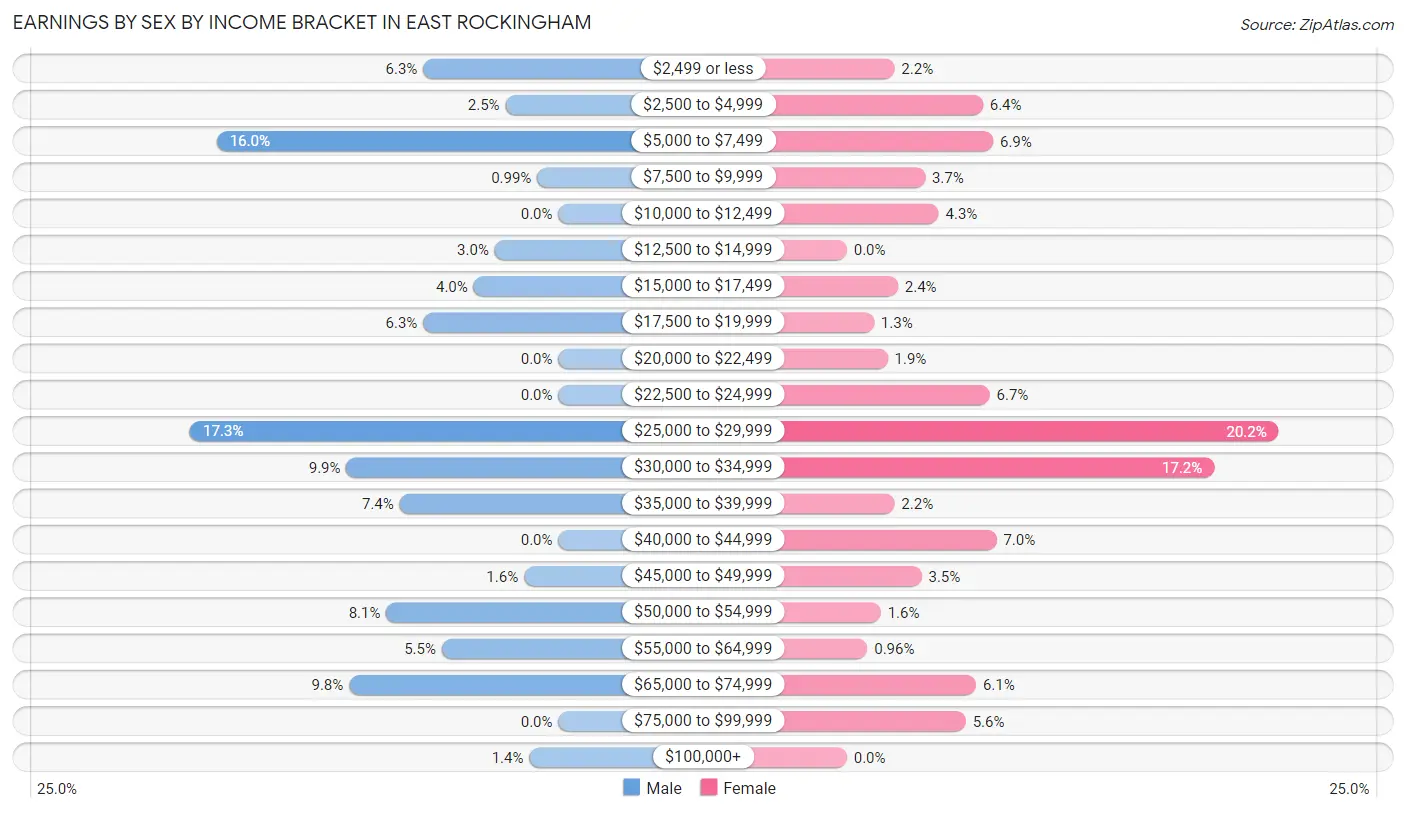
| Income | Male | Female |
| $2,499 or less | 51 (6.3%) | 14 (2.2%) |
| $2,500 to $4,999 | 20 (2.5%) | 40 (6.4%) |
| $5,000 to $7,499 | 129 (16.0%) | 43 (6.9%) |
| $7,500 to $9,999 | 8 (1.0%) | 23 (3.7%) |
| $10,000 to $12,499 | 0 (0.0%) | 27 (4.3%) |
| $12,500 to $14,999 | 24 (3.0%) | 0 (0.0%) |
| $15,000 to $17,499 | 32 (4.0%) | 15 (2.4%) |
| $17,500 to $19,999 | 51 (6.3%) | 8 (1.3%) |
| $20,000 to $22,499 | 0 (0.0%) | 12 (1.9%) |
| $22,500 to $24,999 | 0 (0.0%) | 42 (6.7%) |
| $25,000 to $29,999 | 139 (17.2%) | 127 (20.2%) |
| $30,000 to $34,999 | 80 (9.9%) | 108 (17.2%) |
| $35,000 to $39,999 | 60 (7.4%) | 14 (2.2%) |
| $40,000 to $44,999 | 0 (0.0%) | 44 (7.0%) |
| $45,000 to $49,999 | 13 (1.6%) | 22 (3.5%) |
| $50,000 to $54,999 | 65 (8.1%) | 10 (1.6%) |
| $55,000 to $64,999 | 44 (5.5%) | 6 (1.0%) |
| $65,000 to $74,999 | 79 (9.8%) | 38 (6.0%) |
| $75,000 to $99,999 | 0 (0.0%) | 35 (5.6%) |
| $100,000+ | 11 (1.4%) | 0 (0.0%) |
| Total | 806 (100.0%) | 628 (100.0%) |
Earnings by Sex by Educational Attainment in East Rockingham
Average earnings in East Rockingham are $28,403 for men and $29,808 for women, a difference of 4.7%. Men with an educational attainment of less than high school enjoy the highest average annual earnings of $31,311, while those with high school diploma education earn the least with $31,250. Women with an educational attainment of college or associate's degree earn the most with the average annual earnings of $39,554, while those with high school diploma education have the smallest earnings of $23,274.
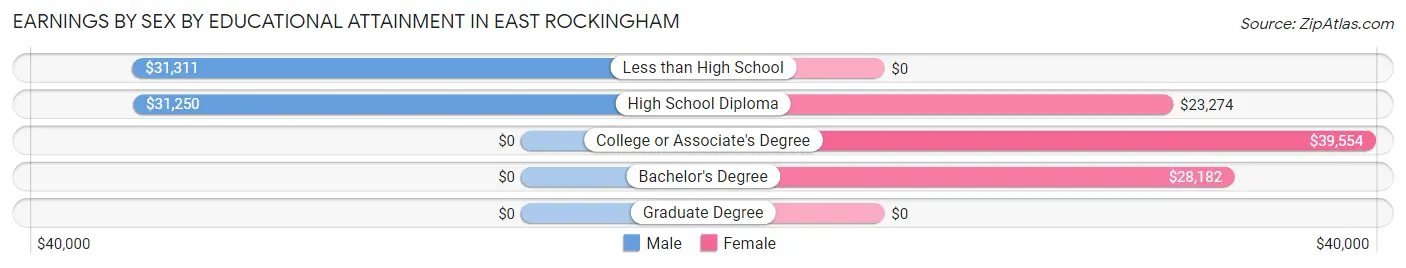
| Educational Attainment | Male Income | Female Income |
| Less than High School | $31,311 | $0 |
| High School Diploma | $31,250 | $23,274 |
| College or Associate's Degree | - | - |
| Bachelor's Degree | - | - |
| Graduate Degree | - | - |
| Total | $28,403 | $29,808 |
Family Income in East Rockingham
Family Income Brackets in East Rockingham
According to the East Rockingham family income data, there are 230 families falling into the $25,000 to $34,999 income range, which is the most common income bracket and makes up 28.1% of all families.
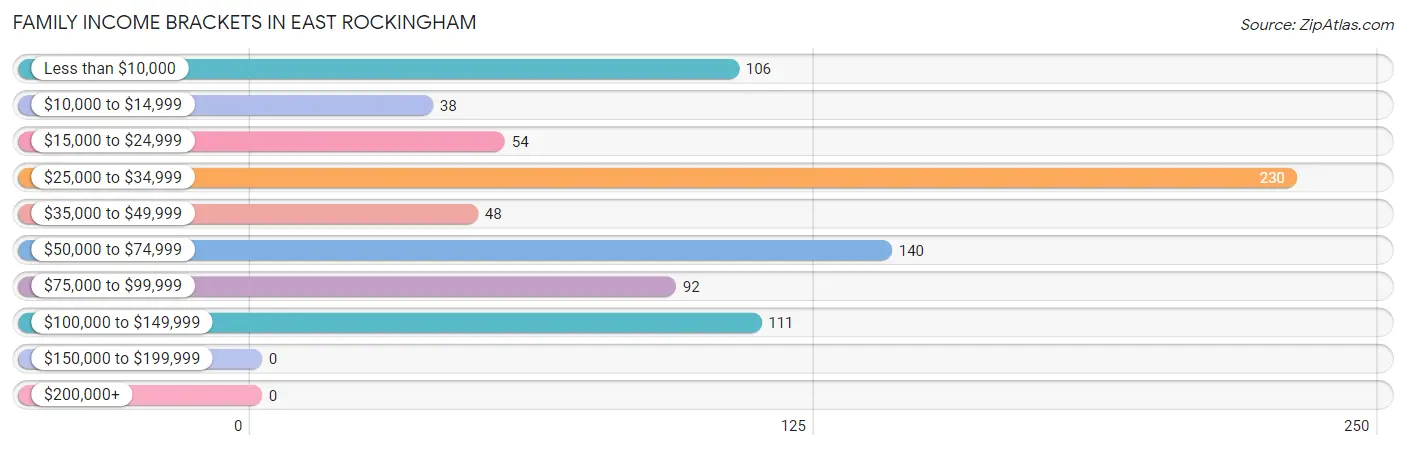
| Income Bracket | # Families | % Families |
| Less than $10,000 | 106 | 12.9% |
| $10,000 to $14,999 | 38 | 4.6% |
| $15,000 to $24,999 | 54 | 6.6% |
| $25,000 to $34,999 | 230 | 28.1% |
| $35,000 to $49,999 | 48 | 5.9% |
| $50,000 to $74,999 | 140 | 17.1% |
| $75,000 to $99,999 | 92 | 11.2% |
| $100,000 to $149,999 | 111 | 13.6% |
| $150,000 to $199,999 | 0 | 0.0% |
| $200,000+ | 0 | 0.0% |
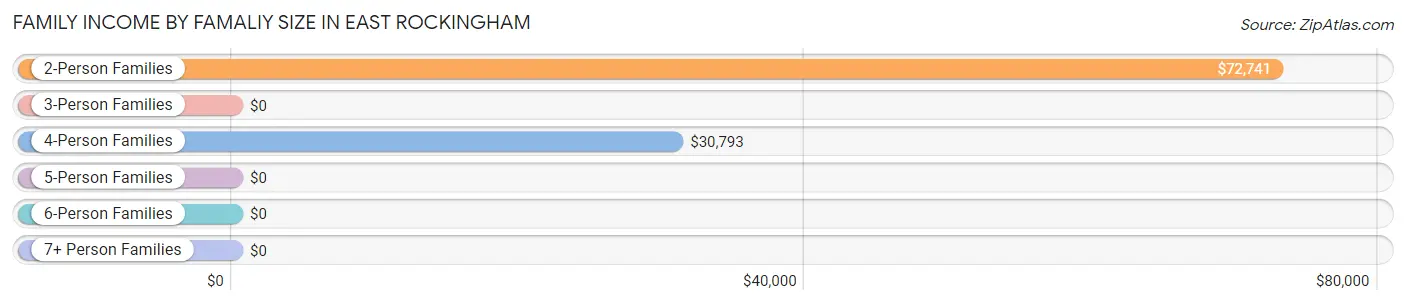
Family Income by Famaliy Size in East Rockingham
2-person families (300 | 36.6%) account for the highest median family income in East Rockingham with $72,741 per family, while 2-person families (300 | 36.6%) have the highest median income of $36,370 per family member.
| Income Bracket | # Families | Median Income |
| 2-Person Families | 300 (36.6%) | $72,741 |
| 3-Person Families | 206 (25.2%) | $0 |
| 4-Person Families | 260 (31.8%) | $30,793 |
| 5-Person Families | 6 (0.7%) | $0 |
| 6-Person Families | 47 (5.7%) | $0 |
| 7+ Person Families | 0 (0.0%) | $0 |
| Total | 819 (100.0%) | $32,566 |
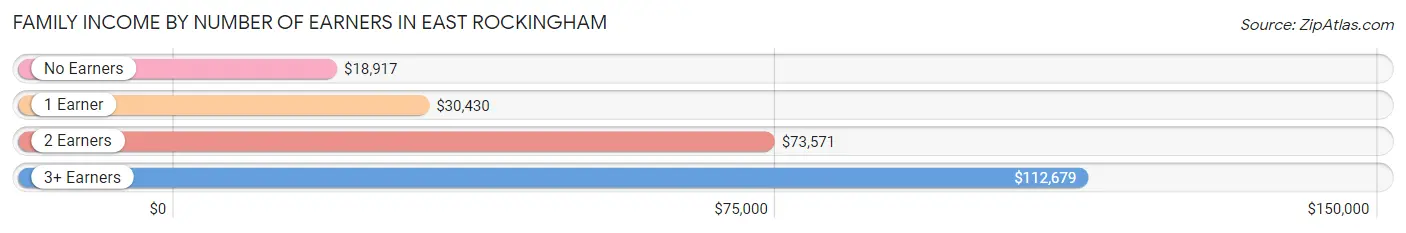
Family Income by Number of Earners in East Rockingham
The median family income in East Rockingham is $32,566, with families comprising 3+ earners (48) having the highest median family income of $112,679, while families with no earners (113) have the lowest median family income of $18,917, accounting for 5.9% and 13.8% of families, respectively.
| Number of Earners | # Families | Median Income |
| No Earners | 113 (13.8%) | $18,917 |
| 1 Earner | 304 (37.1%) | $30,430 |
| 2 Earners | 354 (43.2%) | $73,571 |
| 3+ Earners | 48 (5.9%) | $112,679 |
| Total | 819 (100.0%) | $32,566 |
Household Income in East Rockingham
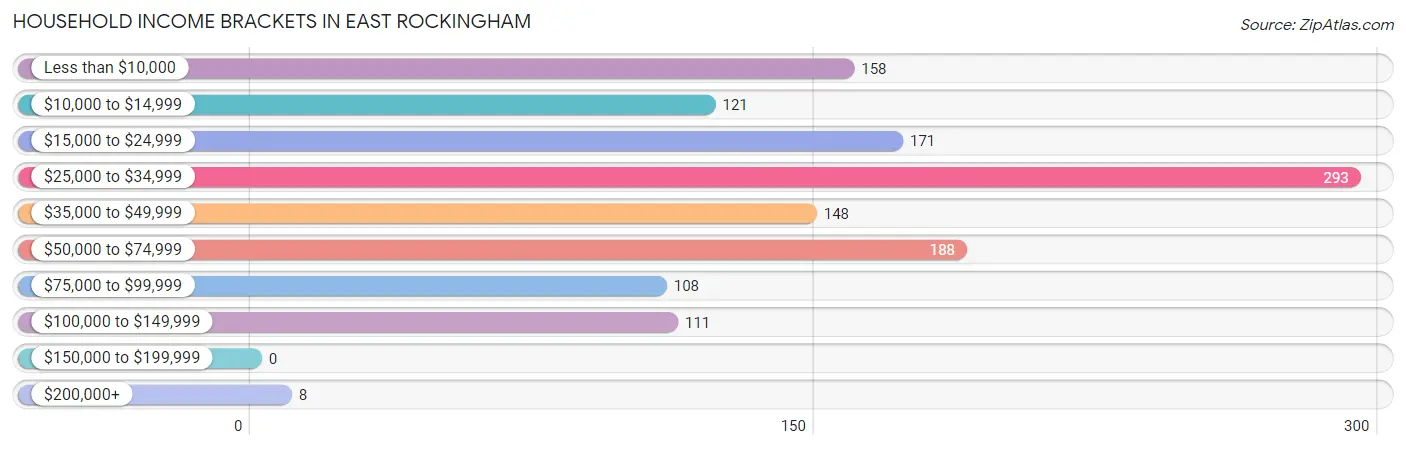
Household Income Brackets in East Rockingham
With 293 households falling in the category, the $25,000 to $34,999 income range is the most frequent in East Rockingham, accounting for 22.4% of all households.
| Income Bracket | # Households | % Households |
| Less than $10,000 | 158 | 12.1% |
| $10,000 to $14,999 | 121 | 9.3% |
| $15,000 to $24,999 | 171 | 13.1% |
| $25,000 to $34,999 | 293 | 22.4% |
| $35,000 to $49,999 | 148 | 11.3% |
| $50,000 to $74,999 | 188 | 14.4% |
| $75,000 to $99,999 | 108 | 8.3% |
| $100,000 to $149,999 | 111 | 8.5% |
| $150,000 to $199,999 | 0 | 0.0% |
| $200,000+ | 8 | 0.6% |
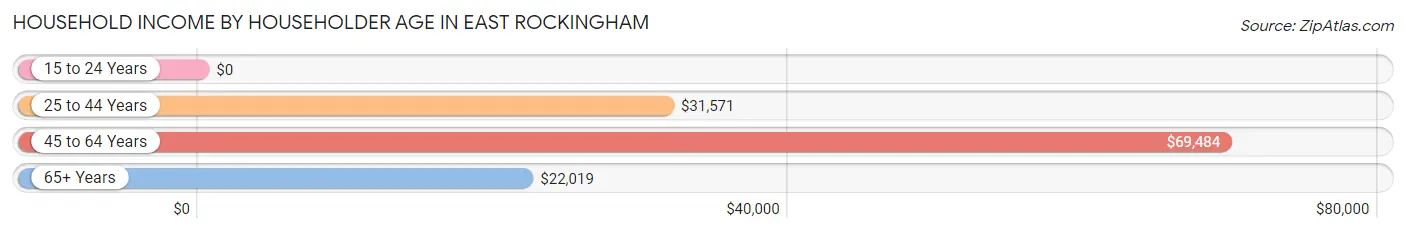
Household Income by Householder Age in East Rockingham
The median household income in East Rockingham is $31,475, with the highest median household income of $69,484 found in the 45 to 64 years age bracket for the primary householder. A total of 449 households (34.4%) fall into this category. Meanwhile, the 15 to 24 years age bracket for the primary householder has the lowest median household income of $0, with 50 households (3.8%) in this group.
| Income Bracket | # Households | Median Income |
| 15 to 24 Years | 50 (3.8%) | $0 |
| 25 to 44 Years | 519 (39.7%) | $31,571 |
| 45 to 64 Years | 449 (34.4%) | $69,484 |
| 65+ Years | 288 (22.1%) | $22,019 |
| Total | 1,306 (100.0%) | $31,475 |
Poverty in East Rockingham
Income Below Poverty by Sex and Age in East Rockingham
With 25.8% poverty level for males and 38.8% for females among the residents of East Rockingham, 6 to 11 year old males and 12 to 14 year old females are the most vulnerable to poverty, with 104 males (61.5%) and 172 females (100.0%) in their respective age groups living below the poverty level.
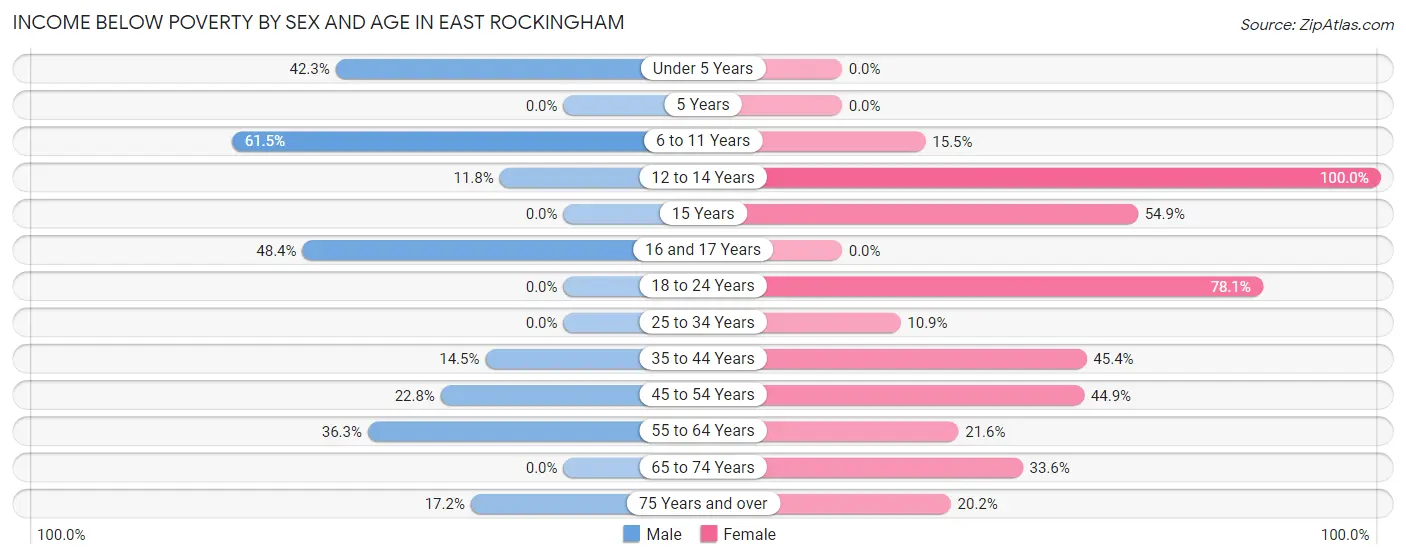
| Age Bracket | Male | Female |
| Under 5 Years | 74 (42.3%) | 0 (0.0%) |
| 5 Years | 0 (0.0%) | 0 (0.0%) |
| 6 to 11 Years | 104 (61.5%) | 29 (15.5%) |
| 12 to 14 Years | 9 (11.8%) | 172 (100.0%) |
| 15 Years | 0 (0.0%) | 39 (54.9%) |
| 16 and 17 Years | 93 (48.4%) | 0 (0.0%) |
| 18 to 24 Years | 0 (0.0%) | 50 (78.1%) |
| 25 to 34 Years | 0 (0.0%) | 15 (10.9%) |
| 35 to 44 Years | 50 (14.5%) | 148 (45.4%) |
| 45 to 54 Years | 46 (22.8%) | 71 (44.9%) |
| 55 to 64 Years | 45 (36.3%) | 40 (21.6%) |
| 65 to 74 Years | 0 (0.0%) | 52 (33.6%) |
| 75 Years and over | 11 (17.2%) | 20 (20.2%) |
| Total | 432 (25.8%) | 636 (38.8%) |
Income Above Poverty by Sex and Age in East Rockingham
According to the poverty statistics in East Rockingham, males aged 18 to 24 years and females aged under 5 years are the age groups that are most secure financially, with 100.0% of males and 100.0% of females in these age groups living above the poverty line.
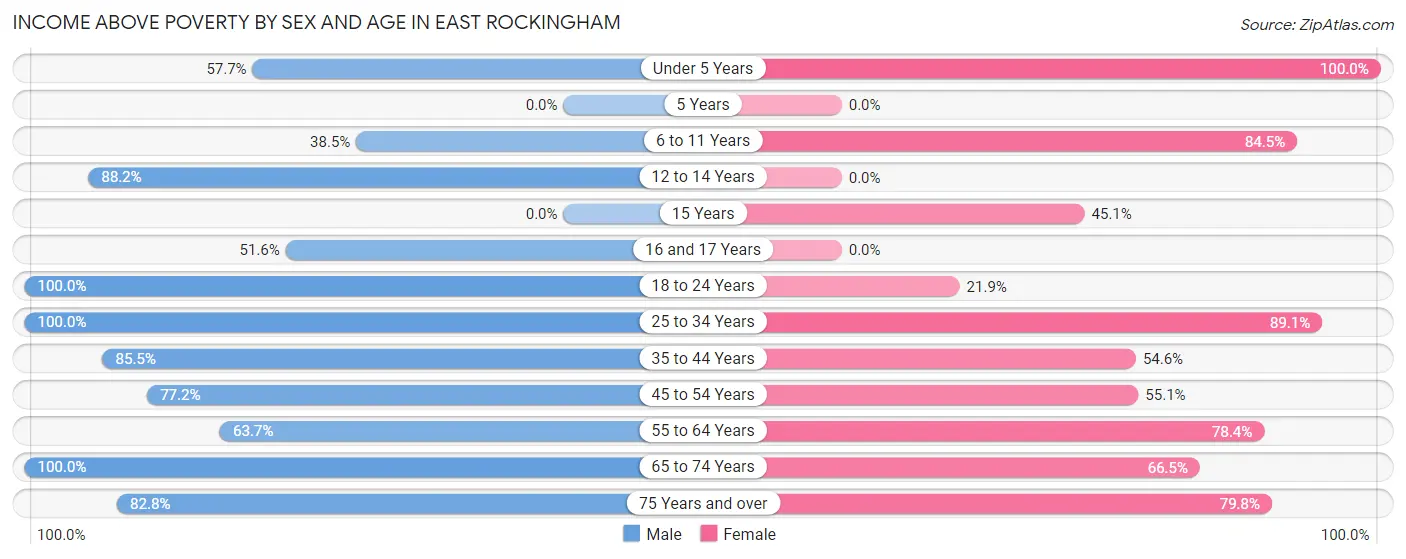
| Age Bracket | Male | Female |
| Under 5 Years | 101 (57.7%) | 83 (100.0%) |
| 5 Years | 0 (0.0%) | 0 (0.0%) |
| 6 to 11 Years | 65 (38.5%) | 158 (84.5%) |
| 12 to 14 Years | 67 (88.2%) | 0 (0.0%) |
| 15 Years | 0 (0.0%) | 32 (45.1%) |
| 16 and 17 Years | 99 (51.6%) | 0 (0.0%) |
| 18 to 24 Years | 191 (100.0%) | 14 (21.9%) |
| 25 to 34 Years | 57 (100.0%) | 123 (89.1%) |
| 35 to 44 Years | 295 (85.5%) | 178 (54.6%) |
| 45 to 54 Years | 156 (77.2%) | 87 (55.1%) |
| 55 to 64 Years | 79 (63.7%) | 145 (78.4%) |
| 65 to 74 Years | 80 (100.0%) | 103 (66.4%) |
| 75 Years and over | 53 (82.8%) | 79 (79.8%) |
| Total | 1,243 (74.2%) | 1,002 (61.2%) |
Income Below Poverty Among Married-Couple Families in East Rockingham
The poverty statistics for married-couple families in East Rockingham show that 1.6% or 6 of the total 369 families live below the poverty line. Families with 1 or 2 children have the highest poverty rate of 3.5%, comprising of 6 families. On the other hand, families with no children have the lowest poverty rate of 0.0%, which includes 0 families.
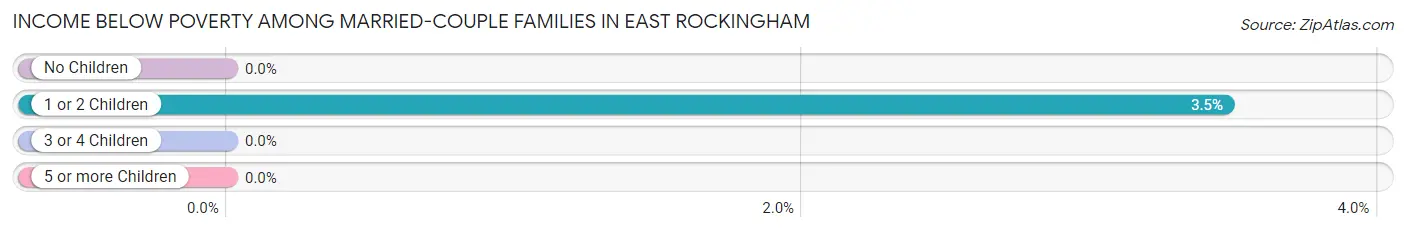
| Children | Above Poverty | Below Poverty |
| No Children | 196 (100.0%) | 0 (0.0%) |
| 1 or 2 Children | 167 (96.5%) | 6 (3.5%) |
| 3 or 4 Children | 0 (0.0%) | 0 (0.0%) |
| 5 or more Children | 0 (0.0%) | 0 (0.0%) |
| Total | 363 (98.4%) | 6 (1.6%) |
Income Below Poverty Among Single-Parent Households in East Rockingham
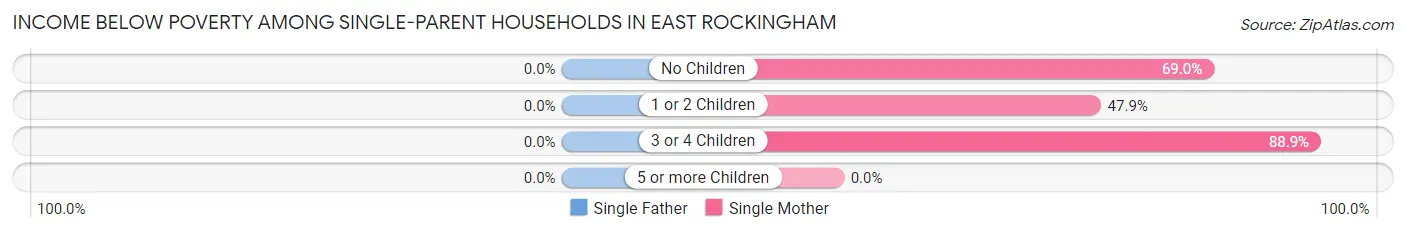
| Children | Single Father | Single Mother |
| No Children | 0 (0.0%) | 20 (69.0%) |
| 1 or 2 Children | 0 (0.0%) | 90 (47.9%) |
| 3 or 4 Children | 0 (0.0%) | 88 (88.9%) |
| 5 or more Children | 0 (0.0%) | 0 (0.0%) |
| Total | 0 (0.0%) | 198 (62.7%) |
Income Below Poverty Among Married-Couple vs Single-Parent Households in East Rockingham
The poverty data for East Rockingham shows that 6 of the married-couple family households (1.6%) and 198 of the single-parent households (44.0%) are living below the poverty level. Within the married-couple family households, those with 1 or 2 children have the highest poverty rate, with 6 households (3.5%) falling below the poverty line. Among the single-parent households, those with 3 or 4 children have the highest poverty rate, with 88 household (60.3%) living below poverty.
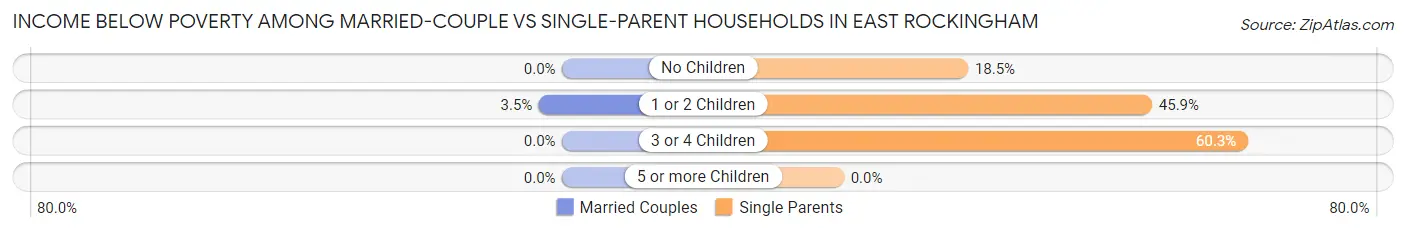
| Children | Married-Couple Families | Single-Parent Households |
| No Children | 0 (0.0%) | 20 (18.5%) |
| 1 or 2 Children | 6 (3.5%) | 90 (45.9%) |
| 3 or 4 Children | 0 (0.0%) | 88 (60.3%) |
| 5 or more Children | 0 (0.0%) | 0 (0.0%) |
| Total | 6 (1.6%) | 198 (44.0%) |
Employment Characteristics in East Rockingham
Employment by Class of Employer in East Rockingham
Among the 1,195 employed individuals in East Rockingham, private company employees (913 | 76.4%), state government employees (110 | 9.2%), and local government employees (77 | 6.4%) make up the most common classes of employment.
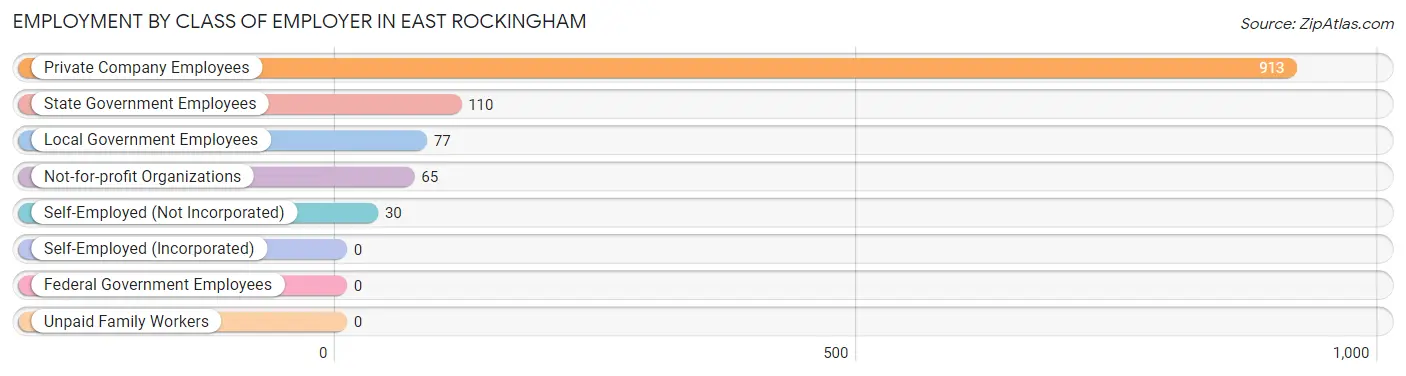
| Employer Class | # Employees | % Employees |
| Private Company Employees | 913 | 76.4% |
| Self-Employed (Incorporated) | 0 | 0.0% |
| Self-Employed (Not Incorporated) | 30 | 2.5% |
| Not-for-profit Organizations | 65 | 5.4% |
| Local Government Employees | 77 | 6.4% |
| State Government Employees | 110 | 9.2% |
| Federal Government Employees | 0 | 0.0% |
| Unpaid Family Workers | 0 | 0.0% |
| Total | 1,195 | 100.0% |
Employment Status by Age in East Rockingham
According to the labor force statistics for East Rockingham, out of the total population over 16 years of age (2,388), 57.2% or 1,366 individuals are in the labor force, with 12.5% or 171 of them unemployed. The age group with the highest labor force participation rate is 30 to 34 years, with 100.0% or 123 individuals in the labor force. Within the labor force, the 20 to 24 years age range has the highest percentage of unemployed individuals, with 38.6% or 44 of them being unemployed.
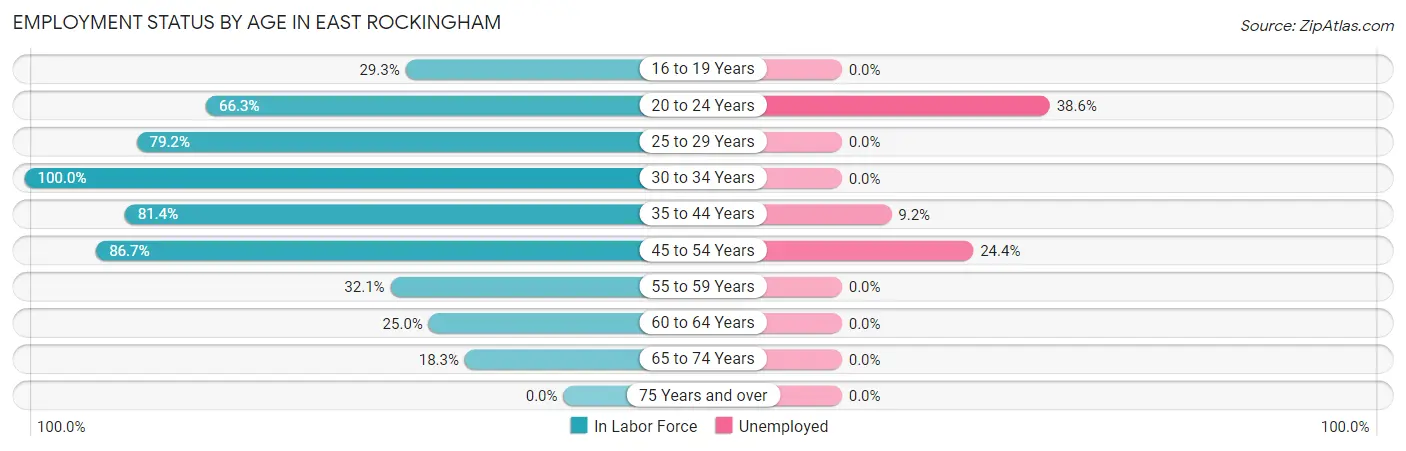
| Age Bracket | In Labor Force | Unemployed |
| 16 to 19 Years | 83 (29.3%) | 0 (0.0%) |
| 20 to 24 Years | 114 (66.3%) | 44 (38.6%) |
| 25 to 29 Years | 57 (79.2%) | 0 (0.0%) |
| 30 to 34 Years | 123 (100.0%) | 0 (0.0%) |
| 35 to 44 Years | 546 (81.4%) | 50 (9.2%) |
| 45 to 54 Years | 312 (86.7%) | 76 (24.4%) |
| 55 to 59 Years | 44 (32.1%) | 0 (0.0%) |
| 60 to 64 Years | 43 (25.0%) | 0 (0.0%) |
| 65 to 74 Years | 43 (18.3%) | 0 (0.0%) |
| 75 Years and over | 0 (0.0%) | 0 (0.0%) |
| Total | 1,366 (57.2%) | 171 (12.5%) |
Employment Status by Educational Attainment in East Rockingham
According to labor force statistics for East Rockingham, 73.3% of individuals (1,125) out of the total population between 25 and 64 years of age (1,535) are in the labor force, with 11.2% or 126 of them being unemployed. The group with the highest labor force participation rate are those with the educational attainment of college / associate degree, with 79.3% or 414 individuals in the labor force. Within the labor force, individuals with high school diploma education have the highest percentage of unemployment, with 25.7% or 118 of them being unemployed.
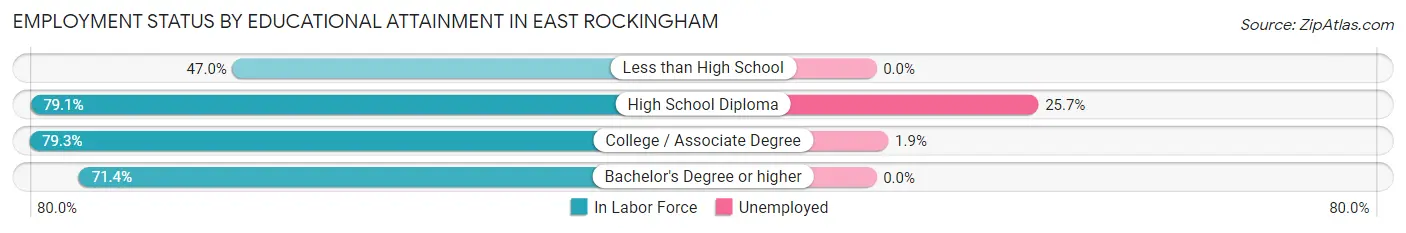
| Educational Attainment | In Labor Force | Unemployed |
| Less than High School | 110 (47.0%) | 0 (0.0%) |
| High School Diploma | 459 (79.1%) | 149 (25.7%) |
| College / Associate Degree | 414 (79.3%) | 10 (1.9%) |
| Bachelor's Degree or higher | 142 (71.4%) | 0 (0.0%) |
| Total | 1,125 (73.3%) | 172 (11.2%) |
Employment Occupations by Sex in East Rockingham
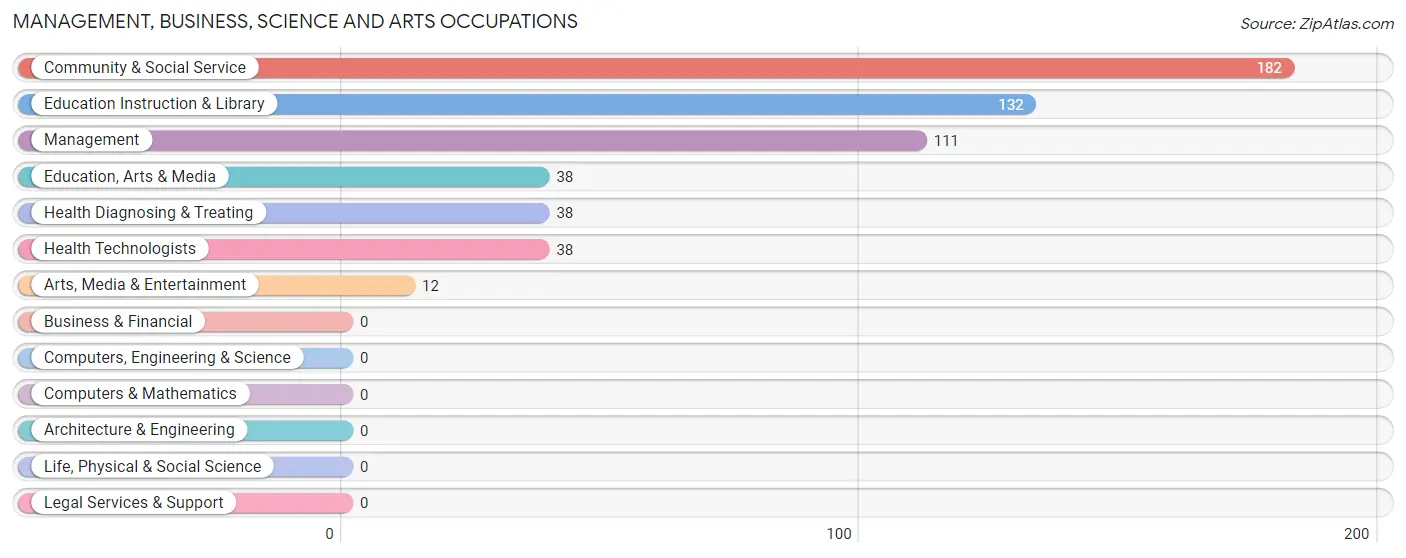
Management, Business, Science and Arts Occupations
The most common Management, Business, Science and Arts occupations in East Rockingham are Community & Social Service (182 | 15.2%), Education Instruction & Library (132 | 11.1%), Management (111 | 9.3%), Education, Arts & Media (38 | 3.2%), and Health Diagnosing & Treating (38 | 3.2%).
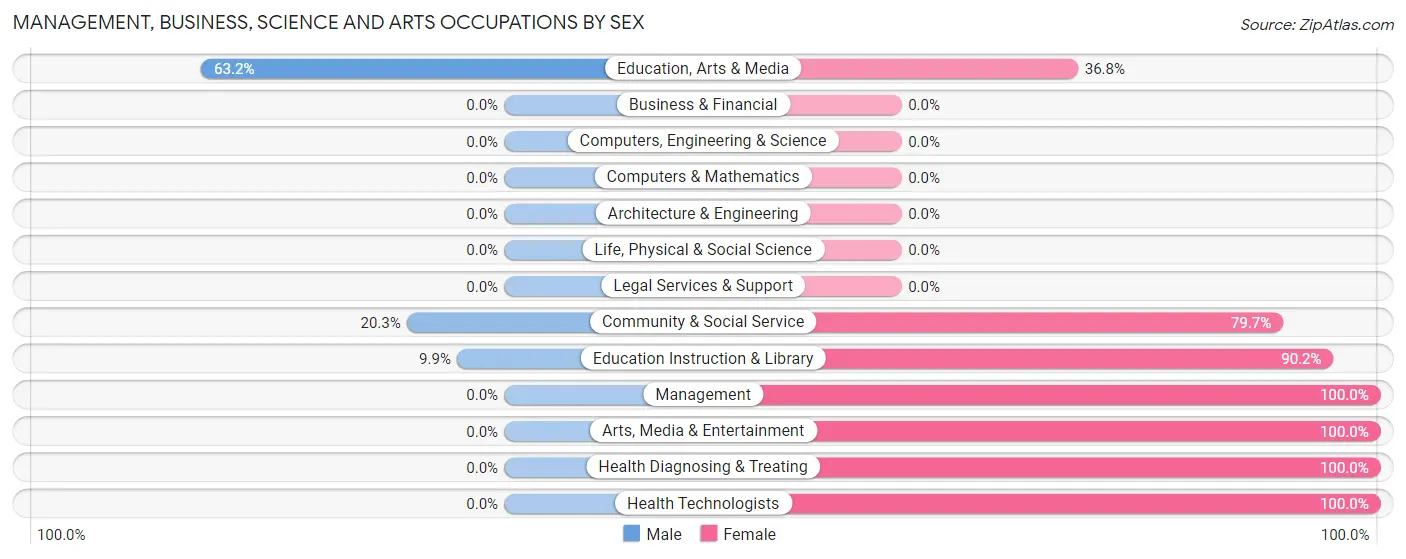
Management, Business, Science and Arts Occupations by Sex
Within the Management, Business, Science and Arts occupations in East Rockingham, the most male-oriented occupations are Education, Arts & Media (63.2%), Community & Social Service (20.3%), and Education Instruction & Library (9.9%), while the most female-oriented occupations are Management (100.0%), Arts, Media & Entertainment (100.0%), and Health Diagnosing & Treating (100.0%).
| Occupation | Male | Female |
| Management | 0 (0.0%) | 111 (100.0%) |
| Business & Financial | 0 (0.0%) | 0 (0.0%) |
| Computers, Engineering & Science | 0 (0.0%) | 0 (0.0%) |
| Computers & Mathematics | 0 (0.0%) | 0 (0.0%) |
| Architecture & Engineering | 0 (0.0%) | 0 (0.0%) |
| Life, Physical & Social Science | 0 (0.0%) | 0 (0.0%) |
| Community & Social Service | 37 (20.3%) | 145 (79.7%) |
| Education, Arts & Media | 24 (63.2%) | 14 (36.8%) |
| Legal Services & Support | 0 (0.0%) | 0 (0.0%) |
| Education Instruction & Library | 13 (9.9%) | 119 (90.1%) |
| Arts, Media & Entertainment | 0 (0.0%) | 12 (100.0%) |
| Health Diagnosing & Treating | 0 (0.0%) | 38 (100.0%) |
| Health Technologists | 0 (0.0%) | 38 (100.0%) |
| Total (Category) | 37 (11.2%) | 294 (88.8%) |
| Total (Overall) | 661 (55.3%) | 534 (44.7%) |
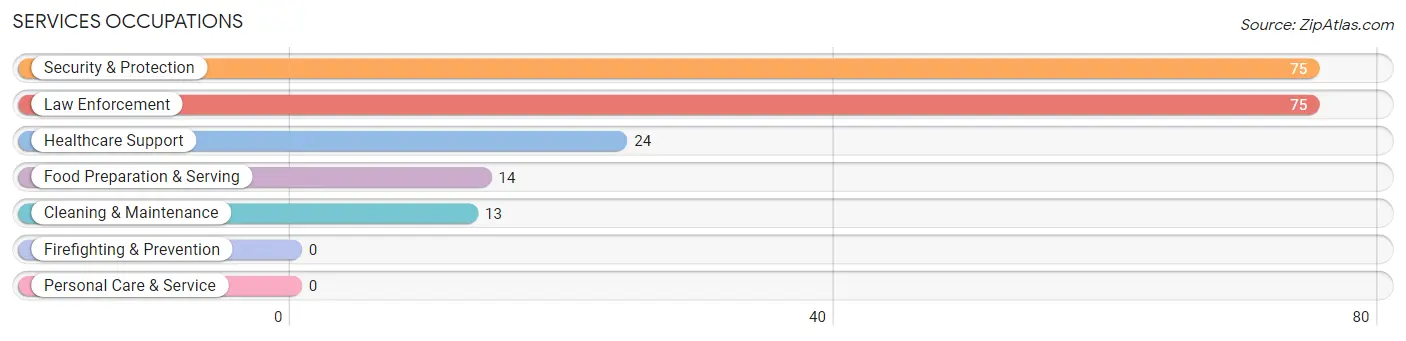
Services Occupations
The most common Services occupations in East Rockingham are Security & Protection (75 | 6.3%), Law Enforcement (75 | 6.3%), Healthcare Support (24 | 2.0%), Food Preparation & Serving (14 | 1.2%), and Cleaning & Maintenance (13 | 1.1%).
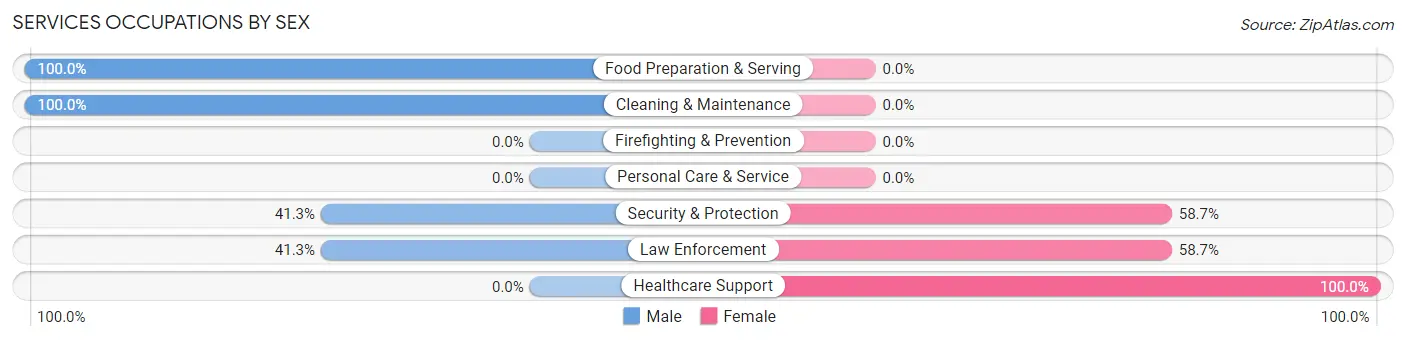
Services Occupations by Sex
Within the Services occupations in East Rockingham, the most male-oriented occupations are Food Preparation & Serving (100.0%), Cleaning & Maintenance (100.0%), and Security & Protection (41.3%), while the most female-oriented occupations are Healthcare Support (100.0%), Security & Protection (58.7%), and Law Enforcement (58.7%).
| Occupation | Male | Female |
| Healthcare Support | 0 (0.0%) | 24 (100.0%) |
| Security & Protection | 31 (41.3%) | 44 (58.7%) |
| Firefighting & Prevention | 0 (0.0%) | 0 (0.0%) |
| Law Enforcement | 31 (41.3%) | 44 (58.7%) |
| Food Preparation & Serving | 14 (100.0%) | 0 (0.0%) |
| Cleaning & Maintenance | 13 (100.0%) | 0 (0.0%) |
| Personal Care & Service | 0 (0.0%) | 0 (0.0%) |
| Total (Category) | 58 (46.0%) | 68 (54.0%) |
| Total (Overall) | 661 (55.3%) | 534 (44.7%) |
Sales and Office Occupations
The most common Sales and Office occupations in East Rockingham are Sales & Related (49 | 4.1%), and Office & Administration (40 | 3.4%).
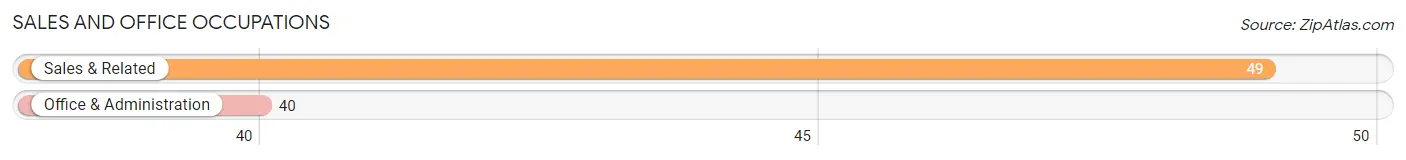
Sales and Office Occupations by Sex
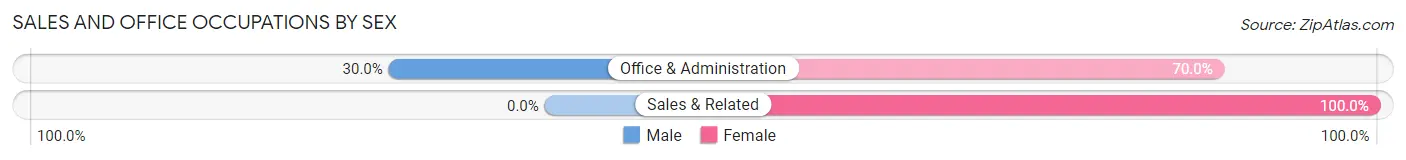
| Occupation | Male | Female |
| Sales & Related | 0 (0.0%) | 49 (100.0%) |
| Office & Administration | 12 (30.0%) | 28 (70.0%) |
| Total (Category) | 12 (13.5%) | 77 (86.5%) |
| Total (Overall) | 661 (55.3%) | 534 (44.7%) |
Natural Resources, Construction and Maintenance Occupations
The most common Natural Resources, Construction and Maintenance occupations in East Rockingham are Construction & Extraction (151 | 12.6%), and Installation, Maintenance & Repair (93 | 7.8%).
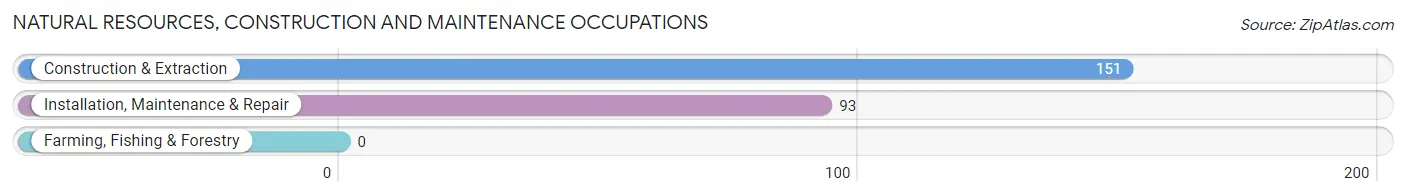
Natural Resources, Construction and Maintenance Occupations by Sex
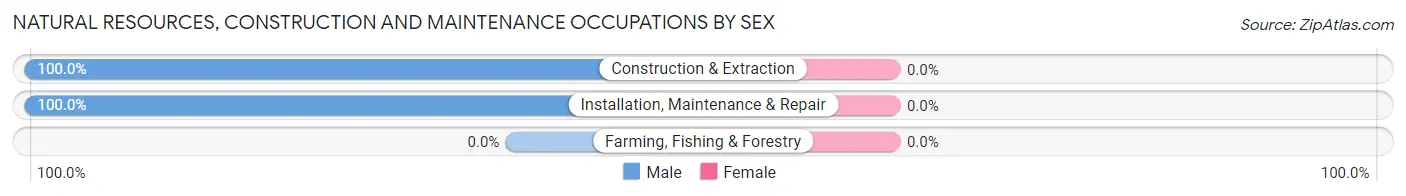
| Occupation | Male | Female |
| Farming, Fishing & Forestry | 0 (0.0%) | 0 (0.0%) |
| Construction & Extraction | 151 (100.0%) | 0 (0.0%) |
| Installation, Maintenance & Repair | 93 (100.0%) | 0 (0.0%) |
| Total (Category) | 244 (100.0%) | 0 (0.0%) |
| Total (Overall) | 661 (55.3%) | 534 (44.7%) |
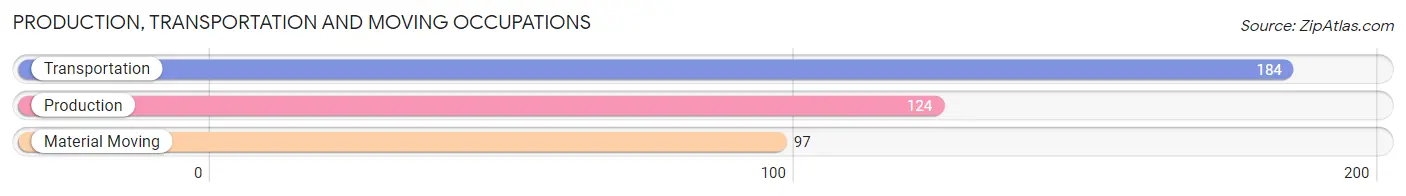
Production, Transportation and Moving Occupations
The most common Production, Transportation and Moving occupations in East Rockingham are Transportation (184 | 15.4%), Production (124 | 10.4%), and Material Moving (97 | 8.1%).
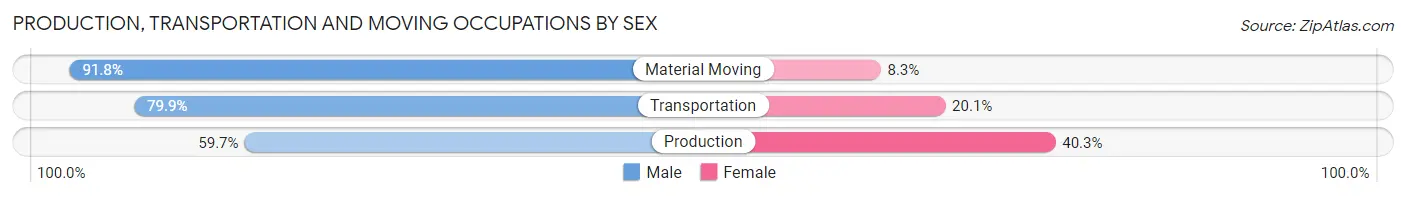
Production, Transportation and Moving Occupations by Sex
| Occupation | Male | Female |
| Production | 74 (59.7%) | 50 (40.3%) |
| Transportation | 147 (79.9%) | 37 (20.1%) |
| Material Moving | 89 (91.7%) | 8 (8.3%) |
| Total (Category) | 310 (76.5%) | 95 (23.5%) |
| Total (Overall) | 661 (55.3%) | 534 (44.7%) |
Employment Industries by Sex in East Rockingham
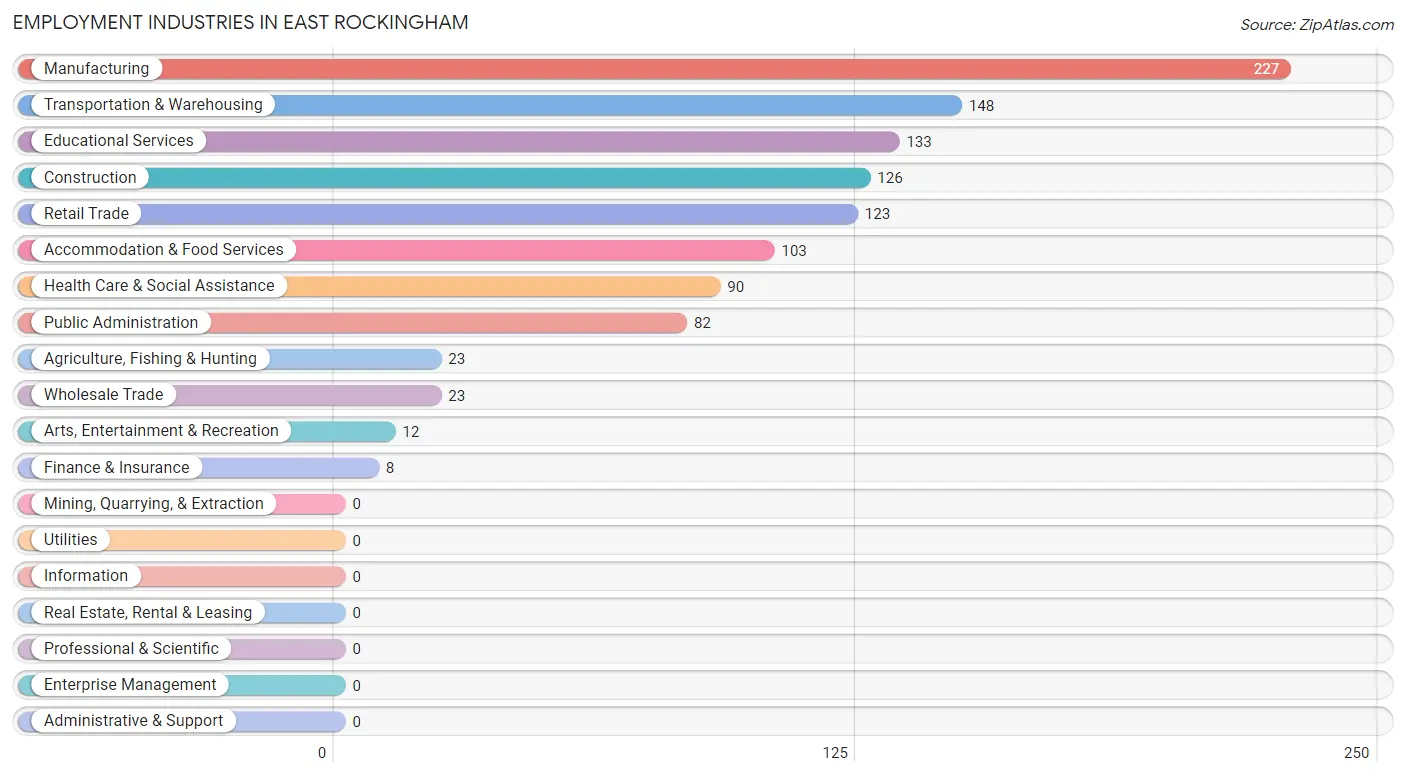
Employment Industries in East Rockingham
The major employment industries in East Rockingham include Manufacturing (227 | 19.0%), Transportation & Warehousing (148 | 12.4%), Educational Services (133 | 11.1%), Construction (126 | 10.5%), and Retail Trade (123 | 10.3%).
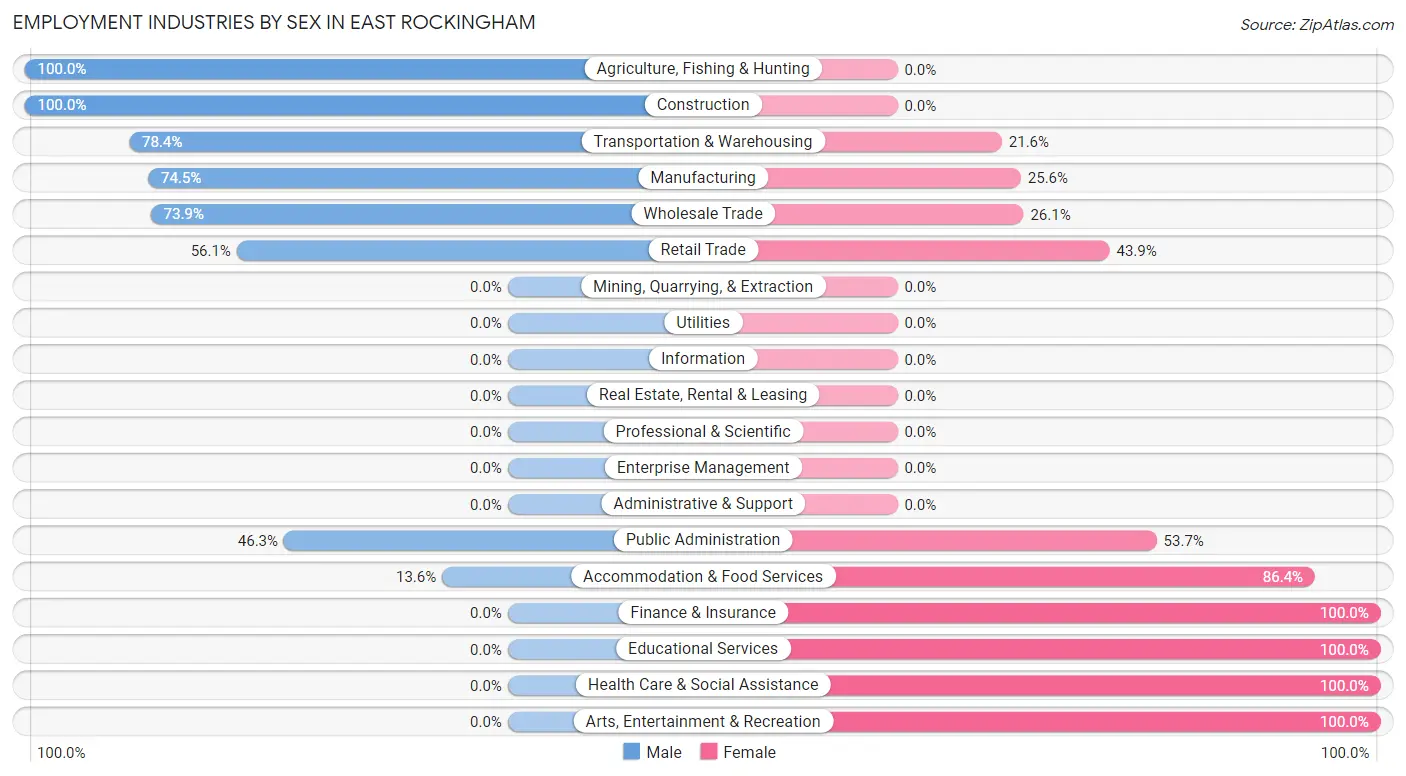
Employment Industries by Sex in East Rockingham
The East Rockingham industries that see more men than women are Agriculture, Fishing & Hunting (100.0%), Construction (100.0%), and Transportation & Warehousing (78.4%), whereas the industries that tend to have a higher number of women are Finance & Insurance (100.0%), Educational Services (100.0%), and Health Care & Social Assistance (100.0%).
| Industry | Male | Female |
| Agriculture, Fishing & Hunting | 23 (100.0%) | 0 (0.0%) |
| Mining, Quarrying, & Extraction | 0 (0.0%) | 0 (0.0%) |
| Construction | 126 (100.0%) | 0 (0.0%) |
| Manufacturing | 169 (74.5%) | 58 (25.6%) |
| Wholesale Trade | 17 (73.9%) | 6 (26.1%) |
| Retail Trade | 69 (56.1%) | 54 (43.9%) |
| Transportation & Warehousing | 116 (78.4%) | 32 (21.6%) |
| Utilities | 0 (0.0%) | 0 (0.0%) |
| Information | 0 (0.0%) | 0 (0.0%) |
| Finance & Insurance | 0 (0.0%) | 8 (100.0%) |
| Real Estate, Rental & Leasing | 0 (0.0%) | 0 (0.0%) |
| Professional & Scientific | 0 (0.0%) | 0 (0.0%) |
| Enterprise Management | 0 (0.0%) | 0 (0.0%) |
| Administrative & Support | 0 (0.0%) | 0 (0.0%) |
| Educational Services | 0 (0.0%) | 133 (100.0%) |
| Health Care & Social Assistance | 0 (0.0%) | 90 (100.0%) |
| Arts, Entertainment & Recreation | 0 (0.0%) | 12 (100.0%) |
| Accommodation & Food Services | 14 (13.6%) | 89 (86.4%) |
| Public Administration | 38 (46.3%) | 44 (53.7%) |
| Total | 661 (55.3%) | 534 (44.7%) |
Education in East Rockingham
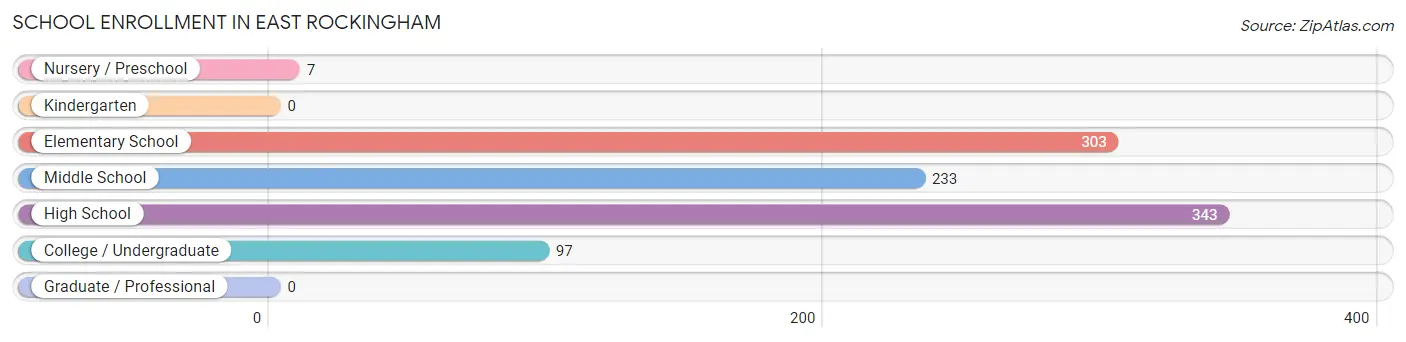
School Enrollment in East Rockingham
The most common levels of schooling among the 983 students in East Rockingham are high school (343 | 34.9%), elementary school (303 | 30.8%), and middle school (233 | 23.7%).
| School Level | # Students | % Students |
| Nursery / Preschool | 7 | 0.7% |
| Kindergarten | 0 | 0.0% |
| Elementary School | 303 | 30.8% |
| Middle School | 233 | 23.7% |
| High School | 343 | 34.9% |
| College / Undergraduate | 97 | 9.9% |
| Graduate / Professional | 0 | 0.0% |
| Total | 983 | 100.0% |
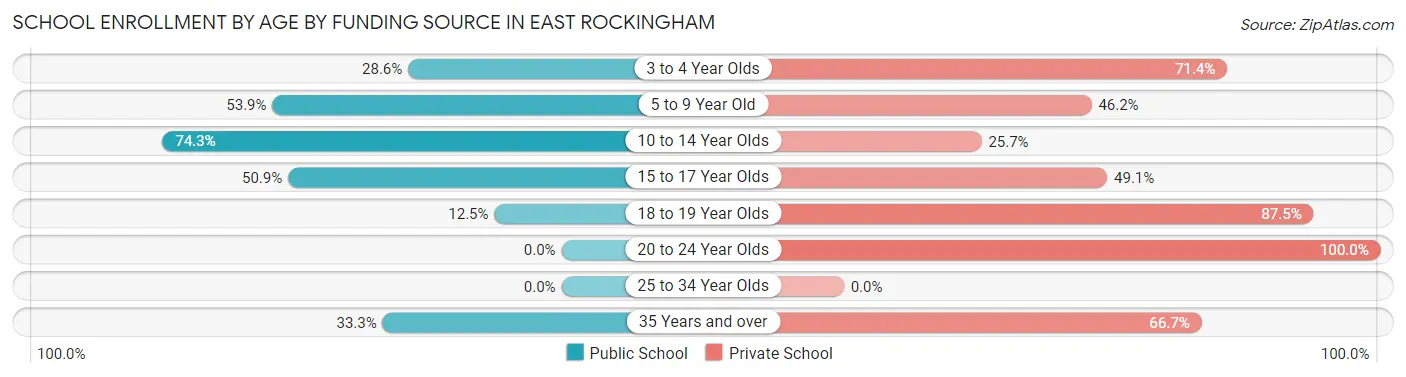
School Enrollment by Age by Funding Source in East Rockingham
Out of a total of 983 students who are enrolled in schools in East Rockingham, 394 (40.1%) attend a private institution, while the remaining 589 (59.9%) are enrolled in public schools. The age group of 20 to 24 year olds has the highest likelihood of being enrolled in private schools, with 47 (100.0% in the age bracket) enrolled. Conversely, the age group of 10 to 14 year olds has the lowest likelihood of being enrolled in a private school, with 394 (74.3% in the age bracket) attending a public institution.
| Age Bracket | Public School | Private School |
| 3 to 4 Year Olds | 2 (28.6%) | 5 (71.4%) |
| 5 to 9 Year Old | 42 (53.8%) | 36 (46.2%) |
| 10 to 14 Year Olds | 394 (74.3%) | 136 (25.7%) |
| 15 to 17 Year Olds | 137 (50.9%) | 132 (49.1%) |
| 18 to 19 Year Olds | 2 (12.5%) | 14 (87.5%) |
| 20 to 24 Year Olds | 0 (0.0%) | 47 (100.0%) |
| 25 to 34 Year Olds | 0 (0.0%) | 0 (0.0%) |
| 35 Years and over | 12 (33.3%) | 24 (66.7%) |
| Total | 589 (59.9%) | 394 (40.1%) |
Educational Attainment by Field of Study in East Rockingham
Business (86 | 37.7%), science & technology (66 | 28.9%), education (35 | 15.3%), psychology (14 | 6.1%), and literature & languages (14 | 6.1%) are the most common fields of study among 228 individuals in East Rockingham who have obtained a bachelor's degree or higher.
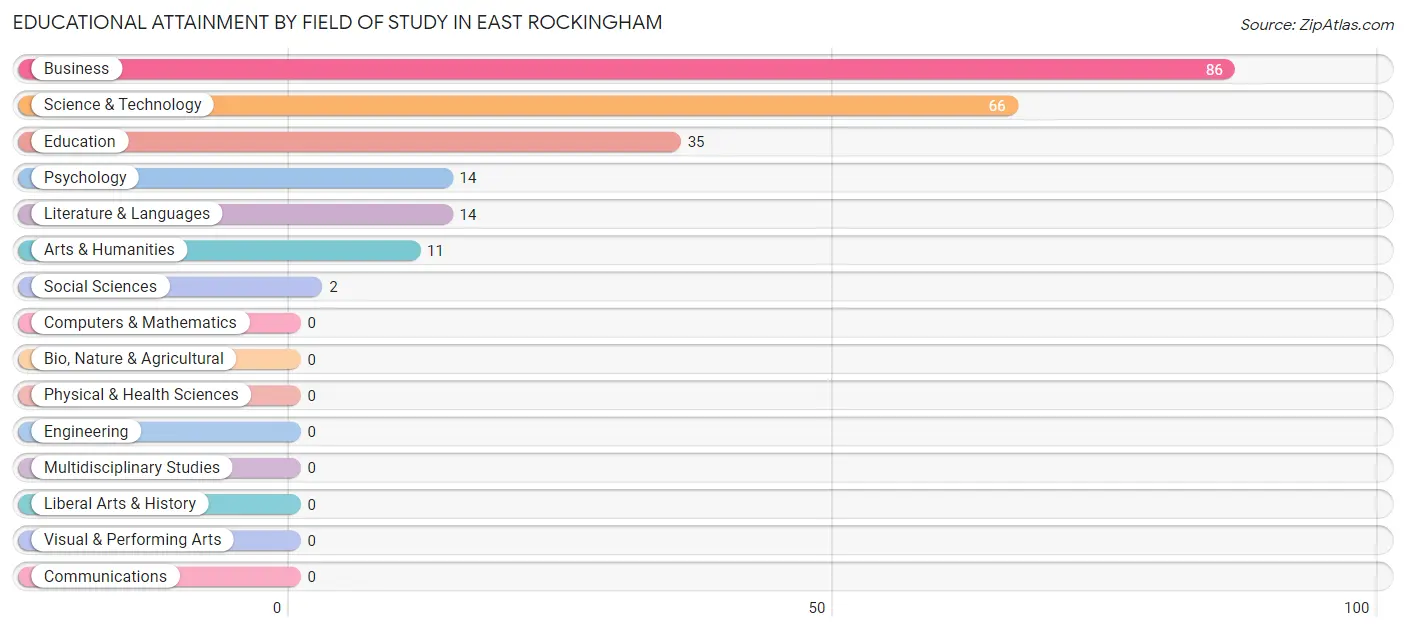
| Field of Study | # Graduates | % Graduates |
| Computers & Mathematics | 0 | 0.0% |
| Bio, Nature & Agricultural | 0 | 0.0% |
| Physical & Health Sciences | 0 | 0.0% |
| Psychology | 14 | 6.1% |
| Social Sciences | 2 | 0.9% |
| Engineering | 0 | 0.0% |
| Multidisciplinary Studies | 0 | 0.0% |
| Science & Technology | 66 | 28.9% |
| Business | 86 | 37.7% |
| Education | 35 | 15.3% |
| Literature & Languages | 14 | 6.1% |
| Liberal Arts & History | 0 | 0.0% |
| Visual & Performing Arts | 0 | 0.0% |
| Communications | 0 | 0.0% |
| Arts & Humanities | 11 | 4.8% |
| Total | 228 | 100.0% |
Transportation & Commute in East Rockingham
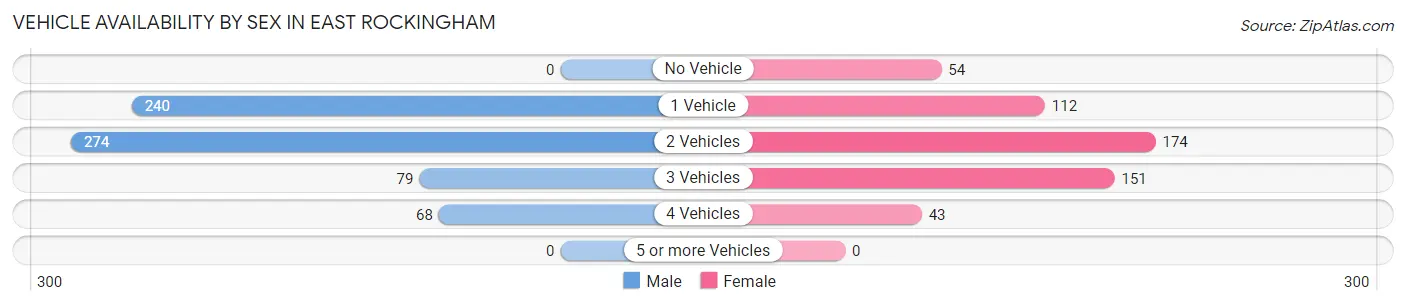
Vehicle Availability by Sex in East Rockingham
The most prevalent vehicle ownership categories in East Rockingham are males with 2 vehicles (274, accounting for 41.4%) and females with 2 vehicles (174, making up 51.3%).
| Vehicles Available | Male | Female |
| No Vehicle | 0 (0.0%) | 54 (10.1%) |
| 1 Vehicle | 240 (36.3%) | 112 (21.0%) |
| 2 Vehicles | 274 (41.4%) | 174 (32.6%) |
| 3 Vehicles | 79 (11.9%) | 151 (28.3%) |
| 4 Vehicles | 68 (10.3%) | 43 (8.1%) |
| 5 or more Vehicles | 0 (0.0%) | 0 (0.0%) |
| Total | 661 (100.0%) | 534 (100.0%) |
Commute Time in East Rockingham
The most frequently occuring commute durations in East Rockingham are 15 to 19 minutes (226 commuters, 19.6%), 90 or more minutes (192 commuters, 16.7%), and 20 to 24 minutes (156 commuters, 13.6%).
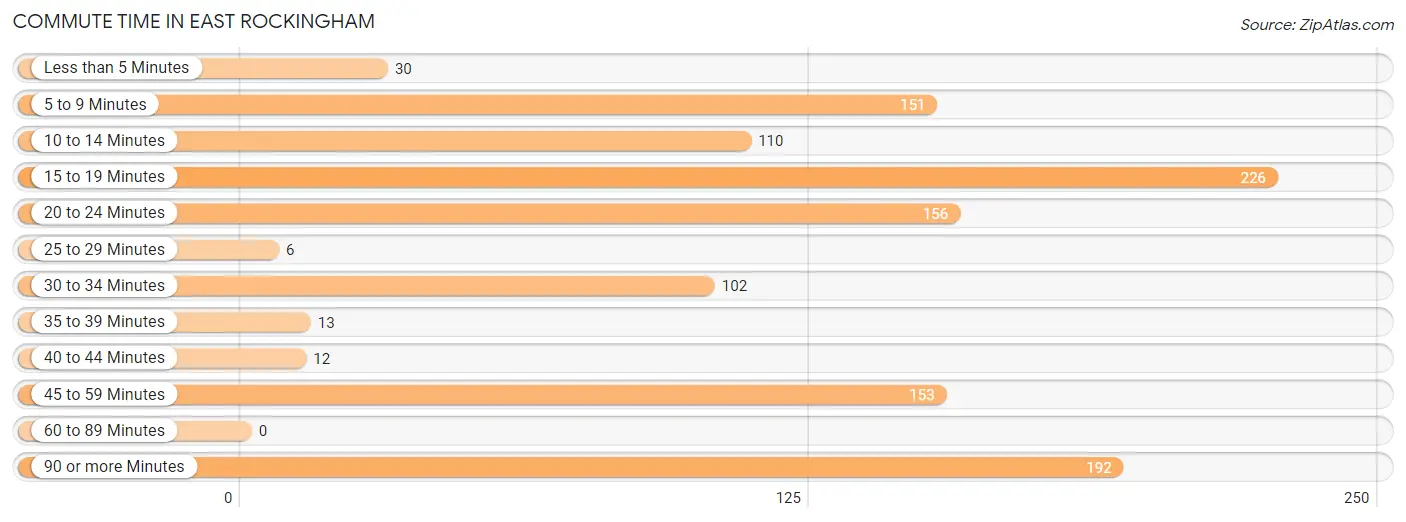
| Commute Time | # Commuters | % Commuters |
| Less than 5 Minutes | 30 | 2.6% |
| 5 to 9 Minutes | 151 | 13.1% |
| 10 to 14 Minutes | 110 | 9.6% |
| 15 to 19 Minutes | 226 | 19.6% |
| 20 to 24 Minutes | 156 | 13.6% |
| 25 to 29 Minutes | 6 | 0.5% |
| 30 to 34 Minutes | 102 | 8.9% |
| 35 to 39 Minutes | 13 | 1.1% |
| 40 to 44 Minutes | 12 | 1.0% |
| 45 to 59 Minutes | 153 | 13.3% |
| 60 to 89 Minutes | 0 | 0.0% |
| 90 or more Minutes | 192 | 16.7% |
Commute Time by Sex in East Rockingham
The most common commute times in East Rockingham are 90 or more minutes (192 commuters, 31.1%) for males and 15 to 19 minutes (128 commuters, 24.0%) for females.
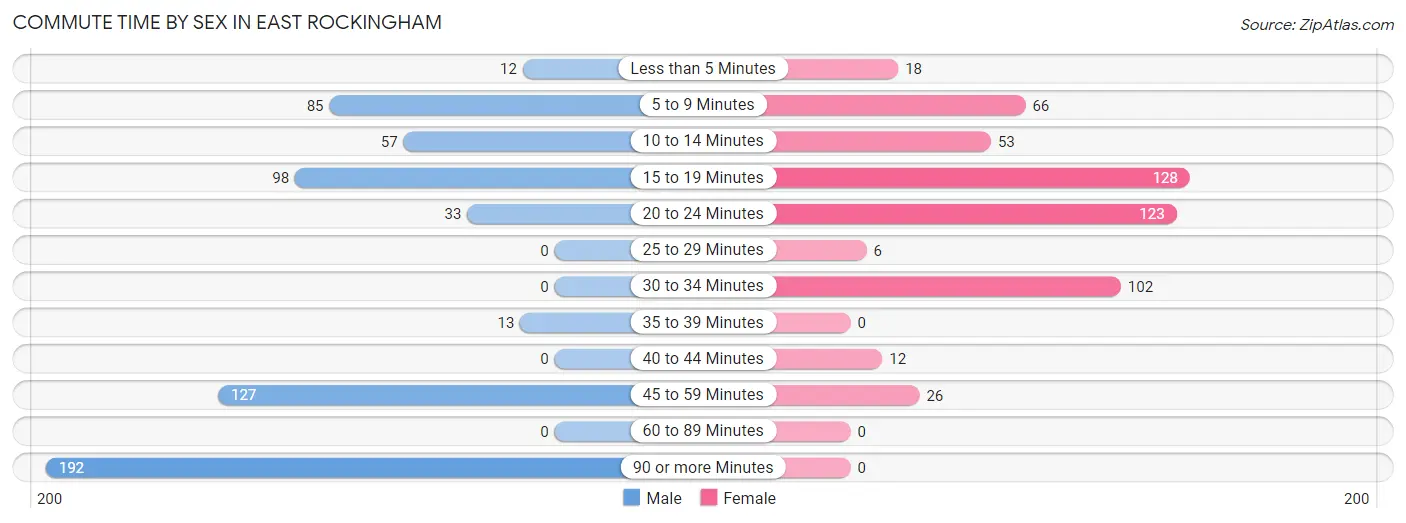
| Commute Time | Male | Female |
| Less than 5 Minutes | 12 (1.9%) | 18 (3.4%) |
| 5 to 9 Minutes | 85 (13.8%) | 66 (12.4%) |
| 10 to 14 Minutes | 57 (9.2%) | 53 (9.9%) |
| 15 to 19 Minutes | 98 (15.9%) | 128 (24.0%) |
| 20 to 24 Minutes | 33 (5.3%) | 123 (23.0%) |
| 25 to 29 Minutes | 0 (0.0%) | 6 (1.1%) |
| 30 to 34 Minutes | 0 (0.0%) | 102 (19.1%) |
| 35 to 39 Minutes | 13 (2.1%) | 0 (0.0%) |
| 40 to 44 Minutes | 0 (0.0%) | 12 (2.2%) |
| 45 to 59 Minutes | 127 (20.6%) | 26 (4.9%) |
| 60 to 89 Minutes | 0 (0.0%) | 0 (0.0%) |
| 90 or more Minutes | 192 (31.1%) | 0 (0.0%) |
Time of Departure to Work by Sex in East Rockingham
The most frequent times of departure to work in East Rockingham are 6:30 AM to 6:59 AM (233, 37.8%) for males and 7:00 AM to 7:29 AM (185, 34.6%) for females.
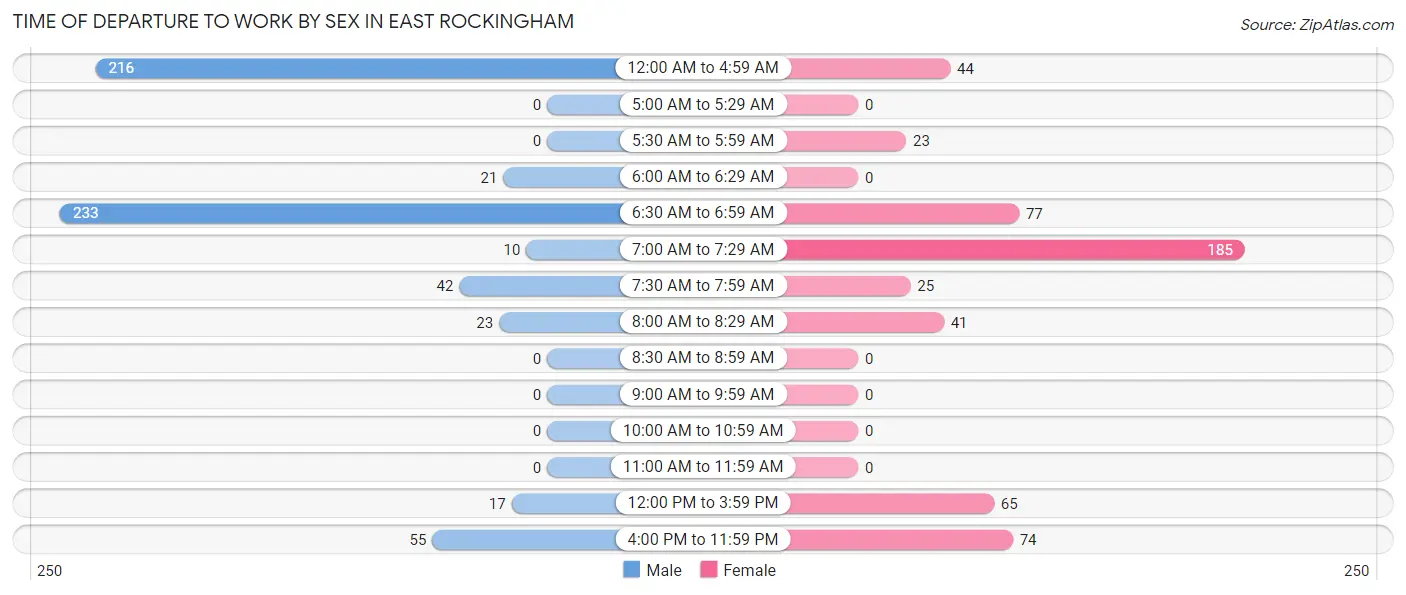
| Time of Departure | Male | Female |
| 12:00 AM to 4:59 AM | 216 (35.0%) | 44 (8.2%) |
| 5:00 AM to 5:29 AM | 0 (0.0%) | 0 (0.0%) |
| 5:30 AM to 5:59 AM | 0 (0.0%) | 23 (4.3%) |
| 6:00 AM to 6:29 AM | 21 (3.4%) | 0 (0.0%) |
| 6:30 AM to 6:59 AM | 233 (37.8%) | 77 (14.4%) |
| 7:00 AM to 7:29 AM | 10 (1.6%) | 185 (34.6%) |
| 7:30 AM to 7:59 AM | 42 (6.8%) | 25 (4.7%) |
| 8:00 AM to 8:29 AM | 23 (3.7%) | 41 (7.7%) |
| 8:30 AM to 8:59 AM | 0 (0.0%) | 0 (0.0%) |
| 9:00 AM to 9:59 AM | 0 (0.0%) | 0 (0.0%) |
| 10:00 AM to 10:59 AM | 0 (0.0%) | 0 (0.0%) |
| 11:00 AM to 11:59 AM | 0 (0.0%) | 0 (0.0%) |
| 12:00 PM to 3:59 PM | 17 (2.8%) | 65 (12.2%) |
| 4:00 PM to 11:59 PM | 55 (8.9%) | 74 (13.9%) |
| Total | 617 (100.0%) | 534 (100.0%) |
Housing Occupancy in East Rockingham
Occupancy by Ownership in East Rockingham
Of the total 1,306 dwellings in East Rockingham, owner-occupied units account for 850 (65.1%), while renter-occupied units make up 456 (34.9%).
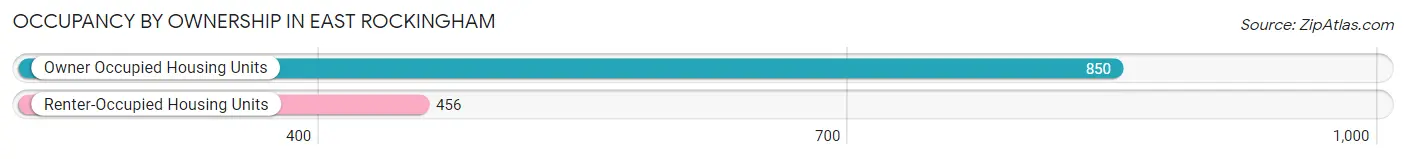
| Occupancy | # Housing Units | % Housing Units |
| Owner Occupied Housing Units | 850 | 65.1% |
| Renter-Occupied Housing Units | 456 | 34.9% |
| Total Occupied Housing Units | 1,306 | 100.0% |
Occupancy by Household Size in East Rockingham
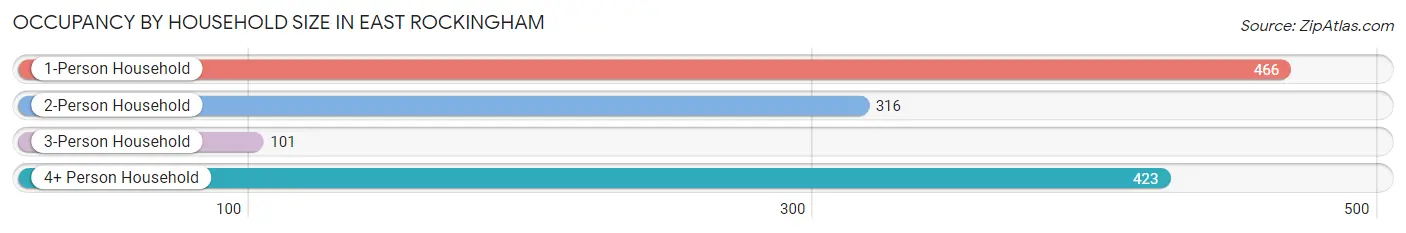
| Household Size | # Housing Units | % Housing Units |
| 1-Person Household | 466 | 35.7% |
| 2-Person Household | 316 | 24.2% |
| 3-Person Household | 101 | 7.7% |
| 4+ Person Household | 423 | 32.4% |
| Total Housing Units | 1,306 | 100.0% |
Occupancy by Ownership by Household Size in East Rockingham
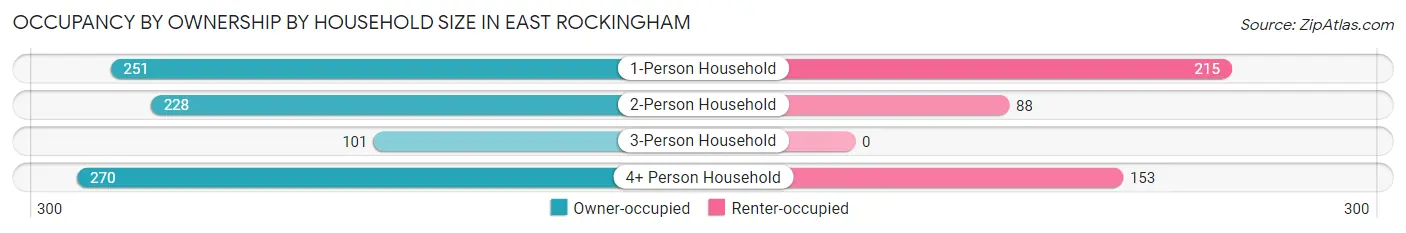
| Household Size | Owner-occupied | Renter-occupied |
| 1-Person Household | 251 (53.9%) | 215 (46.1%) |
| 2-Person Household | 228 (72.2%) | 88 (27.9%) |
| 3-Person Household | 101 (100.0%) | 0 (0.0%) |
| 4+ Person Household | 270 (63.8%) | 153 (36.2%) |
| Total Housing Units | 850 (65.1%) | 456 (34.9%) |
Occupancy by Educational Attainment in East Rockingham
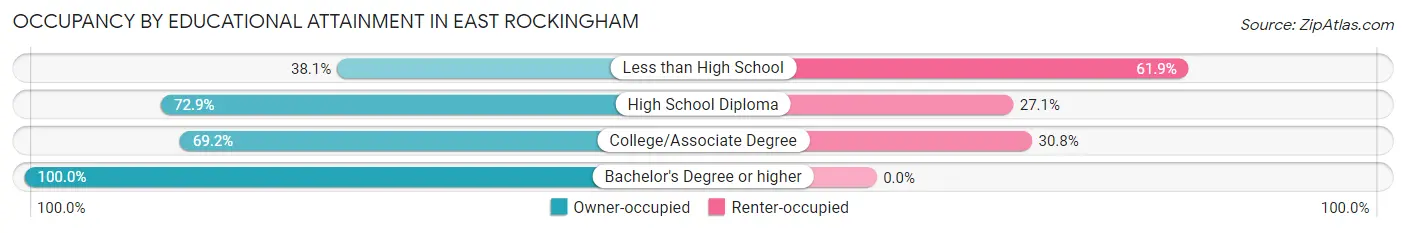
| Household Size | Owner-occupied | Renter-occupied |
| Less than High School | 118 (38.1%) | 192 (61.9%) |
| High School Diploma | 350 (72.9%) | 130 (27.1%) |
| College/Associate Degree | 301 (69.2%) | 134 (30.8%) |
| Bachelor's Degree or higher | 81 (100.0%) | 0 (0.0%) |
Occupancy by Age of Householder in East Rockingham
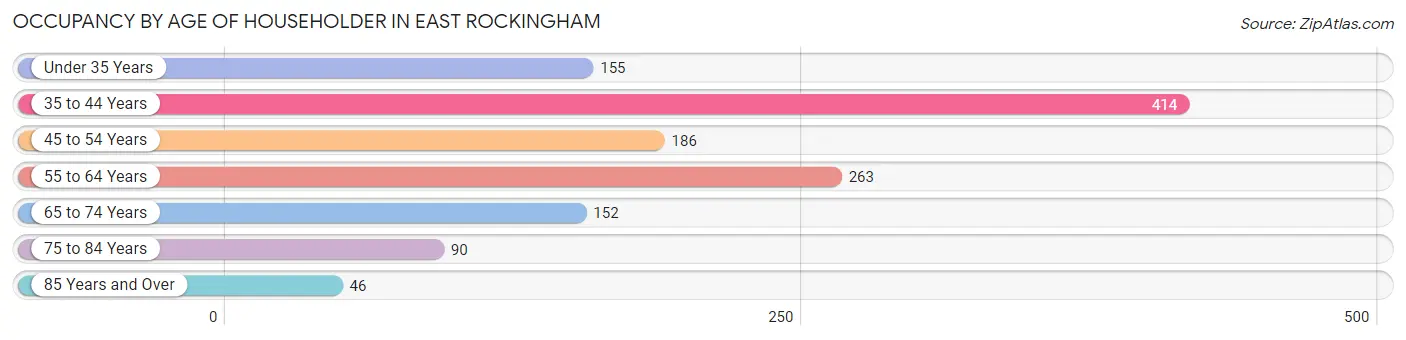
| Age Bracket | # Households | % Households |
| Under 35 Years | 155 | 11.9% |
| 35 to 44 Years | 414 | 31.7% |
| 45 to 54 Years | 186 | 14.2% |
| 55 to 64 Years | 263 | 20.1% |
| 65 to 74 Years | 152 | 11.6% |
| 75 to 84 Years | 90 | 6.9% |
| 85 Years and Over | 46 | 3.5% |
| Total | 1,306 | 100.0% |
Housing Finances in East Rockingham
Median Income by Occupancy in East Rockingham
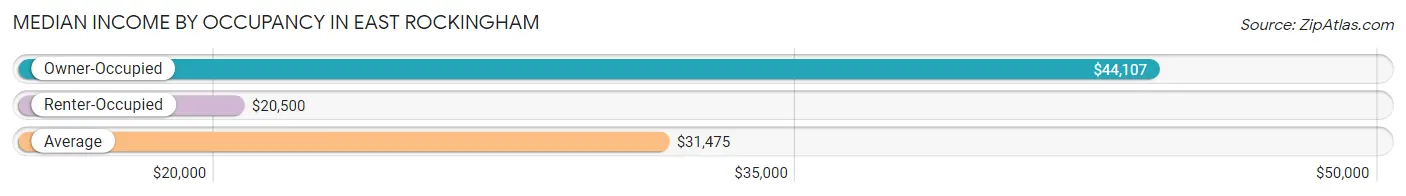
| Occupancy Type | # Households | Median Income |
| Owner-Occupied | 850 (65.1%) | $44,107 |
| Renter-Occupied | 456 (34.9%) | $20,500 |
| Average | 1,306 (100.0%) | $31,475 |
Occupancy by Householder Income Bracket in East Rockingham
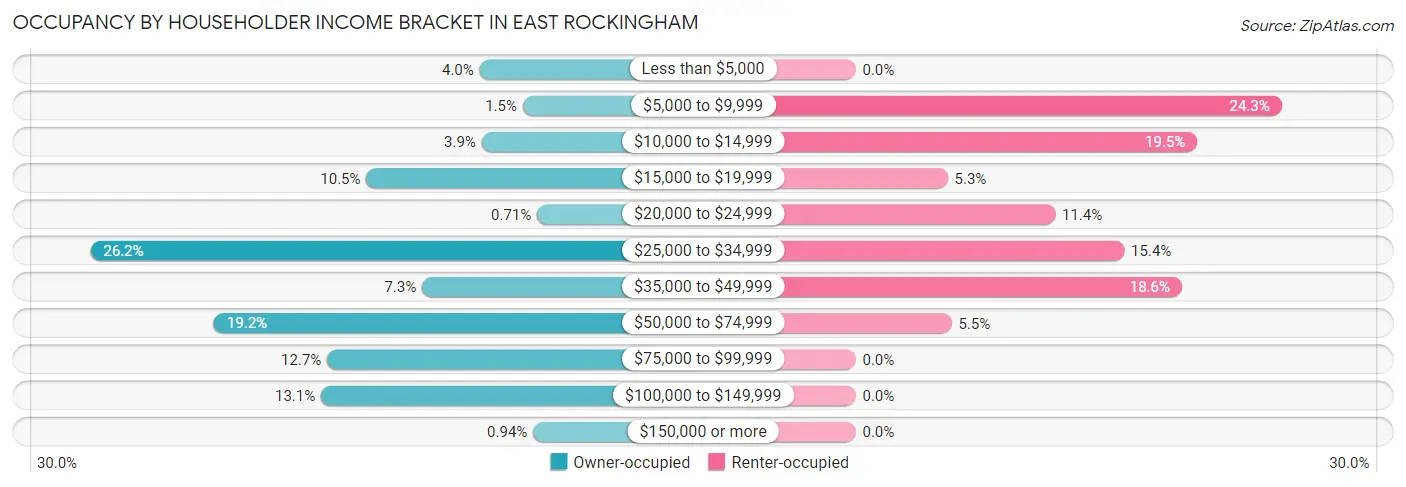
| Income Bracket | Owner-occupied | Renter-occupied |
| Less than $5,000 | 34 (4.0%) | 0 (0.0%) |
| $5,000 to $9,999 | 13 (1.5%) | 111 (24.3%) |
| $10,000 to $14,999 | 33 (3.9%) | 89 (19.5%) |
| $15,000 to $19,999 | 89 (10.5%) | 24 (5.3%) |
| $20,000 to $24,999 | 6 (0.7%) | 52 (11.4%) |
| $25,000 to $34,999 | 223 (26.2%) | 70 (15.3%) |
| $35,000 to $49,999 | 62 (7.3%) | 85 (18.6%) |
| $50,000 to $74,999 | 163 (19.2%) | 25 (5.5%) |
| $75,000 to $99,999 | 108 (12.7%) | 0 (0.0%) |
| $100,000 to $149,999 | 111 (13.1%) | 0 (0.0%) |
| $150,000 or more | 8 (0.9%) | 0 (0.0%) |
| Total | 850 (100.0%) | 456 (100.0%) |
Monthly Housing Cost Tiers in East Rockingham
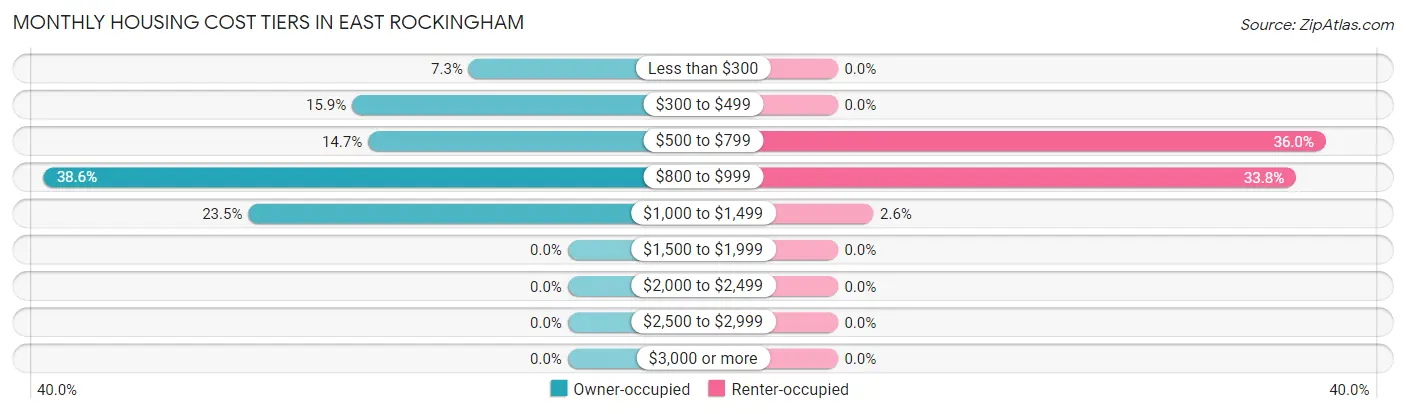
| Monthly Cost | Owner-occupied | Renter-occupied |
| Less than $300 | 62 (7.3%) | 0 (0.0%) |
| $300 to $499 | 135 (15.9%) | 0 (0.0%) |
| $500 to $799 | 125 (14.7%) | 164 (36.0%) |
| $800 to $999 | 328 (38.6%) | 154 (33.8%) |
| $1,000 to $1,499 | 200 (23.5%) | 12 (2.6%) |
| $1,500 to $1,999 | 0 (0.0%) | 0 (0.0%) |
| $2,000 to $2,499 | 0 (0.0%) | 0 (0.0%) |
| $2,500 to $2,999 | 0 (0.0%) | 0 (0.0%) |
| $3,000 or more | 0 (0.0%) | 0 (0.0%) |
| Total | 850 (100.0%) | 456 (100.0%) |
Physical Housing Characteristics in East Rockingham
Housing Structures in East Rockingham
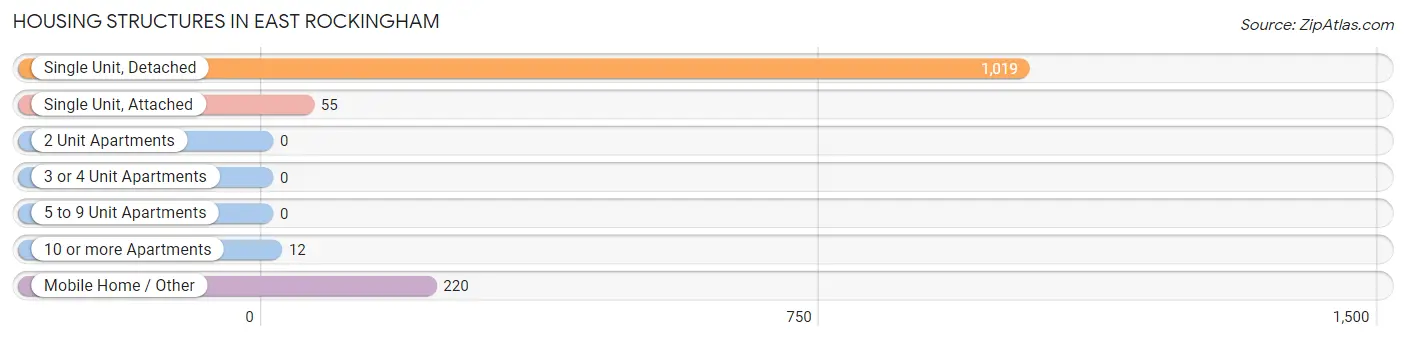
| Structure Type | # Housing Units | % Housing Units |
| Single Unit, Detached | 1,019 | 78.0% |
| Single Unit, Attached | 55 | 4.2% |
| 2 Unit Apartments | 0 | 0.0% |
| 3 or 4 Unit Apartments | 0 | 0.0% |
| 5 to 9 Unit Apartments | 0 | 0.0% |
| 10 or more Apartments | 12 | 0.9% |
| Mobile Home / Other | 220 | 16.9% |
| Total | 1,306 | 100.0% |
Housing Structures by Occupancy in East Rockingham
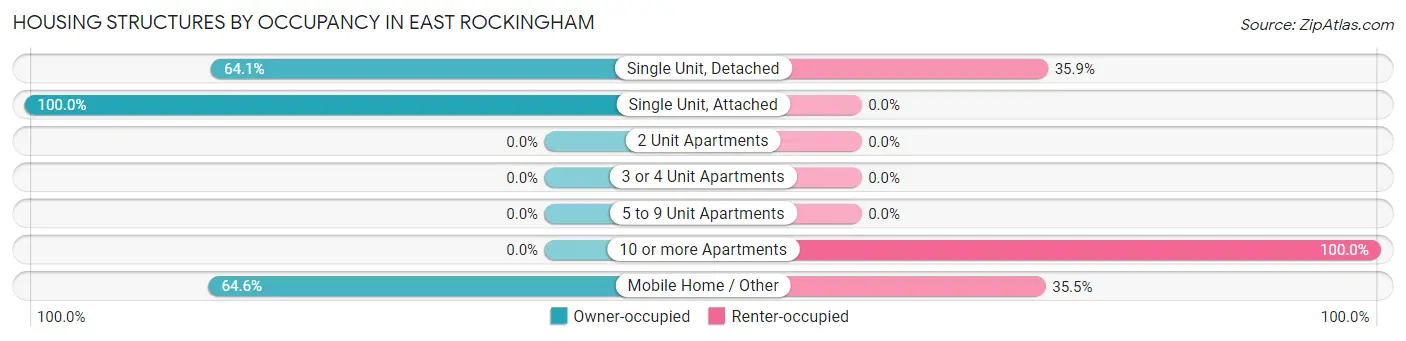
| Structure Type | Owner-occupied | Renter-occupied |
| Single Unit, Detached | 653 (64.1%) | 366 (35.9%) |
| Single Unit, Attached | 55 (100.0%) | 0 (0.0%) |
| 2 Unit Apartments | 0 (0.0%) | 0 (0.0%) |
| 3 or 4 Unit Apartments | 0 (0.0%) | 0 (0.0%) |
| 5 to 9 Unit Apartments | 0 (0.0%) | 0 (0.0%) |
| 10 or more Apartments | 0 (0.0%) | 12 (100.0%) |
| Mobile Home / Other | 142 (64.5%) | 78 (35.4%) |
| Total | 850 (65.1%) | 456 (34.9%) |
Housing Structures by Number of Rooms in East Rockingham
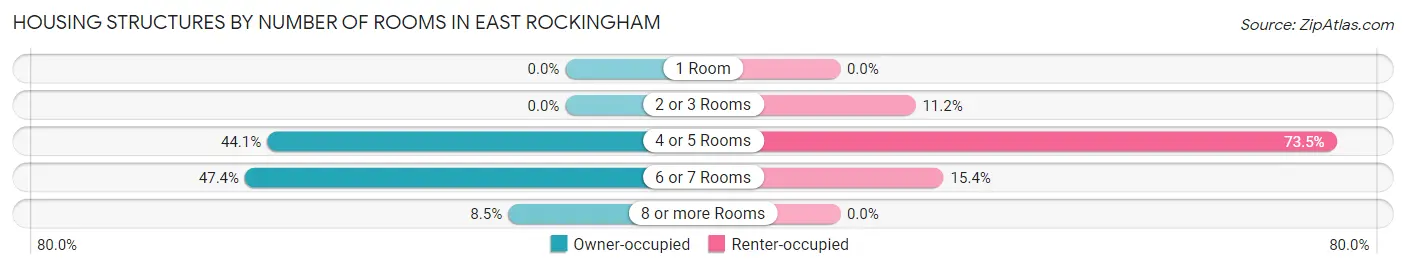
| Number of Rooms | Owner-occupied | Renter-occupied |
| 1 Room | 0 (0.0%) | 0 (0.0%) |
| 2 or 3 Rooms | 0 (0.0%) | 51 (11.2%) |
| 4 or 5 Rooms | 375 (44.1%) | 335 (73.5%) |
| 6 or 7 Rooms | 403 (47.4%) | 70 (15.3%) |
| 8 or more Rooms | 72 (8.5%) | 0 (0.0%) |
| Total | 850 (100.0%) | 456 (100.0%) |
Housing Structure by Heating Type in East Rockingham
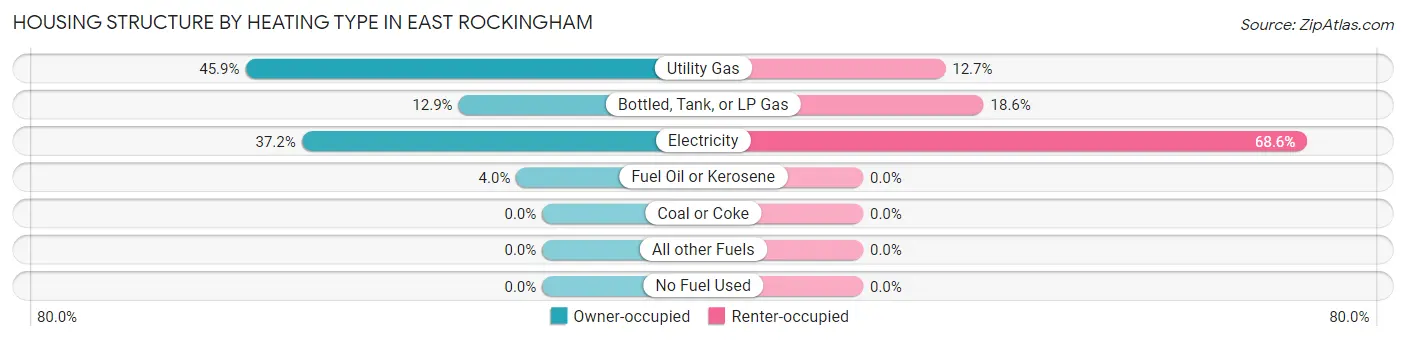
| Heating Type | Owner-occupied | Renter-occupied |
| Utility Gas | 390 (45.9%) | 58 (12.7%) |
| Bottled, Tank, or LP Gas | 110 (12.9%) | 85 (18.6%) |
| Electricity | 316 (37.2%) | 313 (68.6%) |
| Fuel Oil or Kerosene | 34 (4.0%) | 0 (0.0%) |
| Coal or Coke | 0 (0.0%) | 0 (0.0%) |
| All other Fuels | 0 (0.0%) | 0 (0.0%) |
| No Fuel Used | 0 (0.0%) | 0 (0.0%) |
| Total | 850 (100.0%) | 456 (100.0%) |
Household Vehicle Usage in East Rockingham
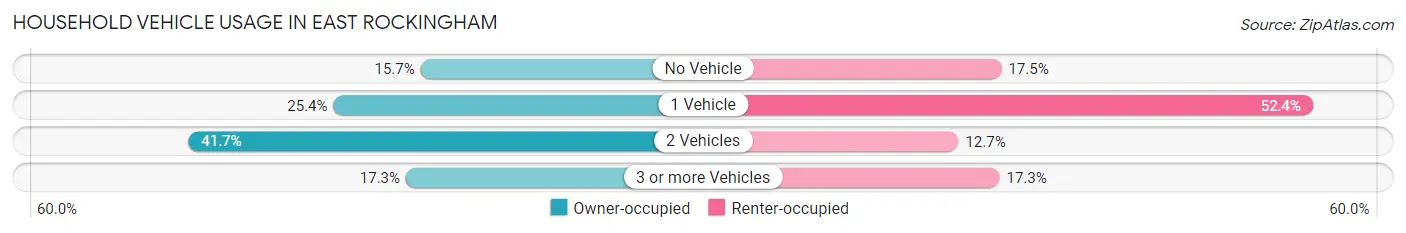
| Vehicles per Household | Owner-occupied | Renter-occupied |
| No Vehicle | 133 (15.7%) | 80 (17.5%) |
| 1 Vehicle | 216 (25.4%) | 239 (52.4%) |
| 2 Vehicles | 354 (41.6%) | 58 (12.7%) |
| 3 or more Vehicles | 147 (17.3%) | 79 (17.3%) |
| Total | 850 (100.0%) | 456 (100.0%) |
Real Estate & Mortgages in East Rockingham
Real Estate and Mortgage Overview in East Rockingham
| Characteristic | Without Mortgage | With Mortgage |
| Housing Units | 359 | 491 |
| Median Property Value | $52,700 | $99,000 |
| Median Household Income | $55,729 | $0 |
| Monthly Housing Costs | $387 | $0 |
| Real Estate Taxes | $510 | $6 |
Property Value by Mortgage Status in East Rockingham
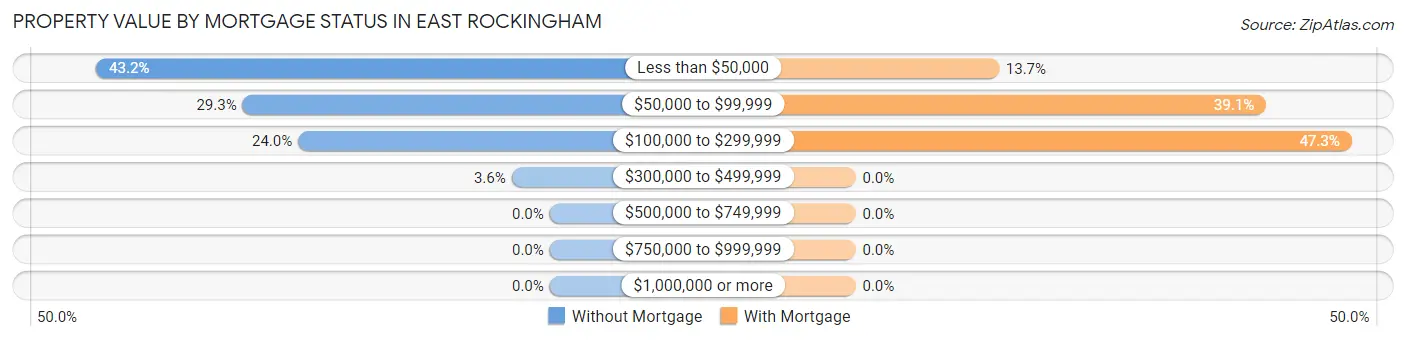
| Property Value | Without Mortgage | With Mortgage |
| Less than $50,000 | 155 (43.2%) | 67 (13.7%) |
| $50,000 to $99,999 | 105 (29.2%) | 192 (39.1%) |
| $100,000 to $299,999 | 86 (24.0%) | 232 (47.2%) |
| $300,000 to $499,999 | 13 (3.6%) | 0 (0.0%) |
| $500,000 to $749,999 | 0 (0.0%) | 0 (0.0%) |
| $750,000 to $999,999 | 0 (0.0%) | 0 (0.0%) |
| $1,000,000 or more | 0 (0.0%) | 0 (0.0%) |
| Total | 359 (100.0%) | 491 (100.0%) |
Household Income by Mortgage Status in East Rockingham
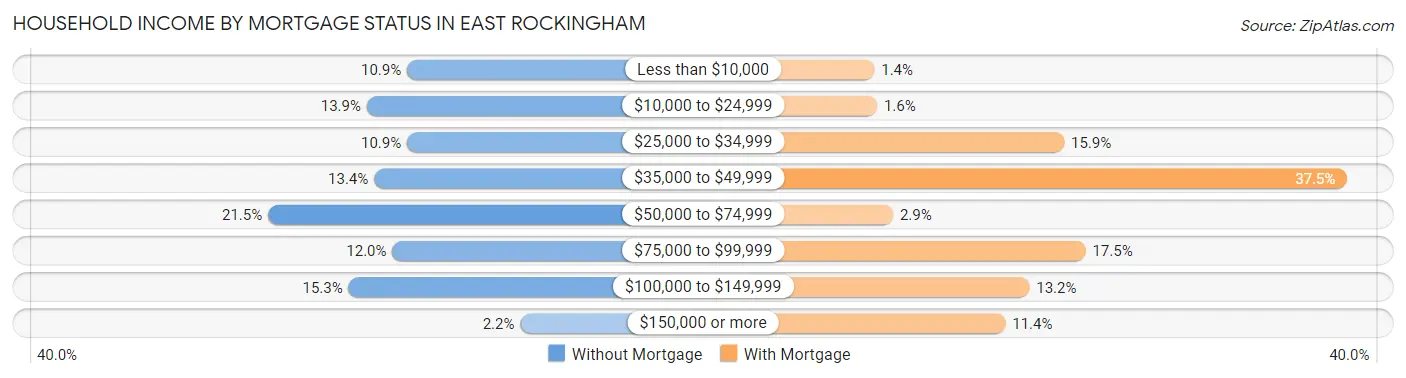
| Household Income | Without Mortgage | With Mortgage |
| Less than $10,000 | 39 (10.9%) | 7 (1.4%) |
| $10,000 to $24,999 | 50 (13.9%) | 8 (1.6%) |
| $25,000 to $34,999 | 39 (10.9%) | 78 (15.9%) |
| $35,000 to $49,999 | 48 (13.4%) | 184 (37.5%) |
| $50,000 to $74,999 | 77 (21.4%) | 14 (2.9%) |
| $75,000 to $99,999 | 43 (12.0%) | 86 (17.5%) |
| $100,000 to $149,999 | 55 (15.3%) | 65 (13.2%) |
| $150,000 or more | 8 (2.2%) | 56 (11.4%) |
| Total | 359 (100.0%) | 491 (100.0%) |
Property Value to Household Income Ratio in East Rockingham
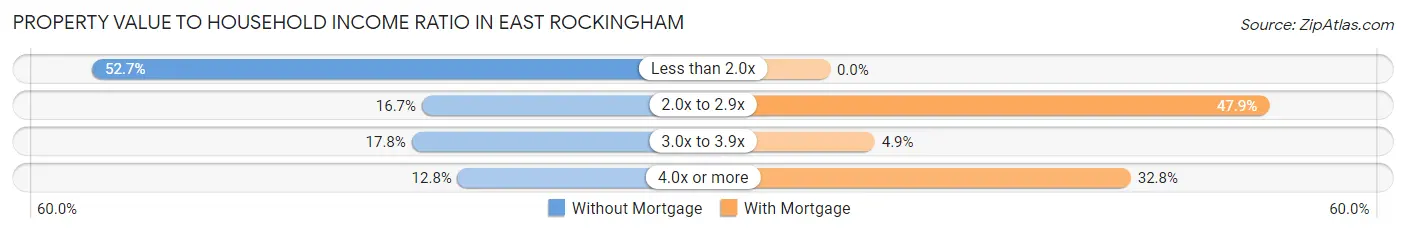
| Value-to-Income Ratio | Without Mortgage | With Mortgage |
| Less than 2.0x | 189 (52.6%) | 0 (0.0%) |
| 2.0x to 2.9x | 60 (16.7%) | 235 (47.9%) |
| 3.0x to 3.9x | 64 (17.8%) | 24 (4.9%) |
| 4.0x or more | 46 (12.8%) | 161 (32.8%) |
| Total | 359 (100.0%) | 491 (100.0%) |
Real Estate Taxes by Mortgage Status in East Rockingham
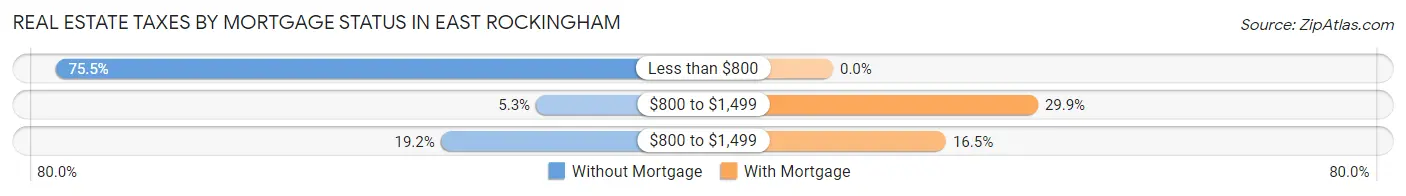
| Property Taxes | Without Mortgage | With Mortgage |
| Less than $800 | 271 (75.5%) | 0 (0.0%) |
| $800 to $1,499 | 19 (5.3%) | 147 (29.9%) |
| $800 to $1,499 | 69 (19.2%) | 81 (16.5%) |
| Total | 359 (100.0%) | 491 (100.0%) |
Health & Disability in East Rockingham
Health Insurance Coverage by Age in East Rockingham
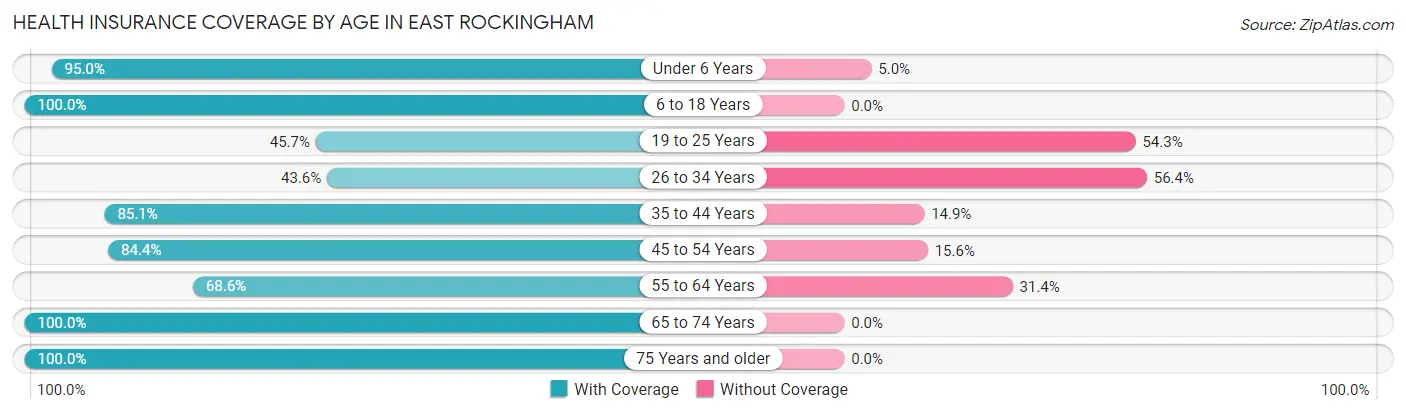
| Age Bracket | With Coverage | Without Coverage |
| Under 6 Years | 245 (95.0%) | 13 (5.0%) |
| 6 to 18 Years | 936 (100.0%) | 0 (0.0%) |
| 19 to 25 Years | 85 (45.7%) | 101 (54.3%) |
| 26 to 34 Years | 85 (43.6%) | 110 (56.4%) |
| 35 to 44 Years | 571 (85.1%) | 100 (14.9%) |
| 45 to 54 Years | 304 (84.4%) | 56 (15.6%) |
| 55 to 64 Years | 212 (68.6%) | 97 (31.4%) |
| 65 to 74 Years | 235 (100.0%) | 0 (0.0%) |
| 75 Years and older | 163 (100.0%) | 0 (0.0%) |
| Total | 2,836 (85.6%) | 477 (14.4%) |
Health Insurance Coverage by Citizenship Status in East Rockingham
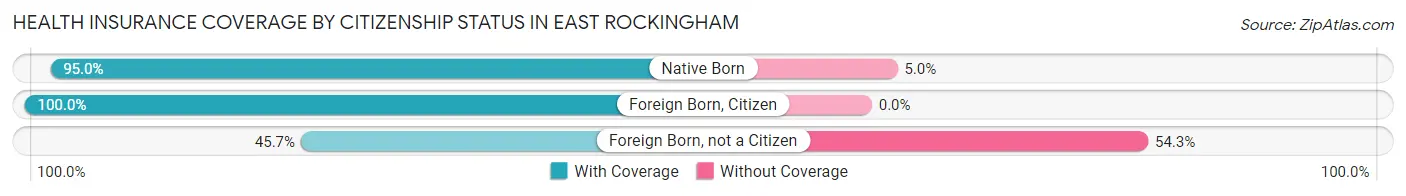
| Citizenship Status | With Coverage | Without Coverage |
| Native Born | 245 (95.0%) | 13 (5.0%) |
| Foreign Born, Citizen | 936 (100.0%) | 0 (0.0%) |
| Foreign Born, not a Citizen | 85 (45.7%) | 101 (54.3%) |
Health Insurance Coverage by Household Income in East Rockingham
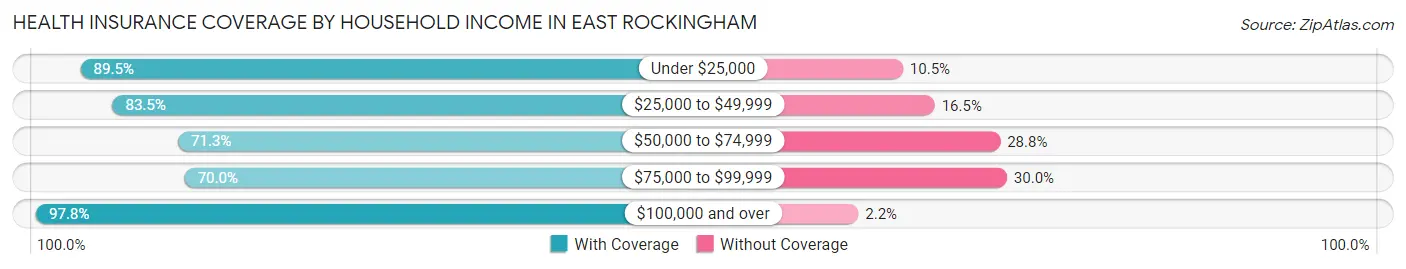
| Household Income | With Coverage | Without Coverage |
| Under $25,000 | 928 (89.5%) | 109 (10.5%) |
| $25,000 to $49,999 | 877 (83.5%) | 173 (16.5%) |
| $50,000 to $74,999 | 280 (71.3%) | 113 (28.7%) |
| $75,000 to $99,999 | 161 (70.0%) | 69 (30.0%) |
| $100,000 and over | 590 (97.8%) | 13 (2.2%) |
Public vs Private Health Insurance Coverage by Age in East Rockingham
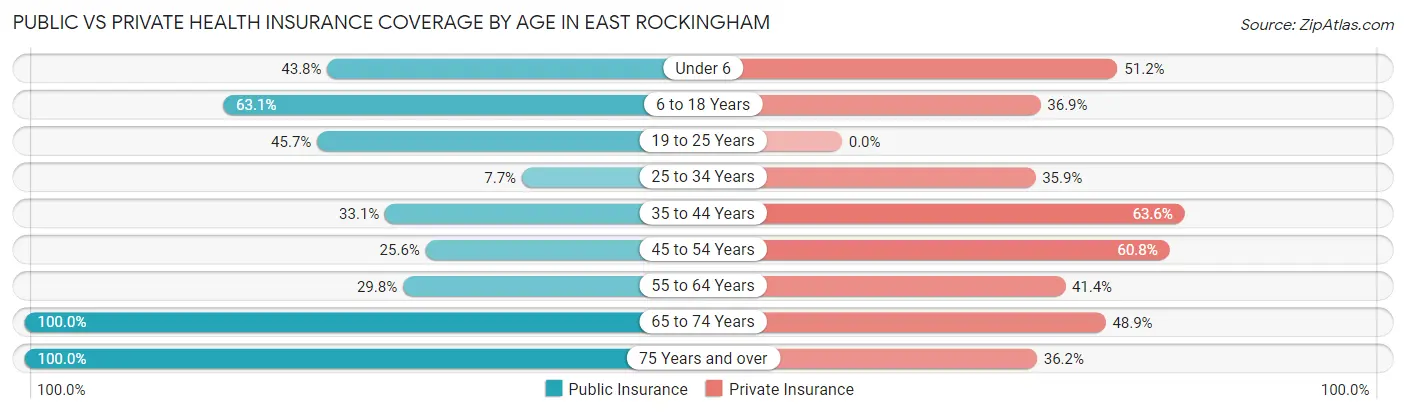
| Age Bracket | Public Insurance | Private Insurance |
| Under 6 | 113 (43.8%) | 132 (51.2%) |
| 6 to 18 Years | 591 (63.1%) | 345 (36.9%) |
| 19 to 25 Years | 85 (45.7%) | 0 (0.0%) |
| 25 to 34 Years | 15 (7.7%) | 70 (35.9%) |
| 35 to 44 Years | 222 (33.1%) | 427 (63.6%) |
| 45 to 54 Years | 92 (25.6%) | 219 (60.8%) |
| 55 to 64 Years | 92 (29.8%) | 128 (41.4%) |
| 65 to 74 Years | 235 (100.0%) | 115 (48.9%) |
| 75 Years and over | 163 (100.0%) | 59 (36.2%) |
| Total | 1,608 (48.5%) | 1,495 (45.1%) |
Disability Status by Sex by Age in East Rockingham
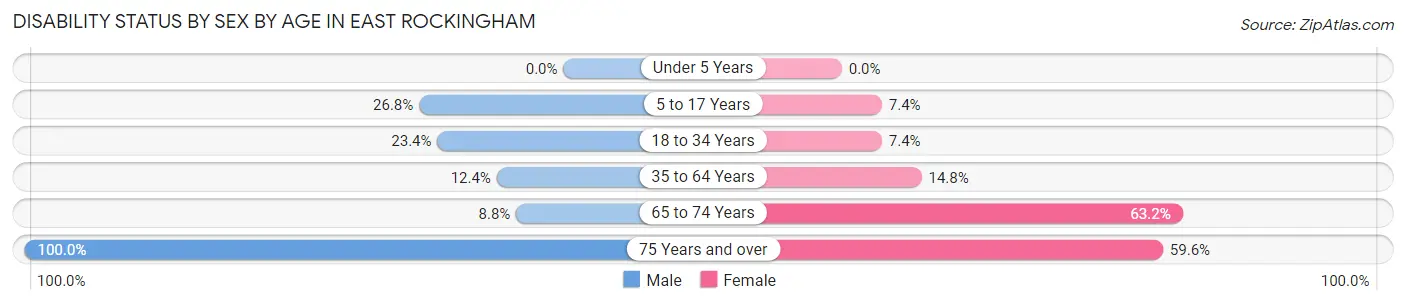
| Age Bracket | Male | Female |
| Under 5 Years | 0 (0.0%) | 0 (0.0%) |
| 5 to 17 Years | 117 (26.8%) | 32 (7.4%) |
| 18 to 34 Years | 58 (23.4%) | 15 (7.4%) |
| 35 to 64 Years | 83 (12.4%) | 99 (14.8%) |
| 65 to 74 Years | 7 (8.7%) | 98 (63.2%) |
| 75 Years and over | 64 (100.0%) | 59 (59.6%) |
Disability Class by Sex by Age in East Rockingham
Disability Class: Hearing Difficulty
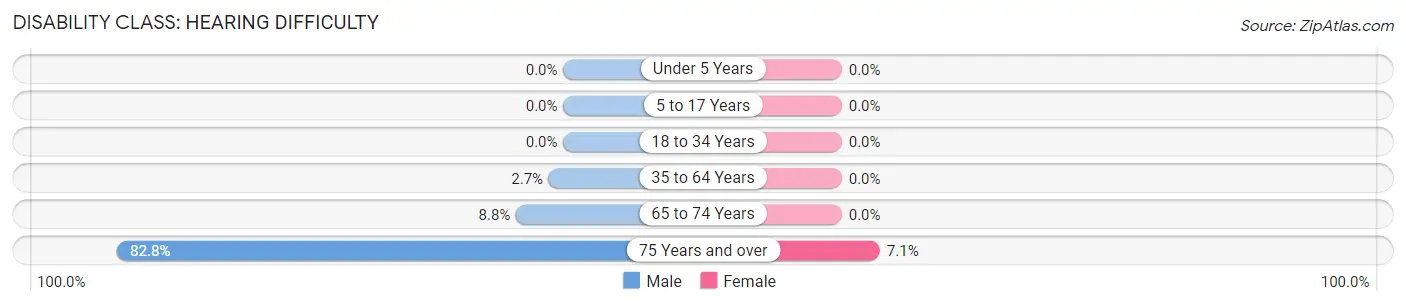
| Age Bracket | Male | Female |
| Under 5 Years | 0 (0.0%) | 0 (0.0%) |
| 5 to 17 Years | 0 (0.0%) | 0 (0.0%) |
| 18 to 34 Years | 0 (0.0%) | 0 (0.0%) |
| 35 to 64 Years | 18 (2.7%) | 0 (0.0%) |
| 65 to 74 Years | 7 (8.7%) | 0 (0.0%) |
| 75 Years and over | 53 (82.8%) | 7 (7.1%) |
Disability Class: Vision Difficulty
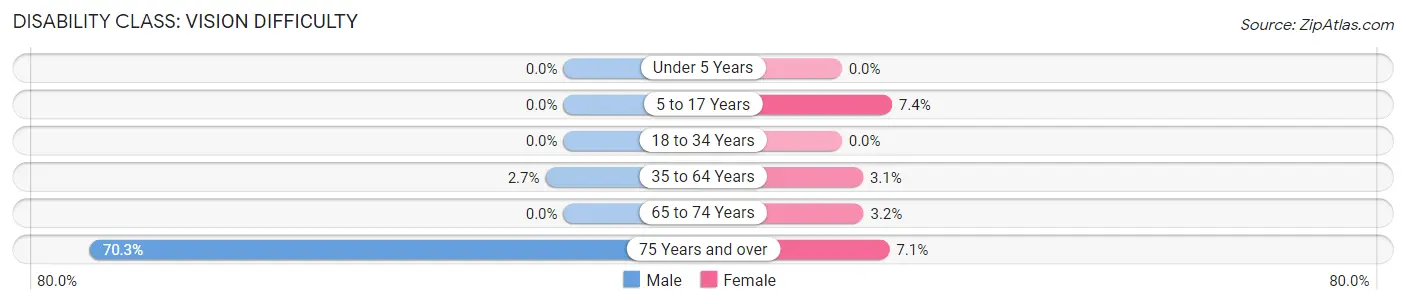
| Age Bracket | Male | Female |
| Under 5 Years | 0 (0.0%) | 0 (0.0%) |
| 5 to 17 Years | 0 (0.0%) | 32 (7.4%) |
| 18 to 34 Years | 0 (0.0%) | 0 (0.0%) |
| 35 to 64 Years | 18 (2.7%) | 21 (3.1%) |
| 65 to 74 Years | 0 (0.0%) | 5 (3.2%) |
| 75 Years and over | 45 (70.3%) | 7 (7.1%) |
Disability Class: Cognitive Difficulty
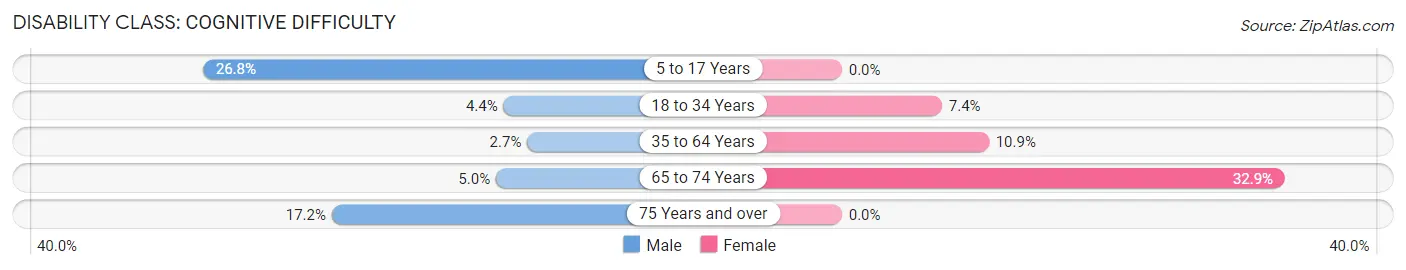
| Age Bracket | Male | Female |
| 5 to 17 Years | 117 (26.8%) | 0 (0.0%) |
| 18 to 34 Years | 11 (4.4%) | 15 (7.4%) |
| 35 to 64 Years | 18 (2.7%) | 73 (10.9%) |
| 65 to 74 Years | 4 (5.0%) | 51 (32.9%) |
| 75 Years and over | 11 (17.2%) | 0 (0.0%) |
Disability Class: Ambulatory Difficulty
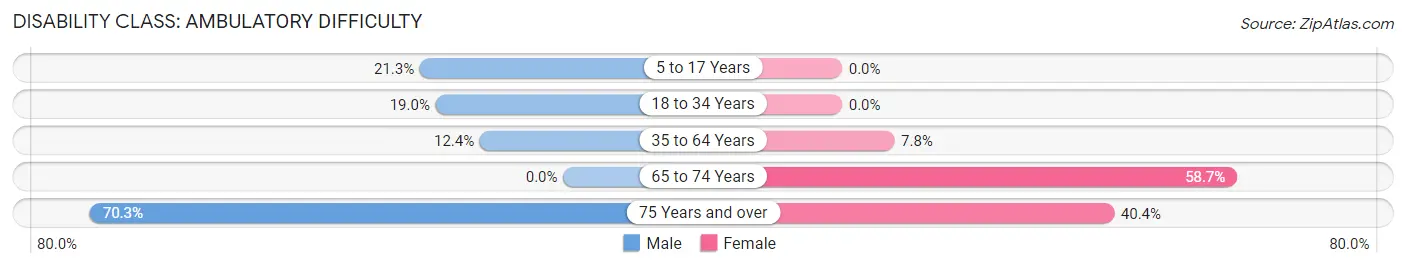
| Age Bracket | Male | Female |
| 5 to 17 Years | 93 (21.3%) | 0 (0.0%) |
| 18 to 34 Years | 47 (19.0%) | 0 (0.0%) |
| 35 to 64 Years | 83 (12.4%) | 52 (7.8%) |
| 65 to 74 Years | 0 (0.0%) | 91 (58.7%) |
| 75 Years and over | 45 (70.3%) | 40 (40.4%) |
Disability Class: Self-Care Difficulty
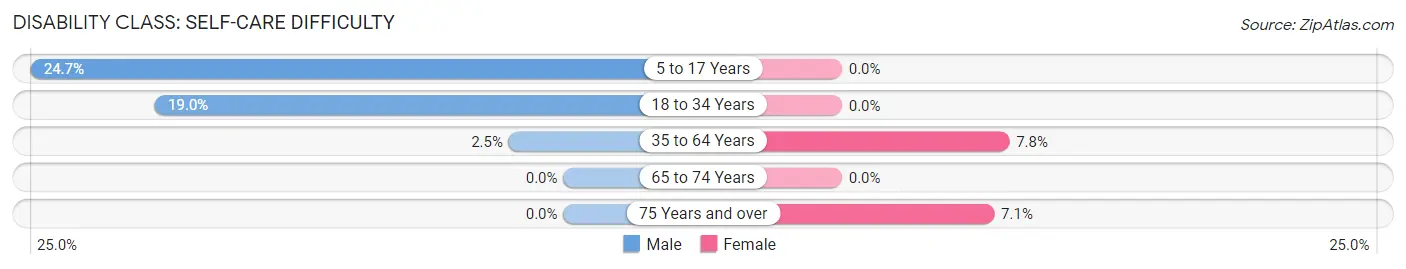
| Age Bracket | Male | Female |
| 5 to 17 Years | 108 (24.7%) | 0 (0.0%) |
| 18 to 34 Years | 47 (19.0%) | 0 (0.0%) |
| 35 to 64 Years | 17 (2.5%) | 52 (7.8%) |
| 65 to 74 Years | 0 (0.0%) | 0 (0.0%) |
| 75 Years and over | 0 (0.0%) | 7 (7.1%) |
Technology Access in East Rockingham
Computing Device Access in East Rockingham
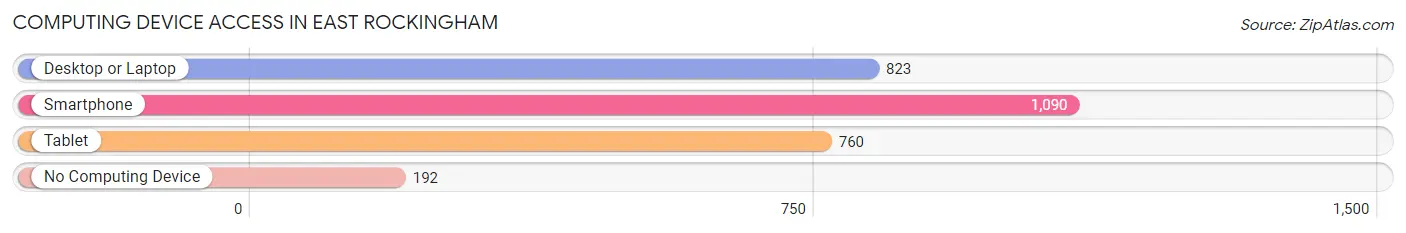
| Device Type | # Households | % Households |
| Desktop or Laptop | 823 | 63.0% |
| Smartphone | 1,090 | 83.5% |
| Tablet | 760 | 58.2% |
| No Computing Device | 192 | 14.7% |
| Total | 1,306 | 100.0% |
Internet Access in East Rockingham
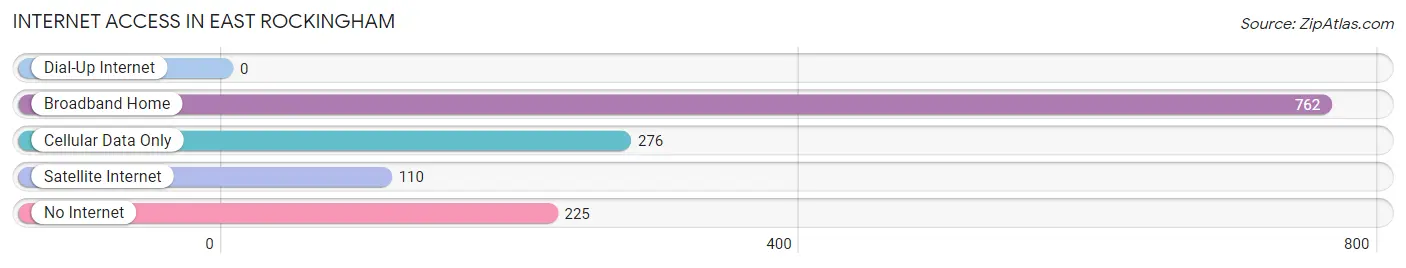
| Internet Type | # Households | % Households |
| Dial-Up Internet | 0 | 0.0% |
| Broadband Home | 762 | 58.4% |
| Cellular Data Only | 276 | 21.1% |
| Satellite Internet | 110 | 8.4% |
| No Internet | 225 | 17.2% |
| Total | 1,306 | 100.0% |
East Rockingham Summary
History
East Rockingham is a small town located in Richmond County, North Carolina. It is situated on the banks of the Pee Dee River, about 20 miles east of Rockingham, the county seat. The town was founded in 1790 by a group of settlers from Scotland, who named it after their homeland. The town was originally known as "Rockingham," but the name was changed to "East Rockingham" in 1820 to distinguish it from the larger town of Rockingham.
East Rockingham has a rich history that dates back to the early 1800s. The town was an important stop on the stagecoach route between Fayetteville and Wilmington. It was also a major trading center for the surrounding area, and was home to several mills and factories. During the Civil War, East Rockingham was the site of a major battle between Union and Confederate forces.
Geography
East Rockingham is located in the southeastern corner of Richmond County, North Carolina. It is situated on the banks of the Pee Dee River, about 20 miles east of Rockingham, the county seat. The town is surrounded by rolling hills and farmland, and is bordered by the towns of Hoffman, Ellerbe, and Cordova.
The climate in East Rockingham is mild and humid, with hot summers and mild winters. The average annual temperature is around 70 degrees Fahrenheit, and the average annual precipitation is around 45 inches.
Economy
East Rockingham's economy is largely based on agriculture and manufacturing. The town is home to several farms, which produce a variety of crops, including corn, soybeans, cotton, and tobacco. There are also several factories in the area, which produce a variety of products, including furniture, textiles, and paper products.
The town is also home to several small businesses, including restaurants, shops, and service providers. The town is also home to a branch of the Richmond County Public Library, which provides access to books, magazines, and other resources.
Demographics
As of the 2010 census, East Rockingham had a population of 1,845. The racial makeup of the town was 79.3% White, 17.2% African American, 0.5% Native American, 0.3% Asian, 0.1% Pacific Islander, and 2.6% from other races. The median household income was $30,938, and the median family income was $37,813.
East Rockingham is a small, rural town with a close-knit community. The town is home to several churches, and there are several community events throughout the year, including a Fourth of July parade and a Christmas parade. The town is also home to a branch of the Richmond County Public Library, which provides access to books, magazines, and other resources.
Common Questions
What is the Total Population of East Rockingham?
Total Population of East Rockingham is 3,328.
What is the Total Male Population of East Rockingham?
Total Male Population of East Rockingham is 1,688.
What is the Total Female Population of East Rockingham?
Total Female Population of East Rockingham is 1,640.
What is the Ratio of Males per 100 Females in East Rockingham?
There are 102.93 Males per 100 Females in East Rockingham.
What is the Ratio of Females per 100 Males in East Rockingham?
There are 97.16 Females per 100 Males in East Rockingham.
What is the Median Population Age in East Rockingham?
Median Population Age in East Rockingham is 35.8 Years.
What is the Average Family Size in East Rockingham
Average Family Size in East Rockingham is 3.3 People.
What is the Average Household Size in East Rockingham
Average Household Size in East Rockingham is 2.5 People.
What is Per Capita Income in East Rockingham?
Per Capita income in East Rockingham is $20,390.
What is the Median Family Income in East Rockingham?
Median Family Income in East Rockingham is $32,566.
What is the Median Household income in East Rockingham?
Median Household Income in East Rockingham is $31,475.
What is Income or Wage Gap in East Rockingham?
Income or Wage Gap in East Rockingham is 1.1%.
Women in East Rockingham earn 98.9 cents for every dollar earned by a man.
What is Inequality or Gini Index in East Rockingham?
Inequality or Gini Index in East Rockingham is 0.50.
How Large is the Labor Force in East Rockingham?
There are 1,366 People in the Labor Forcein in East Rockingham.
What is the Percentage of People in the Labor Force in East Rockingham?
57.2% of People are in the Labor Force in East Rockingham.
What is the Unemployment Rate in East Rockingham?
Unemployment Rate in East Rockingham is 12.5%.