Elk Park, NC
Elk Park Map
Elk Park Overview
511
TOTAL POPULATION
212
MALE POPULATION
299
FEMALE POPULATION
70.90
MALES / 100 FEMALES
141.04
FEMALES / 100 MALES
47.3
MEDIAN AGE
2.6
AVG FAMILY SIZE
2.0
AVG HOUSEHOLD SIZE
$27,386
PER CAPITA INCOME
$70,455
AVG FAMILY INCOME
$45,455
AVG HOUSEHOLD INCOME
26.3%
WAGE / INCOME GAP [ % ]
73.7¢/ $1
WAGE / INCOME GAP [ $ ]
0.40
INEQUALITY / GINI INDEX
233
LABOR FORCE [ PEOPLE ]
51.8%
PERCENT IN LABOR FORCE
7.3%
UNEMPLOYMENT RATE
Elk Park Zip Codes
Elk Park Area Codes
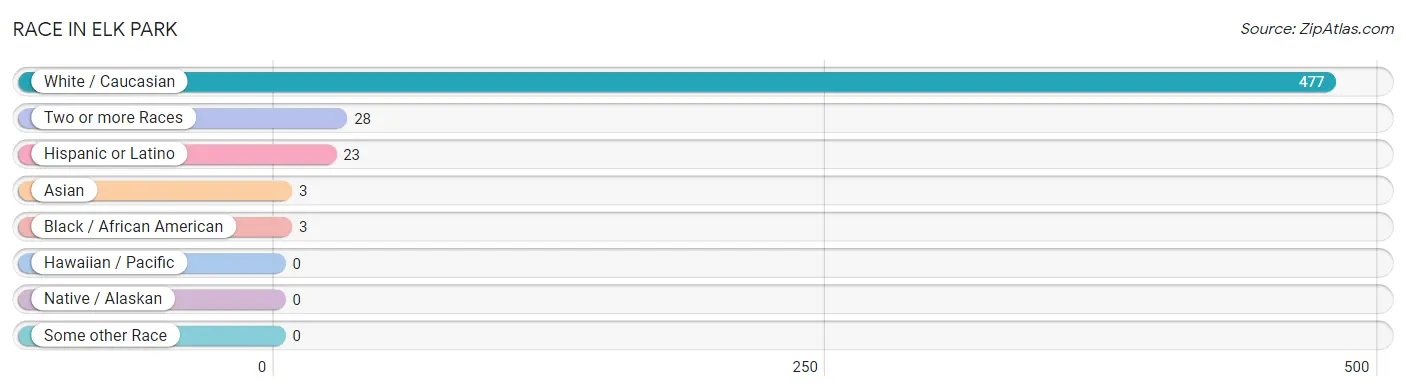
Race in Elk Park
The most populous races in Elk Park are White / Caucasian (477 | 93.3%), Two or more Races (28 | 5.5%), and Hispanic or Latino (23 | 4.5%).
| Race | # Population | % Population |
| Asian | 3 | 0.6% |
| Black / African American | 3 | 0.6% |
| Hawaiian / Pacific | 0 | 0.0% |
| Hispanic or Latino | 23 | 4.5% |
| Native / Alaskan | 0 | 0.0% |
| White / Caucasian | 477 | 93.3% |
| Two or more Races | 28 | 5.5% |
| Some other Race | 0 | 0.0% |
| Total | 511 | 100.0% |
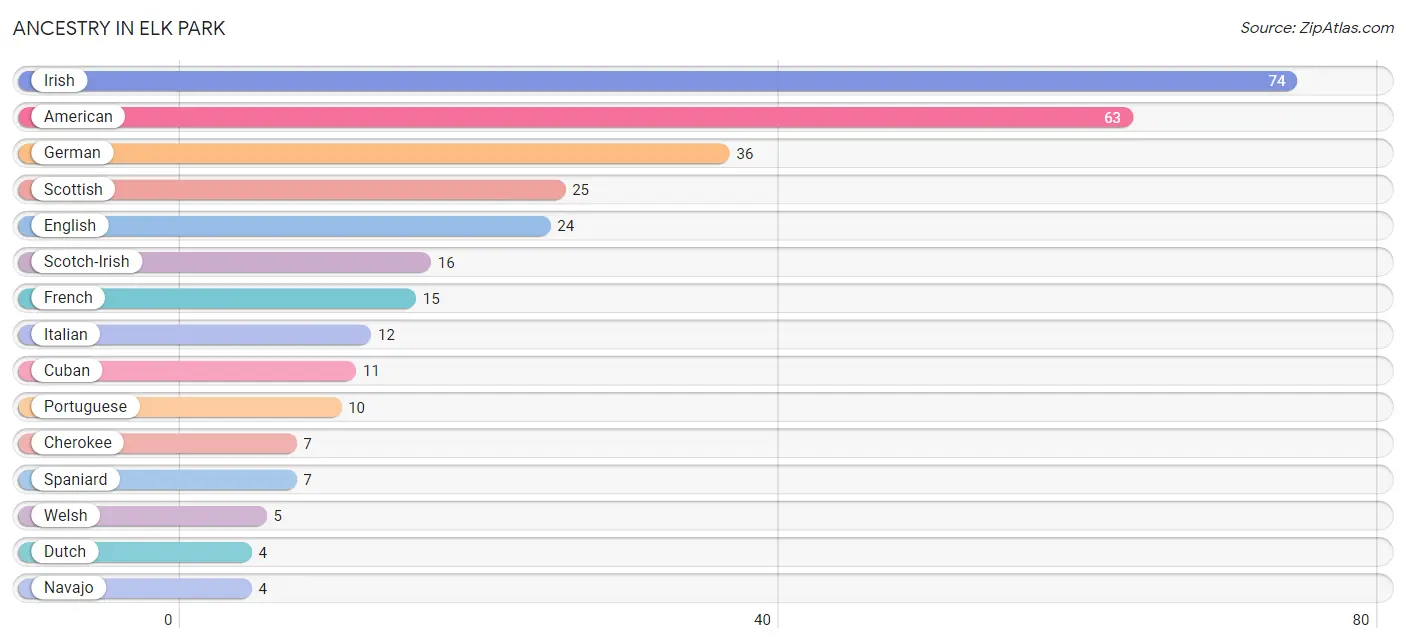
Ancestry in Elk Park
The most populous ancestries reported in Elk Park are Irish (74 | 14.5%), American (63 | 12.3%), German (36 | 7.0%), Scottish (25 | 4.9%), and English (24 | 4.7%), together accounting for 43.4% of all Elk Park residents.
| Ancestry | # Population | % Population |
| American | 63 | 12.3% |
| British | 2 | 0.4% |
| Cherokee | 7 | 1.4% |
| Cuban | 11 | 2.1% |
| Czech | 1 | 0.2% |
| Dutch | 4 | 0.8% |
| English | 24 | 4.7% |
| French | 15 | 2.9% |
| German | 36 | 7.0% |
| Icelander | 2 | 0.4% |
| Irish | 74 | 14.5% |
| Italian | 12 | 2.4% |
| Malaysian | 3 | 0.6% |
| Navajo | 4 | 0.8% |
| Portuguese | 10 | 2.0% |
| Puerto Rican | 2 | 0.4% |
| Scotch-Irish | 16 | 3.1% |
| Scottish | 25 | 4.9% |
| Spaniard | 7 | 1.4% |
| Spanish | 3 | 0.6% |
| Welsh | 5 | 1.0% | View All 21 Rows |
Immigrants in Elk Park

| Immigration Origin | # Population | % Population | View All 0 Rows |
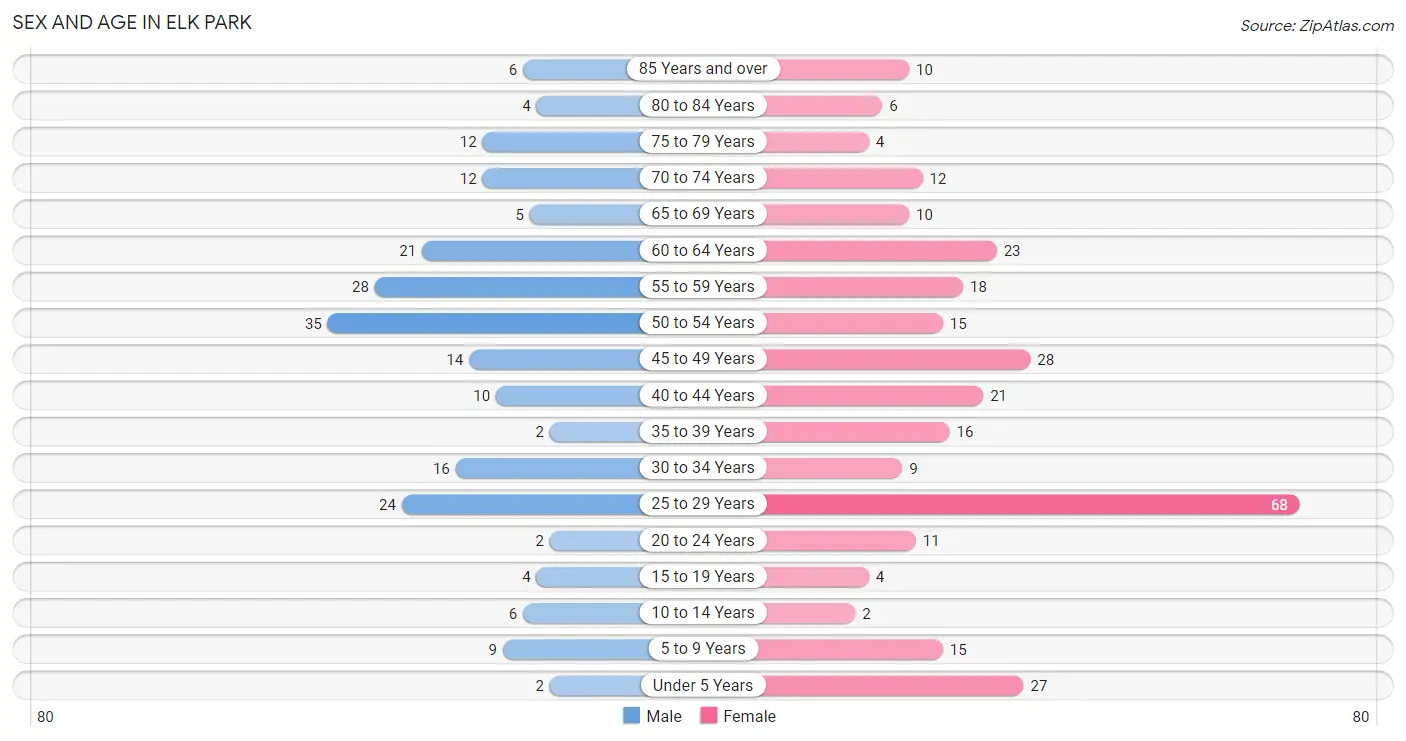
Sex and Age in Elk Park
Sex and Age in Elk Park
The most populous age groups in Elk Park are 50 to 54 Years (35 | 16.5%) for men and 25 to 29 Years (68 | 22.7%) for women.
| Age Bracket | Male | Female |
| Under 5 Years | 2 (0.9%) | 27 (9.0%) |
| 5 to 9 Years | 9 (4.3%) | 15 (5.0%) |
| 10 to 14 Years | 6 (2.8%) | 2 (0.7%) |
| 15 to 19 Years | 4 (1.9%) | 4 (1.3%) |
| 20 to 24 Years | 2 (0.9%) | 11 (3.7%) |
| 25 to 29 Years | 24 (11.3%) | 68 (22.7%) |
| 30 to 34 Years | 16 (7.5%) | 9 (3.0%) |
| 35 to 39 Years | 2 (0.9%) | 16 (5.3%) |
| 40 to 44 Years | 10 (4.7%) | 21 (7.0%) |
| 45 to 49 Years | 14 (6.6%) | 28 (9.4%) |
| 50 to 54 Years | 35 (16.5%) | 15 (5.0%) |
| 55 to 59 Years | 28 (13.2%) | 18 (6.0%) |
| 60 to 64 Years | 21 (9.9%) | 23 (7.7%) |
| 65 to 69 Years | 5 (2.4%) | 10 (3.3%) |
| 70 to 74 Years | 12 (5.7%) | 12 (4.0%) |
| 75 to 79 Years | 12 (5.7%) | 4 (1.3%) |
| 80 to 84 Years | 4 (1.9%) | 6 (2.0%) |
| 85 Years and over | 6 (2.8%) | 10 (3.3%) |
| Total | 212 (100.0%) | 299 (100.0%) |
Families and Households in Elk Park
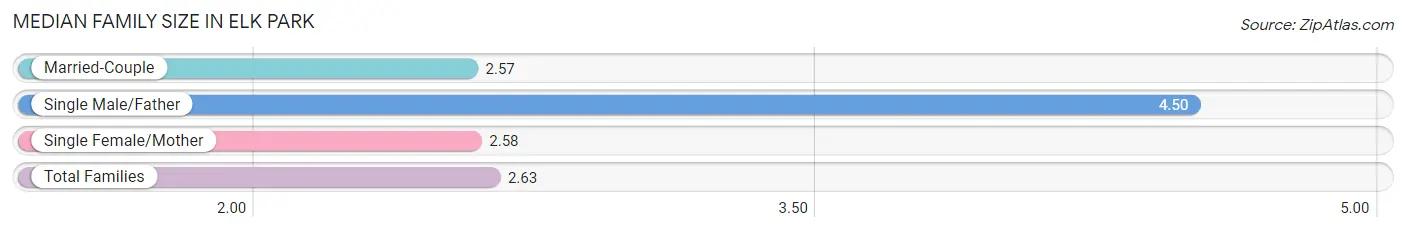
Median Family Size in Elk Park
The median family size in Elk Park is 2.63 persons per family, with single male/father families (4 | 3.0%) accounting for the largest median family size of 4.5 persons per family. On the other hand, married-couple families (92 | 68.7%) represent the smallest median family size with 2.57 persons per family.
| Family Type | # Families | Family Size |
| Married-Couple | 92 (68.7%) | 2.57 |
| Single Male/Father | 4 (3.0%) | 4.50 |
| Single Female/Mother | 38 (28.4%) | 2.58 |
| Total Families | 134 (100.0%) | 2.63 |
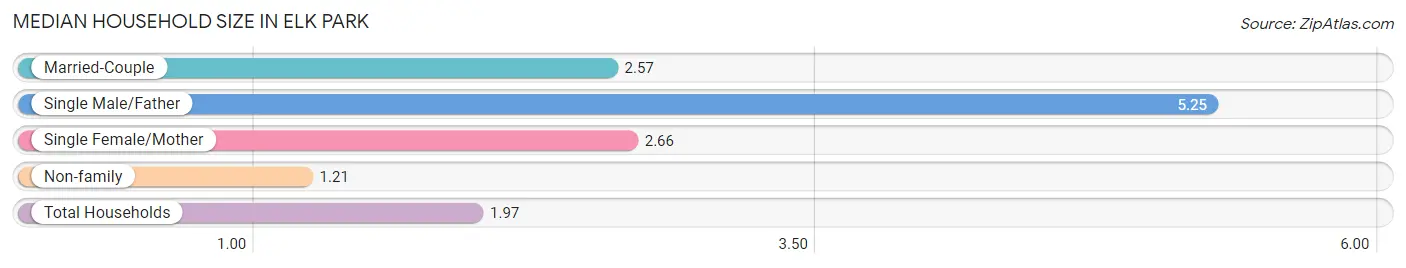
Median Household Size in Elk Park
The median household size in Elk Park is 1.97 persons per household, with single male/father households (4 | 1.5%) accounting for the largest median household size of 5.25 persons per household. non-family households (126 | 48.5%) represent the smallest median household size with 1.21 persons per household.
| Household Type | # Households | Household Size |
| Married-Couple | 92 (35.4%) | 2.57 |
| Single Male/Father | 4 (1.5%) | 5.25 |
| Single Female/Mother | 38 (14.6%) | 2.66 |
| Non-family | 126 (48.5%) | 1.21 |
| Total Households | 260 (100.0%) | 1.97 |
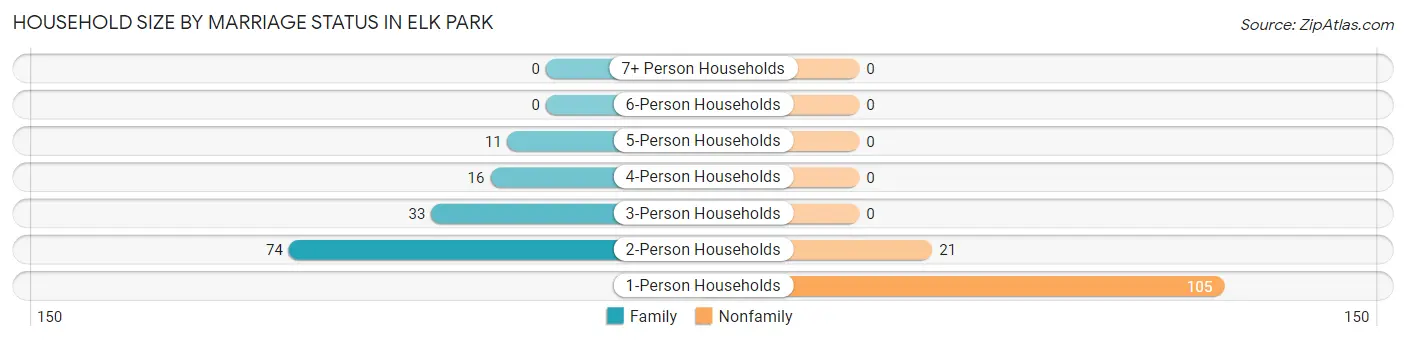
Household Size by Marriage Status in Elk Park
Out of a total of 260 households in Elk Park, 134 (51.5%) are family households, while 126 (48.5%) are nonfamily households. The most numerous type of family households are 2-person households, comprising 74, and the most common type of nonfamily households are 1-person households, comprising 105.
| Household Size | Family Households | Nonfamily Households |
| 1-Person Households | - | 105 (40.4%) |
| 2-Person Households | 74 (28.5%) | 21 (8.1%) |
| 3-Person Households | 33 (12.7%) | 0 (0.0%) |
| 4-Person Households | 16 (6.1%) | 0 (0.0%) |
| 5-Person Households | 11 (4.2%) | 0 (0.0%) |
| 6-Person Households | 0 (0.0%) | 0 (0.0%) |
| 7+ Person Households | 0 (0.0%) | 0 (0.0%) |
| Total | 134 (51.5%) | 126 (48.5%) |
Female Fertility in Elk Park
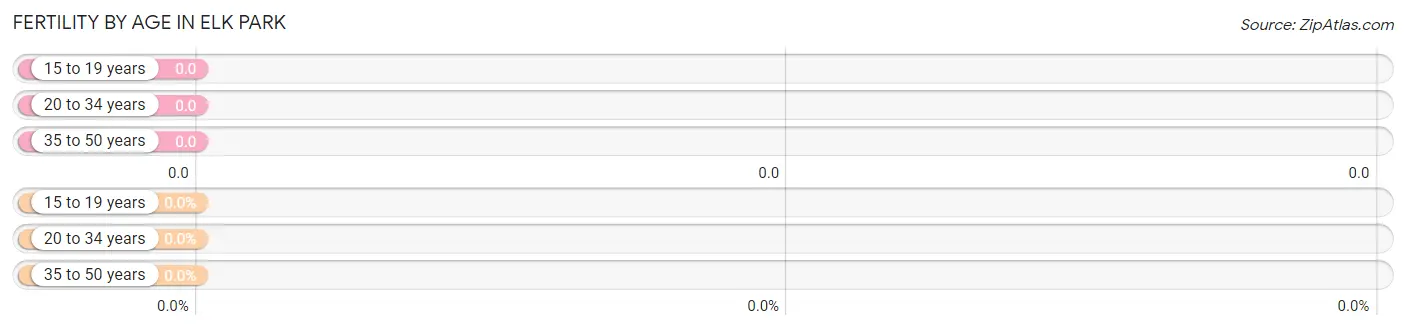
Fertility by Age in Elk Park
| Age Bracket | Women with Births | Births / 1,000 Women |
| 15 to 19 years | 0 (0.0%) | 0.0 |
| 20 to 34 years | 0 (0.0%) | 0.0 |
| 35 to 50 years | 0 (0.0%) | 0.0 |
| Total | 0 (0.0%) | 0.0 |
Fertility by Age by Marriage Status in Elk Park
| Age Bracket | Married | Unmarried |
| 15 to 19 years | 0 (0.0%) | 0 (0.0%) |
| 20 to 34 years | 0 (0.0%) | 0 (0.0%) |
| 35 to 50 years | 0 (0.0%) | 0 (0.0%) |
| Total | 0 (0.0%) | 0 (0.0%) |
Fertility by Education in Elk Park
| Educational Attainment | Women with Births | Births / 1,000 Women |
| Less than High School | 0 (0.0%) | 0.0 |
| High School Diploma | 0 (0.0%) | 0.0 |
| College or Associate's Degree | 0 (0.0%) | 0.0 |
| Bachelor's Degree | 0 (0.0%) | 0.0 |
| Graduate Degree | 0 (0.0%) | 0.0 |
| Total | 0 (0.0%) | 0.0 |
Fertility by Education by Marriage Status in Elk Park
| Educational Attainment | Married | Unmarried |
| Less than High School | 0 (0.0%) | 0 (0.0%) |
| High School Diploma | 0 (0.0%) | 0 (0.0%) |
| College or Associate's Degree | 0 (0.0%) | 0 (0.0%) |
| Bachelor's Degree | 0 (0.0%) | 0 (0.0%) |
| Graduate Degree | 0 (0.0%) | 0 (0.0%) |
| Total | 0 (0.0%) | 0 (0.0%) |
Income in Elk Park
Income Overview in Elk Park
Per Capita Income in Elk Park is $27,386, while median incomes of families and households are $70,455 and $45,455 respectively.
| Characteristic | Number | Measure |
| Per Capita Income | 511 | $27,386 |
| Median Family Income | 134 | $70,455 |
| Mean Family Income | 134 | $68,548 |
| Median Household Income | 260 | $45,455 |
| Mean Household Income | 260 | $52,786 |
| Income Deficit | 134 | $0 |
| Wage / Income Gap (%) | 511 | 26.33% |
| Wage / Income Gap ($) | 511 | 73.67¢ per $1 |
| Gini / Inequality Index | 511 | 0.40 |
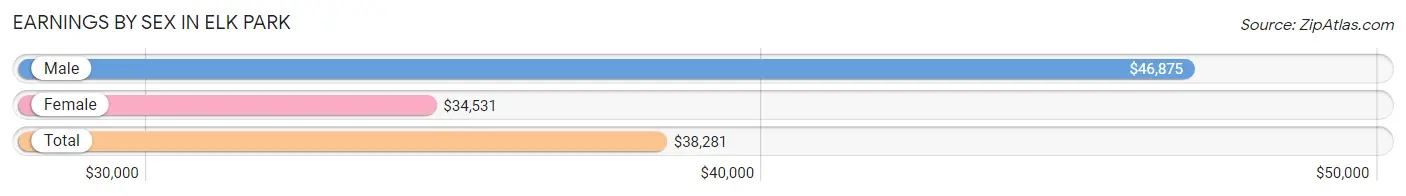
Earnings by Sex in Elk Park
Average Earnings in Elk Park are $38,281, $46,875 for men and $34,531 for women, a difference of 26.3%.
| Sex | Number | Average Earnings |
| Male | 109 (44.7%) | $46,875 |
| Female | 135 (55.3%) | $34,531 |
| Total | 244 (100.0%) | $38,281 |
Earnings by Sex by Income Bracket in Elk Park
The most common earnings brackets in Elk Park are $55,000 to $64,999 for men (27 | 24.8%) and $35,000 to $39,999 for women (25 | 18.5%).
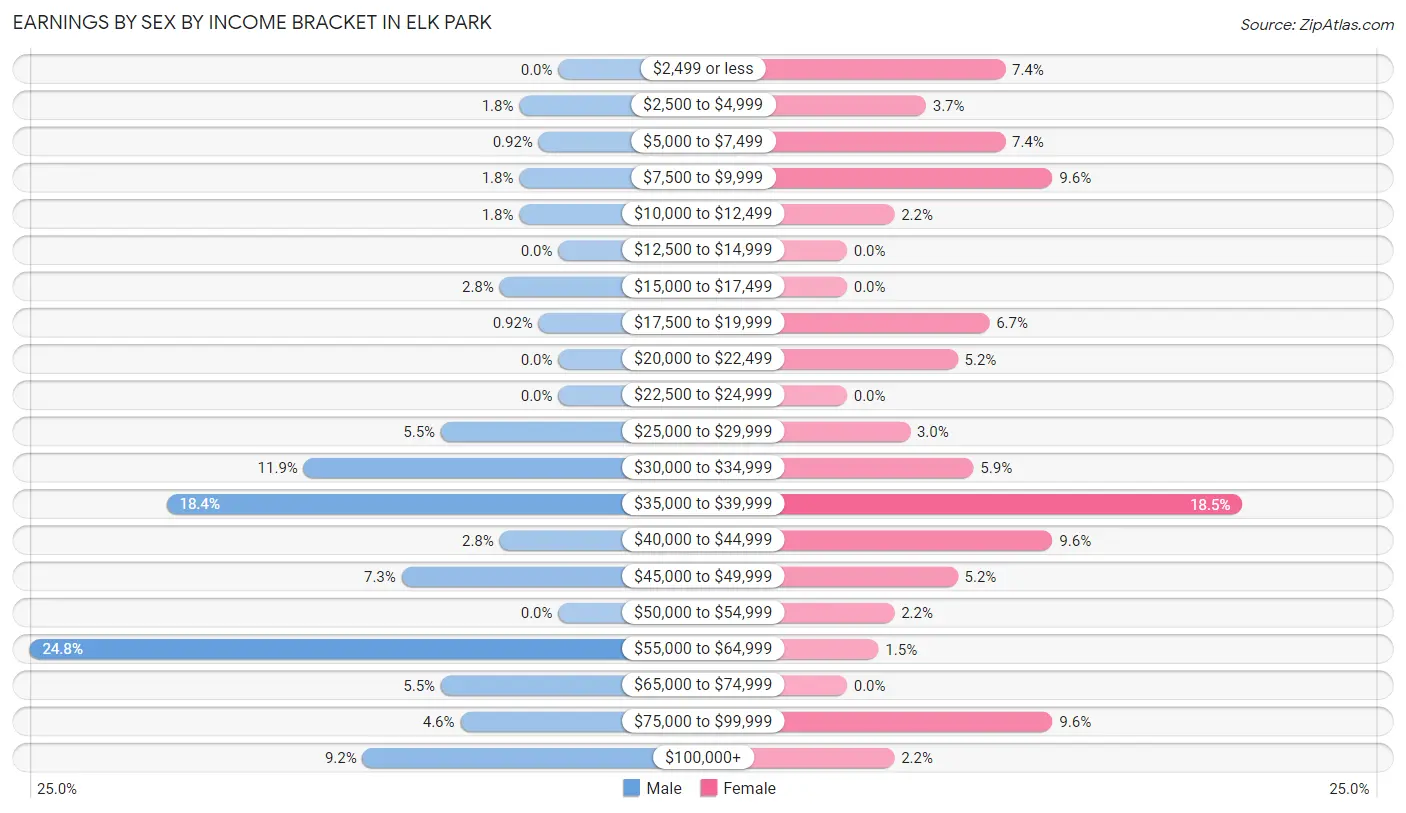
| Income | Male | Female |
| $2,499 or less | 0 (0.0%) | 10 (7.4%) |
| $2,500 to $4,999 | 2 (1.8%) | 5 (3.7%) |
| $5,000 to $7,499 | 1 (0.9%) | 10 (7.4%) |
| $7,500 to $9,999 | 2 (1.8%) | 13 (9.6%) |
| $10,000 to $12,499 | 2 (1.8%) | 3 (2.2%) |
| $12,500 to $14,999 | 0 (0.0%) | 0 (0.0%) |
| $15,000 to $17,499 | 3 (2.8%) | 0 (0.0%) |
| $17,500 to $19,999 | 1 (0.9%) | 9 (6.7%) |
| $20,000 to $22,499 | 0 (0.0%) | 7 (5.2%) |
| $22,500 to $24,999 | 0 (0.0%) | 0 (0.0%) |
| $25,000 to $29,999 | 6 (5.5%) | 4 (3.0%) |
| $30,000 to $34,999 | 13 (11.9%) | 8 (5.9%) |
| $35,000 to $39,999 | 20 (18.3%) | 25 (18.5%) |
| $40,000 to $44,999 | 3 (2.8%) | 13 (9.6%) |
| $45,000 to $49,999 | 8 (7.3%) | 7 (5.2%) |
| $50,000 to $54,999 | 0 (0.0%) | 3 (2.2%) |
| $55,000 to $64,999 | 27 (24.8%) | 2 (1.5%) |
| $65,000 to $74,999 | 6 (5.5%) | 0 (0.0%) |
| $75,000 to $99,999 | 5 (4.6%) | 13 (9.6%) |
| $100,000+ | 10 (9.2%) | 3 (2.2%) |
| Total | 109 (100.0%) | 135 (100.0%) |
Earnings by Sex by Educational Attainment in Elk Park
Average earnings in Elk Park are $47,708 for men and $35,536 for women, a difference of 25.5%. Men with an educational attainment of less than high school enjoy the highest average annual earnings of $60,125, while those with college or associate's degree education earn the least with $38,929. Women with an educational attainment of bachelor's degree earn the most with the average annual earnings of $46,071, while those with college or associate's degree education have the smallest earnings of $37,917.
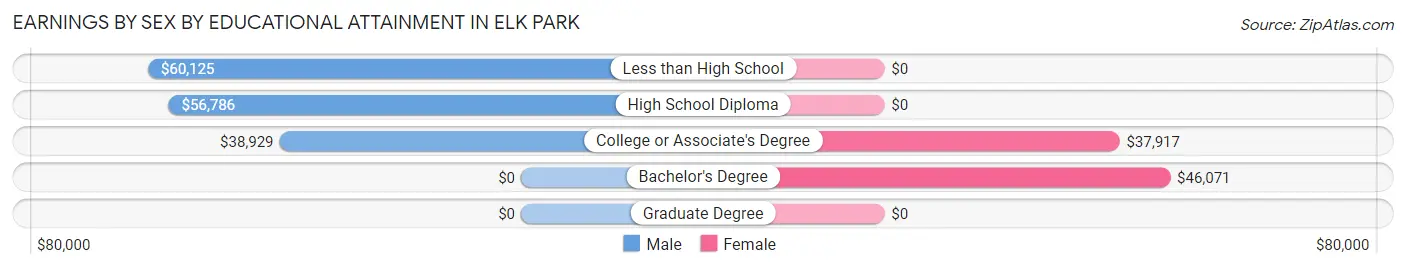
| Educational Attainment | Male Income | Female Income |
| Less than High School | $60,125 | $0 |
| High School Diploma | $56,786 | $0 |
| College or Associate's Degree | $38,929 | $37,917 |
| Bachelor's Degree | - | - |
| Graduate Degree | - | - |
| Total | $47,708 | $35,536 |
Family Income in Elk Park
Family Income Brackets in Elk Park
According to the Elk Park family income data, there are 38 families falling into the $50,000 to $74,999 income range, which is the most common income bracket and makes up 28.4% of all families. Conversely, the $10,000 to $14,999 income bracket is the least frequent group with only 1 families (0.7%) belonging to this category.
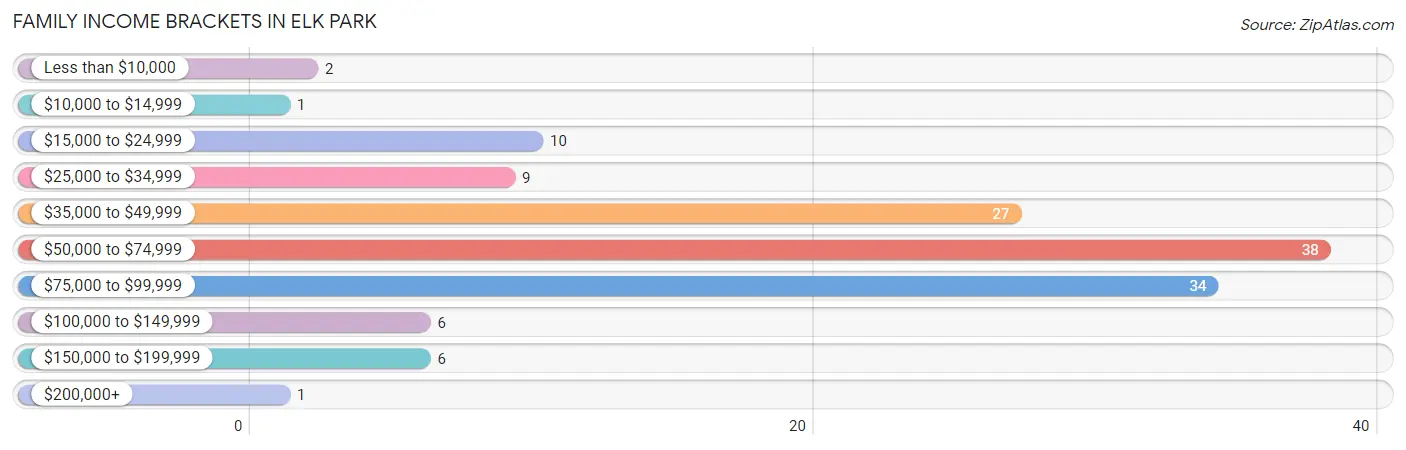
| Income Bracket | # Families | % Families |
| Less than $10,000 | 2 | 1.5% |
| $10,000 to $14,999 | 1 | 0.7% |
| $15,000 to $24,999 | 10 | 7.5% |
| $25,000 to $34,999 | 9 | 6.7% |
| $35,000 to $49,999 | 27 | 20.1% |
| $50,000 to $74,999 | 38 | 28.4% |
| $75,000 to $99,999 | 34 | 25.4% |
| $100,000 to $149,999 | 6 | 4.5% |
| $150,000 to $199,999 | 6 | 4.5% |
| $200,000+ | 1 | 0.7% |
Family Income by Famaliy Size in Elk Park
5-person families (9 | 6.7%) account for the highest median family income in Elk Park with $96,250 per family, while 2-person families (83 | 61.9%) have the highest median income of $36,762 per family member.
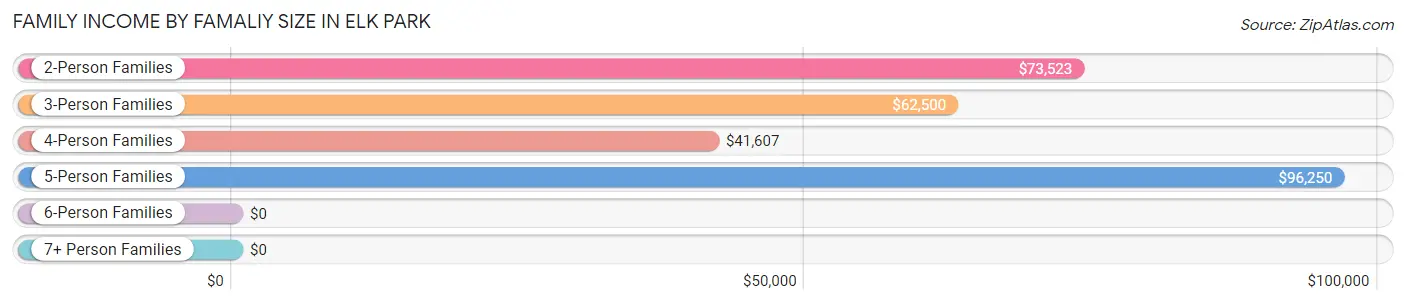
| Income Bracket | # Families | Median Income |
| 2-Person Families | 83 (61.9%) | $73,523 |
| 3-Person Families | 24 (17.9%) | $62,500 |
| 4-Person Families | 18 (13.4%) | $41,607 |
| 5-Person Families | 9 (6.7%) | $96,250 |
| 6-Person Families | 0 (0.0%) | $0 |
| 7+ Person Families | 0 (0.0%) | $0 |
| Total | 134 (100.0%) | $70,455 |
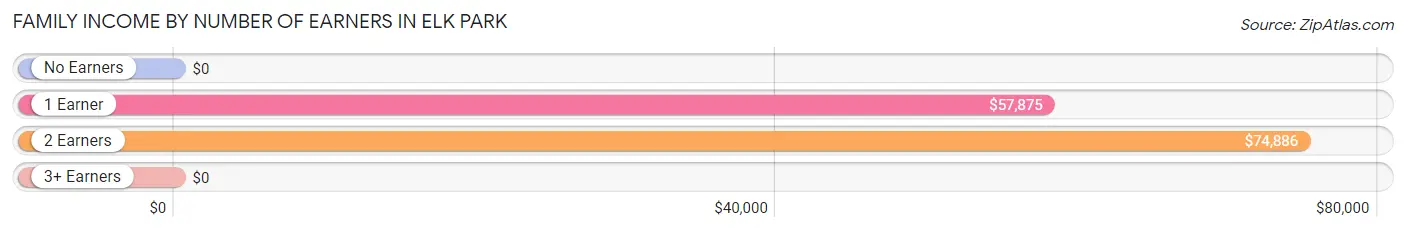
Family Income by Number of Earners in Elk Park
| Number of Earners | # Families | Median Income |
| No Earners | 18 (13.4%) | $0 |
| 1 Earner | 71 (53.0%) | $57,875 |
| 2 Earners | 39 (29.1%) | $74,886 |
| 3+ Earners | 6 (4.5%) | $0 |
| Total | 134 (100.0%) | $70,455 |
Household Income in Elk Park
Household Income Brackets in Elk Park
With 66 households falling in the category, the $35,000 to $49,999 income range is the most frequent in Elk Park, accounting for 25.4% of all households. In contrast, only 1 households (0.4%) fall into the $200,000+ income bracket, making it the least populous group.
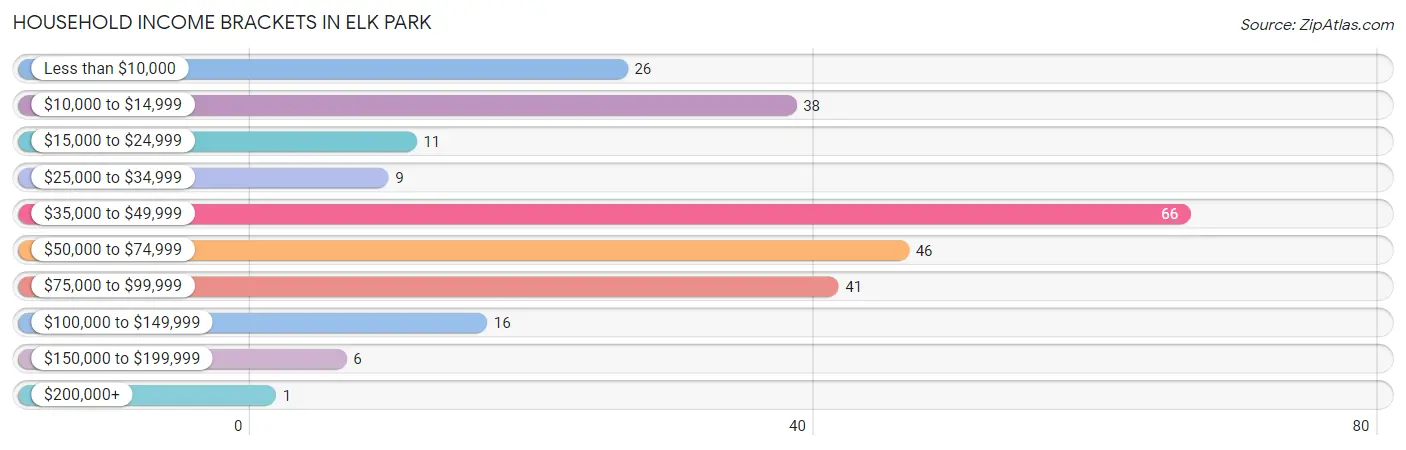
| Income Bracket | # Households | % Households |
| Less than $10,000 | 26 | 10.0% |
| $10,000 to $14,999 | 38 | 14.6% |
| $15,000 to $24,999 | 11 | 4.2% |
| $25,000 to $34,999 | 9 | 3.5% |
| $35,000 to $49,999 | 66 | 25.4% |
| $50,000 to $74,999 | 46 | 17.7% |
| $75,000 to $99,999 | 41 | 15.8% |
| $100,000 to $149,999 | 16 | 6.2% |
| $150,000 to $199,999 | 6 | 2.3% |
| $200,000+ | 1 | 0.4% |
Household Income by Householder Age in Elk Park
The median household income in Elk Park is $45,455, with the highest median household income of $54,375 found in the 65+ years age bracket for the primary householder. A total of 59 households (22.7%) fall into this category. Meanwhile, the 15 to 24 years age bracket for the primary householder has the lowest median household income of $0, with 2 households (0.8%) in this group.
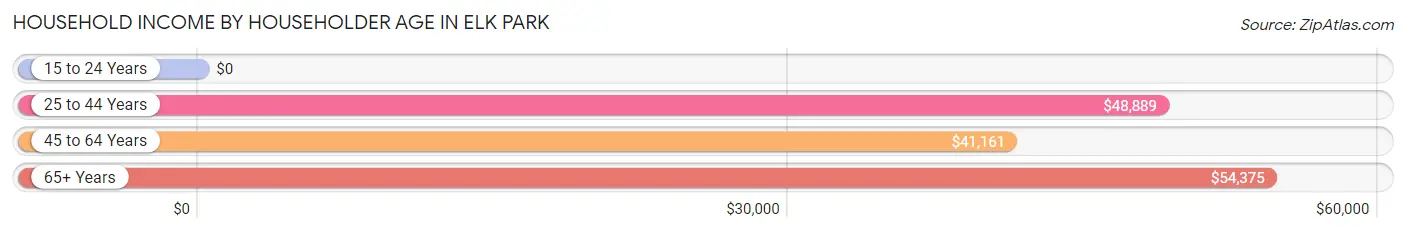
| Income Bracket | # Households | Median Income |
| 15 to 24 Years | 2 (0.8%) | $0 |
| 25 to 44 Years | 72 (27.7%) | $48,889 |
| 45 to 64 Years | 127 (48.8%) | $41,161 |
| 65+ Years | 59 (22.7%) | $54,375 |
| Total | 260 (100.0%) | $45,455 |
Poverty in Elk Park
Income Below Poverty by Sex and Age in Elk Park
With 25.0% poverty level for males and 22.1% for females among the residents of Elk Park, 35 to 44 year old males and 6 to 11 year old females are the most vulnerable to poverty, with 10 males (83.3%) and 3 females (60.0%) in their respective age groups living below the poverty level.
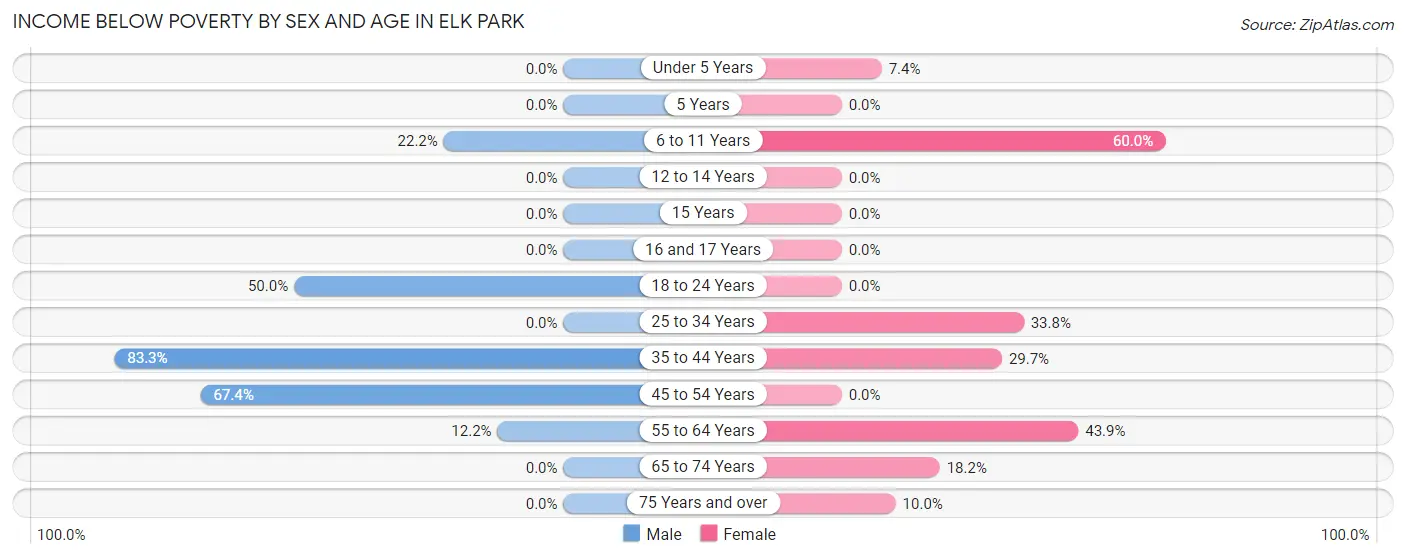
| Age Bracket | Male | Female |
| Under 5 Years | 0 (0.0%) | 2 (7.4%) |
| 5 Years | 0 (0.0%) | 0 (0.0%) |
| 6 to 11 Years | 2 (22.2%) | 3 (60.0%) |
| 12 to 14 Years | 0 (0.0%) | 0 (0.0%) |
| 15 Years | 0 (0.0%) | 0 (0.0%) |
| 16 and 17 Years | 0 (0.0%) | 0 (0.0%) |
| 18 to 24 Years | 2 (50.0%) | 0 (0.0%) |
| 25 to 34 Years | 0 (0.0%) | 26 (33.8%) |
| 35 to 44 Years | 10 (83.3%) | 11 (29.7%) |
| 45 to 54 Years | 33 (67.3%) | 0 (0.0%) |
| 55 to 64 Years | 6 (12.2%) | 18 (43.9%) |
| 65 to 74 Years | 0 (0.0%) | 4 (18.2%) |
| 75 Years and over | 0 (0.0%) | 2 (10.0%) |
| Total | 53 (25.0%) | 66 (22.1%) |
Income Above Poverty by Sex and Age in Elk Park
According to the poverty statistics in Elk Park, males aged under 5 years and females aged 5 years are the age groups that are most secure financially, with 100.0% of males and 100.0% of females in these age groups living above the poverty line.
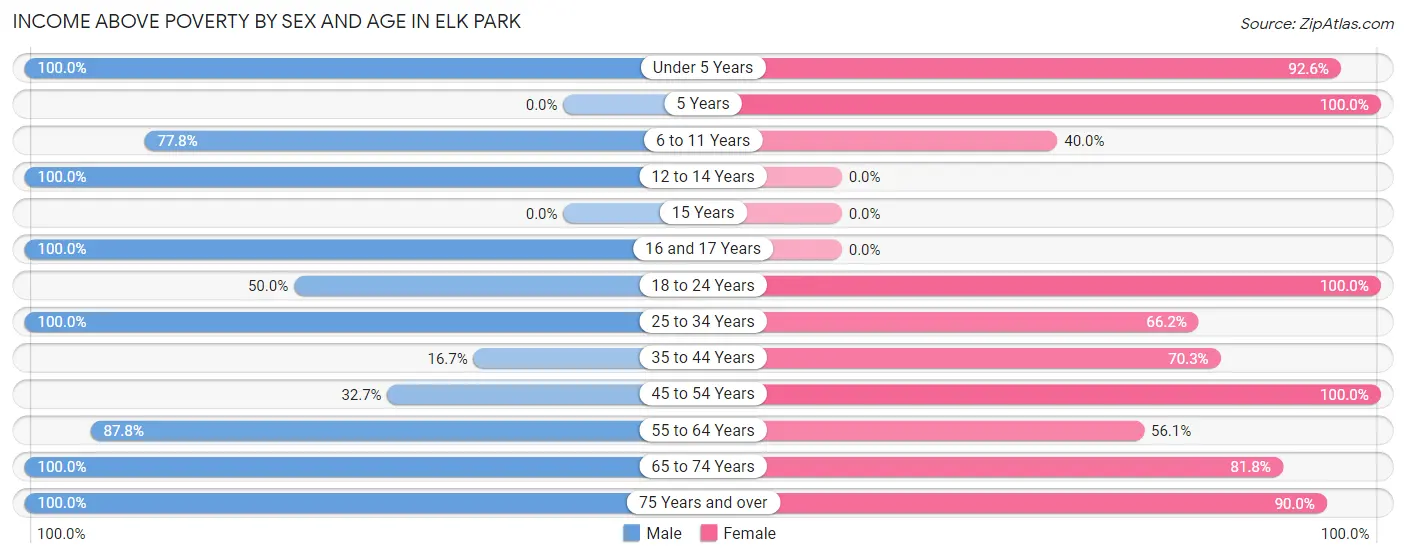
| Age Bracket | Male | Female |
| Under 5 Years | 2 (100.0%) | 25 (92.6%) |
| 5 Years | 0 (0.0%) | 12 (100.0%) |
| 6 to 11 Years | 7 (77.8%) | 2 (40.0%) |
| 12 to 14 Years | 6 (100.0%) | 0 (0.0%) |
| 15 Years | 0 (0.0%) | 0 (0.0%) |
| 16 and 17 Years | 2 (100.0%) | 0 (0.0%) |
| 18 to 24 Years | 2 (50.0%) | 15 (100.0%) |
| 25 to 34 Years | 40 (100.0%) | 51 (66.2%) |
| 35 to 44 Years | 2 (16.7%) | 26 (70.3%) |
| 45 to 54 Years | 16 (32.7%) | 43 (100.0%) |
| 55 to 64 Years | 43 (87.8%) | 23 (56.1%) |
| 65 to 74 Years | 17 (100.0%) | 18 (81.8%) |
| 75 Years and over | 22 (100.0%) | 18 (90.0%) |
| Total | 159 (75.0%) | 233 (77.9%) |
Income Below Poverty Among Married-Couple Families in Elk Park
The poverty statistics for married-couple families in Elk Park show that 1.1% or 1 of the total 92 families live below the poverty line. Families with no children have the highest poverty rate of 1.3%, comprising of 1 families. On the other hand, families with 1 or 2 children have the lowest poverty rate of 0.0%, which includes 0 families.
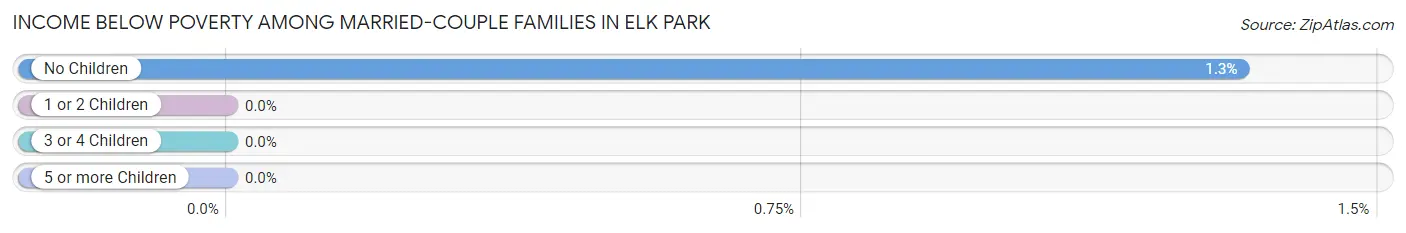
| Children | Above Poverty | Below Poverty |
| No Children | 75 (98.7%) | 1 (1.3%) |
| 1 or 2 Children | 13 (100.0%) | 0 (0.0%) |
| 3 or 4 Children | 3 (100.0%) | 0 (0.0%) |
| 5 or more Children | 0 (0.0%) | 0 (0.0%) |
| Total | 91 (98.9%) | 1 (1.1%) |
Income Below Poverty Among Single-Parent Households in Elk Park
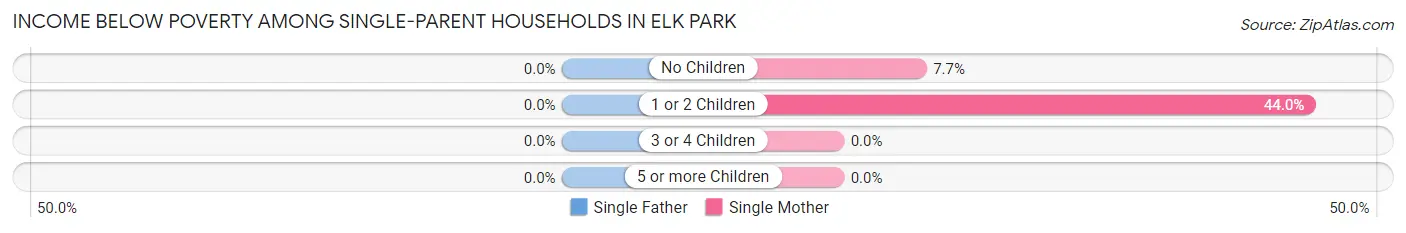
| Children | Single Father | Single Mother |
| No Children | 0 (0.0%) | 1 (7.7%) |
| 1 or 2 Children | 0 (0.0%) | 11 (44.0%) |
| 3 or 4 Children | 0 (0.0%) | 0 (0.0%) |
| 5 or more Children | 0 (0.0%) | 0 (0.0%) |
| Total | 0 (0.0%) | 12 (31.6%) |
Income Below Poverty Among Married-Couple vs Single-Parent Households in Elk Park
The poverty data for Elk Park shows that 1 of the married-couple family households (1.1%) and 12 of the single-parent households (28.6%) are living below the poverty level. Within the married-couple family households, those with no children have the highest poverty rate, with 1 households (1.3%) falling below the poverty line. Among the single-parent households, those with 1 or 2 children have the highest poverty rate, with 11 household (44.0%) living below poverty.
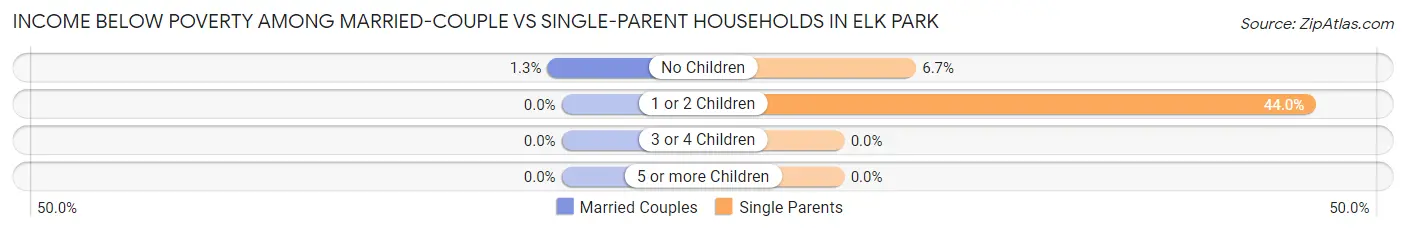
| Children | Married-Couple Families | Single-Parent Households |
| No Children | 1 (1.3%) | 1 (6.7%) |
| 1 or 2 Children | 0 (0.0%) | 11 (44.0%) |
| 3 or 4 Children | 0 (0.0%) | 0 (0.0%) |
| 5 or more Children | 0 (0.0%) | 0 (0.0%) |
| Total | 1 (1.1%) | 12 (28.6%) |
Employment Characteristics in Elk Park
Employment by Class of Employer in Elk Park
Among the 212 employed individuals in Elk Park, private company employees (139 | 65.6%), self-employed (not incorporated) (20 | 9.4%), and state government employees (20 | 9.4%) make up the most common classes of employment.
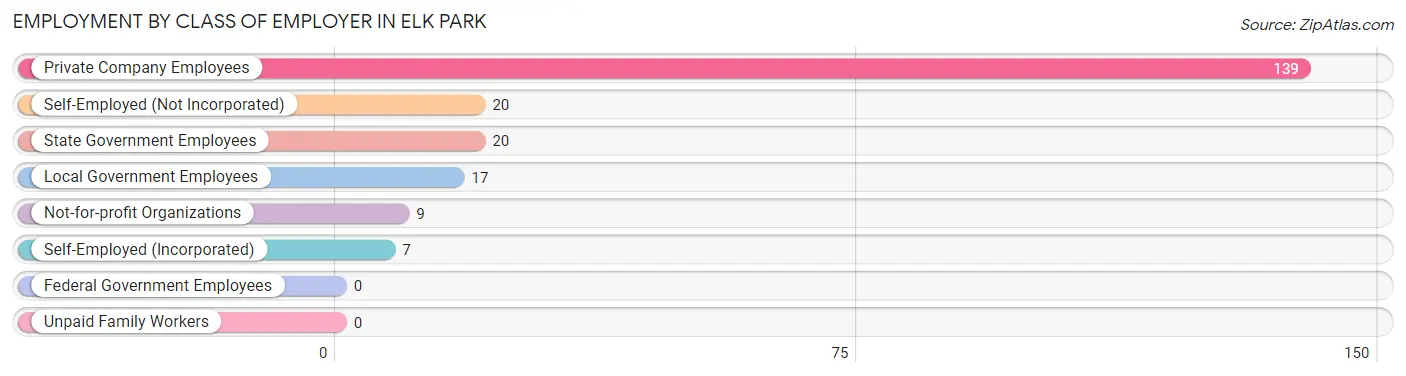
| Employer Class | # Employees | % Employees |
| Private Company Employees | 139 | 65.6% |
| Self-Employed (Incorporated) | 7 | 3.3% |
| Self-Employed (Not Incorporated) | 20 | 9.4% |
| Not-for-profit Organizations | 9 | 4.3% |
| Local Government Employees | 17 | 8.0% |
| State Government Employees | 20 | 9.4% |
| Federal Government Employees | 0 | 0.0% |
| Unpaid Family Workers | 0 | 0.0% |
| Total | 212 | 100.0% |
Employment Status by Age in Elk Park
According to the labor force statistics for Elk Park, out of the total population over 16 years of age (450), 51.8% or 233 individuals are in the labor force, with 7.3% or 17 of them unemployed. The age group with the highest labor force participation rate is 16 to 19 years, with 100.0% or 8 individuals in the labor force. Within the labor force, the 30 to 34 years age range has the highest percentage of unemployed individuals, with 38.9% or 7 of them being unemployed.
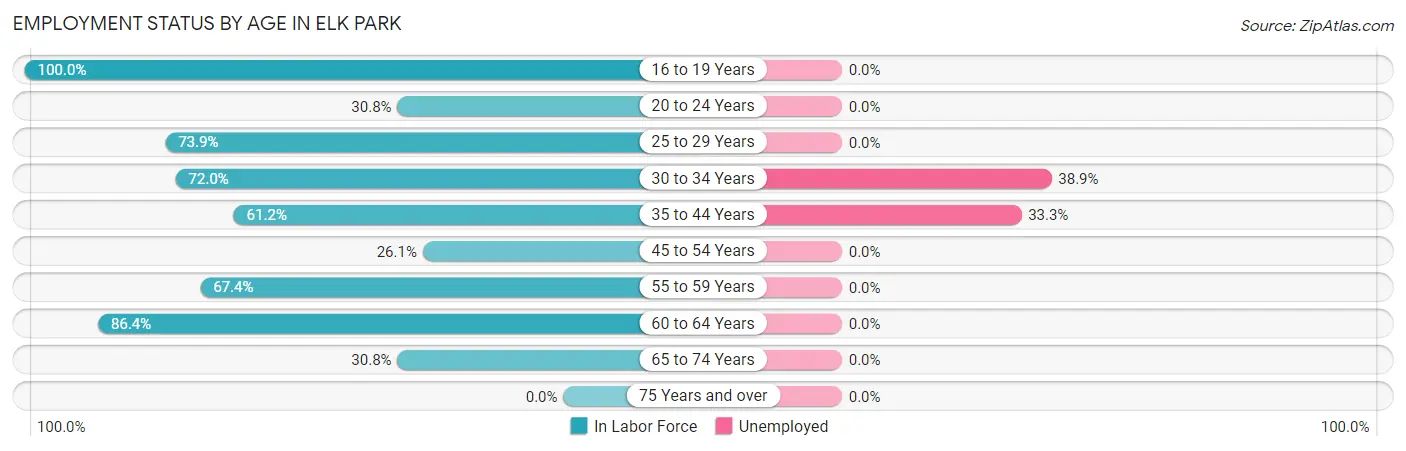
| Age Bracket | In Labor Force | Unemployed |
| 16 to 19 Years | 8 (100.0%) | 0 (0.0%) |
| 20 to 24 Years | 4 (30.8%) | 0 (0.0%) |
| 25 to 29 Years | 68 (73.9%) | 0 (0.0%) |
| 30 to 34 Years | 18 (72.0%) | 7 (38.9%) |
| 35 to 44 Years | 30 (61.2%) | 10 (33.3%) |
| 45 to 54 Years | 24 (26.1%) | 0 (0.0%) |
| 55 to 59 Years | 31 (67.4%) | 0 (0.0%) |
| 60 to 64 Years | 38 (86.4%) | 0 (0.0%) |
| 65 to 74 Years | 12 (30.8%) | 0 (0.0%) |
| 75 Years and over | 0 (0.0%) | 0 (0.0%) |
| Total | 233 (51.8%) | 17 (7.3%) |
Employment Status by Educational Attainment in Elk Park
According to labor force statistics for Elk Park, 60.1% of individuals (209) out of the total population between 25 and 64 years of age (348) are in the labor force, with 8.1% or 17 of them being unemployed. The group with the highest labor force participation rate are those with the educational attainment of less than high school, with 71.4% or 20 individuals in the labor force. Within the labor force, individuals with high school diploma education have the highest percentage of unemployment, with 13.7% or 10 of them being unemployed.
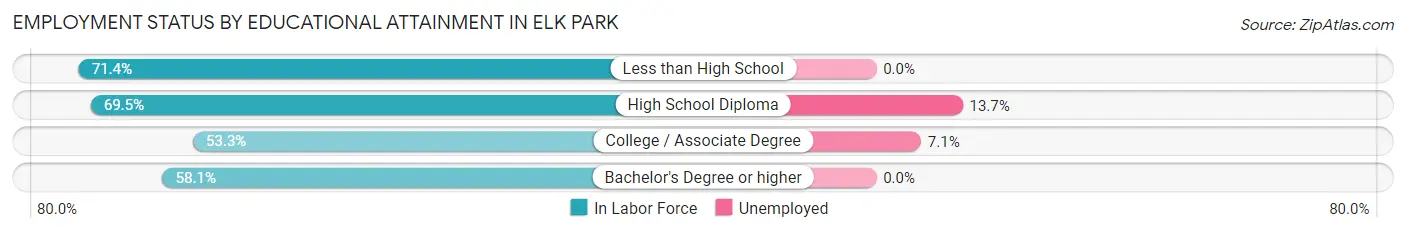
| Educational Attainment | In Labor Force | Unemployed |
| Less than High School | 20 (71.4%) | 0 (0.0%) |
| High School Diploma | 73 (69.5%) | 14 (13.7%) |
| College / Associate Degree | 98 (53.3%) | 13 (7.1%) |
| Bachelor's Degree or higher | 18 (58.1%) | 0 (0.0%) |
| Total | 209 (60.1%) | 28 (8.1%) |
Employment Occupations by Sex in Elk Park
Management, Business, Science and Arts Occupations
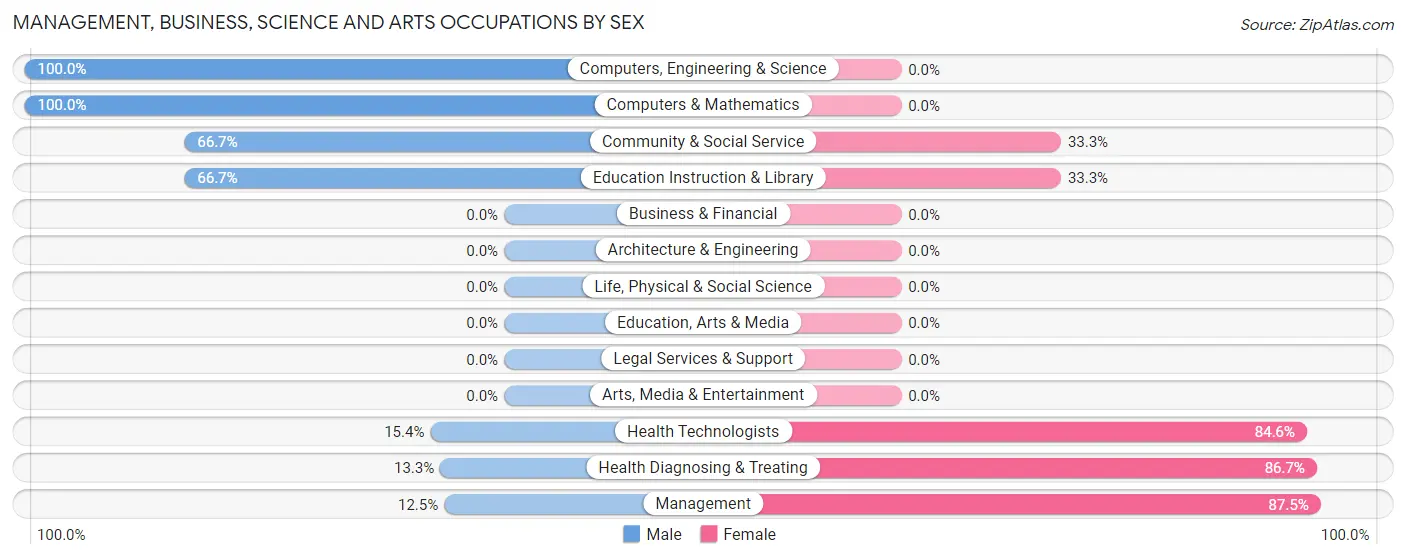
The most common Management, Business, Science and Arts occupations in Elk Park are Management (16 | 7.4%), Community & Social Service (15 | 6.9%), Education Instruction & Library (15 | 6.9%), Health Diagnosing & Treating (15 | 6.9%), and Health Technologists (13 | 6.0%).
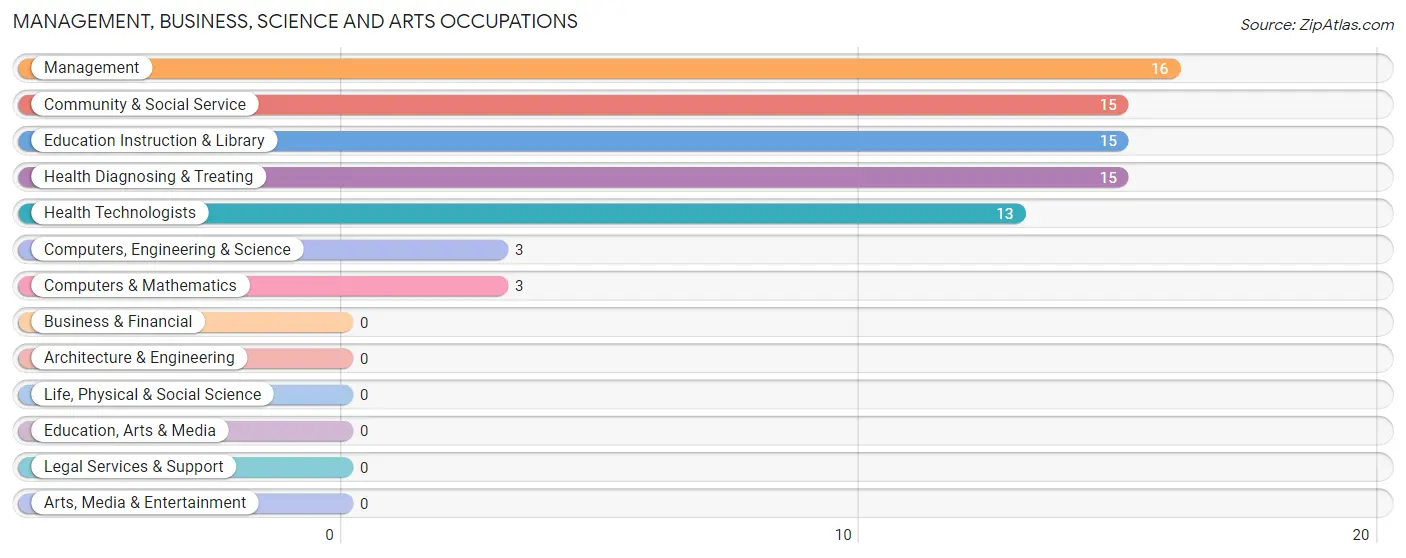
Management, Business, Science and Arts Occupations by Sex
Within the Management, Business, Science and Arts occupations in Elk Park, the most male-oriented occupations are Computers, Engineering & Science (100.0%), Computers & Mathematics (100.0%), and Community & Social Service (66.7%), while the most female-oriented occupations are Management (87.5%), Health Diagnosing & Treating (86.7%), and Health Technologists (84.6%).
| Occupation | Male | Female |
| Management | 2 (12.5%) | 14 (87.5%) |
| Business & Financial | 0 (0.0%) | 0 (0.0%) |
| Computers, Engineering & Science | 3 (100.0%) | 0 (0.0%) |
| Computers & Mathematics | 3 (100.0%) | 0 (0.0%) |
| Architecture & Engineering | 0 (0.0%) | 0 (0.0%) |
| Life, Physical & Social Science | 0 (0.0%) | 0 (0.0%) |
| Community & Social Service | 10 (66.7%) | 5 (33.3%) |
| Education, Arts & Media | 0 (0.0%) | 0 (0.0%) |
| Legal Services & Support | 0 (0.0%) | 0 (0.0%) |
| Education Instruction & Library | 10 (66.7%) | 5 (33.3%) |
| Arts, Media & Entertainment | 0 (0.0%) | 0 (0.0%) |
| Health Diagnosing & Treating | 2 (13.3%) | 13 (86.7%) |
| Health Technologists | 2 (15.4%) | 11 (84.6%) |
| Total (Category) | 17 (34.7%) | 32 (65.3%) |
| Total (Overall) | 98 (45.4%) | 118 (54.6%) |
Services Occupations
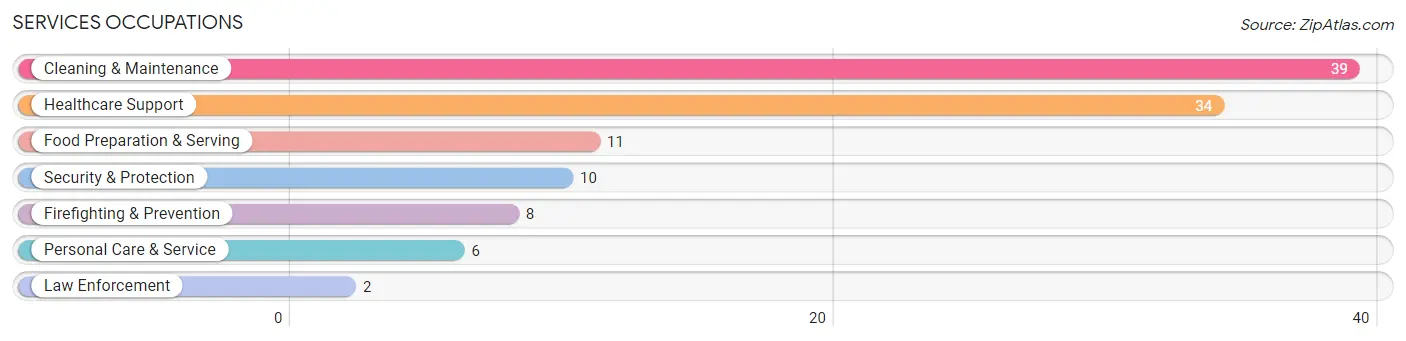
The most common Services occupations in Elk Park are Cleaning & Maintenance (39 | 18.1%), Healthcare Support (34 | 15.7%), Food Preparation & Serving (11 | 5.1%), Security & Protection (10 | 4.6%), and Firefighting & Prevention (8 | 3.7%).
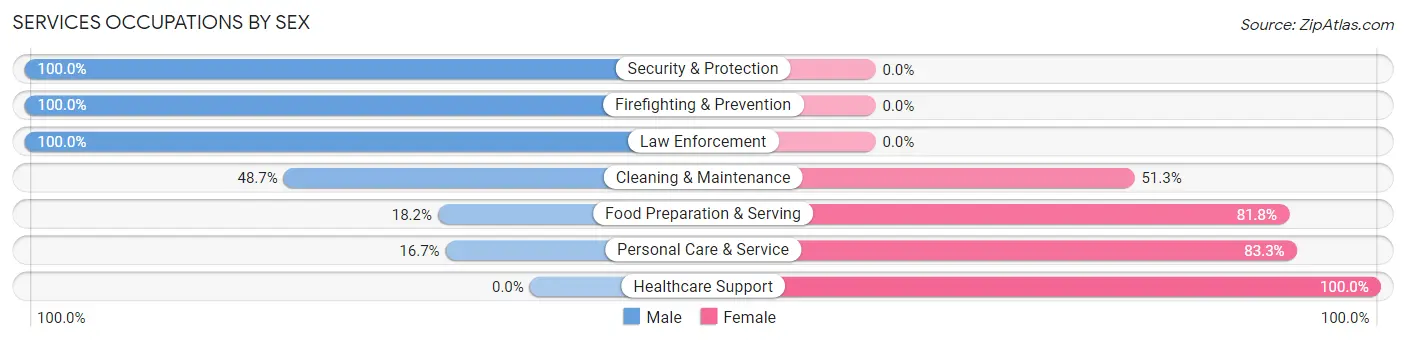
Services Occupations by Sex
Within the Services occupations in Elk Park, the most male-oriented occupations are Security & Protection (100.0%), Firefighting & Prevention (100.0%), and Law Enforcement (100.0%), while the most female-oriented occupations are Healthcare Support (100.0%), Personal Care & Service (83.3%), and Food Preparation & Serving (81.8%).
| Occupation | Male | Female |
| Healthcare Support | 0 (0.0%) | 34 (100.0%) |
| Security & Protection | 10 (100.0%) | 0 (0.0%) |
| Firefighting & Prevention | 8 (100.0%) | 0 (0.0%) |
| Law Enforcement | 2 (100.0%) | 0 (0.0%) |
| Food Preparation & Serving | 2 (18.2%) | 9 (81.8%) |
| Cleaning & Maintenance | 19 (48.7%) | 20 (51.3%) |
| Personal Care & Service | 1 (16.7%) | 5 (83.3%) |
| Total (Category) | 32 (32.0%) | 68 (68.0%) |
| Total (Overall) | 98 (45.4%) | 118 (54.6%) |
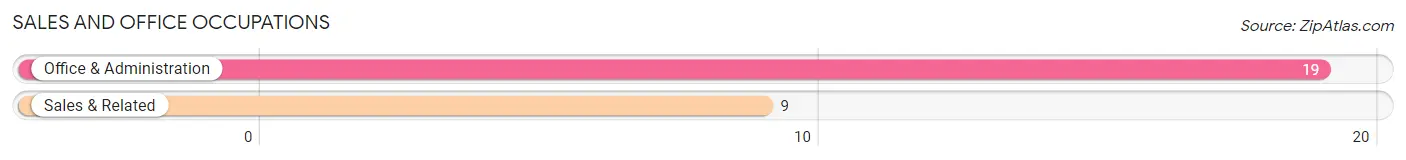
Sales and Office Occupations
The most common Sales and Office occupations in Elk Park are Office & Administration (19 | 8.8%), and Sales & Related (9 | 4.2%).
Sales and Office Occupations by Sex
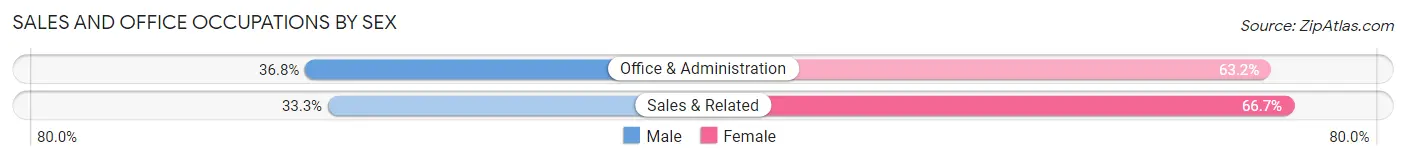
| Occupation | Male | Female |
| Sales & Related | 3 (33.3%) | 6 (66.7%) |
| Office & Administration | 7 (36.8%) | 12 (63.2%) |
| Total (Category) | 10 (35.7%) | 18 (64.3%) |
| Total (Overall) | 98 (45.4%) | 118 (54.6%) |
Natural Resources, Construction and Maintenance Occupations
The most common Natural Resources, Construction and Maintenance occupations in Elk Park are Construction & Extraction (13 | 6.0%), and Installation, Maintenance & Repair (4 | 1.8%).

Natural Resources, Construction and Maintenance Occupations by Sex

| Occupation | Male | Female |
| Farming, Fishing & Forestry | 0 (0.0%) | 0 (0.0%) |
| Construction & Extraction | 13 (100.0%) | 0 (0.0%) |
| Installation, Maintenance & Repair | 4 (100.0%) | 0 (0.0%) |
| Total (Category) | 17 (100.0%) | 0 (0.0%) |
| Total (Overall) | 98 (45.4%) | 118 (54.6%) |
Production, Transportation and Moving Occupations
The most common Production, Transportation and Moving occupations in Elk Park are Transportation (12 | 5.6%), Production (5 | 2.3%), and Material Moving (5 | 2.3%).
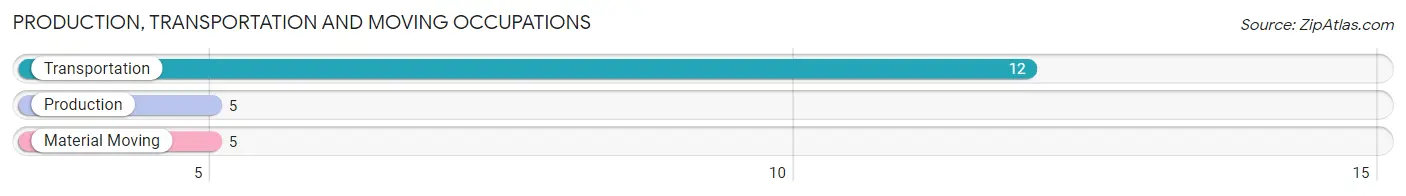
Production, Transportation and Moving Occupations by Sex
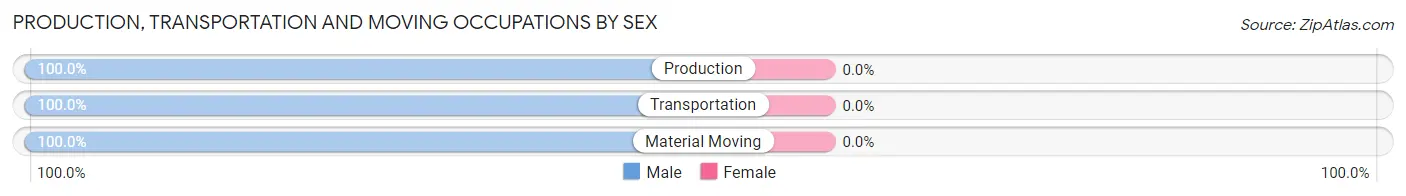
| Occupation | Male | Female |
| Production | 5 (100.0%) | 0 (0.0%) |
| Transportation | 12 (100.0%) | 0 (0.0%) |
| Material Moving | 5 (100.0%) | 0 (0.0%) |
| Total (Category) | 22 (100.0%) | 0 (0.0%) |
| Total (Overall) | 98 (45.4%) | 118 (54.6%) |
Employment Industries by Sex in Elk Park
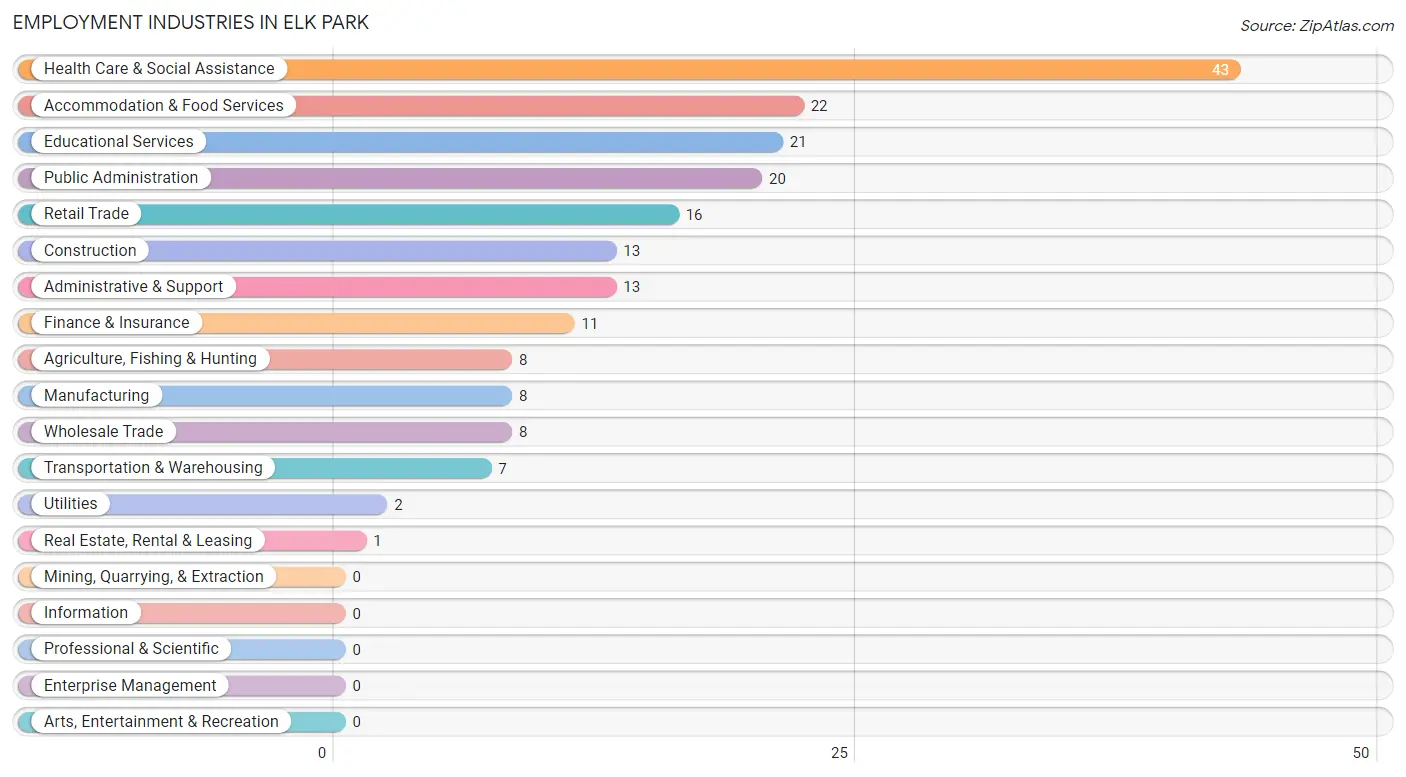
Employment Industries in Elk Park
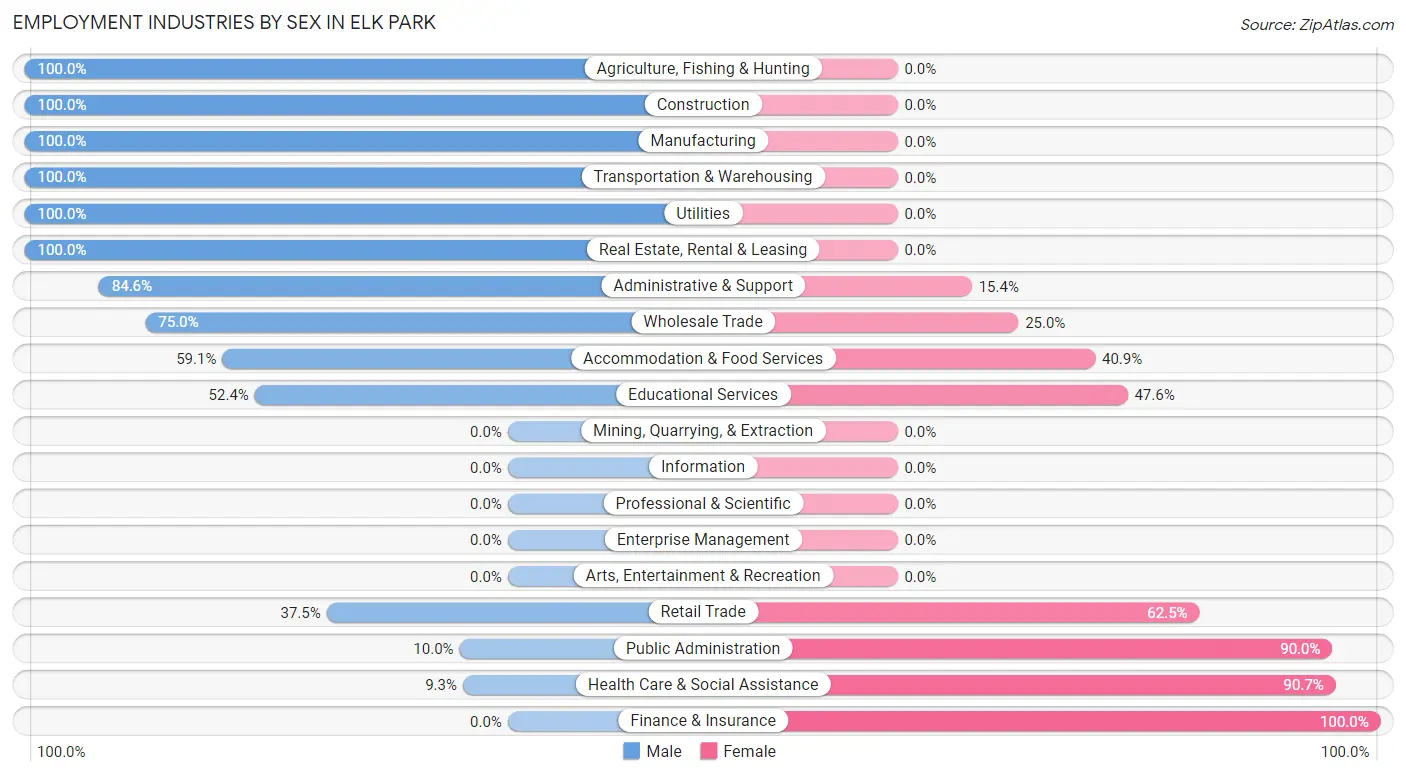
The major employment industries in Elk Park include Health Care & Social Assistance (43 | 19.9%), Accommodation & Food Services (22 | 10.2%), Educational Services (21 | 9.7%), Public Administration (20 | 9.3%), and Retail Trade (16 | 7.4%).
Employment Industries by Sex in Elk Park
The Elk Park industries that see more men than women are Agriculture, Fishing & Hunting (100.0%), Construction (100.0%), and Manufacturing (100.0%), whereas the industries that tend to have a higher number of women are Finance & Insurance (100.0%), Health Care & Social Assistance (90.7%), and Public Administration (90.0%).
| Industry | Male | Female |
| Agriculture, Fishing & Hunting | 8 (100.0%) | 0 (0.0%) |
| Mining, Quarrying, & Extraction | 0 (0.0%) | 0 (0.0%) |
| Construction | 13 (100.0%) | 0 (0.0%) |
| Manufacturing | 8 (100.0%) | 0 (0.0%) |
| Wholesale Trade | 6 (75.0%) | 2 (25.0%) |
| Retail Trade | 6 (37.5%) | 10 (62.5%) |
| Transportation & Warehousing | 7 (100.0%) | 0 (0.0%) |
| Utilities | 2 (100.0%) | 0 (0.0%) |
| Information | 0 (0.0%) | 0 (0.0%) |
| Finance & Insurance | 0 (0.0%) | 11 (100.0%) |
| Real Estate, Rental & Leasing | 1 (100.0%) | 0 (0.0%) |
| Professional & Scientific | 0 (0.0%) | 0 (0.0%) |
| Enterprise Management | 0 (0.0%) | 0 (0.0%) |
| Administrative & Support | 11 (84.6%) | 2 (15.4%) |
| Educational Services | 11 (52.4%) | 10 (47.6%) |
| Health Care & Social Assistance | 4 (9.3%) | 39 (90.7%) |
| Arts, Entertainment & Recreation | 0 (0.0%) | 0 (0.0%) |
| Accommodation & Food Services | 13 (59.1%) | 9 (40.9%) |
| Public Administration | 2 (10.0%) | 18 (90.0%) |
| Total | 98 (45.4%) | 118 (54.6%) |
Education in Elk Park
School Enrollment in Elk Park
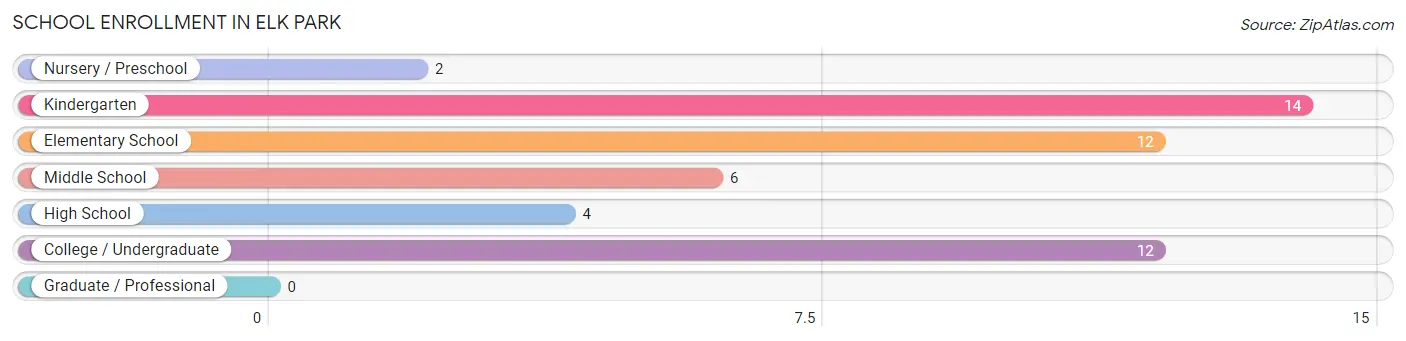
The most common levels of schooling among the 50 students in Elk Park are kindergarten (14 | 28.0%), elementary school (12 | 24.0%), and college / undergraduate (12 | 24.0%).
| School Level | # Students | % Students |
| Nursery / Preschool | 2 | 4.0% |
| Kindergarten | 14 | 28.0% |
| Elementary School | 12 | 24.0% |
| Middle School | 6 | 12.0% |
| High School | 4 | 8.0% |
| College / Undergraduate | 12 | 24.0% |
| Graduate / Professional | 0 | 0.0% |
| Total | 50 | 100.0% |
School Enrollment by Age by Funding Source in Elk Park
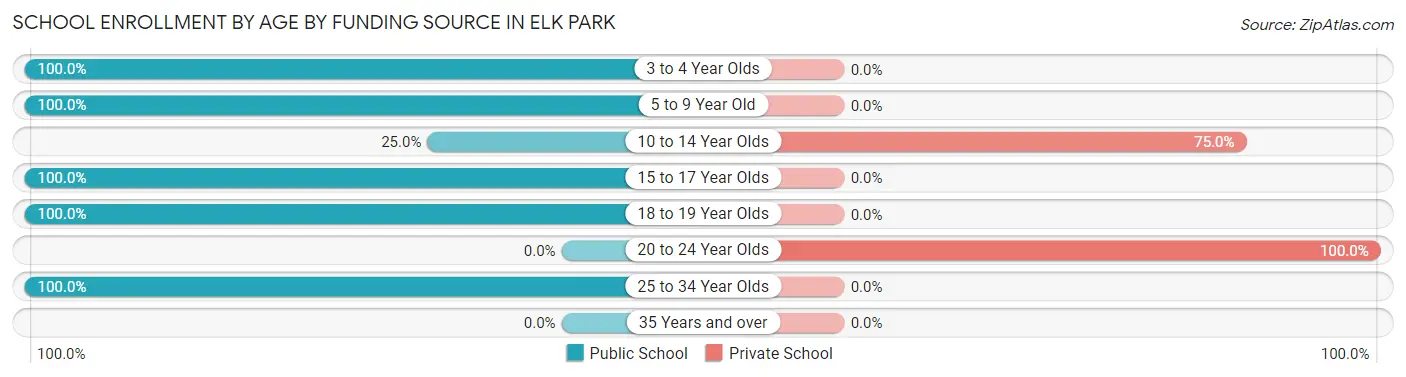
Out of a total of 50 students who are enrolled in schools in Elk Park, 15 (30.0%) attend a private institution, while the remaining 35 (70.0%) are enrolled in public schools. The age group of 20 to 24 year olds has the highest likelihood of being enrolled in private schools, with 9 (100.0% in the age bracket) enrolled. Conversely, the age group of 3 to 4 year olds has the lowest likelihood of being enrolled in a private school, with 2 (100.0% in the age bracket) attending a public institution.
| Age Bracket | Public School | Private School |
| 3 to 4 Year Olds | 2 (100.0%) | 0 (0.0%) |
| 5 to 9 Year Old | 24 (100.0%) | 0 (0.0%) |
| 10 to 14 Year Olds | 2 (25.0%) | 6 (75.0%) |
| 15 to 17 Year Olds | 2 (100.0%) | 0 (0.0%) |
| 18 to 19 Year Olds | 2 (100.0%) | 0 (0.0%) |
| 20 to 24 Year Olds | 0 (0.0%) | 9 (100.0%) |
| 25 to 34 Year Olds | 3 (100.0%) | 0 (0.0%) |
| 35 Years and over | 0 (0.0%) | 0 (0.0%) |
| Total | 35 (70.0%) | 15 (30.0%) |
Educational Attainment by Field of Study in Elk Park
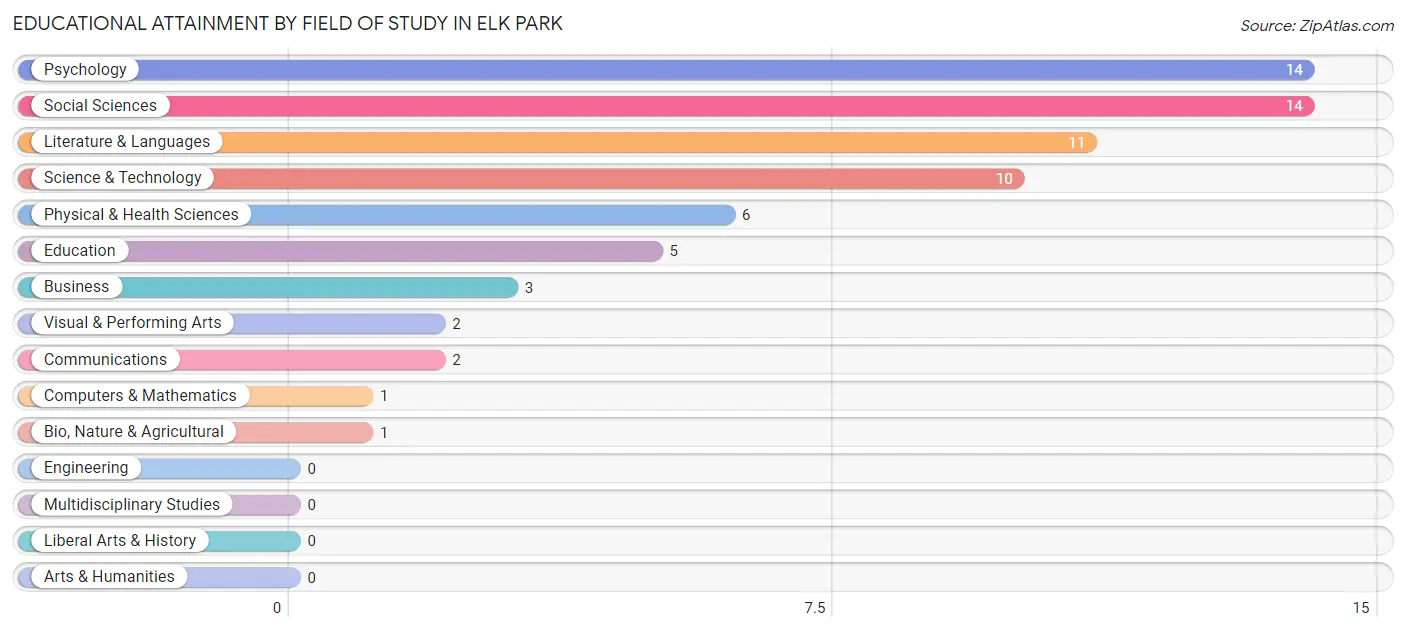
Psychology (14 | 20.3%), social sciences (14 | 20.3%), literature & languages (11 | 15.9%), science & technology (10 | 14.5%), and physical & health sciences (6 | 8.7%) are the most common fields of study among 69 individuals in Elk Park who have obtained a bachelor's degree or higher.
| Field of Study | # Graduates | % Graduates |
| Computers & Mathematics | 1 | 1.5% |
| Bio, Nature & Agricultural | 1 | 1.5% |
| Physical & Health Sciences | 6 | 8.7% |
| Psychology | 14 | 20.3% |
| Social Sciences | 14 | 20.3% |
| Engineering | 0 | 0.0% |
| Multidisciplinary Studies | 0 | 0.0% |
| Science & Technology | 10 | 14.5% |
| Business | 3 | 4.3% |
| Education | 5 | 7.2% |
| Literature & Languages | 11 | 15.9% |
| Liberal Arts & History | 0 | 0.0% |
| Visual & Performing Arts | 2 | 2.9% |
| Communications | 2 | 2.9% |
| Arts & Humanities | 0 | 0.0% |
| Total | 69 | 100.0% |
Transportation & Commute in Elk Park
Vehicle Availability by Sex in Elk Park
The most prevalent vehicle ownership categories in Elk Park are males with 2 vehicles (41, accounting for 41.8%) and females with 2 vehicles (29, making up 36.0%).
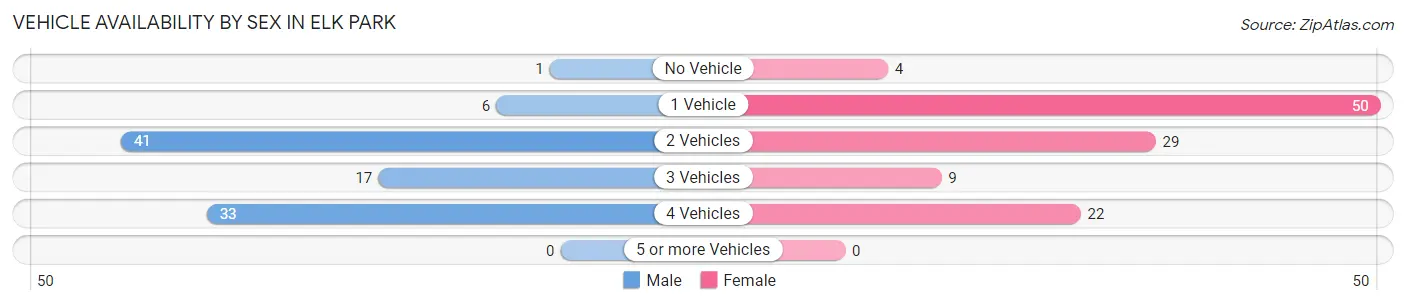
| Vehicles Available | Male | Female |
| No Vehicle | 1 (1.0%) | 4 (3.5%) |
| 1 Vehicle | 6 (6.1%) | 50 (43.9%) |
| 2 Vehicles | 41 (41.8%) | 29 (25.4%) |
| 3 Vehicles | 17 (17.3%) | 9 (7.9%) |
| 4 Vehicles | 33 (33.7%) | 22 (19.3%) |
| 5 or more Vehicles | 0 (0.0%) | 0 (0.0%) |
| Total | 98 (100.0%) | 114 (100.0%) |
Commute Time in Elk Park
The most frequently occuring commute durations in Elk Park are 15 to 19 minutes (33 commuters, 16.7%), 25 to 29 minutes (32 commuters, 16.2%), and 10 to 14 minutes (30 commuters, 15.1%).
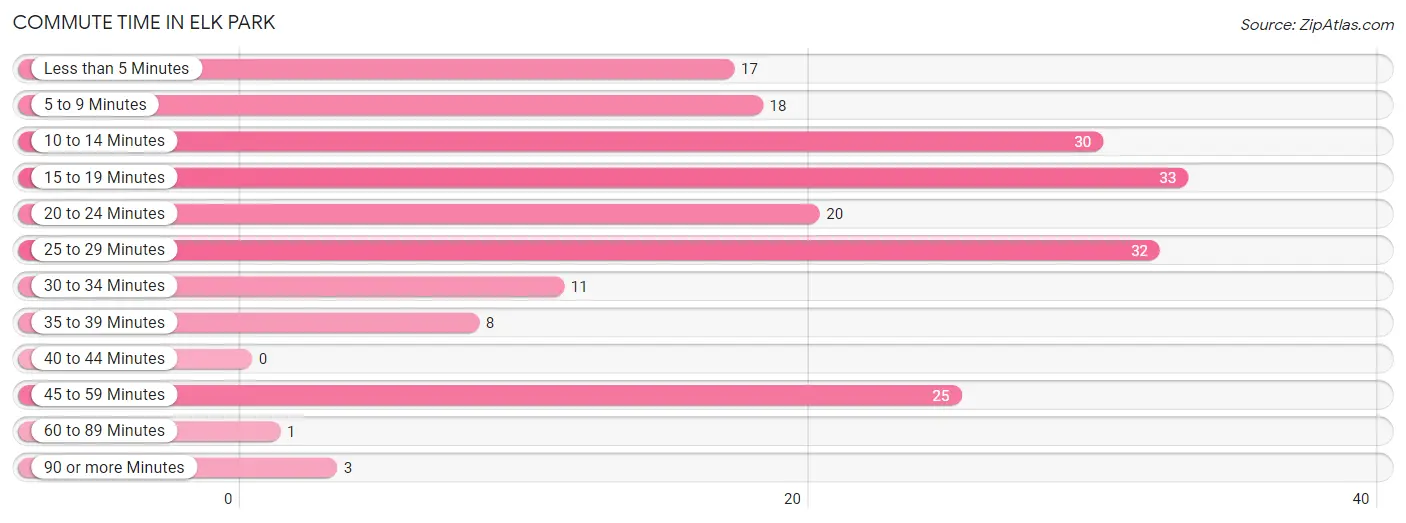
| Commute Time | # Commuters | % Commuters |
| Less than 5 Minutes | 17 | 8.6% |
| 5 to 9 Minutes | 18 | 9.1% |
| 10 to 14 Minutes | 30 | 15.1% |
| 15 to 19 Minutes | 33 | 16.7% |
| 20 to 24 Minutes | 20 | 10.1% |
| 25 to 29 Minutes | 32 | 16.2% |
| 30 to 34 Minutes | 11 | 5.6% |
| 35 to 39 Minutes | 8 | 4.0% |
| 40 to 44 Minutes | 0 | 0.0% |
| 45 to 59 Minutes | 25 | 12.6% |
| 60 to 89 Minutes | 1 | 0.5% |
| 90 or more Minutes | 3 | 1.5% |
Commute Time by Sex in Elk Park
The most common commute times in Elk Park are 10 to 14 minutes (22 commuters, 24.2%) for males and 25 to 29 minutes (26 commuters, 24.3%) for females.
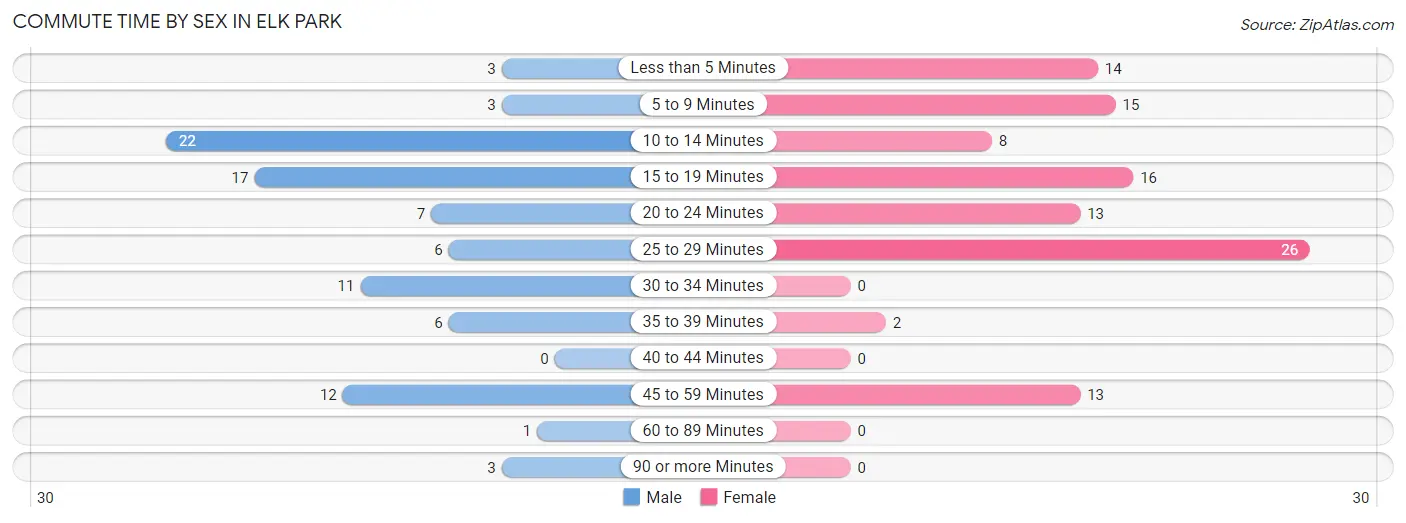
| Commute Time | Male | Female |
| Less than 5 Minutes | 3 (3.3%) | 14 (13.1%) |
| 5 to 9 Minutes | 3 (3.3%) | 15 (14.0%) |
| 10 to 14 Minutes | 22 (24.2%) | 8 (7.5%) |
| 15 to 19 Minutes | 17 (18.7%) | 16 (14.9%) |
| 20 to 24 Minutes | 7 (7.7%) | 13 (12.1%) |
| 25 to 29 Minutes | 6 (6.6%) | 26 (24.3%) |
| 30 to 34 Minutes | 11 (12.1%) | 0 (0.0%) |
| 35 to 39 Minutes | 6 (6.6%) | 2 (1.9%) |
| 40 to 44 Minutes | 0 (0.0%) | 0 (0.0%) |
| 45 to 59 Minutes | 12 (13.2%) | 13 (12.1%) |
| 60 to 89 Minutes | 1 (1.1%) | 0 (0.0%) |
| 90 or more Minutes | 3 (3.3%) | 0 (0.0%) |
Time of Departure to Work by Sex in Elk Park
The most frequent times of departure to work in Elk Park are 7:30 AM to 7:59 AM (24, 26.4%) for males and 7:00 AM to 7:29 AM (28, 26.2%) for females.
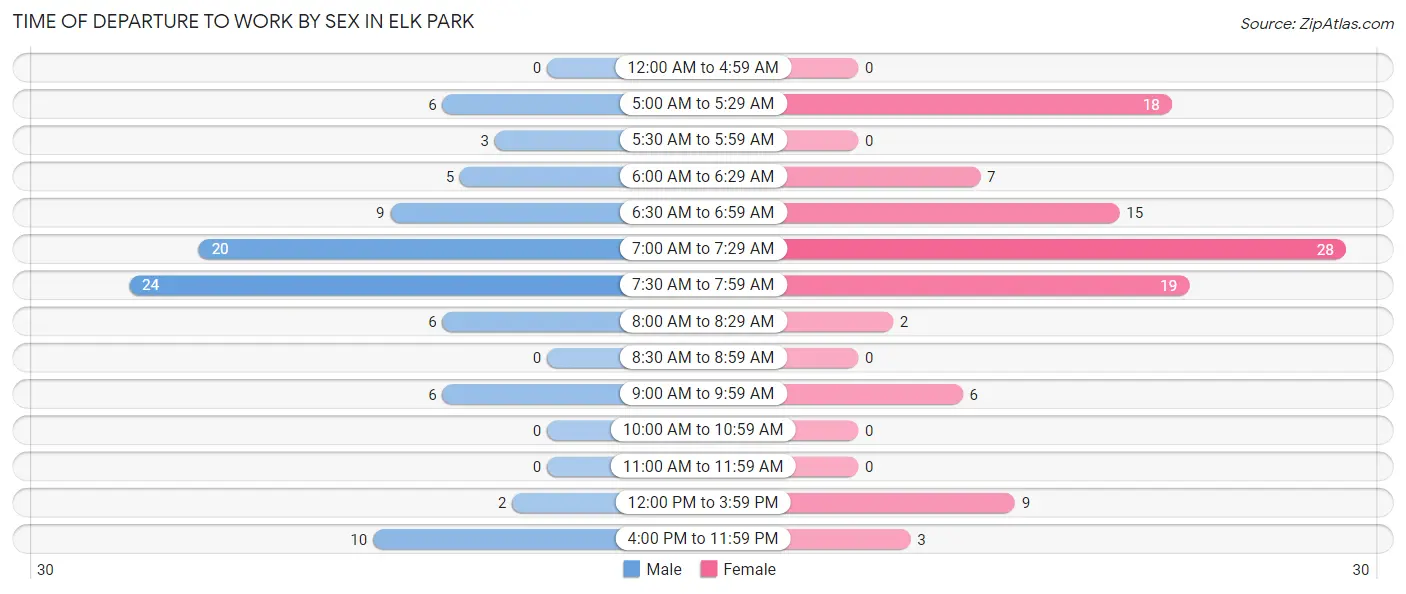
| Time of Departure | Male | Female |
| 12:00 AM to 4:59 AM | 0 (0.0%) | 0 (0.0%) |
| 5:00 AM to 5:29 AM | 6 (6.6%) | 18 (16.8%) |
| 5:30 AM to 5:59 AM | 3 (3.3%) | 0 (0.0%) |
| 6:00 AM to 6:29 AM | 5 (5.5%) | 7 (6.5%) |
| 6:30 AM to 6:59 AM | 9 (9.9%) | 15 (14.0%) |
| 7:00 AM to 7:29 AM | 20 (22.0%) | 28 (26.2%) |
| 7:30 AM to 7:59 AM | 24 (26.4%) | 19 (17.8%) |
| 8:00 AM to 8:29 AM | 6 (6.6%) | 2 (1.9%) |
| 8:30 AM to 8:59 AM | 0 (0.0%) | 0 (0.0%) |
| 9:00 AM to 9:59 AM | 6 (6.6%) | 6 (5.6%) |
| 10:00 AM to 10:59 AM | 0 (0.0%) | 0 (0.0%) |
| 11:00 AM to 11:59 AM | 0 (0.0%) | 0 (0.0%) |
| 12:00 PM to 3:59 PM | 2 (2.2%) | 9 (8.4%) |
| 4:00 PM to 11:59 PM | 10 (11.0%) | 3 (2.8%) |
| Total | 91 (100.0%) | 107 (100.0%) |
Housing Occupancy in Elk Park
Occupancy by Ownership in Elk Park
Of the total 260 dwellings in Elk Park, owner-occupied units account for 138 (53.1%), while renter-occupied units make up 122 (46.9%).
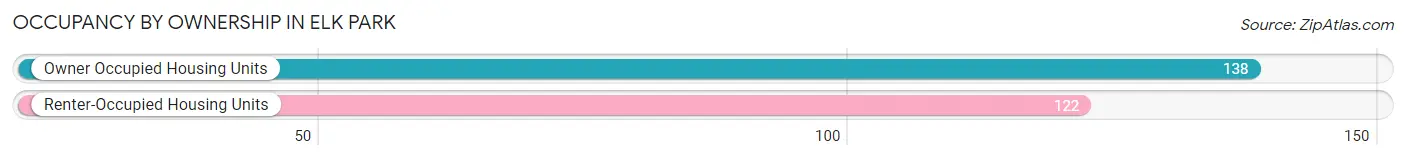
| Occupancy | # Housing Units | % Housing Units |
| Owner Occupied Housing Units | 138 | 53.1% |
| Renter-Occupied Housing Units | 122 | 46.9% |
| Total Occupied Housing Units | 260 | 100.0% |
Occupancy by Household Size in Elk Park
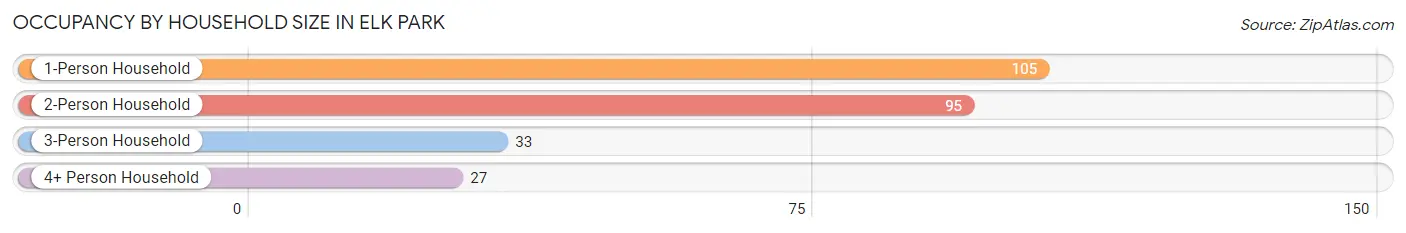
| Household Size | # Housing Units | % Housing Units |
| 1-Person Household | 105 | 40.4% |
| 2-Person Household | 95 | 36.5% |
| 3-Person Household | 33 | 12.7% |
| 4+ Person Household | 27 | 10.4% |
| Total Housing Units | 260 | 100.0% |
Occupancy by Ownership by Household Size in Elk Park
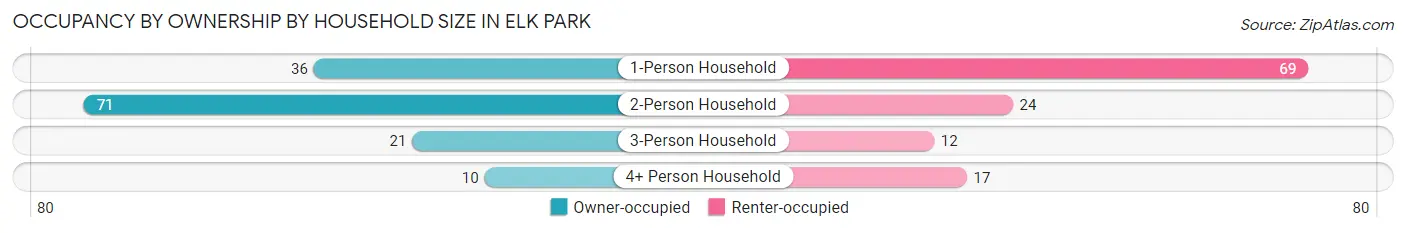
| Household Size | Owner-occupied | Renter-occupied |
| 1-Person Household | 36 (34.3%) | 69 (65.7%) |
| 2-Person Household | 71 (74.7%) | 24 (25.3%) |
| 3-Person Household | 21 (63.6%) | 12 (36.4%) |
| 4+ Person Household | 10 (37.0%) | 17 (63.0%) |
| Total Housing Units | 138 (53.1%) | 122 (46.9%) |
Occupancy by Educational Attainment in Elk Park
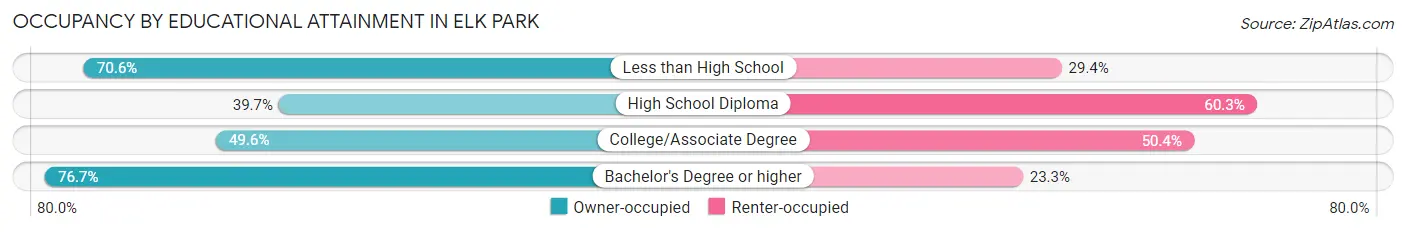
| Household Size | Owner-occupied | Renter-occupied |
| Less than High School | 12 (70.6%) | 5 (29.4%) |
| High School Diploma | 25 (39.7%) | 38 (60.3%) |
| College/Associate Degree | 68 (49.6%) | 69 (50.4%) |
| Bachelor's Degree or higher | 33 (76.7%) | 10 (23.3%) |
Occupancy by Age of Householder in Elk Park
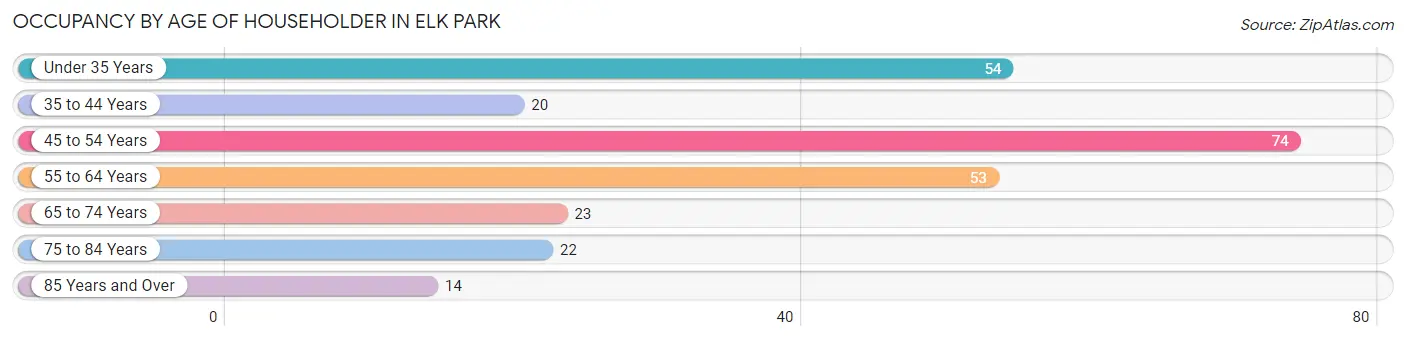
| Age Bracket | # Households | % Households |
| Under 35 Years | 54 | 20.8% |
| 35 to 44 Years | 20 | 7.7% |
| 45 to 54 Years | 74 | 28.5% |
| 55 to 64 Years | 53 | 20.4% |
| 65 to 74 Years | 23 | 8.8% |
| 75 to 84 Years | 22 | 8.5% |
| 85 Years and Over | 14 | 5.4% |
| Total | 260 | 100.0% |
Housing Finances in Elk Park
Median Income by Occupancy in Elk Park
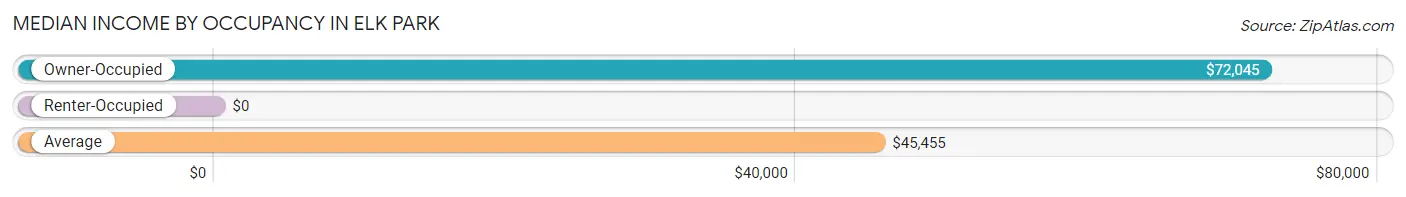
| Occupancy Type | # Households | Median Income |
| Owner-Occupied | 138 (53.1%) | $72,045 |
| Renter-Occupied | 122 (46.9%) | $0 |
| Average | 260 (100.0%) | $45,455 |
Occupancy by Householder Income Bracket in Elk Park
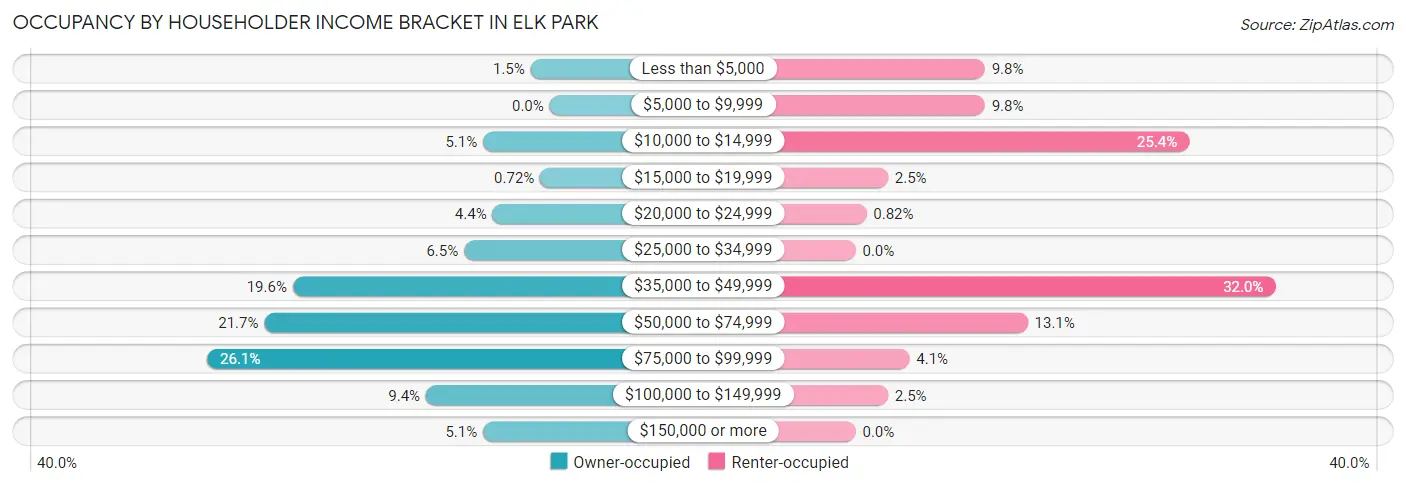
| Income Bracket | Owner-occupied | Renter-occupied |
| Less than $5,000 | 2 (1.5%) | 12 (9.8%) |
| $5,000 to $9,999 | 0 (0.0%) | 12 (9.8%) |
| $10,000 to $14,999 | 7 (5.1%) | 31 (25.4%) |
| $15,000 to $19,999 | 1 (0.7%) | 3 (2.5%) |
| $20,000 to $24,999 | 6 (4.3%) | 1 (0.8%) |
| $25,000 to $34,999 | 9 (6.5%) | 0 (0.0%) |
| $35,000 to $49,999 | 27 (19.6%) | 39 (32.0%) |
| $50,000 to $74,999 | 30 (21.7%) | 16 (13.1%) |
| $75,000 to $99,999 | 36 (26.1%) | 5 (4.1%) |
| $100,000 to $149,999 | 13 (9.4%) | 3 (2.5%) |
| $150,000 or more | 7 (5.1%) | 0 (0.0%) |
| Total | 138 (100.0%) | 122 (100.0%) |
Monthly Housing Cost Tiers in Elk Park
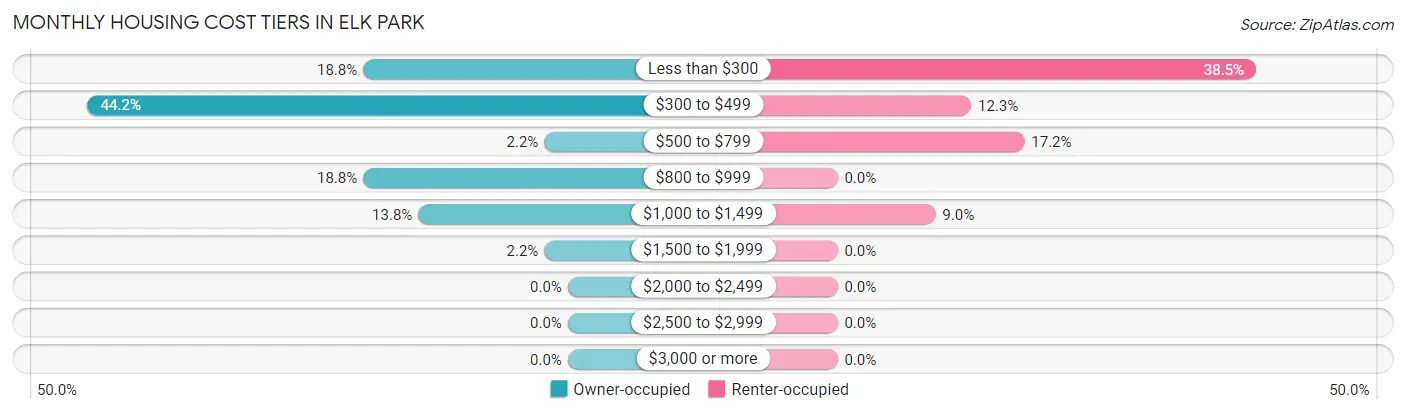
| Monthly Cost | Owner-occupied | Renter-occupied |
| Less than $300 | 26 (18.8%) | 47 (38.5%) |
| $300 to $499 | 61 (44.2%) | 15 (12.3%) |
| $500 to $799 | 3 (2.2%) | 21 (17.2%) |
| $800 to $999 | 26 (18.8%) | 0 (0.0%) |
| $1,000 to $1,499 | 19 (13.8%) | 11 (9.0%) |
| $1,500 to $1,999 | 3 (2.2%) | 0 (0.0%) |
| $2,000 to $2,499 | 0 (0.0%) | 0 (0.0%) |
| $2,500 to $2,999 | 0 (0.0%) | 0 (0.0%) |
| $3,000 or more | 0 (0.0%) | 0 (0.0%) |
| Total | 138 (100.0%) | 122 (100.0%) |
Physical Housing Characteristics in Elk Park
Housing Structures in Elk Park
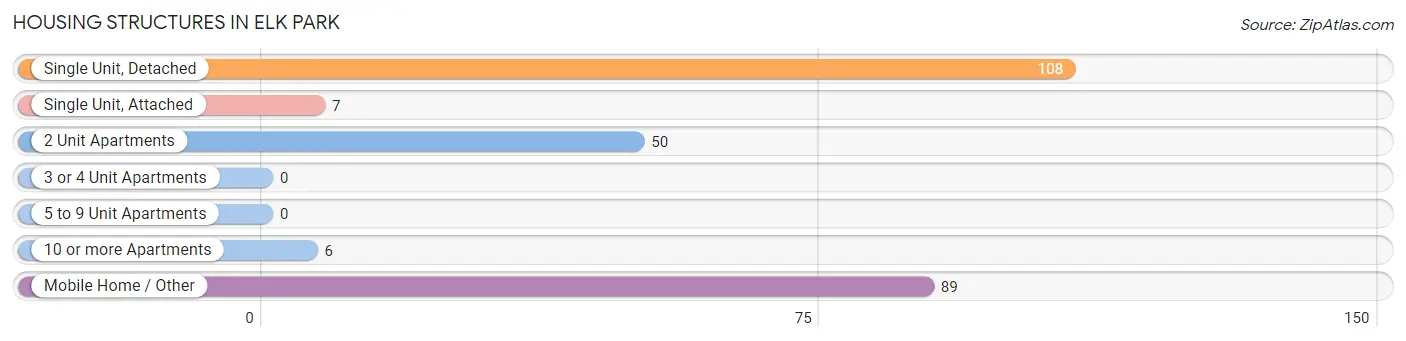
| Structure Type | # Housing Units | % Housing Units |
| Single Unit, Detached | 108 | 41.5% |
| Single Unit, Attached | 7 | 2.7% |
| 2 Unit Apartments | 50 | 19.2% |
| 3 or 4 Unit Apartments | 0 | 0.0% |
| 5 to 9 Unit Apartments | 0 | 0.0% |
| 10 or more Apartments | 6 | 2.3% |
| Mobile Home / Other | 89 | 34.2% |
| Total | 260 | 100.0% |
Housing Structures by Occupancy in Elk Park
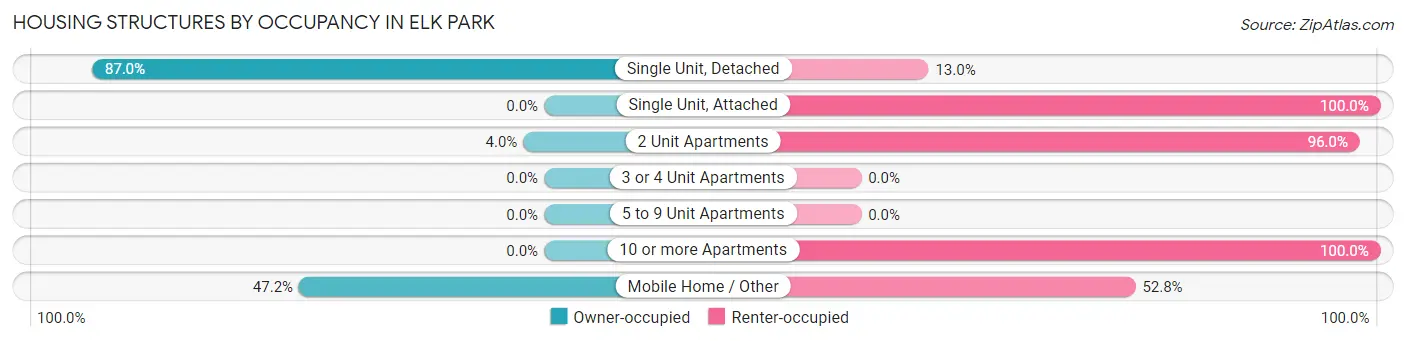
| Structure Type | Owner-occupied | Renter-occupied |
| Single Unit, Detached | 94 (87.0%) | 14 (13.0%) |
| Single Unit, Attached | 0 (0.0%) | 7 (100.0%) |
| 2 Unit Apartments | 2 (4.0%) | 48 (96.0%) |
| 3 or 4 Unit Apartments | 0 (0.0%) | 0 (0.0%) |
| 5 to 9 Unit Apartments | 0 (0.0%) | 0 (0.0%) |
| 10 or more Apartments | 0 (0.0%) | 6 (100.0%) |
| Mobile Home / Other | 42 (47.2%) | 47 (52.8%) |
| Total | 138 (53.1%) | 122 (46.9%) |
Housing Structures by Number of Rooms in Elk Park
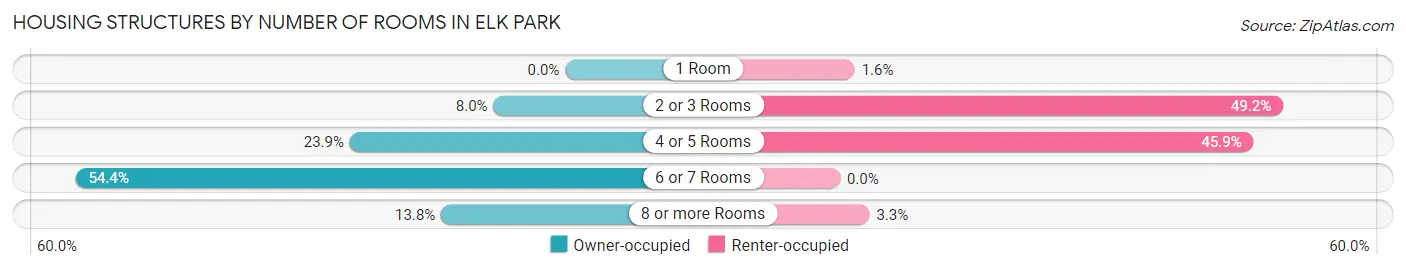
| Number of Rooms | Owner-occupied | Renter-occupied |
| 1 Room | 0 (0.0%) | 2 (1.6%) |
| 2 or 3 Rooms | 11 (8.0%) | 60 (49.2%) |
| 4 or 5 Rooms | 33 (23.9%) | 56 (45.9%) |
| 6 or 7 Rooms | 75 (54.3%) | 0 (0.0%) |
| 8 or more Rooms | 19 (13.8%) | 4 (3.3%) |
| Total | 138 (100.0%) | 122 (100.0%) |
Housing Structure by Heating Type in Elk Park
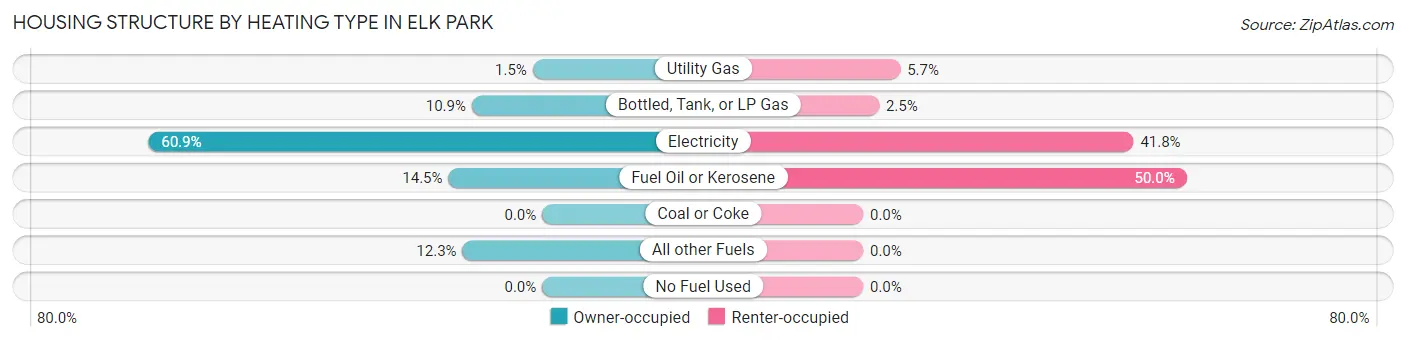
| Heating Type | Owner-occupied | Renter-occupied |
| Utility Gas | 2 (1.5%) | 7 (5.7%) |
| Bottled, Tank, or LP Gas | 15 (10.9%) | 3 (2.5%) |
| Electricity | 84 (60.9%) | 51 (41.8%) |
| Fuel Oil or Kerosene | 20 (14.5%) | 61 (50.0%) |
| Coal or Coke | 0 (0.0%) | 0 (0.0%) |
| All other Fuels | 17 (12.3%) | 0 (0.0%) |
| No Fuel Used | 0 (0.0%) | 0 (0.0%) |
| Total | 138 (100.0%) | 122 (100.0%) |
Household Vehicle Usage in Elk Park
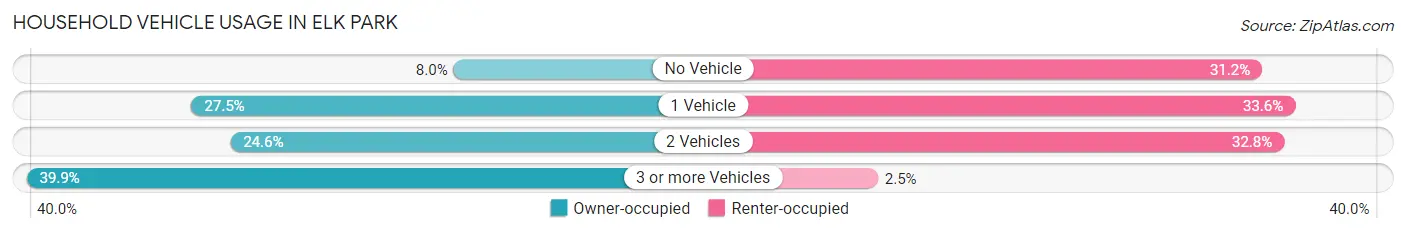
| Vehicles per Household | Owner-occupied | Renter-occupied |
| No Vehicle | 11 (8.0%) | 38 (31.1%) |
| 1 Vehicle | 38 (27.5%) | 41 (33.6%) |
| 2 Vehicles | 34 (24.6%) | 40 (32.8%) |
| 3 or more Vehicles | 55 (39.9%) | 3 (2.5%) |
| Total | 138 (100.0%) | 122 (100.0%) |
Real Estate & Mortgages in Elk Park
Real Estate and Mortgage Overview in Elk Park
| Characteristic | Without Mortgage | With Mortgage |
| Housing Units | 91 | 47 |
| Median Property Value | $145,500 | $110,400 |
| Median Household Income | $44,821 | $0 |
| Monthly Housing Costs | $379 | $0 |
| Real Estate Taxes | $537 | $2 |
Property Value by Mortgage Status in Elk Park
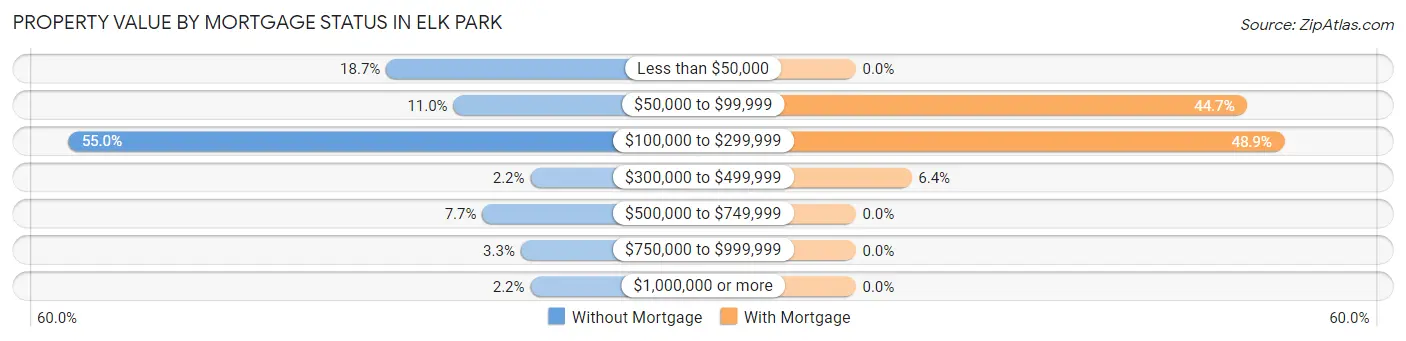
| Property Value | Without Mortgage | With Mortgage |
| Less than $50,000 | 17 (18.7%) | 0 (0.0%) |
| $50,000 to $99,999 | 10 (11.0%) | 21 (44.7%) |
| $100,000 to $299,999 | 50 (54.9%) | 23 (48.9%) |
| $300,000 to $499,999 | 2 (2.2%) | 3 (6.4%) |
| $500,000 to $749,999 | 7 (7.7%) | 0 (0.0%) |
| $750,000 to $999,999 | 3 (3.3%) | 0 (0.0%) |
| $1,000,000 or more | 2 (2.2%) | 0 (0.0%) |
| Total | 91 (100.0%) | 47 (100.0%) |
Household Income by Mortgage Status in Elk Park
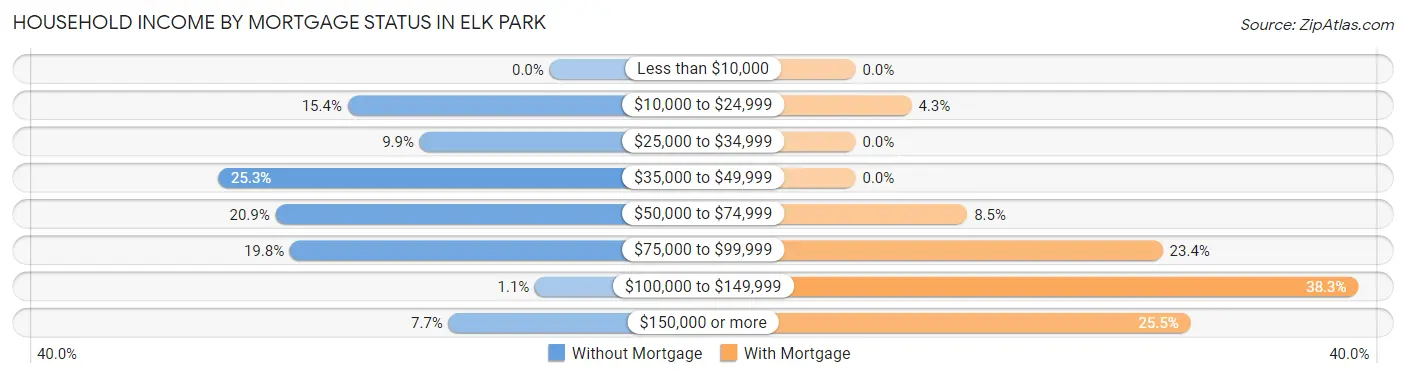
| Household Income | Without Mortgage | With Mortgage |
| Less than $10,000 | 0 (0.0%) | 0 (0.0%) |
| $10,000 to $24,999 | 14 (15.4%) | 2 (4.3%) |
| $25,000 to $34,999 | 9 (9.9%) | 0 (0.0%) |
| $35,000 to $49,999 | 23 (25.3%) | 0 (0.0%) |
| $50,000 to $74,999 | 19 (20.9%) | 4 (8.5%) |
| $75,000 to $99,999 | 18 (19.8%) | 11 (23.4%) |
| $100,000 to $149,999 | 1 (1.1%) | 18 (38.3%) |
| $150,000 or more | 7 (7.7%) | 12 (25.5%) |
| Total | 91 (100.0%) | 47 (100.0%) |
Property Value to Household Income Ratio in Elk Park
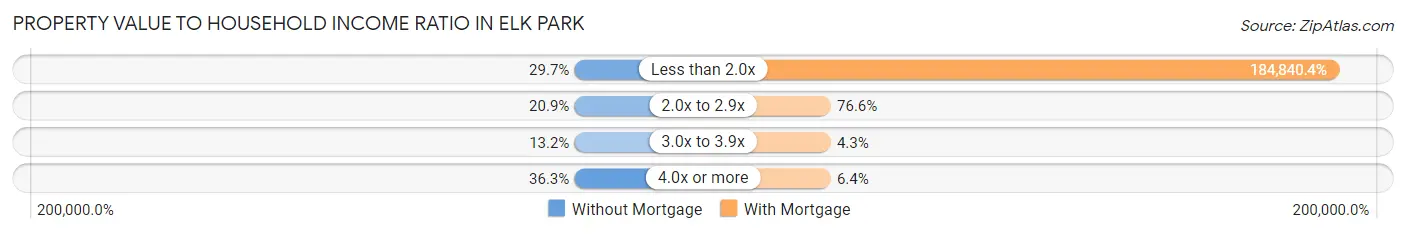
| Value-to-Income Ratio | Without Mortgage | With Mortgage |
| Less than 2.0x | 27 (29.7%) | 86,875 (184,840.4%) |
| 2.0x to 2.9x | 19 (20.9%) | 36 (76.6%) |
| 3.0x to 3.9x | 12 (13.2%) | 2 (4.3%) |
| 4.0x or more | 33 (36.3%) | 3 (6.4%) |
| Total | 91 (100.0%) | 47 (100.0%) |
Real Estate Taxes by Mortgage Status in Elk Park
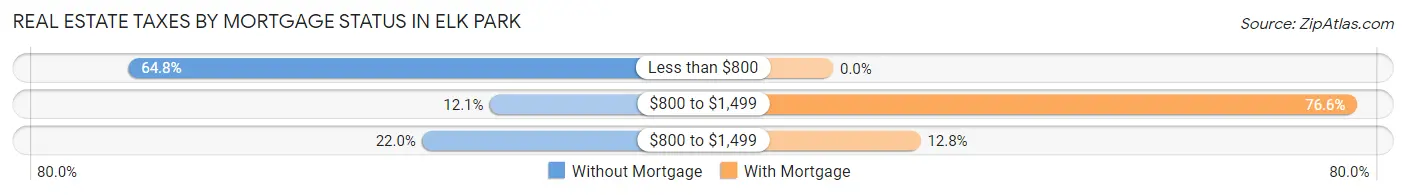
| Property Taxes | Without Mortgage | With Mortgage |
| Less than $800 | 59 (64.8%) | 0 (0.0%) |
| $800 to $1,499 | 11 (12.1%) | 36 (76.6%) |
| $800 to $1,499 | 20 (22.0%) | 6 (12.8%) |
| Total | 91 (100.0%) | 47 (100.0%) |
Health & Disability in Elk Park
Health Insurance Coverage by Age in Elk Park
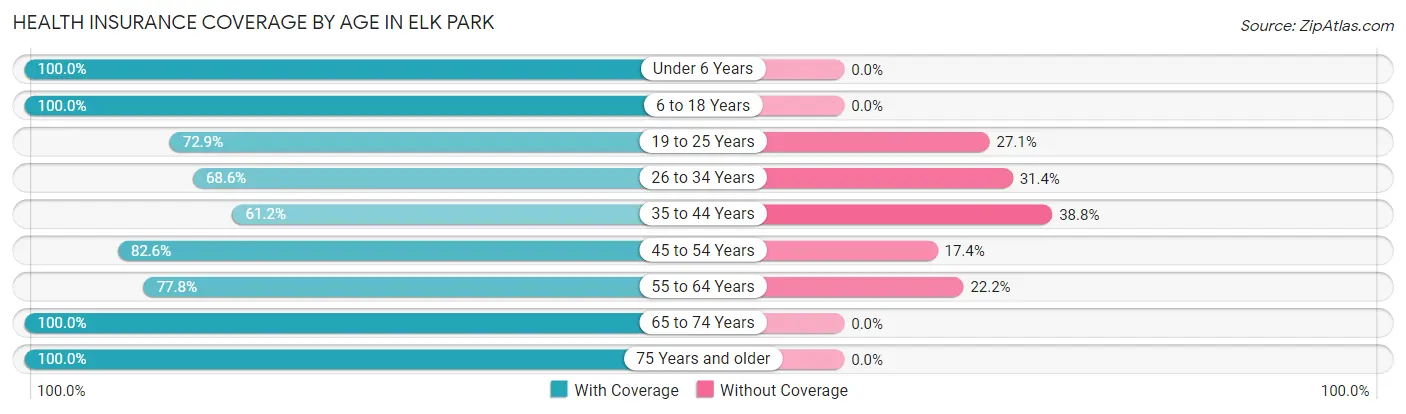
| Age Bracket | With Coverage | Without Coverage |
| Under 6 Years | 41 (100.0%) | 0 (0.0%) |
| 6 to 18 Years | 24 (100.0%) | 0 (0.0%) |
| 19 to 25 Years | 35 (72.9%) | 13 (27.1%) |
| 26 to 34 Years | 59 (68.6%) | 27 (31.4%) |
| 35 to 44 Years | 30 (61.2%) | 19 (38.8%) |
| 45 to 54 Years | 76 (82.6%) | 16 (17.4%) |
| 55 to 64 Years | 70 (77.8%) | 20 (22.2%) |
| 65 to 74 Years | 39 (100.0%) | 0 (0.0%) |
| 75 Years and older | 42 (100.0%) | 0 (0.0%) |
| Total | 416 (81.4%) | 95 (18.6%) |
Health Insurance Coverage by Citizenship Status in Elk Park

| Citizenship Status | With Coverage | Without Coverage |
| Native Born | 41 (100.0%) | 0 (0.0%) |
| Foreign Born, Citizen | 24 (100.0%) | 0 (0.0%) |
| Foreign Born, not a Citizen | 35 (72.9%) | 13 (27.1%) |
Health Insurance Coverage by Household Income in Elk Park
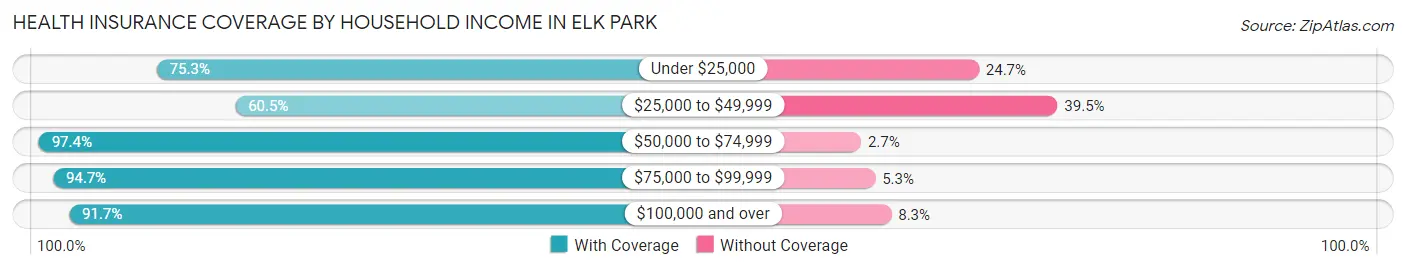
| Household Income | With Coverage | Without Coverage |
| Under $25,000 | 73 (75.3%) | 24 (24.7%) |
| $25,000 to $49,999 | 89 (60.5%) | 58 (39.5%) |
| $50,000 to $74,999 | 110 (97.4%) | 3 (2.6%) |
| $75,000 to $99,999 | 89 (94.7%) | 5 (5.3%) |
| $100,000 and over | 55 (91.7%) | 5 (8.3%) |
Public vs Private Health Insurance Coverage by Age in Elk Park
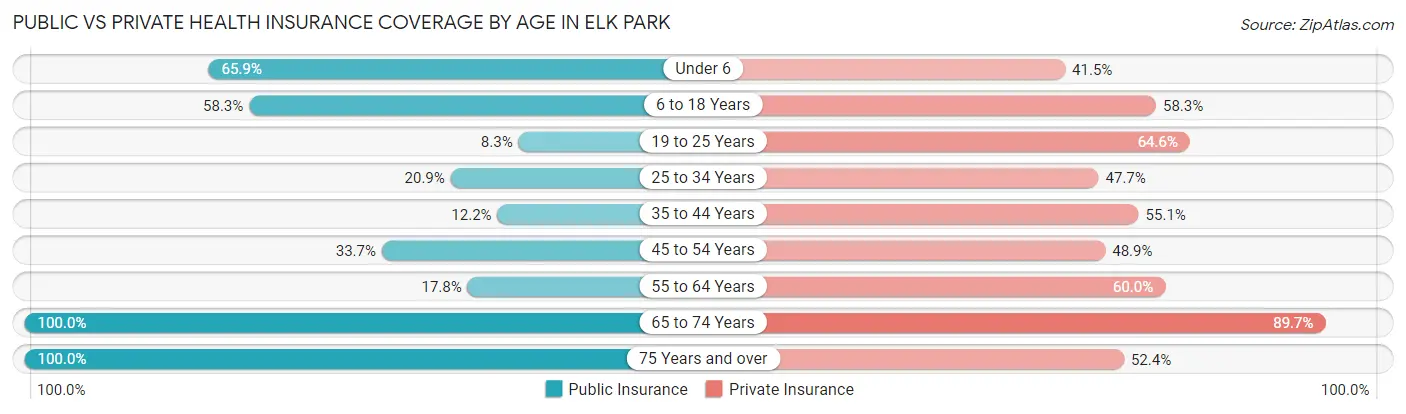
| Age Bracket | Public Insurance | Private Insurance |
| Under 6 | 27 (65.8%) | 17 (41.5%) |
| 6 to 18 Years | 14 (58.3%) | 14 (58.3%) |
| 19 to 25 Years | 4 (8.3%) | 31 (64.6%) |
| 25 to 34 Years | 18 (20.9%) | 41 (47.7%) |
| 35 to 44 Years | 6 (12.2%) | 27 (55.1%) |
| 45 to 54 Years | 31 (33.7%) | 45 (48.9%) |
| 55 to 64 Years | 16 (17.8%) | 54 (60.0%) |
| 65 to 74 Years | 39 (100.0%) | 35 (89.7%) |
| 75 Years and over | 42 (100.0%) | 22 (52.4%) |
| Total | 197 (38.6%) | 286 (56.0%) |
Disability Status by Sex by Age in Elk Park
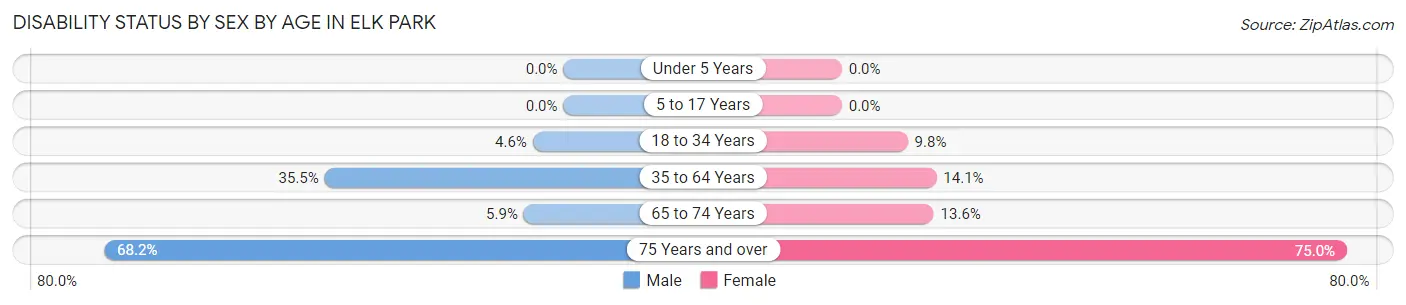
| Age Bracket | Male | Female |
| Under 5 Years | 0 (0.0%) | 0 (0.0%) |
| 5 to 17 Years | 0 (0.0%) | 0 (0.0%) |
| 18 to 34 Years | 2 (4.5%) | 9 (9.8%) |
| 35 to 64 Years | 39 (35.4%) | 17 (14.1%) |
| 65 to 74 Years | 1 (5.9%) | 3 (13.6%) |
| 75 Years and over | 15 (68.2%) | 15 (75.0%) |
Disability Class by Sex by Age in Elk Park
Disability Class: Hearing Difficulty
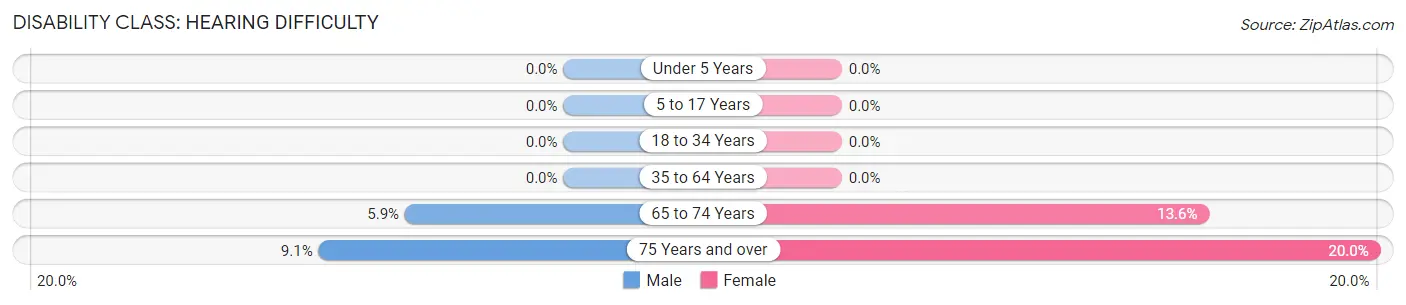
| Age Bracket | Male | Female |
| Under 5 Years | 0 (0.0%) | 0 (0.0%) |
| 5 to 17 Years | 0 (0.0%) | 0 (0.0%) |
| 18 to 34 Years | 0 (0.0%) | 0 (0.0%) |
| 35 to 64 Years | 0 (0.0%) | 0 (0.0%) |
| 65 to 74 Years | 1 (5.9%) | 3 (13.6%) |
| 75 Years and over | 2 (9.1%) | 4 (20.0%) |
Disability Class: Vision Difficulty
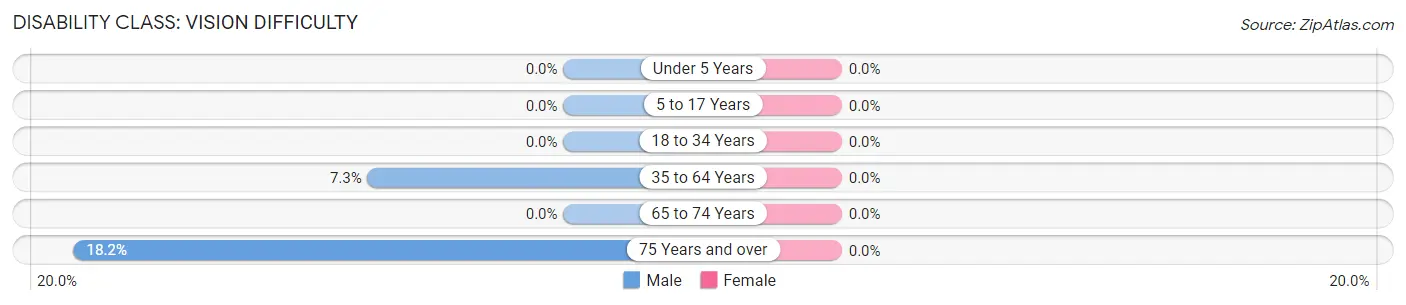
| Age Bracket | Male | Female |
| Under 5 Years | 0 (0.0%) | 0 (0.0%) |
| 5 to 17 Years | 0 (0.0%) | 0 (0.0%) |
| 18 to 34 Years | 0 (0.0%) | 0 (0.0%) |
| 35 to 64 Years | 8 (7.3%) | 0 (0.0%) |
| 65 to 74 Years | 0 (0.0%) | 0 (0.0%) |
| 75 Years and over | 4 (18.2%) | 0 (0.0%) |
Disability Class: Cognitive Difficulty
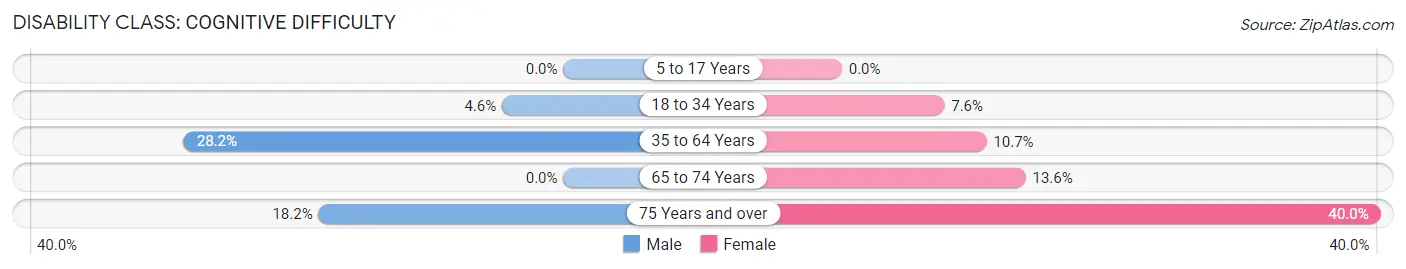
| Age Bracket | Male | Female |
| 5 to 17 Years | 0 (0.0%) | 0 (0.0%) |
| 18 to 34 Years | 2 (4.5%) | 7 (7.6%) |
| 35 to 64 Years | 31 (28.2%) | 13 (10.7%) |
| 65 to 74 Years | 0 (0.0%) | 3 (13.6%) |
| 75 Years and over | 4 (18.2%) | 8 (40.0%) |
Disability Class: Ambulatory Difficulty
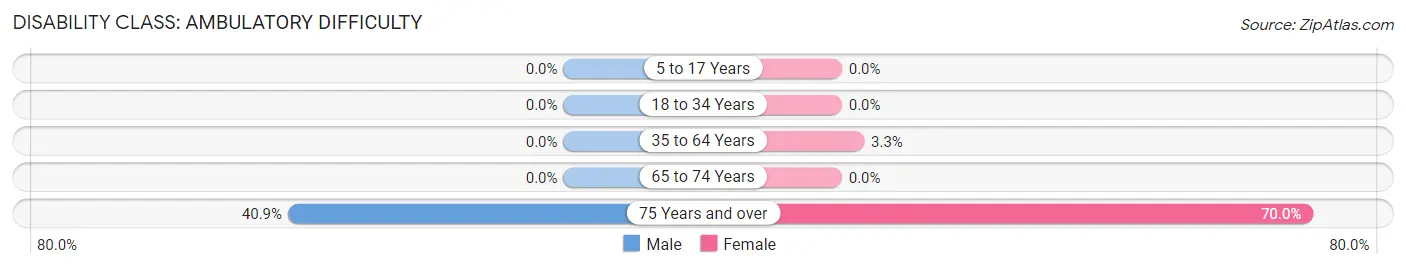
| Age Bracket | Male | Female |
| 5 to 17 Years | 0 (0.0%) | 0 (0.0%) |
| 18 to 34 Years | 0 (0.0%) | 0 (0.0%) |
| 35 to 64 Years | 0 (0.0%) | 4 (3.3%) |
| 65 to 74 Years | 0 (0.0%) | 0 (0.0%) |
| 75 Years and over | 9 (40.9%) | 14 (70.0%) |
Disability Class: Self-Care Difficulty
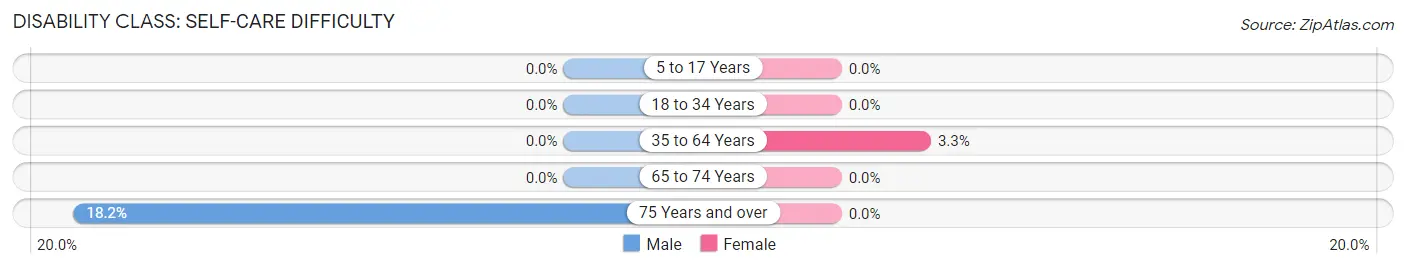
| Age Bracket | Male | Female |
| 5 to 17 Years | 0 (0.0%) | 0 (0.0%) |
| 18 to 34 Years | 0 (0.0%) | 0 (0.0%) |
| 35 to 64 Years | 0 (0.0%) | 4 (3.3%) |
| 65 to 74 Years | 0 (0.0%) | 0 (0.0%) |
| 75 Years and over | 4 (18.2%) | 0 (0.0%) |
Technology Access in Elk Park
Computing Device Access in Elk Park
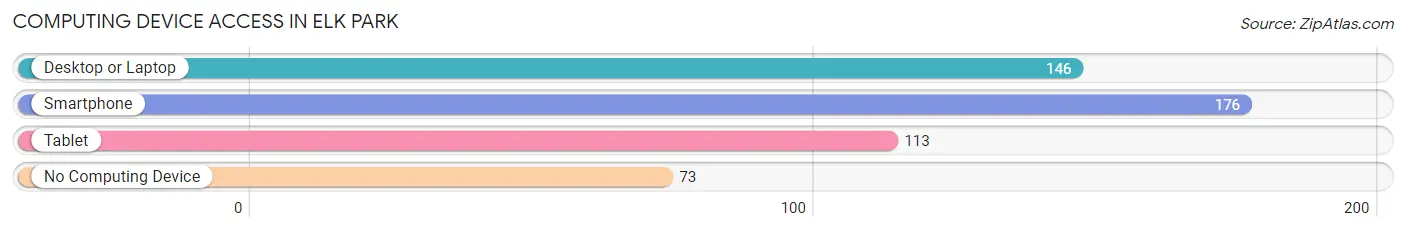
| Device Type | # Households | % Households |
| Desktop or Laptop | 146 | 56.1% |
| Smartphone | 176 | 67.7% |
| Tablet | 113 | 43.5% |
| No Computing Device | 73 | 28.1% |
| Total | 260 | 100.0% |
Internet Access in Elk Park
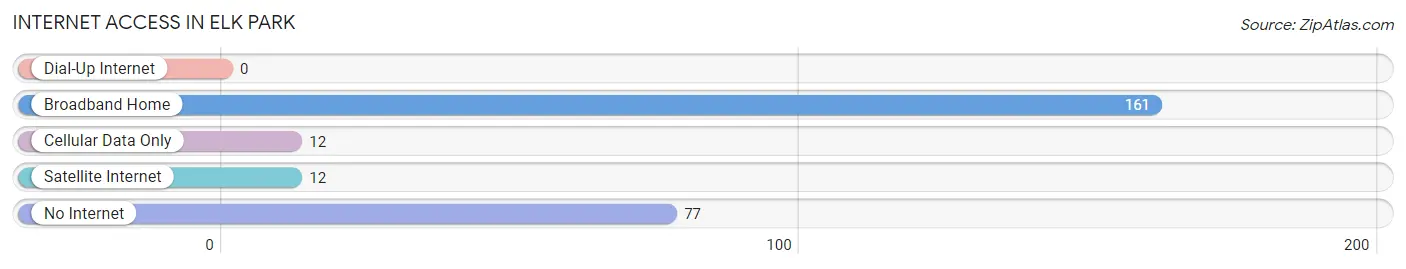
| Internet Type | # Households | % Households |
| Dial-Up Internet | 0 | 0.0% |
| Broadband Home | 161 | 61.9% |
| Cellular Data Only | 12 | 4.6% |
| Satellite Internet | 12 | 4.6% |
| No Internet | 77 | 29.6% |
| Total | 260 | 100.0% |
Elk Park Summary
Elk Park is a small town located in Avery County, North Carolina. It is situated in the Blue Ridge Mountains, and is part of the Appalachian region. The town has a population of approximately 1,000 people, and is known for its scenic beauty and outdoor recreation opportunities.
Geography
Elk Park is located in the Blue Ridge Mountains of western North Carolina. The town is situated at an elevation of 2,400 feet, and is surrounded by the Pisgah National Forest. The town is located on the banks of the Toe River, and is close to the North Carolina-Tennessee border. The town is located approximately 30 miles northeast of Asheville, and is accessible via US Highway 19E.
Climate
Elk Park has a humid subtropical climate, with hot summers and mild winters. The average annual temperature is around 57 degrees Fahrenheit, and the average annual precipitation is around 45 inches. The town experiences all four seasons, with the warmest months being July and August, and the coldest months being December and January.
Demographics
As of the 2010 census, Elk Park had a population of 1,000 people. The racial makeup of the town was 97.2% White, 0.7% African American, 0.3% Native American, 0.2% Asian, 0.1% Pacific Islander, 0.7% from other races, and 0.9% from two or more races. Hispanic or Latino of any race were 1.3% of the population.
Economy
Elk Park is a small, rural town, and the economy is largely based on tourism and outdoor recreation. The town is home to several campgrounds, and is a popular destination for hikers, campers, and other outdoor enthusiasts. The town is also home to several small businesses, including restaurants, shops, and lodging.
History
Elk Park was founded in the late 19th century, and was originally known as “Mountain View.” The town was renamed in the early 20th century, after the elk that were once plentiful in the area. The town was incorporated in 1911, and has remained a small, rural community ever since.
Conclusion
Elk Park is a small town located in Avery County, North Carolina. It is situated in the Blue Ridge Mountains, and is part of the Appalachian region. The town has a population of approximately 1,000 people, and is known for its scenic beauty and outdoor recreation opportunities. The town has a humid subtropical climate, with hot summers and mild winters. The economy is largely based on tourism and outdoor recreation, and the town is home to several small businesses. Elk Park was founded in the late 19th century, and was originally known as “Mountain View.” The town was renamed in the early 20th century, after the elk that were once plentiful in the area.
Common Questions
What is the Total Population of Elk Park?
Total Population of Elk Park is 511.
What is the Total Male Population of Elk Park?
Total Male Population of Elk Park is 212.
What is the Total Female Population of Elk Park?
Total Female Population of Elk Park is 299.
What is the Ratio of Males per 100 Females in Elk Park?
There are 70.90 Males per 100 Females in Elk Park.
What is the Ratio of Females per 100 Males in Elk Park?
There are 141.04 Females per 100 Males in Elk Park.
What is the Median Population Age in Elk Park?
Median Population Age in Elk Park is 47.3 Years.
What is the Average Family Size in Elk Park
Average Family Size in Elk Park is 2.6 People.
What is the Average Household Size in Elk Park
Average Household Size in Elk Park is 2.0 People.
What is Per Capita Income in Elk Park?
Per Capita income in Elk Park is $27,386.
What is the Median Family Income in Elk Park?
Median Family Income in Elk Park is $70,455.
What is the Median Household income in Elk Park?
Median Household Income in Elk Park is $45,455.
What is Income or Wage Gap in Elk Park?
Income or Wage Gap in Elk Park is 26.3%.
Women in Elk Park earn 73.7 cents for every dollar earned by a man.
What is Inequality or Gini Index in Elk Park?
Inequality or Gini Index in Elk Park is 0.40.
How Large is the Labor Force in Elk Park?
There are 233 People in the Labor Forcein in Elk Park.
What is the Percentage of People in the Labor Force in Elk Park?
51.8% of People are in the Labor Force in Elk Park.
What is the Unemployment Rate in Elk Park?
Unemployment Rate in Elk Park is 7.3%.