La Prairie, MN
La Prairie Map
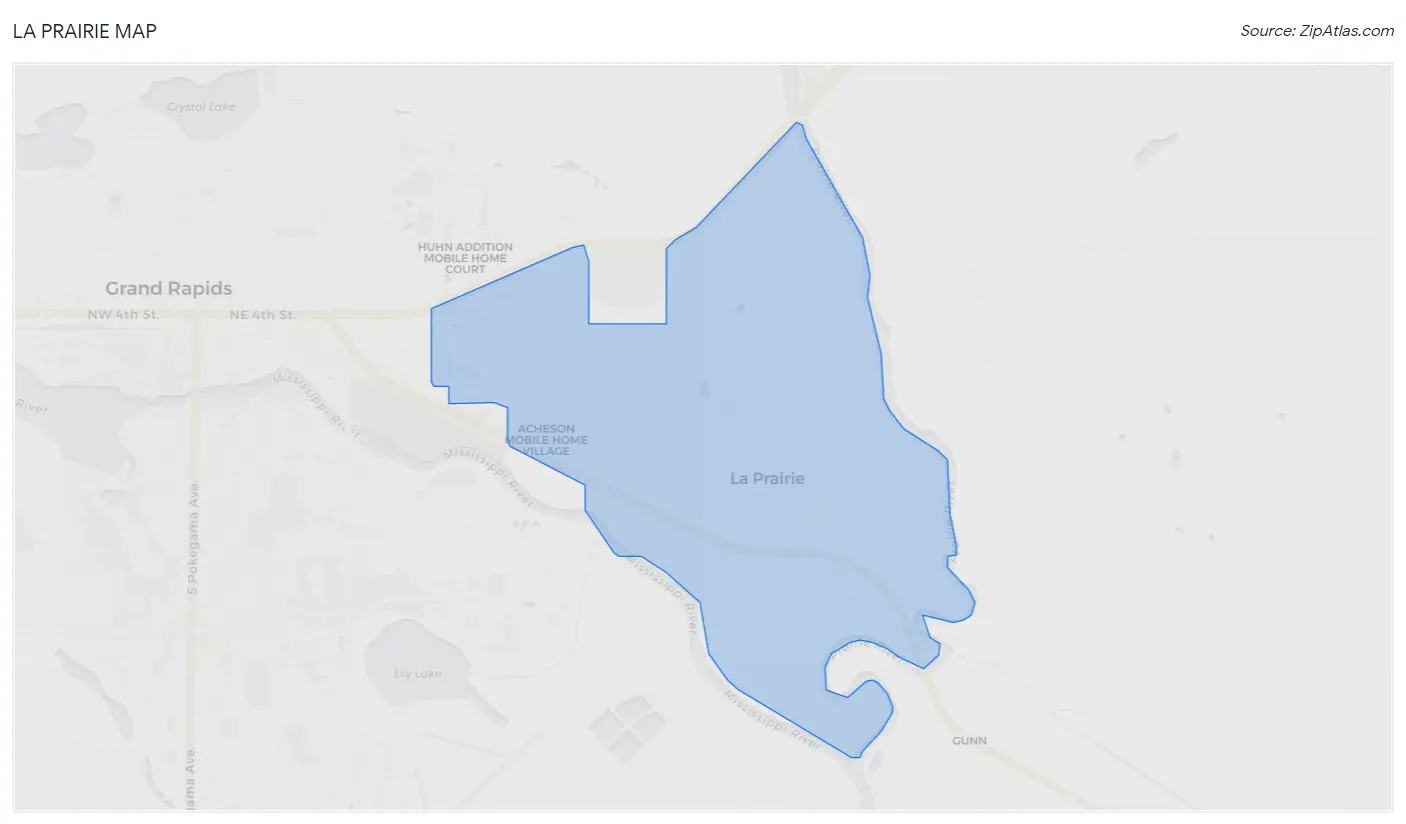
La Prairie Overview
623
TOTAL POPULATION
316
MALE POPULATION
307
FEMALE POPULATION
102.93
MALES / 100 FEMALES
97.15
FEMALES / 100 MALES
46.8
MEDIAN AGE
2.6
AVG FAMILY SIZE
2.4
AVG HOUSEHOLD SIZE
$31,835
PER CAPITA INCOME
$83,125
AVG FAMILY INCOME
$67,917
AVG HOUSEHOLD INCOME
43.3%
WAGE / INCOME GAP [ % ]
56.7¢/ $1
WAGE / INCOME GAP [ $ ]
0.34
INEQUALITY / GINI INDEX
290
LABOR FORCE [ PEOPLE ]
58.0%
PERCENT IN LABOR FORCE
3.8%
UNEMPLOYMENT RATE
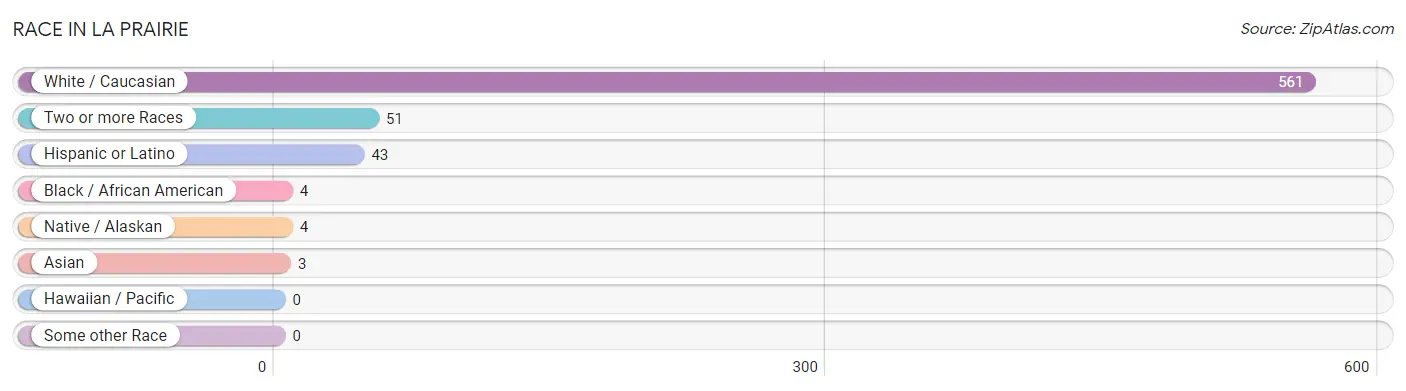
Race in La Prairie
The most populous races in La Prairie are White / Caucasian (561 | 90.0%), Two or more Races (51 | 8.2%), and Hispanic or Latino (43 | 6.9%).
| Race | # Population | % Population |
| Asian | 3 | 0.5% |
| Black / African American | 4 | 0.6% |
| Hawaiian / Pacific | 0 | 0.0% |
| Hispanic or Latino | 43 | 6.9% |
| Native / Alaskan | 4 | 0.6% |
| White / Caucasian | 561 | 90.0% |
| Two or more Races | 51 | 8.2% |
| Some other Race | 0 | 0.0% |
| Total | 623 | 100.0% |
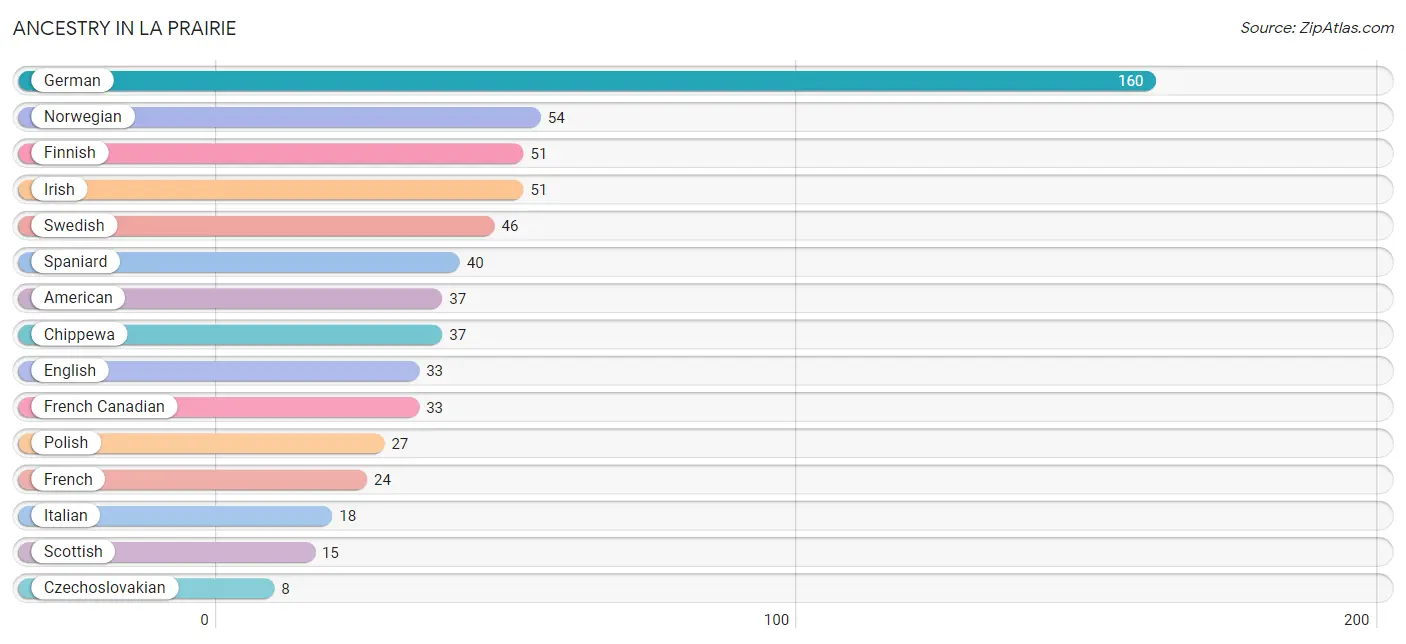
Ancestry in La Prairie
The most populous ancestries reported in La Prairie are German (160 | 25.7%), Norwegian (54 | 8.7%), Finnish (51 | 8.2%), Irish (51 | 8.2%), and Swedish (46 | 7.4%), together accounting for 58.1% of all La Prairie residents.
| Ancestry | # Population | % Population |
| American | 37 | 5.9% |
| British | 2 | 0.3% |
| Canadian | 2 | 0.3% |
| Chippewa | 37 | 5.9% |
| Croatian | 4 | 0.6% |
| Czech | 2 | 0.3% |
| Czechoslovakian | 8 | 1.3% |
| Danish | 8 | 1.3% |
| Dutch | 8 | 1.3% |
| English | 33 | 5.3% |
| Estonian | 3 | 0.5% |
| European | 2 | 0.3% |
| Finnish | 51 | 8.2% |
| French | 24 | 3.8% |
| French Canadian | 33 | 5.3% |
| German | 160 | 25.7% |
| Irish | 51 | 8.2% |
| Italian | 18 | 2.9% |
| Korean | 3 | 0.5% |
| Mexican | 3 | 0.5% |
| Native Hawaiian | 3 | 0.5% |
| Northern European | 5 | 0.8% |
| Norwegian | 54 | 8.7% |
| Polish | 27 | 4.3% |
| Portuguese | 3 | 0.5% |
| Potawatomi | 2 | 0.3% |
| Russian | 4 | 0.6% |
| Scandinavian | 3 | 0.5% |
| Scottish | 15 | 2.4% |
| Serbian | 6 | 1.0% |
| Spaniard | 40 | 6.4% |
| Swedish | 46 | 7.4% |
| Ukrainian | 1 | 0.2% |
| Yugoslavian | 2 | 0.3% | View All 34 Rows |
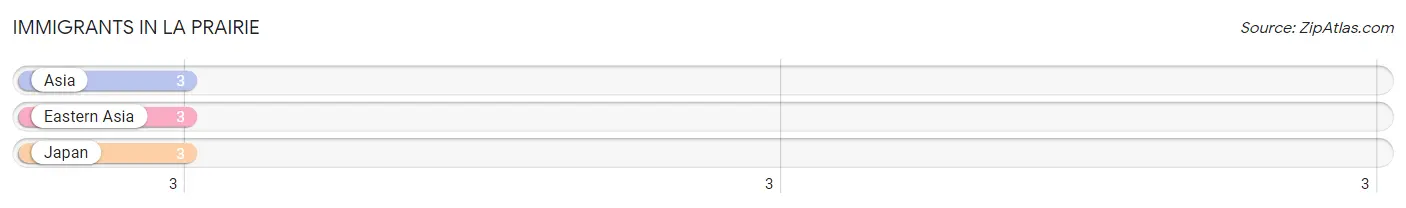
Immigrants in La Prairie
The most numerous immigrant groups reported in La Prairie came from Asia (3 | 0.5%), Eastern Asia (3 | 0.5%), and Japan (3 | 0.5%), together accounting for 1.4% of all La Prairie residents.
| Immigration Origin | # Population | % Population |
| Asia | 3 | 0.5% |
| Eastern Asia | 3 | 0.5% |
| Japan | 3 | 0.5% | View All 3 Rows |
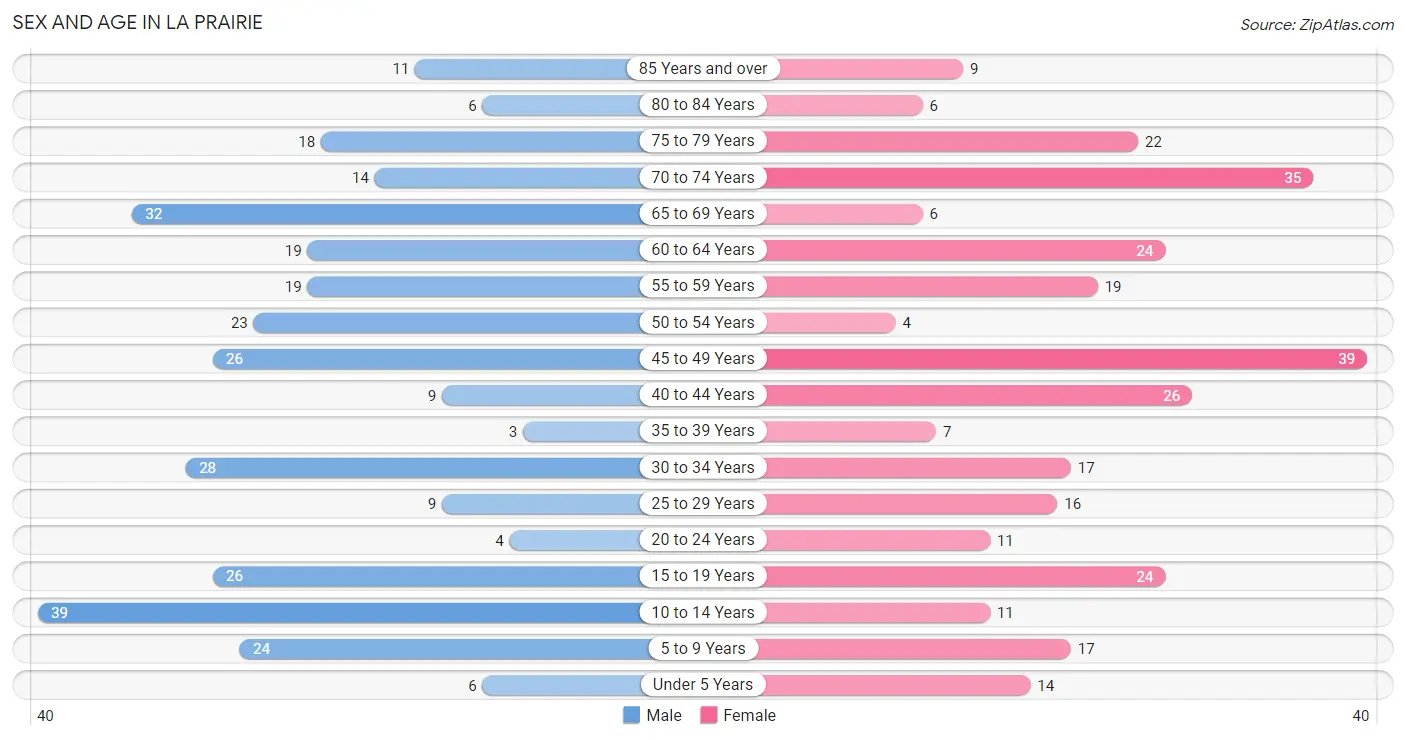
Sex and Age in La Prairie
Sex and Age in La Prairie
The most populous age groups in La Prairie are 10 to 14 Years (39 | 12.3%) for men and 45 to 49 Years (39 | 12.7%) for women.
| Age Bracket | Male | Female |
| Under 5 Years | 6 (1.9%) | 14 (4.6%) |
| 5 to 9 Years | 24 (7.6%) | 17 (5.5%) |
| 10 to 14 Years | 39 (12.3%) | 11 (3.6%) |
| 15 to 19 Years | 26 (8.2%) | 24 (7.8%) |
| 20 to 24 Years | 4 (1.3%) | 11 (3.6%) |
| 25 to 29 Years | 9 (2.9%) | 16 (5.2%) |
| 30 to 34 Years | 28 (8.9%) | 17 (5.5%) |
| 35 to 39 Years | 3 (0.9%) | 7 (2.3%) |
| 40 to 44 Years | 9 (2.9%) | 26 (8.5%) |
| 45 to 49 Years | 26 (8.2%) | 39 (12.7%) |
| 50 to 54 Years | 23 (7.3%) | 4 (1.3%) |
| 55 to 59 Years | 19 (6.0%) | 19 (6.2%) |
| 60 to 64 Years | 19 (6.0%) | 24 (7.8%) |
| 65 to 69 Years | 32 (10.1%) | 6 (1.9%) |
| 70 to 74 Years | 14 (4.4%) | 35 (11.4%) |
| 75 to 79 Years | 18 (5.7%) | 22 (7.2%) |
| 80 to 84 Years | 6 (1.9%) | 6 (1.9%) |
| 85 Years and over | 11 (3.5%) | 9 (2.9%) |
| Total | 316 (100.0%) | 307 (100.0%) |
Families and Households in La Prairie
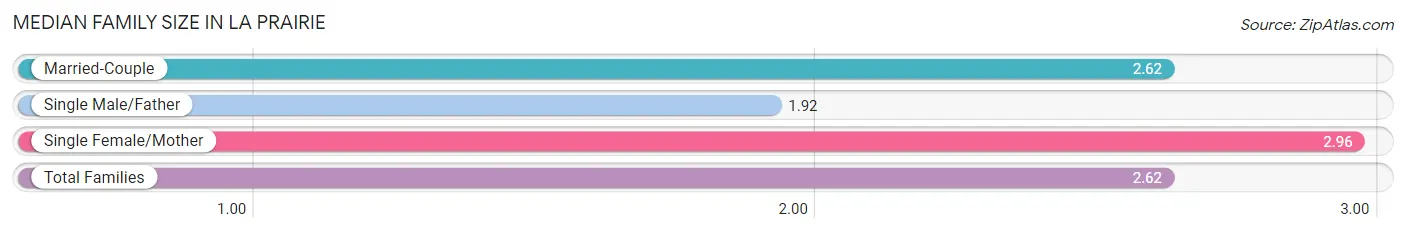
Median Family Size in La Prairie
The median family size in La Prairie is 2.62 persons per family, with single female/mother families (24 | 12.3%) accounting for the largest median family size of 2.96 persons per family. On the other hand, single male/father families (13 | 6.7%) represent the smallest median family size with 1.92 persons per family.
| Family Type | # Families | Family Size |
| Married-Couple | 158 (81.0%) | 2.62 |
| Single Male/Father | 13 (6.7%) | 1.92 |
| Single Female/Mother | 24 (12.3%) | 2.96 |
| Total Families | 195 (100.0%) | 2.62 |
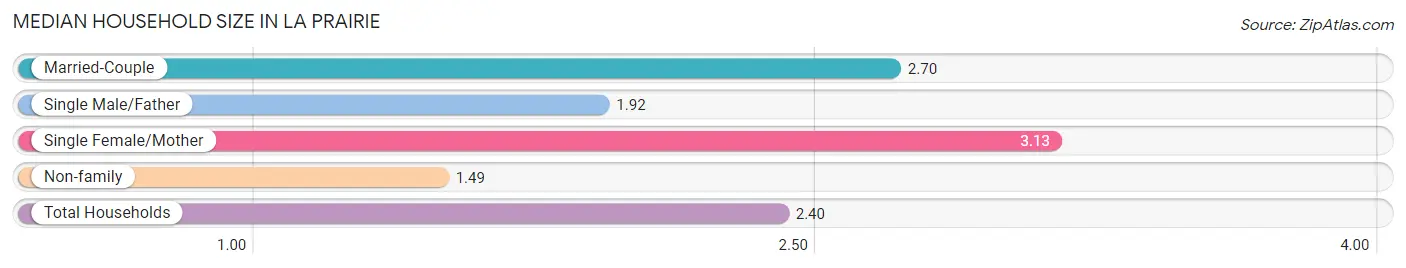
Median Household Size in La Prairie
The median household size in La Prairie is 2.40 persons per household, with single female/mother households (24 | 9.2%) accounting for the largest median household size of 3.13 persons per household. non-family households (65 | 25.0%) represent the smallest median household size with 1.49 persons per household.
| Household Type | # Households | Household Size |
| Married-Couple | 158 (60.8%) | 2.70 |
| Single Male/Father | 13 (5.0%) | 1.92 |
| Single Female/Mother | 24 (9.2%) | 3.13 |
| Non-family | 65 (25.0%) | 1.49 |
| Total Households | 260 (100.0%) | 2.40 |
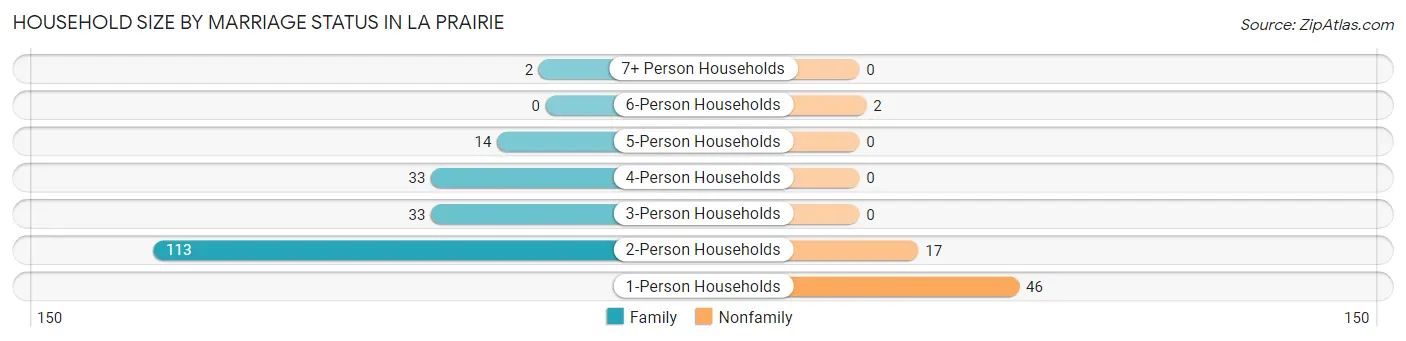
Household Size by Marriage Status in La Prairie
Out of a total of 260 households in La Prairie, 195 (75.0%) are family households, while 65 (25.0%) are nonfamily households. The most numerous type of family households are 2-person households, comprising 113, and the most common type of nonfamily households are 1-person households, comprising 46.
| Household Size | Family Households | Nonfamily Households |
| 1-Person Households | - | 46 (17.7%) |
| 2-Person Households | 113 (43.5%) | 17 (6.5%) |
| 3-Person Households | 33 (12.7%) | 0 (0.0%) |
| 4-Person Households | 33 (12.7%) | 0 (0.0%) |
| 5-Person Households | 14 (5.4%) | 0 (0.0%) |
| 6-Person Households | 0 (0.0%) | 2 (0.8%) |
| 7+ Person Households | 2 (0.8%) | 0 (0.0%) |
| Total | 195 (75.0%) | 65 (25.0%) |
Female Fertility in La Prairie
Fertility by Age in La Prairie
Average fertility rate in La Prairie is 36.0 births per 1,000 women. Women in the age bracket of 20 to 34 years have the highest fertility rate with 45.0 births per 1,000 women. Women in the age bracket of 35 to 50 years acount for 60.0% of all women with births.
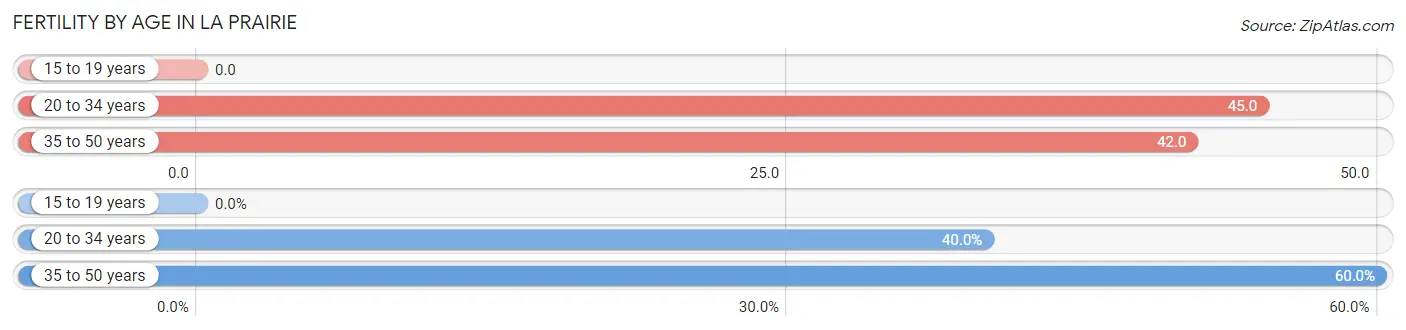
| Age Bracket | Women with Births | Births / 1,000 Women |
| 15 to 19 years | 0 (0.0%) | 0.0 |
| 20 to 34 years | 2 (40.0%) | 45.0 |
| 35 to 50 years | 3 (60.0%) | 42.0 |
| Total | 5 (100.0%) | 36.0 |
Fertility by Age by Marriage Status in La Prairie
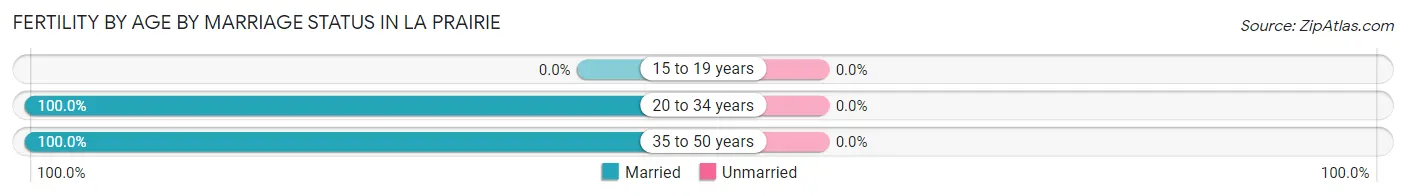
| Age Bracket | Married | Unmarried |
| 15 to 19 years | 0 (0.0%) | 0 (0.0%) |
| 20 to 34 years | 2 (100.0%) | 0 (0.0%) |
| 35 to 50 years | 3 (100.0%) | 0 (0.0%) |
| Total | 5 (100.0%) | 0 (0.0%) |
Fertility by Education in La Prairie
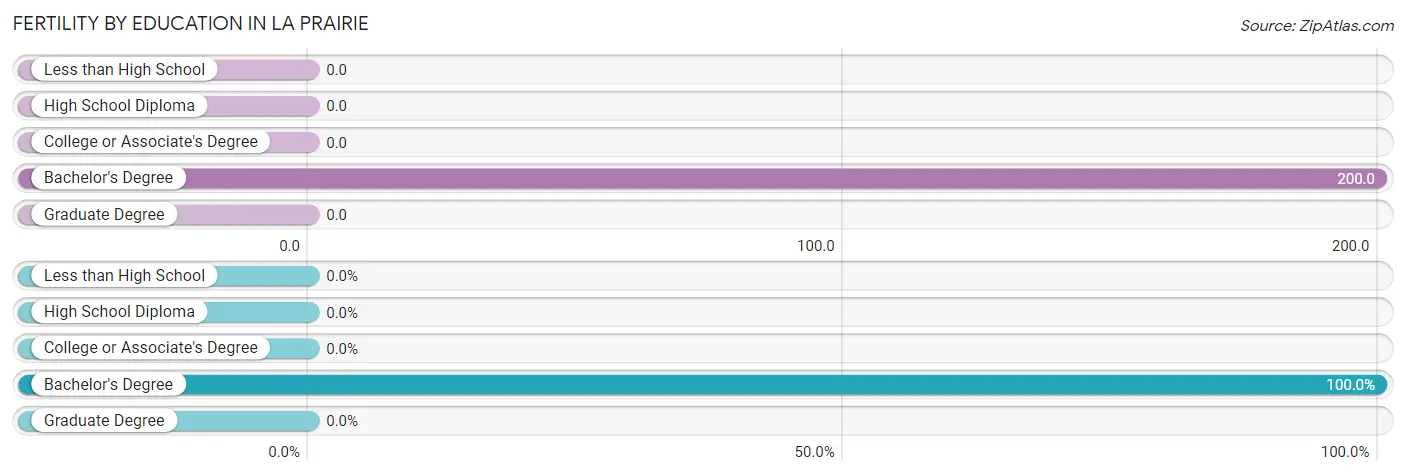
| Educational Attainment | Women with Births | Births / 1,000 Women |
| Less than High School | 0 (0.0%) | 0.0 |
| High School Diploma | 0 (0.0%) | 0.0 |
| College or Associate's Degree | 0 (0.0%) | 0.0 |
| Bachelor's Degree | 5 (100.0%) | 200.0 |
| Graduate Degree | 0 (0.0%) | 0.0 |
| Total | 5 (100.0%) | 36.0 |
Fertility by Education by Marriage Status in La Prairie
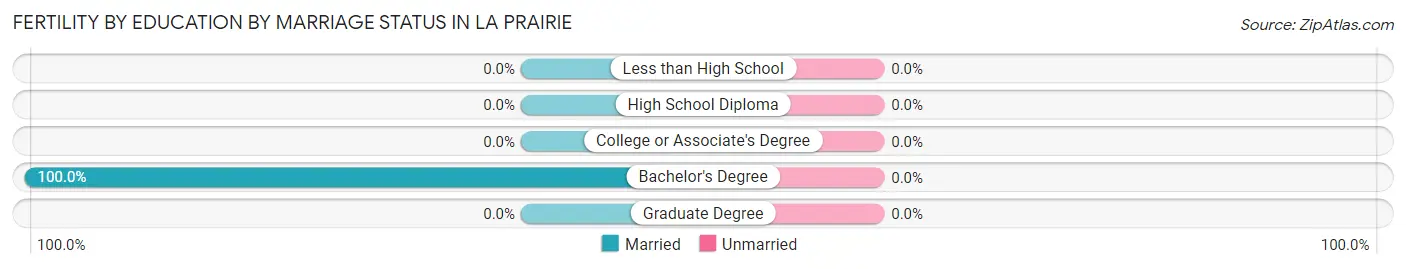
| Educational Attainment | Married | Unmarried |
| Less than High School | 0 (0.0%) | 0 (0.0%) |
| High School Diploma | 0 (0.0%) | 0 (0.0%) |
| College or Associate's Degree | 0 (0.0%) | 0 (0.0%) |
| Bachelor's Degree | 5 (100.0%) | 0 (0.0%) |
| Graduate Degree | 0 (0.0%) | 0 (0.0%) |
| Total | 5 (100.0%) | 0 (0.0%) |
Income in La Prairie
Income Overview in La Prairie
Per Capita Income in La Prairie is $31,835, while median incomes of families and households are $83,125 and $67,917 respectively.
| Characteristic | Number | Measure |
| Per Capita Income | 623 | $31,835 |
| Median Family Income | 195 | $83,125 |
| Mean Family Income | 195 | $84,968 |
| Median Household Income | 260 | $67,917 |
| Mean Household Income | 260 | $77,913 |
| Income Deficit | 195 | $0 |
| Wage / Income Gap (%) | 623 | 43.28% |
| Wage / Income Gap ($) | 623 | 56.72¢ per $1 |
| Gini / Inequality Index | 623 | 0.34 |
Earnings by Sex in La Prairie
Average Earnings in La Prairie are $34,939, $55,729 for men and $31,607 for women, a difference of 43.3%.
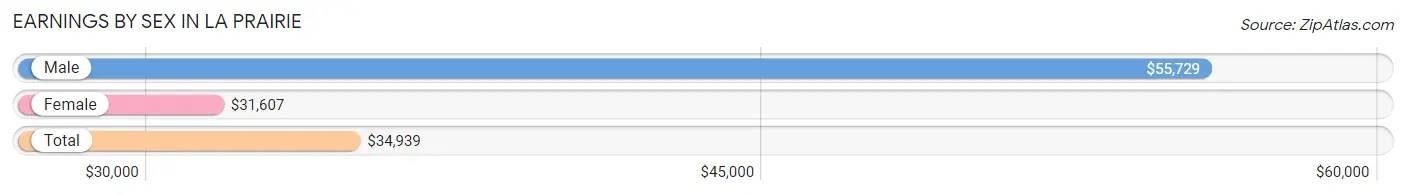
| Sex | Number | Average Earnings |
| Male | 141 (44.9%) | $55,729 |
| Female | 173 (55.1%) | $31,607 |
| Total | 314 (100.0%) | $34,939 |
Earnings by Sex by Income Bracket in La Prairie
The most common earnings brackets in La Prairie are $75,000 to $99,999 for men (37 | 26.2%) and $30,000 to $34,999 for women (45 | 26.0%).
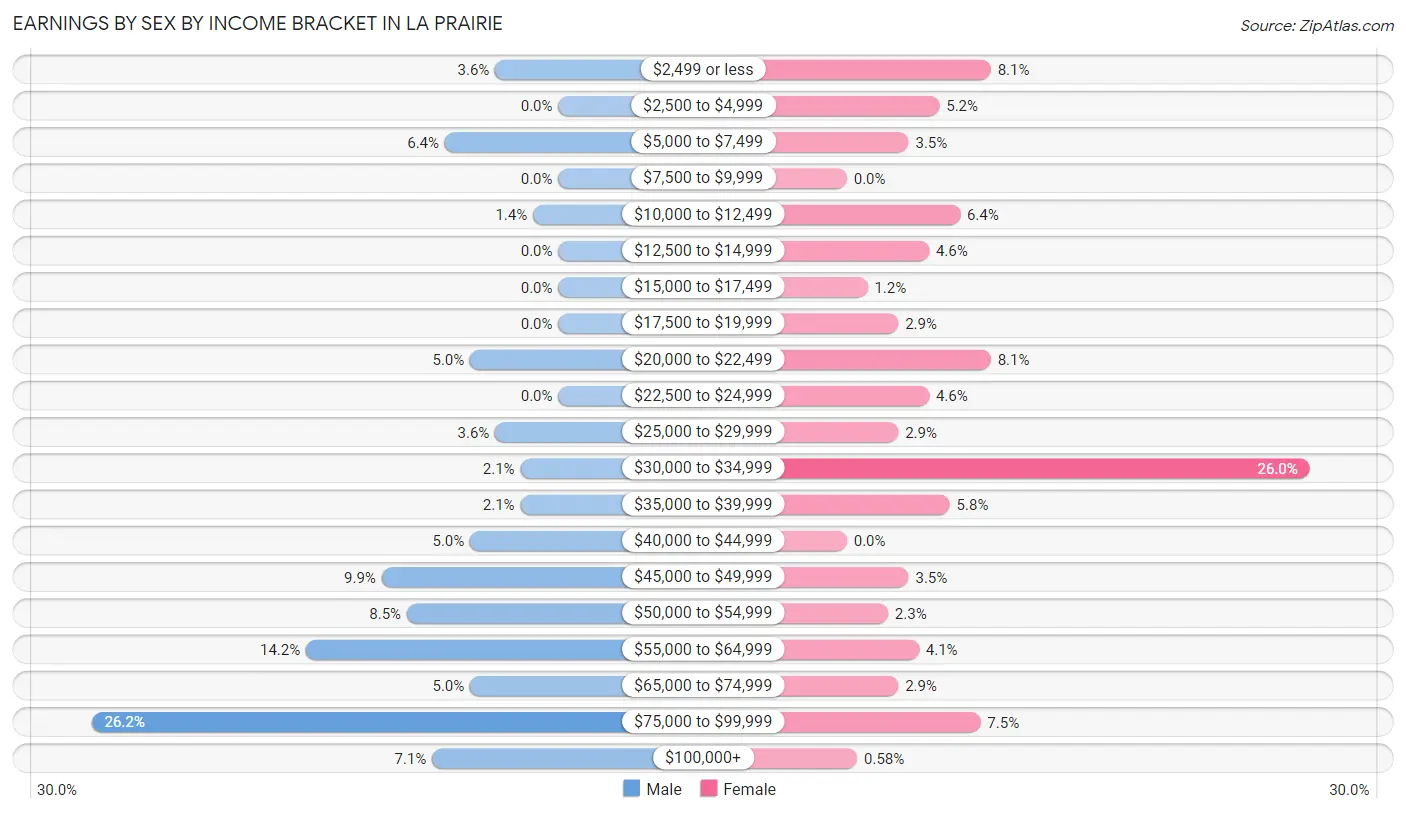
| Income | Male | Female |
| $2,499 or less | 5 (3.5%) | 14 (8.1%) |
| $2,500 to $4,999 | 0 (0.0%) | 9 (5.2%) |
| $5,000 to $7,499 | 9 (6.4%) | 6 (3.5%) |
| $7,500 to $9,999 | 0 (0.0%) | 0 (0.0%) |
| $10,000 to $12,499 | 2 (1.4%) | 11 (6.4%) |
| $12,500 to $14,999 | 0 (0.0%) | 8 (4.6%) |
| $15,000 to $17,499 | 0 (0.0%) | 2 (1.2%) |
| $17,500 to $19,999 | 0 (0.0%) | 5 (2.9%) |
| $20,000 to $22,499 | 7 (5.0%) | 14 (8.1%) |
| $22,500 to $24,999 | 0 (0.0%) | 8 (4.6%) |
| $25,000 to $29,999 | 5 (3.5%) | 5 (2.9%) |
| $30,000 to $34,999 | 3 (2.1%) | 45 (26.0%) |
| $35,000 to $39,999 | 3 (2.1%) | 10 (5.8%) |
| $40,000 to $44,999 | 7 (5.0%) | 0 (0.0%) |
| $45,000 to $49,999 | 14 (9.9%) | 6 (3.5%) |
| $50,000 to $54,999 | 12 (8.5%) | 4 (2.3%) |
| $55,000 to $64,999 | 20 (14.2%) | 7 (4.1%) |
| $65,000 to $74,999 | 7 (5.0%) | 5 (2.9%) |
| $75,000 to $99,999 | 37 (26.2%) | 13 (7.5%) |
| $100,000+ | 10 (7.1%) | 1 (0.6%) |
| Total | 141 (100.0%) | 173 (100.0%) |
Earnings by Sex by Educational Attainment in La Prairie
Average earnings in La Prairie are $57,292 for men and $33,158 for women, a difference of 42.1%. Men with an educational attainment of college or associate's degree enjoy the highest average annual earnings of $62,500, while those with high school diploma education earn the least with $49,375. Women with an educational attainment of bachelor's degree earn the most with the average annual earnings of $42,500, while those with college or associate's degree education have the smallest earnings of $33,507.

| Educational Attainment | Male Income | Female Income |
| Less than High School | - | - |
| High School Diploma | $49,375 | $0 |
| College or Associate's Degree | $62,500 | $33,507 |
| Bachelor's Degree | $56,250 | $42,500 |
| Graduate Degree | - | - |
| Total | $57,292 | $33,158 |
Family Income in La Prairie
Family Income Brackets in La Prairie
According to the La Prairie family income data, there are 58 families falling into the $100,000 to $149,999 income range, which is the most common income bracket and makes up 29.7% of all families. Conversely, the $10,000 to $14,999 income bracket is the least frequent group with only 1 families (0.5%) belonging to this category.
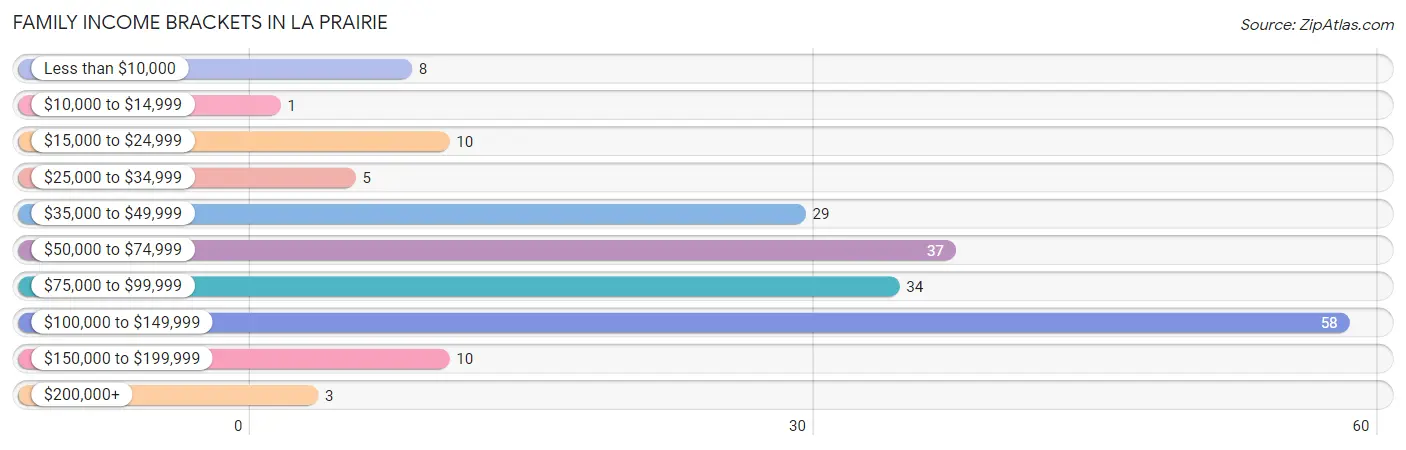
| Income Bracket | # Families | % Families |
| Less than $10,000 | 8 | 4.1% |
| $10,000 to $14,999 | 1 | 0.5% |
| $15,000 to $24,999 | 10 | 5.1% |
| $25,000 to $34,999 | 5 | 2.6% |
| $35,000 to $49,999 | 29 | 14.9% |
| $50,000 to $74,999 | 37 | 19.0% |
| $75,000 to $99,999 | 34 | 17.4% |
| $100,000 to $149,999 | 58 | 29.7% |
| $150,000 to $199,999 | 10 | 5.1% |
| $200,000+ | 3 | 1.5% |
Family Income by Famaliy Size in La Prairie
3-person families (23 | 11.8%) account for the highest median family income in La Prairie with $105,938 per family, while 2-person families (123 | 63.1%) have the highest median income of $39,792 per family member.
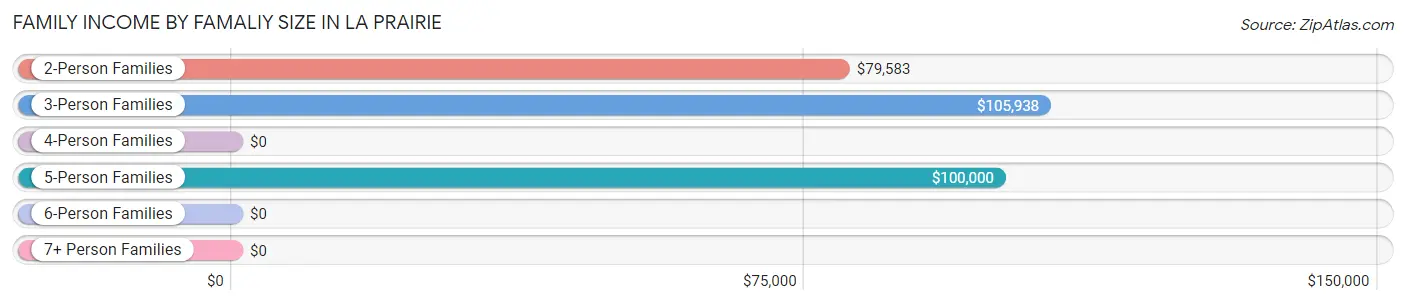
| Income Bracket | # Families | Median Income |
| 2-Person Families | 123 (63.1%) | $79,583 |
| 3-Person Families | 23 (11.8%) | $105,938 |
| 4-Person Families | 35 (17.9%) | $0 |
| 5-Person Families | 12 (6.1%) | $100,000 |
| 6-Person Families | 0 (0.0%) | $0 |
| 7+ Person Families | 2 (1.0%) | $0 |
| Total | 195 (100.0%) | $83,125 |
Family Income by Number of Earners in La Prairie
The median family income in La Prairie is $83,125, with families comprising 2 earners (75) having the highest median family income of $113,365, while families with 1 earner (44) have the lowest median family income of $56,875, accounting for 38.5% and 22.6% of families, respectively.
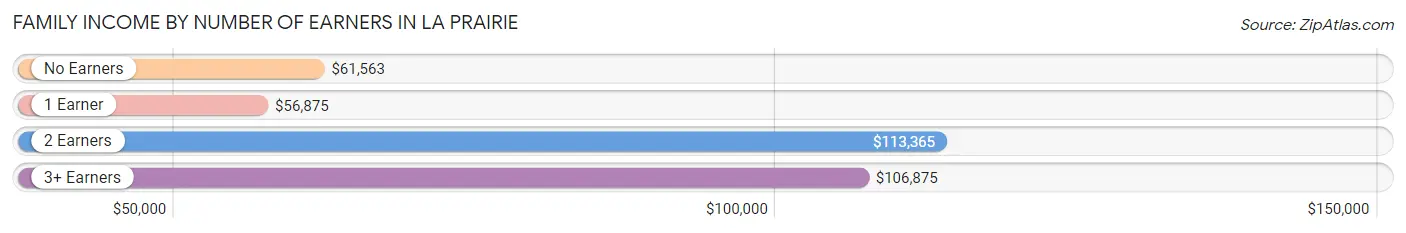
| Number of Earners | # Families | Median Income |
| No Earners | 57 (29.2%) | $61,563 |
| 1 Earner | 44 (22.6%) | $56,875 |
| 2 Earners | 75 (38.5%) | $113,365 |
| 3+ Earners | 19 (9.7%) | $106,875 |
| Total | 195 (100.0%) | $83,125 |
Household Income in La Prairie
Household Income Brackets in La Prairie
With 60 households falling in the category, the $100,000 to $149,999 income range is the most frequent in La Prairie, accounting for 23.1% of all households. In contrast, only 1 households (0.4%) fall into the $10,000 to $14,999 income bracket, making it the least populous group.
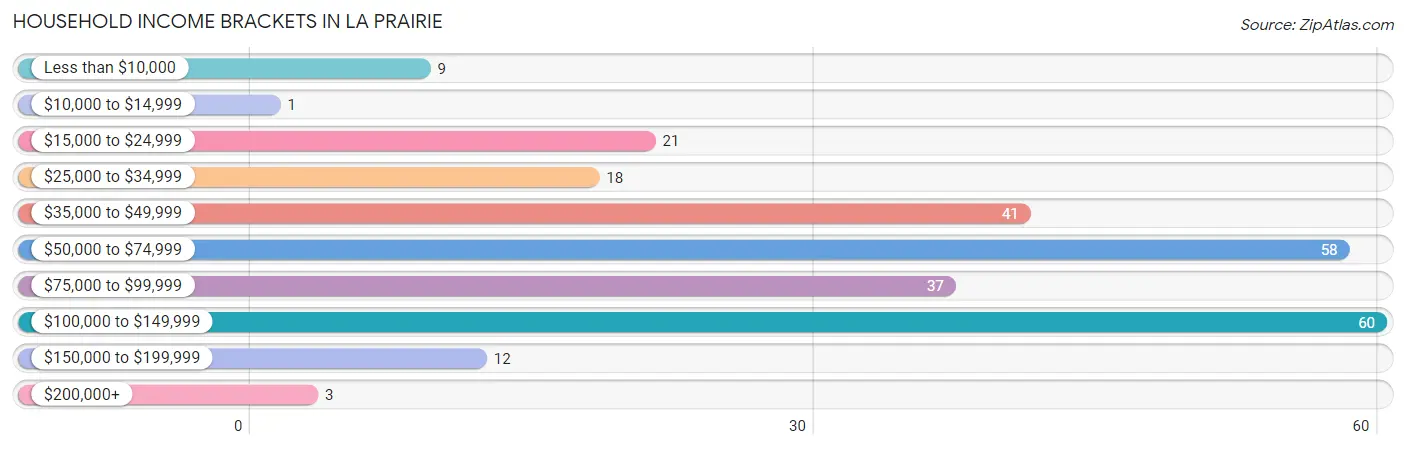
| Income Bracket | # Households | % Households |
| Less than $10,000 | 9 | 3.5% |
| $10,000 to $14,999 | 1 | 0.4% |
| $15,000 to $24,999 | 21 | 8.1% |
| $25,000 to $34,999 | 18 | 6.9% |
| $35,000 to $49,999 | 41 | 15.8% |
| $50,000 to $74,999 | 58 | 22.3% |
| $75,000 to $99,999 | 37 | 14.2% |
| $100,000 to $149,999 | 60 | 23.1% |
| $150,000 to $199,999 | 12 | 4.6% |
| $200,000+ | 3 | 1.2% |
Household Income by Householder Age in La Prairie
The median household income in La Prairie is $67,917, with the highest median household income of $112,250 found in the 45 to 64 years age bracket for the primary householder. A total of 93 households (35.8%) fall into this category.
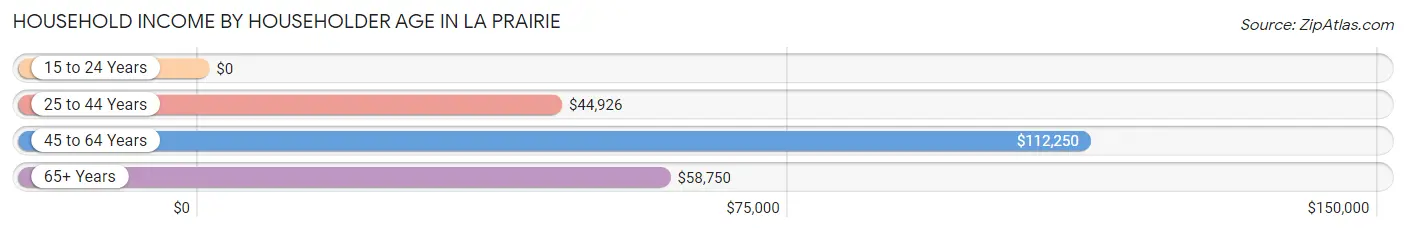
| Income Bracket | # Households | Median Income |
| 15 to 24 Years | 0 (0.0%) | $0 |
| 25 to 44 Years | 73 (28.1%) | $44,926 |
| 45 to 64 Years | 93 (35.8%) | $112,250 |
| 65+ Years | 94 (36.1%) | $58,750 |
| Total | 260 (100.0%) | $67,917 |
Poverty in La Prairie
Income Below Poverty by Sex and Age in La Prairie
With 10.6% poverty level for males and 8.5% for females among the residents of La Prairie, 16 and 17 year old males and under 5 year old females are the most vulnerable to poverty, with 9 males (47.4%) and 9 females (64.3%) in their respective age groups living below the poverty level.
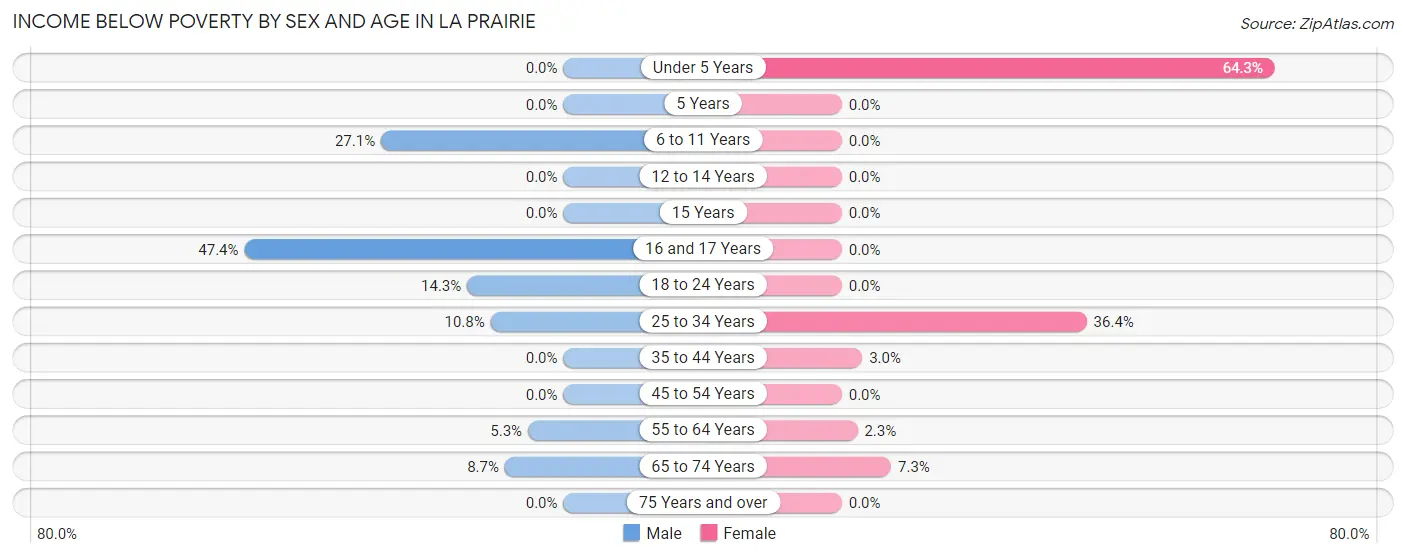
| Age Bracket | Male | Female |
| Under 5 Years | 0 (0.0%) | 9 (64.3%) |
| 5 Years | 0 (0.0%) | 0 (0.0%) |
| 6 to 11 Years | 13 (27.1%) | 0 (0.0%) |
| 12 to 14 Years | 0 (0.0%) | 0 (0.0%) |
| 15 Years | 0 (0.0%) | 0 (0.0%) |
| 16 and 17 Years | 9 (47.4%) | 0 (0.0%) |
| 18 to 24 Years | 1 (14.3%) | 0 (0.0%) |
| 25 to 34 Years | 4 (10.8%) | 12 (36.4%) |
| 35 to 44 Years | 0 (0.0%) | 1 (3.0%) |
| 45 to 54 Years | 0 (0.0%) | 0 (0.0%) |
| 55 to 64 Years | 2 (5.3%) | 1 (2.3%) |
| 65 to 74 Years | 4 (8.7%) | 3 (7.3%) |
| 75 Years and over | 0 (0.0%) | 0 (0.0%) |
| Total | 33 (10.6%) | 26 (8.5%) |
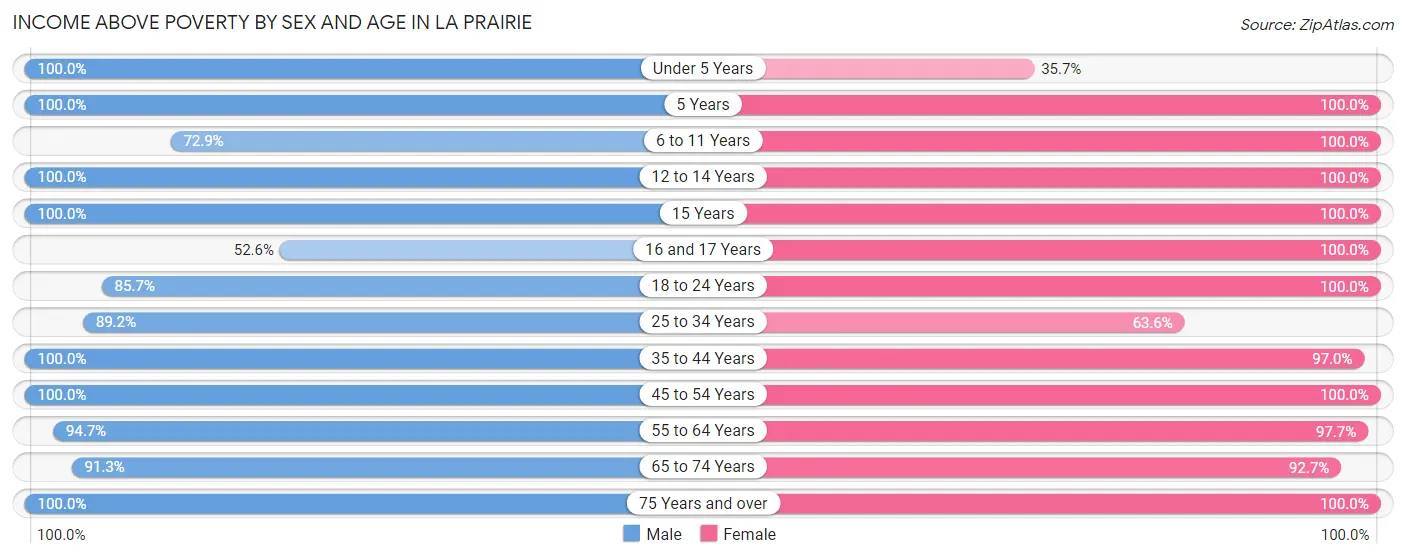
Income Above Poverty by Sex and Age in La Prairie
According to the poverty statistics in La Prairie, males aged under 5 years and females aged 5 years are the age groups that are most secure financially, with 100.0% of males and 100.0% of females in these age groups living above the poverty line.
| Age Bracket | Male | Female |
| Under 5 Years | 6 (100.0%) | 5 (35.7%) |
| 5 Years | 2 (100.0%) | 6 (100.0%) |
| 6 to 11 Years | 35 (72.9%) | 11 (100.0%) |
| 12 to 14 Years | 9 (100.0%) | 11 (100.0%) |
| 15 Years | 4 (100.0%) | 8 (100.0%) |
| 16 and 17 Years | 10 (52.6%) | 11 (100.0%) |
| 18 to 24 Years | 6 (85.7%) | 16 (100.0%) |
| 25 to 34 Years | 33 (89.2%) | 21 (63.6%) |
| 35 to 44 Years | 12 (100.0%) | 32 (97.0%) |
| 45 to 54 Years | 49 (100.0%) | 43 (100.0%) |
| 55 to 64 Years | 36 (94.7%) | 42 (97.7%) |
| 65 to 74 Years | 42 (91.3%) | 38 (92.7%) |
| 75 Years and over | 35 (100.0%) | 37 (100.0%) |
| Total | 279 (89.4%) | 281 (91.5%) |
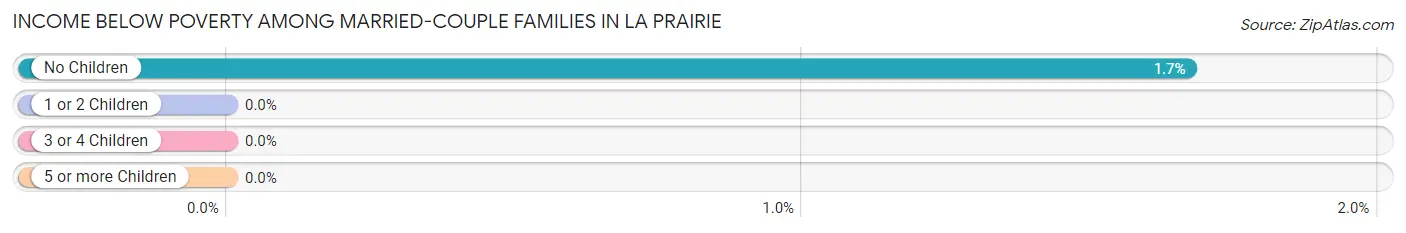
Income Below Poverty Among Married-Couple Families in La Prairie
The poverty statistics for married-couple families in La Prairie show that 1.3% or 2 of the total 158 families live below the poverty line. Families with no children have the highest poverty rate of 1.7%, comprising of 2 families. On the other hand, families with 1 or 2 children have the lowest poverty rate of 0.0%, which includes 0 families.
| Children | Above Poverty | Below Poverty |
| No Children | 118 (98.3%) | 2 (1.7%) |
| 1 or 2 Children | 26 (100.0%) | 0 (0.0%) |
| 3 or 4 Children | 10 (100.0%) | 0 (0.0%) |
| 5 or more Children | 2 (100.0%) | 0 (0.0%) |
| Total | 156 (98.7%) | 2 (1.3%) |
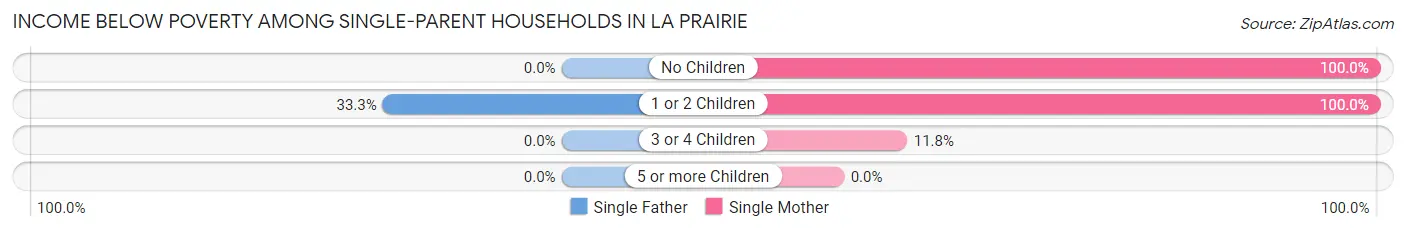
Income Below Poverty Among Single-Parent Households in La Prairie
According to the poverty data in La Prairie, 30.8% or 4 single-father households and 37.5% or 9 single-mother households are living below the poverty line. Among single-father households, those with 1 or 2 children have the highest poverty rate, with 4 households (33.3%) experiencing poverty. Likewise, among single-mother households, those with no children have the highest poverty rate, with 1 households (100.0%) falling below the poverty line.
| Children | Single Father | Single Mother |
| No Children | 0 (0.0%) | 1 (100.0%) |
| 1 or 2 Children | 4 (33.3%) | 6 (100.0%) |
| 3 or 4 Children | 0 (0.0%) | 2 (11.8%) |
| 5 or more Children | 0 (0.0%) | 0 (0.0%) |
| Total | 4 (30.8%) | 9 (37.5%) |
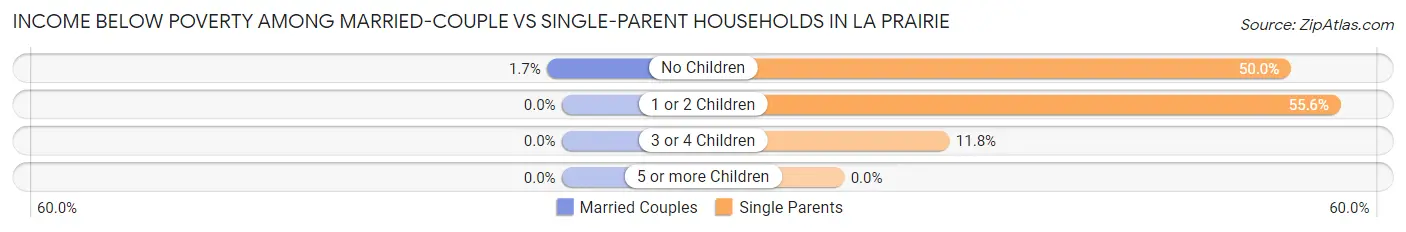
Income Below Poverty Among Married-Couple vs Single-Parent Households in La Prairie
The poverty data for La Prairie shows that 2 of the married-couple family households (1.3%) and 13 of the single-parent households (35.1%) are living below the poverty level. Within the married-couple family households, those with no children have the highest poverty rate, with 2 households (1.7%) falling below the poverty line. Among the single-parent households, those with 1 or 2 children have the highest poverty rate, with 10 household (55.6%) living below poverty.
| Children | Married-Couple Families | Single-Parent Households |
| No Children | 2 (1.7%) | 1 (50.0%) |
| 1 or 2 Children | 0 (0.0%) | 10 (55.6%) |
| 3 or 4 Children | 0 (0.0%) | 2 (11.8%) |
| 5 or more Children | 0 (0.0%) | 0 (0.0%) |
| Total | 2 (1.3%) | 13 (35.1%) |
Employment Characteristics in La Prairie
Employment by Class of Employer in La Prairie
Among the 276 employed individuals in La Prairie, private company employees (200 | 72.5%), local government employees (27 | 9.8%), and not-for-profit organizations (20 | 7.2%) make up the most common classes of employment.
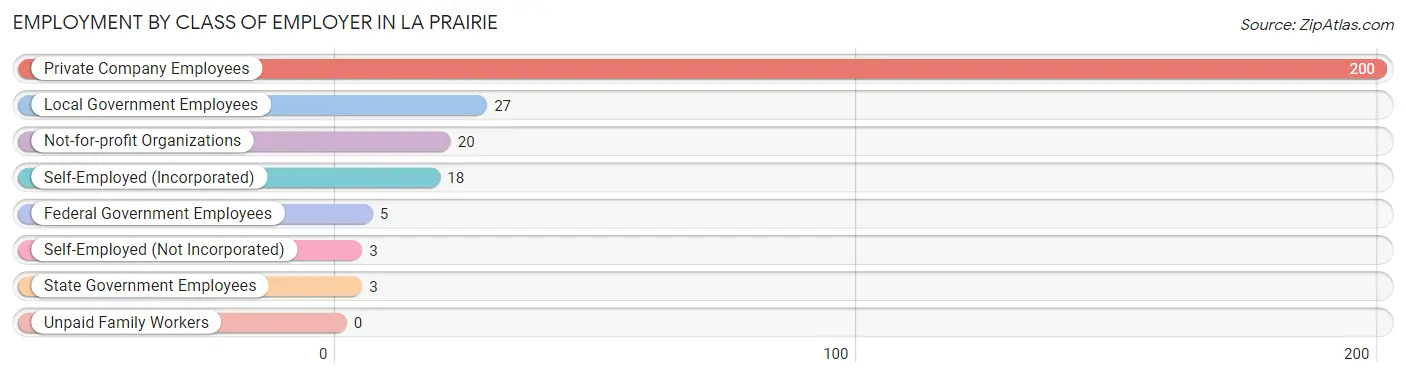
| Employer Class | # Employees | % Employees |
| Private Company Employees | 200 | 72.5% |
| Self-Employed (Incorporated) | 18 | 6.5% |
| Self-Employed (Not Incorporated) | 3 | 1.1% |
| Not-for-profit Organizations | 20 | 7.2% |
| Local Government Employees | 27 | 9.8% |
| State Government Employees | 3 | 1.1% |
| Federal Government Employees | 5 | 1.8% |
| Unpaid Family Workers | 0 | 0.0% |
| Total | 276 | 100.0% |
Employment Status by Age in La Prairie
According to the labor force statistics for La Prairie, out of the total population over 16 years of age (500), 58.0% or 290 individuals are in the labor force, with 3.8% or 11 of them unemployed. The age group with the highest labor force participation rate is 20 to 24 years, with 100.0% or 15 individuals in the labor force. Within the labor force, the 30 to 34 years age range has the highest percentage of unemployed individuals, with 25.0% or 8 of them being unemployed.
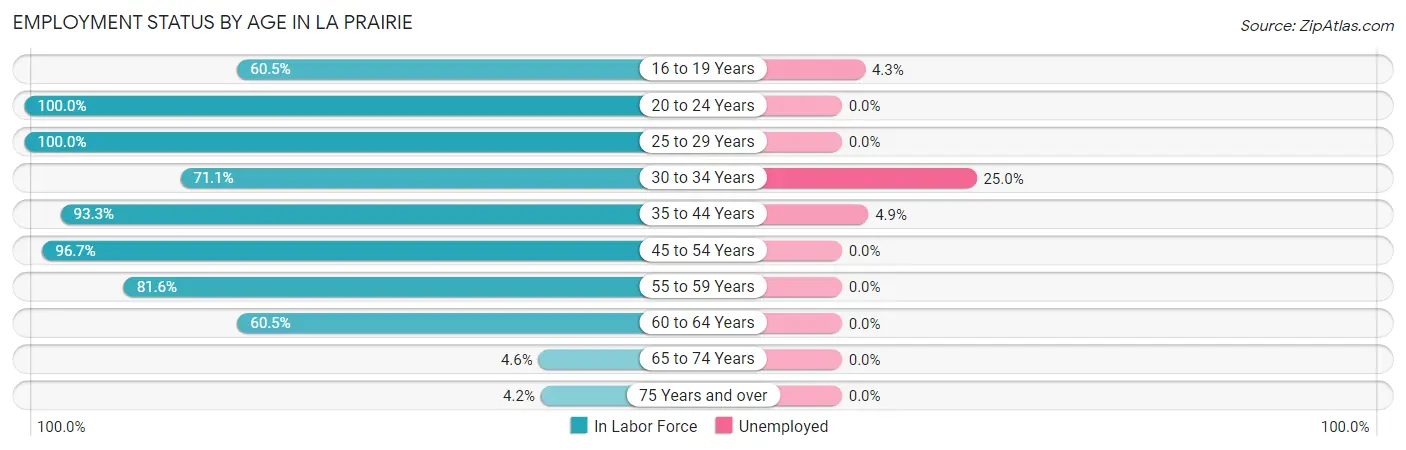
| Age Bracket | In Labor Force | Unemployed |
| 16 to 19 Years | 23 (60.5%) | 1 (4.3%) |
| 20 to 24 Years | 15 (100.0%) | 0 (0.0%) |
| 25 to 29 Years | 25 (100.0%) | 0 (0.0%) |
| 30 to 34 Years | 32 (71.1%) | 8 (25.0%) |
| 35 to 44 Years | 42 (93.3%) | 2 (4.9%) |
| 45 to 54 Years | 89 (96.7%) | 0 (0.0%) |
| 55 to 59 Years | 31 (81.6%) | 0 (0.0%) |
| 60 to 64 Years | 26 (60.5%) | 0 (0.0%) |
| 65 to 74 Years | 4 (4.6%) | 0 (0.0%) |
| 75 Years and over | 3 (4.2%) | 0 (0.0%) |
| Total | 290 (58.0%) | 11 (3.8%) |
Employment Status by Educational Attainment in La Prairie
According to labor force statistics for La Prairie, 85.1% of individuals (245) out of the total population between 25 and 64 years of age (288) are in the labor force, with 4.1% or 10 of them being unemployed. The group with the highest labor force participation rate are those with the educational attainment of college / associate degree, with 91.8% or 123 individuals in the labor force. Within the labor force, individuals with college / associate degree education have the highest percentage of unemployment, with 8.2% or 10 of them being unemployed.
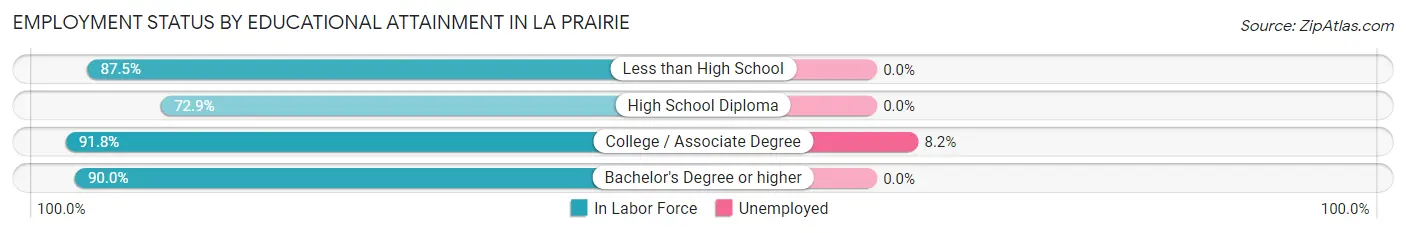
| Educational Attainment | In Labor Force | Unemployed |
| Less than High School | 7 (87.5%) | 0 (0.0%) |
| High School Diploma | 70 (72.9%) | 0 (0.0%) |
| College / Associate Degree | 123 (91.8%) | 11 (8.2%) |
| Bachelor's Degree or higher | 45 (90.0%) | 0 (0.0%) |
| Total | 245 (85.1%) | 12 (4.1%) |
Employment Occupations by Sex in La Prairie
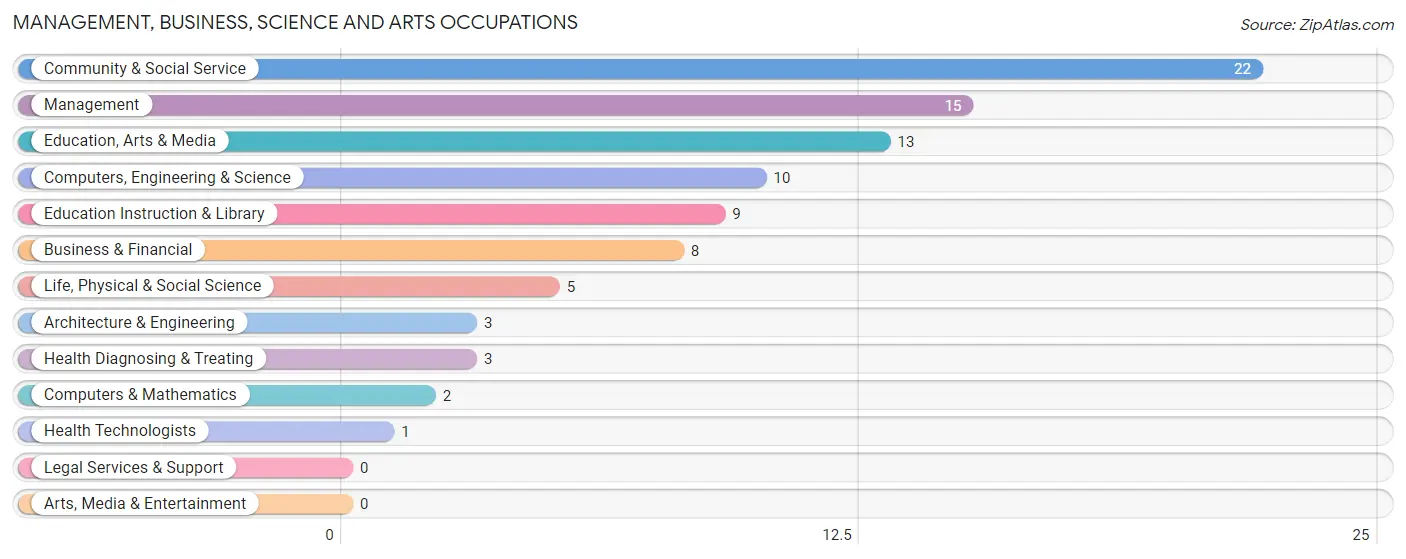
Management, Business, Science and Arts Occupations
The most common Management, Business, Science and Arts occupations in La Prairie are Community & Social Service (22 | 7.9%), Management (15 | 5.4%), Education, Arts & Media (13 | 4.7%), Computers, Engineering & Science (10 | 3.6%), and Education Instruction & Library (9 | 3.2%).
Management, Business, Science and Arts Occupations by Sex
Within the Management, Business, Science and Arts occupations in La Prairie, the most male-oriented occupations are Education Instruction & Library (88.9%), Management (86.7%), and Life, Physical & Social Science (60.0%), while the most female-oriented occupations are Computers & Mathematics (100.0%), Architecture & Engineering (100.0%), and Education, Arts & Media (100.0%).
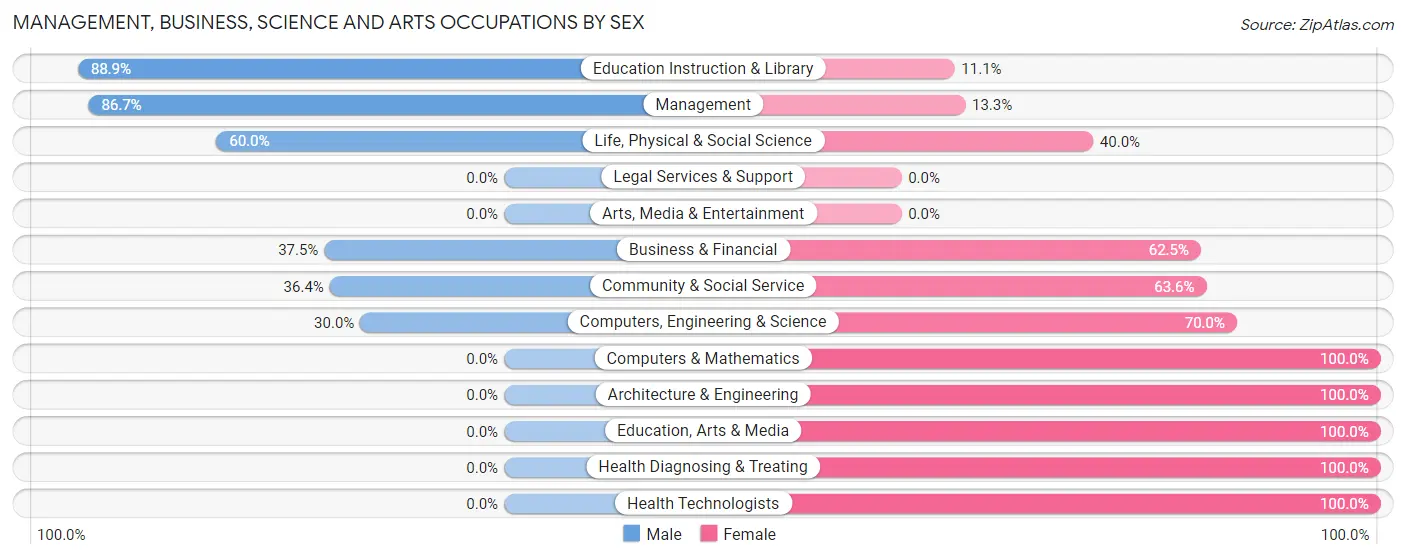
| Occupation | Male | Female |
| Management | 13 (86.7%) | 2 (13.3%) |
| Business & Financial | 3 (37.5%) | 5 (62.5%) |
| Computers, Engineering & Science | 3 (30.0%) | 7 (70.0%) |
| Computers & Mathematics | 0 (0.0%) | 2 (100.0%) |
| Architecture & Engineering | 0 (0.0%) | 3 (100.0%) |
| Life, Physical & Social Science | 3 (60.0%) | 2 (40.0%) |
| Community & Social Service | 8 (36.4%) | 14 (63.6%) |
| Education, Arts & Media | 0 (0.0%) | 13 (100.0%) |
| Legal Services & Support | 0 (0.0%) | 0 (0.0%) |
| Education Instruction & Library | 8 (88.9%) | 1 (11.1%) |
| Arts, Media & Entertainment | 0 (0.0%) | 0 (0.0%) |
| Health Diagnosing & Treating | 0 (0.0%) | 3 (100.0%) |
| Health Technologists | 0 (0.0%) | 1 (100.0%) |
| Total (Category) | 27 (46.6%) | 31 (53.4%) |
| Total (Overall) | 118 (42.4%) | 160 (57.6%) |
Services Occupations
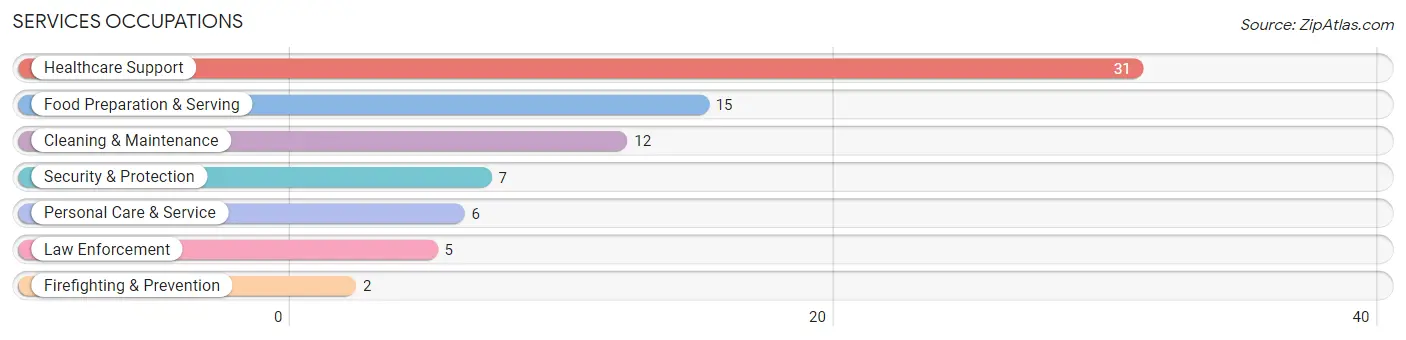
The most common Services occupations in La Prairie are Healthcare Support (31 | 11.2%), Food Preparation & Serving (15 | 5.4%), Cleaning & Maintenance (12 | 4.3%), Security & Protection (7 | 2.5%), and Personal Care & Service (6 | 2.2%).
Services Occupations by Sex
Within the Services occupations in La Prairie, the most male-oriented occupations are Security & Protection (100.0%), Firefighting & Prevention (100.0%), and Law Enforcement (100.0%), while the most female-oriented occupations are Healthcare Support (100.0%), Cleaning & Maintenance (100.0%), and Food Preparation & Serving (86.7%).
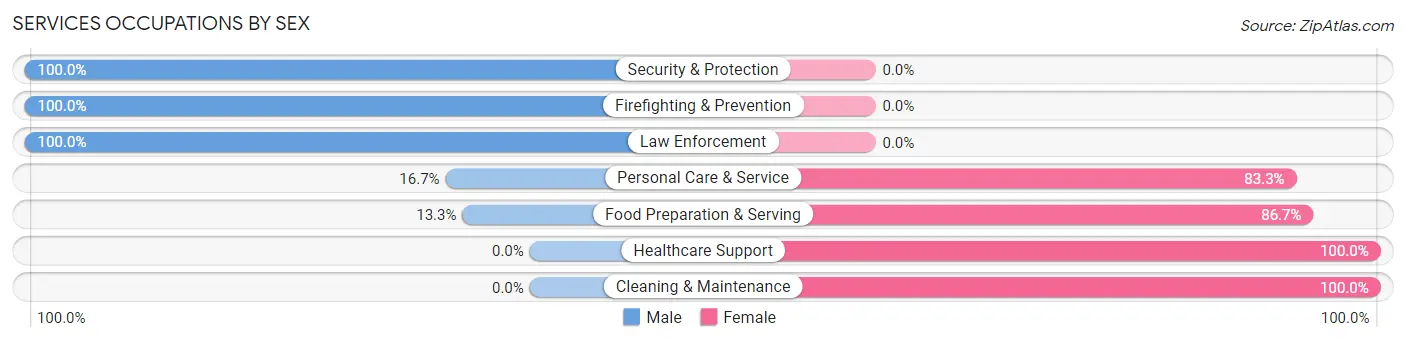
| Occupation | Male | Female |
| Healthcare Support | 0 (0.0%) | 31 (100.0%) |
| Security & Protection | 7 (100.0%) | 0 (0.0%) |
| Firefighting & Prevention | 2 (100.0%) | 0 (0.0%) |
| Law Enforcement | 5 (100.0%) | 0 (0.0%) |
| Food Preparation & Serving | 2 (13.3%) | 13 (86.7%) |
| Cleaning & Maintenance | 0 (0.0%) | 12 (100.0%) |
| Personal Care & Service | 1 (16.7%) | 5 (83.3%) |
| Total (Category) | 10 (14.1%) | 61 (85.9%) |
| Total (Overall) | 118 (42.4%) | 160 (57.6%) |
Sales and Office Occupations
The most common Sales and Office occupations in La Prairie are Sales & Related (39 | 14.0%), and Office & Administration (39 | 14.0%).

Sales and Office Occupations by Sex

| Occupation | Male | Female |
| Sales & Related | 7 (17.9%) | 32 (82.1%) |
| Office & Administration | 15 (38.5%) | 24 (61.5%) |
| Total (Category) | 22 (28.2%) | 56 (71.8%) |
| Total (Overall) | 118 (42.4%) | 160 (57.6%) |
Natural Resources, Construction and Maintenance Occupations
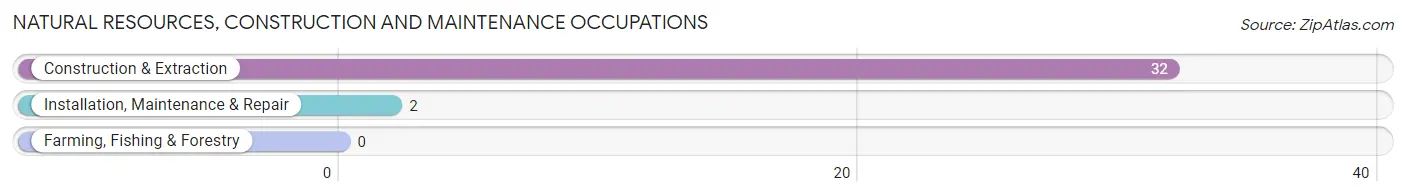
The most common Natural Resources, Construction and Maintenance occupations in La Prairie are Construction & Extraction (32 | 11.5%), and Installation, Maintenance & Repair (2 | 0.7%).
Natural Resources, Construction and Maintenance Occupations by Sex
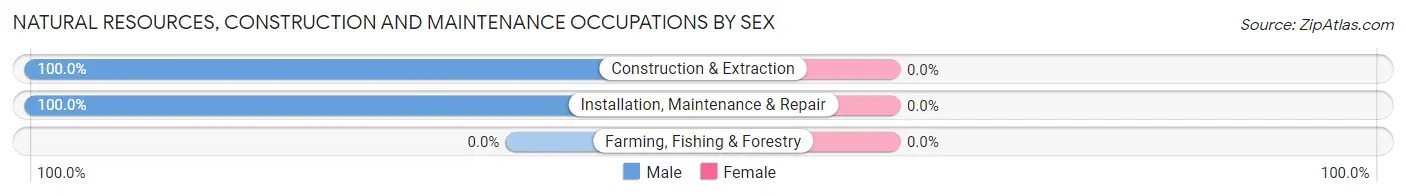
| Occupation | Male | Female |
| Farming, Fishing & Forestry | 0 (0.0%) | 0 (0.0%) |
| Construction & Extraction | 32 (100.0%) | 0 (0.0%) |
| Installation, Maintenance & Repair | 2 (100.0%) | 0 (0.0%) |
| Total (Category) | 34 (100.0%) | 0 (0.0%) |
| Total (Overall) | 118 (42.4%) | 160 (57.6%) |
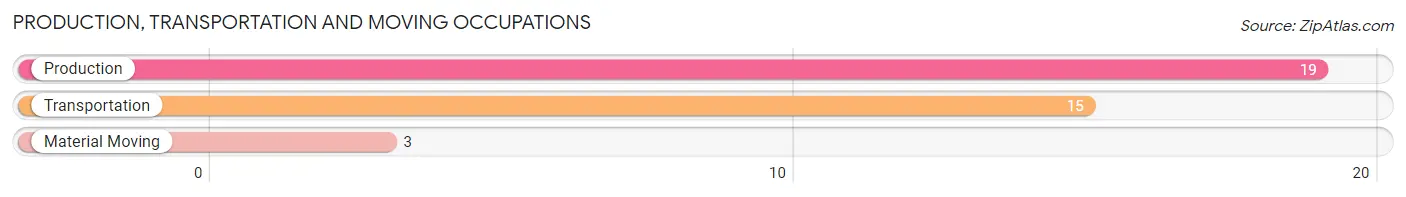
Production, Transportation and Moving Occupations
The most common Production, Transportation and Moving occupations in La Prairie are Production (19 | 6.8%), Transportation (15 | 5.4%), and Material Moving (3 | 1.1%).
Production, Transportation and Moving Occupations by Sex
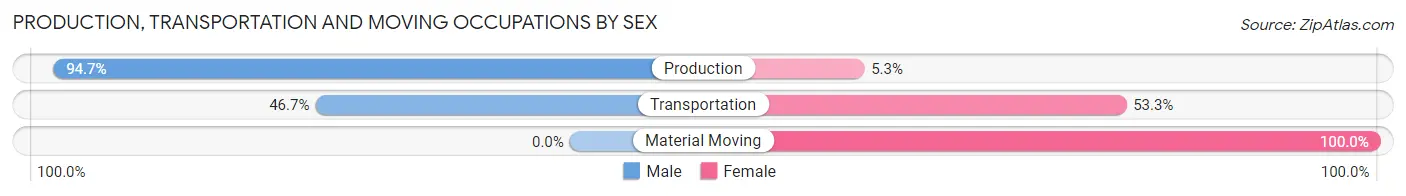
| Occupation | Male | Female |
| Production | 18 (94.7%) | 1 (5.3%) |
| Transportation | 7 (46.7%) | 8 (53.3%) |
| Material Moving | 0 (0.0%) | 3 (100.0%) |
| Total (Category) | 25 (67.6%) | 12 (32.4%) |
| Total (Overall) | 118 (42.4%) | 160 (57.6%) |
Employment Industries by Sex in La Prairie
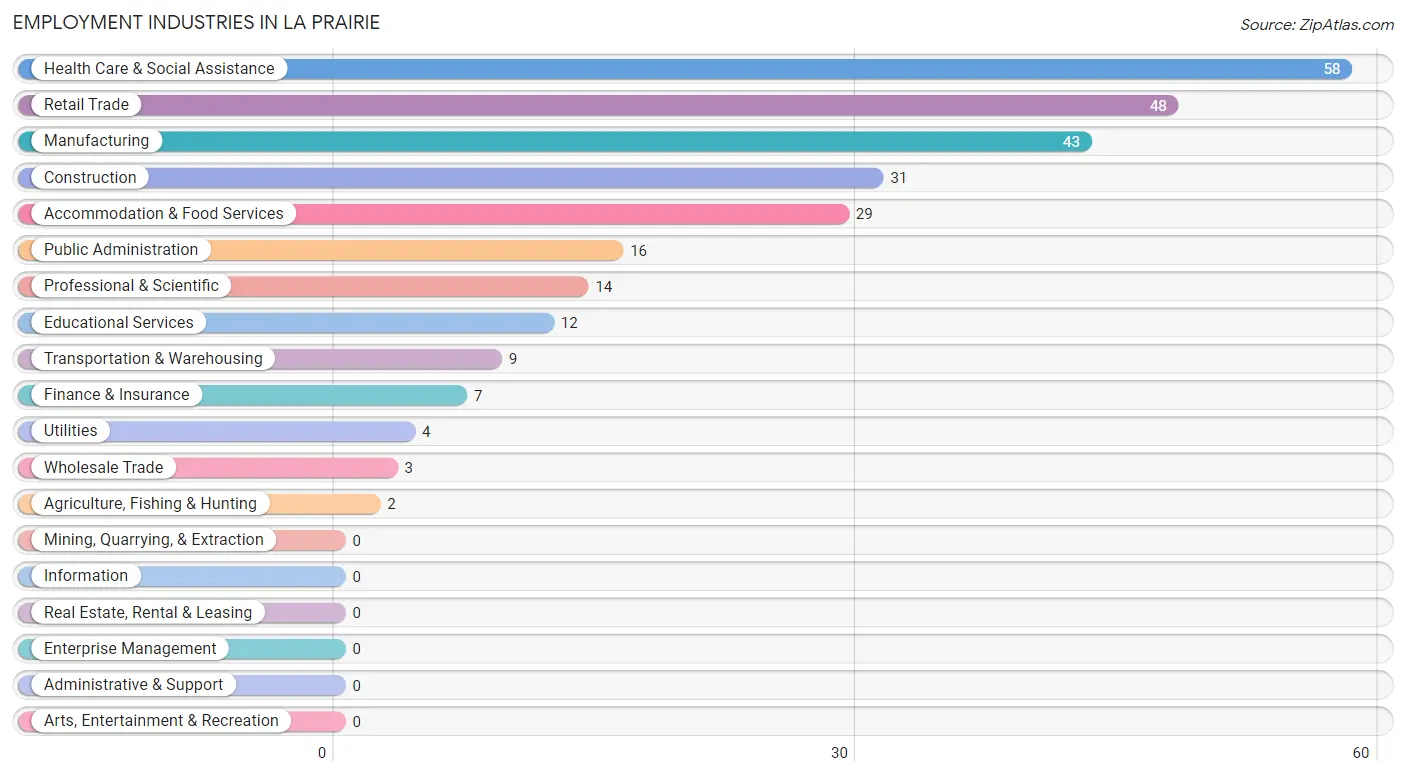
Employment Industries in La Prairie
The major employment industries in La Prairie include Health Care & Social Assistance (58 | 20.9%), Retail Trade (48 | 17.3%), Manufacturing (43 | 15.5%), Construction (31 | 11.2%), and Accommodation & Food Services (29 | 10.4%).
Employment Industries by Sex in La Prairie
The La Prairie industries that see more men than women are Construction (100.0%), Wholesale Trade (100.0%), and Manufacturing (95.4%), whereas the industries that tend to have a higher number of women are Agriculture, Fishing & Hunting (100.0%), Finance & Insurance (100.0%), and Health Care & Social Assistance (93.1%).
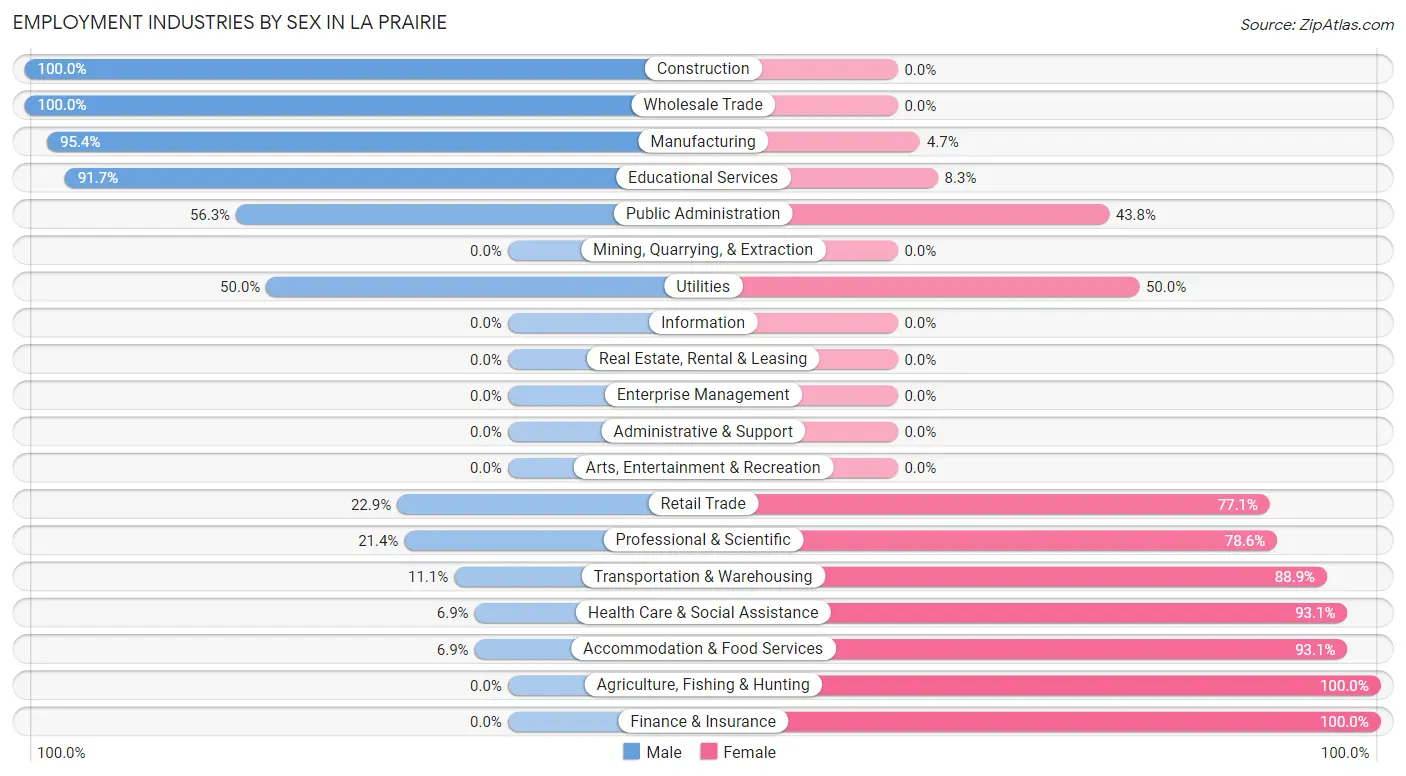
| Industry | Male | Female |
| Agriculture, Fishing & Hunting | 0 (0.0%) | 2 (100.0%) |
| Mining, Quarrying, & Extraction | 0 (0.0%) | 0 (0.0%) |
| Construction | 31 (100.0%) | 0 (0.0%) |
| Manufacturing | 41 (95.4%) | 2 (4.6%) |
| Wholesale Trade | 3 (100.0%) | 0 (0.0%) |
| Retail Trade | 11 (22.9%) | 37 (77.1%) |
| Transportation & Warehousing | 1 (11.1%) | 8 (88.9%) |
| Utilities | 2 (50.0%) | 2 (50.0%) |
| Information | 0 (0.0%) | 0 (0.0%) |
| Finance & Insurance | 0 (0.0%) | 7 (100.0%) |
| Real Estate, Rental & Leasing | 0 (0.0%) | 0 (0.0%) |
| Professional & Scientific | 3 (21.4%) | 11 (78.6%) |
| Enterprise Management | 0 (0.0%) | 0 (0.0%) |
| Administrative & Support | 0 (0.0%) | 0 (0.0%) |
| Educational Services | 11 (91.7%) | 1 (8.3%) |
| Health Care & Social Assistance | 4 (6.9%) | 54 (93.1%) |
| Arts, Entertainment & Recreation | 0 (0.0%) | 0 (0.0%) |
| Accommodation & Food Services | 2 (6.9%) | 27 (93.1%) |
| Public Administration | 9 (56.2%) | 7 (43.8%) |
| Total | 118 (42.4%) | 160 (57.6%) |
Education in La Prairie
School Enrollment in La Prairie
The most common levels of schooling among the 167 students in La Prairie are high school (51 | 30.5%), elementary school (43 | 25.8%), and college / undergraduate (36 | 21.6%).
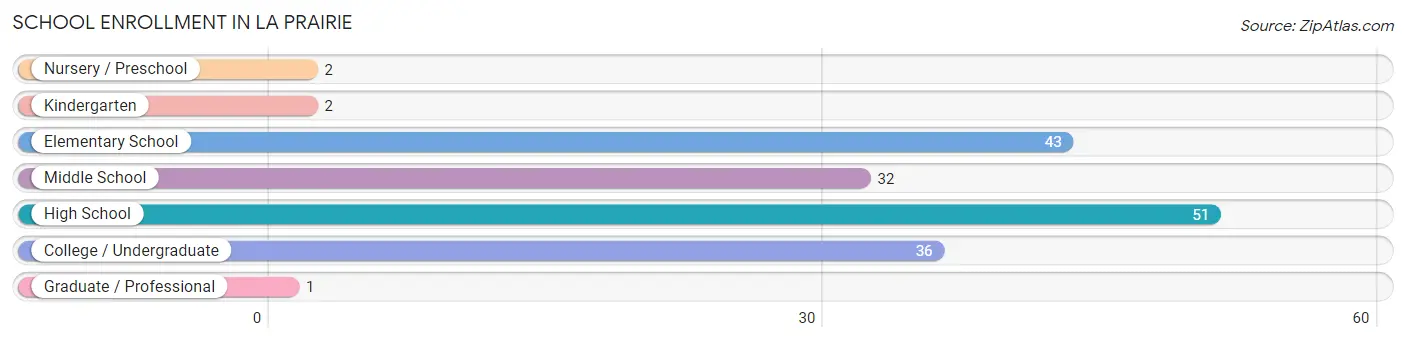
| School Level | # Students | % Students |
| Nursery / Preschool | 2 | 1.2% |
| Kindergarten | 2 | 1.2% |
| Elementary School | 43 | 25.8% |
| Middle School | 32 | 19.2% |
| High School | 51 | 30.5% |
| College / Undergraduate | 36 | 21.6% |
| Graduate / Professional | 1 | 0.6% |
| Total | 167 | 100.0% |
School Enrollment by Age by Funding Source in La Prairie
Out of a total of 167 students who are enrolled in schools in La Prairie, 25 (15.0%) attend a private institution, while the remaining 142 (85.0%) are enrolled in public schools. The age group of 25 to 34 year olds has the highest likelihood of being enrolled in private schools, with 1 (33.3% in the age bracket) enrolled. Conversely, the age group of 18 to 19 year olds has the lowest likelihood of being enrolled in a private school, with 8 (100.0% in the age bracket) attending a public institution.
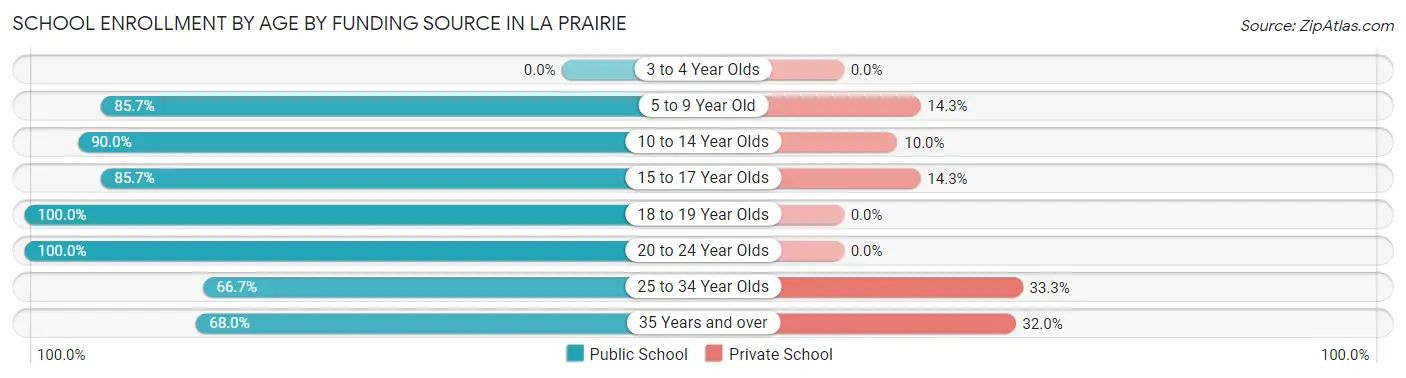
| Age Bracket | Public School | Private School |
| 3 to 4 Year Olds | 0 (0.0%) | 0 (0.0%) |
| 5 to 9 Year Old | 30 (85.7%) | 5 (14.3%) |
| 10 to 14 Year Olds | 45 (90.0%) | 5 (10.0%) |
| 15 to 17 Year Olds | 36 (85.7%) | 6 (14.3%) |
| 18 to 19 Year Olds | 8 (100.0%) | 0 (0.0%) |
| 20 to 24 Year Olds | 4 (100.0%) | 0 (0.0%) |
| 25 to 34 Year Olds | 2 (66.7%) | 1 (33.3%) |
| 35 Years and over | 17 (68.0%) | 8 (32.0%) |
| Total | 142 (85.0%) | 25 (15.0%) |
Educational Attainment by Field of Study in La Prairie
Business (17 | 23.3%), arts & humanities (15 | 20.5%), education (13 | 17.8%), social sciences (7 | 9.6%), and liberal arts & history (7 | 9.6%) are the most common fields of study among 73 individuals in La Prairie who have obtained a bachelor's degree or higher.
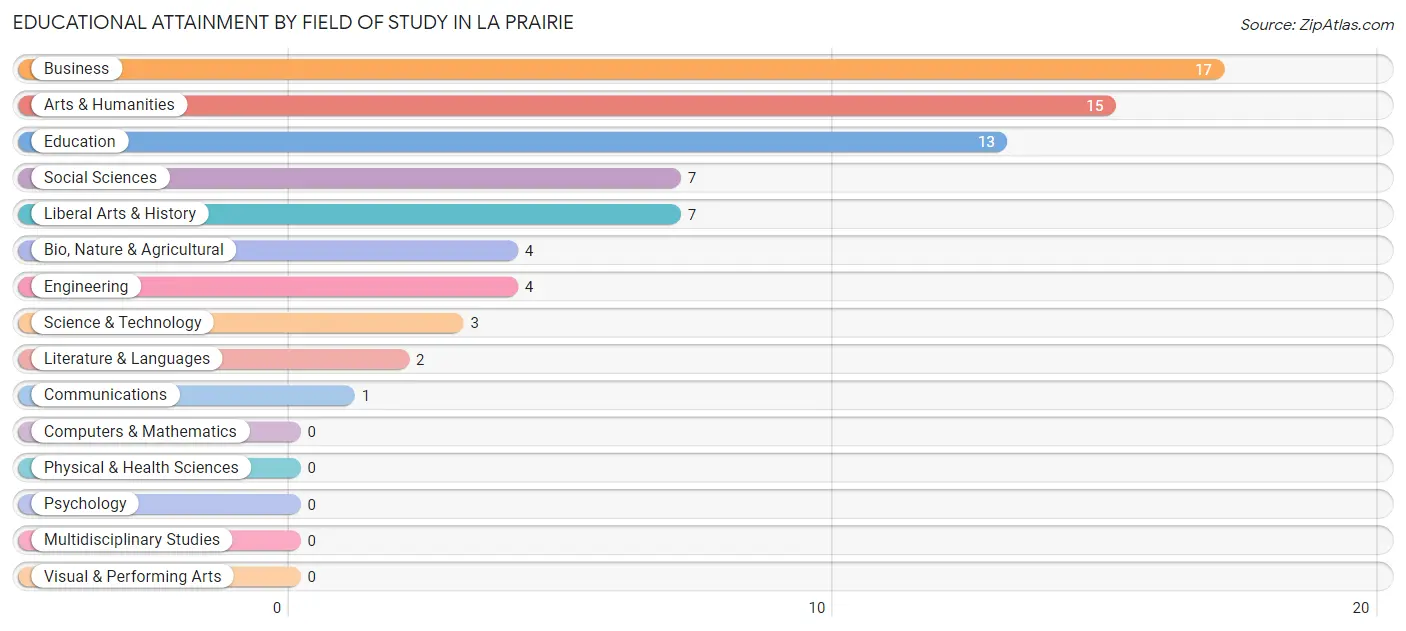
| Field of Study | # Graduates | % Graduates |
| Computers & Mathematics | 0 | 0.0% |
| Bio, Nature & Agricultural | 4 | 5.5% |
| Physical & Health Sciences | 0 | 0.0% |
| Psychology | 0 | 0.0% |
| Social Sciences | 7 | 9.6% |
| Engineering | 4 | 5.5% |
| Multidisciplinary Studies | 0 | 0.0% |
| Science & Technology | 3 | 4.1% |
| Business | 17 | 23.3% |
| Education | 13 | 17.8% |
| Literature & Languages | 2 | 2.7% |
| Liberal Arts & History | 7 | 9.6% |
| Visual & Performing Arts | 0 | 0.0% |
| Communications | 1 | 1.4% |
| Arts & Humanities | 15 | 20.5% |
| Total | 73 | 100.0% |
Transportation & Commute in La Prairie
Vehicle Availability by Sex in La Prairie
The most prevalent vehicle ownership categories in La Prairie are males with 3 vehicles (52, accounting for 44.8%) and females with 3 vehicles (50, making up 32.5%).
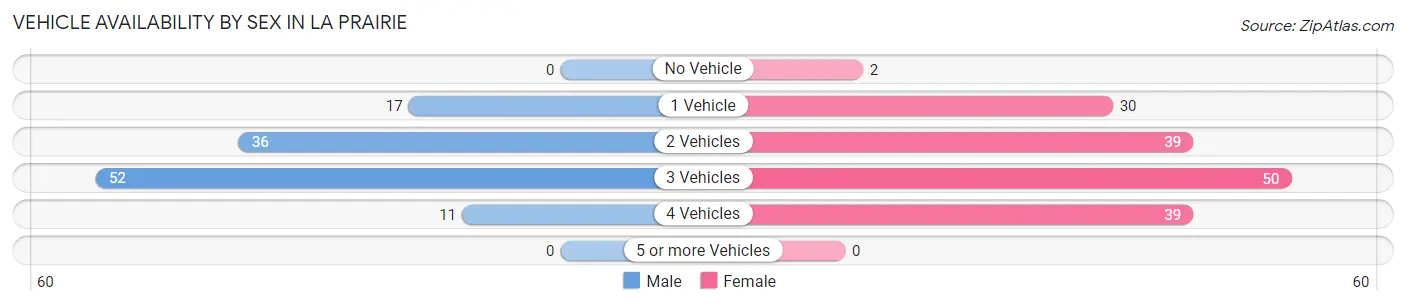
| Vehicles Available | Male | Female |
| No Vehicle | 0 (0.0%) | 2 (1.3%) |
| 1 Vehicle | 17 (14.7%) | 30 (18.8%) |
| 2 Vehicles | 36 (31.0%) | 39 (24.4%) |
| 3 Vehicles | 52 (44.8%) | 50 (31.2%) |
| 4 Vehicles | 11 (9.5%) | 39 (24.4%) |
| 5 or more Vehicles | 0 (0.0%) | 0 (0.0%) |
| Total | 116 (100.0%) | 160 (100.0%) |
Commute Time in La Prairie
The most frequently occuring commute durations in La Prairie are 10 to 14 minutes (91 commuters, 33.7%), 5 to 9 minutes (73 commuters, 27.0%), and 15 to 19 minutes (40 commuters, 14.8%).
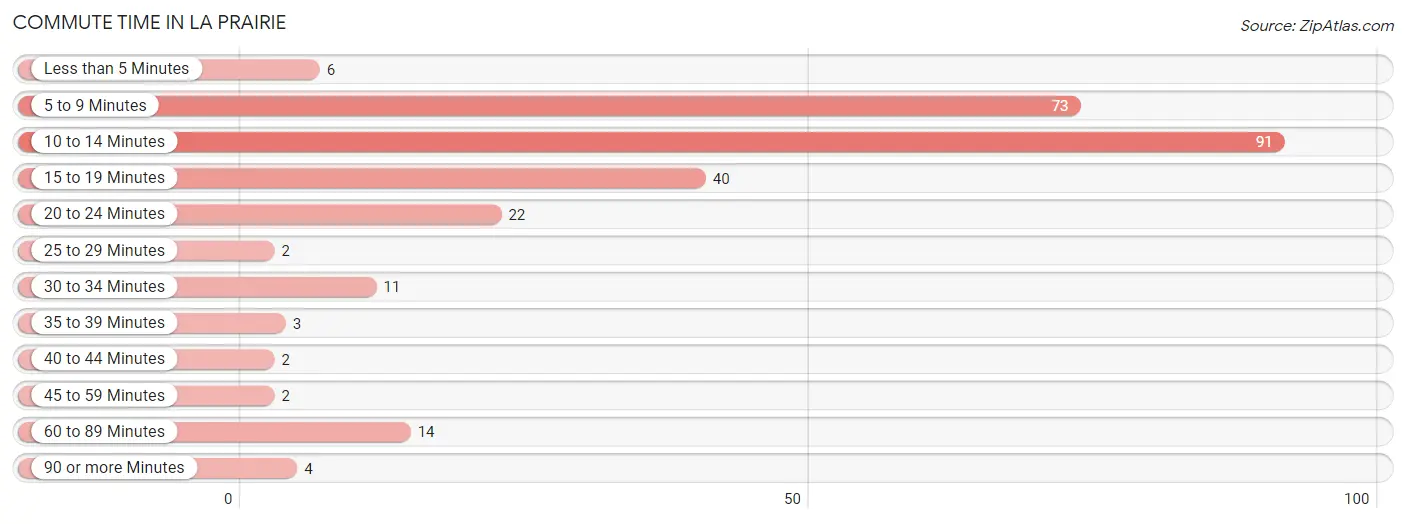
| Commute Time | # Commuters | % Commuters |
| Less than 5 Minutes | 6 | 2.2% |
| 5 to 9 Minutes | 73 | 27.0% |
| 10 to 14 Minutes | 91 | 33.7% |
| 15 to 19 Minutes | 40 | 14.8% |
| 20 to 24 Minutes | 22 | 8.2% |
| 25 to 29 Minutes | 2 | 0.7% |
| 30 to 34 Minutes | 11 | 4.1% |
| 35 to 39 Minutes | 3 | 1.1% |
| 40 to 44 Minutes | 2 | 0.7% |
| 45 to 59 Minutes | 2 | 0.7% |
| 60 to 89 Minutes | 14 | 5.2% |
| 90 or more Minutes | 4 | 1.5% |
Commute Time by Sex in La Prairie
The most common commute times in La Prairie are 10 to 14 minutes (44 commuters, 39.3%) for males and 5 to 9 minutes (51 commuters, 32.3%) for females.
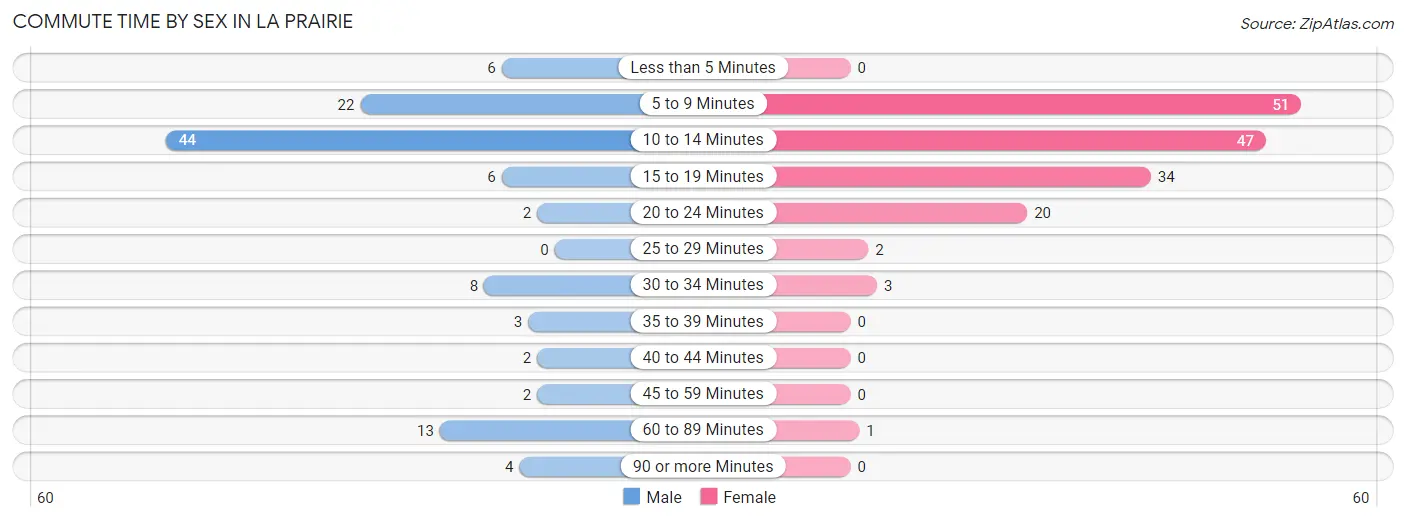
| Commute Time | Male | Female |
| Less than 5 Minutes | 6 (5.4%) | 0 (0.0%) |
| 5 to 9 Minutes | 22 (19.6%) | 51 (32.3%) |
| 10 to 14 Minutes | 44 (39.3%) | 47 (29.7%) |
| 15 to 19 Minutes | 6 (5.4%) | 34 (21.5%) |
| 20 to 24 Minutes | 2 (1.8%) | 20 (12.7%) |
| 25 to 29 Minutes | 0 (0.0%) | 2 (1.3%) |
| 30 to 34 Minutes | 8 (7.1%) | 3 (1.9%) |
| 35 to 39 Minutes | 3 (2.7%) | 0 (0.0%) |
| 40 to 44 Minutes | 2 (1.8%) | 0 (0.0%) |
| 45 to 59 Minutes | 2 (1.8%) | 0 (0.0%) |
| 60 to 89 Minutes | 13 (11.6%) | 1 (0.6%) |
| 90 or more Minutes | 4 (3.6%) | 0 (0.0%) |
Time of Departure to Work by Sex in La Prairie
The most frequent times of departure to work in La Prairie are 6:30 AM to 6:59 AM (35, 31.2%) for males and 6:00 AM to 6:29 AM (24, 15.2%) for females.
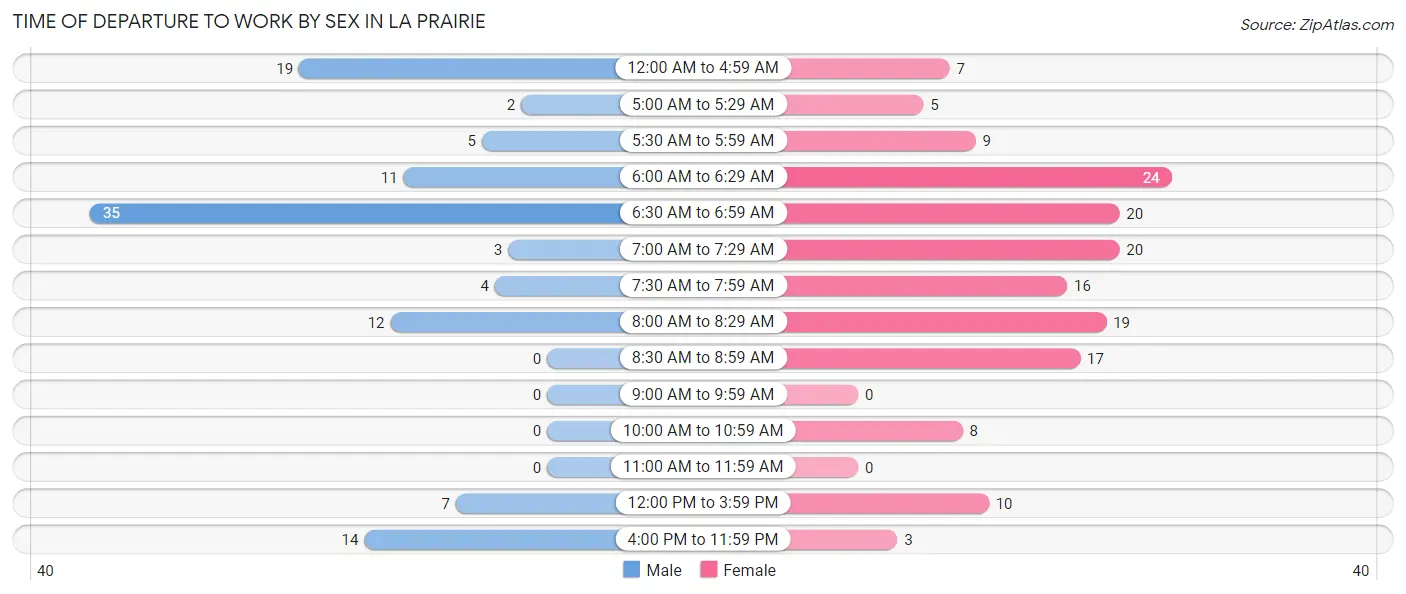
| Time of Departure | Male | Female |
| 12:00 AM to 4:59 AM | 19 (17.0%) | 7 (4.4%) |
| 5:00 AM to 5:29 AM | 2 (1.8%) | 5 (3.2%) |
| 5:30 AM to 5:59 AM | 5 (4.5%) | 9 (5.7%) |
| 6:00 AM to 6:29 AM | 11 (9.8%) | 24 (15.2%) |
| 6:30 AM to 6:59 AM | 35 (31.2%) | 20 (12.7%) |
| 7:00 AM to 7:29 AM | 3 (2.7%) | 20 (12.7%) |
| 7:30 AM to 7:59 AM | 4 (3.6%) | 16 (10.1%) |
| 8:00 AM to 8:29 AM | 12 (10.7%) | 19 (12.0%) |
| 8:30 AM to 8:59 AM | 0 (0.0%) | 17 (10.8%) |
| 9:00 AM to 9:59 AM | 0 (0.0%) | 0 (0.0%) |
| 10:00 AM to 10:59 AM | 0 (0.0%) | 8 (5.1%) |
| 11:00 AM to 11:59 AM | 0 (0.0%) | 0 (0.0%) |
| 12:00 PM to 3:59 PM | 7 (6.2%) | 10 (6.3%) |
| 4:00 PM to 11:59 PM | 14 (12.5%) | 3 (1.9%) |
| Total | 112 (100.0%) | 158 (100.0%) |
Housing Occupancy in La Prairie
Occupancy by Ownership in La Prairie
Of the total 260 dwellings in La Prairie, owner-occupied units account for 220 (84.6%), while renter-occupied units make up 40 (15.4%).
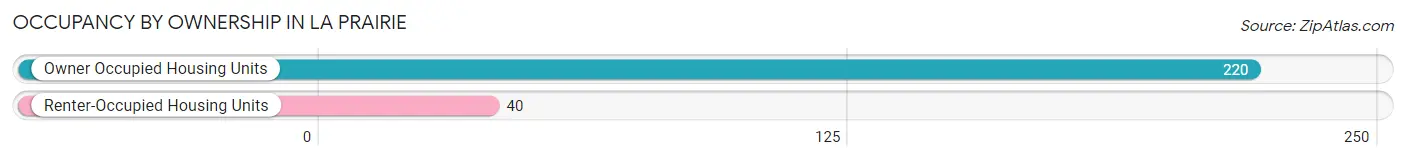
| Occupancy | # Housing Units | % Housing Units |
| Owner Occupied Housing Units | 220 | 84.6% |
| Renter-Occupied Housing Units | 40 | 15.4% |
| Total Occupied Housing Units | 260 | 100.0% |
Occupancy by Household Size in La Prairie
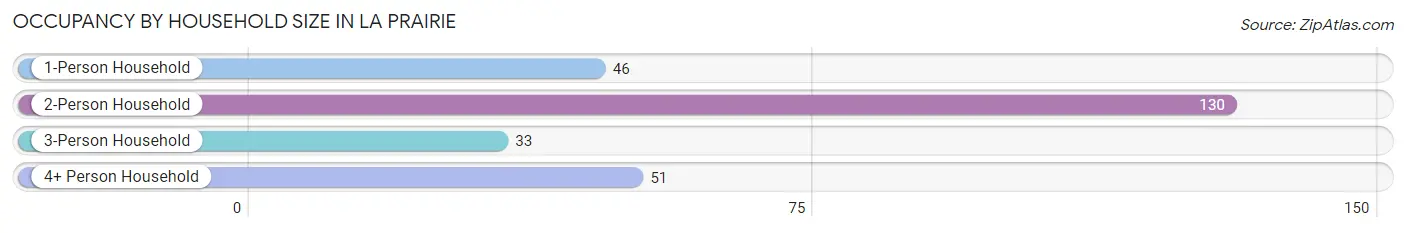
| Household Size | # Housing Units | % Housing Units |
| 1-Person Household | 46 | 17.7% |
| 2-Person Household | 130 | 50.0% |
| 3-Person Household | 33 | 12.7% |
| 4+ Person Household | 51 | 19.6% |
| Total Housing Units | 260 | 100.0% |
Occupancy by Ownership by Household Size in La Prairie
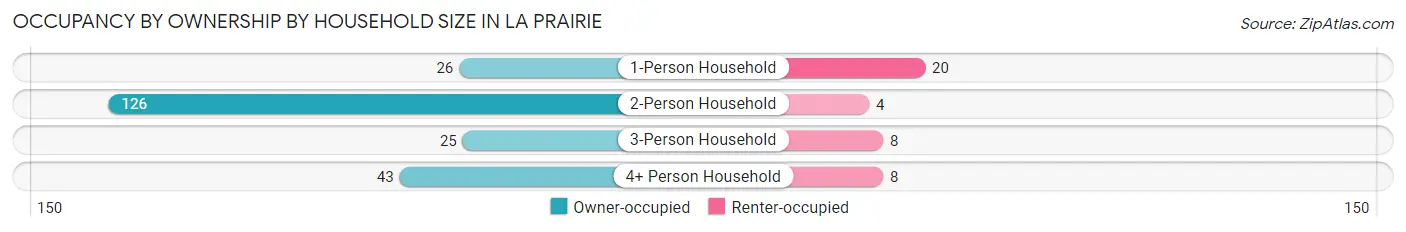
| Household Size | Owner-occupied | Renter-occupied |
| 1-Person Household | 26 (56.5%) | 20 (43.5%) |
| 2-Person Household | 126 (96.9%) | 4 (3.1%) |
| 3-Person Household | 25 (75.8%) | 8 (24.2%) |
| 4+ Person Household | 43 (84.3%) | 8 (15.7%) |
| Total Housing Units | 220 (84.6%) | 40 (15.4%) |
Occupancy by Educational Attainment in La Prairie
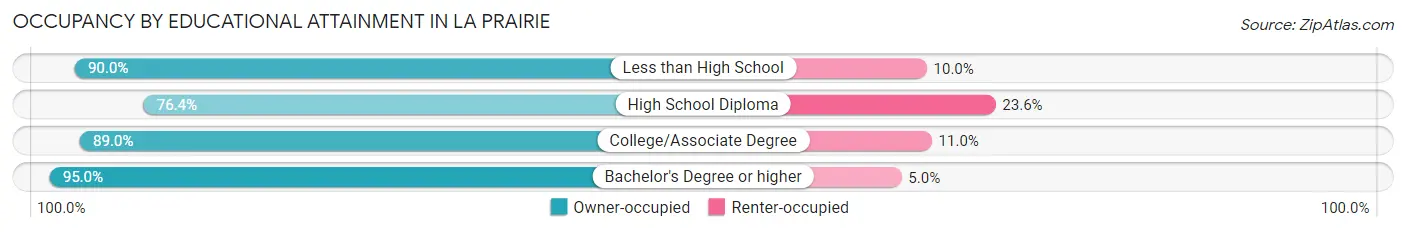
| Household Size | Owner-occupied | Renter-occupied |
| Less than High School | 9 (90.0%) | 1 (10.0%) |
| High School Diploma | 84 (76.4%) | 26 (23.6%) |
| College/Associate Degree | 89 (89.0%) | 11 (11.0%) |
| Bachelor's Degree or higher | 38 (95.0%) | 2 (5.0%) |
Occupancy by Age of Householder in La Prairie
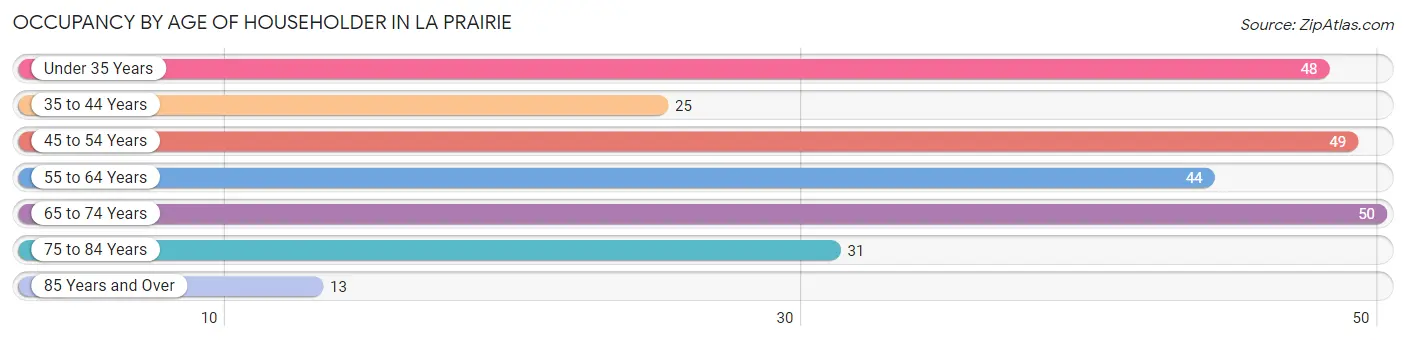
| Age Bracket | # Households | % Households |
| Under 35 Years | 48 | 18.5% |
| 35 to 44 Years | 25 | 9.6% |
| 45 to 54 Years | 49 | 18.9% |
| 55 to 64 Years | 44 | 16.9% |
| 65 to 74 Years | 50 | 19.2% |
| 75 to 84 Years | 31 | 11.9% |
| 85 Years and Over | 13 | 5.0% |
| Total | 260 | 100.0% |
Housing Finances in La Prairie
Median Income by Occupancy in La Prairie
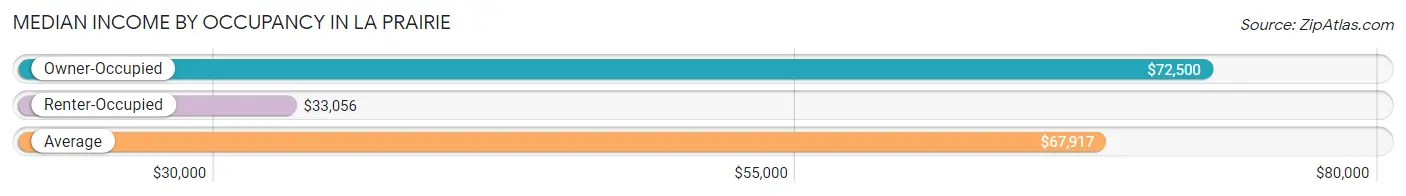
| Occupancy Type | # Households | Median Income |
| Owner-Occupied | 220 (84.6%) | $72,500 |
| Renter-Occupied | 40 (15.4%) | $33,056 |
| Average | 260 (100.0%) | $67,917 |
Occupancy by Householder Income Bracket in La Prairie
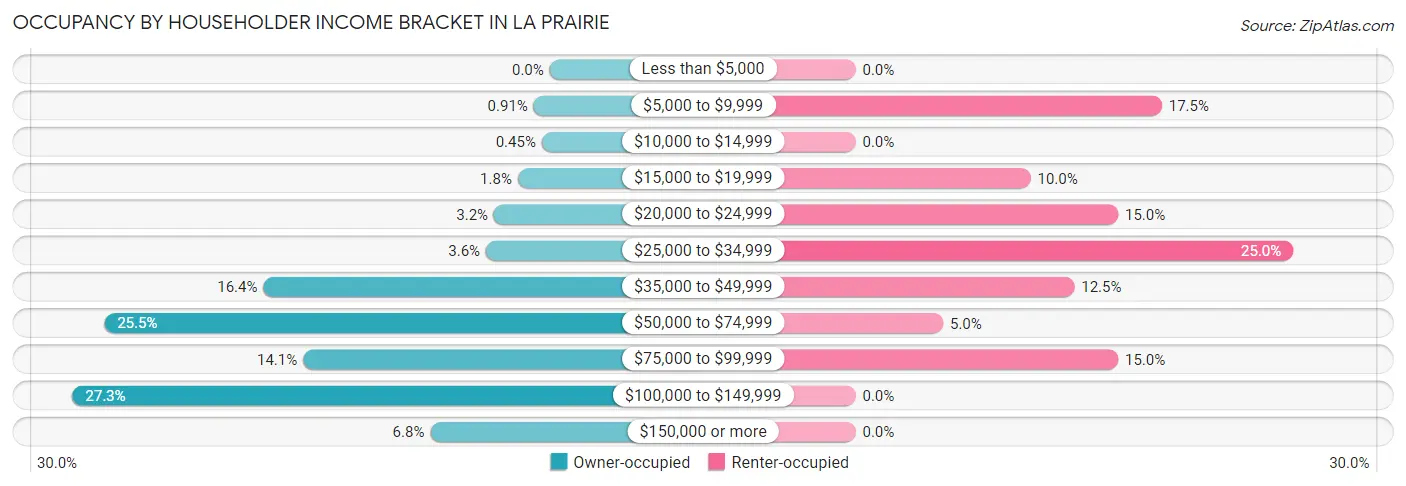
| Income Bracket | Owner-occupied | Renter-occupied |
| Less than $5,000 | 0 (0.0%) | 0 (0.0%) |
| $5,000 to $9,999 | 2 (0.9%) | 7 (17.5%) |
| $10,000 to $14,999 | 1 (0.4%) | 0 (0.0%) |
| $15,000 to $19,999 | 4 (1.8%) | 4 (10.0%) |
| $20,000 to $24,999 | 7 (3.2%) | 6 (15.0%) |
| $25,000 to $34,999 | 8 (3.6%) | 10 (25.0%) |
| $35,000 to $49,999 | 36 (16.4%) | 5 (12.5%) |
| $50,000 to $74,999 | 56 (25.5%) | 2 (5.0%) |
| $75,000 to $99,999 | 31 (14.1%) | 6 (15.0%) |
| $100,000 to $149,999 | 60 (27.3%) | 0 (0.0%) |
| $150,000 or more | 15 (6.8%) | 0 (0.0%) |
| Total | 220 (100.0%) | 40 (100.0%) |
Monthly Housing Cost Tiers in La Prairie
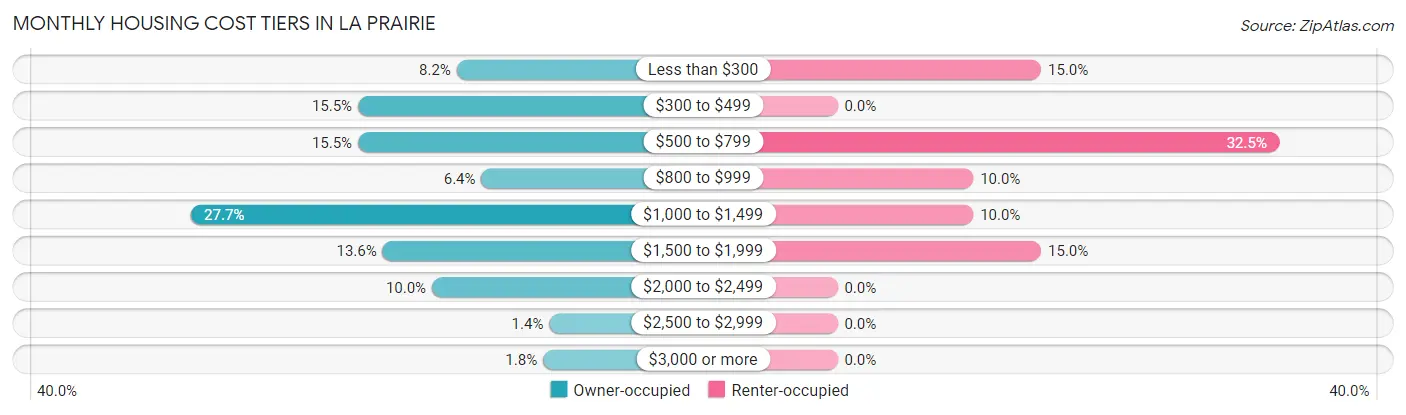
| Monthly Cost | Owner-occupied | Renter-occupied |
| Less than $300 | 18 (8.2%) | 6 (15.0%) |
| $300 to $499 | 34 (15.4%) | 0 (0.0%) |
| $500 to $799 | 34 (15.4%) | 13 (32.5%) |
| $800 to $999 | 14 (6.4%) | 4 (10.0%) |
| $1,000 to $1,499 | 61 (27.7%) | 4 (10.0%) |
| $1,500 to $1,999 | 30 (13.6%) | 6 (15.0%) |
| $2,000 to $2,499 | 22 (10.0%) | 0 (0.0%) |
| $2,500 to $2,999 | 3 (1.4%) | 0 (0.0%) |
| $3,000 or more | 4 (1.8%) | 0 (0.0%) |
| Total | 220 (100.0%) | 40 (100.0%) |
Physical Housing Characteristics in La Prairie
Housing Structures in La Prairie
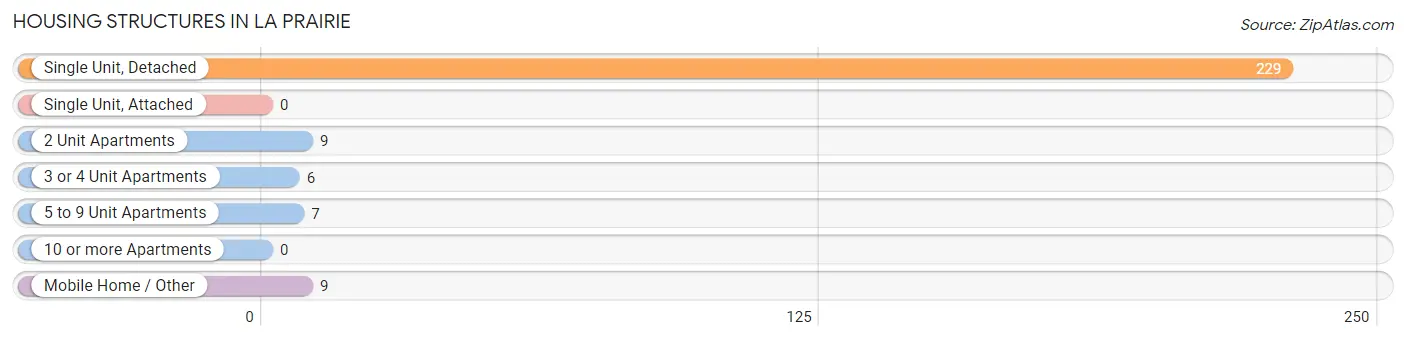
| Structure Type | # Housing Units | % Housing Units |
| Single Unit, Detached | 229 | 88.1% |
| Single Unit, Attached | 0 | 0.0% |
| 2 Unit Apartments | 9 | 3.5% |
| 3 or 4 Unit Apartments | 6 | 2.3% |
| 5 to 9 Unit Apartments | 7 | 2.7% |
| 10 or more Apartments | 0 | 0.0% |
| Mobile Home / Other | 9 | 3.5% |
| Total | 260 | 100.0% |
Housing Structures by Occupancy in La Prairie
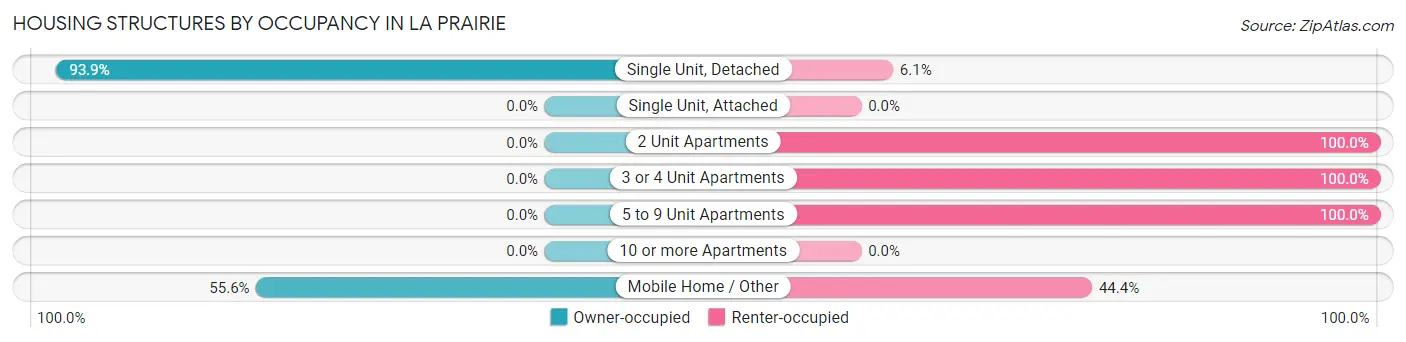
| Structure Type | Owner-occupied | Renter-occupied |
| Single Unit, Detached | 215 (93.9%) | 14 (6.1%) |
| Single Unit, Attached | 0 (0.0%) | 0 (0.0%) |
| 2 Unit Apartments | 0 (0.0%) | 9 (100.0%) |
| 3 or 4 Unit Apartments | 0 (0.0%) | 6 (100.0%) |
| 5 to 9 Unit Apartments | 0 (0.0%) | 7 (100.0%) |
| 10 or more Apartments | 0 (0.0%) | 0 (0.0%) |
| Mobile Home / Other | 5 (55.6%) | 4 (44.4%) |
| Total | 220 (84.6%) | 40 (15.4%) |
Housing Structures by Number of Rooms in La Prairie
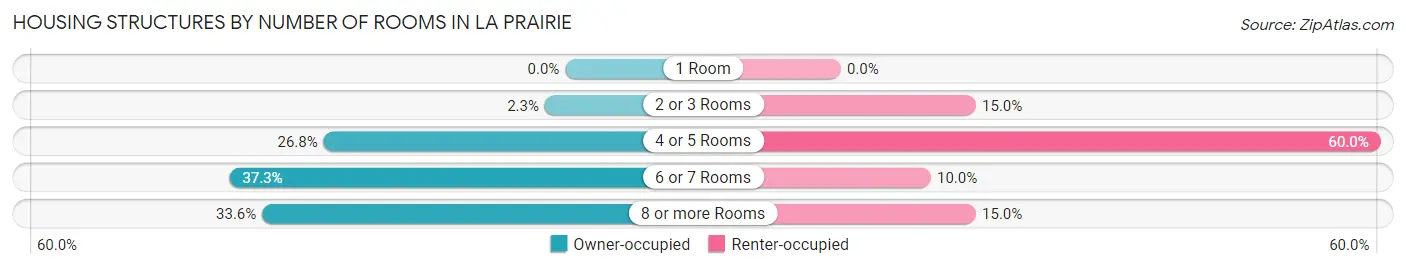
| Number of Rooms | Owner-occupied | Renter-occupied |
| 1 Room | 0 (0.0%) | 0 (0.0%) |
| 2 or 3 Rooms | 5 (2.3%) | 6 (15.0%) |
| 4 or 5 Rooms | 59 (26.8%) | 24 (60.0%) |
| 6 or 7 Rooms | 82 (37.3%) | 4 (10.0%) |
| 8 or more Rooms | 74 (33.6%) | 6 (15.0%) |
| Total | 220 (100.0%) | 40 (100.0%) |
Housing Structure by Heating Type in La Prairie
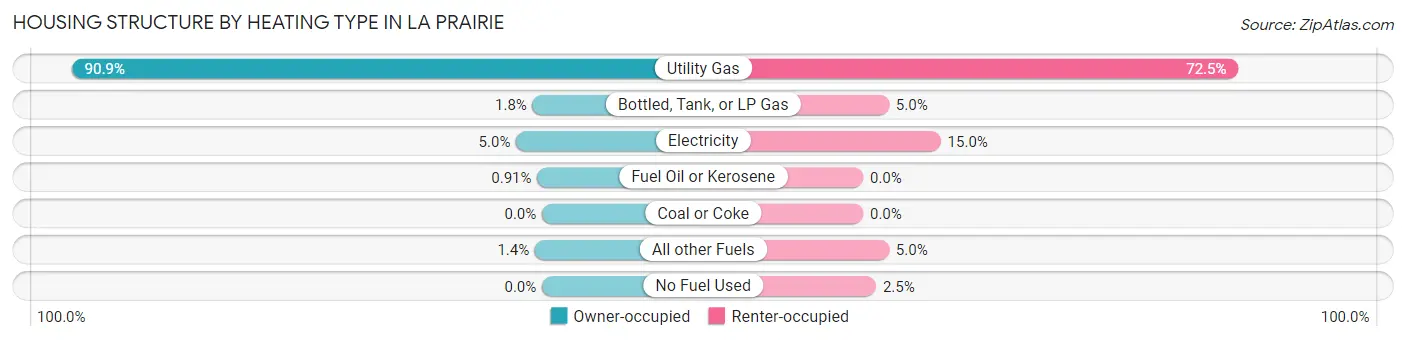
| Heating Type | Owner-occupied | Renter-occupied |
| Utility Gas | 200 (90.9%) | 29 (72.5%) |
| Bottled, Tank, or LP Gas | 4 (1.8%) | 2 (5.0%) |
| Electricity | 11 (5.0%) | 6 (15.0%) |
| Fuel Oil or Kerosene | 2 (0.9%) | 0 (0.0%) |
| Coal or Coke | 0 (0.0%) | 0 (0.0%) |
| All other Fuels | 3 (1.4%) | 2 (5.0%) |
| No Fuel Used | 0 (0.0%) | 1 (2.5%) |
| Total | 220 (100.0%) | 40 (100.0%) |
Household Vehicle Usage in La Prairie
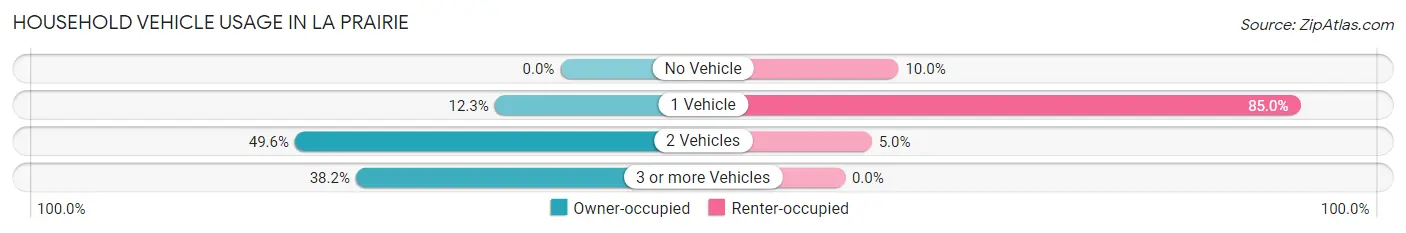
| Vehicles per Household | Owner-occupied | Renter-occupied |
| No Vehicle | 0 (0.0%) | 4 (10.0%) |
| 1 Vehicle | 27 (12.3%) | 34 (85.0%) |
| 2 Vehicles | 109 (49.5%) | 2 (5.0%) |
| 3 or more Vehicles | 84 (38.2%) | 0 (0.0%) |
| Total | 220 (100.0%) | 40 (100.0%) |
Real Estate & Mortgages in La Prairie
Real Estate and Mortgage Overview in La Prairie
| Characteristic | Without Mortgage | With Mortgage |
| Housing Units | 85 | 135 |
| Median Property Value | $196,300 | $182,300 |
| Median Household Income | $60,208 | $8 |
| Monthly Housing Costs | $453 | $4 |
| Real Estate Taxes | $1,931 | $0 |
Property Value by Mortgage Status in La Prairie
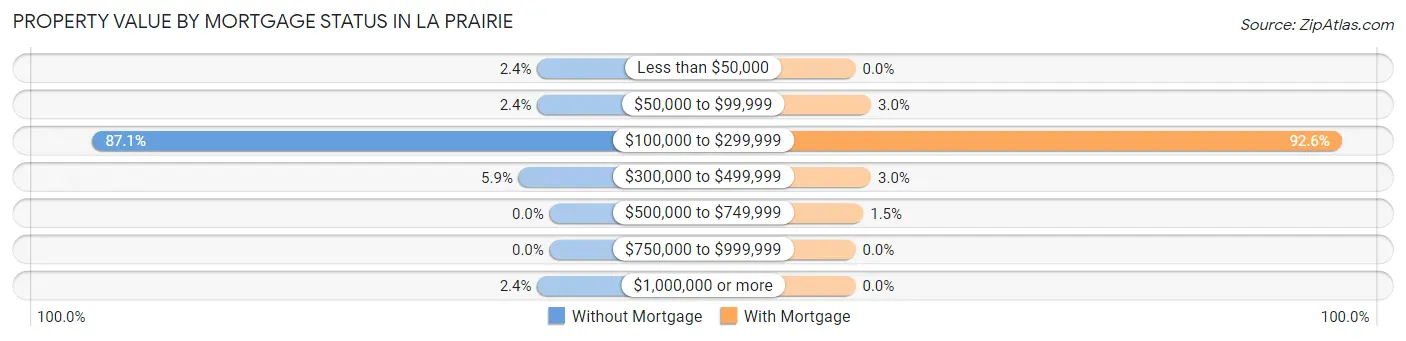
| Property Value | Without Mortgage | With Mortgage |
| Less than $50,000 | 2 (2.4%) | 0 (0.0%) |
| $50,000 to $99,999 | 2 (2.4%) | 4 (3.0%) |
| $100,000 to $299,999 | 74 (87.1%) | 125 (92.6%) |
| $300,000 to $499,999 | 5 (5.9%) | 4 (3.0%) |
| $500,000 to $749,999 | 0 (0.0%) | 2 (1.5%) |
| $750,000 to $999,999 | 0 (0.0%) | 0 (0.0%) |
| $1,000,000 or more | 2 (2.4%) | 0 (0.0%) |
| Total | 85 (100.0%) | 135 (100.0%) |
Household Income by Mortgage Status in La Prairie
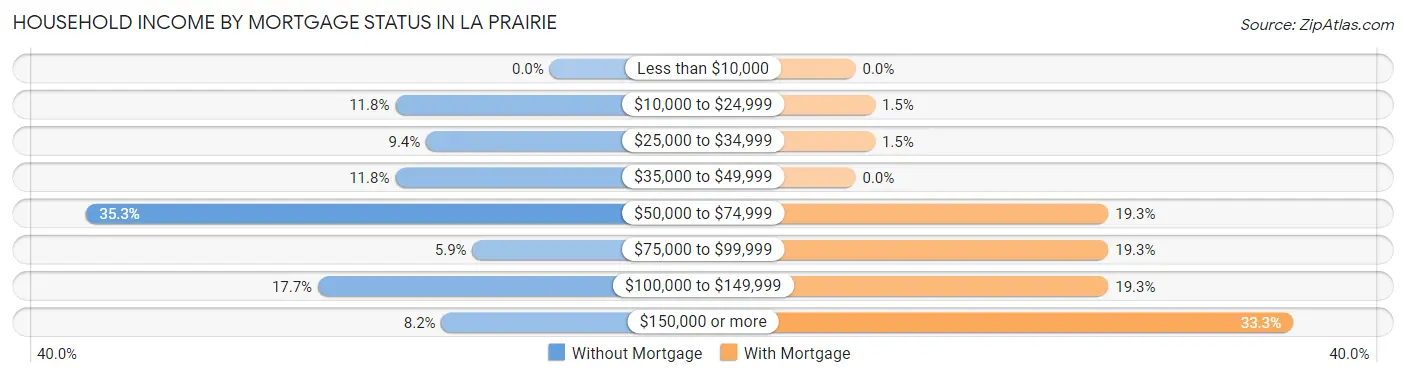
| Household Income | Without Mortgage | With Mortgage |
| Less than $10,000 | 0 (0.0%) | 0 (0.0%) |
| $10,000 to $24,999 | 10 (11.8%) | 2 (1.5%) |
| $25,000 to $34,999 | 8 (9.4%) | 2 (1.5%) |
| $35,000 to $49,999 | 10 (11.8%) | 0 (0.0%) |
| $50,000 to $74,999 | 30 (35.3%) | 26 (19.3%) |
| $75,000 to $99,999 | 5 (5.9%) | 26 (19.3%) |
| $100,000 to $149,999 | 15 (17.6%) | 26 (19.3%) |
| $150,000 or more | 7 (8.2%) | 45 (33.3%) |
| Total | 85 (100.0%) | 135 (100.0%) |
Property Value to Household Income Ratio in La Prairie
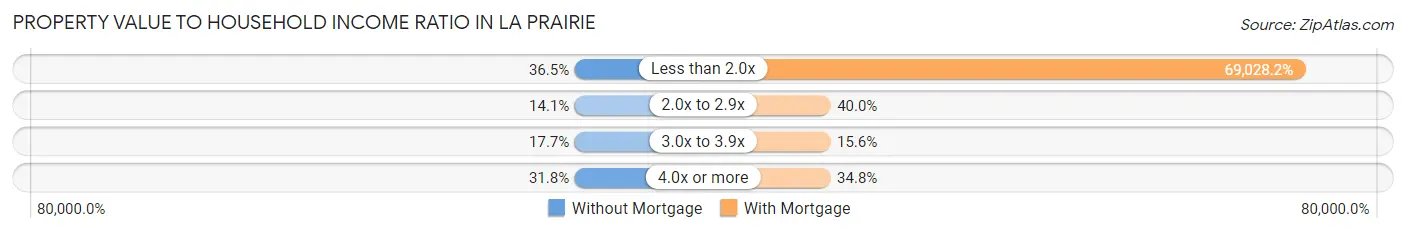
| Value-to-Income Ratio | Without Mortgage | With Mortgage |
| Less than 2.0x | 31 (36.5%) | 93,188 (69,028.2%) |
| 2.0x to 2.9x | 12 (14.1%) | 54 (40.0%) |
| 3.0x to 3.9x | 15 (17.6%) | 21 (15.6%) |
| 4.0x or more | 27 (31.8%) | 47 (34.8%) |
| Total | 85 (100.0%) | 135 (100.0%) |
Real Estate Taxes by Mortgage Status in La Prairie
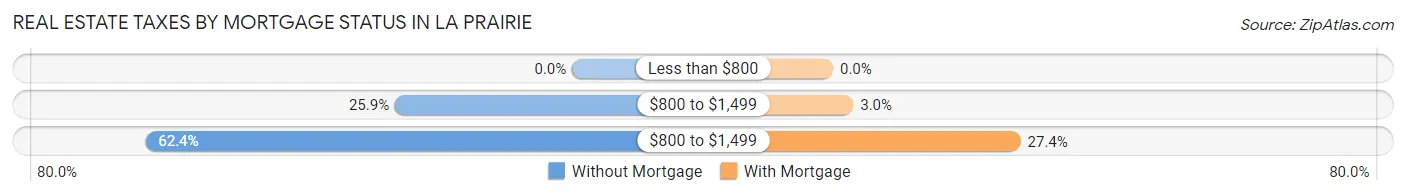
| Property Taxes | Without Mortgage | With Mortgage |
| Less than $800 | 0 (0.0%) | 0 (0.0%) |
| $800 to $1,499 | 22 (25.9%) | 4 (3.0%) |
| $800 to $1,499 | 53 (62.4%) | 37 (27.4%) |
| Total | 85 (100.0%) | 135 (100.0%) |
Health & Disability in La Prairie
Health Insurance Coverage by Age in La Prairie
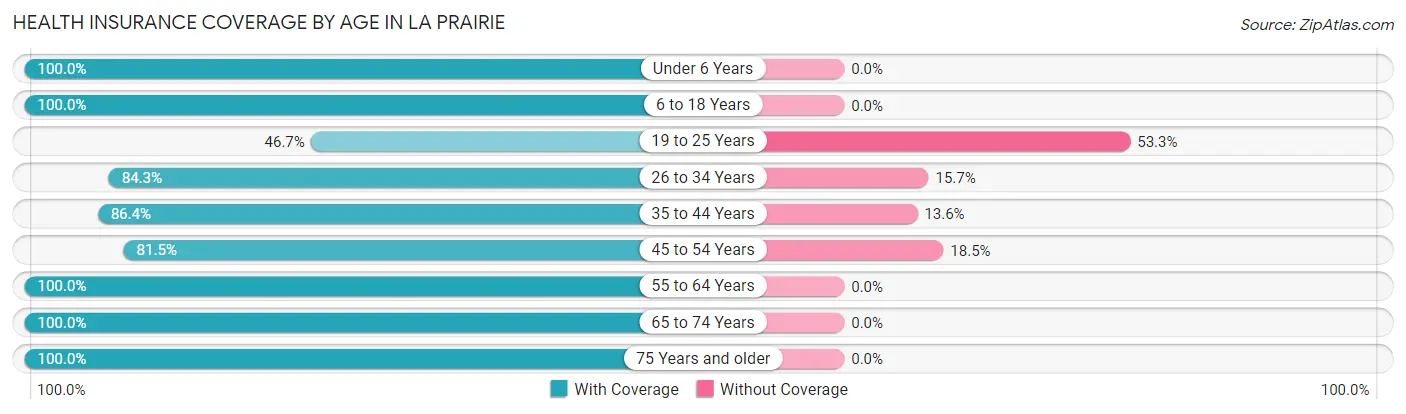
| Age Bracket | With Coverage | Without Coverage |
| Under 6 Years | 28 (100.0%) | 0 (0.0%) |
| 6 to 18 Years | 133 (100.0%) | 0 (0.0%) |
| 19 to 25 Years | 7 (46.7%) | 8 (53.3%) |
| 26 to 34 Years | 59 (84.3%) | 11 (15.7%) |
| 35 to 44 Years | 38 (86.4%) | 6 (13.6%) |
| 45 to 54 Years | 75 (81.5%) | 17 (18.5%) |
| 55 to 64 Years | 81 (100.0%) | 0 (0.0%) |
| 65 to 74 Years | 87 (100.0%) | 0 (0.0%) |
| 75 Years and older | 72 (100.0%) | 0 (0.0%) |
| Total | 580 (93.2%) | 42 (6.8%) |
Health Insurance Coverage by Citizenship Status in La Prairie
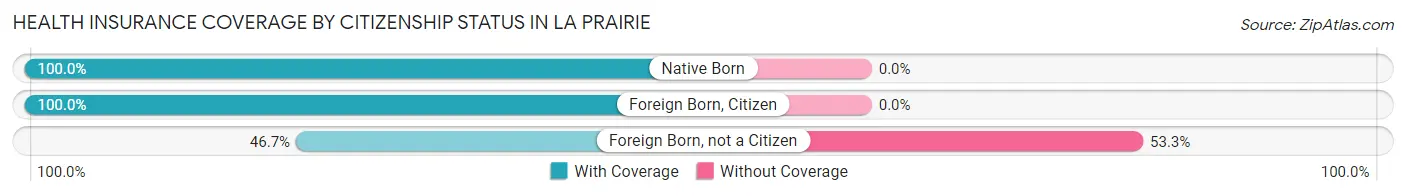
| Citizenship Status | With Coverage | Without Coverage |
| Native Born | 28 (100.0%) | 0 (0.0%) |
| Foreign Born, Citizen | 133 (100.0%) | 0 (0.0%) |
| Foreign Born, not a Citizen | 7 (46.7%) | 8 (53.3%) |
Health Insurance Coverage by Household Income in La Prairie
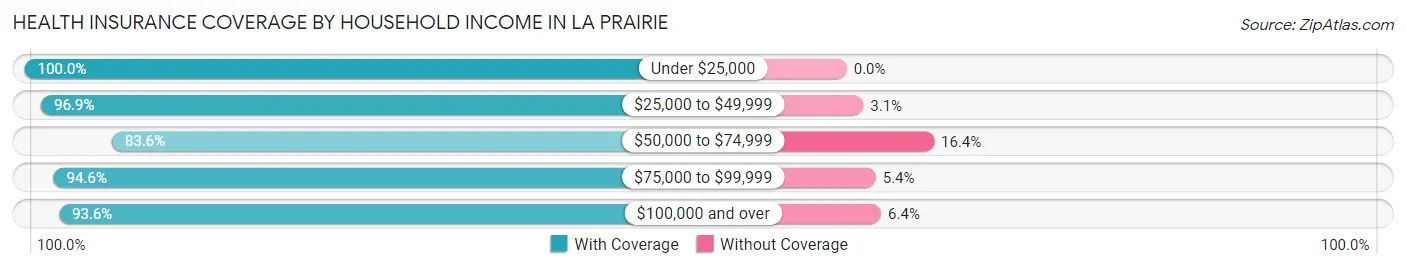
| Household Income | With Coverage | Without Coverage |
| Under $25,000 | 58 (100.0%) | 0 (0.0%) |
| $25,000 to $49,999 | 125 (96.9%) | 4 (3.1%) |
| $50,000 to $74,999 | 92 (83.6%) | 18 (16.4%) |
| $75,000 to $99,999 | 87 (94.6%) | 5 (5.4%) |
| $100,000 and over | 218 (93.6%) | 15 (6.4%) |
Public vs Private Health Insurance Coverage by Age in La Prairie
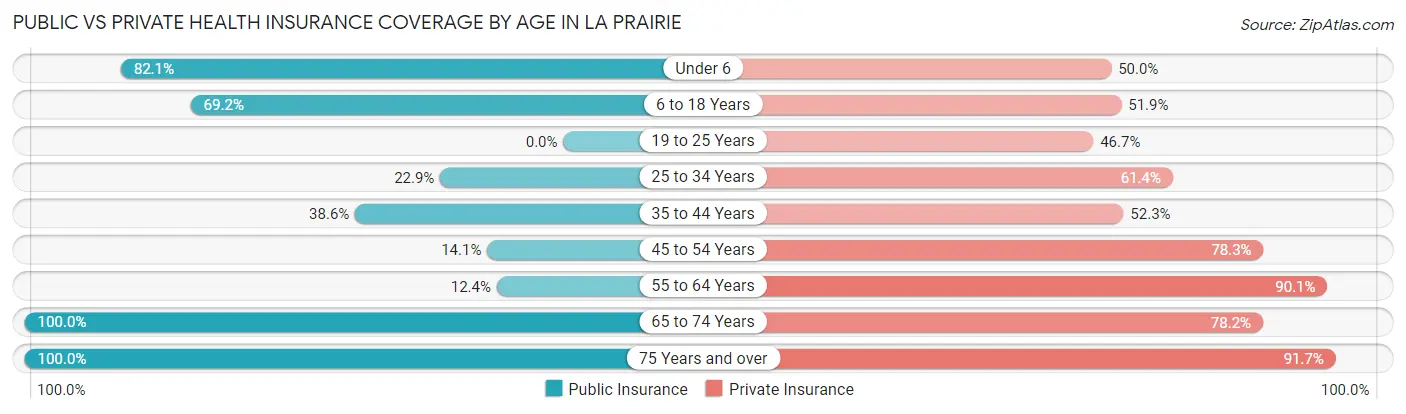
| Age Bracket | Public Insurance | Private Insurance |
| Under 6 | 23 (82.1%) | 14 (50.0%) |
| 6 to 18 Years | 92 (69.2%) | 69 (51.9%) |
| 19 to 25 Years | 0 (0.0%) | 7 (46.7%) |
| 25 to 34 Years | 16 (22.9%) | 43 (61.4%) |
| 35 to 44 Years | 17 (38.6%) | 23 (52.3%) |
| 45 to 54 Years | 13 (14.1%) | 72 (78.3%) |
| 55 to 64 Years | 10 (12.3%) | 73 (90.1%) |
| 65 to 74 Years | 87 (100.0%) | 68 (78.2%) |
| 75 Years and over | 72 (100.0%) | 66 (91.7%) |
| Total | 330 (53.0%) | 435 (69.9%) |
Disability Status by Sex by Age in La Prairie
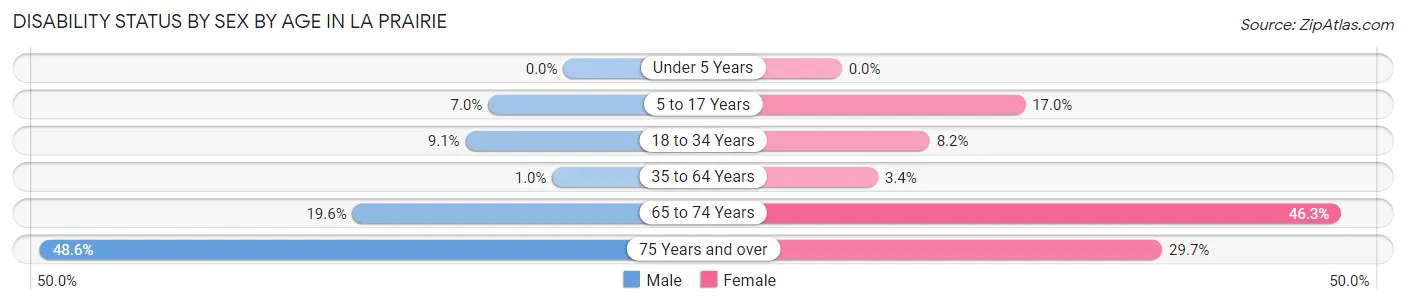
| Age Bracket | Male | Female |
| Under 5 Years | 0 (0.0%) | 0 (0.0%) |
| 5 to 17 Years | 6 (7.0%) | 8 (17.0%) |
| 18 to 34 Years | 4 (9.1%) | 4 (8.2%) |
| 35 to 64 Years | 1 (1.0%) | 4 (3.4%) |
| 65 to 74 Years | 9 (19.6%) | 19 (46.3%) |
| 75 Years and over | 17 (48.6%) | 11 (29.7%) |
Disability Class by Sex by Age in La Prairie
Disability Class: Hearing Difficulty
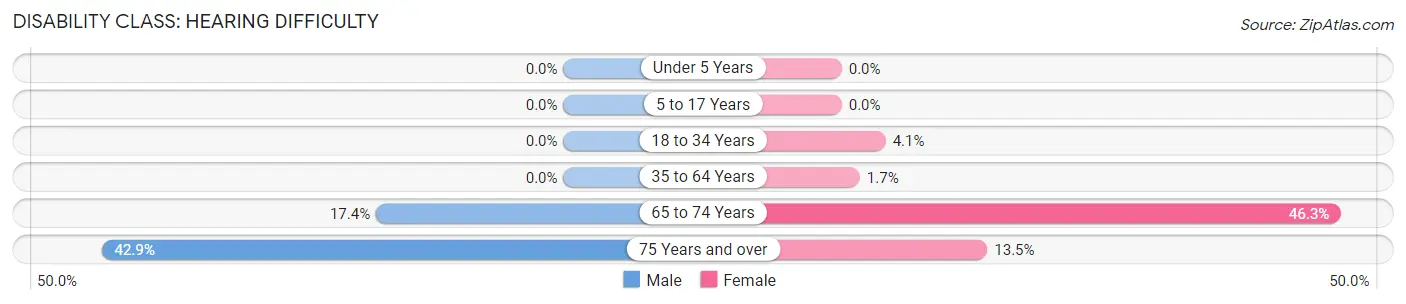
| Age Bracket | Male | Female |
| Under 5 Years | 0 (0.0%) | 0 (0.0%) |
| 5 to 17 Years | 0 (0.0%) | 0 (0.0%) |
| 18 to 34 Years | 0 (0.0%) | 2 (4.1%) |
| 35 to 64 Years | 0 (0.0%) | 2 (1.7%) |
| 65 to 74 Years | 8 (17.4%) | 19 (46.3%) |
| 75 Years and over | 15 (42.9%) | 5 (13.5%) |
Disability Class: Vision Difficulty
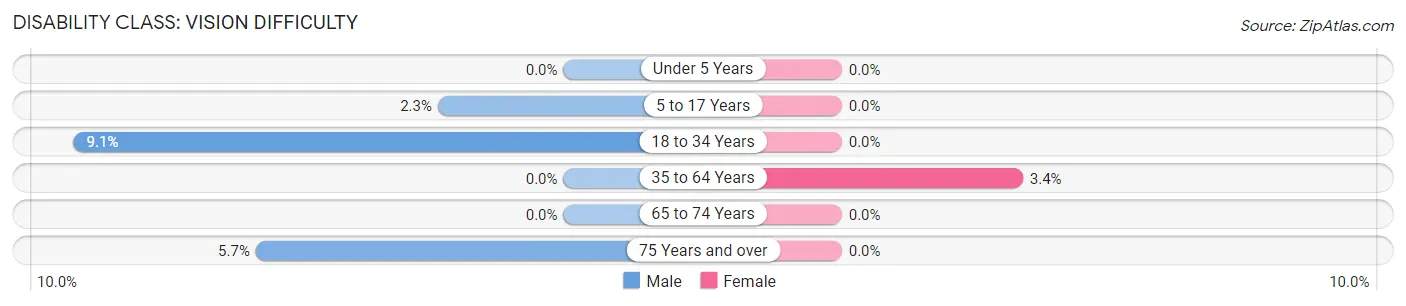
| Age Bracket | Male | Female |
| Under 5 Years | 0 (0.0%) | 0 (0.0%) |
| 5 to 17 Years | 2 (2.3%) | 0 (0.0%) |
| 18 to 34 Years | 4 (9.1%) | 0 (0.0%) |
| 35 to 64 Years | 0 (0.0%) | 4 (3.4%) |
| 65 to 74 Years | 0 (0.0%) | 0 (0.0%) |
| 75 Years and over | 2 (5.7%) | 0 (0.0%) |
Disability Class: Cognitive Difficulty
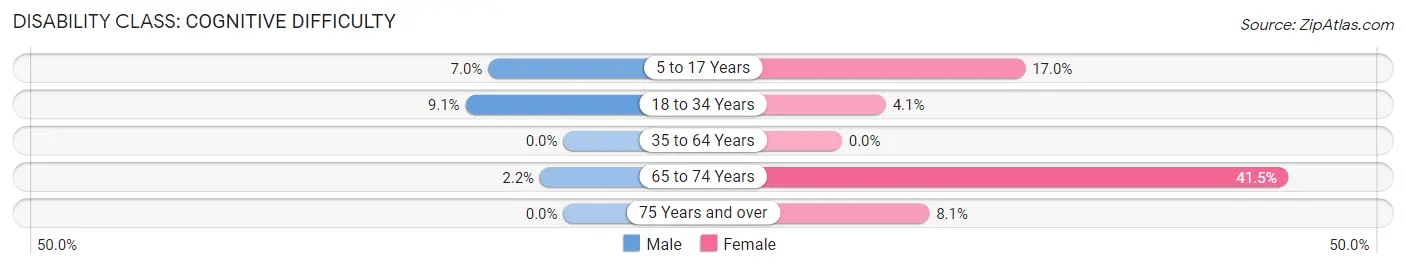
| Age Bracket | Male | Female |
| 5 to 17 Years | 6 (7.0%) | 8 (17.0%) |
| 18 to 34 Years | 4 (9.1%) | 2 (4.1%) |
| 35 to 64 Years | 0 (0.0%) | 0 (0.0%) |
| 65 to 74 Years | 1 (2.2%) | 17 (41.5%) |
| 75 Years and over | 0 (0.0%) | 3 (8.1%) |
Disability Class: Ambulatory Difficulty
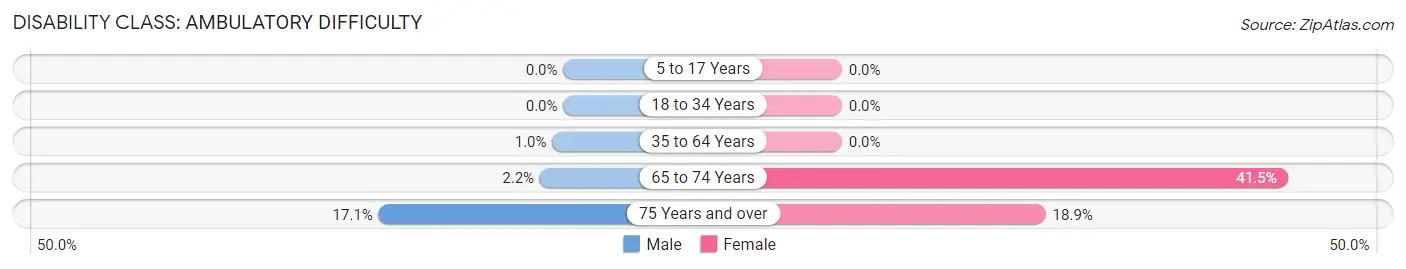
| Age Bracket | Male | Female |
| 5 to 17 Years | 0 (0.0%) | 0 (0.0%) |
| 18 to 34 Years | 0 (0.0%) | 0 (0.0%) |
| 35 to 64 Years | 1 (1.0%) | 0 (0.0%) |
| 65 to 74 Years | 1 (2.2%) | 17 (41.5%) |
| 75 Years and over | 6 (17.1%) | 7 (18.9%) |
Disability Class: Self-Care Difficulty
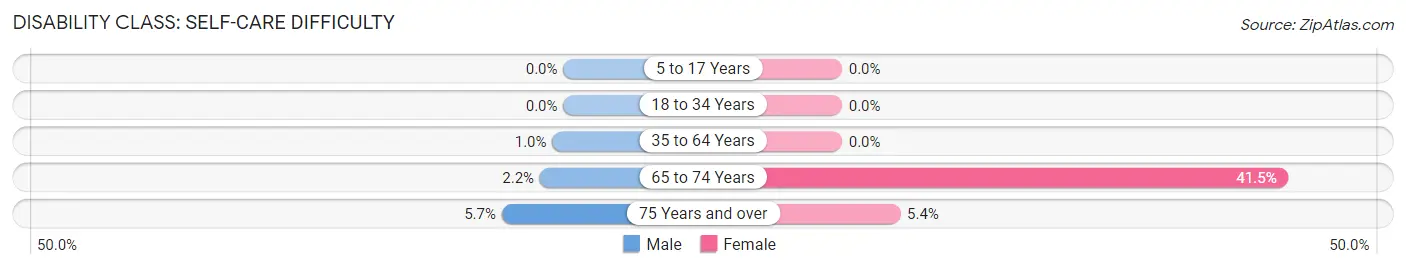
| Age Bracket | Male | Female |
| 5 to 17 Years | 0 (0.0%) | 0 (0.0%) |
| 18 to 34 Years | 0 (0.0%) | 0 (0.0%) |
| 35 to 64 Years | 1 (1.0%) | 0 (0.0%) |
| 65 to 74 Years | 1 (2.2%) | 17 (41.5%) |
| 75 Years and over | 2 (5.7%) | 2 (5.4%) |
Technology Access in La Prairie
Computing Device Access in La Prairie
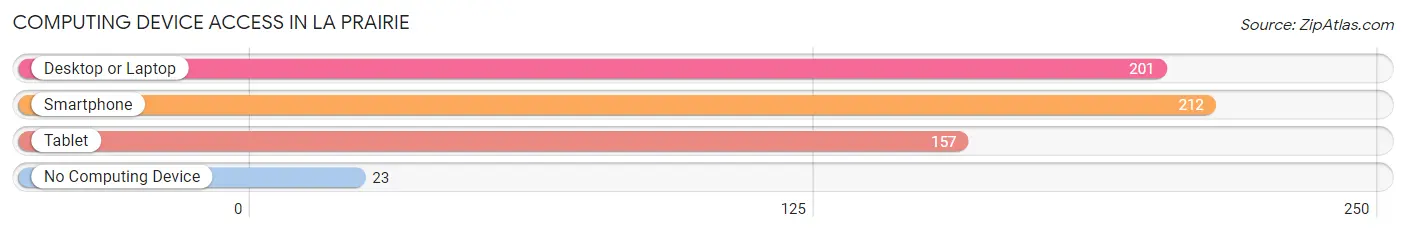
| Device Type | # Households | % Households |
| Desktop or Laptop | 201 | 77.3% |
| Smartphone | 212 | 81.5% |
| Tablet | 157 | 60.4% |
| No Computing Device | 23 | 8.8% |
| Total | 260 | 100.0% |
Internet Access in La Prairie
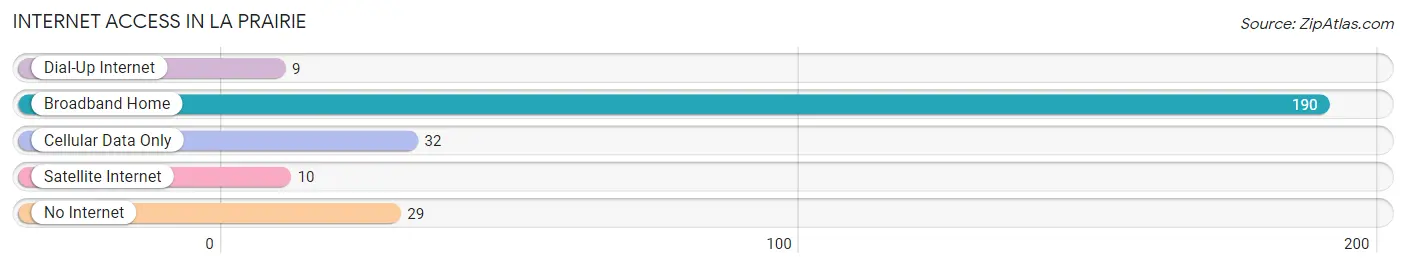
| Internet Type | # Households | % Households |
| Dial-Up Internet | 9 | 3.5% |
| Broadband Home | 190 | 73.1% |
| Cellular Data Only | 32 | 12.3% |
| Satellite Internet | 10 | 3.8% |
| No Internet | 29 | 11.2% |
| Total | 260 | 100.0% |
La Prairie Summary
Prairie, Minnesota is a small city located in the southeastern corner of the state, near the border of Wisconsin. It is part of the Twin Cities metropolitan area and is located in Washington County. The city has a population of approximately 4,000 people and is home to a variety of businesses, including a large manufacturing plant.
History
Prairie, Minnesota was first settled in the late 1800s by a group of German immigrants. The city was originally known as “New Germany” and was later renamed Prairie. The city was officially incorporated in 1891 and was named after the nearby prairie land.
The city grew rapidly in the early 1900s, with the arrival of the railroad and the establishment of a large manufacturing plant. The plant was owned by the Prairie Manufacturing Company and produced a variety of products, including farm equipment, furniture, and clothing. The company was a major employer in the city and helped to fuel its growth.
In the 1950s, the city experienced a period of decline as the manufacturing industry began to move away from the area. The city was able to recover, however, and today it is a vibrant and growing community.
Geography
Prairie, Minnesota is located in the southeastern corner of the state, near the border of Wisconsin. The city is situated on the banks of the St. Croix River and is surrounded by rolling hills and farmland. The city is located approximately 25 miles from Minneapolis and is part of the Twin Cities metropolitan area.
The city has a total area of 4.2 square miles, of which 0.2 square miles is water. The city is located at an elevation of 890 feet above sea level.
Economy
Prairie, Minnesota is home to a variety of businesses, including a large manufacturing plant. The city is also home to a number of small businesses, including restaurants, retail stores, and professional services.
The city is also home to a number of educational institutions, including a community college and a technical college. The city is also home to a number of parks and recreational facilities, including a golf course and a public swimming pool.
Demographics
As of the 2010 census, the population of Prairie, Minnesota was 4,000. The racial makeup of the city was 94.3% White, 1.2% African American, 0.3% Native American, 0.7% Asian, 0.1% Pacific Islander, and 3.4% from other races. Hispanic or Latino of any race were 2.2% of the population.
The median income for a household in the city was $50,000, and the median income for a family was $60,000. The per capita income for the city was $25,000. About 8.3% of families and 10.2% of the population were below the poverty line, including 14.3% of those under age 18 and 6.2% of those age 65 or over.
Common Questions
What is the Total Population of La Prairie?
Total Population of La Prairie is 623.
What is the Total Male Population of La Prairie?
Total Male Population of La Prairie is 316.
What is the Total Female Population of La Prairie?
Total Female Population of La Prairie is 307.
What is the Ratio of Males per 100 Females in La Prairie?
There are 102.93 Males per 100 Females in La Prairie.
What is the Ratio of Females per 100 Males in La Prairie?
There are 97.15 Females per 100 Males in La Prairie.
What is the Median Population Age in La Prairie?
Median Population Age in La Prairie is 46.8 Years.
What is the Average Family Size in La Prairie
Average Family Size in La Prairie is 2.6 People.
What is the Average Household Size in La Prairie
Average Household Size in La Prairie is 2.4 People.
What is Per Capita Income in La Prairie?
Per Capita income in La Prairie is $31,835.
What is the Median Family Income in La Prairie?
Median Family Income in La Prairie is $83,125.
What is the Median Household income in La Prairie?
Median Household Income in La Prairie is $67,917.
What is Income or Wage Gap in La Prairie?
Income or Wage Gap in La Prairie is 43.3%.
Women in La Prairie earn 56.7 cents for every dollar earned by a man.
What is Inequality or Gini Index in La Prairie?
Inequality or Gini Index in La Prairie is 0.34.
How Large is the Labor Force in La Prairie?
There are 290 People in the Labor Forcein in La Prairie.
What is the Percentage of People in the Labor Force in La Prairie?
58.0% of People are in the Labor Force in La Prairie.
What is the Unemployment Rate in La Prairie?
Unemployment Rate in La Prairie is 3.8%.