Perley, MN
Perley Map
Perley Overview
119
TOTAL POPULATION
45
MALE POPULATION
74
FEMALE POPULATION
60.81
MALES / 100 FEMALES
164.44
FEMALES / 100 MALES
51.1
MEDIAN AGE
3.0
AVG FAMILY SIZE
2.2
AVG HOUSEHOLD SIZE
$33,680
PER CAPITA INCOME
$94,167
AVG FAMILY INCOME
$69,000
AVG HOUSEHOLD INCOME
0.37
INEQUALITY / GINI INDEX
76
LABOR FORCE [ PEOPLE ]
72.4%
PERCENT IN LABOR FORCE
25.0%
UNEMPLOYMENT RATE
Perley Zip Codes
Perley Area Codes
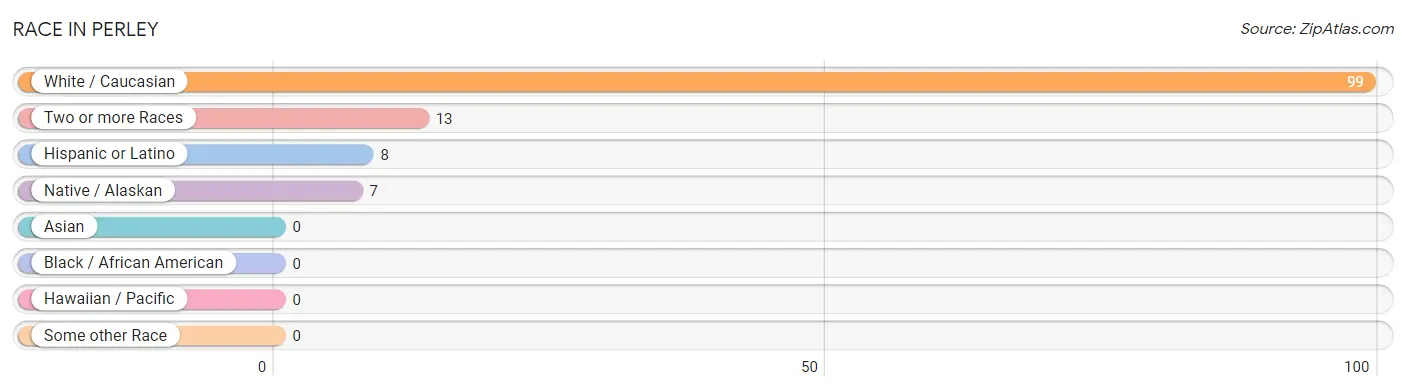
Race in Perley
The most populous races in Perley are White / Caucasian (99 | 83.2%), Two or more Races (13 | 10.9%), and Hispanic or Latino (8 | 6.7%).
| Race | # Population | % Population |
| Asian | 0 | 0.0% |
| Black / African American | 0 | 0.0% |
| Hawaiian / Pacific | 0 | 0.0% |
| Hispanic or Latino | 8 | 6.7% |
| Native / Alaskan | 7 | 5.9% |
| White / Caucasian | 99 | 83.2% |
| Two or more Races | 13 | 10.9% |
| Some other Race | 0 | 0.0% |
| Total | 119 | 100.0% |
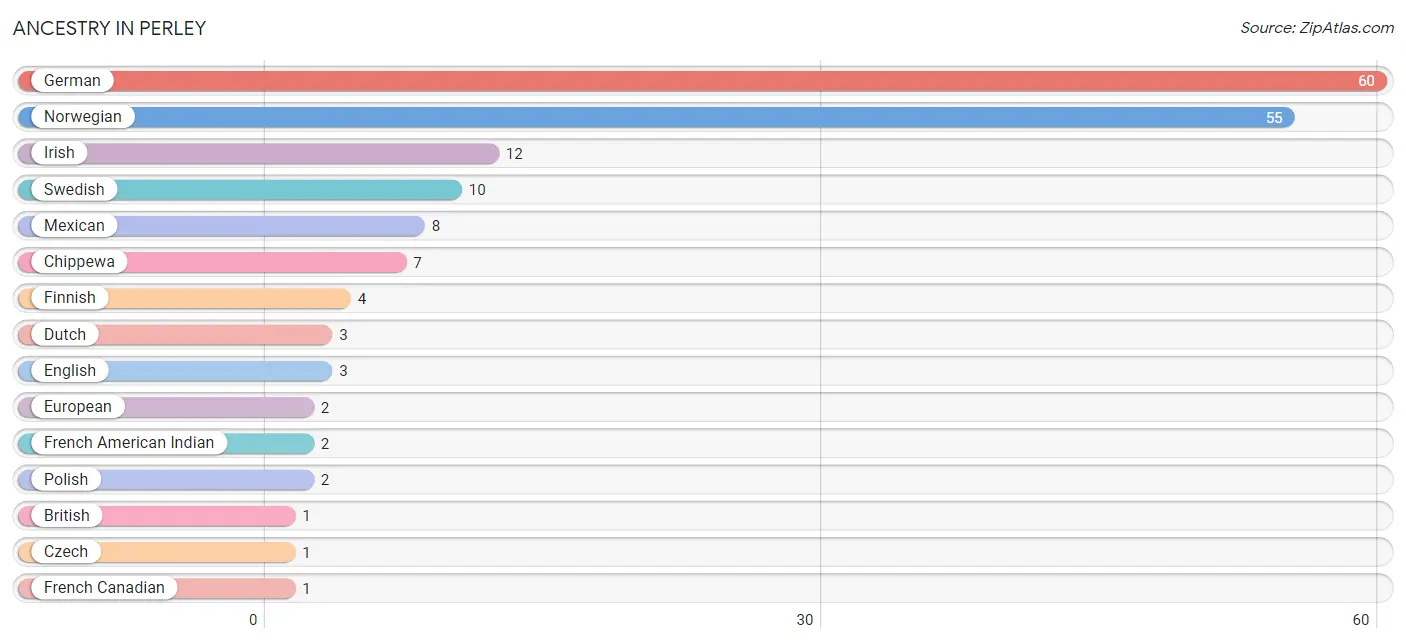
Ancestry in Perley
The most populous ancestries reported in Perley are German (60 | 50.4%), Norwegian (55 | 46.2%), Irish (12 | 10.1%), Swedish (10 | 8.4%), and Mexican (8 | 6.7%), together accounting for 121.8% of all Perley residents.
| Ancestry | # Population | % Population |
| British | 1 | 0.8% |
| Chippewa | 7 | 5.9% |
| Czech | 1 | 0.8% |
| Dutch | 3 | 2.5% |
| English | 3 | 2.5% |
| European | 2 | 1.7% |
| Finnish | 4 | 3.4% |
| French American Indian | 2 | 1.7% |
| French Canadian | 1 | 0.8% |
| German | 60 | 50.4% |
| Irish | 12 | 10.1% |
| Mexican | 8 | 6.7% |
| Norwegian | 55 | 46.2% |
| Polish | 2 | 1.7% |
| Swedish | 10 | 8.4% | View All 15 Rows |
Immigrants in Perley

| Immigration Origin | # Population | % Population | View All 0 Rows |
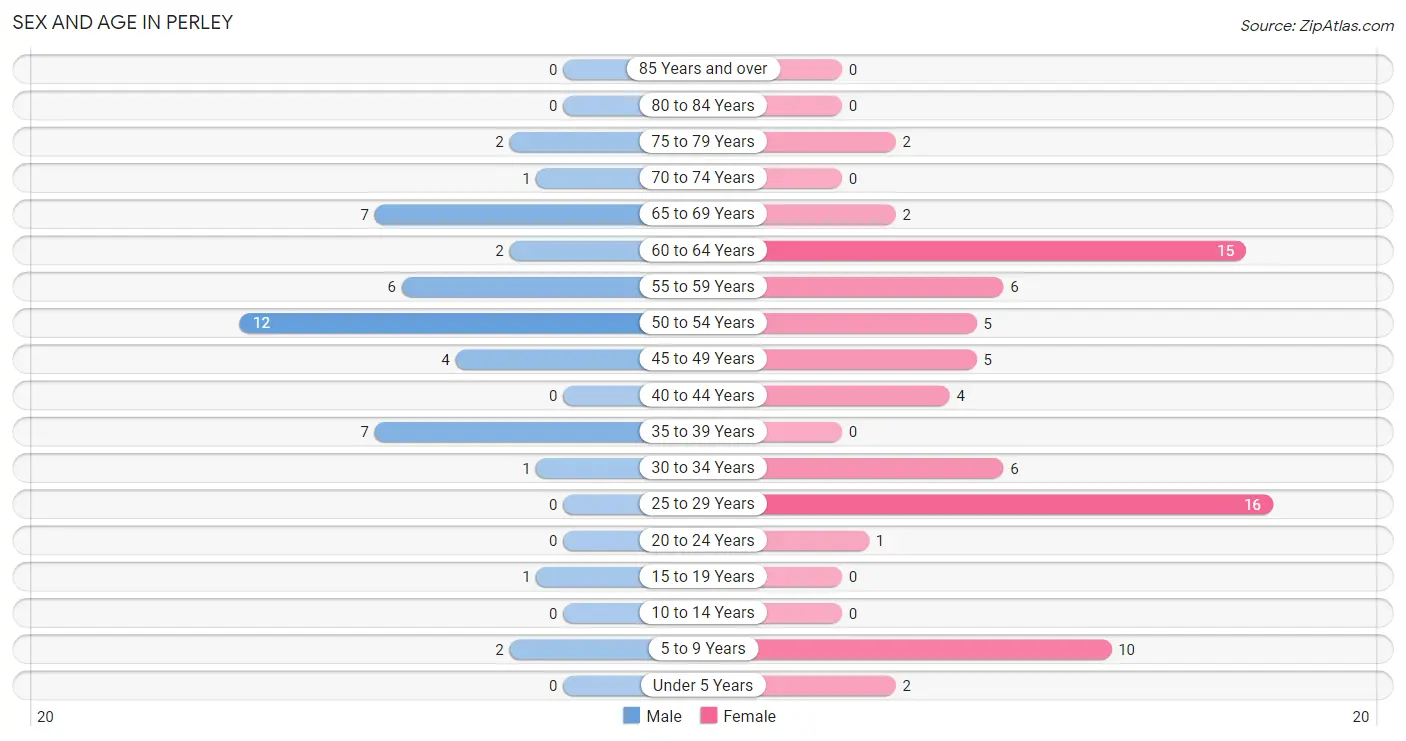
Sex and Age in Perley
Sex and Age in Perley
The most populous age groups in Perley are 50 to 54 Years (12 | 26.7%) for men and 25 to 29 Years (16 | 21.6%) for women.
| Age Bracket | Male | Female |
| Under 5 Years | 0 (0.0%) | 2 (2.7%) |
| 5 to 9 Years | 2 (4.4%) | 10 (13.5%) |
| 10 to 14 Years | 0 (0.0%) | 0 (0.0%) |
| 15 to 19 Years | 1 (2.2%) | 0 (0.0%) |
| 20 to 24 Years | 0 (0.0%) | 1 (1.3%) |
| 25 to 29 Years | 0 (0.0%) | 16 (21.6%) |
| 30 to 34 Years | 1 (2.2%) | 6 (8.1%) |
| 35 to 39 Years | 7 (15.6%) | 0 (0.0%) |
| 40 to 44 Years | 0 (0.0%) | 4 (5.4%) |
| 45 to 49 Years | 4 (8.9%) | 5 (6.8%) |
| 50 to 54 Years | 12 (26.7%) | 5 (6.8%) |
| 55 to 59 Years | 6 (13.3%) | 6 (8.1%) |
| 60 to 64 Years | 2 (4.4%) | 15 (20.3%) |
| 65 to 69 Years | 7 (15.6%) | 2 (2.7%) |
| 70 to 74 Years | 1 (2.2%) | 0 (0.0%) |
| 75 to 79 Years | 2 (4.4%) | 2 (2.7%) |
| 80 to 84 Years | 0 (0.0%) | 0 (0.0%) |
| 85 Years and over | 0 (0.0%) | 0 (0.0%) |
| Total | 45 (100.0%) | 74 (100.0%) |
Families and Households in Perley
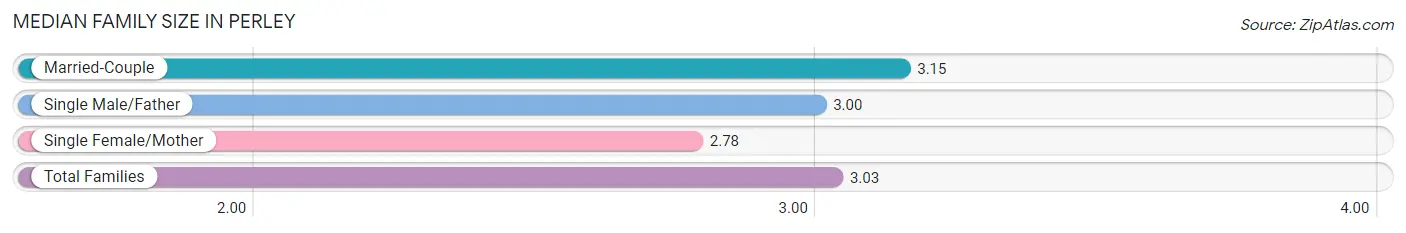
Median Family Size in Perley
The median family size in Perley is 3.03 persons per family, with married-couple families (20 | 66.7%) accounting for the largest median family size of 3.15 persons per family. On the other hand, single female/mother families (9 | 30.0%) represent the smallest median family size with 2.78 persons per family.
| Family Type | # Families | Family Size |
| Married-Couple | 20 (66.7%) | 3.15 |
| Single Male/Father | 1 (3.3%) | 3.00 |
| Single Female/Mother | 9 (30.0%) | 2.78 |
| Total Families | 30 (100.0%) | 3.03 |
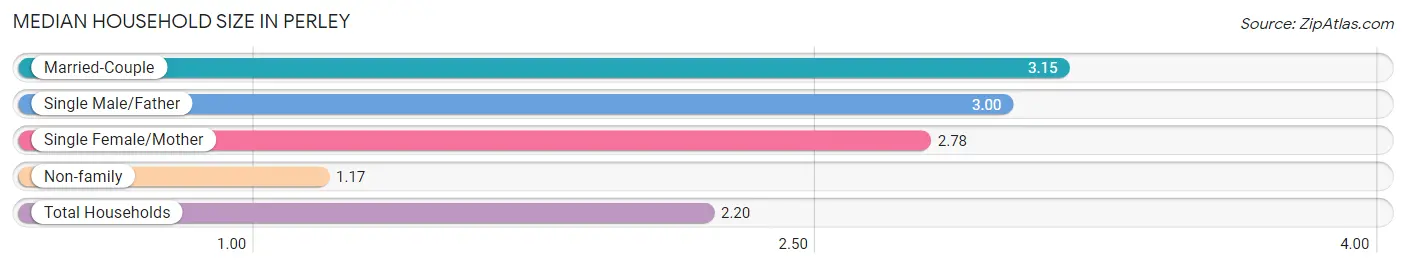
Median Household Size in Perley
The median household size in Perley is 2.20 persons per household, with married-couple households (20 | 37.0%) accounting for the largest median household size of 3.15 persons per household. non-family households (24 | 44.4%) represent the smallest median household size with 1.17 persons per household.
| Household Type | # Households | Household Size |
| Married-Couple | 20 (37.0%) | 3.15 |
| Single Male/Father | 1 (1.8%) | 3.00 |
| Single Female/Mother | 9 (16.7%) | 2.78 |
| Non-family | 24 (44.4%) | 1.17 |
| Total Households | 54 (100.0%) | 2.20 |
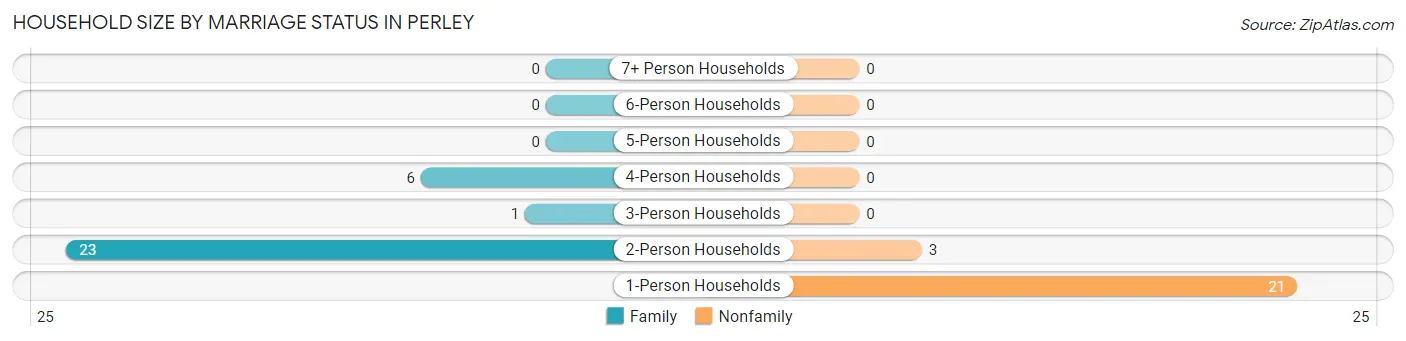
Household Size by Marriage Status in Perley
Out of a total of 54 households in Perley, 30 (55.6%) are family households, while 24 (44.4%) are nonfamily households. The most numerous type of family households are 2-person households, comprising 23, and the most common type of nonfamily households are 1-person households, comprising 21.
| Household Size | Family Households | Nonfamily Households |
| 1-Person Households | - | 21 (38.9%) |
| 2-Person Households | 23 (42.6%) | 3 (5.6%) |
| 3-Person Households | 1 (1.8%) | 0 (0.0%) |
| 4-Person Households | 6 (11.1%) | 0 (0.0%) |
| 5-Person Households | 0 (0.0%) | 0 (0.0%) |
| 6-Person Households | 0 (0.0%) | 0 (0.0%) |
| 7+ Person Households | 0 (0.0%) | 0 (0.0%) |
| Total | 30 (55.6%) | 24 (44.4%) |
Female Fertility in Perley
Fertility by Age in Perley
| Age Bracket | Women with Births | Births / 1,000 Women |
| 15 to 19 years | 0 (0.0%) | 0.0 |
| 20 to 34 years | 0 (0.0%) | 0.0 |
| 35 to 50 years | 0 (0.0%) | 0.0 |
| Total | 0 (0.0%) | 0.0 |
Fertility by Age by Marriage Status in Perley
| Age Bracket | Married | Unmarried |
| 15 to 19 years | 0 (0.0%) | 0 (0.0%) |
| 20 to 34 years | 0 (0.0%) | 0 (0.0%) |
| 35 to 50 years | 0 (0.0%) | 0 (0.0%) |
| Total | 0 (0.0%) | 0 (0.0%) |
Fertility by Education in Perley
| Educational Attainment | Women with Births | Births / 1,000 Women |
| Less than High School | 0 (0.0%) | 0.0 |
| High School Diploma | 0 (0.0%) | 0.0 |
| College or Associate's Degree | 0 (0.0%) | 0.0 |
| Bachelor's Degree | 0 (0.0%) | 0.0 |
| Graduate Degree | 0 (0.0%) | 0.0 |
| Total | 0 (0.0%) | 0.0 |
Fertility by Education by Marriage Status in Perley
| Educational Attainment | Married | Unmarried |
| Less than High School | 0 (0.0%) | 0 (0.0%) |
| High School Diploma | 0 (0.0%) | 0 (0.0%) |
| College or Associate's Degree | 0 (0.0%) | 0 (0.0%) |
| Bachelor's Degree | 0 (0.0%) | 0 (0.0%) |
| Graduate Degree | 0 (0.0%) | 0 (0.0%) |
| Total | 0 (0.0%) | 0 (0.0%) |
Income in Perley
Income Overview in Perley
Per Capita Income in Perley is $33,680, while median incomes of families and households are $94,167 and $69,000 respectively.
| Characteristic | Number | Measure |
| Per Capita Income | 119 | $33,680 |
| Median Family Income | 30 | $94,167 |
| Mean Family Income | 30 | $90,347 |
| Median Household Income | 54 | $69,000 |
| Mean Household Income | 54 | $68,098 |
| Income Deficit | 30 | $0 |
| Wage / Income Gap (%) | 119 | 0.00% |
| Wage / Income Gap ($) | 119 | 100.00¢ per $1 |
| Gini / Inequality Index | 119 | 0.37 |
Earnings by Sex in Perley
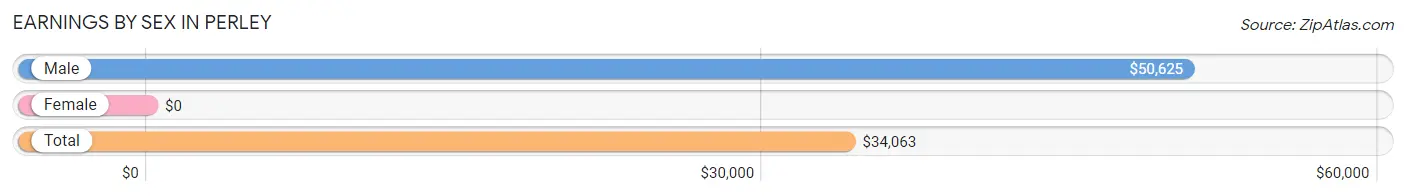
| Sex | Number | Average Earnings |
| Male | 28 (33.7%) | $50,625 |
| Female | 55 (66.3%) | $0 |
| Total | 83 (100.0%) | $34,063 |
Earnings by Sex by Income Bracket in Perley
The most common earnings brackets in Perley are $2,499 or less for men (6 | 21.4%) and $22,500 to $24,999 for women (15 | 27.3%).
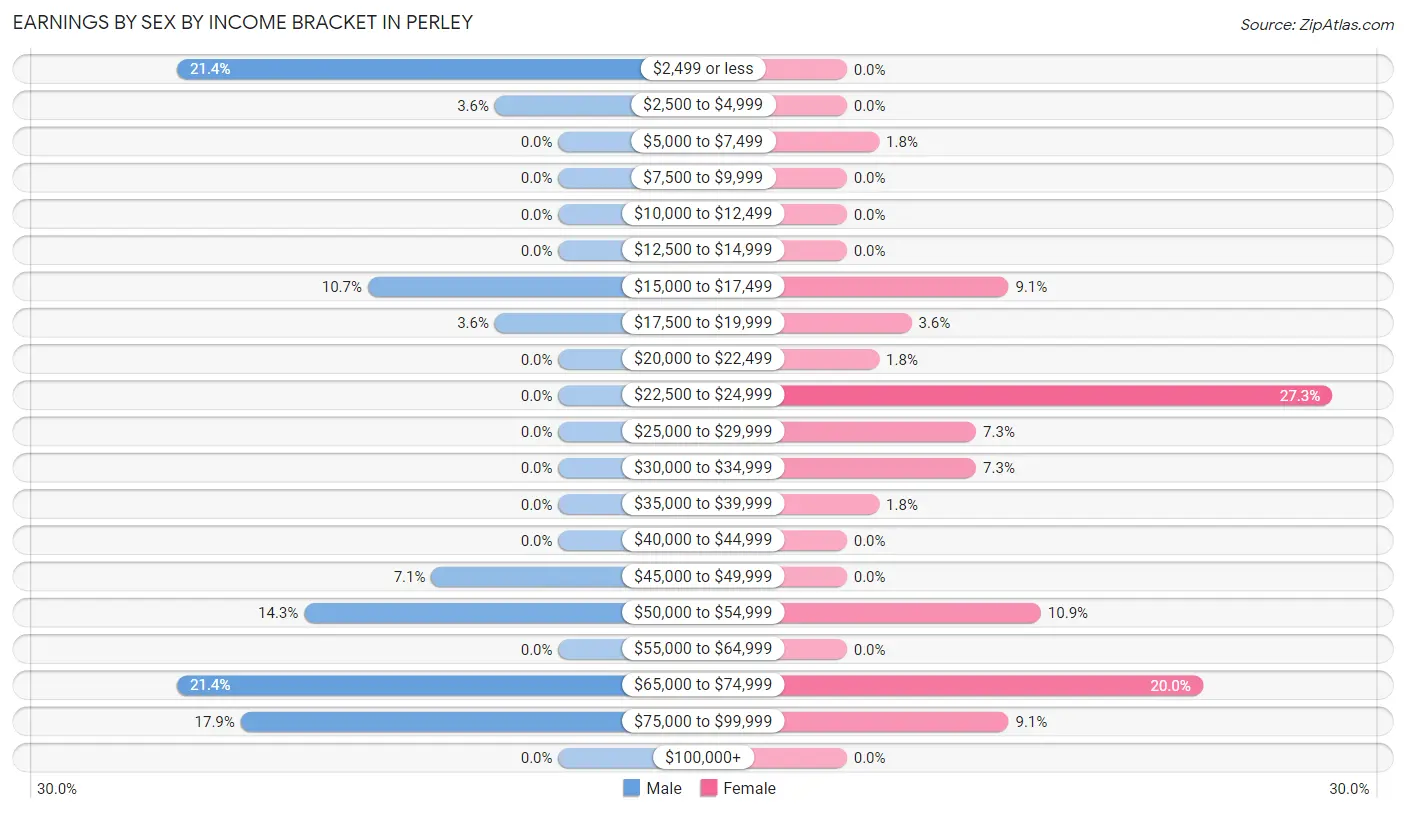
| Income | Male | Female |
| $2,499 or less | 6 (21.4%) | 0 (0.0%) |
| $2,500 to $4,999 | 1 (3.6%) | 0 (0.0%) |
| $5,000 to $7,499 | 0 (0.0%) | 1 (1.8%) |
| $7,500 to $9,999 | 0 (0.0%) | 0 (0.0%) |
| $10,000 to $12,499 | 0 (0.0%) | 0 (0.0%) |
| $12,500 to $14,999 | 0 (0.0%) | 0 (0.0%) |
| $15,000 to $17,499 | 3 (10.7%) | 5 (9.1%) |
| $17,500 to $19,999 | 1 (3.6%) | 2 (3.6%) |
| $20,000 to $22,499 | 0 (0.0%) | 1 (1.8%) |
| $22,500 to $24,999 | 0 (0.0%) | 15 (27.3%) |
| $25,000 to $29,999 | 0 (0.0%) | 4 (7.3%) |
| $30,000 to $34,999 | 0 (0.0%) | 4 (7.3%) |
| $35,000 to $39,999 | 0 (0.0%) | 1 (1.8%) |
| $40,000 to $44,999 | 0 (0.0%) | 0 (0.0%) |
| $45,000 to $49,999 | 2 (7.1%) | 0 (0.0%) |
| $50,000 to $54,999 | 4 (14.3%) | 6 (10.9%) |
| $55,000 to $64,999 | 0 (0.0%) | 0 (0.0%) |
| $65,000 to $74,999 | 6 (21.4%) | 11 (20.0%) |
| $75,000 to $99,999 | 5 (17.9%) | 5 (9.1%) |
| $100,000+ | 0 (0.0%) | 0 (0.0%) |
| Total | 28 (100.0%) | 55 (100.0%) |
Earnings by Sex by Educational Attainment in Perley
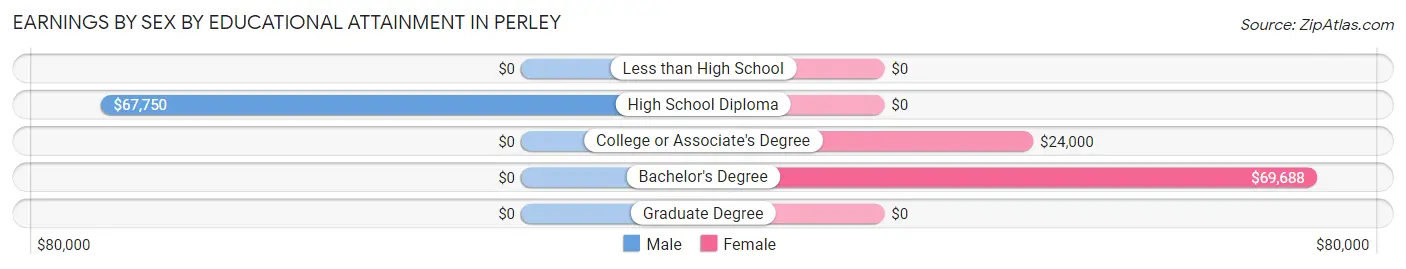
| Educational Attainment | Male Income | Female Income |
| Less than High School | - | - |
| High School Diploma | $67,750 | $0 |
| College or Associate's Degree | - | - |
| Bachelor's Degree | - | - |
| Graduate Degree | - | - |
| Total | $50,625 | $0 |
Family Income in Perley
Family Income Brackets in Perley
According to the Perley family income data, there are 10 families falling into the $100,000 to $149,999 income range, which is the most common income bracket and makes up 33.3% of all families.
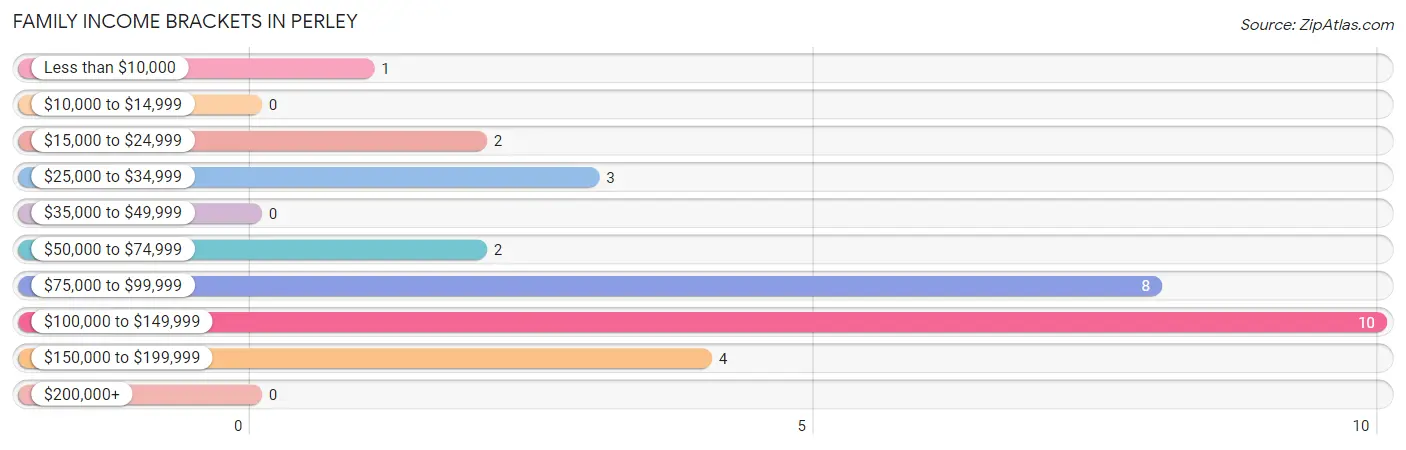
| Income Bracket | # Families | % Families |
| Less than $10,000 | 1 | 3.3% |
| $10,000 to $14,999 | 0 | 0.0% |
| $15,000 to $24,999 | 2 | 6.7% |
| $25,000 to $34,999 | 3 | 10.0% |
| $35,000 to $49,999 | 0 | 0.0% |
| $50,000 to $74,999 | 2 | 6.7% |
| $75,000 to $99,999 | 8 | 26.7% |
| $100,000 to $149,999 | 10 | 33.3% |
| $150,000 to $199,999 | 4 | 13.3% |
| $200,000+ | 0 | 0.0% |
Family Income by Famaliy Size in Perley
2-person families (23 | 76.7%) account for the highest median family income in Perley with $92,917 per family, while 2-person families (23 | 76.7%) have the highest median income of $46,458 per family member.
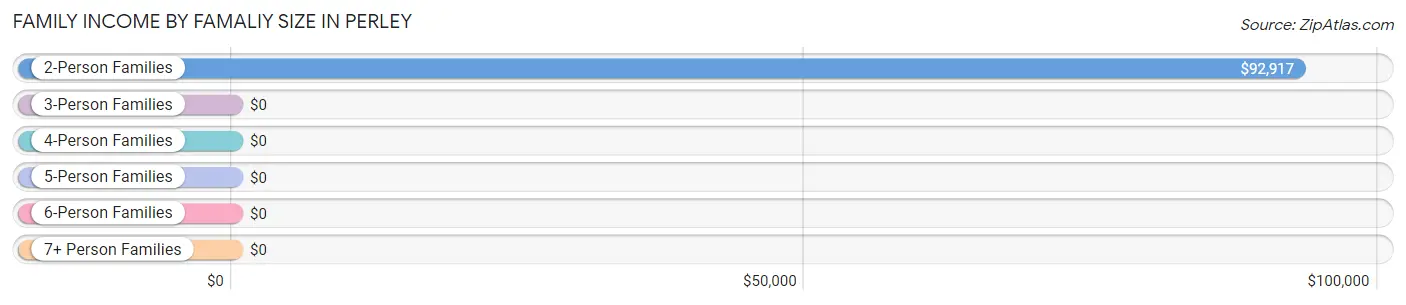
| Income Bracket | # Families | Median Income |
| 2-Person Families | 23 (76.7%) | $92,917 |
| 3-Person Families | 1 (3.3%) | $0 |
| 4-Person Families | 6 (20.0%) | $0 |
| 5-Person Families | 0 (0.0%) | $0 |
| 6-Person Families | 0 (0.0%) | $0 |
| 7+ Person Families | 0 (0.0%) | $0 |
| Total | 30 (100.0%) | $94,167 |
Family Income by Number of Earners in Perley
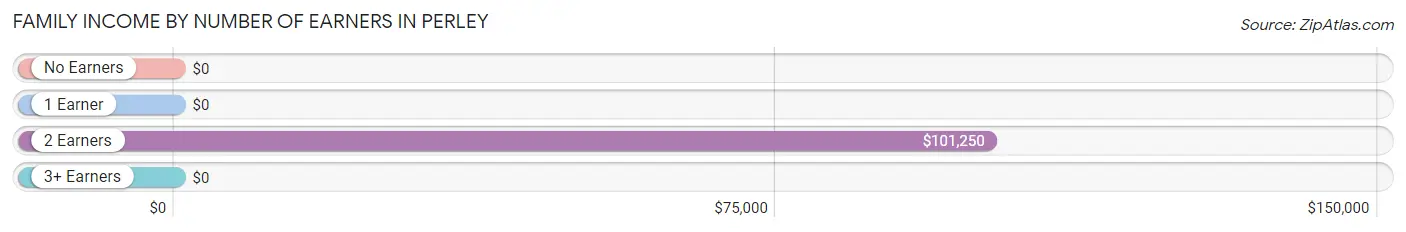
| Number of Earners | # Families | Median Income |
| No Earners | 4 (13.3%) | $0 |
| 1 Earner | 4 (13.3%) | $0 |
| 2 Earners | 17 (56.7%) | $101,250 |
| 3+ Earners | 5 (16.7%) | $0 |
| Total | 30 (100.0%) | $94,167 |
Household Income in Perley
Household Income Brackets in Perley
With 12 households falling in the category, the $50,000 to $74,999 income range is the most frequent in Perley, accounting for 22.2% of all households.
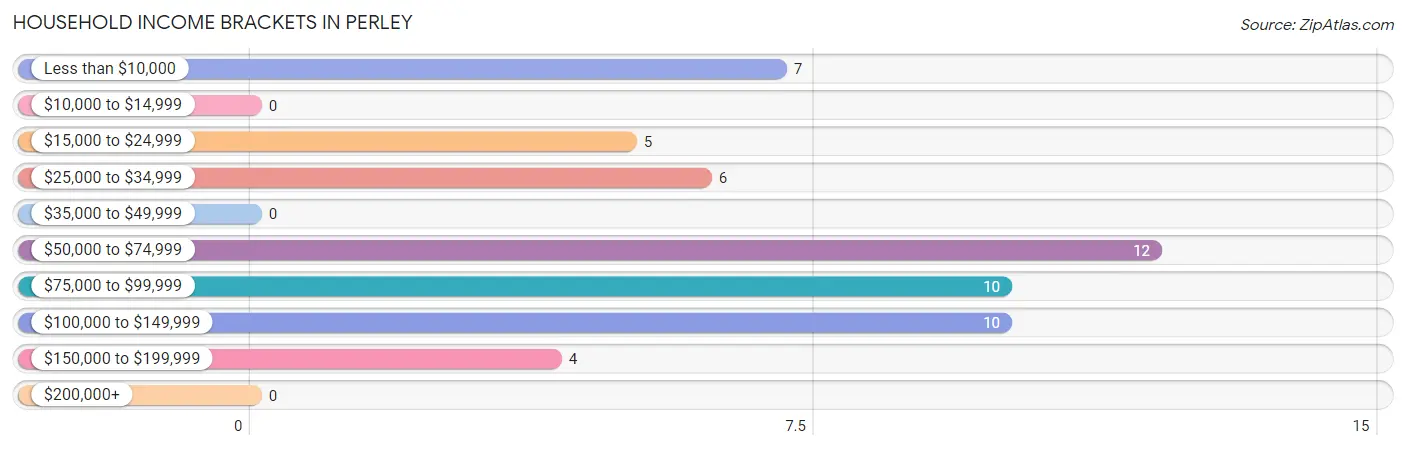
| Income Bracket | # Households | % Households |
| Less than $10,000 | 7 | 13.0% |
| $10,000 to $14,999 | 0 | 0.0% |
| $15,000 to $24,999 | 5 | 9.3% |
| $25,000 to $34,999 | 6 | 11.1% |
| $35,000 to $49,999 | 0 | 0.0% |
| $50,000 to $74,999 | 12 | 22.2% |
| $75,000 to $99,999 | 10 | 18.5% |
| $100,000 to $149,999 | 10 | 18.5% |
| $150,000 to $199,999 | 4 | 7.4% |
| $200,000+ | 0 | 0.0% |
Household Income by Householder Age in Perley
The median household income in Perley is $69,000, with the highest median household income of $81,250 found in the 25 to 44 years age bracket for the primary householder. A total of 5 households (9.3%) fall into this category.
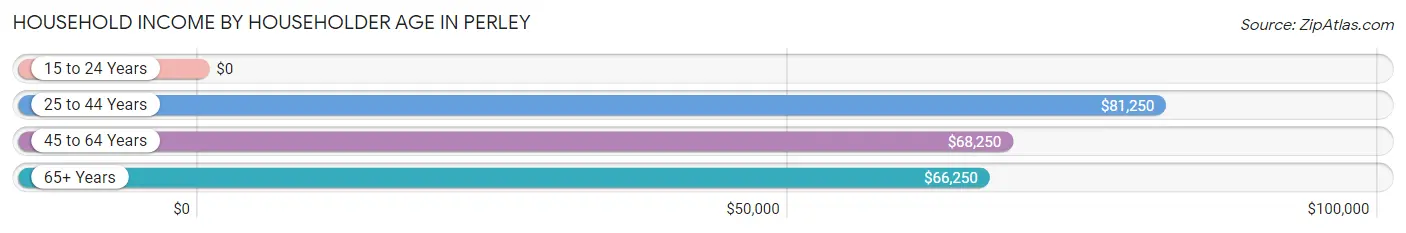
| Income Bracket | # Households | Median Income |
| 15 to 24 Years | 0 (0.0%) | $0 |
| 25 to 44 Years | 5 (9.3%) | $81,250 |
| 45 to 64 Years | 43 (79.6%) | $68,250 |
| 65+ Years | 6 (11.1%) | $66,250 |
| Total | 54 (100.0%) | $69,000 |
Poverty in Perley
Income Below Poverty by Sex and Age in Perley
With 26.7% poverty level for males and 10.8% for females among the residents of Perley, 5 year old males and under 5 year old females are the most vulnerable to poverty, with 2 males (100.0%) and 2 females (100.0%) in their respective age groups living below the poverty level.
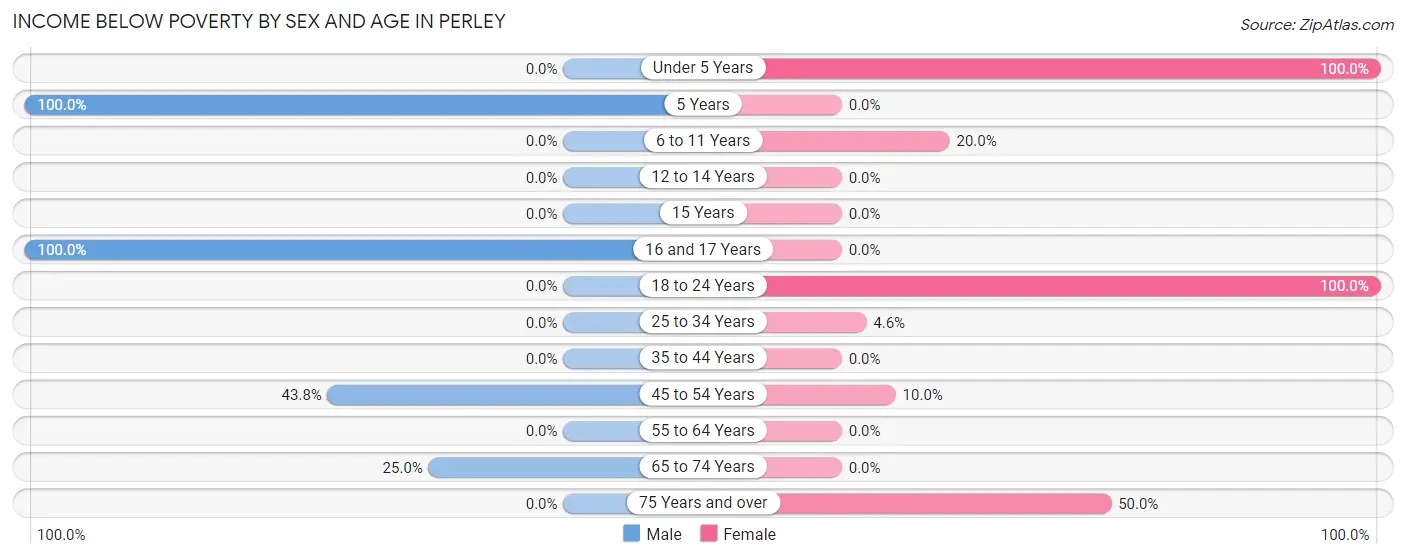
| Age Bracket | Male | Female |
| Under 5 Years | 0 (0.0%) | 2 (100.0%) |
| 5 Years | 2 (100.0%) | 0 (0.0%) |
| 6 to 11 Years | 0 (0.0%) | 2 (20.0%) |
| 12 to 14 Years | 0 (0.0%) | 0 (0.0%) |
| 15 Years | 0 (0.0%) | 0 (0.0%) |
| 16 and 17 Years | 1 (100.0%) | 0 (0.0%) |
| 18 to 24 Years | 0 (0.0%) | 1 (100.0%) |
| 25 to 34 Years | 0 (0.0%) | 1 (4.5%) |
| 35 to 44 Years | 0 (0.0%) | 0 (0.0%) |
| 45 to 54 Years | 7 (43.8%) | 1 (10.0%) |
| 55 to 64 Years | 0 (0.0%) | 0 (0.0%) |
| 65 to 74 Years | 2 (25.0%) | 0 (0.0%) |
| 75 Years and over | 0 (0.0%) | 1 (50.0%) |
| Total | 12 (26.7%) | 8 (10.8%) |
Income Above Poverty by Sex and Age in Perley
According to the poverty statistics in Perley, males aged 25 to 34 years and females aged 35 to 44 years are the age groups that are most secure financially, with 100.0% of males and 100.0% of females in these age groups living above the poverty line.
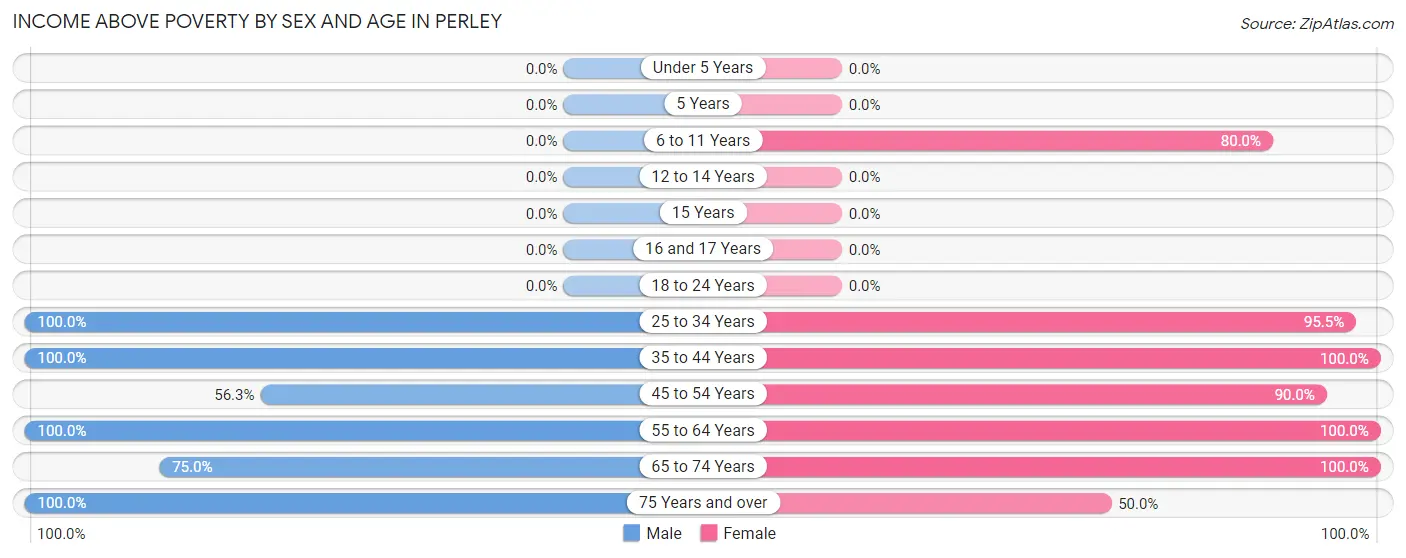
| Age Bracket | Male | Female |
| Under 5 Years | 0 (0.0%) | 0 (0.0%) |
| 5 Years | 0 (0.0%) | 0 (0.0%) |
| 6 to 11 Years | 0 (0.0%) | 8 (80.0%) |
| 12 to 14 Years | 0 (0.0%) | 0 (0.0%) |
| 15 Years | 0 (0.0%) | 0 (0.0%) |
| 16 and 17 Years | 0 (0.0%) | 0 (0.0%) |
| 18 to 24 Years | 0 (0.0%) | 0 (0.0%) |
| 25 to 34 Years | 1 (100.0%) | 21 (95.5%) |
| 35 to 44 Years | 7 (100.0%) | 4 (100.0%) |
| 45 to 54 Years | 9 (56.2%) | 9 (90.0%) |
| 55 to 64 Years | 8 (100.0%) | 21 (100.0%) |
| 65 to 74 Years | 6 (75.0%) | 2 (100.0%) |
| 75 Years and over | 2 (100.0%) | 1 (50.0%) |
| Total | 33 (73.3%) | 66 (89.2%) |
Income Below Poverty Among Married-Couple Families in Perley
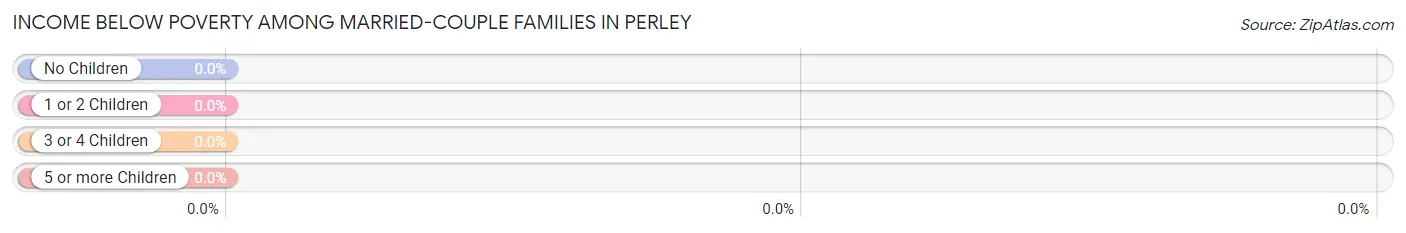
| Children | Above Poverty | Below Poverty |
| No Children | 15 (100.0%) | 0 (0.0%) |
| 1 or 2 Children | 5 (100.0%) | 0 (0.0%) |
| 3 or 4 Children | 0 (0.0%) | 0 (0.0%) |
| 5 or more Children | 0 (0.0%) | 0 (0.0%) |
| Total | 20 (100.0%) | 0 (0.0%) |
Income Below Poverty Among Single-Parent Households in Perley
According to the poverty data in Perley, 100.0% or 1 single-father households and 22.2% or 2 single-mother households are living below the poverty line. Among single-father households, those with 1 or 2 children have the highest poverty rate, with 1 households (100.0%) experiencing poverty. Likewise, among single-mother households, those with 3 or 4 children have the highest poverty rate, with 1 households (100.0%) falling below the poverty line.
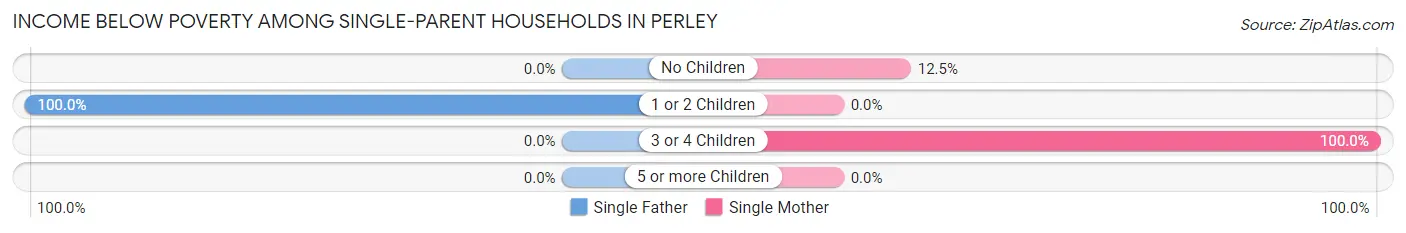
| Children | Single Father | Single Mother |
| No Children | 0 (0.0%) | 1 (12.5%) |
| 1 or 2 Children | 1 (100.0%) | 0 (0.0%) |
| 3 or 4 Children | 0 (0.0%) | 1 (100.0%) |
| 5 or more Children | 0 (0.0%) | 0 (0.0%) |
| Total | 1 (100.0%) | 2 (22.2%) |
Income Below Poverty Among Married-Couple vs Single-Parent Households in Perley
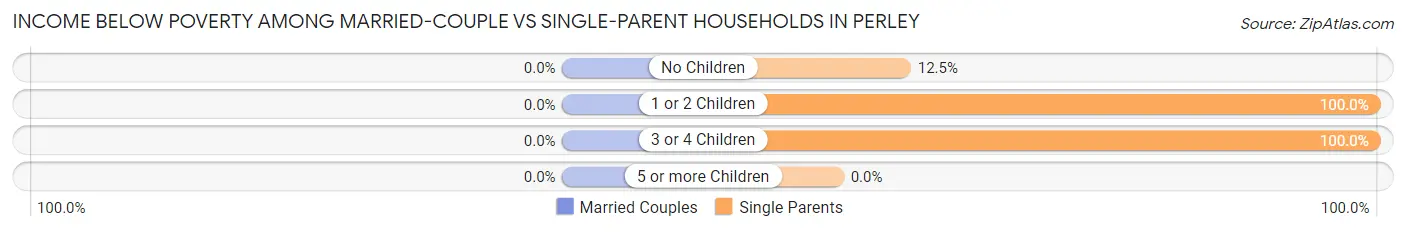
| Children | Married-Couple Families | Single-Parent Households |
| No Children | 0 (0.0%) | 1 (12.5%) |
| 1 or 2 Children | 0 (0.0%) | 1 (100.0%) |
| 3 or 4 Children | 0 (0.0%) | 1 (100.0%) |
| 5 or more Children | 0 (0.0%) | 0 (0.0%) |
| Total | 0 (0.0%) | 3 (30.0%) |
Employment Characteristics in Perley
Employment by Class of Employer in Perley
Among the 57 employed individuals in Perley, private company employees (40 | 70.2%), self-employed (not incorporated) (5 | 8.8%), and not-for-profit organizations (5 | 8.8%) make up the most common classes of employment.
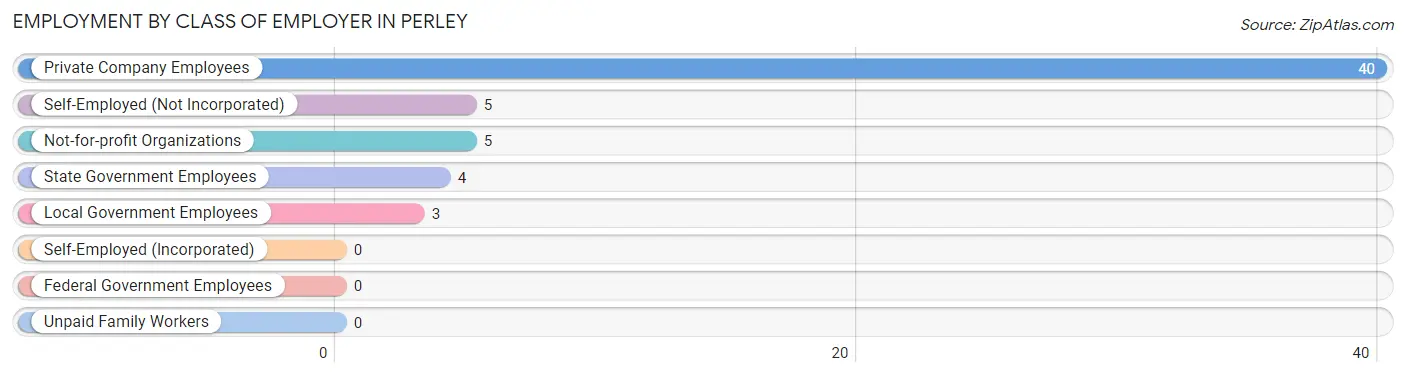
| Employer Class | # Employees | % Employees |
| Private Company Employees | 40 | 70.2% |
| Self-Employed (Incorporated) | 0 | 0.0% |
| Self-Employed (Not Incorporated) | 5 | 8.8% |
| Not-for-profit Organizations | 5 | 8.8% |
| Local Government Employees | 3 | 5.3% |
| State Government Employees | 4 | 7.0% |
| Federal Government Employees | 0 | 0.0% |
| Unpaid Family Workers | 0 | 0.0% |
| Total | 57 | 100.0% |
Employment Status by Age in Perley
According to the labor force statistics for Perley, out of the total population over 16 years of age (105), 72.4% or 76 individuals are in the labor force, with 25.0% or 19 of them unemployed. The age group with the highest labor force participation rate is 20 to 24 years, with 100.0% or 1 individuals in the labor force. Within the labor force, the 20 to 24 years age range has the highest percentage of unemployed individuals, with 100.0% or 1 of them being unemployed.
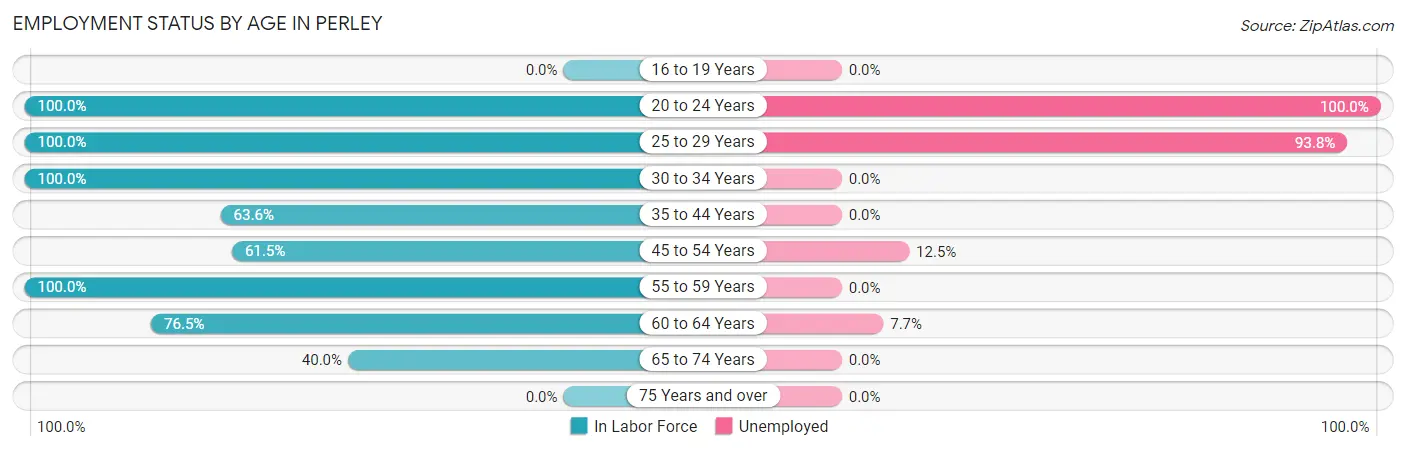
| Age Bracket | In Labor Force | Unemployed |
| 16 to 19 Years | 0 (0.0%) | 0 (0.0%) |
| 20 to 24 Years | 1 (100.0%) | 1 (100.0%) |
| 25 to 29 Years | 16 (100.0%) | 15 (93.8%) |
| 30 to 34 Years | 7 (100.0%) | 0 (0.0%) |
| 35 to 44 Years | 7 (63.6%) | 0 (0.0%) |
| 45 to 54 Years | 16 (61.5%) | 2 (12.5%) |
| 55 to 59 Years | 12 (100.0%) | 0 (0.0%) |
| 60 to 64 Years | 13 (76.5%) | 1 (7.7%) |
| 65 to 74 Years | 4 (40.0%) | 0 (0.0%) |
| 75 Years and over | 0 (0.0%) | 0 (0.0%) |
| Total | 76 (72.4%) | 19 (25.0%) |
Employment Status by Educational Attainment in Perley
According to labor force statistics for Perley, 79.8% of individuals (71) out of the total population between 25 and 64 years of age (89) are in the labor force, with 25.4% or 18 of them being unemployed. The group with the highest labor force participation rate are those with the educational attainment of bachelor's degree or higher, with 100.0% or 15 individuals in the labor force. Within the labor force, individuals with college / associate degree education have the highest percentage of unemployment, with 43.9% or 18 of them being unemployed.
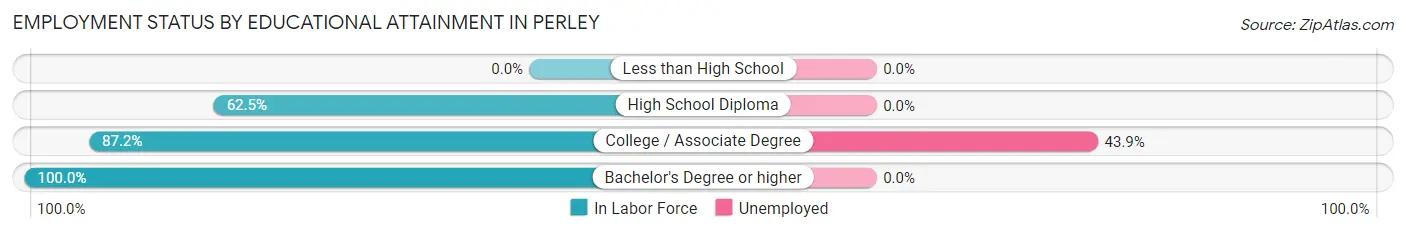
| Educational Attainment | In Labor Force | Unemployed |
| Less than High School | 0 (0.0%) | 0 (0.0%) |
| High School Diploma | 15 (62.5%) | 0 (0.0%) |
| College / Associate Degree | 41 (87.2%) | 21 (43.9%) |
| Bachelor's Degree or higher | 15 (100.0%) | 0 (0.0%) |
| Total | 71 (79.8%) | 23 (25.4%) |
Employment Occupations by Sex in Perley
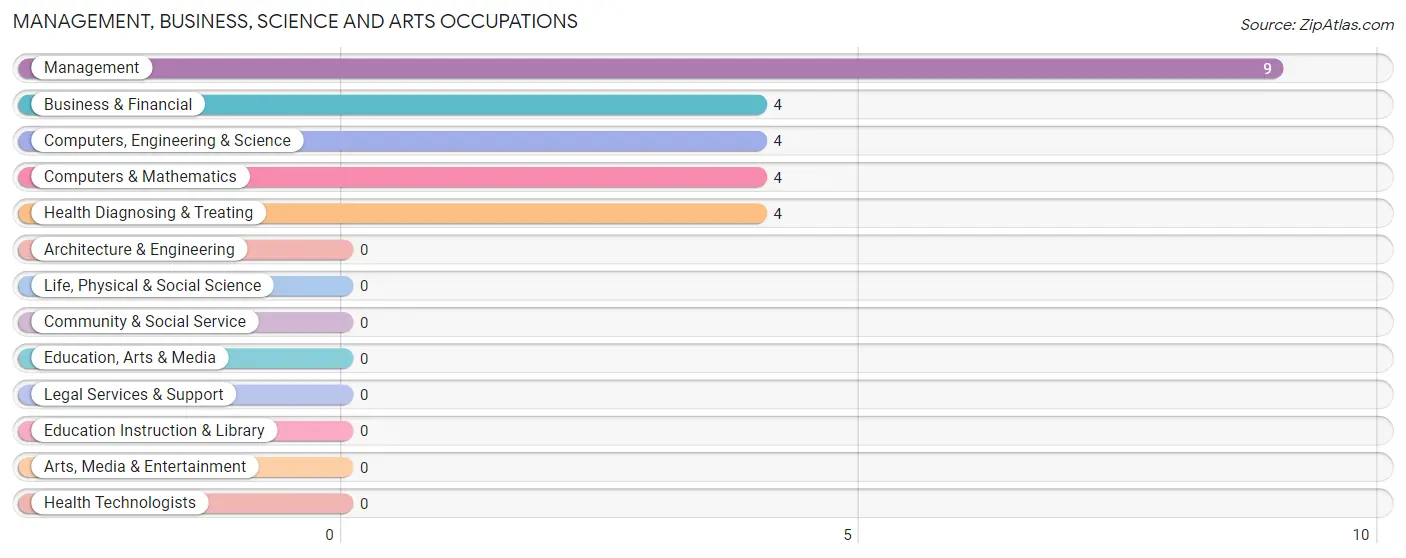
Management, Business, Science and Arts Occupations
The most common Management, Business, Science and Arts occupations in Perley are Management (9 | 15.8%), Business & Financial (4 | 7.0%), Computers, Engineering & Science (4 | 7.0%), Computers & Mathematics (4 | 7.0%), and Health Diagnosing & Treating (4 | 7.0%).
Management, Business, Science and Arts Occupations by Sex
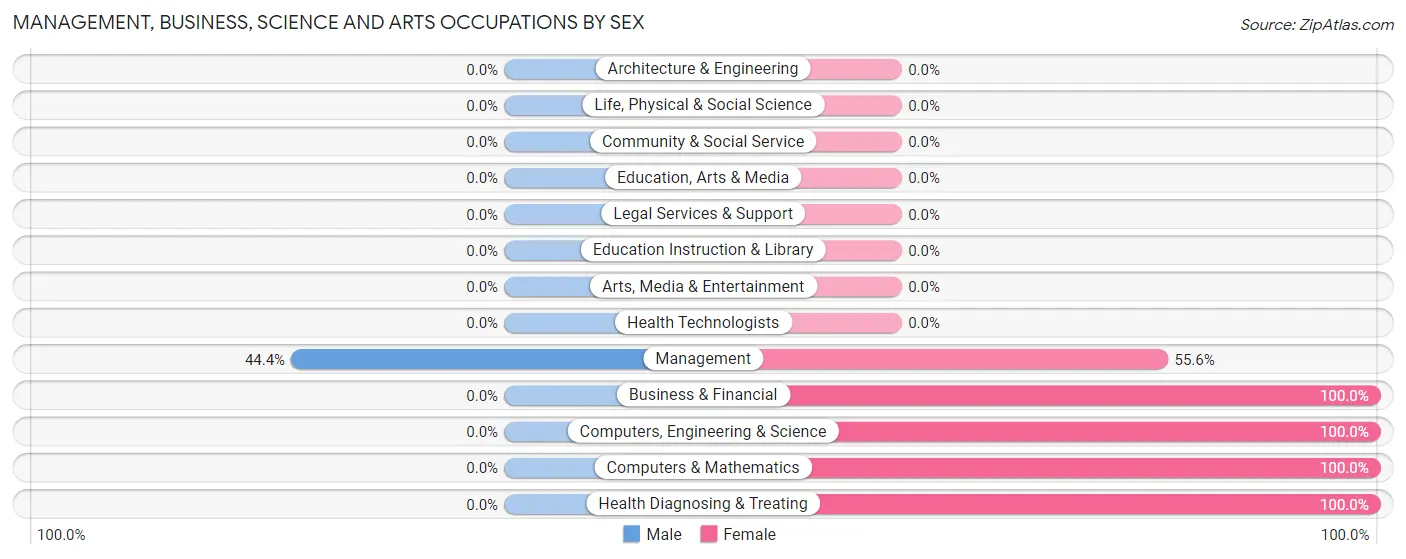
| Occupation | Male | Female |
| Management | 4 (44.4%) | 5 (55.6%) |
| Business & Financial | 0 (0.0%) | 4 (100.0%) |
| Computers, Engineering & Science | 0 (0.0%) | 4 (100.0%) |
| Computers & Mathematics | 0 (0.0%) | 4 (100.0%) |
| Architecture & Engineering | 0 (0.0%) | 0 (0.0%) |
| Life, Physical & Social Science | 0 (0.0%) | 0 (0.0%) |
| Community & Social Service | 0 (0.0%) | 0 (0.0%) |
| Education, Arts & Media | 0 (0.0%) | 0 (0.0%) |
| Legal Services & Support | 0 (0.0%) | 0 (0.0%) |
| Education Instruction & Library | 0 (0.0%) | 0 (0.0%) |
| Arts, Media & Entertainment | 0 (0.0%) | 0 (0.0%) |
| Health Diagnosing & Treating | 0 (0.0%) | 4 (100.0%) |
| Health Technologists | 0 (0.0%) | 0 (0.0%) |
| Total (Category) | 4 (19.1%) | 17 (80.9%) |
| Total (Overall) | 20 (35.1%) | 37 (64.9%) |
Services Occupations
The most common Services occupations in Perley are Healthcare Support (2 | 3.5%), Food Preparation & Serving (1 | 1.8%), and Personal Care & Service (1 | 1.8%).
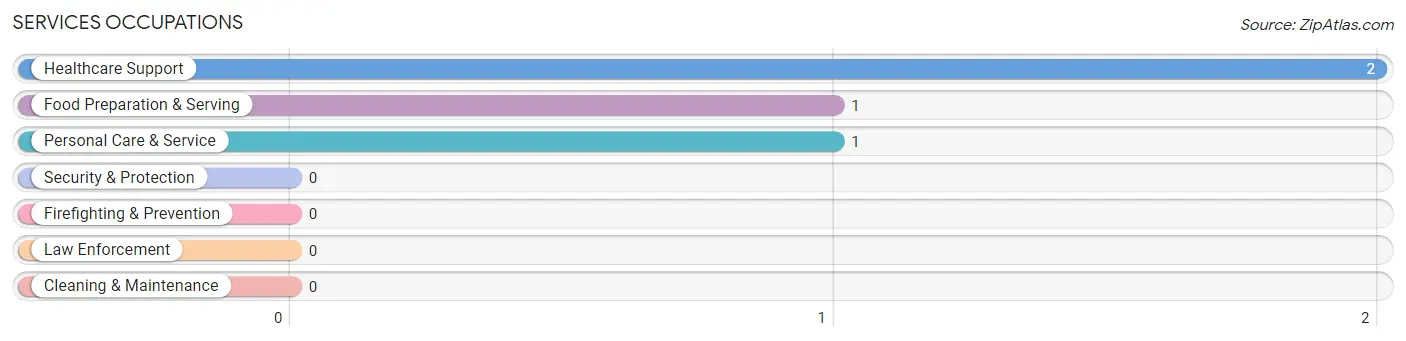
Services Occupations by Sex
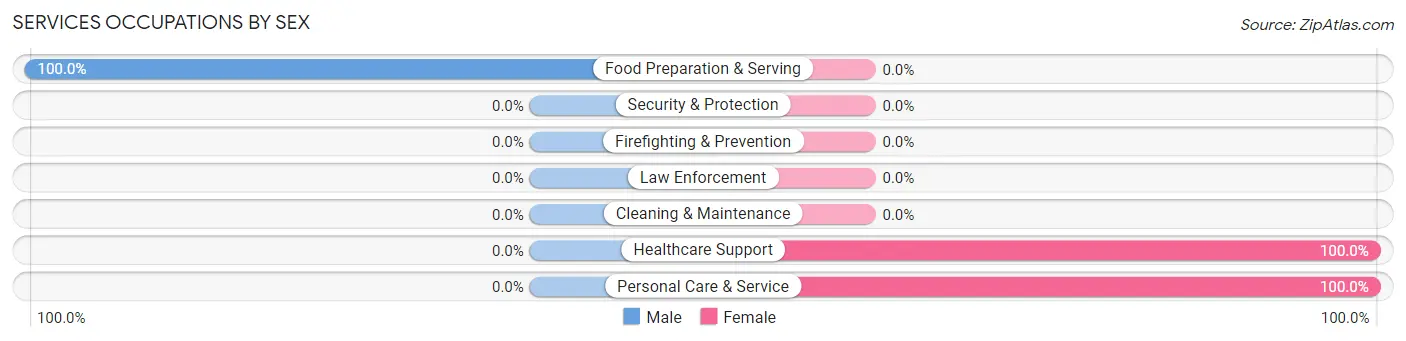
| Occupation | Male | Female |
| Healthcare Support | 0 (0.0%) | 2 (100.0%) |
| Security & Protection | 0 (0.0%) | 0 (0.0%) |
| Firefighting & Prevention | 0 (0.0%) | 0 (0.0%) |
| Law Enforcement | 0 (0.0%) | 0 (0.0%) |
| Food Preparation & Serving | 1 (100.0%) | 0 (0.0%) |
| Cleaning & Maintenance | 0 (0.0%) | 0 (0.0%) |
| Personal Care & Service | 0 (0.0%) | 1 (100.0%) |
| Total (Category) | 1 (25.0%) | 3 (75.0%) |
| Total (Overall) | 20 (35.1%) | 37 (64.9%) |
Sales and Office Occupations
The most common Sales and Office occupations in Perley are , and Office & Administration (12 | 21.0%).
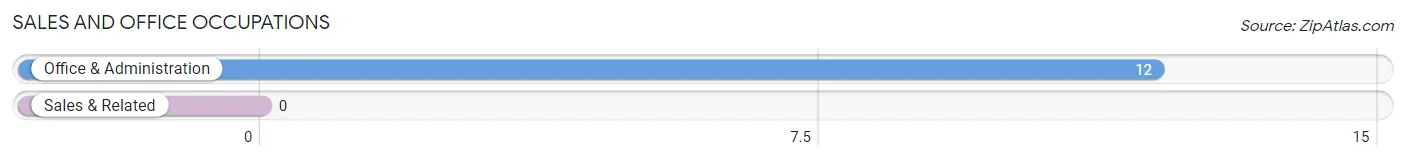
Sales and Office Occupations by Sex
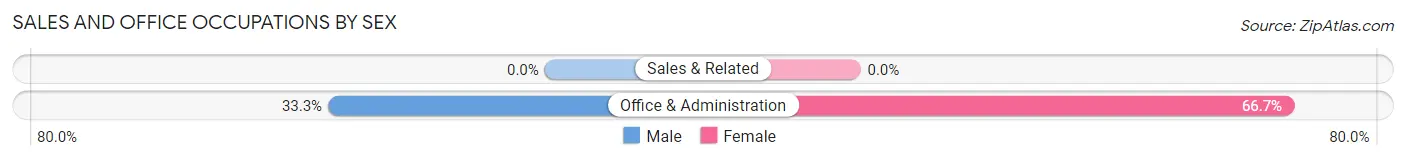
| Occupation | Male | Female |
| Sales & Related | 0 (0.0%) | 0 (0.0%) |
| Office & Administration | 4 (33.3%) | 8 (66.7%) |
| Total (Category) | 4 (33.3%) | 8 (66.7%) |
| Total (Overall) | 20 (35.1%) | 37 (64.9%) |
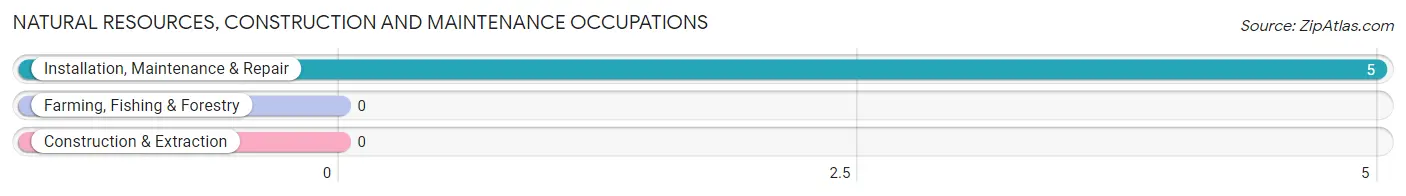
Natural Resources, Construction and Maintenance Occupations
The most common Natural Resources, Construction and Maintenance occupations in Perley are , and Installation, Maintenance & Repair (5 | 8.8%).
Natural Resources, Construction and Maintenance Occupations by Sex
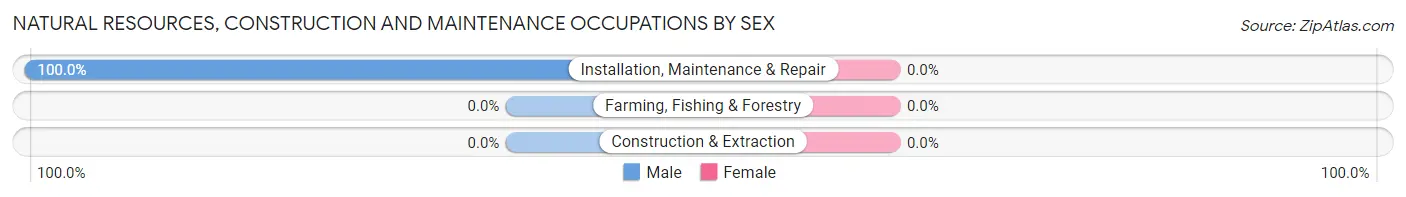
| Occupation | Male | Female |
| Farming, Fishing & Forestry | 0 (0.0%) | 0 (0.0%) |
| Construction & Extraction | 0 (0.0%) | 0 (0.0%) |
| Installation, Maintenance & Repair | 5 (100.0%) | 0 (0.0%) |
| Total (Category) | 5 (100.0%) | 0 (0.0%) |
| Total (Overall) | 20 (35.1%) | 37 (64.9%) |
Production, Transportation and Moving Occupations
The most common Production, Transportation and Moving occupations in Perley are Production (10 | 17.5%), and Transportation (5 | 8.8%).
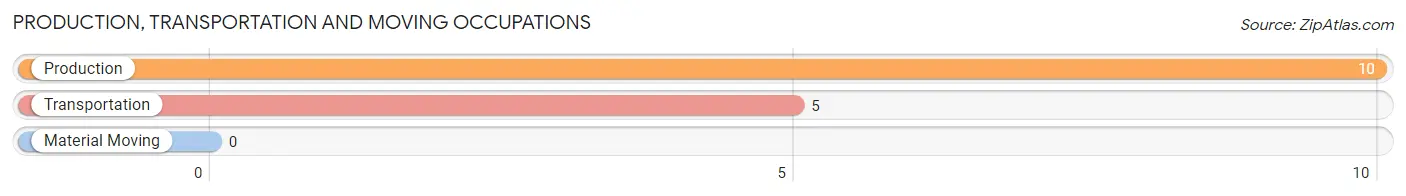
Production, Transportation and Moving Occupations by Sex
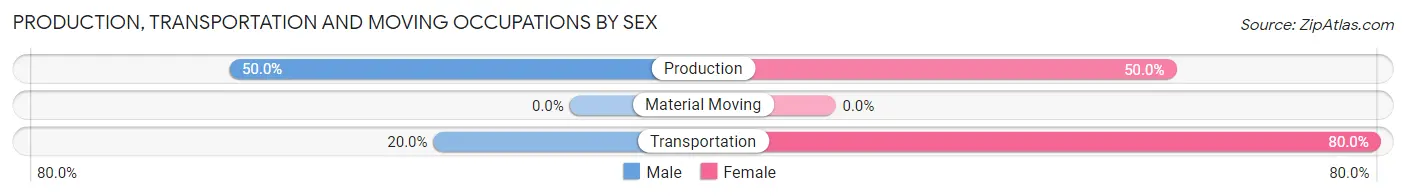
| Occupation | Male | Female |
| Production | 5 (50.0%) | 5 (50.0%) |
| Transportation | 1 (20.0%) | 4 (80.0%) |
| Material Moving | 0 (0.0%) | 0 (0.0%) |
| Total (Category) | 6 (40.0%) | 9 (60.0%) |
| Total (Overall) | 20 (35.1%) | 37 (64.9%) |
Employment Industries by Sex in Perley
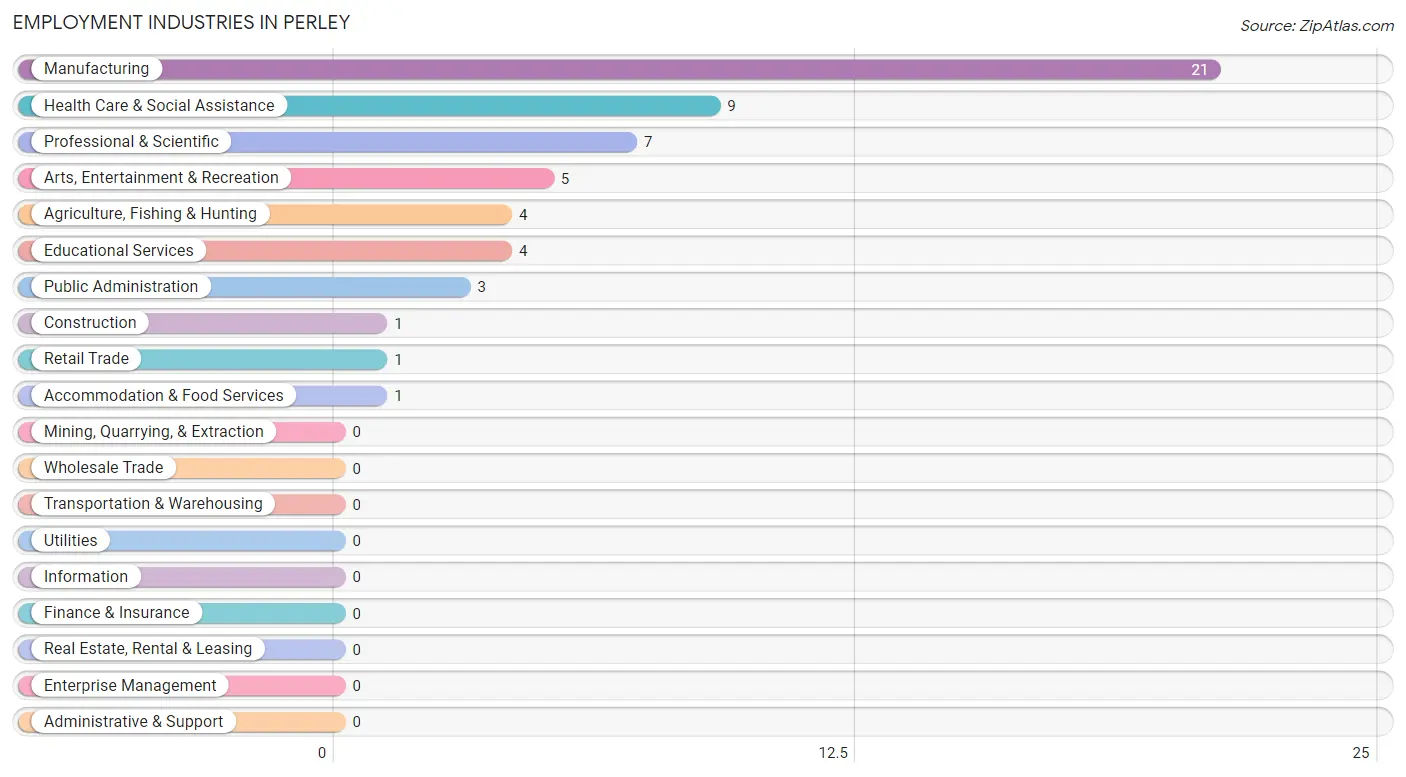
Employment Industries in Perley
The major employment industries in Perley include Manufacturing (21 | 36.8%), Health Care & Social Assistance (9 | 15.8%), Professional & Scientific (7 | 12.3%), Arts, Entertainment & Recreation (5 | 8.8%), and Agriculture, Fishing & Hunting (4 | 7.0%).
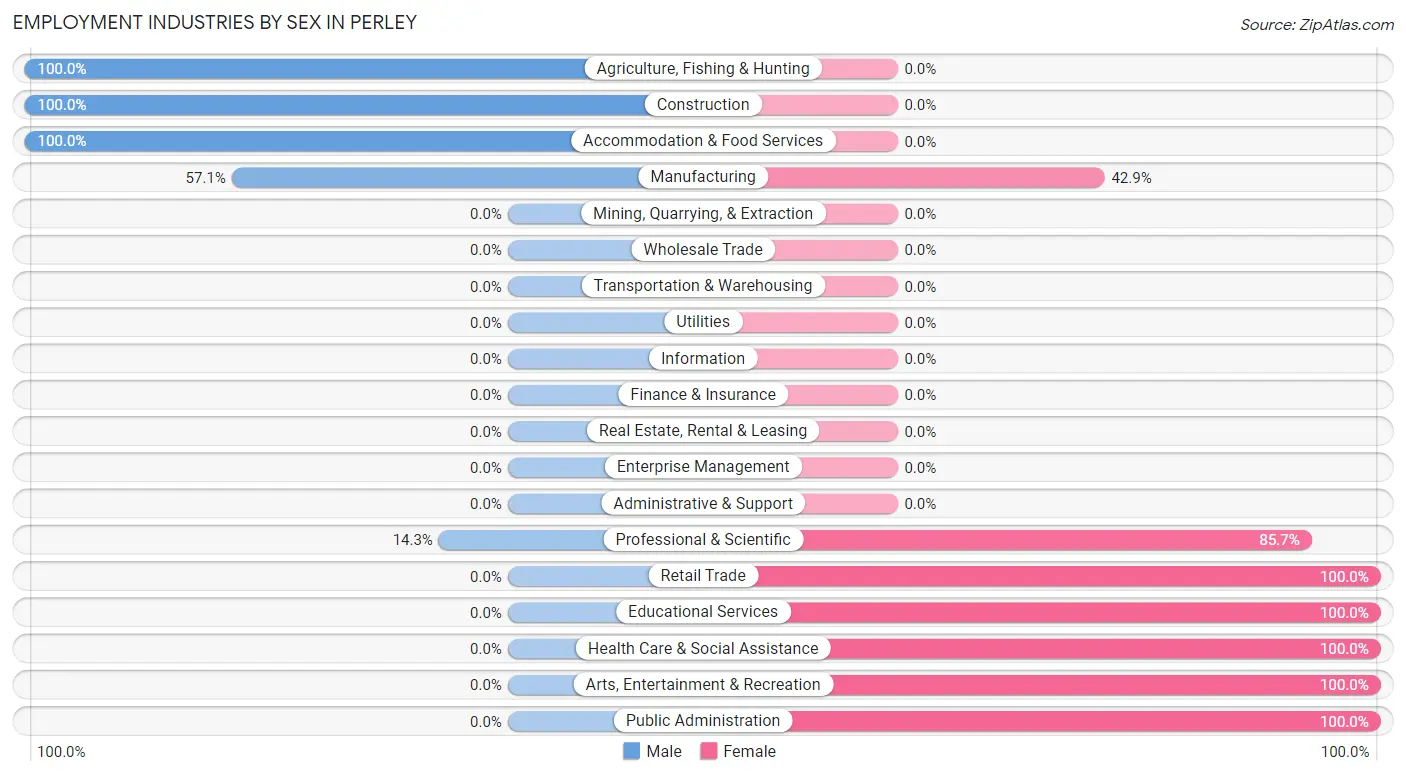
Employment Industries by Sex in Perley
The Perley industries that see more men than women are Agriculture, Fishing & Hunting (100.0%), Construction (100.0%), and Accommodation & Food Services (100.0%), whereas the industries that tend to have a higher number of women are Retail Trade (100.0%), Educational Services (100.0%), and Health Care & Social Assistance (100.0%).
| Industry | Male | Female |
| Agriculture, Fishing & Hunting | 4 (100.0%) | 0 (0.0%) |
| Mining, Quarrying, & Extraction | 0 (0.0%) | 0 (0.0%) |
| Construction | 1 (100.0%) | 0 (0.0%) |
| Manufacturing | 12 (57.1%) | 9 (42.9%) |
| Wholesale Trade | 0 (0.0%) | 0 (0.0%) |
| Retail Trade | 0 (0.0%) | 1 (100.0%) |
| Transportation & Warehousing | 0 (0.0%) | 0 (0.0%) |
| Utilities | 0 (0.0%) | 0 (0.0%) |
| Information | 0 (0.0%) | 0 (0.0%) |
| Finance & Insurance | 0 (0.0%) | 0 (0.0%) |
| Real Estate, Rental & Leasing | 0 (0.0%) | 0 (0.0%) |
| Professional & Scientific | 1 (14.3%) | 6 (85.7%) |
| Enterprise Management | 0 (0.0%) | 0 (0.0%) |
| Administrative & Support | 0 (0.0%) | 0 (0.0%) |
| Educational Services | 0 (0.0%) | 4 (100.0%) |
| Health Care & Social Assistance | 0 (0.0%) | 9 (100.0%) |
| Arts, Entertainment & Recreation | 0 (0.0%) | 5 (100.0%) |
| Accommodation & Food Services | 1 (100.0%) | 0 (0.0%) |
| Public Administration | 0 (0.0%) | 3 (100.0%) |
| Total | 20 (35.1%) | 37 (64.9%) |
Education in Perley
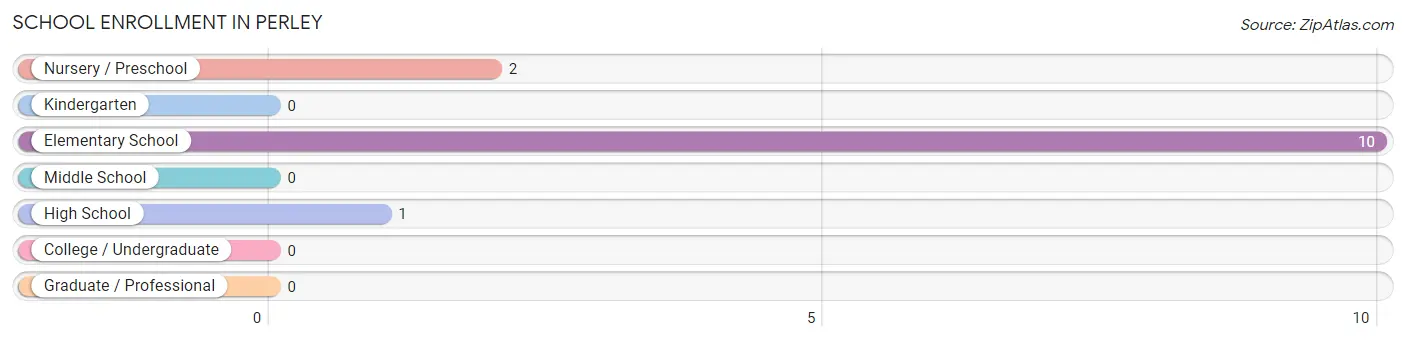
School Enrollment in Perley
The most common levels of schooling among the 13 students in Perley are elementary school (10 | 76.9%), nursery / preschool (2 | 15.4%), and high school (1 | 7.7%).
| School Level | # Students | % Students |
| Nursery / Preschool | 2 | 15.4% |
| Kindergarten | 0 | 0.0% |
| Elementary School | 10 | 76.9% |
| Middle School | 0 | 0.0% |
| High School | 1 | 7.7% |
| College / Undergraduate | 0 | 0.0% |
| Graduate / Professional | 0 | 0.0% |
| Total | 13 | 100.0% |
School Enrollment by Age by Funding Source in Perley
Out of a total of 13 students who are enrolled in schools in Perley, 8 (61.5%) attend a private institution, while the remaining 5 (38.5%) are enrolled in public schools. The age group of 5 to 9 year old has the highest likelihood of being enrolled in private schools, with 8 (66.7% in the age bracket) enrolled. Conversely, the age group of 15 to 17 year olds has the lowest likelihood of being enrolled in a private school, with 1 (100.0% in the age bracket) attending a public institution.
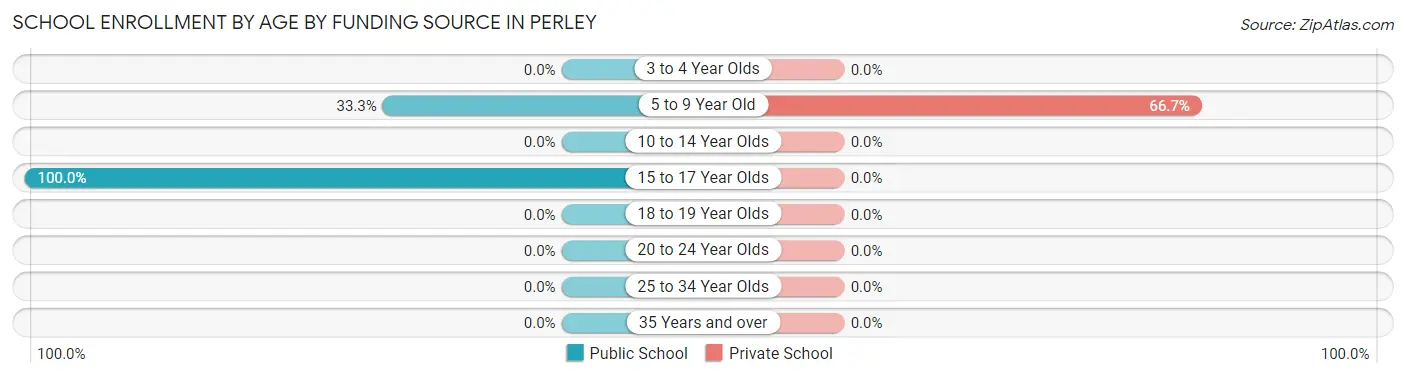
| Age Bracket | Public School | Private School |
| 3 to 4 Year Olds | 0 (0.0%) | 0 (0.0%) |
| 5 to 9 Year Old | 4 (33.3%) | 8 (66.7%) |
| 10 to 14 Year Olds | 0 (0.0%) | 0 (0.0%) |
| 15 to 17 Year Olds | 1 (100.0%) | 0 (0.0%) |
| 18 to 19 Year Olds | 0 (0.0%) | 0 (0.0%) |
| 20 to 24 Year Olds | 0 (0.0%) | 0 (0.0%) |
| 25 to 34 Year Olds | 0 (0.0%) | 0 (0.0%) |
| 35 Years and over | 0 (0.0%) | 0 (0.0%) |
| Total | 5 (38.5%) | 8 (61.5%) |
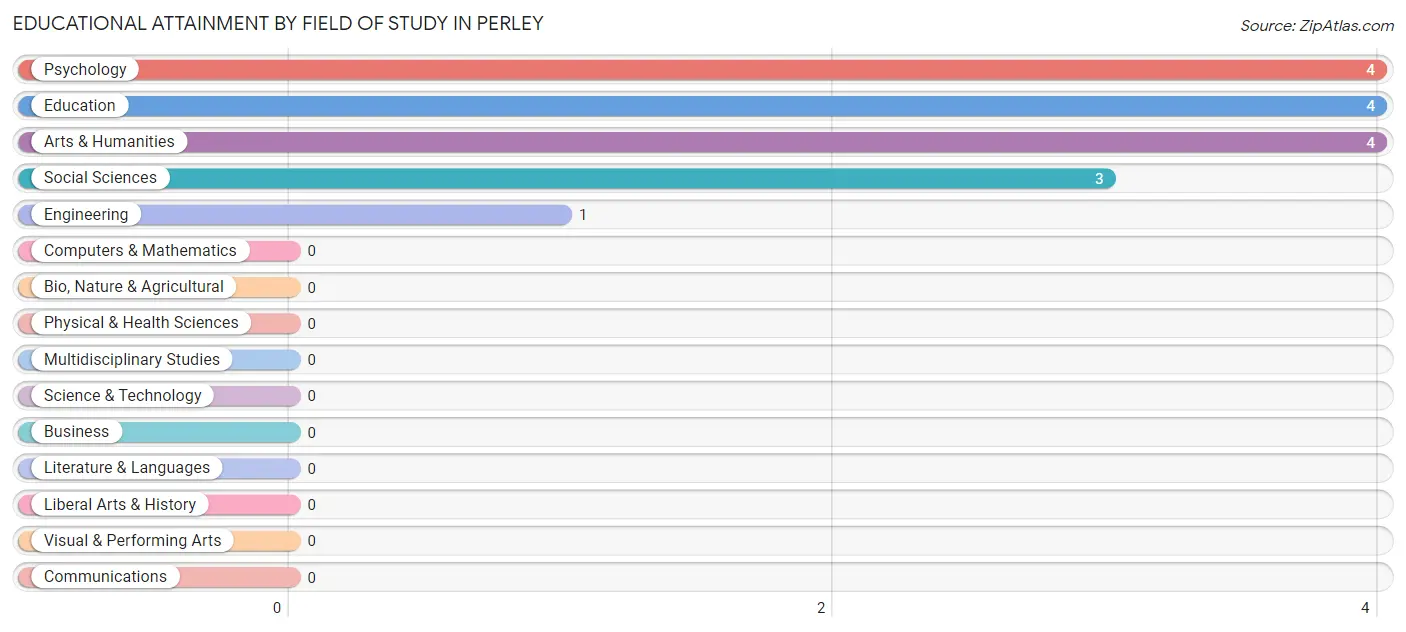
Educational Attainment by Field of Study in Perley
Psychology (4 | 25.0%), education (4 | 25.0%), arts & humanities (4 | 25.0%), social sciences (3 | 18.8%), and engineering (1 | 6.2%) are the most common fields of study among 16 individuals in Perley who have obtained a bachelor's degree or higher.
| Field of Study | # Graduates | % Graduates |
| Computers & Mathematics | 0 | 0.0% |
| Bio, Nature & Agricultural | 0 | 0.0% |
| Physical & Health Sciences | 0 | 0.0% |
| Psychology | 4 | 25.0% |
| Social Sciences | 3 | 18.8% |
| Engineering | 1 | 6.2% |
| Multidisciplinary Studies | 0 | 0.0% |
| Science & Technology | 0 | 0.0% |
| Business | 0 | 0.0% |
| Education | 4 | 25.0% |
| Literature & Languages | 0 | 0.0% |
| Liberal Arts & History | 0 | 0.0% |
| Visual & Performing Arts | 0 | 0.0% |
| Communications | 0 | 0.0% |
| Arts & Humanities | 4 | 25.0% |
| Total | 16 | 100.0% |
Transportation & Commute in Perley
Vehicle Availability by Sex in Perley
The most prevalent vehicle ownership categories in Perley are males with 2 vehicles (15, accounting for 75.0%) and females with 2 vehicles (19, making up 40.5%).
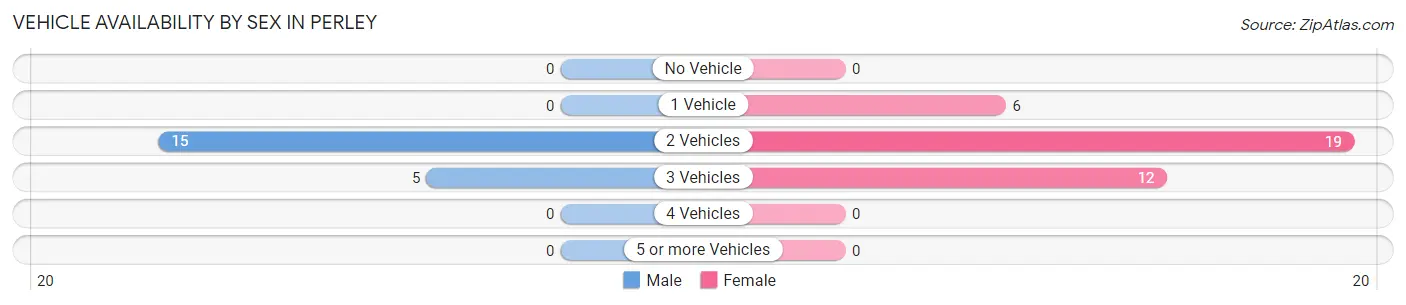
| Vehicles Available | Male | Female |
| No Vehicle | 0 (0.0%) | 0 (0.0%) |
| 1 Vehicle | 0 (0.0%) | 6 (16.2%) |
| 2 Vehicles | 15 (75.0%) | 19 (51.3%) |
| 3 Vehicles | 5 (25.0%) | 12 (32.4%) |
| 4 Vehicles | 0 (0.0%) | 0 (0.0%) |
| 5 or more Vehicles | 0 (0.0%) | 0 (0.0%) |
| Total | 20 (100.0%) | 37 (100.0%) |
Commute Time in Perley
The most frequently occuring commute durations in Perley are 45 to 59 minutes (26 commuters, 49.1%), less than 5 minutes (12 commuters, 22.6%), and 30 to 34 minutes (11 commuters, 20.7%).
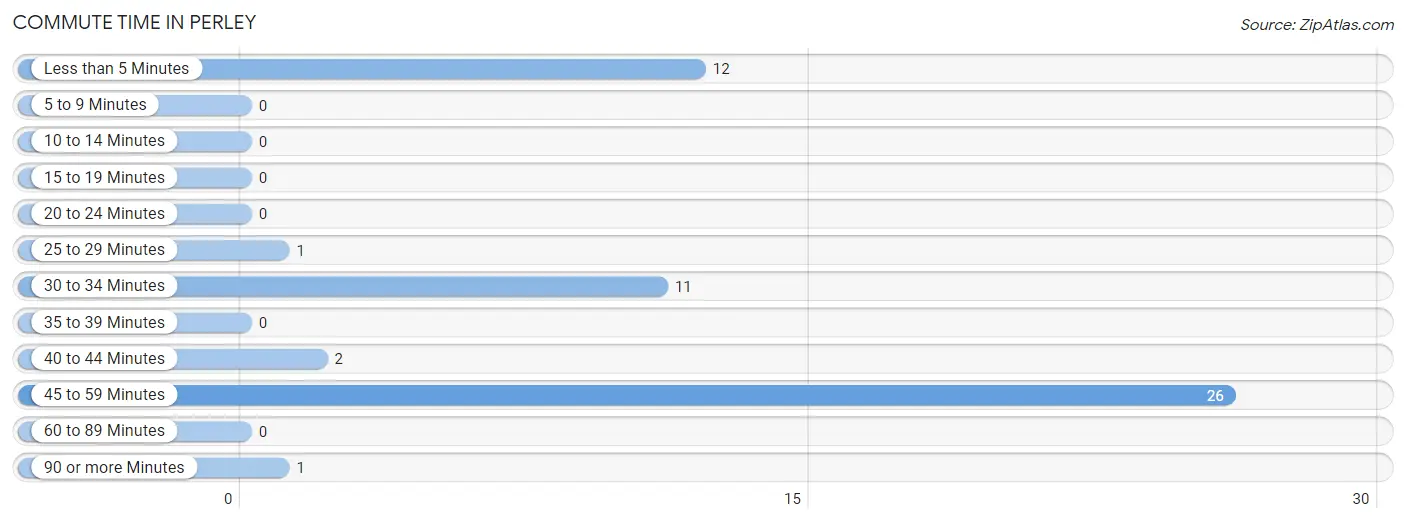
| Commute Time | # Commuters | % Commuters |
| Less than 5 Minutes | 12 | 22.6% |
| 5 to 9 Minutes | 0 | 0.0% |
| 10 to 14 Minutes | 0 | 0.0% |
| 15 to 19 Minutes | 0 | 0.0% |
| 20 to 24 Minutes | 0 | 0.0% |
| 25 to 29 Minutes | 1 | 1.9% |
| 30 to 34 Minutes | 11 | 20.7% |
| 35 to 39 Minutes | 0 | 0.0% |
| 40 to 44 Minutes | 2 | 3.8% |
| 45 to 59 Minutes | 26 | 49.1% |
| 60 to 89 Minutes | 0 | 0.0% |
| 90 or more Minutes | 1 | 1.9% |
Commute Time by Sex in Perley
The most common commute times in Perley are 45 to 59 minutes (9 commuters, 45.0%) for males and 45 to 59 minutes (17 commuters, 51.5%) for females.
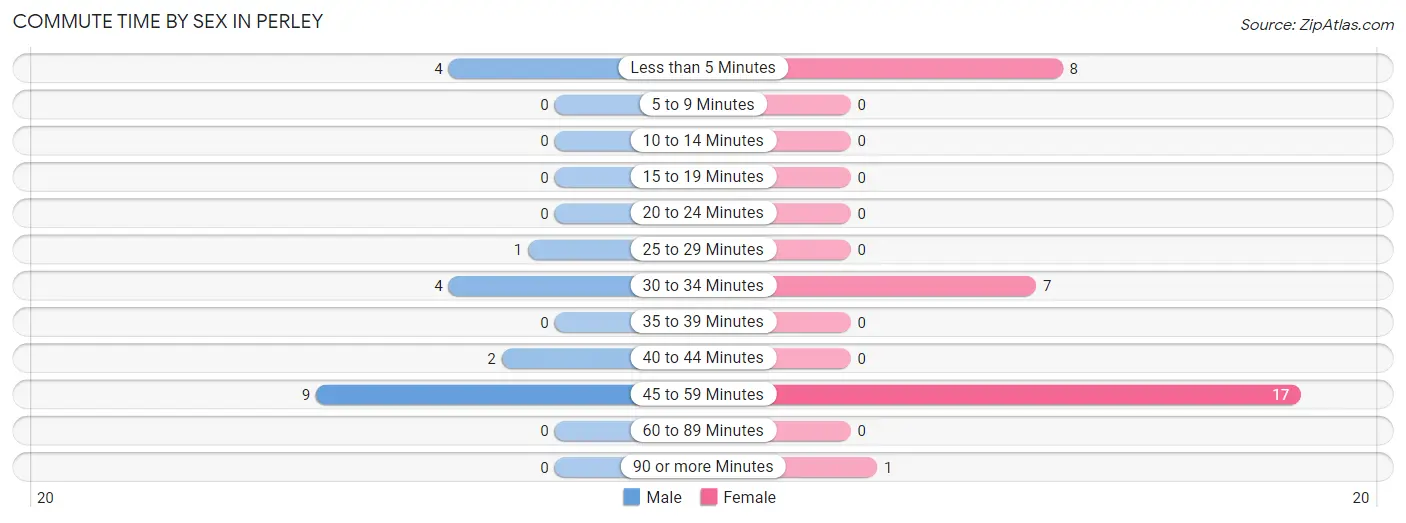
| Commute Time | Male | Female |
| Less than 5 Minutes | 4 (20.0%) | 8 (24.2%) |
| 5 to 9 Minutes | 0 (0.0%) | 0 (0.0%) |
| 10 to 14 Minutes | 0 (0.0%) | 0 (0.0%) |
| 15 to 19 Minutes | 0 (0.0%) | 0 (0.0%) |
| 20 to 24 Minutes | 0 (0.0%) | 0 (0.0%) |
| 25 to 29 Minutes | 1 (5.0%) | 0 (0.0%) |
| 30 to 34 Minutes | 4 (20.0%) | 7 (21.2%) |
| 35 to 39 Minutes | 0 (0.0%) | 0 (0.0%) |
| 40 to 44 Minutes | 2 (10.0%) | 0 (0.0%) |
| 45 to 59 Minutes | 9 (45.0%) | 17 (51.5%) |
| 60 to 89 Minutes | 0 (0.0%) | 0 (0.0%) |
| 90 or more Minutes | 0 (0.0%) | 1 (3.0%) |
Time of Departure to Work by Sex in Perley
The most frequent times of departure to work in Perley are 12:00 AM to 4:59 AM (8, 40.0%) for males and 6:30 AM to 6:59 AM (12, 36.4%) for females.
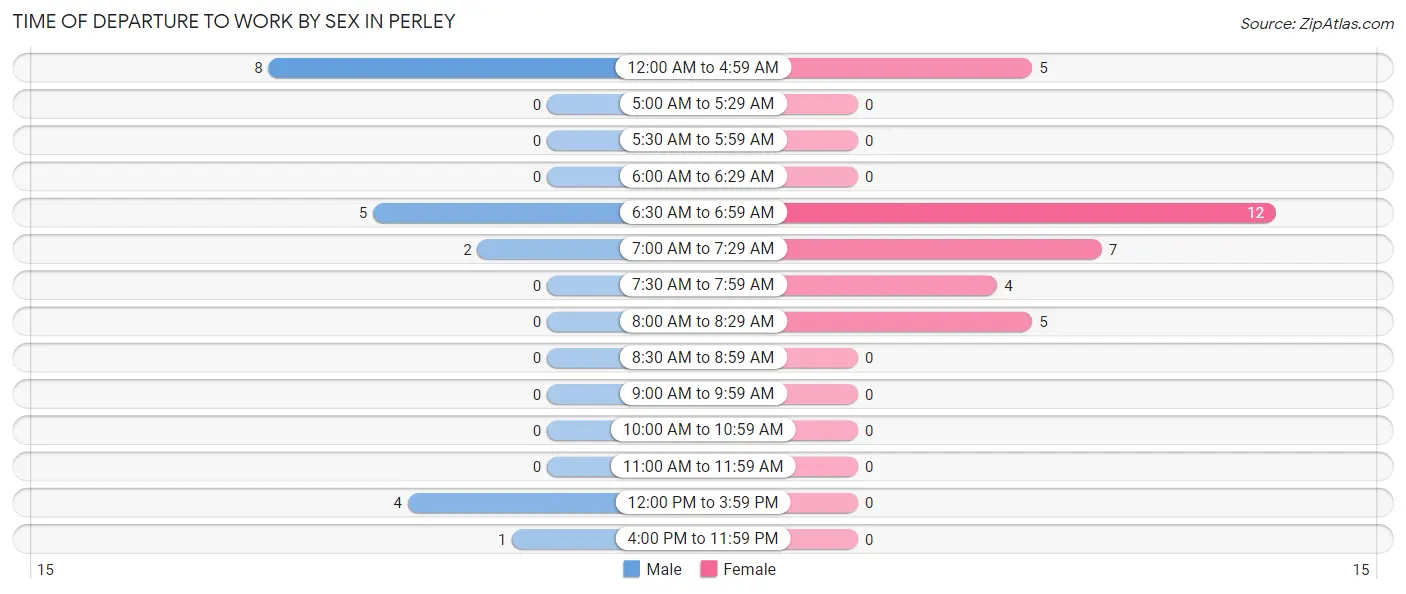
| Time of Departure | Male | Female |
| 12:00 AM to 4:59 AM | 8 (40.0%) | 5 (15.1%) |
| 5:00 AM to 5:29 AM | 0 (0.0%) | 0 (0.0%) |
| 5:30 AM to 5:59 AM | 0 (0.0%) | 0 (0.0%) |
| 6:00 AM to 6:29 AM | 0 (0.0%) | 0 (0.0%) |
| 6:30 AM to 6:59 AM | 5 (25.0%) | 12 (36.4%) |
| 7:00 AM to 7:29 AM | 2 (10.0%) | 7 (21.2%) |
| 7:30 AM to 7:59 AM | 0 (0.0%) | 4 (12.1%) |
| 8:00 AM to 8:29 AM | 0 (0.0%) | 5 (15.1%) |
| 8:30 AM to 8:59 AM | 0 (0.0%) | 0 (0.0%) |
| 9:00 AM to 9:59 AM | 0 (0.0%) | 0 (0.0%) |
| 10:00 AM to 10:59 AM | 0 (0.0%) | 0 (0.0%) |
| 11:00 AM to 11:59 AM | 0 (0.0%) | 0 (0.0%) |
| 12:00 PM to 3:59 PM | 4 (20.0%) | 0 (0.0%) |
| 4:00 PM to 11:59 PM | 1 (5.0%) | 0 (0.0%) |
| Total | 20 (100.0%) | 33 (100.0%) |
Housing Occupancy in Perley
Occupancy by Ownership in Perley
Of the total 54 dwellings in Perley, owner-occupied units account for 54 (100.0%), while renter-occupied units make up 0 (0.0%).
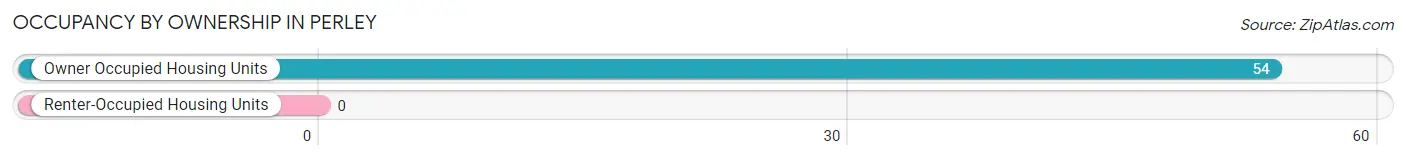
| Occupancy | # Housing Units | % Housing Units |
| Owner Occupied Housing Units | 54 | 100.0% |
| Renter-Occupied Housing Units | 0 | 0.0% |
| Total Occupied Housing Units | 54 | 100.0% |
Occupancy by Household Size in Perley
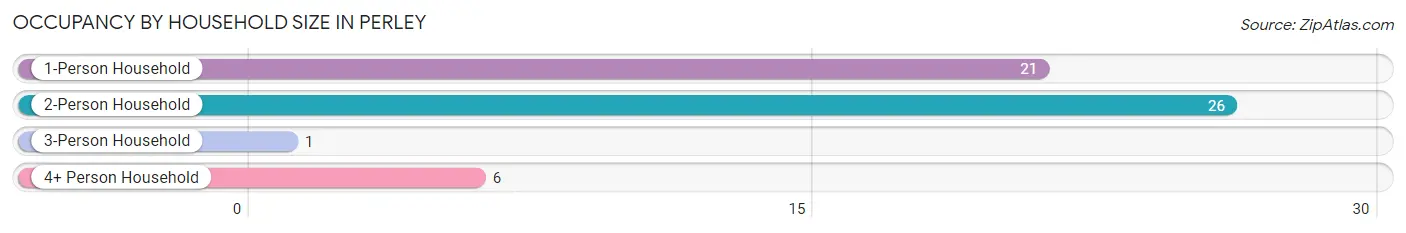
| Household Size | # Housing Units | % Housing Units |
| 1-Person Household | 21 | 38.9% |
| 2-Person Household | 26 | 48.1% |
| 3-Person Household | 1 | 1.8% |
| 4+ Person Household | 6 | 11.1% |
| Total Housing Units | 54 | 100.0% |
Occupancy by Ownership by Household Size in Perley
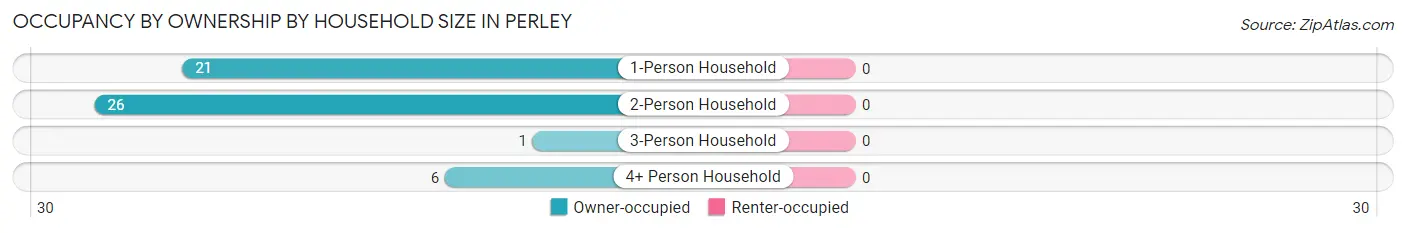
| Household Size | Owner-occupied | Renter-occupied |
| 1-Person Household | 21 (100.0%) | 0 (0.0%) |
| 2-Person Household | 26 (100.0%) | 0 (0.0%) |
| 3-Person Household | 1 (100.0%) | 0 (0.0%) |
| 4+ Person Household | 6 (100.0%) | 0 (0.0%) |
| Total Housing Units | 54 (100.0%) | 0 (0.0%) |
Occupancy by Educational Attainment in Perley
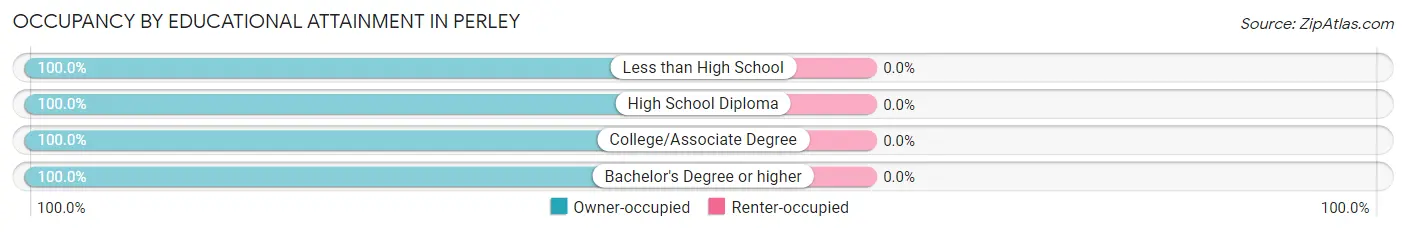
| Household Size | Owner-occupied | Renter-occupied |
| Less than High School | 3 (100.0%) | 0 (0.0%) |
| High School Diploma | 10 (100.0%) | 0 (0.0%) |
| College/Associate Degree | 25 (100.0%) | 0 (0.0%) |
| Bachelor's Degree or higher | 16 (100.0%) | 0 (0.0%) |
Occupancy by Age of Householder in Perley
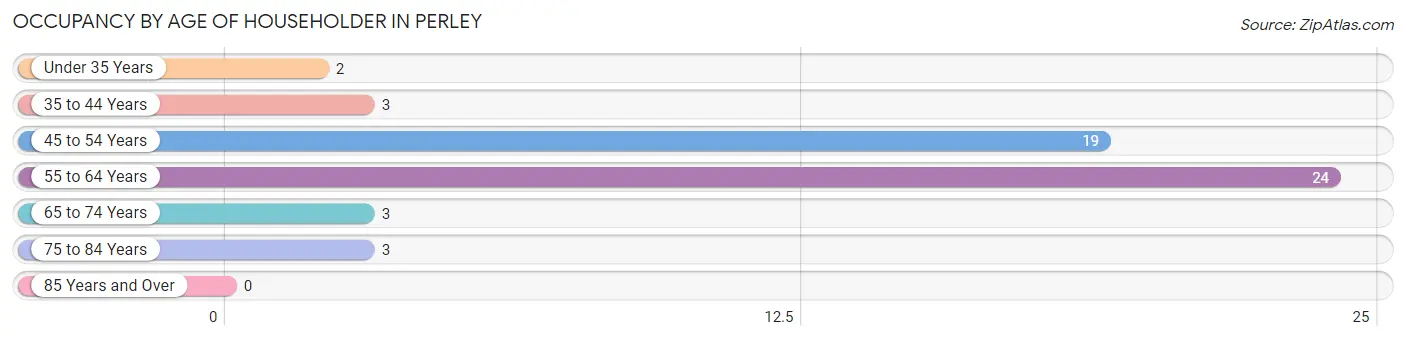
| Age Bracket | # Households | % Households |
| Under 35 Years | 2 | 3.7% |
| 35 to 44 Years | 3 | 5.6% |
| 45 to 54 Years | 19 | 35.2% |
| 55 to 64 Years | 24 | 44.4% |
| 65 to 74 Years | 3 | 5.6% |
| 75 to 84 Years | 3 | 5.6% |
| 85 Years and Over | 0 | 0.0% |
| Total | 54 | 100.0% |
Housing Finances in Perley
Median Income by Occupancy in Perley
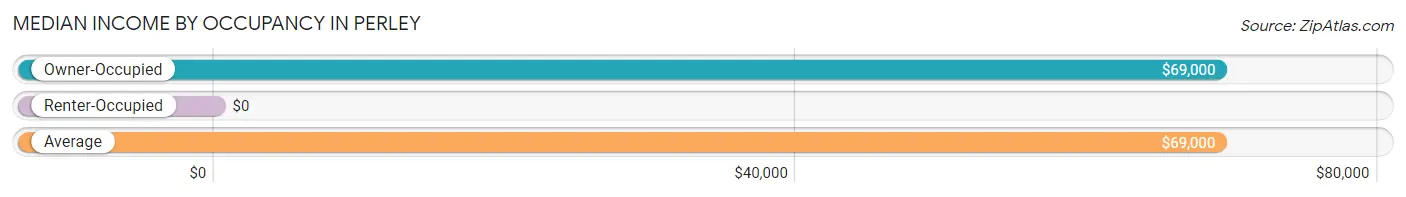
| Occupancy Type | # Households | Median Income |
| Owner-Occupied | 54 (100.0%) | $69,000 |
| Renter-Occupied | 0 (0.0%) | $0 |
| Average | 54 (100.0%) | $69,000 |
Occupancy by Householder Income Bracket in Perley
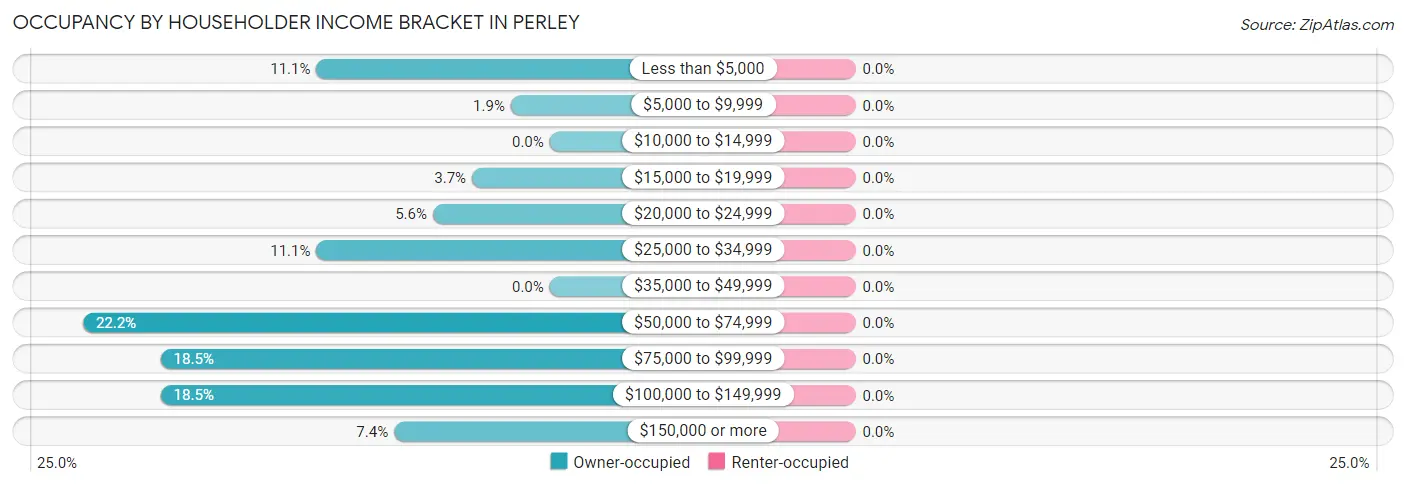
| Income Bracket | Owner-occupied | Renter-occupied |
| Less than $5,000 | 6 (11.1%) | 0 (0.0%) |
| $5,000 to $9,999 | 1 (1.8%) | 0 (0.0%) |
| $10,000 to $14,999 | 0 (0.0%) | 0 (0.0%) |
| $15,000 to $19,999 | 2 (3.7%) | 0 (0.0%) |
| $20,000 to $24,999 | 3 (5.6%) | 0 (0.0%) |
| $25,000 to $34,999 | 6 (11.1%) | 0 (0.0%) |
| $35,000 to $49,999 | 0 (0.0%) | 0 (0.0%) |
| $50,000 to $74,999 | 12 (22.2%) | 0 (0.0%) |
| $75,000 to $99,999 | 10 (18.5%) | 0 (0.0%) |
| $100,000 to $149,999 | 10 (18.5%) | 0 (0.0%) |
| $150,000 or more | 4 (7.4%) | 0 (0.0%) |
| Total | 54 (100.0%) | 0 (0.0%) |
Monthly Housing Cost Tiers in Perley
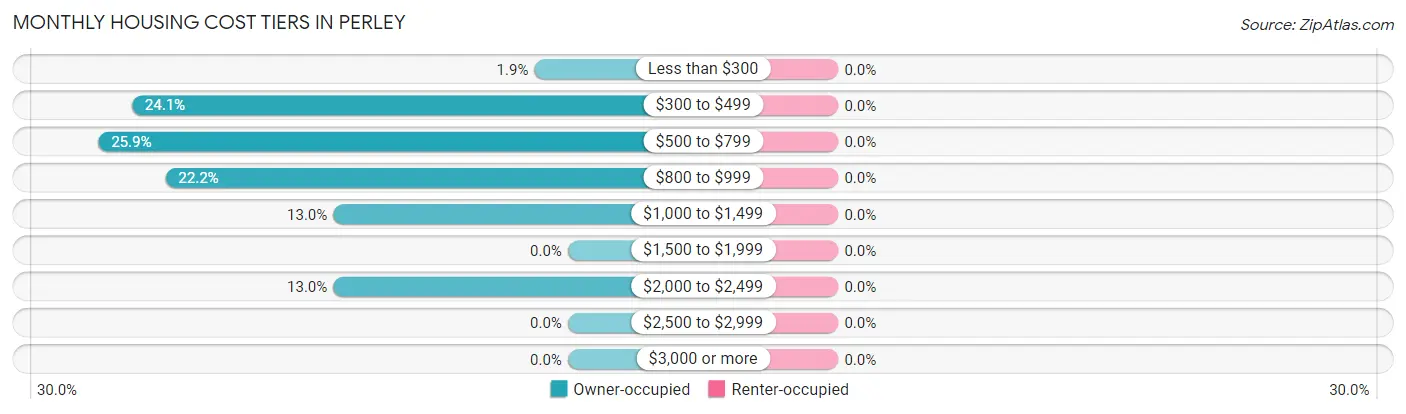
| Monthly Cost | Owner-occupied | Renter-occupied |
| Less than $300 | 1 (1.8%) | 0 (0.0%) |
| $300 to $499 | 13 (24.1%) | 0 (0.0%) |
| $500 to $799 | 14 (25.9%) | 0 (0.0%) |
| $800 to $999 | 12 (22.2%) | 0 (0.0%) |
| $1,000 to $1,499 | 7 (13.0%) | 0 (0.0%) |
| $1,500 to $1,999 | 0 (0.0%) | 0 (0.0%) |
| $2,000 to $2,499 | 7 (13.0%) | 0 (0.0%) |
| $2,500 to $2,999 | 0 (0.0%) | 0 (0.0%) |
| $3,000 or more | 0 (0.0%) | 0 (0.0%) |
| Total | 54 (100.0%) | 0 (0.0%) |
Physical Housing Characteristics in Perley
Housing Structures in Perley
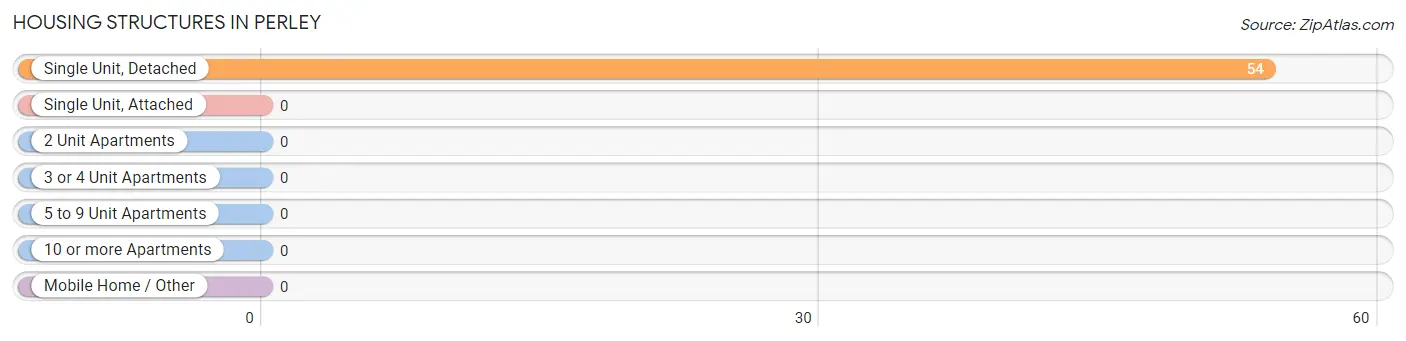
| Structure Type | # Housing Units | % Housing Units |
| Single Unit, Detached | 54 | 100.0% |
| Single Unit, Attached | 0 | 0.0% |
| 2 Unit Apartments | 0 | 0.0% |
| 3 or 4 Unit Apartments | 0 | 0.0% |
| 5 to 9 Unit Apartments | 0 | 0.0% |
| 10 or more Apartments | 0 | 0.0% |
| Mobile Home / Other | 0 | 0.0% |
| Total | 54 | 100.0% |
Housing Structures by Occupancy in Perley
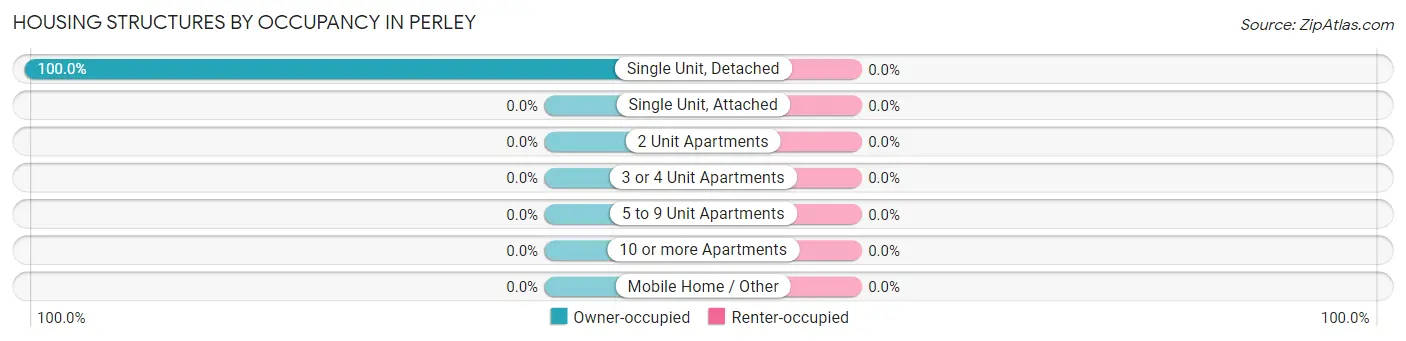
| Structure Type | Owner-occupied | Renter-occupied |
| Single Unit, Detached | 54 (100.0%) | 0 (0.0%) |
| Single Unit, Attached | 0 (0.0%) | 0 (0.0%) |
| 2 Unit Apartments | 0 (0.0%) | 0 (0.0%) |
| 3 or 4 Unit Apartments | 0 (0.0%) | 0 (0.0%) |
| 5 to 9 Unit Apartments | 0 (0.0%) | 0 (0.0%) |
| 10 or more Apartments | 0 (0.0%) | 0 (0.0%) |
| Mobile Home / Other | 0 (0.0%) | 0 (0.0%) |
| Total | 54 (100.0%) | 0 (0.0%) |
Housing Structures by Number of Rooms in Perley
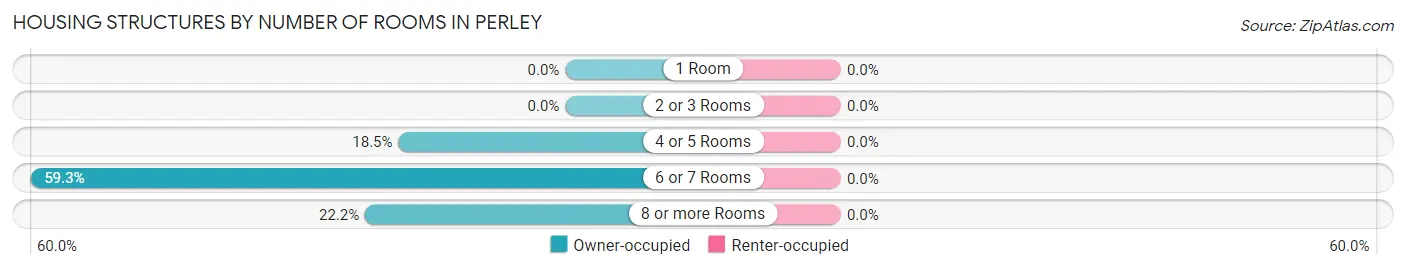
| Number of Rooms | Owner-occupied | Renter-occupied |
| 1 Room | 0 (0.0%) | 0 (0.0%) |
| 2 or 3 Rooms | 0 (0.0%) | 0 (0.0%) |
| 4 or 5 Rooms | 10 (18.5%) | 0 (0.0%) |
| 6 or 7 Rooms | 32 (59.3%) | 0 (0.0%) |
| 8 or more Rooms | 12 (22.2%) | 0 (0.0%) |
| Total | 54 (100.0%) | 0 (0.0%) |
Housing Structure by Heating Type in Perley
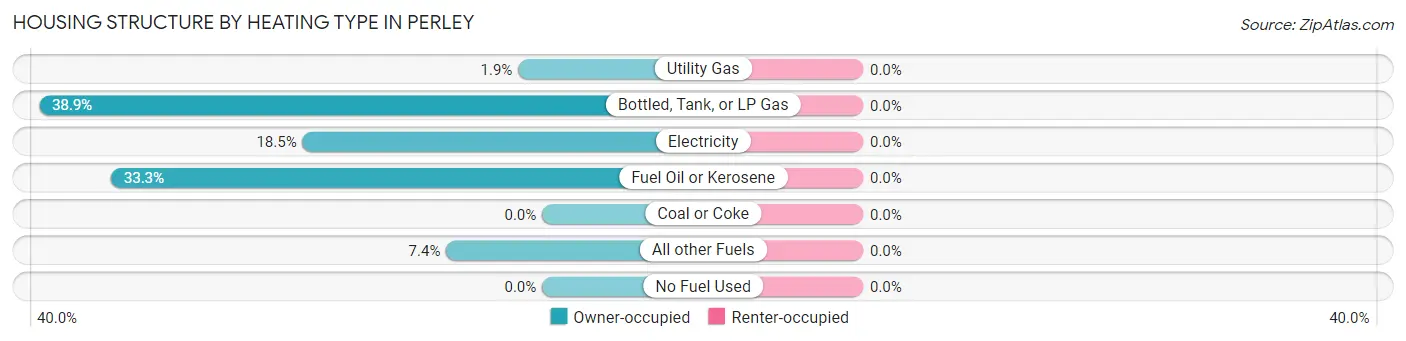
| Heating Type | Owner-occupied | Renter-occupied |
| Utility Gas | 1 (1.8%) | 0 (0.0%) |
| Bottled, Tank, or LP Gas | 21 (38.9%) | 0 (0.0%) |
| Electricity | 10 (18.5%) | 0 (0.0%) |
| Fuel Oil or Kerosene | 18 (33.3%) | 0 (0.0%) |
| Coal or Coke | 0 (0.0%) | 0 (0.0%) |
| All other Fuels | 4 (7.4%) | 0 (0.0%) |
| No Fuel Used | 0 (0.0%) | 0 (0.0%) |
| Total | 54 (100.0%) | 0 (0.0%) |
Household Vehicle Usage in Perley
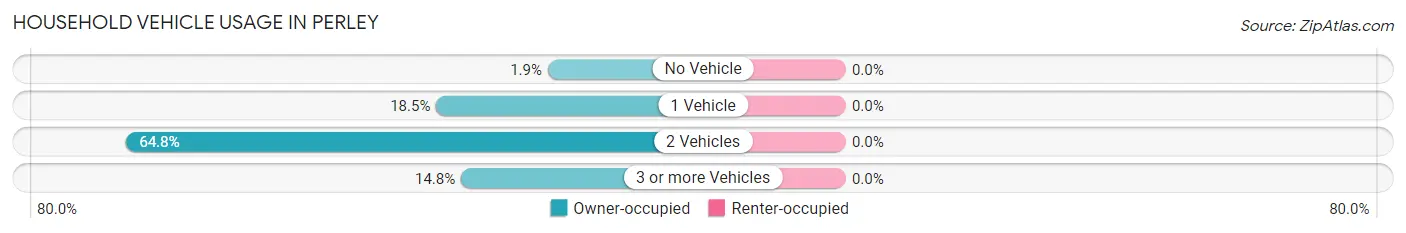
| Vehicles per Household | Owner-occupied | Renter-occupied |
| No Vehicle | 1 (1.8%) | 0 (0.0%) |
| 1 Vehicle | 10 (18.5%) | 0 (0.0%) |
| 2 Vehicles | 35 (64.8%) | 0 (0.0%) |
| 3 or more Vehicles | 8 (14.8%) | 0 (0.0%) |
| Total | 54 (100.0%) | 0 (0.0%) |
Real Estate & Mortgages in Perley
Real Estate and Mortgage Overview in Perley
| Characteristic | Without Mortgage | With Mortgage |
| Housing Units | 28 | 26 |
| Median Property Value | $75,000 | $92,000 |
| Median Household Income | $65,000 | $0 |
| Monthly Housing Costs | $500 | $0 |
| Real Estate Taxes | $900 | $0 |
Property Value by Mortgage Status in Perley
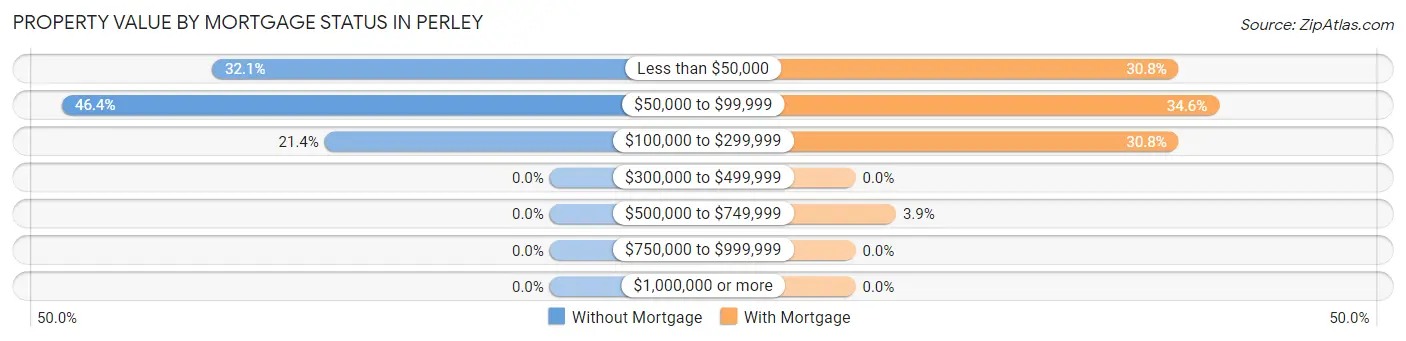
| Property Value | Without Mortgage | With Mortgage |
| Less than $50,000 | 9 (32.1%) | 8 (30.8%) |
| $50,000 to $99,999 | 13 (46.4%) | 9 (34.6%) |
| $100,000 to $299,999 | 6 (21.4%) | 8 (30.8%) |
| $300,000 to $499,999 | 0 (0.0%) | 0 (0.0%) |
| $500,000 to $749,999 | 0 (0.0%) | 1 (3.8%) |
| $750,000 to $999,999 | 0 (0.0%) | 0 (0.0%) |
| $1,000,000 or more | 0 (0.0%) | 0 (0.0%) |
| Total | 28 (100.0%) | 26 (100.0%) |
Household Income by Mortgage Status in Perley
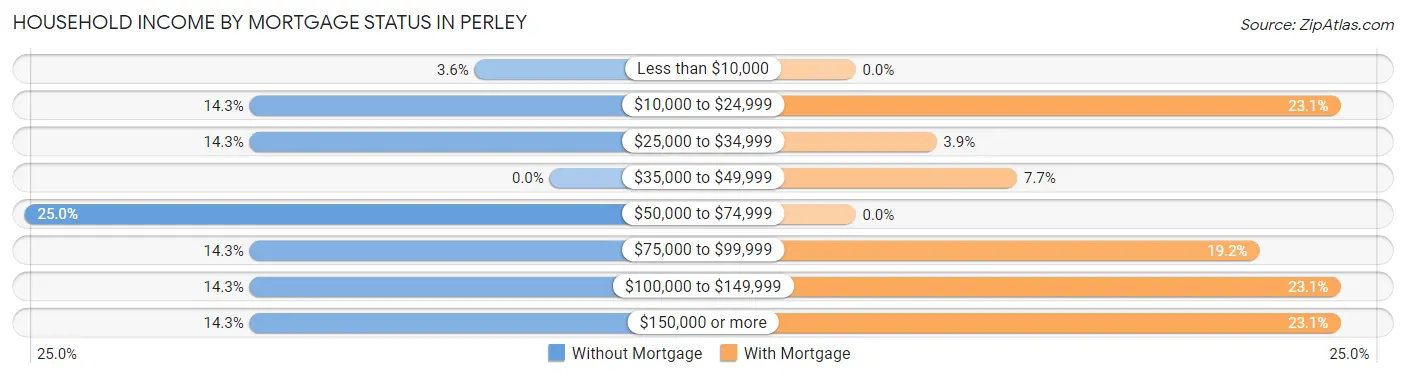
| Household Income | Without Mortgage | With Mortgage |
| Less than $10,000 | 1 (3.6%) | 0 (0.0%) |
| $10,000 to $24,999 | 4 (14.3%) | 6 (23.1%) |
| $25,000 to $34,999 | 4 (14.3%) | 1 (3.8%) |
| $35,000 to $49,999 | 0 (0.0%) | 2 (7.7%) |
| $50,000 to $74,999 | 7 (25.0%) | 0 (0.0%) |
| $75,000 to $99,999 | 4 (14.3%) | 5 (19.2%) |
| $100,000 to $149,999 | 4 (14.3%) | 6 (23.1%) |
| $150,000 or more | 4 (14.3%) | 6 (23.1%) |
| Total | 28 (100.0%) | 26 (100.0%) |
Property Value to Household Income Ratio in Perley
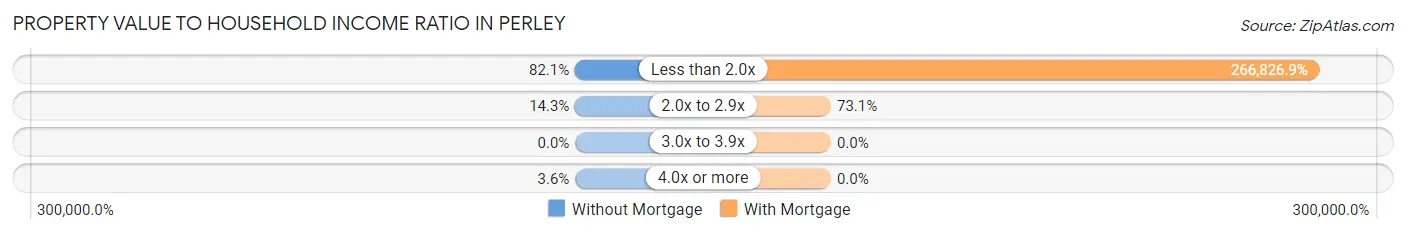
| Value-to-Income Ratio | Without Mortgage | With Mortgage |
| Less than 2.0x | 23 (82.1%) | 69,375 (266,826.9%) |
| 2.0x to 2.9x | 4 (14.3%) | 19 (73.1%) |
| 3.0x to 3.9x | 0 (0.0%) | 0 (0.0%) |
| 4.0x or more | 1 (3.6%) | 0 (0.0%) |
| Total | 28 (100.0%) | 26 (100.0%) |
Real Estate Taxes by Mortgage Status in Perley
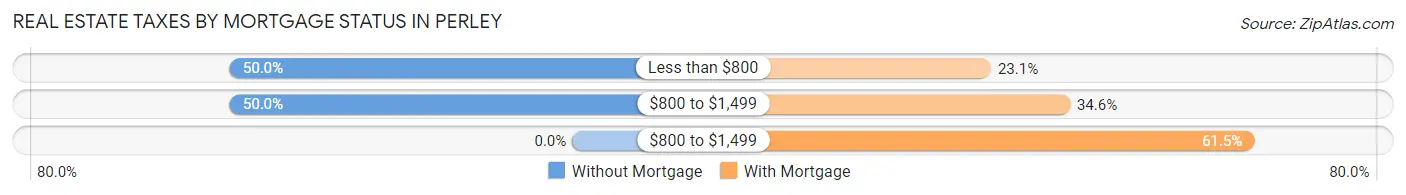
| Property Taxes | Without Mortgage | With Mortgage |
| Less than $800 | 14 (50.0%) | 6 (23.1%) |
| $800 to $1,499 | 14 (50.0%) | 9 (34.6%) |
| $800 to $1,499 | 0 (0.0%) | 16 (61.5%) |
| Total | 28 (100.0%) | 26 (100.0%) |
Health & Disability in Perley
Health Insurance Coverage by Age in Perley
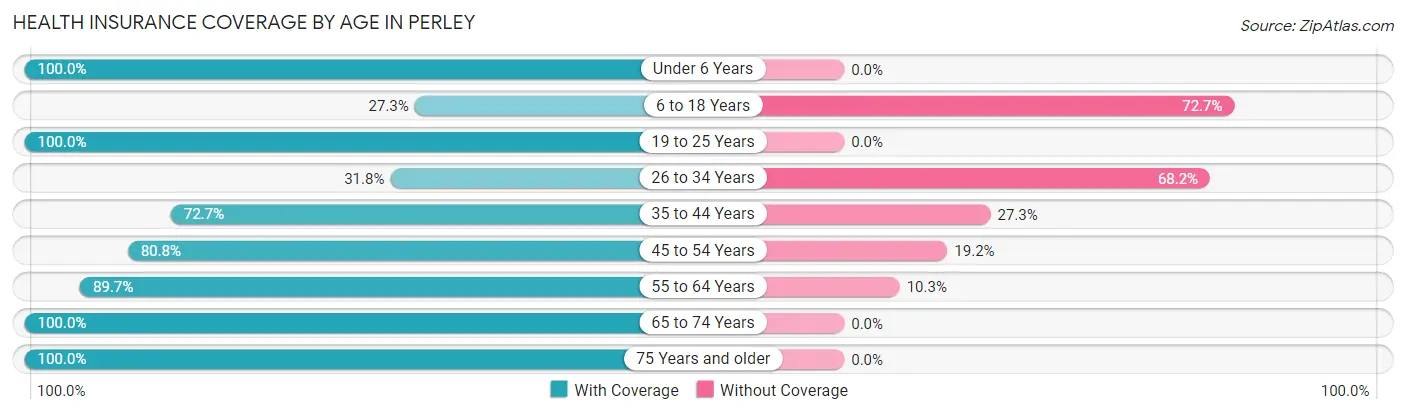
| Age Bracket | With Coverage | Without Coverage |
| Under 6 Years | 4 (100.0%) | 0 (0.0%) |
| 6 to 18 Years | 3 (27.3%) | 8 (72.7%) |
| 19 to 25 Years | 2 (100.0%) | 0 (0.0%) |
| 26 to 34 Years | 7 (31.8%) | 15 (68.2%) |
| 35 to 44 Years | 8 (72.7%) | 3 (27.3%) |
| 45 to 54 Years | 21 (80.8%) | 5 (19.2%) |
| 55 to 64 Years | 26 (89.7%) | 3 (10.3%) |
| 65 to 74 Years | 10 (100.0%) | 0 (0.0%) |
| 75 Years and older | 4 (100.0%) | 0 (0.0%) |
| Total | 85 (71.4%) | 34 (28.6%) |
Health Insurance Coverage by Citizenship Status in Perley
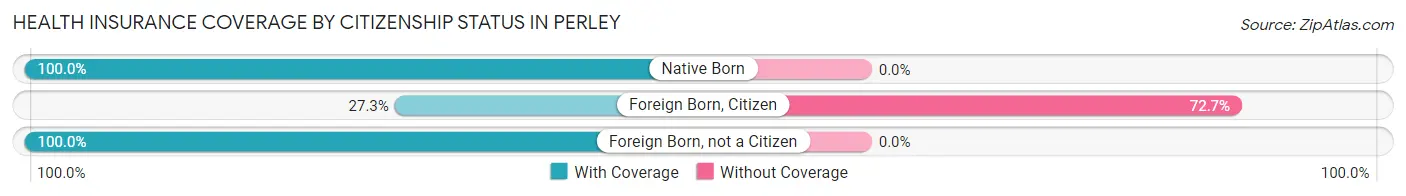
| Citizenship Status | With Coverage | Without Coverage |
| Native Born | 4 (100.0%) | 0 (0.0%) |
| Foreign Born, Citizen | 3 (27.3%) | 8 (72.7%) |
| Foreign Born, not a Citizen | 2 (100.0%) | 0 (0.0%) |
Health Insurance Coverage by Household Income in Perley
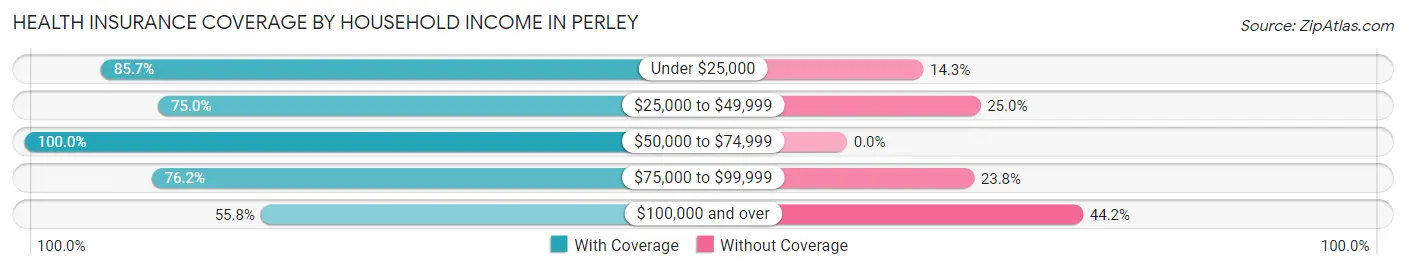
| Household Income | With Coverage | Without Coverage |
| Under $25,000 | 18 (85.7%) | 3 (14.3%) |
| $25,000 to $49,999 | 9 (75.0%) | 3 (25.0%) |
| $50,000 to $74,999 | 13 (100.0%) | 0 (0.0%) |
| $75,000 to $99,999 | 16 (76.2%) | 5 (23.8%) |
| $100,000 and over | 29 (55.8%) | 23 (44.2%) |
Public vs Private Health Insurance Coverage by Age in Perley
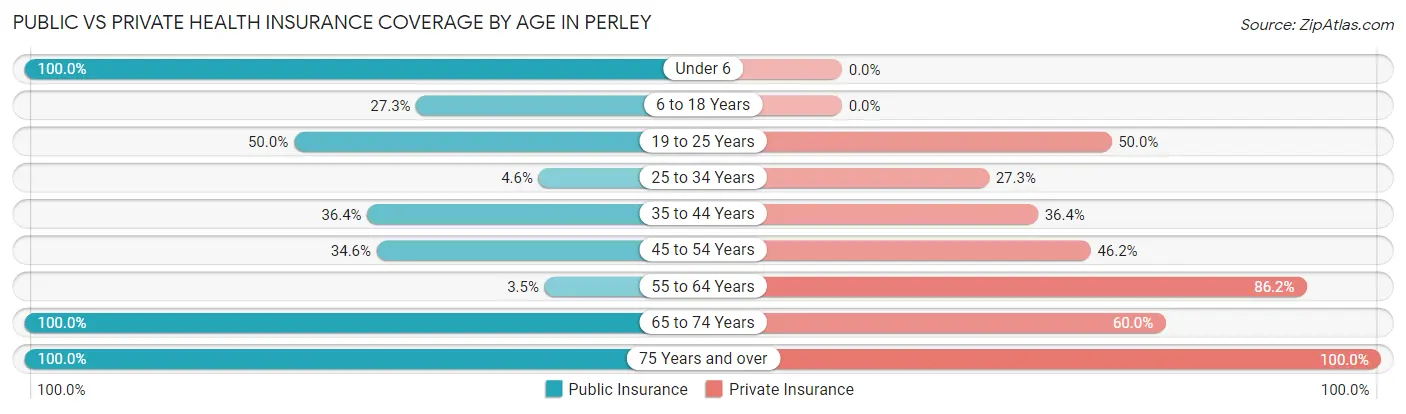
| Age Bracket | Public Insurance | Private Insurance |
| Under 6 | 4 (100.0%) | 0 (0.0%) |
| 6 to 18 Years | 3 (27.3%) | 0 (0.0%) |
| 19 to 25 Years | 1 (50.0%) | 1 (50.0%) |
| 25 to 34 Years | 1 (4.5%) | 6 (27.3%) |
| 35 to 44 Years | 4 (36.4%) | 4 (36.4%) |
| 45 to 54 Years | 9 (34.6%) | 12 (46.2%) |
| 55 to 64 Years | 1 (3.5%) | 25 (86.2%) |
| 65 to 74 Years | 10 (100.0%) | 6 (60.0%) |
| 75 Years and over | 4 (100.0%) | 4 (100.0%) |
| Total | 37 (31.1%) | 58 (48.7%) |
Disability Status by Sex by Age in Perley
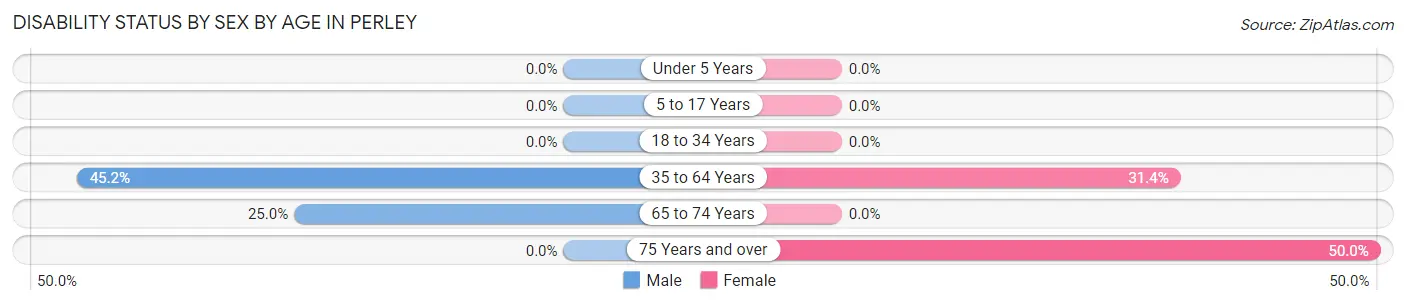
| Age Bracket | Male | Female |
| Under 5 Years | 0 (0.0%) | 0 (0.0%) |
| 5 to 17 Years | 0 (0.0%) | 0 (0.0%) |
| 18 to 34 Years | 0 (0.0%) | 0 (0.0%) |
| 35 to 64 Years | 14 (45.2%) | 11 (31.4%) |
| 65 to 74 Years | 2 (25.0%) | 0 (0.0%) |
| 75 Years and over | 0 (0.0%) | 1 (50.0%) |
Disability Class by Sex by Age in Perley
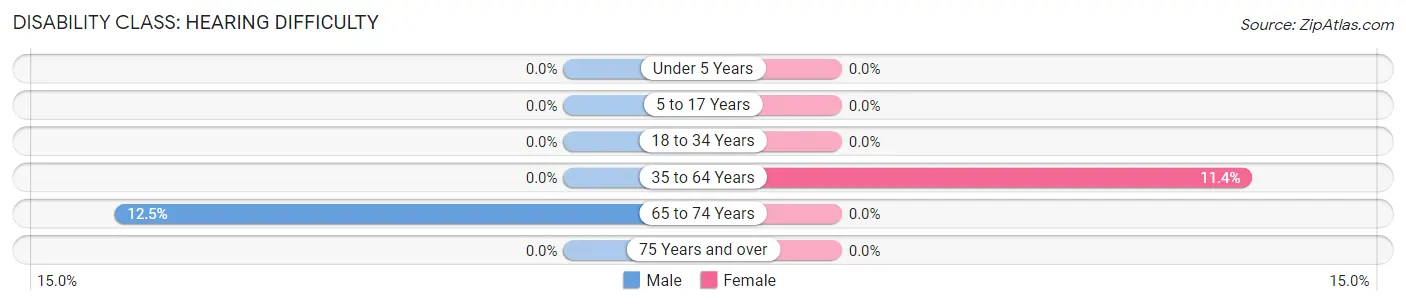
Disability Class: Hearing Difficulty
| Age Bracket | Male | Female |
| Under 5 Years | 0 (0.0%) | 0 (0.0%) |
| 5 to 17 Years | 0 (0.0%) | 0 (0.0%) |
| 18 to 34 Years | 0 (0.0%) | 0 (0.0%) |
| 35 to 64 Years | 0 (0.0%) | 4 (11.4%) |
| 65 to 74 Years | 1 (12.5%) | 0 (0.0%) |
| 75 Years and over | 0 (0.0%) | 0 (0.0%) |
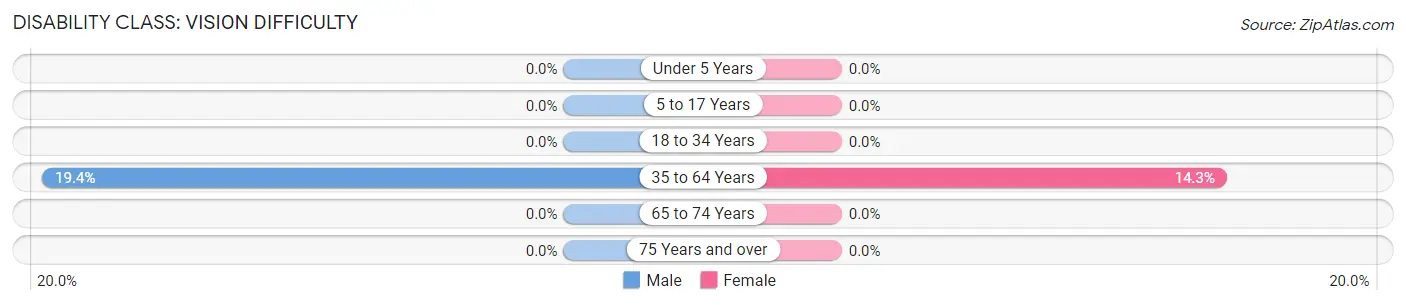
Disability Class: Vision Difficulty
| Age Bracket | Male | Female |
| Under 5 Years | 0 (0.0%) | 0 (0.0%) |
| 5 to 17 Years | 0 (0.0%) | 0 (0.0%) |
| 18 to 34 Years | 0 (0.0%) | 0 (0.0%) |
| 35 to 64 Years | 6 (19.4%) | 5 (14.3%) |
| 65 to 74 Years | 0 (0.0%) | 0 (0.0%) |
| 75 Years and over | 0 (0.0%) | 0 (0.0%) |
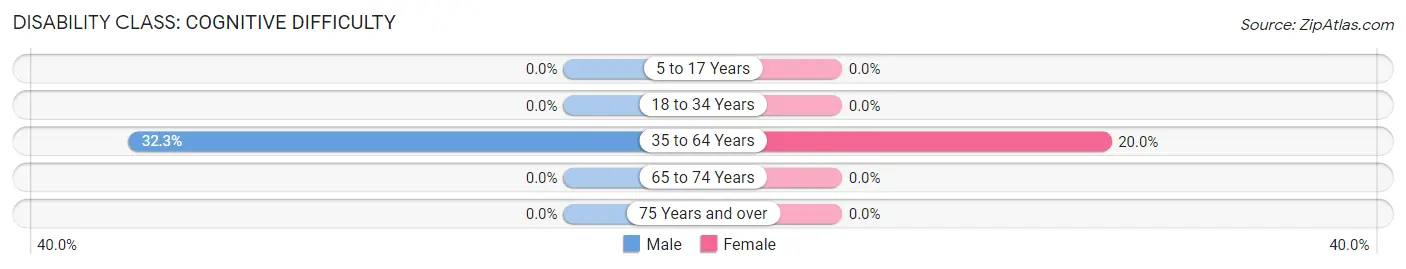
Disability Class: Cognitive Difficulty
| Age Bracket | Male | Female |
| 5 to 17 Years | 0 (0.0%) | 0 (0.0%) |
| 18 to 34 Years | 0 (0.0%) | 0 (0.0%) |
| 35 to 64 Years | 10 (32.3%) | 7 (20.0%) |
| 65 to 74 Years | 0 (0.0%) | 0 (0.0%) |
| 75 Years and over | 0 (0.0%) | 0 (0.0%) |
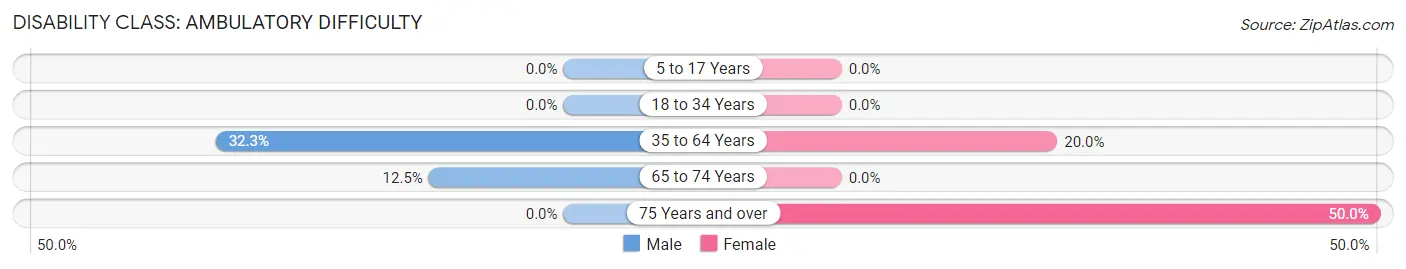
Disability Class: Ambulatory Difficulty
| Age Bracket | Male | Female |
| 5 to 17 Years | 0 (0.0%) | 0 (0.0%) |
| 18 to 34 Years | 0 (0.0%) | 0 (0.0%) |
| 35 to 64 Years | 10 (32.3%) | 7 (20.0%) |
| 65 to 74 Years | 1 (12.5%) | 0 (0.0%) |
| 75 Years and over | 0 (0.0%) | 1 (50.0%) |
Disability Class: Self-Care Difficulty
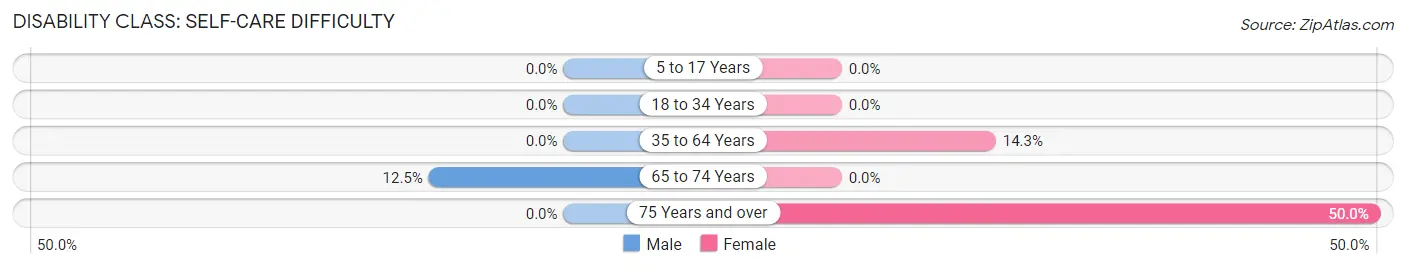
| Age Bracket | Male | Female |
| 5 to 17 Years | 0 (0.0%) | 0 (0.0%) |
| 18 to 34 Years | 0 (0.0%) | 0 (0.0%) |
| 35 to 64 Years | 0 (0.0%) | 5 (14.3%) |
| 65 to 74 Years | 1 (12.5%) | 0 (0.0%) |
| 75 Years and over | 0 (0.0%) | 1 (50.0%) |
Technology Access in Perley
Computing Device Access in Perley
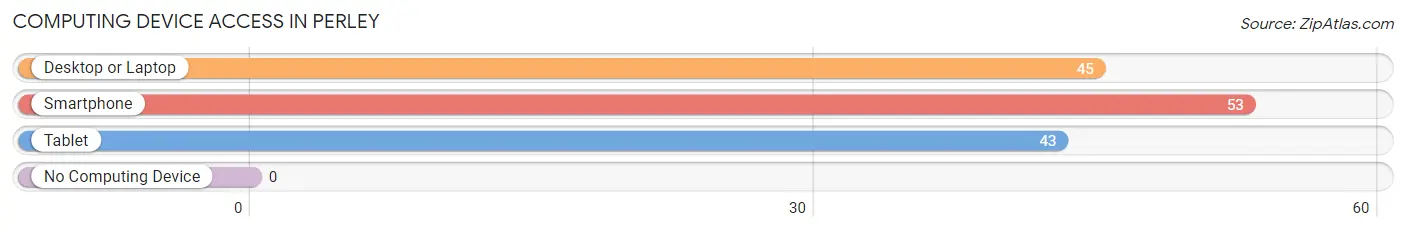
| Device Type | # Households | % Households |
| Desktop or Laptop | 45 | 83.3% |
| Smartphone | 53 | 98.2% |
| Tablet | 43 | 79.6% |
| No Computing Device | 0 | 0.0% |
| Total | 54 | 100.0% |
Internet Access in Perley
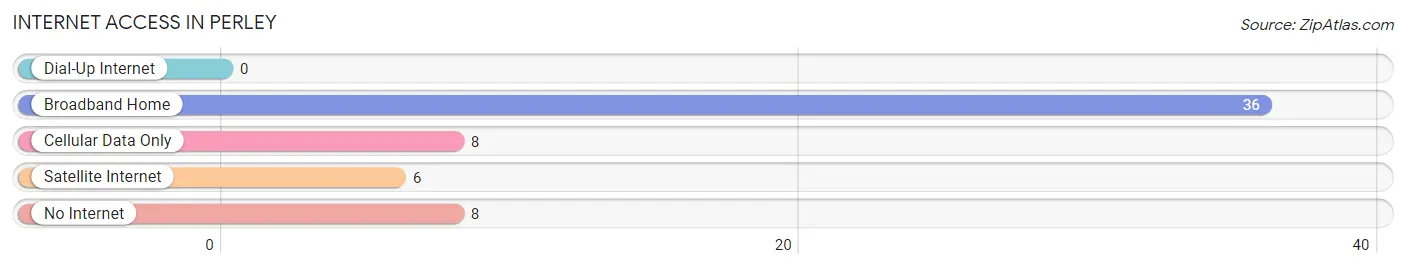
| Internet Type | # Households | % Households |
| Dial-Up Internet | 0 | 0.0% |
| Broadband Home | 36 | 66.7% |
| Cellular Data Only | 8 | 14.8% |
| Satellite Internet | 6 | 11.1% |
| No Internet | 8 | 14.8% |
| Total | 54 | 100.0% |
Perley Summary
Perley, Minnesota is a small city located in Clay County, Minnesota. It is situated on the banks of the Red River of the North, and is part of the Fargo-Moorhead metropolitan area. The city has a population of approximately 1,000 people, and is home to a variety of businesses, including a grocery store, a hardware store, and a few restaurants.
History
Perley was founded in 1881 by a group of settlers from Norway. The settlers named the town after their leader, Perley Johnson. The town was originally a farming community, and the settlers grew wheat, oats, and barley. In the early 1900s, the town began to grow and develop, and the first school was built in 1906.
In the 1920s, the town began to experience a population boom, and the population grew to over 1,000 people. During this time, the town was home to a variety of businesses, including a bank, a hotel, a movie theater, and a variety of stores.
In the 1950s, the town began to decline, and the population began to decrease. The decline was due to the fact that the town was no longer a farming community, and the businesses began to close. In the 1970s, the town began to experience a resurgence, and the population began to increase again.
Geography
Perley is located in Clay County, Minnesota, and is situated on the banks of the Red River of the North. The city is located approximately 25 miles north of Fargo, North Dakota, and approximately 40 miles south of Grand Forks, North Dakota. The city is located in a flat, open area, and is surrounded by farmland.
Economy
Perley’s economy is largely based on agriculture and tourism. The town is home to a variety of businesses, including a grocery store, a hardware store, and a few restaurants. The town also has a few small manufacturing businesses, and is home to a variety of farms.
The town is also home to a variety of tourist attractions, including the Perley Museum, which is dedicated to the history of the town, and the Perley Nature Center, which is a nature preserve. The town also hosts a variety of festivals and events throughout the year, including the Perley Days Festival, which is held in June.
Demographics
As of the 2010 census, the population of Perley was 1,000 people. The racial makeup of the town was 97.2% White, 0.7% African American, 0.3% Native American, 0.3% Asian, 0.1% Pacific Islander, and 1.4% from two or more races. The median household income was $41,250, and the median family income was $50,000.
Conclusion
Perley, Minnesota is a small city located in Clay County, Minnesota. It is situated on the banks of the Red River of the North, and is part of the Fargo-Moorhead metropolitan area. The city has a population of approximately 1,000 people, and is home to a variety of businesses, including a grocery store, a hardware store, and a few restaurants. The town’s economy is largely based on agriculture and tourism, and the town is home to a variety of tourist attractions, including the Perley Museum and the Perley Nature Center. The town also hosts a variety of festivals and events throughout the year. As of the 2010 census, the population of Perley was 1,000 people, and the racial makeup of the town was 97.2% White, 0.7% African American, 0.3% Native American, 0.3% Asian, 0.1% Pacific Islander, and 1.4% from two or more races.
Common Questions
What is the Total Population of Perley?
Total Population of Perley is 119.
What is the Total Male Population of Perley?
Total Male Population of Perley is 45.
What is the Total Female Population of Perley?
Total Female Population of Perley is 74.
What is the Ratio of Males per 100 Females in Perley?
There are 60.81 Males per 100 Females in Perley.
What is the Ratio of Females per 100 Males in Perley?
There are 164.44 Females per 100 Males in Perley.
What is the Median Population Age in Perley?
Median Population Age in Perley is 51.1 Years.
What is the Average Family Size in Perley
Average Family Size in Perley is 3.0 People.
What is the Average Household Size in Perley
Average Household Size in Perley is 2.2 People.
What is Per Capita Income in Perley?
Per Capita income in Perley is $33,680.
What is the Median Family Income in Perley?
Median Family Income in Perley is $94,167.
What is the Median Household income in Perley?
Median Household Income in Perley is $69,000.
What is Inequality or Gini Index in Perley?
Inequality or Gini Index in Perley is 0.37.
How Large is the Labor Force in Perley?
There are 76 People in the Labor Forcein in Perley.
What is the Percentage of People in the Labor Force in Perley?
72.4% of People are in the Labor Force in Perley.
What is the Unemployment Rate in Perley?
Unemployment Rate in Perley is 25.0%.