Pine Point, MN
Pine Point Map
Pine Point Overview
285
TOTAL POPULATION
119
MALE POPULATION
166
FEMALE POPULATION
71.69
MALES / 100 FEMALES
139.50
FEMALES / 100 MALES
38.1
MEDIAN AGE
3.3
AVG FAMILY SIZE
2.9
AVG HOUSEHOLD SIZE
$14,784
PER CAPITA INCOME
$41,364
AVG FAMILY INCOME
$40,455
AVG HOUSEHOLD INCOME
0.41
INEQUALITY / GINI INDEX
75
LABOR FORCE [ PEOPLE ]
41.2%
PERCENT IN LABOR FORCE
22.7%
UNEMPLOYMENT RATE
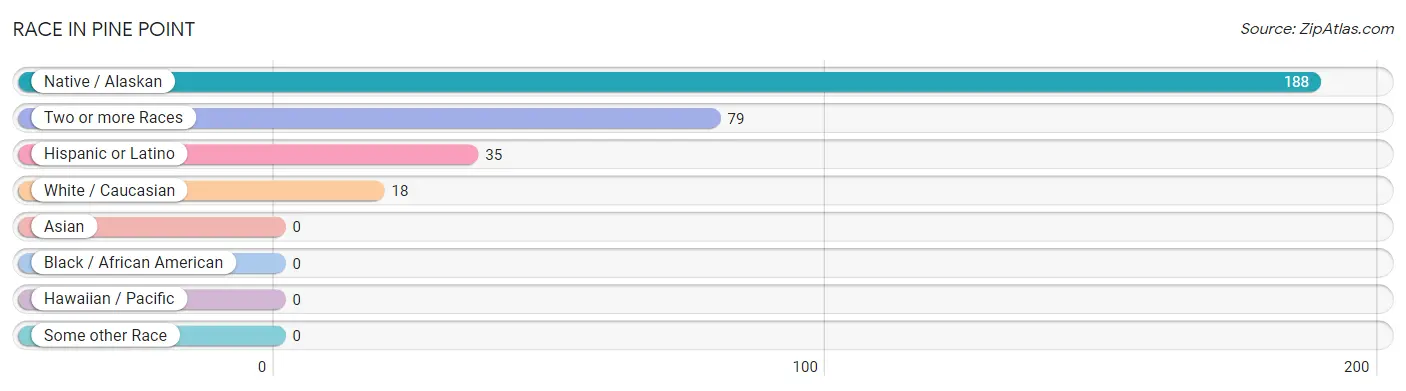
Race in Pine Point
The most populous races in Pine Point are Native / Alaskan (188 | 66.0%), Two or more Races (79 | 27.7%), and Hispanic or Latino (35 | 12.3%).
| Race | # Population | % Population |
| Asian | 0 | 0.0% |
| Black / African American | 0 | 0.0% |
| Hawaiian / Pacific | 0 | 0.0% |
| Hispanic or Latino | 35 | 12.3% |
| Native / Alaskan | 188 | 66.0% |
| White / Caucasian | 18 | 6.3% |
| Two or more Races | 79 | 27.7% |
| Some other Race | 0 | 0.0% |
| Total | 285 | 100.0% |
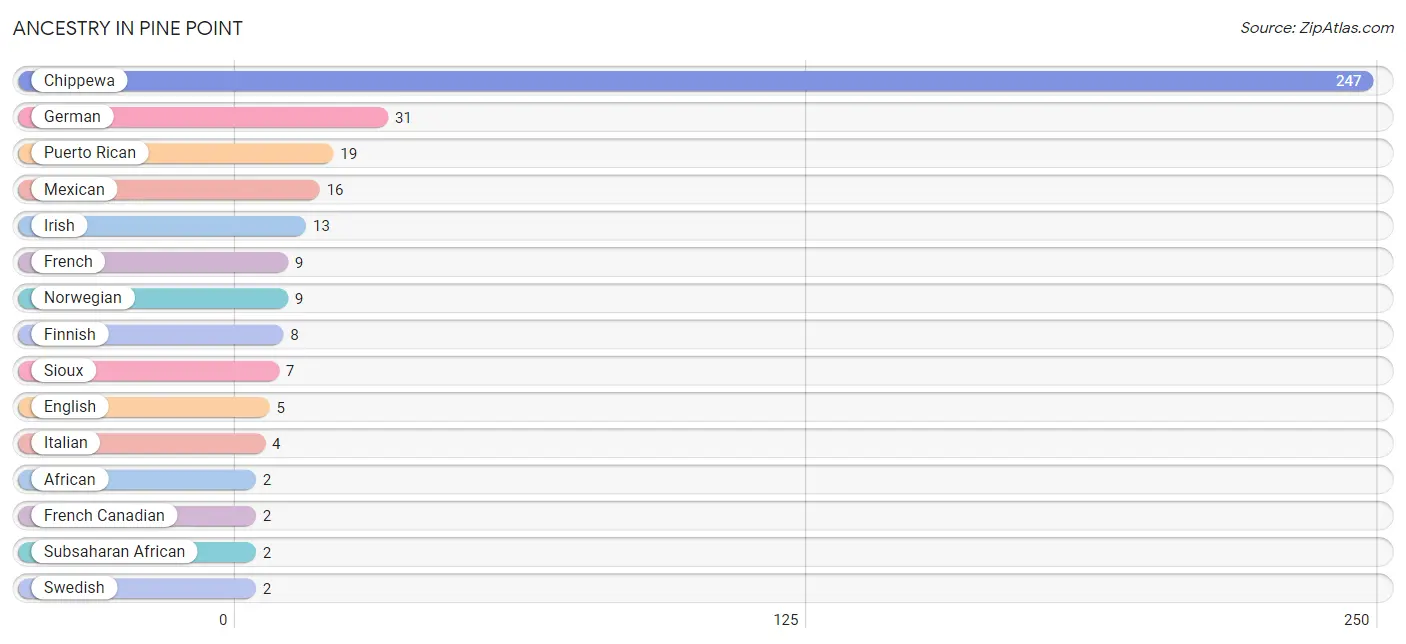
Ancestry in Pine Point
The most populous ancestries reported in Pine Point are Chippewa (247 | 86.7%), German (31 | 10.9%), Puerto Rican (19 | 6.7%), Mexican (16 | 5.6%), and Irish (13 | 4.6%), together accounting for 114.4% of all Pine Point residents.
| Ancestry | # Population | % Population |
| African | 2 | 0.7% |
| American | 1 | 0.4% |
| Chippewa | 247 | 86.7% |
| English | 5 | 1.8% |
| European | 1 | 0.4% |
| Finnish | 8 | 2.8% |
| French | 9 | 3.2% |
| French Canadian | 2 | 0.7% |
| German | 31 | 10.9% |
| Irish | 13 | 4.6% |
| Italian | 4 | 1.4% |
| Mexican | 16 | 5.6% |
| Norwegian | 9 | 3.2% |
| Puerto Rican | 19 | 6.7% |
| Scottish | 1 | 0.4% |
| Sioux | 7 | 2.5% |
| Subsaharan African | 2 | 0.7% |
| Swedish | 2 | 0.7% | View All 18 Rows |
Immigrants in Pine Point

| Immigration Origin | # Population | % Population | View All 0 Rows |
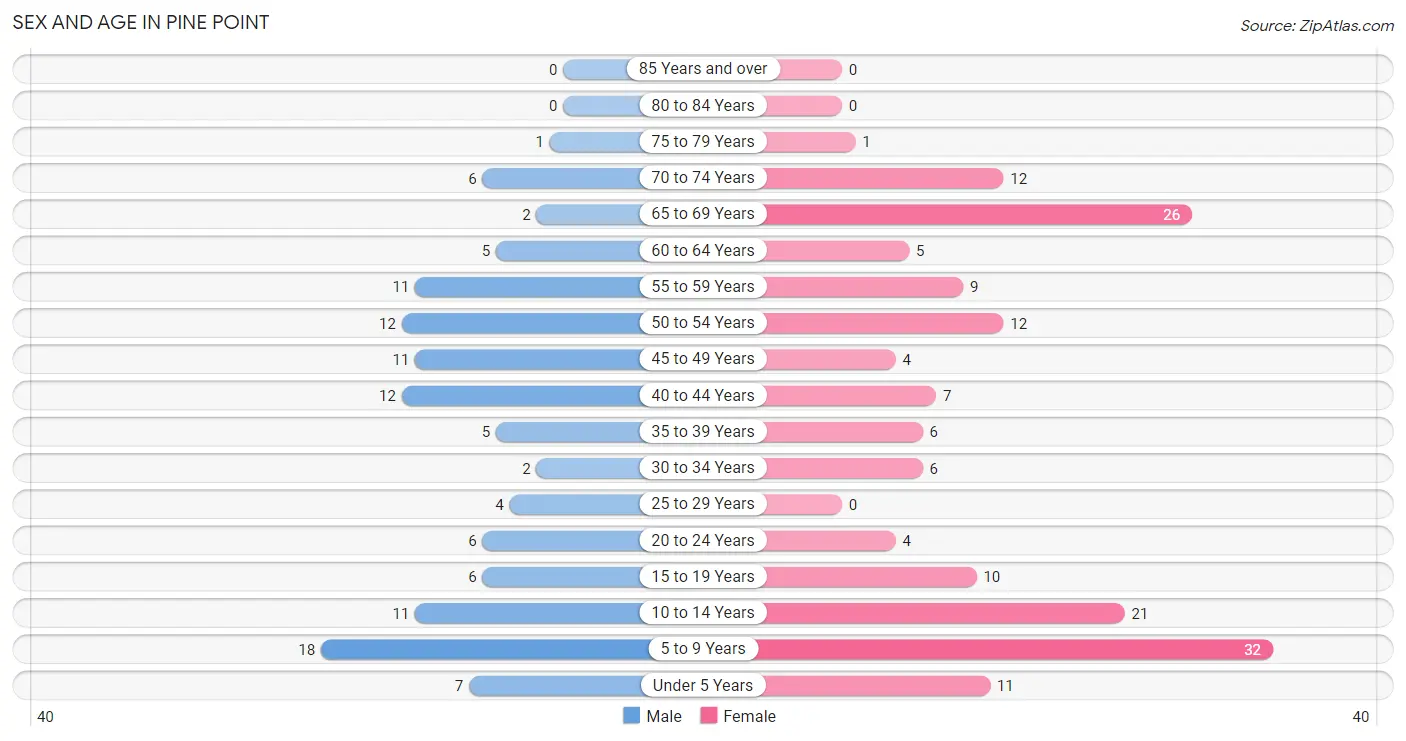
Sex and Age in Pine Point
Sex and Age in Pine Point
The most populous age groups in Pine Point are 5 to 9 Years (18 | 15.1%) for men and 5 to 9 Years (32 | 19.3%) for women.
| Age Bracket | Male | Female |
| Under 5 Years | 7 (5.9%) | 11 (6.6%) |
| 5 to 9 Years | 18 (15.1%) | 32 (19.3%) |
| 10 to 14 Years | 11 (9.2%) | 21 (12.7%) |
| 15 to 19 Years | 6 (5.0%) | 10 (6.0%) |
| 20 to 24 Years | 6 (5.0%) | 4 (2.4%) |
| 25 to 29 Years | 4 (3.4%) | 0 (0.0%) |
| 30 to 34 Years | 2 (1.7%) | 6 (3.6%) |
| 35 to 39 Years | 5 (4.2%) | 6 (3.6%) |
| 40 to 44 Years | 12 (10.1%) | 7 (4.2%) |
| 45 to 49 Years | 11 (9.2%) | 4 (2.4%) |
| 50 to 54 Years | 12 (10.1%) | 12 (7.2%) |
| 55 to 59 Years | 11 (9.2%) | 9 (5.4%) |
| 60 to 64 Years | 5 (4.2%) | 5 (3.0%) |
| 65 to 69 Years | 2 (1.7%) | 26 (15.7%) |
| 70 to 74 Years | 6 (5.0%) | 12 (7.2%) |
| 75 to 79 Years | 1 (0.8%) | 1 (0.6%) |
| 80 to 84 Years | 0 (0.0%) | 0 (0.0%) |
| 85 Years and over | 0 (0.0%) | 0 (0.0%) |
| Total | 119 (100.0%) | 166 (100.0%) |
Families and Households in Pine Point
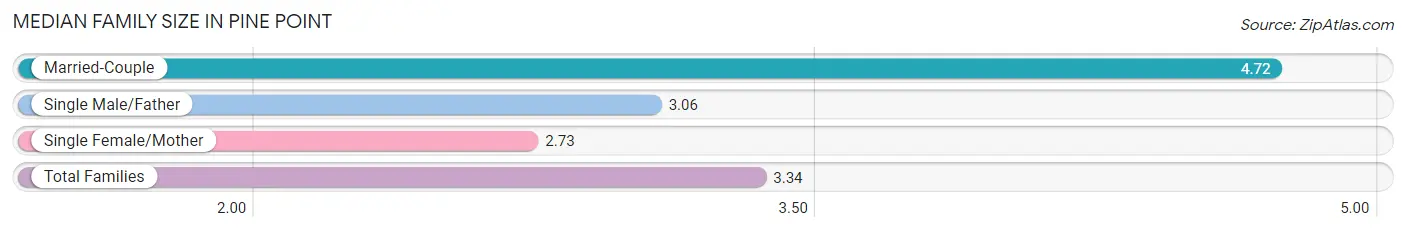
Median Family Size in Pine Point
The median family size in Pine Point is 3.34 persons per family, with married-couple families (18 | 26.5%) accounting for the largest median family size of 4.72 persons per family. On the other hand, single female/mother families (33 | 48.5%) represent the smallest median family size with 2.73 persons per family.
| Family Type | # Families | Family Size |
| Married-Couple | 18 (26.5%) | 4.72 |
| Single Male/Father | 17 (25.0%) | 3.06 |
| Single Female/Mother | 33 (48.5%) | 2.73 |
| Total Families | 68 (100.0%) | 3.34 |
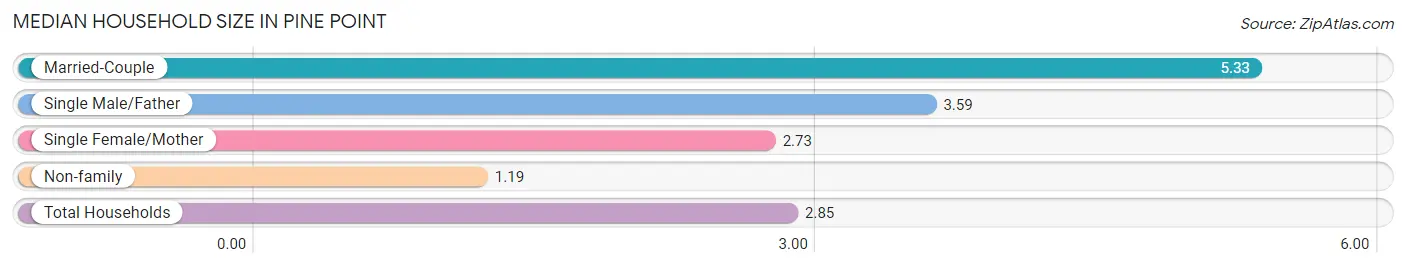
Median Household Size in Pine Point
The median household size in Pine Point is 2.85 persons per household, with married-couple households (18 | 18.0%) accounting for the largest median household size of 5.33 persons per household. non-family households (32 | 32.0%) represent the smallest median household size with 1.19 persons per household.
| Household Type | # Households | Household Size |
| Married-Couple | 18 (18.0%) | 5.33 |
| Single Male/Father | 17 (17.0%) | 3.59 |
| Single Female/Mother | 33 (33.0%) | 2.73 |
| Non-family | 32 (32.0%) | 1.19 |
| Total Households | 100 (100.0%) | 2.85 |
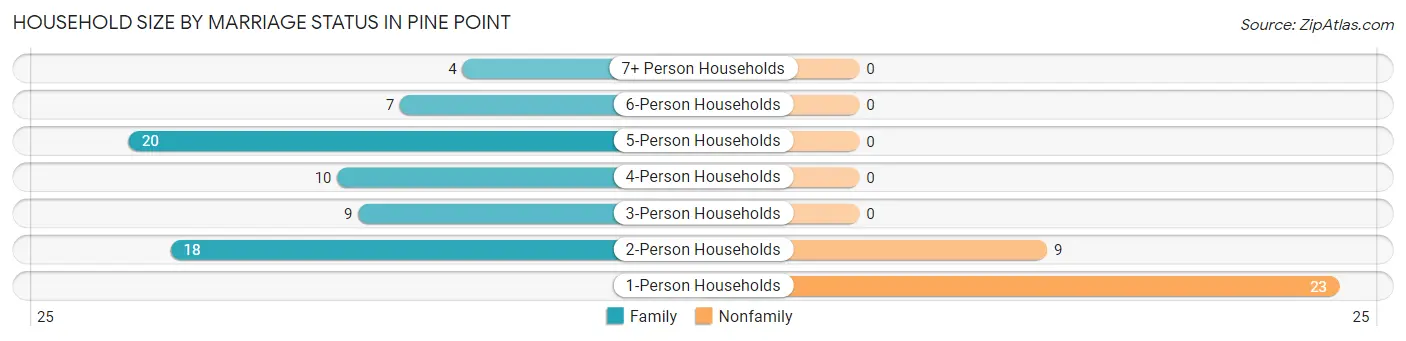
Household Size by Marriage Status in Pine Point
Out of a total of 100 households in Pine Point, 68 (68.0%) are family households, while 32 (32.0%) are nonfamily households. The most numerous type of family households are 5-person households, comprising 20, and the most common type of nonfamily households are 1-person households, comprising 23.
| Household Size | Family Households | Nonfamily Households |
| 1-Person Households | - | 23 (23.0%) |
| 2-Person Households | 18 (18.0%) | 9 (9.0%) |
| 3-Person Households | 9 (9.0%) | 0 (0.0%) |
| 4-Person Households | 10 (10.0%) | 0 (0.0%) |
| 5-Person Households | 20 (20.0%) | 0 (0.0%) |
| 6-Person Households | 7 (7.0%) | 0 (0.0%) |
| 7+ Person Households | 4 (4.0%) | 0 (0.0%) |
| Total | 68 (68.0%) | 32 (32.0%) |
Female Fertility in Pine Point
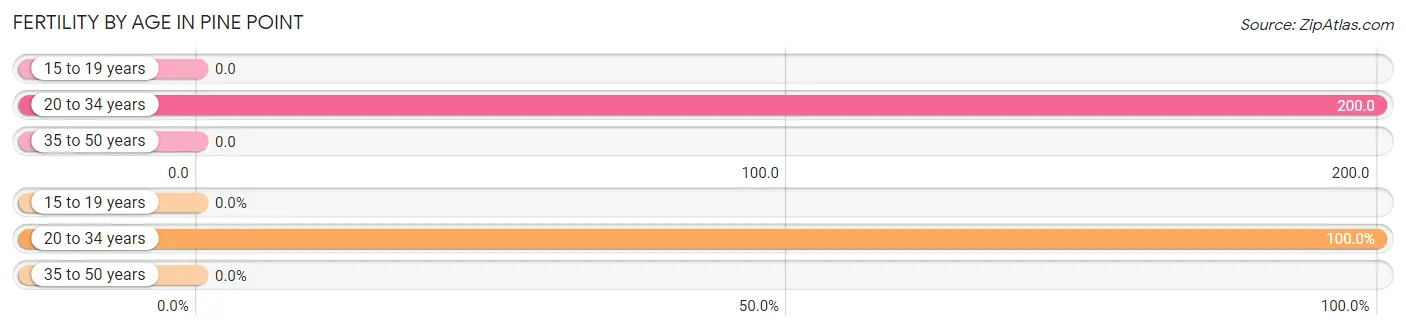
Fertility by Age in Pine Point
Average fertility rate in Pine Point is 54.0 births per 1,000 women. Women in the age bracket of 20 to 34 years have the highest fertility rate with 200.0 births per 1,000 women. Women in the age bracket of 20 to 34 years acount for 100.0% of all women with births.
| Age Bracket | Women with Births | Births / 1,000 Women |
| 15 to 19 years | 0 (0.0%) | 0.0 |
| 20 to 34 years | 2 (100.0%) | 200.0 |
| 35 to 50 years | 0 (0.0%) | 0.0 |
| Total | 2 (100.0%) | 54.0 |
Fertility by Age by Marriage Status in Pine Point
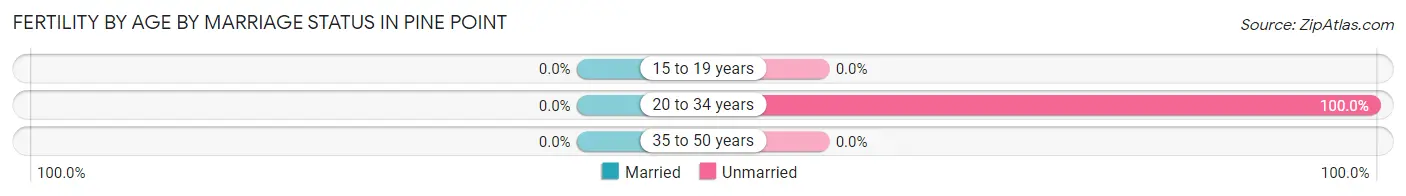
| Age Bracket | Married | Unmarried |
| 15 to 19 years | 0 (0.0%) | 0 (0.0%) |
| 20 to 34 years | 0 (0.0%) | 2 (100.0%) |
| 35 to 50 years | 0 (0.0%) | 0 (0.0%) |
| Total | 0 (0.0%) | 2 (100.0%) |
Fertility by Education in Pine Point
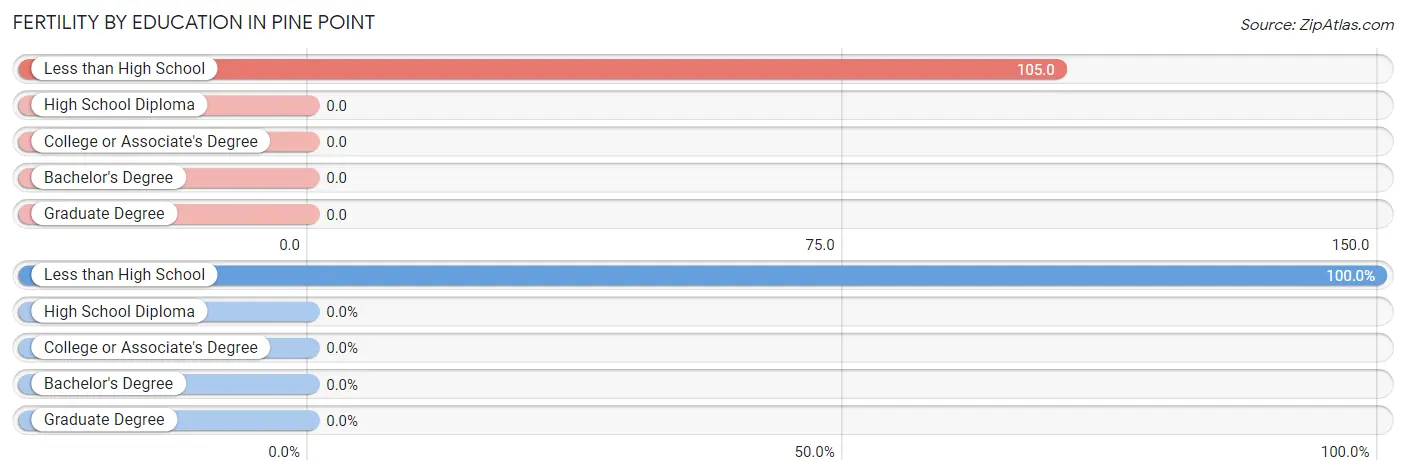
| Educational Attainment | Women with Births | Births / 1,000 Women |
| Less than High School | 2 (100.0%) | 105.0 |
| High School Diploma | 0 (0.0%) | 0.0 |
| College or Associate's Degree | 0 (0.0%) | 0.0 |
| Bachelor's Degree | 0 (0.0%) | 0.0 |
| Graduate Degree | 0 (0.0%) | 0.0 |
| Total | 2 (100.0%) | 54.0 |
Fertility by Education by Marriage Status in Pine Point
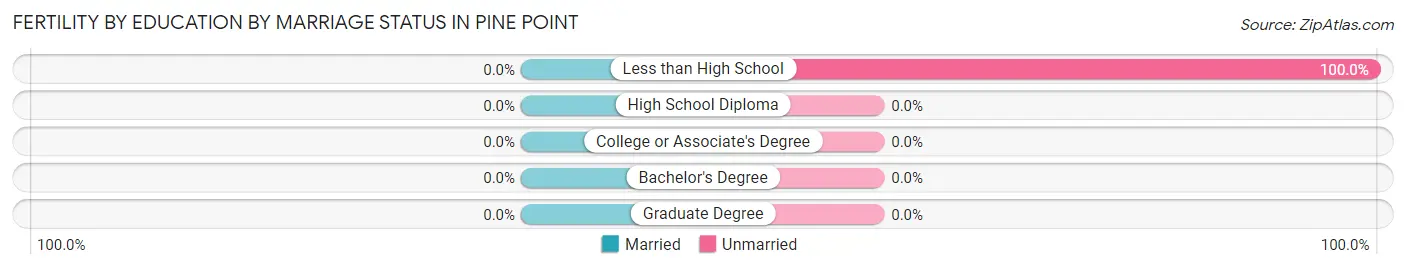
| Educational Attainment | Married | Unmarried |
| Less than High School | 0 (0.0%) | 2 (100.0%) |
| High School Diploma | 0 (0.0%) | 0 (0.0%) |
| College or Associate's Degree | 0 (0.0%) | 0 (0.0%) |
| Bachelor's Degree | 0 (0.0%) | 0 (0.0%) |
| Graduate Degree | 0 (0.0%) | 0 (0.0%) |
| Total | 0 (0.0%) | 2 (100.0%) |
Income in Pine Point
Income Overview in Pine Point
Per Capita Income in Pine Point is $14,784, while median incomes of families and households are $41,364 and $40,455 respectively.
| Characteristic | Number | Measure |
| Per Capita Income | 285 | $14,784 |
| Median Family Income | 68 | $41,364 |
| Mean Family Income | 68 | $48,847 |
| Median Household Income | 100 | $40,455 |
| Mean Household Income | 100 | $43,137 |
| Income Deficit | 68 | $0 |
| Wage / Income Gap (%) | 285 | 0.00% |
| Wage / Income Gap ($) | 285 | 100.00¢ per $1 |
| Gini / Inequality Index | 285 | 0.41 |
Earnings by Sex in Pine Point
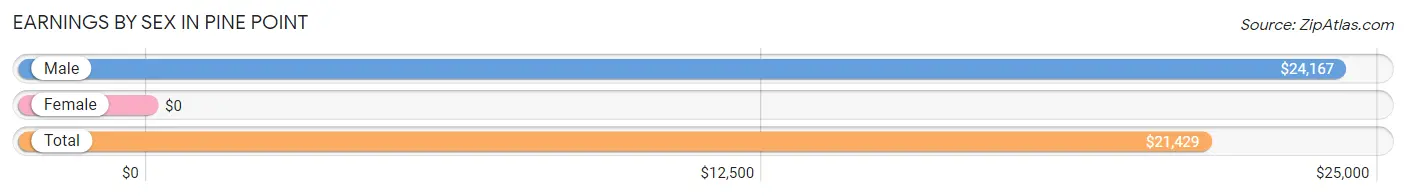
| Sex | Number | Average Earnings |
| Male | 38 (47.5%) | $24,167 |
| Female | 42 (52.5%) | $0 |
| Total | 80 (100.0%) | $21,429 |
Earnings by Sex by Income Bracket in Pine Point
The most common earnings brackets in Pine Point are $50,000 to $54,999 for men (9 | 23.7%) and $2,499 or less for women (16 | 38.1%).
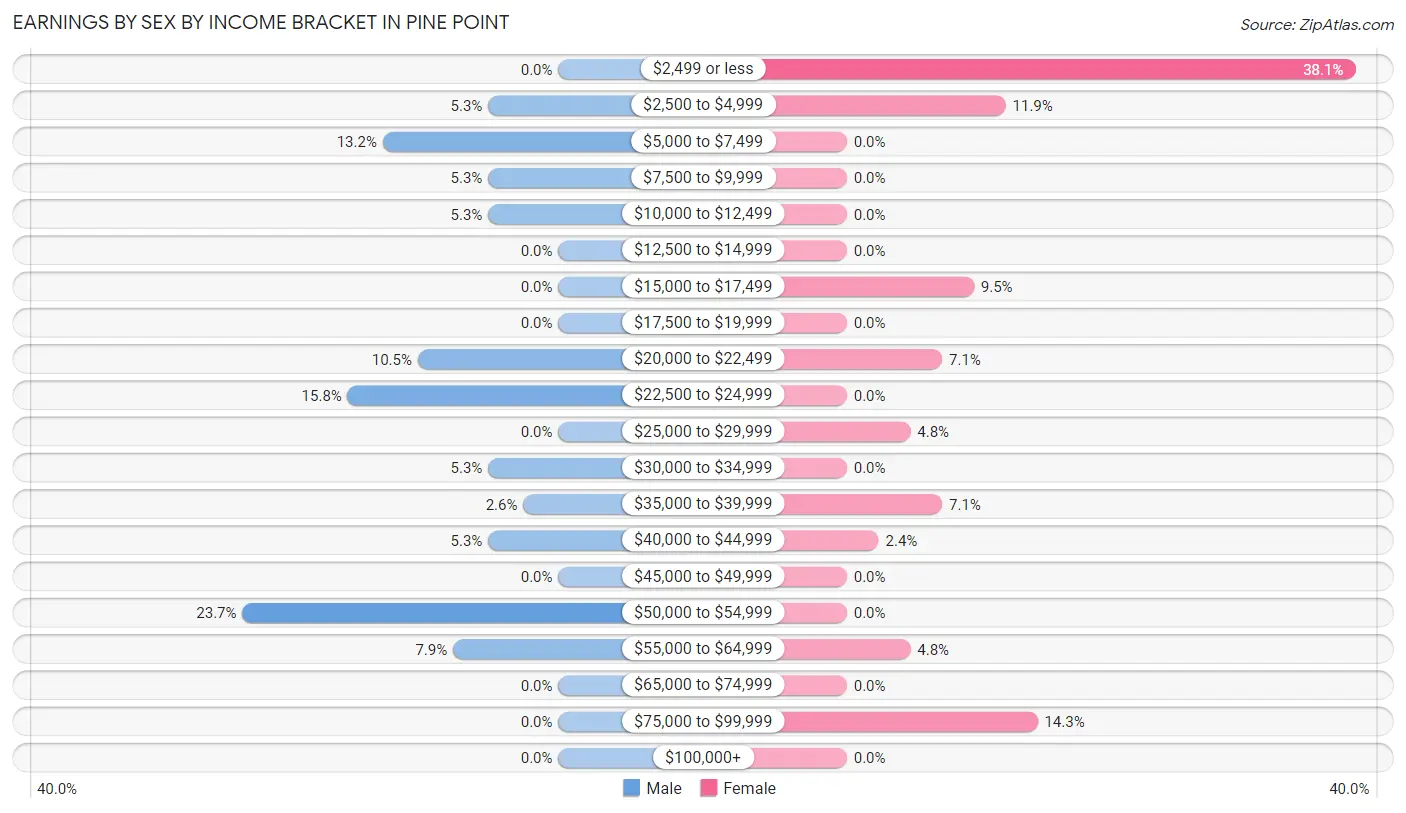
| Income | Male | Female |
| $2,499 or less | 0 (0.0%) | 16 (38.1%) |
| $2,500 to $4,999 | 2 (5.3%) | 5 (11.9%) |
| $5,000 to $7,499 | 5 (13.2%) | 0 (0.0%) |
| $7,500 to $9,999 | 2 (5.3%) | 0 (0.0%) |
| $10,000 to $12,499 | 2 (5.3%) | 0 (0.0%) |
| $12,500 to $14,999 | 0 (0.0%) | 0 (0.0%) |
| $15,000 to $17,499 | 0 (0.0%) | 4 (9.5%) |
| $17,500 to $19,999 | 0 (0.0%) | 0 (0.0%) |
| $20,000 to $22,499 | 4 (10.5%) | 3 (7.1%) |
| $22,500 to $24,999 | 6 (15.8%) | 0 (0.0%) |
| $25,000 to $29,999 | 0 (0.0%) | 2 (4.8%) |
| $30,000 to $34,999 | 2 (5.3%) | 0 (0.0%) |
| $35,000 to $39,999 | 1 (2.6%) | 3 (7.1%) |
| $40,000 to $44,999 | 2 (5.3%) | 1 (2.4%) |
| $45,000 to $49,999 | 0 (0.0%) | 0 (0.0%) |
| $50,000 to $54,999 | 9 (23.7%) | 0 (0.0%) |
| $55,000 to $64,999 | 3 (7.9%) | 2 (4.8%) |
| $65,000 to $74,999 | 0 (0.0%) | 0 (0.0%) |
| $75,000 to $99,999 | 0 (0.0%) | 6 (14.3%) |
| $100,000+ | 0 (0.0%) | 0 (0.0%) |
| Total | 38 (100.0%) | 42 (100.0%) |
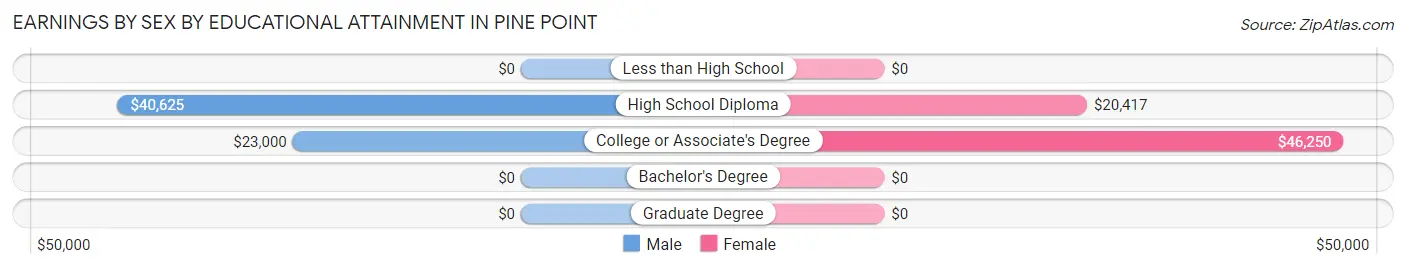
Earnings by Sex by Educational Attainment in Pine Point
Average earnings in Pine Point are $24,167 for men and $17,188 for women, a difference of 28.9%. Men with an educational attainment of high school diploma enjoy the highest average annual earnings of $40,625, while those with college or associate's degree education earn the least with $23,000. Women with an educational attainment of college or associate's degree earn the most with the average annual earnings of $46,250, while those with high school diploma education have the smallest earnings of $20,417.
| Educational Attainment | Male Income | Female Income |
| Less than High School | - | - |
| High School Diploma | $40,625 | $20,417 |
| College or Associate's Degree | $23,000 | $46,250 |
| Bachelor's Degree | - | - |
| Graduate Degree | - | - |
| Total | $24,167 | $17,188 |
Family Income in Pine Point
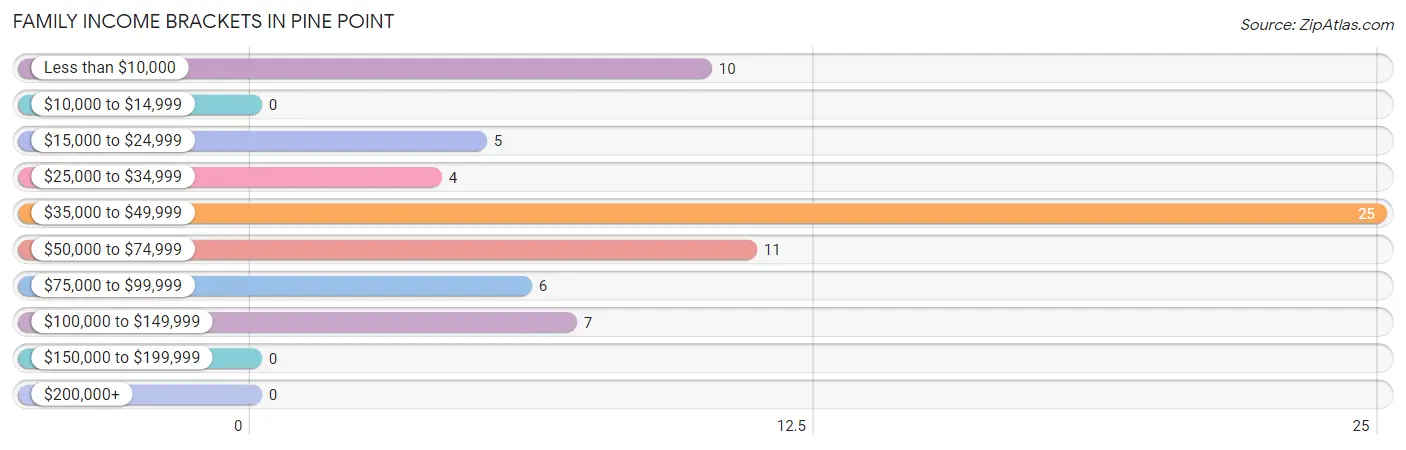
Family Income Brackets in Pine Point
According to the Pine Point family income data, there are 25 families falling into the $35,000 to $49,999 income range, which is the most common income bracket and makes up 36.8% of all families.
| Income Bracket | # Families | % Families |
| Less than $10,000 | 10 | 14.7% |
| $10,000 to $14,999 | 0 | 0.0% |
| $15,000 to $24,999 | 5 | 7.4% |
| $25,000 to $34,999 | 4 | 5.9% |
| $35,000 to $49,999 | 25 | 36.8% |
| $50,000 to $74,999 | 11 | 16.2% |
| $75,000 to $99,999 | 6 | 8.8% |
| $100,000 to $149,999 | 7 | 10.3% |
| $150,000 to $199,999 | 0 | 0.0% |
| $200,000+ | 0 | 0.0% |
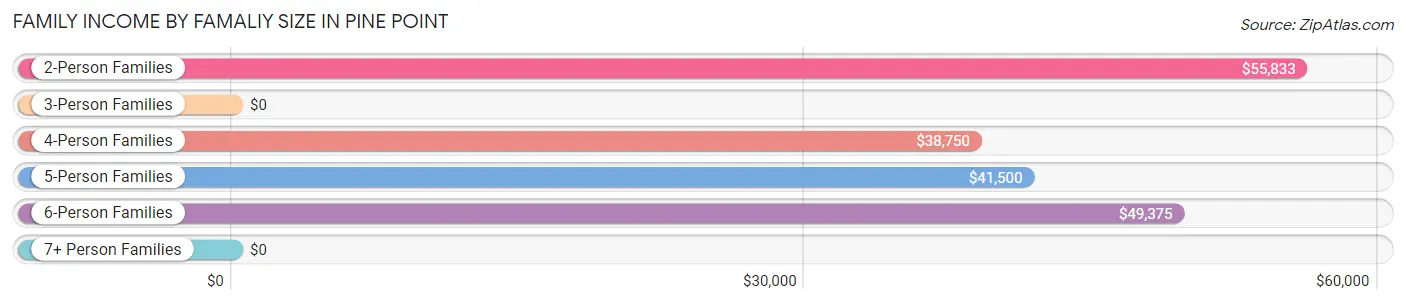
Family Income by Famaliy Size in Pine Point
2-person families (26 | 38.2%) account for the highest median family income in Pine Point with $55,833 per family, while 2-person families (26 | 38.2%) have the highest median income of $27,916 per family member.
| Income Bracket | # Families | Median Income |
| 2-Person Families | 26 (38.2%) | $55,833 |
| 3-Person Families | 5 (7.3%) | $0 |
| 4-Person Families | 10 (14.7%) | $38,750 |
| 5-Person Families | 18 (26.5%) | $41,500 |
| 6-Person Families | 7 (10.3%) | $49,375 |
| 7+ Person Families | 2 (2.9%) | $0 |
| Total | 68 (100.0%) | $41,364 |
Family Income by Number of Earners in Pine Point
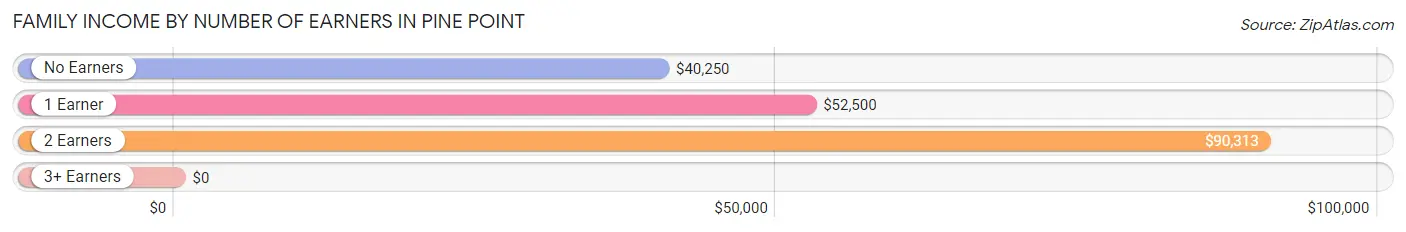
| Number of Earners | # Families | Median Income |
| No Earners | 30 (44.1%) | $40,250 |
| 1 Earner | 28 (41.2%) | $52,500 |
| 2 Earners | 9 (13.2%) | $90,313 |
| 3+ Earners | 1 (1.5%) | $0 |
| Total | 68 (100.0%) | $41,364 |
Household Income in Pine Point
Household Income Brackets in Pine Point
With 24 households falling in the category, the $35,000 to $49,999 income range is the most frequent in Pine Point, accounting for 24.0% of all households.
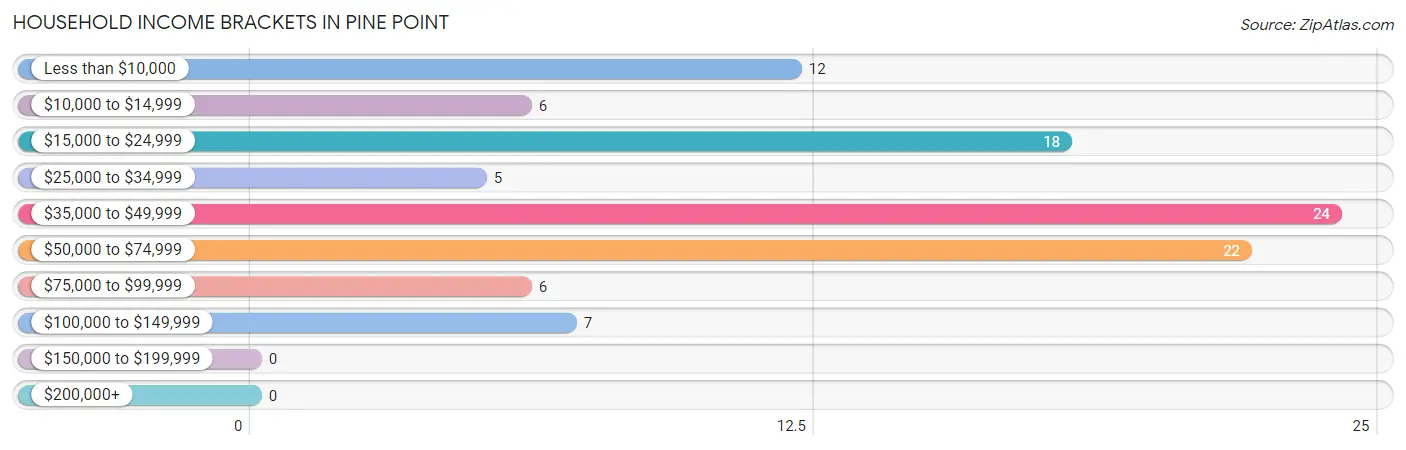
| Income Bracket | # Households | % Households |
| Less than $10,000 | 12 | 12.0% |
| $10,000 to $14,999 | 6 | 6.0% |
| $15,000 to $24,999 | 18 | 18.0% |
| $25,000 to $34,999 | 5 | 5.0% |
| $35,000 to $49,999 | 24 | 24.0% |
| $50,000 to $74,999 | 22 | 22.0% |
| $75,000 to $99,999 | 6 | 6.0% |
| $100,000 to $149,999 | 7 | 7.0% |
| $150,000 to $199,999 | 0 | 0.0% |
| $200,000+ | 0 | 0.0% |
Household Income by Householder Age in Pine Point
The median household income in Pine Point is $40,455, with the highest median household income of $42,500 found in the 65+ years age bracket for the primary householder. A total of 38 households (38.0%) fall into this category. Meanwhile, the 15 to 24 years age bracket for the primary householder has the lowest median household income of $0, with 4 households (4.0%) in this group.
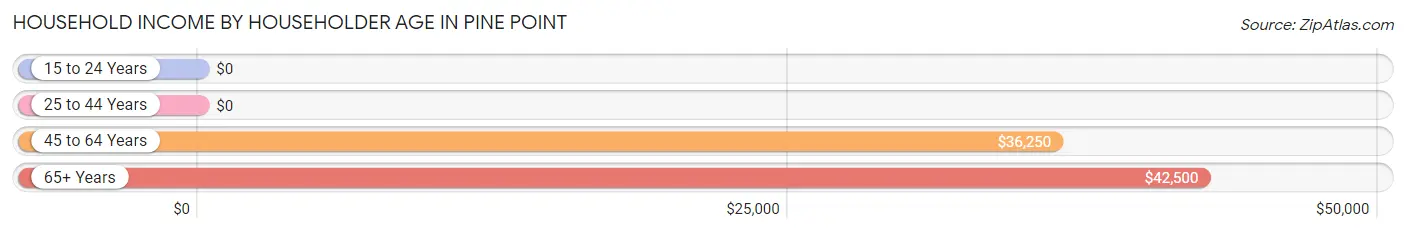
| Income Bracket | # Households | Median Income |
| 15 to 24 Years | 4 (4.0%) | $0 |
| 25 to 44 Years | 13 (13.0%) | $0 |
| 45 to 64 Years | 45 (45.0%) | $36,250 |
| 65+ Years | 38 (38.0%) | $42,500 |
| Total | 100 (100.0%) | $40,455 |
Poverty in Pine Point
Income Below Poverty by Sex and Age in Pine Point
With 36.4% poverty level for males and 34.8% for females among the residents of Pine Point, 16 and 17 year old males and 25 to 34 year old females are the most vulnerable to poverty, with 2 males (100.0%) and 5 females (83.3%) in their respective age groups living below the poverty level.
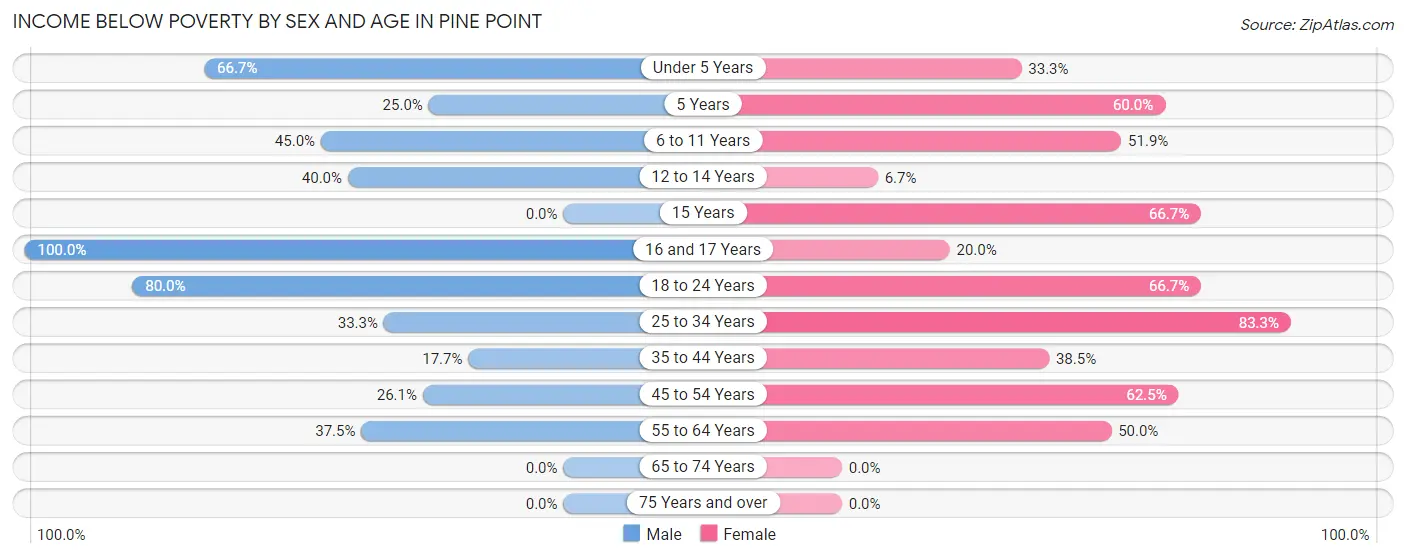
| Age Bracket | Male | Female |
| Under 5 Years | 4 (66.7%) | 2 (33.3%) |
| 5 Years | 1 (25.0%) | 3 (60.0%) |
| 6 to 11 Years | 9 (45.0%) | 14 (51.8%) |
| 12 to 14 Years | 2 (40.0%) | 1 (6.7%) |
| 15 Years | 0 (0.0%) | 2 (66.7%) |
| 16 and 17 Years | 2 (100.0%) | 1 (20.0%) |
| 18 to 24 Years | 8 (80.0%) | 4 (66.7%) |
| 25 to 34 Years | 2 (33.3%) | 5 (83.3%) |
| 35 to 44 Years | 3 (17.6%) | 5 (38.5%) |
| 45 to 54 Years | 6 (26.1%) | 10 (62.5%) |
| 55 to 64 Years | 6 (37.5%) | 7 (50.0%) |
| 65 to 74 Years | 0 (0.0%) | 0 (0.0%) |
| 75 Years and over | 0 (0.0%) | 0 (0.0%) |
| Total | 43 (36.4%) | 54 (34.8%) |
Income Above Poverty by Sex and Age in Pine Point
According to the poverty statistics in Pine Point, males aged 65 to 74 years and females aged 65 to 74 years are the age groups that are most secure financially, with 100.0% of males and 100.0% of females in these age groups living above the poverty line.
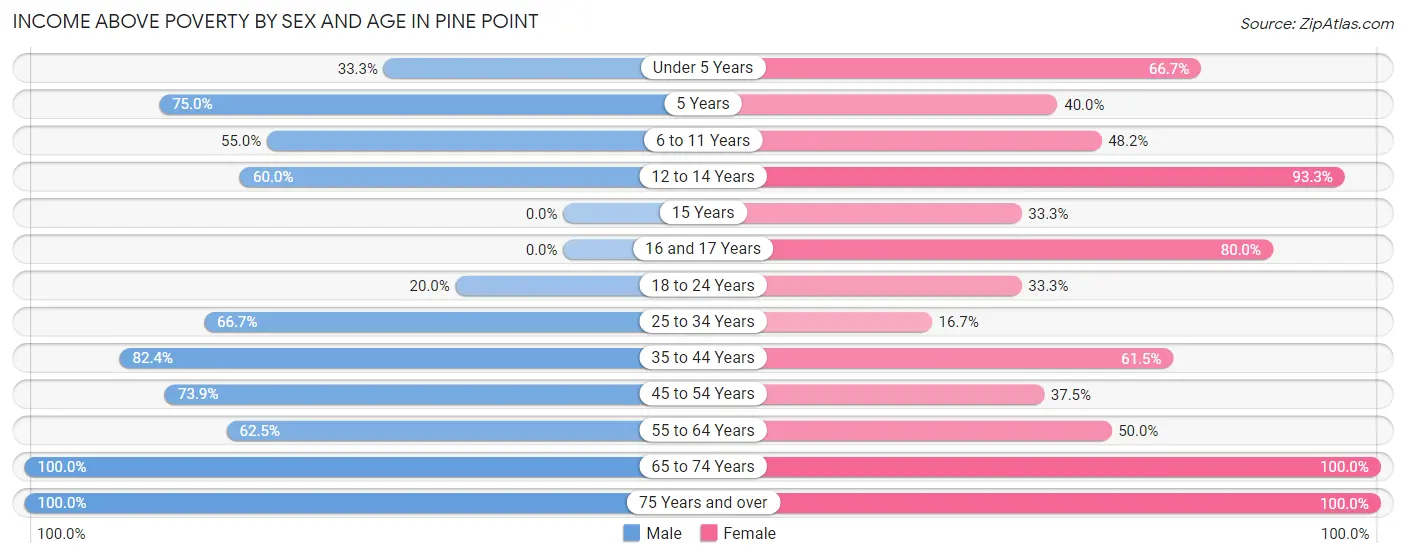
| Age Bracket | Male | Female |
| Under 5 Years | 2 (33.3%) | 4 (66.7%) |
| 5 Years | 3 (75.0%) | 2 (40.0%) |
| 6 to 11 Years | 11 (55.0%) | 13 (48.1%) |
| 12 to 14 Years | 3 (60.0%) | 14 (93.3%) |
| 15 Years | 0 (0.0%) | 1 (33.3%) |
| 16 and 17 Years | 0 (0.0%) | 4 (80.0%) |
| 18 to 24 Years | 2 (20.0%) | 2 (33.3%) |
| 25 to 34 Years | 4 (66.7%) | 1 (16.7%) |
| 35 to 44 Years | 14 (82.4%) | 8 (61.5%) |
| 45 to 54 Years | 17 (73.9%) | 6 (37.5%) |
| 55 to 64 Years | 10 (62.5%) | 7 (50.0%) |
| 65 to 74 Years | 8 (100.0%) | 38 (100.0%) |
| 75 Years and over | 1 (100.0%) | 1 (100.0%) |
| Total | 75 (63.6%) | 101 (65.2%) |
Income Below Poverty Among Married-Couple Families in Pine Point
The poverty statistics for married-couple families in Pine Point show that 5.6% or 1 of the total 18 families live below the poverty line. Families with 1 or 2 children have the highest poverty rate of 33.3%, comprising of 1 families. On the other hand, families with no children have the lowest poverty rate of 0.0%, which includes 0 families.
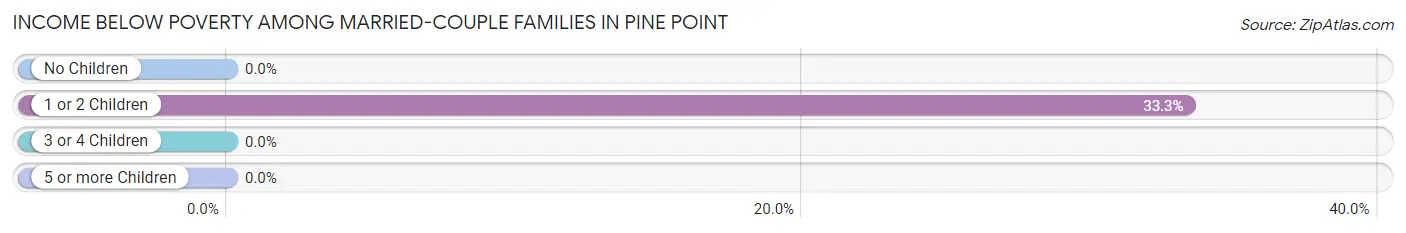
| Children | Above Poverty | Below Poverty |
| No Children | 9 (100.0%) | 0 (0.0%) |
| 1 or 2 Children | 2 (66.7%) | 1 (33.3%) |
| 3 or 4 Children | 6 (100.0%) | 0 (0.0%) |
| 5 or more Children | 0 (0.0%) | 0 (0.0%) |
| Total | 17 (94.4%) | 1 (5.6%) |
Income Below Poverty Among Single-Parent Households in Pine Point
According to the poverty data in Pine Point, 58.8% or 10 single-father households and 24.2% or 8 single-mother households are living below the poverty line. Among single-father households, those with 5 or more children have the highest poverty rate, with 4 households (100.0%) experiencing poverty. Likewise, among single-mother households, those with 1 or 2 children have the highest poverty rate, with 6 households (35.3%) falling below the poverty line.
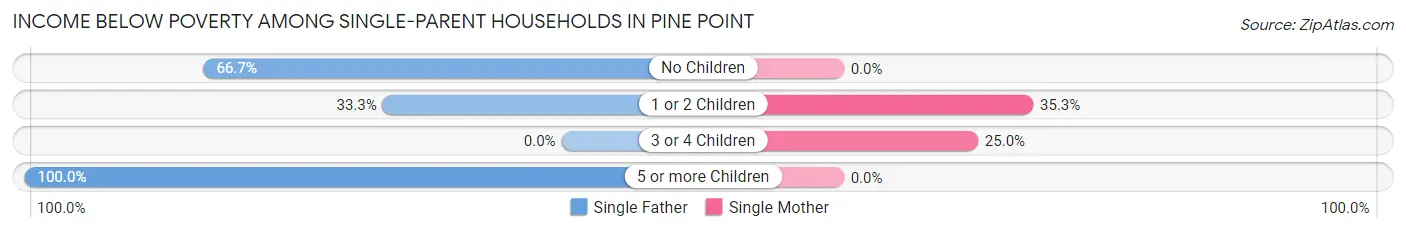
| Children | Single Father | Single Mother |
| No Children | 4 (66.7%) | 0 (0.0%) |
| 1 or 2 Children | 2 (33.3%) | 6 (35.3%) |
| 3 or 4 Children | 0 (0.0%) | 2 (25.0%) |
| 5 or more Children | 4 (100.0%) | 0 (0.0%) |
| Total | 10 (58.8%) | 8 (24.2%) |
Income Below Poverty Among Married-Couple vs Single-Parent Households in Pine Point
The poverty data for Pine Point shows that 1 of the married-couple family households (5.6%) and 18 of the single-parent households (36.0%) are living below the poverty level. Within the married-couple family households, those with 1 or 2 children have the highest poverty rate, with 1 households (33.3%) falling below the poverty line. Among the single-parent households, those with 5 or more children have the highest poverty rate, with 4 household (100.0%) living below poverty.
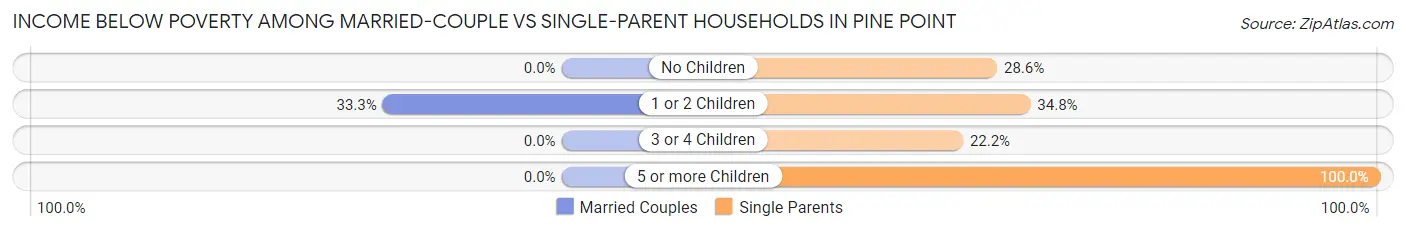
| Children | Married-Couple Families | Single-Parent Households |
| No Children | 0 (0.0%) | 4 (28.6%) |
| 1 or 2 Children | 1 (33.3%) | 8 (34.8%) |
| 3 or 4 Children | 0 (0.0%) | 2 (22.2%) |
| 5 or more Children | 0 (0.0%) | 4 (100.0%) |
| Total | 1 (5.6%) | 18 (36.0%) |
Employment Characteristics in Pine Point
Employment by Class of Employer in Pine Point
Among the 45 employed individuals in Pine Point, local government employees (23 | 51.1%), self-employed (not incorporated) (9 | 20.0%), and private company employees (8 | 17.8%) make up the most common classes of employment.
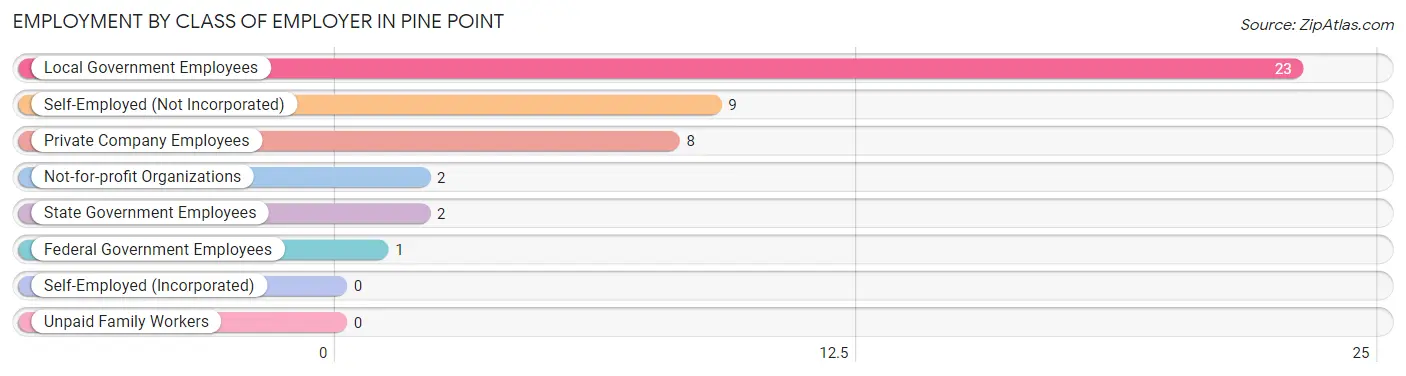
| Employer Class | # Employees | % Employees |
| Private Company Employees | 8 | 17.8% |
| Self-Employed (Incorporated) | 0 | 0.0% |
| Self-Employed (Not Incorporated) | 9 | 20.0% |
| Not-for-profit Organizations | 2 | 4.4% |
| Local Government Employees | 23 | 51.1% |
| State Government Employees | 2 | 4.4% |
| Federal Government Employees | 1 | 2.2% |
| Unpaid Family Workers | 0 | 0.0% |
| Total | 45 | 100.0% |
Employment Status by Age in Pine Point
According to the labor force statistics for Pine Point, out of the total population over 16 years of age (182), 41.2% or 75 individuals are in the labor force, with 22.7% or 17 of them unemployed. The age group with the highest labor force participation rate is 30 to 34 years, with 87.5% or 7 individuals in the labor force. Within the labor force, the 16 to 19 years age range has the highest percentage of unemployed individuals, with 50.0% or 2 of them being unemployed.
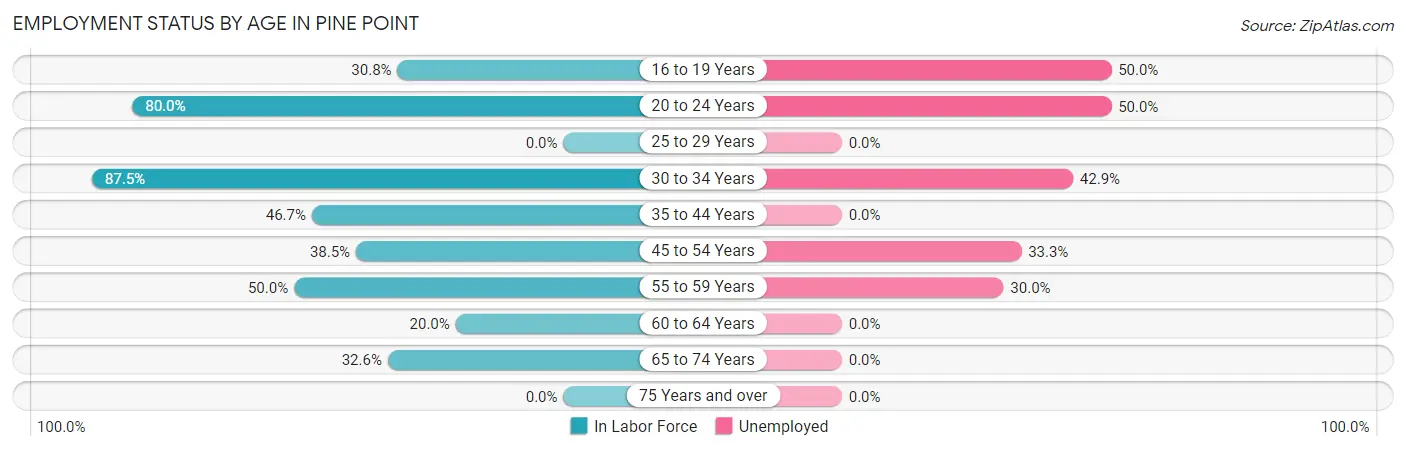
| Age Bracket | In Labor Force | Unemployed |
| 16 to 19 Years | 4 (30.8%) | 2 (50.0%) |
| 20 to 24 Years | 8 (80.0%) | 4 (50.0%) |
| 25 to 29 Years | 0 (0.0%) | 0 (0.0%) |
| 30 to 34 Years | 7 (87.5%) | 3 (42.9%) |
| 35 to 44 Years | 14 (46.7%) | 0 (0.0%) |
| 45 to 54 Years | 15 (38.5%) | 5 (33.3%) |
| 55 to 59 Years | 10 (50.0%) | 3 (30.0%) |
| 60 to 64 Years | 2 (20.0%) | 0 (0.0%) |
| 65 to 74 Years | 15 (32.6%) | 0 (0.0%) |
| 75 Years and over | 0 (0.0%) | 0 (0.0%) |
| Total | 75 (41.2%) | 17 (22.7%) |
Employment Status by Educational Attainment in Pine Point
According to labor force statistics for Pine Point, 43.2% of individuals (48) out of the total population between 25 and 64 years of age (111) are in the labor force, with 22.9% or 11 of them being unemployed. The group with the highest labor force participation rate are those with the educational attainment of high school diploma, with 52.5% or 32 individuals in the labor force. Within the labor force, individuals with less than high school education have the highest percentage of unemployment, with 33.3% or 1 of them being unemployed.
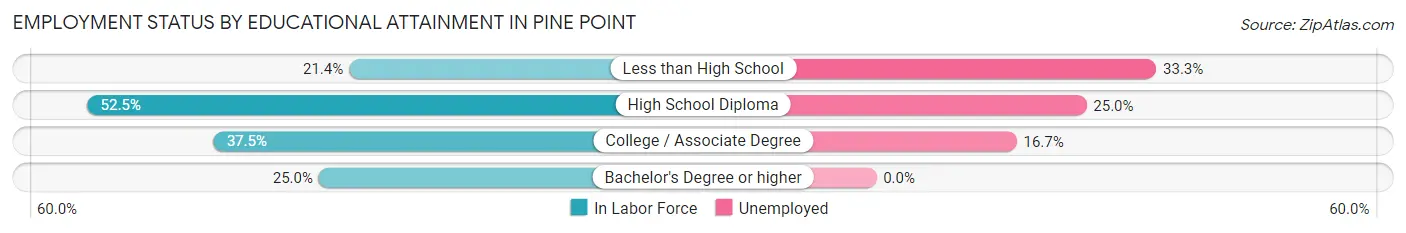
| Educational Attainment | In Labor Force | Unemployed |
| Less than High School | 3 (21.4%) | 5 (33.3%) |
| High School Diploma | 32 (52.5%) | 15 (25.0%) |
| College / Associate Degree | 12 (37.5%) | 5 (16.7%) |
| Bachelor's Degree or higher | 1 (25.0%) | 0 (0.0%) |
| Total | 48 (43.2%) | 25 (22.9%) |
Employment Occupations by Sex in Pine Point
Management, Business, Science and Arts Occupations
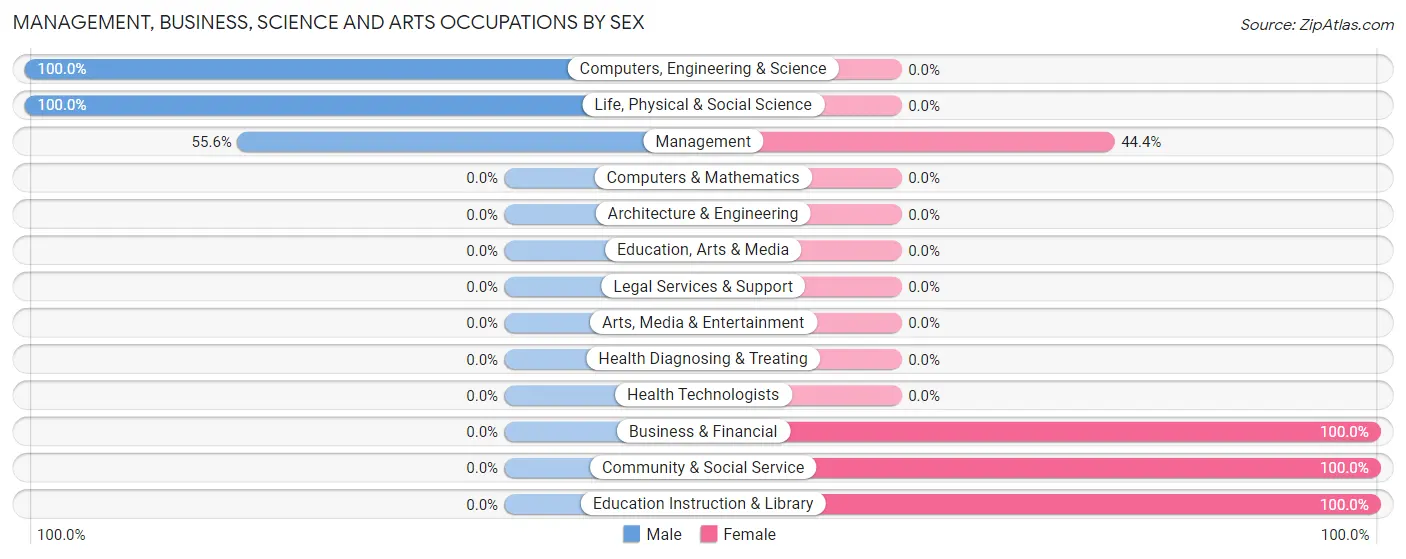
The most common Management, Business, Science and Arts occupations in Pine Point are Management (9 | 15.5%), Business & Financial (8 | 13.8%), Community & Social Service (3 | 5.2%), Education Instruction & Library (3 | 5.2%), and Computers, Engineering & Science (2 | 3.5%).
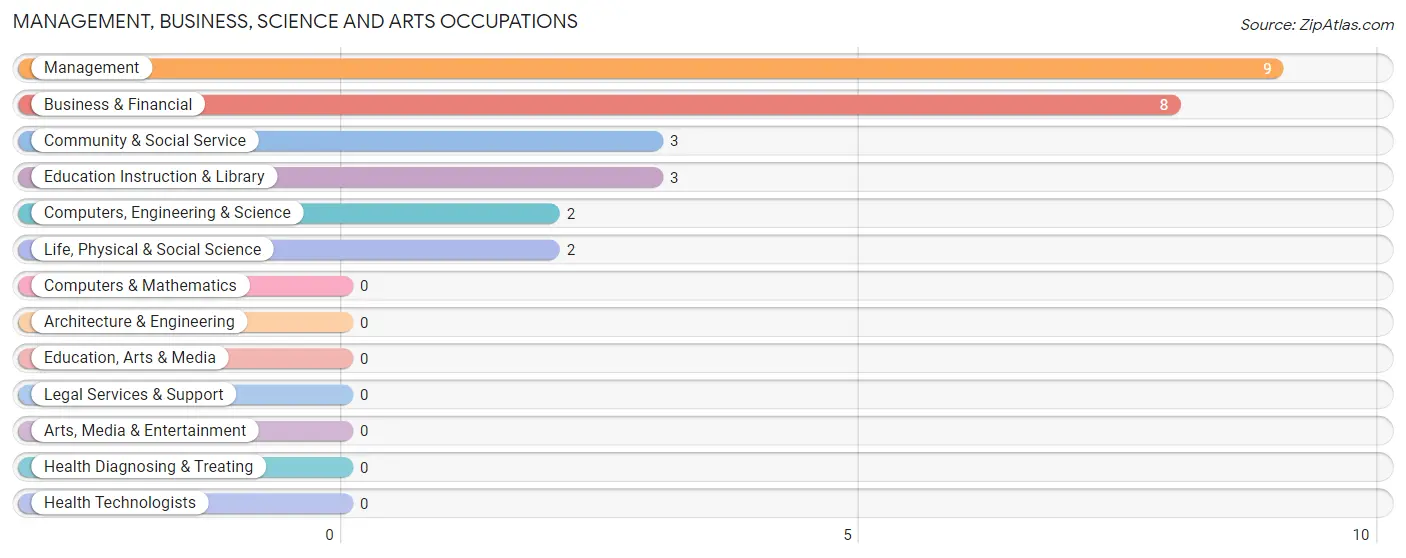
Management, Business, Science and Arts Occupations by Sex
Within the Management, Business, Science and Arts occupations in Pine Point, the most male-oriented occupations are Computers, Engineering & Science (100.0%), Life, Physical & Social Science (100.0%), and Management (55.6%), while the most female-oriented occupations are Business & Financial (100.0%), Community & Social Service (100.0%), and Education Instruction & Library (100.0%).
| Occupation | Male | Female |
| Management | 5 (55.6%) | 4 (44.4%) |
| Business & Financial | 0 (0.0%) | 8 (100.0%) |
| Computers, Engineering & Science | 2 (100.0%) | 0 (0.0%) |
| Computers & Mathematics | 0 (0.0%) | 0 (0.0%) |
| Architecture & Engineering | 0 (0.0%) | 0 (0.0%) |
| Life, Physical & Social Science | 2 (100.0%) | 0 (0.0%) |
| Community & Social Service | 0 (0.0%) | 3 (100.0%) |
| Education, Arts & Media | 0 (0.0%) | 0 (0.0%) |
| Legal Services & Support | 0 (0.0%) | 0 (0.0%) |
| Education Instruction & Library | 0 (0.0%) | 3 (100.0%) |
| Arts, Media & Entertainment | 0 (0.0%) | 0 (0.0%) |
| Health Diagnosing & Treating | 0 (0.0%) | 0 (0.0%) |
| Health Technologists | 0 (0.0%) | 0 (0.0%) |
| Total (Category) | 7 (31.8%) | 15 (68.2%) |
| Total (Overall) | 28 (48.3%) | 30 (51.7%) |
Services Occupations
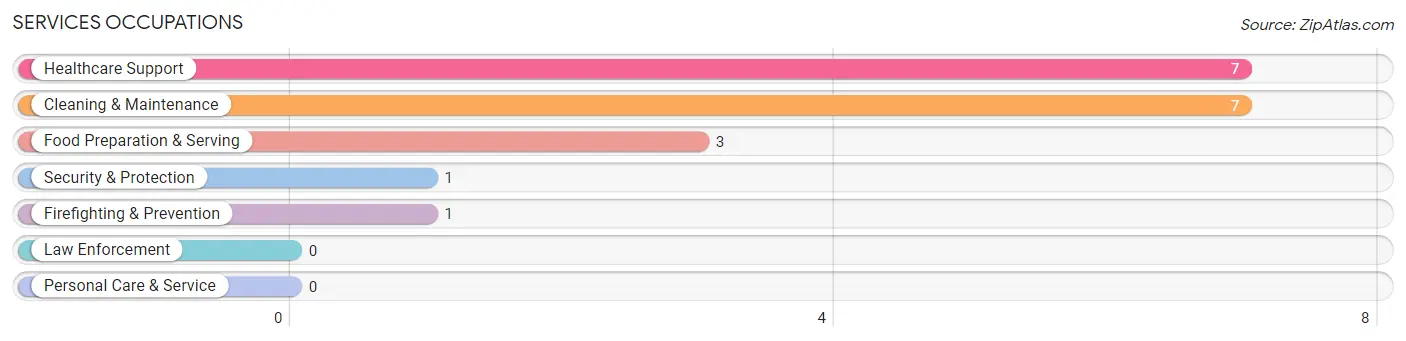
The most common Services occupations in Pine Point are Healthcare Support (7 | 12.1%), Cleaning & Maintenance (7 | 12.1%), Food Preparation & Serving (3 | 5.2%), Security & Protection (1 | 1.7%), and Firefighting & Prevention (1 | 1.7%).
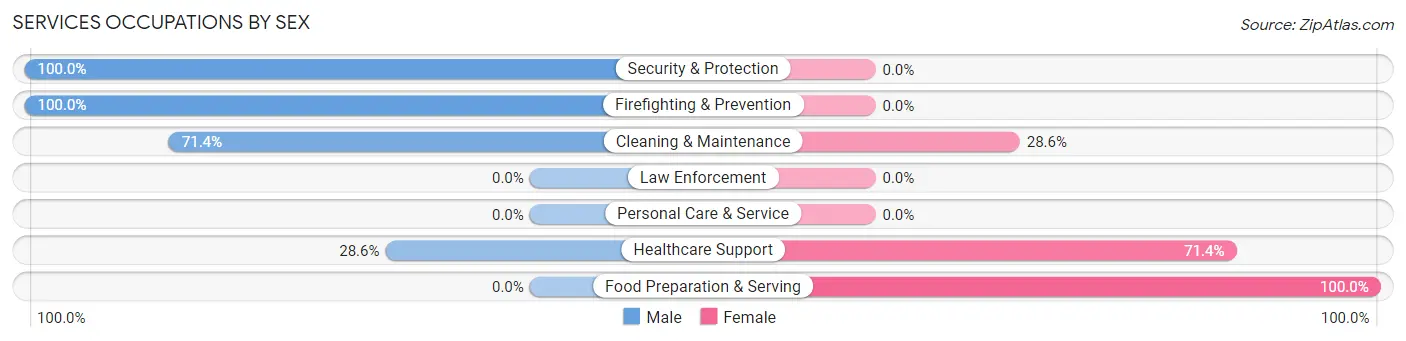
Services Occupations by Sex
Within the Services occupations in Pine Point, the most male-oriented occupations are Security & Protection (100.0%), Firefighting & Prevention (100.0%), and Cleaning & Maintenance (71.4%), while the most female-oriented occupations are Food Preparation & Serving (100.0%), Healthcare Support (71.4%), and Cleaning & Maintenance (28.6%).
| Occupation | Male | Female |
| Healthcare Support | 2 (28.6%) | 5 (71.4%) |
| Security & Protection | 1 (100.0%) | 0 (0.0%) |
| Firefighting & Prevention | 1 (100.0%) | 0 (0.0%) |
| Law Enforcement | 0 (0.0%) | 0 (0.0%) |
| Food Preparation & Serving | 0 (0.0%) | 3 (100.0%) |
| Cleaning & Maintenance | 5 (71.4%) | 2 (28.6%) |
| Personal Care & Service | 0 (0.0%) | 0 (0.0%) |
| Total (Category) | 8 (44.4%) | 10 (55.6%) |
| Total (Overall) | 28 (48.3%) | 30 (51.7%) |
Sales and Office Occupations
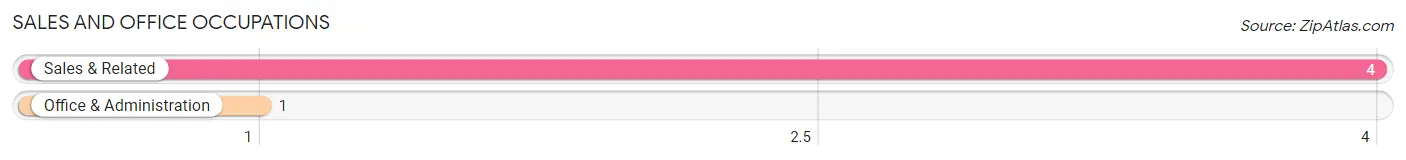
The most common Sales and Office occupations in Pine Point are Sales & Related (4 | 6.9%), and Office & Administration (1 | 1.7%).
Sales and Office Occupations by Sex

| Occupation | Male | Female |
| Sales & Related | 2 (50.0%) | 2 (50.0%) |
| Office & Administration | 0 (0.0%) | 1 (100.0%) |
| Total (Category) | 2 (40.0%) | 3 (60.0%) |
| Total (Overall) | 28 (48.3%) | 30 (51.7%) |
Natural Resources, Construction and Maintenance Occupations
The most common Natural Resources, Construction and Maintenance occupations in Pine Point are , and Construction & Extraction (7 | 12.1%).
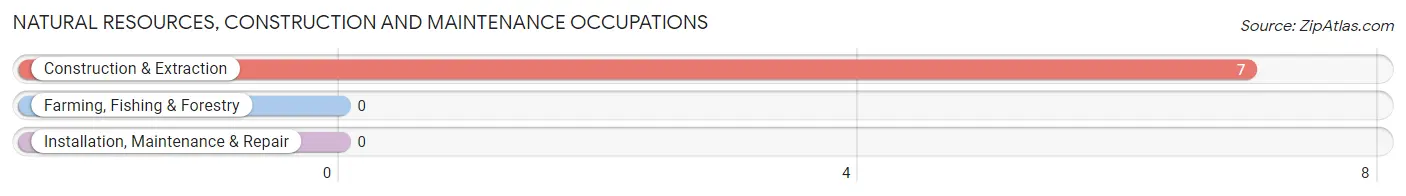
Natural Resources, Construction and Maintenance Occupations by Sex
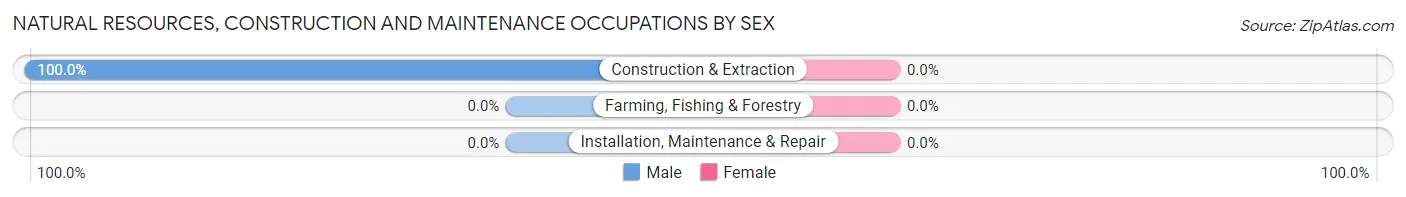
| Occupation | Male | Female |
| Farming, Fishing & Forestry | 0 (0.0%) | 0 (0.0%) |
| Construction & Extraction | 7 (100.0%) | 0 (0.0%) |
| Installation, Maintenance & Repair | 0 (0.0%) | 0 (0.0%) |
| Total (Category) | 7 (100.0%) | 0 (0.0%) |
| Total (Overall) | 28 (48.3%) | 30 (51.7%) |
Production, Transportation and Moving Occupations
The most common Production, Transportation and Moving occupations in Pine Point are Transportation (4 | 6.9%), and Production (2 | 3.5%).
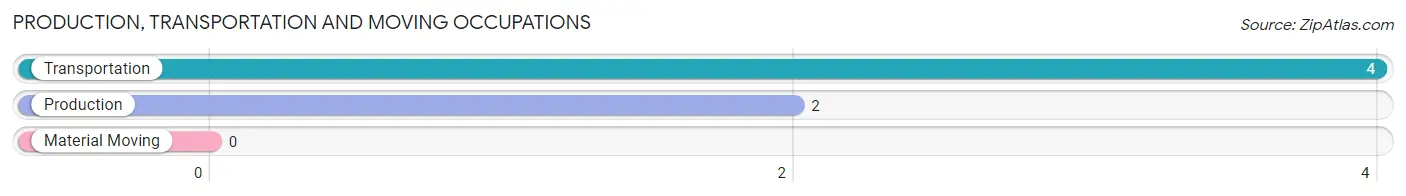
Production, Transportation and Moving Occupations by Sex
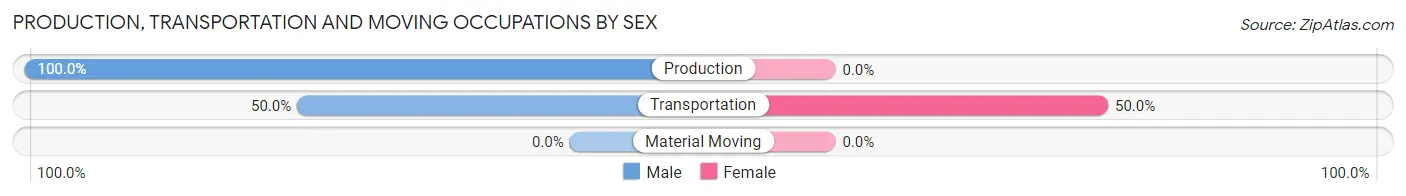
| Occupation | Male | Female |
| Production | 2 (100.0%) | 0 (0.0%) |
| Transportation | 2 (50.0%) | 2 (50.0%) |
| Material Moving | 0 (0.0%) | 0 (0.0%) |
| Total (Category) | 4 (66.7%) | 2 (33.3%) |
| Total (Overall) | 28 (48.3%) | 30 (51.7%) |
Employment Industries by Sex in Pine Point
Employment Industries in Pine Point
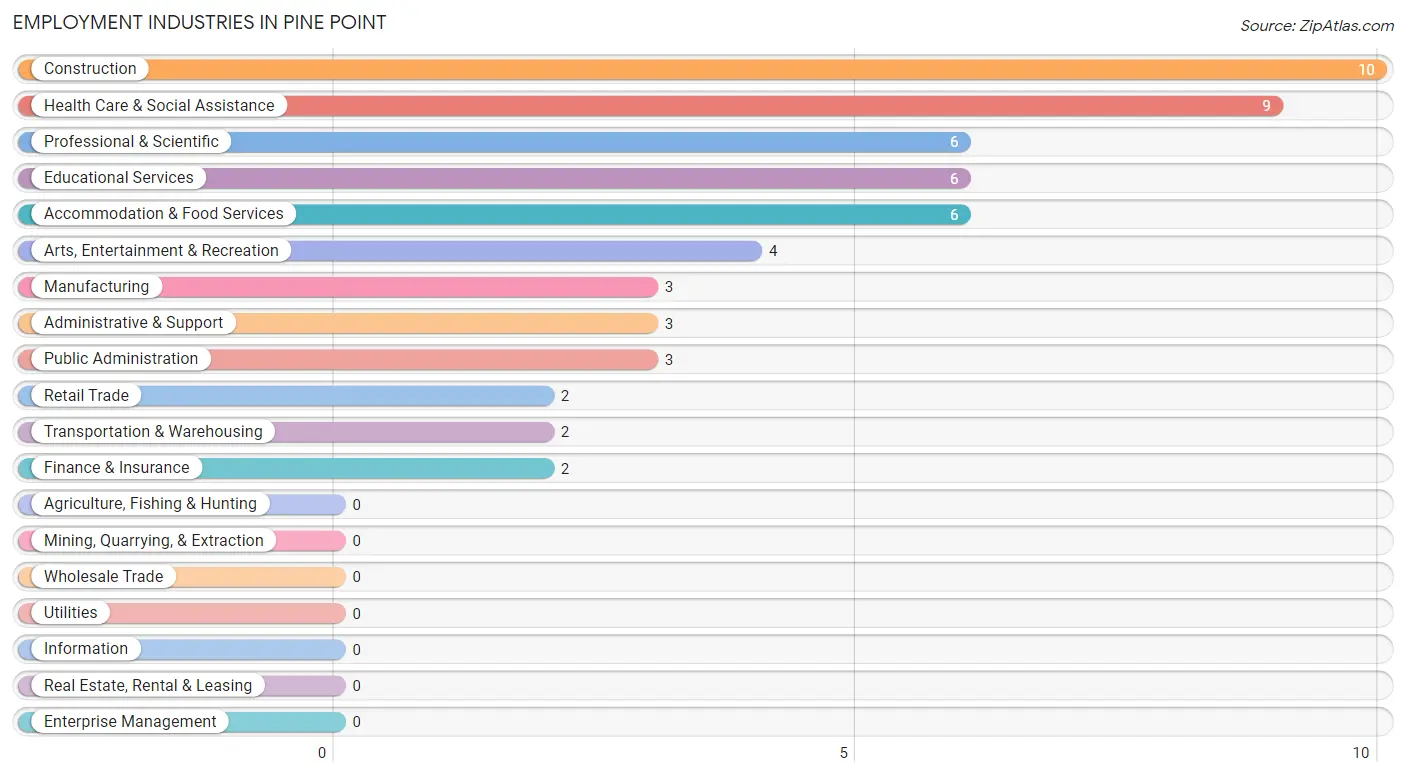
The major employment industries in Pine Point include Construction (10 | 17.2%), Health Care & Social Assistance (9 | 15.5%), Professional & Scientific (6 | 10.3%), Educational Services (6 | 10.3%), and Accommodation & Food Services (6 | 10.3%).
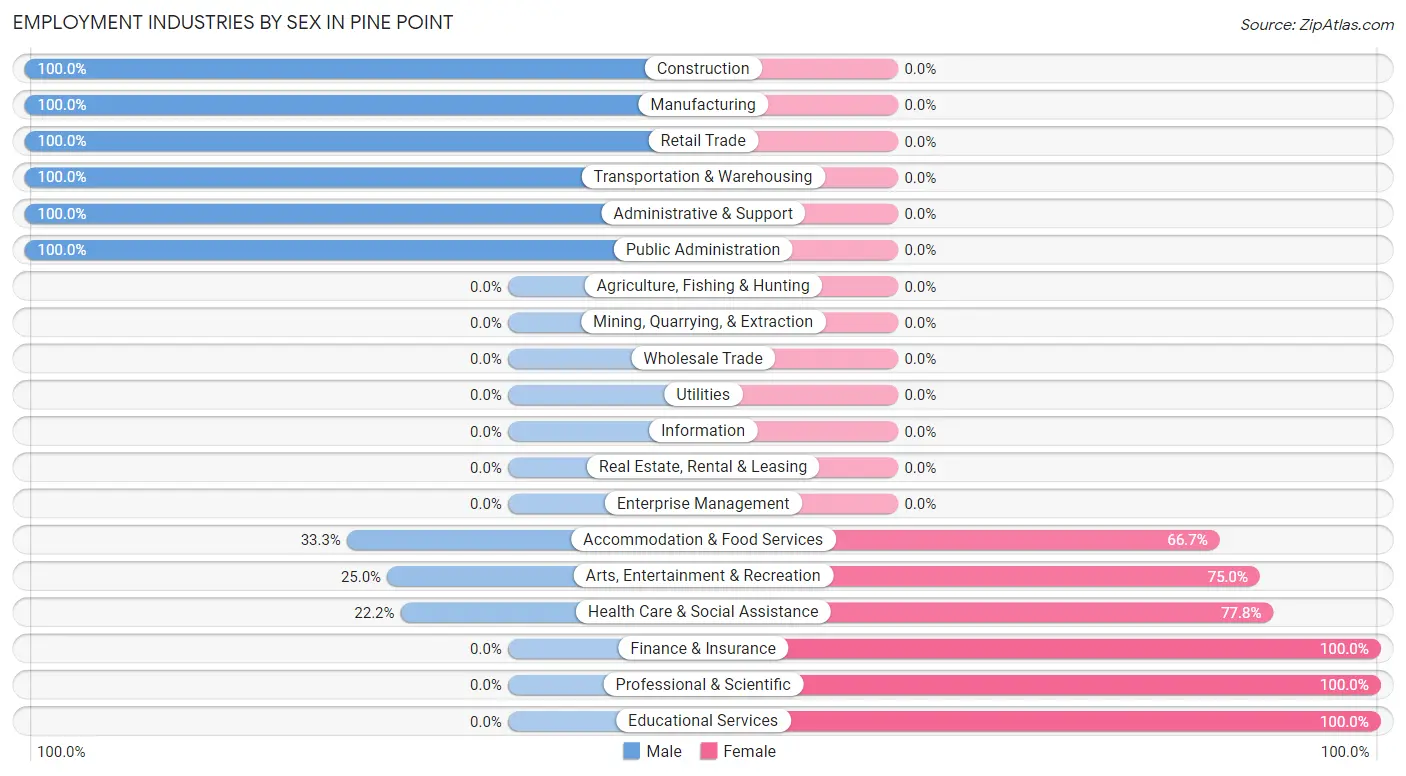
Employment Industries by Sex in Pine Point
The Pine Point industries that see more men than women are Construction (100.0%), Manufacturing (100.0%), and Retail Trade (100.0%), whereas the industries that tend to have a higher number of women are Finance & Insurance (100.0%), Professional & Scientific (100.0%), and Educational Services (100.0%).
| Industry | Male | Female |
| Agriculture, Fishing & Hunting | 0 (0.0%) | 0 (0.0%) |
| Mining, Quarrying, & Extraction | 0 (0.0%) | 0 (0.0%) |
| Construction | 10 (100.0%) | 0 (0.0%) |
| Manufacturing | 3 (100.0%) | 0 (0.0%) |
| Wholesale Trade | 0 (0.0%) | 0 (0.0%) |
| Retail Trade | 2 (100.0%) | 0 (0.0%) |
| Transportation & Warehousing | 2 (100.0%) | 0 (0.0%) |
| Utilities | 0 (0.0%) | 0 (0.0%) |
| Information | 0 (0.0%) | 0 (0.0%) |
| Finance & Insurance | 0 (0.0%) | 2 (100.0%) |
| Real Estate, Rental & Leasing | 0 (0.0%) | 0 (0.0%) |
| Professional & Scientific | 0 (0.0%) | 6 (100.0%) |
| Enterprise Management | 0 (0.0%) | 0 (0.0%) |
| Administrative & Support | 3 (100.0%) | 0 (0.0%) |
| Educational Services | 0 (0.0%) | 6 (100.0%) |
| Health Care & Social Assistance | 2 (22.2%) | 7 (77.8%) |
| Arts, Entertainment & Recreation | 1 (25.0%) | 3 (75.0%) |
| Accommodation & Food Services | 2 (33.3%) | 4 (66.7%) |
| Public Administration | 3 (100.0%) | 0 (0.0%) |
| Total | 28 (48.3%) | 30 (51.7%) |
Education in Pine Point
School Enrollment in Pine Point
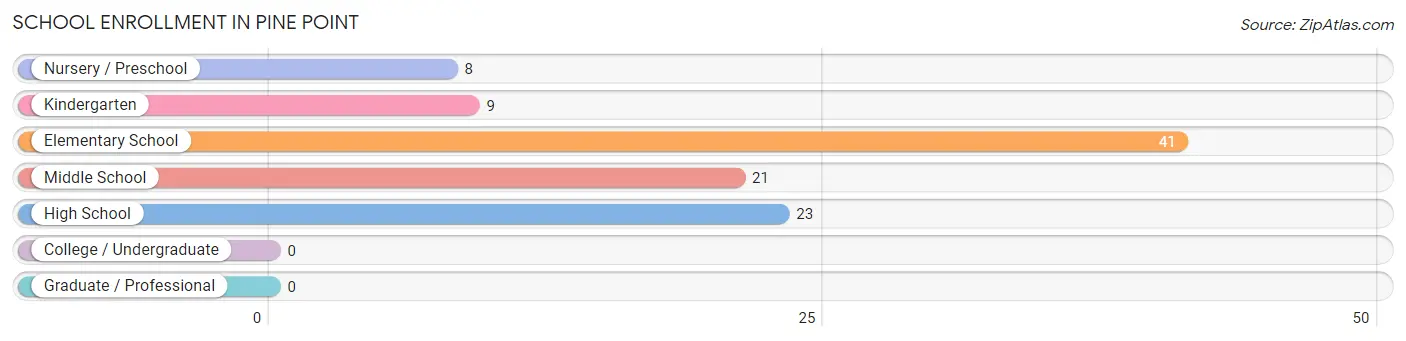
The most common levels of schooling among the 102 students in Pine Point are elementary school (41 | 40.2%), high school (23 | 22.6%), and middle school (21 | 20.6%).
| School Level | # Students | % Students |
| Nursery / Preschool | 8 | 7.8% |
| Kindergarten | 9 | 8.8% |
| Elementary School | 41 | 40.2% |
| Middle School | 21 | 20.6% |
| High School | 23 | 22.6% |
| College / Undergraduate | 0 | 0.0% |
| Graduate / Professional | 0 | 0.0% |
| Total | 102 | 100.0% |
School Enrollment by Age by Funding Source in Pine Point
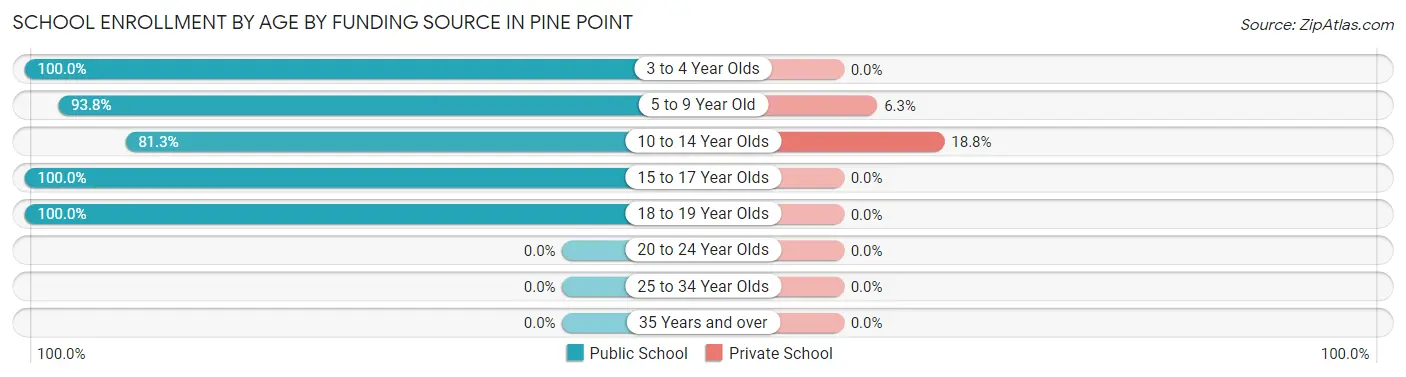
Out of a total of 102 students who are enrolled in schools in Pine Point, 9 (8.8%) attend a private institution, while the remaining 93 (91.2%) are enrolled in public schools. The age group of 10 to 14 year olds has the highest likelihood of being enrolled in private schools, with 6 (18.8% in the age bracket) enrolled. Conversely, the age group of 3 to 4 year olds has the lowest likelihood of being enrolled in a private school, with 8 (100.0% in the age bracket) attending a public institution.
| Age Bracket | Public School | Private School |
| 3 to 4 Year Olds | 8 (100.0%) | 0 (0.0%) |
| 5 to 9 Year Old | 45 (93.8%) | 3 (6.2%) |
| 10 to 14 Year Olds | 26 (81.2%) | 6 (18.8%) |
| 15 to 17 Year Olds | 10 (100.0%) | 0 (0.0%) |
| 18 to 19 Year Olds | 4 (100.0%) | 0 (0.0%) |
| 20 to 24 Year Olds | 0 (0.0%) | 0 (0.0%) |
| 25 to 34 Year Olds | 0 (0.0%) | 0 (0.0%) |
| 35 Years and over | 0 (0.0%) | 0 (0.0%) |
| Total | 93 (91.2%) | 9 (8.8%) |
Educational Attainment by Field of Study in Pine Point
Social sciences (16 | 69.6%), bio, nature & agricultural (2 | 8.7%), psychology (2 | 8.7%), education (2 | 8.7%), and business (1 | 4.3%) are the most common fields of study among 23 individuals in Pine Point who have obtained a bachelor's degree or higher.
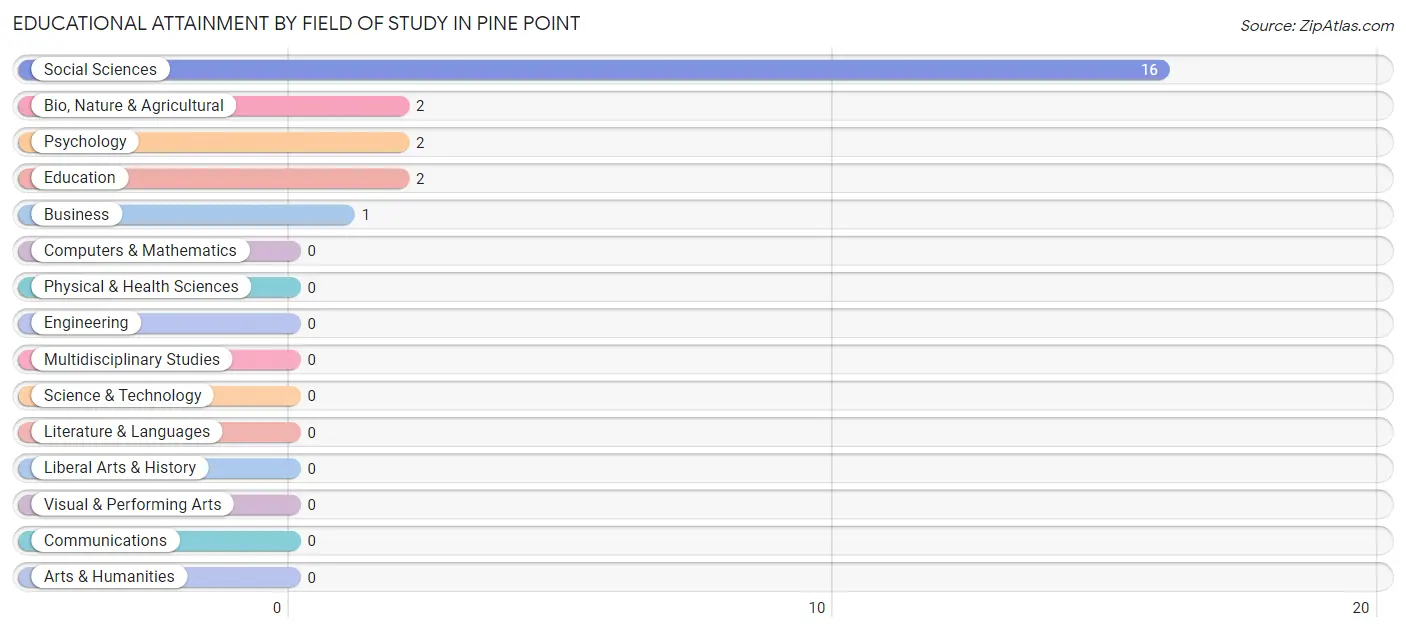
| Field of Study | # Graduates | % Graduates |
| Computers & Mathematics | 0 | 0.0% |
| Bio, Nature & Agricultural | 2 | 8.7% |
| Physical & Health Sciences | 0 | 0.0% |
| Psychology | 2 | 8.7% |
| Social Sciences | 16 | 69.6% |
| Engineering | 0 | 0.0% |
| Multidisciplinary Studies | 0 | 0.0% |
| Science & Technology | 0 | 0.0% |
| Business | 1 | 4.3% |
| Education | 2 | 8.7% |
| Literature & Languages | 0 | 0.0% |
| Liberal Arts & History | 0 | 0.0% |
| Visual & Performing Arts | 0 | 0.0% |
| Communications | 0 | 0.0% |
| Arts & Humanities | 0 | 0.0% |
| Total | 23 | 100.0% |
Transportation & Commute in Pine Point
Vehicle Availability by Sex in Pine Point
The most prevalent vehicle ownership categories in Pine Point are males with 2 vehicles (12, accounting for 63.2%) and females with 2 vehicles (9, making up 46.2%).
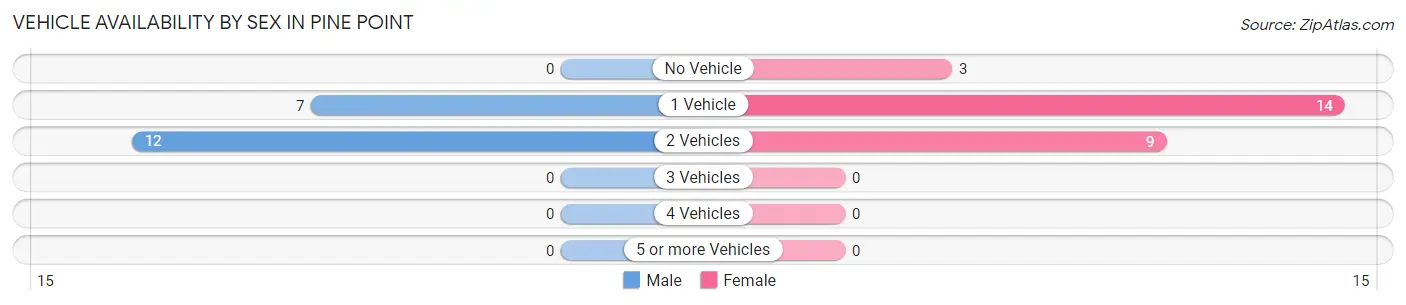
| Vehicles Available | Male | Female |
| No Vehicle | 0 (0.0%) | 3 (11.5%) |
| 1 Vehicle | 7 (36.8%) | 14 (53.8%) |
| 2 Vehicles | 12 (63.2%) | 9 (34.6%) |
| 3 Vehicles | 0 (0.0%) | 0 (0.0%) |
| 4 Vehicles | 0 (0.0%) | 0 (0.0%) |
| 5 or more Vehicles | 0 (0.0%) | 0 (0.0%) |
| Total | 19 (100.0%) | 26 (100.0%) |
Commute Time in Pine Point
The most frequently occuring commute durations in Pine Point are 60 to 89 minutes (14 commuters, 35.9%), less than 5 minutes (7 commuters, 17.9%), and 10 to 14 minutes (6 commuters, 15.4%).
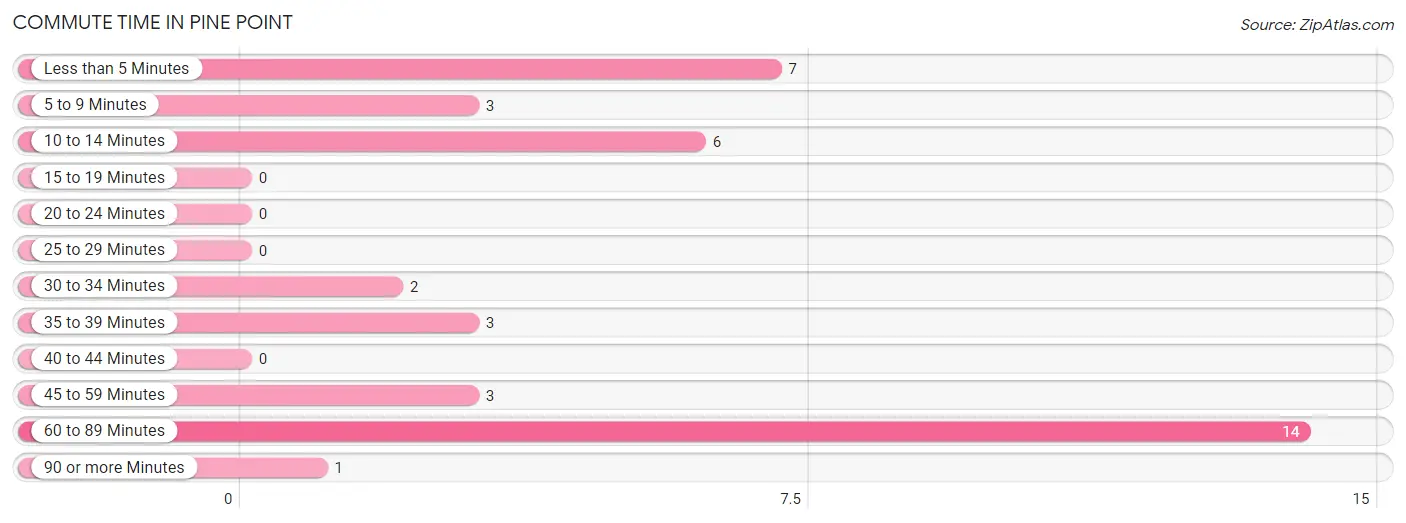
| Commute Time | # Commuters | % Commuters |
| Less than 5 Minutes | 7 | 17.9% |
| 5 to 9 Minutes | 3 | 7.7% |
| 10 to 14 Minutes | 6 | 15.4% |
| 15 to 19 Minutes | 0 | 0.0% |
| 20 to 24 Minutes | 0 | 0.0% |
| 25 to 29 Minutes | 0 | 0.0% |
| 30 to 34 Minutes | 2 | 5.1% |
| 35 to 39 Minutes | 3 | 7.7% |
| 40 to 44 Minutes | 0 | 0.0% |
| 45 to 59 Minutes | 3 | 7.7% |
| 60 to 89 Minutes | 14 | 35.9% |
| 90 or more Minutes | 1 | 2.6% |
Commute Time by Sex in Pine Point
The most common commute times in Pine Point are 60 to 89 minutes (14 commuters, 73.7%) for males and less than 5 minutes (6 commuters, 30.0%) for females.
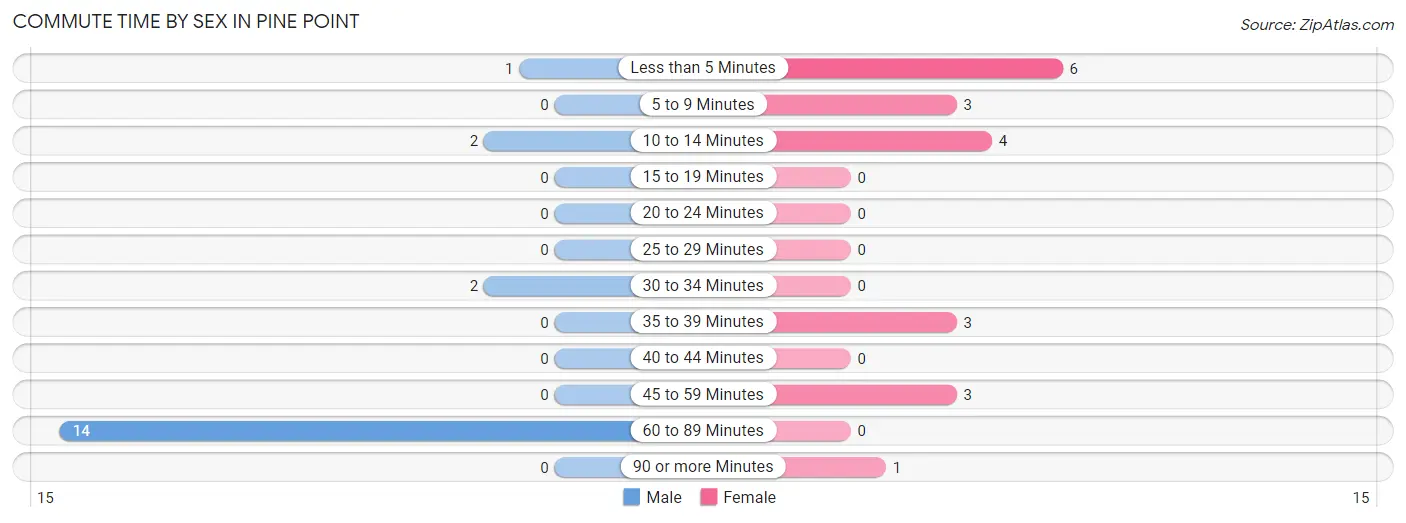
| Commute Time | Male | Female |
| Less than 5 Minutes | 1 (5.3%) | 6 (30.0%) |
| 5 to 9 Minutes | 0 (0.0%) | 3 (15.0%) |
| 10 to 14 Minutes | 2 (10.5%) | 4 (20.0%) |
| 15 to 19 Minutes | 0 (0.0%) | 0 (0.0%) |
| 20 to 24 Minutes | 0 (0.0%) | 0 (0.0%) |
| 25 to 29 Minutes | 0 (0.0%) | 0 (0.0%) |
| 30 to 34 Minutes | 2 (10.5%) | 0 (0.0%) |
| 35 to 39 Minutes | 0 (0.0%) | 3 (15.0%) |
| 40 to 44 Minutes | 0 (0.0%) | 0 (0.0%) |
| 45 to 59 Minutes | 0 (0.0%) | 3 (15.0%) |
| 60 to 89 Minutes | 14 (73.7%) | 0 (0.0%) |
| 90 or more Minutes | 0 (0.0%) | 1 (5.0%) |
Time of Departure to Work by Sex in Pine Point
The most frequent times of departure to work in Pine Point are 7:00 AM to 7:29 AM (7, 36.8%) for males and 6:00 AM to 6:29 AM (5, 25.0%) for females.
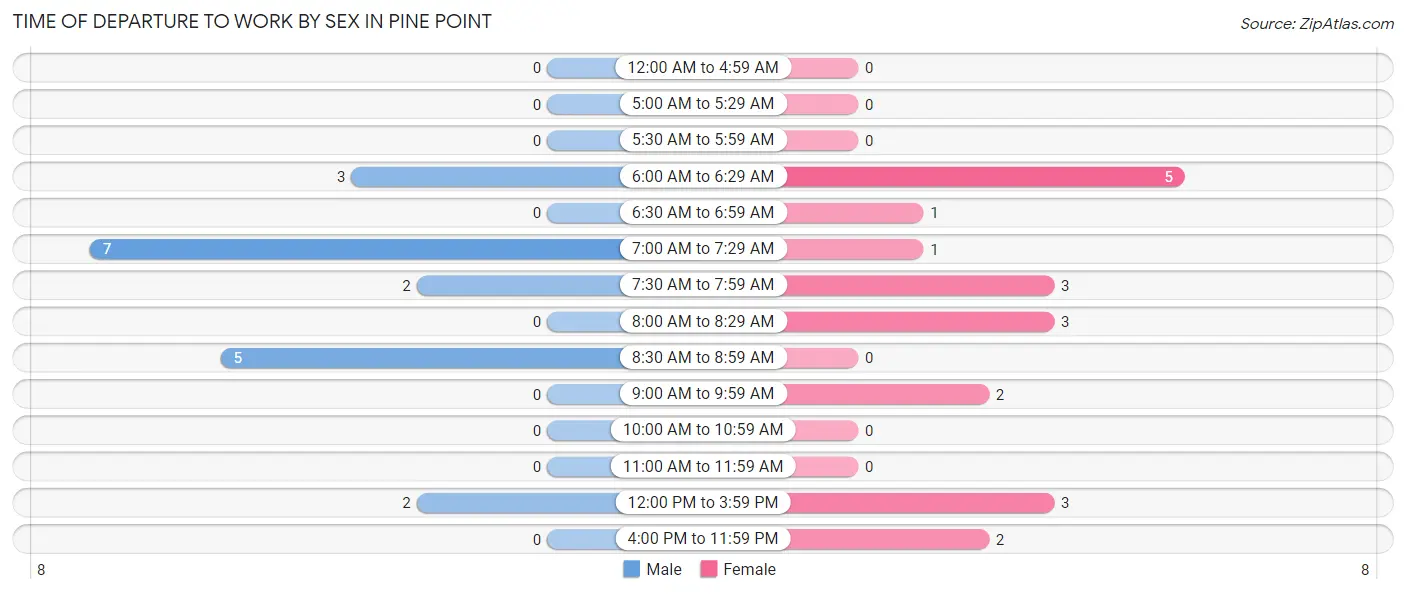
| Time of Departure | Male | Female |
| 12:00 AM to 4:59 AM | 0 (0.0%) | 0 (0.0%) |
| 5:00 AM to 5:29 AM | 0 (0.0%) | 0 (0.0%) |
| 5:30 AM to 5:59 AM | 0 (0.0%) | 0 (0.0%) |
| 6:00 AM to 6:29 AM | 3 (15.8%) | 5 (25.0%) |
| 6:30 AM to 6:59 AM | 0 (0.0%) | 1 (5.0%) |
| 7:00 AM to 7:29 AM | 7 (36.8%) | 1 (5.0%) |
| 7:30 AM to 7:59 AM | 2 (10.5%) | 3 (15.0%) |
| 8:00 AM to 8:29 AM | 0 (0.0%) | 3 (15.0%) |
| 8:30 AM to 8:59 AM | 5 (26.3%) | 0 (0.0%) |
| 9:00 AM to 9:59 AM | 0 (0.0%) | 2 (10.0%) |
| 10:00 AM to 10:59 AM | 0 (0.0%) | 0 (0.0%) |
| 11:00 AM to 11:59 AM | 0 (0.0%) | 0 (0.0%) |
| 12:00 PM to 3:59 PM | 2 (10.5%) | 3 (15.0%) |
| 4:00 PM to 11:59 PM | 0 (0.0%) | 2 (10.0%) |
| Total | 19 (100.0%) | 20 (100.0%) |
Housing Occupancy in Pine Point
Occupancy by Ownership in Pine Point
Of the total 100 dwellings in Pine Point, owner-occupied units account for 61 (61.0%), while renter-occupied units make up 39 (39.0%).
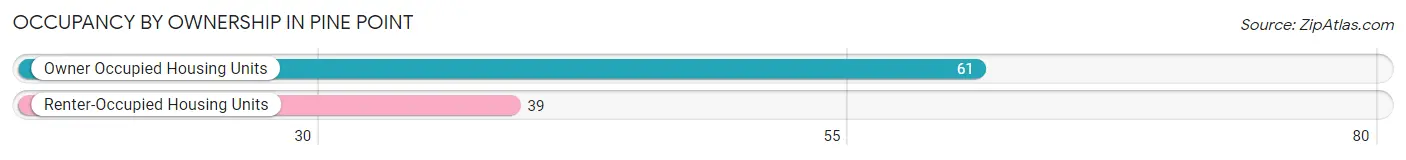
| Occupancy | # Housing Units | % Housing Units |
| Owner Occupied Housing Units | 61 | 61.0% |
| Renter-Occupied Housing Units | 39 | 39.0% |
| Total Occupied Housing Units | 100 | 100.0% |
Occupancy by Household Size in Pine Point
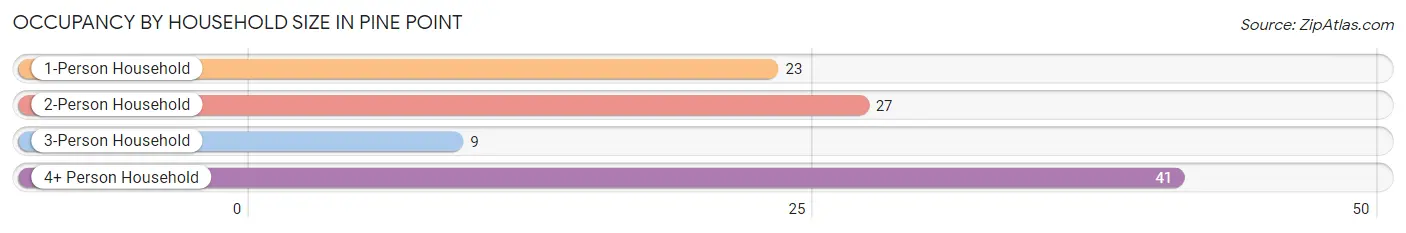
| Household Size | # Housing Units | % Housing Units |
| 1-Person Household | 23 | 23.0% |
| 2-Person Household | 27 | 27.0% |
| 3-Person Household | 9 | 9.0% |
| 4+ Person Household | 41 | 41.0% |
| Total Housing Units | 100 | 100.0% |
Occupancy by Ownership by Household Size in Pine Point
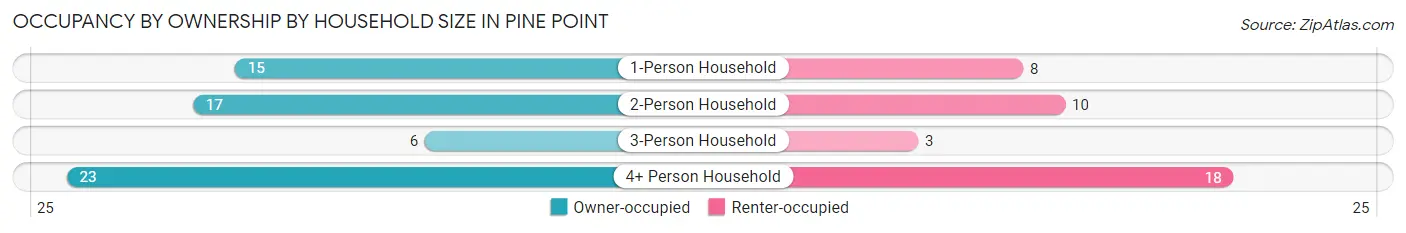
| Household Size | Owner-occupied | Renter-occupied |
| 1-Person Household | 15 (65.2%) | 8 (34.8%) |
| 2-Person Household | 17 (63.0%) | 10 (37.0%) |
| 3-Person Household | 6 (66.7%) | 3 (33.3%) |
| 4+ Person Household | 23 (56.1%) | 18 (43.9%) |
| Total Housing Units | 61 (61.0%) | 39 (39.0%) |
Occupancy by Educational Attainment in Pine Point
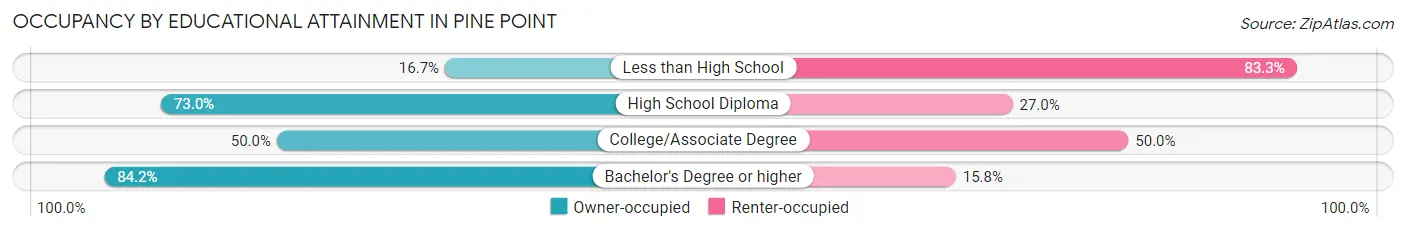
| Household Size | Owner-occupied | Renter-occupied |
| Less than High School | 2 (16.7%) | 10 (83.3%) |
| High School Diploma | 27 (73.0%) | 10 (27.0%) |
| College/Associate Degree | 16 (50.0%) | 16 (50.0%) |
| Bachelor's Degree or higher | 16 (84.2%) | 3 (15.8%) |
Occupancy by Age of Householder in Pine Point
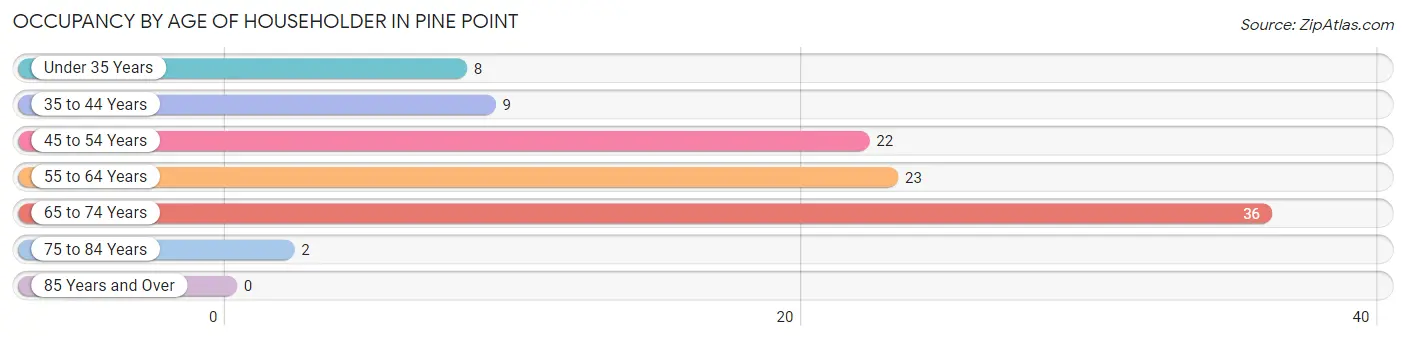
| Age Bracket | # Households | % Households |
| Under 35 Years | 8 | 8.0% |
| 35 to 44 Years | 9 | 9.0% |
| 45 to 54 Years | 22 | 22.0% |
| 55 to 64 Years | 23 | 23.0% |
| 65 to 74 Years | 36 | 36.0% |
| 75 to 84 Years | 2 | 2.0% |
| 85 Years and Over | 0 | 0.0% |
| Total | 100 | 100.0% |
Housing Finances in Pine Point
Median Income by Occupancy in Pine Point
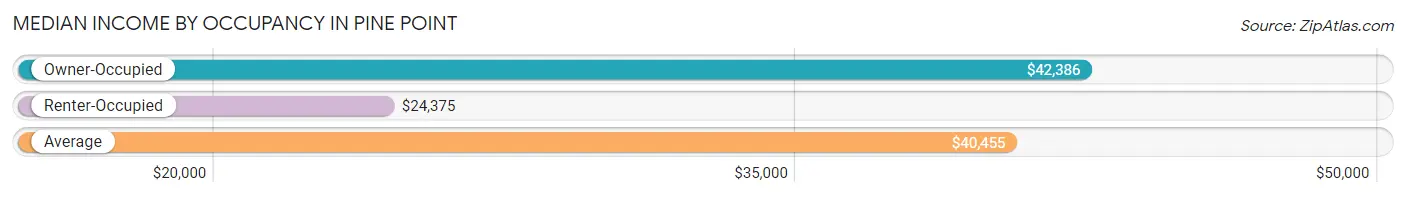
| Occupancy Type | # Households | Median Income |
| Owner-Occupied | 61 (61.0%) | $42,386 |
| Renter-Occupied | 39 (39.0%) | $24,375 |
| Average | 100 (100.0%) | $40,455 |
Occupancy by Householder Income Bracket in Pine Point
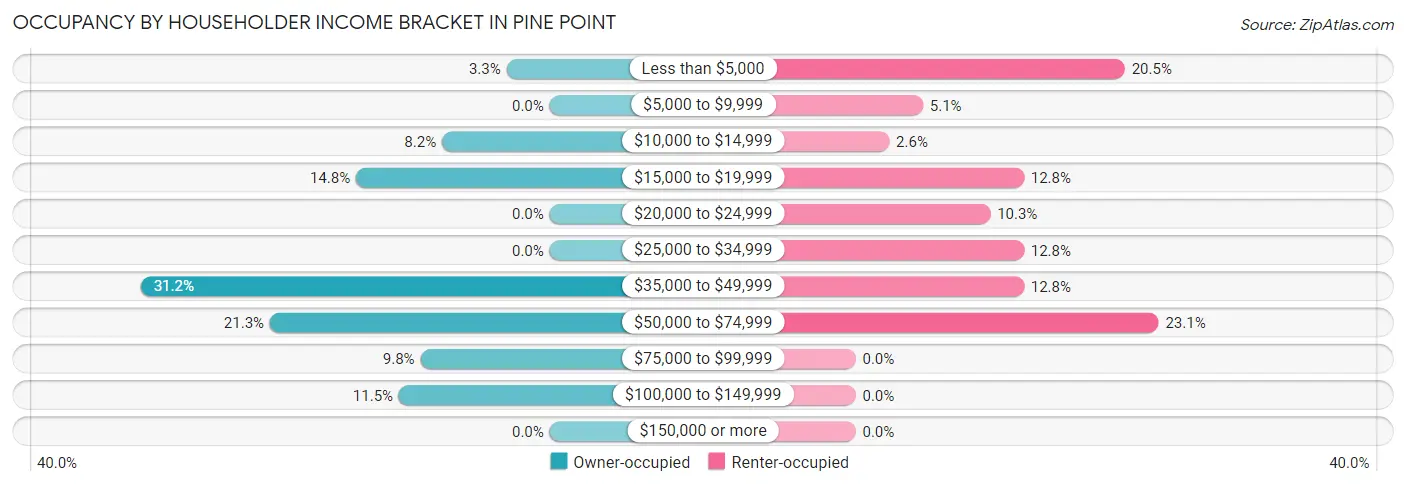
| Income Bracket | Owner-occupied | Renter-occupied |
| Less than $5,000 | 2 (3.3%) | 8 (20.5%) |
| $5,000 to $9,999 | 0 (0.0%) | 2 (5.1%) |
| $10,000 to $14,999 | 5 (8.2%) | 1 (2.6%) |
| $15,000 to $19,999 | 9 (14.7%) | 5 (12.8%) |
| $20,000 to $24,999 | 0 (0.0%) | 4 (10.3%) |
| $25,000 to $34,999 | 0 (0.0%) | 5 (12.8%) |
| $35,000 to $49,999 | 19 (31.1%) | 5 (12.8%) |
| $50,000 to $74,999 | 13 (21.3%) | 9 (23.1%) |
| $75,000 to $99,999 | 6 (9.8%) | 0 (0.0%) |
| $100,000 to $149,999 | 7 (11.5%) | 0 (0.0%) |
| $150,000 or more | 0 (0.0%) | 0 (0.0%) |
| Total | 61 (100.0%) | 39 (100.0%) |
Monthly Housing Cost Tiers in Pine Point
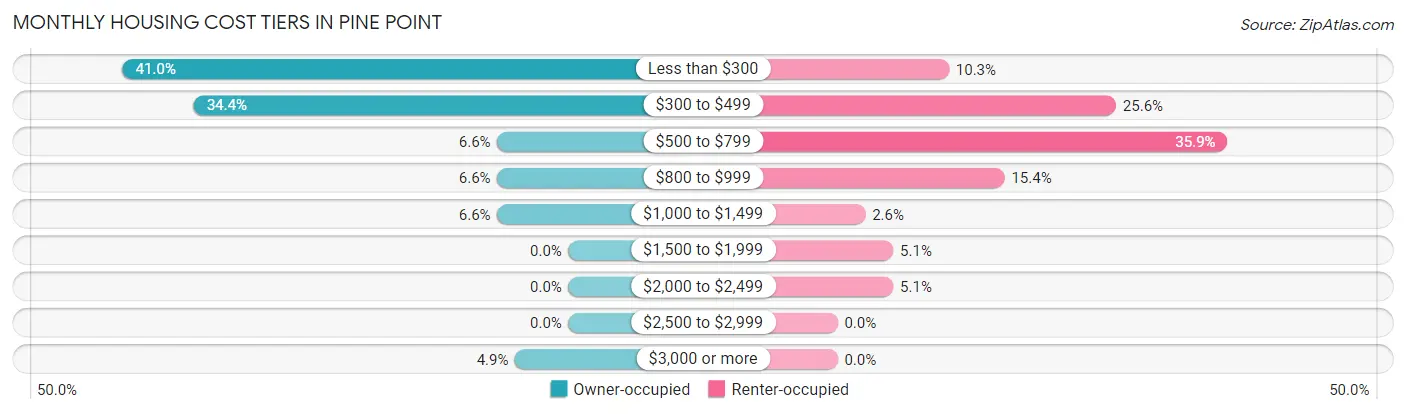
| Monthly Cost | Owner-occupied | Renter-occupied |
| Less than $300 | 25 (41.0%) | 4 (10.3%) |
| $300 to $499 | 21 (34.4%) | 10 (25.6%) |
| $500 to $799 | 4 (6.6%) | 14 (35.9%) |
| $800 to $999 | 4 (6.6%) | 6 (15.4%) |
| $1,000 to $1,499 | 4 (6.6%) | 1 (2.6%) |
| $1,500 to $1,999 | 0 (0.0%) | 2 (5.1%) |
| $2,000 to $2,499 | 0 (0.0%) | 2 (5.1%) |
| $2,500 to $2,999 | 0 (0.0%) | 0 (0.0%) |
| $3,000 or more | 3 (4.9%) | 0 (0.0%) |
| Total | 61 (100.0%) | 39 (100.0%) |
Physical Housing Characteristics in Pine Point
Housing Structures in Pine Point
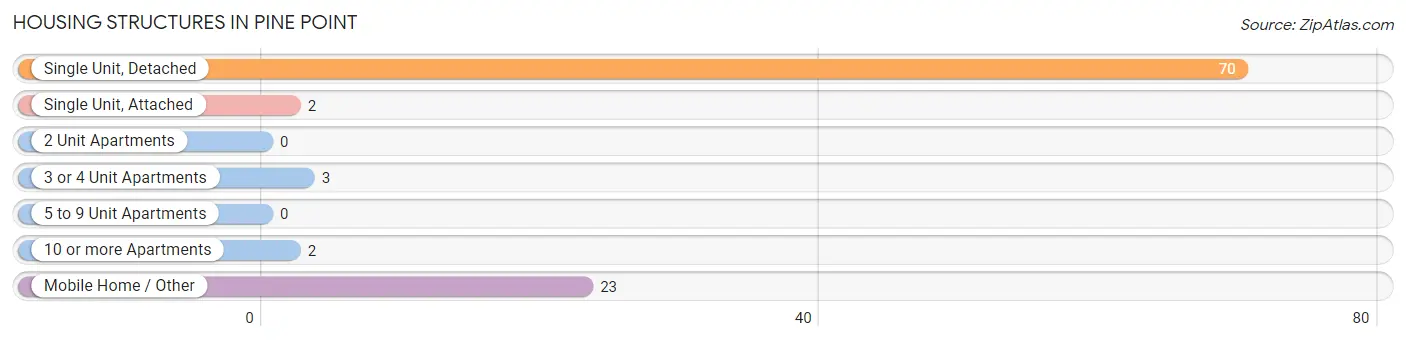
| Structure Type | # Housing Units | % Housing Units |
| Single Unit, Detached | 70 | 70.0% |
| Single Unit, Attached | 2 | 2.0% |
| 2 Unit Apartments | 0 | 0.0% |
| 3 or 4 Unit Apartments | 3 | 3.0% |
| 5 to 9 Unit Apartments | 0 | 0.0% |
| 10 or more Apartments | 2 | 2.0% |
| Mobile Home / Other | 23 | 23.0% |
| Total | 100 | 100.0% |
Housing Structures by Occupancy in Pine Point
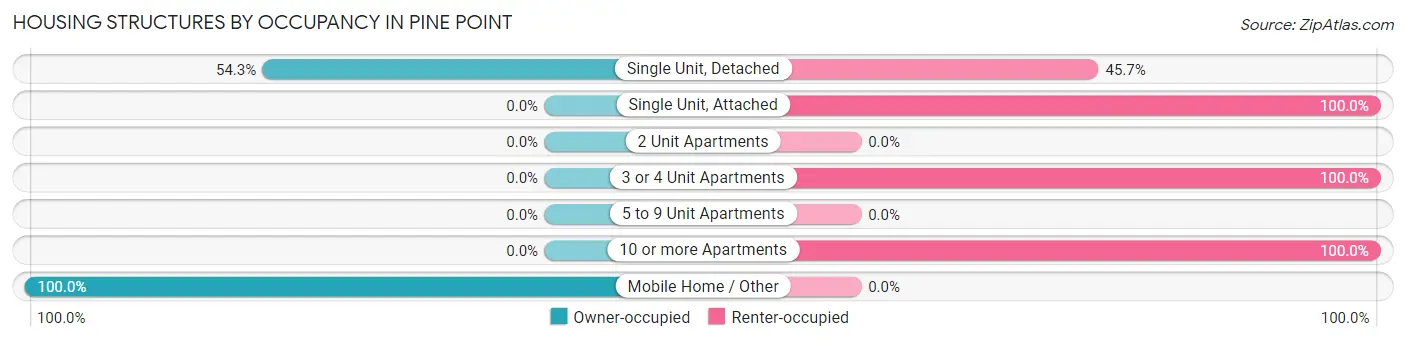
| Structure Type | Owner-occupied | Renter-occupied |
| Single Unit, Detached | 38 (54.3%) | 32 (45.7%) |
| Single Unit, Attached | 0 (0.0%) | 2 (100.0%) |
| 2 Unit Apartments | 0 (0.0%) | 0 (0.0%) |
| 3 or 4 Unit Apartments | 0 (0.0%) | 3 (100.0%) |
| 5 to 9 Unit Apartments | 0 (0.0%) | 0 (0.0%) |
| 10 or more Apartments | 0 (0.0%) | 2 (100.0%) |
| Mobile Home / Other | 23 (100.0%) | 0 (0.0%) |
| Total | 61 (61.0%) | 39 (39.0%) |
Housing Structures by Number of Rooms in Pine Point
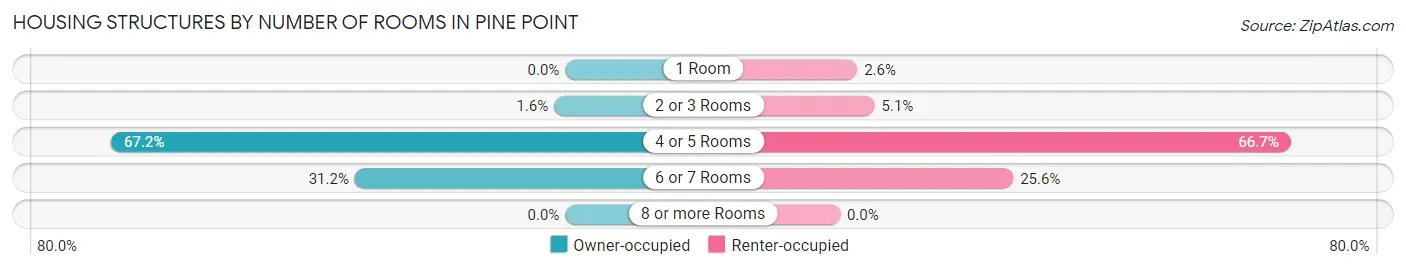
| Number of Rooms | Owner-occupied | Renter-occupied |
| 1 Room | 0 (0.0%) | 1 (2.6%) |
| 2 or 3 Rooms | 1 (1.6%) | 2 (5.1%) |
| 4 or 5 Rooms | 41 (67.2%) | 26 (66.7%) |
| 6 or 7 Rooms | 19 (31.1%) | 10 (25.6%) |
| 8 or more Rooms | 0 (0.0%) | 0 (0.0%) |
| Total | 61 (100.0%) | 39 (100.0%) |
Housing Structure by Heating Type in Pine Point
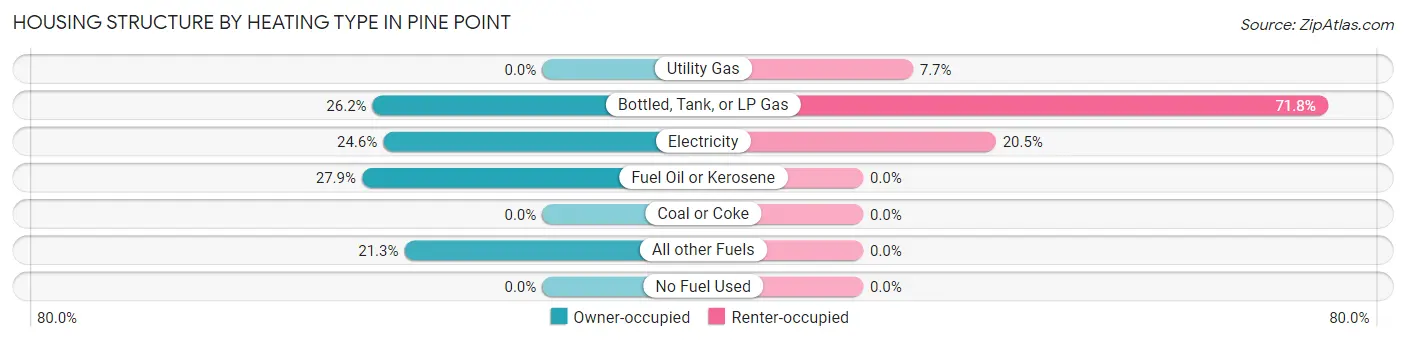
| Heating Type | Owner-occupied | Renter-occupied |
| Utility Gas | 0 (0.0%) | 3 (7.7%) |
| Bottled, Tank, or LP Gas | 16 (26.2%) | 28 (71.8%) |
| Electricity | 15 (24.6%) | 8 (20.5%) |
| Fuel Oil or Kerosene | 17 (27.9%) | 0 (0.0%) |
| Coal or Coke | 0 (0.0%) | 0 (0.0%) |
| All other Fuels | 13 (21.3%) | 0 (0.0%) |
| No Fuel Used | 0 (0.0%) | 0 (0.0%) |
| Total | 61 (100.0%) | 39 (100.0%) |
Household Vehicle Usage in Pine Point
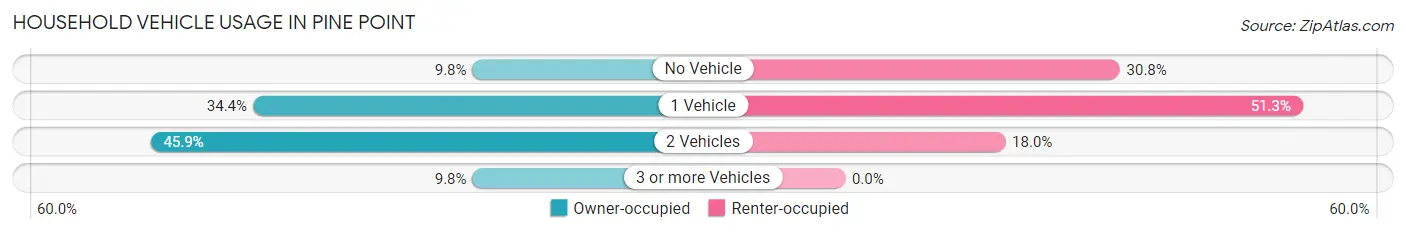
| Vehicles per Household | Owner-occupied | Renter-occupied |
| No Vehicle | 6 (9.8%) | 12 (30.8%) |
| 1 Vehicle | 21 (34.4%) | 20 (51.3%) |
| 2 Vehicles | 28 (45.9%) | 7 (17.9%) |
| 3 or more Vehicles | 6 (9.8%) | 0 (0.0%) |
| Total | 61 (100.0%) | 39 (100.0%) |
Real Estate & Mortgages in Pine Point
Real Estate and Mortgage Overview in Pine Point
| Characteristic | Without Mortgage | With Mortgage |
| Housing Units | 54 | 7 |
| Median Property Value | $65,000 | $0 |
| Median Household Income | $41,591 | $0 |
| Monthly Housing Costs | $325 | $3 |
| Real Estate Taxes | - | - |
Property Value by Mortgage Status in Pine Point
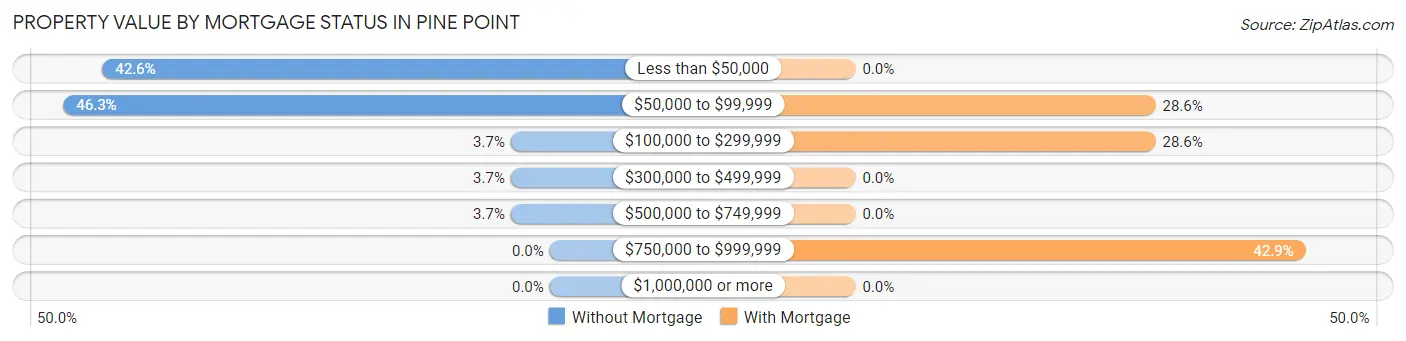
| Property Value | Without Mortgage | With Mortgage |
| Less than $50,000 | 23 (42.6%) | 0 (0.0%) |
| $50,000 to $99,999 | 25 (46.3%) | 2 (28.6%) |
| $100,000 to $299,999 | 2 (3.7%) | 2 (28.6%) |
| $300,000 to $499,999 | 2 (3.7%) | 0 (0.0%) |
| $500,000 to $749,999 | 2 (3.7%) | 0 (0.0%) |
| $750,000 to $999,999 | 0 (0.0%) | 3 (42.9%) |
| $1,000,000 or more | 0 (0.0%) | 0 (0.0%) |
| Total | 54 (100.0%) | 7 (100.0%) |
Household Income by Mortgage Status in Pine Point
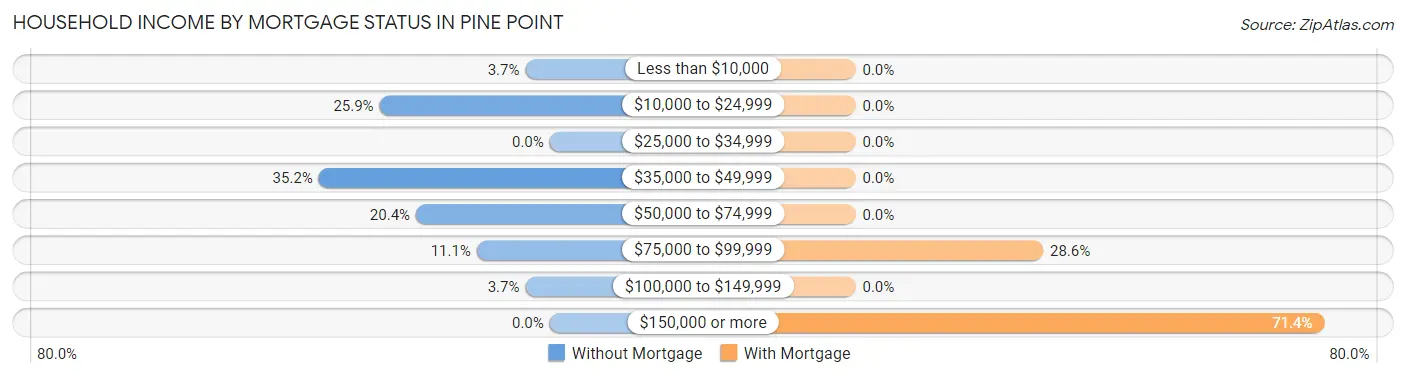
| Household Income | Without Mortgage | With Mortgage |
| Less than $10,000 | 2 (3.7%) | 0 (0.0%) |
| $10,000 to $24,999 | 14 (25.9%) | 0 (0.0%) |
| $25,000 to $34,999 | 0 (0.0%) | 0 (0.0%) |
| $35,000 to $49,999 | 19 (35.2%) | 0 (0.0%) |
| $50,000 to $74,999 | 11 (20.4%) | 0 (0.0%) |
| $75,000 to $99,999 | 6 (11.1%) | 2 (28.6%) |
| $100,000 to $149,999 | 2 (3.7%) | 0 (0.0%) |
| $150,000 or more | 0 (0.0%) | 5 (71.4%) |
| Total | 54 (100.0%) | 7 (100.0%) |
Property Value to Household Income Ratio in Pine Point
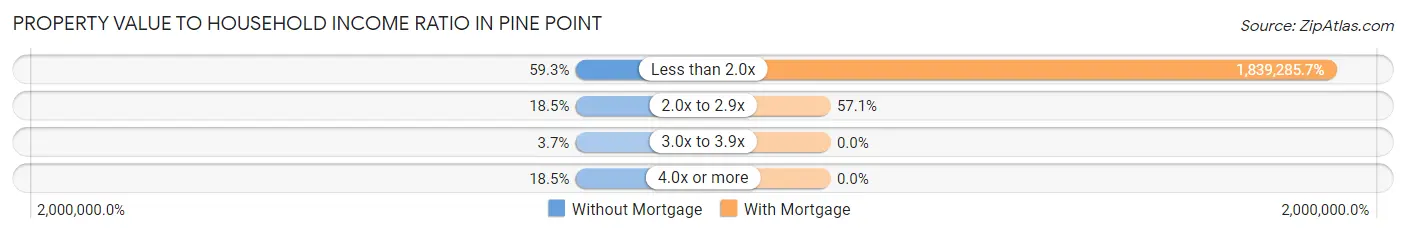
| Value-to-Income Ratio | Without Mortgage | With Mortgage |
| Less than 2.0x | 32 (59.3%) | 128,750 (1,839,285.7%) |
| 2.0x to 2.9x | 10 (18.5%) | 4 (57.1%) |
| 3.0x to 3.9x | 2 (3.7%) | 0 (0.0%) |
| 4.0x or more | 10 (18.5%) | 0 (0.0%) |
| Total | 54 (100.0%) | 7 (100.0%) |
Real Estate Taxes by Mortgage Status in Pine Point
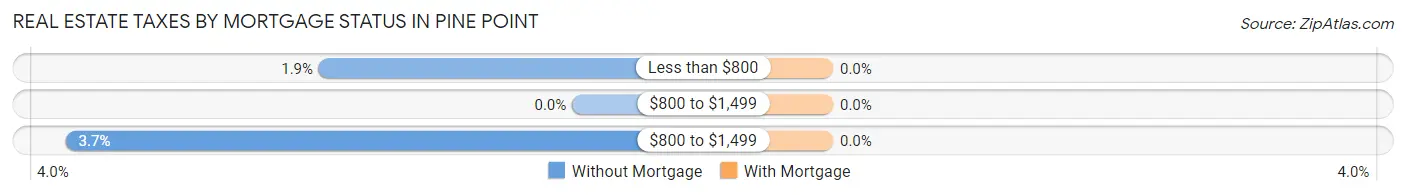
| Property Taxes | Without Mortgage | With Mortgage |
| Less than $800 | 1 (1.8%) | 0 (0.0%) |
| $800 to $1,499 | 0 (0.0%) | 0 (0.0%) |
| $800 to $1,499 | 2 (3.7%) | 0 (0.0%) |
| Total | 54 (100.0%) | 7 (100.0%) |
Health & Disability in Pine Point
Health Insurance Coverage by Age in Pine Point
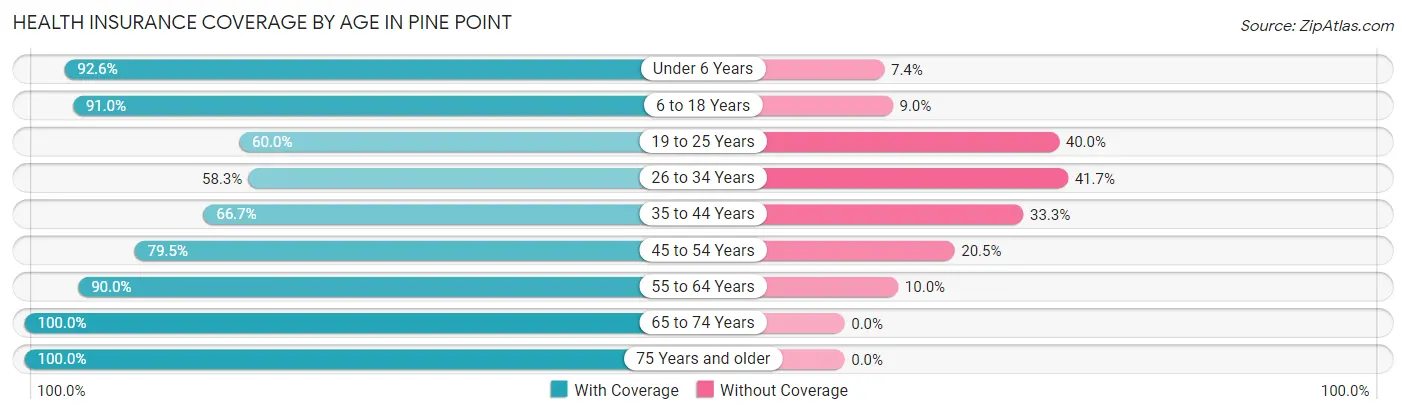
| Age Bracket | With Coverage | Without Coverage |
| Under 6 Years | 25 (92.6%) | 2 (7.4%) |
| 6 to 18 Years | 81 (91.0%) | 8 (9.0%) |
| 19 to 25 Years | 6 (60.0%) | 4 (40.0%) |
| 26 to 34 Years | 7 (58.3%) | 5 (41.7%) |
| 35 to 44 Years | 20 (66.7%) | 10 (33.3%) |
| 45 to 54 Years | 31 (79.5%) | 8 (20.5%) |
| 55 to 64 Years | 27 (90.0%) | 3 (10.0%) |
| 65 to 74 Years | 46 (100.0%) | 0 (0.0%) |
| 75 Years and older | 2 (100.0%) | 0 (0.0%) |
| Total | 245 (86.0%) | 40 (14.0%) |
Health Insurance Coverage by Citizenship Status in Pine Point
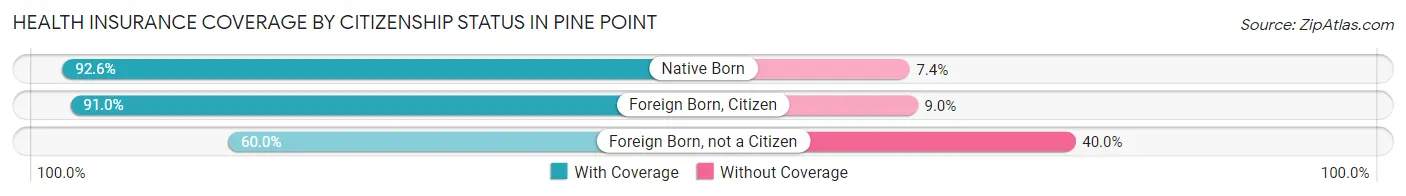
| Citizenship Status | With Coverage | Without Coverage |
| Native Born | 25 (92.6%) | 2 (7.4%) |
| Foreign Born, Citizen | 81 (91.0%) | 8 (9.0%) |
| Foreign Born, not a Citizen | 6 (60.0%) | 4 (40.0%) |
Health Insurance Coverage by Household Income in Pine Point
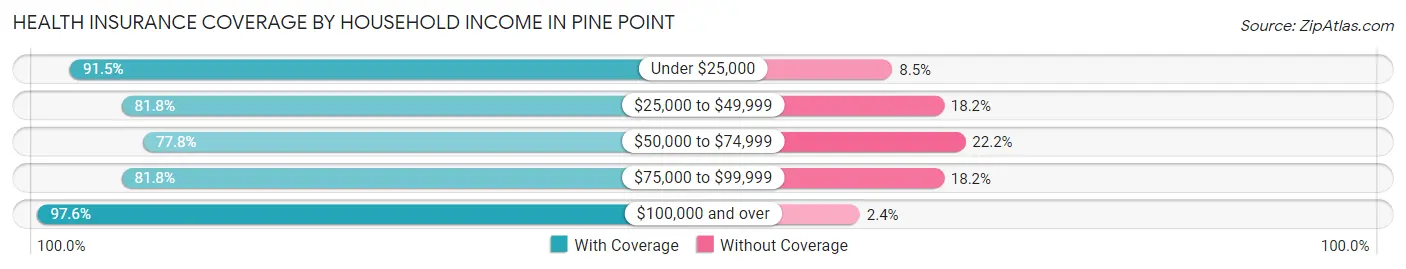
| Household Income | With Coverage | Without Coverage |
| Under $25,000 | 75 (91.5%) | 7 (8.5%) |
| $25,000 to $49,999 | 72 (81.8%) | 16 (18.2%) |
| $50,000 to $74,999 | 49 (77.8%) | 14 (22.2%) |
| $75,000 to $99,999 | 9 (81.8%) | 2 (18.2%) |
| $100,000 and over | 40 (97.6%) | 1 (2.4%) |
Public vs Private Health Insurance Coverage by Age in Pine Point
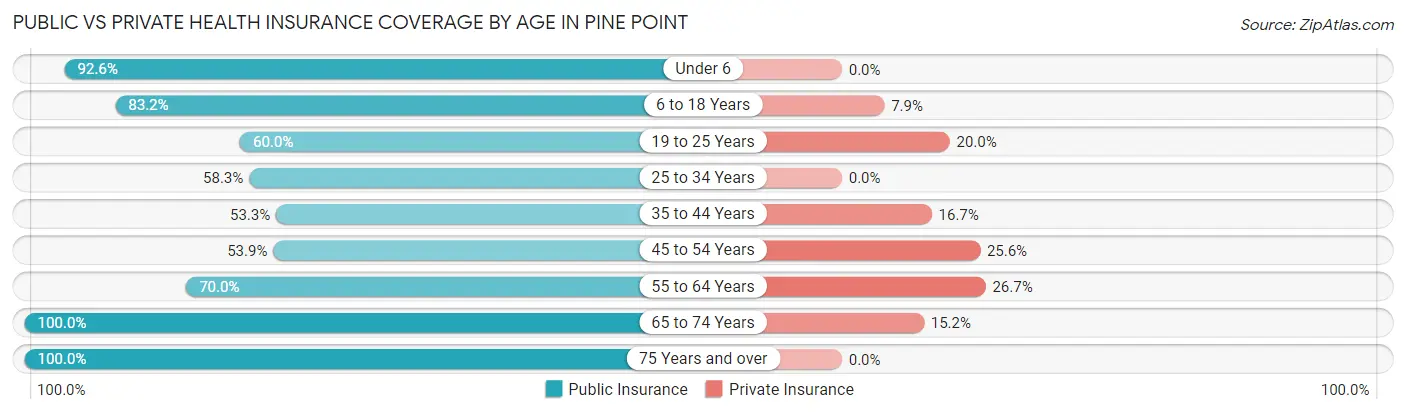
| Age Bracket | Public Insurance | Private Insurance |
| Under 6 | 25 (92.6%) | 0 (0.0%) |
| 6 to 18 Years | 74 (83.2%) | 7 (7.9%) |
| 19 to 25 Years | 6 (60.0%) | 2 (20.0%) |
| 25 to 34 Years | 7 (58.3%) | 0 (0.0%) |
| 35 to 44 Years | 16 (53.3%) | 5 (16.7%) |
| 45 to 54 Years | 21 (53.8%) | 10 (25.6%) |
| 55 to 64 Years | 21 (70.0%) | 8 (26.7%) |
| 65 to 74 Years | 46 (100.0%) | 7 (15.2%) |
| 75 Years and over | 2 (100.0%) | 0 (0.0%) |
| Total | 218 (76.5%) | 39 (13.7%) |
Disability Status by Sex by Age in Pine Point
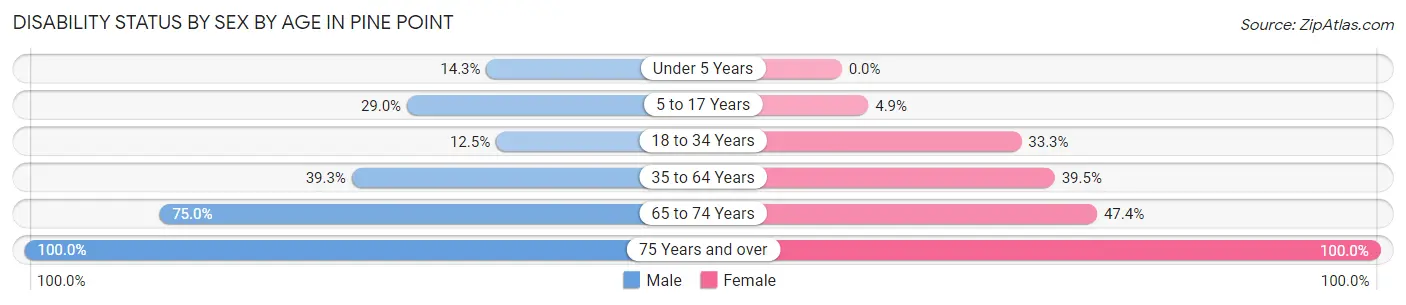
| Age Bracket | Male | Female |
| Under 5 Years | 1 (14.3%) | 0 (0.0%) |
| 5 to 17 Years | 9 (29.0%) | 3 (4.9%) |
| 18 to 34 Years | 2 (12.5%) | 4 (33.3%) |
| 35 to 64 Years | 22 (39.3%) | 17 (39.5%) |
| 65 to 74 Years | 6 (75.0%) | 18 (47.4%) |
| 75 Years and over | 1 (100.0%) | 1 (100.0%) |
Disability Class by Sex by Age in Pine Point
Disability Class: Hearing Difficulty
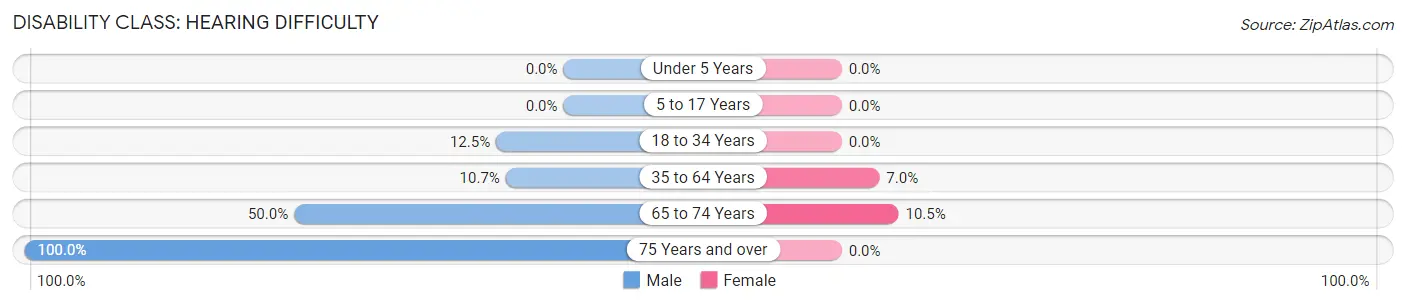
| Age Bracket | Male | Female |
| Under 5 Years | 0 (0.0%) | 0 (0.0%) |
| 5 to 17 Years | 0 (0.0%) | 0 (0.0%) |
| 18 to 34 Years | 2 (12.5%) | 0 (0.0%) |
| 35 to 64 Years | 6 (10.7%) | 3 (7.0%) |
| 65 to 74 Years | 4 (50.0%) | 4 (10.5%) |
| 75 Years and over | 1 (100.0%) | 0 (0.0%) |
Disability Class: Vision Difficulty
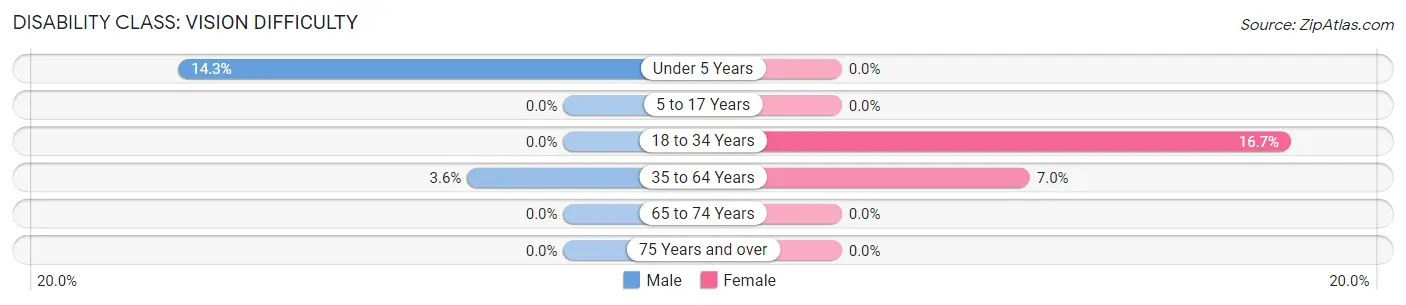
| Age Bracket | Male | Female |
| Under 5 Years | 1 (14.3%) | 0 (0.0%) |
| 5 to 17 Years | 0 (0.0%) | 0 (0.0%) |
| 18 to 34 Years | 0 (0.0%) | 2 (16.7%) |
| 35 to 64 Years | 2 (3.6%) | 3 (7.0%) |
| 65 to 74 Years | 0 (0.0%) | 0 (0.0%) |
| 75 Years and over | 0 (0.0%) | 0 (0.0%) |
Disability Class: Cognitive Difficulty
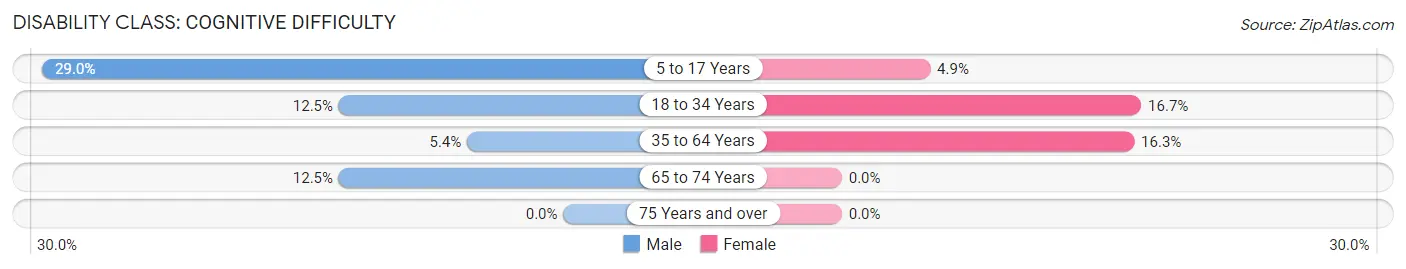
| Age Bracket | Male | Female |
| 5 to 17 Years | 9 (29.0%) | 3 (4.9%) |
| 18 to 34 Years | 2 (12.5%) | 2 (16.7%) |
| 35 to 64 Years | 3 (5.4%) | 7 (16.3%) |
| 65 to 74 Years | 1 (12.5%) | 0 (0.0%) |
| 75 Years and over | 0 (0.0%) | 0 (0.0%) |
Disability Class: Ambulatory Difficulty
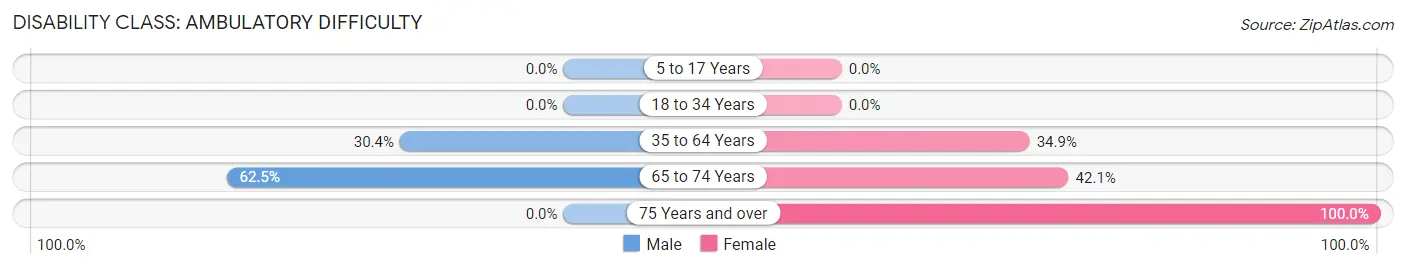
| Age Bracket | Male | Female |
| 5 to 17 Years | 0 (0.0%) | 0 (0.0%) |
| 18 to 34 Years | 0 (0.0%) | 0 (0.0%) |
| 35 to 64 Years | 17 (30.4%) | 15 (34.9%) |
| 65 to 74 Years | 5 (62.5%) | 16 (42.1%) |
| 75 Years and over | 0 (0.0%) | 1 (100.0%) |
Disability Class: Self-Care Difficulty
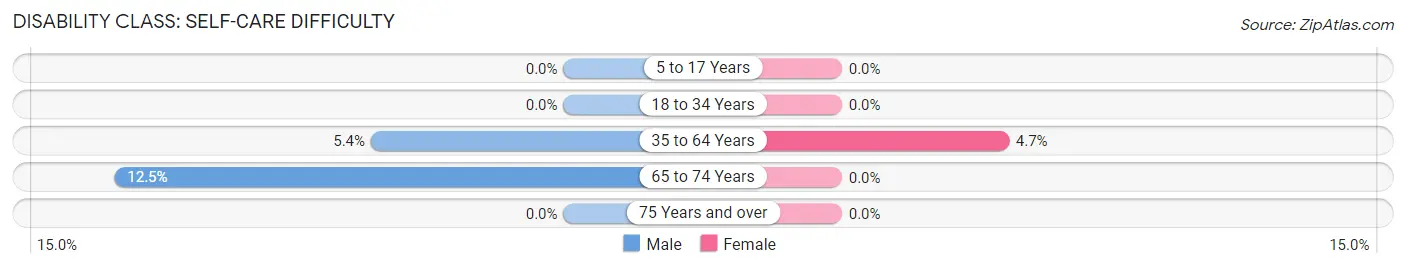
| Age Bracket | Male | Female |
| 5 to 17 Years | 0 (0.0%) | 0 (0.0%) |
| 18 to 34 Years | 0 (0.0%) | 0 (0.0%) |
| 35 to 64 Years | 3 (5.4%) | 2 (4.6%) |
| 65 to 74 Years | 1 (12.5%) | 0 (0.0%) |
| 75 Years and over | 0 (0.0%) | 0 (0.0%) |
Technology Access in Pine Point
Computing Device Access in Pine Point
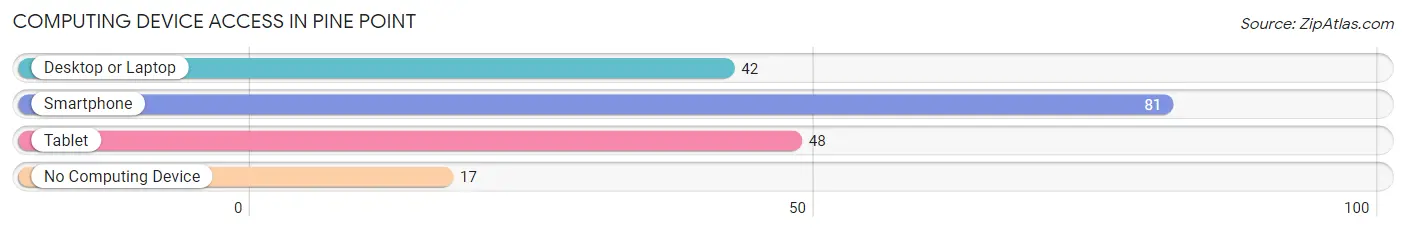
| Device Type | # Households | % Households |
| Desktop or Laptop | 42 | 42.0% |
| Smartphone | 81 | 81.0% |
| Tablet | 48 | 48.0% |
| No Computing Device | 17 | 17.0% |
| Total | 100 | 100.0% |
Internet Access in Pine Point
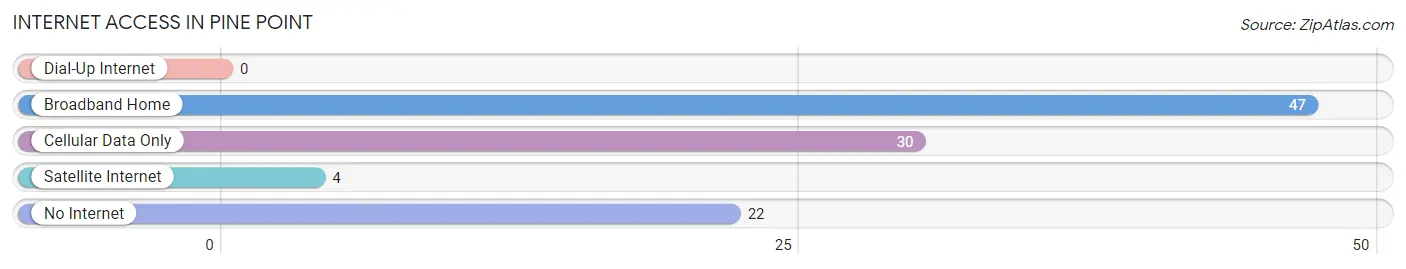
| Internet Type | # Households | % Households |
| Dial-Up Internet | 0 | 0.0% |
| Broadband Home | 47 | 47.0% |
| Cellular Data Only | 30 | 30.0% |
| Satellite Internet | 4 | 4.0% |
| No Internet | 22 | 22.0% |
| Total | 100 | 100.0% |
Pine Point Summary
Pine Point is a small unincorporated community located in St. Louis County, Minnesota, United States. It is situated on the north shore of Lake Vermilion, approximately 20 miles northeast of the city of Duluth. The population of Pine Point was estimated to be around 200 people in 2000.
History
The area that is now Pine Point was first settled in the late 1800s by Finnish immigrants. The first permanent settlers were the families of John and Mary Kivimaki, who arrived in 1891. The Kivimaki family established a homestead and began farming the land. Other Finnish families soon followed, and the area became known as “Finn Town”.
In the early 1900s, the area began to attract more settlers, including a number of Swedish immigrants. The community was officially established in 1906, when the post office was established. The name “Pine Point” was chosen to reflect the abundance of pine trees in the area.
Geography
Pine Point is located in St. Louis County, Minnesota, approximately 20 miles northeast of the city of Duluth. It is situated on the north shore of Lake Vermilion, a large lake that is part of the Vermilion River system. The area is characterized by rolling hills, dense forests, and numerous lakes and streams.
Economy
The economy of Pine Point is largely based on tourism and recreation. The area is popular with anglers, hunters, and other outdoor enthusiasts. There are several resorts and lodges in the area, as well as a number of campgrounds. The area is also home to a number of small businesses, including a general store, a gas station, and a restaurant.
Demographics
The population of Pine Point was estimated to be around 200 people in 2000. The racial makeup of the town was 97.5% White, 0.5% Native American, and 2.0% from two or more races. The median household income was $37,500, and the median family income was $41,250. The per capita income was $17,500.
Conclusion
Pine Point is a small unincorporated community located in St. Louis County, Minnesota. It is situated on the north shore of Lake Vermilion, and is home to around 200 people. The economy of Pine Point is largely based on tourism and recreation, and the area is popular with anglers, hunters, and other outdoor enthusiasts. The population of Pine Point is predominantly white, with a median household income of $37,500 and a median family income of $41,250.
Common Questions
What is the Total Population of Pine Point?
Total Population of Pine Point is 285.
What is the Total Male Population of Pine Point?
Total Male Population of Pine Point is 119.
What is the Total Female Population of Pine Point?
Total Female Population of Pine Point is 166.
What is the Ratio of Males per 100 Females in Pine Point?
There are 71.69 Males per 100 Females in Pine Point.
What is the Ratio of Females per 100 Males in Pine Point?
There are 139.50 Females per 100 Males in Pine Point.
What is the Median Population Age in Pine Point?
Median Population Age in Pine Point is 38.1 Years.
What is the Average Family Size in Pine Point
Average Family Size in Pine Point is 3.3 People.
What is the Average Household Size in Pine Point
Average Household Size in Pine Point is 2.9 People.
What is Per Capita Income in Pine Point?
Per Capita income in Pine Point is $14,784.
What is the Median Family Income in Pine Point?
Median Family Income in Pine Point is $41,364.
What is the Median Household income in Pine Point?
Median Household Income in Pine Point is $40,455.
What is Inequality or Gini Index in Pine Point?
Inequality or Gini Index in Pine Point is 0.41.
How Large is the Labor Force in Pine Point?
There are 75 People in the Labor Forcein in Pine Point.
What is the Percentage of People in the Labor Force in Pine Point?
41.2% of People are in the Labor Force in Pine Point.
What is the Unemployment Rate in Pine Point?
Unemployment Rate in Pine Point is 22.7%.