Backus, MN
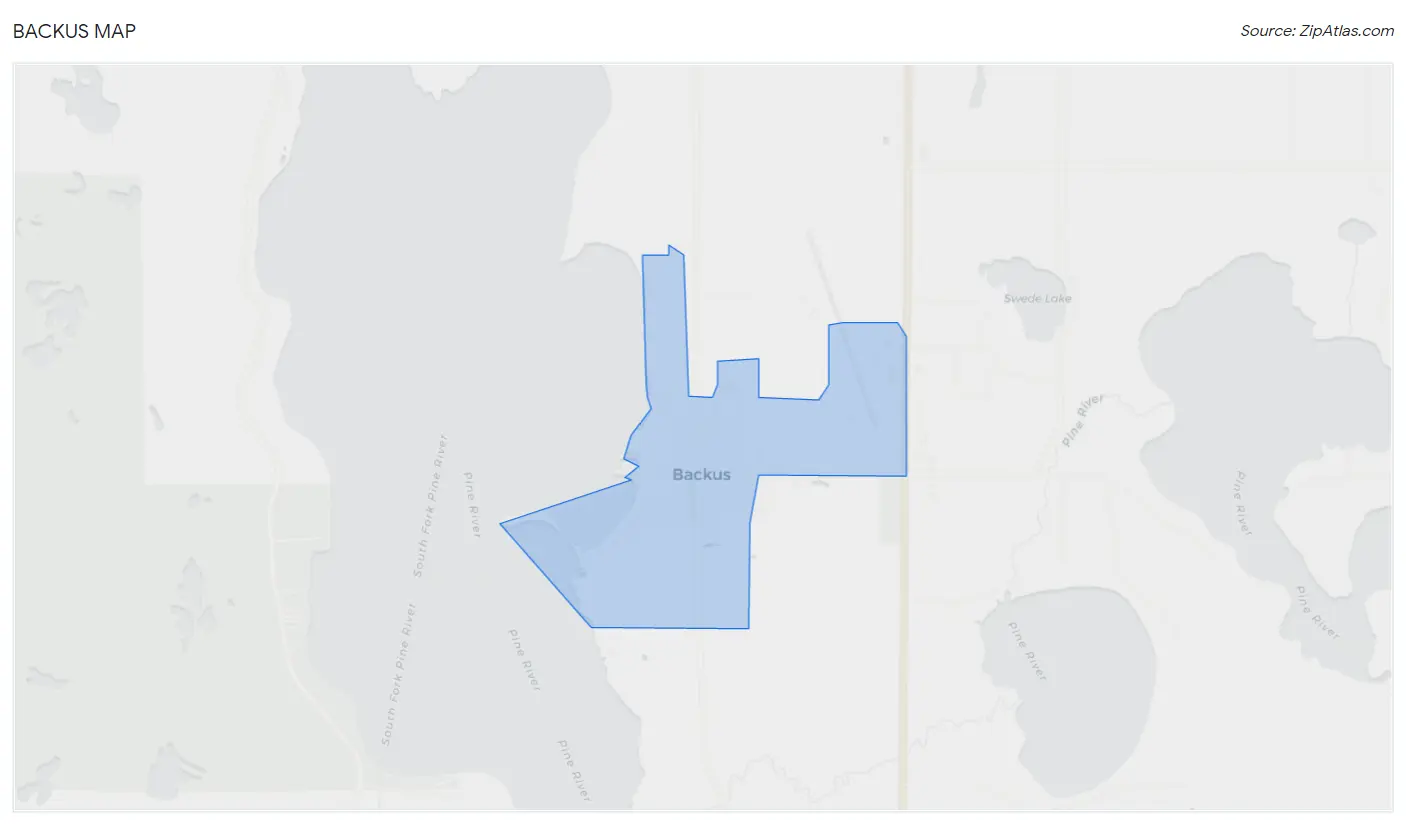
Backus Map
Backus Overview
320
TOTAL POPULATION
181
MALE POPULATION
139
FEMALE POPULATION
130.22
MALES / 100 FEMALES
76.80
FEMALES / 100 MALES
44.0
MEDIAN AGE
3.0
AVG FAMILY SIZE
2.6
AVG HOUSEHOLD SIZE
$25,001
PER CAPITA INCOME
$50,417
AVG FAMILY INCOME
$49,250
AVG HOUSEHOLD INCOME
39.6%
WAGE / INCOME GAP [ % ]
60.4¢/ $1
WAGE / INCOME GAP [ $ ]
0.39
INEQUALITY / GINI INDEX
132
LABOR FORCE [ PEOPLE ]
57.1%
PERCENT IN LABOR FORCE
1.5%
UNEMPLOYMENT RATE
Backus Zip Codes
Backus Area Codes
Race in Backus
The most populous races in Backus are White / Caucasian (254 | 79.4%), Two or more Races (46 | 14.4%), and Black / African American (19 | 5.9%).
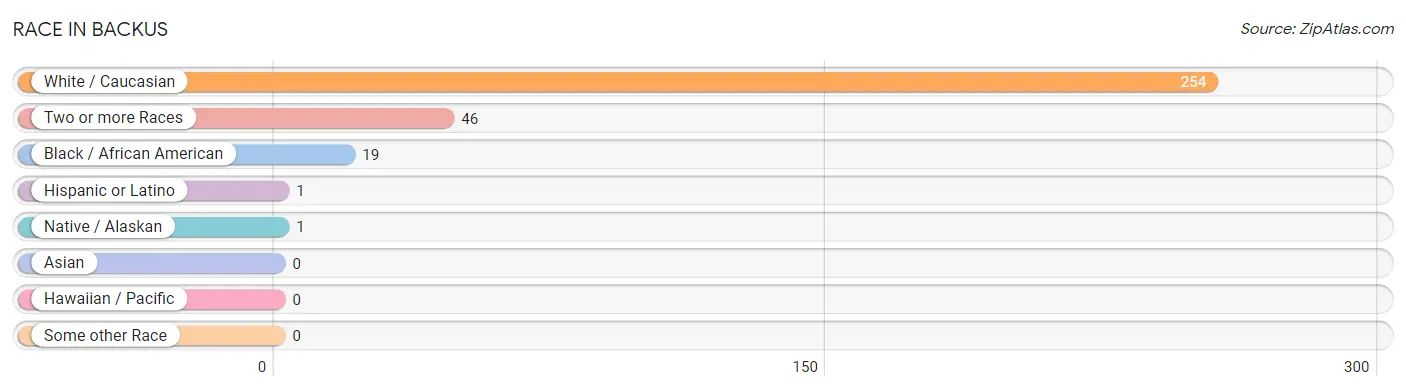
| Race | # Population | % Population |
| Asian | 0 | 0.0% |
| Black / African American | 19 | 5.9% |
| Hawaiian / Pacific | 0 | 0.0% |
| Hispanic or Latino | 1 | 0.3% |
| Native / Alaskan | 1 | 0.3% |
| White / Caucasian | 254 | 79.4% |
| Two or more Races | 46 | 14.4% |
| Some other Race | 0 | 0.0% |
| Total | 320 | 100.0% |
Ancestry in Backus
The most populous ancestries reported in Backus are German (55 | 17.2%), Norwegian (29 | 9.1%), Irish (28 | 8.7%), American (19 | 5.9%), and English (18 | 5.6%), together accounting for 46.6% of all Backus residents.
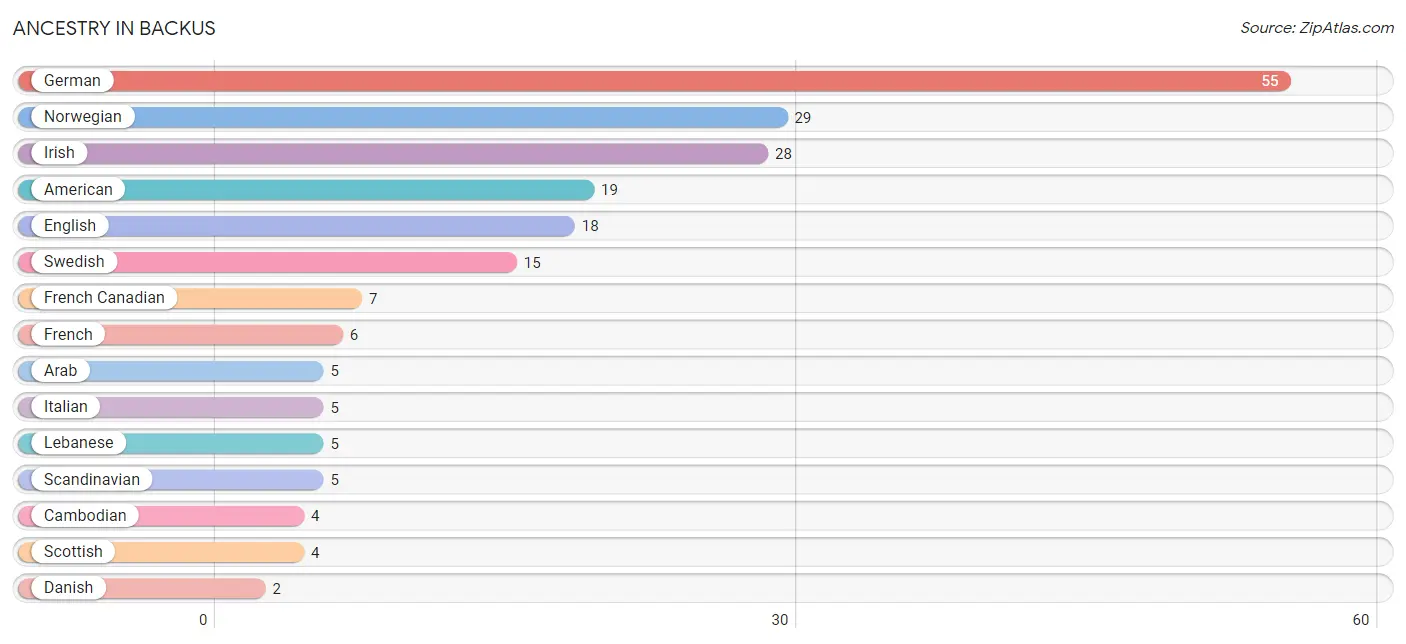
| Ancestry | # Population | % Population |
| American | 19 | 5.9% |
| Arab | 5 | 1.6% |
| Austrian | 1 | 0.3% |
| Cambodian | 4 | 1.3% |
| Chippewa | 1 | 0.3% |
| Danish | 2 | 0.6% |
| Dutch | 2 | 0.6% |
| English | 18 | 5.6% |
| French | 6 | 1.9% |
| French Canadian | 7 | 2.2% |
| German | 55 | 17.2% |
| Irish | 28 | 8.7% |
| Italian | 5 | 1.6% |
| Lebanese | 5 | 1.6% |
| Mexican | 1 | 0.3% |
| Northern European | 2 | 0.6% |
| Norwegian | 29 | 9.1% |
| Russian | 2 | 0.6% |
| Scandinavian | 5 | 1.6% |
| Scottish | 4 | 1.3% |
| Swedish | 15 | 4.7% | View All 21 Rows |
Immigrants in Backus
The most numerous immigrant groups reported in Backus came from Europe (9 | 2.8%), Germany (9 | 2.8%), Western Europe (9 | 2.8%), Central America (1 | 0.3%), and Latin America (1 | 0.3%), together accounting for 9.1% of all Backus residents.
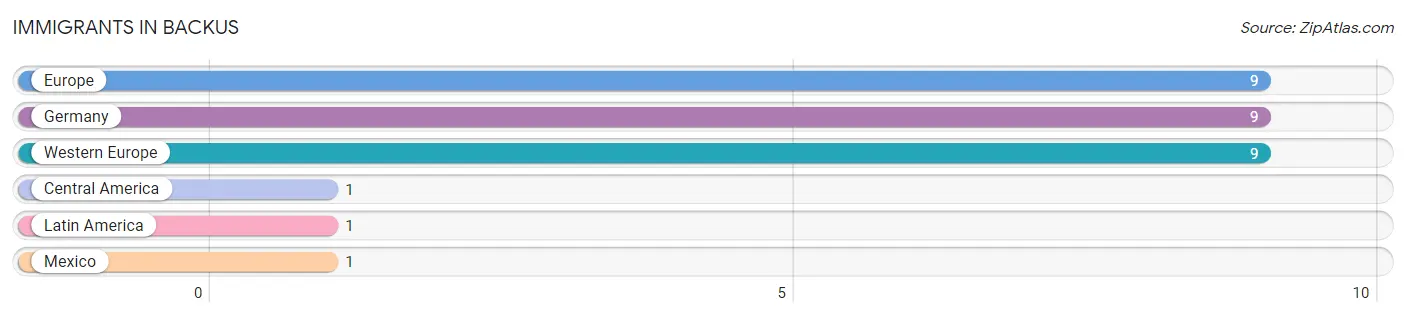
| Immigration Origin | # Population | % Population |
| Central America | 1 | 0.3% |
| Europe | 9 | 2.8% |
| Germany | 9 | 2.8% |
| Latin America | 1 | 0.3% |
| Mexico | 1 | 0.3% |
| Western Europe | 9 | 2.8% | View All 6 Rows |
Sex and Age in Backus
Sex and Age in Backus
The most populous age groups in Backus are Under 5 Years (35 | 19.3%) for men and 25 to 29 Years (19 | 13.7%) for women.
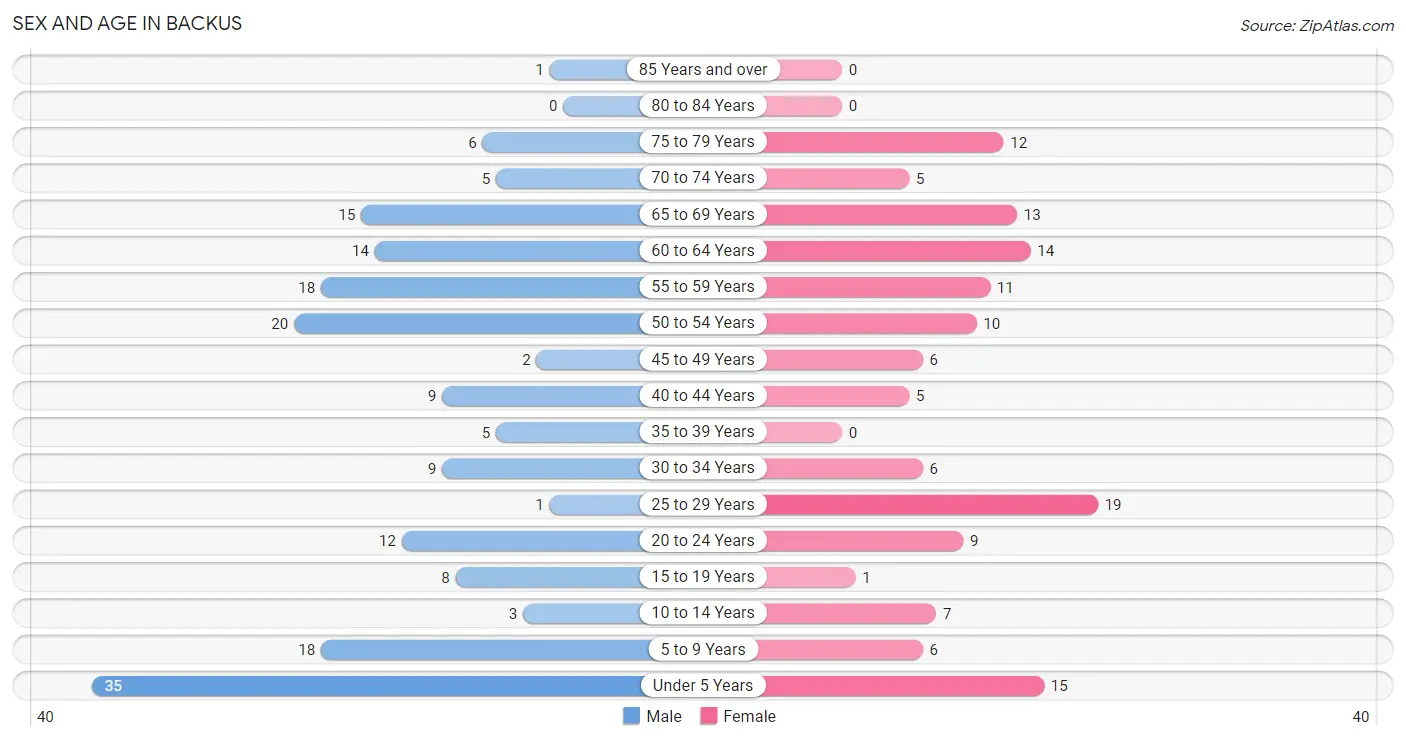
| Age Bracket | Male | Female |
| Under 5 Years | 35 (19.3%) | 15 (10.8%) |
| 5 to 9 Years | 18 (9.9%) | 6 (4.3%) |
| 10 to 14 Years | 3 (1.7%) | 7 (5.0%) |
| 15 to 19 Years | 8 (4.4%) | 1 (0.7%) |
| 20 to 24 Years | 12 (6.6%) | 9 (6.5%) |
| 25 to 29 Years | 1 (0.5%) | 19 (13.7%) |
| 30 to 34 Years | 9 (5.0%) | 6 (4.3%) |
| 35 to 39 Years | 5 (2.8%) | 0 (0.0%) |
| 40 to 44 Years | 9 (5.0%) | 5 (3.6%) |
| 45 to 49 Years | 2 (1.1%) | 6 (4.3%) |
| 50 to 54 Years | 20 (11.1%) | 10 (7.2%) |
| 55 to 59 Years | 18 (9.9%) | 11 (7.9%) |
| 60 to 64 Years | 14 (7.7%) | 14 (10.1%) |
| 65 to 69 Years | 15 (8.3%) | 13 (9.3%) |
| 70 to 74 Years | 5 (2.8%) | 5 (3.6%) |
| 75 to 79 Years | 6 (3.3%) | 12 (8.6%) |
| 80 to 84 Years | 0 (0.0%) | 0 (0.0%) |
| 85 Years and over | 1 (0.5%) | 0 (0.0%) |
| Total | 181 (100.0%) | 139 (100.0%) |
Families and Households in Backus
Median Family Size in Backus
The median family size in Backus is 2.96 persons per family, with single male/father families (19 | 27.1%) accounting for the largest median family size of 3.79 persons per family. On the other hand, married-couple families (37 | 52.9%) represent the smallest median family size with 2.57 persons per family.
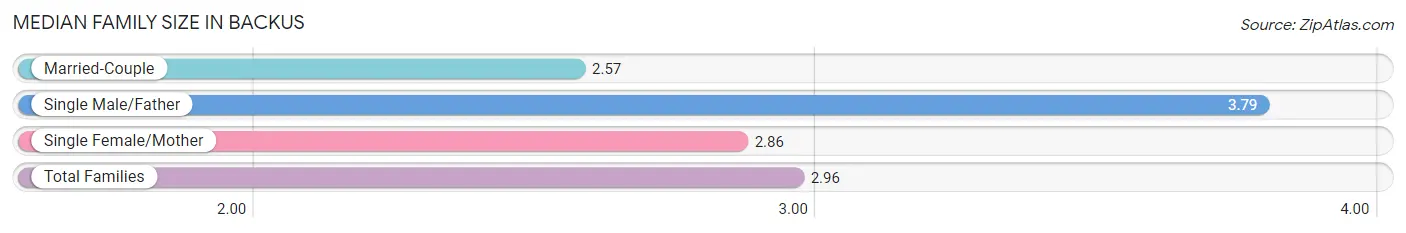
| Family Type | # Families | Family Size |
| Married-Couple | 37 (52.9%) | 2.57 |
| Single Male/Father | 19 (27.1%) | 3.79 |
| Single Female/Mother | 14 (20.0%) | 2.86 |
| Total Families | 70 (100.0%) | 2.96 |
Median Household Size in Backus
The median household size in Backus is 2.62 persons per household, with single male/father households (19 | 15.6%) accounting for the largest median household size of 4.89 persons per household. non-family households (52 | 42.6%) represent the smallest median household size with 1.44 persons per household.
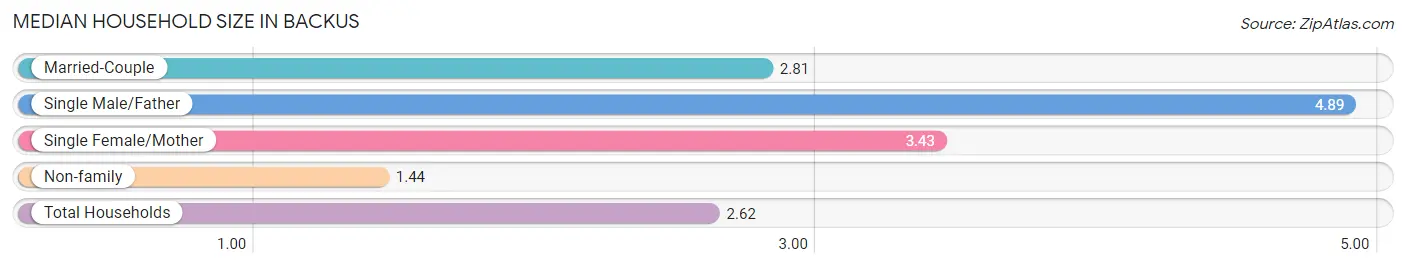
| Household Type | # Households | Household Size |
| Married-Couple | 37 (30.3%) | 2.81 |
| Single Male/Father | 19 (15.6%) | 4.89 |
| Single Female/Mother | 14 (11.5%) | 3.43 |
| Non-family | 52 (42.6%) | 1.44 |
| Total Households | 122 (100.0%) | 2.62 |
Household Size by Marriage Status in Backus
Out of a total of 122 households in Backus, 70 (57.4%) are family households, while 52 (42.6%) are nonfamily households. The most numerous type of family households are 2-person households, comprising 27, and the most common type of nonfamily households are 1-person households, comprising 39.
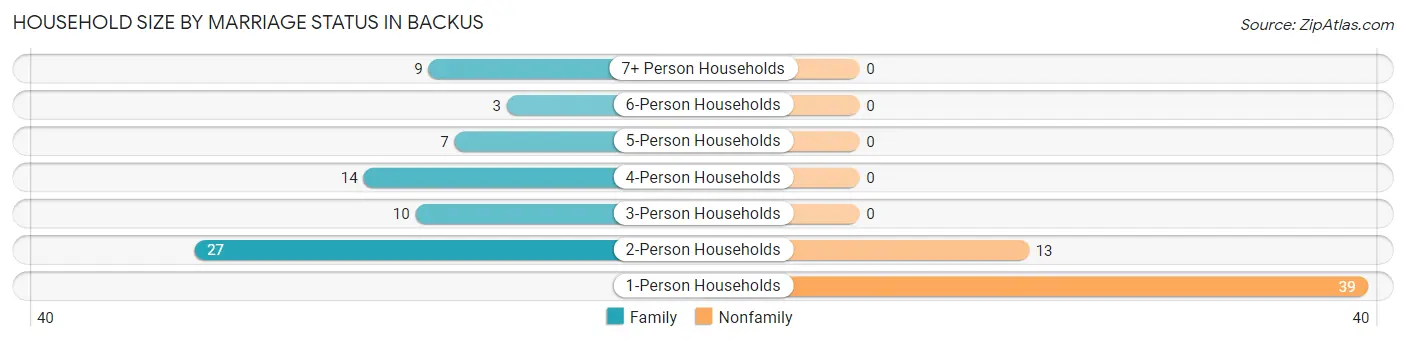
| Household Size | Family Households | Nonfamily Households |
| 1-Person Households | - | 39 (32.0%) |
| 2-Person Households | 27 (22.1%) | 13 (10.7%) |
| 3-Person Households | 10 (8.2%) | 0 (0.0%) |
| 4-Person Households | 14 (11.5%) | 0 (0.0%) |
| 5-Person Households | 7 (5.7%) | 0 (0.0%) |
| 6-Person Households | 3 (2.5%) | 0 (0.0%) |
| 7+ Person Households | 9 (7.4%) | 0 (0.0%) |
| Total | 70 (57.4%) | 52 (42.6%) |
Female Fertility in Backus
Fertility by Age in Backus
Average fertility rate in Backus is 87.0 births per 1,000 women. Women in the age bracket of 20 to 34 years have the highest fertility rate with 118.0 births per 1,000 women. Women in the age bracket of 20 to 34 years acount for 100.0% of all women with births.
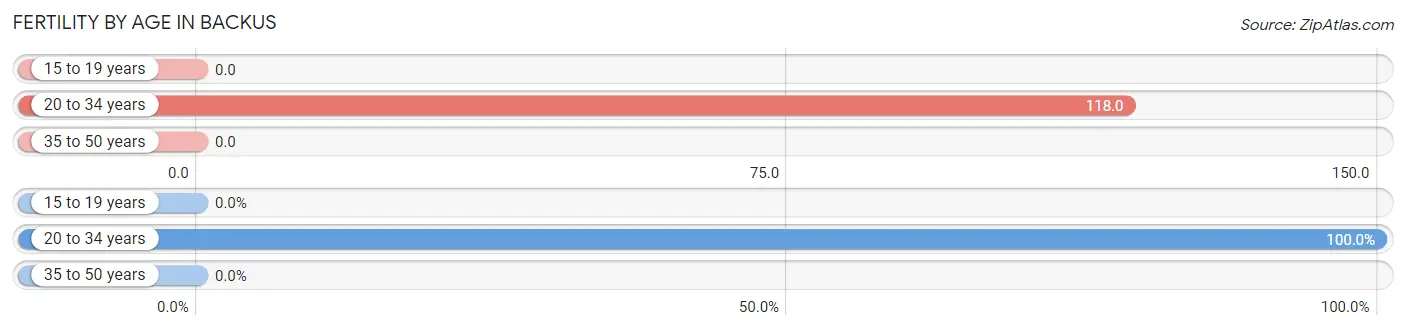
| Age Bracket | Women with Births | Births / 1,000 Women |
| 15 to 19 years | 0 (0.0%) | 0.0 |
| 20 to 34 years | 4 (100.0%) | 118.0 |
| 35 to 50 years | 0 (0.0%) | 0.0 |
| Total | 4 (100.0%) | 87.0 |
Fertility by Age by Marriage Status in Backus
50.0% of women with births (4) in Backus are married. The highest percentage of unmarried women with births falls into 20 to 34 years age bracket with 50.0% of them unmarried at the time of birth, while the lowest percentage of unmarried women with births belong to 20 to 34 years age bracket with 50.0% of them unmarried.
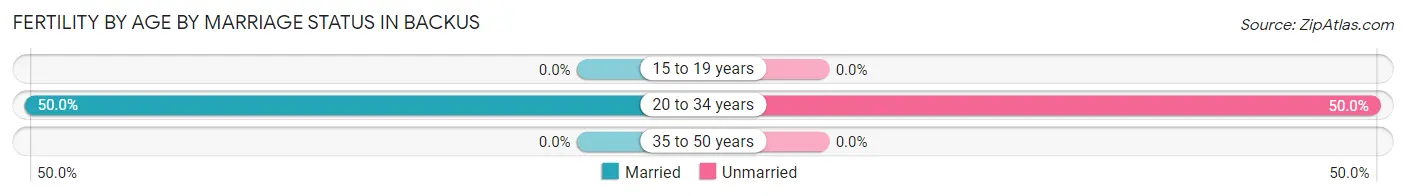
| Age Bracket | Married | Unmarried |
| 15 to 19 years | 0 (0.0%) | 0 (0.0%) |
| 20 to 34 years | 2 (50.0%) | 2 (50.0%) |
| 35 to 50 years | 0 (0.0%) | 0 (0.0%) |
| Total | 2 (50.0%) | 2 (50.0%) |
Fertility by Education in Backus
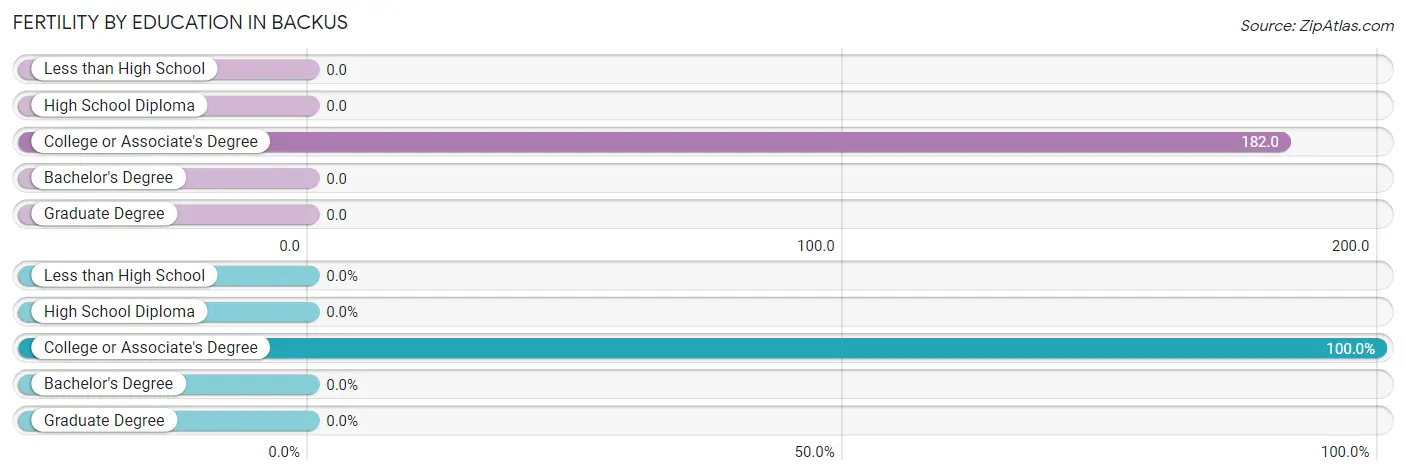
| Educational Attainment | Women with Births | Births / 1,000 Women |
| Less than High School | 0 (0.0%) | 0.0 |
| High School Diploma | 0 (0.0%) | 0.0 |
| College or Associate's Degree | 4 (100.0%) | 182.0 |
| Bachelor's Degree | 0 (0.0%) | 0.0 |
| Graduate Degree | 0 (0.0%) | 0.0 |
| Total | 4 (100.0%) | 87.0 |
Fertility by Education by Marriage Status in Backus
50.0% of women with births in Backus are unmarried. Women with the educational attainment of college or associate's degree are most likely to be married with 50.0% of them married at childbirth, while women with the educational attainment of college or associate's degree are least likely to be married with 50.0% of them unmarried at childbirth.
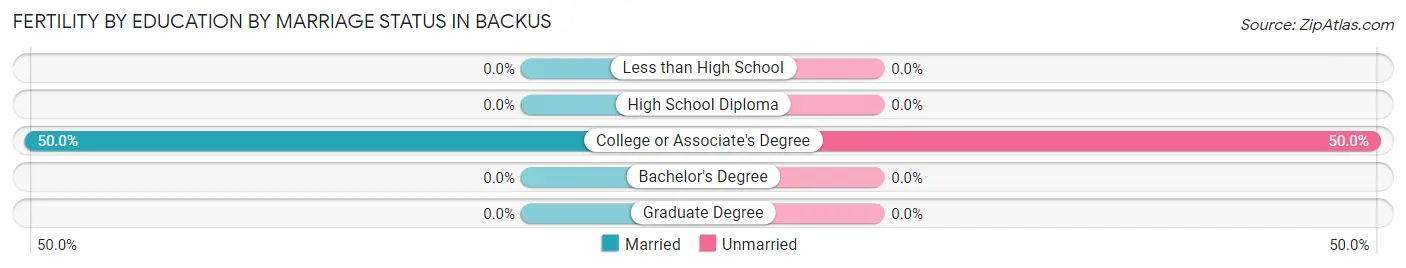
| Educational Attainment | Married | Unmarried |
| Less than High School | 0 (0.0%) | 0 (0.0%) |
| High School Diploma | 0 (0.0%) | 0 (0.0%) |
| College or Associate's Degree | 2 (50.0%) | 2 (50.0%) |
| Bachelor's Degree | 0 (0.0%) | 0 (0.0%) |
| Graduate Degree | 0 (0.0%) | 0 (0.0%) |
| Total | 2 (50.0%) | 2 (50.0%) |
Income in Backus
Income Overview in Backus
Per Capita Income in Backus is $25,001, while median incomes of families and households are $50,417 and $49,250 respectively.
| Characteristic | Number | Measure |
| Per Capita Income | 320 | $25,001 |
| Median Family Income | 70 | $50,417 |
| Mean Family Income | 70 | $56,364 |
| Median Household Income | 122 | $49,250 |
| Mean Household Income | 122 | $63,754 |
| Income Deficit | 70 | $0 |
| Wage / Income Gap (%) | 320 | 39.65% |
| Wage / Income Gap ($) | 320 | 60.35¢ per $1 |
| Gini / Inequality Index | 320 | 0.39 |
Earnings by Sex in Backus
Average Earnings in Backus are $36,477, $45,104 for men and $27,222 for women, a difference of 39.7%.
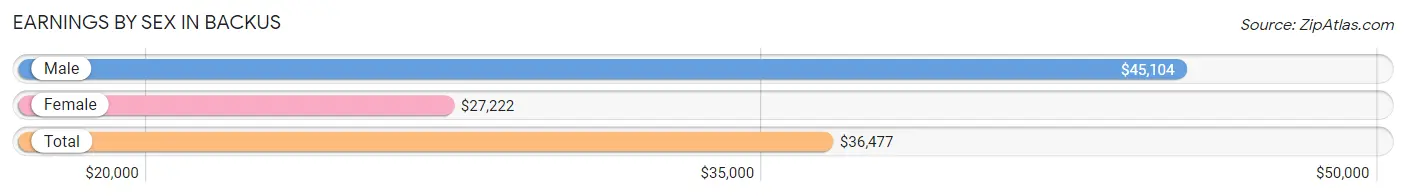
| Sex | Number | Average Earnings |
| Male | 83 (59.7%) | $45,104 |
| Female | 56 (40.3%) | $27,222 |
| Total | 139 (100.0%) | $36,477 |
Earnings by Sex by Income Bracket in Backus
The most common earnings brackets in Backus are $65,000 to $74,999 for men (19 | 22.9%) and $25,000 to $29,999 for women (15 | 26.8%).
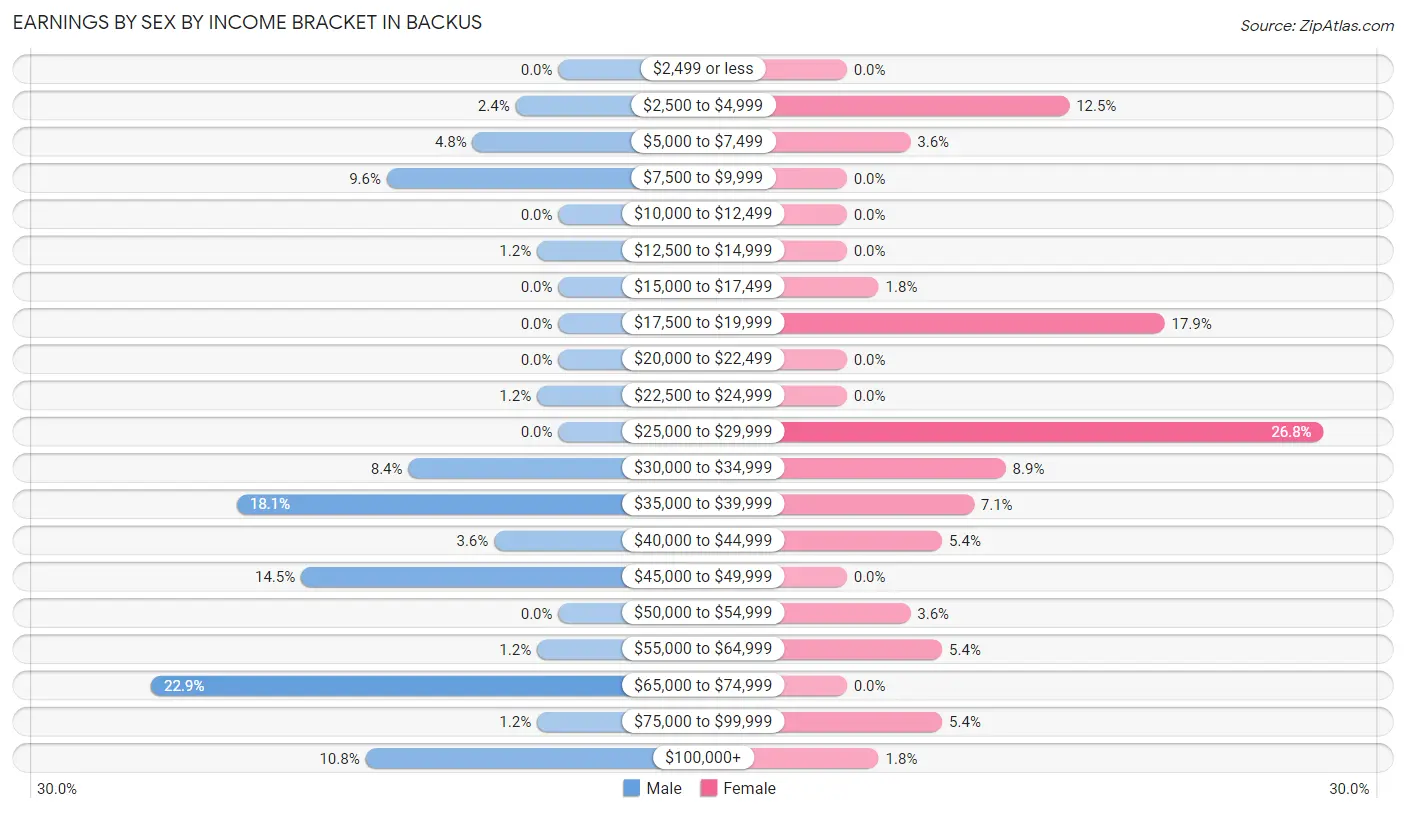
| Income | Male | Female |
| $2,499 or less | 0 (0.0%) | 0 (0.0%) |
| $2,500 to $4,999 | 2 (2.4%) | 7 (12.5%) |
| $5,000 to $7,499 | 4 (4.8%) | 2 (3.6%) |
| $7,500 to $9,999 | 8 (9.6%) | 0 (0.0%) |
| $10,000 to $12,499 | 0 (0.0%) | 0 (0.0%) |
| $12,500 to $14,999 | 1 (1.2%) | 0 (0.0%) |
| $15,000 to $17,499 | 0 (0.0%) | 1 (1.8%) |
| $17,500 to $19,999 | 0 (0.0%) | 10 (17.9%) |
| $20,000 to $22,499 | 0 (0.0%) | 0 (0.0%) |
| $22,500 to $24,999 | 1 (1.2%) | 0 (0.0%) |
| $25,000 to $29,999 | 0 (0.0%) | 15 (26.8%) |
| $30,000 to $34,999 | 7 (8.4%) | 5 (8.9%) |
| $35,000 to $39,999 | 15 (18.1%) | 4 (7.1%) |
| $40,000 to $44,999 | 3 (3.6%) | 3 (5.4%) |
| $45,000 to $49,999 | 12 (14.5%) | 0 (0.0%) |
| $50,000 to $54,999 | 0 (0.0%) | 2 (3.6%) |
| $55,000 to $64,999 | 1 (1.2%) | 3 (5.4%) |
| $65,000 to $74,999 | 19 (22.9%) | 0 (0.0%) |
| $75,000 to $99,999 | 1 (1.2%) | 3 (5.4%) |
| $100,000+ | 9 (10.8%) | 1 (1.8%) |
| Total | 83 (100.0%) | 56 (100.0%) |
Earnings by Sex by Educational Attainment in Backus
Average earnings in Backus are $46,528 for men and $28,542 for women, a difference of 38.7%. Men with an educational attainment of high school diploma enjoy the highest average annual earnings of $70,329, while those with college or associate's degree education earn the least with $39,167. Women with an educational attainment of high school diploma earn the most with the average annual earnings of $35,313, while those with college or associate's degree education have the smallest earnings of $28,542.
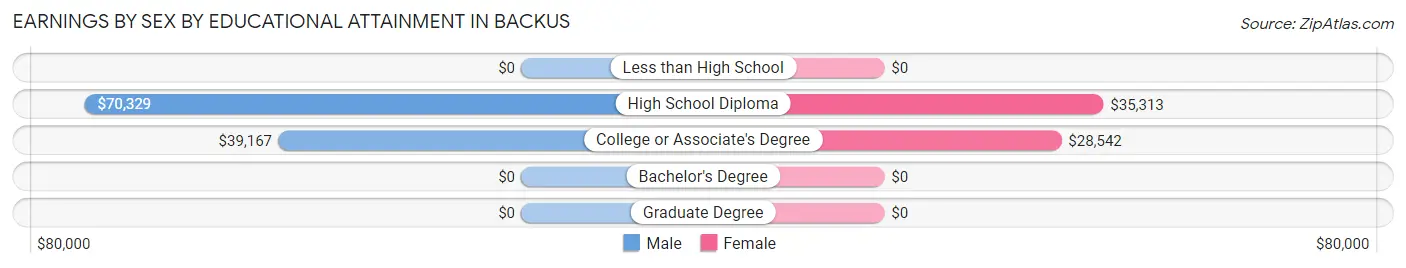
| Educational Attainment | Male Income | Female Income |
| Less than High School | - | - |
| High School Diploma | $70,329 | $35,313 |
| College or Associate's Degree | $39,167 | $28,542 |
| Bachelor's Degree | - | - |
| Graduate Degree | - | - |
| Total | $46,528 | $28,542 |
Family Income in Backus
Family Income Brackets in Backus
According to the Backus family income data, there are 28 families falling into the $50,000 to $74,999 income range, which is the most common income bracket and makes up 40.0% of all families.
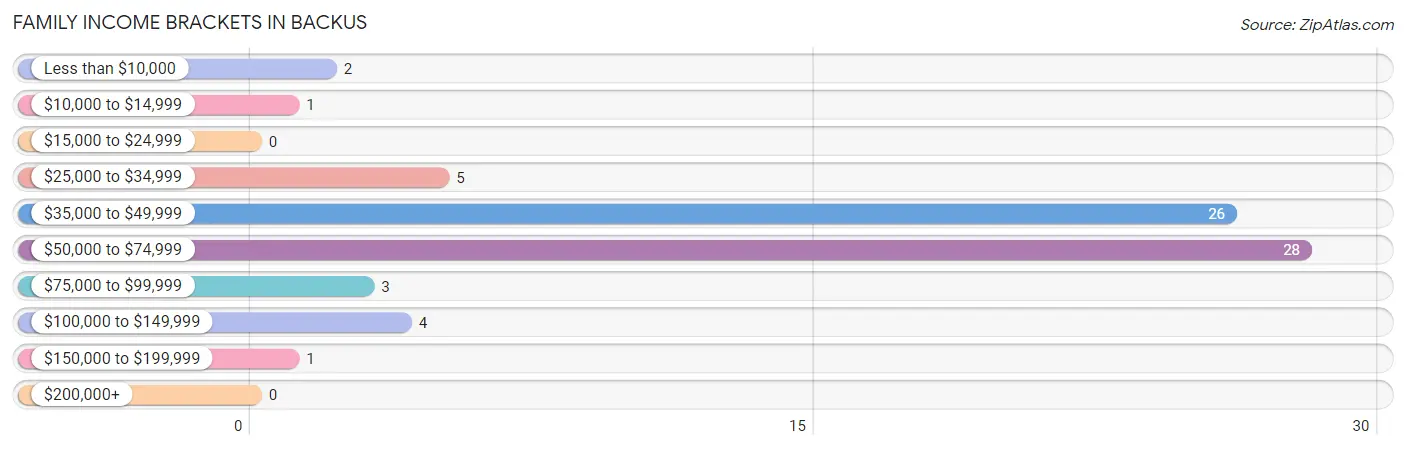
| Income Bracket | # Families | % Families |
| Less than $10,000 | 2 | 2.9% |
| $10,000 to $14,999 | 1 | 1.4% |
| $15,000 to $24,999 | 0 | 0.0% |
| $25,000 to $34,999 | 5 | 7.1% |
| $35,000 to $49,999 | 26 | 37.1% |
| $50,000 to $74,999 | 28 | 40.0% |
| $75,000 to $99,999 | 3 | 4.3% |
| $100,000 to $149,999 | 4 | 5.7% |
| $150,000 to $199,999 | 1 | 1.4% |
| $200,000+ | 0 | 0.0% |
Family Income by Famaliy Size in Backus
2-person families (33 | 47.1%) account for the highest median family income in Backus with $53,750 per family, while 2-person families (33 | 47.1%) have the highest median income of $26,875 per family member.
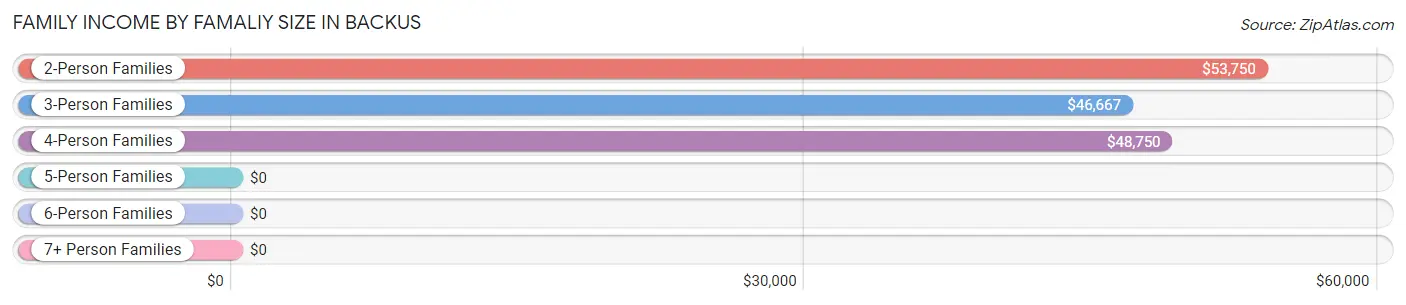
| Income Bracket | # Families | Median Income |
| 2-Person Families | 33 (47.1%) | $53,750 |
| 3-Person Families | 12 (17.1%) | $46,667 |
| 4-Person Families | 14 (20.0%) | $48,750 |
| 5-Person Families | 4 (5.7%) | $0 |
| 6-Person Families | 7 (10.0%) | $0 |
| 7+ Person Families | 0 (0.0%) | $0 |
| Total | 70 (100.0%) | $50,417 |
Family Income by Number of Earners in Backus
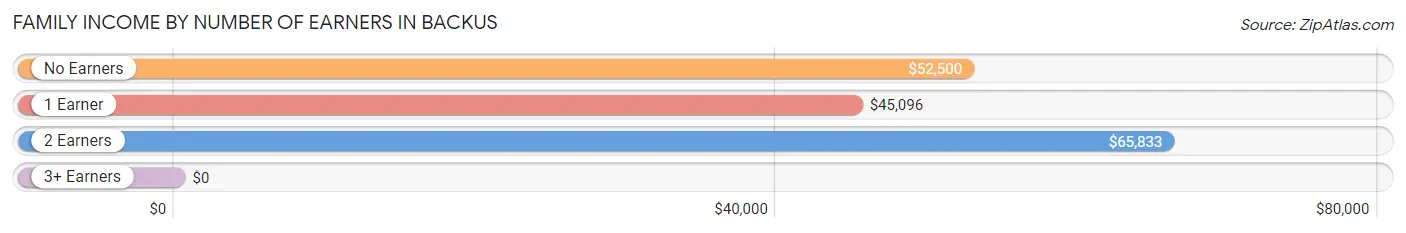
| Number of Earners | # Families | Median Income |
| No Earners | 14 (20.0%) | $52,500 |
| 1 Earner | 33 (47.1%) | $45,096 |
| 2 Earners | 20 (28.6%) | $65,833 |
| 3+ Earners | 3 (4.3%) | $0 |
| Total | 70 (100.0%) | $50,417 |
Household Income in Backus
Household Income Brackets in Backus
With 38 households falling in the category, the $50,000 to $74,999 income range is the most frequent in Backus, accounting for 31.1% of all households. In contrast, only 2 households (1.6%) fall into the $200,000+ income bracket, making it the least populous group.
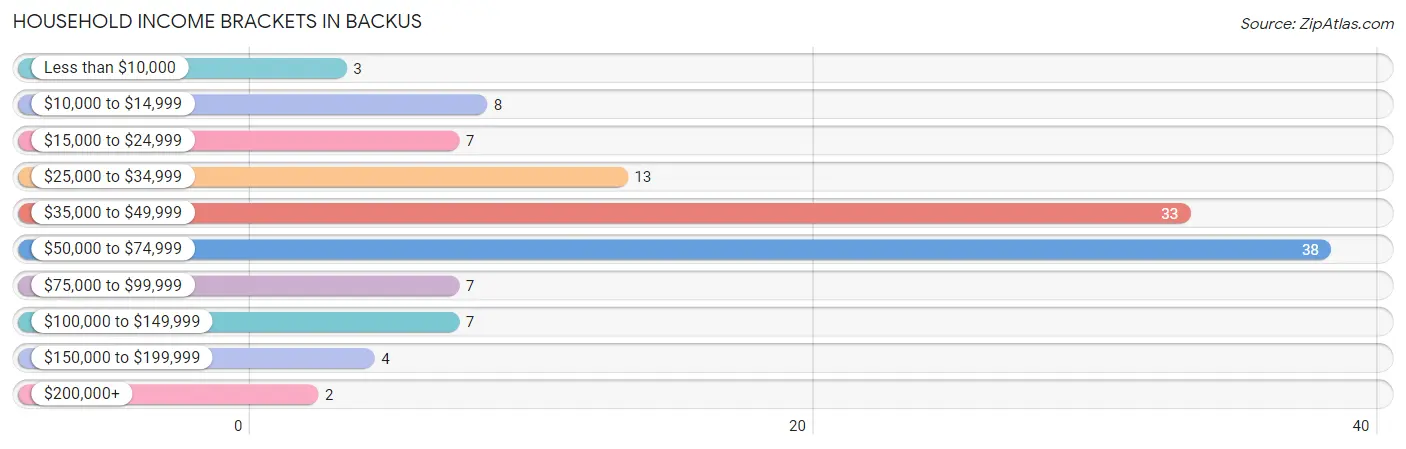
| Income Bracket | # Households | % Households |
| Less than $10,000 | 3 | 2.5% |
| $10,000 to $14,999 | 8 | 6.6% |
| $15,000 to $24,999 | 7 | 5.7% |
| $25,000 to $34,999 | 13 | 10.7% |
| $35,000 to $49,999 | 33 | 27.0% |
| $50,000 to $74,999 | 38 | 31.1% |
| $75,000 to $99,999 | 7 | 5.7% |
| $100,000 to $149,999 | 7 | 5.7% |
| $150,000 to $199,999 | 4 | 3.3% |
| $200,000+ | 2 | 1.6% |
Household Income by Householder Age in Backus
The median household income in Backus is $49,250, with the highest median household income of $51,667 found in the 65+ years age bracket for the primary householder. A total of 38 households (31.1%) fall into this category. Meanwhile, the 15 to 24 years age bracket for the primary householder has the lowest median household income of $0, with 10 households (8.2%) in this group.
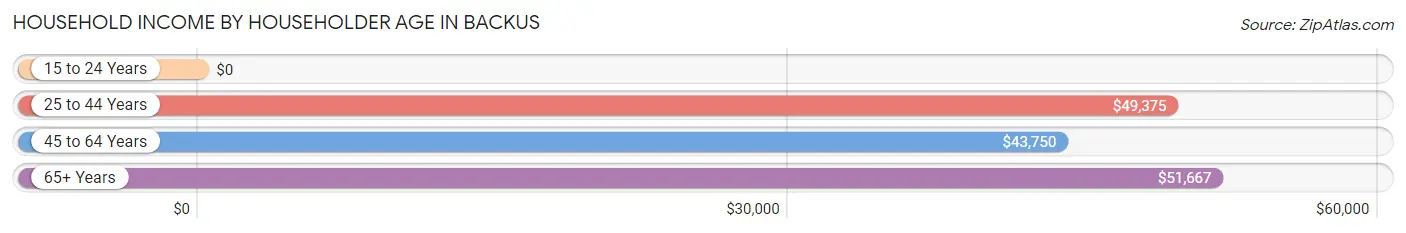
| Income Bracket | # Households | Median Income |
| 15 to 24 Years | 10 (8.2%) | $0 |
| 25 to 44 Years | 31 (25.4%) | $49,375 |
| 45 to 64 Years | 43 (35.2%) | $43,750 |
| 65+ Years | 38 (31.1%) | $51,667 |
| Total | 122 (100.0%) | $49,250 |
Poverty in Backus
Income Below Poverty by Sex and Age in Backus
With 29.3% poverty level for males and 25.2% for females among the residents of Backus, 12 to 14 year old males and 18 to 24 year old females are the most vulnerable to poverty, with 1 males (100.0%) and 7 females (77.8%) in their respective age groups living below the poverty level.
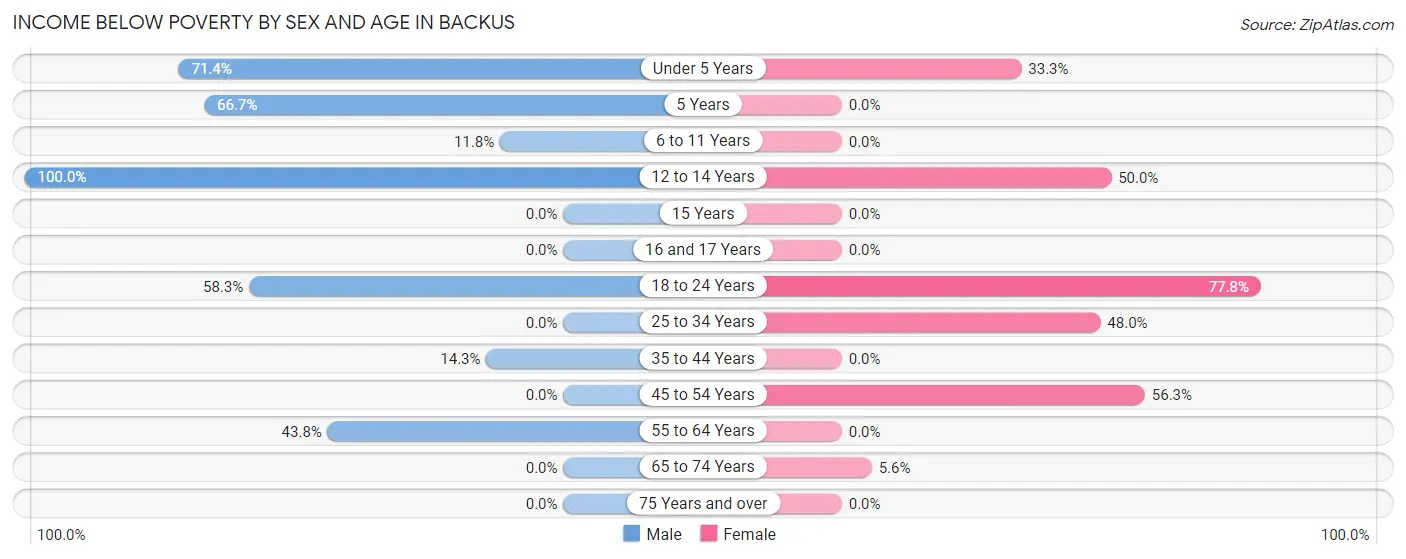
| Age Bracket | Male | Female |
| Under 5 Years | 25 (71.4%) | 5 (33.3%) |
| 5 Years | 2 (66.7%) | 0 (0.0%) |
| 6 to 11 Years | 2 (11.8%) | 0 (0.0%) |
| 12 to 14 Years | 1 (100.0%) | 1 (50.0%) |
| 15 Years | 0 (0.0%) | 0 (0.0%) |
| 16 and 17 Years | 0 (0.0%) | 0 (0.0%) |
| 18 to 24 Years | 7 (58.3%) | 7 (77.8%) |
| 25 to 34 Years | 0 (0.0%) | 12 (48.0%) |
| 35 to 44 Years | 2 (14.3%) | 0 (0.0%) |
| 45 to 54 Years | 0 (0.0%) | 9 (56.2%) |
| 55 to 64 Years | 14 (43.8%) | 0 (0.0%) |
| 65 to 74 Years | 0 (0.0%) | 1 (5.6%) |
| 75 Years and over | 0 (0.0%) | 0 (0.0%) |
| Total | 53 (29.3%) | 35 (25.2%) |
Income Above Poverty by Sex and Age in Backus
According to the poverty statistics in Backus, males aged 15 years and females aged 5 years are the age groups that are most secure financially, with 100.0% of males and 100.0% of females in these age groups living above the poverty line.
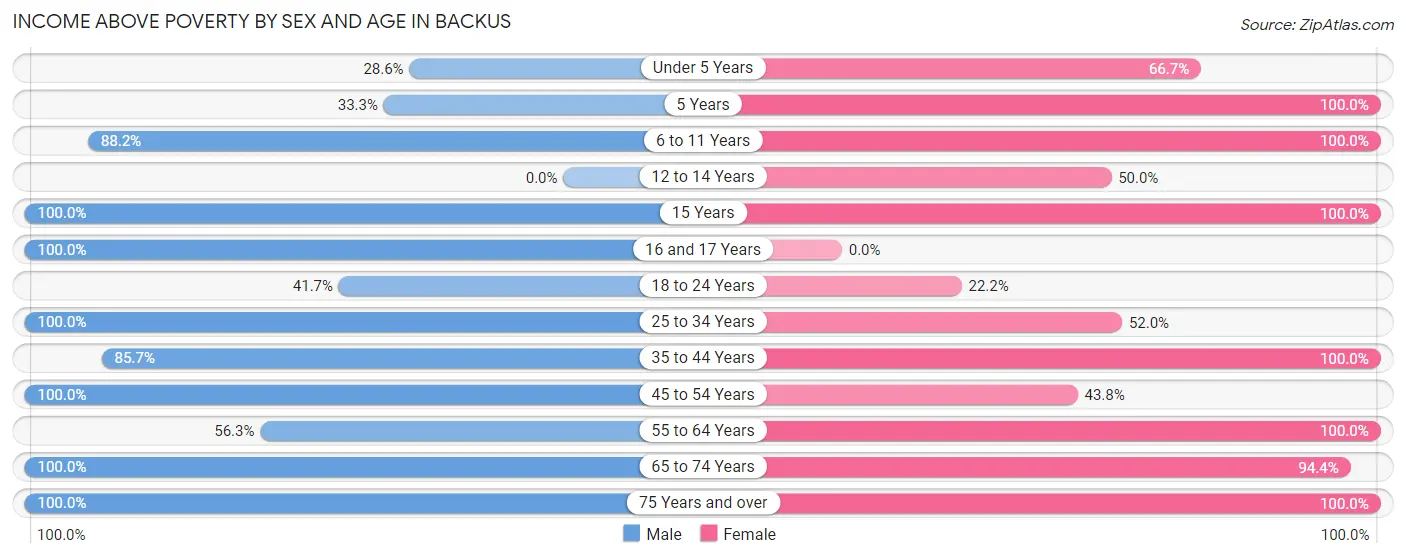
| Age Bracket | Male | Female |
| Under 5 Years | 10 (28.6%) | 10 (66.7%) |
| 5 Years | 1 (33.3%) | 6 (100.0%) |
| 6 to 11 Years | 15 (88.2%) | 5 (100.0%) |
| 12 to 14 Years | 0 (0.0%) | 1 (50.0%) |
| 15 Years | 4 (100.0%) | 1 (100.0%) |
| 16 and 17 Years | 4 (100.0%) | 0 (0.0%) |
| 18 to 24 Years | 5 (41.7%) | 2 (22.2%) |
| 25 to 34 Years | 10 (100.0%) | 13 (52.0%) |
| 35 to 44 Years | 12 (85.7%) | 5 (100.0%) |
| 45 to 54 Years | 22 (100.0%) | 7 (43.8%) |
| 55 to 64 Years | 18 (56.2%) | 25 (100.0%) |
| 65 to 74 Years | 20 (100.0%) | 17 (94.4%) |
| 75 Years and over | 7 (100.0%) | 12 (100.0%) |
| Total | 128 (70.7%) | 104 (74.8%) |
Income Below Poverty Among Married-Couple Families in Backus
The poverty statistics for married-couple families in Backus show that 2.7% or 1 of the total 37 families live below the poverty line. Families with 1 or 2 children have the highest poverty rate of 8.3%, comprising of 1 families. On the other hand, families with no children have the lowest poverty rate of 0.0%, which includes 0 families.
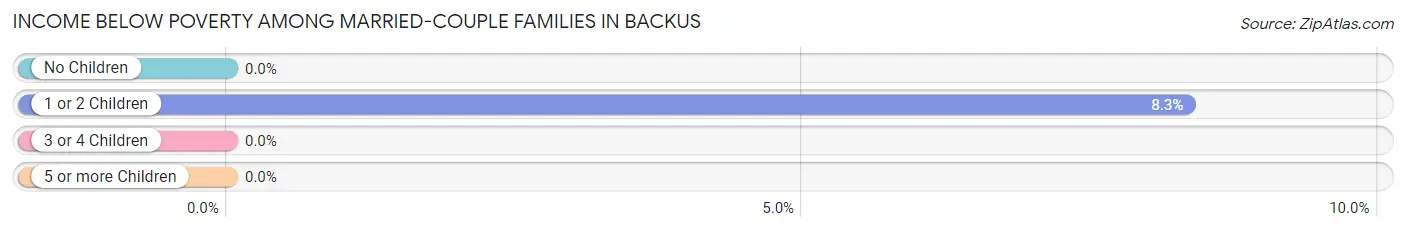
| Children | Above Poverty | Below Poverty |
| No Children | 24 (100.0%) | 0 (0.0%) |
| 1 or 2 Children | 11 (91.7%) | 1 (8.3%) |
| 3 or 4 Children | 1 (100.0%) | 0 (0.0%) |
| 5 or more Children | 0 (0.0%) | 0 (0.0%) |
| Total | 36 (97.3%) | 1 (2.7%) |
Income Below Poverty Among Single-Parent Households in Backus
According to the poverty data in Backus, 36.8% or 7 single-father households and 28.6% or 4 single-mother households are living below the poverty line. Among single-father households, those with 5 or more children have the highest poverty rate, with 7 households (100.0%) experiencing poverty. Likewise, among single-mother households, those with 3 or 4 children have the highest poverty rate, with 2 households (100.0%) falling below the poverty line.
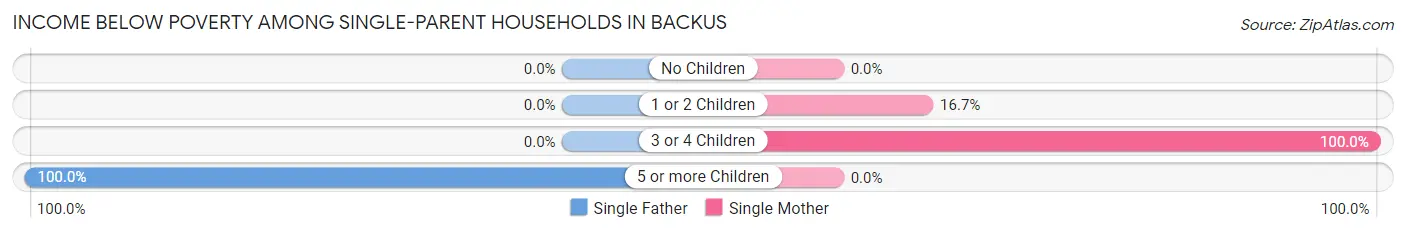
| Children | Single Father | Single Mother |
| No Children | 0 (0.0%) | 0 (0.0%) |
| 1 or 2 Children | 0 (0.0%) | 2 (16.7%) |
| 3 or 4 Children | 0 (0.0%) | 2 (100.0%) |
| 5 or more Children | 7 (100.0%) | 0 (0.0%) |
| Total | 7 (36.8%) | 4 (28.6%) |
Income Below Poverty Among Married-Couple vs Single-Parent Households in Backus
The poverty data for Backus shows that 1 of the married-couple family households (2.7%) and 11 of the single-parent households (33.3%) are living below the poverty level. Within the married-couple family households, those with 1 or 2 children have the highest poverty rate, with 1 households (8.3%) falling below the poverty line. Among the single-parent households, those with 5 or more children have the highest poverty rate, with 7 household (100.0%) living below poverty.
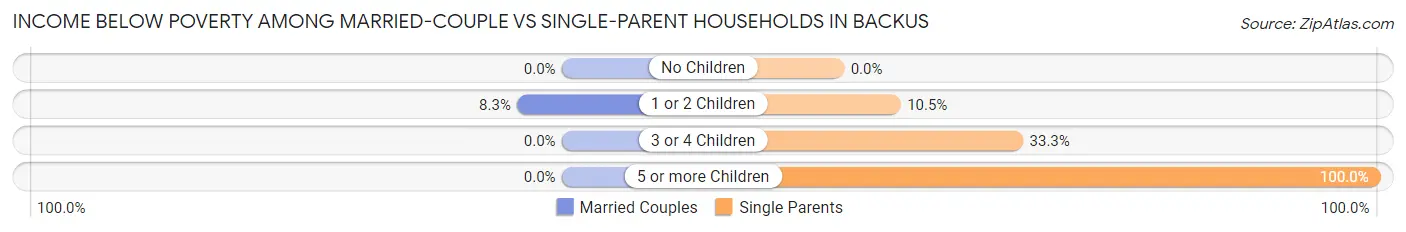
| Children | Married-Couple Families | Single-Parent Households |
| No Children | 0 (0.0%) | 0 (0.0%) |
| 1 or 2 Children | 1 (8.3%) | 2 (10.5%) |
| 3 or 4 Children | 0 (0.0%) | 2 (33.3%) |
| 5 or more Children | 0 (0.0%) | 7 (100.0%) |
| Total | 1 (2.7%) | 11 (33.3%) |
Employment Characteristics in Backus
Employment by Class of Employer in Backus
Among the 130 employed individuals in Backus, private company employees (104 | 80.0%), not-for-profit organizations (9 | 6.9%), and self-employed (incorporated) (6 | 4.6%) make up the most common classes of employment.
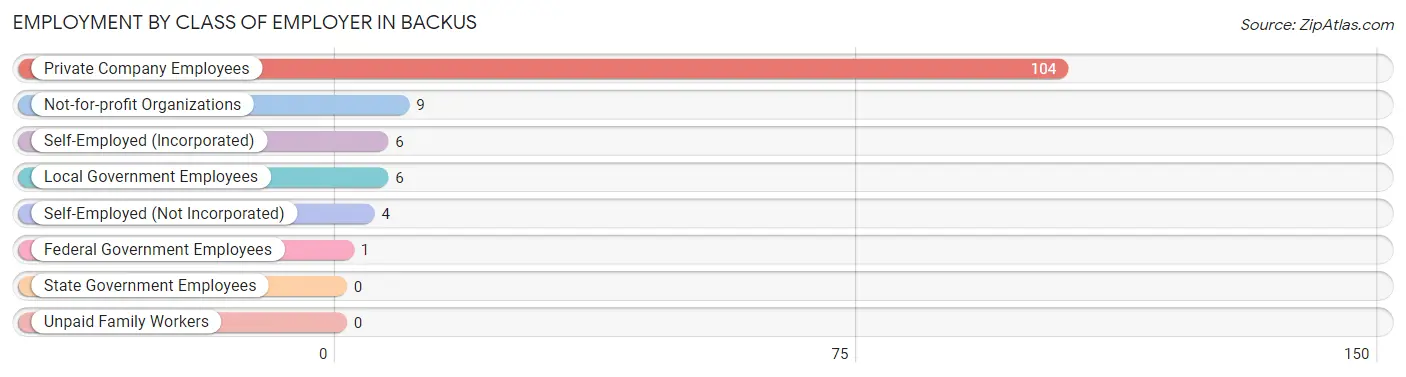
| Employer Class | # Employees | % Employees |
| Private Company Employees | 104 | 80.0% |
| Self-Employed (Incorporated) | 6 | 4.6% |
| Self-Employed (Not Incorporated) | 4 | 3.1% |
| Not-for-profit Organizations | 9 | 6.9% |
| Local Government Employees | 6 | 4.6% |
| State Government Employees | 0 | 0.0% |
| Federal Government Employees | 1 | 0.8% |
| Unpaid Family Workers | 0 | 0.0% |
| Total | 130 | 100.0% |
Employment Status by Age in Backus
According to the labor force statistics for Backus, out of the total population over 16 years of age (231), 57.1% or 132 individuals are in the labor force, with 1.5% or 2 of them unemployed. The age group with the highest labor force participation rate is 16 to 19 years, with 100.0% or 4 individuals in the labor force. Within the labor force, the 30 to 34 years age range has the highest percentage of unemployed individuals, with 6.7% or 1 of them being unemployed.
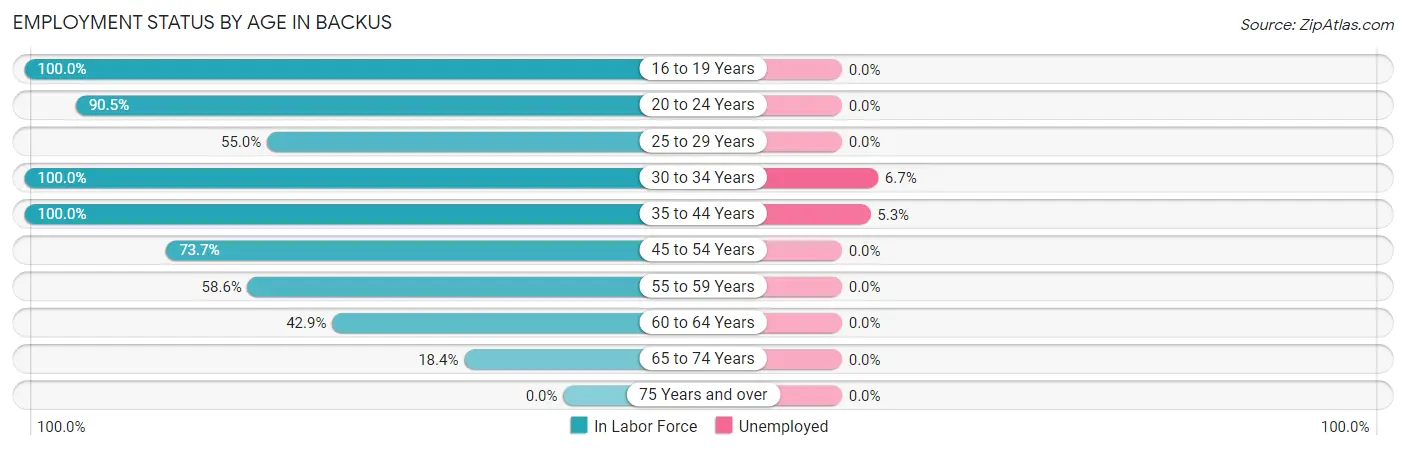
| Age Bracket | In Labor Force | Unemployed |
| 16 to 19 Years | 4 (100.0%) | 0 (0.0%) |
| 20 to 24 Years | 19 (90.5%) | 0 (0.0%) |
| 25 to 29 Years | 11 (55.0%) | 0 (0.0%) |
| 30 to 34 Years | 15 (100.0%) | 1 (6.7%) |
| 35 to 44 Years | 19 (100.0%) | 1 (5.3%) |
| 45 to 54 Years | 28 (73.7%) | 0 (0.0%) |
| 55 to 59 Years | 17 (58.6%) | 0 (0.0%) |
| 60 to 64 Years | 12 (42.9%) | 0 (0.0%) |
| 65 to 74 Years | 7 (18.4%) | 0 (0.0%) |
| 75 Years and over | 0 (0.0%) | 0 (0.0%) |
| Total | 132 (57.1%) | 2 (1.5%) |
Employment Status by Educational Attainment in Backus
According to labor force statistics for Backus, 68.5% of individuals (102) out of the total population between 25 and 64 years of age (149) are in the labor force, with 2.0% or 2 of them being unemployed. The group with the highest labor force participation rate are those with the educational attainment of bachelor's degree or higher, with 100.0% or 14 individuals in the labor force. Within the labor force, individuals with high school diploma education have the highest percentage of unemployment, with 3.9% or 2 of them being unemployed.
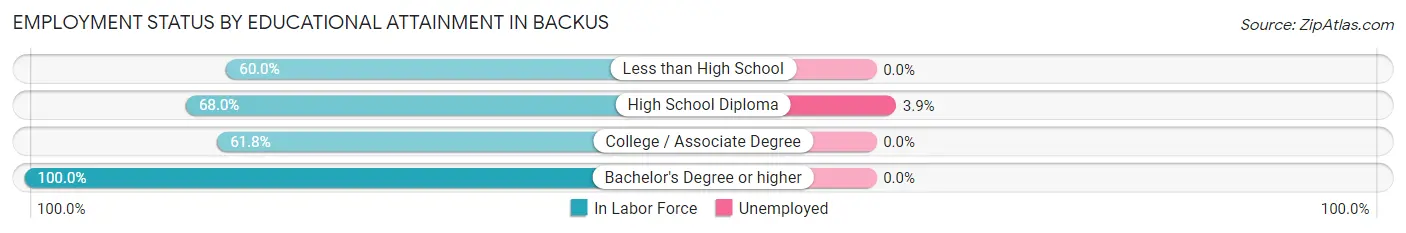
| Educational Attainment | In Labor Force | Unemployed |
| Less than High School | 3 (60.0%) | 0 (0.0%) |
| High School Diploma | 51 (68.0%) | 3 (3.9%) |
| College / Associate Degree | 34 (61.8%) | 0 (0.0%) |
| Bachelor's Degree or higher | 14 (100.0%) | 0 (0.0%) |
| Total | 102 (68.5%) | 3 (2.0%) |
Employment Occupations by Sex in Backus
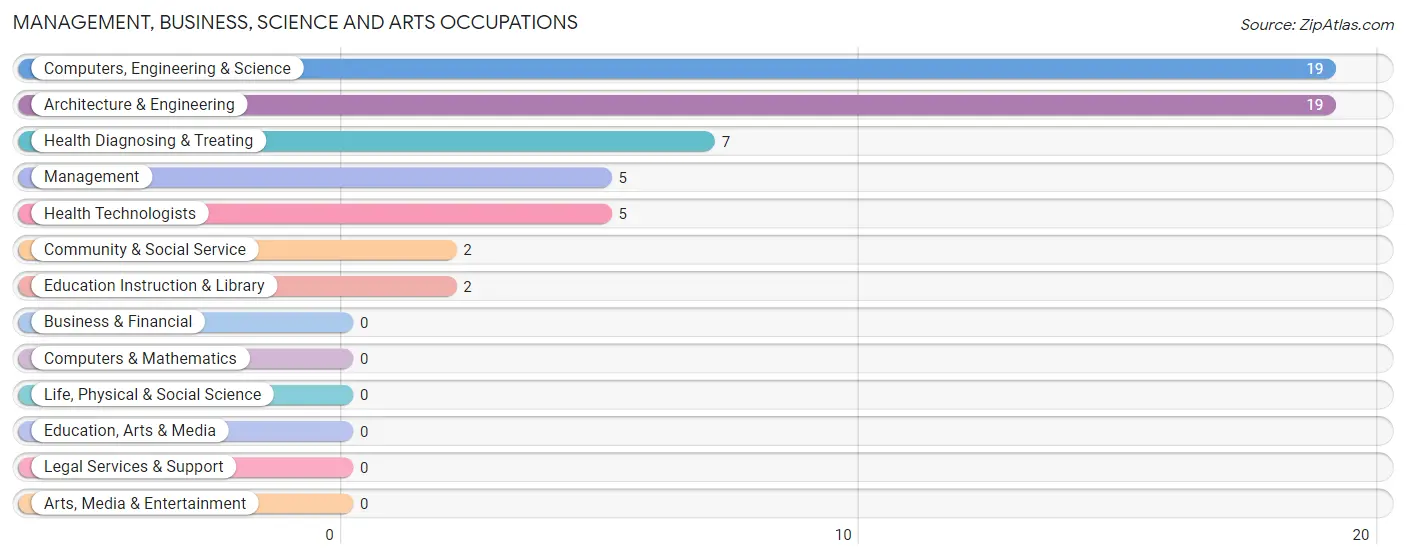
Management, Business, Science and Arts Occupations
The most common Management, Business, Science and Arts occupations in Backus are Computers, Engineering & Science (19 | 14.6%), Architecture & Engineering (19 | 14.6%), Health Diagnosing & Treating (7 | 5.4%), Management (5 | 3.8%), and Health Technologists (5 | 3.8%).
Management, Business, Science and Arts Occupations by Sex
Within the Management, Business, Science and Arts occupations in Backus, the most male-oriented occupations are Computers, Engineering & Science (100.0%), Architecture & Engineering (100.0%), and Management (80.0%), while the most female-oriented occupations are Community & Social Service (100.0%), Education Instruction & Library (100.0%), and Health Diagnosing & Treating (100.0%).
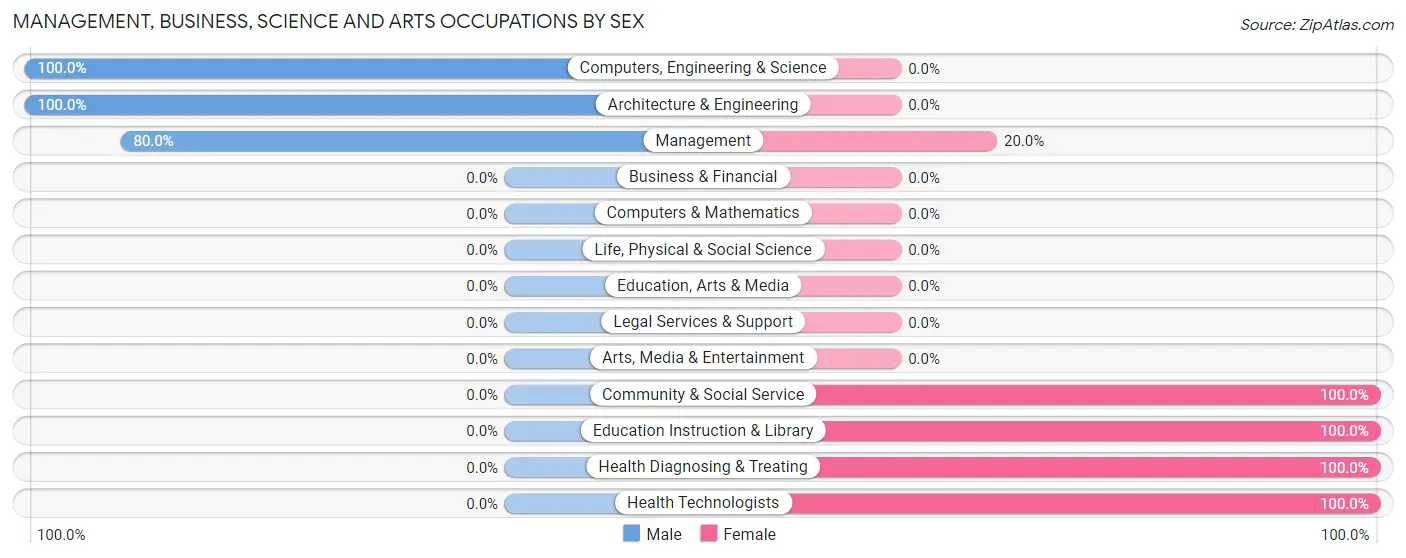
| Occupation | Male | Female |
| Management | 4 (80.0%) | 1 (20.0%) |
| Business & Financial | 0 (0.0%) | 0 (0.0%) |
| Computers, Engineering & Science | 19 (100.0%) | 0 (0.0%) |
| Computers & Mathematics | 0 (0.0%) | 0 (0.0%) |
| Architecture & Engineering | 19 (100.0%) | 0 (0.0%) |
| Life, Physical & Social Science | 0 (0.0%) | 0 (0.0%) |
| Community & Social Service | 0 (0.0%) | 2 (100.0%) |
| Education, Arts & Media | 0 (0.0%) | 0 (0.0%) |
| Legal Services & Support | 0 (0.0%) | 0 (0.0%) |
| Education Instruction & Library | 0 (0.0%) | 2 (100.0%) |
| Arts, Media & Entertainment | 0 (0.0%) | 0 (0.0%) |
| Health Diagnosing & Treating | 0 (0.0%) | 7 (100.0%) |
| Health Technologists | 0 (0.0%) | 5 (100.0%) |
| Total (Category) | 23 (69.7%) | 10 (30.3%) |
| Total (Overall) | 75 (57.7%) | 55 (42.3%) |
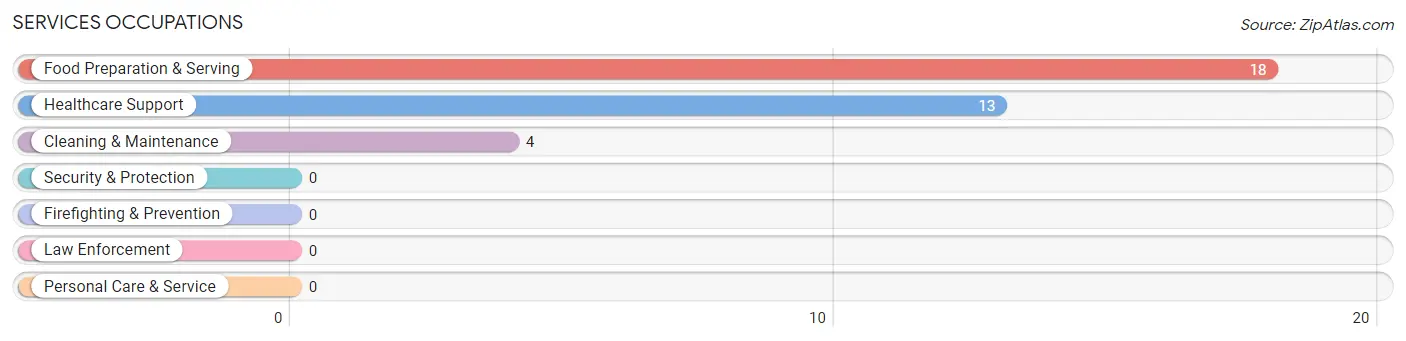
Services Occupations
The most common Services occupations in Backus are Food Preparation & Serving (18 | 13.9%), Healthcare Support (13 | 10.0%), and Cleaning & Maintenance (4 | 3.1%).
Services Occupations by Sex
Within the Services occupations in Backus, the most male-oriented occupations are Cleaning & Maintenance (100.0%), and Food Preparation & Serving (22.2%), while the most female-oriented occupations are Healthcare Support (100.0%), and Food Preparation & Serving (77.8%).
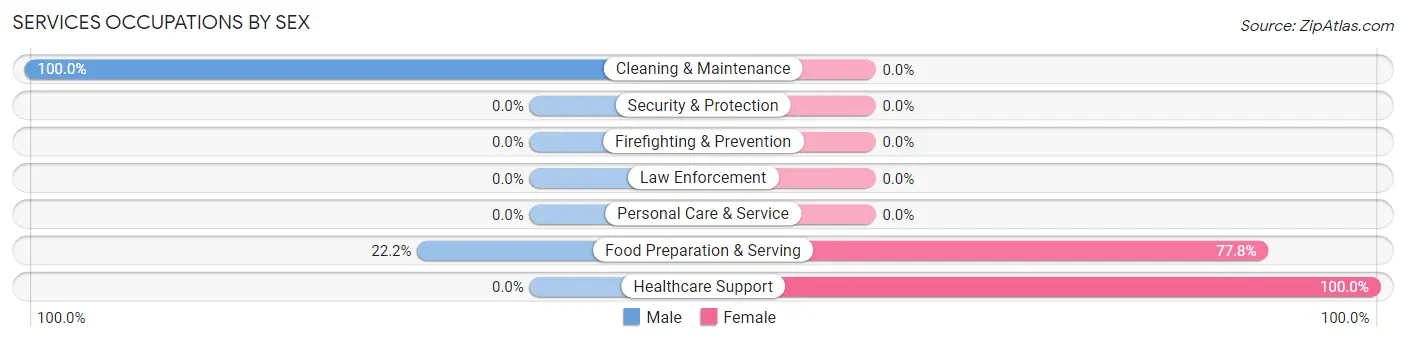
| Occupation | Male | Female |
| Healthcare Support | 0 (0.0%) | 13 (100.0%) |
| Security & Protection | 0 (0.0%) | 0 (0.0%) |
| Firefighting & Prevention | 0 (0.0%) | 0 (0.0%) |
| Law Enforcement | 0 (0.0%) | 0 (0.0%) |
| Food Preparation & Serving | 4 (22.2%) | 14 (77.8%) |
| Cleaning & Maintenance | 4 (100.0%) | 0 (0.0%) |
| Personal Care & Service | 0 (0.0%) | 0 (0.0%) |
| Total (Category) | 8 (22.9%) | 27 (77.1%) |
| Total (Overall) | 75 (57.7%) | 55 (42.3%) |
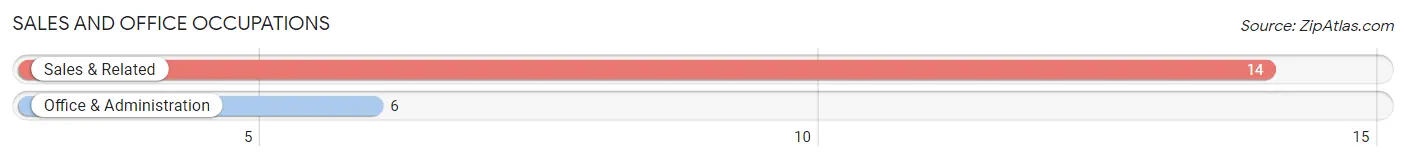
Sales and Office Occupations
The most common Sales and Office occupations in Backus are Sales & Related (14 | 10.8%), and Office & Administration (6 | 4.6%).
Sales and Office Occupations by Sex
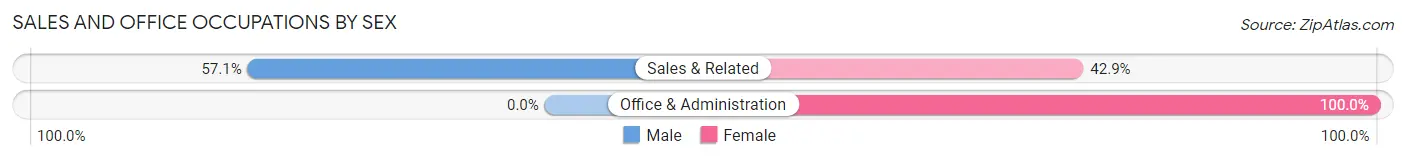
| Occupation | Male | Female |
| Sales & Related | 8 (57.1%) | 6 (42.9%) |
| Office & Administration | 0 (0.0%) | 6 (100.0%) |
| Total (Category) | 8 (40.0%) | 12 (60.0%) |
| Total (Overall) | 75 (57.7%) | 55 (42.3%) |
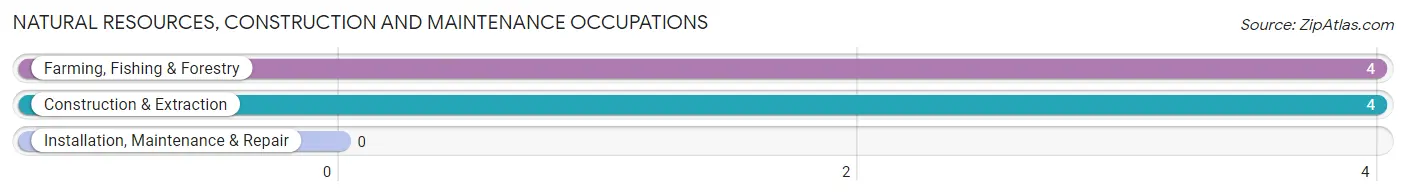
Natural Resources, Construction and Maintenance Occupations
The most common Natural Resources, Construction and Maintenance occupations in Backus are Farming, Fishing & Forestry (4 | 3.1%), and Construction & Extraction (4 | 3.1%).
Natural Resources, Construction and Maintenance Occupations by Sex
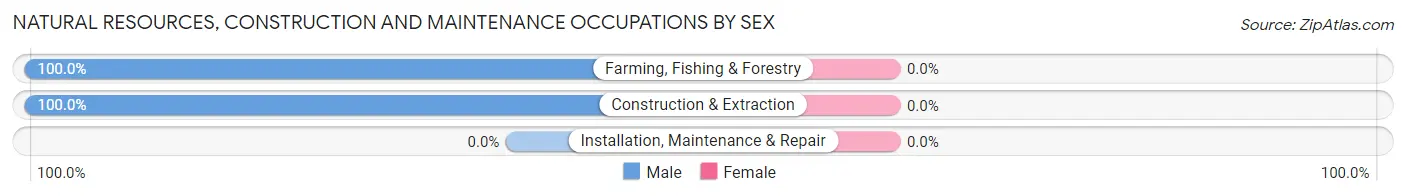
| Occupation | Male | Female |
| Farming, Fishing & Forestry | 4 (100.0%) | 0 (0.0%) |
| Construction & Extraction | 4 (100.0%) | 0 (0.0%) |
| Installation, Maintenance & Repair | 0 (0.0%) | 0 (0.0%) |
| Total (Category) | 8 (100.0%) | 0 (0.0%) |
| Total (Overall) | 75 (57.7%) | 55 (42.3%) |
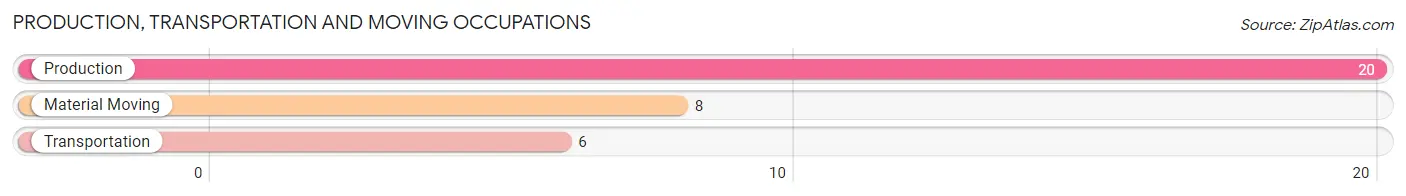
Production, Transportation and Moving Occupations
The most common Production, Transportation and Moving occupations in Backus are Production (20 | 15.4%), Material Moving (8 | 6.1%), and Transportation (6 | 4.6%).
Production, Transportation and Moving Occupations by Sex
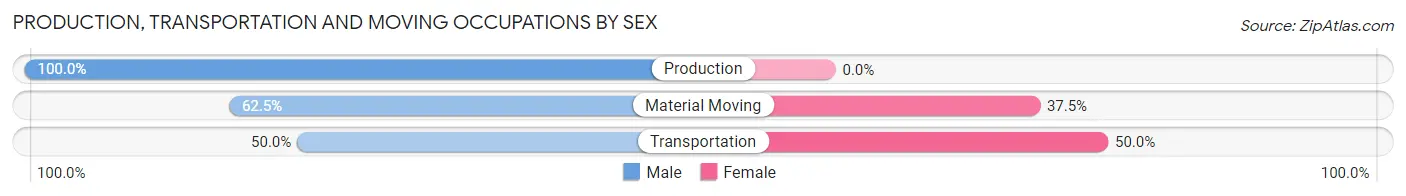
| Occupation | Male | Female |
| Production | 20 (100.0%) | 0 (0.0%) |
| Transportation | 3 (50.0%) | 3 (50.0%) |
| Material Moving | 5 (62.5%) | 3 (37.5%) |
| Total (Category) | 28 (82.4%) | 6 (17.6%) |
| Total (Overall) | 75 (57.7%) | 55 (42.3%) |
Employment Industries by Sex in Backus
Employment Industries in Backus
The major employment industries in Backus include Health Care & Social Assistance (31 | 23.8%), Retail Trade (25 | 19.2%), Information (23 | 17.7%), Manufacturing (18 | 13.9%), and Construction (8 | 6.1%).
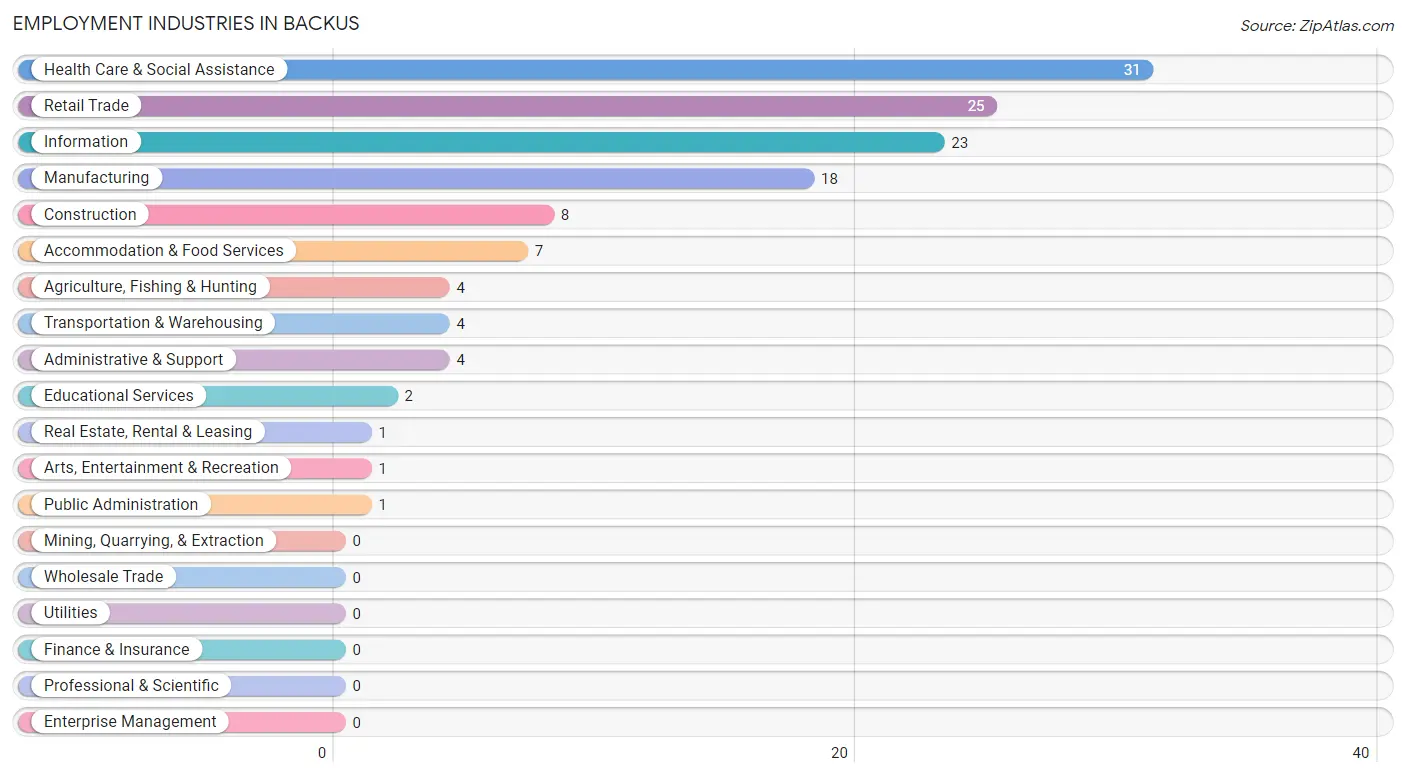
Employment Industries by Sex in Backus
The Backus industries that see more men than women are Agriculture, Fishing & Hunting (100.0%), Manufacturing (100.0%), and Information (100.0%), whereas the industries that tend to have a higher number of women are Accommodation & Food Services (100.0%), Public Administration (100.0%), and Health Care & Social Assistance (87.1%).
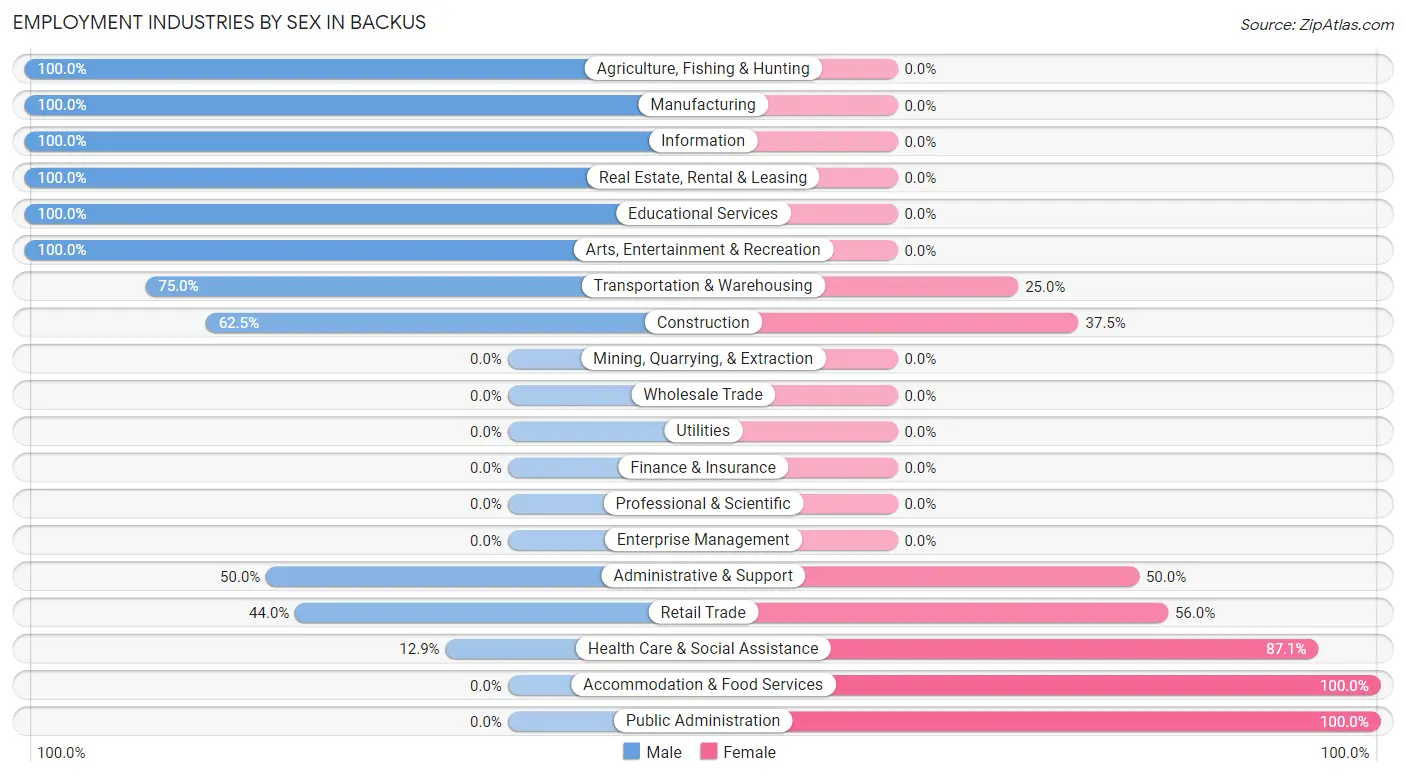
| Industry | Male | Female |
| Agriculture, Fishing & Hunting | 4 (100.0%) | 0 (0.0%) |
| Mining, Quarrying, & Extraction | 0 (0.0%) | 0 (0.0%) |
| Construction | 5 (62.5%) | 3 (37.5%) |
| Manufacturing | 18 (100.0%) | 0 (0.0%) |
| Wholesale Trade | 0 (0.0%) | 0 (0.0%) |
| Retail Trade | 11 (44.0%) | 14 (56.0%) |
| Transportation & Warehousing | 3 (75.0%) | 1 (25.0%) |
| Utilities | 0 (0.0%) | 0 (0.0%) |
| Information | 23 (100.0%) | 0 (0.0%) |
| Finance & Insurance | 0 (0.0%) | 0 (0.0%) |
| Real Estate, Rental & Leasing | 1 (100.0%) | 0 (0.0%) |
| Professional & Scientific | 0 (0.0%) | 0 (0.0%) |
| Enterprise Management | 0 (0.0%) | 0 (0.0%) |
| Administrative & Support | 2 (50.0%) | 2 (50.0%) |
| Educational Services | 2 (100.0%) | 0 (0.0%) |
| Health Care & Social Assistance | 4 (12.9%) | 27 (87.1%) |
| Arts, Entertainment & Recreation | 1 (100.0%) | 0 (0.0%) |
| Accommodation & Food Services | 0 (0.0%) | 7 (100.0%) |
| Public Administration | 0 (0.0%) | 1 (100.0%) |
| Total | 75 (57.7%) | 55 (42.3%) |
Education in Backus
School Enrollment in Backus
The most common levels of schooling among the 58 students in Backus are college / undergraduate (17 | 29.3%), elementary school (16 | 27.6%), and high school (9 | 15.5%).
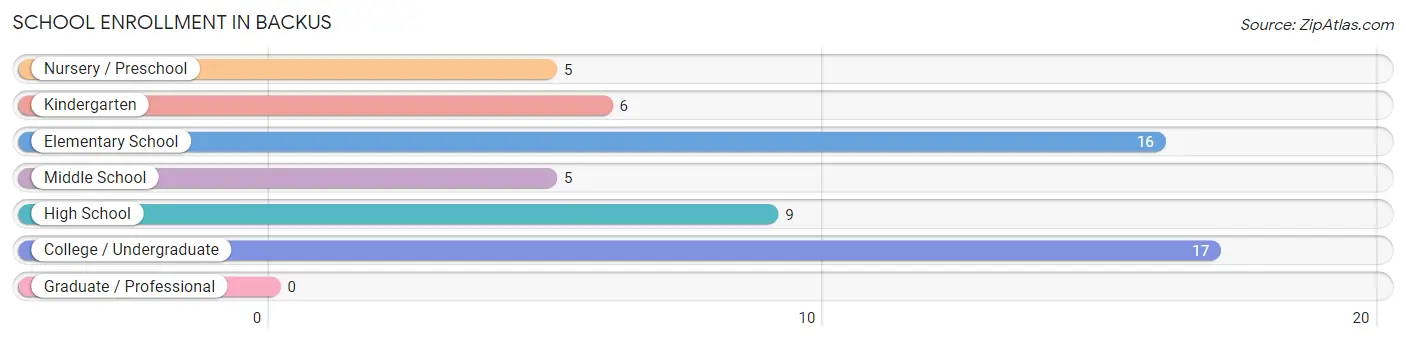
| School Level | # Students | % Students |
| Nursery / Preschool | 5 | 8.6% |
| Kindergarten | 6 | 10.3% |
| Elementary School | 16 | 27.6% |
| Middle School | 5 | 8.6% |
| High School | 9 | 15.5% |
| College / Undergraduate | 17 | 29.3% |
| Graduate / Professional | 0 | 0.0% |
| Total | 58 | 100.0% |
School Enrollment by Age by Funding Source in Backus
Out of a total of 58 students who are enrolled in schools in Backus, 11 (19.0%) attend a private institution, while the remaining 47 (81.0%) are enrolled in public schools. The age group of 5 to 9 year old has the highest likelihood of being enrolled in private schools, with 10 (55.6% in the age bracket) enrolled. Conversely, the age group of 3 to 4 year olds has the lowest likelihood of being enrolled in a private school, with 4 (100.0% in the age bracket) attending a public institution.
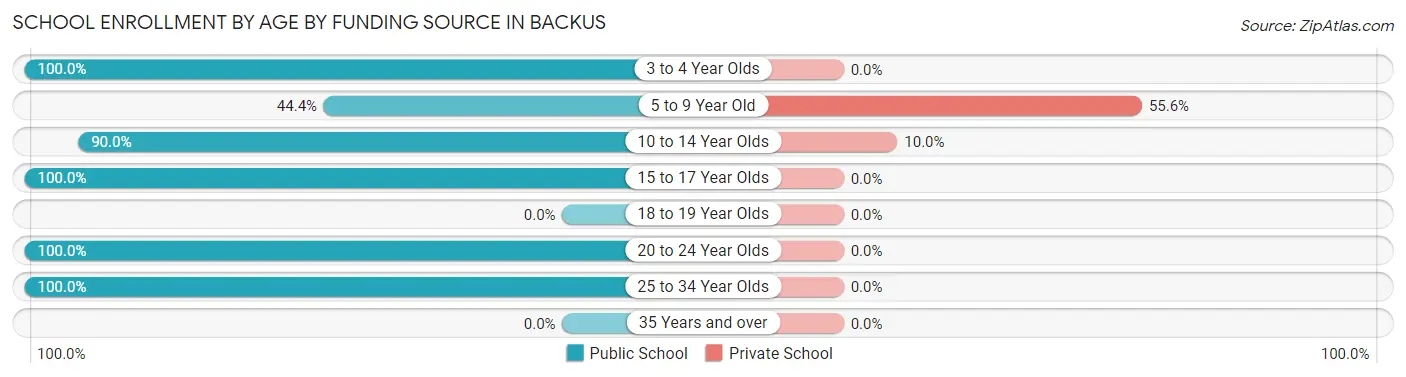
| Age Bracket | Public School | Private School |
| 3 to 4 Year Olds | 4 (100.0%) | 0 (0.0%) |
| 5 to 9 Year Old | 8 (44.4%) | 10 (55.6%) |
| 10 to 14 Year Olds | 9 (90.0%) | 1 (10.0%) |
| 15 to 17 Year Olds | 9 (100.0%) | 0 (0.0%) |
| 18 to 19 Year Olds | 0 (0.0%) | 0 (0.0%) |
| 20 to 24 Year Olds | 2 (100.0%) | 0 (0.0%) |
| 25 to 34 Year Olds | 15 (100.0%) | 0 (0.0%) |
| 35 Years and over | 0 (0.0%) | 0 (0.0%) |
| Total | 47 (81.0%) | 11 (19.0%) |
Educational Attainment by Field of Study in Backus
Visual & performing arts (7 | 36.8%), science & technology (5 | 26.3%), education (3 | 15.8%), psychology (2 | 10.5%), and bio, nature & agricultural (1 | 5.3%) are the most common fields of study among 19 individuals in Backus who have obtained a bachelor's degree or higher.
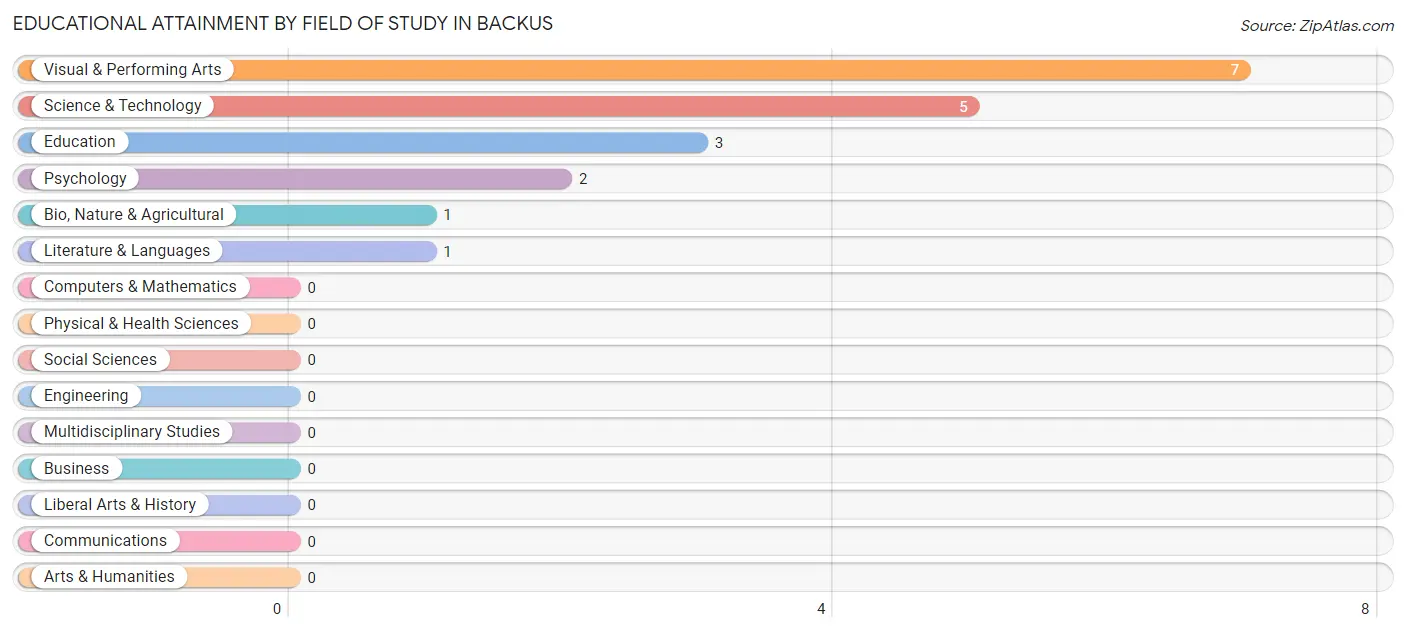
| Field of Study | # Graduates | % Graduates |
| Computers & Mathematics | 0 | 0.0% |
| Bio, Nature & Agricultural | 1 | 5.3% |
| Physical & Health Sciences | 0 | 0.0% |
| Psychology | 2 | 10.5% |
| Social Sciences | 0 | 0.0% |
| Engineering | 0 | 0.0% |
| Multidisciplinary Studies | 0 | 0.0% |
| Science & Technology | 5 | 26.3% |
| Business | 0 | 0.0% |
| Education | 3 | 15.8% |
| Literature & Languages | 1 | 5.3% |
| Liberal Arts & History | 0 | 0.0% |
| Visual & Performing Arts | 7 | 36.8% |
| Communications | 0 | 0.0% |
| Arts & Humanities | 0 | 0.0% |
| Total | 19 | 100.0% |
Transportation & Commute in Backus
Vehicle Availability by Sex in Backus
The most prevalent vehicle ownership categories in Backus are males with 2 vehicles (53, accounting for 70.7%) and females with 2 vehicles (24, making up 96.4%).
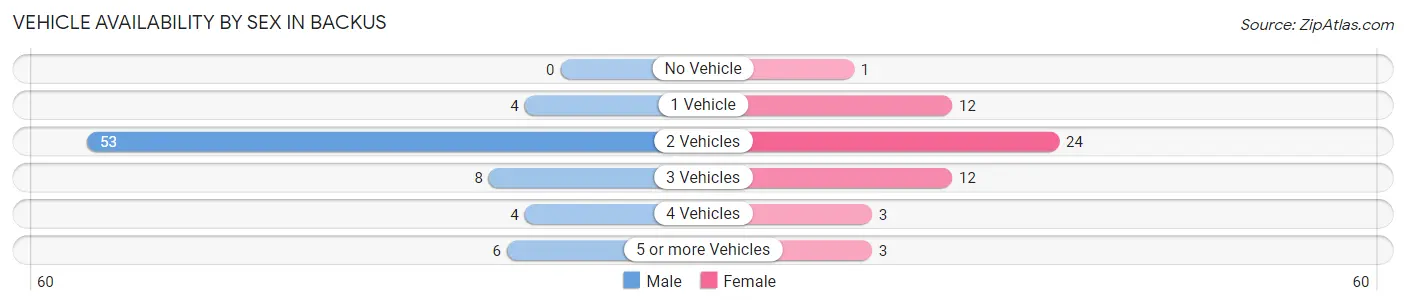
| Vehicles Available | Male | Female |
| No Vehicle | 0 (0.0%) | 1 (1.8%) |
| 1 Vehicle | 4 (5.3%) | 12 (21.8%) |
| 2 Vehicles | 53 (70.7%) | 24 (43.6%) |
| 3 Vehicles | 8 (10.7%) | 12 (21.8%) |
| 4 Vehicles | 4 (5.3%) | 3 (5.4%) |
| 5 or more Vehicles | 6 (8.0%) | 3 (5.4%) |
| Total | 75 (100.0%) | 55 (100.0%) |
Commute Time in Backus
The most frequently occuring commute durations in Backus are 10 to 14 minutes (31 commuters, 25.4%), 5 to 9 minutes (26 commuters, 21.3%), and 30 to 34 minutes (17 commuters, 13.9%).
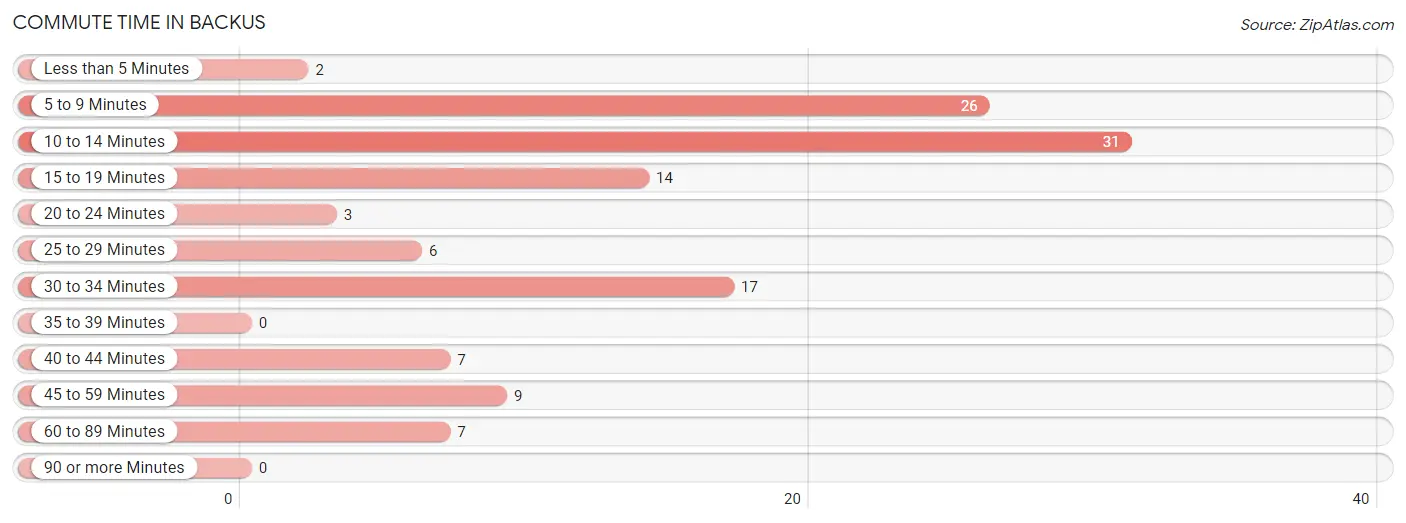
| Commute Time | # Commuters | % Commuters |
| Less than 5 Minutes | 2 | 1.6% |
| 5 to 9 Minutes | 26 | 21.3% |
| 10 to 14 Minutes | 31 | 25.4% |
| 15 to 19 Minutes | 14 | 11.5% |
| 20 to 24 Minutes | 3 | 2.5% |
| 25 to 29 Minutes | 6 | 4.9% |
| 30 to 34 Minutes | 17 | 13.9% |
| 35 to 39 Minutes | 0 | 0.0% |
| 40 to 44 Minutes | 7 | 5.7% |
| 45 to 59 Minutes | 9 | 7.4% |
| 60 to 89 Minutes | 7 | 5.7% |
| 90 or more Minutes | 0 | 0.0% |
Commute Time by Sex in Backus
The most common commute times in Backus are 10 to 14 minutes (22 commuters, 31.0%) for males and 30 to 34 minutes (12 commuters, 23.5%) for females.
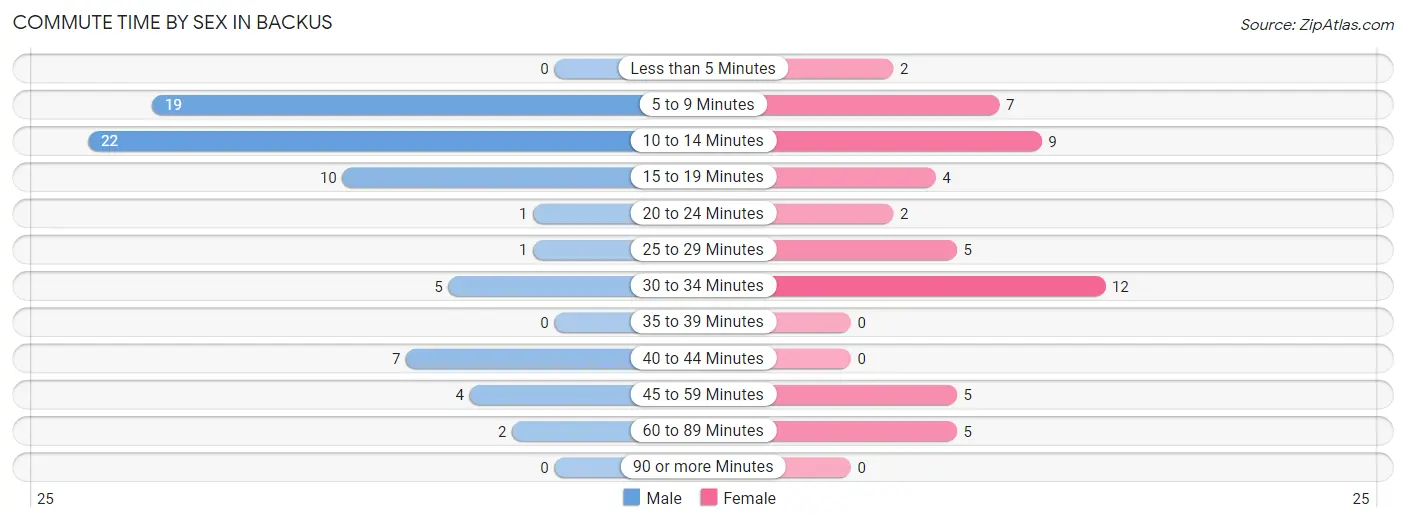
| Commute Time | Male | Female |
| Less than 5 Minutes | 0 (0.0%) | 2 (3.9%) |
| 5 to 9 Minutes | 19 (26.8%) | 7 (13.7%) |
| 10 to 14 Minutes | 22 (31.0%) | 9 (17.6%) |
| 15 to 19 Minutes | 10 (14.1%) | 4 (7.8%) |
| 20 to 24 Minutes | 1 (1.4%) | 2 (3.9%) |
| 25 to 29 Minutes | 1 (1.4%) | 5 (9.8%) |
| 30 to 34 Minutes | 5 (7.0%) | 12 (23.5%) |
| 35 to 39 Minutes | 0 (0.0%) | 0 (0.0%) |
| 40 to 44 Minutes | 7 (9.9%) | 0 (0.0%) |
| 45 to 59 Minutes | 4 (5.6%) | 5 (9.8%) |
| 60 to 89 Minutes | 2 (2.8%) | 5 (9.8%) |
| 90 or more Minutes | 0 (0.0%) | 0 (0.0%) |
Time of Departure to Work by Sex in Backus
The most frequent times of departure to work in Backus are 7:00 AM to 7:29 AM (26, 36.6%) for males and 7:00 AM to 7:29 AM (12, 23.5%) for females.
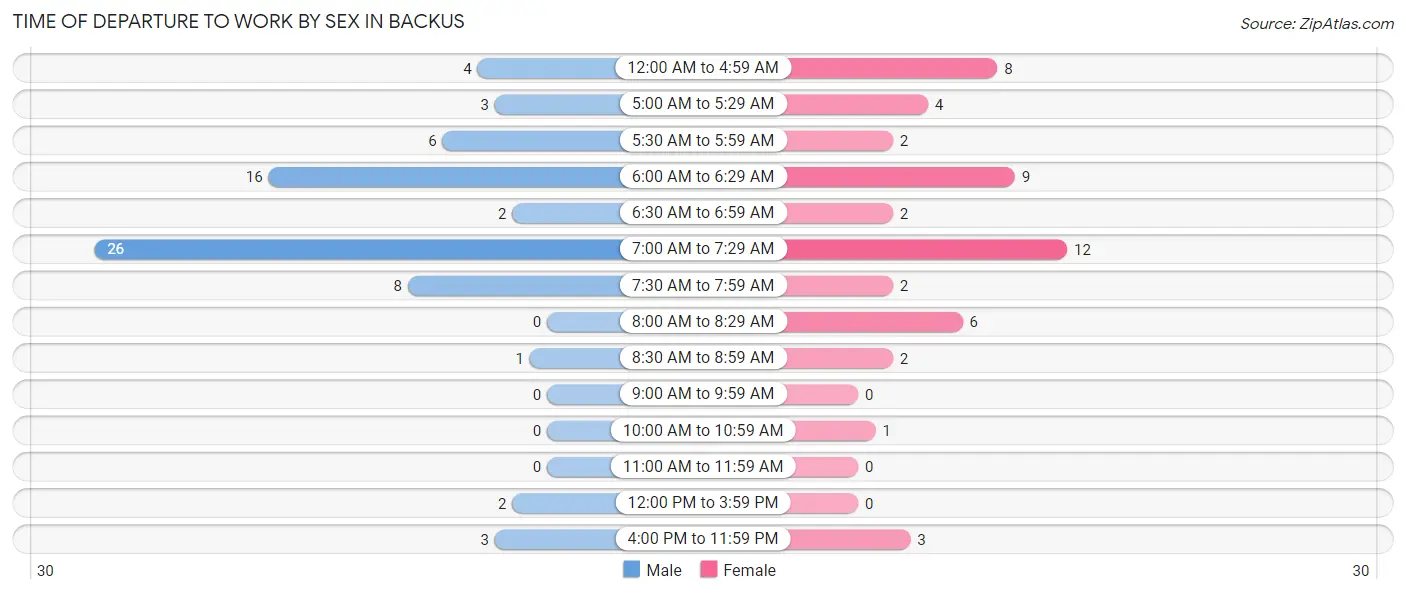
| Time of Departure | Male | Female |
| 12:00 AM to 4:59 AM | 4 (5.6%) | 8 (15.7%) |
| 5:00 AM to 5:29 AM | 3 (4.2%) | 4 (7.8%) |
| 5:30 AM to 5:59 AM | 6 (8.5%) | 2 (3.9%) |
| 6:00 AM to 6:29 AM | 16 (22.5%) | 9 (17.6%) |
| 6:30 AM to 6:59 AM | 2 (2.8%) | 2 (3.9%) |
| 7:00 AM to 7:29 AM | 26 (36.6%) | 12 (23.5%) |
| 7:30 AM to 7:59 AM | 8 (11.3%) | 2 (3.9%) |
| 8:00 AM to 8:29 AM | 0 (0.0%) | 6 (11.8%) |
| 8:30 AM to 8:59 AM | 1 (1.4%) | 2 (3.9%) |
| 9:00 AM to 9:59 AM | 0 (0.0%) | 0 (0.0%) |
| 10:00 AM to 10:59 AM | 0 (0.0%) | 1 (2.0%) |
| 11:00 AM to 11:59 AM | 0 (0.0%) | 0 (0.0%) |
| 12:00 PM to 3:59 PM | 2 (2.8%) | 0 (0.0%) |
| 4:00 PM to 11:59 PM | 3 (4.2%) | 3 (5.9%) |
| Total | 71 (100.0%) | 51 (100.0%) |
Housing Occupancy in Backus
Occupancy by Ownership in Backus
Of the total 122 dwellings in Backus, owner-occupied units account for 95 (77.9%), while renter-occupied units make up 27 (22.1%).
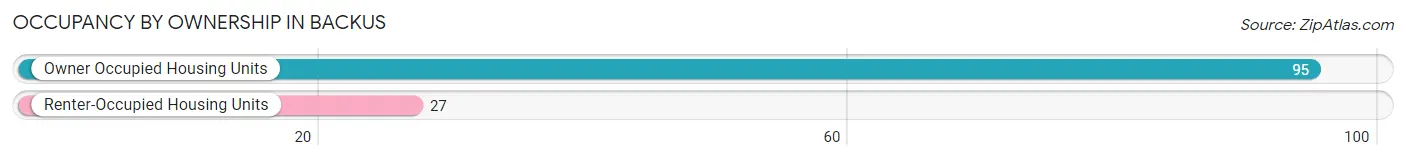
| Occupancy | # Housing Units | % Housing Units |
| Owner Occupied Housing Units | 95 | 77.9% |
| Renter-Occupied Housing Units | 27 | 22.1% |
| Total Occupied Housing Units | 122 | 100.0% |
Occupancy by Household Size in Backus
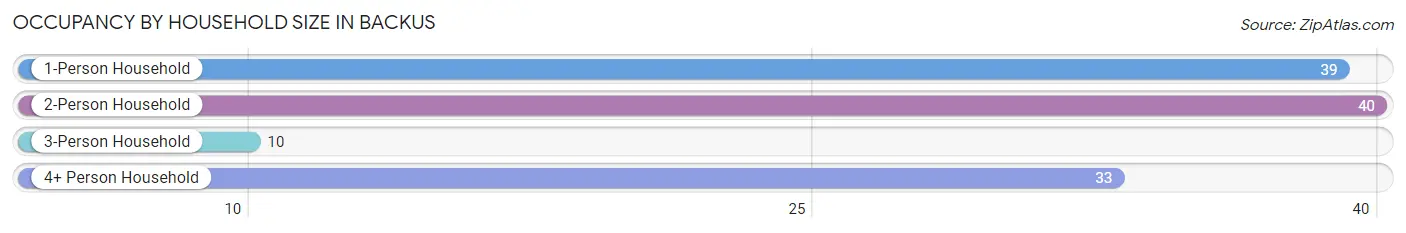
| Household Size | # Housing Units | % Housing Units |
| 1-Person Household | 39 | 32.0% |
| 2-Person Household | 40 | 32.8% |
| 3-Person Household | 10 | 8.2% |
| 4+ Person Household | 33 | 27.1% |
| Total Housing Units | 122 | 100.0% |
Occupancy by Ownership by Household Size in Backus
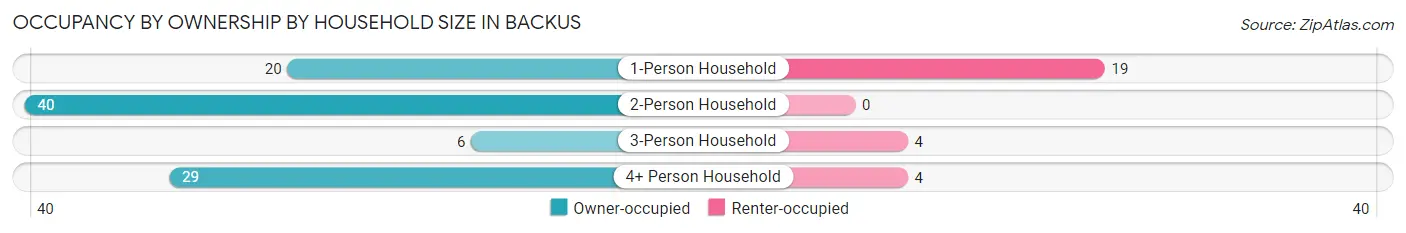
| Household Size | Owner-occupied | Renter-occupied |
| 1-Person Household | 20 (51.3%) | 19 (48.7%) |
| 2-Person Household | 40 (100.0%) | 0 (0.0%) |
| 3-Person Household | 6 (60.0%) | 4 (40.0%) |
| 4+ Person Household | 29 (87.9%) | 4 (12.1%) |
| Total Housing Units | 95 (77.9%) | 27 (22.1%) |
Occupancy by Educational Attainment in Backus
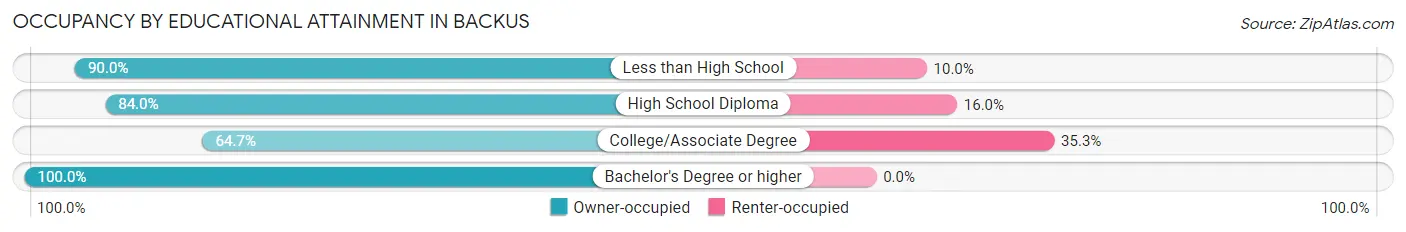
| Household Size | Owner-occupied | Renter-occupied |
| Less than High School | 9 (90.0%) | 1 (10.0%) |
| High School Diploma | 42 (84.0%) | 8 (16.0%) |
| College/Associate Degree | 33 (64.7%) | 18 (35.3%) |
| Bachelor's Degree or higher | 11 (100.0%) | 0 (0.0%) |
Occupancy by Age of Householder in Backus
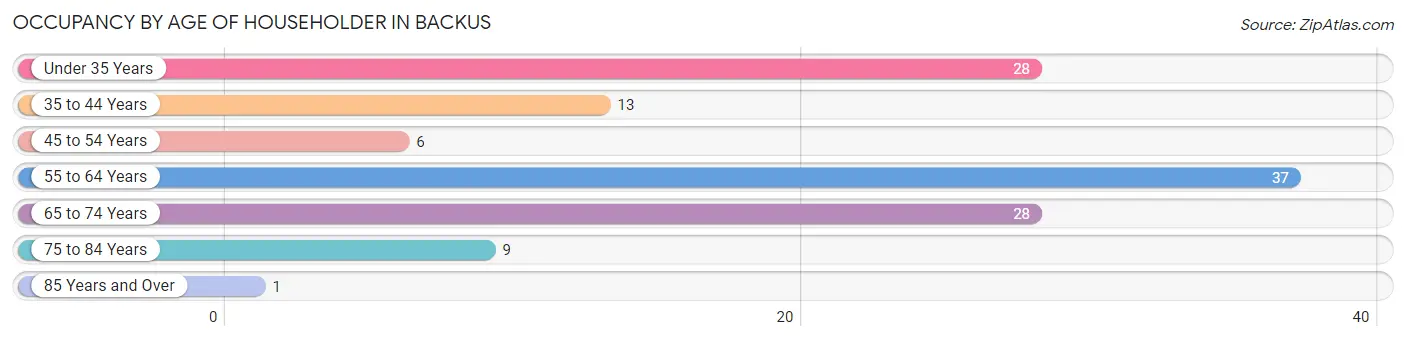
| Age Bracket | # Households | % Households |
| Under 35 Years | 28 | 23.0% |
| 35 to 44 Years | 13 | 10.7% |
| 45 to 54 Years | 6 | 4.9% |
| 55 to 64 Years | 37 | 30.3% |
| 65 to 74 Years | 28 | 23.0% |
| 75 to 84 Years | 9 | 7.4% |
| 85 Years and Over | 1 | 0.8% |
| Total | 122 | 100.0% |
Housing Finances in Backus
Median Income by Occupancy in Backus
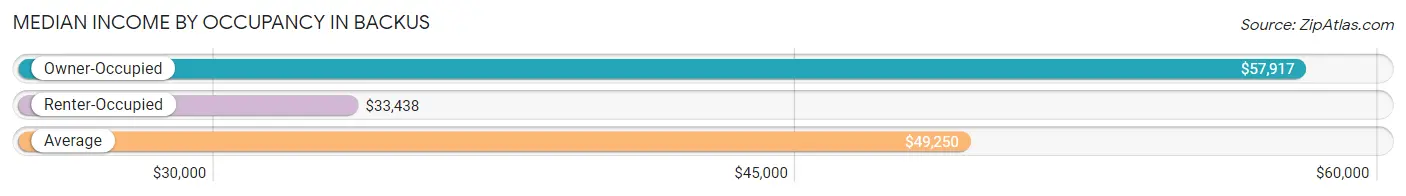
| Occupancy Type | # Households | Median Income |
| Owner-Occupied | 95 (77.9%) | $57,917 |
| Renter-Occupied | 27 (22.1%) | $33,438 |
| Average | 122 (100.0%) | $49,250 |
Occupancy by Householder Income Bracket in Backus
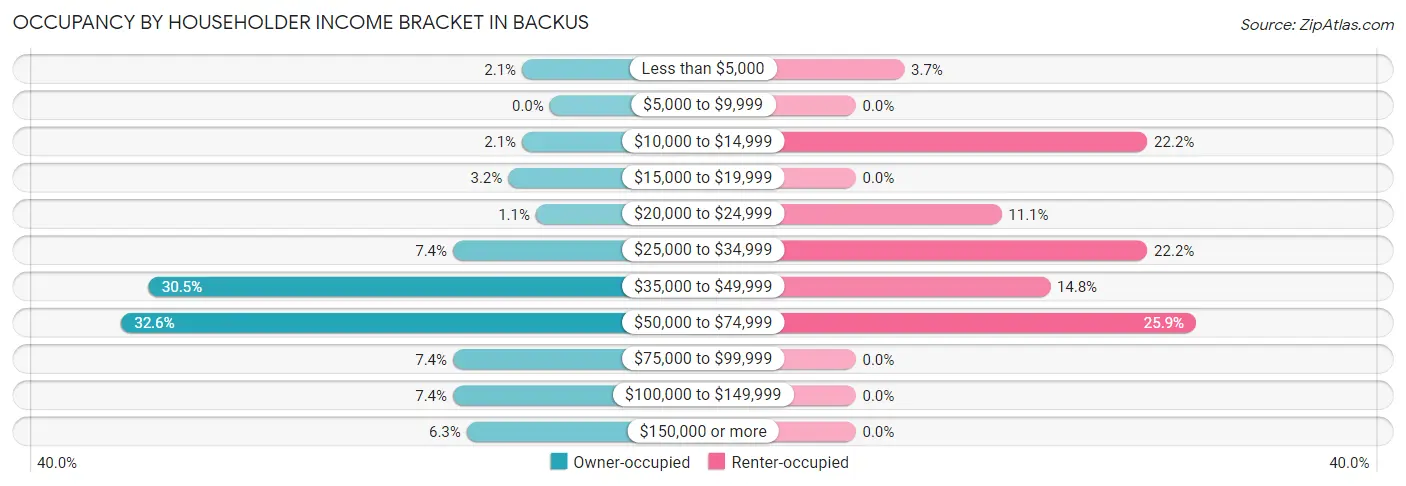
| Income Bracket | Owner-occupied | Renter-occupied |
| Less than $5,000 | 2 (2.1%) | 1 (3.7%) |
| $5,000 to $9,999 | 0 (0.0%) | 0 (0.0%) |
| $10,000 to $14,999 | 2 (2.1%) | 6 (22.2%) |
| $15,000 to $19,999 | 3 (3.2%) | 0 (0.0%) |
| $20,000 to $24,999 | 1 (1.1%) | 3 (11.1%) |
| $25,000 to $34,999 | 7 (7.4%) | 6 (22.2%) |
| $35,000 to $49,999 | 29 (30.5%) | 4 (14.8%) |
| $50,000 to $74,999 | 31 (32.6%) | 7 (25.9%) |
| $75,000 to $99,999 | 7 (7.4%) | 0 (0.0%) |
| $100,000 to $149,999 | 7 (7.4%) | 0 (0.0%) |
| $150,000 or more | 6 (6.3%) | 0 (0.0%) |
| Total | 95 (100.0%) | 27 (100.0%) |
Monthly Housing Cost Tiers in Backus
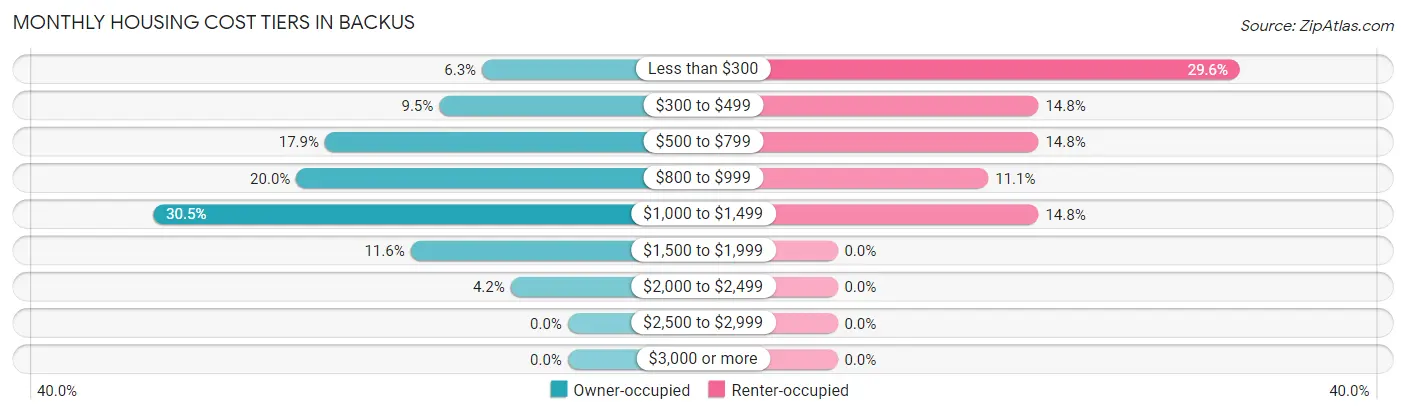
| Monthly Cost | Owner-occupied | Renter-occupied |
| Less than $300 | 6 (6.3%) | 8 (29.6%) |
| $300 to $499 | 9 (9.5%) | 4 (14.8%) |
| $500 to $799 | 17 (17.9%) | 4 (14.8%) |
| $800 to $999 | 19 (20.0%) | 3 (11.1%) |
| $1,000 to $1,499 | 29 (30.5%) | 4 (14.8%) |
| $1,500 to $1,999 | 11 (11.6%) | 0 (0.0%) |
| $2,000 to $2,499 | 4 (4.2%) | 0 (0.0%) |
| $2,500 to $2,999 | 0 (0.0%) | 0 (0.0%) |
| $3,000 or more | 0 (0.0%) | 0 (0.0%) |
| Total | 95 (100.0%) | 27 (100.0%) |
Physical Housing Characteristics in Backus
Housing Structures in Backus
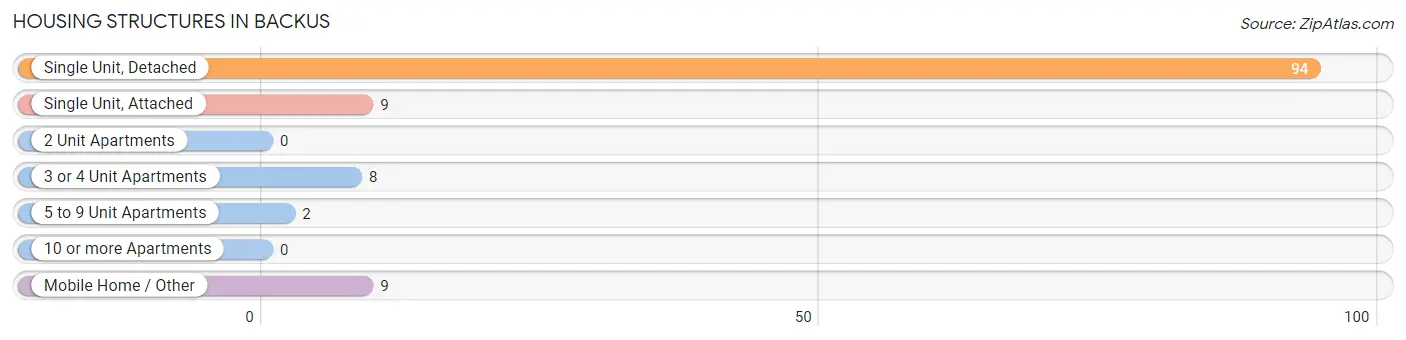
| Structure Type | # Housing Units | % Housing Units |
| Single Unit, Detached | 94 | 77.0% |
| Single Unit, Attached | 9 | 7.4% |
| 2 Unit Apartments | 0 | 0.0% |
| 3 or 4 Unit Apartments | 8 | 6.6% |
| 5 to 9 Unit Apartments | 2 | 1.6% |
| 10 or more Apartments | 0 | 0.0% |
| Mobile Home / Other | 9 | 7.4% |
| Total | 122 | 100.0% |
Housing Structures by Occupancy in Backus
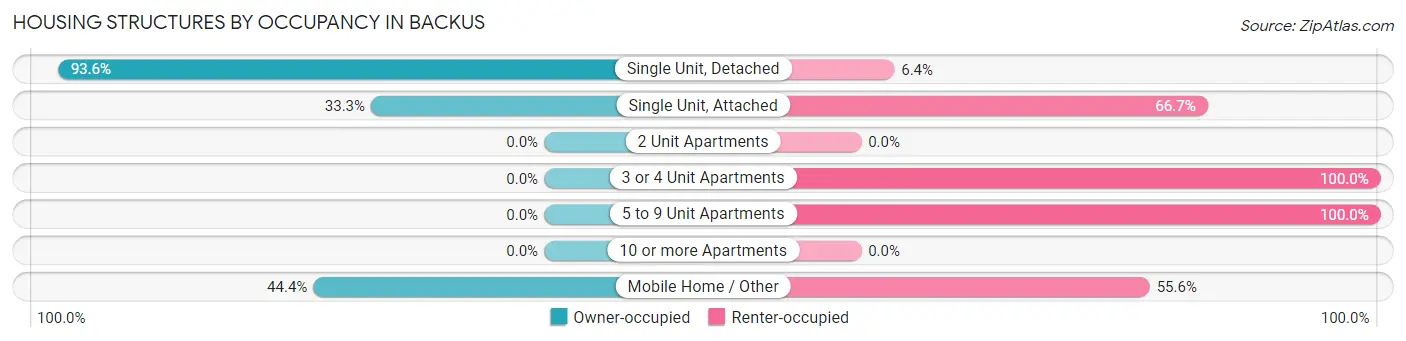
| Structure Type | Owner-occupied | Renter-occupied |
| Single Unit, Detached | 88 (93.6%) | 6 (6.4%) |
| Single Unit, Attached | 3 (33.3%) | 6 (66.7%) |
| 2 Unit Apartments | 0 (0.0%) | 0 (0.0%) |
| 3 or 4 Unit Apartments | 0 (0.0%) | 8 (100.0%) |
| 5 to 9 Unit Apartments | 0 (0.0%) | 2 (100.0%) |
| 10 or more Apartments | 0 (0.0%) | 0 (0.0%) |
| Mobile Home / Other | 4 (44.4%) | 5 (55.6%) |
| Total | 95 (77.9%) | 27 (22.1%) |
Housing Structures by Number of Rooms in Backus
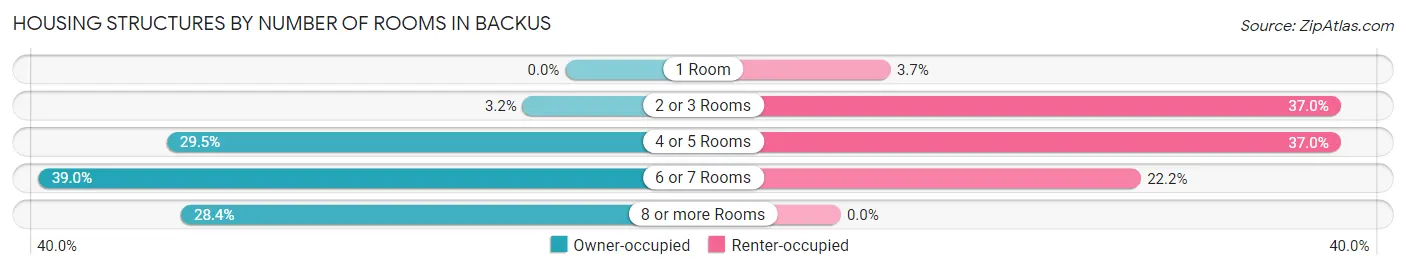
| Number of Rooms | Owner-occupied | Renter-occupied |
| 1 Room | 0 (0.0%) | 1 (3.7%) |
| 2 or 3 Rooms | 3 (3.2%) | 10 (37.0%) |
| 4 or 5 Rooms | 28 (29.5%) | 10 (37.0%) |
| 6 or 7 Rooms | 37 (39.0%) | 6 (22.2%) |
| 8 or more Rooms | 27 (28.4%) | 0 (0.0%) |
| Total | 95 (100.0%) | 27 (100.0%) |
Housing Structure by Heating Type in Backus
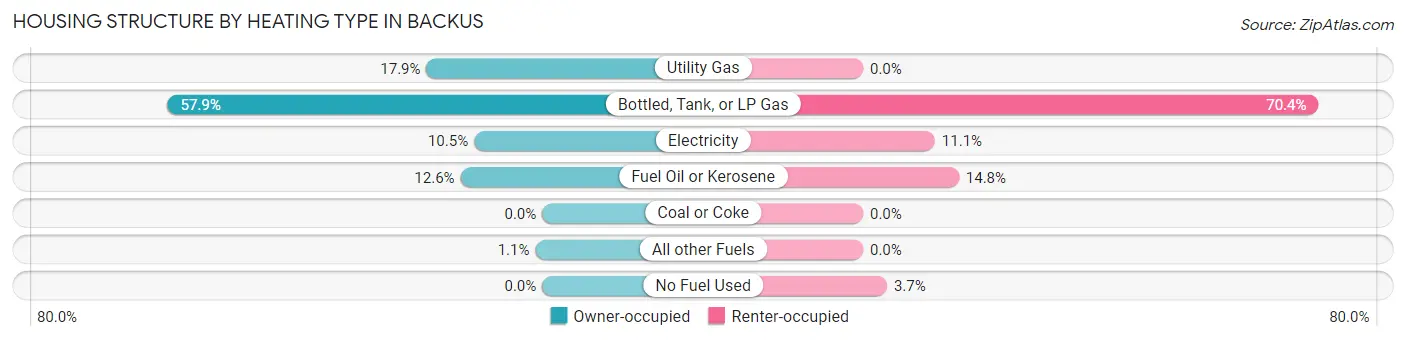
| Heating Type | Owner-occupied | Renter-occupied |
| Utility Gas | 17 (17.9%) | 0 (0.0%) |
| Bottled, Tank, or LP Gas | 55 (57.9%) | 19 (70.4%) |
| Electricity | 10 (10.5%) | 3 (11.1%) |
| Fuel Oil or Kerosene | 12 (12.6%) | 4 (14.8%) |
| Coal or Coke | 0 (0.0%) | 0 (0.0%) |
| All other Fuels | 1 (1.1%) | 0 (0.0%) |
| No Fuel Used | 0 (0.0%) | 1 (3.7%) |
| Total | 95 (100.0%) | 27 (100.0%) |
Household Vehicle Usage in Backus
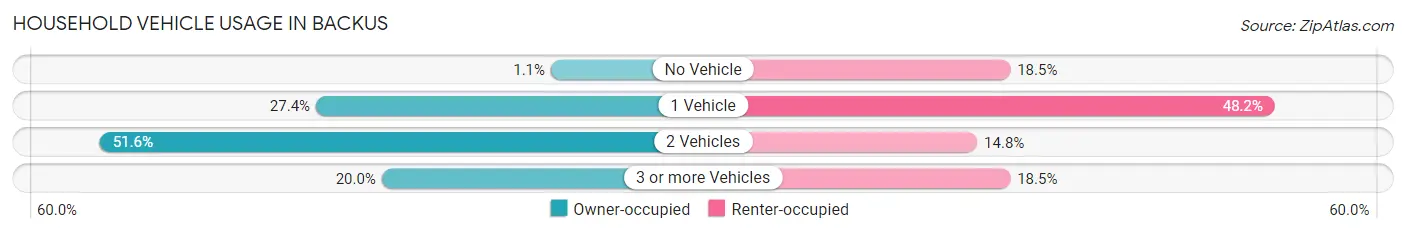
| Vehicles per Household | Owner-occupied | Renter-occupied |
| No Vehicle | 1 (1.1%) | 5 (18.5%) |
| 1 Vehicle | 26 (27.4%) | 13 (48.1%) |
| 2 Vehicles | 49 (51.6%) | 4 (14.8%) |
| 3 or more Vehicles | 19 (20.0%) | 5 (18.5%) |
| Total | 95 (100.0%) | 27 (100.0%) |
Real Estate & Mortgages in Backus
Real Estate and Mortgage Overview in Backus
| Characteristic | Without Mortgage | With Mortgage |
| Housing Units | 15 | 80 |
| Median Property Value | - | - |
| Median Household Income | $49,688 | $6 |
| Monthly Housing Costs | $525 | $0 |
| Real Estate Taxes | - | - |
Property Value by Mortgage Status in Backus
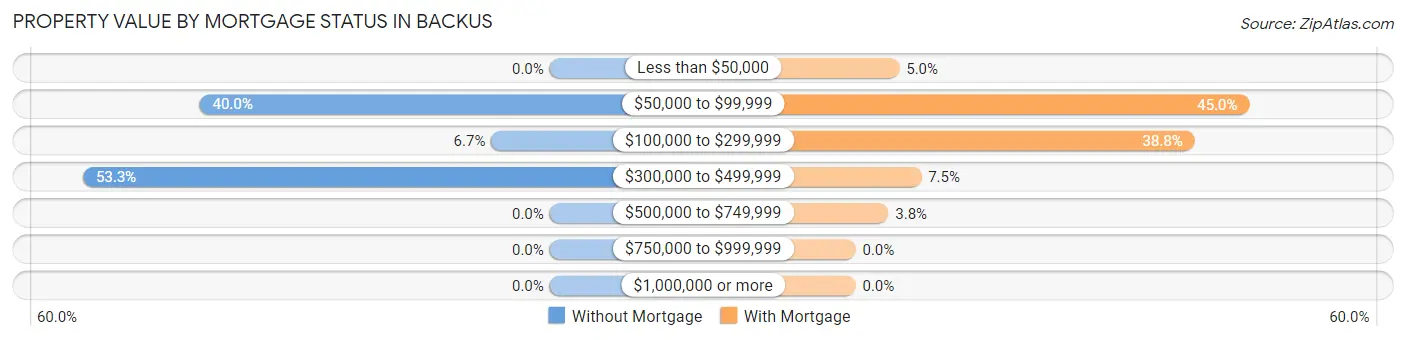
| Property Value | Without Mortgage | With Mortgage |
| Less than $50,000 | 0 (0.0%) | 4 (5.0%) |
| $50,000 to $99,999 | 6 (40.0%) | 36 (45.0%) |
| $100,000 to $299,999 | 1 (6.7%) | 31 (38.8%) |
| $300,000 to $499,999 | 8 (53.3%) | 6 (7.5%) |
| $500,000 to $749,999 | 0 (0.0%) | 3 (3.7%) |
| $750,000 to $999,999 | 0 (0.0%) | 0 (0.0%) |
| $1,000,000 or more | 0 (0.0%) | 0 (0.0%) |
| Total | 15 (100.0%) | 80 (100.0%) |
Household Income by Mortgage Status in Backus
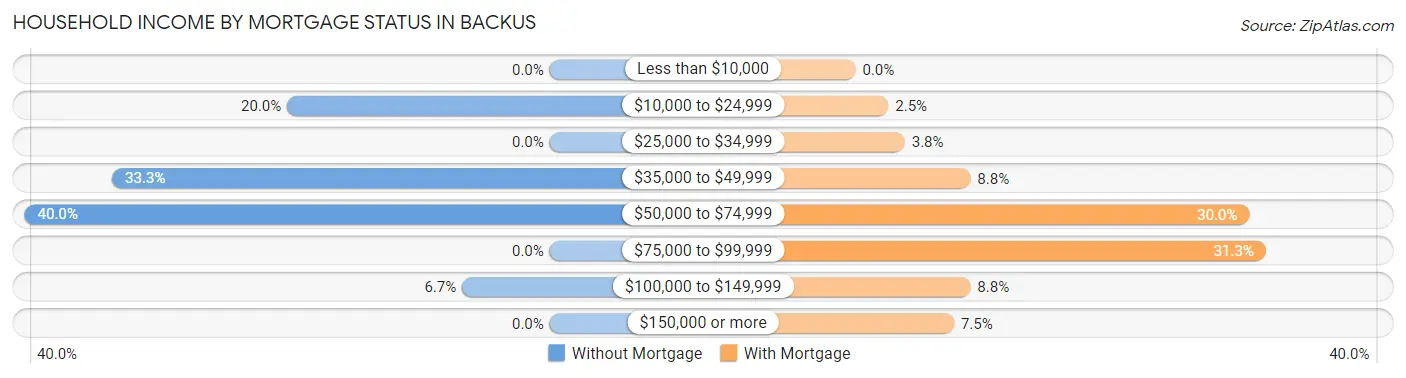
| Household Income | Without Mortgage | With Mortgage |
| Less than $10,000 | 0 (0.0%) | 0 (0.0%) |
| $10,000 to $24,999 | 3 (20.0%) | 2 (2.5%) |
| $25,000 to $34,999 | 0 (0.0%) | 3 (3.7%) |
| $35,000 to $49,999 | 5 (33.3%) | 7 (8.7%) |
| $50,000 to $74,999 | 6 (40.0%) | 24 (30.0%) |
| $75,000 to $99,999 | 0 (0.0%) | 25 (31.2%) |
| $100,000 to $149,999 | 1 (6.7%) | 7 (8.7%) |
| $150,000 or more | 0 (0.0%) | 6 (7.5%) |
| Total | 15 (100.0%) | 80 (100.0%) |
Property Value to Household Income Ratio in Backus
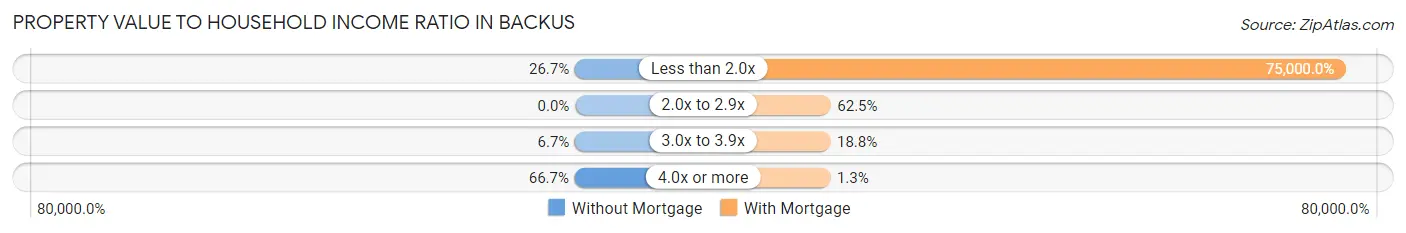
| Value-to-Income Ratio | Without Mortgage | With Mortgage |
| Less than 2.0x | 4 (26.7%) | 60,000 (75,000.0%) |
| 2.0x to 2.9x | 0 (0.0%) | 50 (62.5%) |
| 3.0x to 3.9x | 1 (6.7%) | 15 (18.8%) |
| 4.0x or more | 10 (66.7%) | 1 (1.3%) |
| Total | 15 (100.0%) | 80 (100.0%) |
Real Estate Taxes by Mortgage Status in Backus
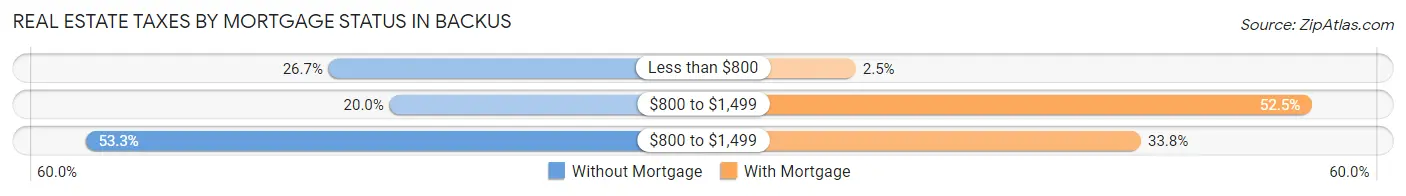
| Property Taxes | Without Mortgage | With Mortgage |
| Less than $800 | 4 (26.7%) | 2 (2.5%) |
| $800 to $1,499 | 3 (20.0%) | 42 (52.5%) |
| $800 to $1,499 | 8 (53.3%) | 27 (33.8%) |
| Total | 15 (100.0%) | 80 (100.0%) |
Health & Disability in Backus
Health Insurance Coverage by Age in Backus
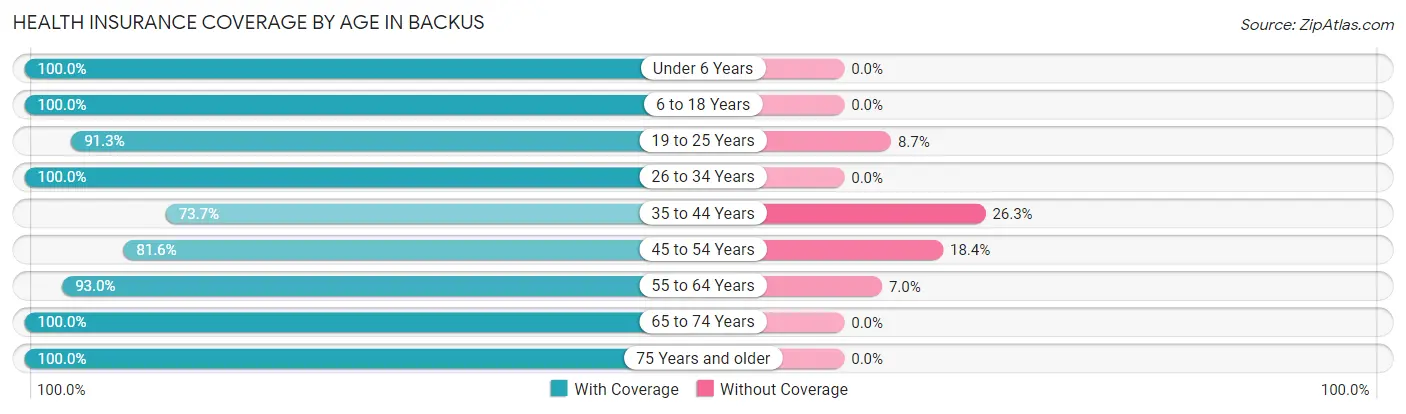
| Age Bracket | With Coverage | Without Coverage |
| Under 6 Years | 59 (100.0%) | 0 (0.0%) |
| 6 to 18 Years | 34 (100.0%) | 0 (0.0%) |
| 19 to 25 Years | 21 (91.3%) | 2 (8.7%) |
| 26 to 34 Years | 33 (100.0%) | 0 (0.0%) |
| 35 to 44 Years | 14 (73.7%) | 5 (26.3%) |
| 45 to 54 Years | 31 (81.6%) | 7 (18.4%) |
| 55 to 64 Years | 53 (93.0%) | 4 (7.0%) |
| 65 to 74 Years | 38 (100.0%) | 0 (0.0%) |
| 75 Years and older | 19 (100.0%) | 0 (0.0%) |
| Total | 302 (94.4%) | 18 (5.6%) |
Health Insurance Coverage by Citizenship Status in Backus
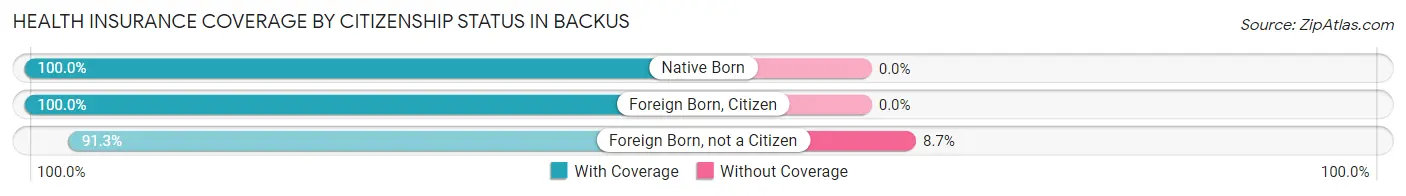
| Citizenship Status | With Coverage | Without Coverage |
| Native Born | 59 (100.0%) | 0 (0.0%) |
| Foreign Born, Citizen | 34 (100.0%) | 0 (0.0%) |
| Foreign Born, not a Citizen | 21 (91.3%) | 2 (8.7%) |
Health Insurance Coverage by Household Income in Backus
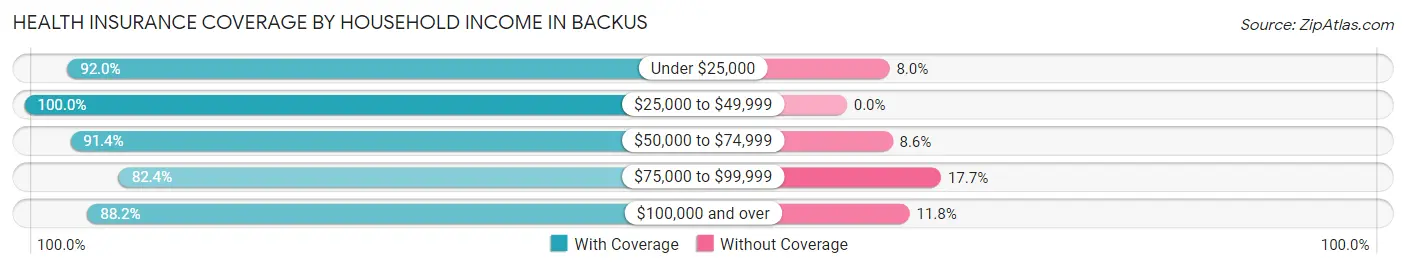
| Household Income | With Coverage | Without Coverage |
| Under $25,000 | 23 (92.0%) | 2 (8.0%) |
| $25,000 to $49,999 | 139 (100.0%) | 0 (0.0%) |
| $50,000 to $74,999 | 96 (91.4%) | 9 (8.6%) |
| $75,000 to $99,999 | 14 (82.4%) | 3 (17.6%) |
| $100,000 and over | 30 (88.2%) | 4 (11.8%) |
Public vs Private Health Insurance Coverage by Age in Backus
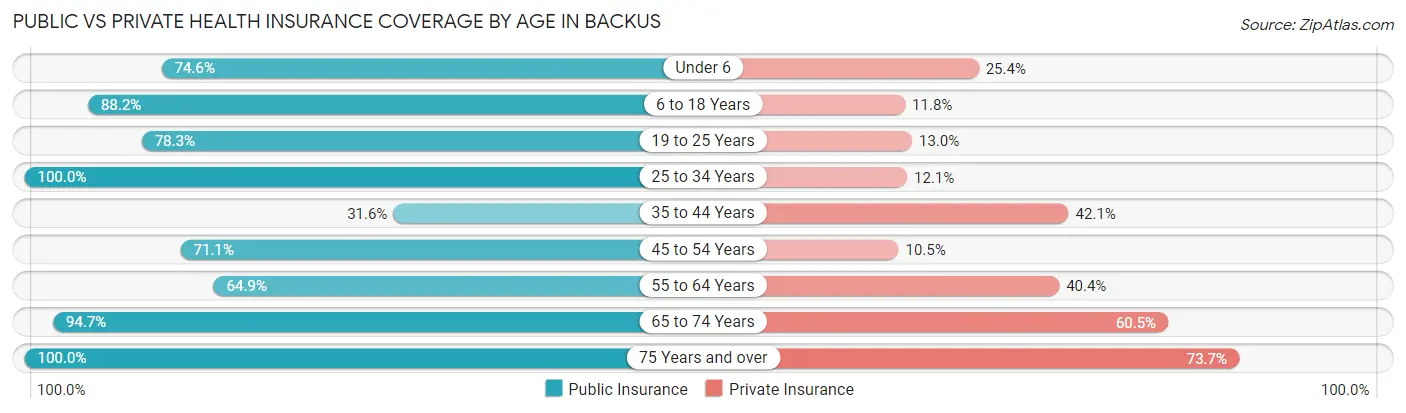
| Age Bracket | Public Insurance | Private Insurance |
| Under 6 | 44 (74.6%) | 15 (25.4%) |
| 6 to 18 Years | 30 (88.2%) | 4 (11.8%) |
| 19 to 25 Years | 18 (78.3%) | 3 (13.0%) |
| 25 to 34 Years | 33 (100.0%) | 4 (12.1%) |
| 35 to 44 Years | 6 (31.6%) | 8 (42.1%) |
| 45 to 54 Years | 27 (71.1%) | 4 (10.5%) |
| 55 to 64 Years | 37 (64.9%) | 23 (40.4%) |
| 65 to 74 Years | 36 (94.7%) | 23 (60.5%) |
| 75 Years and over | 19 (100.0%) | 14 (73.7%) |
| Total | 250 (78.1%) | 98 (30.6%) |
Disability Status by Sex by Age in Backus
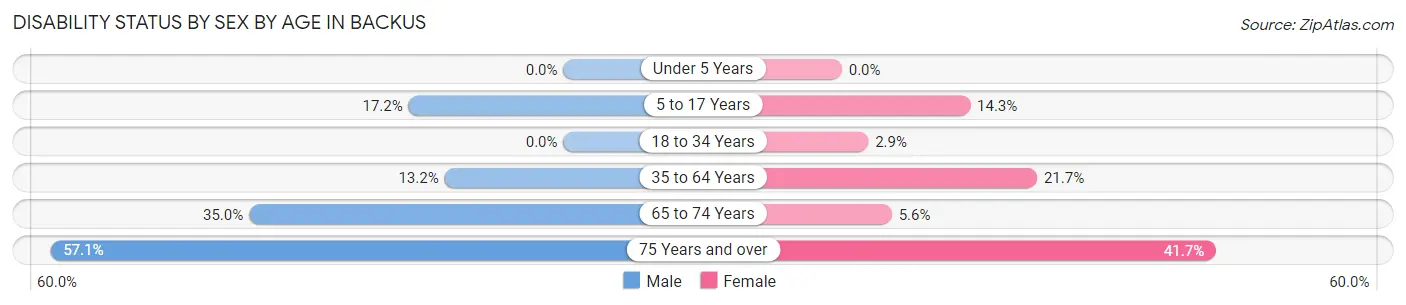
| Age Bracket | Male | Female |
| Under 5 Years | 0 (0.0%) | 0 (0.0%) |
| 5 to 17 Years | 5 (17.2%) | 2 (14.3%) |
| 18 to 34 Years | 0 (0.0%) | 1 (2.9%) |
| 35 to 64 Years | 9 (13.2%) | 10 (21.7%) |
| 65 to 74 Years | 7 (35.0%) | 1 (5.6%) |
| 75 Years and over | 4 (57.1%) | 5 (41.7%) |
Disability Class by Sex by Age in Backus
Disability Class: Hearing Difficulty
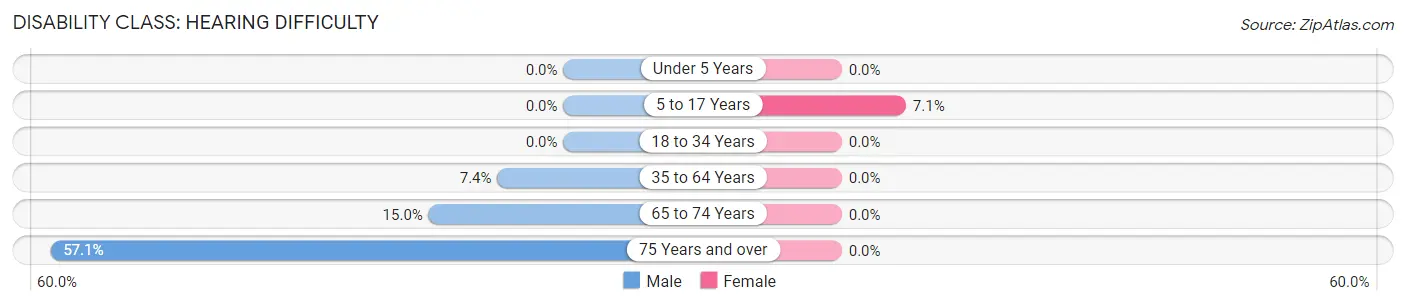
| Age Bracket | Male | Female |
| Under 5 Years | 0 (0.0%) | 0 (0.0%) |
| 5 to 17 Years | 0 (0.0%) | 1 (7.1%) |
| 18 to 34 Years | 0 (0.0%) | 0 (0.0%) |
| 35 to 64 Years | 5 (7.3%) | 0 (0.0%) |
| 65 to 74 Years | 3 (15.0%) | 0 (0.0%) |
| 75 Years and over | 4 (57.1%) | 0 (0.0%) |
Disability Class: Vision Difficulty
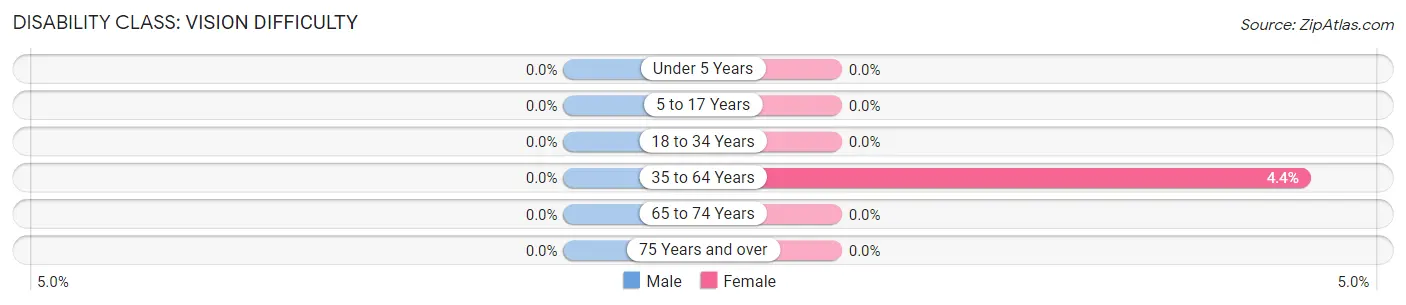
| Age Bracket | Male | Female |
| Under 5 Years | 0 (0.0%) | 0 (0.0%) |
| 5 to 17 Years | 0 (0.0%) | 0 (0.0%) |
| 18 to 34 Years | 0 (0.0%) | 0 (0.0%) |
| 35 to 64 Years | 0 (0.0%) | 2 (4.3%) |
| 65 to 74 Years | 0 (0.0%) | 0 (0.0%) |
| 75 Years and over | 0 (0.0%) | 0 (0.0%) |
Disability Class: Cognitive Difficulty
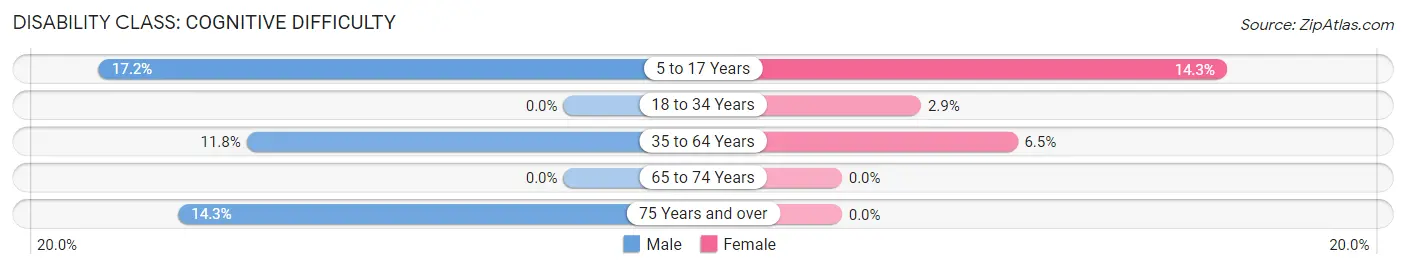
| Age Bracket | Male | Female |
| 5 to 17 Years | 5 (17.2%) | 2 (14.3%) |
| 18 to 34 Years | 0 (0.0%) | 1 (2.9%) |
| 35 to 64 Years | 8 (11.8%) | 3 (6.5%) |
| 65 to 74 Years | 0 (0.0%) | 0 (0.0%) |
| 75 Years and over | 1 (14.3%) | 0 (0.0%) |
Disability Class: Ambulatory Difficulty
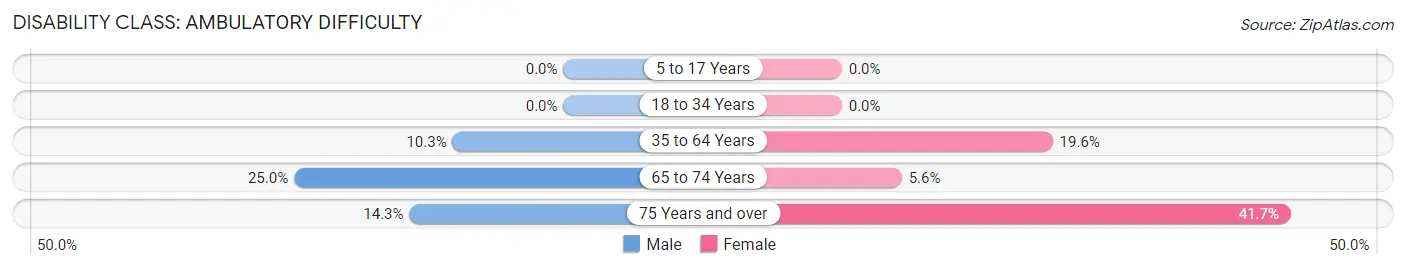
| Age Bracket | Male | Female |
| 5 to 17 Years | 0 (0.0%) | 0 (0.0%) |
| 18 to 34 Years | 0 (0.0%) | 0 (0.0%) |
| 35 to 64 Years | 7 (10.3%) | 9 (19.6%) |
| 65 to 74 Years | 5 (25.0%) | 1 (5.6%) |
| 75 Years and over | 1 (14.3%) | 5 (41.7%) |
Disability Class: Self-Care Difficulty
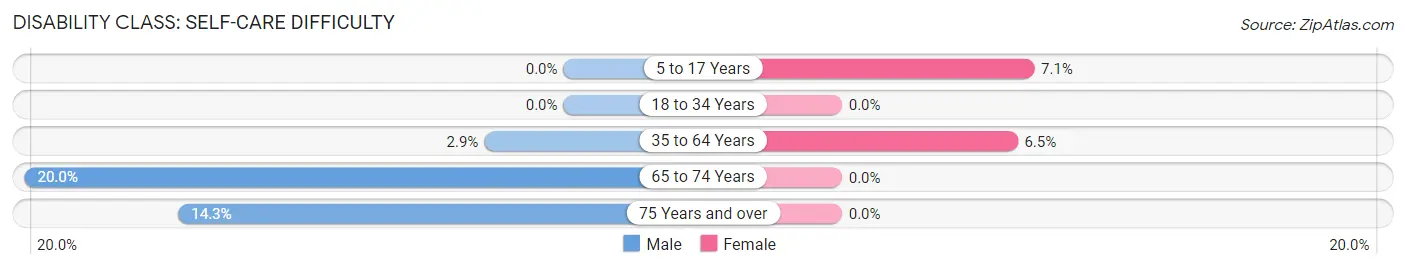
| Age Bracket | Male | Female |
| 5 to 17 Years | 0 (0.0%) | 1 (7.1%) |
| 18 to 34 Years | 0 (0.0%) | 0 (0.0%) |
| 35 to 64 Years | 2 (2.9%) | 3 (6.5%) |
| 65 to 74 Years | 4 (20.0%) | 0 (0.0%) |
| 75 Years and over | 1 (14.3%) | 0 (0.0%) |
Technology Access in Backus
Computing Device Access in Backus
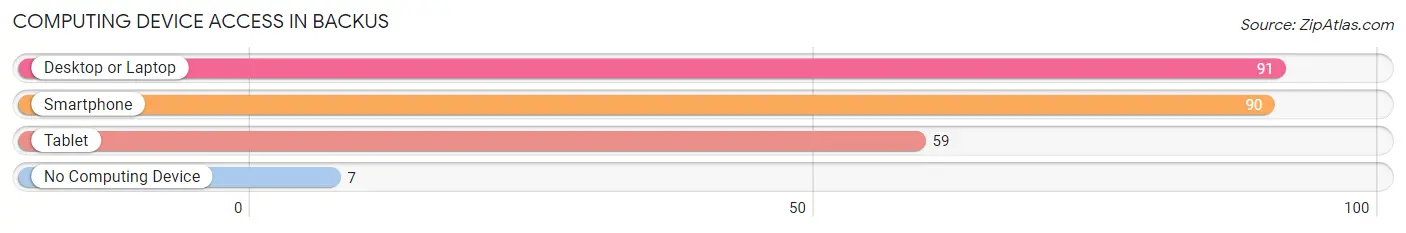
| Device Type | # Households | % Households |
| Desktop or Laptop | 91 | 74.6% |
| Smartphone | 90 | 73.8% |
| Tablet | 59 | 48.4% |
| No Computing Device | 7 | 5.7% |
| Total | 122 | 100.0% |
Internet Access in Backus
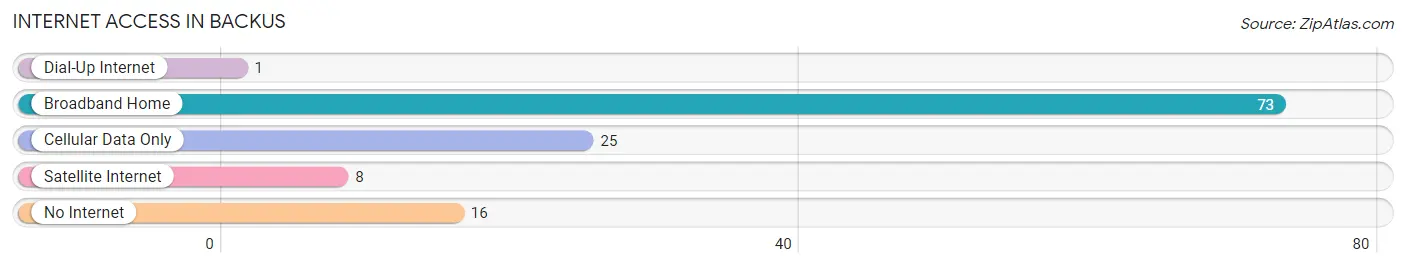
| Internet Type | # Households | % Households |
| Dial-Up Internet | 1 | 0.8% |
| Broadband Home | 73 | 59.8% |
| Cellular Data Only | 25 | 20.5% |
| Satellite Internet | 8 | 6.6% |
| No Internet | 16 | 13.1% |
| Total | 122 | 100.0% |
Backus Summary
Backus is a small city located in Cass County, Minnesota. It is situated on the south shore of Pine Mountain Lake, and is part of the Brainerd Micropolitan Statistical Area. The city has a population of approximately 1,000 people, and is known for its small-town charm and outdoor recreation opportunities.
History
Backus was founded in 1887 by a group of settlers from Wisconsin. The city was named after the Backus family, who were among the first settlers in the area. The city was originally a logging and farming community, and the first post office was established in 1891.
In the early 1900s, the city began to grow and develop. The first school was built in 1910, and the first church was built in 1912. The city was incorporated in 1914, and the first mayor was elected in 1915.
In the 1920s, the city began to attract tourists, and the first resort was built on Pine Mountain Lake. The city continued to grow and develop throughout the 20th century, and today it is a popular destination for outdoor recreation.
Geography
Backus is located in the north-central part of Minnesota, in Cass County. It is situated on the south shore of Pine Mountain Lake, and is surrounded by forests and lakes. The city is located approximately 30 miles north of Brainerd, and is part of the Brainerd Micropolitan Statistical Area.
The city has a total area of 1.2 square miles, all of which is land. The terrain is mostly flat, with some rolling hills. The climate is humid continental, with cold winters and warm summers.
Economy
The economy of Backus is largely based on tourism and outdoor recreation. The city is home to several resorts and campgrounds, as well as a variety of outdoor activities such as fishing, hunting, and boating. The city also has a few small businesses, including a grocery store, a hardware store, and a few restaurants.
Demographics
As of the 2010 census, the population of Backus was 1,000 people. The racial makeup of the city was 97.2% White, 0.7% African American, 0.3% Native American, 0.2% Asian, 0.1% Pacific Islander, and 1.5% from other races. The median household income was $41,250, and the median family income was $48,750.
The city has a high rate of homeownership, with approximately 75% of the population owning their own homes. The city also has a high rate of educational attainment, with over 90% of the population having at least a high school diploma.
Conclusion
Backus is a small city located in Cass County, Minnesota. It is situated on the south shore of Pine Mountain Lake, and is part of the Brainerd Micropolitan Statistical Area. The city has a population of approximately 1,000 people, and is known for its small-town charm and outdoor recreation opportunities. The economy of Backus is largely based on tourism and outdoor recreation, and the city has a high rate of homeownership and educational attainment.
Common Questions
What is the Total Population of Backus?
Total Population of Backus is 320.
What is the Total Male Population of Backus?
Total Male Population of Backus is 181.
What is the Total Female Population of Backus?
Total Female Population of Backus is 139.
What is the Ratio of Males per 100 Females in Backus?
There are 130.22 Males per 100 Females in Backus.
What is the Ratio of Females per 100 Males in Backus?
There are 76.80 Females per 100 Males in Backus.
What is the Median Population Age in Backus?
Median Population Age in Backus is 44.0 Years.
What is the Average Family Size in Backus
Average Family Size in Backus is 3.0 People.
What is the Average Household Size in Backus
Average Household Size in Backus is 2.6 People.
What is Per Capita Income in Backus?
Per Capita income in Backus is $25,001.
What is the Median Family Income in Backus?
Median Family Income in Backus is $50,417.
What is the Median Household income in Backus?
Median Household Income in Backus is $49,250.
What is Income or Wage Gap in Backus?
Income or Wage Gap in Backus is 39.6%.
Women in Backus earn 60.4 cents for every dollar earned by a man.
What is Inequality or Gini Index in Backus?
Inequality or Gini Index in Backus is 0.39.
How Large is the Labor Force in Backus?
There are 132 People in the Labor Forcein in Backus.
What is the Percentage of People in the Labor Force in Backus?
57.1% of People are in the Labor Force in Backus.
What is the Unemployment Rate in Backus?
Unemployment Rate in Backus is 1.5%.