The Lakes, MN
The Lakes Map
The Lakes Overview
647
TOTAL POPULATION
317
MALE POPULATION
330
FEMALE POPULATION
96.06
MALES / 100 FEMALES
104.10
FEMALES / 100 MALES
63.7
MEDIAN AGE
2.3
AVG FAMILY SIZE
2.0
AVG HOUSEHOLD SIZE
$55,226
PER CAPITA INCOME
$107,917
AVG FAMILY INCOME
$85,833
AVG HOUSEHOLD INCOME
31.2%
WAGE / INCOME GAP [ % ]
68.8¢/ $1
WAGE / INCOME GAP [ $ ]
0.39
INEQUALITY / GINI INDEX
347
LABOR FORCE [ PEOPLE ]
56.6%
PERCENT IN LABOR FORCE
2.3%
UNEMPLOYMENT RATE
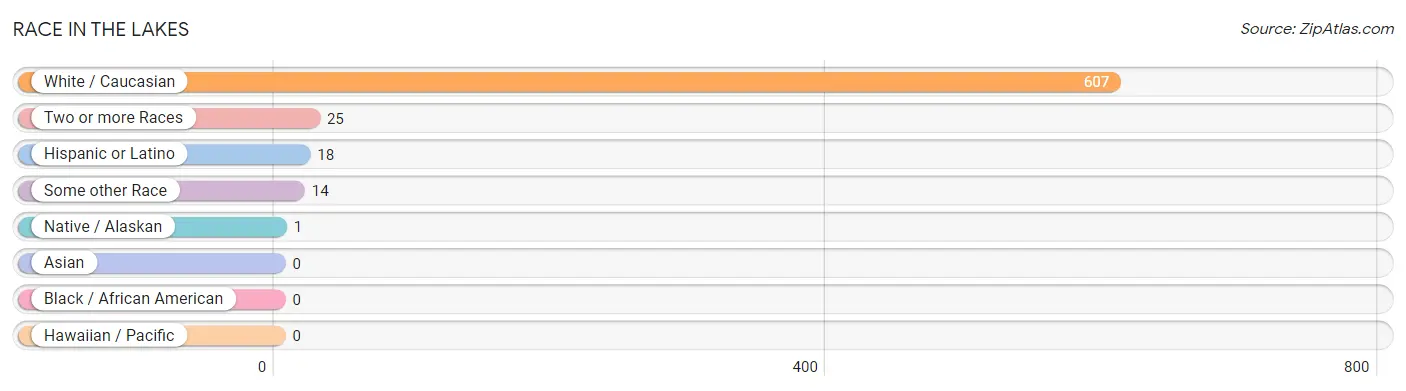
Race in The Lakes
The most populous races in The Lakes are White / Caucasian (607 | 93.8%), Two or more Races (25 | 3.9%), and Hispanic or Latino (18 | 2.8%).
| Race | # Population | % Population |
| Asian | 0 | 0.0% |
| Black / African American | 0 | 0.0% |
| Hawaiian / Pacific | 0 | 0.0% |
| Hispanic or Latino | 18 | 2.8% |
| Native / Alaskan | 1 | 0.2% |
| White / Caucasian | 607 | 93.8% |
| Two or more Races | 25 | 3.9% |
| Some other Race | 14 | 2.2% |
| Total | 647 | 100.0% |
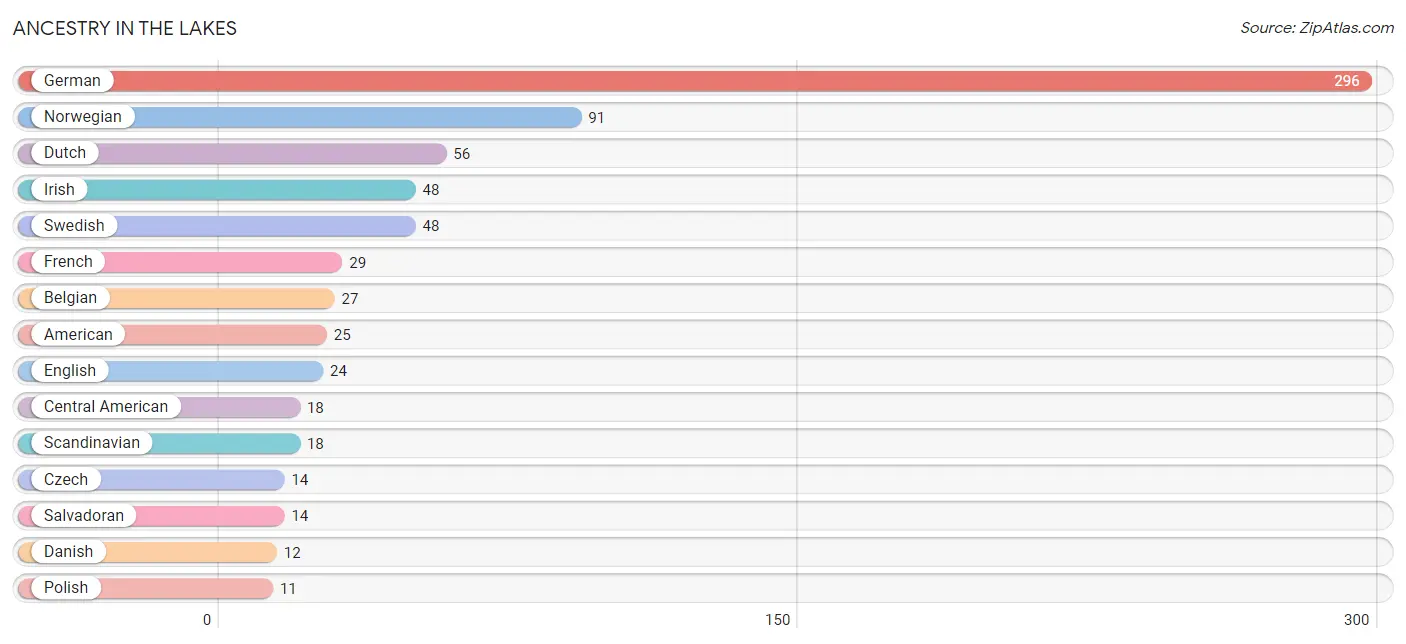
Ancestry in The Lakes
The most populous ancestries reported in The Lakes are German (296 | 45.8%), Norwegian (91 | 14.1%), Dutch (56 | 8.7%), Irish (48 | 7.4%), and Swedish (48 | 7.4%), together accounting for 83.3% of all The Lakes residents.
| Ancestry | # Population | % Population |
| American | 25 | 3.9% |
| Austrian | 2 | 0.3% |
| Belgian | 27 | 4.2% |
| Burmese | 3 | 0.5% |
| Central American | 18 | 2.8% |
| Central American Indian | 4 | 0.6% |
| Czech | 14 | 2.2% |
| Czechoslovakian | 1 | 0.2% |
| Danish | 12 | 1.8% |
| Dutch | 56 | 8.7% |
| English | 24 | 3.7% |
| European | 10 | 1.5% |
| French | 29 | 4.5% |
| French Canadian | 4 | 0.6% |
| German | 296 | 45.8% |
| Guatemalan | 4 | 0.6% |
| Irish | 48 | 7.4% |
| Italian | 4 | 0.6% |
| Luxembourger | 1 | 0.2% |
| Norwegian | 91 | 14.1% |
| Polish | 11 | 1.7% |
| Russian | 3 | 0.5% |
| Salvadoran | 14 | 2.2% |
| Scandinavian | 18 | 2.8% |
| Scotch-Irish | 4 | 0.6% |
| Swedish | 48 | 7.4% |
| Ukrainian | 1 | 0.2% |
| Welsh | 4 | 0.6% | View All 28 Rows |
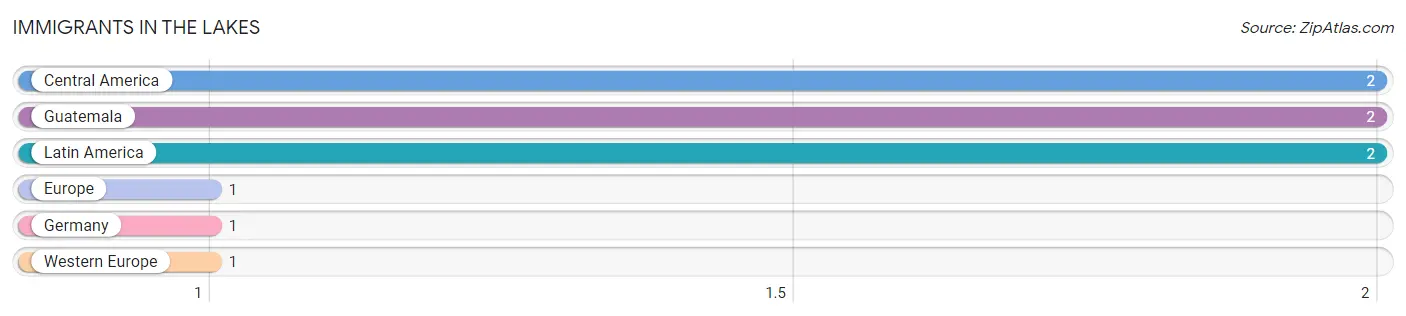
Immigrants in The Lakes
The most numerous immigrant groups reported in The Lakes came from Central America (2 | 0.3%), Guatemala (2 | 0.3%), Latin America (2 | 0.3%), Europe (1 | 0.2%), and Germany (1 | 0.2%), together accounting for 1.2% of all The Lakes residents.
| Immigration Origin | # Population | % Population |
| Central America | 2 | 0.3% |
| Europe | 1 | 0.2% |
| Germany | 1 | 0.2% |
| Guatemala | 2 | 0.3% |
| Latin America | 2 | 0.3% |
| Western Europe | 1 | 0.2% | View All 6 Rows |
Sex and Age in The Lakes
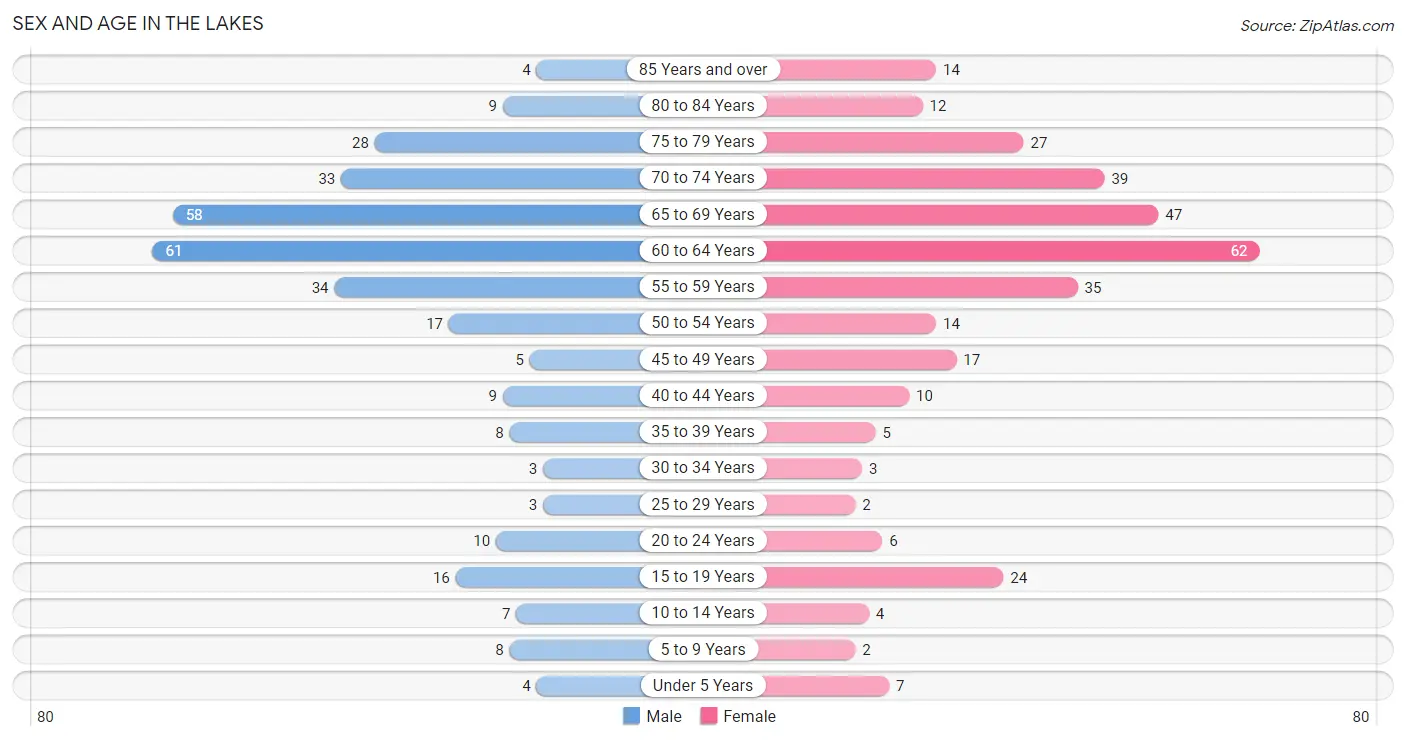
Sex and Age in The Lakes
The most populous age groups in The Lakes are 60 to 64 Years (61 | 19.2%) for men and 60 to 64 Years (62 | 18.8%) for women.
| Age Bracket | Male | Female |
| Under 5 Years | 4 (1.3%) | 7 (2.1%) |
| 5 to 9 Years | 8 (2.5%) | 2 (0.6%) |
| 10 to 14 Years | 7 (2.2%) | 4 (1.2%) |
| 15 to 19 Years | 16 (5.1%) | 24 (7.3%) |
| 20 to 24 Years | 10 (3.2%) | 6 (1.8%) |
| 25 to 29 Years | 3 (0.9%) | 2 (0.6%) |
| 30 to 34 Years | 3 (0.9%) | 3 (0.9%) |
| 35 to 39 Years | 8 (2.5%) | 5 (1.5%) |
| 40 to 44 Years | 9 (2.8%) | 10 (3.0%) |
| 45 to 49 Years | 5 (1.6%) | 17 (5.1%) |
| 50 to 54 Years | 17 (5.4%) | 14 (4.2%) |
| 55 to 59 Years | 34 (10.7%) | 35 (10.6%) |
| 60 to 64 Years | 61 (19.2%) | 62 (18.8%) |
| 65 to 69 Years | 58 (18.3%) | 47 (14.2%) |
| 70 to 74 Years | 33 (10.4%) | 39 (11.8%) |
| 75 to 79 Years | 28 (8.8%) | 27 (8.2%) |
| 80 to 84 Years | 9 (2.8%) | 12 (3.6%) |
| 85 Years and over | 4 (1.3%) | 14 (4.2%) |
| Total | 317 (100.0%) | 330 (100.0%) |
Families and Households in The Lakes
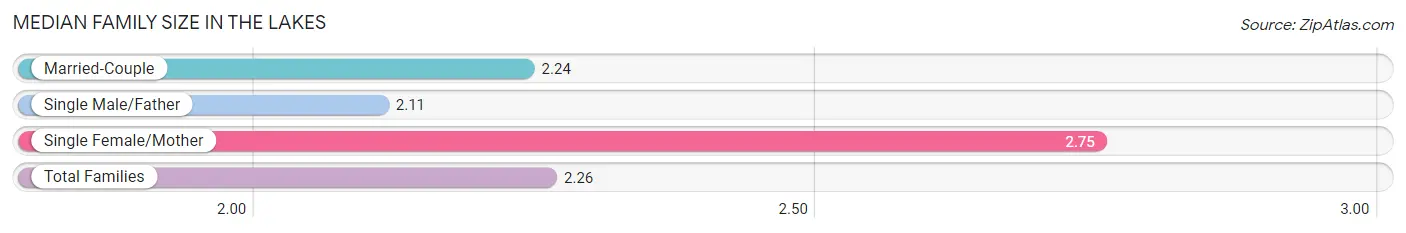
Median Family Size in The Lakes
The median family size in The Lakes is 2.26 persons per family, with single female/mother families (12 | 5.0%) accounting for the largest median family size of 2.75 persons per family. On the other hand, single male/father families (9 | 3.7%) represent the smallest median family size with 2.11 persons per family.
| Family Type | # Families | Family Size |
| Married-Couple | 220 (91.3%) | 2.24 |
| Single Male/Father | 9 (3.7%) | 2.11 |
| Single Female/Mother | 12 (5.0%) | 2.75 |
| Total Families | 241 (100.0%) | 2.26 |
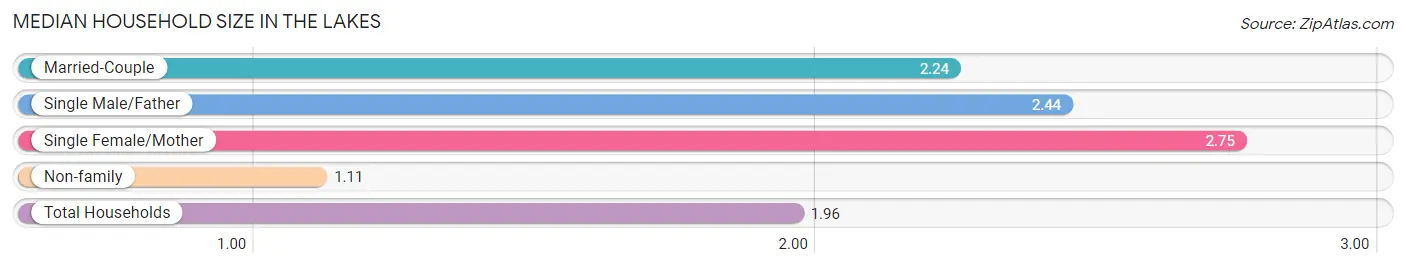
Median Household Size in The Lakes
The median household size in The Lakes is 1.96 persons per household, with single female/mother households (12 | 3.6%) accounting for the largest median household size of 2.75 persons per household. non-family households (89 | 27.0%) represent the smallest median household size with 1.11 persons per household.
| Household Type | # Households | Household Size |
| Married-Couple | 220 (66.7%) | 2.24 |
| Single Male/Father | 9 (2.7%) | 2.44 |
| Single Female/Mother | 12 (3.6%) | 2.75 |
| Non-family | 89 (27.0%) | 1.11 |
| Total Households | 330 (100.0%) | 1.96 |
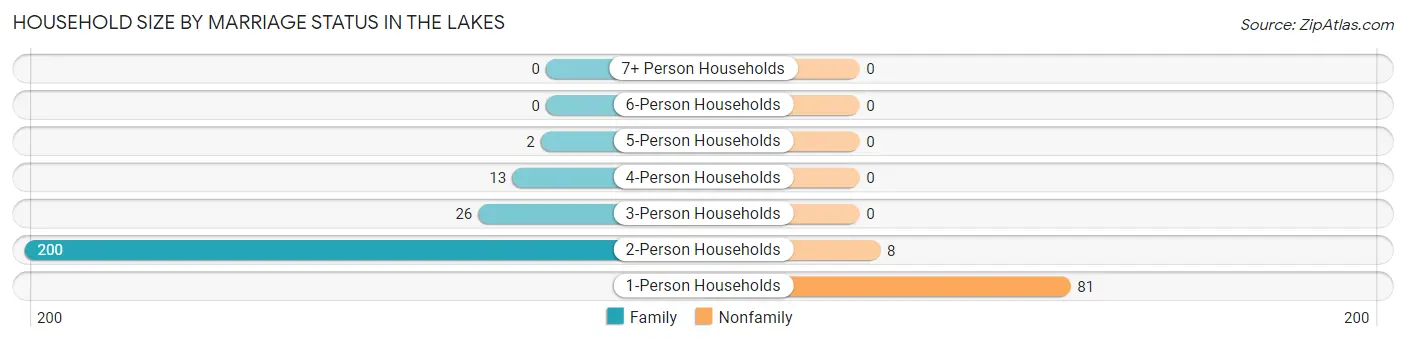
Household Size by Marriage Status in The Lakes
Out of a total of 330 households in The Lakes, 241 (73.0%) are family households, while 89 (27.0%) are nonfamily households. The most numerous type of family households are 2-person households, comprising 200, and the most common type of nonfamily households are 1-person households, comprising 81.
| Household Size | Family Households | Nonfamily Households |
| 1-Person Households | - | 81 (24.5%) |
| 2-Person Households | 200 (60.6%) | 8 (2.4%) |
| 3-Person Households | 26 (7.9%) | 0 (0.0%) |
| 4-Person Households | 13 (3.9%) | 0 (0.0%) |
| 5-Person Households | 2 (0.6%) | 0 (0.0%) |
| 6-Person Households | 0 (0.0%) | 0 (0.0%) |
| 7+ Person Households | 0 (0.0%) | 0 (0.0%) |
| Total | 241 (73.0%) | 89 (27.0%) |
Female Fertility in The Lakes
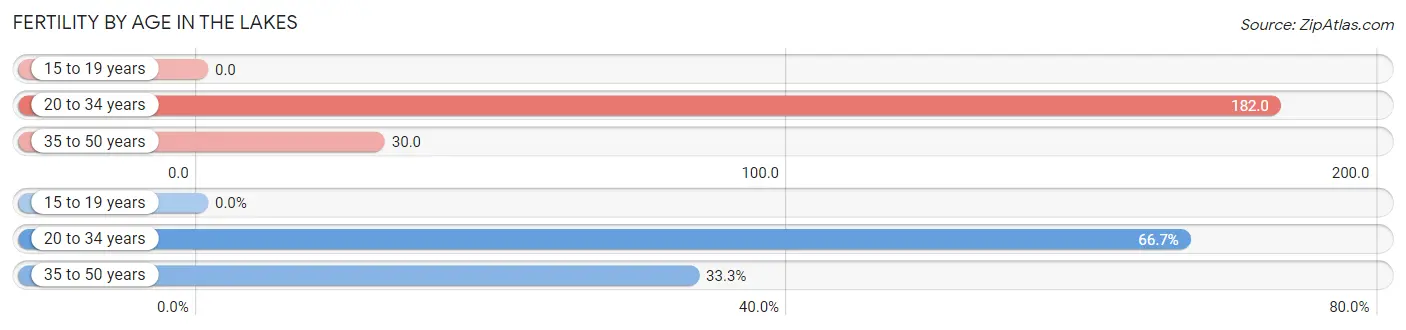
Fertility by Age in The Lakes
Average fertility rate in The Lakes is 44.0 births per 1,000 women. Women in the age bracket of 20 to 34 years have the highest fertility rate with 182.0 births per 1,000 women. Women in the age bracket of 20 to 34 years acount for 66.7% of all women with births.
| Age Bracket | Women with Births | Births / 1,000 Women |
| 15 to 19 years | 0 (0.0%) | 0.0 |
| 20 to 34 years | 2 (66.7%) | 182.0 |
| 35 to 50 years | 1 (33.3%) | 30.0 |
| Total | 3 (100.0%) | 44.0 |
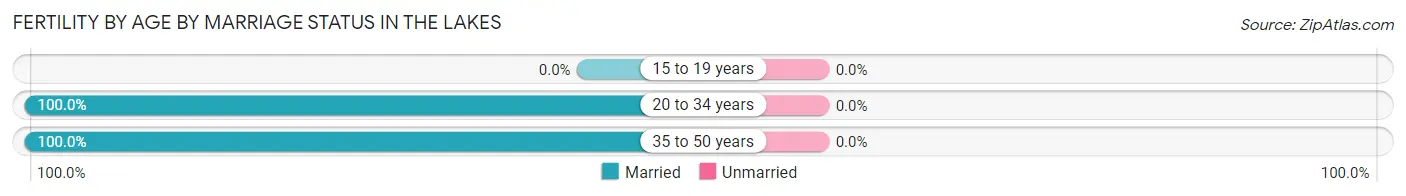
Fertility by Age by Marriage Status in The Lakes
| Age Bracket | Married | Unmarried |
| 15 to 19 years | 0 (0.0%) | 0 (0.0%) |
| 20 to 34 years | 2 (100.0%) | 0 (0.0%) |
| 35 to 50 years | 1 (100.0%) | 0 (0.0%) |
| Total | 3 (100.0%) | 0 (0.0%) |
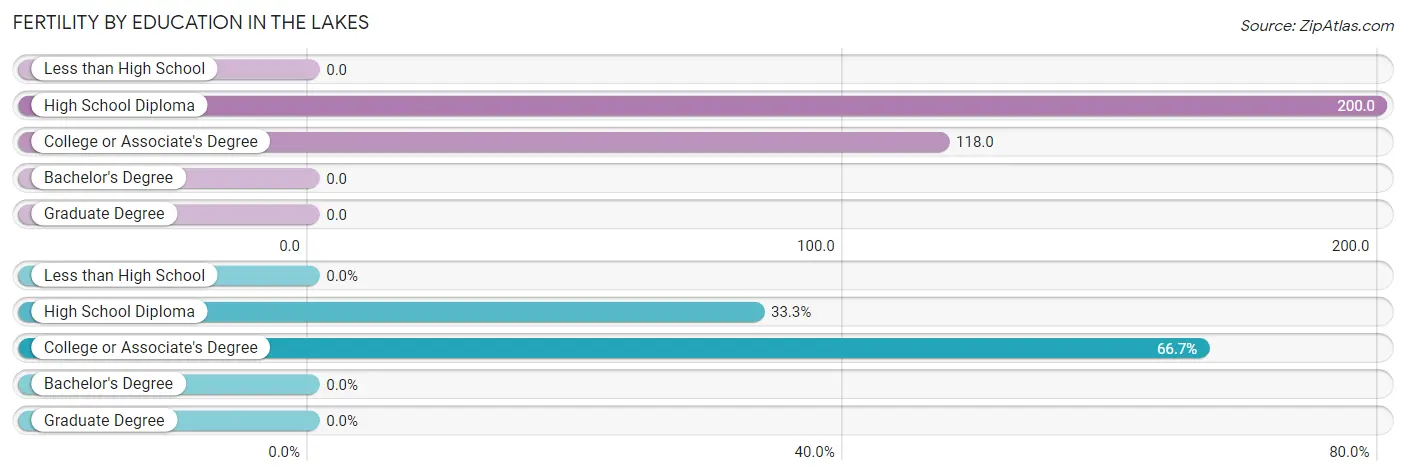
Fertility by Education in The Lakes
| Educational Attainment | Women with Births | Births / 1,000 Women |
| Less than High School | 0 (0.0%) | 0.0 |
| High School Diploma | 1 (33.3%) | 200.0 |
| College or Associate's Degree | 2 (66.7%) | 118.0 |
| Bachelor's Degree | 0 (0.0%) | 0.0 |
| Graduate Degree | 0 (0.0%) | 0.0 |
| Total | 3 (100.0%) | 44.0 |
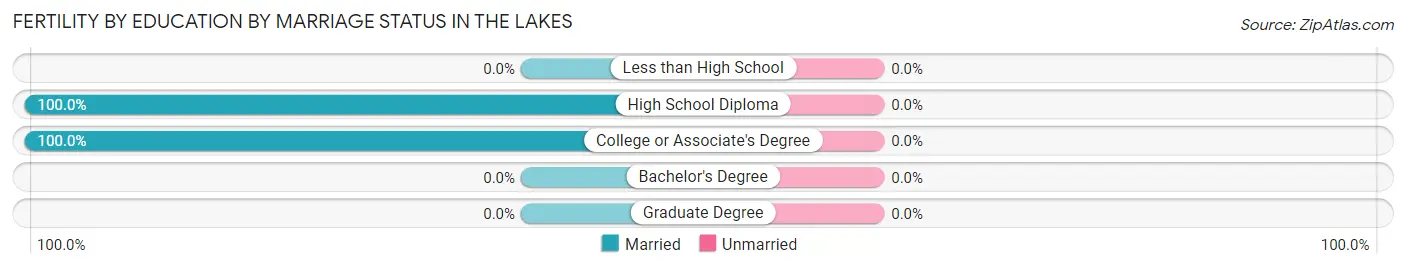
Fertility by Education by Marriage Status in The Lakes
| Educational Attainment | Married | Unmarried |
| Less than High School | 0 (0.0%) | 0 (0.0%) |
| High School Diploma | 1 (100.0%) | 0 (0.0%) |
| College or Associate's Degree | 2 (100.0%) | 0 (0.0%) |
| Bachelor's Degree | 0 (0.0%) | 0 (0.0%) |
| Graduate Degree | 0 (0.0%) | 0 (0.0%) |
| Total | 3 (100.0%) | 0 (0.0%) |
Income in The Lakes
Income Overview in The Lakes
Per Capita Income in The Lakes is $55,226, while median incomes of families and households are $107,917 and $85,833 respectively.
| Characteristic | Number | Measure |
| Per Capita Income | 647 | $55,226 |
| Median Family Income | 241 | $107,917 |
| Mean Family Income | 241 | $124,095 |
| Median Household Income | 330 | $85,833 |
| Mean Household Income | 330 | $109,065 |
| Income Deficit | 241 | $0 |
| Wage / Income Gap (%) | 647 | 31.19% |
| Wage / Income Gap ($) | 647 | 68.81¢ per $1 |
| Gini / Inequality Index | 647 | 0.39 |
Earnings by Sex in The Lakes
Average Earnings in The Lakes are $47,500, $54,196 for men and $37,292 for women, a difference of 31.2%.
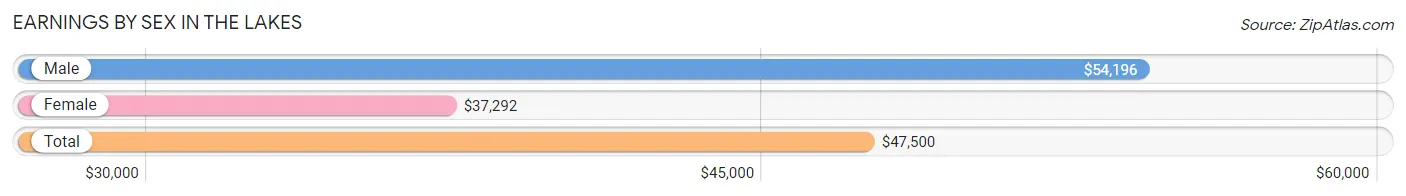
| Sex | Number | Average Earnings |
| Male | 205 (49.8%) | $54,196 |
| Female | 207 (50.2%) | $37,292 |
| Total | 412 (100.0%) | $47,500 |
Earnings by Sex by Income Bracket in The Lakes
The most common earnings brackets in The Lakes are $75,000 to $99,999 for men (45 | 22.0%) and $2,499 or less for women (32 | 15.5%).
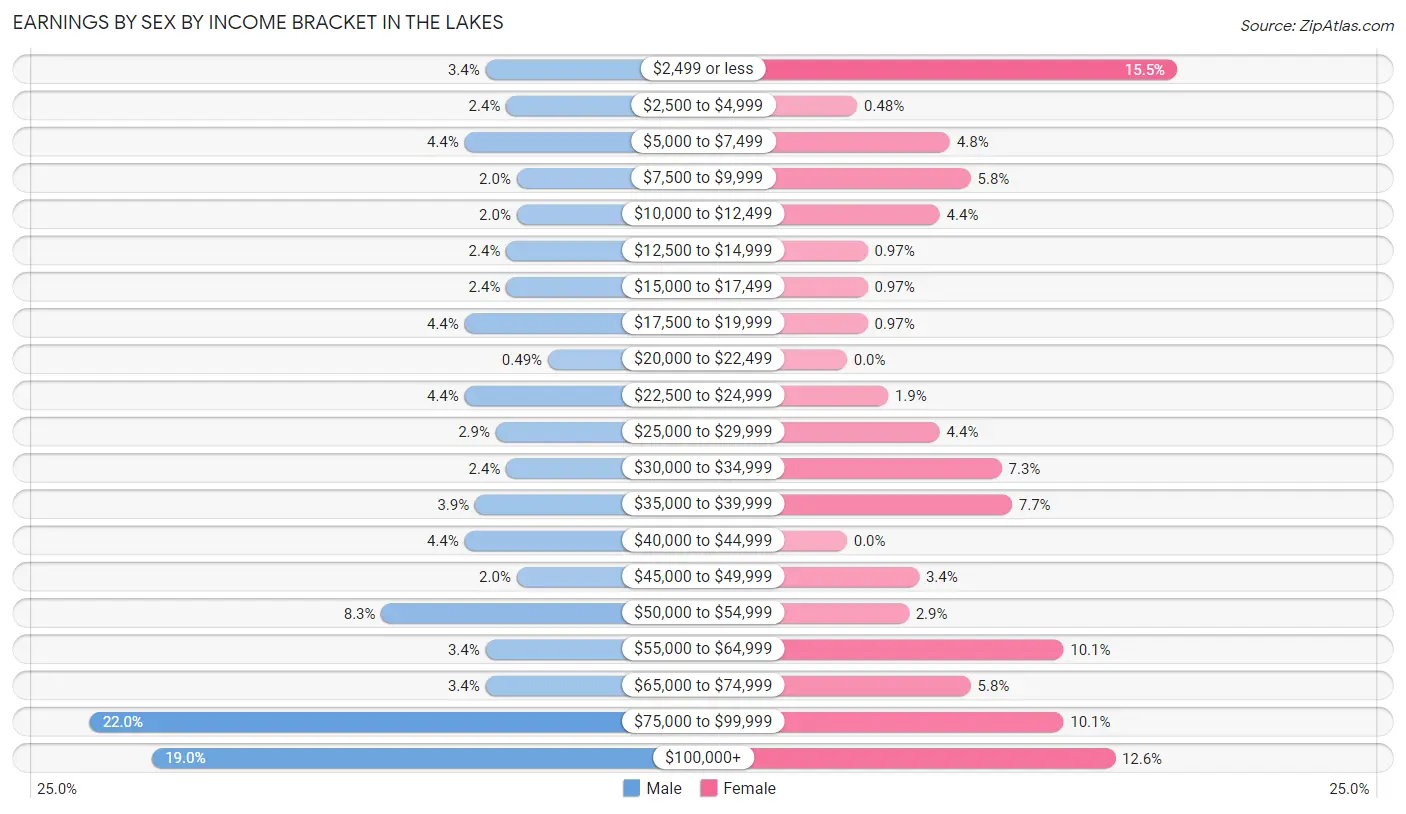
| Income | Male | Female |
| $2,499 or less | 7 (3.4%) | 32 (15.5%) |
| $2,500 to $4,999 | 5 (2.4%) | 1 (0.5%) |
| $5,000 to $7,499 | 9 (4.4%) | 10 (4.8%) |
| $7,500 to $9,999 | 4 (1.9%) | 12 (5.8%) |
| $10,000 to $12,499 | 4 (1.9%) | 9 (4.3%) |
| $12,500 to $14,999 | 5 (2.4%) | 2 (1.0%) |
| $15,000 to $17,499 | 5 (2.4%) | 2 (1.0%) |
| $17,500 to $19,999 | 9 (4.4%) | 2 (1.0%) |
| $20,000 to $22,499 | 1 (0.5%) | 0 (0.0%) |
| $22,500 to $24,999 | 9 (4.4%) | 4 (1.9%) |
| $25,000 to $29,999 | 6 (2.9%) | 9 (4.3%) |
| $30,000 to $34,999 | 5 (2.4%) | 15 (7.2%) |
| $35,000 to $39,999 | 8 (3.9%) | 16 (7.7%) |
| $40,000 to $44,999 | 9 (4.4%) | 0 (0.0%) |
| $45,000 to $49,999 | 4 (1.9%) | 7 (3.4%) |
| $50,000 to $54,999 | 17 (8.3%) | 6 (2.9%) |
| $55,000 to $64,999 | 7 (3.4%) | 21 (10.1%) |
| $65,000 to $74,999 | 7 (3.4%) | 12 (5.8%) |
| $75,000 to $99,999 | 45 (22.0%) | 21 (10.1%) |
| $100,000+ | 39 (19.0%) | 26 (12.6%) |
| Total | 205 (100.0%) | 207 (100.0%) |
Earnings by Sex by Educational Attainment in The Lakes
Average earnings in The Lakes are $64,063 for men and $46,250 for women, a difference of 27.8%. Men with an educational attainment of graduate degree enjoy the highest average annual earnings of $140,000, while those with high school diploma education earn the least with $42,500. Women with an educational attainment of graduate degree earn the most with the average annual earnings of $95,938, while those with college or associate's degree education have the smallest earnings of $31,500.
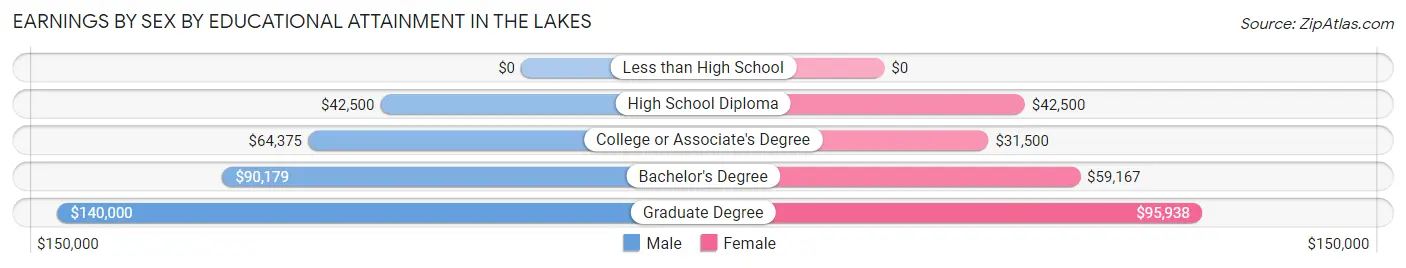
| Educational Attainment | Male Income | Female Income |
| Less than High School | - | - |
| High School Diploma | $42,500 | $42,500 |
| College or Associate's Degree | $64,375 | $31,500 |
| Bachelor's Degree | $90,179 | $59,167 |
| Graduate Degree | $140,000 | $95,938 |
| Total | $64,063 | $46,250 |
Family Income in The Lakes
Family Income Brackets in The Lakes
According to the The Lakes family income data, there are 65 families falling into the $100,000 to $149,999 income range, which is the most common income bracket and makes up 27.0% of all families. Conversely, the less than $10,000 income bracket is the least frequent group with only 1 families (0.4%) belonging to this category.
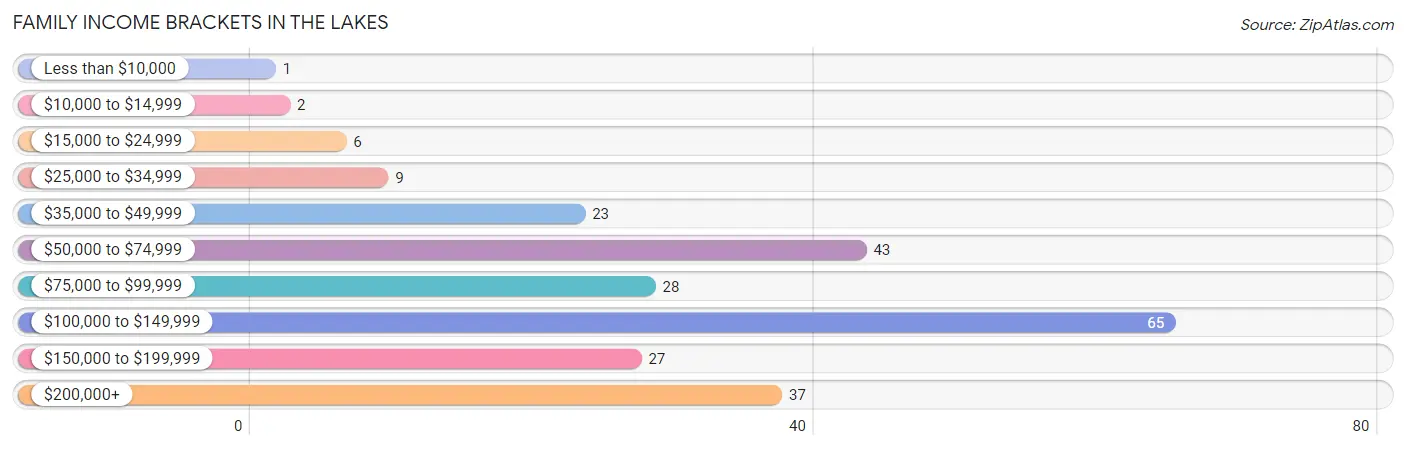
| Income Bracket | # Families | % Families |
| Less than $10,000 | 1 | 0.4% |
| $10,000 to $14,999 | 2 | 0.8% |
| $15,000 to $24,999 | 6 | 2.5% |
| $25,000 to $34,999 | 9 | 3.7% |
| $35,000 to $49,999 | 23 | 9.5% |
| $50,000 to $74,999 | 43 | 17.8% |
| $75,000 to $99,999 | 28 | 11.6% |
| $100,000 to $149,999 | 65 | 27.0% |
| $150,000 to $199,999 | 27 | 11.2% |
| $200,000+ | 37 | 15.4% |
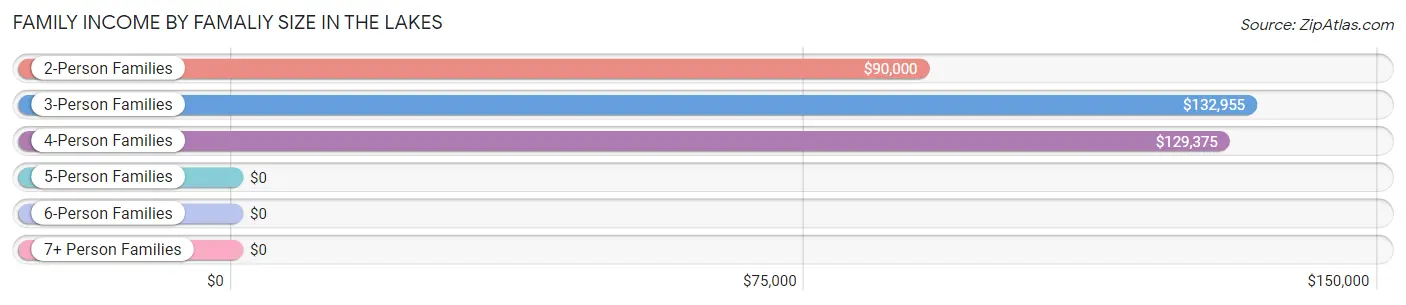
Family Income by Famaliy Size in The Lakes
3-person families (26 | 10.8%) account for the highest median family income in The Lakes with $132,955 per family, while 2-person families (202 | 83.8%) have the highest median income of $45,000 per family member.
| Income Bracket | # Families | Median Income |
| 2-Person Families | 202 (83.8%) | $90,000 |
| 3-Person Families | 26 (10.8%) | $132,955 |
| 4-Person Families | 11 (4.6%) | $129,375 |
| 5-Person Families | 2 (0.8%) | $0 |
| 6-Person Families | 0 (0.0%) | $0 |
| 7+ Person Families | 0 (0.0%) | $0 |
| Total | 241 (100.0%) | $107,917 |
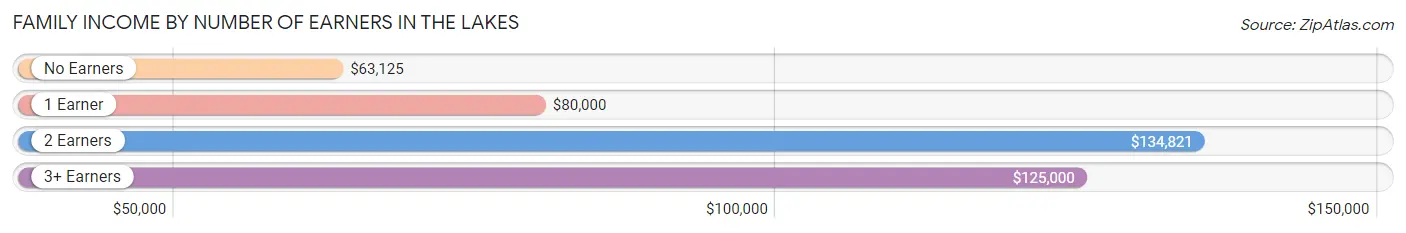
Family Income by Number of Earners in The Lakes
The median family income in The Lakes is $107,917, with families comprising 2 earners (116) having the highest median family income of $134,821, while families with no earners (53) have the lowest median family income of $63,125, accounting for 48.1% and 22.0% of families, respectively.
| Number of Earners | # Families | Median Income |
| No Earners | 53 (22.0%) | $63,125 |
| 1 Earner | 62 (25.7%) | $80,000 |
| 2 Earners | 116 (48.1%) | $134,821 |
| 3+ Earners | 10 (4.2%) | $125,000 |
| Total | 241 (100.0%) | $107,917 |
Household Income in The Lakes
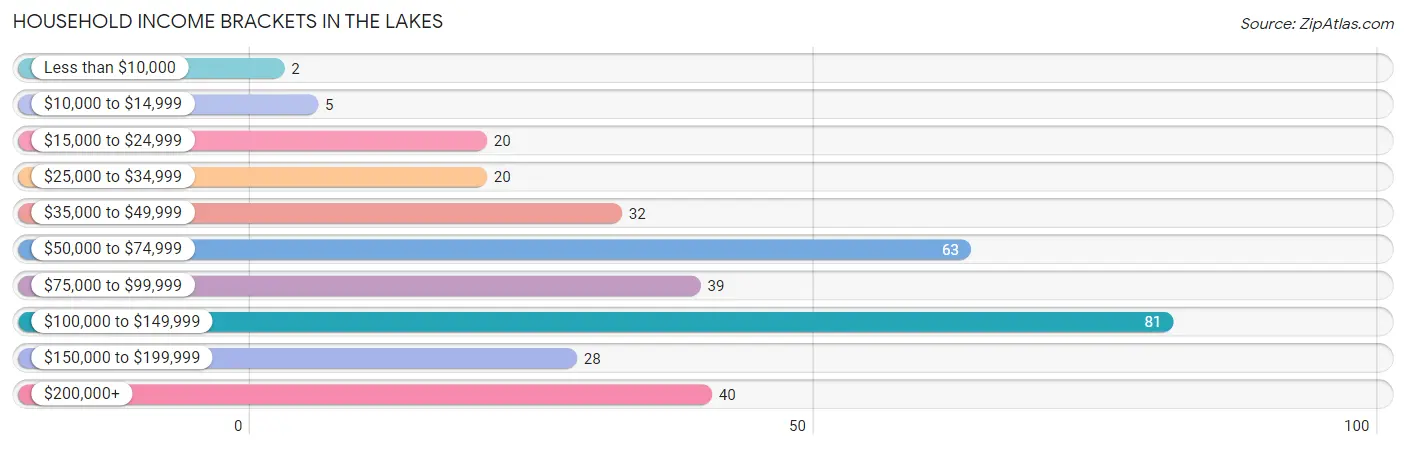
Household Income Brackets in The Lakes
With 81 households falling in the category, the $100,000 to $149,999 income range is the most frequent in The Lakes, accounting for 24.5% of all households. In contrast, only 2 households (0.6%) fall into the less than $10,000 income bracket, making it the least populous group.
| Income Bracket | # Households | % Households |
| Less than $10,000 | 2 | 0.6% |
| $10,000 to $14,999 | 5 | 1.5% |
| $15,000 to $24,999 | 20 | 6.1% |
| $25,000 to $34,999 | 20 | 6.1% |
| $35,000 to $49,999 | 32 | 9.7% |
| $50,000 to $74,999 | 63 | 19.1% |
| $75,000 to $99,999 | 39 | 11.8% |
| $100,000 to $149,999 | 81 | 24.5% |
| $150,000 to $199,999 | 28 | 8.5% |
| $200,000+ | 40 | 12.1% |
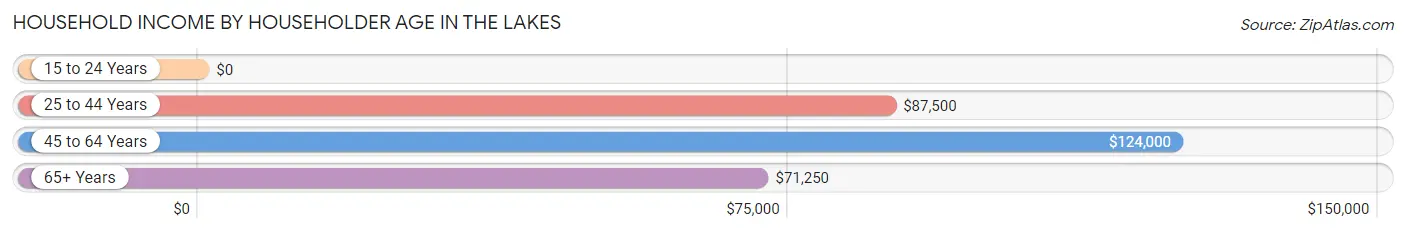
Household Income by Householder Age in The Lakes
The median household income in The Lakes is $85,833, with the highest median household income of $124,000 found in the 45 to 64 years age bracket for the primary householder. A total of 146 households (44.2%) fall into this category. Meanwhile, the 15 to 24 years age bracket for the primary householder has the lowest median household income of $0, with 4 households (1.2%) in this group.
| Income Bracket | # Households | Median Income |
| 15 to 24 Years | 4 (1.2%) | $0 |
| 25 to 44 Years | 18 (5.4%) | $87,500 |
| 45 to 64 Years | 146 (44.2%) | $124,000 |
| 65+ Years | 162 (49.1%) | $71,250 |
| Total | 330 (100.0%) | $85,833 |
Poverty in The Lakes
Income Below Poverty by Sex and Age in The Lakes
With 3.8% poverty level for males and 2.4% for females among the residents of The Lakes, 12 to 14 year old males and 35 to 44 year old females are the most vulnerable to poverty, with 2 males (50.0%) and 2 females (13.3%) in their respective age groups living below the poverty level.
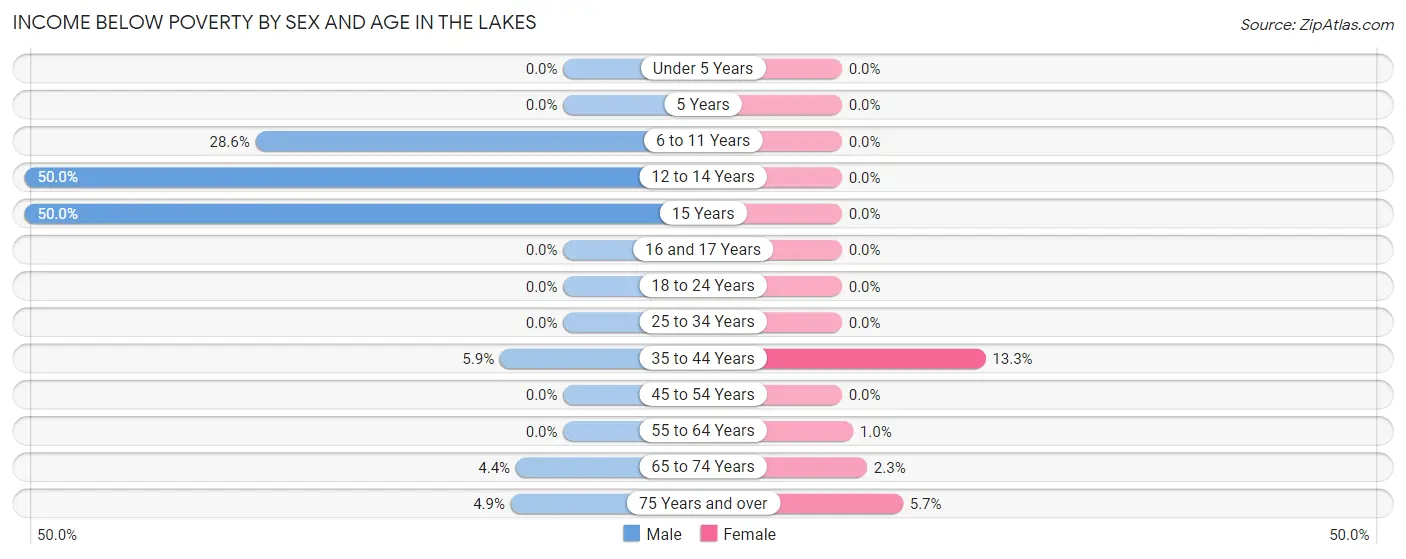
| Age Bracket | Male | Female |
| Under 5 Years | 0 (0.0%) | 0 (0.0%) |
| 5 Years | 0 (0.0%) | 0 (0.0%) |
| 6 to 11 Years | 2 (28.6%) | 0 (0.0%) |
| 12 to 14 Years | 2 (50.0%) | 0 (0.0%) |
| 15 Years | 1 (50.0%) | 0 (0.0%) |
| 16 and 17 Years | 0 (0.0%) | 0 (0.0%) |
| 18 to 24 Years | 0 (0.0%) | 0 (0.0%) |
| 25 to 34 Years | 0 (0.0%) | 0 (0.0%) |
| 35 to 44 Years | 1 (5.9%) | 2 (13.3%) |
| 45 to 54 Years | 0 (0.0%) | 0 (0.0%) |
| 55 to 64 Years | 0 (0.0%) | 1 (1.0%) |
| 65 to 74 Years | 4 (4.4%) | 2 (2.3%) |
| 75 Years and over | 2 (4.9%) | 3 (5.7%) |
| Total | 12 (3.8%) | 8 (2.4%) |
Income Above Poverty by Sex and Age in The Lakes
According to the poverty statistics in The Lakes, males aged under 5 years and females aged under 5 years are the age groups that are most secure financially, with 100.0% of males and 100.0% of females in these age groups living above the poverty line.
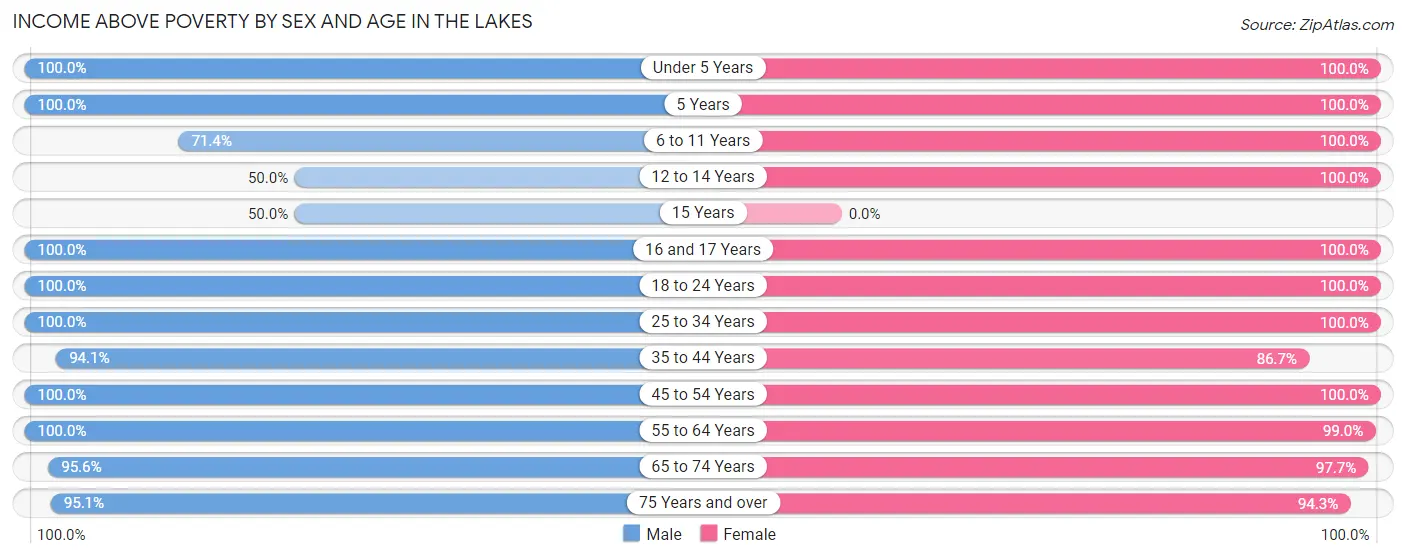
| Age Bracket | Male | Female |
| Under 5 Years | 4 (100.0%) | 7 (100.0%) |
| 5 Years | 4 (100.0%) | 1 (100.0%) |
| 6 to 11 Years | 5 (71.4%) | 4 (100.0%) |
| 12 to 14 Years | 2 (50.0%) | 1 (100.0%) |
| 15 Years | 1 (50.0%) | 0 (0.0%) |
| 16 and 17 Years | 2 (100.0%) | 22 (100.0%) |
| 18 to 24 Years | 22 (100.0%) | 8 (100.0%) |
| 25 to 34 Years | 6 (100.0%) | 5 (100.0%) |
| 35 to 44 Years | 16 (94.1%) | 13 (86.7%) |
| 45 to 54 Years | 22 (100.0%) | 31 (100.0%) |
| 55 to 64 Years | 95 (100.0%) | 96 (99.0%) |
| 65 to 74 Years | 87 (95.6%) | 84 (97.7%) |
| 75 Years and over | 39 (95.1%) | 50 (94.3%) |
| Total | 305 (96.2%) | 322 (97.6%) |
Income Below Poverty Among Married-Couple Families in The Lakes
The poverty statistics for married-couple families in The Lakes show that 1.4% or 3 of the total 220 families live below the poverty line. Families with no children have the highest poverty rate of 1.6%, comprising of 3 families. On the other hand, families with 1 or 2 children have the lowest poverty rate of 0.0%, which includes 0 families.
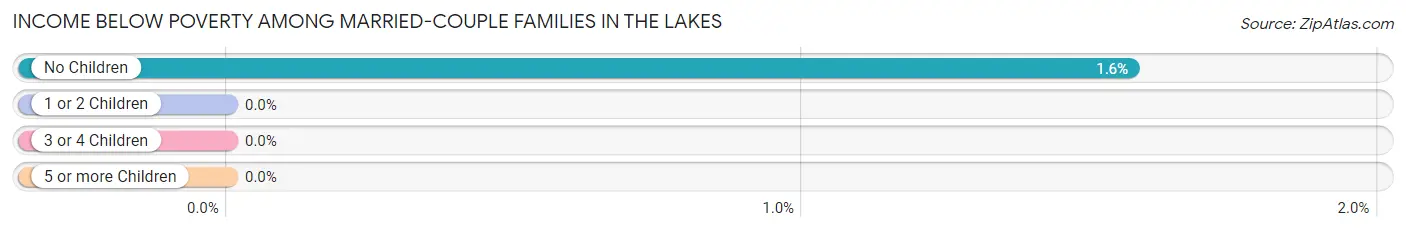
| Children | Above Poverty | Below Poverty |
| No Children | 188 (98.4%) | 3 (1.6%) |
| 1 or 2 Children | 27 (100.0%) | 0 (0.0%) |
| 3 or 4 Children | 2 (100.0%) | 0 (0.0%) |
| 5 or more Children | 0 (0.0%) | 0 (0.0%) |
| Total | 217 (98.6%) | 3 (1.4%) |
Income Below Poverty Among Single-Parent Households in The Lakes
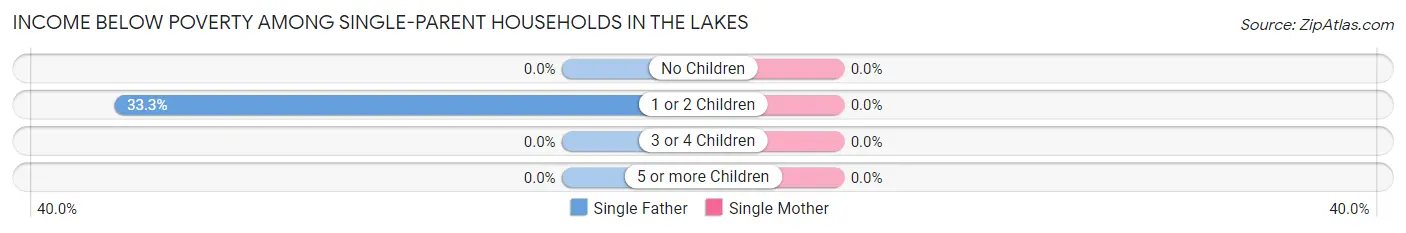
| Children | Single Father | Single Mother |
| No Children | 0 (0.0%) | 0 (0.0%) |
| 1 or 2 Children | 1 (33.3%) | 0 (0.0%) |
| 3 or 4 Children | 0 (0.0%) | 0 (0.0%) |
| 5 or more Children | 0 (0.0%) | 0 (0.0%) |
| Total | 1 (11.1%) | 0 (0.0%) |
Income Below Poverty Among Married-Couple vs Single-Parent Households in The Lakes
The poverty data for The Lakes shows that 3 of the married-couple family households (1.4%) and 1 of the single-parent households (4.8%) are living below the poverty level. Within the married-couple family households, those with no children have the highest poverty rate, with 3 households (1.6%) falling below the poverty line. Among the single-parent households, those with 1 or 2 children have the highest poverty rate, with 1 household (33.3%) living below poverty.
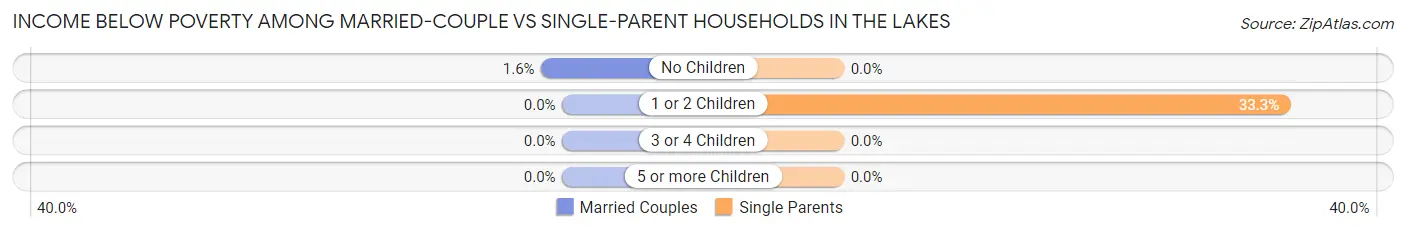
| Children | Married-Couple Families | Single-Parent Households |
| No Children | 3 (1.6%) | 0 (0.0%) |
| 1 or 2 Children | 0 (0.0%) | 1 (33.3%) |
| 3 or 4 Children | 0 (0.0%) | 0 (0.0%) |
| 5 or more Children | 0 (0.0%) | 0 (0.0%) |
| Total | 3 (1.4%) | 1 (4.8%) |
Employment Characteristics in The Lakes
Employment by Class of Employer in The Lakes
Among the 330 employed individuals in The Lakes, private company employees (189 | 57.3%), self-employed (not incorporated) (39 | 11.8%), and self-employed (incorporated) (29 | 8.8%) make up the most common classes of employment.
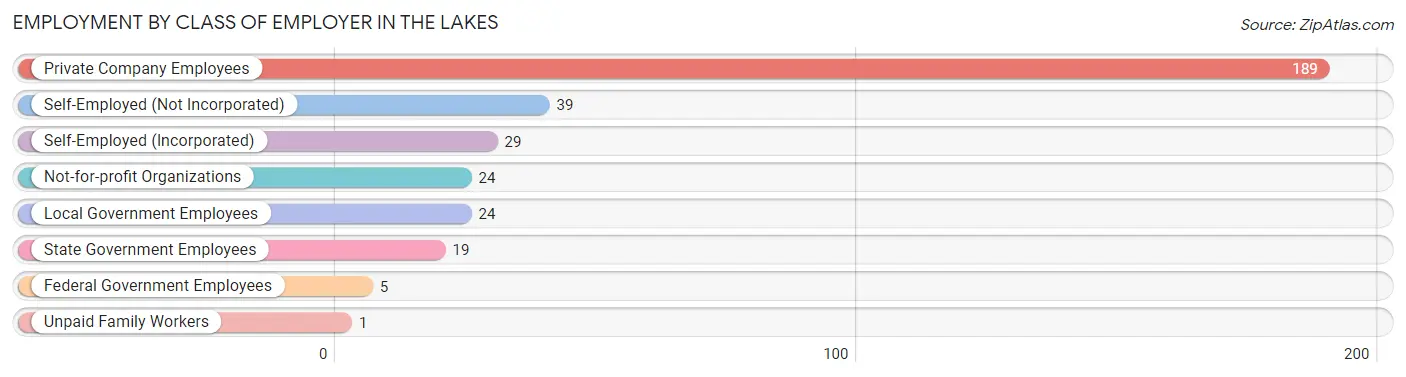
| Employer Class | # Employees | % Employees |
| Private Company Employees | 189 | 57.3% |
| Self-Employed (Incorporated) | 29 | 8.8% |
| Self-Employed (Not Incorporated) | 39 | 11.8% |
| Not-for-profit Organizations | 24 | 7.3% |
| Local Government Employees | 24 | 7.3% |
| State Government Employees | 19 | 5.8% |
| Federal Government Employees | 5 | 1.5% |
| Unpaid Family Workers | 1 | 0.3% |
| Total | 330 | 100.0% |
Employment Status by Age in The Lakes
According to the labor force statistics for The Lakes, out of the total population over 16 years of age (613), 56.6% or 347 individuals are in the labor force, with 2.3% or 8 of them unemployed. The age group with the highest labor force participation rate is 20 to 24 years, with 100.0% or 16 individuals in the labor force. Within the labor force, the 55 to 59 years age range has the highest percentage of unemployed individuals, with 4.3% or 2 of them being unemployed.
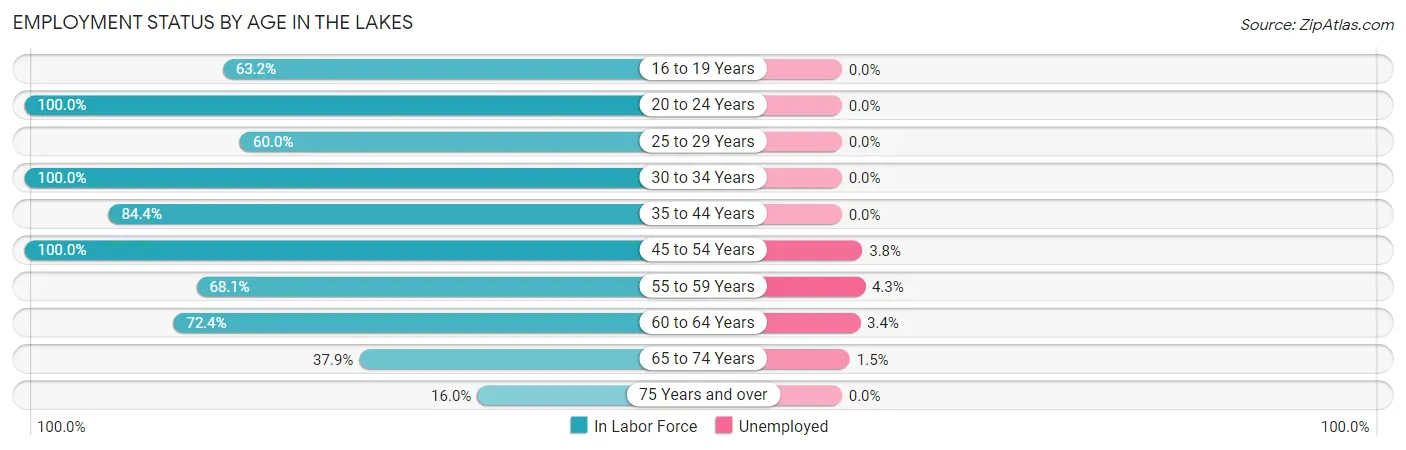
| Age Bracket | In Labor Force | Unemployed |
| 16 to 19 Years | 24 (63.2%) | 0 (0.0%) |
| 20 to 24 Years | 16 (100.0%) | 0 (0.0%) |
| 25 to 29 Years | 3 (60.0%) | 0 (0.0%) |
| 30 to 34 Years | 6 (100.0%) | 0 (0.0%) |
| 35 to 44 Years | 27 (84.4%) | 0 (0.0%) |
| 45 to 54 Years | 53 (100.0%) | 2 (3.8%) |
| 55 to 59 Years | 47 (68.1%) | 2 (4.3%) |
| 60 to 64 Years | 89 (72.4%) | 3 (3.4%) |
| 65 to 74 Years | 67 (37.9%) | 1 (1.5%) |
| 75 Years and over | 15 (16.0%) | 0 (0.0%) |
| Total | 347 (56.6%) | 8 (2.3%) |
Employment Status by Educational Attainment in The Lakes
According to labor force statistics for The Lakes, 78.1% of individuals (225) out of the total population between 25 and 64 years of age (288) are in the labor force, with 3.1% or 7 of them being unemployed. The group with the highest labor force participation rate are those with the educational attainment of bachelor's degree or higher, with 89.2% or 83 individuals in the labor force. Within the labor force, individuals with high school diploma education have the highest percentage of unemployment, with 8.2% or 4 of them being unemployed.
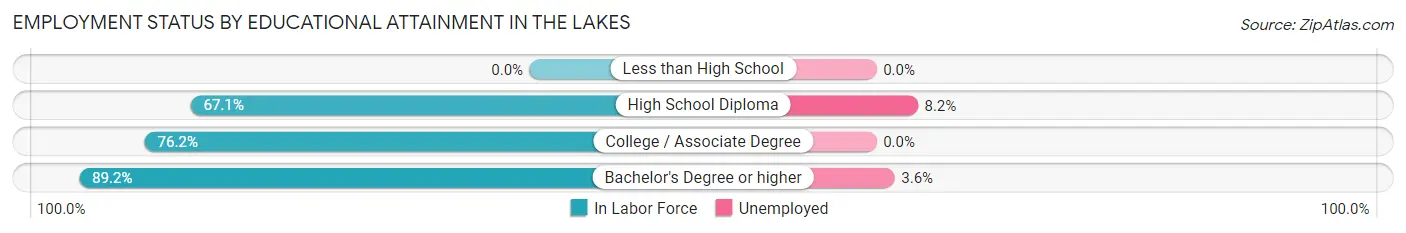
| Educational Attainment | In Labor Force | Unemployed |
| Less than High School | 0 (0.0%) | 0 (0.0%) |
| High School Diploma | 49 (67.1%) | 6 (8.2%) |
| College / Associate Degree | 93 (76.2%) | 0 (0.0%) |
| Bachelor's Degree or higher | 83 (89.2%) | 3 (3.6%) |
| Total | 225 (78.1%) | 9 (3.1%) |
Employment Occupations by Sex in The Lakes
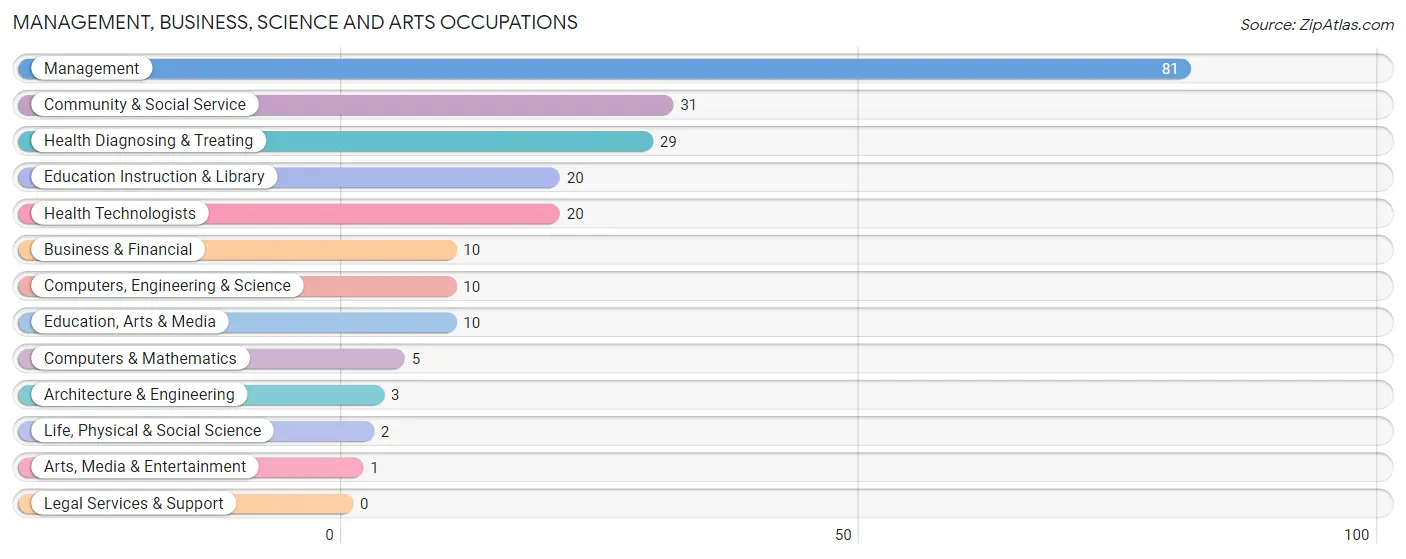
Management, Business, Science and Arts Occupations
The most common Management, Business, Science and Arts occupations in The Lakes are Management (81 | 23.9%), Community & Social Service (31 | 9.1%), Health Diagnosing & Treating (29 | 8.6%), Education Instruction & Library (20 | 5.9%), and Health Technologists (20 | 5.9%).
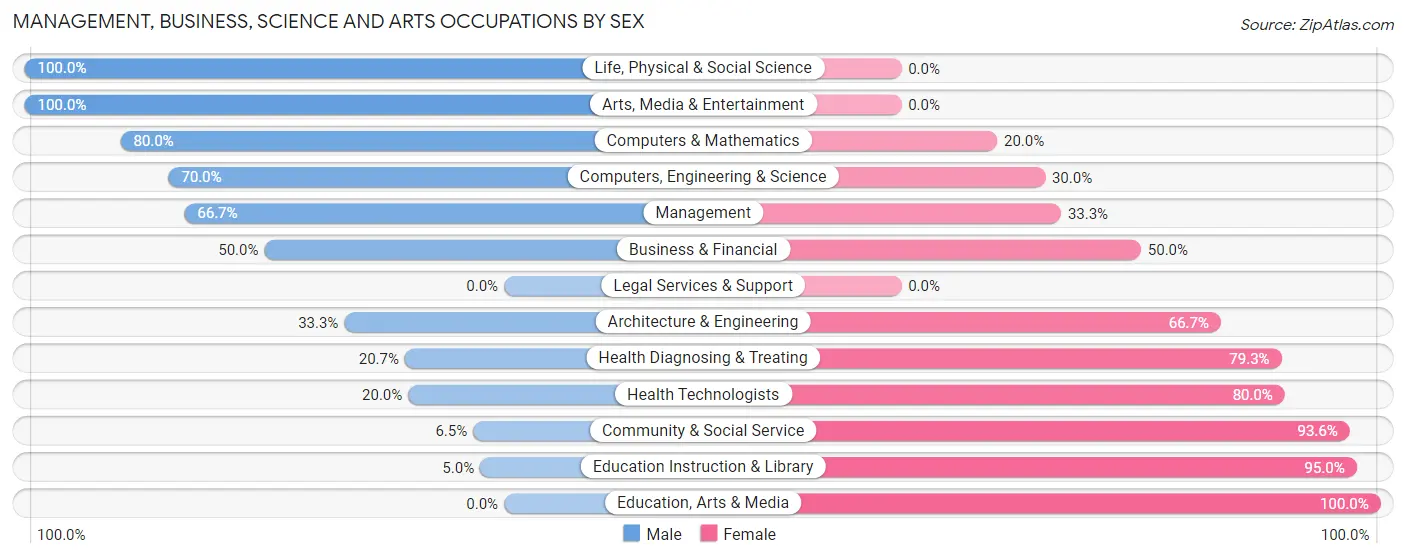
Management, Business, Science and Arts Occupations by Sex
Within the Management, Business, Science and Arts occupations in The Lakes, the most male-oriented occupations are Life, Physical & Social Science (100.0%), Arts, Media & Entertainment (100.0%), and Computers & Mathematics (80.0%), while the most female-oriented occupations are Education, Arts & Media (100.0%), Education Instruction & Library (95.0%), and Community & Social Service (93.5%).
| Occupation | Male | Female |
| Management | 54 (66.7%) | 27 (33.3%) |
| Business & Financial | 5 (50.0%) | 5 (50.0%) |
| Computers, Engineering & Science | 7 (70.0%) | 3 (30.0%) |
| Computers & Mathematics | 4 (80.0%) | 1 (20.0%) |
| Architecture & Engineering | 1 (33.3%) | 2 (66.7%) |
| Life, Physical & Social Science | 2 (100.0%) | 0 (0.0%) |
| Community & Social Service | 2 (6.5%) | 29 (93.5%) |
| Education, Arts & Media | 0 (0.0%) | 10 (100.0%) |
| Legal Services & Support | 0 (0.0%) | 0 (0.0%) |
| Education Instruction & Library | 1 (5.0%) | 19 (95.0%) |
| Arts, Media & Entertainment | 1 (100.0%) | 0 (0.0%) |
| Health Diagnosing & Treating | 6 (20.7%) | 23 (79.3%) |
| Health Technologists | 4 (20.0%) | 16 (80.0%) |
| Total (Category) | 74 (46.0%) | 87 (54.0%) |
| Total (Overall) | 173 (51.0%) | 166 (49.0%) |
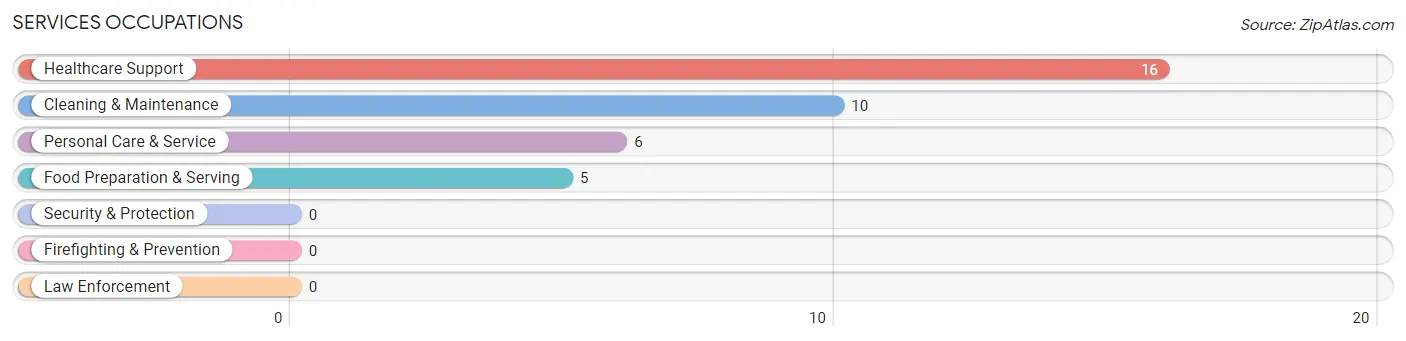
Services Occupations
The most common Services occupations in The Lakes are Healthcare Support (16 | 4.7%), Cleaning & Maintenance (10 | 2.9%), Personal Care & Service (6 | 1.8%), and Food Preparation & Serving (5 | 1.5%).
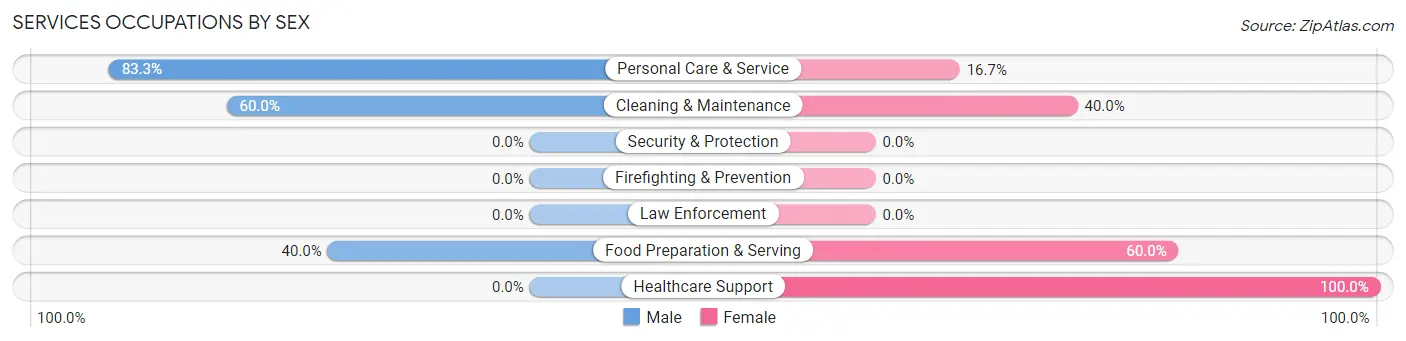
Services Occupations by Sex
Within the Services occupations in The Lakes, the most male-oriented occupations are Personal Care & Service (83.3%), Cleaning & Maintenance (60.0%), and Food Preparation & Serving (40.0%), while the most female-oriented occupations are Healthcare Support (100.0%), Food Preparation & Serving (60.0%), and Cleaning & Maintenance (40.0%).
| Occupation | Male | Female |
| Healthcare Support | 0 (0.0%) | 16 (100.0%) |
| Security & Protection | 0 (0.0%) | 0 (0.0%) |
| Firefighting & Prevention | 0 (0.0%) | 0 (0.0%) |
| Law Enforcement | 0 (0.0%) | 0 (0.0%) |
| Food Preparation & Serving | 2 (40.0%) | 3 (60.0%) |
| Cleaning & Maintenance | 6 (60.0%) | 4 (40.0%) |
| Personal Care & Service | 5 (83.3%) | 1 (16.7%) |
| Total (Category) | 13 (35.1%) | 24 (64.9%) |
| Total (Overall) | 173 (51.0%) | 166 (49.0%) |
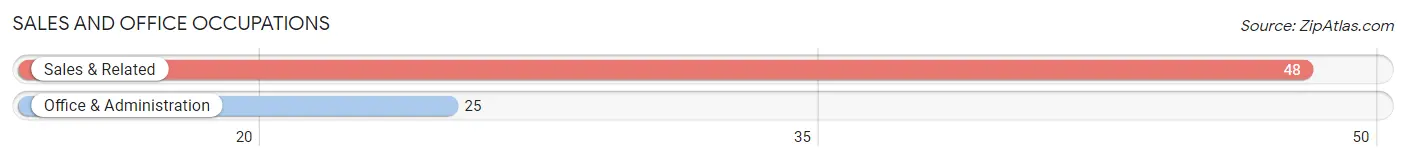
Sales and Office Occupations
The most common Sales and Office occupations in The Lakes are Sales & Related (48 | 14.2%), and Office & Administration (25 | 7.4%).
Sales and Office Occupations by Sex
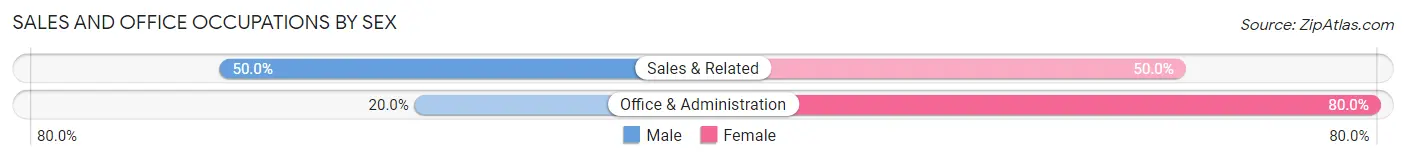
| Occupation | Male | Female |
| Sales & Related | 24 (50.0%) | 24 (50.0%) |
| Office & Administration | 5 (20.0%) | 20 (80.0%) |
| Total (Category) | 29 (39.7%) | 44 (60.3%) |
| Total (Overall) | 173 (51.0%) | 166 (49.0%) |
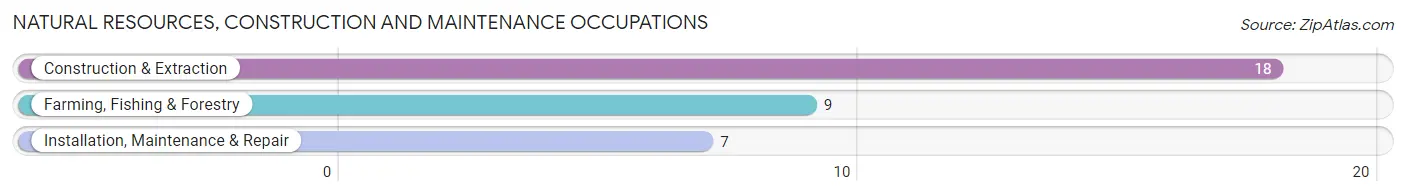
Natural Resources, Construction and Maintenance Occupations
The most common Natural Resources, Construction and Maintenance occupations in The Lakes are Construction & Extraction (18 | 5.3%), Farming, Fishing & Forestry (9 | 2.6%), and Installation, Maintenance & Repair (7 | 2.1%).
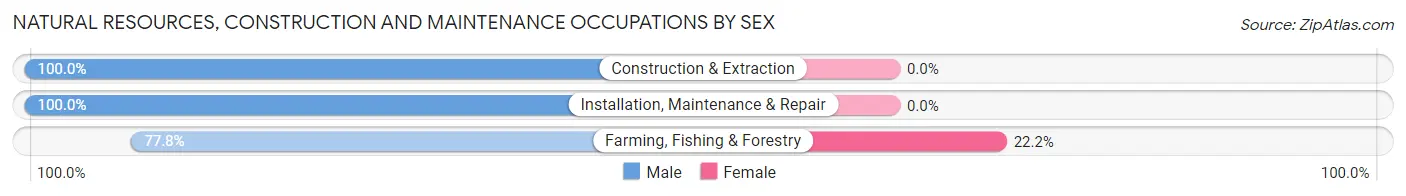
Natural Resources, Construction and Maintenance Occupations by Sex
| Occupation | Male | Female |
| Farming, Fishing & Forestry | 7 (77.8%) | 2 (22.2%) |
| Construction & Extraction | 18 (100.0%) | 0 (0.0%) |
| Installation, Maintenance & Repair | 7 (100.0%) | 0 (0.0%) |
| Total (Category) | 32 (94.1%) | 2 (5.9%) |
| Total (Overall) | 173 (51.0%) | 166 (49.0%) |
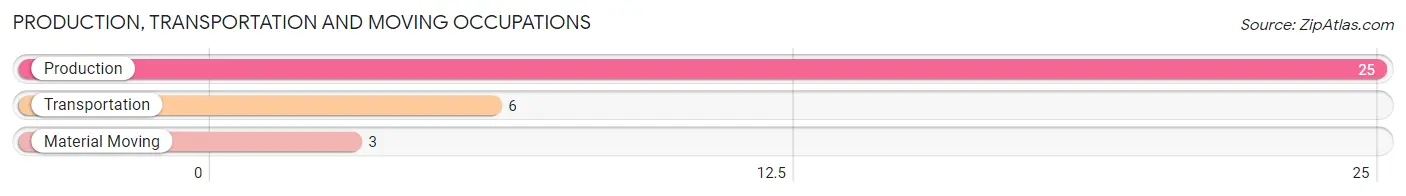
Production, Transportation and Moving Occupations
The most common Production, Transportation and Moving occupations in The Lakes are Production (25 | 7.4%), Transportation (6 | 1.8%), and Material Moving (3 | 0.9%).
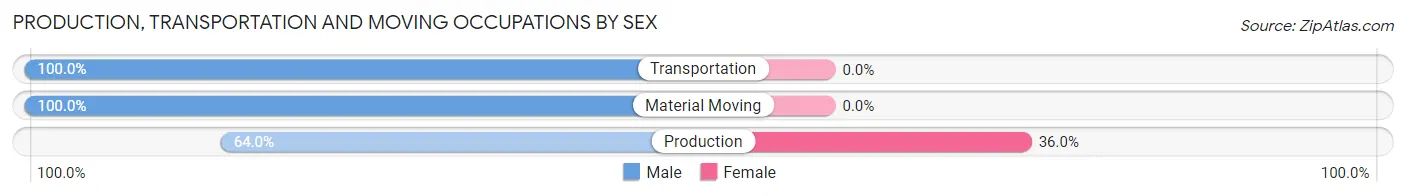
Production, Transportation and Moving Occupations by Sex
| Occupation | Male | Female |
| Production | 16 (64.0%) | 9 (36.0%) |
| Transportation | 6 (100.0%) | 0 (0.0%) |
| Material Moving | 3 (100.0%) | 0 (0.0%) |
| Total (Category) | 25 (73.5%) | 9 (26.5%) |
| Total (Overall) | 173 (51.0%) | 166 (49.0%) |
Employment Industries by Sex in The Lakes
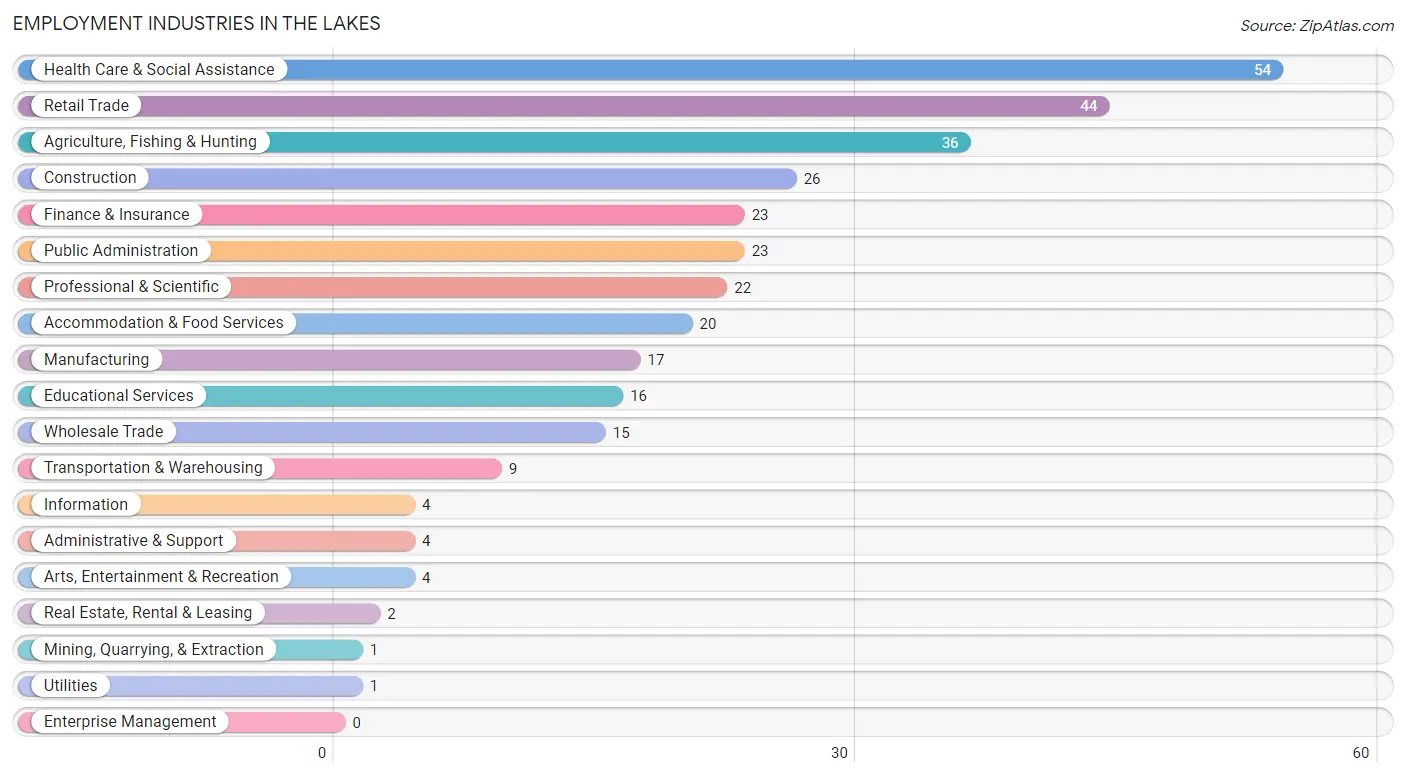
Employment Industries in The Lakes
The major employment industries in The Lakes include Health Care & Social Assistance (54 | 15.9%), Retail Trade (44 | 13.0%), Agriculture, Fishing & Hunting (36 | 10.6%), Construction (26 | 7.7%), and Finance & Insurance (23 | 6.8%).
Employment Industries by Sex in The Lakes
The The Lakes industries that see more men than women are Mining, Quarrying, & Extraction (100.0%), Construction (100.0%), and Utilities (100.0%), whereas the industries that tend to have a higher number of women are Information (100.0%), Real Estate, Rental & Leasing (100.0%), and Accommodation & Food Services (90.0%).

| Industry | Male | Female |
| Agriculture, Fishing & Hunting | 34 (94.4%) | 2 (5.6%) |
| Mining, Quarrying, & Extraction | 1 (100.0%) | 0 (0.0%) |
| Construction | 26 (100.0%) | 0 (0.0%) |
| Manufacturing | 12 (70.6%) | 5 (29.4%) |
| Wholesale Trade | 9 (60.0%) | 6 (40.0%) |
| Retail Trade | 19 (43.2%) | 25 (56.8%) |
| Transportation & Warehousing | 8 (88.9%) | 1 (11.1%) |
| Utilities | 1 (100.0%) | 0 (0.0%) |
| Information | 0 (0.0%) | 4 (100.0%) |
| Finance & Insurance | 14 (60.9%) | 9 (39.1%) |
| Real Estate, Rental & Leasing | 0 (0.0%) | 2 (100.0%) |
| Professional & Scientific | 15 (68.2%) | 7 (31.8%) |
| Enterprise Management | 0 (0.0%) | 0 (0.0%) |
| Administrative & Support | 2 (50.0%) | 2 (50.0%) |
| Educational Services | 4 (25.0%) | 12 (75.0%) |
| Health Care & Social Assistance | 9 (16.7%) | 45 (83.3%) |
| Arts, Entertainment & Recreation | 2 (50.0%) | 2 (50.0%) |
| Accommodation & Food Services | 2 (10.0%) | 18 (90.0%) |
| Public Administration | 5 (21.7%) | 18 (78.3%) |
| Total | 173 (51.0%) | 166 (49.0%) |
Education in The Lakes
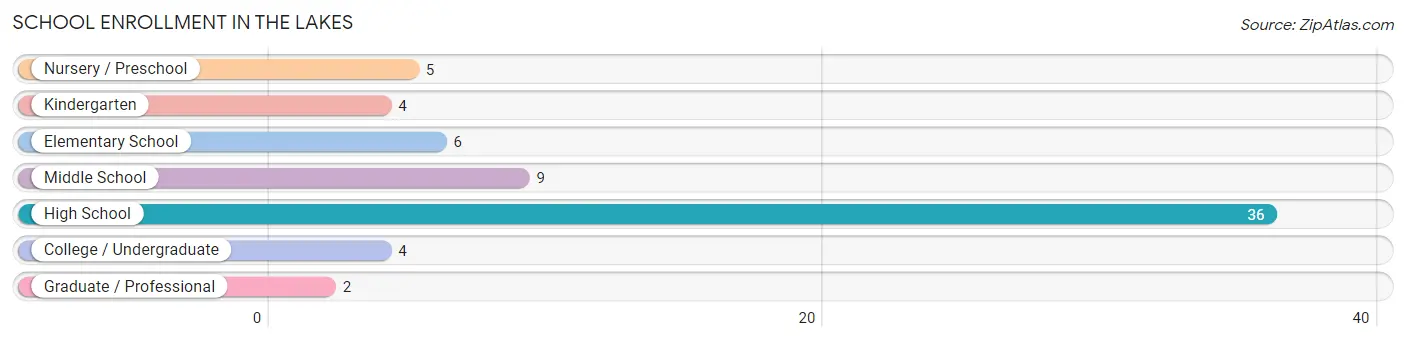
School Enrollment in The Lakes
The most common levels of schooling among the 66 students in The Lakes are high school (36 | 54.5%), middle school (9 | 13.6%), and elementary school (6 | 9.1%).
| School Level | # Students | % Students |
| Nursery / Preschool | 5 | 7.6% |
| Kindergarten | 4 | 6.1% |
| Elementary School | 6 | 9.1% |
| Middle School | 9 | 13.6% |
| High School | 36 | 54.5% |
| College / Undergraduate | 4 | 6.1% |
| Graduate / Professional | 2 | 3.0% |
| Total | 66 | 100.0% |
School Enrollment by Age by Funding Source in The Lakes
Out of a total of 66 students who are enrolled in schools in The Lakes, 2 (3.0%) attend a private institution, while the remaining 64 (97.0%) are enrolled in public schools. The age group of 20 to 24 year olds has the highest likelihood of being enrolled in private schools, with 2 (33.3% in the age bracket) enrolled. Conversely, the age group of 3 to 4 year olds has the lowest likelihood of being enrolled in a private school, with 3 (100.0% in the age bracket) attending a public institution.
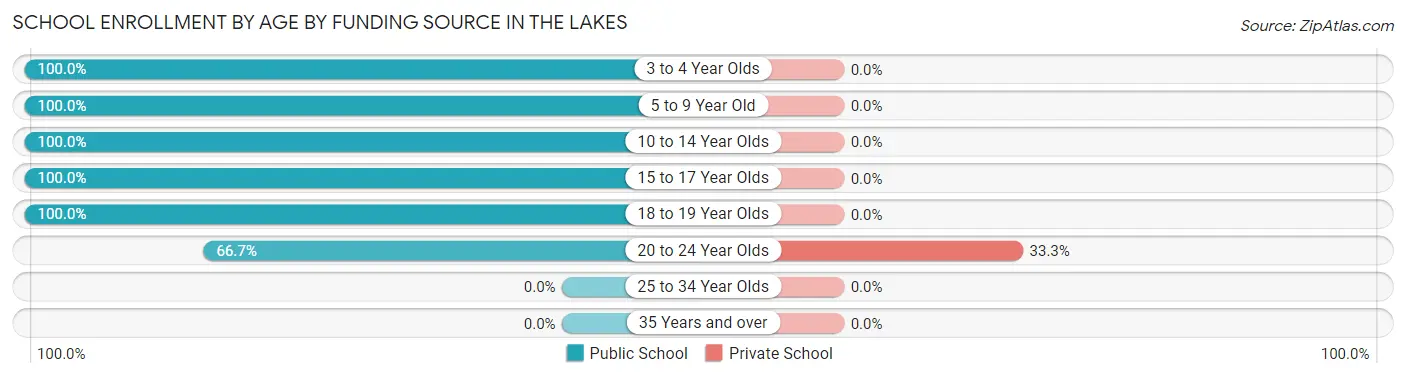
| Age Bracket | Public School | Private School |
| 3 to 4 Year Olds | 3 (100.0%) | 0 (0.0%) |
| 5 to 9 Year Old | 10 (100.0%) | 0 (0.0%) |
| 10 to 14 Year Olds | 11 (100.0%) | 0 (0.0%) |
| 15 to 17 Year Olds | 26 (100.0%) | 0 (0.0%) |
| 18 to 19 Year Olds | 10 (100.0%) | 0 (0.0%) |
| 20 to 24 Year Olds | 4 (66.7%) | 2 (33.3%) |
| 25 to 34 Year Olds | 0 (0.0%) | 0 (0.0%) |
| 35 Years and over | 0 (0.0%) | 0 (0.0%) |
| Total | 64 (97.0%) | 2 (3.0%) |
Educational Attainment by Field of Study in The Lakes
Business (46 | 26.9%), education (38 | 22.2%), social sciences (19 | 11.1%), science & technology (19 | 11.1%), and computers & mathematics (9 | 5.3%) are the most common fields of study among 171 individuals in The Lakes who have obtained a bachelor's degree or higher.
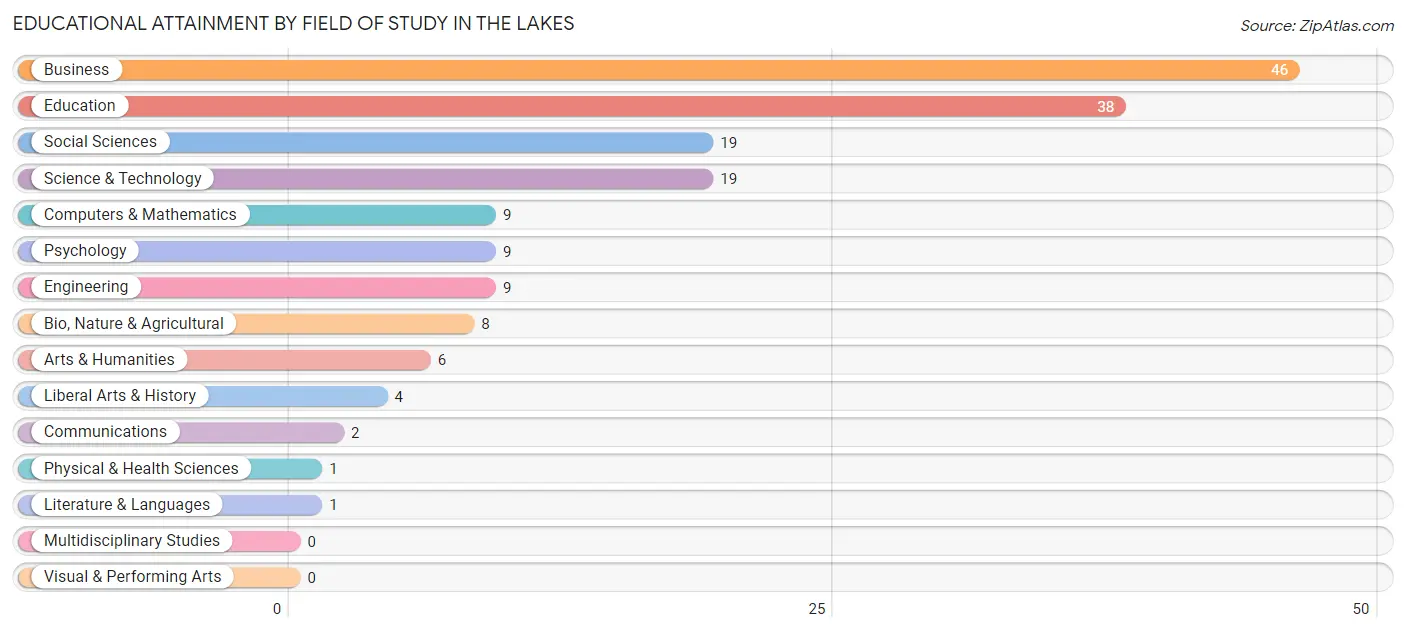
| Field of Study | # Graduates | % Graduates |
| Computers & Mathematics | 9 | 5.3% |
| Bio, Nature & Agricultural | 8 | 4.7% |
| Physical & Health Sciences | 1 | 0.6% |
| Psychology | 9 | 5.3% |
| Social Sciences | 19 | 11.1% |
| Engineering | 9 | 5.3% |
| Multidisciplinary Studies | 0 | 0.0% |
| Science & Technology | 19 | 11.1% |
| Business | 46 | 26.9% |
| Education | 38 | 22.2% |
| Literature & Languages | 1 | 0.6% |
| Liberal Arts & History | 4 | 2.3% |
| Visual & Performing Arts | 0 | 0.0% |
| Communications | 2 | 1.2% |
| Arts & Humanities | 6 | 3.5% |
| Total | 171 | 100.0% |
Transportation & Commute in The Lakes
Vehicle Availability by Sex in The Lakes
The most prevalent vehicle ownership categories in The Lakes are males with 2 vehicles (77, accounting for 45.0%) and females with 2 vehicles (67, making up 48.4%).
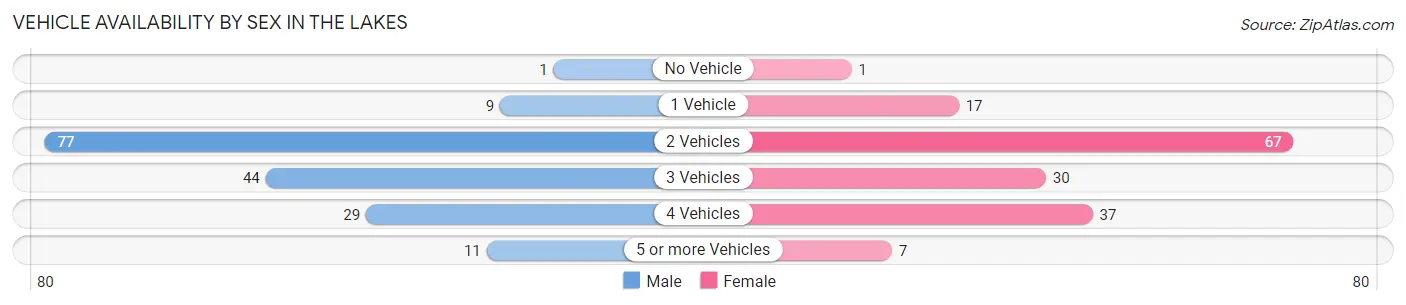
| Vehicles Available | Male | Female |
| No Vehicle | 1 (0.6%) | 1 (0.6%) |
| 1 Vehicle | 9 (5.3%) | 17 (10.7%) |
| 2 Vehicles | 77 (45.0%) | 67 (42.1%) |
| 3 Vehicles | 44 (25.7%) | 30 (18.9%) |
| 4 Vehicles | 29 (17.0%) | 37 (23.3%) |
| 5 or more Vehicles | 11 (6.4%) | 7 (4.4%) |
| Total | 171 (100.0%) | 159 (100.0%) |
Commute Time in The Lakes
The most frequently occuring commute durations in The Lakes are 15 to 19 minutes (56 commuters, 19.7%), 30 to 34 minutes (52 commuters, 18.3%), and 20 to 24 minutes (51 commuters, 18.0%).
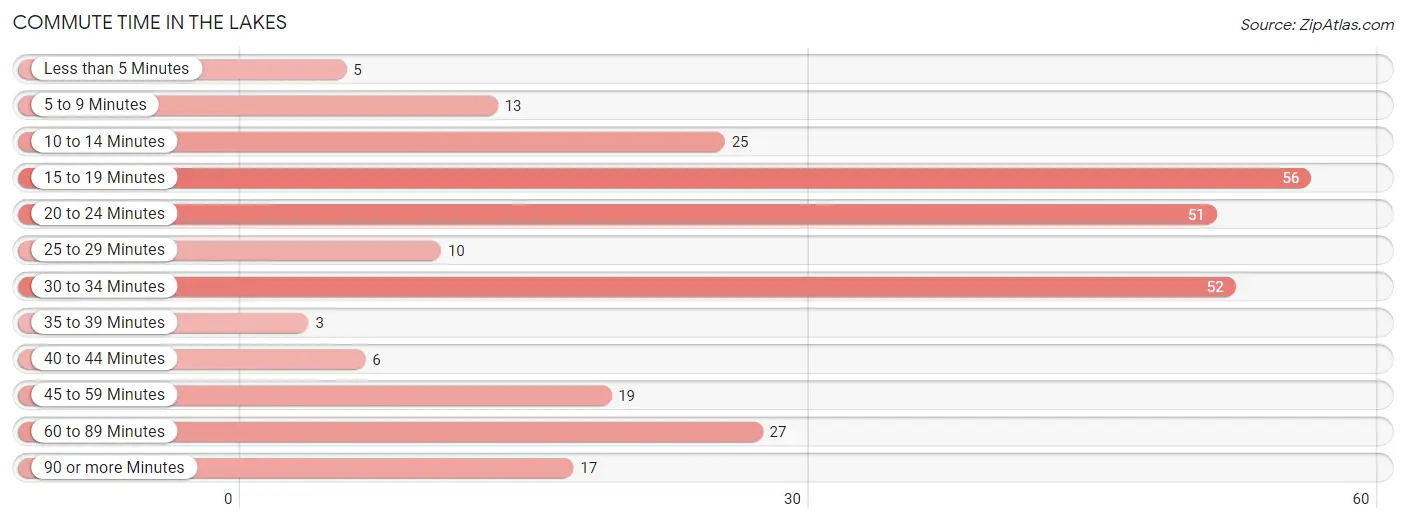
| Commute Time | # Commuters | % Commuters |
| Less than 5 Minutes | 5 | 1.8% |
| 5 to 9 Minutes | 13 | 4.6% |
| 10 to 14 Minutes | 25 | 8.8% |
| 15 to 19 Minutes | 56 | 19.7% |
| 20 to 24 Minutes | 51 | 18.0% |
| 25 to 29 Minutes | 10 | 3.5% |
| 30 to 34 Minutes | 52 | 18.3% |
| 35 to 39 Minutes | 3 | 1.1% |
| 40 to 44 Minutes | 6 | 2.1% |
| 45 to 59 Minutes | 19 | 6.7% |
| 60 to 89 Minutes | 27 | 9.5% |
| 90 or more Minutes | 17 | 6.0% |
Commute Time by Sex in The Lakes
The most common commute times in The Lakes are 30 to 34 minutes (35 commuters, 24.5%) for males and 15 to 19 minutes (41 commuters, 29.1%) for females.
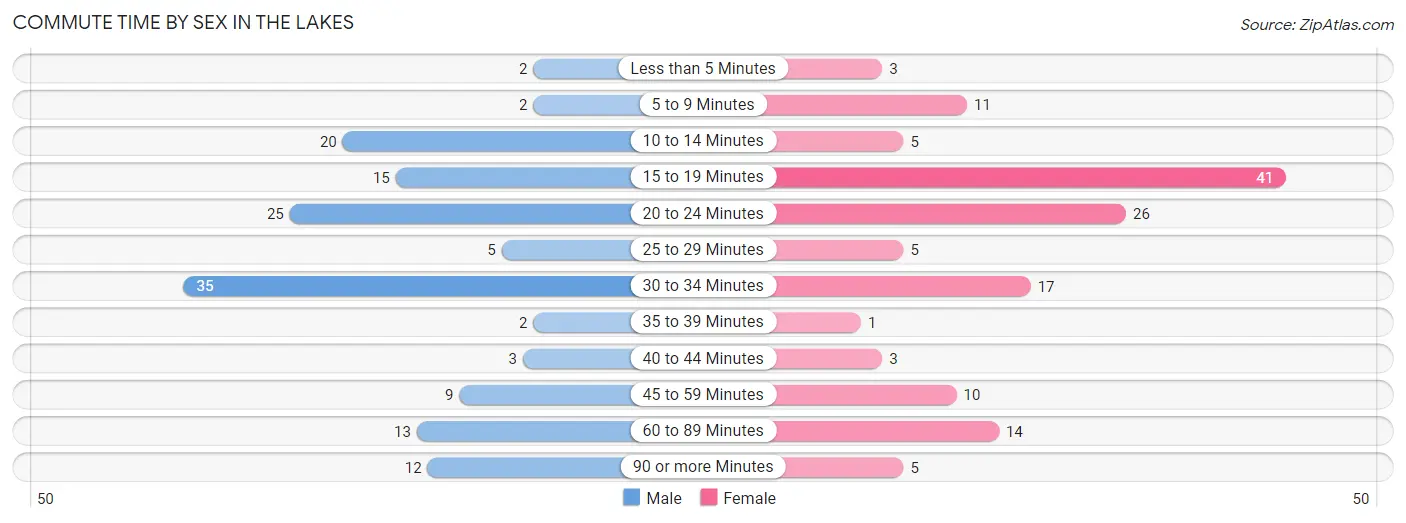
| Commute Time | Male | Female |
| Less than 5 Minutes | 2 (1.4%) | 3 (2.1%) |
| 5 to 9 Minutes | 2 (1.4%) | 11 (7.8%) |
| 10 to 14 Minutes | 20 (14.0%) | 5 (3.5%) |
| 15 to 19 Minutes | 15 (10.5%) | 41 (29.1%) |
| 20 to 24 Minutes | 25 (17.5%) | 26 (18.4%) |
| 25 to 29 Minutes | 5 (3.5%) | 5 (3.5%) |
| 30 to 34 Minutes | 35 (24.5%) | 17 (12.1%) |
| 35 to 39 Minutes | 2 (1.4%) | 1 (0.7%) |
| 40 to 44 Minutes | 3 (2.1%) | 3 (2.1%) |
| 45 to 59 Minutes | 9 (6.3%) | 10 (7.1%) |
| 60 to 89 Minutes | 13 (9.1%) | 14 (9.9%) |
| 90 or more Minutes | 12 (8.4%) | 5 (3.5%) |
Time of Departure to Work by Sex in The Lakes
The most frequent times of departure to work in The Lakes are 6:30 AM to 6:59 AM (29, 20.3%) for males and 7:30 AM to 7:59 AM (44, 31.2%) for females.
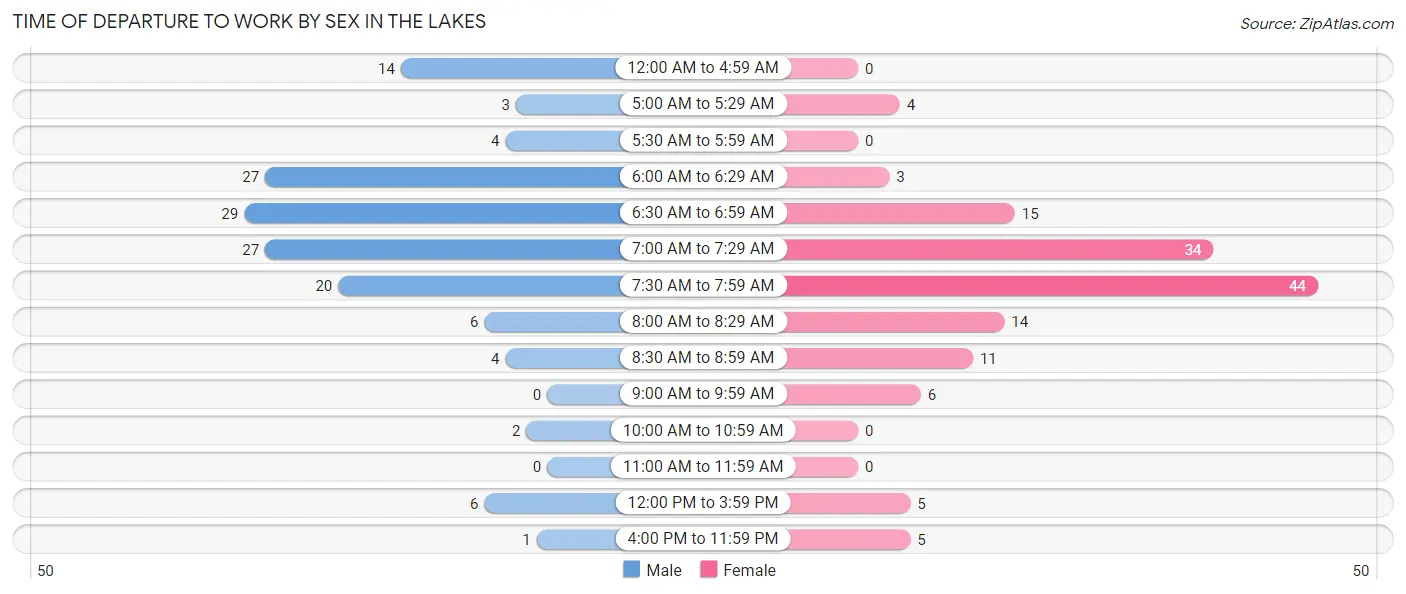
| Time of Departure | Male | Female |
| 12:00 AM to 4:59 AM | 14 (9.8%) | 0 (0.0%) |
| 5:00 AM to 5:29 AM | 3 (2.1%) | 4 (2.8%) |
| 5:30 AM to 5:59 AM | 4 (2.8%) | 0 (0.0%) |
| 6:00 AM to 6:29 AM | 27 (18.9%) | 3 (2.1%) |
| 6:30 AM to 6:59 AM | 29 (20.3%) | 15 (10.6%) |
| 7:00 AM to 7:29 AM | 27 (18.9%) | 34 (24.1%) |
| 7:30 AM to 7:59 AM | 20 (14.0%) | 44 (31.2%) |
| 8:00 AM to 8:29 AM | 6 (4.2%) | 14 (9.9%) |
| 8:30 AM to 8:59 AM | 4 (2.8%) | 11 (7.8%) |
| 9:00 AM to 9:59 AM | 0 (0.0%) | 6 (4.3%) |
| 10:00 AM to 10:59 AM | 2 (1.4%) | 0 (0.0%) |
| 11:00 AM to 11:59 AM | 0 (0.0%) | 0 (0.0%) |
| 12:00 PM to 3:59 PM | 6 (4.2%) | 5 (3.5%) |
| 4:00 PM to 11:59 PM | 1 (0.7%) | 5 (3.5%) |
| Total | 143 (100.0%) | 141 (100.0%) |
Housing Occupancy in The Lakes
Occupancy by Ownership in The Lakes
Of the total 330 dwellings in The Lakes, owner-occupied units account for 308 (93.3%), while renter-occupied units make up 22 (6.7%).
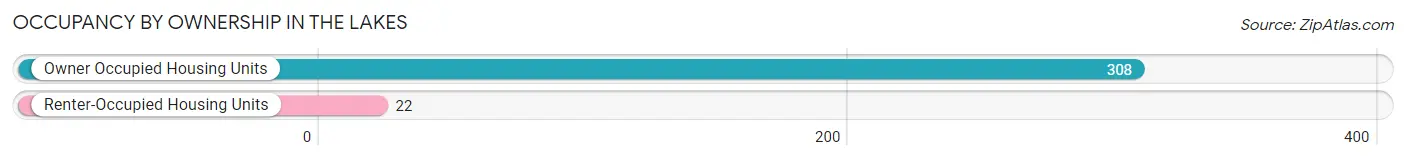
| Occupancy | # Housing Units | % Housing Units |
| Owner Occupied Housing Units | 308 | 93.3% |
| Renter-Occupied Housing Units | 22 | 6.7% |
| Total Occupied Housing Units | 330 | 100.0% |
Occupancy by Household Size in The Lakes
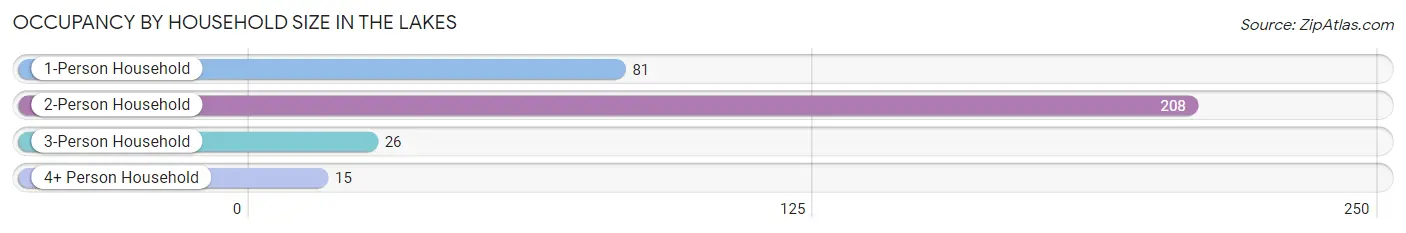
| Household Size | # Housing Units | % Housing Units |
| 1-Person Household | 81 | 24.5% |
| 2-Person Household | 208 | 63.0% |
| 3-Person Household | 26 | 7.9% |
| 4+ Person Household | 15 | 4.5% |
| Total Housing Units | 330 | 100.0% |
Occupancy by Ownership by Household Size in The Lakes
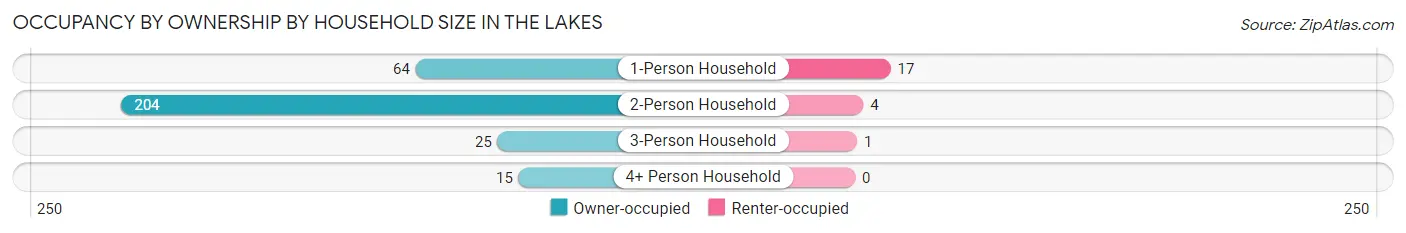
| Household Size | Owner-occupied | Renter-occupied |
| 1-Person Household | 64 (79.0%) | 17 (21.0%) |
| 2-Person Household | 204 (98.1%) | 4 (1.9%) |
| 3-Person Household | 25 (96.2%) | 1 (3.8%) |
| 4+ Person Household | 15 (100.0%) | 0 (0.0%) |
| Total Housing Units | 308 (93.3%) | 22 (6.7%) |
Occupancy by Educational Attainment in The Lakes
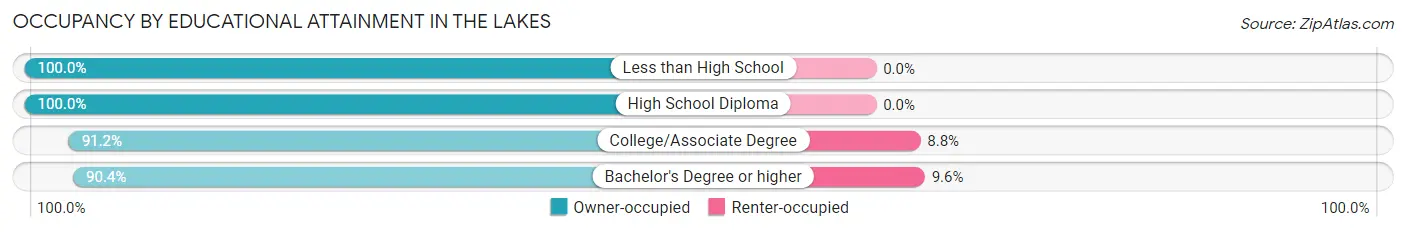
| Household Size | Owner-occupied | Renter-occupied |
| Less than High School | 5 (100.0%) | 0 (0.0%) |
| High School Diploma | 84 (100.0%) | 0 (0.0%) |
| College/Associate Degree | 125 (91.2%) | 12 (8.8%) |
| Bachelor's Degree or higher | 94 (90.4%) | 10 (9.6%) |
Occupancy by Age of Householder in The Lakes
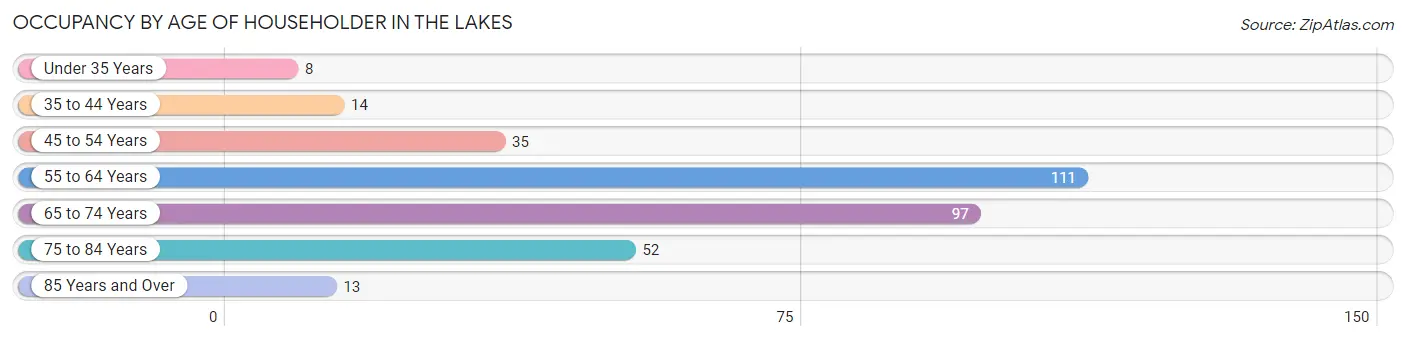
| Age Bracket | # Households | % Households |
| Under 35 Years | 8 | 2.4% |
| 35 to 44 Years | 14 | 4.2% |
| 45 to 54 Years | 35 | 10.6% |
| 55 to 64 Years | 111 | 33.6% |
| 65 to 74 Years | 97 | 29.4% |
| 75 to 84 Years | 52 | 15.8% |
| 85 Years and Over | 13 | 3.9% |
| Total | 330 | 100.0% |
Housing Finances in The Lakes
Median Income by Occupancy in The Lakes
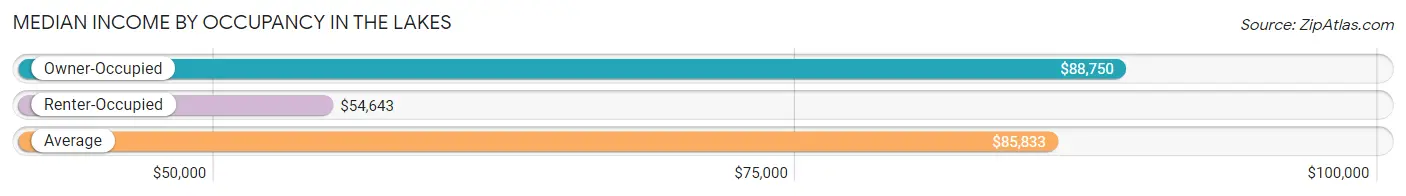
| Occupancy Type | # Households | Median Income |
| Owner-Occupied | 308 (93.3%) | $88,750 |
| Renter-Occupied | 22 (6.7%) | $54,643 |
| Average | 330 (100.0%) | $85,833 |
Occupancy by Householder Income Bracket in The Lakes
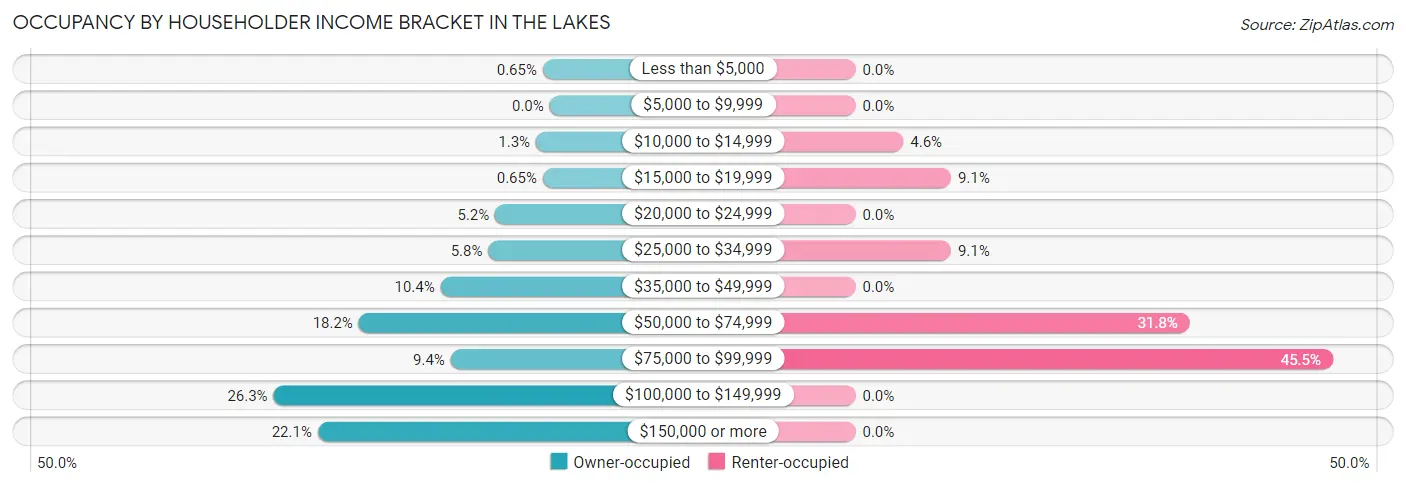
| Income Bracket | Owner-occupied | Renter-occupied |
| Less than $5,000 | 2 (0.6%) | 0 (0.0%) |
| $5,000 to $9,999 | 0 (0.0%) | 0 (0.0%) |
| $10,000 to $14,999 | 4 (1.3%) | 1 (4.5%) |
| $15,000 to $19,999 | 2 (0.6%) | 2 (9.1%) |
| $20,000 to $24,999 | 16 (5.2%) | 0 (0.0%) |
| $25,000 to $34,999 | 18 (5.8%) | 2 (9.1%) |
| $35,000 to $49,999 | 32 (10.4%) | 0 (0.0%) |
| $50,000 to $74,999 | 56 (18.2%) | 7 (31.8%) |
| $75,000 to $99,999 | 29 (9.4%) | 10 (45.5%) |
| $100,000 to $149,999 | 81 (26.3%) | 0 (0.0%) |
| $150,000 or more | 68 (22.1%) | 0 (0.0%) |
| Total | 308 (100.0%) | 22 (100.0%) |
Monthly Housing Cost Tiers in The Lakes
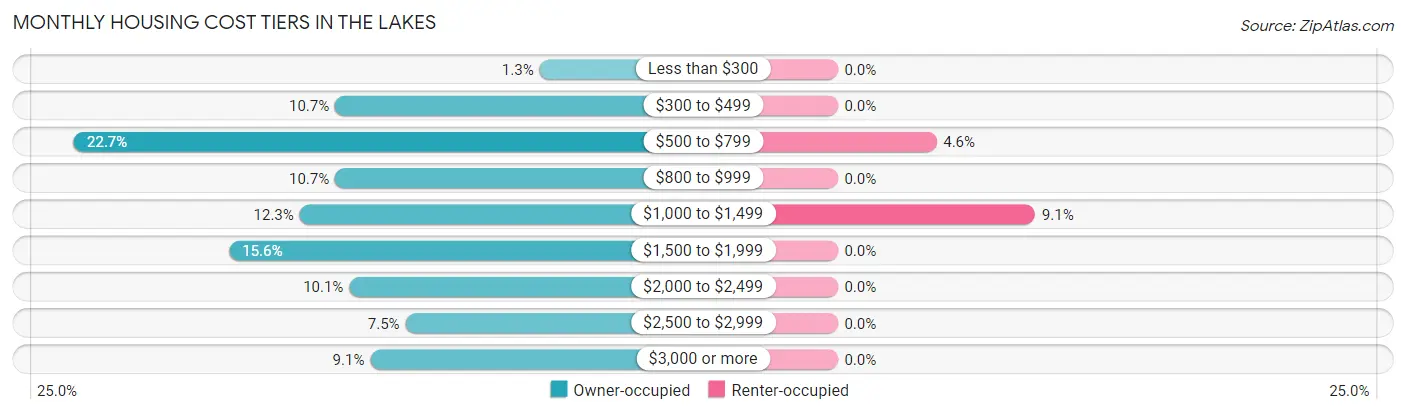
| Monthly Cost | Owner-occupied | Renter-occupied |
| Less than $300 | 4 (1.3%) | 0 (0.0%) |
| $300 to $499 | 33 (10.7%) | 0 (0.0%) |
| $500 to $799 | 70 (22.7%) | 1 (4.5%) |
| $800 to $999 | 33 (10.7%) | 0 (0.0%) |
| $1,000 to $1,499 | 38 (12.3%) | 2 (9.1%) |
| $1,500 to $1,999 | 48 (15.6%) | 0 (0.0%) |
| $2,000 to $2,499 | 31 (10.1%) | 0 (0.0%) |
| $2,500 to $2,999 | 23 (7.5%) | 0 (0.0%) |
| $3,000 or more | 28 (9.1%) | 0 (0.0%) |
| Total | 308 (100.0%) | 22 (100.0%) |
Physical Housing Characteristics in The Lakes
Housing Structures in The Lakes
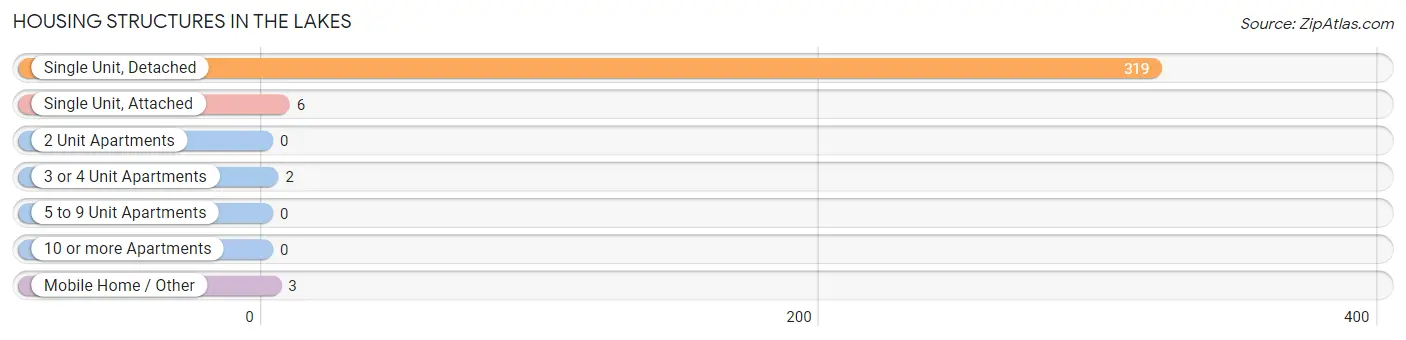
| Structure Type | # Housing Units | % Housing Units |
| Single Unit, Detached | 319 | 96.7% |
| Single Unit, Attached | 6 | 1.8% |
| 2 Unit Apartments | 0 | 0.0% |
| 3 or 4 Unit Apartments | 2 | 0.6% |
| 5 to 9 Unit Apartments | 0 | 0.0% |
| 10 or more Apartments | 0 | 0.0% |
| Mobile Home / Other | 3 | 0.9% |
| Total | 330 | 100.0% |
Housing Structures by Occupancy in The Lakes
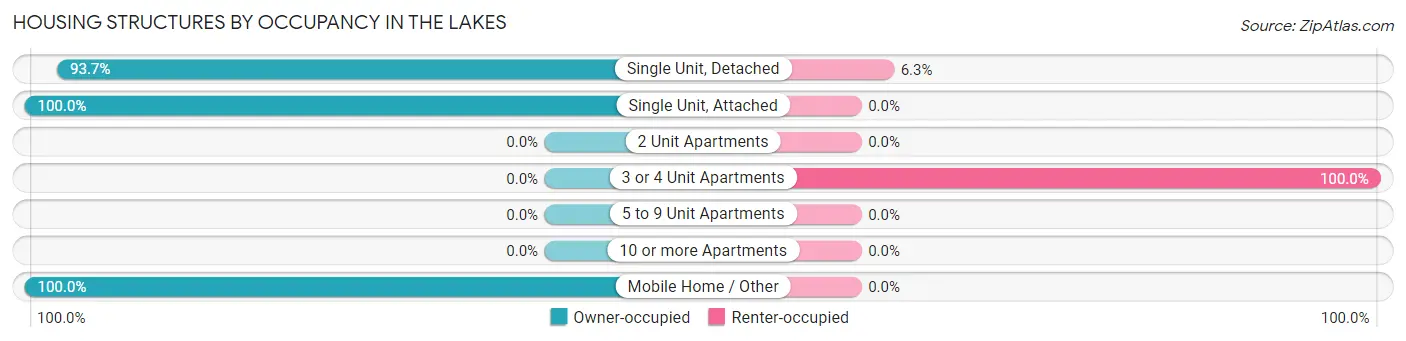
| Structure Type | Owner-occupied | Renter-occupied |
| Single Unit, Detached | 299 (93.7%) | 20 (6.3%) |
| Single Unit, Attached | 6 (100.0%) | 0 (0.0%) |
| 2 Unit Apartments | 0 (0.0%) | 0 (0.0%) |
| 3 or 4 Unit Apartments | 0 (0.0%) | 2 (100.0%) |
| 5 to 9 Unit Apartments | 0 (0.0%) | 0 (0.0%) |
| 10 or more Apartments | 0 (0.0%) | 0 (0.0%) |
| Mobile Home / Other | 3 (100.0%) | 0 (0.0%) |
| Total | 308 (93.3%) | 22 (6.7%) |
Housing Structures by Number of Rooms in The Lakes
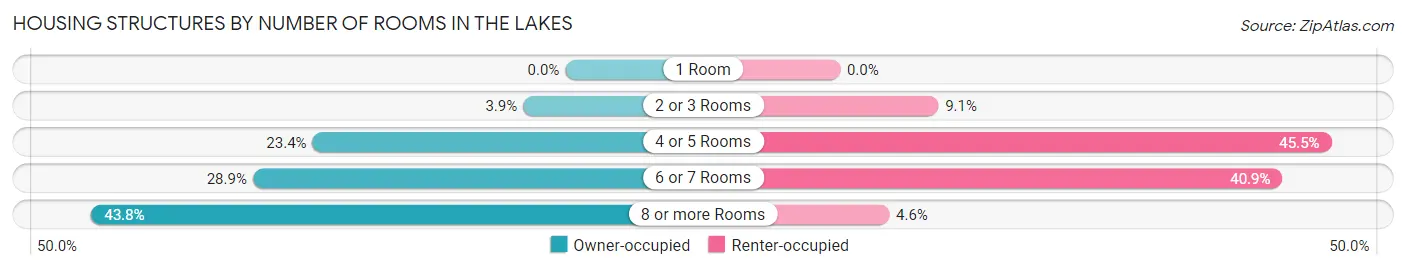
| Number of Rooms | Owner-occupied | Renter-occupied |
| 1 Room | 0 (0.0%) | 0 (0.0%) |
| 2 or 3 Rooms | 12 (3.9%) | 2 (9.1%) |
| 4 or 5 Rooms | 72 (23.4%) | 10 (45.5%) |
| 6 or 7 Rooms | 89 (28.9%) | 9 (40.9%) |
| 8 or more Rooms | 135 (43.8%) | 1 (4.5%) |
| Total | 308 (100.0%) | 22 (100.0%) |
Housing Structure by Heating Type in The Lakes
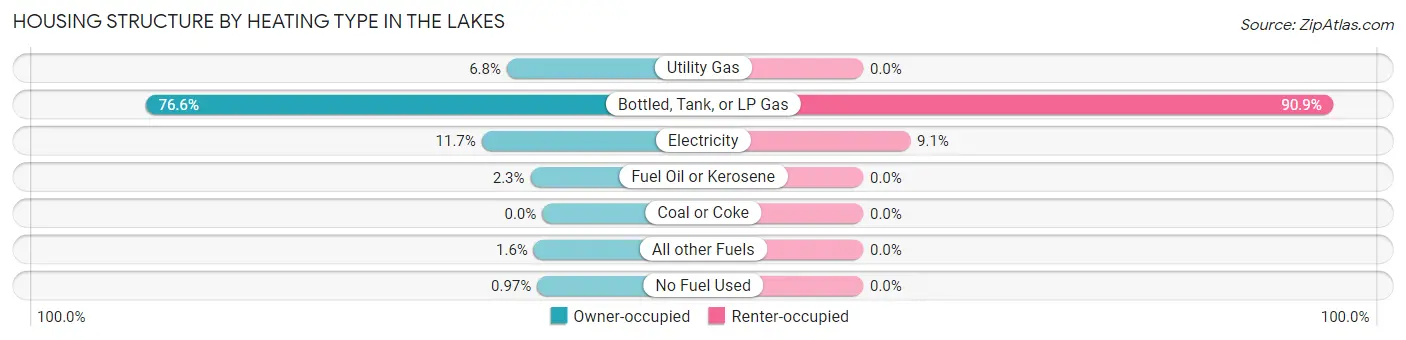
| Heating Type | Owner-occupied | Renter-occupied |
| Utility Gas | 21 (6.8%) | 0 (0.0%) |
| Bottled, Tank, or LP Gas | 236 (76.6%) | 20 (90.9%) |
| Electricity | 36 (11.7%) | 2 (9.1%) |
| Fuel Oil or Kerosene | 7 (2.3%) | 0 (0.0%) |
| Coal or Coke | 0 (0.0%) | 0 (0.0%) |
| All other Fuels | 5 (1.6%) | 0 (0.0%) |
| No Fuel Used | 3 (1.0%) | 0 (0.0%) |
| Total | 308 (100.0%) | 22 (100.0%) |
Household Vehicle Usage in The Lakes
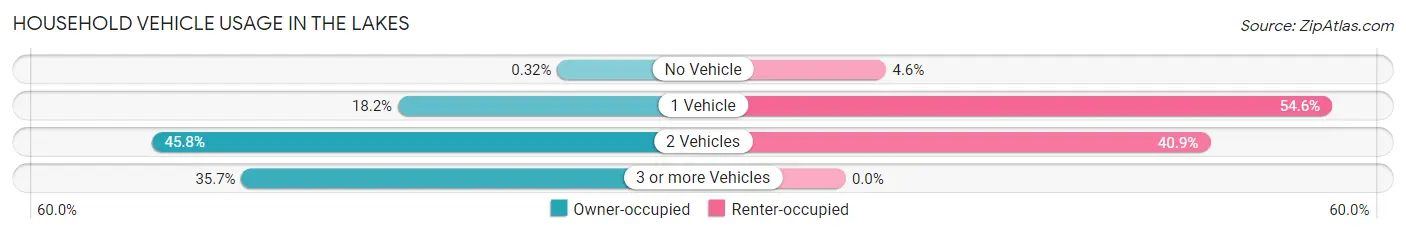
| Vehicles per Household | Owner-occupied | Renter-occupied |
| No Vehicle | 1 (0.3%) | 1 (4.5%) |
| 1 Vehicle | 56 (18.2%) | 12 (54.5%) |
| 2 Vehicles | 141 (45.8%) | 9 (40.9%) |
| 3 or more Vehicles | 110 (35.7%) | 0 (0.0%) |
| Total | 308 (100.0%) | 22 (100.0%) |
Real Estate & Mortgages in The Lakes
Real Estate and Mortgage Overview in The Lakes
| Characteristic | Without Mortgage | With Mortgage |
| Housing Units | 141 | 167 |
| Median Property Value | $385,000 | $345,000 |
| Median Household Income | $66,094 | $45 |
| Monthly Housing Costs | $631 | $28 |
| Real Estate Taxes | $2,459 | $0 |
Property Value by Mortgage Status in The Lakes
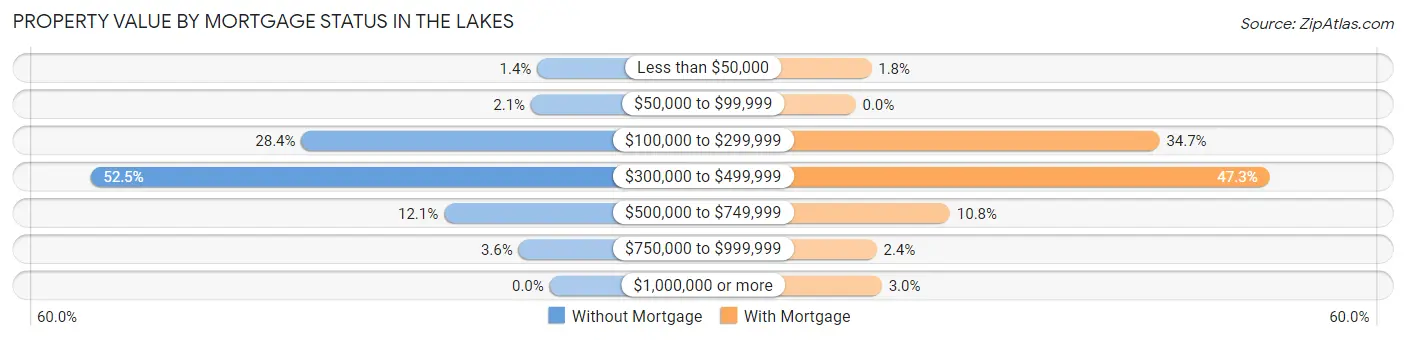
| Property Value | Without Mortgage | With Mortgage |
| Less than $50,000 | 2 (1.4%) | 3 (1.8%) |
| $50,000 to $99,999 | 3 (2.1%) | 0 (0.0%) |
| $100,000 to $299,999 | 40 (28.4%) | 58 (34.7%) |
| $300,000 to $499,999 | 74 (52.5%) | 79 (47.3%) |
| $500,000 to $749,999 | 17 (12.1%) | 18 (10.8%) |
| $750,000 to $999,999 | 5 (3.5%) | 4 (2.4%) |
| $1,000,000 or more | 0 (0.0%) | 5 (3.0%) |
| Total | 141 (100.0%) | 167 (100.0%) |
Household Income by Mortgage Status in The Lakes
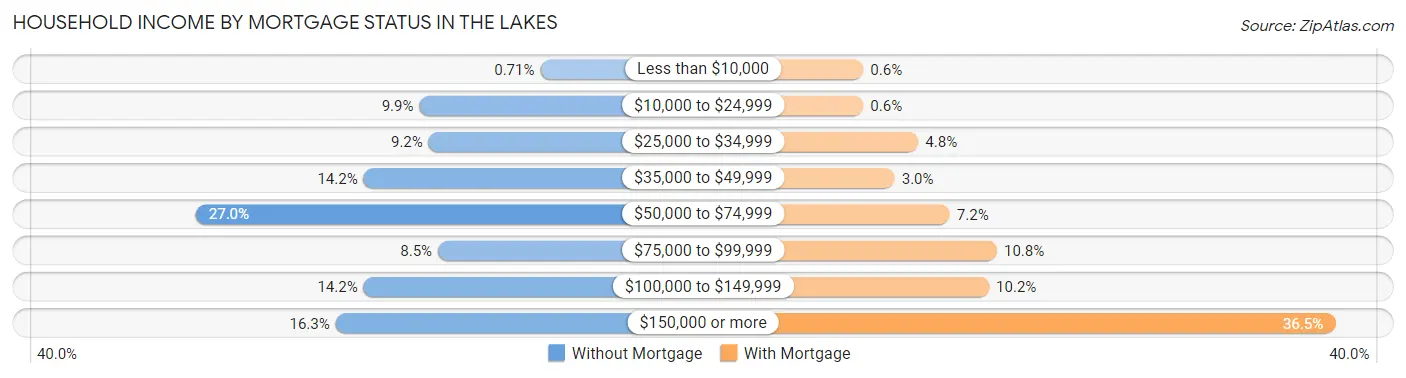
| Household Income | Without Mortgage | With Mortgage |
| Less than $10,000 | 1 (0.7%) | 1 (0.6%) |
| $10,000 to $24,999 | 14 (9.9%) | 1 (0.6%) |
| $25,000 to $34,999 | 13 (9.2%) | 8 (4.8%) |
| $35,000 to $49,999 | 20 (14.2%) | 5 (3.0%) |
| $50,000 to $74,999 | 38 (27.0%) | 12 (7.2%) |
| $75,000 to $99,999 | 12 (8.5%) | 18 (10.8%) |
| $100,000 to $149,999 | 20 (14.2%) | 17 (10.2%) |
| $150,000 or more | 23 (16.3%) | 61 (36.5%) |
| Total | 141 (100.0%) | 167 (100.0%) |
Property Value to Household Income Ratio in The Lakes
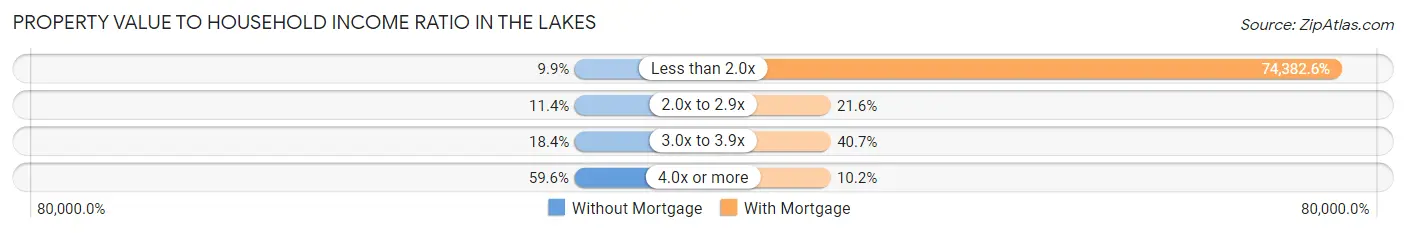
| Value-to-Income Ratio | Without Mortgage | With Mortgage |
| Less than 2.0x | 14 (9.9%) | 124,219 (74,382.6%) |
| 2.0x to 2.9x | 16 (11.4%) | 36 (21.6%) |
| 3.0x to 3.9x | 26 (18.4%) | 68 (40.7%) |
| 4.0x or more | 84 (59.6%) | 17 (10.2%) |
| Total | 141 (100.0%) | 167 (100.0%) |
Real Estate Taxes by Mortgage Status in The Lakes
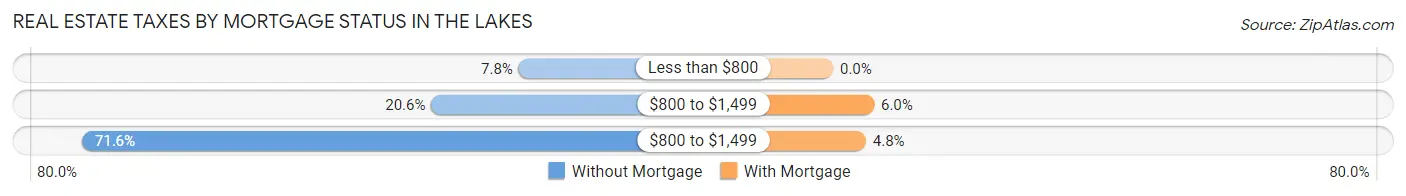
| Property Taxes | Without Mortgage | With Mortgage |
| Less than $800 | 11 (7.8%) | 0 (0.0%) |
| $800 to $1,499 | 29 (20.6%) | 10 (6.0%) |
| $800 to $1,499 | 101 (71.6%) | 8 (4.8%) |
| Total | 141 (100.0%) | 167 (100.0%) |
Health & Disability in The Lakes
Health Insurance Coverage by Age in The Lakes
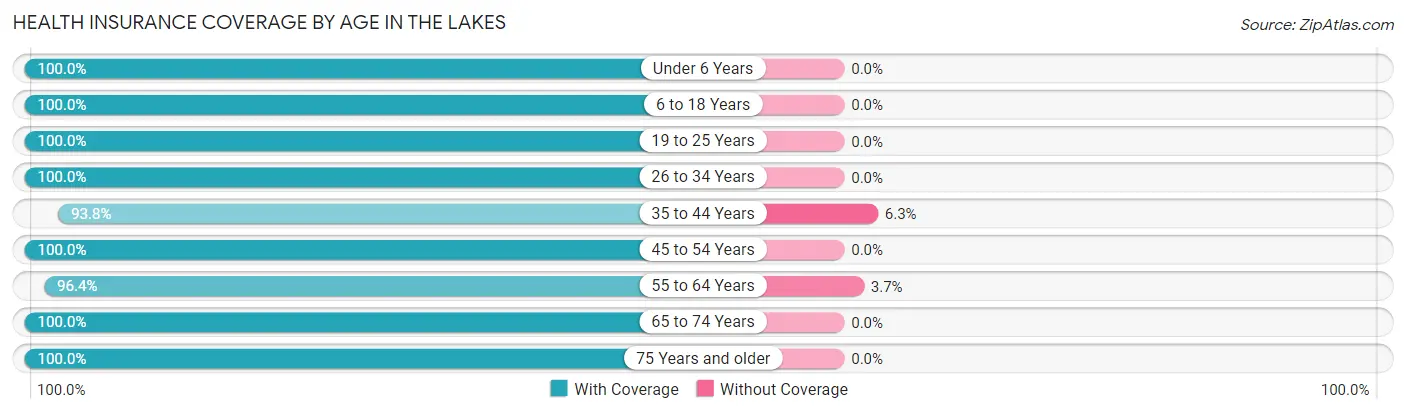
| Age Bracket | With Coverage | Without Coverage |
| Under 6 Years | 16 (100.0%) | 0 (0.0%) |
| 6 to 18 Years | 52 (100.0%) | 0 (0.0%) |
| 19 to 25 Years | 20 (100.0%) | 0 (0.0%) |
| 26 to 34 Years | 11 (100.0%) | 0 (0.0%) |
| 35 to 44 Years | 30 (93.8%) | 2 (6.2%) |
| 45 to 54 Years | 53 (100.0%) | 0 (0.0%) |
| 55 to 64 Years | 185 (96.4%) | 7 (3.6%) |
| 65 to 74 Years | 177 (100.0%) | 0 (0.0%) |
| 75 Years and older | 94 (100.0%) | 0 (0.0%) |
| Total | 638 (98.6%) | 9 (1.4%) |
Health Insurance Coverage by Citizenship Status in The Lakes
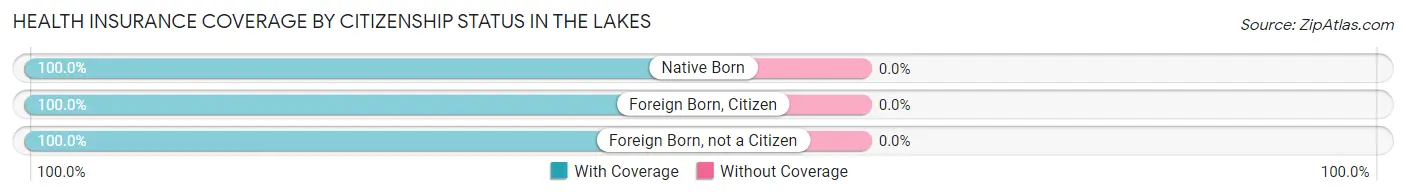
| Citizenship Status | With Coverage | Without Coverage |
| Native Born | 16 (100.0%) | 0 (0.0%) |
| Foreign Born, Citizen | 52 (100.0%) | 0 (0.0%) |
| Foreign Born, not a Citizen | 20 (100.0%) | 0 (0.0%) |
Health Insurance Coverage by Household Income in The Lakes
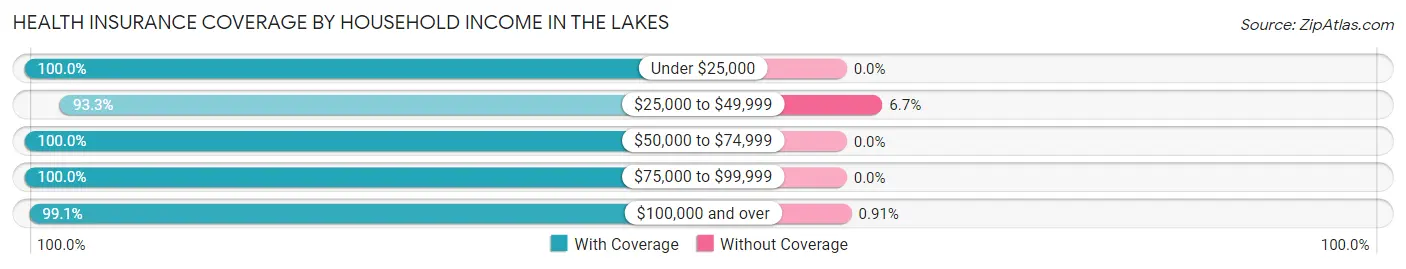
| Household Income | With Coverage | Without Coverage |
| Under $25,000 | 39 (100.0%) | 0 (0.0%) |
| $25,000 to $49,999 | 84 (93.3%) | 6 (6.7%) |
| $50,000 to $74,999 | 114 (100.0%) | 0 (0.0%) |
| $75,000 to $99,999 | 74 (100.0%) | 0 (0.0%) |
| $100,000 and over | 327 (99.1%) | 3 (0.9%) |
Public vs Private Health Insurance Coverage by Age in The Lakes
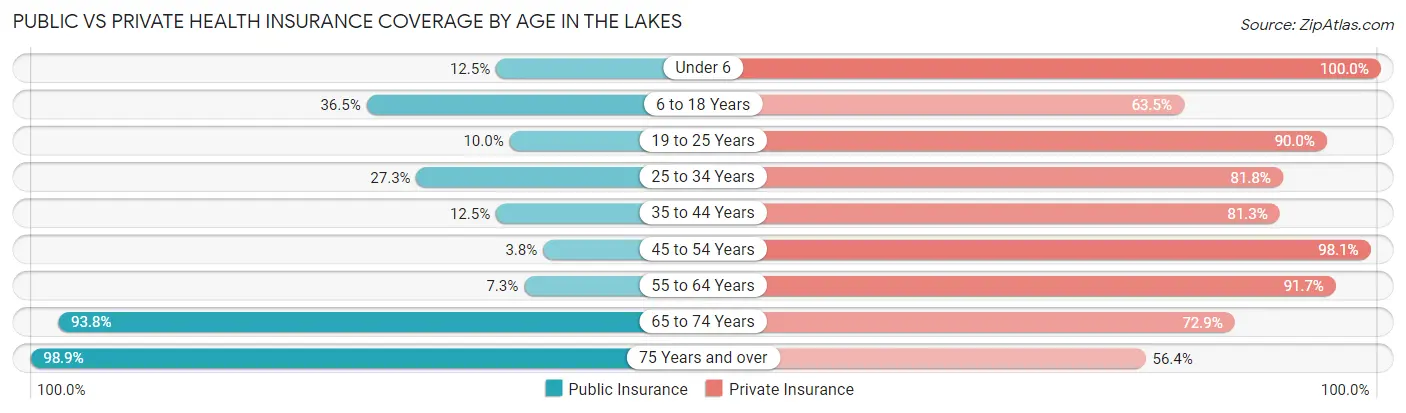
| Age Bracket | Public Insurance | Private Insurance |
| Under 6 | 2 (12.5%) | 16 (100.0%) |
| 6 to 18 Years | 19 (36.5%) | 33 (63.5%) |
| 19 to 25 Years | 2 (10.0%) | 18 (90.0%) |
| 25 to 34 Years | 3 (27.3%) | 9 (81.8%) |
| 35 to 44 Years | 4 (12.5%) | 26 (81.2%) |
| 45 to 54 Years | 2 (3.8%) | 52 (98.1%) |
| 55 to 64 Years | 14 (7.3%) | 176 (91.7%) |
| 65 to 74 Years | 166 (93.8%) | 129 (72.9%) |
| 75 Years and over | 93 (98.9%) | 53 (56.4%) |
| Total | 305 (47.1%) | 512 (79.1%) |
Disability Status by Sex by Age in The Lakes
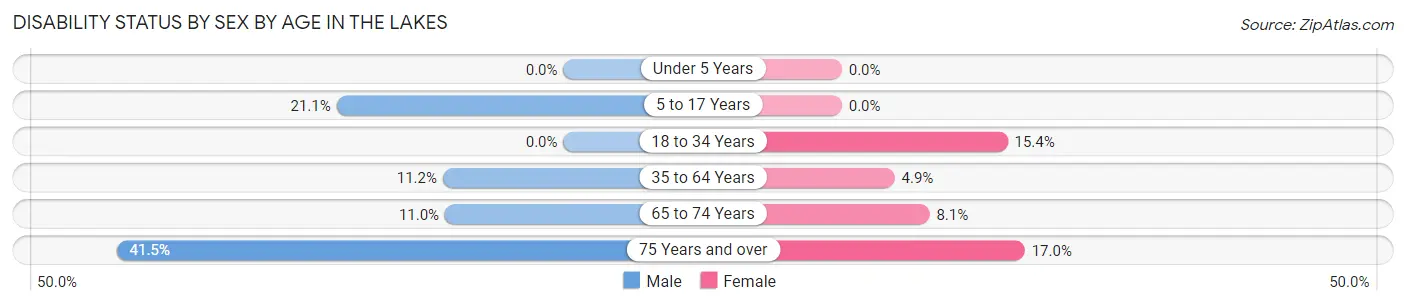
| Age Bracket | Male | Female |
| Under 5 Years | 0 (0.0%) | 0 (0.0%) |
| 5 to 17 Years | 4 (21.0%) | 0 (0.0%) |
| 18 to 34 Years | 0 (0.0%) | 2 (15.4%) |
| 35 to 64 Years | 15 (11.2%) | 7 (4.9%) |
| 65 to 74 Years | 10 (11.0%) | 7 (8.1%) |
| 75 Years and over | 17 (41.5%) | 9 (17.0%) |
Disability Class by Sex by Age in The Lakes
Disability Class: Hearing Difficulty
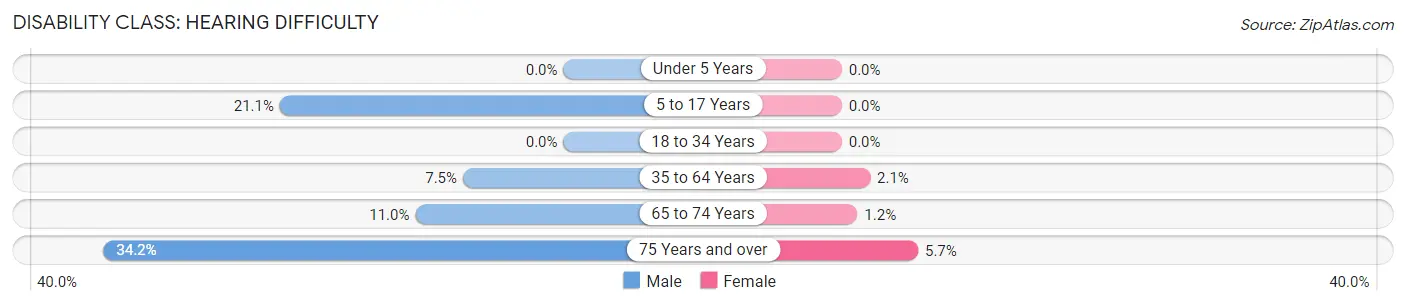
| Age Bracket | Male | Female |
| Under 5 Years | 0 (0.0%) | 0 (0.0%) |
| 5 to 17 Years | 4 (21.0%) | 0 (0.0%) |
| 18 to 34 Years | 0 (0.0%) | 0 (0.0%) |
| 35 to 64 Years | 10 (7.5%) | 3 (2.1%) |
| 65 to 74 Years | 10 (11.0%) | 1 (1.2%) |
| 75 Years and over | 14 (34.2%) | 3 (5.7%) |
Disability Class: Vision Difficulty
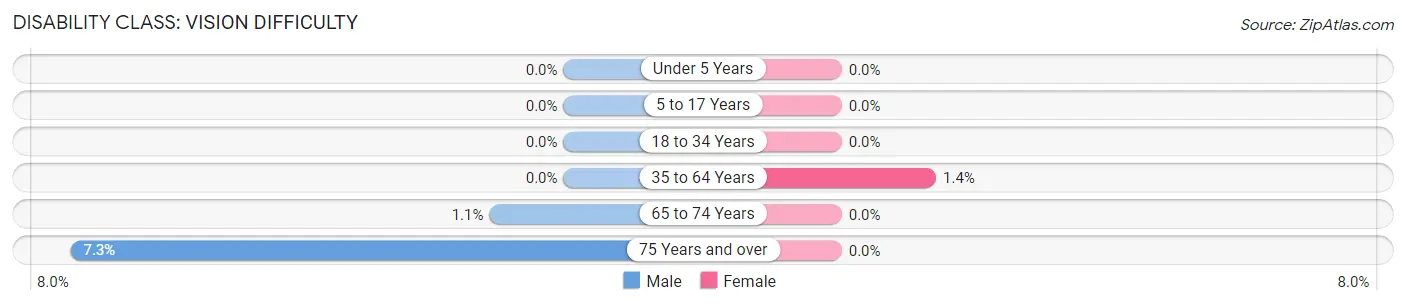
| Age Bracket | Male | Female |
| Under 5 Years | 0 (0.0%) | 0 (0.0%) |
| 5 to 17 Years | 0 (0.0%) | 0 (0.0%) |
| 18 to 34 Years | 0 (0.0%) | 0 (0.0%) |
| 35 to 64 Years | 0 (0.0%) | 2 (1.4%) |
| 65 to 74 Years | 1 (1.1%) | 0 (0.0%) |
| 75 Years and over | 3 (7.3%) | 0 (0.0%) |
Disability Class: Cognitive Difficulty
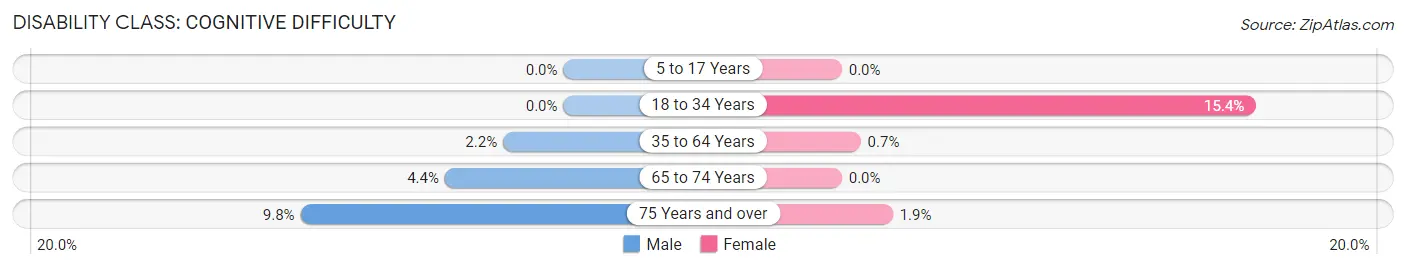
| Age Bracket | Male | Female |
| 5 to 17 Years | 0 (0.0%) | 0 (0.0%) |
| 18 to 34 Years | 0 (0.0%) | 2 (15.4%) |
| 35 to 64 Years | 3 (2.2%) | 1 (0.7%) |
| 65 to 74 Years | 4 (4.4%) | 0 (0.0%) |
| 75 Years and over | 4 (9.8%) | 1 (1.9%) |
Disability Class: Ambulatory Difficulty
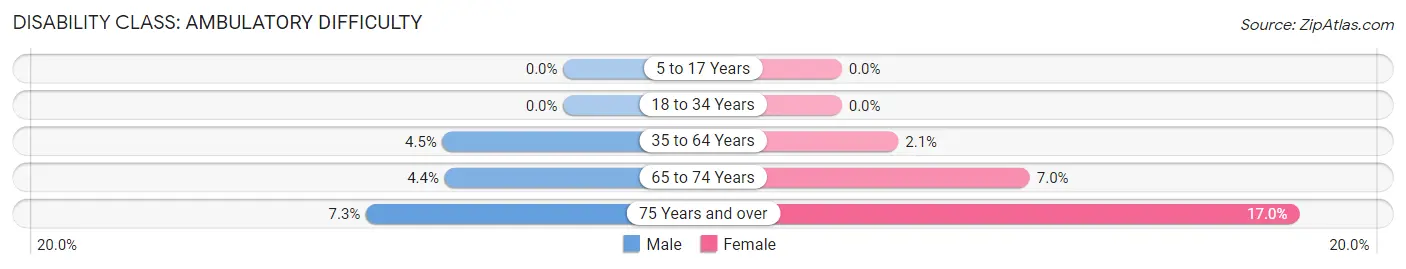
| Age Bracket | Male | Female |
| 5 to 17 Years | 0 (0.0%) | 0 (0.0%) |
| 18 to 34 Years | 0 (0.0%) | 0 (0.0%) |
| 35 to 64 Years | 6 (4.5%) | 3 (2.1%) |
| 65 to 74 Years | 4 (4.4%) | 6 (7.0%) |
| 75 Years and over | 3 (7.3%) | 9 (17.0%) |
Disability Class: Self-Care Difficulty
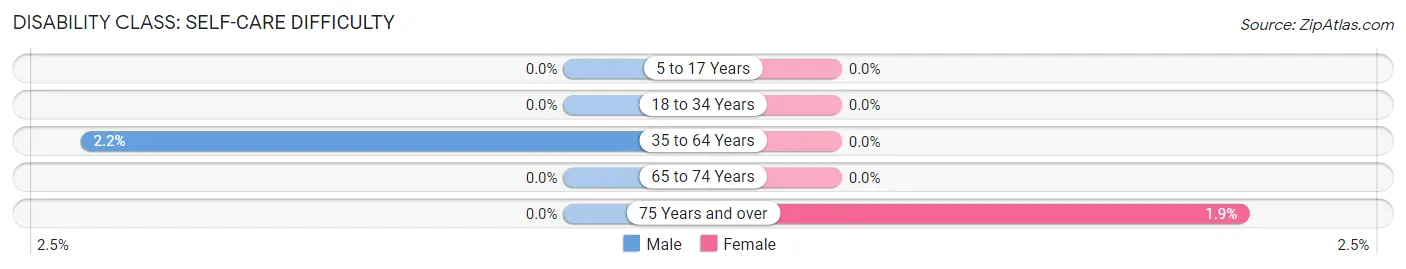
| Age Bracket | Male | Female |
| 5 to 17 Years | 0 (0.0%) | 0 (0.0%) |
| 18 to 34 Years | 0 (0.0%) | 0 (0.0%) |
| 35 to 64 Years | 3 (2.2%) | 0 (0.0%) |
| 65 to 74 Years | 0 (0.0%) | 0 (0.0%) |
| 75 Years and over | 0 (0.0%) | 1 (1.9%) |
Technology Access in The Lakes
Computing Device Access in The Lakes
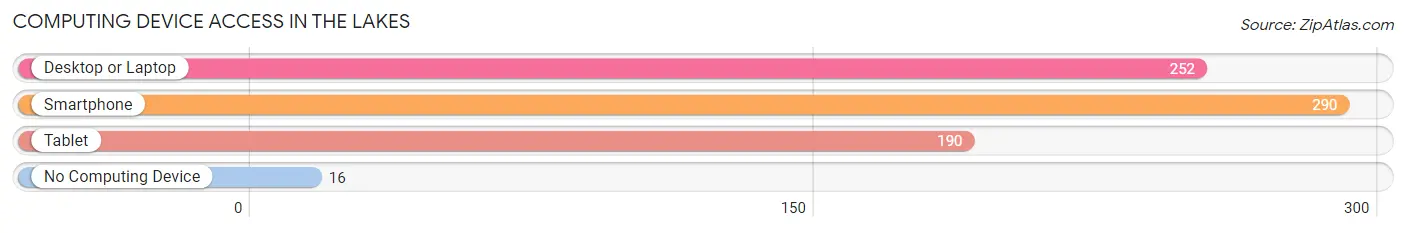
| Device Type | # Households | % Households |
| Desktop or Laptop | 252 | 76.4% |
| Smartphone | 290 | 87.9% |
| Tablet | 190 | 57.6% |
| No Computing Device | 16 | 4.9% |
| Total | 330 | 100.0% |
Internet Access in The Lakes
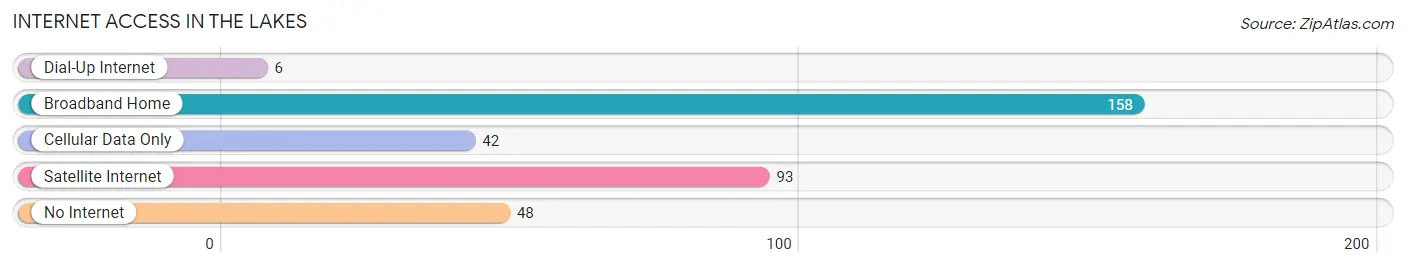
| Internet Type | # Households | % Households |
| Dial-Up Internet | 6 | 1.8% |
| Broadband Home | 158 | 47.9% |
| Cellular Data Only | 42 | 12.7% |
| Satellite Internet | 93 | 28.2% |
| No Internet | 48 | 14.5% |
| Total | 330 | 100.0% |
The Lakes Summary
The city of Lakes, Minnesota is located in the northern part of the state, just south of the Twin Cities metropolitan area. It is a small city of about 8,000 people, and is part of the larger Hennepin County. The city is known for its many lakes, which give it its name, and its proximity to the larger cities of Minneapolis and St. Paul.
History
The area that is now Lakes, Minnesota was first settled in the late 1800s by a group of Scandinavian immigrants. The area was originally known as “Lakeside” and was a small farming community. In the early 1900s, the area began to grow and develop, and in 1912, the city of Lakes was officially incorporated.
The city of Lakes has a long history of being a popular destination for tourists and outdoor enthusiasts. The city is home to many parks and trails, as well as numerous lakes and rivers. The city is also home to a number of historic sites, including the historic Lakeside Hotel, which was built in the late 1800s.
Geography
The city of Lakes is located in the northern part of Minnesota, just south of the Twin Cities metropolitan area. The city is situated on the banks of the Mississippi River, and is surrounded by a number of lakes, including Lake Minnetonka, Lake Calhoun, and Lake Harriet. The city is also home to a number of parks and trails, including the popular Minnehaha Park.
Economy
The economy of Lakes is largely based on tourism and outdoor recreation. The city is home to a number of popular attractions, including the historic Lakeside Hotel, the Minnehaha Park, and the Chain of Lakes. The city is also home to a number of businesses, including restaurants, retail stores, and professional services.
Demographics
As of the 2010 census, the population of Lakes was 8,072. The population is largely white, with a small percentage of African Americans, Asians, and Hispanics. The median household income in the city is $50,000, and the median age is 37. The city is home to a number of educational institutions, including the University of Minnesota, the University of St. Thomas, and the University of Minnesota-Twin Cities.
Conclusion
The city of Lakes, Minnesota is a small city located in the northern part of the state, just south of the Twin Cities metropolitan area. The city is known for its many lakes, which give it its name, and its proximity to the larger cities of Minneapolis and St. Paul. The economy of Lakes is largely based on tourism and outdoor recreation, and the city is home to a number of popular attractions, businesses, and educational institutions. The population of Lakes is largely white, with a small percentage of African Americans, Asians, and Hispanics.
Common Questions
What is the Total Population of The Lakes?
Total Population of The Lakes is 647.
What is the Total Male Population of The Lakes?
Total Male Population of The Lakes is 317.
What is the Total Female Population of The Lakes?
Total Female Population of The Lakes is 330.
What is the Ratio of Males per 100 Females in The Lakes?
There are 96.06 Males per 100 Females in The Lakes.
What is the Ratio of Females per 100 Males in The Lakes?
There are 104.10 Females per 100 Males in The Lakes.
What is the Median Population Age in The Lakes?
Median Population Age in The Lakes is 63.7 Years.
What is the Average Family Size in The Lakes
Average Family Size in The Lakes is 2.3 People.
What is the Average Household Size in The Lakes
Average Household Size in The Lakes is 2.0 People.
What is Per Capita Income in The Lakes?
Per Capita income in The Lakes is $55,226.
What is the Median Family Income in The Lakes?
Median Family Income in The Lakes is $107,917.
What is the Median Household income in The Lakes?
Median Household Income in The Lakes is $85,833.
What is Income or Wage Gap in The Lakes?
Income or Wage Gap in The Lakes is 31.2%.
Women in The Lakes earn 68.8 cents for every dollar earned by a man.
What is Inequality or Gini Index in The Lakes?
Inequality or Gini Index in The Lakes is 0.39.
How Large is the Labor Force in The Lakes?
There are 347 People in the Labor Forcein in The Lakes.
What is the Percentage of People in the Labor Force in The Lakes?
56.6% of People are in the Labor Force in The Lakes.
What is the Unemployment Rate in The Lakes?
Unemployment Rate in The Lakes is 2.3%.