Cities with the Highest Percentage of Immigrants from Saudi Arabia in the United States
RELATED REPORTS & OPTIONS
Saudi Arabia
United States
Compare Cities
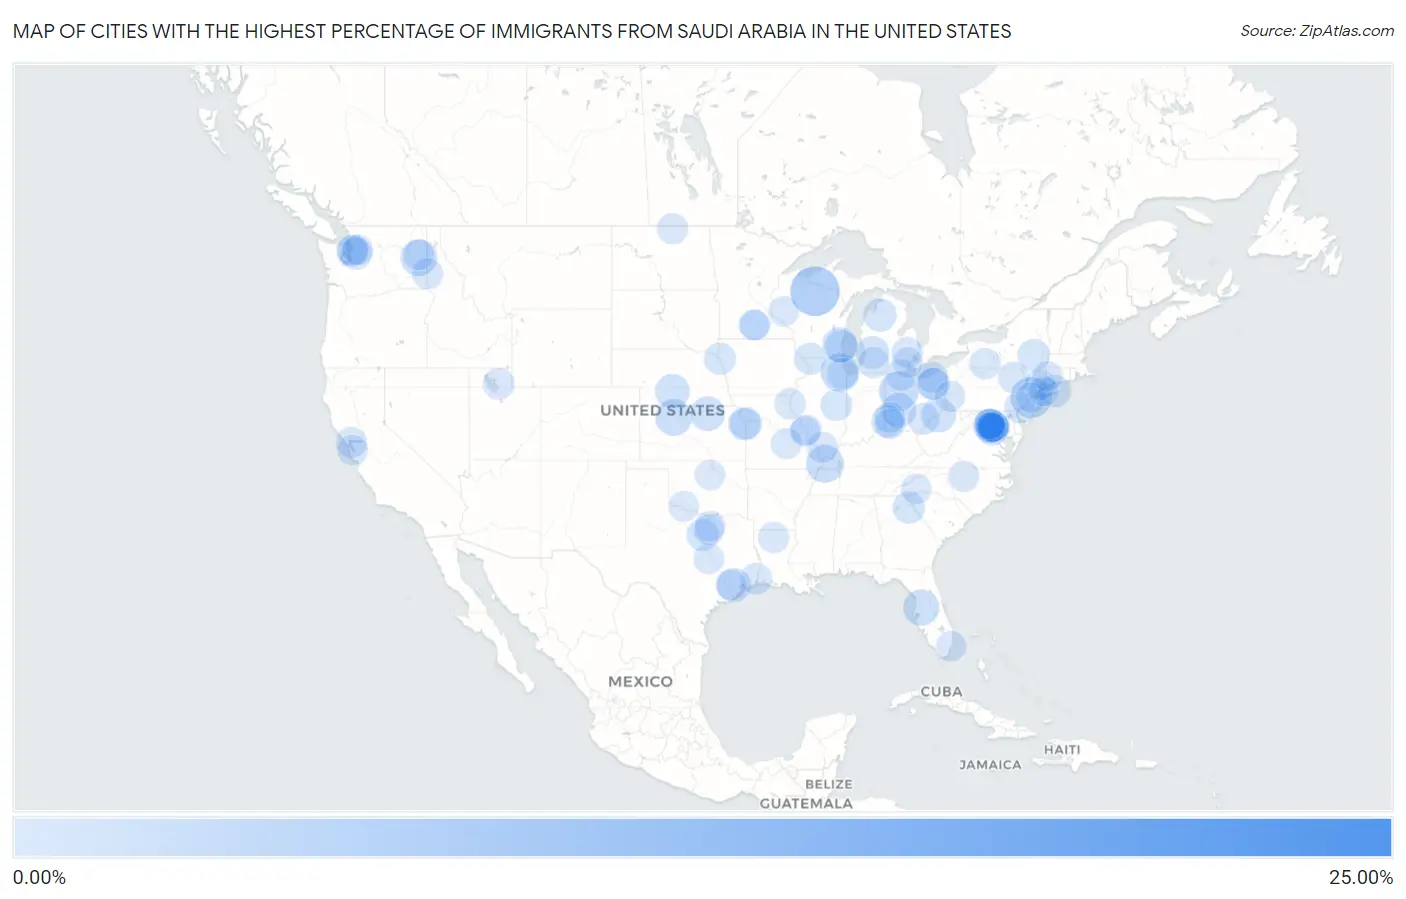
Map of Cities with the Highest Percentage of Immigrants from Saudi Arabia in the United States
0.00%
25.00%
Cities with the Highest Percentage of Immigrants from Saudi Arabia in the United States
| City | Saudi Arabia | vs State | vs National | |
| 1. | Bolivar | 20.41% | 0.0073%(+20.4)#-1 | 0.020%(+20.4)#0 |
| 2. | Mehan | 8.82% | 0.021%(+8.80)#-1 | 0.020%(+8.80)#1 |
| 3. | Minocqua | 6.15% | 0.017%(+6.13)#-1 | 0.020%(+6.13)#2 |
| 4. | Pleasant Plains | 3.62% | 0.021%(+3.60)#-1 | 0.020%(+3.60)#3 |
| 5. | Ada | 3.11% | 0.031%(+3.07)#-1 | 0.020%(+3.09)#4 |
| 6. | Clarendon Hills | 2.71% | 0.026%(+2.69)#-1 | 0.020%(+2.69)#5 |
| 7. | Arlington | 2.63% | 0.0077%(+2.62)#-1 | 0.020%(+2.61)#6 |
| 8. | Silverado | 2.28% | 0.019%(+2.26)#-1 | 0.020%(+2.26)#7 |
| 9. | Bogue | 2.27% | 0.014%(+2.26)#-1 | 0.020%(+2.25)#8 |
| 10. | Cheney | 2.26% | 0.026%(+2.24)#-1 | 0.020%(+2.25)#9 |
| 11. | Riverdale Borough | 2.21% | 0.021%(+2.18)#0 | 0.020%(+2.19)#10 |
| 12. | St Leo | 2.14% | 0.021%(+2.12)#-1 | 0.020%(+2.12)#11 |
| 13. | Brown Deer | 1.87% | 0.017%(+1.85)#0 | 0.020%(+1.85)#12 |
| 14. | Fair Oaks | 1.74% | 0.043%(+1.70)#45 | 0.020%(+1.72)#688 |
| 15. | Lexington | 1.66% | 0.032%(+1.63)#-1 | 0.020%(+1.64)#689 |
| 16. | Matamoras | 1.65% | 0.031%(+1.62)#0 | 0.020%(+1.63)#690 |
| 17. | Vining | 1.64% | 0.014%(+1.63)#0 | 0.020%(+1.62)#691 |
| 18. | Cedarville | 1.61% | 0.031%(+1.58)#1 | 0.020%(+1.59)#692 |
| 19. | Southside Place | 1.56% | 0.032%(+1.53)#-1 | 0.020%(+1.54)#693 |
| 20. | Roeland Park | 1.45% | 0.014%(+1.43)#1 | 0.020%(+1.43)#694 |
| 21. | Merrifield | 1.32% | 0.043%(+1.28)#46 | 0.020%(+1.30)#695 |
| 22. | Byron Center | 1.22% | 0.031%(+1.19)#-1 | 0.020%(+1.20)#696 |
| 23. | Kalkaska | 1.21% | 0.031%(+1.18)#0 | 0.020%(+1.19)#697 |
| 24. | Glendale | 1.17% | 0.017%(+1.15)#1 | 0.020%(+1.15)#698 |
| 25. | Coleytown | 1.12% | 0.023%(+1.10)#-1 | 0.020%(+1.10)#699 |
| 26. | Roessleville | 1.10% | 0.016%(+1.08)#-1 | 0.020%(+1.08)#700 |
| 27. | Mastic Beach | 1.03% | 0.016%(+1.02)#0 | 0.020%(+1.01)#701 |
| 28. | Dent | 1.00% | 0.031%(+0.972)#2 | 0.020%(+0.983)#702 |
| 29. | Pensacola Station | 1.00% | 0.021%(+0.976)#0 | 0.020%(+0.977)#703 |
| 30. | Kent | 0.98% | 0.031%(+0.949)#13 | 0.020%(+0.961)#704 |
| 31. | Tysons | 0.97% | 0.043%(+0.931)#47 | 0.020%(+0.954)#705 |
| 32. | Royston | 0.95% | 0.010%(+0.944)#-1 | 0.020%(+0.935)#706 |
| 33. | Schoharie | 0.94% | 0.016%(+0.925)#1 | 0.020%(+0.922)#707 |
| 34. | South Sioux City | 0.90% | 0.032%(+0.865)#0 | 0.020%(+0.876)#708 |
| 35. | Annetta North | 0.88% | 0.032%(+0.852)#0 | 0.020%(+0.864)#709 |
| 36. | Savoy | 0.88% | 0.026%(+0.849)#0 | 0.020%(+0.856)#710 |
| 37. | Apple River | 0.86% | 0.026%(+0.831)#1 | 0.020%(+0.837)#711 |
| 38. | Union Hill Novelty Hill | 0.84% | 0.026%(+0.812)#1 | 0.020%(+0.817)#712 |
| 39. | South Ogden | 0.84% | 0.014%(+0.822)#4 | 0.020%(+0.816)#713 |
| 40. | Bridge City | 0.84% | 0.032%(+0.803)#1 | 0.020%(+0.815)#714 |
| 41. | Chicago Ridge | 0.81% | 0.026%(+0.786)#2 | 0.020%(+0.792)#715 |
| 42. | Stow | 0.81% | 0.031%(+0.776)#14 | 0.020%(+0.787)#716 |
| 43. | Paramus Borough | 0.80% | 0.021%(+0.777)#1 | 0.020%(+0.778)#717 |
| 44. | Dunn Loring | 0.79% | 0.043%(+0.749)#48 | 0.020%(+0.773)#718 |
| 45. | Athens | 0.78% | 0.031%(+0.753)#15 | 0.020%(+0.764)#719 |
| 46. | Alderwood Manor | 0.75% | 0.026%(+0.725)#2 | 0.020%(+0.731)#720 |
| 47. | Stone Ridge | 0.75% | 0.043%(+0.705)#49 | 0.020%(+0.728)#721 |
| 48. | Folsom | 0.74% | 0.019%(+0.719)#1 | 0.020%(+0.718)#722 |
| 49. | Alfred | 0.72% | 0.016%(+0.705)#2 | 0.020%(+0.701)#723 |
| 50. | Glenburn | 0.72% | 0.019%(+0.700)#2 | 0.020%(+0.700)#724 |
| 51. | Canton | 0.70% | 0.020%(+0.675)#-1 | 0.020%(+0.675)#725 |
| 52. | Ottawa Hills | 0.69% | 0.031%(+0.659)#16 | 0.020%(+0.670)#726 |
| 53. | Burgettstown Borough | 0.68% | 0.019%(+0.665)#3 | 0.020%(+0.665)#727 |
| 54. | Kalamazoo | 0.68% | 0.031%(+0.647)#1 | 0.020%(+0.658)#728 |
| 55. | Belcourt | 0.68% | 0.016%(+0.661)#-1 | 0.020%(+0.657)#729 |
| 56. | Moscow | 0.66% | 0.017%(+0.639)#1 | 0.020%(+0.636)#848 |
| 57. | Blawnox Borough | 0.65% | 0.019%(+0.633)#4 | 0.020%(+0.633)#849 |
| 58. | Lake Orion | 0.65% | 0.031%(+0.621)#2 | 0.020%(+0.632)#850 |
| 59. | Pepper Pike | 0.65% | 0.031%(+0.618)#17 | 0.020%(+0.629)#851 |
| 60. | Lorton | 0.64% | 0.043%(+0.596)#57 | 0.020%(+0.620)#950 |
| 61. | Cheswick Borough | 0.61% | 0.019%(+0.591)#5 | 0.020%(+0.591)#951 |
| 62. | Mission | 0.61% | 0.014%(+0.593)#2 | 0.020%(+0.587)#952 |
| 63. | Santa Rita Ranch | 0.60% | 0.032%(+0.570)#2 | 0.020%(+0.582)#953 |
| 64. | Seven Corners | 0.60% | 0.043%(+0.559)#58 | 0.020%(+0.582)#954 |
| 65. | Montalvin Manor | 0.59% | 0.019%(+0.573)#0 | 0.020%(+0.572)#955 |
| 66. | Mcnair | 0.59% | 0.043%(+0.543)#59 | 0.020%(+0.566)#956 |
| 67. | Vienna | 0.59% | 0.043%(+0.542)#60 | 0.020%(+0.566)#999 |
| 68. | Ruston | 0.57% | 0.0083%(+0.566)#-1 | 0.020%(+0.555)#1,000 |
| 69. | Mebane | 0.55% | 0.010%(+0.543)#-1 | 0.020%(+0.533)#1,001 |
| 70. | Valley Cottage | 0.55% | 0.016%(+0.535)#3 | 0.020%(+0.532)#1,002 |
| 71. | Larch Way | 0.55% | 0.026%(+0.520)#3 | 0.020%(+0.526)#1,003 |
| 72. | Carbondale | 0.54% | 0.026%(+0.514)#3 | 0.020%(+0.520)#1,004 |
| 73. | Beckett Ridge | 0.53% | 0.031%(+0.495)#30 | 0.020%(+0.507)#1,005 |
| 74. | Rolla | 0.52% | 0.020%(+0.499)#0 | 0.020%(+0.500)#1,006 |
| 75. | Woods Creek | 0.51% | 0.026%(+0.485)#4 | 0.020%(+0.491)#1,007 |
| 76. | Lincolnia | 0.50% | 0.043%(+0.457)#63 | 0.020%(+0.480)#1,029 |
| 77. | Bruceville Eddy | 0.49% | 0.032%(+0.456)#3 | 0.020%(+0.468)#1,030 |
| 78. | Frederick | 0.49% | 0.021%(+0.467)#0 | 0.020%(+0.468)#1,031 |
| 79. | Carnot Moon | 0.49% | 0.019%(+0.468)#6 | 0.020%(+0.467)#1,032 |
| 80. | North Mankato | 0.48% | 0.021%(+0.463)#-1 | 0.020%(+0.465)#1,033 |
| 81. | Fair Lakes | 0.48% | 0.043%(+0.439)#64 | 0.020%(+0.462)#1,034 |
| 82. | Foster City | 0.48% | 0.019%(+0.460)#29 | 0.020%(+0.459)#1,035 |
| 83. | Olivette | 0.46% | 0.020%(+0.443)#1 | 0.020%(+0.443)#1,036 |
| 84. | Westlake | 0.46% | 0.032%(+0.430)#4 | 0.020%(+0.442)#1,037 |
| 85. | Town And Country | 0.46% | 0.020%(+0.438)#4 | 0.020%(+0.438)#1,038 |
| 86. | Highland Heights | 0.46% | 0.0077%(+0.449)#0 | 0.020%(+0.437)#1,039 |
| 87. | Mission Bend | 0.45% | 0.032%(+0.423)#5 | 0.020%(+0.435)#1,040 |
| 88. | Dearborn | 0.45% | 0.031%(+0.419)#3 | 0.020%(+0.429)#1,041 |
| 89. | Denton | 0.45% | 0.032%(+0.414)#50 | 0.020%(+0.426)#1,042 |
| 90. | Bay Harbor Islands | 0.44% | 0.021%(+0.424)#1 | 0.020%(+0.425)#1,043 |
| 91. | Dulles Town Center | 0.44% | 0.043%(+0.399)#65 | 0.020%(+0.422)#1,044 |
| 92. | Franklin Park | 0.43% | 0.021%(+0.411)#2 | 0.020%(+0.412)#1,045 |
| 93. | Menomonie | 0.43% | 0.017%(+0.412)#2 | 0.020%(+0.409)#1,046 |
| 94. | Mankato | 0.43% | 0.021%(+0.404)#0 | 0.020%(+0.405)#1,047 |
| 95. | Mills River | 0.42% | 0.010%(+0.412)#0 | 0.020%(+0.403)#1,048 |
| 96. | New Milford | 0.41% | 0.023%(+0.386)#0 | 0.020%(+0.389)#1,049 |
| 97. | Fairfax | 0.41% | 0.043%(+0.365)#66 | 0.020%(+0.389)#1,050 |
| 98. | Stillwater | 0.41% | 0.021%(+0.386)#1 | 0.020%(+0.387)#1,051 |
| 99. | Airway Heights | 0.41% | 0.026%(+0.381)#5 | 0.020%(+0.387)#1,052 |
| 100. | Searingtown | 0.40% | 0.016%(+0.388)#4 | 0.020%(+0.384)#1,053 |
Common Questions
What are the Top 10 Cities with the Highest Percentage of Immigrants from Saudi Arabia in the United States?
Top 10 Cities with the Highest Percentage of Immigrants from Saudi Arabia in the United States are:
What city has the Highest Percentage of Immigrants from Saudi Arabia in the United States?
Minocqua has the Highest Percentage of Immigrants from Saudi Arabia in the United States with 6.15%.
What is the Percentage of Immigrants from Saudi Arabia in the United States?
Percentage of Immigrants from Saudi Arabia in the United States is 0.020%.