Houston County, GA
Houston County Overview
164,117
TOTAL POPULATION
79,890
MALE POPULATION
84,227
FEMALE POPULATION
94.85
MALES / 100 FEMALES
105.43
FEMALES / 100 MALES
36.1
MEDIAN AGE
3.2
AVG FAMILY SIZE
2.7
AVG HOUSEHOLD SIZE
$35,223
PER CAPITA INCOME
$91,406
AVG FAMILY INCOME
$76,968
AVG HOUSEHOLD INCOME
27.8%
WAGE / INCOME GAP [ % ]
72.2¢/ $1
WAGE / INCOME GAP [ $ ]
$11,224
FAMILY INCOME DEFICIT
0.41
INEQUALITY / GINI INDEX
83,215
LABOR FORCE [ PEOPLE ]
65.3%
PERCENT IN LABOR FORCE
4.8%
UNEMPLOYMENT RATE
Houston County Area Codes
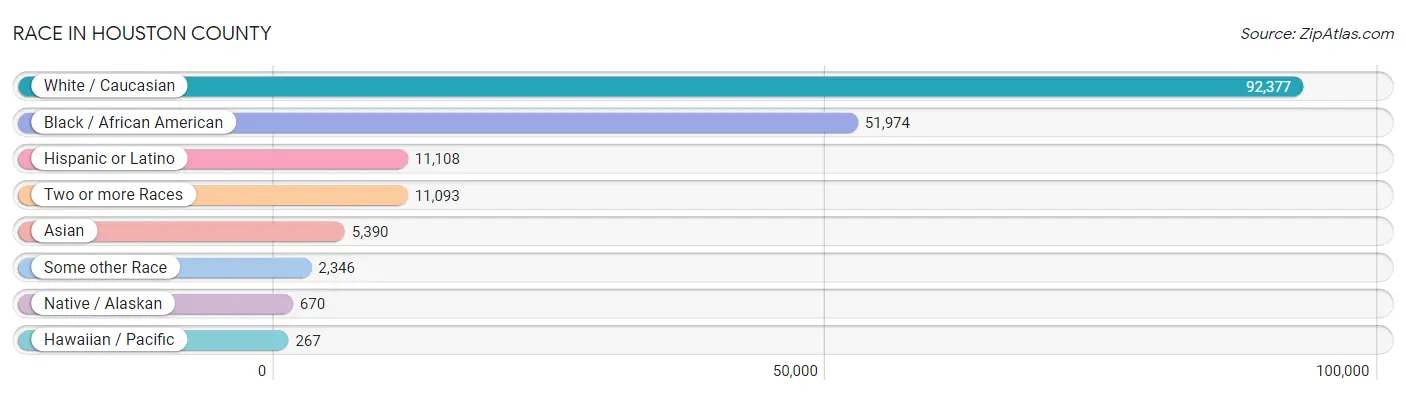
Race in Houston County
The most populous races in Houston County are White / Caucasian (92,377 | 56.3%), Black / African American (51,974 | 31.7%), and Hispanic or Latino (11,108 | 6.8%).
| Race | # Population | % Population |
| Asian | 5,390 | 3.3% |
| Black / African American | 51,974 | 31.7% |
| Hawaiian / Pacific | 267 | 0.2% |
| Hispanic or Latino | 11,108 | 6.8% |
| Native / Alaskan | 670 | 0.4% |
| White / Caucasian | 92,377 | 56.3% |
| Two or more Races | 11,093 | 6.8% |
| Some other Race | 2,346 | 1.4% |
| Total | 164,117 | 100.0% |
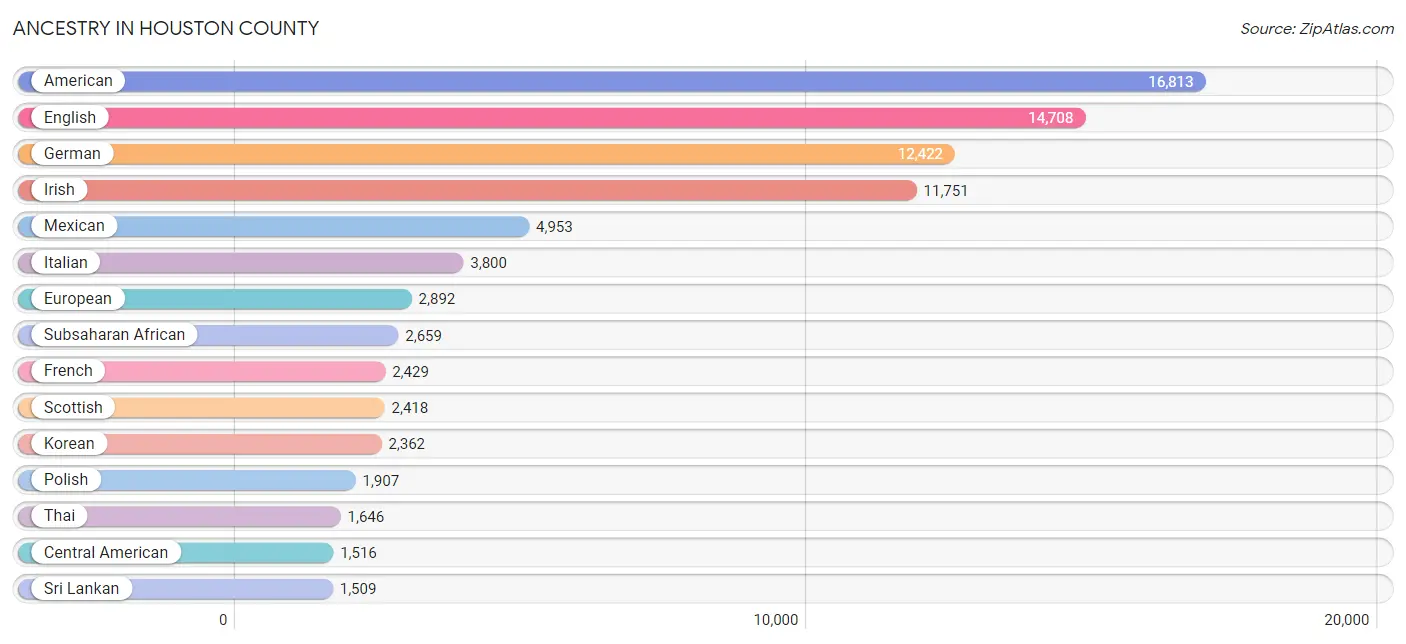
Ancestry in Houston County
The most populous ancestries reported in Houston County are American (16,813 | 10.2%), English (14,708 | 9.0%), German (12,422 | 7.6%), Irish (11,751 | 7.2%), and Mexican (4,953 | 3.0%), together accounting for 36.9% of all Houston County residents.
| Ancestry | # Population | % Population |
| African | 1,294 | 0.8% |
| Albanian | 33 | 0.0% |
| American | 16,813 | 10.2% |
| Apache | 28 | 0.0% |
| Arab | 517 | 0.3% |
| Argentinean | 311 | 0.2% |
| Armenian | 20 | 0.0% |
| Australian | 106 | 0.1% |
| Austrian | 105 | 0.1% |
| Bahamian | 3 | 0.0% |
| Bangladeshi | 18 | 0.0% |
| Belgian | 153 | 0.1% |
| Bhutanese | 280 | 0.2% |
| Blackfeet | 270 | 0.2% |
| Brazilian | 162 | 0.1% |
| British | 1,177 | 0.7% |
| British West Indian | 89 | 0.1% |
| Bulgarian | 39 | 0.0% |
| Burmese | 783 | 0.5% |
| Cajun | 98 | 0.1% |
| Canadian | 137 | 0.1% |
| Celtic | 74 | 0.1% |
| Central American | 1,516 | 0.9% |
| Central American Indian | 36 | 0.0% |
| Cherokee | 713 | 0.4% |
| Choctaw | 171 | 0.1% |
| Colombian | 469 | 0.3% |
| Creek | 41 | 0.0% |
| Croatian | 45 | 0.0% |
| Cuban | 763 | 0.5% |
| Czech | 187 | 0.1% |
| Czechoslovakian | 52 | 0.0% |
| Danish | 63 | 0.0% |
| Dominican | 206 | 0.1% |
| Dutch | 1,179 | 0.7% |
| Eastern European | 292 | 0.2% |
| Ecuadorian | 138 | 0.1% |
| Egyptian | 5 | 0.0% |
| English | 14,708 | 9.0% |
| Ethiopian | 554 | 0.3% |
| European | 2,892 | 1.8% |
| Filipino | 61 | 0.0% |
| Finnish | 76 | 0.1% |
| French | 2,429 | 1.5% |
| French Canadian | 414 | 0.3% |
| German | 12,422 | 7.6% |
| Ghanaian | 9 | 0.0% |
| Greek | 357 | 0.2% |
| Guatemalan | 541 | 0.3% |
| Haitian | 264 | 0.2% |
| Honduran | 138 | 0.1% |
| Hungarian | 131 | 0.1% |
| Indian (Asian) | 527 | 0.3% |
| Indonesian | 254 | 0.2% |
| Iranian | 11 | 0.0% |
| Irish | 11,751 | 7.2% |
| Israeli | 12 | 0.0% |
| Italian | 3,800 | 2.3% |
| Jamaican | 1,192 | 0.7% |
| Japanese | 78 | 0.1% |
| Jordanian | 363 | 0.2% |
| Kenyan | 43 | 0.0% |
| Korean | 2,362 | 1.4% |
| Latvian | 17 | 0.0% |
| Lebanese | 65 | 0.0% |
| Lithuanian | 29 | 0.0% |
| Luxembourger | 38 | 0.0% |
| Malaysian | 28 | 0.0% |
| Mexican | 4,953 | 3.0% |
| Mexican American Indian | 286 | 0.2% |
| Native Hawaiian | 417 | 0.3% |
| Navajo | 18 | 0.0% |
| Nicaraguan | 128 | 0.1% |
| Nigerian | 255 | 0.2% |
| Northern European | 209 | 0.1% |
| Norwegian | 481 | 0.3% |
| Pakistani | 100 | 0.1% |
| Panamanian | 124 | 0.1% |
| Pennsylvania German | 27 | 0.0% |
| Peruvian | 59 | 0.0% |
| Polish | 1,907 | 1.2% |
| Portuguese | 291 | 0.2% |
| Puerto Rican | 1,498 | 0.9% |
| Romanian | 27 | 0.0% |
| Russian | 239 | 0.2% |
| Salvadoran | 573 | 0.4% |
| Samoan | 25 | 0.0% |
| Scandinavian | 101 | 0.1% |
| Scotch-Irish | 1,471 | 0.9% |
| Scottish | 2,418 | 1.5% |
| Seminole | 21 | 0.0% |
| Senegalese | 156 | 0.1% |
| Sioux | 122 | 0.1% |
| Slavic | 56 | 0.0% |
| Slovak | 22 | 0.0% |
| South American | 1,054 | 0.6% |
| Spaniard | 292 | 0.2% |
| Spanish | 34 | 0.0% |
| Sri Lankan | 1,509 | 0.9% |
| Subsaharan African | 2,659 | 1.6% |
| Swedish | 814 | 0.5% |
| Swiss | 50 | 0.0% |
| Syrian | 15 | 0.0% |
| Thai | 1,646 | 1.0% |
| Tongan | 101 | 0.1% |
| Trinidadian and Tobagonian | 15 | 0.0% |
| Ukrainian | 47 | 0.0% |
| Uruguayan | 31 | 0.0% |
| Venezuelan | 41 | 0.0% |
| Welsh | 707 | 0.4% |
| West Indian | 233 | 0.1% |
| Yugoslavian | 19 | 0.0% | View All 112 Rows |
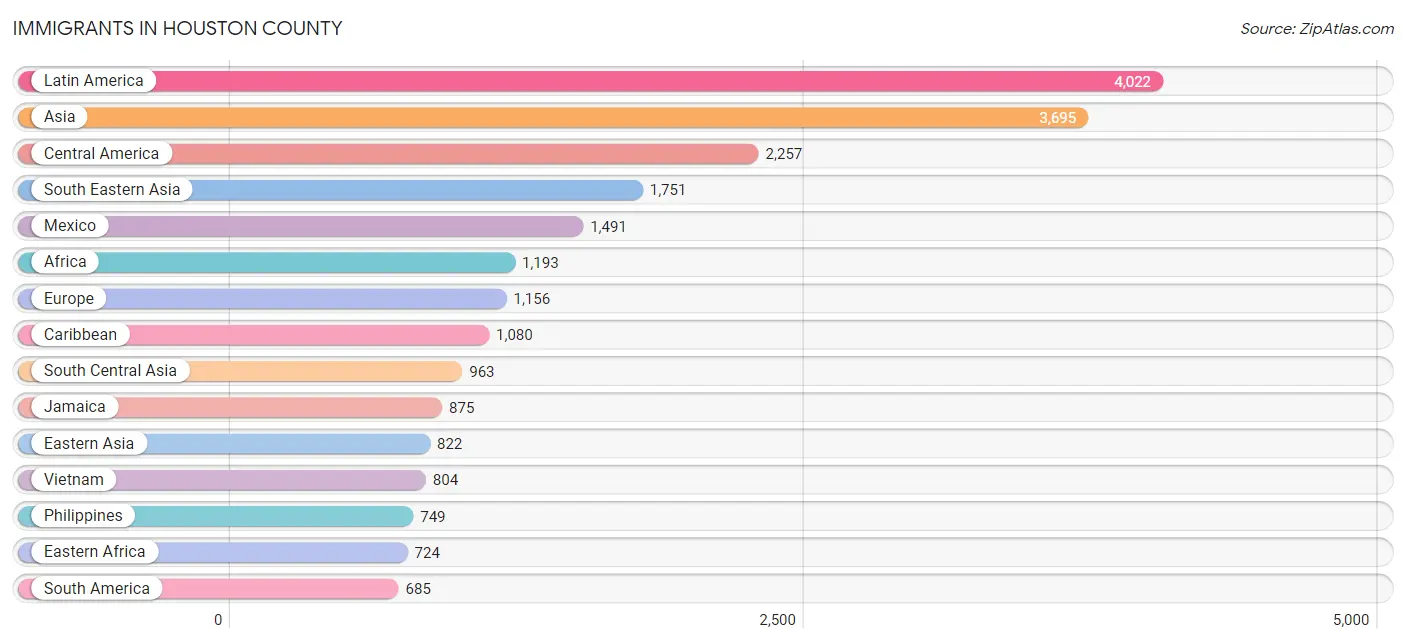
Immigrants in Houston County
The most numerous immigrant groups reported in Houston County came from Latin America (4,022 | 2.5%), Asia (3,695 | 2.2%), Central America (2,257 | 1.4%), South Eastern Asia (1,751 | 1.1%), and Mexico (1,491 | 0.9%), together accounting for 8.1% of all Houston County residents.
| Immigration Origin | # Population | % Population |
| Africa | 1,193 | 0.7% |
| Albania | 33 | 0.0% |
| Asia | 3,695 | 2.2% |
| Australia | 63 | 0.0% |
| Belgium | 45 | 0.0% |
| Belize | 35 | 0.0% |
| Brazil | 24 | 0.0% |
| Cameroon | 35 | 0.0% |
| Canada | 230 | 0.1% |
| Caribbean | 1,080 | 0.7% |
| Central America | 2,257 | 1.4% |
| China | 25 | 0.0% |
| Colombia | 481 | 0.3% |
| Congo | 30 | 0.0% |
| Cuba | 18 | 0.0% |
| Czechoslovakia | 15 | 0.0% |
| Dominican Republic | 26 | 0.0% |
| Eastern Africa | 724 | 0.4% |
| Eastern Asia | 822 | 0.5% |
| Eastern Europe | 250 | 0.2% |
| Ecuador | 65 | 0.0% |
| Egypt | 5 | 0.0% |
| El Salvador | 114 | 0.1% |
| England | 256 | 0.2% |
| Ethiopia | 628 | 0.4% |
| Europe | 1,156 | 0.7% |
| France | 30 | 0.0% |
| Germany | 319 | 0.2% |
| Ghana | 24 | 0.0% |
| Greece | 7 | 0.0% |
| Guatemala | 552 | 0.3% |
| Haiti | 7 | 0.0% |
| India | 455 | 0.3% |
| Iran | 11 | 0.0% |
| Italy | 4 | 0.0% |
| Jamaica | 875 | 0.5% |
| Japan | 175 | 0.1% |
| Jordan | 159 | 0.1% |
| Kenya | 80 | 0.1% |
| Korea | 622 | 0.4% |
| Laos | 14 | 0.0% |
| Latin America | 4,022 | 2.5% |
| Latvia | 17 | 0.0% |
| Liberia | 26 | 0.0% |
| Malaysia | 9 | 0.0% |
| Mexico | 1,491 | 0.9% |
| Middle Africa | 163 | 0.1% |
| Nicaragua | 7 | 0.0% |
| Northern Africa | 55 | 0.0% |
| Northern Europe | 418 | 0.3% |
| Oceania | 64 | 0.0% |
| Pakistan | 327 | 0.2% |
| Panama | 58 | 0.0% |
| Philippines | 749 | 0.5% |
| Russia | 166 | 0.1% |
| Scotland | 21 | 0.0% |
| Senegal | 50 | 0.0% |
| Serbia | 19 | 0.0% |
| South Africa | 28 | 0.0% |
| South America | 685 | 0.4% |
| South Central Asia | 963 | 0.6% |
| South Eastern Asia | 1,751 | 1.1% |
| Southern Europe | 94 | 0.1% |
| Spain | 83 | 0.1% |
| Sri Lanka | 170 | 0.1% |
| Sudan | 37 | 0.0% |
| Thailand | 101 | 0.1% |
| Trinidad and Tobago | 40 | 0.0% |
| Uruguay | 74 | 0.1% |
| Venezuela | 41 | 0.0% |
| Vietnam | 804 | 0.5% |
| Western Africa | 223 | 0.1% |
| Western Asia | 159 | 0.1% |
| Western Europe | 394 | 0.2% |
| Zaire | 98 | 0.1% | View All 75 Rows |
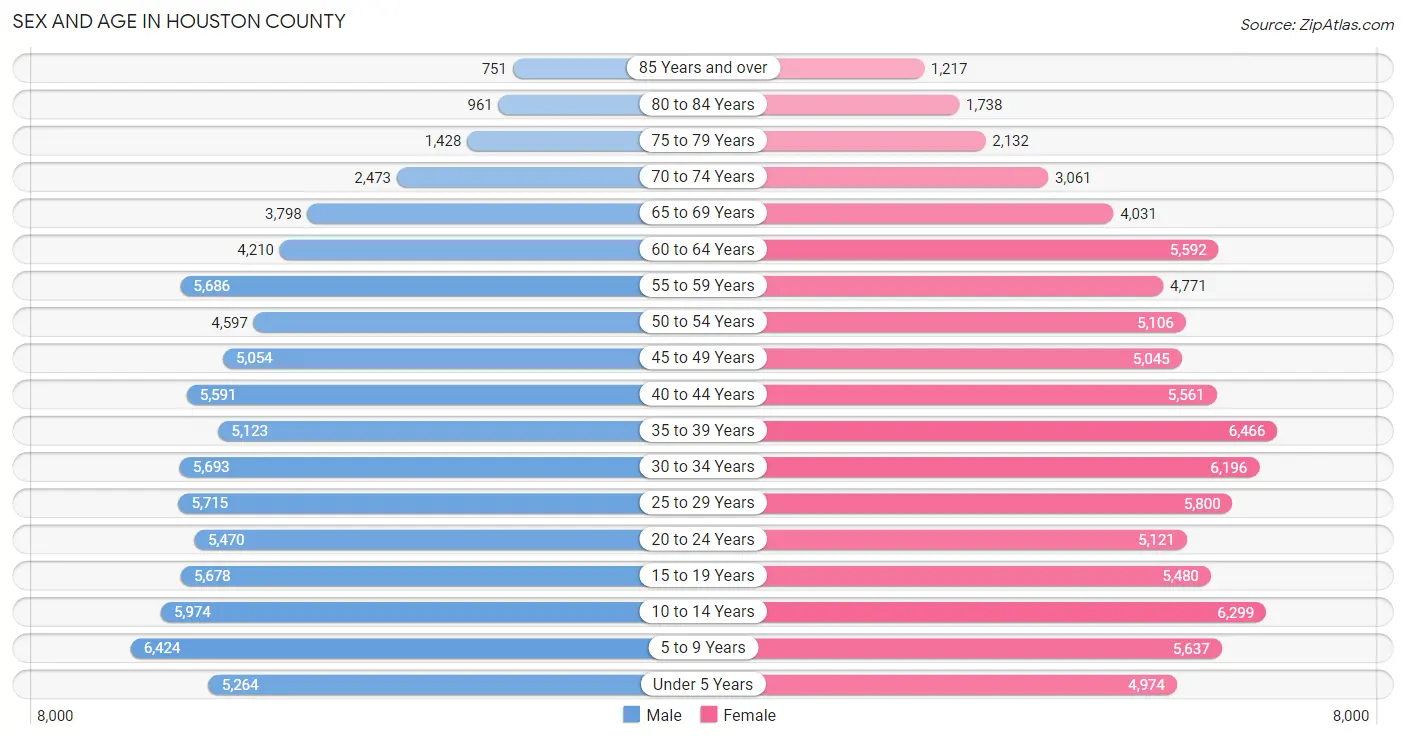
Sex and Age in Houston County
Sex and Age in Houston County
The most populous age groups in Houston County are 5 to 9 Years (6,424 | 8.0%) for men and 35 to 39 Years (6,466 | 7.7%) for women.
| Age Bracket | Male | Female |
| Under 5 Years | 5,264 (6.6%) | 4,974 (5.9%) |
| 5 to 9 Years | 6,424 (8.0%) | 5,637 (6.7%) |
| 10 to 14 Years | 5,974 (7.5%) | 6,299 (7.5%) |
| 15 to 19 Years | 5,678 (7.1%) | 5,480 (6.5%) |
| 20 to 24 Years | 5,470 (6.9%) | 5,121 (6.1%) |
| 25 to 29 Years | 5,715 (7.1%) | 5,800 (6.9%) |
| 30 to 34 Years | 5,693 (7.1%) | 6,196 (7.4%) |
| 35 to 39 Years | 5,123 (6.4%) | 6,466 (7.7%) |
| 40 to 44 Years | 5,591 (7.0%) | 5,561 (6.6%) |
| 45 to 49 Years | 5,054 (6.3%) | 5,045 (6.0%) |
| 50 to 54 Years | 4,597 (5.8%) | 5,106 (6.1%) |
| 55 to 59 Years | 5,686 (7.1%) | 4,771 (5.7%) |
| 60 to 64 Years | 4,210 (5.3%) | 5,592 (6.6%) |
| 65 to 69 Years | 3,798 (4.8%) | 4,031 (4.8%) |
| 70 to 74 Years | 2,473 (3.1%) | 3,061 (3.6%) |
| 75 to 79 Years | 1,428 (1.8%) | 2,132 (2.5%) |
| 80 to 84 Years | 961 (1.2%) | 1,738 (2.1%) |
| 85 Years and over | 751 (0.9%) | 1,217 (1.4%) |
| Total | 79,890 (100.0%) | 84,227 (100.0%) |
Families and Households in Houston County
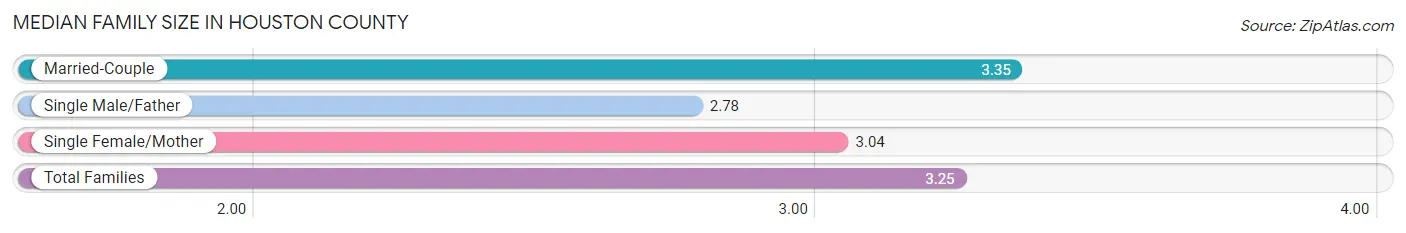
Median Family Size in Houston County
The median family size in Houston County is 3.25 persons per family, with married-couple families (30,806 | 72.6%) accounting for the largest median family size of 3.35 persons per family. On the other hand, single male/father families (3,174 | 7.5%) represent the smallest median family size with 2.78 persons per family.
| Family Type | # Families | Family Size |
| Married-Couple | 30,806 (72.6%) | 3.35 |
| Single Male/Father | 3,174 (7.5%) | 2.78 |
| Single Female/Mother | 8,481 (20.0%) | 3.04 |
| Total Families | 42,461 (100.0%) | 3.25 |
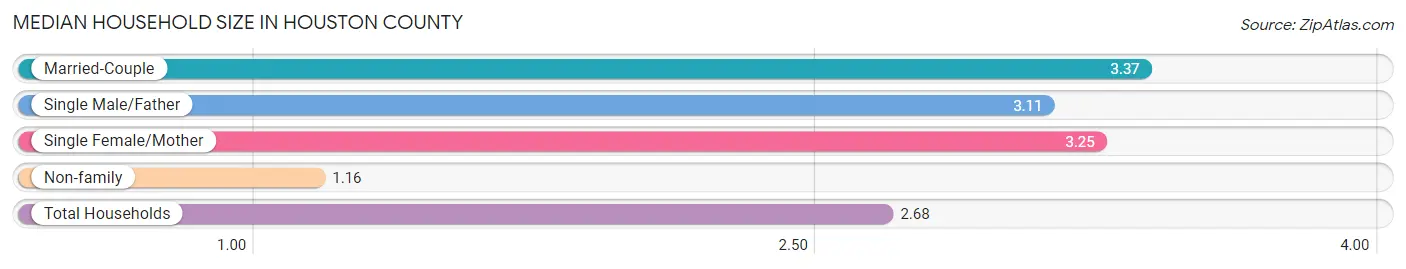
Median Household Size in Houston County
The median household size in Houston County is 2.68 persons per household, with married-couple households (30,806 | 50.8%) accounting for the largest median household size of 3.37 persons per household. non-family households (18,146 | 29.9%) represent the smallest median household size with 1.16 persons per household.
| Household Type | # Households | Household Size |
| Married-Couple | 30,806 (50.8%) | 3.37 |
| Single Male/Father | 3,174 (5.2%) | 3.11 |
| Single Female/Mother | 8,481 (14.0%) | 3.25 |
| Non-family | 18,146 (29.9%) | 1.16 |
| Total Households | 60,607 (100.0%) | 2.68 |
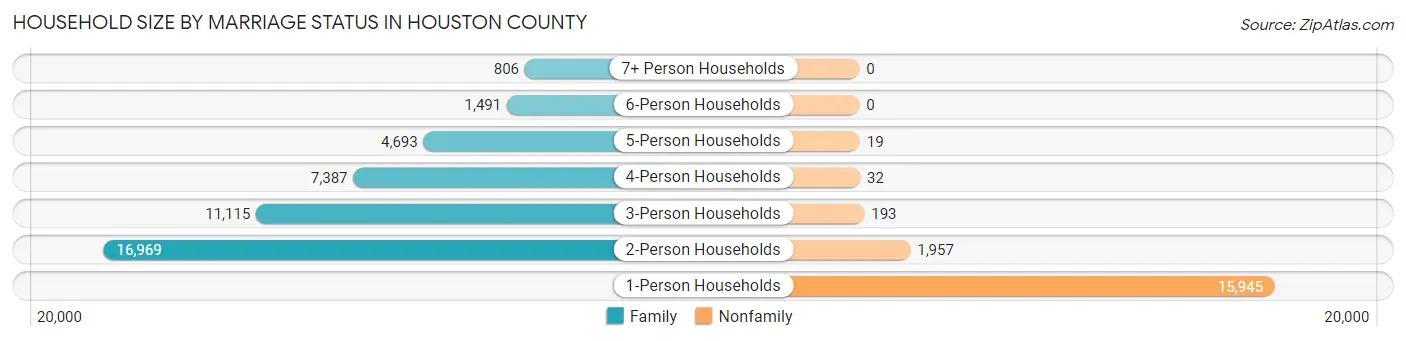
Household Size by Marriage Status in Houston County
Out of a total of 60,607 households in Houston County, 42,461 (70.1%) are family households, while 18,146 (29.9%) are nonfamily households. The most numerous type of family households are 2-person households, comprising 16,969, and the most common type of nonfamily households are 1-person households, comprising 15,945.
| Household Size | Family Households | Nonfamily Households |
| 1-Person Households | - | 15,945 (26.3%) |
| 2-Person Households | 16,969 (28.0%) | 1,957 (3.2%) |
| 3-Person Households | 11,115 (18.3%) | 193 (0.3%) |
| 4-Person Households | 7,387 (12.2%) | 32 (0.1%) |
| 5-Person Households | 4,693 (7.7%) | 19 (0.0%) |
| 6-Person Households | 1,491 (2.5%) | 0 (0.0%) |
| 7+ Person Households | 806 (1.3%) | 0 (0.0%) |
| Total | 42,461 (70.1%) | 18,146 (29.9%) |
Female Fertility in Houston County
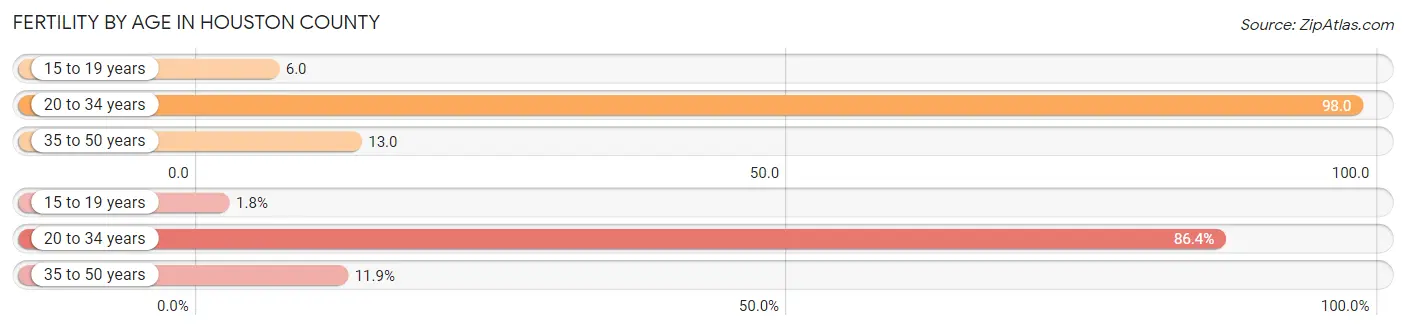
Fertility by Age in Houston County
Average fertility rate in Houston County is 48.0 births per 1,000 women. Women in the age bracket of 20 to 34 years have the highest fertility rate with 98.0 births per 1,000 women. Women in the age bracket of 20 to 34 years acount for 86.4% of all women with births.
| Age Bracket | Women with Births | Births / 1,000 Women |
| 15 to 19 years | 35 (1.8%) | 6.0 |
| 20 to 34 years | 1,684 (86.4%) | 98.0 |
| 35 to 50 years | 231 (11.8%) | 13.0 |
| Total | 1,950 (100.0%) | 48.0 |
Fertility by Age by Marriage Status in Houston County
73.5% of women with births (1,950) in Houston County are married. The highest percentage of unmarried women with births falls into 15 to 19 years age bracket with 100.0% of them unmarried at the time of birth, while the lowest percentage of unmarried women with births belong to 35 to 50 years age bracket with 20.4% of them unmarried.
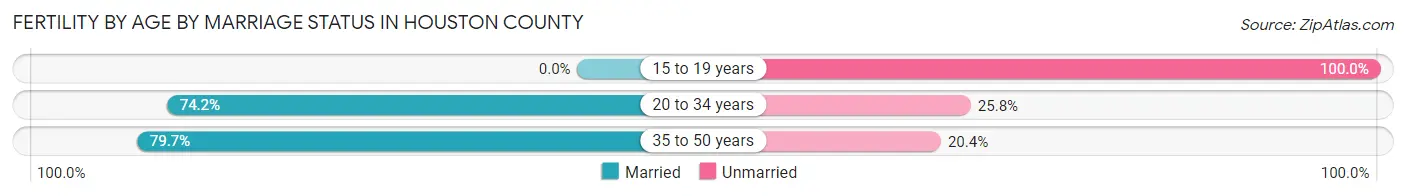
| Age Bracket | Married | Unmarried |
| 15 to 19 years | 0 (0.0%) | 35 (100.0%) |
| 20 to 34 years | 1,250 (74.2%) | 434 (25.8%) |
| 35 to 50 years | 184 (79.6%) | 47 (20.3%) |
| Total | 1,433 (73.5%) | 517 (26.5%) |
Fertility by Education in Houston County
Average fertility rate in Houston County is 48.0 births per 1,000 women. Women with the education attainment of graduate degree have the highest fertility rate of 61.0 births per 1,000 women, while women with the education attainment of college or associate's degree have the lowest fertility at 41.0 births per 1,000 women. Women with the education attainment of college or associate's degree represent 28.6% of all women with births.

| Educational Attainment | Women with Births | Births / 1,000 Women |
| Less than High School | 272 (14.0%) | 46.0 |
| High School Diploma | 445 (22.8%) | 51.0 |
| College or Associate's Degree | 558 (28.6%) | 41.0 |
| Bachelor's Degree | 402 (20.6%) | 53.0 |
| Graduate Degree | 273 (14.0%) | 61.0 |
| Total | 1,950 (100.0%) | 48.0 |
Fertility by Education by Marriage Status in Houston County
26.5% of women with births in Houston County are unmarried. Women with the educational attainment of bachelor's degree are most likely to be married with 100.0% of them married at childbirth, while women with the educational attainment of less than high school are least likely to be married with 74.3% of them unmarried at childbirth.
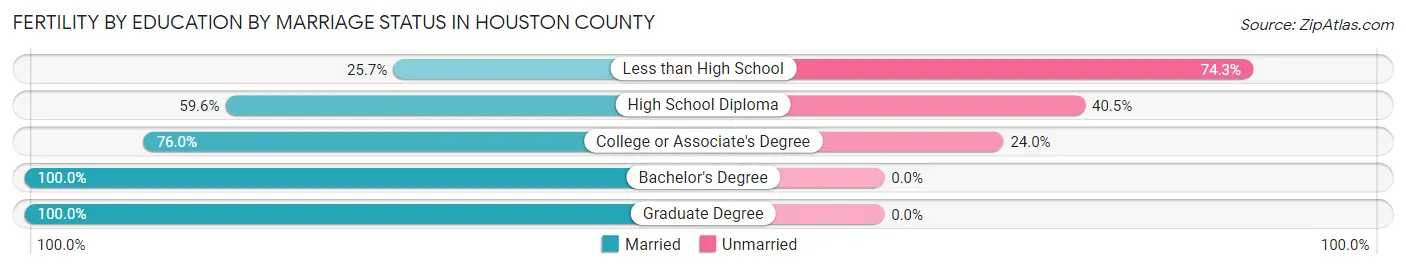
| Educational Attainment | Married | Unmarried |
| Less than High School | 70 (25.7%) | 202 (74.3%) |
| High School Diploma | 265 (59.6%) | 180 (40.5%) |
| College or Associate's Degree | 424 (76.0%) | 134 (24.0%) |
| Bachelor's Degree | 402 (100.0%) | 0 (0.0%) |
| Graduate Degree | 273 (100.0%) | 0 (0.0%) |
| Total | 1,433 (73.5%) | 517 (26.5%) |
Income in Houston County
Income Overview in Houston County
Per Capita Income in Houston County is $35,223, while median incomes of families and households are $91,406 and $76,968 respectively.
| Characteristic | Number | Measure |
| Per Capita Income | 164,117 | $35,223 |
| Median Family Income | 42,461 | $91,406 |
| Mean Family Income | 42,461 | $106,744 |
| Median Household Income | 60,607 | $76,968 |
| Mean Household Income | 60,607 | $92,873 |
| Income Deficit | 42,461 | $11,224 |
| Wage / Income Gap (%) | 164,117 | 27.80% |
| Wage / Income Gap ($) | 164,117 | 72.20¢ per $1 |
| Gini / Inequality Index | 164,117 | 0.41 |
Earnings by Sex in Houston County
Average Earnings in Houston County are $43,520, $50,420 for men and $36,402 for women, a difference of 27.8%.
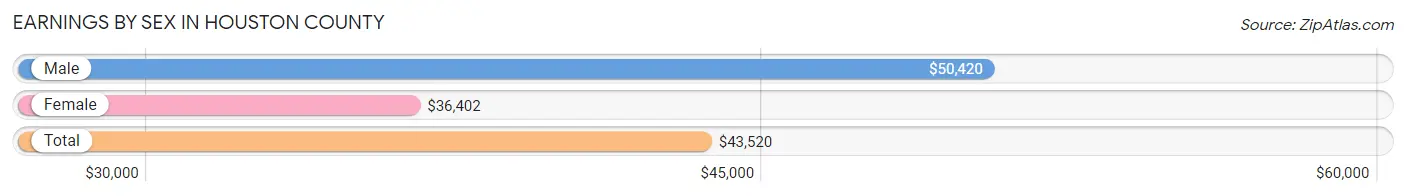
| Sex | Number | Average Earnings |
| Male | 44,274 (52.6%) | $50,420 |
| Female | 39,883 (47.4%) | $36,402 |
| Total | 84,157 (100.0%) | $43,520 |
Earnings by Sex by Income Bracket in Houston County
The most common earnings brackets in Houston County are $100,000+ for men (6,956 | 15.7%) and $75,000 to $99,999 for women (3,516 | 8.8%).
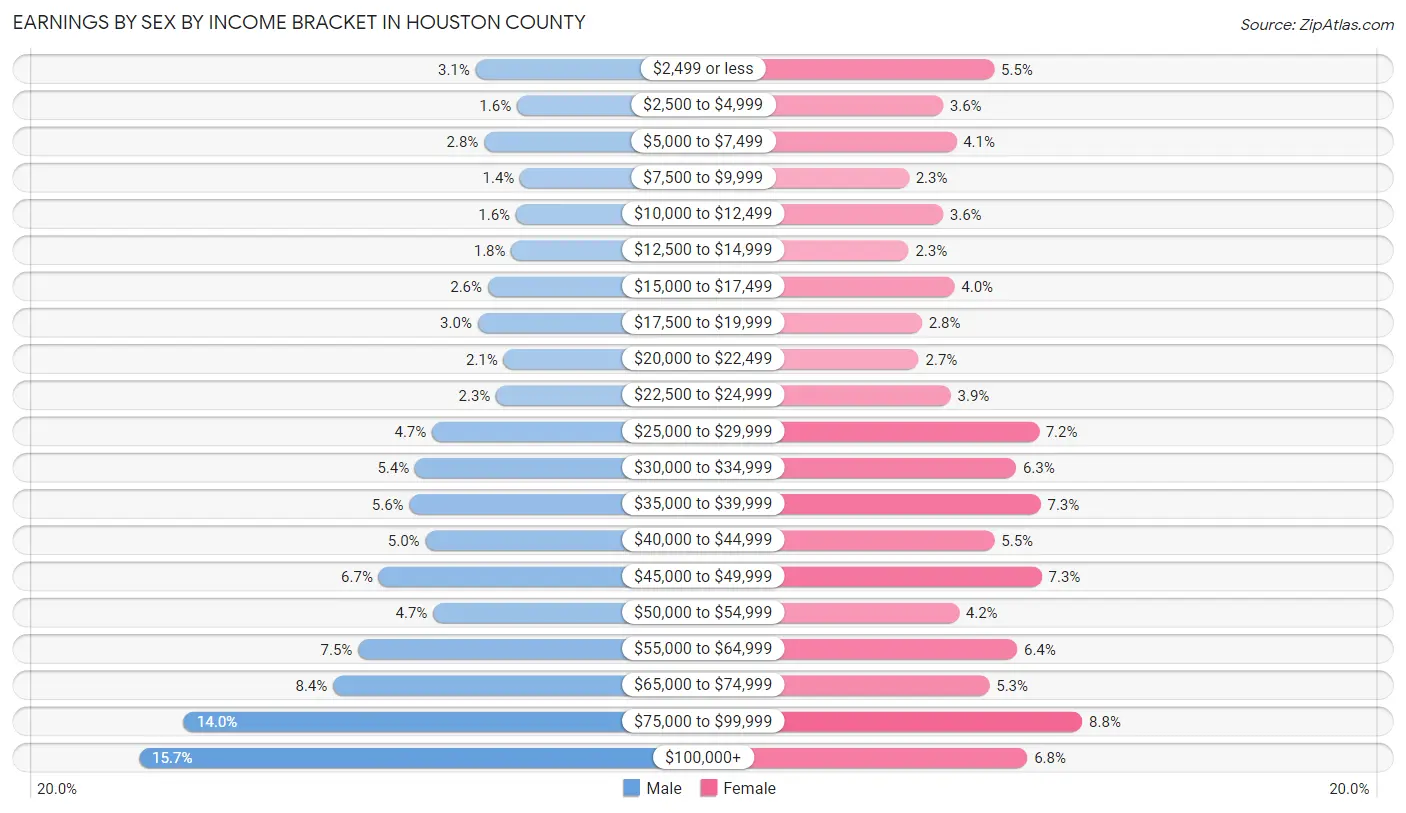
| Income | Male | Female |
| $2,499 or less | 1,373 (3.1%) | 2,202 (5.5%) |
| $2,500 to $4,999 | 685 (1.5%) | 1,434 (3.6%) |
| $5,000 to $7,499 | 1,232 (2.8%) | 1,634 (4.1%) |
| $7,500 to $9,999 | 632 (1.4%) | 927 (2.3%) |
| $10,000 to $12,499 | 705 (1.6%) | 1,436 (3.6%) |
| $12,500 to $14,999 | 778 (1.8%) | 923 (2.3%) |
| $15,000 to $17,499 | 1,170 (2.6%) | 1,609 (4.0%) |
| $17,500 to $19,999 | 1,335 (3.0%) | 1,119 (2.8%) |
| $20,000 to $22,499 | 909 (2.1%) | 1,073 (2.7%) |
| $22,500 to $24,999 | 1,030 (2.3%) | 1,552 (3.9%) |
| $25,000 to $29,999 | 2,093 (4.7%) | 2,869 (7.2%) |
| $30,000 to $34,999 | 2,378 (5.4%) | 2,528 (6.3%) |
| $35,000 to $39,999 | 2,470 (5.6%) | 2,897 (7.3%) |
| $40,000 to $44,999 | 2,203 (5.0%) | 2,207 (5.5%) |
| $45,000 to $49,999 | 2,981 (6.7%) | 2,912 (7.3%) |
| $50,000 to $54,999 | 2,075 (4.7%) | 1,676 (4.2%) |
| $55,000 to $64,999 | 3,320 (7.5%) | 2,544 (6.4%) |
| $65,000 to $74,999 | 3,737 (8.4%) | 2,129 (5.3%) |
| $75,000 to $99,999 | 6,212 (14.0%) | 3,516 (8.8%) |
| $100,000+ | 6,956 (15.7%) | 2,696 (6.8%) |
| Total | 44,274 (100.0%) | 39,883 (100.0%) |
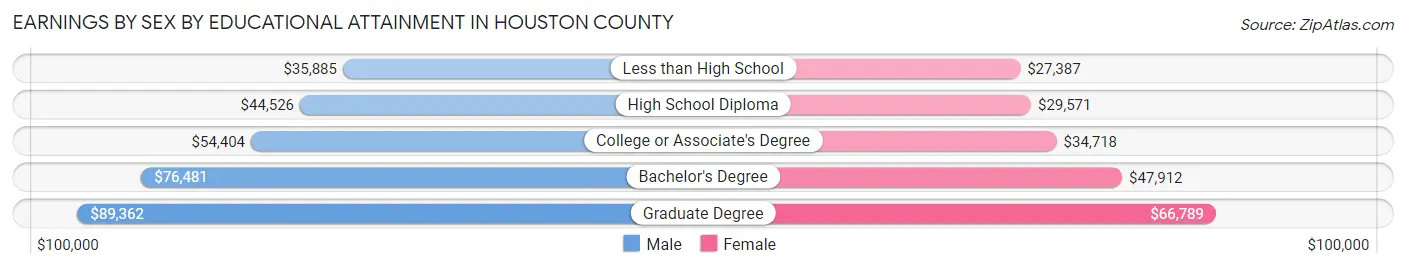
Earnings by Sex by Educational Attainment in Houston County
Average earnings in Houston County are $57,981 for men and $39,893 for women, a difference of 31.2%. Men with an educational attainment of graduate degree enjoy the highest average annual earnings of $89,362, while those with less than high school education earn the least with $35,885. Women with an educational attainment of graduate degree earn the most with the average annual earnings of $66,789, while those with less than high school education have the smallest earnings of $27,387.
| Educational Attainment | Male Income | Female Income |
| Less than High School | $35,885 | $27,387 |
| High School Diploma | $44,526 | $29,571 |
| College or Associate's Degree | $54,404 | $34,718 |
| Bachelor's Degree | $76,481 | $47,912 |
| Graduate Degree | $89,362 | $66,789 |
| Total | $57,981 | $39,893 |
Family Income in Houston County
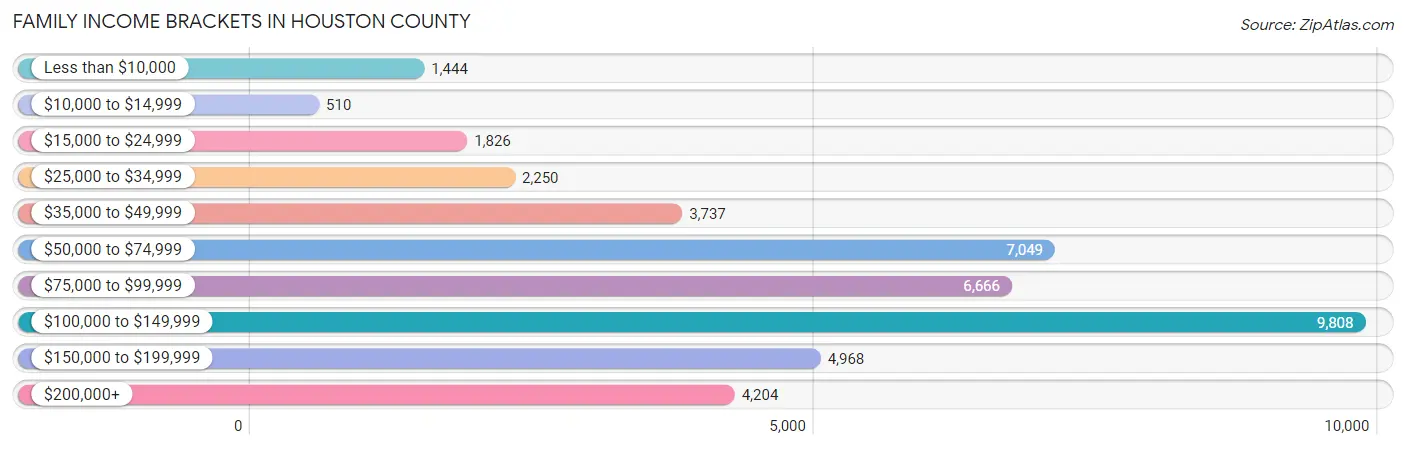
Family Income Brackets in Houston County
According to the Houston County family income data, there are 9,808 families falling into the $100,000 to $149,999 income range, which is the most common income bracket and makes up 23.1% of all families. Conversely, the $10,000 to $14,999 income bracket is the least frequent group with only 510 families (1.2%) belonging to this category.
| Income Bracket | # Families | % Families |
| Less than $10,000 | 1,444 | 3.4% |
| $10,000 to $14,999 | 510 | 1.2% |
| $15,000 to $24,999 | 1,826 | 4.3% |
| $25,000 to $34,999 | 2,250 | 5.3% |
| $35,000 to $49,999 | 3,737 | 8.8% |
| $50,000 to $74,999 | 7,049 | 16.6% |
| $75,000 to $99,999 | 6,666 | 15.7% |
| $100,000 to $149,999 | 9,808 | 23.1% |
| $150,000 to $199,999 | 4,968 | 11.7% |
| $200,000+ | 4,204 | 9.9% |
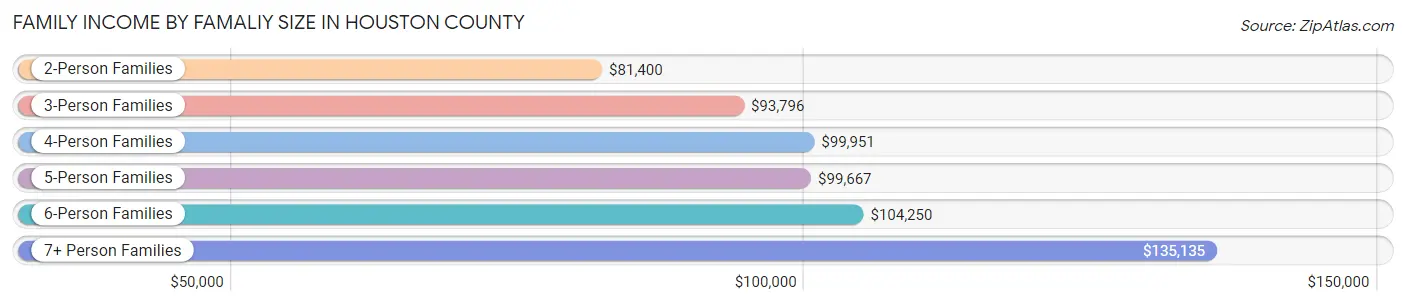
Family Income by Famaliy Size in Houston County
7+ person families (795 | 1.9%) account for the highest median family income in Houston County with $135,135 per family, while 2-person families (18,241 | 43.0%) have the highest median income of $40,700 per family member.
| Income Bracket | # Families | Median Income |
| 2-Person Families | 18,241 (43.0%) | $81,400 |
| 3-Person Families | 11,360 (26.8%) | $93,796 |
| 4-Person Families | 6,442 (15.2%) | $99,951 |
| 5-Person Families | 4,286 (10.1%) | $99,667 |
| 6-Person Families | 1,337 (3.2%) | $104,250 |
| 7+ Person Families | 795 (1.9%) | $135,135 |
| Total | 42,461 (100.0%) | $91,406 |
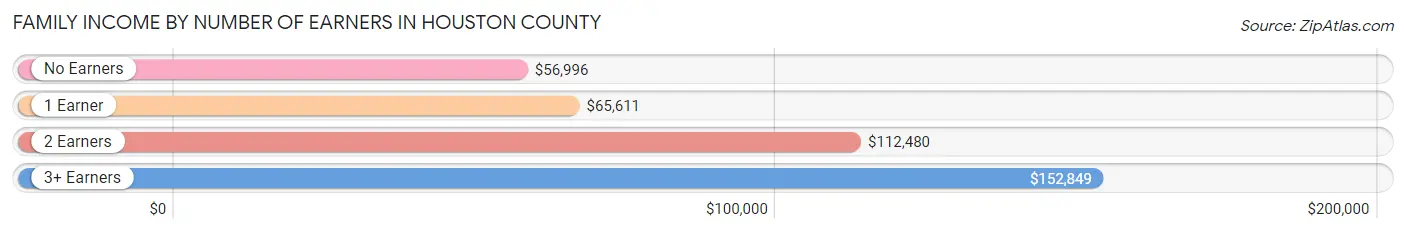
Family Income by Number of Earners in Houston County
The median family income in Houston County is $91,406, with families comprising 3+ earners (4,386) having the highest median family income of $152,849, while families with no earners (5,819) have the lowest median family income of $56,996, accounting for 10.3% and 13.7% of families, respectively.
| Number of Earners | # Families | Median Income |
| No Earners | 5,819 (13.7%) | $56,996 |
| 1 Earner | 14,831 (34.9%) | $65,611 |
| 2 Earners | 17,425 (41.0%) | $112,480 |
| 3+ Earners | 4,386 (10.3%) | $152,849 |
| Total | 42,461 (100.0%) | $91,406 |
Household Income in Houston County
Household Income Brackets in Houston County
With 11,879 households falling in the category, the $100,000 to $149,999 income range is the most frequent in Houston County, accounting for 19.6% of all households. In contrast, only 1,818 households (3.0%) fall into the $10,000 to $14,999 income bracket, making it the least populous group.
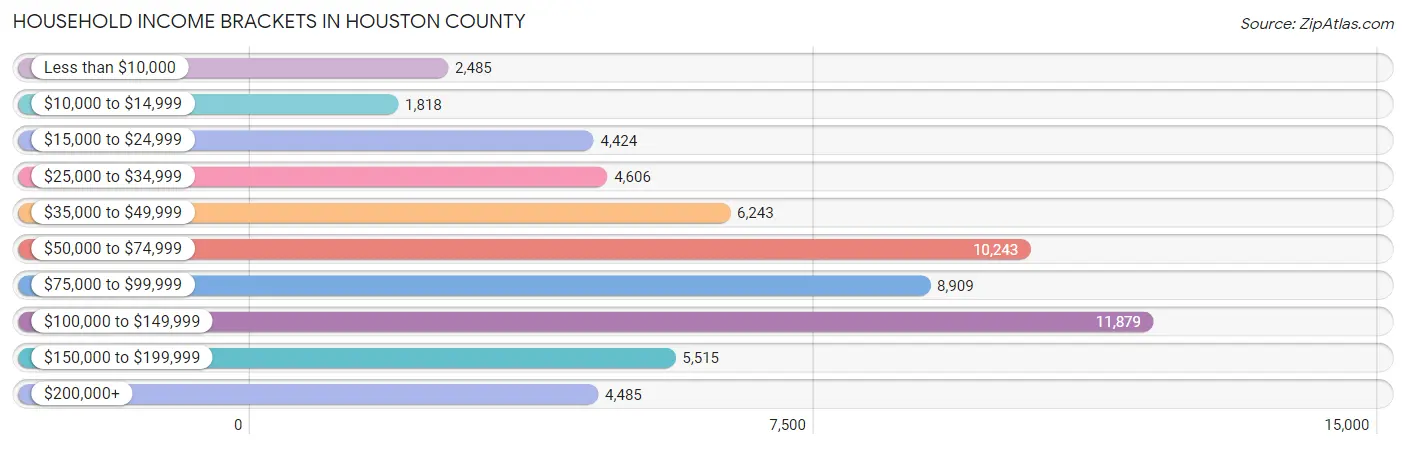
| Income Bracket | # Households | % Households |
| Less than $10,000 | 2,485 | 4.1% |
| $10,000 to $14,999 | 1,818 | 3.0% |
| $15,000 to $24,999 | 4,424 | 7.3% |
| $25,000 to $34,999 | 4,606 | 7.6% |
| $35,000 to $49,999 | 6,243 | 10.3% |
| $50,000 to $74,999 | 10,243 | 16.9% |
| $75,000 to $99,999 | 8,909 | 14.7% |
| $100,000 to $149,999 | 11,879 | 19.6% |
| $150,000 to $199,999 | 5,515 | 9.1% |
| $200,000+ | 4,485 | 7.4% |
Household Income by Householder Age in Houston County
The median household income in Houston County is $76,968, with the highest median household income of $96,880 found in the 45 to 64 years age bracket for the primary householder. A total of 22,657 households (37.4%) fall into this category. Meanwhile, the 15 to 24 years age bracket for the primary householder has the lowest median household income of $36,492, with 2,328 households (3.8%) in this group.
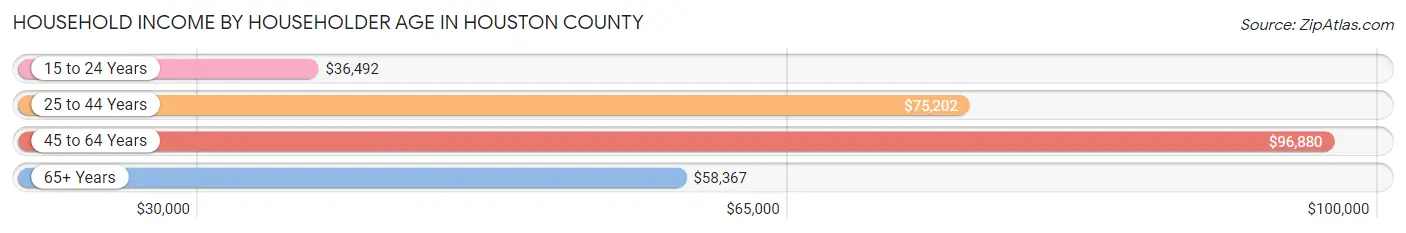
| Income Bracket | # Households | Median Income |
| 15 to 24 Years | 2,328 (3.8%) | $36,492 |
| 25 to 44 Years | 22,426 (37.0%) | $75,202 |
| 45 to 64 Years | 22,657 (37.4%) | $96,880 |
| 65+ Years | 13,196 (21.8%) | $58,367 |
| Total | 60,607 (100.0%) | $76,968 |
Poverty in Houston County
Income Below Poverty by Sex and Age in Houston County
With 9.3% poverty level for males and 10.1% for females among the residents of Houston County, 6 to 11 year old males and 6 to 11 year old females are the most vulnerable to poverty, with 1,254 males (17.1%) and 1,007 females (14.0%) in their respective age groups living below the poverty level.
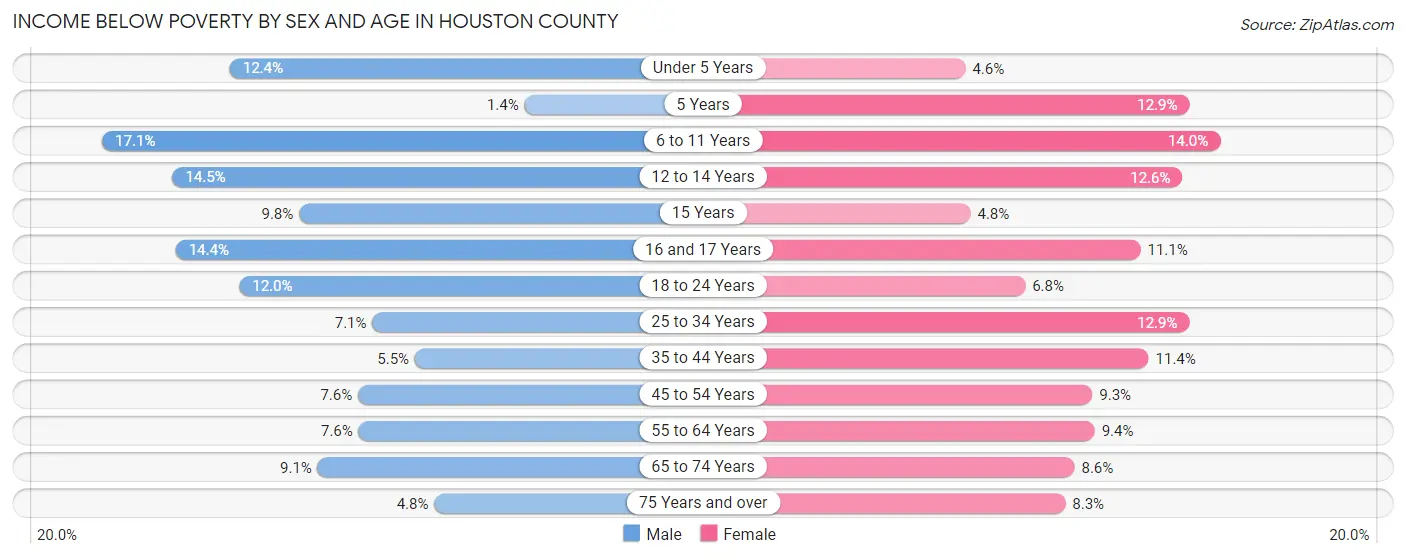
| Age Bracket | Male | Female |
| Under 5 Years | 649 (12.4%) | 221 (4.6%) |
| 5 Years | 17 (1.4%) | 80 (12.9%) |
| 6 to 11 Years | 1,254 (17.1%) | 1,007 (14.0%) |
| 12 to 14 Years | 546 (14.5%) | 490 (12.6%) |
| 15 Years | 102 (9.8%) | 51 (4.8%) |
| 16 and 17 Years | 363 (14.4%) | 278 (11.1%) |
| 18 to 24 Years | 864 (12.0%) | 473 (6.8%) |
| 25 to 34 Years | 795 (7.1%) | 1,544 (12.9%) |
| 35 to 44 Years | 584 (5.5%) | 1,365 (11.4%) |
| 45 to 54 Years | 728 (7.6%) | 943 (9.3%) |
| 55 to 64 Years | 746 (7.6%) | 973 (9.4%) |
| 65 to 74 Years | 569 (9.1%) | 607 (8.6%) |
| 75 Years and over | 146 (4.8%) | 396 (8.3%) |
| Total | 7,363 (9.3%) | 8,428 (10.1%) |
Income Above Poverty by Sex and Age in Houston County
According to the poverty statistics in Houston County, males aged 5 years and females aged under 5 years are the age groups that are most secure financially, with 98.6% of males and 95.4% of females in these age groups living above the poverty line.
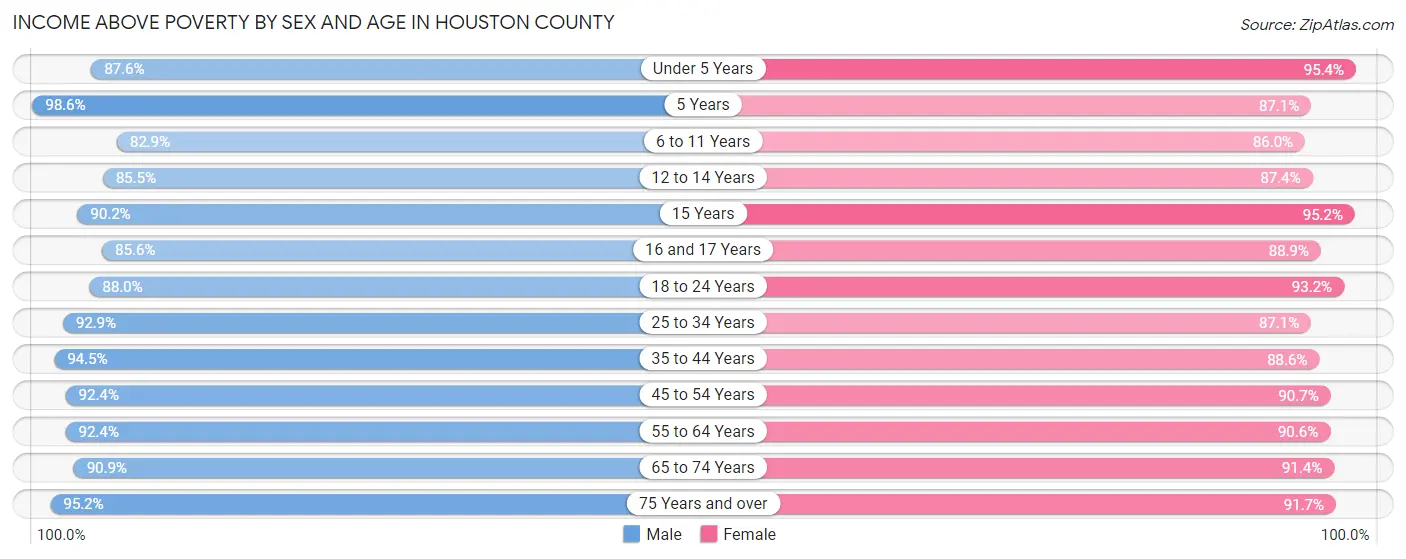
| Age Bracket | Male | Female |
| Under 5 Years | 4,595 (87.6%) | 4,594 (95.4%) |
| 5 Years | 1,163 (98.6%) | 540 (87.1%) |
| 6 to 11 Years | 6,072 (82.9%) | 6,167 (86.0%) |
| 12 to 14 Years | 3,218 (85.5%) | 3,388 (87.4%) |
| 15 Years | 938 (90.2%) | 1,016 (95.2%) |
| 16 and 17 Years | 2,160 (85.6%) | 2,228 (88.9%) |
| 18 to 24 Years | 6,321 (88.0%) | 6,476 (93.2%) |
| 25 to 34 Years | 10,424 (92.9%) | 10,428 (87.1%) |
| 35 to 44 Years | 10,019 (94.5%) | 10,622 (88.6%) |
| 45 to 54 Years | 8,827 (92.4%) | 9,194 (90.7%) |
| 55 to 64 Years | 9,066 (92.4%) | 9,390 (90.6%) |
| 65 to 74 Years | 5,670 (90.9%) | 6,422 (91.4%) |
| 75 Years and over | 2,903 (95.2%) | 4,377 (91.7%) |
| Total | 71,376 (90.6%) | 74,842 (89.9%) |
Income Below Poverty Among Married-Couple Families in Houston County
The poverty statistics for married-couple families in Houston County show that 3.7% or 1,150 of the total 30,806 families live below the poverty line. Families with 3 or 4 children have the highest poverty rate of 10.7%, comprising of 369 families. On the other hand, families with 5 or more children have the lowest poverty rate of 0.0%, which includes 0 families.
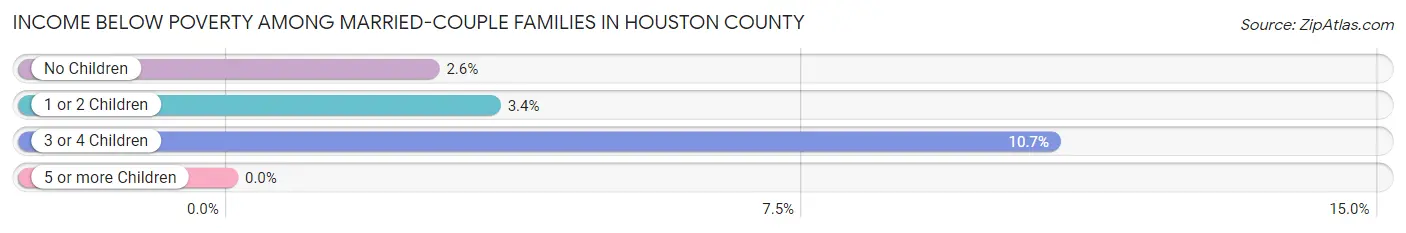
| Children | Above Poverty | Below Poverty |
| No Children | 16,686 (97.4%) | 450 (2.6%) |
| 1 or 2 Children | 9,308 (96.6%) | 331 (3.4%) |
| 3 or 4 Children | 3,068 (89.3%) | 369 (10.7%) |
| 5 or more Children | 594 (100.0%) | 0 (0.0%) |
| Total | 29,656 (96.3%) | 1,150 (3.7%) |
Income Below Poverty Among Single-Parent Households in Houston County
According to the poverty data in Houston County, 13.7% or 435 single-father households and 20.8% or 1,768 single-mother households are living below the poverty line. Among single-father households, those with 3 or 4 children have the highest poverty rate, with 48 households (21.6%) experiencing poverty. Likewise, among single-mother households, those with 5 or more children have the highest poverty rate, with 26 households (100.0%) falling below the poverty line.
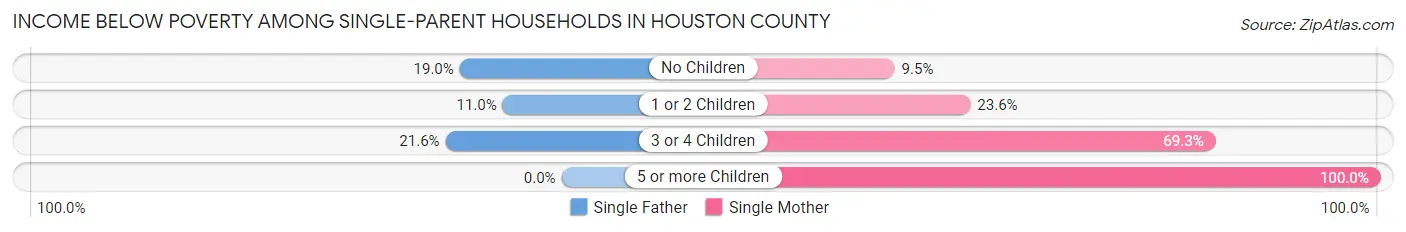
| Children | Single Father | Single Mother |
| No Children | 155 (19.0%) | 286 (9.5%) |
| 1 or 2 Children | 232 (11.0%) | 1,197 (23.6%) |
| 3 or 4 Children | 48 (21.6%) | 259 (69.3%) |
| 5 or more Children | 0 (0.0%) | 26 (100.0%) |
| Total | 435 (13.7%) | 1,768 (20.8%) |
Income Below Poverty Among Married-Couple vs Single-Parent Households in Houston County
The poverty data for Houston County shows that 1,150 of the married-couple family households (3.7%) and 2,203 of the single-parent households (18.9%) are living below the poverty level. Within the married-couple family households, those with 3 or 4 children have the highest poverty rate, with 369 households (10.7%) falling below the poverty line. Among the single-parent households, those with 5 or more children have the highest poverty rate, with 26 household (54.2%) living below poverty.
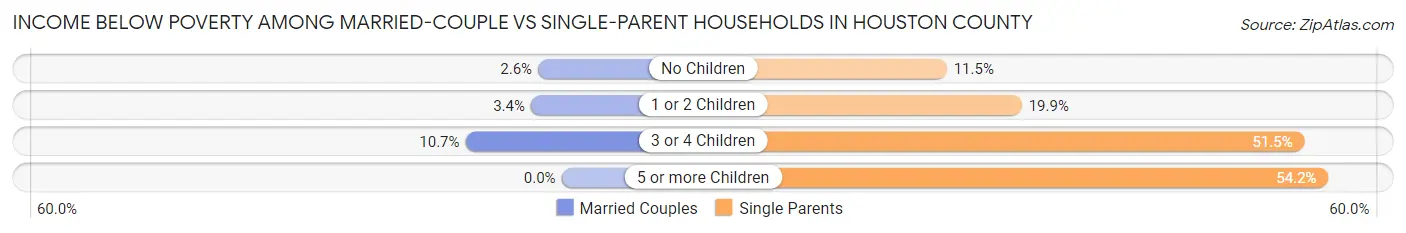
| Children | Married-Couple Families | Single-Parent Households |
| No Children | 450 (2.6%) | 441 (11.5%) |
| 1 or 2 Children | 331 (3.4%) | 1,429 (19.9%) |
| 3 or 4 Children | 369 (10.7%) | 307 (51.5%) |
| 5 or more Children | 0 (0.0%) | 26 (54.2%) |
| Total | 1,150 (3.7%) | 2,203 (18.9%) |
Employment Characteristics in Houston County
Employment by Class of Employer in Houston County
Among the 78,041 employed individuals in Houston County, private company employees (43,618 | 55.9%), federal government employees (15,204 | 19.5%), and local government employees (6,153 | 7.9%) make up the most common classes of employment.
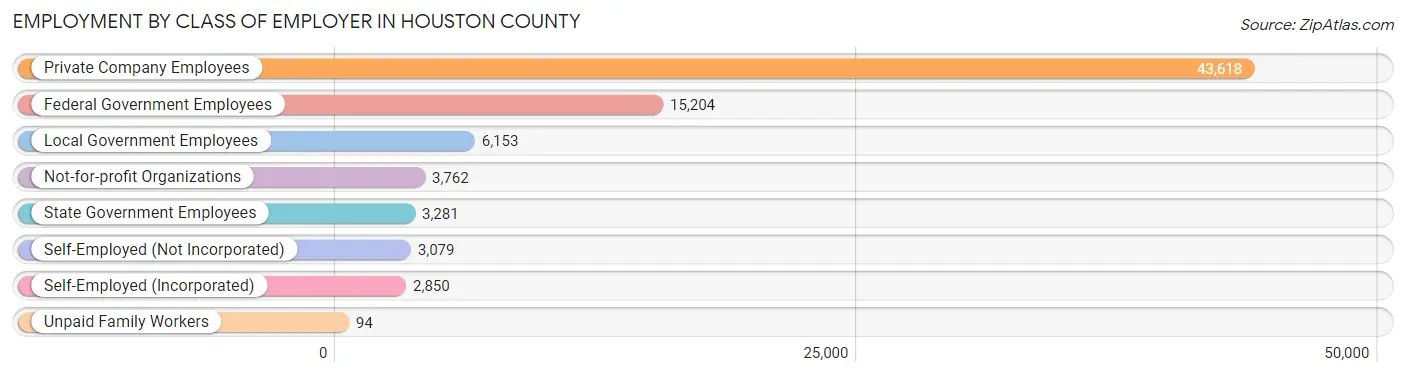
| Employer Class | # Employees | % Employees |
| Private Company Employees | 43,618 | 55.9% |
| Self-Employed (Incorporated) | 2,850 | 3.6% |
| Self-Employed (Not Incorporated) | 3,079 | 4.0% |
| Not-for-profit Organizations | 3,762 | 4.8% |
| Local Government Employees | 6,153 | 7.9% |
| State Government Employees | 3,281 | 4.2% |
| Federal Government Employees | 15,204 | 19.5% |
| Unpaid Family Workers | 94 | 0.1% |
| Total | 78,041 | 100.0% |
Employment Status by Age in Houston County
According to the labor force statistics for Houston County, out of the total population over 16 years of age (127,435), 65.3% or 83,215 individuals are in the labor force, with 4.8% or 3,994 of them unemployed. The age group with the highest labor force participation rate is 35 to 44 years, with 86.1% or 19,580 individuals in the labor force. Within the labor force, the 16 to 19 years age range has the highest percentage of unemployed individuals, with 19.3% or 704 of them being unemployed.
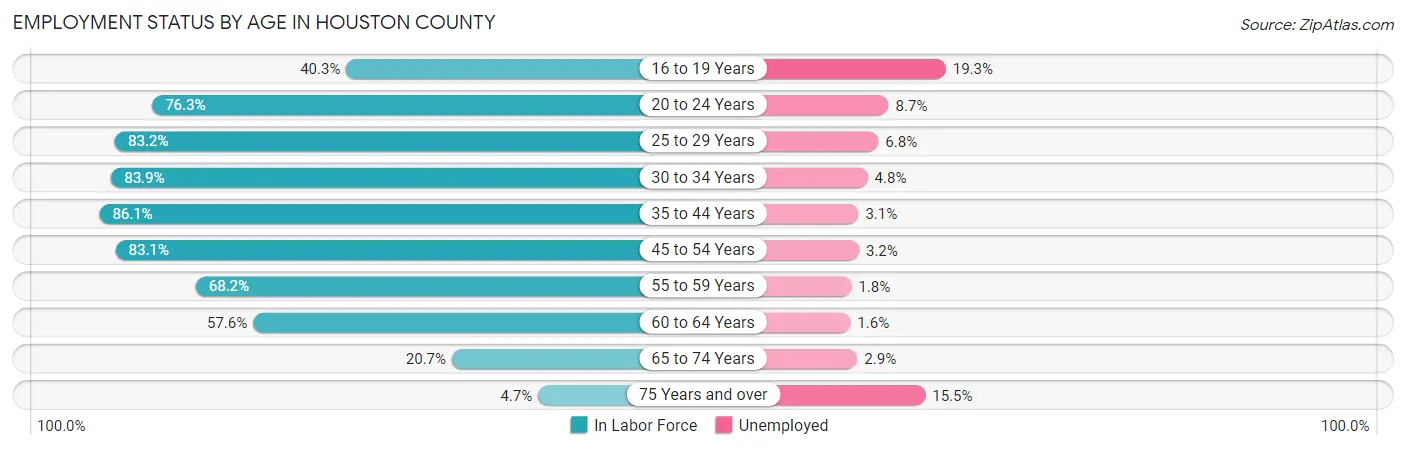
| Age Bracket | In Labor Force | Unemployed |
| 16 to 19 Years | 3,646 (40.3%) | 704 (19.3%) |
| 20 to 24 Years | 8,081 (76.3%) | 703 (8.7%) |
| 25 to 29 Years | 9,580 (83.2%) | 651 (6.8%) |
| 30 to 34 Years | 9,975 (83.9%) | 479 (4.8%) |
| 35 to 44 Years | 19,580 (86.1%) | 607 (3.1%) |
| 45 to 54 Years | 16,455 (83.1%) | 527 (3.2%) |
| 55 to 59 Years | 7,132 (68.2%) | 128 (1.8%) |
| 60 to 64 Years | 5,646 (57.6%) | 90 (1.6%) |
| 65 to 74 Years | 2,766 (20.7%) | 80 (2.9%) |
| 75 Years and over | 387 (4.7%) | 60 (15.5%) |
| Total | 83,215 (65.3%) | 3,994 (4.8%) |
Employment Status by Educational Attainment in Houston County
According to labor force statistics for Houston County, 79.3% of individuals (68,361) out of the total population between 25 and 64 years of age (86,206) are in the labor force, with 3.6% or 2,461 of them being unemployed. The group with the highest labor force participation rate are those with the educational attainment of bachelor's degree or higher, with 87.0% or 25,470 individuals in the labor force. Within the labor force, individuals with high school diploma education have the highest percentage of unemployment, with 6.2% or 975 of them being unemployed.
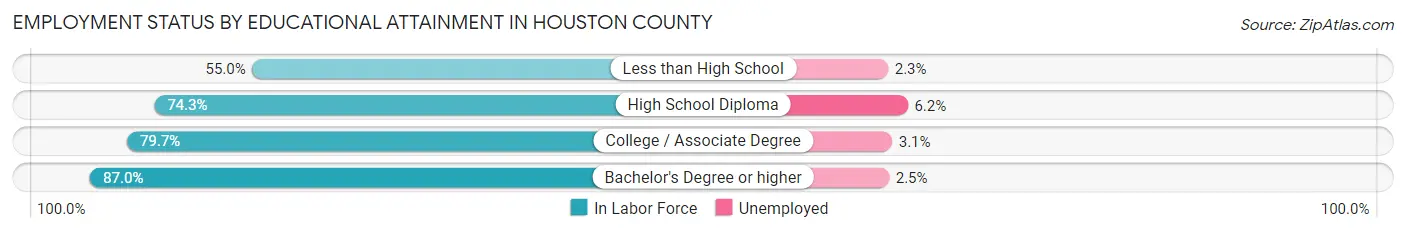
| Educational Attainment | In Labor Force | Unemployed |
| Less than High School | 2,926 (55.0%) | 122 (2.3%) |
| High School Diploma | 15,722 (74.3%) | 1,312 (6.2%) |
| College / Associate Degree | 24,269 (79.7%) | 944 (3.1%) |
| Bachelor's Degree or higher | 25,470 (87.0%) | 732 (2.5%) |
| Total | 68,361 (79.3%) | 3,103 (3.6%) |
Employment Occupations by Sex in Houston County
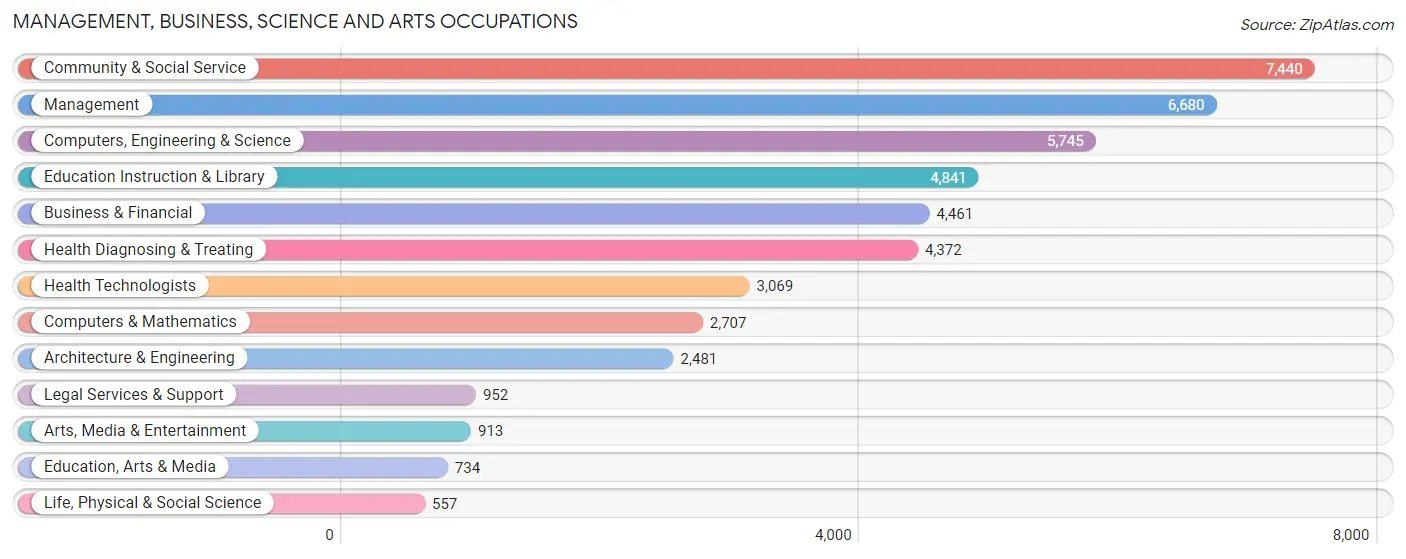
Management, Business, Science and Arts Occupations
The most common Management, Business, Science and Arts occupations in Houston County are Community & Social Service (7,440 | 9.9%), Management (6,680 | 8.9%), Computers, Engineering & Science (5,745 | 7.6%), Education Instruction & Library (4,841 | 6.4%), and Business & Financial (4,461 | 5.9%).
Management, Business, Science and Arts Occupations by Sex
Within the Management, Business, Science and Arts occupations in Houston County, the most male-oriented occupations are Architecture & Engineering (88.4%), Computers, Engineering & Science (75.4%), and Computers & Mathematics (70.2%), while the most female-oriented occupations are Education Instruction & Library (75.5%), Health Diagnosing & Treating (72.4%), and Health Technologists (72.3%).
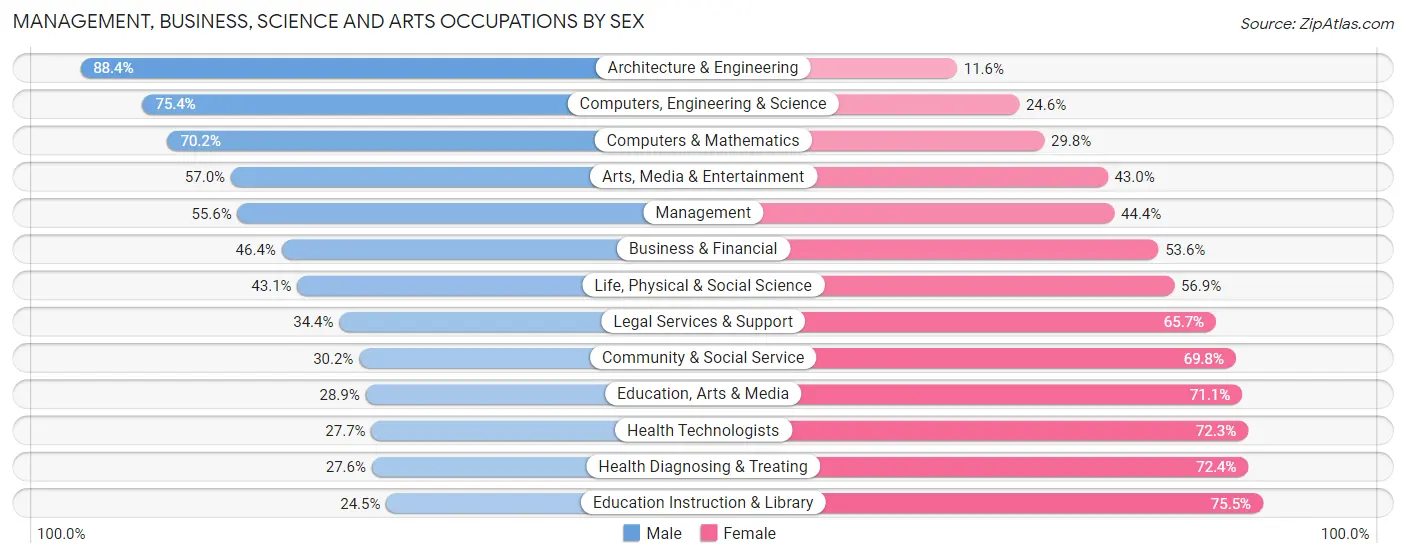
| Occupation | Male | Female |
| Management | 3,713 (55.6%) | 2,967 (44.4%) |
| Business & Financial | 2,069 (46.4%) | 2,392 (53.6%) |
| Computers, Engineering & Science | 4,333 (75.4%) | 1,412 (24.6%) |
| Computers & Mathematics | 1,900 (70.2%) | 807 (29.8%) |
| Architecture & Engineering | 2,193 (88.4%) | 288 (11.6%) |
| Life, Physical & Social Science | 240 (43.1%) | 317 (56.9%) |
| Community & Social Service | 2,247 (30.2%) | 5,193 (69.8%) |
| Education, Arts & Media | 212 (28.9%) | 522 (71.1%) |
| Legal Services & Support | 327 (34.4%) | 625 (65.6%) |
| Education Instruction & Library | 1,188 (24.5%) | 3,653 (75.5%) |
| Arts, Media & Entertainment | 520 (57.0%) | 393 (43.0%) |
| Health Diagnosing & Treating | 1,206 (27.6%) | 3,166 (72.4%) |
| Health Technologists | 849 (27.7%) | 2,220 (72.3%) |
| Total (Category) | 13,568 (47.3%) | 15,130 (52.7%) |
| Total (Overall) | 38,950 (51.9%) | 36,163 (48.1%) |
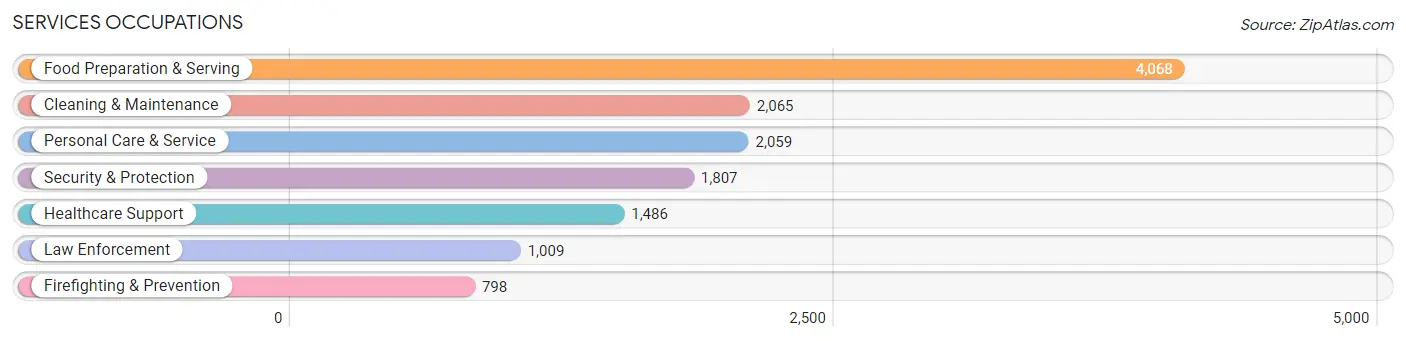
Services Occupations
The most common Services occupations in Houston County are Food Preparation & Serving (4,068 | 5.4%), Cleaning & Maintenance (2,065 | 2.8%), Personal Care & Service (2,059 | 2.7%), Security & Protection (1,807 | 2.4%), and Healthcare Support (1,486 | 2.0%).
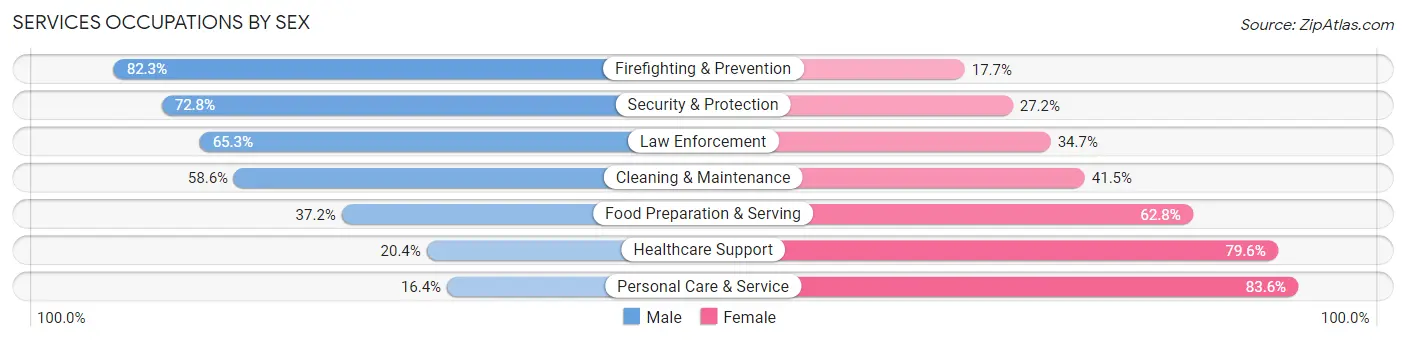
Services Occupations by Sex
Within the Services occupations in Houston County, the most male-oriented occupations are Firefighting & Prevention (82.3%), Security & Protection (72.8%), and Law Enforcement (65.3%), while the most female-oriented occupations are Personal Care & Service (83.6%), Healthcare Support (79.6%), and Food Preparation & Serving (62.8%).
| Occupation | Male | Female |
| Healthcare Support | 303 (20.4%) | 1,183 (79.6%) |
| Security & Protection | 1,316 (72.8%) | 491 (27.2%) |
| Firefighting & Prevention | 657 (82.3%) | 141 (17.7%) |
| Law Enforcement | 659 (65.3%) | 350 (34.7%) |
| Food Preparation & Serving | 1,514 (37.2%) | 2,554 (62.8%) |
| Cleaning & Maintenance | 1,209 (58.6%) | 856 (41.4%) |
| Personal Care & Service | 337 (16.4%) | 1,722 (83.6%) |
| Total (Category) | 4,679 (40.7%) | 6,806 (59.3%) |
| Total (Overall) | 38,950 (51.9%) | 36,163 (48.1%) |
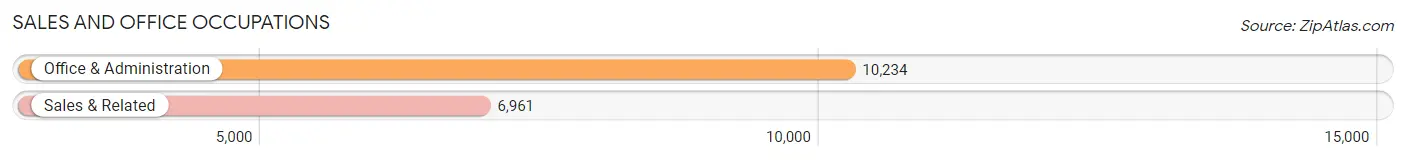
Sales and Office Occupations
The most common Sales and Office occupations in Houston County are Office & Administration (10,234 | 13.6%), and Sales & Related (6,961 | 9.3%).
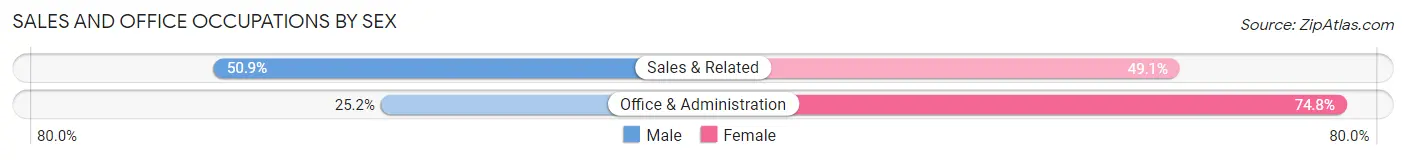
Sales and Office Occupations by Sex
| Occupation | Male | Female |
| Sales & Related | 3,542 (50.9%) | 3,419 (49.1%) |
| Office & Administration | 2,579 (25.2%) | 7,655 (74.8%) |
| Total (Category) | 6,121 (35.6%) | 11,074 (64.4%) |
| Total (Overall) | 38,950 (51.9%) | 36,163 (48.1%) |
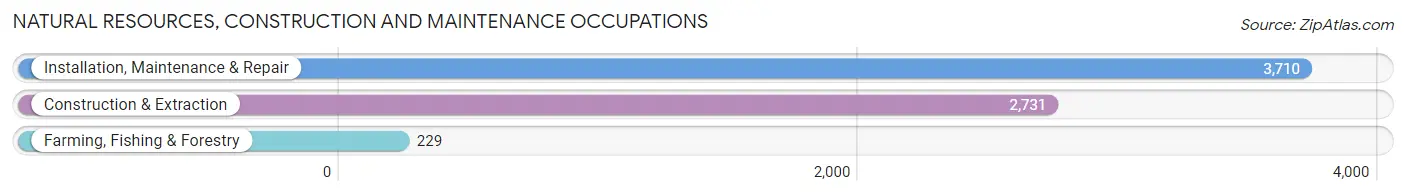
Natural Resources, Construction and Maintenance Occupations
The most common Natural Resources, Construction and Maintenance occupations in Houston County are Installation, Maintenance & Repair (3,710 | 4.9%), Construction & Extraction (2,731 | 3.6%), and Farming, Fishing & Forestry (229 | 0.3%).
Natural Resources, Construction and Maintenance Occupations by Sex
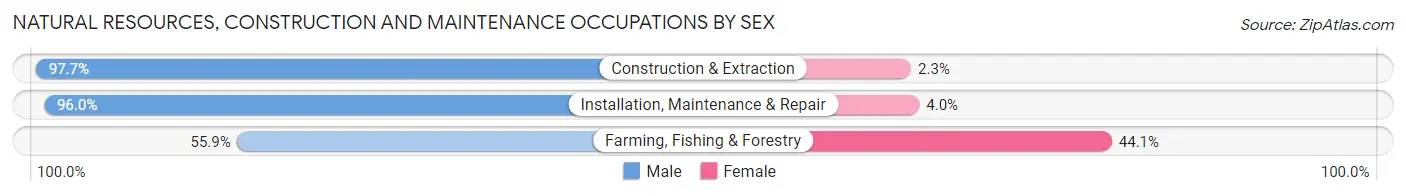
| Occupation | Male | Female |
| Farming, Fishing & Forestry | 128 (55.9%) | 101 (44.1%) |
| Construction & Extraction | 2,667 (97.7%) | 64 (2.3%) |
| Installation, Maintenance & Repair | 3,560 (96.0%) | 150 (4.0%) |
| Total (Category) | 6,355 (95.3%) | 315 (4.7%) |
| Total (Overall) | 38,950 (51.9%) | 36,163 (48.1%) |
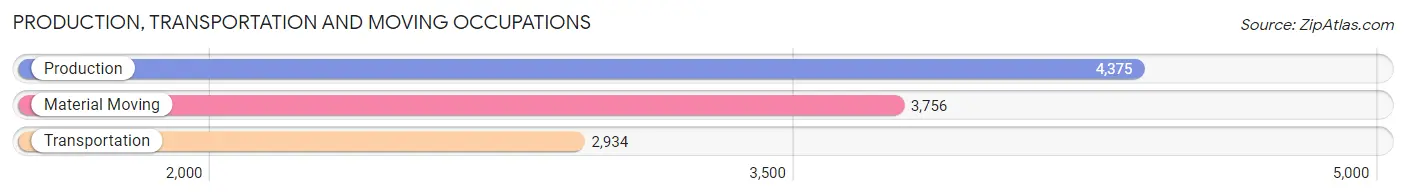
Production, Transportation and Moving Occupations
The most common Production, Transportation and Moving occupations in Houston County are Production (4,375 | 5.8%), Material Moving (3,756 | 5.0%), and Transportation (2,934 | 3.9%).
Production, Transportation and Moving Occupations by Sex
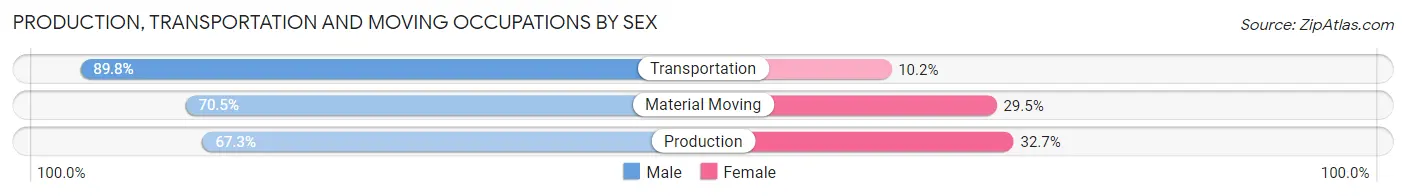
| Occupation | Male | Female |
| Production | 2,946 (67.3%) | 1,429 (32.7%) |
| Transportation | 2,634 (89.8%) | 300 (10.2%) |
| Material Moving | 2,647 (70.5%) | 1,109 (29.5%) |
| Total (Category) | 8,227 (74.4%) | 2,838 (25.7%) |
| Total (Overall) | 38,950 (51.9%) | 36,163 (48.1%) |
Employment Industries by Sex in Houston County
Employment Industries in Houston County
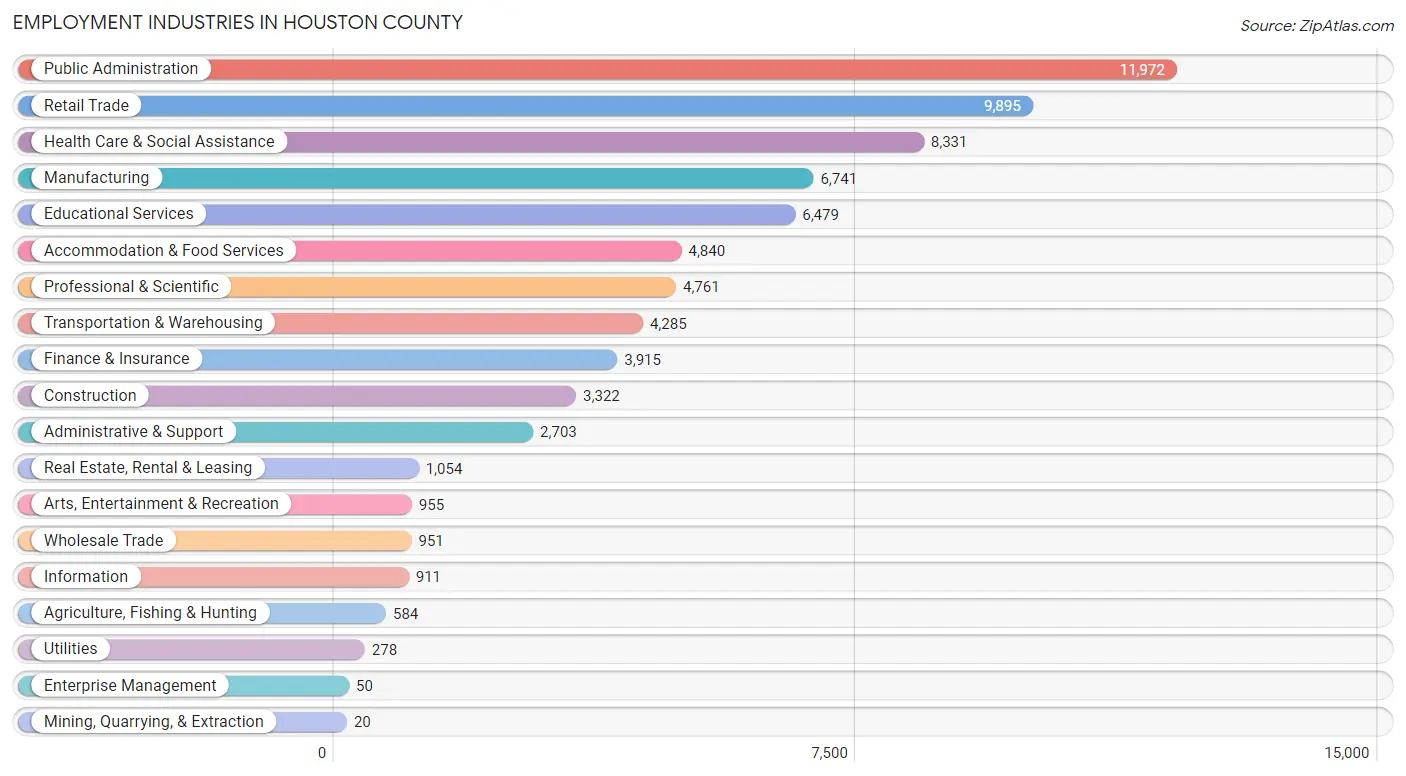
The major employment industries in Houston County include Public Administration (11,972 | 15.9%), Retail Trade (9,895 | 13.2%), Health Care & Social Assistance (8,331 | 11.1%), Manufacturing (6,741 | 9.0%), and Educational Services (6,479 | 8.6%).
Employment Industries by Sex in Houston County
The Houston County industries that see more men than women are Mining, Quarrying, & Extraction (100.0%), Construction (89.2%), and Wholesale Trade (83.7%), whereas the industries that tend to have a higher number of women are Health Care & Social Assistance (76.1%), Educational Services (74.3%), and Finance & Insurance (62.8%).
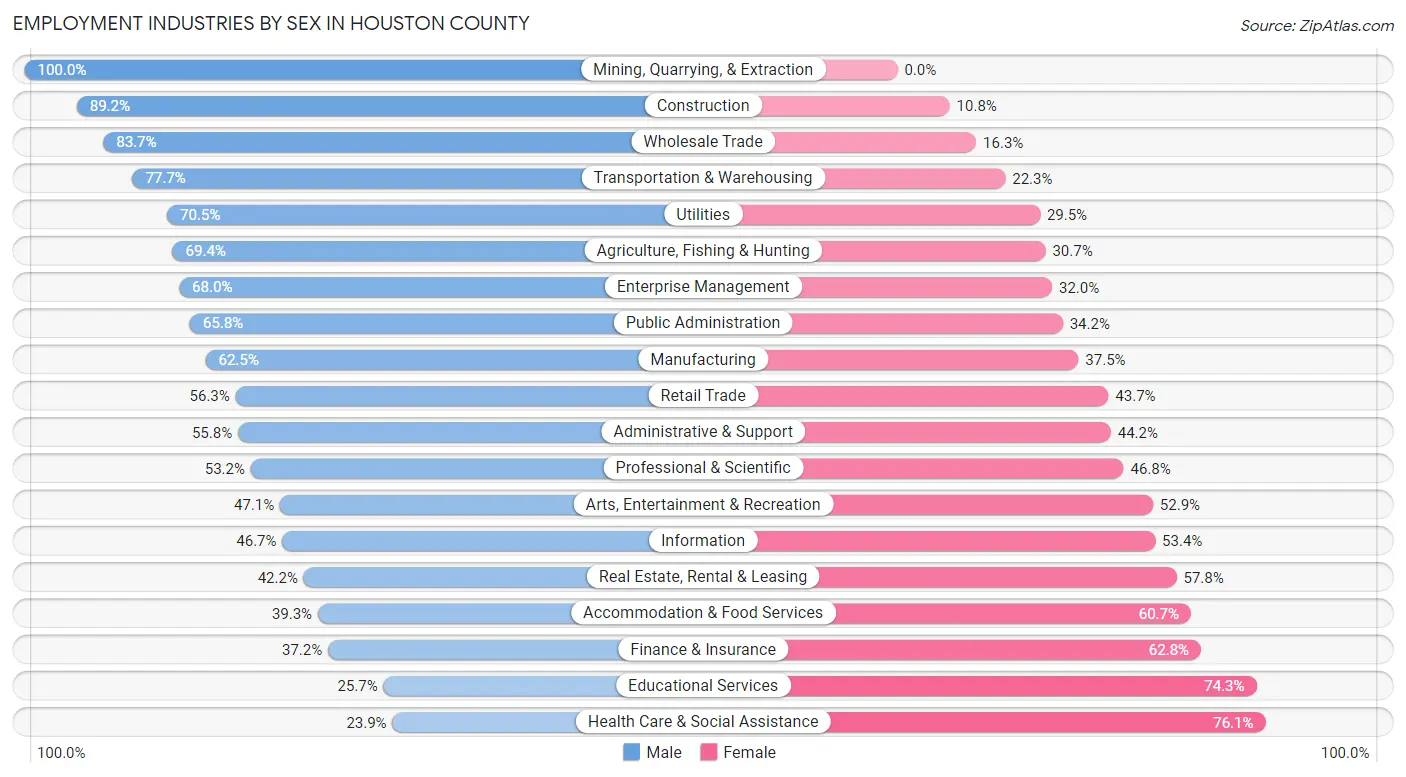
| Industry | Male | Female |
| Agriculture, Fishing & Hunting | 405 (69.4%) | 179 (30.6%) |
| Mining, Quarrying, & Extraction | 20 (100.0%) | 0 (0.0%) |
| Construction | 2,963 (89.2%) | 359 (10.8%) |
| Manufacturing | 4,216 (62.5%) | 2,525 (37.5%) |
| Wholesale Trade | 796 (83.7%) | 155 (16.3%) |
| Retail Trade | 5,574 (56.3%) | 4,321 (43.7%) |
| Transportation & Warehousing | 3,328 (77.7%) | 957 (22.3%) |
| Utilities | 196 (70.5%) | 82 (29.5%) |
| Information | 425 (46.7%) | 486 (53.3%) |
| Finance & Insurance | 1,456 (37.2%) | 2,459 (62.8%) |
| Real Estate, Rental & Leasing | 445 (42.2%) | 609 (57.8%) |
| Professional & Scientific | 2,532 (53.2%) | 2,229 (46.8%) |
| Enterprise Management | 34 (68.0%) | 16 (32.0%) |
| Administrative & Support | 1,509 (55.8%) | 1,194 (44.2%) |
| Educational Services | 1,666 (25.7%) | 4,813 (74.3%) |
| Health Care & Social Assistance | 1,988 (23.9%) | 6,343 (76.1%) |
| Arts, Entertainment & Recreation | 450 (47.1%) | 505 (52.9%) |
| Accommodation & Food Services | 1,901 (39.3%) | 2,939 (60.7%) |
| Public Administration | 7,875 (65.8%) | 4,097 (34.2%) |
| Total | 38,950 (51.9%) | 36,163 (48.1%) |
Education in Houston County
School Enrollment in Houston County
The most common levels of schooling among the 45,029 students in Houston County are middle school (10,275 | 22.8%), high school (9,341 | 20.7%), and elementary school (9,214 | 20.5%).
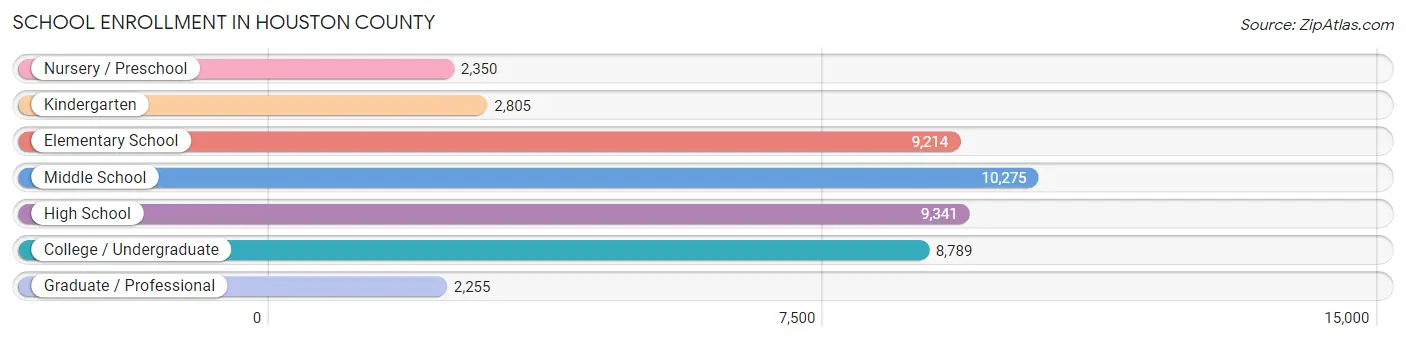
| School Level | # Students | % Students |
| Nursery / Preschool | 2,350 | 5.2% |
| Kindergarten | 2,805 | 6.2% |
| Elementary School | 9,214 | 20.5% |
| Middle School | 10,275 | 22.8% |
| High School | 9,341 | 20.7% |
| College / Undergraduate | 8,789 | 19.5% |
| Graduate / Professional | 2,255 | 5.0% |
| Total | 45,029 | 100.0% |
School Enrollment by Age by Funding Source in Houston County
Out of a total of 45,029 students who are enrolled in schools in Houston County, 5,403 (12.0%) attend a private institution, while the remaining 39,626 (88.0%) are enrolled in public schools. The age group of 35 years and over has the highest likelihood of being enrolled in private schools, with 843 (28.3% in the age bracket) enrolled. Conversely, the age group of 5 to 9 year old has the lowest likelihood of being enrolled in a private school, with 10,855 (93.5% in the age bracket) attending a public institution.
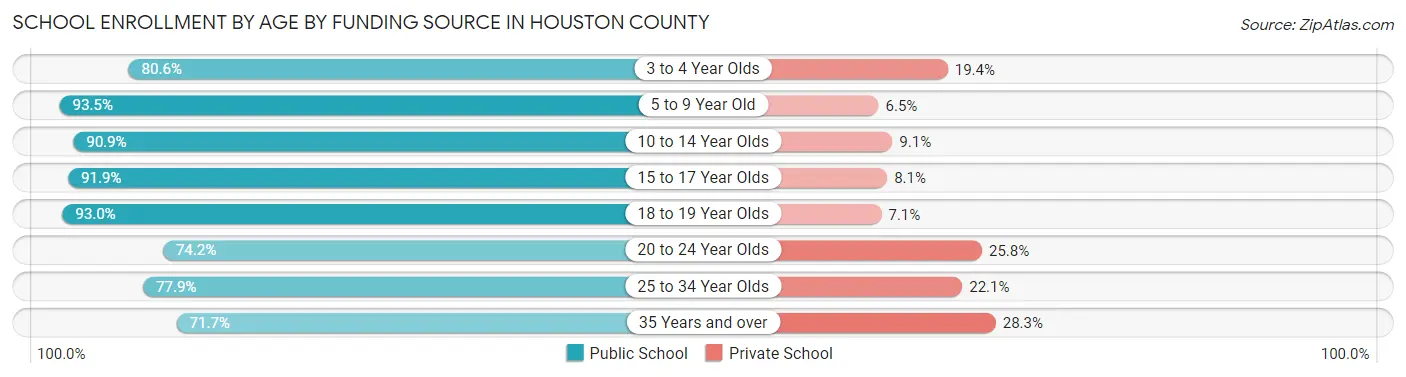
| Age Bracket | Public School | Private School |
| 3 to 4 Year Olds | 1,522 (80.6%) | 366 (19.4%) |
| 5 to 9 Year Old | 10,855 (93.5%) | 756 (6.5%) |
| 10 to 14 Year Olds | 11,081 (90.9%) | 1,106 (9.1%) |
| 15 to 17 Year Olds | 6,341 (91.9%) | 560 (8.1%) |
| 18 to 19 Year Olds | 2,793 (92.9%) | 212 (7.0%) |
| 20 to 24 Year Olds | 2,470 (74.2%) | 858 (25.8%) |
| 25 to 34 Year Olds | 2,441 (77.9%) | 692 (22.1%) |
| 35 Years and over | 2,133 (71.7%) | 843 (28.3%) |
| Total | 39,626 (88.0%) | 5,403 (12.0%) |
Educational Attainment by Field of Study in Houston County
Business (7,960 | 21.8%), education (5,252 | 14.4%), science & technology (3,419 | 9.4%), engineering (3,329 | 9.1%), and arts & humanities (2,987 | 8.2%) are the most common fields of study among 36,533 individuals in Houston County who have obtained a bachelor's degree or higher.
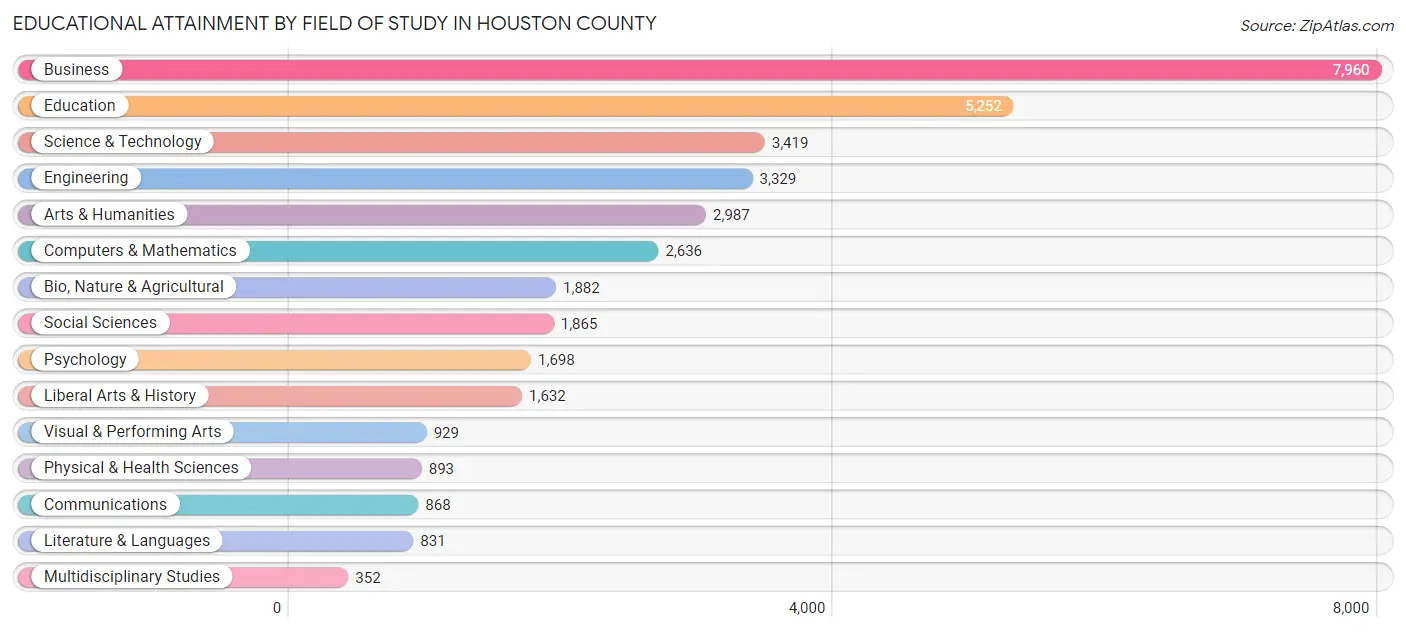
| Field of Study | # Graduates | % Graduates |
| Computers & Mathematics | 2,636 | 7.2% |
| Bio, Nature & Agricultural | 1,882 | 5.1% |
| Physical & Health Sciences | 893 | 2.4% |
| Psychology | 1,698 | 4.6% |
| Social Sciences | 1,865 | 5.1% |
| Engineering | 3,329 | 9.1% |
| Multidisciplinary Studies | 352 | 1.0% |
| Science & Technology | 3,419 | 9.4% |
| Business | 7,960 | 21.8% |
| Education | 5,252 | 14.4% |
| Literature & Languages | 831 | 2.3% |
| Liberal Arts & History | 1,632 | 4.5% |
| Visual & Performing Arts | 929 | 2.5% |
| Communications | 868 | 2.4% |
| Arts & Humanities | 2,987 | 8.2% |
| Total | 36,533 | 100.0% |
Transportation & Commute in Houston County
Vehicle Availability by Sex in Houston County
The most prevalent vehicle ownership categories in Houston County are males with 2 vehicles (16,891, accounting for 41.0%) and females with 2 vehicles (14,387, making up 46.3%).
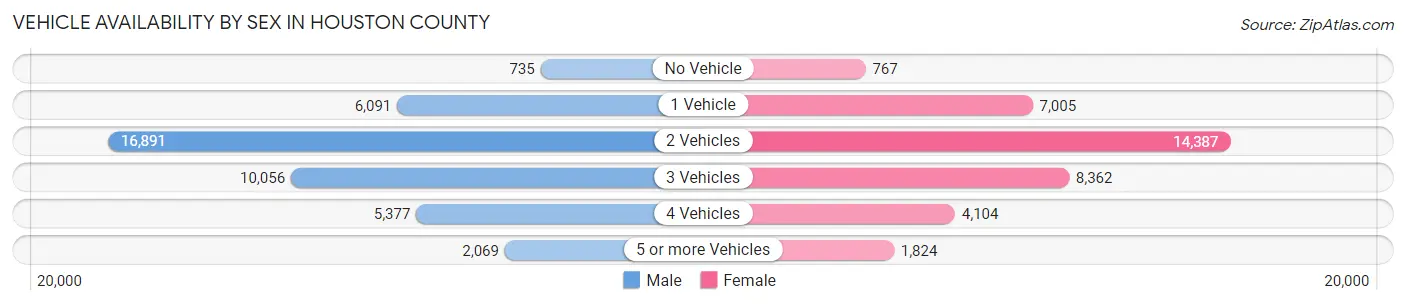
| Vehicles Available | Male | Female |
| No Vehicle | 735 (1.8%) | 767 (2.1%) |
| 1 Vehicle | 6,091 (14.8%) | 7,005 (19.2%) |
| 2 Vehicles | 16,891 (41.0%) | 14,387 (39.5%) |
| 3 Vehicles | 10,056 (24.4%) | 8,362 (22.9%) |
| 4 Vehicles | 5,377 (13.0%) | 4,104 (11.3%) |
| 5 or more Vehicles | 2,069 (5.0%) | 1,824 (5.0%) |
| Total | 41,219 (100.0%) | 36,449 (100.0%) |
Commute Time in Houston County
The most frequently occuring commute durations in Houston County are 15 to 19 minutes (15,115 commuters, 20.9%), 20 to 24 minutes (13,371 commuters, 18.4%), and 10 to 14 minutes (13,090 commuters, 18.1%).
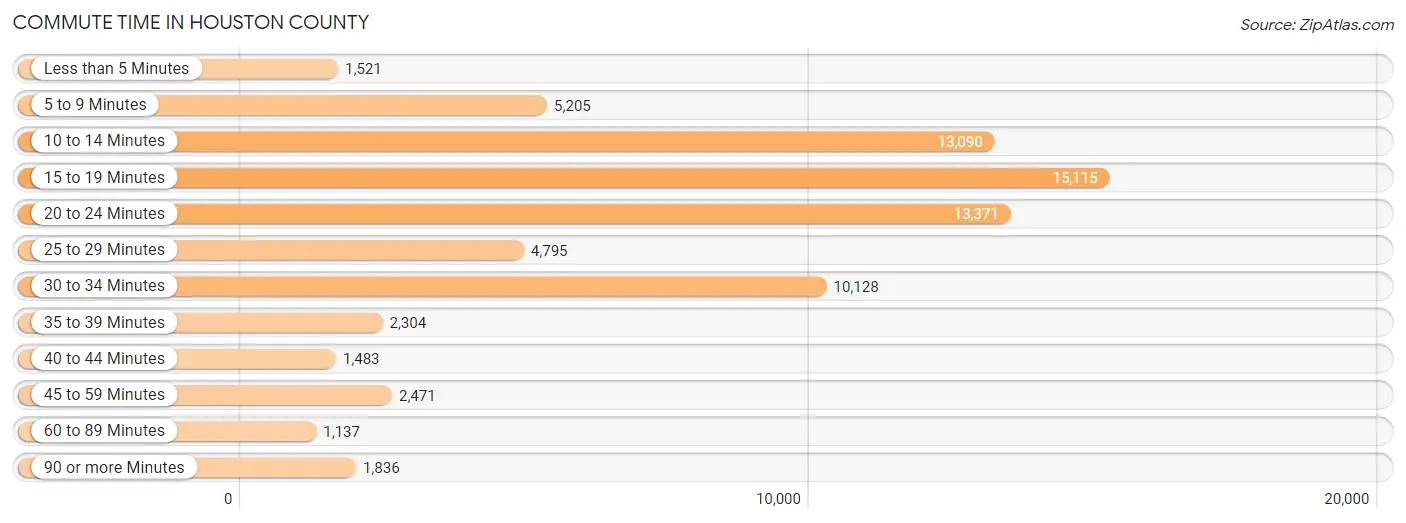
| Commute Time | # Commuters | % Commuters |
| Less than 5 Minutes | 1,521 | 2.1% |
| 5 to 9 Minutes | 5,205 | 7.2% |
| 10 to 14 Minutes | 13,090 | 18.1% |
| 15 to 19 Minutes | 15,115 | 20.9% |
| 20 to 24 Minutes | 13,371 | 18.4% |
| 25 to 29 Minutes | 4,795 | 6.6% |
| 30 to 34 Minutes | 10,128 | 14.0% |
| 35 to 39 Minutes | 2,304 | 3.2% |
| 40 to 44 Minutes | 1,483 | 2.1% |
| 45 to 59 Minutes | 2,471 | 3.4% |
| 60 to 89 Minutes | 1,137 | 1.6% |
| 90 or more Minutes | 1,836 | 2.5% |
Commute Time by Sex in Houston County
The most common commute times in Houston County are 15 to 19 minutes (7,883 commuters, 20.1%) for males and 15 to 19 minutes (7,232 commuters, 21.8%) for females.
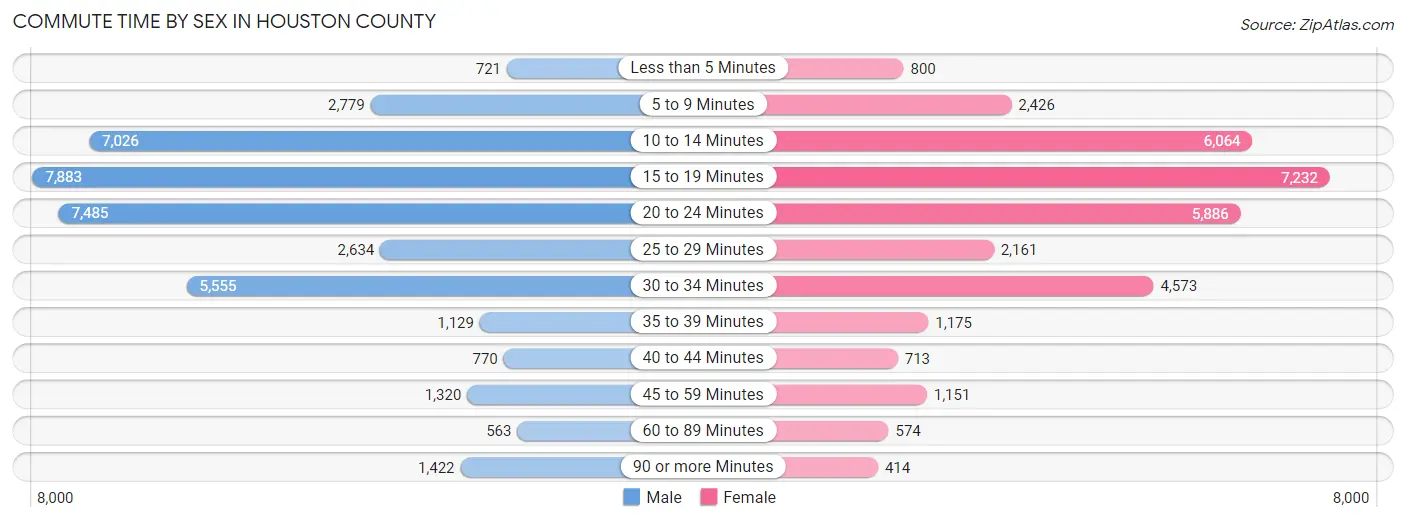
| Commute Time | Male | Female |
| Less than 5 Minutes | 721 (1.8%) | 800 (2.4%) |
| 5 to 9 Minutes | 2,779 (7.1%) | 2,426 (7.3%) |
| 10 to 14 Minutes | 7,026 (17.9%) | 6,064 (18.3%) |
| 15 to 19 Minutes | 7,883 (20.1%) | 7,232 (21.8%) |
| 20 to 24 Minutes | 7,485 (19.1%) | 5,886 (17.7%) |
| 25 to 29 Minutes | 2,634 (6.7%) | 2,161 (6.5%) |
| 30 to 34 Minutes | 5,555 (14.1%) | 4,573 (13.8%) |
| 35 to 39 Minutes | 1,129 (2.9%) | 1,175 (3.5%) |
| 40 to 44 Minutes | 770 (2.0%) | 713 (2.1%) |
| 45 to 59 Minutes | 1,320 (3.4%) | 1,151 (3.5%) |
| 60 to 89 Minutes | 563 (1.4%) | 574 (1.7%) |
| 90 or more Minutes | 1,422 (3.6%) | 414 (1.3%) |
Time of Departure to Work by Sex in Houston County
The most frequent times of departure to work in Houston County are 7:00 AM to 7:29 AM (6,649, 16.9%) for males and 7:00 AM to 7:29 AM (5,633, 17.0%) for females.
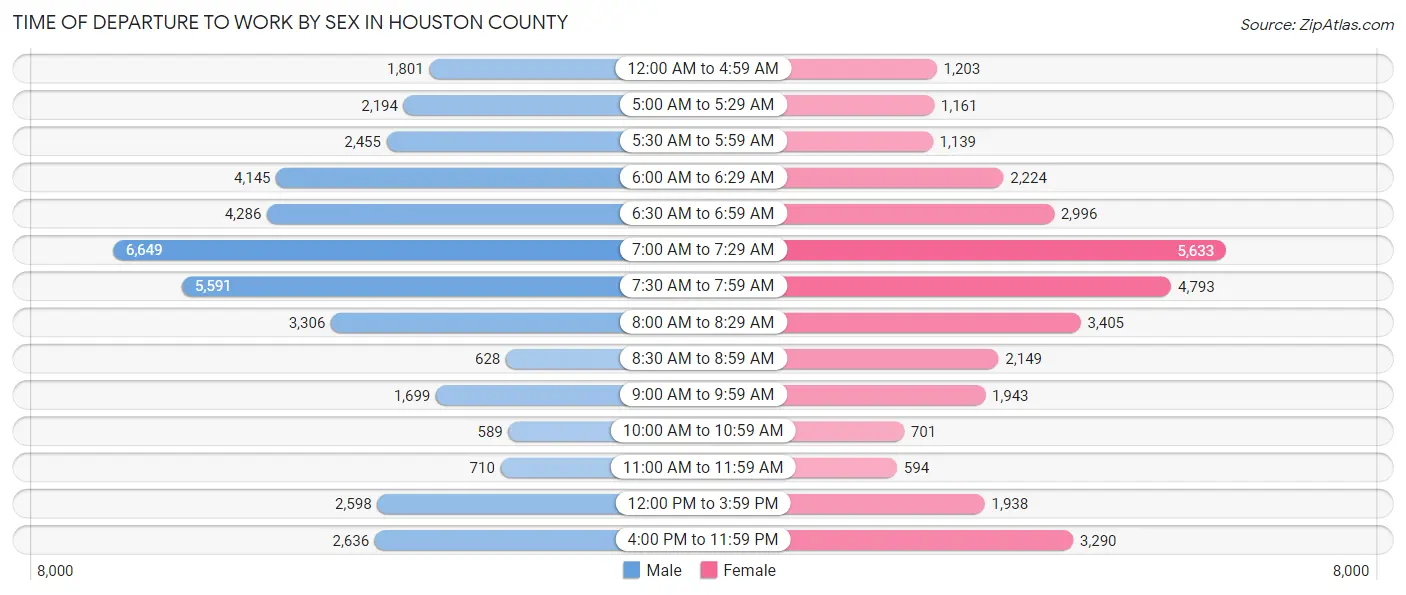
| Time of Departure | Male | Female |
| 12:00 AM to 4:59 AM | 1,801 (4.6%) | 1,203 (3.6%) |
| 5:00 AM to 5:29 AM | 2,194 (5.6%) | 1,161 (3.5%) |
| 5:30 AM to 5:59 AM | 2,455 (6.2%) | 1,139 (3.4%) |
| 6:00 AM to 6:29 AM | 4,145 (10.5%) | 2,224 (6.7%) |
| 6:30 AM to 6:59 AM | 4,286 (10.9%) | 2,996 (9.0%) |
| 7:00 AM to 7:29 AM | 6,649 (16.9%) | 5,633 (17.0%) |
| 7:30 AM to 7:59 AM | 5,591 (14.2%) | 4,793 (14.4%) |
| 8:00 AM to 8:29 AM | 3,306 (8.4%) | 3,405 (10.3%) |
| 8:30 AM to 8:59 AM | 628 (1.6%) | 2,149 (6.5%) |
| 9:00 AM to 9:59 AM | 1,699 (4.3%) | 1,943 (5.9%) |
| 10:00 AM to 10:59 AM | 589 (1.5%) | 701 (2.1%) |
| 11:00 AM to 11:59 AM | 710 (1.8%) | 594 (1.8%) |
| 12:00 PM to 3:59 PM | 2,598 (6.6%) | 1,938 (5.8%) |
| 4:00 PM to 11:59 PM | 2,636 (6.7%) | 3,290 (9.9%) |
| Total | 39,287 (100.0%) | 33,169 (100.0%) |
Housing Occupancy in Houston County
Occupancy by Ownership in Houston County
Of the total 60,607 dwellings in Houston County, owner-occupied units account for 40,563 (66.9%), while renter-occupied units make up 20,044 (33.1%).
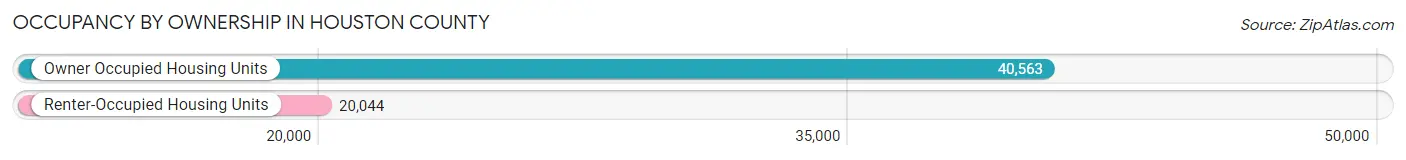
| Occupancy | # Housing Units | % Housing Units |
| Owner Occupied Housing Units | 40,563 | 66.9% |
| Renter-Occupied Housing Units | 20,044 | 33.1% |
| Total Occupied Housing Units | 60,607 | 100.0% |
Occupancy by Household Size in Houston County
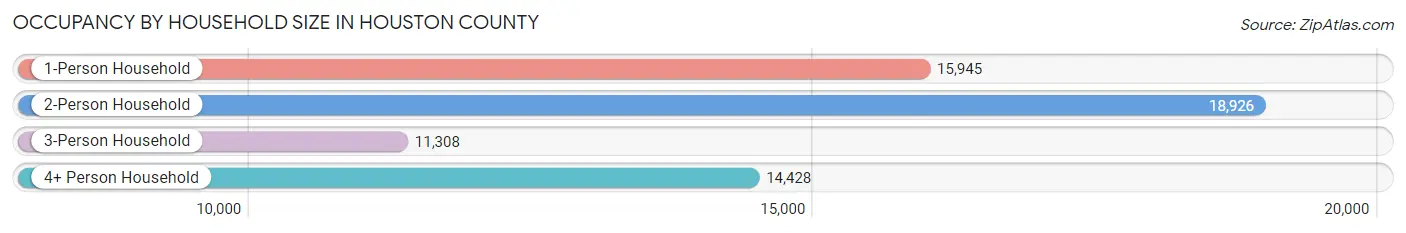
| Household Size | # Housing Units | % Housing Units |
| 1-Person Household | 15,945 | 26.3% |
| 2-Person Household | 18,926 | 31.2% |
| 3-Person Household | 11,308 | 18.7% |
| 4+ Person Household | 14,428 | 23.8% |
| Total Housing Units | 60,607 | 100.0% |
Occupancy by Ownership by Household Size in Houston County
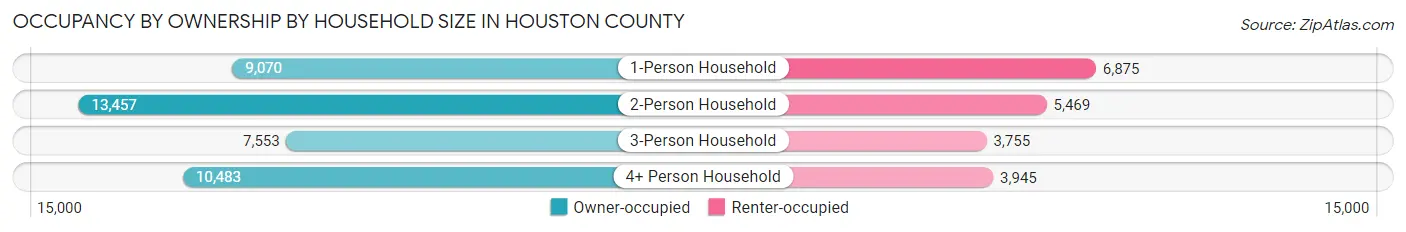
| Household Size | Owner-occupied | Renter-occupied |
| 1-Person Household | 9,070 (56.9%) | 6,875 (43.1%) |
| 2-Person Household | 13,457 (71.1%) | 5,469 (28.9%) |
| 3-Person Household | 7,553 (66.8%) | 3,755 (33.2%) |
| 4+ Person Household | 10,483 (72.7%) | 3,945 (27.3%) |
| Total Housing Units | 40,563 (66.9%) | 20,044 (33.1%) |
Occupancy by Educational Attainment in Houston County
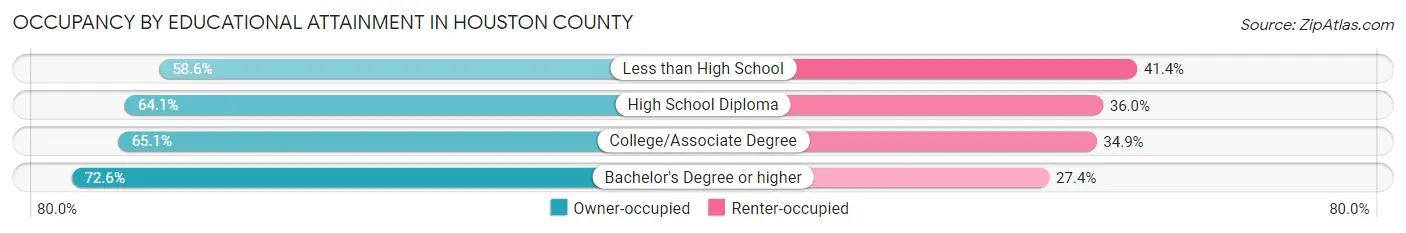
| Household Size | Owner-occupied | Renter-occupied |
| Less than High School | 2,155 (58.6%) | 1,520 (41.4%) |
| High School Diploma | 9,487 (64.0%) | 5,325 (35.9%) |
| College/Associate Degree | 14,267 (65.1%) | 7,657 (34.9%) |
| Bachelor's Degree or higher | 14,654 (72.6%) | 5,542 (27.4%) |
Occupancy by Age of Householder in Houston County
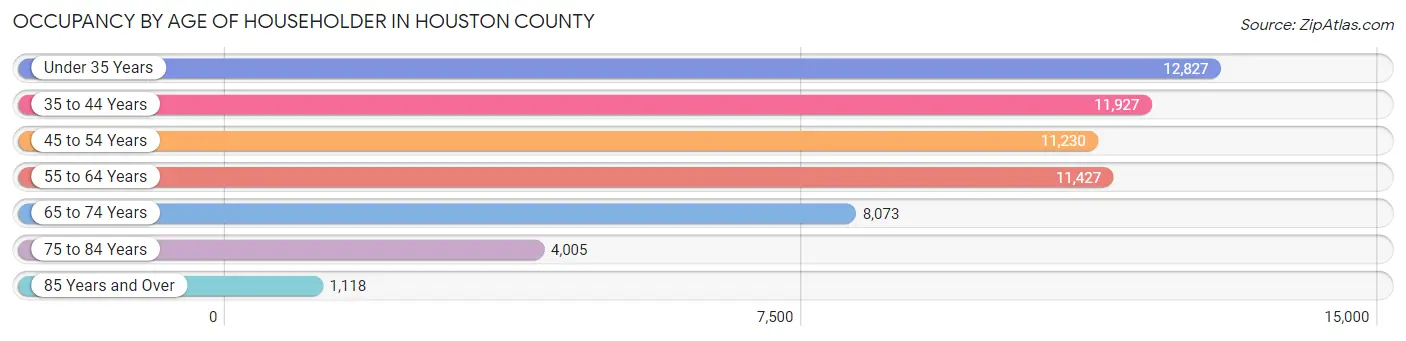
| Age Bracket | # Households | % Households |
| Under 35 Years | 12,827 | 21.2% |
| 35 to 44 Years | 11,927 | 19.7% |
| 45 to 54 Years | 11,230 | 18.5% |
| 55 to 64 Years | 11,427 | 18.9% |
| 65 to 74 Years | 8,073 | 13.3% |
| 75 to 84 Years | 4,005 | 6.6% |
| 85 Years and Over | 1,118 | 1.8% |
| Total | 60,607 | 100.0% |
Housing Finances in Houston County
Median Income by Occupancy in Houston County
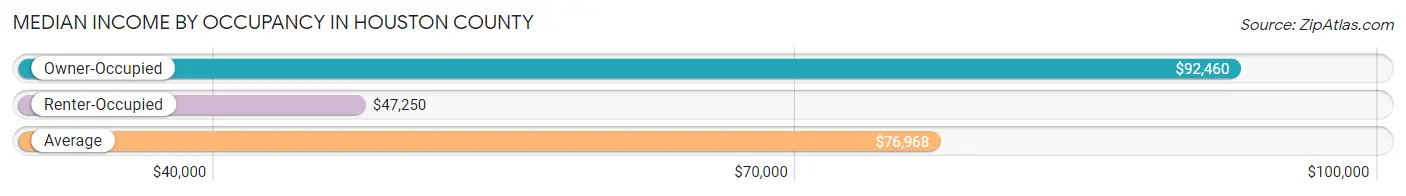
| Occupancy Type | # Households | Median Income |
| Owner-Occupied | 40,563 (66.9%) | $92,460 |
| Renter-Occupied | 20,044 (33.1%) | $47,250 |
| Average | 60,607 (100.0%) | $76,968 |
Occupancy by Householder Income Bracket in Houston County
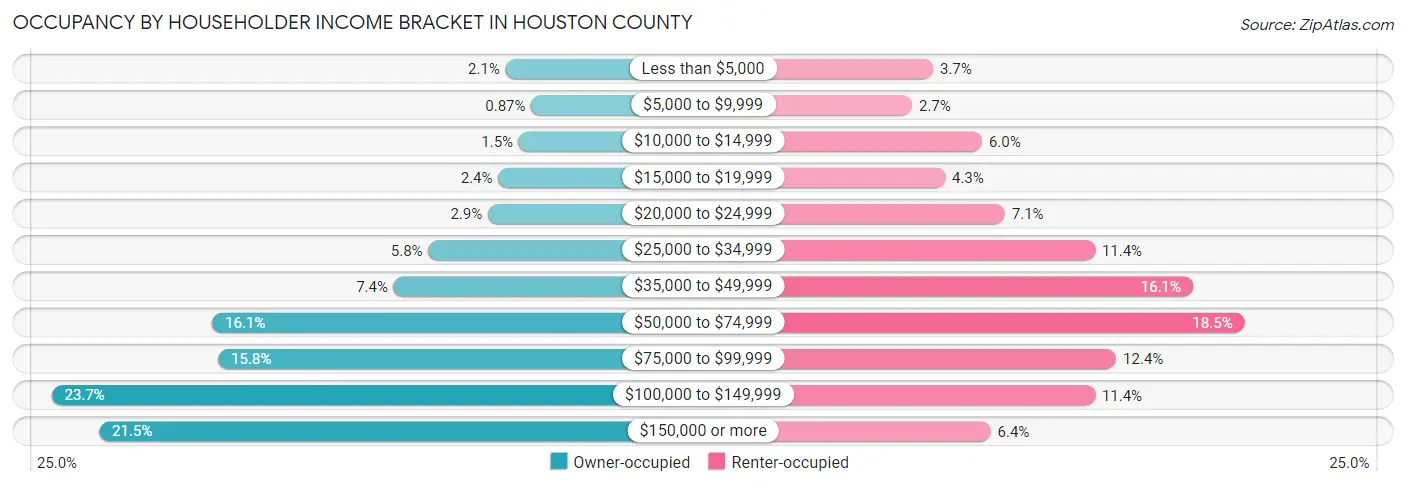
| Income Bracket | Owner-occupied | Renter-occupied |
| Less than $5,000 | 846 (2.1%) | 739 (3.7%) |
| $5,000 to $9,999 | 353 (0.9%) | 540 (2.7%) |
| $10,000 to $14,999 | 591 (1.5%) | 1,206 (6.0%) |
| $15,000 to $19,999 | 988 (2.4%) | 853 (4.3%) |
| $20,000 to $24,999 | 1,188 (2.9%) | 1,425 (7.1%) |
| $25,000 to $34,999 | 2,340 (5.8%) | 2,286 (11.4%) |
| $35,000 to $49,999 | 3,010 (7.4%) | 3,219 (16.1%) |
| $50,000 to $74,999 | 6,520 (16.1%) | 3,713 (18.5%) |
| $75,000 to $99,999 | 6,406 (15.8%) | 2,488 (12.4%) |
| $100,000 to $149,999 | 9,620 (23.7%) | 2,286 (11.4%) |
| $150,000 or more | 8,701 (21.4%) | 1,289 (6.4%) |
| Total | 40,563 (100.0%) | 20,044 (100.0%) |
Monthly Housing Cost Tiers in Houston County
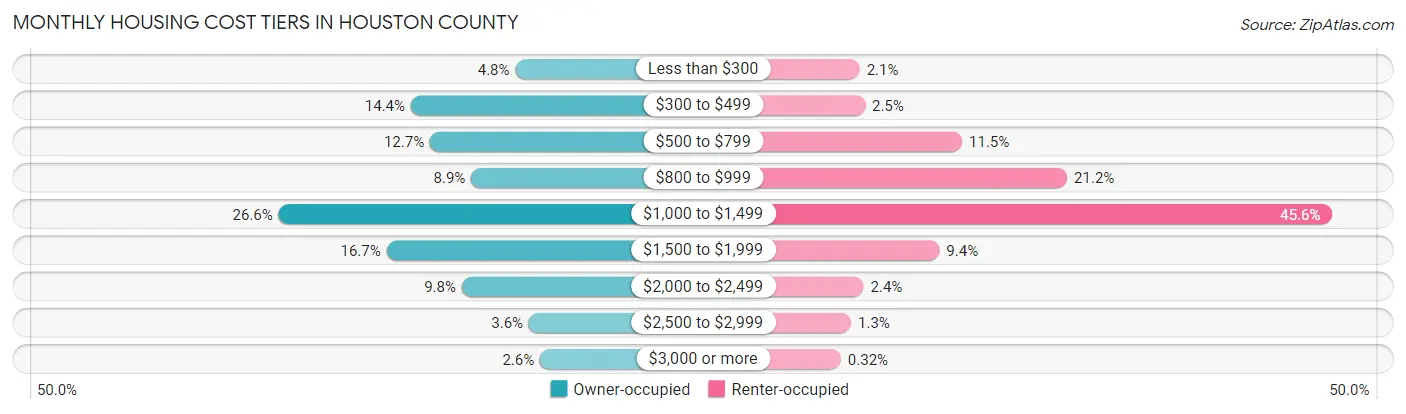
| Monthly Cost | Owner-occupied | Renter-occupied |
| Less than $300 | 1,955 (4.8%) | 411 (2.1%) |
| $300 to $499 | 5,858 (14.4%) | 510 (2.5%) |
| $500 to $799 | 5,142 (12.7%) | 2,302 (11.5%) |
| $800 to $999 | 3,606 (8.9%) | 4,239 (21.1%) |
| $1,000 to $1,499 | 10,798 (26.6%) | 9,132 (45.6%) |
| $1,500 to $1,999 | 6,767 (16.7%) | 1,882 (9.4%) |
| $2,000 to $2,499 | 3,955 (9.8%) | 483 (2.4%) |
| $2,500 to $2,999 | 1,449 (3.6%) | 252 (1.3%) |
| $3,000 or more | 1,033 (2.5%) | 64 (0.3%) |
| Total | 40,563 (100.0%) | 20,044 (100.0%) |
Physical Housing Characteristics in Houston County
Housing Structures in Houston County
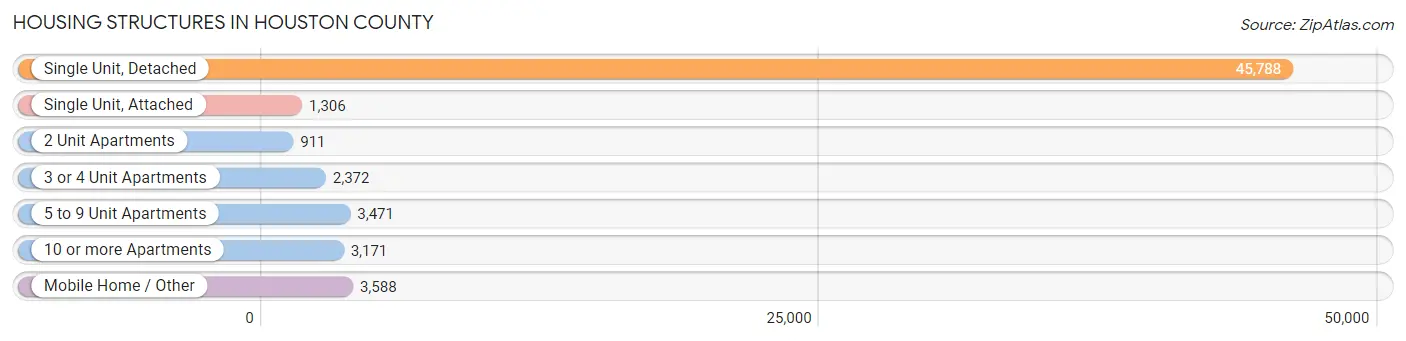
| Structure Type | # Housing Units | % Housing Units |
| Single Unit, Detached | 45,788 | 75.5% |
| Single Unit, Attached | 1,306 | 2.1% |
| 2 Unit Apartments | 911 | 1.5% |
| 3 or 4 Unit Apartments | 2,372 | 3.9% |
| 5 to 9 Unit Apartments | 3,471 | 5.7% |
| 10 or more Apartments | 3,171 | 5.2% |
| Mobile Home / Other | 3,588 | 5.9% |
| Total | 60,607 | 100.0% |
Housing Structures by Occupancy in Houston County
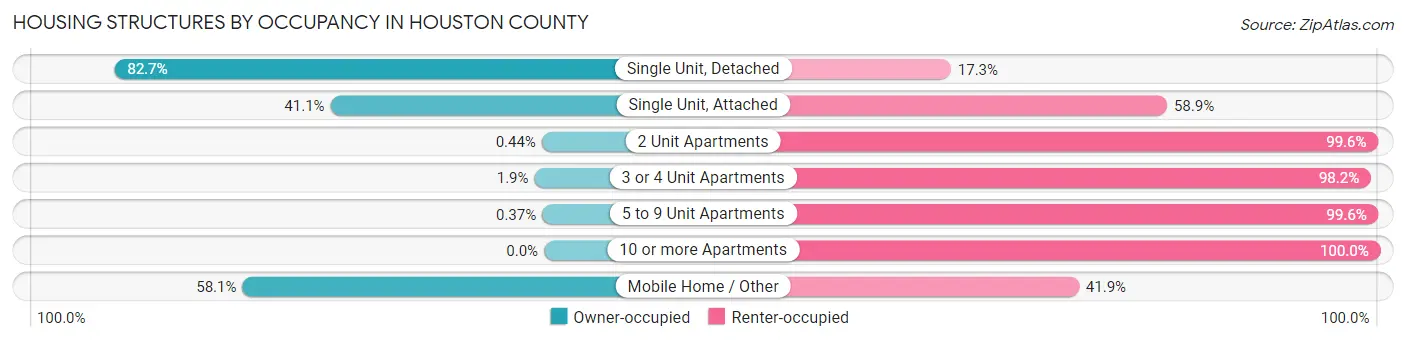
| Structure Type | Owner-occupied | Renter-occupied |
| Single Unit, Detached | 37,881 (82.7%) | 7,907 (17.3%) |
| Single Unit, Attached | 537 (41.1%) | 769 (58.9%) |
| 2 Unit Apartments | 4 (0.4%) | 907 (99.6%) |
| 3 or 4 Unit Apartments | 44 (1.8%) | 2,328 (98.2%) |
| 5 to 9 Unit Apartments | 13 (0.4%) | 3,458 (99.6%) |
| 10 or more Apartments | 0 (0.0%) | 3,171 (100.0%) |
| Mobile Home / Other | 2,084 (58.1%) | 1,504 (41.9%) |
| Total | 40,563 (66.9%) | 20,044 (33.1%) |
Housing Structures by Number of Rooms in Houston County
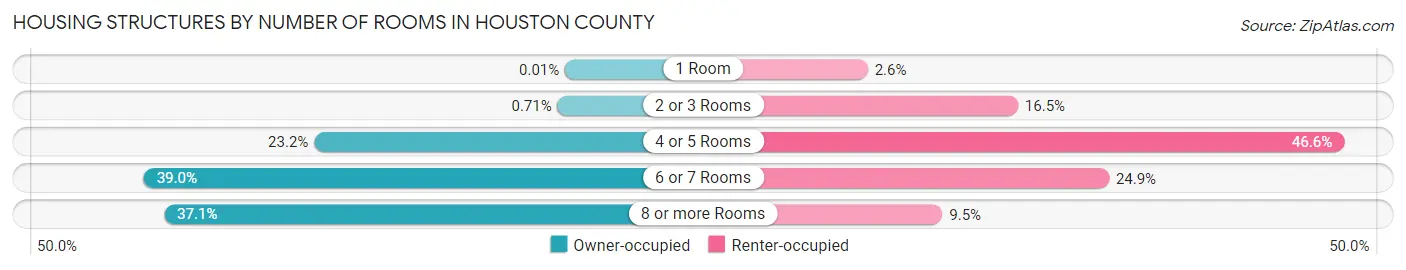
| Number of Rooms | Owner-occupied | Renter-occupied |
| 1 Room | 6 (0.0%) | 516 (2.6%) |
| 2 or 3 Rooms | 286 (0.7%) | 3,299 (16.5%) |
| 4 or 5 Rooms | 9,417 (23.2%) | 9,345 (46.6%) |
| 6 or 7 Rooms | 15,811 (39.0%) | 4,986 (24.9%) |
| 8 or more Rooms | 15,043 (37.1%) | 1,898 (9.5%) |
| Total | 40,563 (100.0%) | 20,044 (100.0%) |
Housing Structure by Heating Type in Houston County
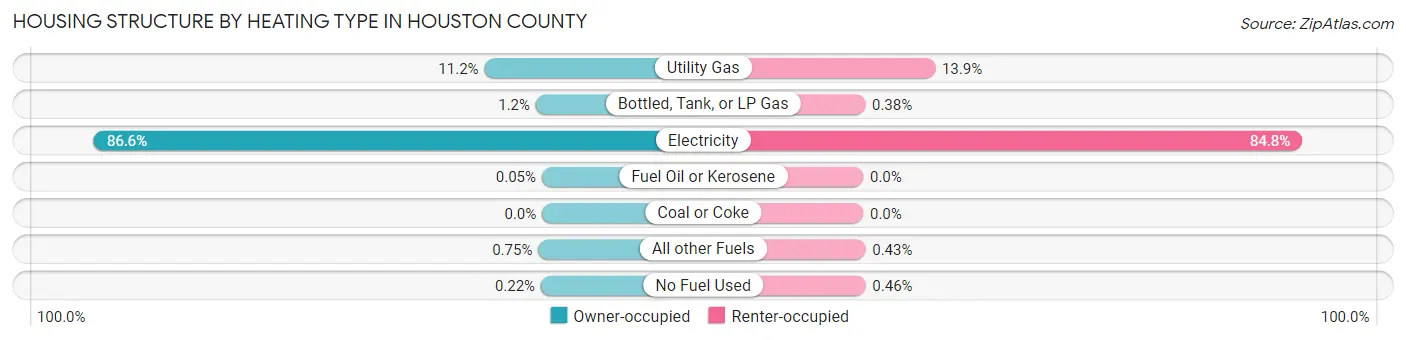
| Heating Type | Owner-occupied | Renter-occupied |
| Utility Gas | 4,523 (11.2%) | 2,787 (13.9%) |
| Bottled, Tank, or LP Gas | 491 (1.2%) | 76 (0.4%) |
| Electricity | 35,133 (86.6%) | 17,001 (84.8%) |
| Fuel Oil or Kerosene | 21 (0.1%) | 0 (0.0%) |
| Coal or Coke | 0 (0.0%) | 0 (0.0%) |
| All other Fuels | 304 (0.7%) | 87 (0.4%) |
| No Fuel Used | 91 (0.2%) | 93 (0.5%) |
| Total | 40,563 (100.0%) | 20,044 (100.0%) |
Household Vehicle Usage in Houston County
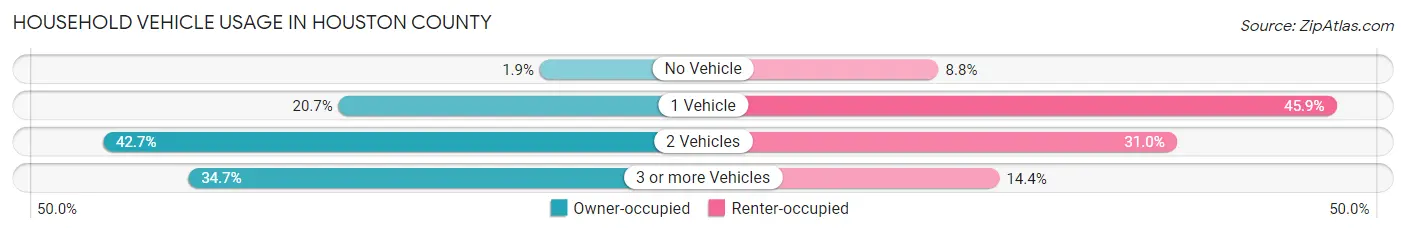
| Vehicles per Household | Owner-occupied | Renter-occupied |
| No Vehicle | 774 (1.9%) | 1,754 (8.7%) |
| 1 Vehicle | 8,393 (20.7%) | 9,194 (45.9%) |
| 2 Vehicles | 17,314 (42.7%) | 6,203 (30.9%) |
| 3 or more Vehicles | 14,082 (34.7%) | 2,893 (14.4%) |
| Total | 40,563 (100.0%) | 20,044 (100.0%) |
Real Estate & Mortgages in Houston County
Real Estate and Mortgage Overview in Houston County
| Characteristic | Without Mortgage | With Mortgage |
| Housing Units | 12,433 | 28,130 |
| Median Property Value | $144,300 | $209,300 |
| Median Household Income | $64,592 | $6,950 |
| Monthly Housing Costs | $445 | $1,013 |
| Real Estate Taxes | $1,270 | $1,113 |
Property Value by Mortgage Status in Houston County
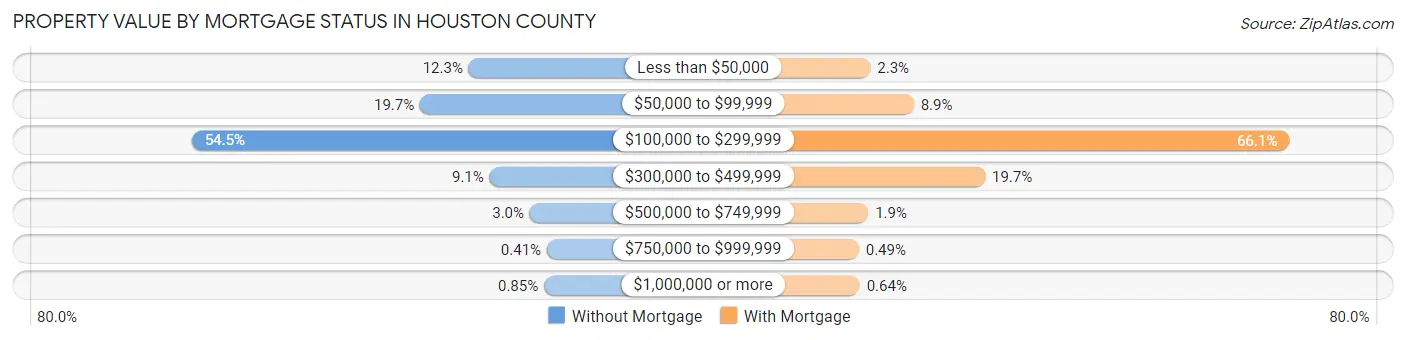
| Property Value | Without Mortgage | With Mortgage |
| Less than $50,000 | 1,532 (12.3%) | 637 (2.3%) |
| $50,000 to $99,999 | 2,454 (19.7%) | 2,491 (8.9%) |
| $100,000 to $299,999 | 6,780 (54.5%) | 18,589 (66.1%) |
| $300,000 to $499,999 | 1,136 (9.1%) | 5,551 (19.7%) |
| $500,000 to $749,999 | 374 (3.0%) | 544 (1.9%) |
| $750,000 to $999,999 | 51 (0.4%) | 139 (0.5%) |
| $1,000,000 or more | 106 (0.9%) | 179 (0.6%) |
| Total | 12,433 (100.0%) | 28,130 (100.0%) |
Household Income by Mortgage Status in Houston County
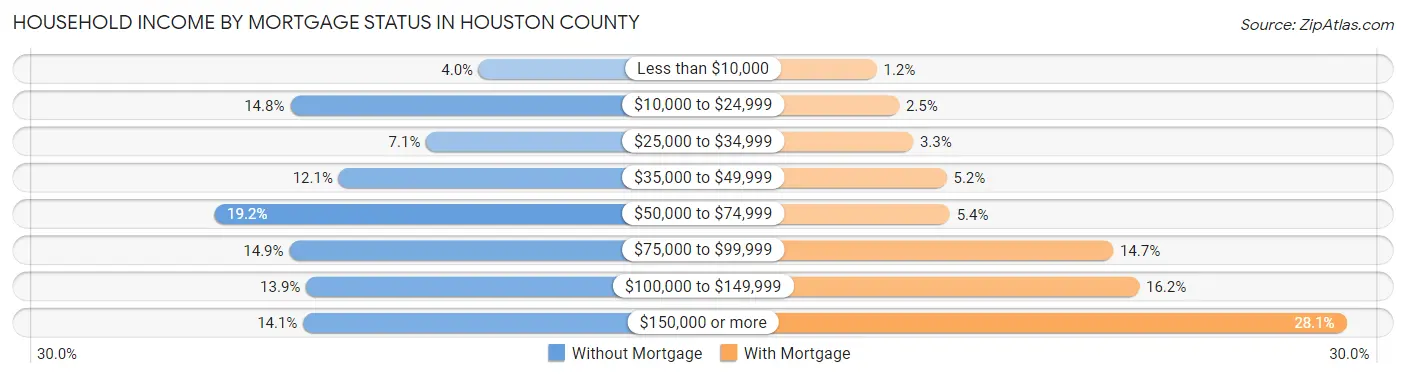
| Household Income | Without Mortgage | With Mortgage |
| Less than $10,000 | 502 (4.0%) | 337 (1.2%) |
| $10,000 to $24,999 | 1,843 (14.8%) | 697 (2.5%) |
| $25,000 to $34,999 | 877 (7.0%) | 924 (3.3%) |
| $35,000 to $49,999 | 1,498 (12.0%) | 1,463 (5.2%) |
| $50,000 to $74,999 | 2,383 (19.2%) | 1,512 (5.4%) |
| $75,000 to $99,999 | 1,849 (14.9%) | 4,137 (14.7%) |
| $100,000 to $149,999 | 1,730 (13.9%) | 4,557 (16.2%) |
| $150,000 or more | 1,751 (14.1%) | 7,890 (28.1%) |
| Total | 12,433 (100.0%) | 28,130 (100.0%) |
Property Value to Household Income Ratio in Houston County
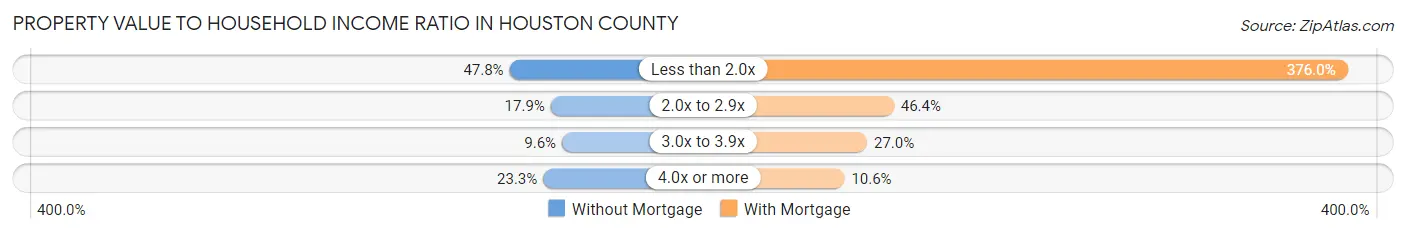
| Value-to-Income Ratio | Without Mortgage | With Mortgage |
| Less than 2.0x | 5,941 (47.8%) | 105,758 (376.0%) |
| 2.0x to 2.9x | 2,221 (17.9%) | 13,054 (46.4%) |
| 3.0x to 3.9x | 1,199 (9.6%) | 7,596 (27.0%) |
| 4.0x or more | 2,901 (23.3%) | 2,974 (10.6%) |
| Total | 12,433 (100.0%) | 28,130 (100.0%) |
Real Estate Taxes by Mortgage Status in Houston County
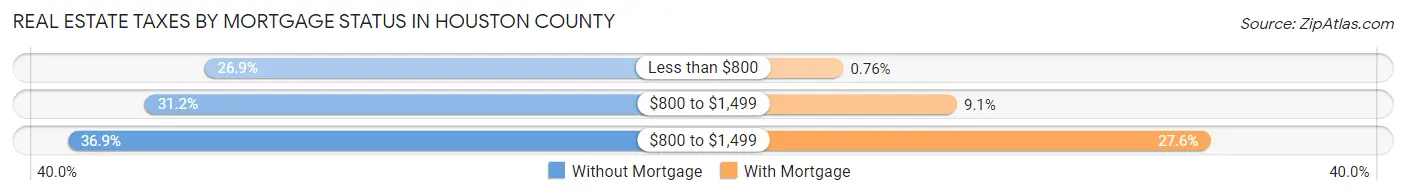
| Property Taxes | Without Mortgage | With Mortgage |
| Less than $800 | 3,338 (26.9%) | 214 (0.8%) |
| $800 to $1,499 | 3,882 (31.2%) | 2,548 (9.1%) |
| $800 to $1,499 | 4,581 (36.8%) | 7,754 (27.6%) |
| Total | 12,433 (100.0%) | 28,130 (100.0%) |
Health & Disability in Houston County
Health Insurance Coverage by Age in Houston County
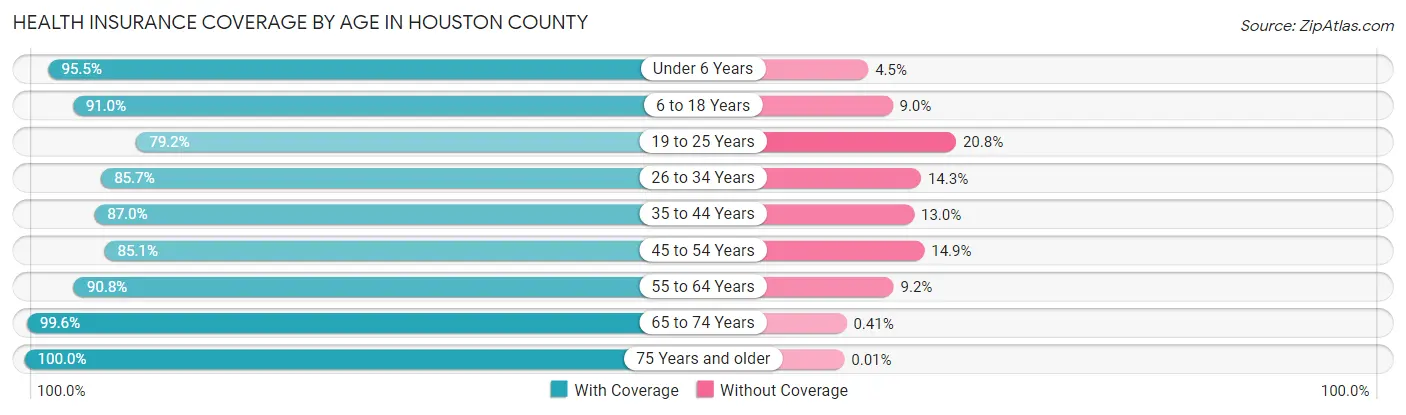
| Age Bracket | With Coverage | Without Coverage |
| Under 6 Years | 11,501 (95.5%) | 537 (4.5%) |
| 6 to 18 Years | 28,718 (91.0%) | 2,837 (9.0%) |
| 19 to 25 Years | 10,765 (79.2%) | 2,832 (20.8%) |
| 26 to 34 Years | 17,171 (85.7%) | 2,866 (14.3%) |
| 35 to 44 Years | 18,238 (87.0%) | 2,726 (13.0%) |
| 45 to 54 Years | 16,379 (85.1%) | 2,872 (14.9%) |
| 55 to 64 Years | 18,205 (90.8%) | 1,844 (9.2%) |
| 65 to 74 Years | 13,214 (99.6%) | 54 (0.4%) |
| 75 Years and older | 7,821 (100.0%) | 1 (0.0%) |
| Total | 142,012 (89.5%) | 16,569 (10.4%) |
Health Insurance Coverage by Citizenship Status in Houston County
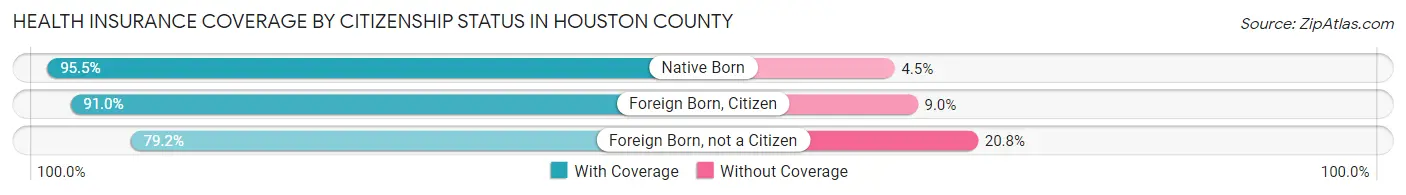
| Citizenship Status | With Coverage | Without Coverage |
| Native Born | 11,501 (95.5%) | 537 (4.5%) |
| Foreign Born, Citizen | 28,718 (91.0%) | 2,837 (9.0%) |
| Foreign Born, not a Citizen | 10,765 (79.2%) | 2,832 (20.8%) |
Health Insurance Coverage by Household Income in Houston County
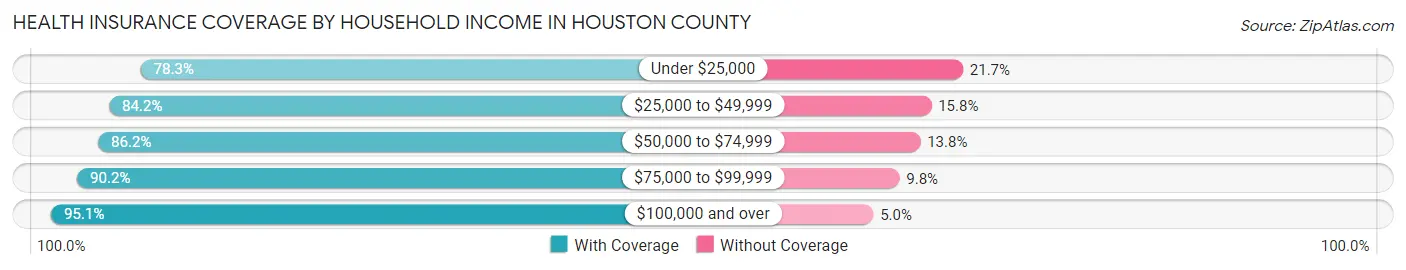
| Household Income | With Coverage | Without Coverage |
| Under $25,000 | 12,819 (78.3%) | 3,560 (21.7%) |
| $25,000 to $49,999 | 18,932 (84.2%) | 3,558 (15.8%) |
| $50,000 to $74,999 | 22,494 (86.2%) | 3,590 (13.8%) |
| $75,000 to $99,999 | 22,081 (90.2%) | 2,410 (9.8%) |
| $100,000 and over | 65,574 (95.1%) | 3,415 (5.0%) |
Public vs Private Health Insurance Coverage by Age in Houston County
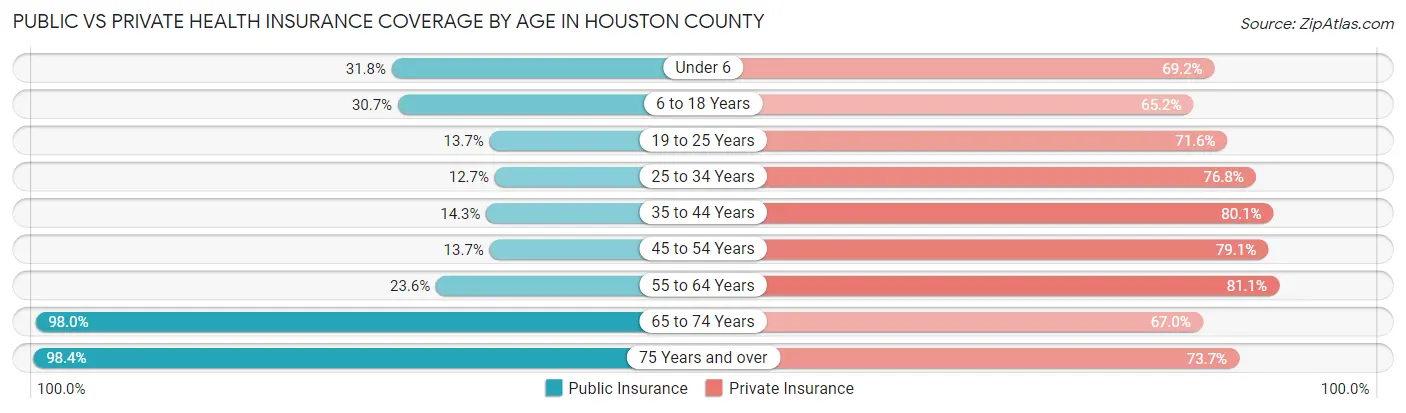
| Age Bracket | Public Insurance | Private Insurance |
| Under 6 | 3,833 (31.8%) | 8,325 (69.2%) |
| 6 to 18 Years | 9,686 (30.7%) | 20,583 (65.2%) |
| 19 to 25 Years | 1,863 (13.7%) | 9,731 (71.6%) |
| 25 to 34 Years | 2,551 (12.7%) | 15,390 (76.8%) |
| 35 to 44 Years | 2,997 (14.3%) | 16,795 (80.1%) |
| 45 to 54 Years | 2,633 (13.7%) | 15,227 (79.1%) |
| 55 to 64 Years | 4,736 (23.6%) | 16,261 (81.1%) |
| 65 to 74 Years | 13,005 (98.0%) | 8,887 (67.0%) |
| 75 Years and over | 7,697 (98.4%) | 5,765 (73.7%) |
| Total | 49,001 (30.9%) | 116,964 (73.8%) |
Disability Status by Sex by Age in Houston County
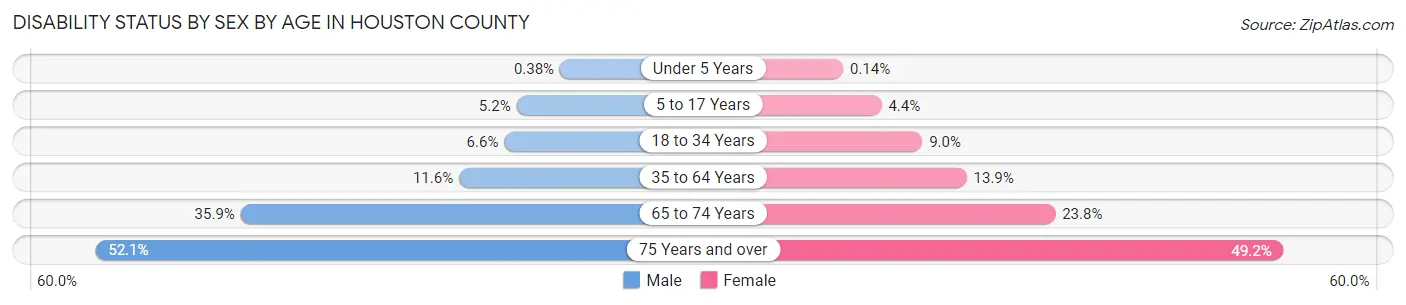
| Age Bracket | Male | Female |
| Under 5 Years | 20 (0.4%) | 7 (0.1%) |
| 5 to 17 Years | 833 (5.2%) | 686 (4.4%) |
| 18 to 34 Years | 1,114 (6.6%) | 1,666 (9.0%) |
| 35 to 64 Years | 3,297 (11.6%) | 4,431 (13.9%) |
| 65 to 74 Years | 2,242 (35.9%) | 1,671 (23.8%) |
| 75 Years and over | 1,589 (52.1%) | 2,348 (49.2%) |
Disability Class by Sex by Age in Houston County
Disability Class: Hearing Difficulty
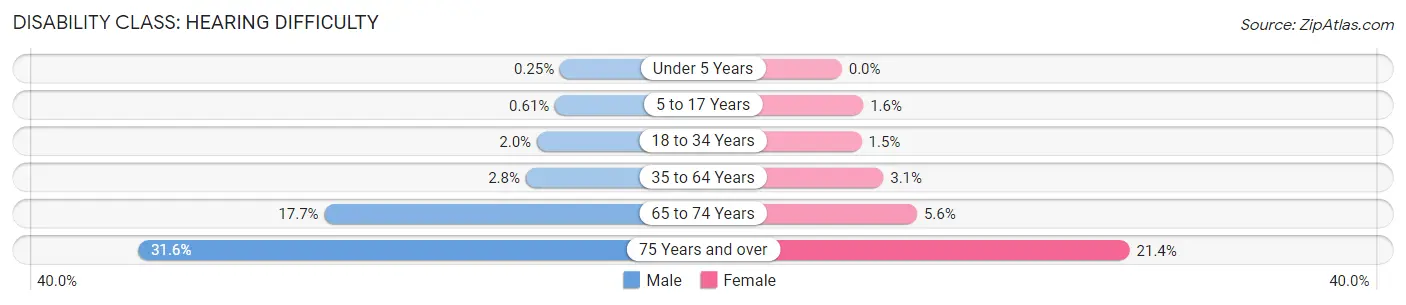
| Age Bracket | Male | Female |
| Under 5 Years | 13 (0.3%) | 0 (0.0%) |
| 5 to 17 Years | 98 (0.6%) | 246 (1.6%) |
| 18 to 34 Years | 332 (2.0%) | 274 (1.5%) |
| 35 to 64 Years | 792 (2.8%) | 981 (3.1%) |
| 65 to 74 Years | 1,107 (17.7%) | 392 (5.6%) |
| 75 Years and over | 963 (31.6%) | 1,020 (21.4%) |
Disability Class: Vision Difficulty
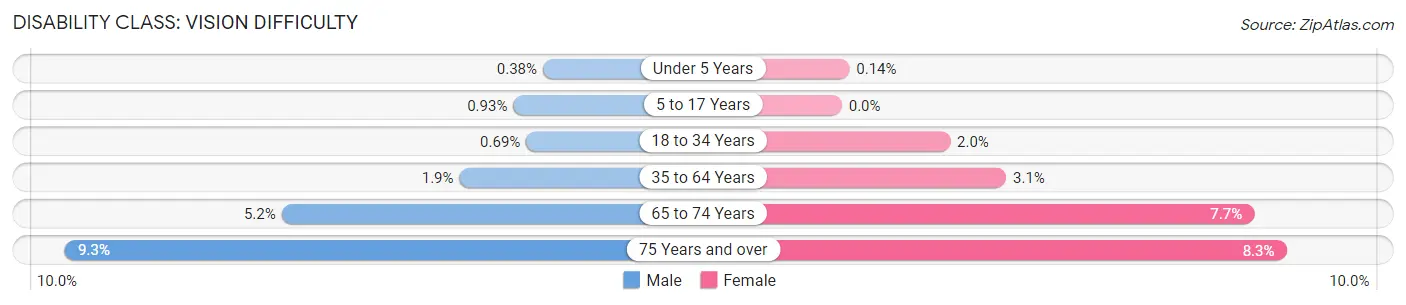
| Age Bracket | Male | Female |
| Under 5 Years | 20 (0.4%) | 7 (0.1%) |
| 5 to 17 Years | 149 (0.9%) | 0 (0.0%) |
| 18 to 34 Years | 116 (0.7%) | 373 (2.0%) |
| 35 to 64 Years | 547 (1.9%) | 974 (3.0%) |
| 65 to 74 Years | 326 (5.2%) | 538 (7.6%) |
| 75 Years and over | 282 (9.2%) | 394 (8.3%) |
Disability Class: Cognitive Difficulty
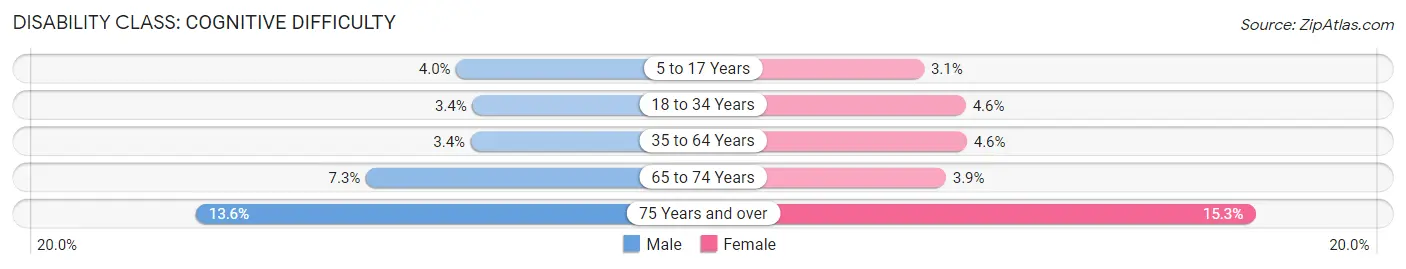
| Age Bracket | Male | Female |
| 5 to 17 Years | 634 (4.0%) | 473 (3.0%) |
| 18 to 34 Years | 570 (3.4%) | 855 (4.6%) |
| 35 to 64 Years | 973 (3.4%) | 1,479 (4.6%) |
| 65 to 74 Years | 457 (7.3%) | 271 (3.9%) |
| 75 Years and over | 416 (13.6%) | 732 (15.3%) |
Disability Class: Ambulatory Difficulty
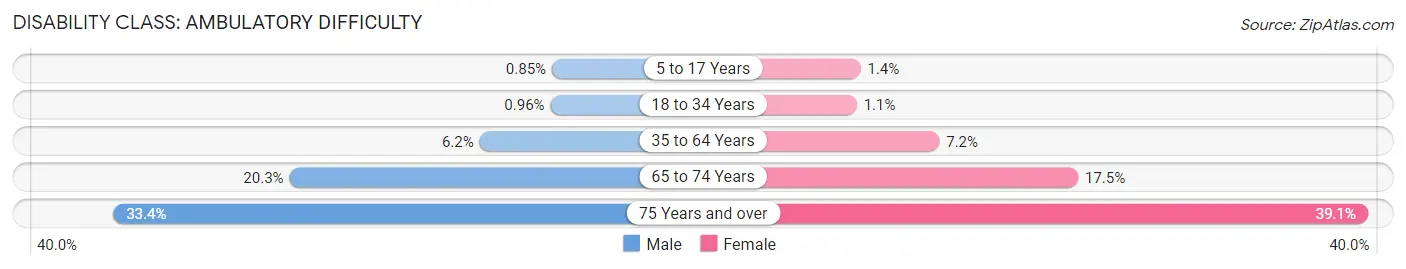
| Age Bracket | Male | Female |
| 5 to 17 Years | 135 (0.9%) | 216 (1.4%) |
| 18 to 34 Years | 163 (1.0%) | 206 (1.1%) |
| 35 to 64 Years | 1,765 (6.2%) | 2,309 (7.2%) |
| 65 to 74 Years | 1,269 (20.3%) | 1,233 (17.5%) |
| 75 Years and over | 1,019 (33.4%) | 1,864 (39.1%) |
Disability Class: Self-Care Difficulty
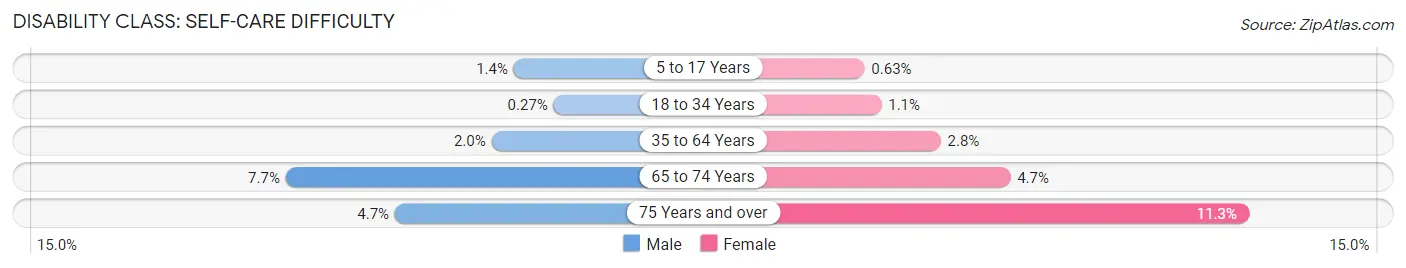
| Age Bracket | Male | Female |
| 5 to 17 Years | 221 (1.4%) | 98 (0.6%) |
| 18 to 34 Years | 46 (0.3%) | 205 (1.1%) |
| 35 to 64 Years | 568 (2.0%) | 878 (2.8%) |
| 65 to 74 Years | 482 (7.7%) | 330 (4.7%) |
| 75 Years and over | 143 (4.7%) | 541 (11.3%) |
Technology Access in Houston County
Computing Device Access in Houston County
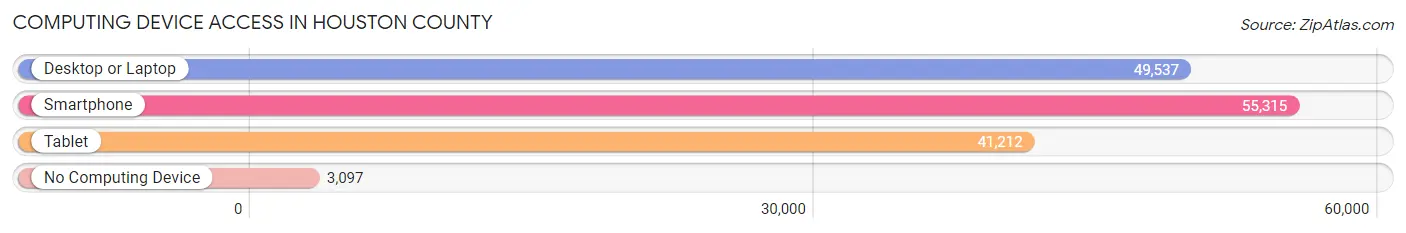
| Device Type | # Households | % Households |
| Desktop or Laptop | 49,537 | 81.7% |
| Smartphone | 55,315 | 91.3% |
| Tablet | 41,212 | 68.0% |
| No Computing Device | 3,097 | 5.1% |
| Total | 60,607 | 100.0% |
Internet Access in Houston County
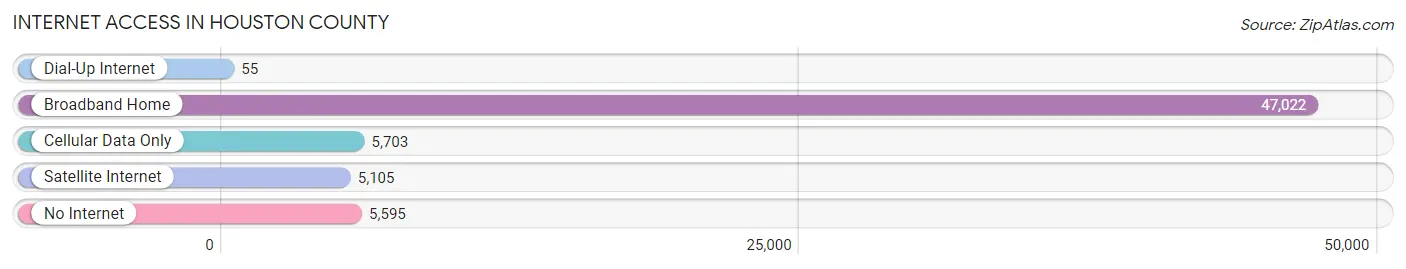
| Internet Type | # Households | % Households |
| Dial-Up Internet | 55 | 0.1% |
| Broadband Home | 47,022 | 77.6% |
| Cellular Data Only | 5,703 | 9.4% |
| Satellite Internet | 5,105 | 8.4% |
| No Internet | 5,595 | 9.2% |
| Total | 60,607 | 100.0% |
Houston County Summary
History
Houston County, Georgia is located in the central part of the state and is part of the Macon metropolitan area. The county was created in 1821 from parts of Pulaski, Laurens, and Bibb counties. It was named after Georgia Governor John Houstoun. The county seat is Perry, which was founded in 1823.
The area was originally inhabited by the Creek and Cherokee Native American tribes. The first European settlers arrived in the area in the late 1700s. The county was largely agricultural, with cotton being the main crop. The county also had a thriving timber industry.
During the Civil War, Houston County was a major supplier of food and supplies to the Confederate Army. After the war, the county experienced a period of economic decline. The county was largely rural until the 1950s, when the population began to grow rapidly due to the expansion of the military base at Robins Air Force Base.
Geography
Houston County is located in the central part of Georgia, about 100 miles south of Atlanta. It is bordered by Bibb County to the north, Peach County to the east, Twiggs County to the south, and Crawford and Monroe counties to the west. The county covers an area of 441 square miles and has a population of 149,935 (as of 2019).
The county is mostly flat, with some rolling hills in the northern part. The Flint River runs through the county, and there are several small lakes and ponds. The climate is humid subtropical, with hot summers and mild winters.
Economy
Houston County is largely rural, with a strong agricultural base. The main crops are cotton, corn, soybeans, and peanuts. The county also has a thriving timber industry.
The county is home to Robins Air Force Base, which is the largest employer in the county. Other major employers include Houston Healthcare, Houston County Board of Education, and Houston County Schools.
Demographics
As of 2019, the population of Houston County was 149,935. The racial makeup of the county was 68.3% White, 25.2% African American, 0.7% Native American, 2.2% Asian, 0.1% Pacific Islander, 1.7% from other races, and 2.0% from two or more races. Hispanic or Latino of any race were 4.3% of the population.
The median household income was $45,945 and the median family income was $54,945. The per capita income was $22,945. About 15.3% of the population was below the poverty line.
Common Questions
What is the Total Population of Houston County?
Total Population of Houston County is 164,117.
What is the Total Male Population of Houston County?
Total Male Population of Houston County is 79,890.
What is the Total Female Population of Houston County?
Total Female Population of Houston County is 84,227.
What is the Ratio of Males per 100 Females in Houston County?
There are 94.85 Males per 100 Females in Houston County.
What is the Ratio of Females per 100 Males in Houston County?
There are 105.43 Females per 100 Males in Houston County.
What is the Median Population Age in Houston County?
Median Population Age in Houston County is 36.1 Years.
What is the Average Family Size in Houston County
Average Family Size in Houston County is 3.2 People.
What is the Average Household Size in Houston County
Average Household Size in Houston County is 2.7 People.
What is Per Capita Income in Houston County?
Per Capita income in Houston County is $35,223.
What is the Median Family Income in Houston County?
Median Family Income in Houston County is $91,406.
What is the Median Household income in Houston County?
Median Household Income in Houston County is $76,968.
What is Income or Wage Gap in Houston County?
Income or Wage Gap in Houston County is 27.8%.
Women in Houston County earn 72.2 cents for every dollar earned by a man.
What is Family Income Deficit in Houston County?
Family Income Deficit in Houston County is $11,224.
Families that are below poverty line in Houston County earn $11,224 less on average than the poverty threshold level.
What is Inequality or Gini Index in Houston County?
Inequality or Gini Index in Houston County is 0.41.
How Large is the Labor Force in Houston County?
There are 83,215 People in the Labor Forcein in Houston County.
What is the Percentage of People in the Labor Force in Houston County?
65.3% of People are in the Labor Force in Houston County.
What is the Unemployment Rate in Houston County?
Unemployment Rate in Houston County is 4.8%.