Dougherty County, GA
Dougherty County Map
Dougherty County Overview
85,038
TOTAL POPULATION
39,219
MALE POPULATION
45,819
FEMALE POPULATION
85.60
MALES / 100 FEMALES
116.83
FEMALES / 100 MALES
36.2
MEDIAN AGE
3.1
AVG FAMILY SIZE
2.4
AVG HOUSEHOLD SIZE
$26,563
PER CAPITA INCOME
$54,050
AVG FAMILY INCOME
$45,640
AVG HOUSEHOLD INCOME
24.4%
WAGE / INCOME GAP [ % ]
75.6¢/ $1
WAGE / INCOME GAP [ $ ]
$12,329
FAMILY INCOME DEFICIT
0.49
INEQUALITY / GINI INDEX
37,547
LABOR FORCE [ PEOPLE ]
56.1%
PERCENT IN LABOR FORCE
10.0%
UNEMPLOYMENT RATE
Dougherty County Area Codes
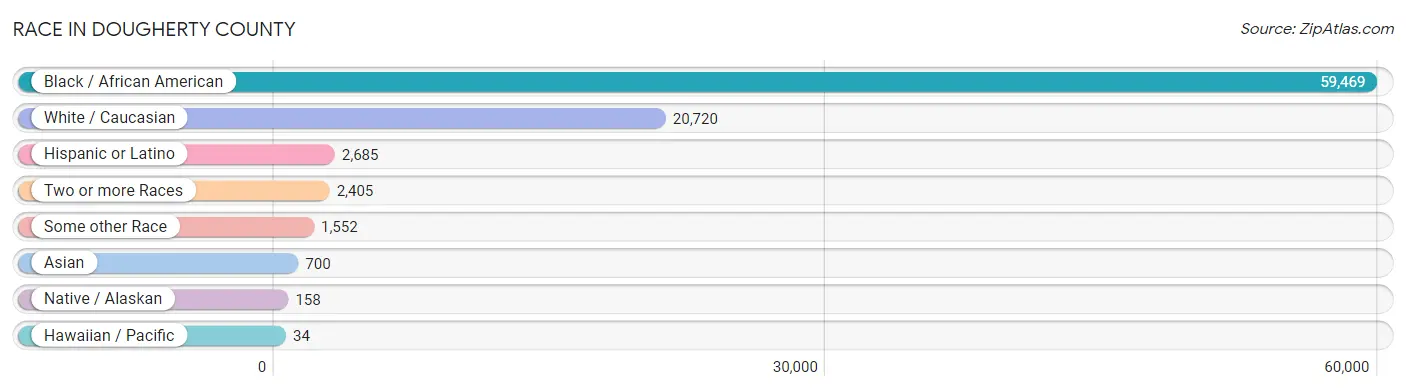
Race in Dougherty County
The most populous races in Dougherty County are Black / African American (59,469 | 69.9%), White / Caucasian (20,720 | 24.4%), and Hispanic or Latino (2,685 | 3.2%).
| Race | # Population | % Population |
| Asian | 700 | 0.8% |
| Black / African American | 59,469 | 69.9% |
| Hawaiian / Pacific | 34 | 0.0% |
| Hispanic or Latino | 2,685 | 3.2% |
| Native / Alaskan | 158 | 0.2% |
| White / Caucasian | 20,720 | 24.4% |
| Two or more Races | 2,405 | 2.8% |
| Some other Race | 1,552 | 1.8% |
| Total | 85,038 | 100.0% |
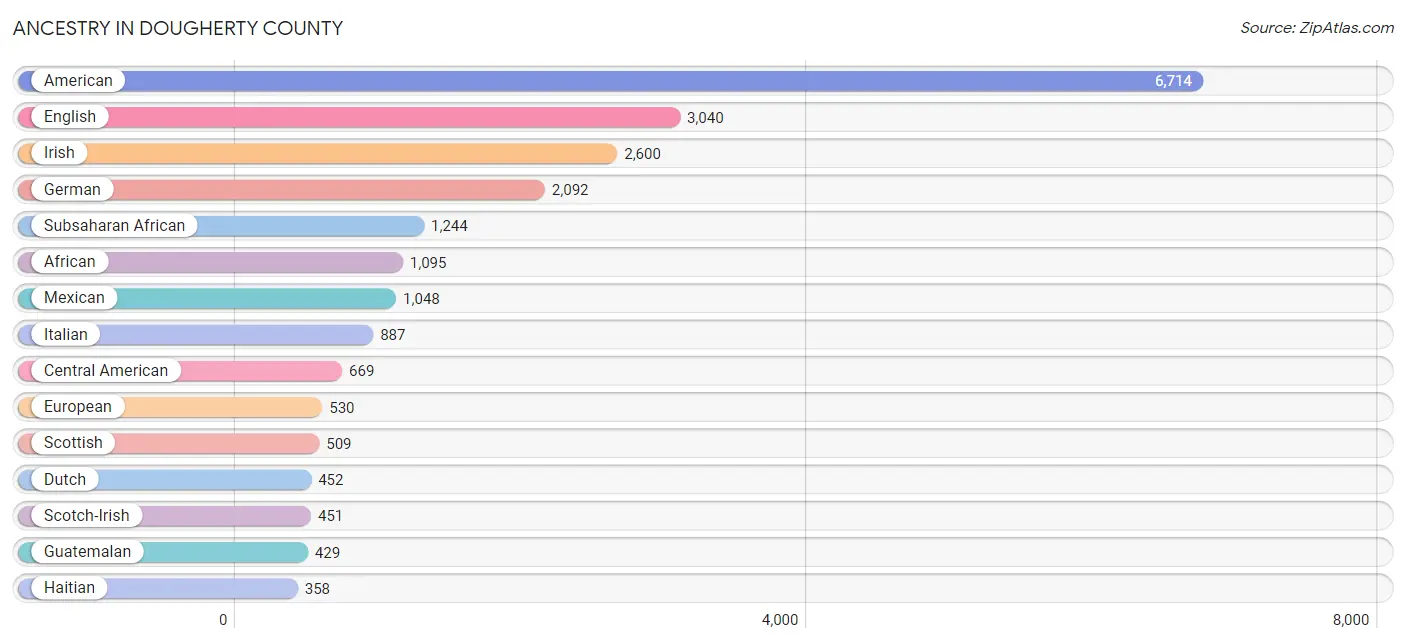
Ancestry in Dougherty County
The most populous ancestries reported in Dougherty County are American (6,714 | 7.9%), English (3,040 | 3.6%), Irish (2,600 | 3.1%), German (2,092 | 2.5%), and Subsaharan African (1,244 | 1.5%), together accounting for 18.4% of all Dougherty County residents.
| Ancestry | # Population | % Population |
| Afghan | 24 | 0.0% |
| African | 1,095 | 1.3% |
| American | 6,714 | 7.9% |
| Arab | 50 | 0.1% |
| Australian | 181 | 0.2% |
| Austrian | 29 | 0.0% |
| Bahamian | 215 | 0.3% |
| Barbadian | 5 | 0.0% |
| Bhutanese | 175 | 0.2% |
| Blackfeet | 20 | 0.0% |
| Brazilian | 37 | 0.0% |
| British | 200 | 0.2% |
| British West Indian | 7 | 0.0% |
| Burmese | 24 | 0.0% |
| Canadian | 6 | 0.0% |
| Central American | 669 | 0.8% |
| Cherokee | 80 | 0.1% |
| Choctaw | 10 | 0.0% |
| Colombian | 9 | 0.0% |
| Creek | 6 | 0.0% |
| Croatian | 29 | 0.0% |
| Cuban | 57 | 0.1% |
| Czech | 136 | 0.2% |
| Czechoslovakian | 5 | 0.0% |
| Danish | 10 | 0.0% |
| Dominican | 317 | 0.4% |
| Dutch | 452 | 0.5% |
| Ecuadorian | 37 | 0.0% |
| Egyptian | 10 | 0.0% |
| English | 3,040 | 3.6% |
| Ethiopian | 7 | 0.0% |
| European | 530 | 0.6% |
| French | 307 | 0.4% |
| French Canadian | 5 | 0.0% |
| German | 2,092 | 2.5% |
| Greek | 58 | 0.1% |
| Guatemalan | 429 | 0.5% |
| Haitian | 358 | 0.4% |
| Honduran | 78 | 0.1% |
| Hungarian | 8 | 0.0% |
| Icelander | 3 | 0.0% |
| Indian (Asian) | 238 | 0.3% |
| Irish | 2,600 | 3.1% |
| Iroquois | 5 | 0.0% |
| Israeli | 76 | 0.1% |
| Italian | 887 | 1.0% |
| Jamaican | 105 | 0.1% |
| Kenyan | 26 | 0.0% |
| Korean | 315 | 0.4% |
| Lebanese | 29 | 0.0% |
| Mexican | 1,048 | 1.2% |
| Mexican American Indian | 30 | 0.0% |
| Native Hawaiian | 44 | 0.1% |
| Navajo | 19 | 0.0% |
| Nicaraguan | 31 | 0.0% |
| Nigerian | 62 | 0.1% |
| Northern European | 9 | 0.0% |
| Norwegian | 81 | 0.1% |
| Pakistani | 35 | 0.0% |
| Panamanian | 44 | 0.1% |
| Peruvian | 2 | 0.0% |
| Polish | 184 | 0.2% |
| Portuguese | 8 | 0.0% |
| Puerto Rican | 216 | 0.3% |
| Russian | 55 | 0.1% |
| Salvadoran | 87 | 0.1% |
| Scandinavian | 69 | 0.1% |
| Scotch-Irish | 451 | 0.5% |
| Scottish | 509 | 0.6% |
| Seminole | 7 | 0.0% |
| Sioux | 4 | 0.0% |
| South American | 135 | 0.2% |
| South American Indian | 26 | 0.0% |
| Spaniard | 146 | 0.2% |
| Spanish | 27 | 0.0% |
| Sri Lankan | 247 | 0.3% |
| Subsaharan African | 1,244 | 1.5% |
| Swedish | 89 | 0.1% |
| Swiss | 21 | 0.0% |
| Trinidadian and Tobagonian | 7 | 0.0% |
| U.S. Virgin Islander | 11 | 0.0% |
| Venezuelan | 87 | 0.1% |
| Welsh | 98 | 0.1% |
| West Indian | 26 | 0.0% |
| Yugoslavian | 9 | 0.0% | View All 85 Rows |
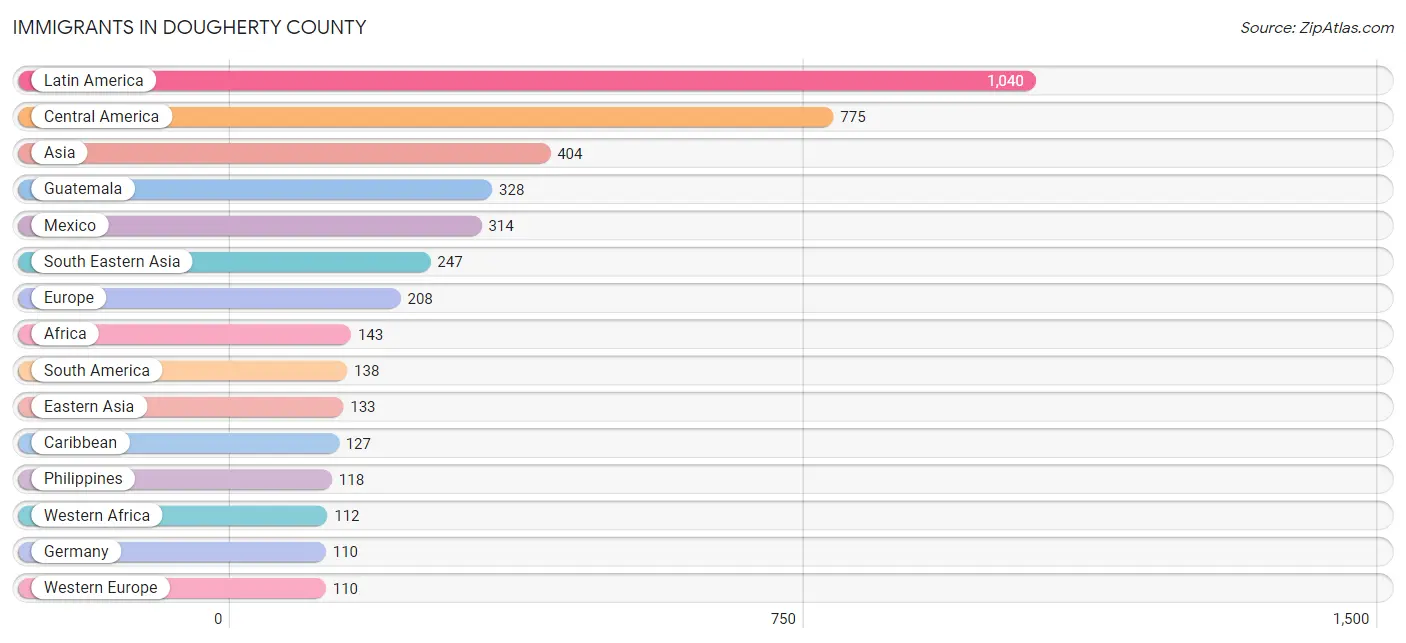
Immigrants in Dougherty County
The most numerous immigrant groups reported in Dougherty County came from Latin America (1,040 | 1.2%), Central America (775 | 0.9%), Asia (404 | 0.5%), Guatemala (328 | 0.4%), and Mexico (314 | 0.4%), together accounting for 3.4% of all Dougherty County residents.
| Immigration Origin | # Population | % Population |
| Afghanistan | 24 | 0.0% |
| Africa | 143 | 0.2% |
| Asia | 404 | 0.5% |
| Australia | 43 | 0.1% |
| Brazil | 37 | 0.0% |
| Canada | 26 | 0.0% |
| Caribbean | 127 | 0.2% |
| Central America | 775 | 0.9% |
| China | 109 | 0.1% |
| Colombia | 17 | 0.0% |
| Cuba | 15 | 0.0% |
| Dominican Republic | 42 | 0.1% |
| Eastern Africa | 31 | 0.0% |
| Eastern Asia | 133 | 0.2% |
| Eastern Europe | 27 | 0.0% |
| Ecuador | 37 | 0.0% |
| El Salvador | 70 | 0.1% |
| England | 35 | 0.0% |
| Ethiopia | 5 | 0.0% |
| Europe | 208 | 0.2% |
| Germany | 110 | 0.1% |
| Ghana | 34 | 0.0% |
| Greece | 13 | 0.0% |
| Guatemala | 328 | 0.4% |
| Haiti | 3 | 0.0% |
| Jamaica | 45 | 0.1% |
| Kenya | 26 | 0.0% |
| Korea | 24 | 0.0% |
| Latin America | 1,040 | 1.2% |
| Liberia | 30 | 0.0% |
| Mexico | 314 | 0.4% |
| Nicaragua | 19 | 0.0% |
| Nigeria | 48 | 0.1% |
| Northern Europe | 58 | 0.1% |
| Oceania | 43 | 0.1% |
| Panama | 44 | 0.1% |
| Peru | 32 | 0.0% |
| Philippines | 118 | 0.1% |
| Russia | 27 | 0.0% |
| South America | 138 | 0.2% |
| South Central Asia | 24 | 0.0% |
| South Eastern Asia | 247 | 0.3% |
| Southern Europe | 13 | 0.0% |
| Taiwan | 4 | 0.0% |
| Thailand | 35 | 0.0% |
| Trinidad and Tobago | 22 | 0.0% |
| Vietnam | 94 | 0.1% |
| Western Africa | 112 | 0.1% |
| Western Europe | 110 | 0.1% | View All 49 Rows |
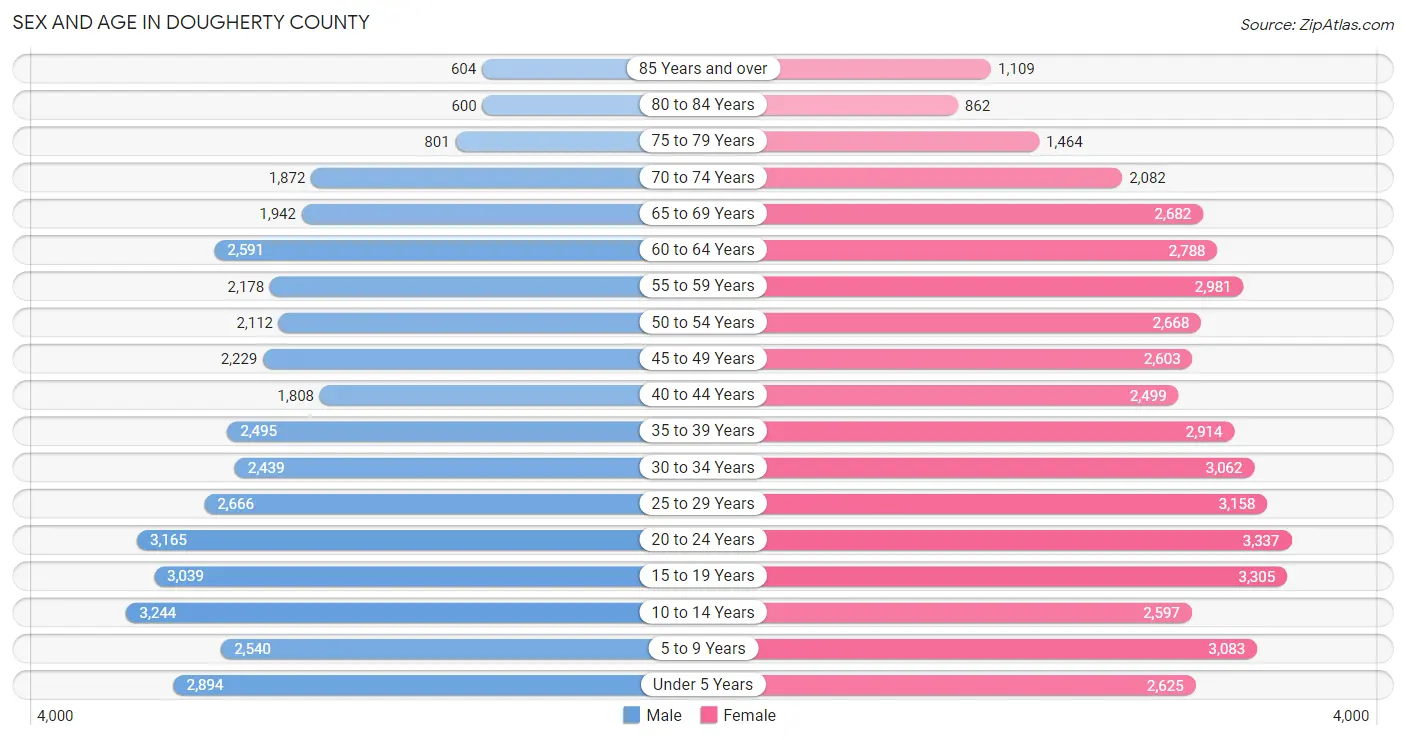
Sex and Age in Dougherty County
Sex and Age in Dougherty County
The most populous age groups in Dougherty County are 10 to 14 Years (3,244 | 8.3%) for men and 20 to 24 Years (3,337 | 7.3%) for women.
| Age Bracket | Male | Female |
| Under 5 Years | 2,894 (7.4%) | 2,625 (5.7%) |
| 5 to 9 Years | 2,540 (6.5%) | 3,083 (6.7%) |
| 10 to 14 Years | 3,244 (8.3%) | 2,597 (5.7%) |
| 15 to 19 Years | 3,039 (7.7%) | 3,305 (7.2%) |
| 20 to 24 Years | 3,165 (8.1%) | 3,337 (7.3%) |
| 25 to 29 Years | 2,666 (6.8%) | 3,158 (6.9%) |
| 30 to 34 Years | 2,439 (6.2%) | 3,062 (6.7%) |
| 35 to 39 Years | 2,495 (6.4%) | 2,914 (6.4%) |
| 40 to 44 Years | 1,808 (4.6%) | 2,499 (5.4%) |
| 45 to 49 Years | 2,229 (5.7%) | 2,603 (5.7%) |
| 50 to 54 Years | 2,112 (5.4%) | 2,668 (5.8%) |
| 55 to 59 Years | 2,178 (5.6%) | 2,981 (6.5%) |
| 60 to 64 Years | 2,591 (6.6%) | 2,788 (6.1%) |
| 65 to 69 Years | 1,942 (5.0%) | 2,682 (5.9%) |
| 70 to 74 Years | 1,872 (4.8%) | 2,082 (4.5%) |
| 75 to 79 Years | 801 (2.0%) | 1,464 (3.2%) |
| 80 to 84 Years | 600 (1.5%) | 862 (1.9%) |
| 85 Years and over | 604 (1.5%) | 1,109 (2.4%) |
| Total | 39,219 (100.0%) | 45,819 (100.0%) |
Families and Households in Dougherty County
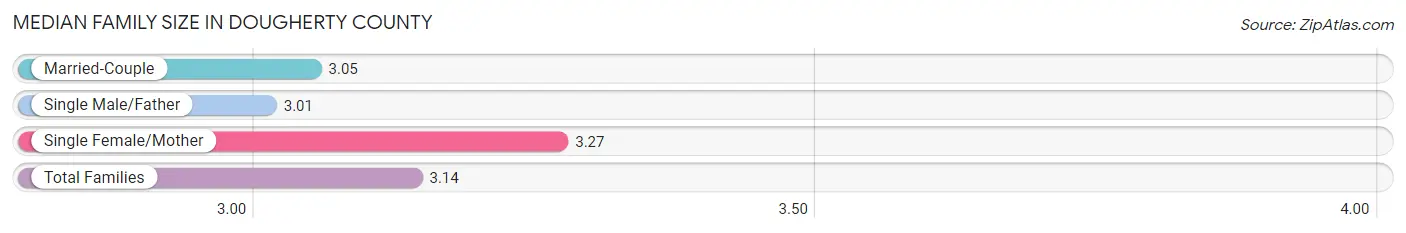
Median Family Size in Dougherty County
The median family size in Dougherty County is 3.14 persons per family, with single female/mother families (8,317 | 42.4%) accounting for the largest median family size of 3.27 persons per family. On the other hand, single male/father families (1,741 | 8.9%) represent the smallest median family size with 3.01 persons per family.
| Family Type | # Families | Family Size |
| Married-Couple | 9,558 (48.7%) | 3.05 |
| Single Male/Father | 1,741 (8.9%) | 3.01 |
| Single Female/Mother | 8,317 (42.4%) | 3.27 |
| Total Families | 19,616 (100.0%) | 3.14 |
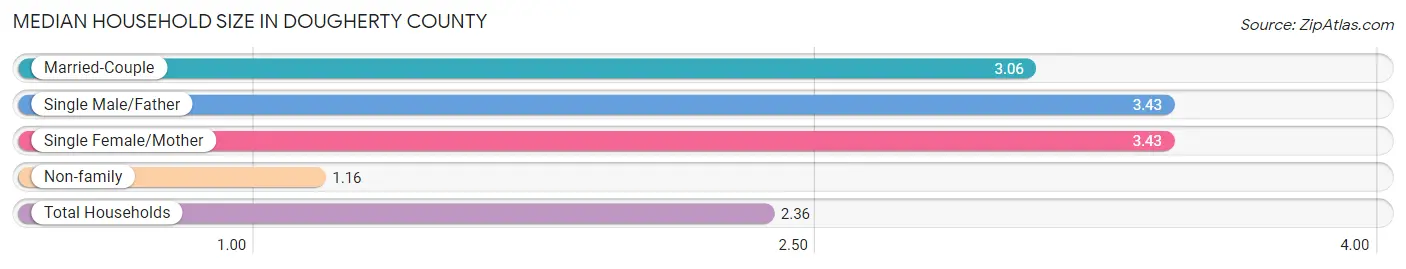
Median Household Size in Dougherty County
The median household size in Dougherty County is 2.36 persons per household, with single male/father households (1,741 | 5.1%) accounting for the largest median household size of 3.43 persons per household. non-family households (14,425 | 42.4%) represent the smallest median household size with 1.16 persons per household.
| Household Type | # Households | Household Size |
| Married-Couple | 9,558 (28.1%) | 3.06 |
| Single Male/Father | 1,741 (5.1%) | 3.43 |
| Single Female/Mother | 8,317 (24.4%) | 3.43 |
| Non-family | 14,425 (42.4%) | 1.16 |
| Total Households | 34,041 (100.0%) | 2.36 |
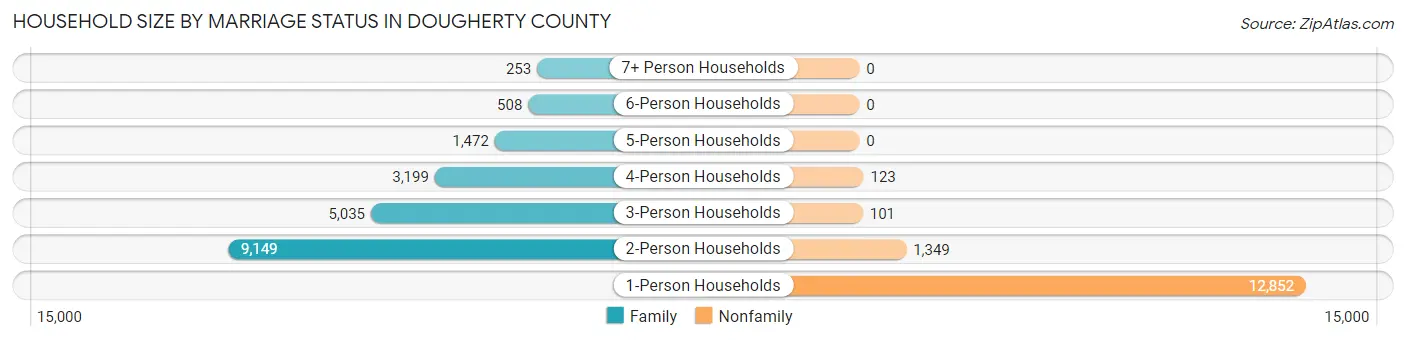
Household Size by Marriage Status in Dougherty County
Out of a total of 34,041 households in Dougherty County, 19,616 (57.6%) are family households, while 14,425 (42.4%) are nonfamily households. The most numerous type of family households are 2-person households, comprising 9,149, and the most common type of nonfamily households are 1-person households, comprising 12,852.
| Household Size | Family Households | Nonfamily Households |
| 1-Person Households | - | 12,852 (37.8%) |
| 2-Person Households | 9,149 (26.9%) | 1,349 (4.0%) |
| 3-Person Households | 5,035 (14.8%) | 101 (0.3%) |
| 4-Person Households | 3,199 (9.4%) | 123 (0.4%) |
| 5-Person Households | 1,472 (4.3%) | 0 (0.0%) |
| 6-Person Households | 508 (1.5%) | 0 (0.0%) |
| 7+ Person Households | 253 (0.7%) | 0 (0.0%) |
| Total | 19,616 (57.6%) | 14,425 (42.4%) |
Female Fertility in Dougherty County
Fertility by Age in Dougherty County
Average fertility rate in Dougherty County is 62.0 births per 1,000 women. Women in the age bracket of 20 to 34 years have the highest fertility rate with 113.0 births per 1,000 women. Women in the age bracket of 20 to 34 years acount for 81.7% of all women with births.
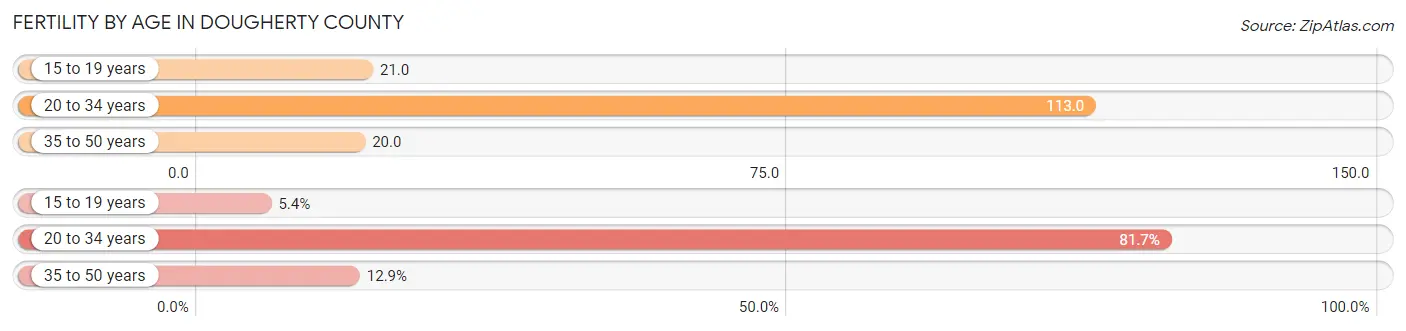
| Age Bracket | Women with Births | Births / 1,000 Women |
| 15 to 19 years | 71 (5.4%) | 21.0 |
| 20 to 34 years | 1,079 (81.7%) | 113.0 |
| 35 to 50 years | 170 (12.9%) | 20.0 |
| Total | 1,320 (100.0%) | 62.0 |
Fertility by Age by Marriage Status in Dougherty County
34.6% of women with births (1,320) in Dougherty County are married. The highest percentage of unmarried women with births falls into 15 to 19 years age bracket with 100.0% of them unmarried at the time of birth, while the lowest percentage of unmarried women with births belong to 20 to 34 years age bracket with 61.6% of them unmarried.
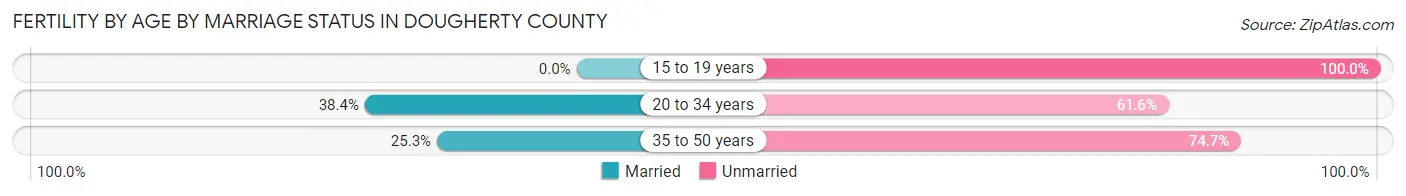
| Age Bracket | Married | Unmarried |
| 15 to 19 years | 0 (0.0%) | 71 (100.0%) |
| 20 to 34 years | 414 (38.4%) | 665 (61.6%) |
| 35 to 50 years | 43 (25.3%) | 127 (74.7%) |
| Total | 457 (34.6%) | 863 (65.4%) |
Fertility by Education in Dougherty County
Average fertility rate in Dougherty County is 62.0 births per 1,000 women. Women with the education attainment of high school diploma have the highest fertility rate of 91.0 births per 1,000 women, while women with the education attainment of less than high school have the lowest fertility at 23.0 births per 1,000 women. Women with the education attainment of college or associate's degree represent 36.6% of all women with births.
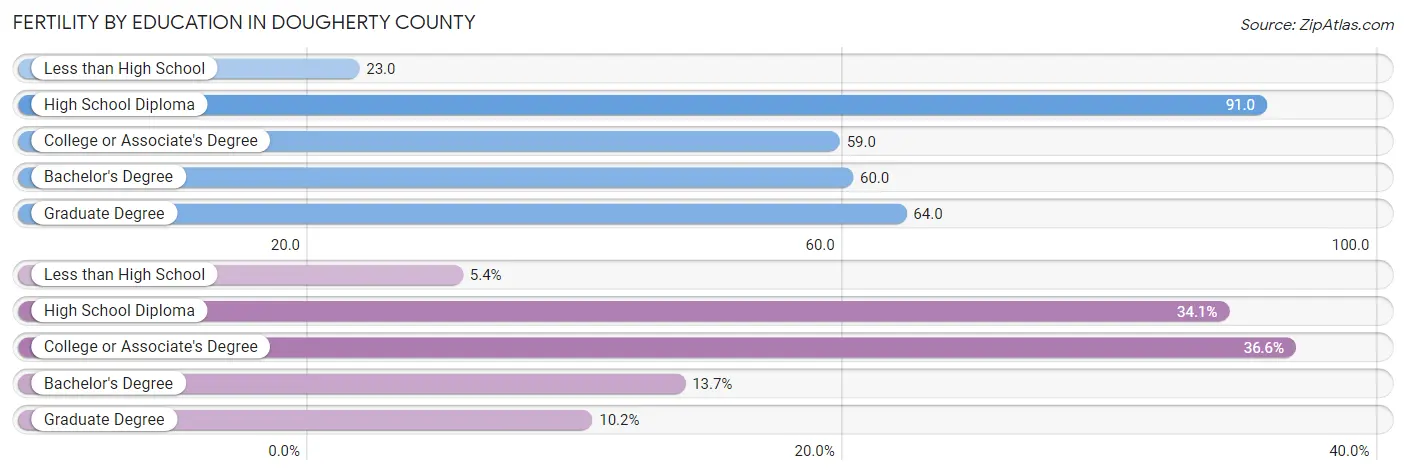
| Educational Attainment | Women with Births | Births / 1,000 Women |
| Less than High School | 71 (5.4%) | 23.0 |
| High School Diploma | 450 (34.1%) | 91.0 |
| College or Associate's Degree | 483 (36.6%) | 59.0 |
| Bachelor's Degree | 181 (13.7%) | 60.0 |
| Graduate Degree | 135 (10.2%) | 64.0 |
| Total | 1,320 (100.0%) | 62.0 |
Fertility by Education by Marriage Status in Dougherty County
65.4% of women with births in Dougherty County are unmarried. Women with the educational attainment of graduate degree are most likely to be married with 100.0% of them married at childbirth, while women with the educational attainment of college or associate's degree are least likely to be married with 77.0% of them unmarried at childbirth.
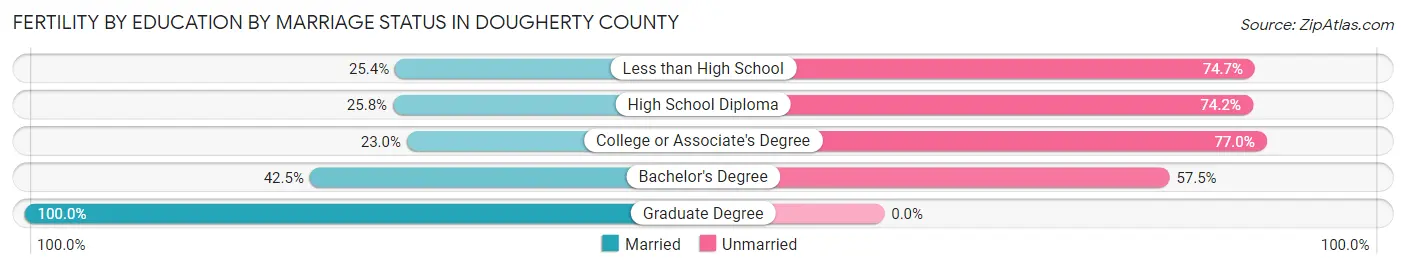
| Educational Attainment | Married | Unmarried |
| Less than High School | 18 (25.4%) | 53 (74.7%) |
| High School Diploma | 116 (25.8%) | 334 (74.2%) |
| College or Associate's Degree | 111 (23.0%) | 372 (77.0%) |
| Bachelor's Degree | 77 (42.5%) | 104 (57.5%) |
| Graduate Degree | 135 (100.0%) | 0 (0.0%) |
| Total | 457 (34.6%) | 863 (65.4%) |
Income in Dougherty County
Income Overview in Dougherty County
Per Capita Income in Dougherty County is $26,563, while median incomes of families and households are $54,050 and $45,640 respectively.
| Characteristic | Number | Measure |
| Per Capita Income | 85,038 | $26,563 |
| Median Family Income | 19,616 | $54,050 |
| Mean Family Income | 19,616 | $75,824 |
| Median Household Income | 34,041 | $45,640 |
| Mean Household Income | 34,041 | $62,407 |
| Income Deficit | 19,616 | $12,329 |
| Wage / Income Gap (%) | 85,038 | 24.35% |
| Wage / Income Gap ($) | 85,038 | 75.65¢ per $1 |
| Gini / Inequality Index | 85,038 | 0.49 |
Earnings by Sex in Dougherty County
Average Earnings in Dougherty County are $31,403, $37,287 for men and $28,207 for women, a difference of 24.3%.
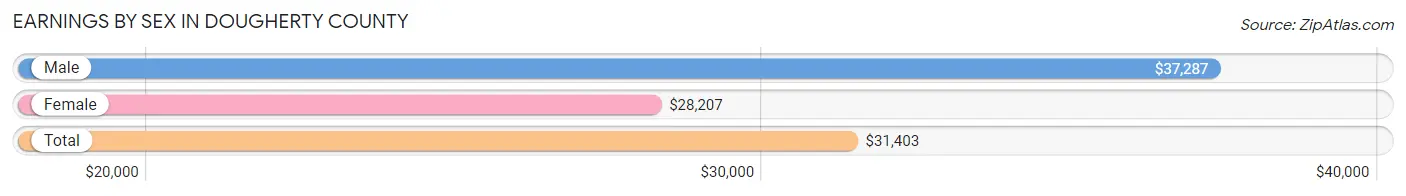
| Sex | Number | Average Earnings |
| Male | 17,536 (45.1%) | $37,287 |
| Female | 21,310 (54.9%) | $28,207 |
| Total | 38,846 (100.0%) | $31,403 |
Earnings by Sex by Income Bracket in Dougherty County
The most common earnings brackets in Dougherty County are $100,000+ for men (1,709 | 9.8%) and $25,000 to $29,999 for women (2,160 | 10.1%).
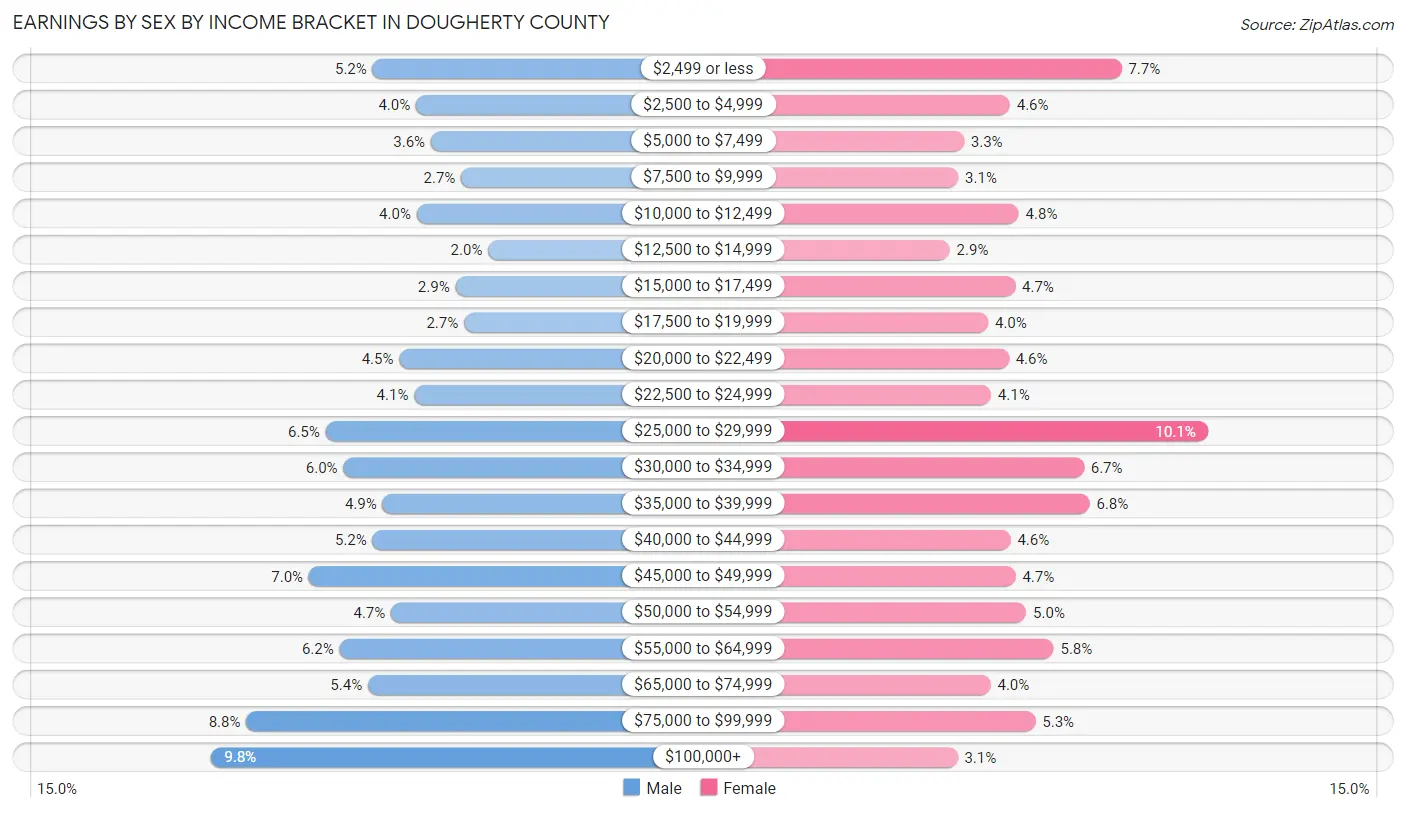
| Income | Male | Female |
| $2,499 or less | 915 (5.2%) | 1,646 (7.7%) |
| $2,500 to $4,999 | 701 (4.0%) | 976 (4.6%) |
| $5,000 to $7,499 | 627 (3.6%) | 701 (3.3%) |
| $7,500 to $9,999 | 479 (2.7%) | 666 (3.1%) |
| $10,000 to $12,499 | 698 (4.0%) | 1,030 (4.8%) |
| $12,500 to $14,999 | 345 (2.0%) | 615 (2.9%) |
| $15,000 to $17,499 | 507 (2.9%) | 1,009 (4.7%) |
| $17,500 to $19,999 | 464 (2.6%) | 846 (4.0%) |
| $20,000 to $22,499 | 784 (4.5%) | 969 (4.5%) |
| $22,500 to $24,999 | 710 (4.1%) | 862 (4.1%) |
| $25,000 to $29,999 | 1,146 (6.5%) | 2,160 (10.1%) |
| $30,000 to $34,999 | 1,059 (6.0%) | 1,420 (6.7%) |
| $35,000 to $39,999 | 867 (4.9%) | 1,454 (6.8%) |
| $40,000 to $44,999 | 916 (5.2%) | 981 (4.6%) |
| $45,000 to $49,999 | 1,229 (7.0%) | 1,011 (4.7%) |
| $50,000 to $54,999 | 825 (4.7%) | 1,074 (5.0%) |
| $55,000 to $64,999 | 1,079 (6.1%) | 1,238 (5.8%) |
| $65,000 to $74,999 | 938 (5.3%) | 860 (4.0%) |
| $75,000 to $99,999 | 1,538 (8.8%) | 1,130 (5.3%) |
| $100,000+ | 1,709 (9.8%) | 662 (3.1%) |
| Total | 17,536 (100.0%) | 21,310 (100.0%) |
Earnings by Sex by Educational Attainment in Dougherty County
Average earnings in Dougherty County are $43,143 for men and $32,539 for women, a difference of 24.6%. Men with an educational attainment of graduate degree enjoy the highest average annual earnings of $81,809, while those with less than high school education earn the least with $31,676. Women with an educational attainment of graduate degree earn the most with the average annual earnings of $60,370, while those with less than high school education have the smallest earnings of $18,451.
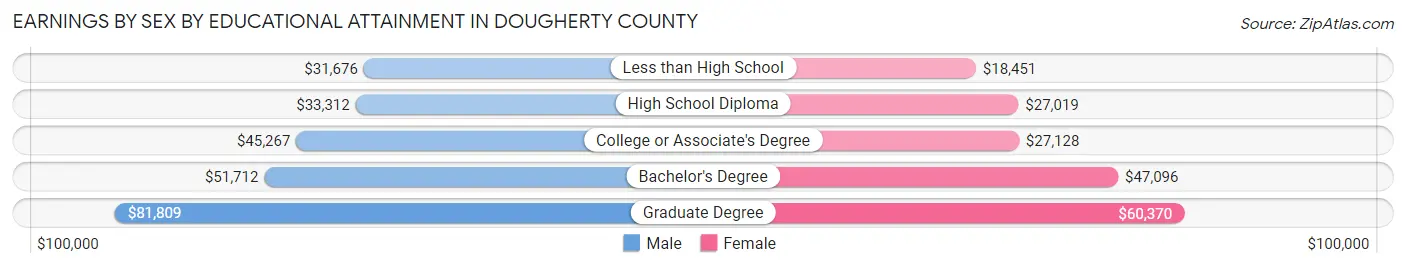
| Educational Attainment | Male Income | Female Income |
| Less than High School | $31,676 | $18,451 |
| High School Diploma | $33,312 | $27,019 |
| College or Associate's Degree | $45,267 | $27,128 |
| Bachelor's Degree | $51,712 | $47,096 |
| Graduate Degree | $81,809 | $60,370 |
| Total | $43,143 | $32,539 |
Family Income in Dougherty County
Family Income Brackets in Dougherty County
According to the Dougherty County family income data, there are 3,531 families falling into the $50,000 to $74,999 income range, which is the most common income bracket and makes up 18.0% of all families. Conversely, the $150,000 to $199,999 income bracket is the least frequent group with only 843 families (4.3%) belonging to this category.
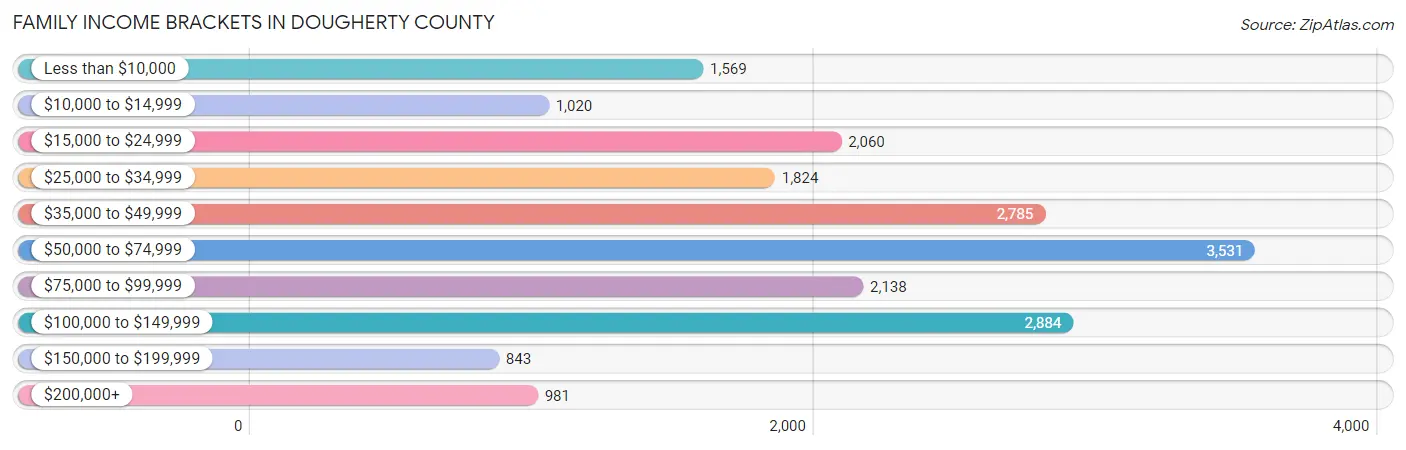
| Income Bracket | # Families | % Families |
| Less than $10,000 | 1,569 | 8.0% |
| $10,000 to $14,999 | 1,020 | 5.2% |
| $15,000 to $24,999 | 2,060 | 10.5% |
| $25,000 to $34,999 | 1,824 | 9.3% |
| $35,000 to $49,999 | 2,785 | 14.2% |
| $50,000 to $74,999 | 3,531 | 18.0% |
| $75,000 to $99,999 | 2,138 | 10.9% |
| $100,000 to $149,999 | 2,884 | 14.7% |
| $150,000 to $199,999 | 843 | 4.3% |
| $200,000+ | 981 | 5.0% |
Family Income by Famaliy Size in Dougherty County
7+ person families (209 | 1.1%) account for the highest median family income in Dougherty County with $71,528 per family, while 2-person families (9,985 | 50.9%) have the highest median income of $27,704 per family member.
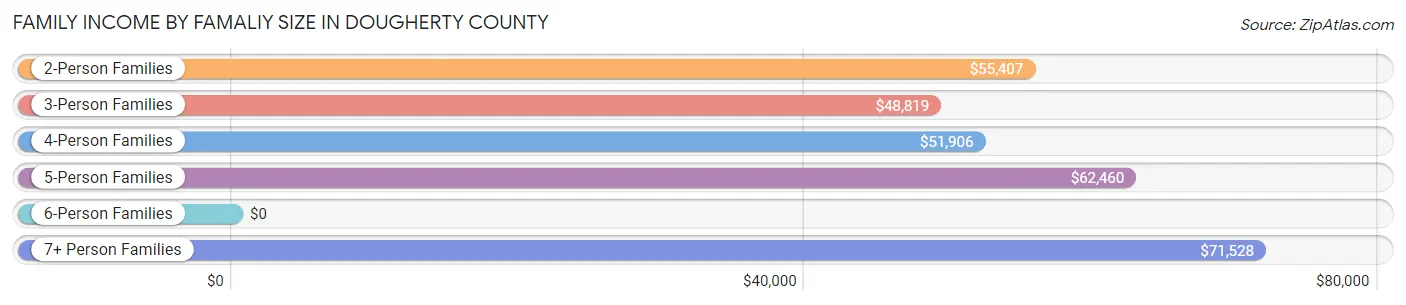
| Income Bracket | # Families | Median Income |
| 2-Person Families | 9,985 (50.9%) | $55,407 |
| 3-Person Families | 4,796 (24.4%) | $48,819 |
| 4-Person Families | 2,790 (14.2%) | $51,906 |
| 5-Person Families | 1,419 (7.2%) | $62,460 |
| 6-Person Families | 417 (2.1%) | $0 |
| 7+ Person Families | 209 (1.1%) | $71,528 |
| Total | 19,616 (100.0%) | $54,050 |
Family Income by Number of Earners in Dougherty County
The median family income in Dougherty County is $54,050, with families comprising 3+ earners (1,074) having the highest median family income of $106,842, while families with no earners (3,899) have the lowest median family income of $26,853, accounting for 5.5% and 19.9% of families, respectively.
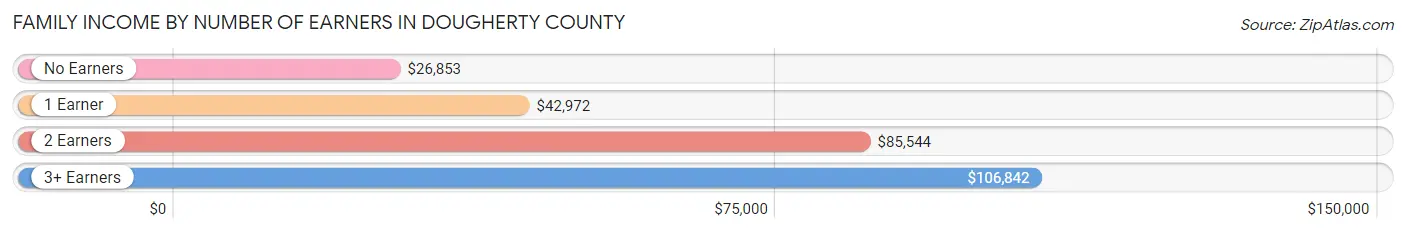
| Number of Earners | # Families | Median Income |
| No Earners | 3,899 (19.9%) | $26,853 |
| 1 Earner | 8,455 (43.1%) | $42,972 |
| 2 Earners | 6,188 (31.6%) | $85,544 |
| 3+ Earners | 1,074 (5.5%) | $106,842 |
| Total | 19,616 (100.0%) | $54,050 |
Household Income in Dougherty County
Household Income Brackets in Dougherty County
With 5,991 households falling in the category, the $50,000 to $74,999 income range is the most frequent in Dougherty County, accounting for 17.6% of all households. In contrast, only 1,055 households (3.1%) fall into the $200,000+ income bracket, making it the least populous group.
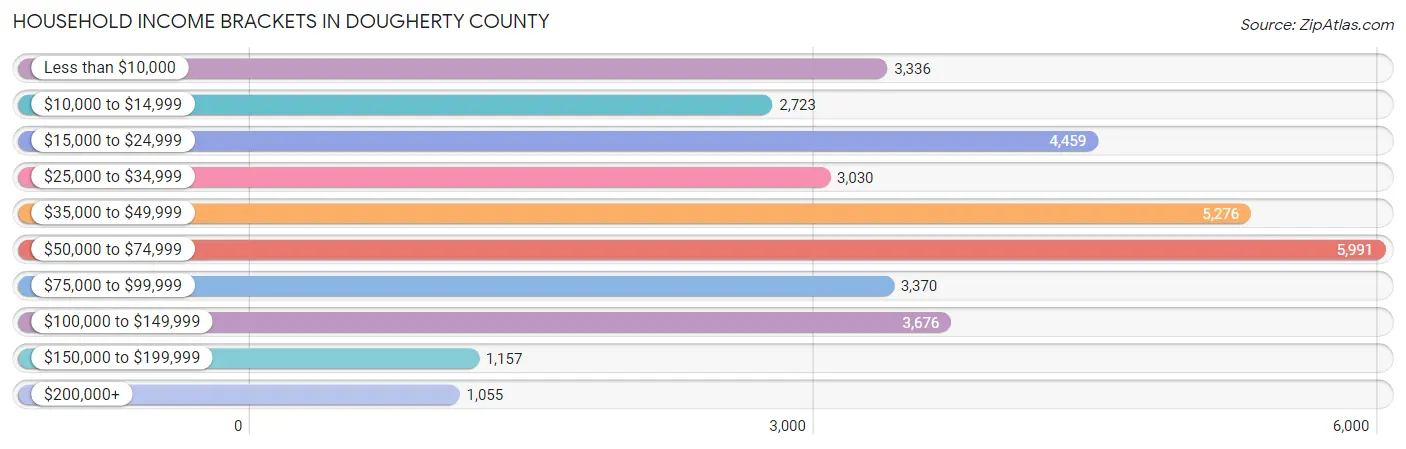
| Income Bracket | # Households | % Households |
| Less than $10,000 | 3,336 | 9.8% |
| $10,000 to $14,999 | 2,723 | 8.0% |
| $15,000 to $24,999 | 4,459 | 13.1% |
| $25,000 to $34,999 | 3,030 | 8.9% |
| $35,000 to $49,999 | 5,276 | 15.5% |
| $50,000 to $74,999 | 5,991 | 17.6% |
| $75,000 to $99,999 | 3,370 | 9.9% |
| $100,000 to $149,999 | 3,676 | 10.8% |
| $150,000 to $199,999 | 1,157 | 3.4% |
| $200,000+ | 1,055 | 3.1% |
Household Income by Householder Age in Dougherty County
The median household income in Dougherty County is $45,640, with the highest median household income of $50,193 found in the 45 to 64 years age bracket for the primary householder. A total of 12,273 households (36.0%) fall into this category. Meanwhile, the 15 to 24 years age bracket for the primary householder has the lowest median household income of $24,478, with 1,825 households (5.4%) in this group.
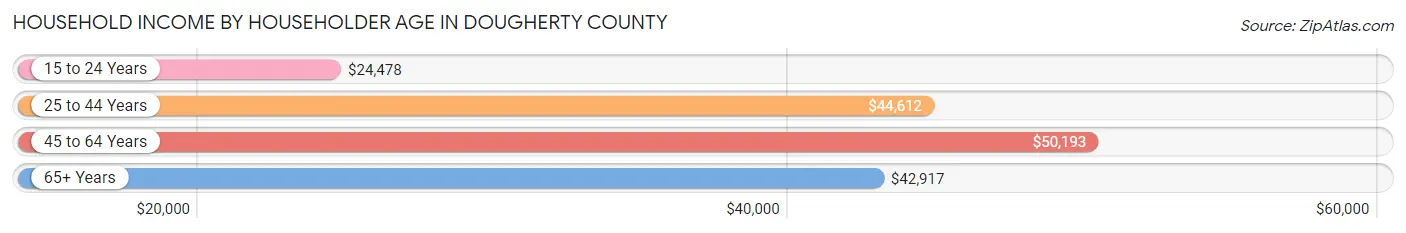
| Income Bracket | # Households | Median Income |
| 15 to 24 Years | 1,825 (5.4%) | $24,478 |
| 25 to 44 Years | 10,724 (31.5%) | $44,612 |
| 45 to 64 Years | 12,273 (36.0%) | $50,193 |
| 65+ Years | 9,219 (27.1%) | $42,917 |
| Total | 34,041 (100.0%) | $45,640 |
Poverty in Dougherty County
Income Below Poverty by Sex and Age in Dougherty County
With 25.3% poverty level for males and 27.3% for females among the residents of Dougherty County, 5 year old males and 5 year old females are the most vulnerable to poverty, with 220 males (49.0%) and 241 females (49.4%) in their respective age groups living below the poverty level.
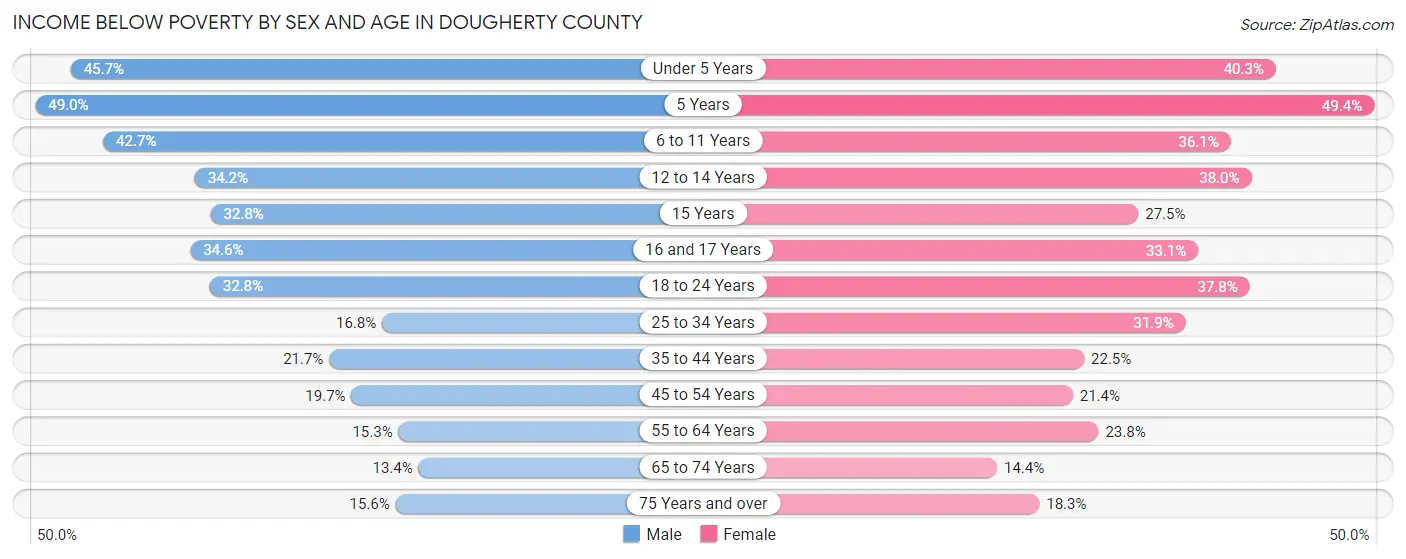
| Age Bracket | Male | Female |
| Under 5 Years | 1,307 (45.7%) | 1,051 (40.3%) |
| 5 Years | 220 (49.0%) | 241 (49.4%) |
| 6 to 11 Years | 1,504 (42.7%) | 1,329 (36.1%) |
| 12 to 14 Years | 620 (34.2%) | 556 (38.0%) |
| 15 Years | 167 (32.8%) | 169 (27.5%) |
| 16 and 17 Years | 417 (34.6%) | 340 (33.1%) |
| 18 to 24 Years | 1,124 (32.8%) | 1,449 (37.8%) |
| 25 to 34 Years | 791 (16.8%) | 1,966 (31.9%) |
| 35 to 44 Years | 894 (21.7%) | 1,209 (22.5%) |
| 45 to 54 Years | 836 (19.7%) | 1,130 (21.4%) |
| 55 to 64 Years | 717 (15.3%) | 1,370 (23.8%) |
| 65 to 74 Years | 510 (13.4%) | 674 (14.4%) |
| 75 Years and over | 292 (15.6%) | 610 (18.3%) |
| Total | 9,399 (25.3%) | 12,094 (27.3%) |
Income Above Poverty by Sex and Age in Dougherty County
According to the poverty statistics in Dougherty County, males aged 65 to 74 years and females aged 65 to 74 years are the age groups that are most secure financially, with 86.6% of males and 85.6% of females in these age groups living above the poverty line.
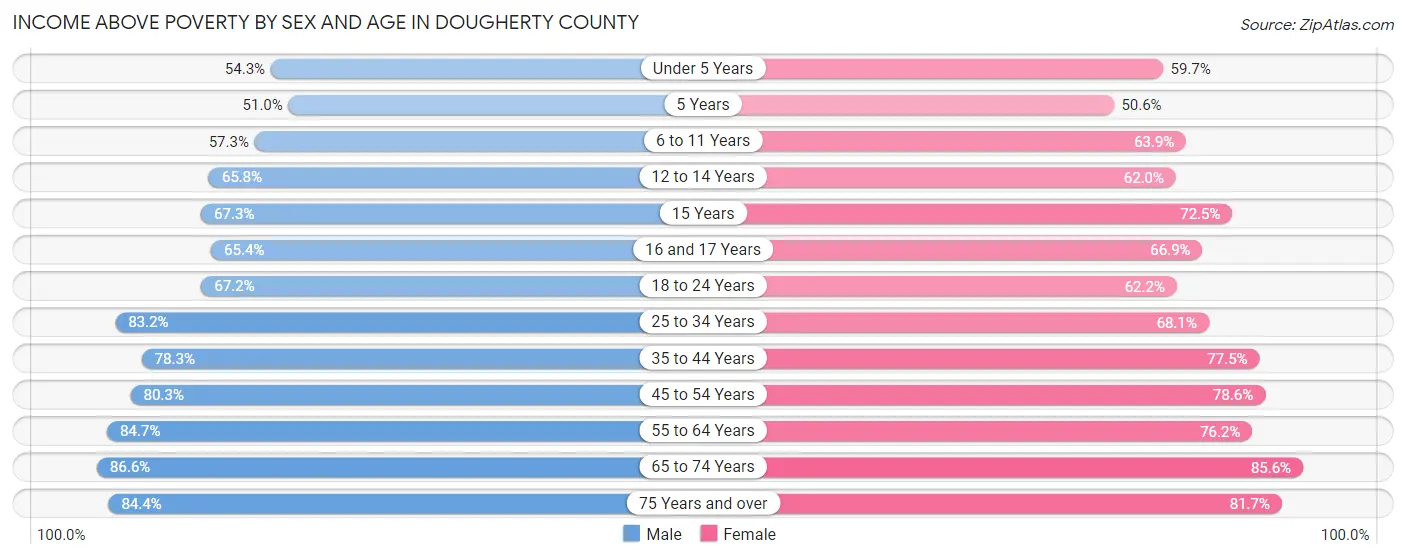
| Age Bracket | Male | Female |
| Under 5 Years | 1,552 (54.3%) | 1,559 (59.7%) |
| 5 Years | 229 (51.0%) | 247 (50.6%) |
| 6 to 11 Years | 2,017 (57.3%) | 2,354 (63.9%) |
| 12 to 14 Years | 1,193 (65.8%) | 907 (62.0%) |
| 15 Years | 343 (67.2%) | 445 (72.5%) |
| 16 and 17 Years | 787 (65.4%) | 688 (66.9%) |
| 18 to 24 Years | 2,302 (67.2%) | 2,380 (62.2%) |
| 25 to 34 Years | 3,913 (83.2%) | 4,197 (68.1%) |
| 35 to 44 Years | 3,221 (78.3%) | 4,166 (77.5%) |
| 45 to 54 Years | 3,415 (80.3%) | 4,141 (78.6%) |
| 55 to 64 Years | 3,970 (84.7%) | 4,381 (76.2%) |
| 65 to 74 Years | 3,288 (86.6%) | 4,003 (85.6%) |
| 75 Years and over | 1,584 (84.4%) | 2,718 (81.7%) |
| Total | 27,814 (74.7%) | 32,186 (72.7%) |
Income Below Poverty Among Married-Couple Families in Dougherty County
The poverty statistics for married-couple families in Dougherty County show that 7.6% or 731 of the total 9,558 families live below the poverty line. Families with 3 or 4 children have the highest poverty rate of 26.0%, comprising of 203 families. On the other hand, families with 5 or more children have the lowest poverty rate of 0.0%, which includes 0 families.
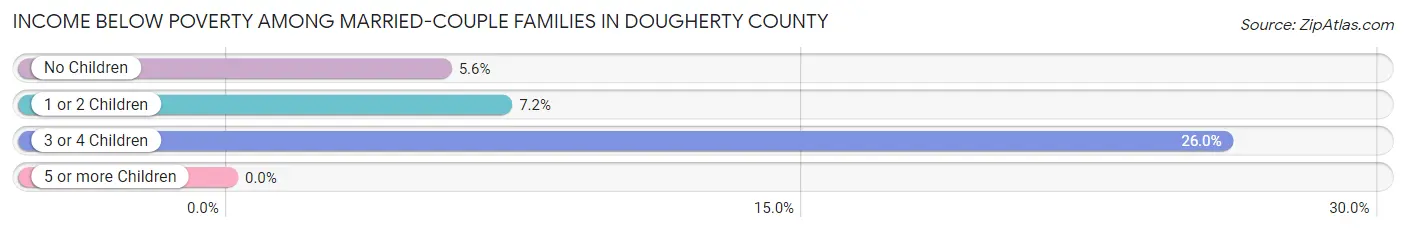
| Children | Above Poverty | Below Poverty |
| No Children | 5,919 (94.4%) | 350 (5.6%) |
| 1 or 2 Children | 2,309 (92.8%) | 178 (7.2%) |
| 3 or 4 Children | 578 (74.0%) | 203 (26.0%) |
| 5 or more Children | 21 (100.0%) | 0 (0.0%) |
| Total | 8,827 (92.3%) | 731 (7.6%) |
Income Below Poverty Among Single-Parent Households in Dougherty County
According to the poverty data in Dougherty County, 28.8% or 501 single-father households and 35.1% or 2,923 single-mother households are living below the poverty line. Among single-father households, those with 5 or more children have the highest poverty rate, with 14 households (100.0%) experiencing poverty. Likewise, among single-mother households, those with 3 or 4 children have the highest poverty rate, with 674 households (79.8%) falling below the poverty line.
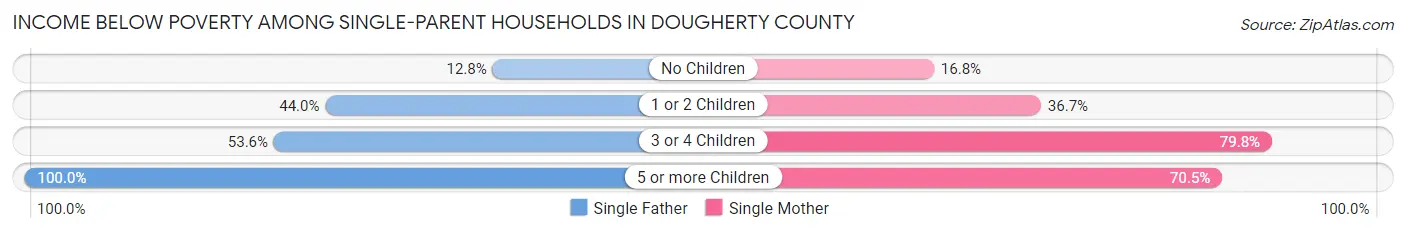
| Children | Single Father | Single Mother |
| No Children | 119 (12.8%) | 436 (16.8%) |
| 1 or 2 Children | 278 (44.0%) | 1,770 (36.7%) |
| 3 or 4 Children | 90 (53.6%) | 674 (79.8%) |
| 5 or more Children | 14 (100.0%) | 43 (70.5%) |
| Total | 501 (28.8%) | 2,923 (35.1%) |
Income Below Poverty Among Married-Couple vs Single-Parent Households in Dougherty County
The poverty data for Dougherty County shows that 731 of the married-couple family households (7.6%) and 3,424 of the single-parent households (34.0%) are living below the poverty level. Within the married-couple family households, those with 3 or 4 children have the highest poverty rate, with 203 households (26.0%) falling below the poverty line. Among the single-parent households, those with 5 or more children have the highest poverty rate, with 57 household (76.0%) living below poverty.
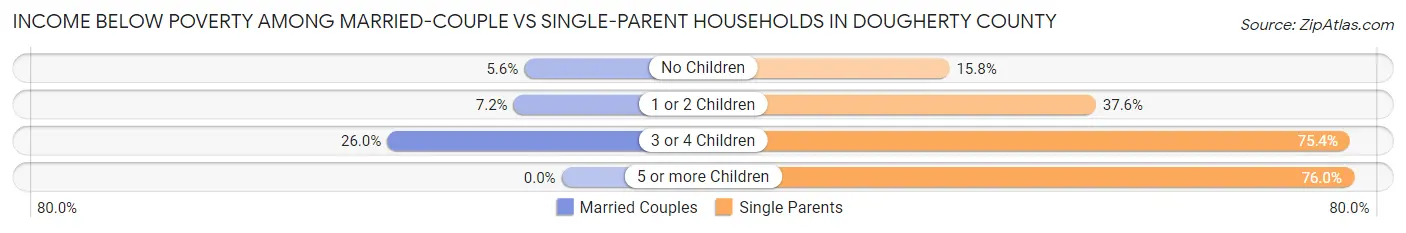
| Children | Married-Couple Families | Single-Parent Households |
| No Children | 350 (5.6%) | 555 (15.8%) |
| 1 or 2 Children | 178 (7.2%) | 2,048 (37.6%) |
| 3 or 4 Children | 203 (26.0%) | 764 (75.4%) |
| 5 or more Children | 0 (0.0%) | 57 (76.0%) |
| Total | 731 (7.6%) | 3,424 (34.0%) |
Employment Characteristics in Dougherty County
Employment by Class of Employer in Dougherty County
Among the 32,937 employed individuals in Dougherty County, private company employees (20,232 | 61.4%), not-for-profit organizations (3,329 | 10.1%), and local government employees (2,597 | 7.9%) make up the most common classes of employment.
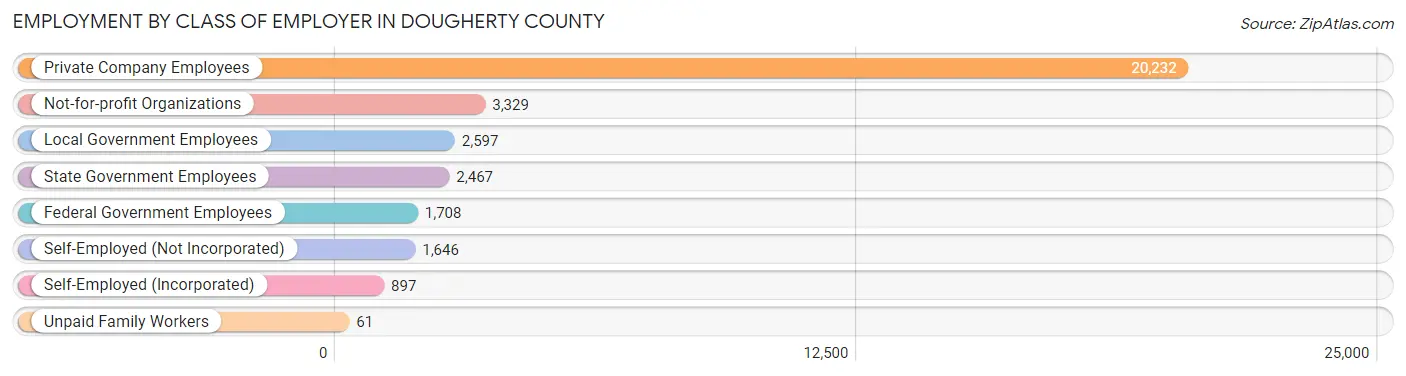
| Employer Class | # Employees | % Employees |
| Private Company Employees | 20,232 | 61.4% |
| Self-Employed (Incorporated) | 897 | 2.7% |
| Self-Employed (Not Incorporated) | 1,646 | 5.0% |
| Not-for-profit Organizations | 3,329 | 10.1% |
| Local Government Employees | 2,597 | 7.9% |
| State Government Employees | 2,467 | 7.5% |
| Federal Government Employees | 1,708 | 5.2% |
| Unpaid Family Workers | 61 | 0.2% |
| Total | 32,937 | 100.0% |
Employment Status by Age in Dougherty County
According to the labor force statistics for Dougherty County, out of the total population over 16 years of age (66,929), 56.1% or 37,547 individuals are in the labor force, with 10.0% or 3,755 of them unemployed. The age group with the highest labor force participation rate is 35 to 44 years, with 78.9% or 7,666 individuals in the labor force. Within the labor force, the 16 to 19 years age range has the highest percentage of unemployed individuals, with 37.2% or 540 of them being unemployed.
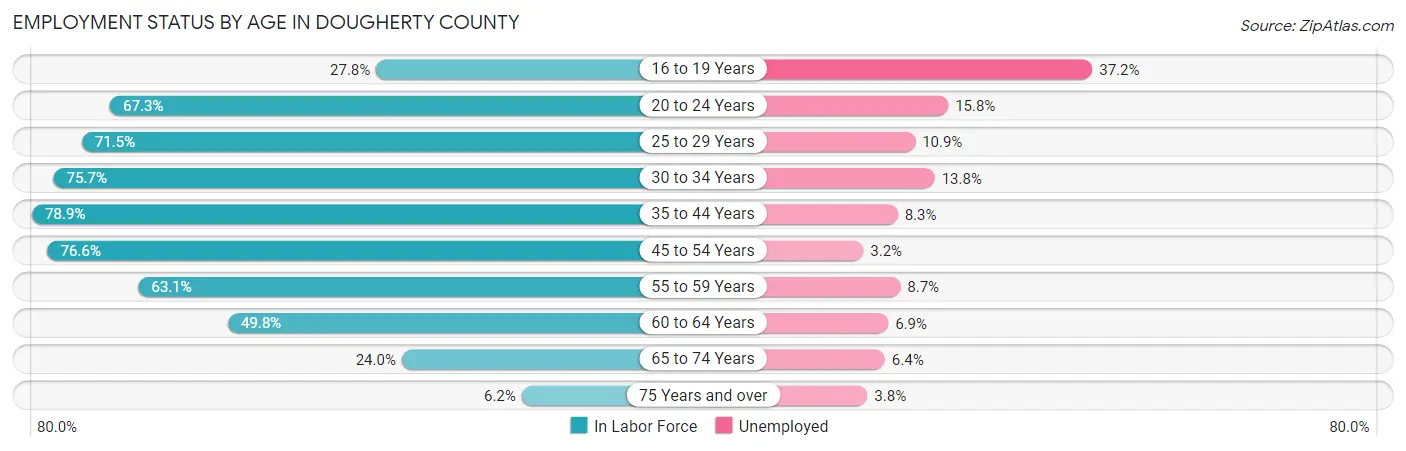
| Age Bracket | In Labor Force | Unemployed |
| 16 to 19 Years | 1,451 (27.8%) | 540 (37.2%) |
| 20 to 24 Years | 4,376 (67.3%) | 691 (15.8%) |
| 25 to 29 Years | 4,164 (71.5%) | 454 (10.9%) |
| 30 to 34 Years | 4,164 (75.7%) | 575 (13.8%) |
| 35 to 44 Years | 7,666 (78.9%) | 636 (8.3%) |
| 45 to 54 Years | 7,363 (76.6%) | 236 (3.2%) |
| 55 to 59 Years | 3,255 (63.1%) | 283 (8.7%) |
| 60 to 64 Years | 2,679 (49.8%) | 185 (6.9%) |
| 65 to 74 Years | 2,059 (24.0%) | 132 (6.4%) |
| 75 Years and over | 337 (6.2%) | 13 (3.8%) |
| Total | 37,547 (56.1%) | 3,755 (10.0%) |
Employment Status by Educational Attainment in Dougherty County
According to labor force statistics for Dougherty County, 71.1% of individuals (29,287) out of the total population between 25 and 64 years of age (41,191) are in the labor force, with 8.1% or 2,372 of them being unemployed. The group with the highest labor force participation rate are those with the educational attainment of bachelor's degree or higher, with 85.2% or 8,085 individuals in the labor force. Within the labor force, individuals with less than high school education have the highest percentage of unemployment, with 21.2% or 536 of them being unemployed.
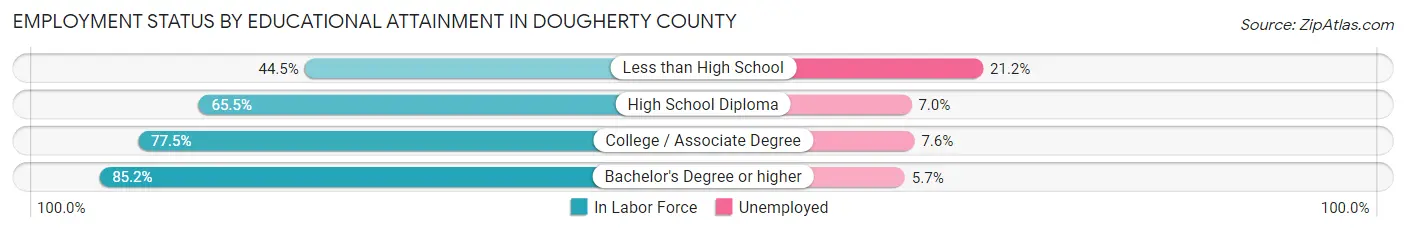
| Educational Attainment | In Labor Force | Unemployed |
| Less than High School | 2,528 (44.5%) | 1,204 (21.2%) |
| High School Diploma | 8,141 (65.5%) | 870 (7.0%) |
| College / Associate Degree | 10,533 (77.5%) | 1,033 (7.6%) |
| Bachelor's Degree or higher | 8,085 (85.2%) | 541 (5.7%) |
| Total | 29,287 (71.1%) | 3,336 (8.1%) |
Employment Occupations by Sex in Dougherty County
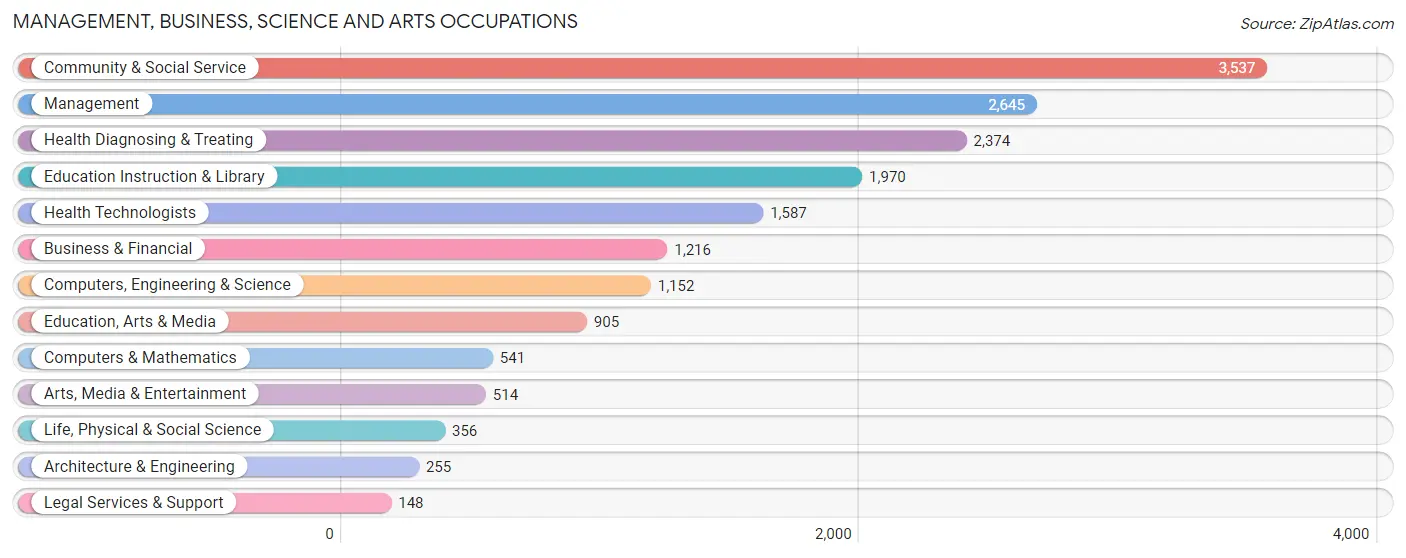
Management, Business, Science and Arts Occupations
The most common Management, Business, Science and Arts occupations in Dougherty County are Community & Social Service (3,537 | 10.6%), Management (2,645 | 7.9%), Health Diagnosing & Treating (2,374 | 7.1%), Education Instruction & Library (1,970 | 5.9%), and Health Technologists (1,587 | 4.8%).
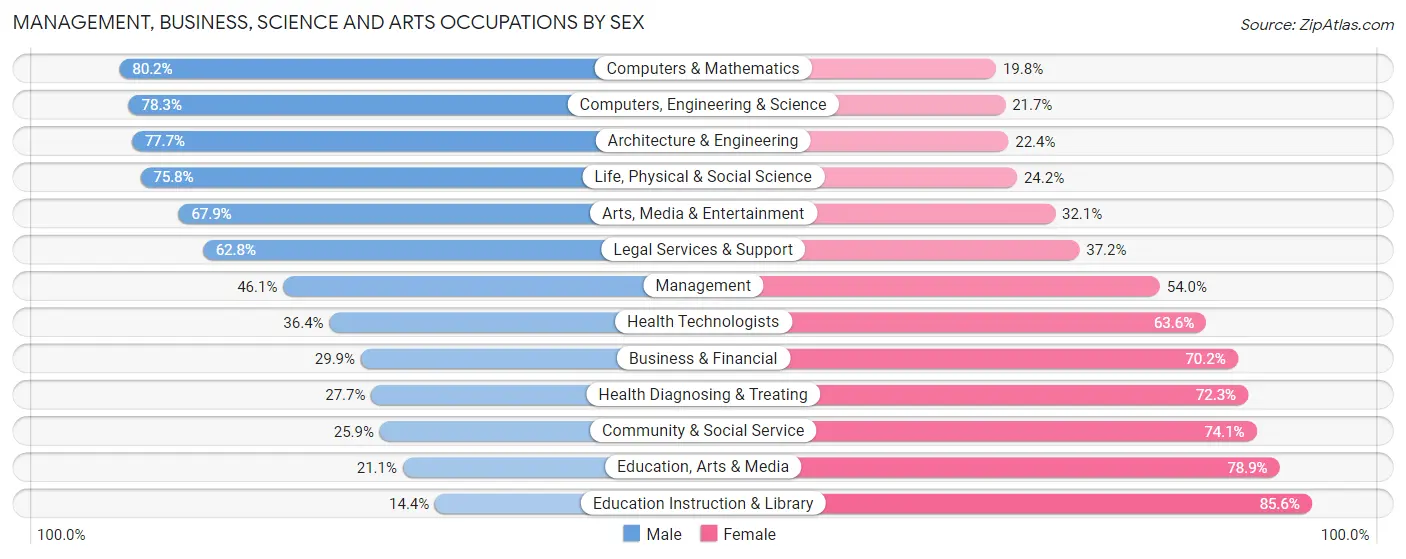
Management, Business, Science and Arts Occupations by Sex
Within the Management, Business, Science and Arts occupations in Dougherty County, the most male-oriented occupations are Computers & Mathematics (80.2%), Computers, Engineering & Science (78.3%), and Architecture & Engineering (77.6%), while the most female-oriented occupations are Education Instruction & Library (85.6%), Education, Arts & Media (78.9%), and Community & Social Service (74.1%).
| Occupation | Male | Female |
| Management | 1,218 (46.1%) | 1,427 (53.9%) |
| Business & Financial | 363 (29.8%) | 853 (70.2%) |
| Computers, Engineering & Science | 902 (78.3%) | 250 (21.7%) |
| Computers & Mathematics | 434 (80.2%) | 107 (19.8%) |
| Architecture & Engineering | 198 (77.6%) | 57 (22.4%) |
| Life, Physical & Social Science | 270 (75.8%) | 86 (24.2%) |
| Community & Social Service | 916 (25.9%) | 2,621 (74.1%) |
| Education, Arts & Media | 191 (21.1%) | 714 (78.9%) |
| Legal Services & Support | 93 (62.8%) | 55 (37.2%) |
| Education Instruction & Library | 283 (14.4%) | 1,687 (85.6%) |
| Arts, Media & Entertainment | 349 (67.9%) | 165 (32.1%) |
| Health Diagnosing & Treating | 657 (27.7%) | 1,717 (72.3%) |
| Health Technologists | 578 (36.4%) | 1,009 (63.6%) |
| Total (Category) | 4,056 (37.1%) | 6,868 (62.9%) |
| Total (Overall) | 14,625 (43.7%) | 18,817 (56.3%) |
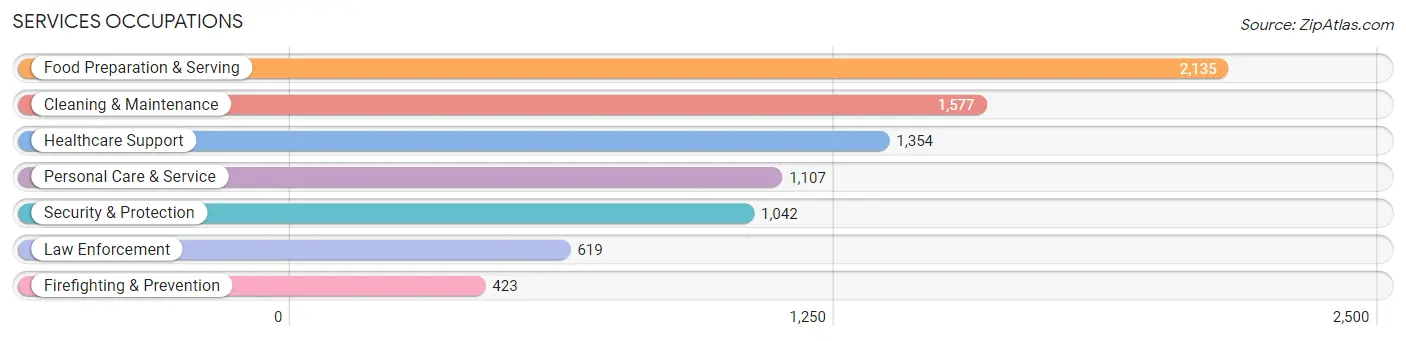
Services Occupations
The most common Services occupations in Dougherty County are Food Preparation & Serving (2,135 | 6.4%), Cleaning & Maintenance (1,577 | 4.7%), Healthcare Support (1,354 | 4.1%), Personal Care & Service (1,107 | 3.3%), and Security & Protection (1,042 | 3.1%).
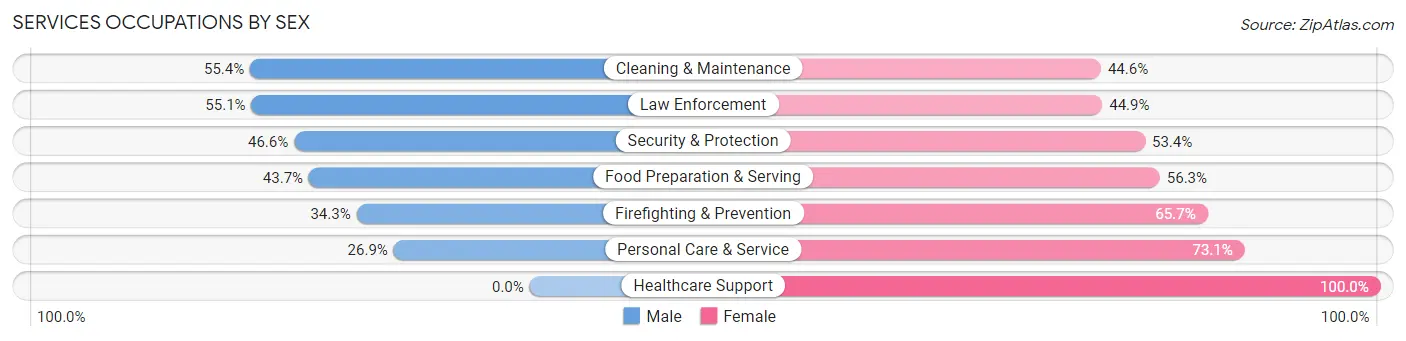
Services Occupations by Sex
Within the Services occupations in Dougherty County, the most male-oriented occupations are Cleaning & Maintenance (55.4%), Law Enforcement (55.1%), and Security & Protection (46.6%), while the most female-oriented occupations are Healthcare Support (100.0%), Personal Care & Service (73.1%), and Firefighting & Prevention (65.7%).
| Occupation | Male | Female |
| Healthcare Support | 0 (0.0%) | 1,354 (100.0%) |
| Security & Protection | 486 (46.6%) | 556 (53.4%) |
| Firefighting & Prevention | 145 (34.3%) | 278 (65.7%) |
| Law Enforcement | 341 (55.1%) | 278 (44.9%) |
| Food Preparation & Serving | 933 (43.7%) | 1,202 (56.3%) |
| Cleaning & Maintenance | 873 (55.4%) | 704 (44.6%) |
| Personal Care & Service | 298 (26.9%) | 809 (73.1%) |
| Total (Category) | 2,590 (35.9%) | 4,625 (64.1%) |
| Total (Overall) | 14,625 (43.7%) | 18,817 (56.3%) |
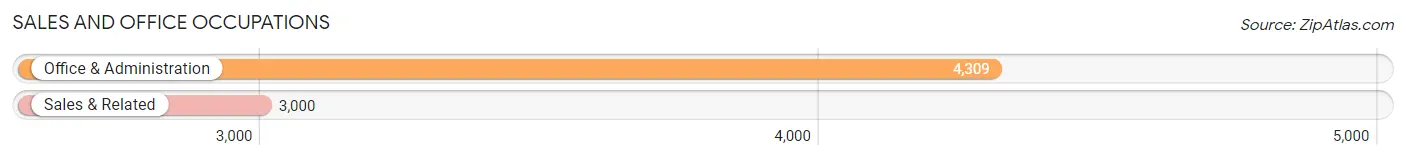
Sales and Office Occupations
The most common Sales and Office occupations in Dougherty County are Office & Administration (4,309 | 12.9%), and Sales & Related (3,000 | 9.0%).
Sales and Office Occupations by Sex
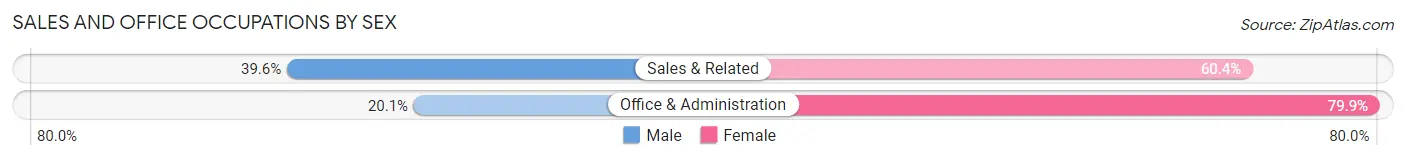
| Occupation | Male | Female |
| Sales & Related | 1,189 (39.6%) | 1,811 (60.4%) |
| Office & Administration | 866 (20.1%) | 3,443 (79.9%) |
| Total (Category) | 2,055 (28.1%) | 5,254 (71.9%) |
| Total (Overall) | 14,625 (43.7%) | 18,817 (56.3%) |
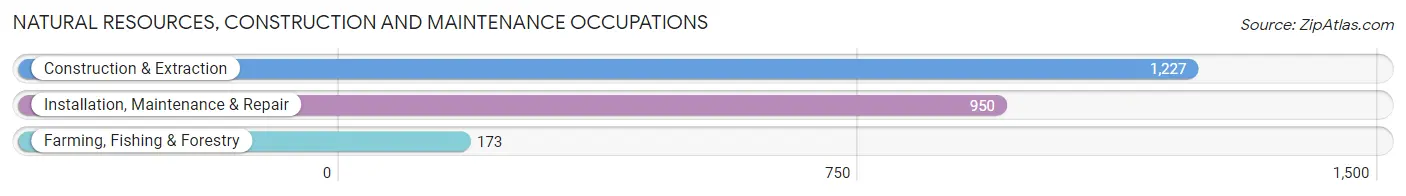
Natural Resources, Construction and Maintenance Occupations
The most common Natural Resources, Construction and Maintenance occupations in Dougherty County are Construction & Extraction (1,227 | 3.7%), Installation, Maintenance & Repair (950 | 2.8%), and Farming, Fishing & Forestry (173 | 0.5%).
Natural Resources, Construction and Maintenance Occupations by Sex
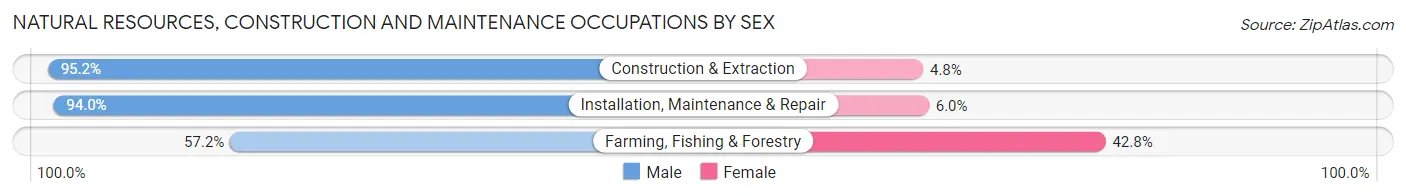
| Occupation | Male | Female |
| Farming, Fishing & Forestry | 99 (57.2%) | 74 (42.8%) |
| Construction & Extraction | 1,168 (95.2%) | 59 (4.8%) |
| Installation, Maintenance & Repair | 893 (94.0%) | 57 (6.0%) |
| Total (Category) | 2,160 (91.9%) | 190 (8.1%) |
| Total (Overall) | 14,625 (43.7%) | 18,817 (56.3%) |
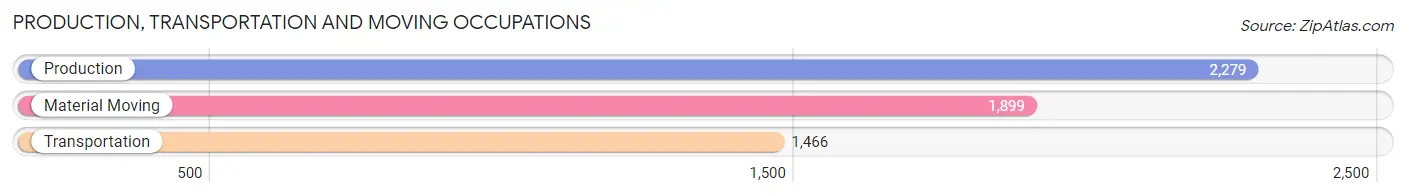
Production, Transportation and Moving Occupations
The most common Production, Transportation and Moving occupations in Dougherty County are Production (2,279 | 6.8%), Material Moving (1,899 | 5.7%), and Transportation (1,466 | 4.4%).
Production, Transportation and Moving Occupations by Sex
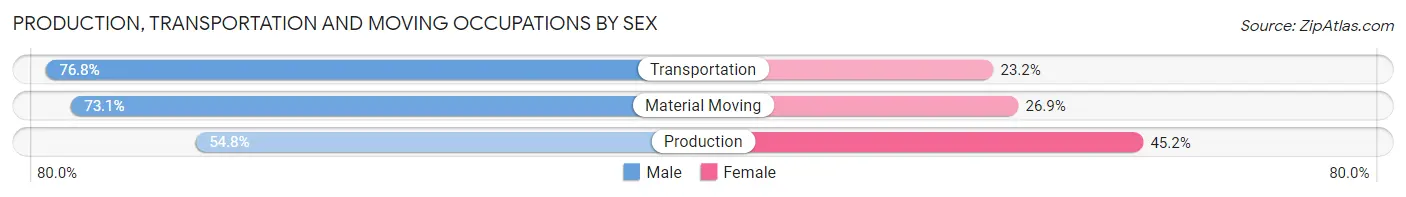
| Occupation | Male | Female |
| Production | 1,249 (54.8%) | 1,030 (45.2%) |
| Transportation | 1,126 (76.8%) | 340 (23.2%) |
| Material Moving | 1,389 (73.1%) | 510 (26.9%) |
| Total (Category) | 3,764 (66.7%) | 1,880 (33.3%) |
| Total (Overall) | 14,625 (43.7%) | 18,817 (56.3%) |
Employment Industries by Sex in Dougherty County
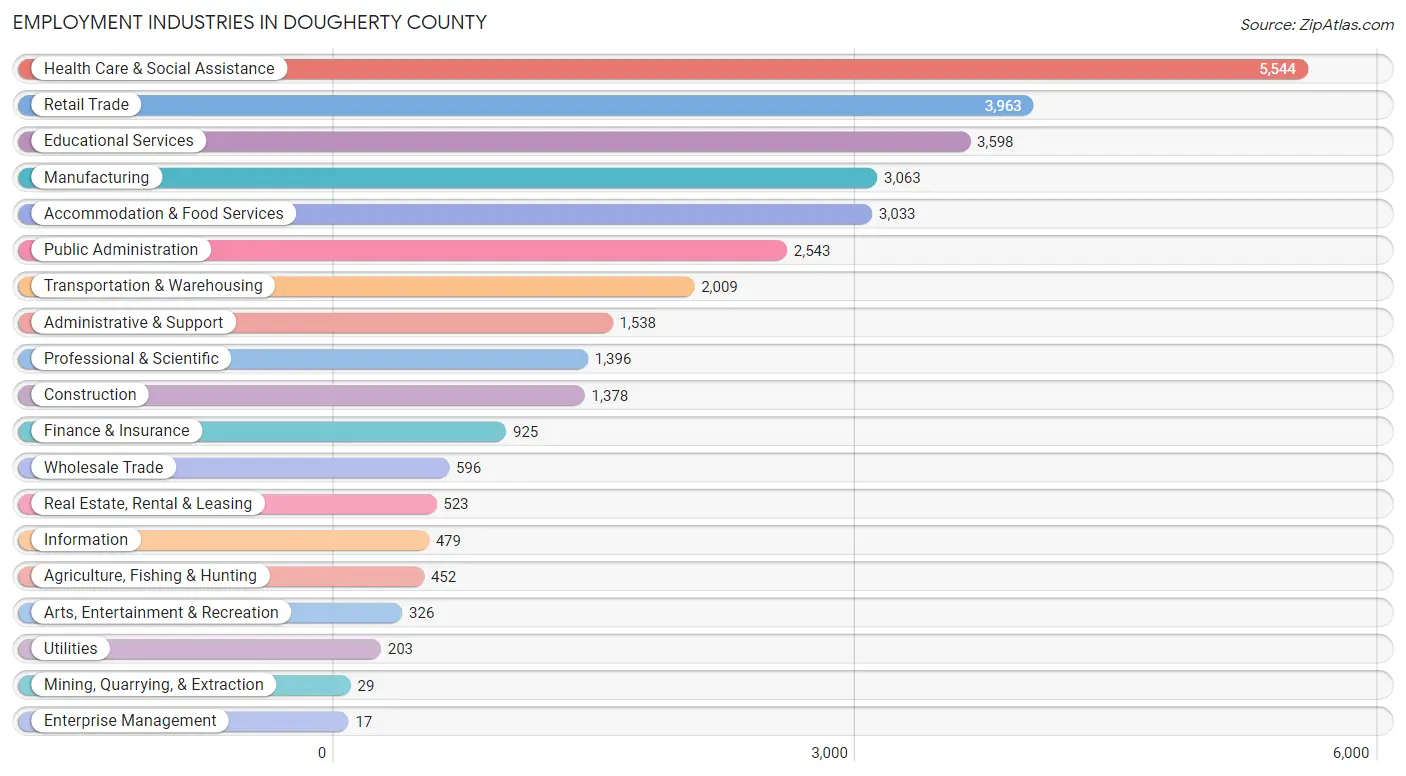
Employment Industries in Dougherty County
The major employment industries in Dougherty County include Health Care & Social Assistance (5,544 | 16.6%), Retail Trade (3,963 | 11.8%), Educational Services (3,598 | 10.8%), Manufacturing (3,063 | 9.2%), and Accommodation & Food Services (3,033 | 9.1%).
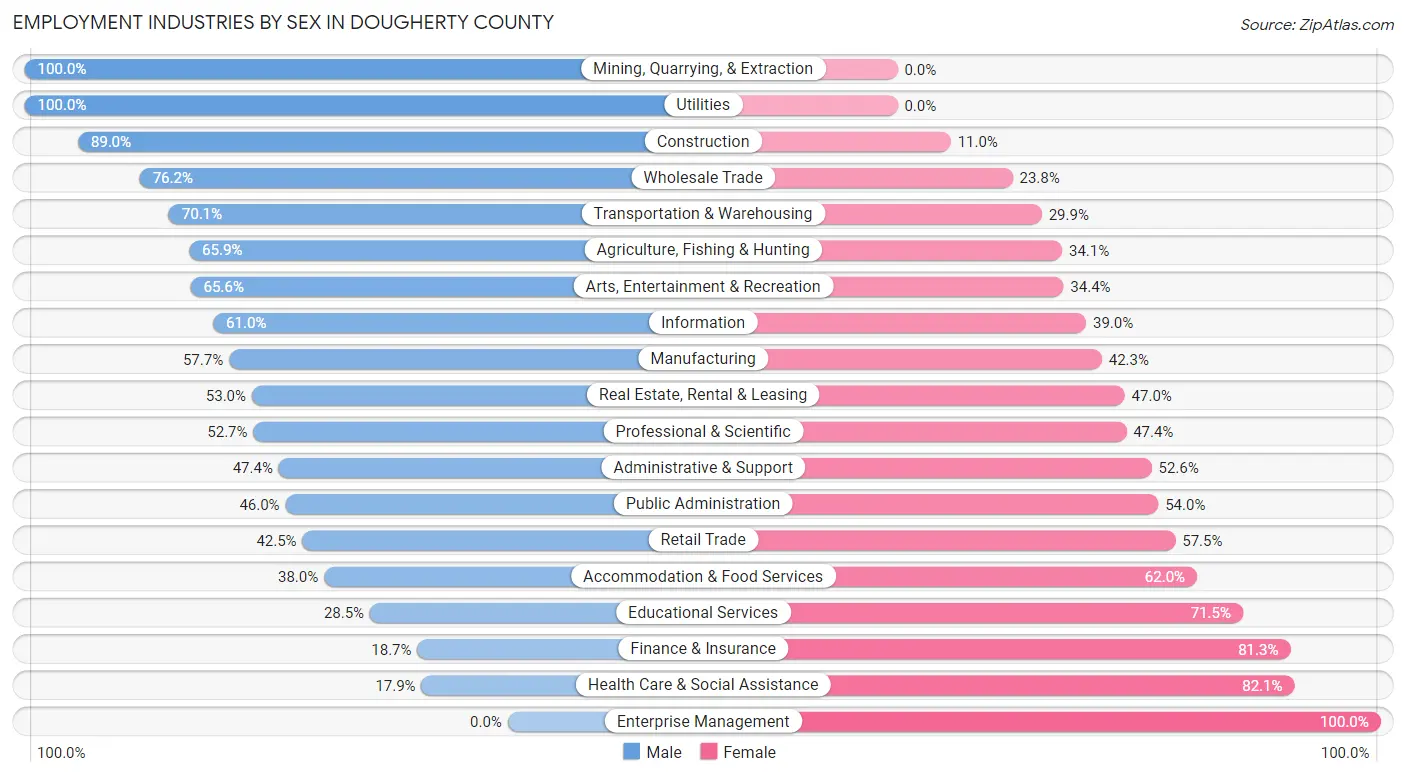
Employment Industries by Sex in Dougherty County
The Dougherty County industries that see more men than women are Mining, Quarrying, & Extraction (100.0%), Utilities (100.0%), and Construction (89.0%), whereas the industries that tend to have a higher number of women are Enterprise Management (100.0%), Health Care & Social Assistance (82.1%), and Finance & Insurance (81.3%).
| Industry | Male | Female |
| Agriculture, Fishing & Hunting | 298 (65.9%) | 154 (34.1%) |
| Mining, Quarrying, & Extraction | 29 (100.0%) | 0 (0.0%) |
| Construction | 1,226 (89.0%) | 152 (11.0%) |
| Manufacturing | 1,767 (57.7%) | 1,296 (42.3%) |
| Wholesale Trade | 454 (76.2%) | 142 (23.8%) |
| Retail Trade | 1,684 (42.5%) | 2,279 (57.5%) |
| Transportation & Warehousing | 1,409 (70.1%) | 600 (29.9%) |
| Utilities | 203 (100.0%) | 0 (0.0%) |
| Information | 292 (61.0%) | 187 (39.0%) |
| Finance & Insurance | 173 (18.7%) | 752 (81.3%) |
| Real Estate, Rental & Leasing | 277 (53.0%) | 246 (47.0%) |
| Professional & Scientific | 735 (52.6%) | 661 (47.3%) |
| Enterprise Management | 0 (0.0%) | 17 (100.0%) |
| Administrative & Support | 729 (47.4%) | 809 (52.6%) |
| Educational Services | 1,026 (28.5%) | 2,572 (71.5%) |
| Health Care & Social Assistance | 990 (17.9%) | 4,554 (82.1%) |
| Arts, Entertainment & Recreation | 214 (65.6%) | 112 (34.4%) |
| Accommodation & Food Services | 1,153 (38.0%) | 1,880 (62.0%) |
| Public Administration | 1,170 (46.0%) | 1,373 (54.0%) |
| Total | 14,625 (43.7%) | 18,817 (56.3%) |
Education in Dougherty County
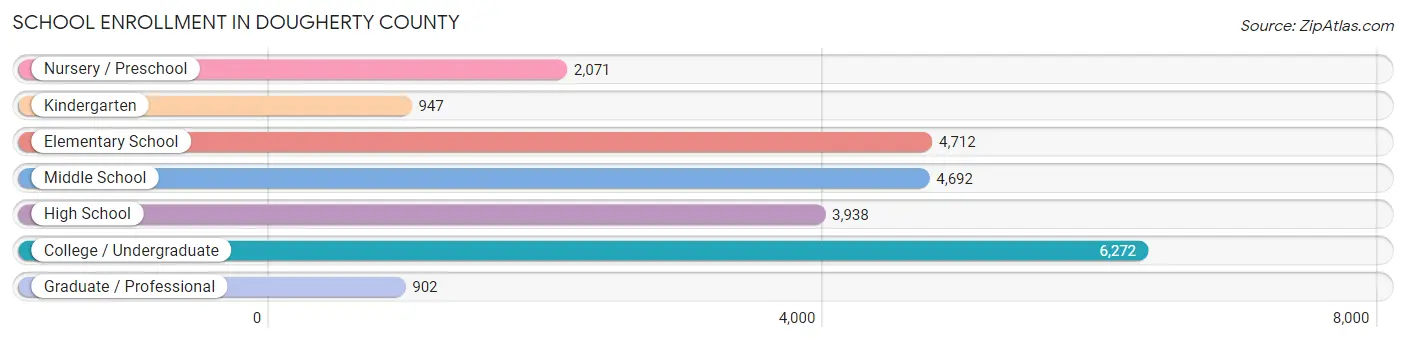
School Enrollment in Dougherty County
The most common levels of schooling among the 23,534 students in Dougherty County are college / undergraduate (6,272 | 26.7%), elementary school (4,712 | 20.0%), and middle school (4,692 | 19.9%).
| School Level | # Students | % Students |
| Nursery / Preschool | 2,071 | 8.8% |
| Kindergarten | 947 | 4.0% |
| Elementary School | 4,712 | 20.0% |
| Middle School | 4,692 | 19.9% |
| High School | 3,938 | 16.7% |
| College / Undergraduate | 6,272 | 26.7% |
| Graduate / Professional | 902 | 3.8% |
| Total | 23,534 | 100.0% |
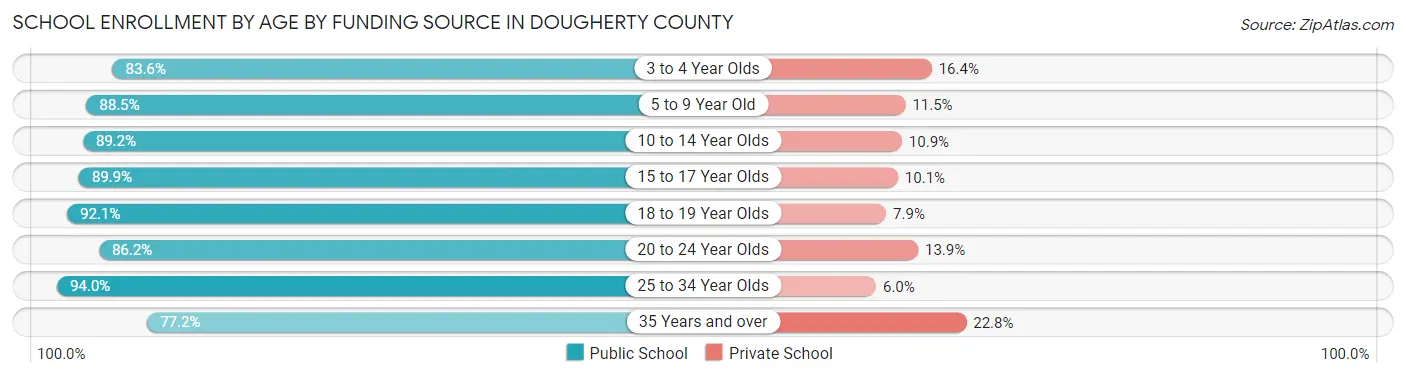
School Enrollment by Age by Funding Source in Dougherty County
Out of a total of 23,534 students who are enrolled in schools in Dougherty County, 2,801 (11.9%) attend a private institution, while the remaining 20,733 (88.1%) are enrolled in public schools. The age group of 35 years and over has the highest likelihood of being enrolled in private schools, with 356 (22.8% in the age bracket) enrolled. Conversely, the age group of 25 to 34 year olds has the lowest likelihood of being enrolled in a private school, with 1,417 (94.0% in the age bracket) attending a public institution.
| Age Bracket | Public School | Private School |
| 3 to 4 Year Olds | 1,376 (83.6%) | 270 (16.4%) |
| 5 to 9 Year Old | 4,680 (88.5%) | 609 (11.5%) |
| 10 to 14 Year Olds | 4,932 (89.1%) | 600 (10.8%) |
| 15 to 17 Year Olds | 2,910 (89.9%) | 327 (10.1%) |
| 18 to 19 Year Olds | 1,840 (92.1%) | 158 (7.9%) |
| 20 to 24 Year Olds | 2,382 (86.2%) | 383 (13.9%) |
| 25 to 34 Year Olds | 1,417 (94.0%) | 91 (6.0%) |
| 35 Years and over | 1,203 (77.2%) | 356 (22.8%) |
| Total | 20,733 (88.1%) | 2,801 (11.9%) |
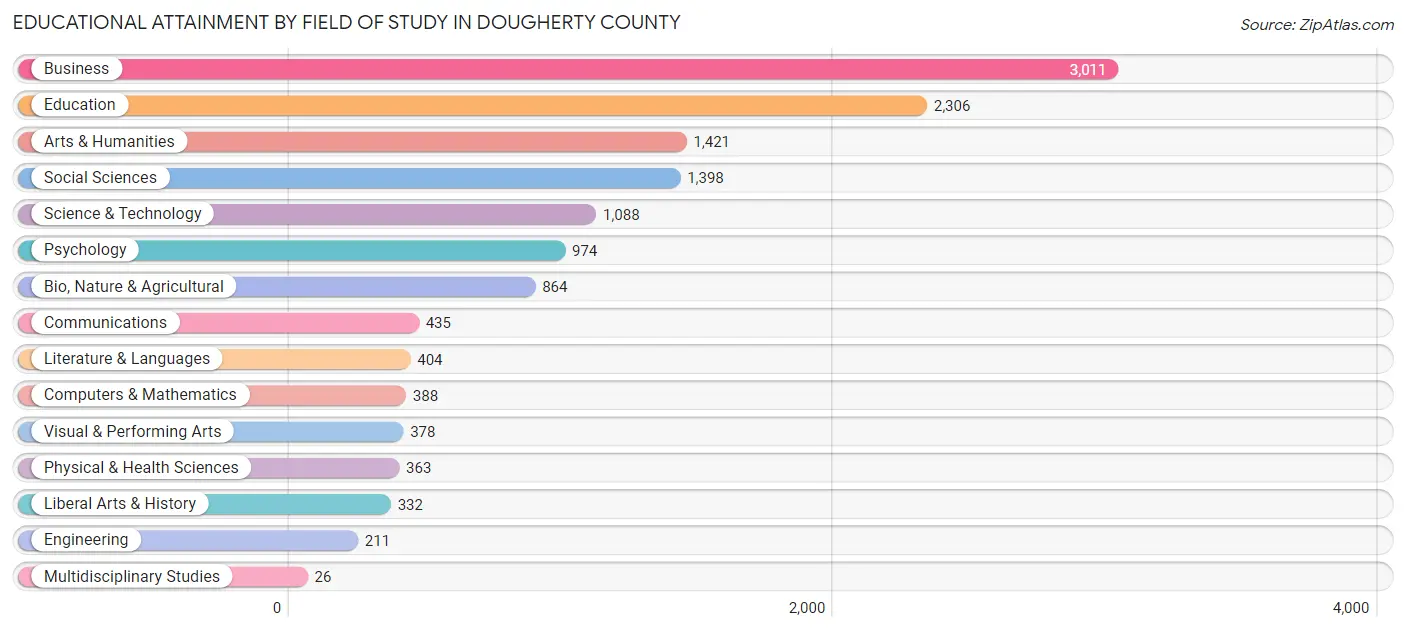
Educational Attainment by Field of Study in Dougherty County
Business (3,011 | 22.1%), education (2,306 | 17.0%), arts & humanities (1,421 | 10.4%), social sciences (1,398 | 10.3%), and science & technology (1,088 | 8.0%) are the most common fields of study among 13,599 individuals in Dougherty County who have obtained a bachelor's degree or higher.
| Field of Study | # Graduates | % Graduates |
| Computers & Mathematics | 388 | 2.9% |
| Bio, Nature & Agricultural | 864 | 6.4% |
| Physical & Health Sciences | 363 | 2.7% |
| Psychology | 974 | 7.2% |
| Social Sciences | 1,398 | 10.3% |
| Engineering | 211 | 1.5% |
| Multidisciplinary Studies | 26 | 0.2% |
| Science & Technology | 1,088 | 8.0% |
| Business | 3,011 | 22.1% |
| Education | 2,306 | 17.0% |
| Literature & Languages | 404 | 3.0% |
| Liberal Arts & History | 332 | 2.4% |
| Visual & Performing Arts | 378 | 2.8% |
| Communications | 435 | 3.2% |
| Arts & Humanities | 1,421 | 10.4% |
| Total | 13,599 | 100.0% |
Transportation & Commute in Dougherty County
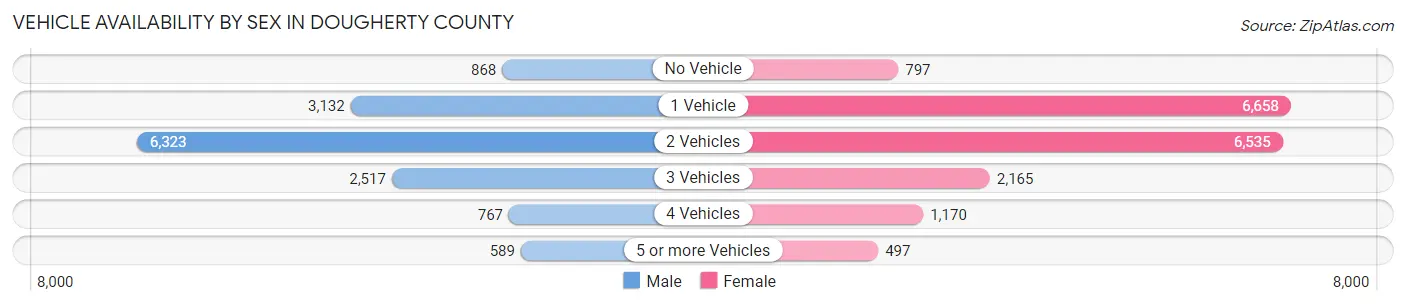
Vehicle Availability by Sex in Dougherty County
The most prevalent vehicle ownership categories in Dougherty County are males with 2 vehicles (6,323, accounting for 44.5%) and females with 2 vehicles (6,535, making up 35.5%).
| Vehicles Available | Male | Female |
| No Vehicle | 868 (6.1%) | 797 (4.5%) |
| 1 Vehicle | 3,132 (22.1%) | 6,658 (37.4%) |
| 2 Vehicles | 6,323 (44.5%) | 6,535 (36.7%) |
| 3 Vehicles | 2,517 (17.7%) | 2,165 (12.1%) |
| 4 Vehicles | 767 (5.4%) | 1,170 (6.6%) |
| 5 or more Vehicles | 589 (4.2%) | 497 (2.8%) |
| Total | 14,196 (100.0%) | 17,822 (100.0%) |
Commute Time in Dougherty County
The most frequently occuring commute durations in Dougherty County are 15 to 19 minutes (7,472 commuters, 24.0%), 10 to 14 minutes (7,018 commuters, 22.6%), and 20 to 24 minutes (4,873 commuters, 15.7%).
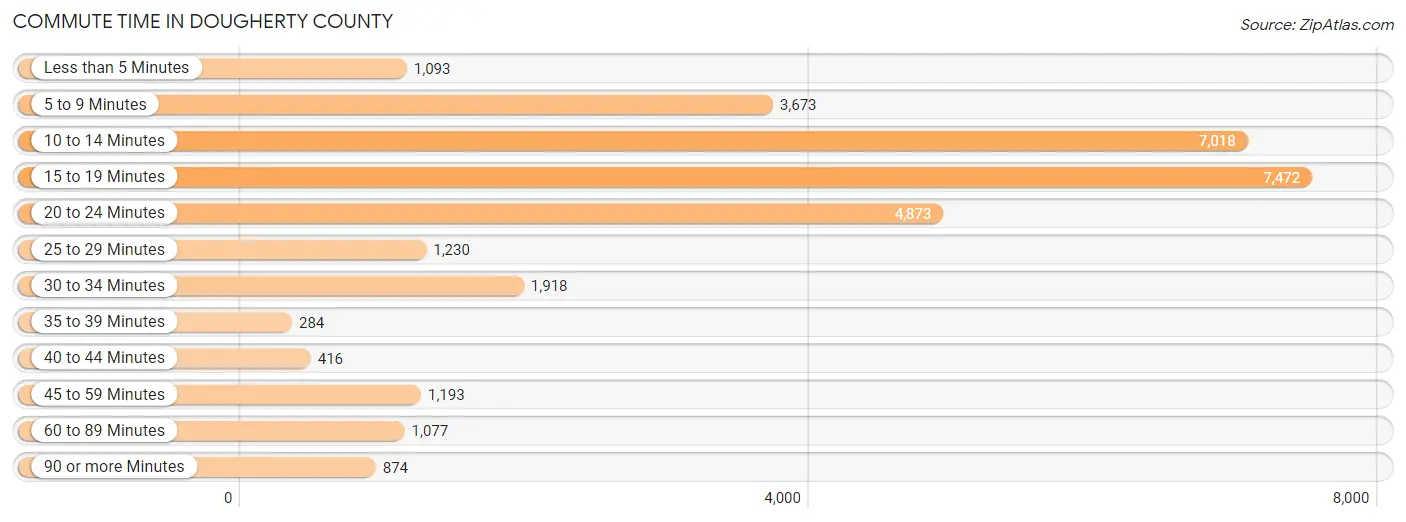
| Commute Time | # Commuters | % Commuters |
| Less than 5 Minutes | 1,093 | 3.5% |
| 5 to 9 Minutes | 3,673 | 11.8% |
| 10 to 14 Minutes | 7,018 | 22.6% |
| 15 to 19 Minutes | 7,472 | 24.0% |
| 20 to 24 Minutes | 4,873 | 15.7% |
| 25 to 29 Minutes | 1,230 | 4.0% |
| 30 to 34 Minutes | 1,918 | 6.2% |
| 35 to 39 Minutes | 284 | 0.9% |
| 40 to 44 Minutes | 416 | 1.3% |
| 45 to 59 Minutes | 1,193 | 3.8% |
| 60 to 89 Minutes | 1,077 | 3.5% |
| 90 or more Minutes | 874 | 2.8% |
Commute Time by Sex in Dougherty County
The most common commute times in Dougherty County are 15 to 19 minutes (3,298 commuters, 23.6%) for males and 15 to 19 minutes (4,174 commuters, 24.4%) for females.
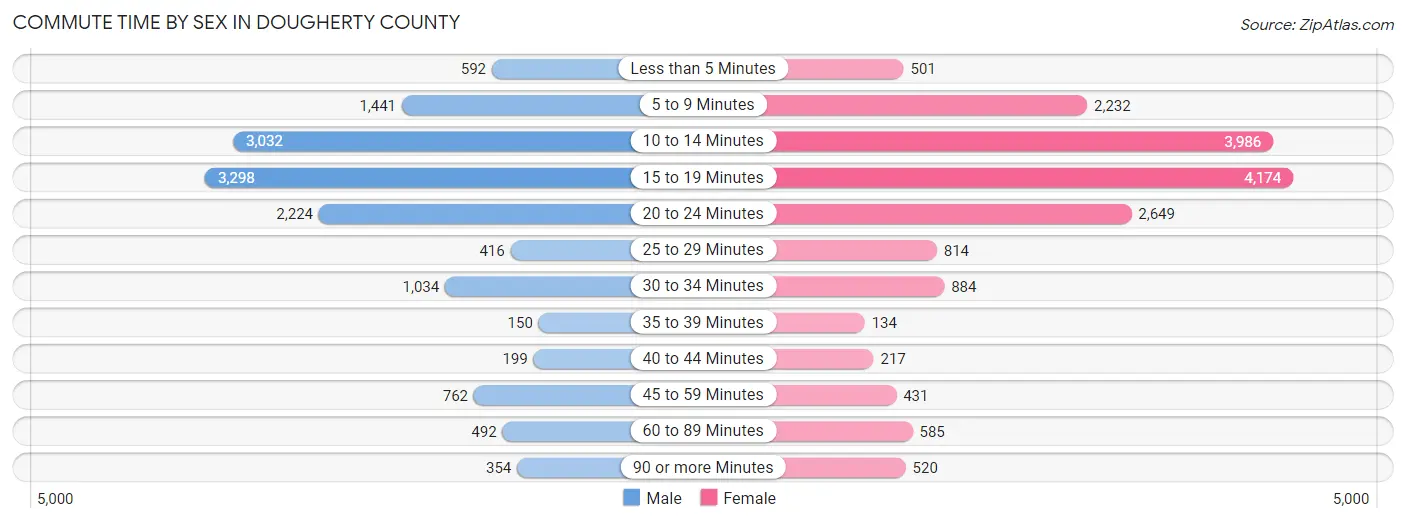
| Commute Time | Male | Female |
| Less than 5 Minutes | 592 (4.2%) | 501 (2.9%) |
| 5 to 9 Minutes | 1,441 (10.3%) | 2,232 (13.0%) |
| 10 to 14 Minutes | 3,032 (21.7%) | 3,986 (23.3%) |
| 15 to 19 Minutes | 3,298 (23.6%) | 4,174 (24.4%) |
| 20 to 24 Minutes | 2,224 (15.9%) | 2,649 (15.5%) |
| 25 to 29 Minutes | 416 (3.0%) | 814 (4.8%) |
| 30 to 34 Minutes | 1,034 (7.4%) | 884 (5.2%) |
| 35 to 39 Minutes | 150 (1.1%) | 134 (0.8%) |
| 40 to 44 Minutes | 199 (1.4%) | 217 (1.3%) |
| 45 to 59 Minutes | 762 (5.4%) | 431 (2.5%) |
| 60 to 89 Minutes | 492 (3.5%) | 585 (3.4%) |
| 90 or more Minutes | 354 (2.5%) | 520 (3.0%) |
Time of Departure to Work by Sex in Dougherty County
The most frequent times of departure to work in Dougherty County are 7:30 AM to 7:59 AM (2,105, 15.0%) for males and 7:30 AM to 7:59 AM (3,299, 19.3%) for females.
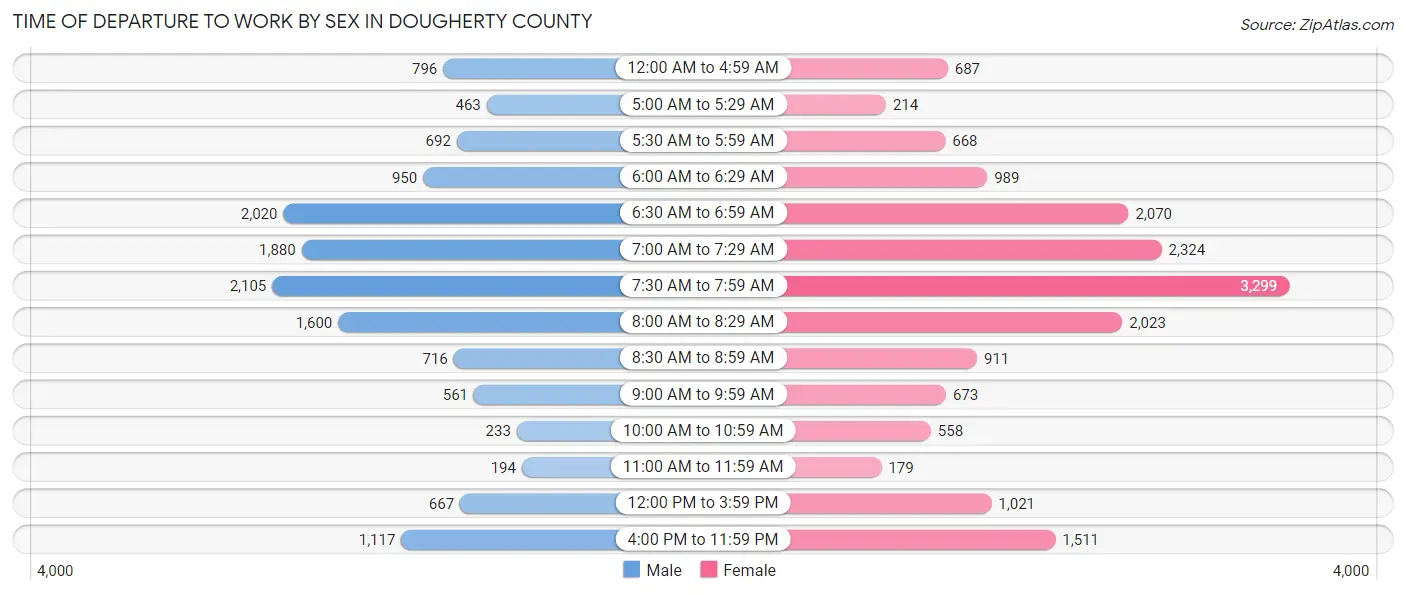
| Time of Departure | Male | Female |
| 12:00 AM to 4:59 AM | 796 (5.7%) | 687 (4.0%) |
| 5:00 AM to 5:29 AM | 463 (3.3%) | 214 (1.3%) |
| 5:30 AM to 5:59 AM | 692 (4.9%) | 668 (3.9%) |
| 6:00 AM to 6:29 AM | 950 (6.8%) | 989 (5.8%) |
| 6:30 AM to 6:59 AM | 2,020 (14.4%) | 2,070 (12.1%) |
| 7:00 AM to 7:29 AM | 1,880 (13.4%) | 2,324 (13.6%) |
| 7:30 AM to 7:59 AM | 2,105 (15.0%) | 3,299 (19.3%) |
| 8:00 AM to 8:29 AM | 1,600 (11.4%) | 2,023 (11.8%) |
| 8:30 AM to 8:59 AM | 716 (5.1%) | 911 (5.3%) |
| 9:00 AM to 9:59 AM | 561 (4.0%) | 673 (3.9%) |
| 10:00 AM to 10:59 AM | 233 (1.7%) | 558 (3.3%) |
| 11:00 AM to 11:59 AM | 194 (1.4%) | 179 (1.1%) |
| 12:00 PM to 3:59 PM | 667 (4.8%) | 1,021 (6.0%) |
| 4:00 PM to 11:59 PM | 1,117 (8.0%) | 1,511 (8.8%) |
| Total | 13,994 (100.0%) | 17,127 (100.0%) |
Housing Occupancy in Dougherty County
Occupancy by Ownership in Dougherty County
Of the total 34,041 dwellings in Dougherty County, owner-occupied units account for 15,852 (46.6%), while renter-occupied units make up 18,189 (53.4%).
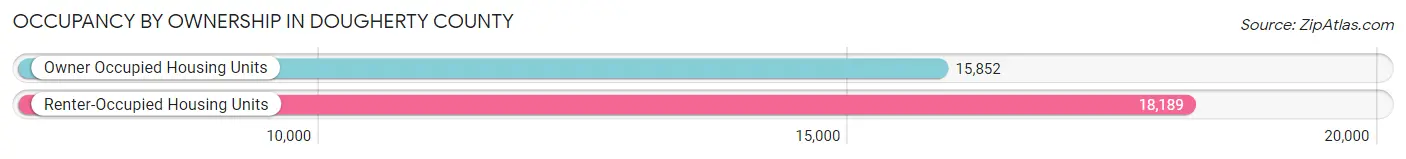
| Occupancy | # Housing Units | % Housing Units |
| Owner Occupied Housing Units | 15,852 | 46.6% |
| Renter-Occupied Housing Units | 18,189 | 53.4% |
| Total Occupied Housing Units | 34,041 | 100.0% |
Occupancy by Household Size in Dougherty County
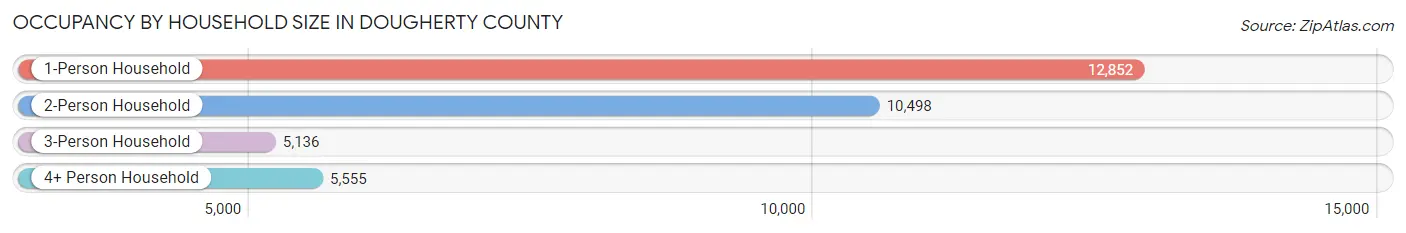
| Household Size | # Housing Units | % Housing Units |
| 1-Person Household | 12,852 | 37.8% |
| 2-Person Household | 10,498 | 30.8% |
| 3-Person Household | 5,136 | 15.1% |
| 4+ Person Household | 5,555 | 16.3% |
| Total Housing Units | 34,041 | 100.0% |
Occupancy by Ownership by Household Size in Dougherty County
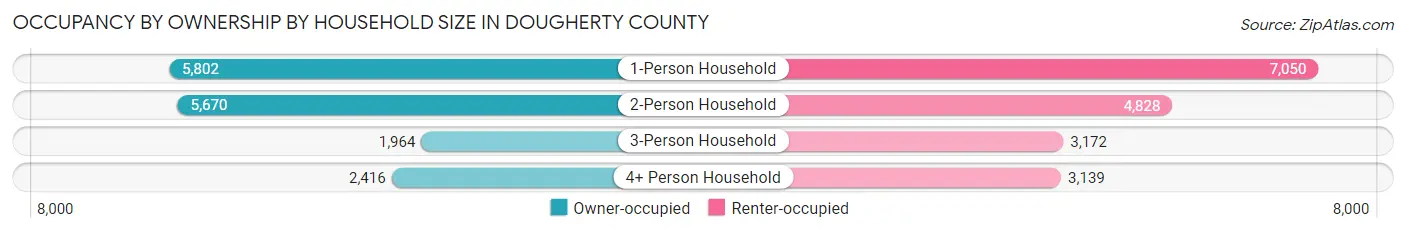
| Household Size | Owner-occupied | Renter-occupied |
| 1-Person Household | 5,802 (45.1%) | 7,050 (54.9%) |
| 2-Person Household | 5,670 (54.0%) | 4,828 (46.0%) |
| 3-Person Household | 1,964 (38.2%) | 3,172 (61.8%) |
| 4+ Person Household | 2,416 (43.5%) | 3,139 (56.5%) |
| Total Housing Units | 15,852 (46.6%) | 18,189 (53.4%) |
Occupancy by Educational Attainment in Dougherty County
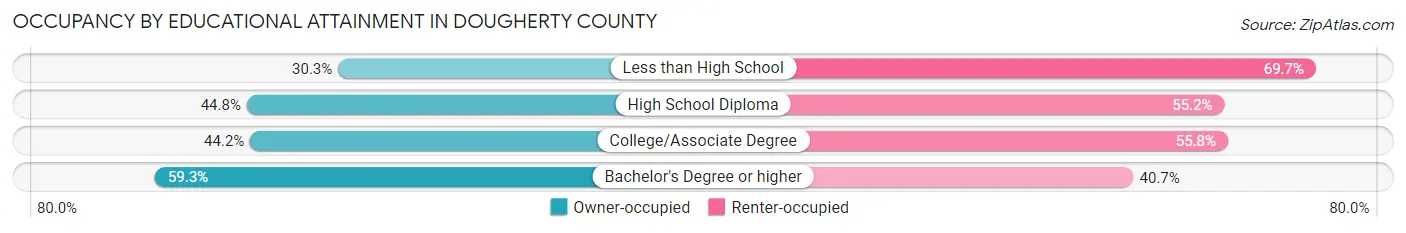
| Household Size | Owner-occupied | Renter-occupied |
| Less than High School | 1,303 (30.3%) | 3,001 (69.7%) |
| High School Diploma | 4,245 (44.8%) | 5,237 (55.2%) |
| College/Associate Degree | 5,014 (44.2%) | 6,325 (55.8%) |
| Bachelor's Degree or higher | 5,290 (59.3%) | 3,626 (40.7%) |
Occupancy by Age of Householder in Dougherty County
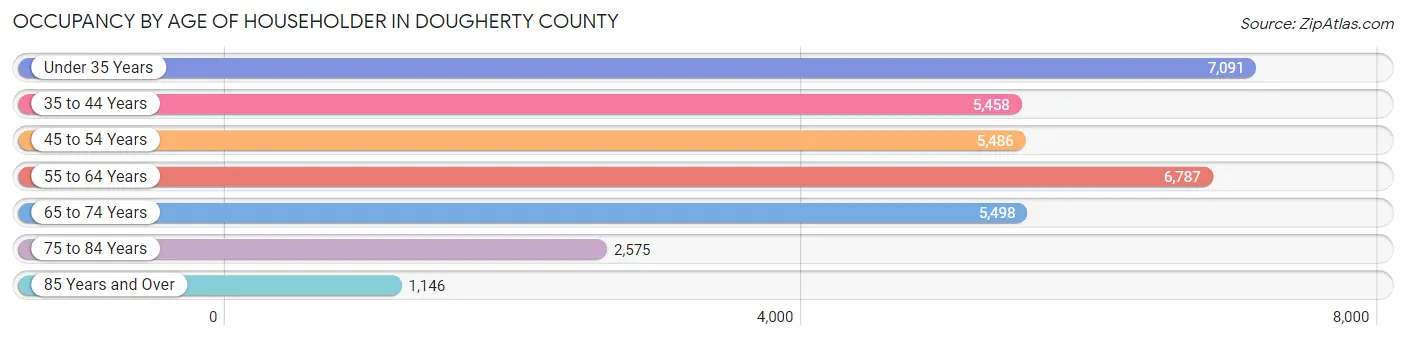
| Age Bracket | # Households | % Households |
| Under 35 Years | 7,091 | 20.8% |
| 35 to 44 Years | 5,458 | 16.0% |
| 45 to 54 Years | 5,486 | 16.1% |
| 55 to 64 Years | 6,787 | 19.9% |
| 65 to 74 Years | 5,498 | 16.2% |
| 75 to 84 Years | 2,575 | 7.6% |
| 85 Years and Over | 1,146 | 3.4% |
| Total | 34,041 | 100.0% |
Housing Finances in Dougherty County
Median Income by Occupancy in Dougherty County
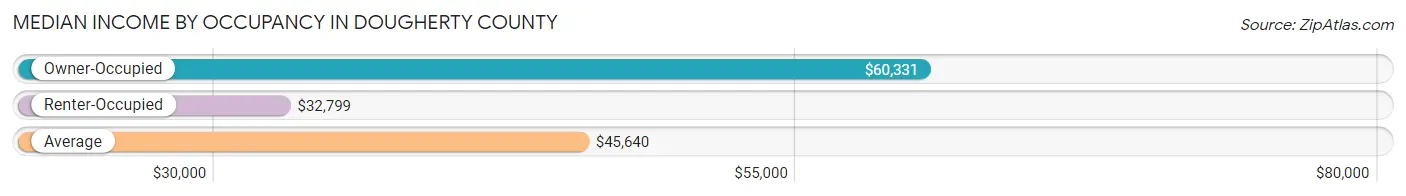
| Occupancy Type | # Households | Median Income |
| Owner-Occupied | 15,852 (46.6%) | $60,331 |
| Renter-Occupied | 18,189 (53.4%) | $32,799 |
| Average | 34,041 (100.0%) | $45,640 |
Occupancy by Householder Income Bracket in Dougherty County
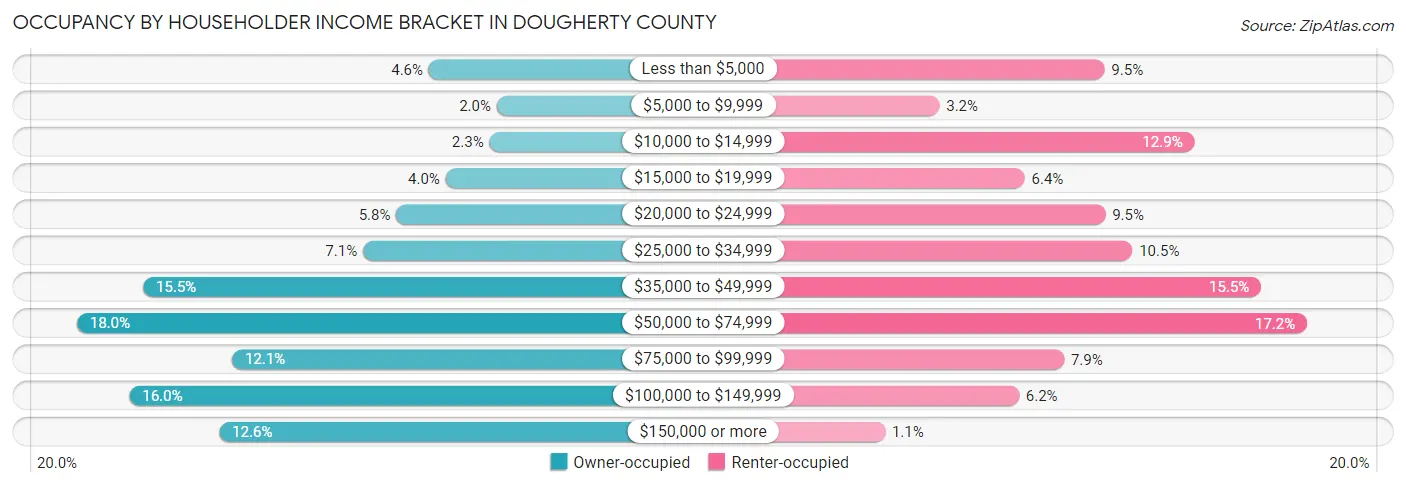
| Income Bracket | Owner-occupied | Renter-occupied |
| Less than $5,000 | 729 (4.6%) | 1,725 (9.5%) |
| $5,000 to $9,999 | 318 (2.0%) | 580 (3.2%) |
| $10,000 to $14,999 | 363 (2.3%) | 2,349 (12.9%) |
| $15,000 to $19,999 | 627 (4.0%) | 1,172 (6.4%) |
| $20,000 to $24,999 | 926 (5.8%) | 1,729 (9.5%) |
| $25,000 to $34,999 | 1,127 (7.1%) | 1,918 (10.5%) |
| $35,000 to $49,999 | 2,456 (15.5%) | 2,810 (15.4%) |
| $50,000 to $74,999 | 2,855 (18.0%) | 3,128 (17.2%) |
| $75,000 to $99,999 | 1,918 (12.1%) | 1,444 (7.9%) |
| $100,000 to $149,999 | 2,538 (16.0%) | 1,131 (6.2%) |
| $150,000 or more | 1,995 (12.6%) | 203 (1.1%) |
| Total | 15,852 (100.0%) | 18,189 (100.0%) |
Monthly Housing Cost Tiers in Dougherty County
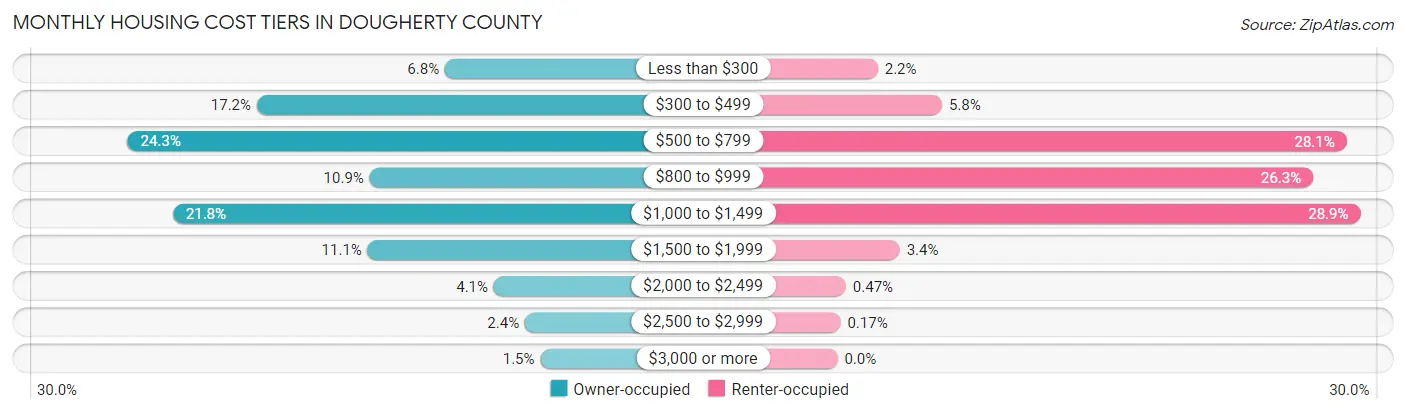
| Monthly Cost | Owner-occupied | Renter-occupied |
| Less than $300 | 1,074 (6.8%) | 406 (2.2%) |
| $300 to $499 | 2,721 (17.2%) | 1,051 (5.8%) |
| $500 to $799 | 3,853 (24.3%) | 5,115 (28.1%) |
| $800 to $999 | 1,734 (10.9%) | 4,779 (26.3%) |
| $1,000 to $1,499 | 3,458 (21.8%) | 5,253 (28.9%) |
| $1,500 to $1,999 | 1,752 (11.1%) | 625 (3.4%) |
| $2,000 to $2,499 | 646 (4.1%) | 85 (0.5%) |
| $2,500 to $2,999 | 374 (2.4%) | 31 (0.2%) |
| $3,000 or more | 240 (1.5%) | 0 (0.0%) |
| Total | 15,852 (100.0%) | 18,189 (100.0%) |
Physical Housing Characteristics in Dougherty County
Housing Structures in Dougherty County
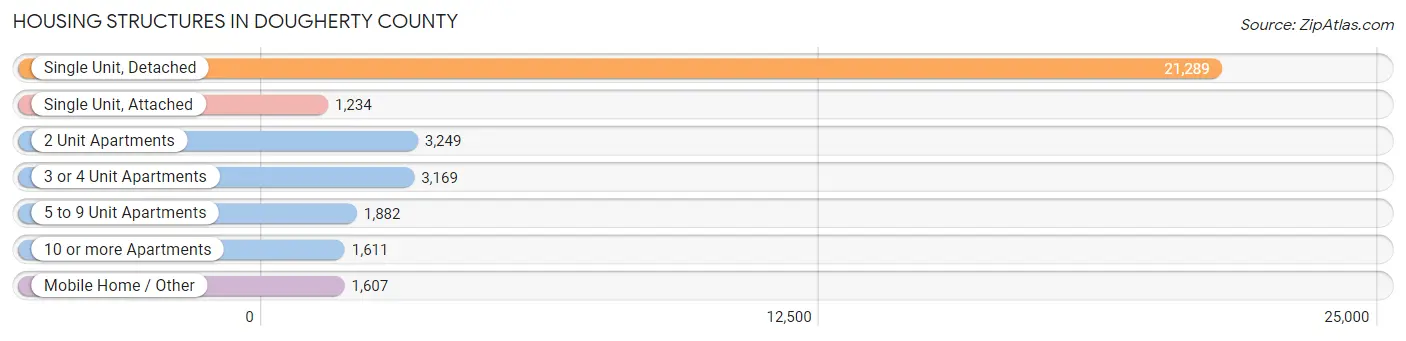
| Structure Type | # Housing Units | % Housing Units |
| Single Unit, Detached | 21,289 | 62.5% |
| Single Unit, Attached | 1,234 | 3.6% |
| 2 Unit Apartments | 3,249 | 9.5% |
| 3 or 4 Unit Apartments | 3,169 | 9.3% |
| 5 to 9 Unit Apartments | 1,882 | 5.5% |
| 10 or more Apartments | 1,611 | 4.7% |
| Mobile Home / Other | 1,607 | 4.7% |
| Total | 34,041 | 100.0% |
Housing Structures by Occupancy in Dougherty County
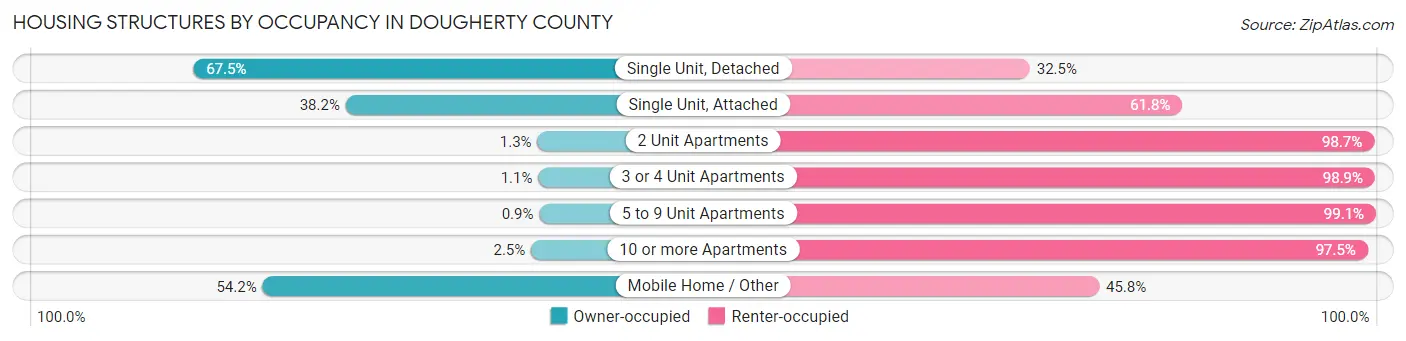
| Structure Type | Owner-occupied | Renter-occupied |
| Single Unit, Detached | 14,377 (67.5%) | 6,912 (32.5%) |
| Single Unit, Attached | 471 (38.2%) | 763 (61.8%) |
| 2 Unit Apartments | 41 (1.3%) | 3,208 (98.7%) |
| 3 or 4 Unit Apartments | 35 (1.1%) | 3,134 (98.9%) |
| 5 to 9 Unit Apartments | 17 (0.9%) | 1,865 (99.1%) |
| 10 or more Apartments | 40 (2.5%) | 1,571 (97.5%) |
| Mobile Home / Other | 871 (54.2%) | 736 (45.8%) |
| Total | 15,852 (46.6%) | 18,189 (53.4%) |
Housing Structures by Number of Rooms in Dougherty County
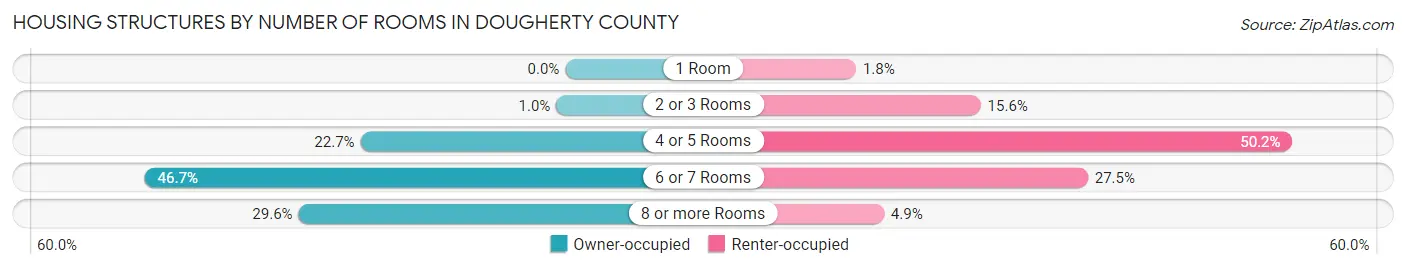
| Number of Rooms | Owner-occupied | Renter-occupied |
| 1 Room | 0 (0.0%) | 324 (1.8%) |
| 2 or 3 Rooms | 158 (1.0%) | 2,841 (15.6%) |
| 4 or 5 Rooms | 3,603 (22.7%) | 9,132 (50.2%) |
| 6 or 7 Rooms | 7,398 (46.7%) | 5,004 (27.5%) |
| 8 or more Rooms | 4,693 (29.6%) | 888 (4.9%) |
| Total | 15,852 (100.0%) | 18,189 (100.0%) |
Housing Structure by Heating Type in Dougherty County
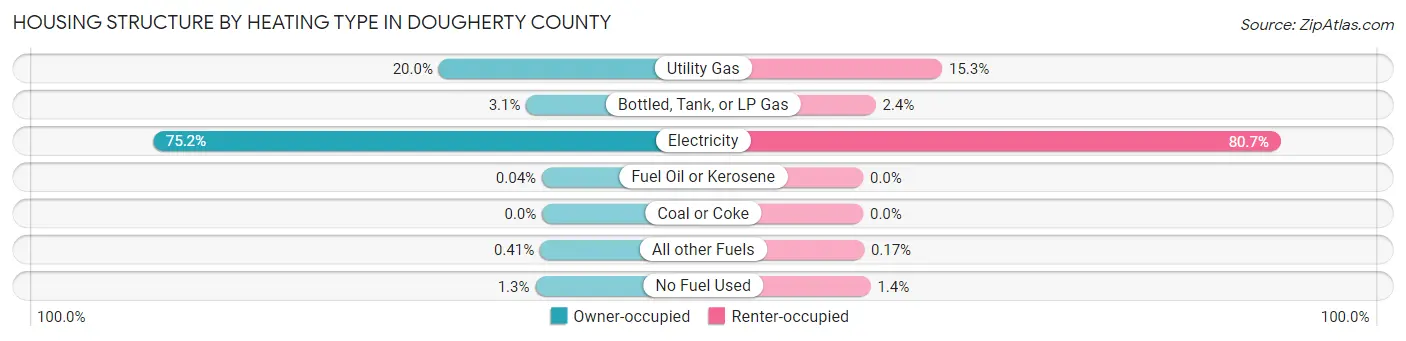
| Heating Type | Owner-occupied | Renter-occupied |
| Utility Gas | 3,165 (20.0%) | 2,778 (15.3%) |
| Bottled, Tank, or LP Gas | 484 (3.0%) | 439 (2.4%) |
| Electricity | 11,923 (75.2%) | 14,680 (80.7%) |
| Fuel Oil or Kerosene | 7 (0.0%) | 0 (0.0%) |
| Coal or Coke | 0 (0.0%) | 0 (0.0%) |
| All other Fuels | 65 (0.4%) | 31 (0.2%) |
| No Fuel Used | 208 (1.3%) | 261 (1.4%) |
| Total | 15,852 (100.0%) | 18,189 (100.0%) |
Household Vehicle Usage in Dougherty County
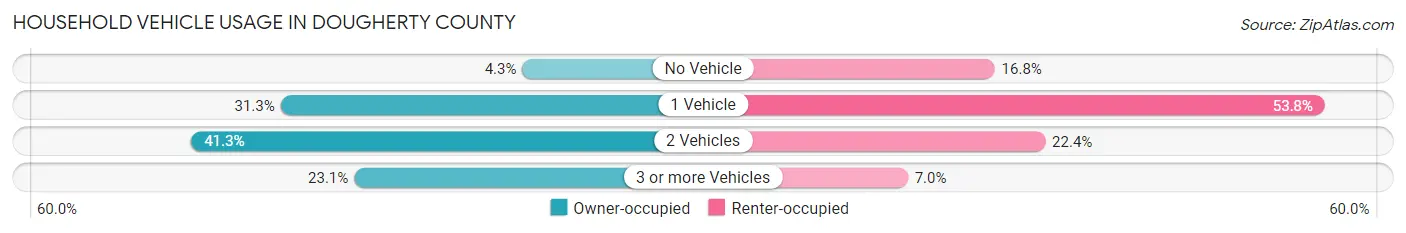
| Vehicles per Household | Owner-occupied | Renter-occupied |
| No Vehicle | 673 (4.3%) | 3,051 (16.8%) |
| 1 Vehicle | 4,967 (31.3%) | 9,779 (53.8%) |
| 2 Vehicles | 6,551 (41.3%) | 4,080 (22.4%) |
| 3 or more Vehicles | 3,661 (23.1%) | 1,279 (7.0%) |
| Total | 15,852 (100.0%) | 18,189 (100.0%) |
Real Estate & Mortgages in Dougherty County
Real Estate and Mortgage Overview in Dougherty County
| Characteristic | Without Mortgage | With Mortgage |
| Housing Units | 7,185 | 8,667 |
| Median Property Value | $100,100 | $137,500 |
| Median Household Income | $50,697 | $1,366 |
| Monthly Housing Costs | $495 | $240 |
| Real Estate Taxes | $1,452 | $379 |
Property Value by Mortgage Status in Dougherty County
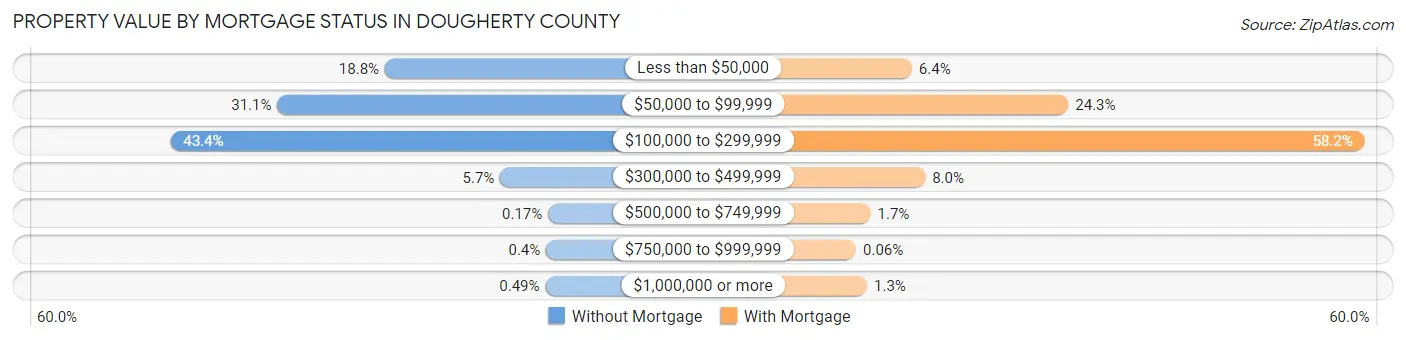
| Property Value | Without Mortgage | With Mortgage |
| Less than $50,000 | 1,352 (18.8%) | 558 (6.4%) |
| $50,000 to $99,999 | 2,236 (31.1%) | 2,108 (24.3%) |
| $100,000 to $299,999 | 3,115 (43.3%) | 5,043 (58.2%) |
| $300,000 to $499,999 | 406 (5.7%) | 690 (8.0%) |
| $500,000 to $749,999 | 12 (0.2%) | 149 (1.7%) |
| $750,000 to $999,999 | 29 (0.4%) | 5 (0.1%) |
| $1,000,000 or more | 35 (0.5%) | 114 (1.3%) |
| Total | 7,185 (100.0%) | 8,667 (100.0%) |
Household Income by Mortgage Status in Dougherty County
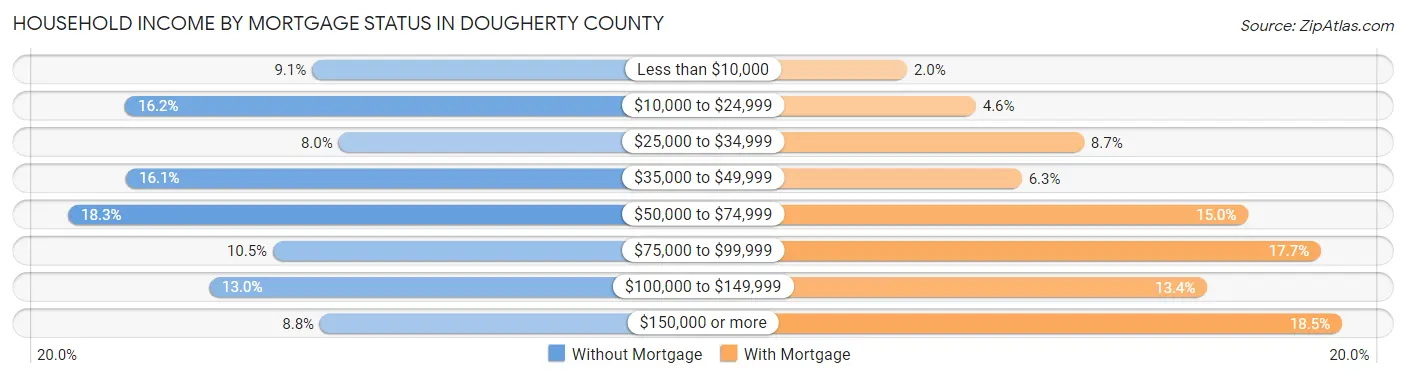
| Household Income | Without Mortgage | With Mortgage |
| Less than $10,000 | 650 (9.0%) | 170 (2.0%) |
| $10,000 to $24,999 | 1,162 (16.2%) | 397 (4.6%) |
| $25,000 to $34,999 | 578 (8.0%) | 754 (8.7%) |
| $35,000 to $49,999 | 1,159 (16.1%) | 549 (6.3%) |
| $50,000 to $74,999 | 1,318 (18.3%) | 1,297 (15.0%) |
| $75,000 to $99,999 | 757 (10.5%) | 1,537 (17.7%) |
| $100,000 to $149,999 | 932 (13.0%) | 1,161 (13.4%) |
| $150,000 or more | 629 (8.7%) | 1,606 (18.5%) |
| Total | 7,185 (100.0%) | 8,667 (100.0%) |
Property Value to Household Income Ratio in Dougherty County
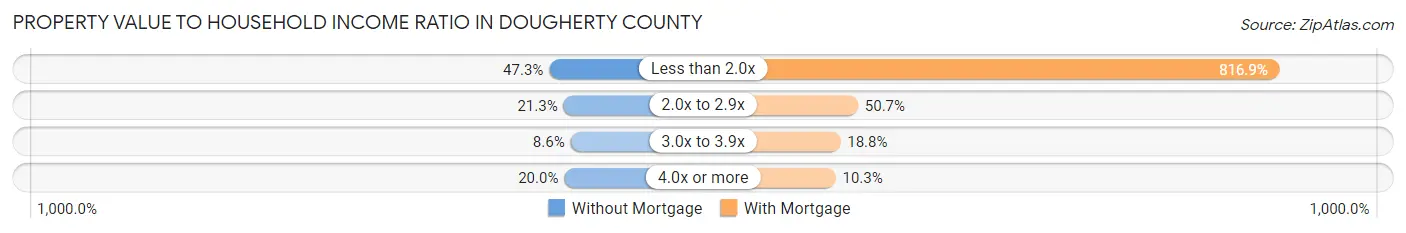
| Value-to-Income Ratio | Without Mortgage | With Mortgage |
| Less than 2.0x | 3,400 (47.3%) | 70,800 (816.9%) |
| 2.0x to 2.9x | 1,530 (21.3%) | 4,395 (50.7%) |
| 3.0x to 3.9x | 620 (8.6%) | 1,629 (18.8%) |
| 4.0x or more | 1,436 (20.0%) | 891 (10.3%) |
| Total | 7,185 (100.0%) | 8,667 (100.0%) |
Real Estate Taxes by Mortgage Status in Dougherty County
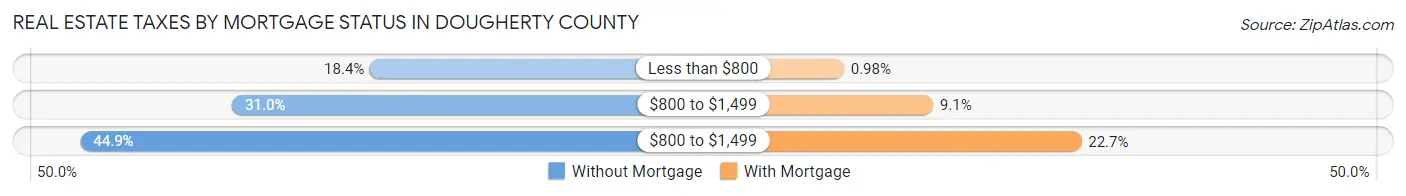
| Property Taxes | Without Mortgage | With Mortgage |
| Less than $800 | 1,325 (18.4%) | 85 (1.0%) |
| $800 to $1,499 | 2,230 (31.0%) | 790 (9.1%) |
| $800 to $1,499 | 3,226 (44.9%) | 1,965 (22.7%) |
| Total | 7,185 (100.0%) | 8,667 (100.0%) |
Health & Disability in Dougherty County
Health Insurance Coverage by Age in Dougherty County
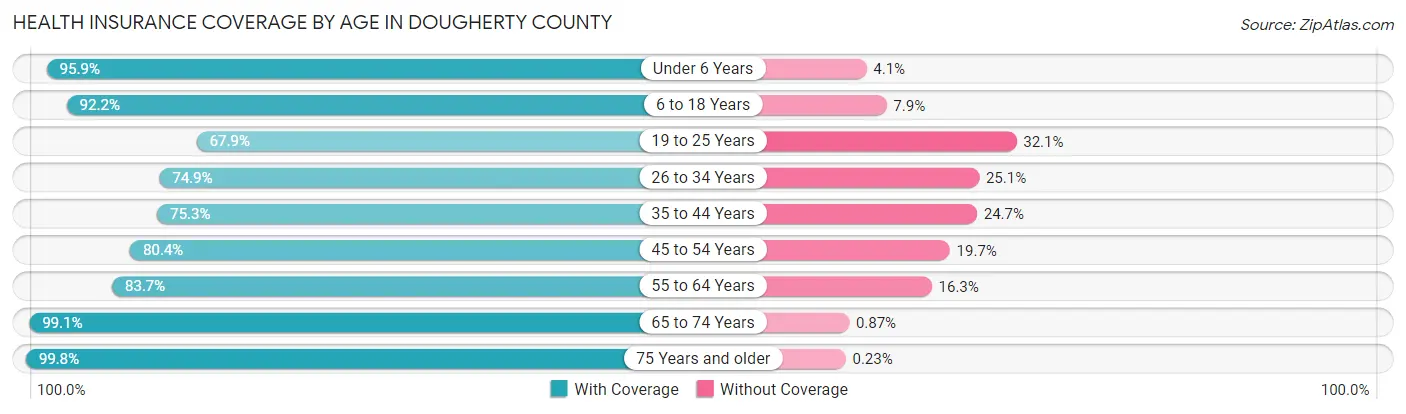
| Age Bracket | With Coverage | Without Coverage |
| Under 6 Years | 6,209 (95.9%) | 266 (4.1%) |
| 6 to 18 Years | 13,902 (92.1%) | 1,184 (7.9%) |
| 19 to 25 Years | 5,952 (67.9%) | 2,811 (32.1%) |
| 26 to 34 Years | 7,302 (74.9%) | 2,449 (25.1%) |
| 35 to 44 Years | 7,141 (75.3%) | 2,344 (24.7%) |
| 45 to 54 Years | 7,609 (80.3%) | 1,861 (19.7%) |
| 55 to 64 Years | 8,739 (83.7%) | 1,699 (16.3%) |
| 65 to 74 Years | 8,401 (99.1%) | 74 (0.9%) |
| 75 Years and older | 5,192 (99.8%) | 12 (0.2%) |
| Total | 70,447 (84.7%) | 12,700 (15.3%) |
Health Insurance Coverage by Citizenship Status in Dougherty County
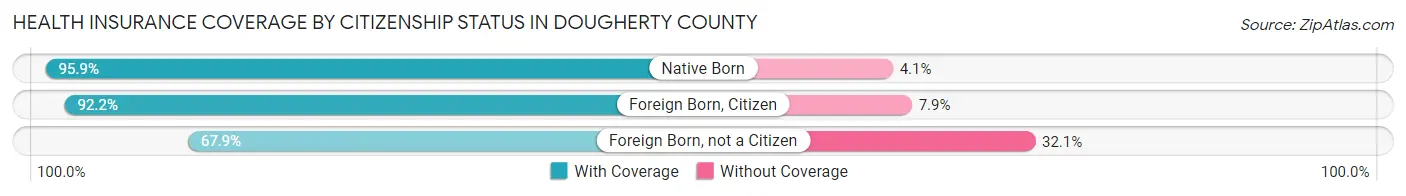
| Citizenship Status | With Coverage | Without Coverage |
| Native Born | 6,209 (95.9%) | 266 (4.1%) |
| Foreign Born, Citizen | 13,902 (92.1%) | 1,184 (7.9%) |
| Foreign Born, not a Citizen | 5,952 (67.9%) | 2,811 (32.1%) |
Health Insurance Coverage by Household Income in Dougherty County
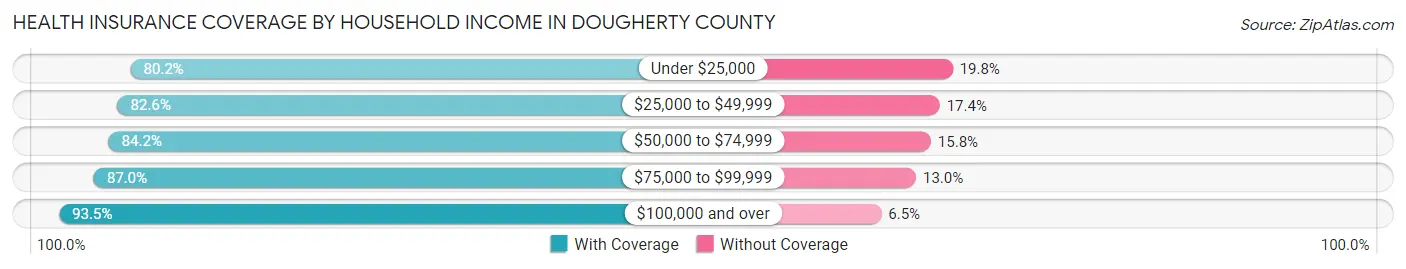
| Household Income | With Coverage | Without Coverage |
| Under $25,000 | 16,590 (80.2%) | 4,105 (19.8%) |
| $25,000 to $49,999 | 15,014 (82.6%) | 3,165 (17.4%) |
| $50,000 to $74,999 | 11,980 (84.2%) | 2,241 (15.8%) |
| $75,000 to $99,999 | 7,971 (87.0%) | 1,188 (13.0%) |
| $100,000 and over | 16,815 (93.5%) | 1,164 (6.5%) |
Public vs Private Health Insurance Coverage by Age in Dougherty County
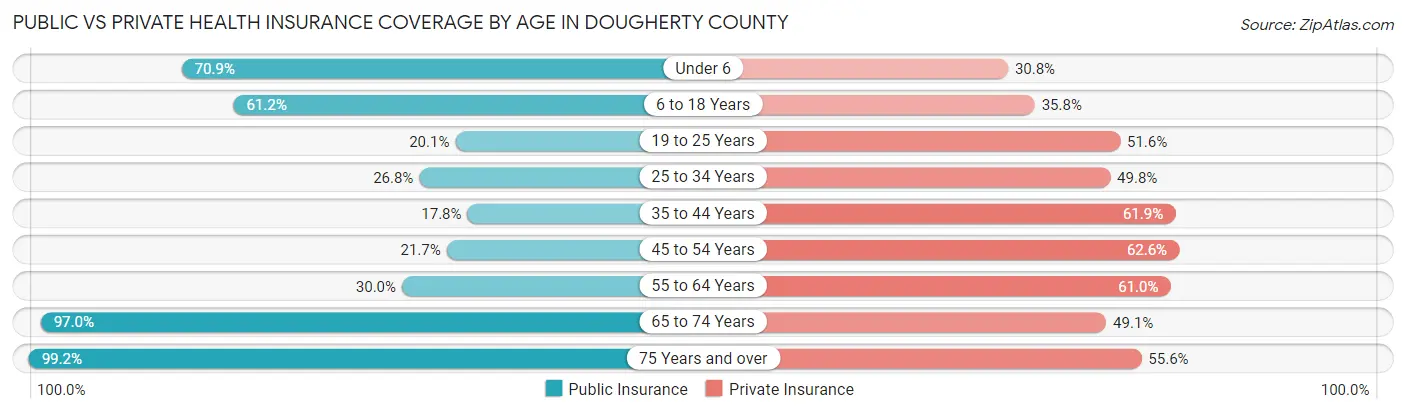
| Age Bracket | Public Insurance | Private Insurance |
| Under 6 | 4,589 (70.9%) | 1,997 (30.8%) |
| 6 to 18 Years | 9,235 (61.2%) | 5,403 (35.8%) |
| 19 to 25 Years | 1,759 (20.1%) | 4,525 (51.6%) |
| 25 to 34 Years | 2,609 (26.8%) | 4,857 (49.8%) |
| 35 to 44 Years | 1,690 (17.8%) | 5,866 (61.9%) |
| 45 to 54 Years | 2,053 (21.7%) | 5,925 (62.6%) |
| 55 to 64 Years | 3,129 (30.0%) | 6,364 (61.0%) |
| 65 to 74 Years | 8,221 (97.0%) | 4,159 (49.1%) |
| 75 Years and over | 5,164 (99.2%) | 2,894 (55.6%) |
| Total | 38,449 (46.2%) | 41,990 (50.5%) |
Disability Status by Sex by Age in Dougherty County
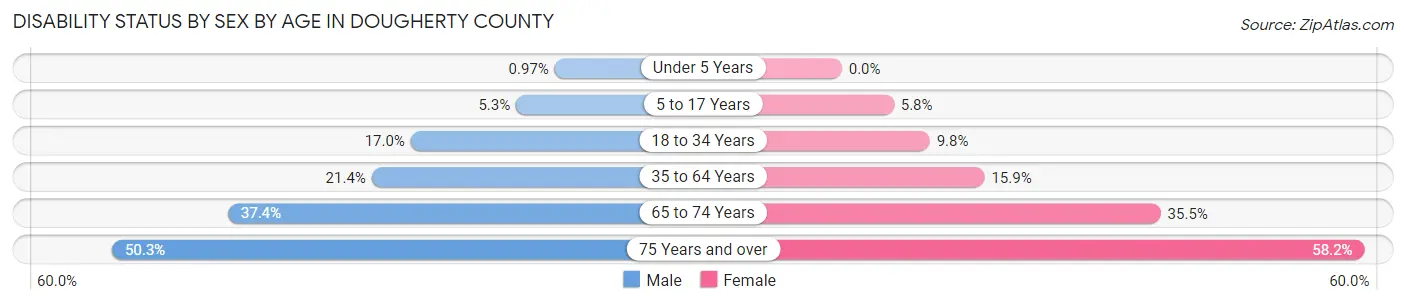
| Age Bracket | Male | Female |
| Under 5 Years | 28 (1.0%) | 0 (0.0%) |
| 5 to 17 Years | 395 (5.3%) | 425 (5.8%) |
| 18 to 34 Years | 1,468 (17.0%) | 1,085 (9.8%) |
| 35 to 64 Years | 2,774 (21.3%) | 2,606 (15.9%) |
| 65 to 74 Years | 1,419 (37.4%) | 1,661 (35.5%) |
| 75 Years and over | 943 (50.3%) | 1,937 (58.2%) |
Disability Class by Sex by Age in Dougherty County
Disability Class: Hearing Difficulty
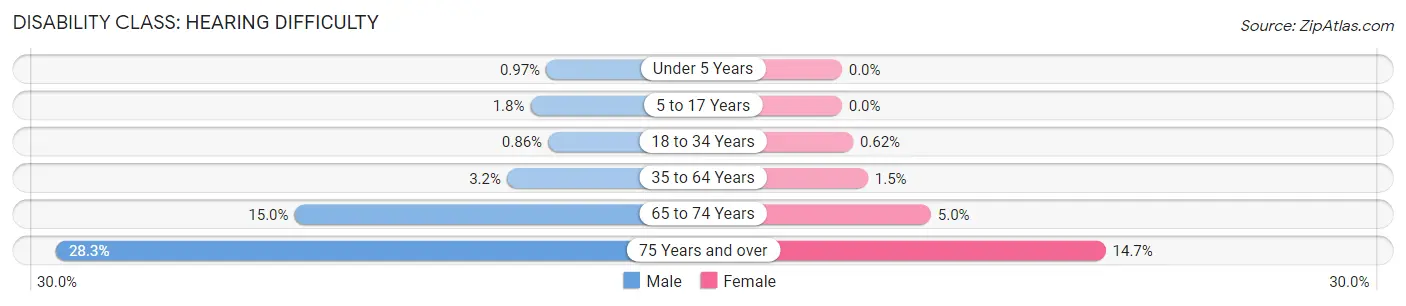
| Age Bracket | Male | Female |
| Under 5 Years | 28 (1.0%) | 0 (0.0%) |
| 5 to 17 Years | 138 (1.8%) | 0 (0.0%) |
| 18 to 34 Years | 74 (0.9%) | 69 (0.6%) |
| 35 to 64 Years | 410 (3.2%) | 238 (1.5%) |
| 65 to 74 Years | 569 (15.0%) | 232 (5.0%) |
| 75 Years and over | 530 (28.2%) | 489 (14.7%) |
Disability Class: Vision Difficulty
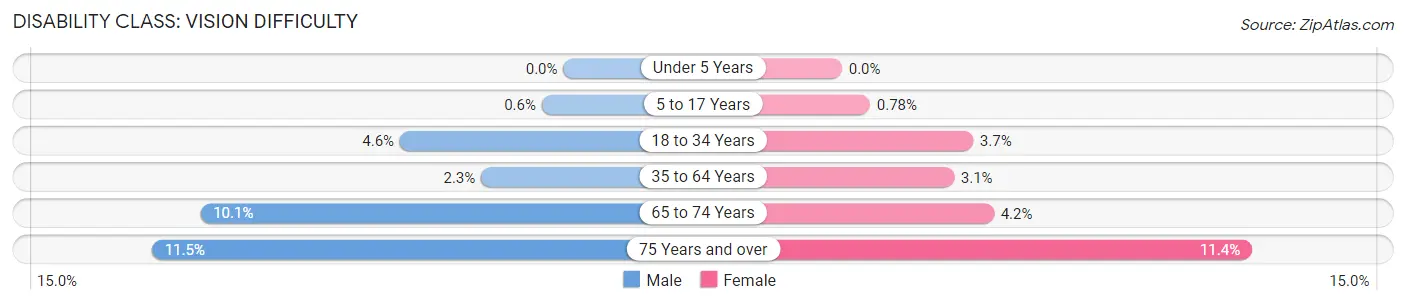
| Age Bracket | Male | Female |
| Under 5 Years | 0 (0.0%) | 0 (0.0%) |
| 5 to 17 Years | 45 (0.6%) | 57 (0.8%) |
| 18 to 34 Years | 393 (4.5%) | 405 (3.6%) |
| 35 to 64 Years | 298 (2.3%) | 511 (3.1%) |
| 65 to 74 Years | 384 (10.1%) | 198 (4.2%) |
| 75 Years and over | 215 (11.5%) | 380 (11.4%) |
Disability Class: Cognitive Difficulty
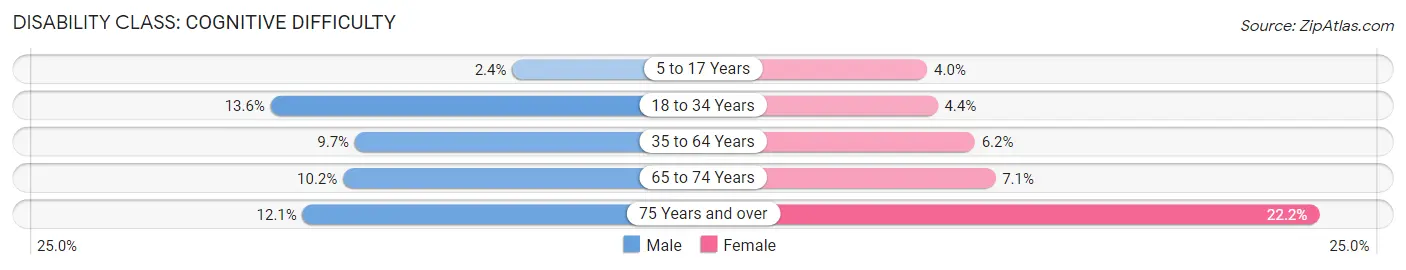
| Age Bracket | Male | Female |
| 5 to 17 Years | 178 (2.4%) | 291 (4.0%) |
| 18 to 34 Years | 1,173 (13.6%) | 492 (4.4%) |
| 35 to 64 Years | 1,257 (9.7%) | 1,011 (6.2%) |
| 65 to 74 Years | 388 (10.2%) | 333 (7.1%) |
| 75 Years and over | 227 (12.1%) | 737 (22.2%) |
Disability Class: Ambulatory Difficulty
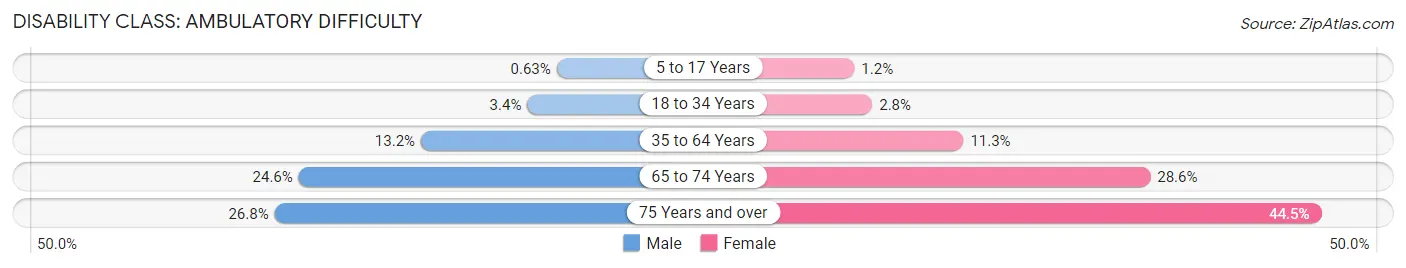
| Age Bracket | Male | Female |
| 5 to 17 Years | 47 (0.6%) | 86 (1.2%) |
| 18 to 34 Years | 289 (3.4%) | 314 (2.8%) |
| 35 to 64 Years | 1,718 (13.2%) | 1,851 (11.3%) |
| 65 to 74 Years | 933 (24.6%) | 1,339 (28.6%) |
| 75 Years and over | 503 (26.8%) | 1,481 (44.5%) |
Disability Class: Self-Care Difficulty
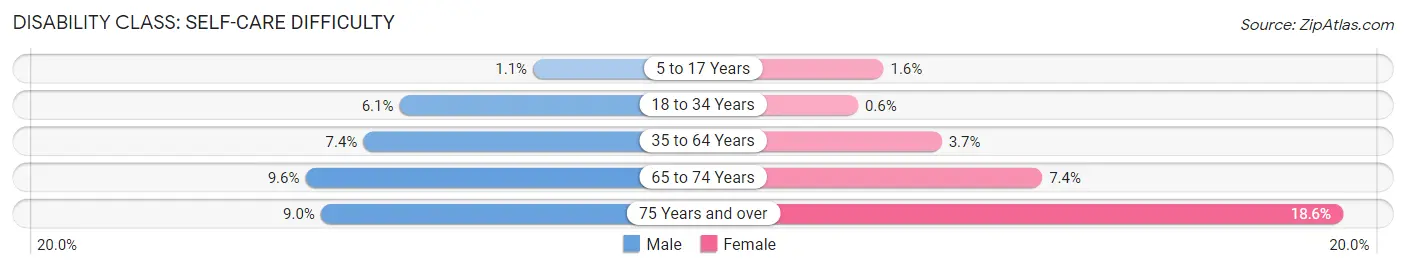
| Age Bracket | Male | Female |
| 5 to 17 Years | 85 (1.1%) | 114 (1.5%) |
| 18 to 34 Years | 526 (6.1%) | 66 (0.6%) |
| 35 to 64 Years | 966 (7.4%) | 609 (3.7%) |
| 65 to 74 Years | 364 (9.6%) | 348 (7.4%) |
| 75 Years and over | 169 (9.0%) | 619 (18.6%) |
Technology Access in Dougherty County
Computing Device Access in Dougherty County
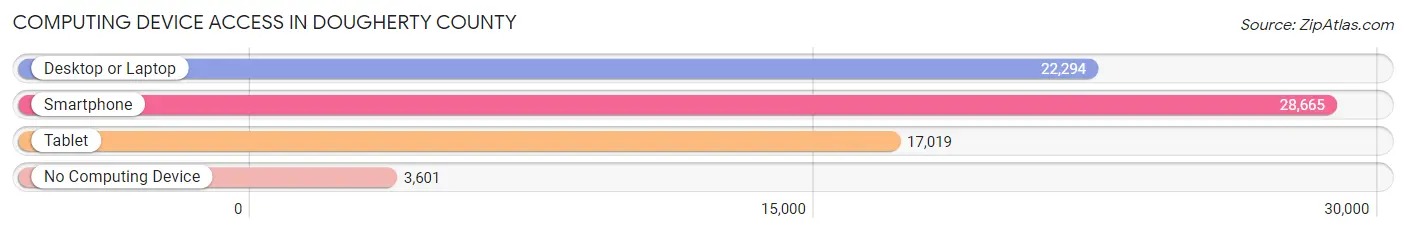
| Device Type | # Households | % Households |
| Desktop or Laptop | 22,294 | 65.5% |
| Smartphone | 28,665 | 84.2% |
| Tablet | 17,019 | 50.0% |
| No Computing Device | 3,601 | 10.6% |
| Total | 34,041 | 100.0% |
Internet Access in Dougherty County
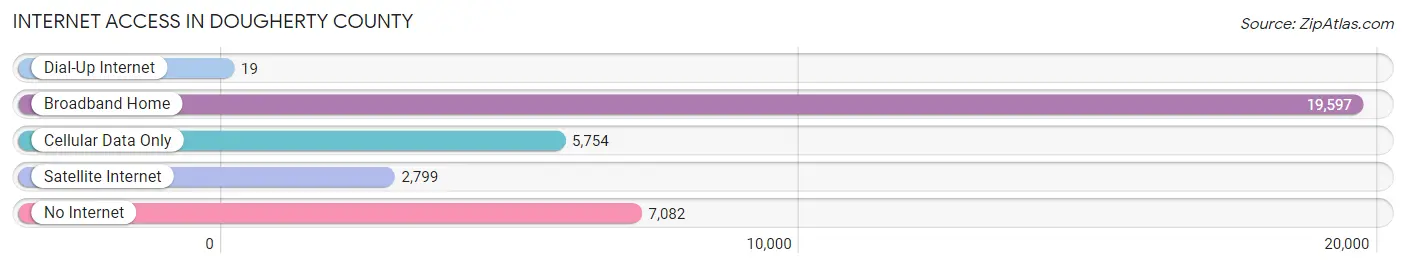
| Internet Type | # Households | % Households |
| Dial-Up Internet | 19 | 0.1% |
| Broadband Home | 19,597 | 57.6% |
| Cellular Data Only | 5,754 | 16.9% |
| Satellite Internet | 2,799 | 8.2% |
| No Internet | 7,082 | 20.8% |
| Total | 34,041 | 100.0% |
Dougherty County Summary
History
Dougherty County, Georgia is located in the southwestern part of the state and is part of the Albany metropolitan area. The county was created in 1853 from a portion of Baker County and was named for Charles Dougherty, a former Georgia Supreme Court justice. The county seat is Albany, which is the largest city in the county.
Dougherty County has a long and rich history. The area was originally inhabited by the Creek Indians, who were forcibly removed in the 1830s as part of the Indian Removal Act. After the removal of the Creek Indians, the area was opened up for settlement by white settlers. The first settlers in the area were mostly farmers and planters, who established small farms and plantations.
The county was officially established in 1853 and the county seat was established in Albany. The city of Albany quickly became the economic and cultural center of the county. The city was a major hub for the cotton industry and was home to several large cotton mills. The city also became a major railroad hub, with several major railroads running through the city.
The county experienced significant growth during the late 19th and early 20th centuries. The population of the county increased from just over 10,000 in 1880 to over 40,000 in 1920. The county also experienced a significant economic boom during this period, with the establishment of several large industries, including the Albany Naval Air Station, which was established in 1941.
Geography
Dougherty County is located in the southwestern part of the state of Georgia. The county is bordered by Lee County to the north, Baker County to the east, Worth County to the south, and Mitchell County to the west. The county covers an area of 545 square miles and has a population of 94,565 as of the 2010 census.
The county is located in the Coastal Plain region of Georgia and is mostly flat. The Flint River runs through the county and is the main source of water for the county. The county is also home to several small lakes, including Lake Chehaw and Lake Blackshear.
Economy
Dougherty County has a diverse economy that is driven by several major industries. The county is home to several large manufacturing companies, including Procter & Gamble, MillerCoors, and Georgia-Pacific. The county is also home to several large healthcare providers, including Phoebe Putney Memorial Hospital and the Albany Area Primary Health Care Center.
The county is also home to several large retail stores, including Walmart, Target, and Lowe’s. The county is also home to several large agricultural operations, including poultry farms and cotton farms.
Demographics
As of the 2010 census, Dougherty County had a population of 94,565. The racial makeup of the county was 57.3% White, 37.2% African American, 0.5% Native American, 1.2% Asian, 0.1% Pacific Islander, 1.7% from other races, and 2.2% from two or more races. Hispanic or Latino of any race were 4.2% of the population.
The median income for a household in the county was $35,945 and the median income for a family was $44,945. The per capita income for the county was $20,845. About 19.2% of the population was below the poverty line.
Common Questions
What is the Total Population of Dougherty County?
Total Population of Dougherty County is 85,038.
What is the Total Male Population of Dougherty County?
Total Male Population of Dougherty County is 39,219.
What is the Total Female Population of Dougherty County?
Total Female Population of Dougherty County is 45,819.
What is the Ratio of Males per 100 Females in Dougherty County?
There are 85.60 Males per 100 Females in Dougherty County.
What is the Ratio of Females per 100 Males in Dougherty County?
There are 116.83 Females per 100 Males in Dougherty County.
What is the Median Population Age in Dougherty County?
Median Population Age in Dougherty County is 36.2 Years.
What is the Average Family Size in Dougherty County
Average Family Size in Dougherty County is 3.1 People.
What is the Average Household Size in Dougherty County
Average Household Size in Dougherty County is 2.4 People.
What is Per Capita Income in Dougherty County?
Per Capita income in Dougherty County is $26,563.
What is the Median Family Income in Dougherty County?
Median Family Income in Dougherty County is $54,050.
What is the Median Household income in Dougherty County?
Median Household Income in Dougherty County is $45,640.
What is Income or Wage Gap in Dougherty County?
Income or Wage Gap in Dougherty County is 24.4%.
Women in Dougherty County earn 75.6 cents for every dollar earned by a man.
What is Family Income Deficit in Dougherty County?
Family Income Deficit in Dougherty County is $12,329.
Families that are below poverty line in Dougherty County earn $12,329 less on average than the poverty threshold level.
What is Inequality or Gini Index in Dougherty County?
Inequality or Gini Index in Dougherty County is 0.49.
How Large is the Labor Force in Dougherty County?
There are 37,547 People in the Labor Forcein in Dougherty County.
What is the Percentage of People in the Labor Force in Dougherty County?
56.1% of People are in the Labor Force in Dougherty County.
What is the Unemployment Rate in Dougherty County?
Unemployment Rate in Dougherty County is 10.0%.