Newton County, GA
Newton County Map
Newton County Overview
113,298
TOTAL POPULATION
53,614
MALE POPULATION
59,684
FEMALE POPULATION
89.83
MALES / 100 FEMALES
111.32
FEMALES / 100 MALES
36.4
MEDIAN AGE
3.3
AVG FAMILY SIZE
2.8
AVG HOUSEHOLD SIZE
$30,101
PER CAPITA INCOME
$75,725
AVG FAMILY INCOME
$70,732
AVG HOUSEHOLD INCOME
23.5%
WAGE / INCOME GAP [ % ]
76.5¢/ $1
WAGE / INCOME GAP [ $ ]
$11,151
FAMILY INCOME DEFICIT
0.41
INEQUALITY / GINI INDEX
56,618
LABOR FORCE [ PEOPLE ]
64.7%
PERCENT IN LABOR FORCE
6.6%
UNEMPLOYMENT RATE
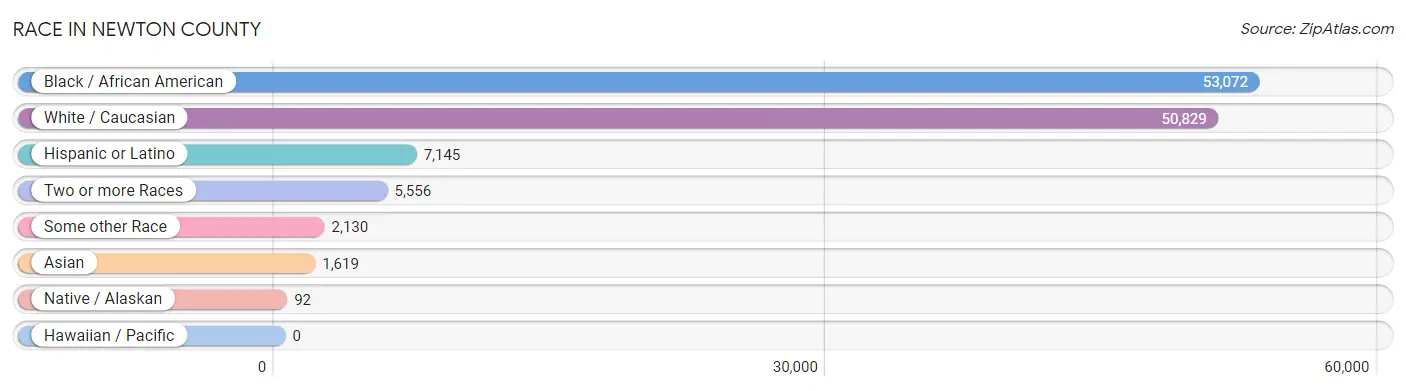
Race in Newton County
The most populous races in Newton County are Black / African American (53,072 | 46.8%), White / Caucasian (50,829 | 44.9%), and Hispanic or Latino (7,145 | 6.3%).
| Race | # Population | % Population |
| Asian | 1,619 | 1.4% |
| Black / African American | 53,072 | 46.8% |
| Hawaiian / Pacific | 0 | 0.0% |
| Hispanic or Latino | 7,145 | 6.3% |
| Native / Alaskan | 92 | 0.1% |
| White / Caucasian | 50,829 | 44.9% |
| Two or more Races | 5,556 | 4.9% |
| Some other Race | 2,130 | 1.9% |
| Total | 113,298 | 100.0% |
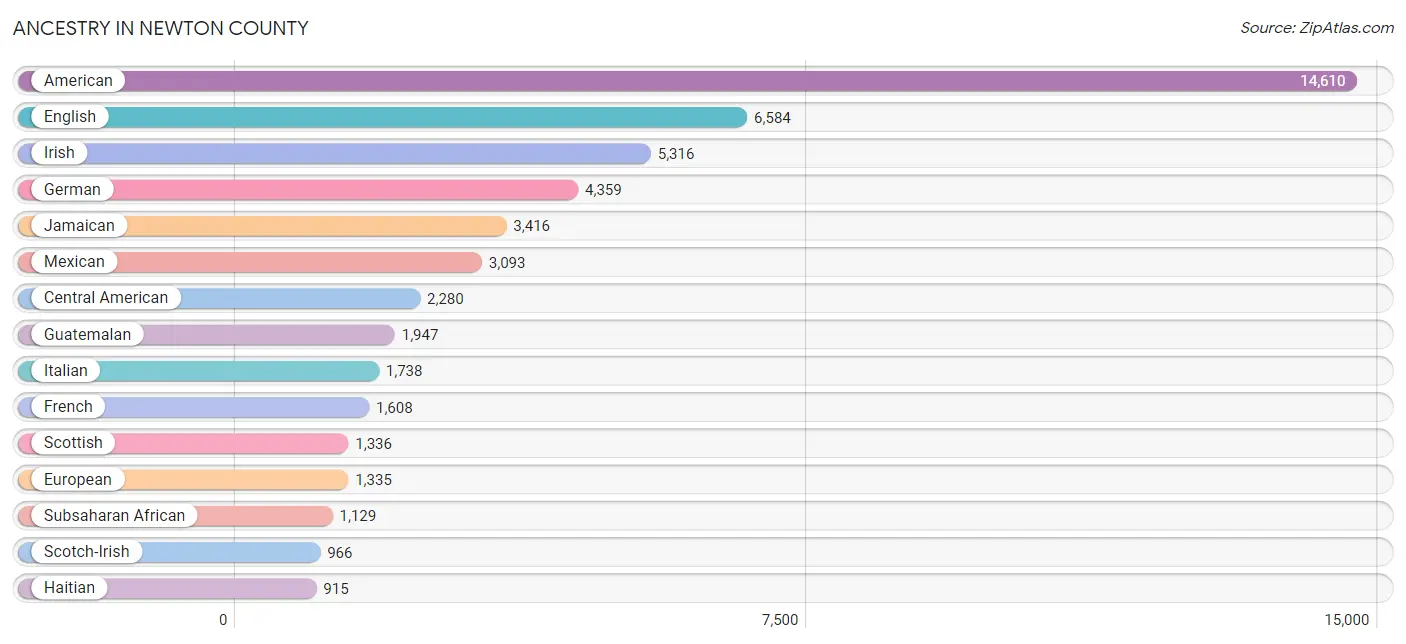
Ancestry in Newton County
The most populous ancestries reported in Newton County are American (14,610 | 12.9%), English (6,584 | 5.8%), Irish (5,316 | 4.7%), German (4,359 | 3.8%), and Jamaican (3,416 | 3.0%), together accounting for 30.3% of all Newton County residents.
| Ancestry | # Population | % Population |
| African | 850 | 0.7% |
| American | 14,610 | 12.9% |
| Arab | 105 | 0.1% |
| Argentinean | 61 | 0.1% |
| Australian | 39 | 0.0% |
| Bahamian | 73 | 0.1% |
| Bangladeshi | 339 | 0.3% |
| Barbadian | 15 | 0.0% |
| Basque | 61 | 0.1% |
| Belgian | 41 | 0.0% |
| Belizean | 18 | 0.0% |
| Bhutanese | 157 | 0.1% |
| Blackfeet | 2 | 0.0% |
| British | 218 | 0.2% |
| British West Indian | 679 | 0.6% |
| Bulgarian | 8 | 0.0% |
| Burmese | 98 | 0.1% |
| Cajun | 24 | 0.0% |
| Canadian | 124 | 0.1% |
| Celtic | 12 | 0.0% |
| Central American | 2,280 | 2.0% |
| Cherokee | 326 | 0.3% |
| Chilean | 5 | 0.0% |
| Choctaw | 49 | 0.0% |
| Colombian | 291 | 0.3% |
| Costa Rican | 41 | 0.0% |
| Croatian | 38 | 0.0% |
| Cuban | 311 | 0.3% |
| Czech | 54 | 0.1% |
| Czechoslovakian | 76 | 0.1% |
| Danish | 76 | 0.1% |
| Dominican | 64 | 0.1% |
| Dutch | 429 | 0.4% |
| Eastern European | 11 | 0.0% |
| English | 6,584 | 5.8% |
| Ethiopian | 59 | 0.1% |
| European | 1,335 | 1.2% |
| Filipino | 2 | 0.0% |
| French | 1,608 | 1.4% |
| French Canadian | 58 | 0.1% |
| German | 4,359 | 3.8% |
| Ghanaian | 15 | 0.0% |
| Greek | 125 | 0.1% |
| Guatemalan | 1,947 | 1.7% |
| Guyanese | 148 | 0.1% |
| Haitian | 915 | 0.8% |
| Honduran | 13 | 0.0% |
| Hungarian | 66 | 0.1% |
| Indian (Asian) | 283 | 0.3% |
| Inupiat | 7 | 0.0% |
| Irish | 5,316 | 4.7% |
| Iroquois | 15 | 0.0% |
| Italian | 1,738 | 1.5% |
| Jamaican | 3,416 | 3.0% |
| Japanese | 258 | 0.2% |
| Kenyan | 91 | 0.1% |
| Korean | 312 | 0.3% |
| Lebanese | 33 | 0.0% |
| Lithuanian | 9 | 0.0% |
| Lumbee | 4 | 0.0% |
| Mexican | 3,093 | 2.7% |
| Mongolian | 139 | 0.1% |
| Moroccan | 72 | 0.1% |
| Nigerian | 72 | 0.1% |
| Northern European | 72 | 0.1% |
| Norwegian | 187 | 0.2% |
| Pakistani | 26 | 0.0% |
| Panamanian | 54 | 0.1% |
| Polish | 707 | 0.6% |
| Portuguese | 70 | 0.1% |
| Puerto Rican | 870 | 0.8% |
| Romanian | 30 | 0.0% |
| Russian | 90 | 0.1% |
| Salvadoran | 225 | 0.2% |
| Scandinavian | 178 | 0.2% |
| Scotch-Irish | 966 | 0.9% |
| Scottish | 1,336 | 1.2% |
| Seminole | 11 | 0.0% |
| Senegalese | 3 | 0.0% |
| Sioux | 3 | 0.0% |
| Slovak | 32 | 0.0% |
| South American | 456 | 0.4% |
| South American Indian | 101 | 0.1% |
| Spaniard | 26 | 0.0% |
| Sri Lankan | 124 | 0.1% |
| Subsaharan African | 1,129 | 1.0% |
| Swedish | 240 | 0.2% |
| Swiss | 16 | 0.0% |
| Thai | 337 | 0.3% |
| Tongan | 7 | 0.0% |
| Trinidadian and Tobagonian | 184 | 0.2% |
| Turkish | 90 | 0.1% |
| U.S. Virgin Islander | 42 | 0.0% |
| Ugandan | 2 | 0.0% |
| Ukrainian | 55 | 0.1% |
| Uruguayan | 40 | 0.0% |
| Venezuelan | 59 | 0.1% |
| Welsh | 293 | 0.3% |
| West Indian | 513 | 0.4% |
| Yugoslavian | 13 | 0.0% | View All 100 Rows |
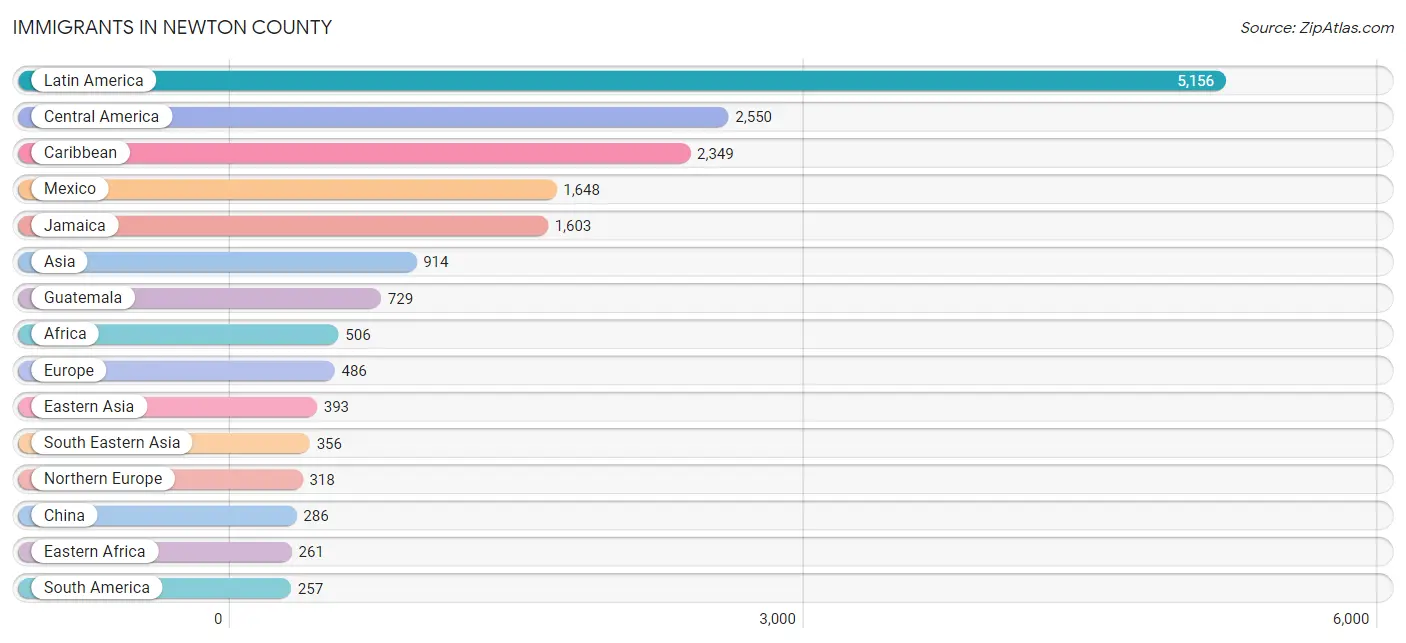
Immigrants in Newton County
The most numerous immigrant groups reported in Newton County came from Latin America (5,156 | 4.5%), Central America (2,550 | 2.2%), Caribbean (2,349 | 2.1%), Mexico (1,648 | 1.5%), and Jamaica (1,603 | 1.4%), together accounting for 11.7% of all Newton County residents.
| Immigration Origin | # Population | % Population |
| Africa | 506 | 0.4% |
| Argentina | 61 | 0.1% |
| Asia | 914 | 0.8% |
| Bangladesh | 26 | 0.0% |
| Barbados | 21 | 0.0% |
| Bulgaria | 2 | 0.0% |
| Cambodia | 18 | 0.0% |
| Cameroon | 16 | 0.0% |
| Canada | 66 | 0.1% |
| Caribbean | 2,349 | 2.1% |
| Central America | 2,550 | 2.2% |
| China | 286 | 0.3% |
| Costa Rica | 15 | 0.0% |
| Cuba | 31 | 0.0% |
| Dominica | 37 | 0.0% |
| Eastern Africa | 261 | 0.2% |
| Eastern Asia | 393 | 0.4% |
| Eastern Europe | 45 | 0.0% |
| El Salvador | 130 | 0.1% |
| England | 243 | 0.2% |
| Ethiopia | 20 | 0.0% |
| Europe | 486 | 0.4% |
| France | 26 | 0.0% |
| Germany | 46 | 0.0% |
| Ghana | 15 | 0.0% |
| Grenada | 59 | 0.1% |
| Guatemala | 729 | 0.6% |
| Guyana | 154 | 0.1% |
| Haiti | 201 | 0.2% |
| Honduras | 13 | 0.0% |
| Hong Kong | 73 | 0.1% |
| India | 132 | 0.1% |
| Italy | 50 | 0.0% |
| Jamaica | 1,603 | 1.4% |
| Japan | 69 | 0.1% |
| Kenya | 241 | 0.2% |
| Korea | 38 | 0.0% |
| Laos | 37 | 0.0% |
| Latin America | 5,156 | 4.5% |
| Lebanon | 7 | 0.0% |
| Malaysia | 153 | 0.1% |
| Mexico | 1,648 | 1.5% |
| Middle Africa | 37 | 0.0% |
| Morocco | 36 | 0.0% |
| Nigeria | 115 | 0.1% |
| Northern Africa | 36 | 0.0% |
| Northern Europe | 318 | 0.3% |
| Panama | 15 | 0.0% |
| Philippines | 72 | 0.1% |
| Romania | 26 | 0.0% |
| Scotland | 40 | 0.0% |
| South America | 257 | 0.2% |
| South Central Asia | 158 | 0.1% |
| South Eastern Asia | 356 | 0.3% |
| Southern Europe | 51 | 0.1% |
| Spain | 1 | 0.0% |
| St. Vincent and the Grenadines | 40 | 0.0% |
| Taiwan | 14 | 0.0% |
| Thailand | 76 | 0.1% |
| Trinidad and Tobago | 51 | 0.1% |
| Ukraine | 17 | 0.0% |
| Uruguay | 20 | 0.0% |
| Venezuela | 22 | 0.0% |
| Western Africa | 172 | 0.2% |
| Western Asia | 7 | 0.0% |
| Western Europe | 72 | 0.1% |
| Zaire | 21 | 0.0% | View All 67 Rows |
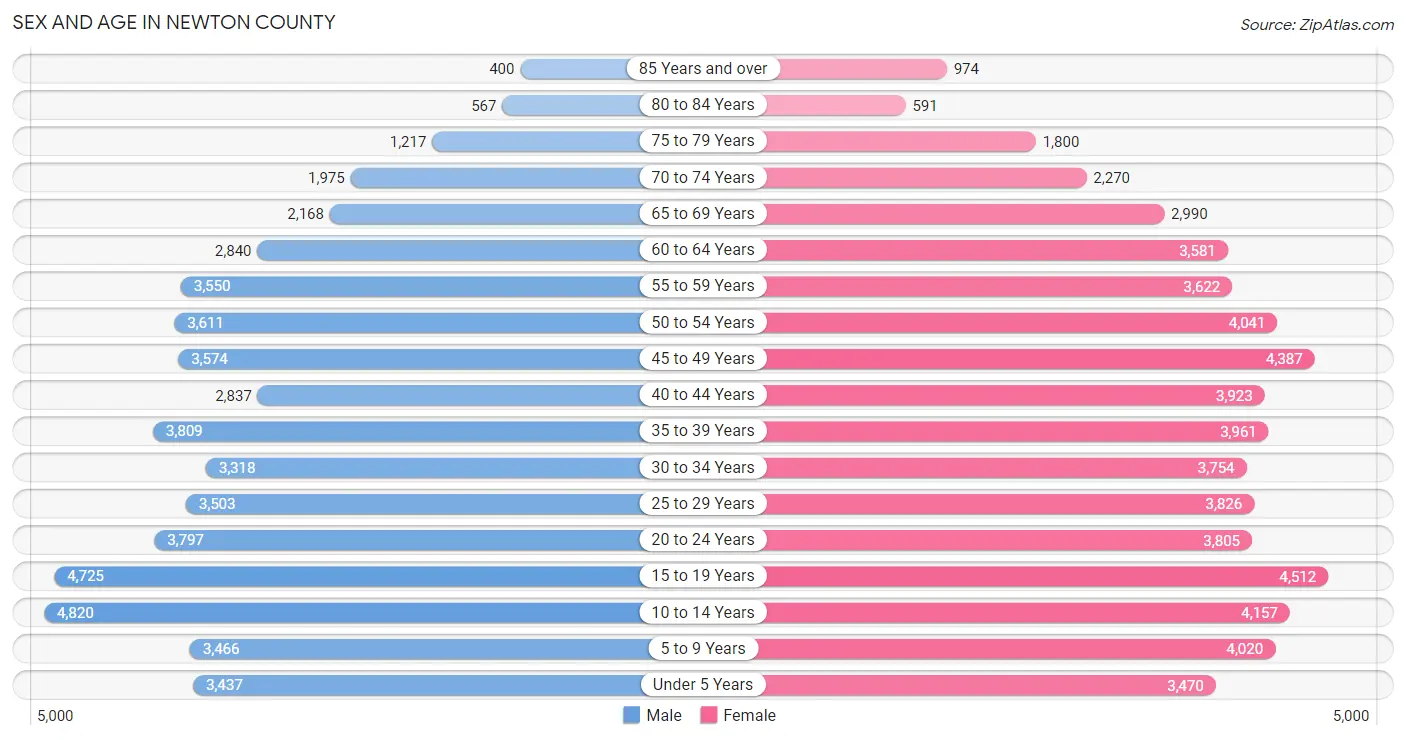
Sex and Age in Newton County
Sex and Age in Newton County
The most populous age groups in Newton County are 10 to 14 Years (4,820 | 9.0%) for men and 15 to 19 Years (4,512 | 7.6%) for women.
| Age Bracket | Male | Female |
| Under 5 Years | 3,437 (6.4%) | 3,470 (5.8%) |
| 5 to 9 Years | 3,466 (6.5%) | 4,020 (6.7%) |
| 10 to 14 Years | 4,820 (9.0%) | 4,157 (7.0%) |
| 15 to 19 Years | 4,725 (8.8%) | 4,512 (7.6%) |
| 20 to 24 Years | 3,797 (7.1%) | 3,805 (6.4%) |
| 25 to 29 Years | 3,503 (6.5%) | 3,826 (6.4%) |
| 30 to 34 Years | 3,318 (6.2%) | 3,754 (6.3%) |
| 35 to 39 Years | 3,809 (7.1%) | 3,961 (6.6%) |
| 40 to 44 Years | 2,837 (5.3%) | 3,923 (6.6%) |
| 45 to 49 Years | 3,574 (6.7%) | 4,387 (7.3%) |
| 50 to 54 Years | 3,611 (6.7%) | 4,041 (6.8%) |
| 55 to 59 Years | 3,550 (6.6%) | 3,622 (6.1%) |
| 60 to 64 Years | 2,840 (5.3%) | 3,581 (6.0%) |
| 65 to 69 Years | 2,168 (4.0%) | 2,990 (5.0%) |
| 70 to 74 Years | 1,975 (3.7%) | 2,270 (3.8%) |
| 75 to 79 Years | 1,217 (2.3%) | 1,800 (3.0%) |
| 80 to 84 Years | 567 (1.1%) | 591 (1.0%) |
| 85 Years and over | 400 (0.7%) | 974 (1.6%) |
| Total | 53,614 (100.0%) | 59,684 (100.0%) |
Families and Households in Newton County
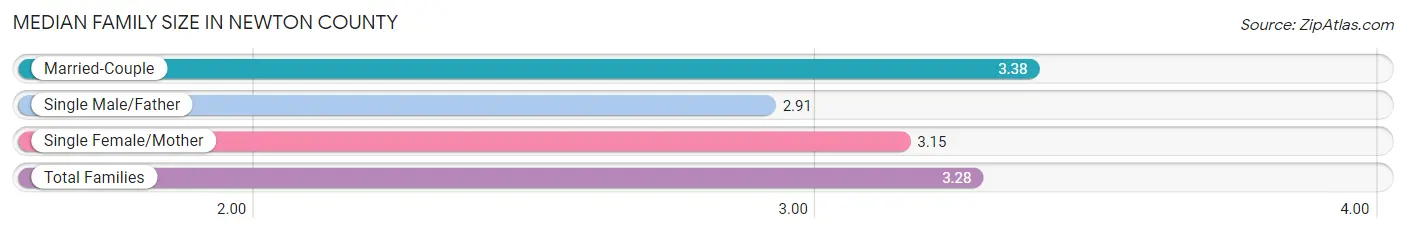
Median Family Size in Newton County
The median family size in Newton County is 3.28 persons per family, with married-couple families (19,168 | 65.3%) accounting for the largest median family size of 3.38 persons per family. On the other hand, single male/father families (2,266 | 7.7%) represent the smallest median family size with 2.91 persons per family.
| Family Type | # Families | Family Size |
| Married-Couple | 19,168 (65.3%) | 3.38 |
| Single Male/Father | 2,266 (7.7%) | 2.91 |
| Single Female/Mother | 7,906 (27.0%) | 3.15 |
| Total Families | 29,340 (100.0%) | 3.28 |
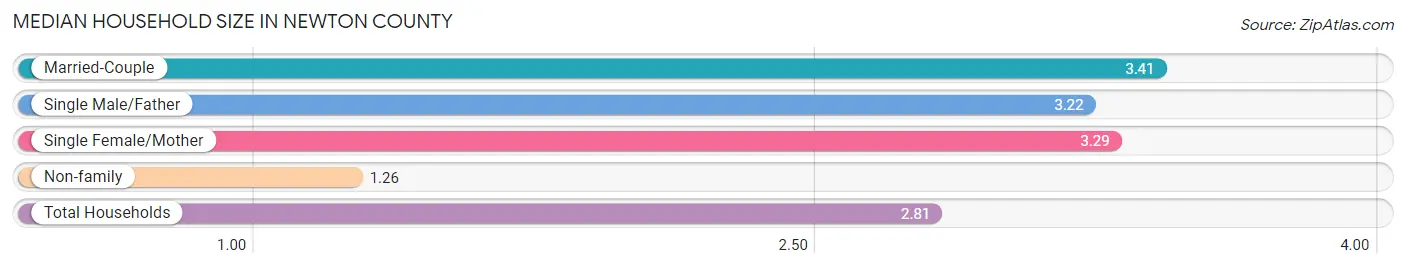
Median Household Size in Newton County
The median household size in Newton County is 2.81 persons per household, with married-couple households (19,168 | 48.0%) accounting for the largest median household size of 3.41 persons per household. non-family households (10,566 | 26.5%) represent the smallest median household size with 1.26 persons per household.
| Household Type | # Households | Household Size |
| Married-Couple | 19,168 (48.0%) | 3.41 |
| Single Male/Father | 2,266 (5.7%) | 3.22 |
| Single Female/Mother | 7,906 (19.8%) | 3.29 |
| Non-family | 10,566 (26.5%) | 1.26 |
| Total Households | 39,906 (100.0%) | 2.81 |
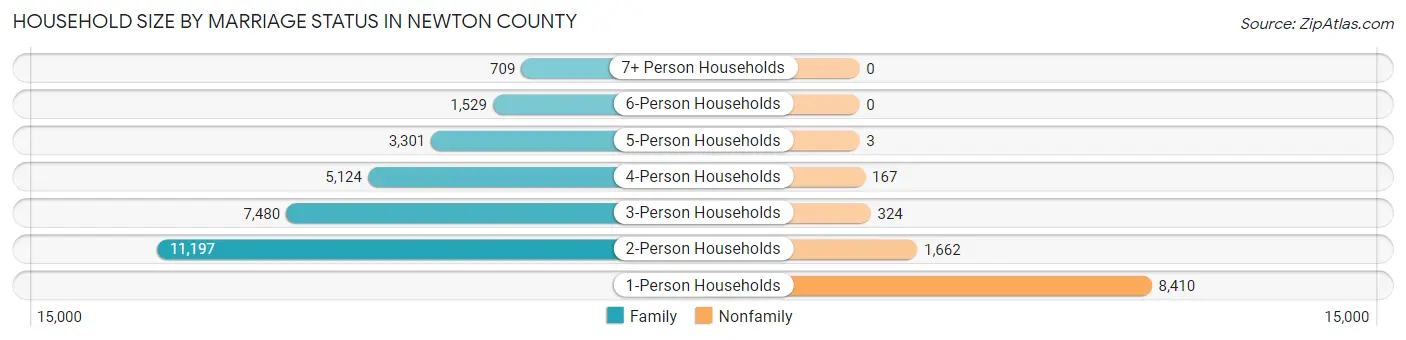
Household Size by Marriage Status in Newton County
Out of a total of 39,906 households in Newton County, 29,340 (73.5%) are family households, while 10,566 (26.5%) are nonfamily households. The most numerous type of family households are 2-person households, comprising 11,197, and the most common type of nonfamily households are 1-person households, comprising 8,410.
| Household Size | Family Households | Nonfamily Households |
| 1-Person Households | - | 8,410 (21.1%) |
| 2-Person Households | 11,197 (28.1%) | 1,662 (4.2%) |
| 3-Person Households | 7,480 (18.7%) | 324 (0.8%) |
| 4-Person Households | 5,124 (12.8%) | 167 (0.4%) |
| 5-Person Households | 3,301 (8.3%) | 3 (0.0%) |
| 6-Person Households | 1,529 (3.8%) | 0 (0.0%) |
| 7+ Person Households | 709 (1.8%) | 0 (0.0%) |
| Total | 29,340 (73.5%) | 10,566 (26.5%) |
Female Fertility in Newton County
Fertility by Age in Newton County
Average fertility rate in Newton County is 47.0 births per 1,000 women. Women in the age bracket of 20 to 34 years have the highest fertility rate with 85.0 births per 1,000 women. Women in the age bracket of 20 to 34 years acount for 71.6% of all women with births.
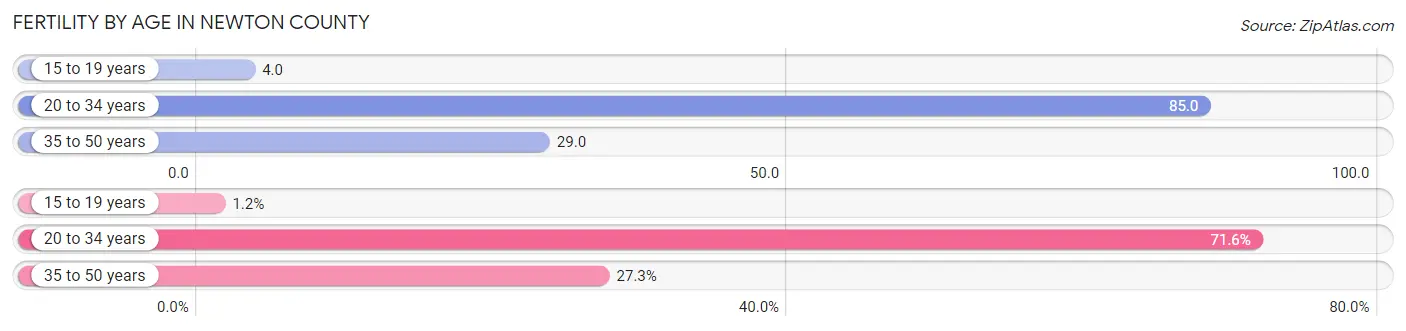
| Age Bracket | Women with Births | Births / 1,000 Women |
| 15 to 19 years | 16 (1.2%) | 4.0 |
| 20 to 34 years | 969 (71.6%) | 85.0 |
| 35 to 50 years | 369 (27.3%) | 29.0 |
| Total | 1,354 (100.0%) | 47.0 |
Fertility by Age by Marriage Status in Newton County
56.0% of women with births (1,354) in Newton County are married. The highest percentage of unmarried women with births falls into 15 to 19 years age bracket with 100.0% of them unmarried at the time of birth, while the lowest percentage of unmarried women with births belong to 20 to 34 years age bracket with 37.3% of them unmarried.
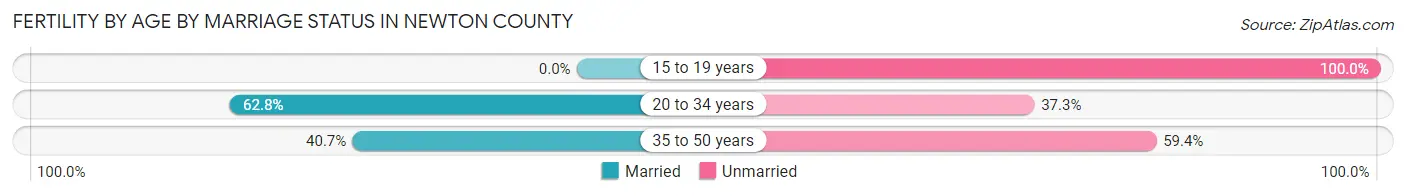
| Age Bracket | Married | Unmarried |
| 15 to 19 years | 0 (0.0%) | 16 (100.0%) |
| 20 to 34 years | 608 (62.7%) | 361 (37.2%) |
| 35 to 50 years | 150 (40.6%) | 219 (59.4%) |
| Total | 758 (56.0%) | 596 (44.0%) |
Fertility by Education in Newton County
Average fertility rate in Newton County is 47.0 births per 1,000 women. Women with the education attainment of bachelor's degree have the highest fertility rate of 89.0 births per 1,000 women, while women with the education attainment of less than high school have the lowest fertility at 13.0 births per 1,000 women. Women with the education attainment of college or associate's degree represent 43.8% of all women with births.
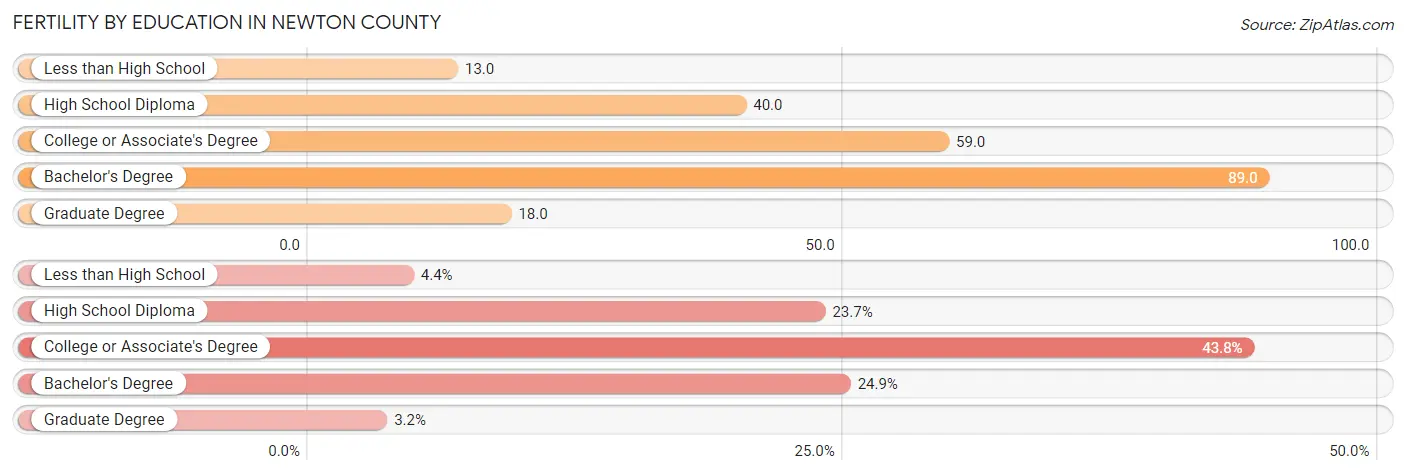
| Educational Attainment | Women with Births | Births / 1,000 Women |
| Less than High School | 60 (4.4%) | 13.0 |
| High School Diploma | 321 (23.7%) | 40.0 |
| College or Associate's Degree | 593 (43.8%) | 59.0 |
| Bachelor's Degree | 337 (24.9%) | 89.0 |
| Graduate Degree | 43 (3.2%) | 18.0 |
| Total | 1,354 (100.0%) | 47.0 |
Fertility by Education by Marriage Status in Newton County
44.0% of women with births in Newton County are unmarried. Women with the educational attainment of graduate degree are most likely to be married with 100.0% of them married at childbirth, while women with the educational attainment of less than high school are least likely to be married with 100.0% of them unmarried at childbirth.
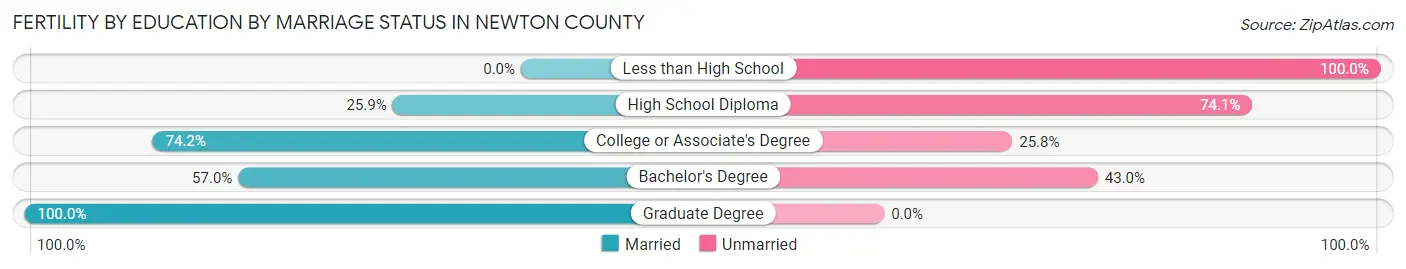
| Educational Attainment | Married | Unmarried |
| Less than High School | 0 (0.0%) | 60 (100.0%) |
| High School Diploma | 83 (25.9%) | 238 (74.1%) |
| College or Associate's Degree | 440 (74.2%) | 153 (25.8%) |
| Bachelor's Degree | 192 (57.0%) | 145 (43.0%) |
| Graduate Degree | 43 (100.0%) | 0 (0.0%) |
| Total | 758 (56.0%) | 596 (44.0%) |
Income in Newton County
Income Overview in Newton County
Per Capita Income in Newton County is $30,101, while median incomes of families and households are $75,725 and $70,732 respectively.
| Characteristic | Number | Measure |
| Per Capita Income | 113,298 | $30,101 |
| Median Family Income | 29,340 | $75,725 |
| Mean Family Income | 29,340 | $91,755 |
| Median Household Income | 39,906 | $70,732 |
| Mean Household Income | 39,906 | $84,253 |
| Income Deficit | 29,340 | $11,151 |
| Wage / Income Gap (%) | 113,298 | 23.47% |
| Wage / Income Gap ($) | 113,298 | 76.53¢ per $1 |
| Gini / Inequality Index | 113,298 | 0.41 |
Earnings by Sex in Newton County
Average Earnings in Newton County are $36,226, $40,931 for men and $31,324 for women, a difference of 23.5%.
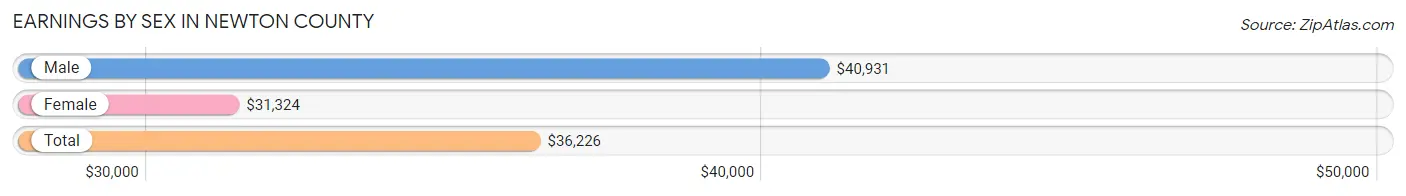
| Sex | Number | Average Earnings |
| Male | 28,646 (48.8%) | $40,931 |
| Female | 30,049 (51.2%) | $31,324 |
| Total | 58,695 (100.0%) | $36,226 |
Earnings by Sex by Income Bracket in Newton County
The most common earnings brackets in Newton County are $100,000+ for men (3,008 | 10.5%) and $40,000 to $44,999 for women (2,062 | 6.9%).
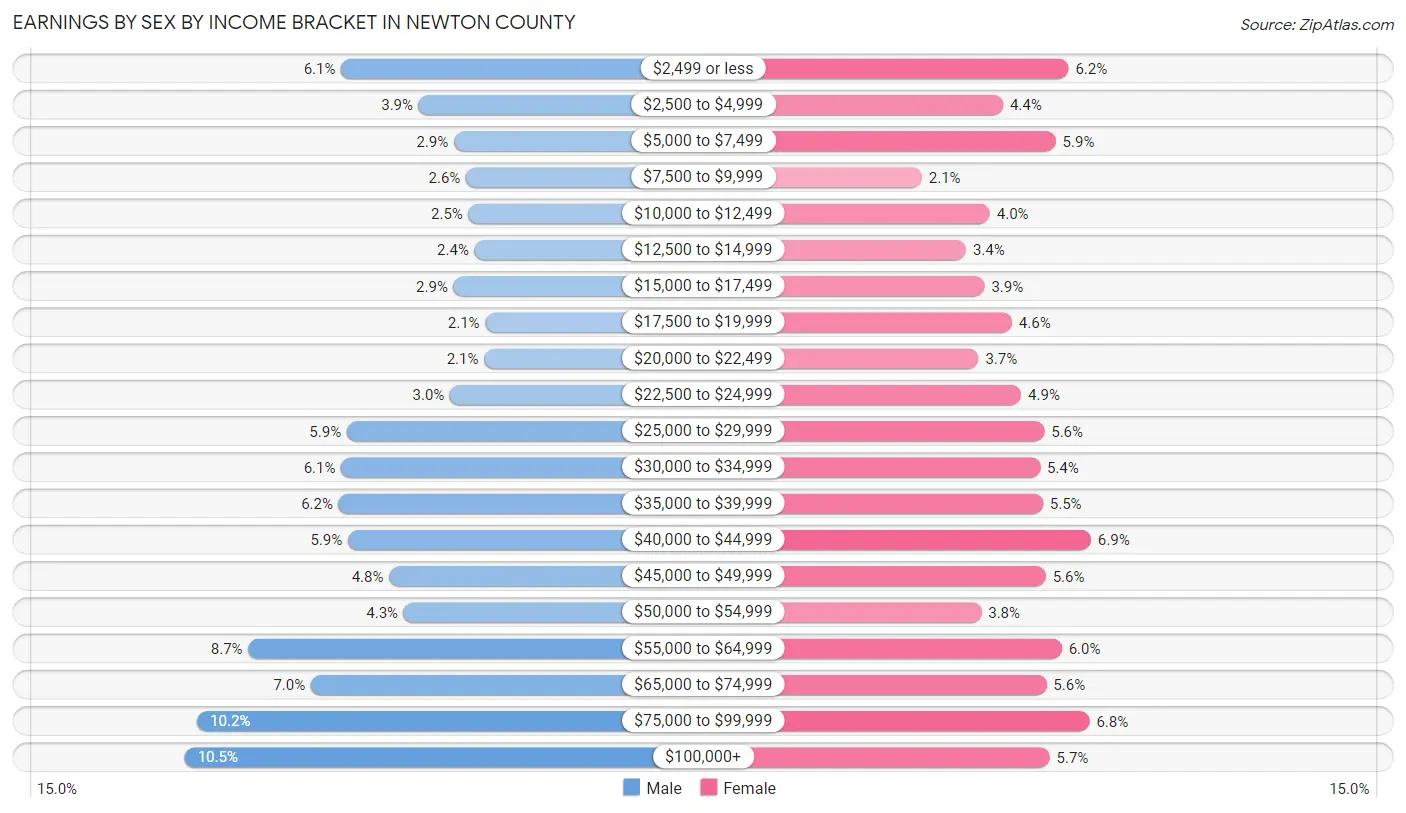
| Income | Male | Female |
| $2,499 or less | 1,746 (6.1%) | 1,872 (6.2%) |
| $2,500 to $4,999 | 1,122 (3.9%) | 1,320 (4.4%) |
| $5,000 to $7,499 | 839 (2.9%) | 1,764 (5.9%) |
| $7,500 to $9,999 | 742 (2.6%) | 633 (2.1%) |
| $10,000 to $12,499 | 721 (2.5%) | 1,207 (4.0%) |
| $12,500 to $14,999 | 672 (2.4%) | 1,006 (3.4%) |
| $15,000 to $17,499 | 841 (2.9%) | 1,163 (3.9%) |
| $17,500 to $19,999 | 586 (2.1%) | 1,394 (4.6%) |
| $20,000 to $22,499 | 595 (2.1%) | 1,113 (3.7%) |
| $22,500 to $24,999 | 871 (3.0%) | 1,473 (4.9%) |
| $25,000 to $29,999 | 1,701 (5.9%) | 1,669 (5.6%) |
| $30,000 to $34,999 | 1,746 (6.1%) | 1,632 (5.4%) |
| $35,000 to $39,999 | 1,768 (6.2%) | 1,656 (5.5%) |
| $40,000 to $44,999 | 1,692 (5.9%) | 2,062 (6.9%) |
| $45,000 to $49,999 | 1,361 (4.8%) | 1,681 (5.6%) |
| $50,000 to $54,999 | 1,242 (4.3%) | 1,137 (3.8%) |
| $55,000 to $64,999 | 2,495 (8.7%) | 1,816 (6.0%) |
| $65,000 to $74,999 | 1,990 (7.0%) | 1,687 (5.6%) |
| $75,000 to $99,999 | 2,908 (10.2%) | 2,050 (6.8%) |
| $100,000+ | 3,008 (10.5%) | 1,714 (5.7%) |
| Total | 28,646 (100.0%) | 30,049 (100.0%) |
Earnings by Sex by Educational Attainment in Newton County
Average earnings in Newton County are $46,418 for men and $37,015 for women, a difference of 20.3%. Men with an educational attainment of graduate degree enjoy the highest average annual earnings of $79,457, while those with less than high school education earn the least with $35,788. Women with an educational attainment of graduate degree earn the most with the average annual earnings of $69,447, while those with less than high school education have the smallest earnings of $21,355.
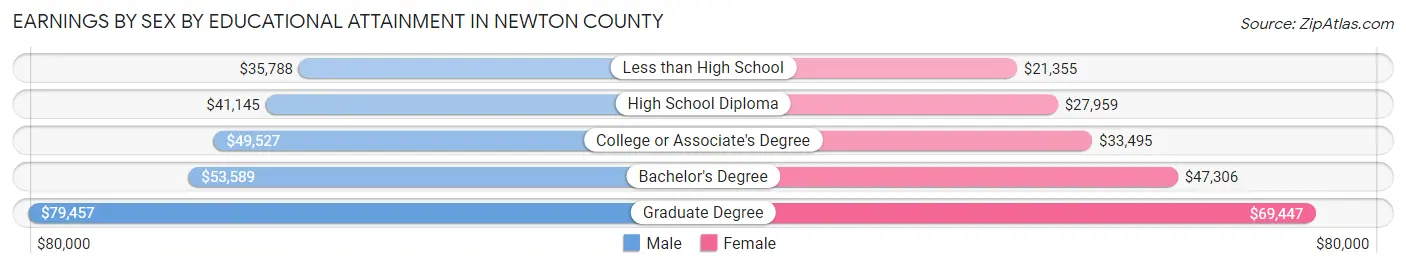
| Educational Attainment | Male Income | Female Income |
| Less than High School | $35,788 | $21,355 |
| High School Diploma | $41,145 | $27,959 |
| College or Associate's Degree | $49,527 | $33,495 |
| Bachelor's Degree | $53,589 | $47,306 |
| Graduate Degree | $79,457 | $69,447 |
| Total | $46,418 | $37,015 |
Family Income in Newton County
Family Income Brackets in Newton County
According to the Newton County family income data, there are 6,279 families falling into the $100,000 to $149,999 income range, which is the most common income bracket and makes up 21.4% of all families. Conversely, the $10,000 to $14,999 income bracket is the least frequent group with only 557 families (1.9%) belonging to this category.
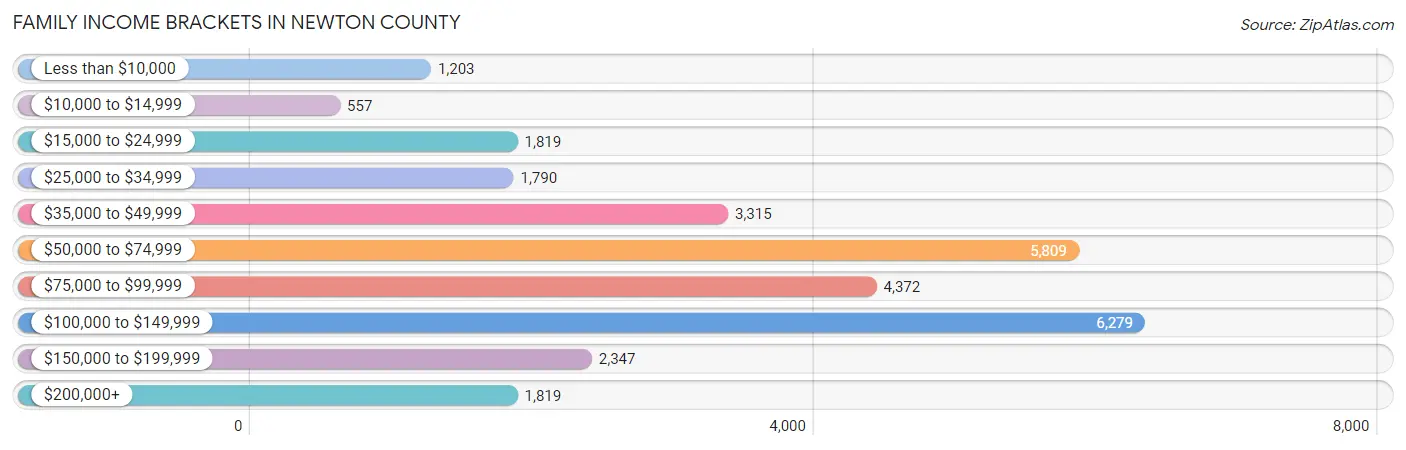
| Income Bracket | # Families | % Families |
| Less than $10,000 | 1,203 | 4.1% |
| $10,000 to $14,999 | 557 | 1.9% |
| $15,000 to $24,999 | 1,819 | 6.2% |
| $25,000 to $34,999 | 1,790 | 6.1% |
| $35,000 to $49,999 | 3,315 | 11.3% |
| $50,000 to $74,999 | 5,809 | 19.8% |
| $75,000 to $99,999 | 4,372 | 14.9% |
| $100,000 to $149,999 | 6,279 | 21.4% |
| $150,000 to $199,999 | 2,347 | 8.0% |
| $200,000+ | 1,819 | 6.2% |
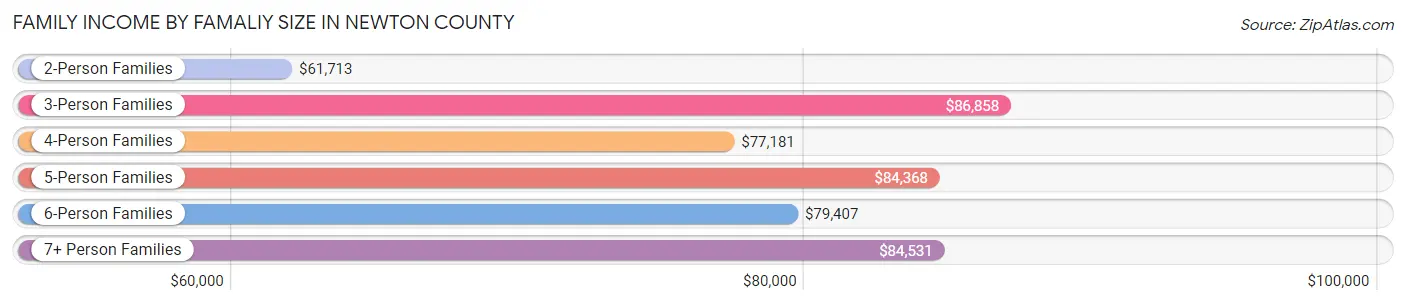
Family Income by Famaliy Size in Newton County
3-person families (7,201 | 24.5%) account for the highest median family income in Newton County with $86,858 per family, while 2-person families (12,046 | 41.1%) have the highest median income of $30,856 per family member.
| Income Bracket | # Families | Median Income |
| 2-Person Families | 12,046 (41.1%) | $61,713 |
| 3-Person Families | 7,201 (24.5%) | $86,858 |
| 4-Person Families | 4,964 (16.9%) | $77,181 |
| 5-Person Families | 3,337 (11.4%) | $84,368 |
| 6-Person Families | 1,249 (4.3%) | $79,407 |
| 7+ Person Families | 543 (1.8%) | $84,531 |
| Total | 29,340 (100.0%) | $75,725 |
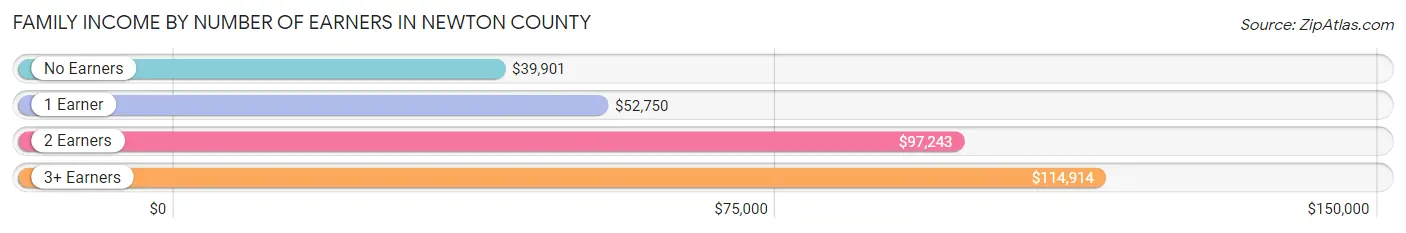
Family Income by Number of Earners in Newton County
The median family income in Newton County is $75,725, with families comprising 3+ earners (3,942) having the highest median family income of $114,914, while families with no earners (4,133) have the lowest median family income of $39,901, accounting for 13.4% and 14.1% of families, respectively.
| Number of Earners | # Families | Median Income |
| No Earners | 4,133 (14.1%) | $39,901 |
| 1 Earner | 9,020 (30.7%) | $52,750 |
| 2 Earners | 12,245 (41.7%) | $97,243 |
| 3+ Earners | 3,942 (13.4%) | $114,914 |
| Total | 29,340 (100.0%) | $75,725 |
Household Income in Newton County
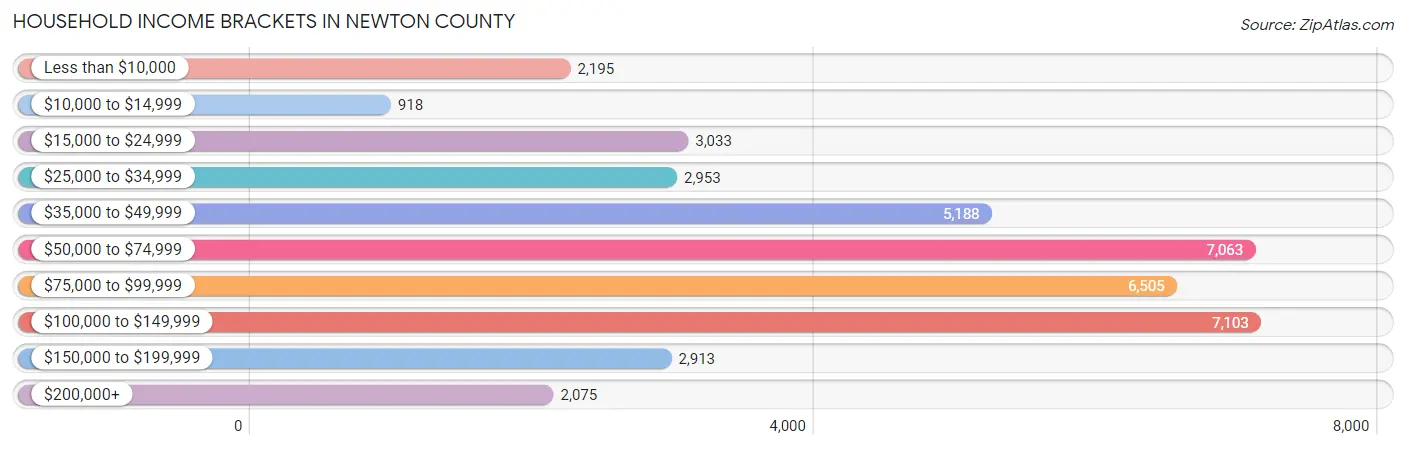
Household Income Brackets in Newton County
With 7,103 households falling in the category, the $100,000 to $149,999 income range is the most frequent in Newton County, accounting for 17.8% of all households. In contrast, only 918 households (2.3%) fall into the $10,000 to $14,999 income bracket, making it the least populous group.
| Income Bracket | # Households | % Households |
| Less than $10,000 | 2,195 | 5.5% |
| $10,000 to $14,999 | 918 | 2.3% |
| $15,000 to $24,999 | 3,033 | 7.6% |
| $25,000 to $34,999 | 2,953 | 7.4% |
| $35,000 to $49,999 | 5,188 | 13.0% |
| $50,000 to $74,999 | 7,063 | 17.7% |
| $75,000 to $99,999 | 6,505 | 16.3% |
| $100,000 to $149,999 | 7,103 | 17.8% |
| $150,000 to $199,999 | 2,913 | 7.3% |
| $200,000+ | 2,075 | 5.2% |
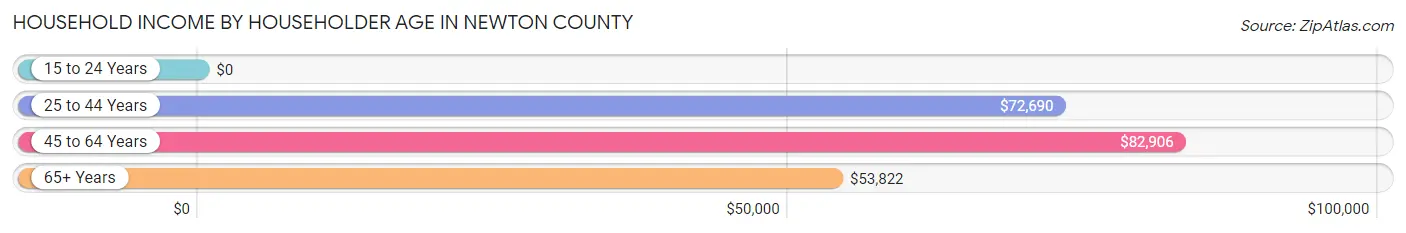
Household Income by Householder Age in Newton County
The median household income in Newton County is $70,732, with the highest median household income of $82,906 found in the 45 to 64 years age bracket for the primary householder. A total of 16,257 households (40.7%) fall into this category. Meanwhile, the 15 to 24 years age bracket for the primary householder has the lowest median household income of $0, with 845 households (2.1%) in this group.
| Income Bracket | # Households | Median Income |
| 15 to 24 Years | 845 (2.1%) | $0 |
| 25 to 44 Years | 13,601 (34.1%) | $72,690 |
| 45 to 64 Years | 16,257 (40.7%) | $82,906 |
| 65+ Years | 9,203 (23.1%) | $53,822 |
| Total | 39,906 (100.0%) | $70,732 |
Poverty in Newton County
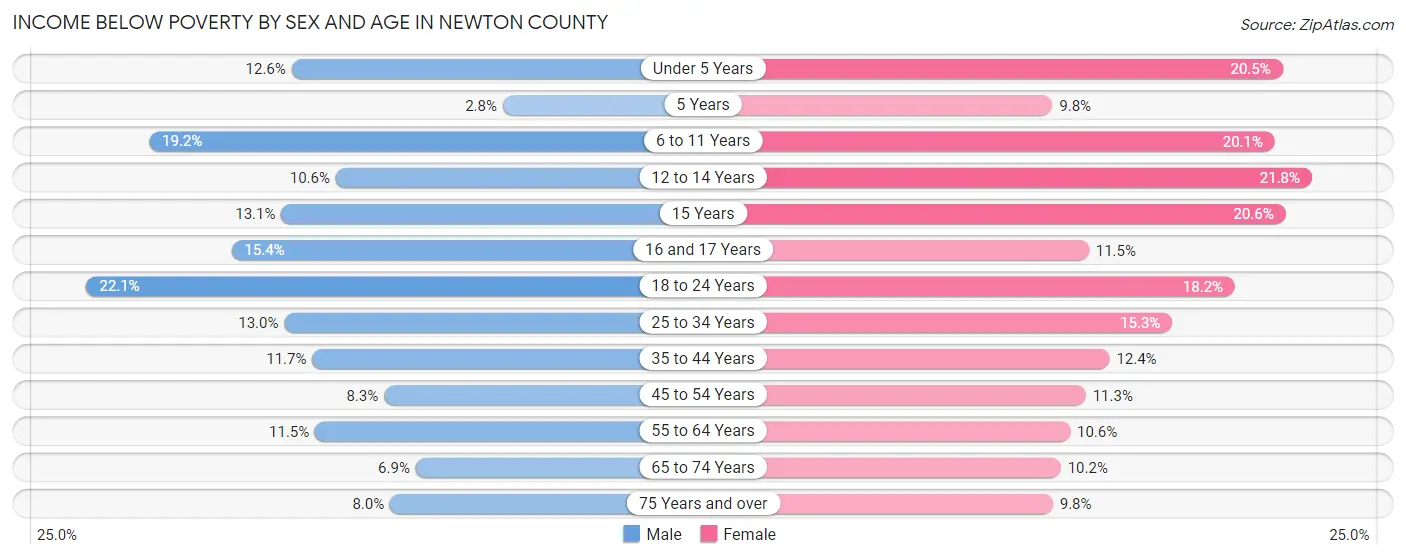
Income Below Poverty by Sex and Age in Newton County
With 12.6% poverty level for males and 14.1% for females among the residents of Newton County, 18 to 24 year old males and 12 to 14 year old females are the most vulnerable to poverty, with 1,184 males (22.1%) and 524 females (21.8%) in their respective age groups living below the poverty level.
| Age Bracket | Male | Female |
| Under 5 Years | 430 (12.6%) | 691 (20.4%) |
| 5 Years | 18 (2.8%) | 103 (9.8%) |
| 6 to 11 Years | 852 (19.2%) | 886 (20.1%) |
| 12 to 14 Years | 330 (10.6%) | 524 (21.8%) |
| 15 Years | 157 (13.1%) | 251 (20.6%) |
| 16 and 17 Years | 265 (15.4%) | 161 (11.5%) |
| 18 to 24 Years | 1,184 (22.1%) | 977 (18.2%) |
| 25 to 34 Years | 872 (13.0%) | 1,157 (15.3%) |
| 35 to 44 Years | 759 (11.7%) | 978 (12.4%) |
| 45 to 54 Years | 595 (8.3%) | 954 (11.3%) |
| 55 to 64 Years | 733 (11.5%) | 760 (10.6%) |
| 65 to 74 Years | 281 (6.9%) | 531 (10.2%) |
| 75 Years and over | 170 (8.0%) | 316 (9.8%) |
| Total | 6,646 (12.6%) | 8,289 (14.1%) |
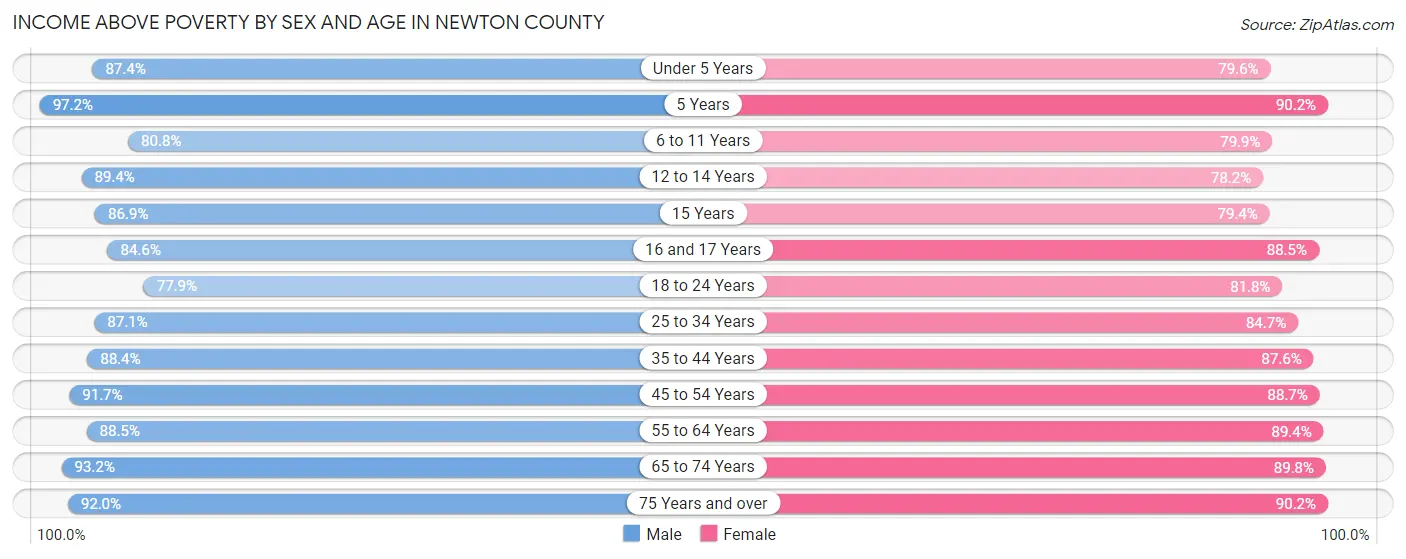
Income Above Poverty by Sex and Age in Newton County
According to the poverty statistics in Newton County, males aged 5 years and females aged 5 years are the age groups that are most secure financially, with 97.2% of males and 90.2% of females in these age groups living above the poverty line.
| Age Bracket | Male | Female |
| Under 5 Years | 2,979 (87.4%) | 2,688 (79.5%) |
| 5 Years | 623 (97.2%) | 951 (90.2%) |
| 6 to 11 Years | 3,580 (80.8%) | 3,524 (79.9%) |
| 12 to 14 Years | 2,796 (89.4%) | 1,879 (78.2%) |
| 15 Years | 1,042 (86.9%) | 968 (79.4%) |
| 16 and 17 Years | 1,456 (84.6%) | 1,244 (88.5%) |
| 18 to 24 Years | 4,165 (77.9%) | 4,379 (81.8%) |
| 25 to 34 Years | 5,864 (87.1%) | 6,390 (84.7%) |
| 35 to 44 Years | 5,754 (88.3%) | 6,898 (87.6%) |
| 45 to 54 Years | 6,553 (91.7%) | 7,474 (88.7%) |
| 55 to 64 Years | 5,631 (88.5%) | 6,414 (89.4%) |
| 65 to 74 Years | 3,824 (93.1%) | 4,695 (89.8%) |
| 75 Years and over | 1,944 (92.0%) | 2,912 (90.2%) |
| Total | 46,211 (87.4%) | 50,416 (85.9%) |
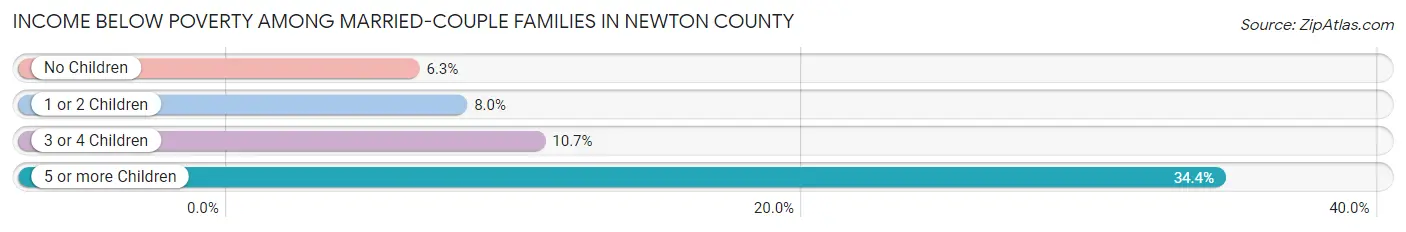
Income Below Poverty Among Married-Couple Families in Newton County
The poverty statistics for married-couple families in Newton County show that 7.7% or 1,473 of the total 19,168 families live below the poverty line. Families with 5 or more children have the highest poverty rate of 34.4%, comprising of 87 families. On the other hand, families with no children have the lowest poverty rate of 6.3%, which includes 665 families.
| Children | Above Poverty | Below Poverty |
| No Children | 9,863 (93.7%) | 665 (6.3%) |
| 1 or 2 Children | 5,971 (92.0%) | 518 (8.0%) |
| 3 or 4 Children | 1,695 (89.3%) | 203 (10.7%) |
| 5 or more Children | 166 (65.6%) | 87 (34.4%) |
| Total | 17,695 (92.3%) | 1,473 (7.7%) |
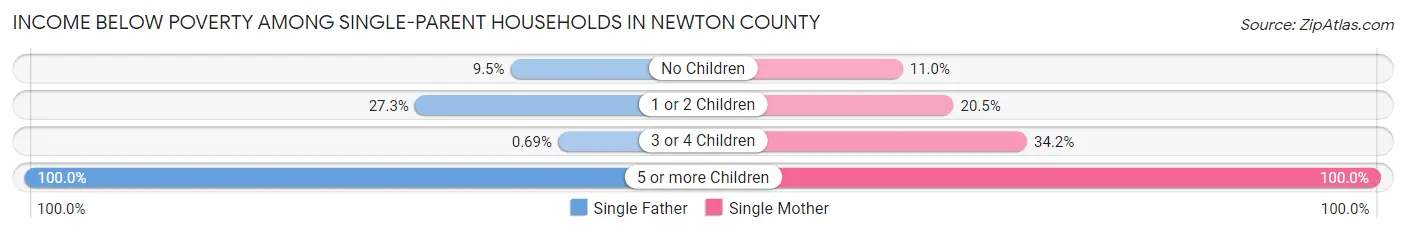
Income Below Poverty Among Single-Parent Households in Newton County
According to the poverty data in Newton County, 15.0% or 340 single-father households and 18.4% or 1,454 single-mother households are living below the poverty line. Among single-father households, those with 5 or more children have the highest poverty rate, with 3 households (100.0%) experiencing poverty. Likewise, among single-mother households, those with 5 or more children have the highest poverty rate, with 76 households (100.0%) falling below the poverty line.
| Children | Single Father | Single Mother |
| No Children | 89 (9.5%) | 362 (11.0%) |
| 1 or 2 Children | 245 (27.3%) | 799 (20.5%) |
| 3 or 4 Children | 3 (0.7%) | 217 (34.2%) |
| 5 or more Children | 3 (100.0%) | 76 (100.0%) |
| Total | 340 (15.0%) | 1,454 (18.4%) |
Income Below Poverty Among Married-Couple vs Single-Parent Households in Newton County
The poverty data for Newton County shows that 1,473 of the married-couple family households (7.7%) and 1,794 of the single-parent households (17.6%) are living below the poverty level. Within the married-couple family households, those with 5 or more children have the highest poverty rate, with 87 households (34.4%) falling below the poverty line. Among the single-parent households, those with 5 or more children have the highest poverty rate, with 79 household (100.0%) living below poverty.
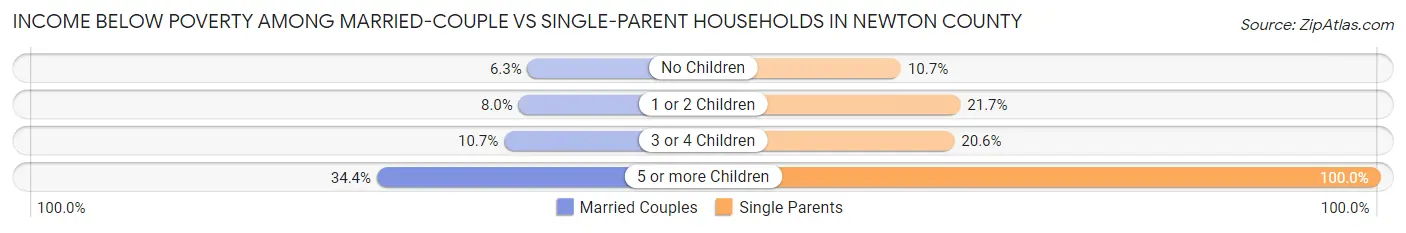
| Children | Married-Couple Families | Single-Parent Households |
| No Children | 665 (6.3%) | 451 (10.7%) |
| 1 or 2 Children | 518 (8.0%) | 1,044 (21.7%) |
| 3 or 4 Children | 203 (10.7%) | 220 (20.6%) |
| 5 or more Children | 87 (34.4%) | 79 (100.0%) |
| Total | 1,473 (7.7%) | 1,794 (17.6%) |
Employment Characteristics in Newton County
Employment by Class of Employer in Newton County
Among the 52,493 employed individuals in Newton County, private company employees (36,088 | 68.8%), local government employees (4,808 | 9.2%), and self-employed (not incorporated) (3,014 | 5.7%) make up the most common classes of employment.
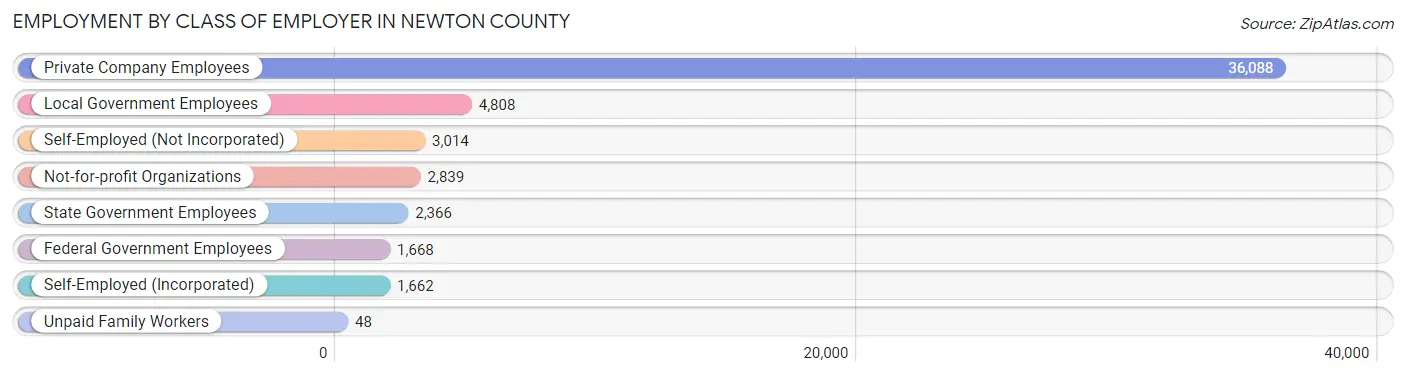
| Employer Class | # Employees | % Employees |
| Private Company Employees | 36,088 | 68.8% |
| Self-Employed (Incorporated) | 1,662 | 3.2% |
| Self-Employed (Not Incorporated) | 3,014 | 5.7% |
| Not-for-profit Organizations | 2,839 | 5.4% |
| Local Government Employees | 4,808 | 9.2% |
| State Government Employees | 2,366 | 4.5% |
| Federal Government Employees | 1,668 | 3.2% |
| Unpaid Family Workers | 48 | 0.1% |
| Total | 52,493 | 100.0% |
Employment Status by Age in Newton County
According to the labor force statistics for Newton County, out of the total population over 16 years of age (87,508), 64.7% or 56,618 individuals are in the labor force, with 6.6% or 3,737 of them unemployed. The age group with the highest labor force participation rate is 25 to 29 years, with 85.3% or 6,252 individuals in the labor force. Within the labor force, the 16 to 19 years age range has the highest percentage of unemployed individuals, with 21.6% or 589 of them being unemployed.
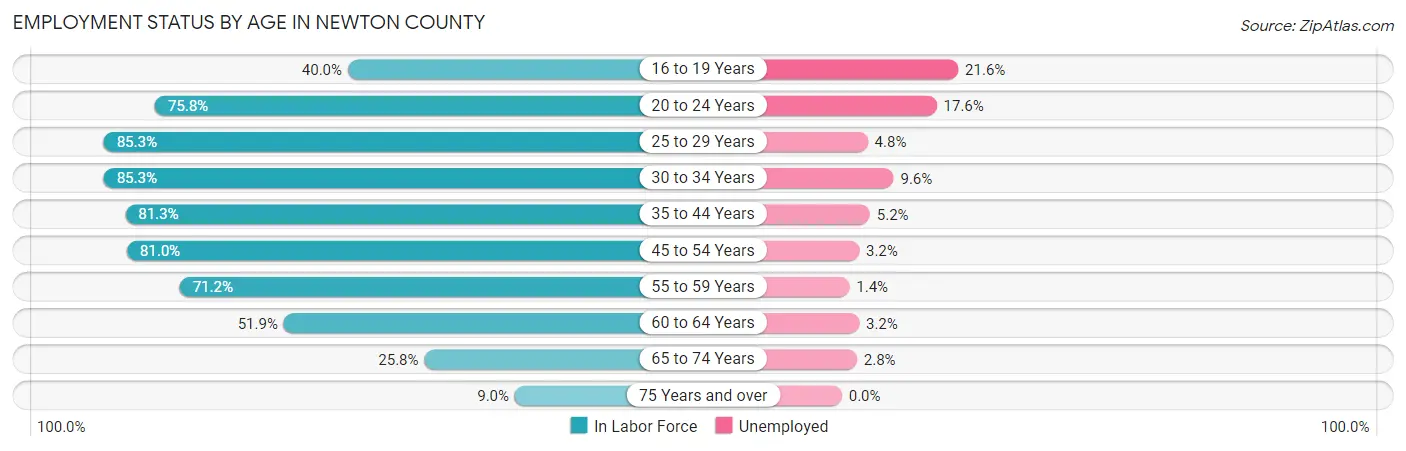
| Age Bracket | In Labor Force | Unemployed |
| 16 to 19 Years | 2,727 (40.0%) | 589 (21.6%) |
| 20 to 24 Years | 5,762 (75.8%) | 1,014 (17.6%) |
| 25 to 29 Years | 6,252 (85.3%) | 300 (4.8%) |
| 30 to 34 Years | 6,032 (85.3%) | 579 (9.6%) |
| 35 to 44 Years | 11,813 (81.3%) | 614 (5.2%) |
| 45 to 54 Years | 12,647 (81.0%) | 405 (3.2%) |
| 55 to 59 Years | 5,106 (71.2%) | 71 (1.4%) |
| 60 to 64 Years | 3,332 (51.9%) | 107 (3.2%) |
| 65 to 74 Years | 2,426 (25.8%) | 68 (2.8%) |
| 75 Years and over | 499 (9.0%) | 0 (0.0%) |
| Total | 56,618 (64.7%) | 3,737 (6.6%) |
Employment Status by Educational Attainment in Newton County
According to labor force statistics for Newton County, 77.7% of individuals (45,172) out of the total population between 25 and 64 years of age (58,137) are in the labor force, with 4.6% or 2,078 of them being unemployed. The group with the highest labor force participation rate are those with the educational attainment of bachelor's degree or higher, with 88.1% or 11,982 individuals in the labor force. Within the labor force, individuals with college / associate degree education have the highest percentage of unemployment, with 6.7% or 1,106 of them being unemployed.
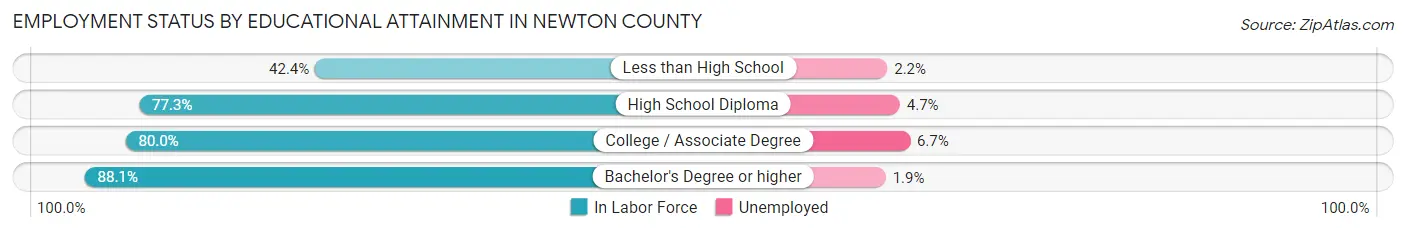
| Educational Attainment | In Labor Force | Unemployed |
| Less than High School | 2,177 (42.4%) | 113 (2.2%) |
| High School Diploma | 14,514 (77.3%) | 882 (4.7%) |
| College / Associate Degree | 16,502 (80.0%) | 1,382 (6.7%) |
| Bachelor's Degree or higher | 11,982 (88.1%) | 258 (1.9%) |
| Total | 45,172 (77.7%) | 2,674 (4.6%) |
Employment Occupations by Sex in Newton County
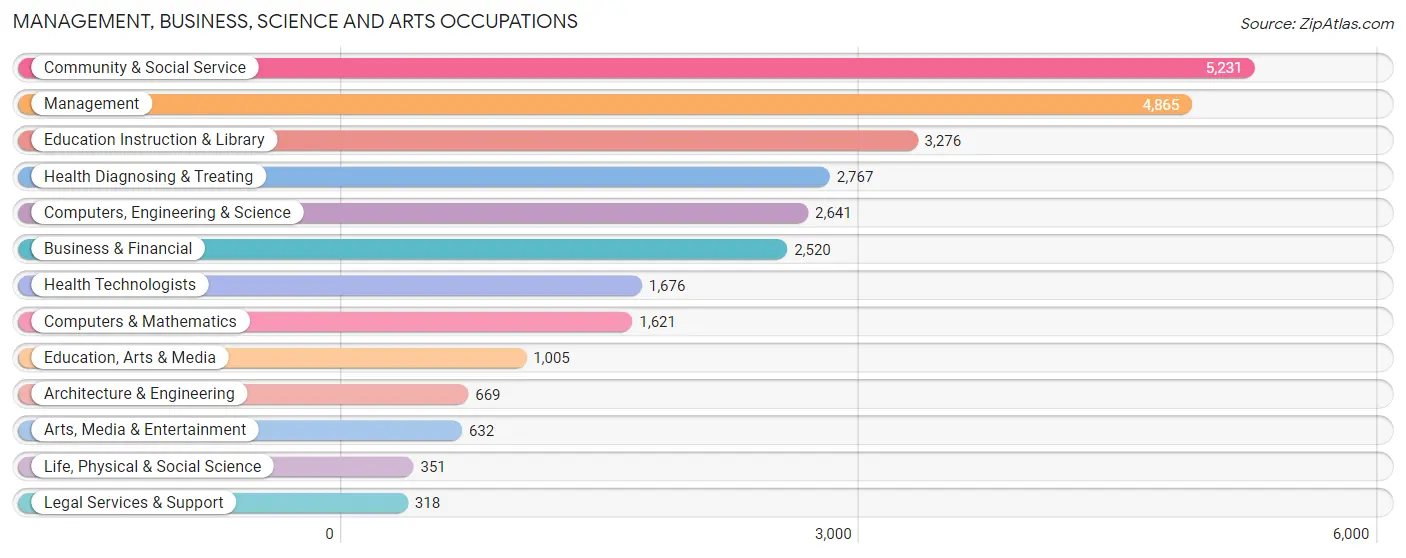
Management, Business, Science and Arts Occupations
The most common Management, Business, Science and Arts occupations in Newton County are Community & Social Service (5,231 | 9.9%), Management (4,865 | 9.2%), Education Instruction & Library (3,276 | 6.2%), Health Diagnosing & Treating (2,767 | 5.2%), and Computers, Engineering & Science (2,641 | 5.0%).
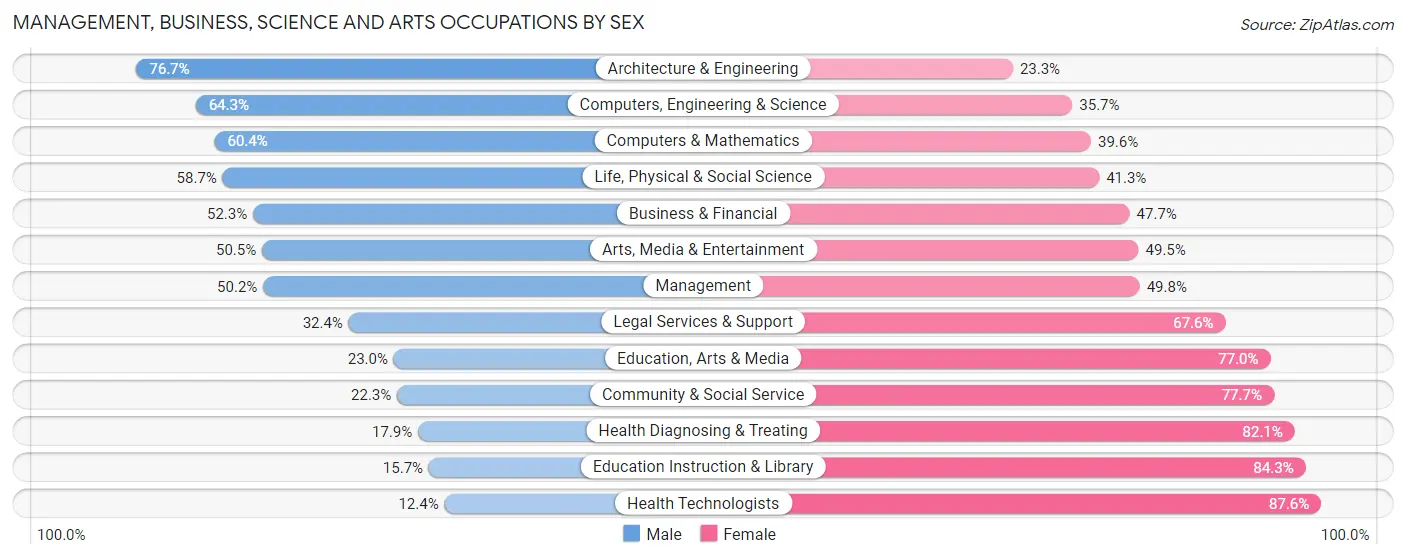
Management, Business, Science and Arts Occupations by Sex
Within the Management, Business, Science and Arts occupations in Newton County, the most male-oriented occupations are Architecture & Engineering (76.7%), Computers, Engineering & Science (64.3%), and Computers & Mathematics (60.4%), while the most female-oriented occupations are Health Technologists (87.6%), Education Instruction & Library (84.3%), and Health Diagnosing & Treating (82.1%).
| Occupation | Male | Female |
| Management | 2,444 (50.2%) | 2,421 (49.8%) |
| Business & Financial | 1,319 (52.3%) | 1,201 (47.7%) |
| Computers, Engineering & Science | 1,698 (64.3%) | 943 (35.7%) |
| Computers & Mathematics | 979 (60.4%) | 642 (39.6%) |
| Architecture & Engineering | 513 (76.7%) | 156 (23.3%) |
| Life, Physical & Social Science | 206 (58.7%) | 145 (41.3%) |
| Community & Social Service | 1,166 (22.3%) | 4,065 (77.7%) |
| Education, Arts & Media | 231 (23.0%) | 774 (77.0%) |
| Legal Services & Support | 103 (32.4%) | 215 (67.6%) |
| Education Instruction & Library | 513 (15.7%) | 2,763 (84.3%) |
| Arts, Media & Entertainment | 319 (50.5%) | 313 (49.5%) |
| Health Diagnosing & Treating | 496 (17.9%) | 2,271 (82.1%) |
| Health Technologists | 208 (12.4%) | 1,468 (87.6%) |
| Total (Category) | 7,123 (39.5%) | 10,901 (60.5%) |
| Total (Overall) | 25,883 (49.1%) | 26,854 (50.9%) |
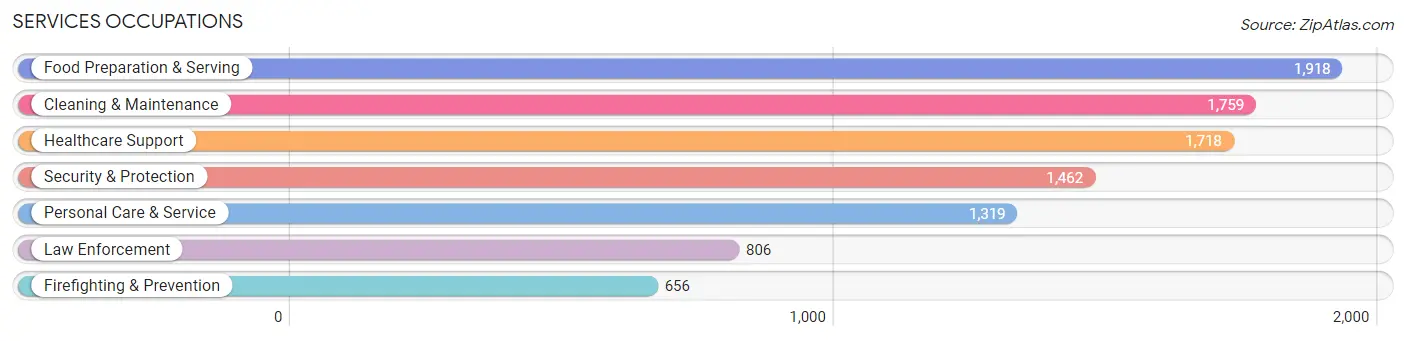
Services Occupations
The most common Services occupations in Newton County are Food Preparation & Serving (1,918 | 3.6%), Cleaning & Maintenance (1,759 | 3.3%), Healthcare Support (1,718 | 3.3%), Security & Protection (1,462 | 2.8%), and Personal Care & Service (1,319 | 2.5%).
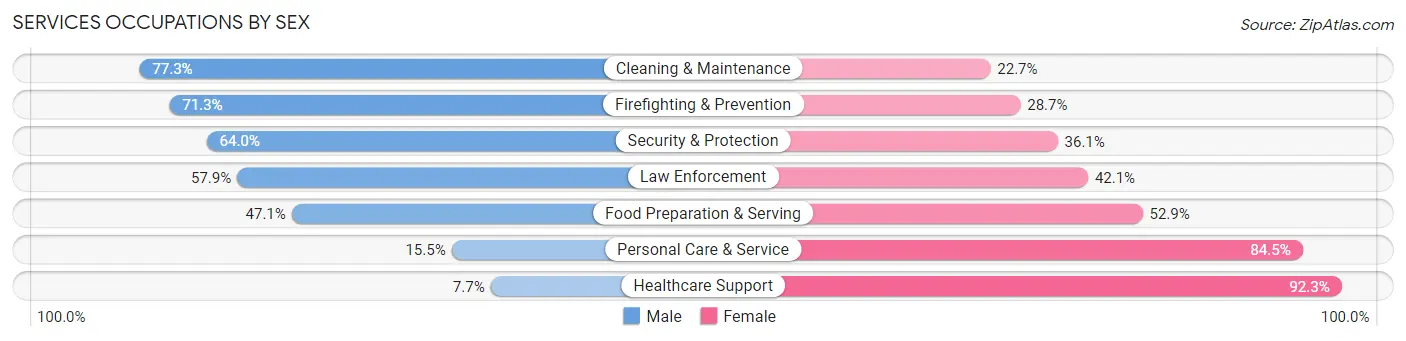
Services Occupations by Sex
Within the Services occupations in Newton County, the most male-oriented occupations are Cleaning & Maintenance (77.3%), Firefighting & Prevention (71.3%), and Security & Protection (63.9%), while the most female-oriented occupations are Healthcare Support (92.3%), Personal Care & Service (84.5%), and Food Preparation & Serving (52.9%).
| Occupation | Male | Female |
| Healthcare Support | 133 (7.7%) | 1,585 (92.3%) |
| Security & Protection | 935 (63.9%) | 527 (36.0%) |
| Firefighting & Prevention | 468 (71.3%) | 188 (28.7%) |
| Law Enforcement | 467 (57.9%) | 339 (42.1%) |
| Food Preparation & Serving | 904 (47.1%) | 1,014 (52.9%) |
| Cleaning & Maintenance | 1,359 (77.3%) | 400 (22.7%) |
| Personal Care & Service | 204 (15.5%) | 1,115 (84.5%) |
| Total (Category) | 3,535 (43.2%) | 4,641 (56.8%) |
| Total (Overall) | 25,883 (49.1%) | 26,854 (50.9%) |
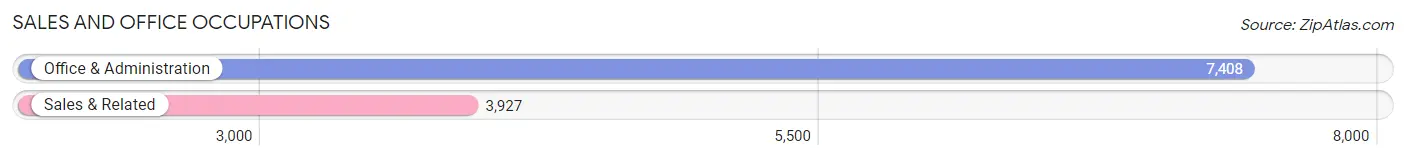
Sales and Office Occupations
The most common Sales and Office occupations in Newton County are Office & Administration (7,408 | 14.1%), and Sales & Related (3,927 | 7.4%).
Sales and Office Occupations by Sex
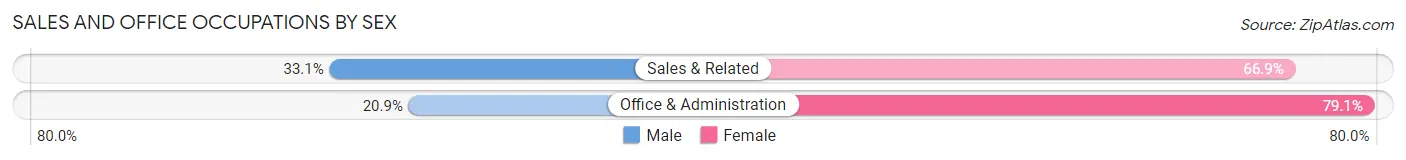
| Occupation | Male | Female |
| Sales & Related | 1,299 (33.1%) | 2,628 (66.9%) |
| Office & Administration | 1,548 (20.9%) | 5,860 (79.1%) |
| Total (Category) | 2,847 (25.1%) | 8,488 (74.9%) |
| Total (Overall) | 25,883 (49.1%) | 26,854 (50.9%) |
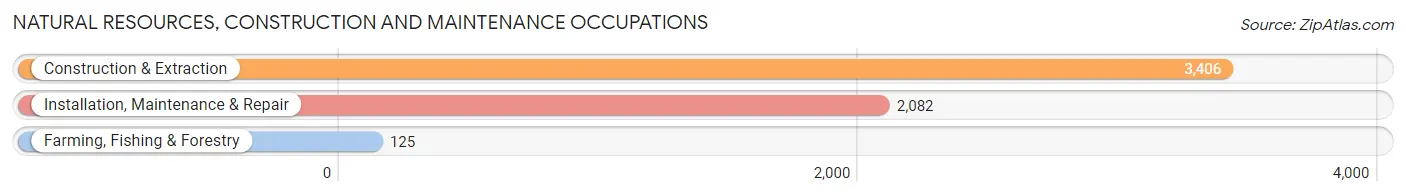
Natural Resources, Construction and Maintenance Occupations
The most common Natural Resources, Construction and Maintenance occupations in Newton County are Construction & Extraction (3,406 | 6.5%), Installation, Maintenance & Repair (2,082 | 4.0%), and Farming, Fishing & Forestry (125 | 0.2%).
Natural Resources, Construction and Maintenance Occupations by Sex
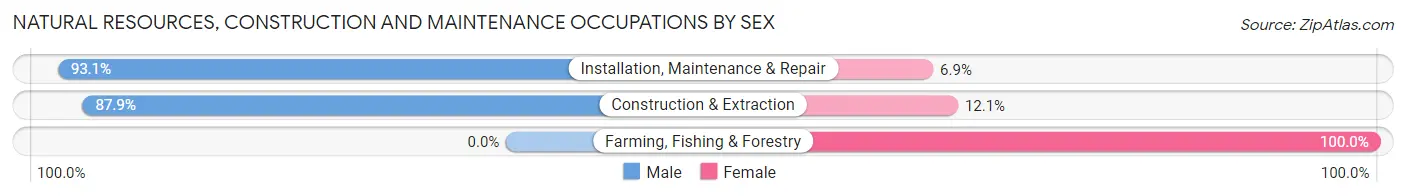
| Occupation | Male | Female |
| Farming, Fishing & Forestry | 0 (0.0%) | 125 (100.0%) |
| Construction & Extraction | 2,995 (87.9%) | 411 (12.1%) |
| Installation, Maintenance & Repair | 1,938 (93.1%) | 144 (6.9%) |
| Total (Category) | 4,933 (87.9%) | 680 (12.1%) |
| Total (Overall) | 25,883 (49.1%) | 26,854 (50.9%) |
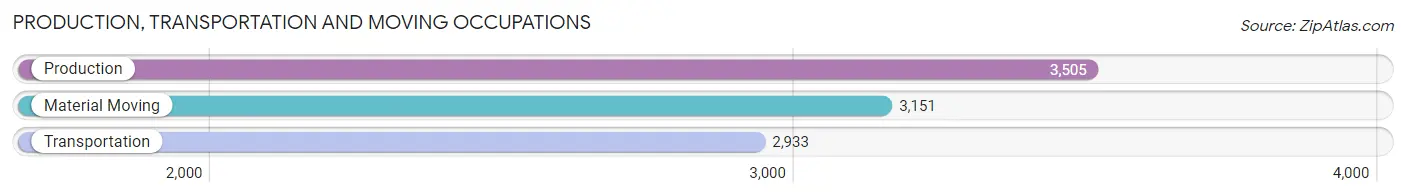
Production, Transportation and Moving Occupations
The most common Production, Transportation and Moving occupations in Newton County are Production (3,505 | 6.7%), Material Moving (3,151 | 6.0%), and Transportation (2,933 | 5.6%).
Production, Transportation and Moving Occupations by Sex
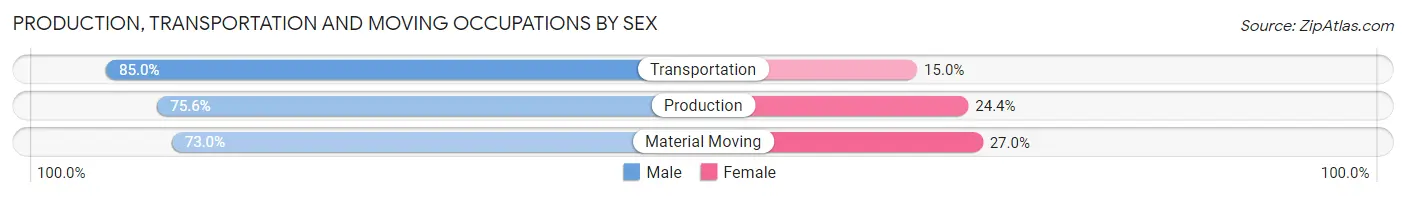
| Occupation | Male | Female |
| Production | 2,651 (75.6%) | 854 (24.4%) |
| Transportation | 2,494 (85.0%) | 439 (15.0%) |
| Material Moving | 2,300 (73.0%) | 851 (27.0%) |
| Total (Category) | 7,445 (77.6%) | 2,144 (22.4%) |
| Total (Overall) | 25,883 (49.1%) | 26,854 (50.9%) |
Employment Industries by Sex in Newton County
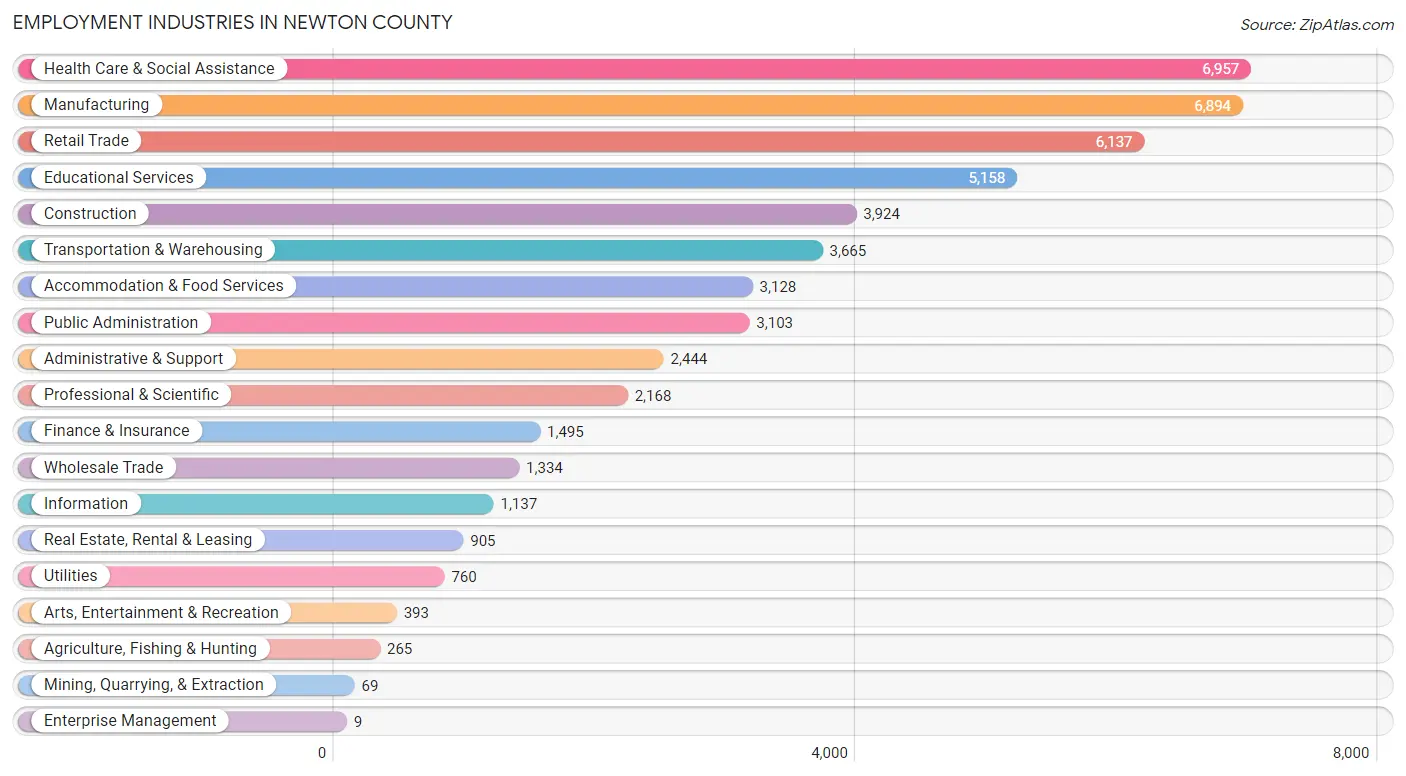
Employment Industries in Newton County
The major employment industries in Newton County include Health Care & Social Assistance (6,957 | 13.2%), Manufacturing (6,894 | 13.1%), Retail Trade (6,137 | 11.6%), Educational Services (5,158 | 9.8%), and Construction (3,924 | 7.4%).
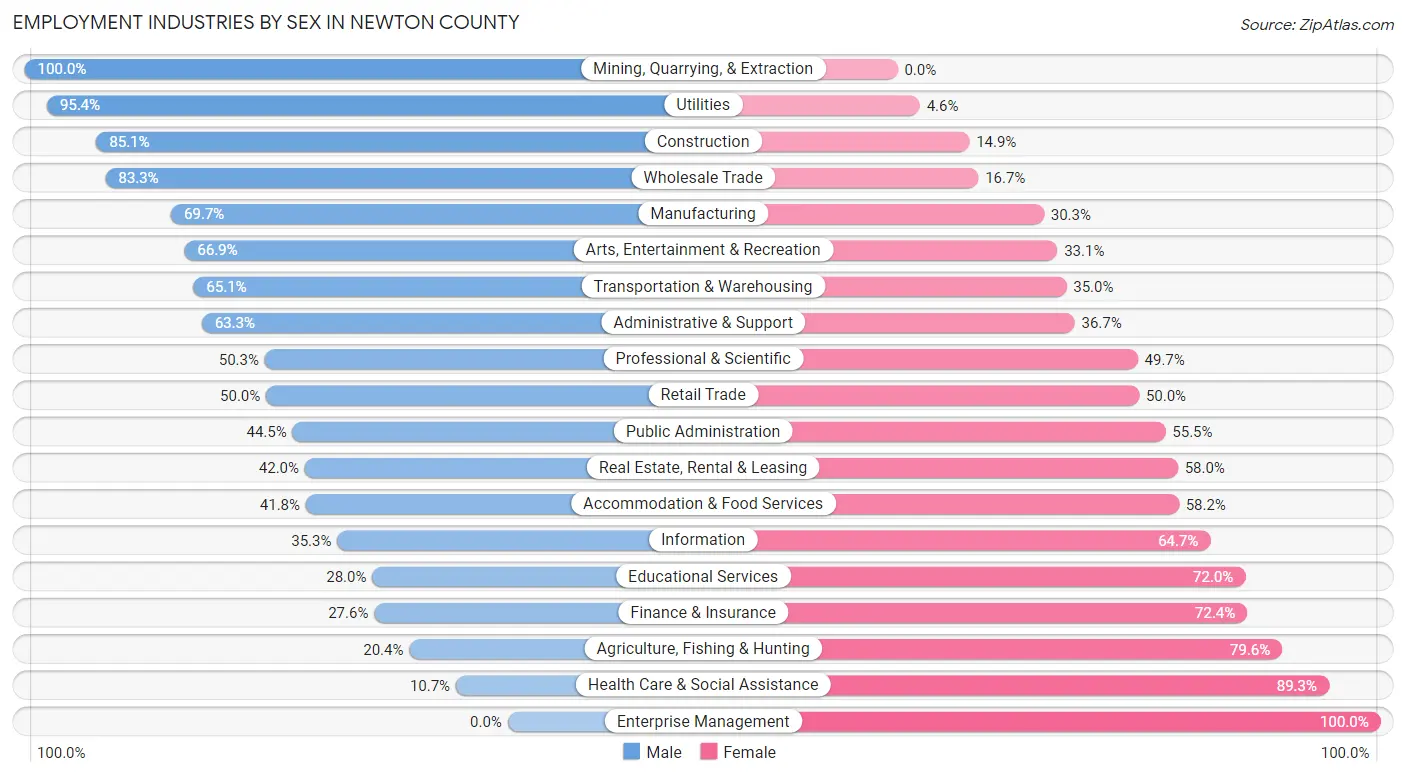
Employment Industries by Sex in Newton County
The Newton County industries that see more men than women are Mining, Quarrying, & Extraction (100.0%), Utilities (95.4%), and Construction (85.1%), whereas the industries that tend to have a higher number of women are Enterprise Management (100.0%), Health Care & Social Assistance (89.3%), and Agriculture, Fishing & Hunting (79.6%).
| Industry | Male | Female |
| Agriculture, Fishing & Hunting | 54 (20.4%) | 211 (79.6%) |
| Mining, Quarrying, & Extraction | 69 (100.0%) | 0 (0.0%) |
| Construction | 3,341 (85.1%) | 583 (14.9%) |
| Manufacturing | 4,805 (69.7%) | 2,089 (30.3%) |
| Wholesale Trade | 1,111 (83.3%) | 223 (16.7%) |
| Retail Trade | 3,069 (50.0%) | 3,068 (50.0%) |
| Transportation & Warehousing | 2,384 (65.0%) | 1,281 (34.9%) |
| Utilities | 725 (95.4%) | 35 (4.6%) |
| Information | 401 (35.3%) | 736 (64.7%) |
| Finance & Insurance | 413 (27.6%) | 1,082 (72.4%) |
| Real Estate, Rental & Leasing | 380 (42.0%) | 525 (58.0%) |
| Professional & Scientific | 1,090 (50.3%) | 1,078 (49.7%) |
| Enterprise Management | 0 (0.0%) | 9 (100.0%) |
| Administrative & Support | 1,548 (63.3%) | 896 (36.7%) |
| Educational Services | 1,446 (28.0%) | 3,712 (72.0%) |
| Health Care & Social Assistance | 746 (10.7%) | 6,211 (89.3%) |
| Arts, Entertainment & Recreation | 263 (66.9%) | 130 (33.1%) |
| Accommodation & Food Services | 1,307 (41.8%) | 1,821 (58.2%) |
| Public Administration | 1,382 (44.5%) | 1,721 (55.5%) |
| Total | 25,883 (49.1%) | 26,854 (50.9%) |
Education in Newton County
School Enrollment in Newton County
The most common levels of schooling among the 30,608 students in Newton County are middle school (7,636 | 24.9%), high school (7,201 | 23.5%), and elementary school (5,952 | 19.5%).
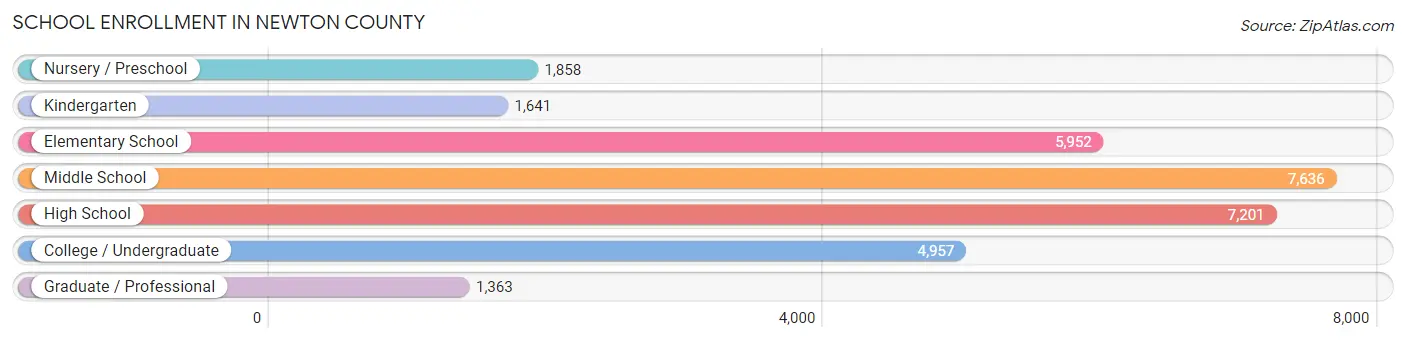
| School Level | # Students | % Students |
| Nursery / Preschool | 1,858 | 6.1% |
| Kindergarten | 1,641 | 5.4% |
| Elementary School | 5,952 | 19.5% |
| Middle School | 7,636 | 24.9% |
| High School | 7,201 | 23.5% |
| College / Undergraduate | 4,957 | 16.2% |
| Graduate / Professional | 1,363 | 4.4% |
| Total | 30,608 | 100.0% |
School Enrollment by Age by Funding Source in Newton County
Out of a total of 30,608 students who are enrolled in schools in Newton County, 4,040 (13.2%) attend a private institution, while the remaining 26,568 (86.8%) are enrolled in public schools. The age group of 3 to 4 year olds has the highest likelihood of being enrolled in private schools, with 385 (25.0% in the age bracket) enrolled. Conversely, the age group of 15 to 17 year olds has the lowest likelihood of being enrolled in a private school, with 5,054 (93.6% in the age bracket) attending a public institution.
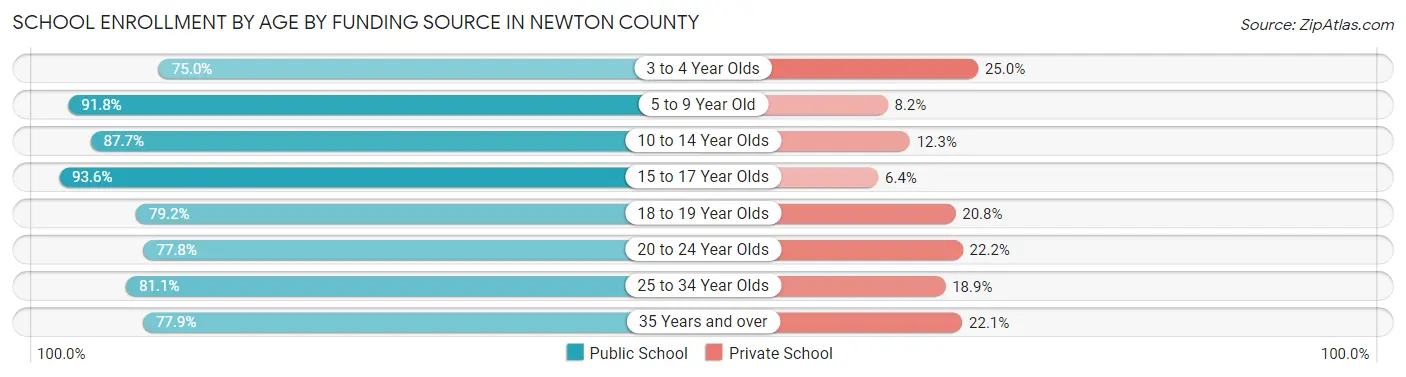
| Age Bracket | Public School | Private School |
| 3 to 4 Year Olds | 1,154 (75.0%) | 385 (25.0%) |
| 5 to 9 Year Old | 6,532 (91.8%) | 581 (8.2%) |
| 10 to 14 Year Olds | 7,730 (87.7%) | 1,085 (12.3%) |
| 15 to 17 Year Olds | 5,054 (93.6%) | 347 (6.4%) |
| 18 to 19 Year Olds | 1,810 (79.2%) | 475 (20.8%) |
| 20 to 24 Year Olds | 1,570 (77.8%) | 447 (22.2%) |
| 25 to 34 Year Olds | 913 (81.1%) | 213 (18.9%) |
| 35 Years and over | 1,802 (77.9%) | 510 (22.1%) |
| Total | 26,568 (86.8%) | 4,040 (13.2%) |
Educational Attainment by Field of Study in Newton County
Business (3,500 | 19.5%), education (2,647 | 14.7%), science & technology (1,822 | 10.2%), arts & humanities (1,735 | 9.7%), and psychology (1,272 | 7.1%) are the most common fields of study among 17,959 individuals in Newton County who have obtained a bachelor's degree or higher.
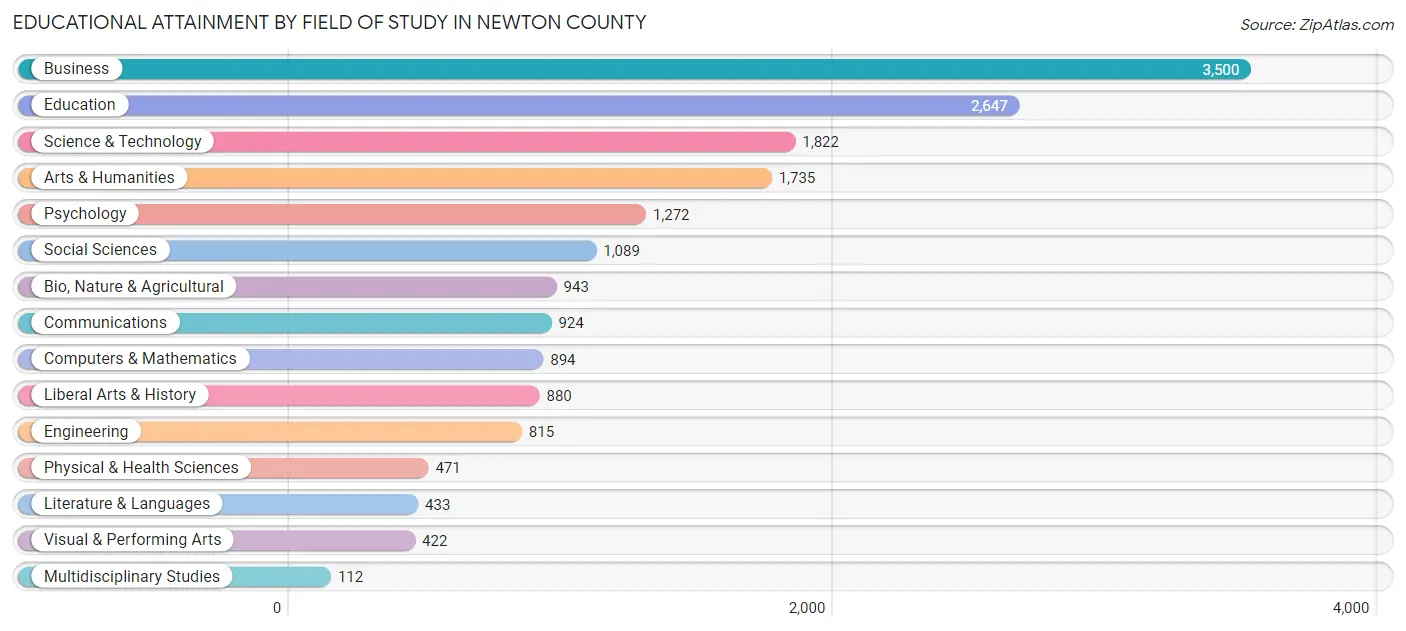
| Field of Study | # Graduates | % Graduates |
| Computers & Mathematics | 894 | 5.0% |
| Bio, Nature & Agricultural | 943 | 5.2% |
| Physical & Health Sciences | 471 | 2.6% |
| Psychology | 1,272 | 7.1% |
| Social Sciences | 1,089 | 6.1% |
| Engineering | 815 | 4.5% |
| Multidisciplinary Studies | 112 | 0.6% |
| Science & Technology | 1,822 | 10.2% |
| Business | 3,500 | 19.5% |
| Education | 2,647 | 14.7% |
| Literature & Languages | 433 | 2.4% |
| Liberal Arts & History | 880 | 4.9% |
| Visual & Performing Arts | 422 | 2.4% |
| Communications | 924 | 5.1% |
| Arts & Humanities | 1,735 | 9.7% |
| Total | 17,959 | 100.0% |
Transportation & Commute in Newton County
Vehicle Availability by Sex in Newton County
The most prevalent vehicle ownership categories in Newton County are males with 2 vehicles (10,639, accounting for 41.4%) and females with 2 vehicles (10,611, making up 40.0%).
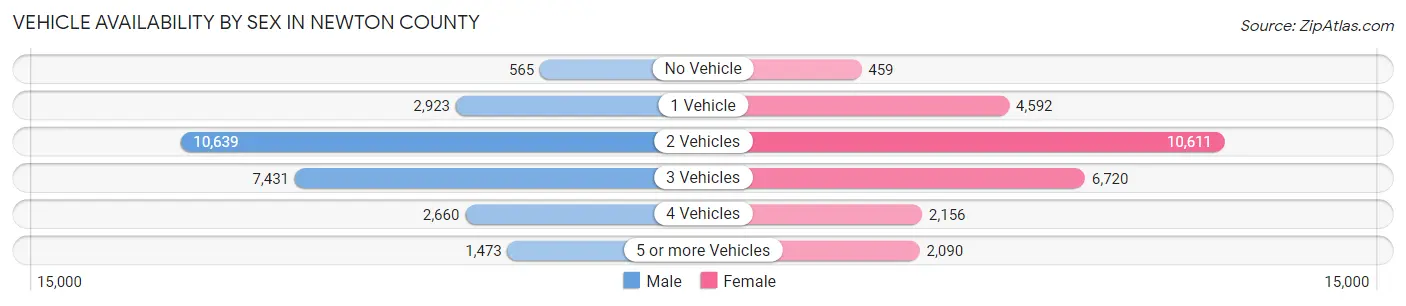
| Vehicles Available | Male | Female |
| No Vehicle | 565 (2.2%) | 459 (1.7%) |
| 1 Vehicle | 2,923 (11.4%) | 4,592 (17.2%) |
| 2 Vehicles | 10,639 (41.4%) | 10,611 (39.9%) |
| 3 Vehicles | 7,431 (28.9%) | 6,720 (25.2%) |
| 4 Vehicles | 2,660 (10.3%) | 2,156 (8.1%) |
| 5 or more Vehicles | 1,473 (5.7%) | 2,090 (7.9%) |
| Total | 25,691 (100.0%) | 26,628 (100.0%) |
Commute Time in Newton County
The most frequently occuring commute durations in Newton County are 60 to 89 minutes (6,811 commuters, 14.4%), 15 to 19 minutes (6,744 commuters, 14.3%), and 30 to 34 minutes (6,149 commuters, 13.0%).
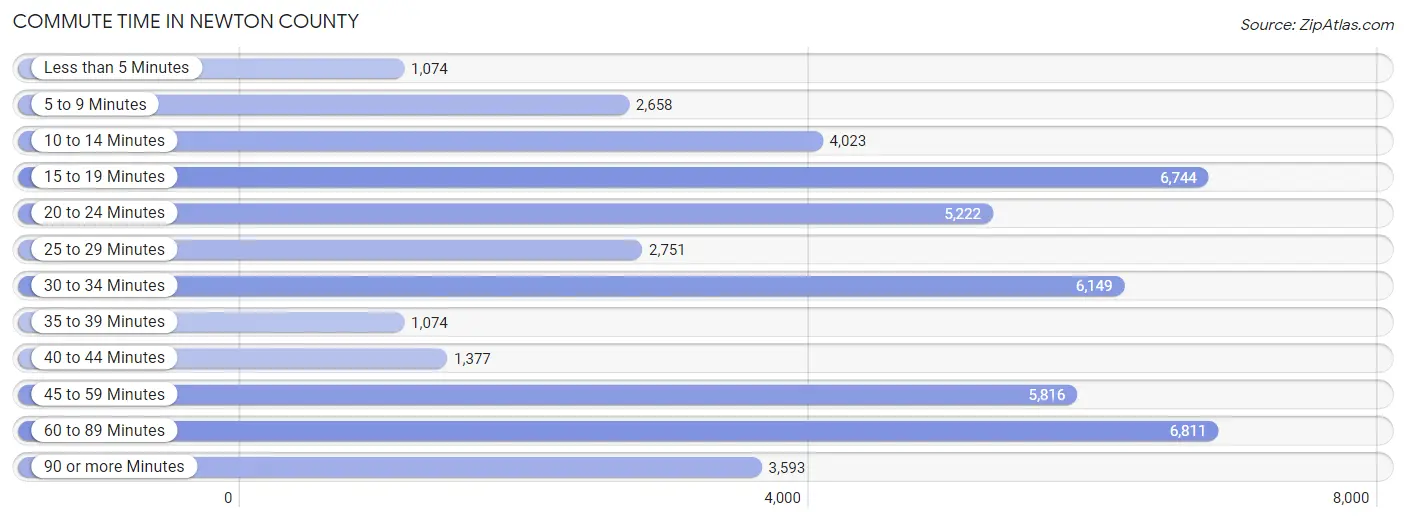
| Commute Time | # Commuters | % Commuters |
| Less than 5 Minutes | 1,074 | 2.3% |
| 5 to 9 Minutes | 2,658 | 5.6% |
| 10 to 14 Minutes | 4,023 | 8.5% |
| 15 to 19 Minutes | 6,744 | 14.3% |
| 20 to 24 Minutes | 5,222 | 11.0% |
| 25 to 29 Minutes | 2,751 | 5.8% |
| 30 to 34 Minutes | 6,149 | 13.0% |
| 35 to 39 Minutes | 1,074 | 2.3% |
| 40 to 44 Minutes | 1,377 | 2.9% |
| 45 to 59 Minutes | 5,816 | 12.3% |
| 60 to 89 Minutes | 6,811 | 14.4% |
| 90 or more Minutes | 3,593 | 7.6% |
Commute Time by Sex in Newton County
The most common commute times in Newton County are 60 to 89 minutes (3,833 commuters, 15.8%) for males and 15 to 19 minutes (3,358 commuters, 14.6%) for females.
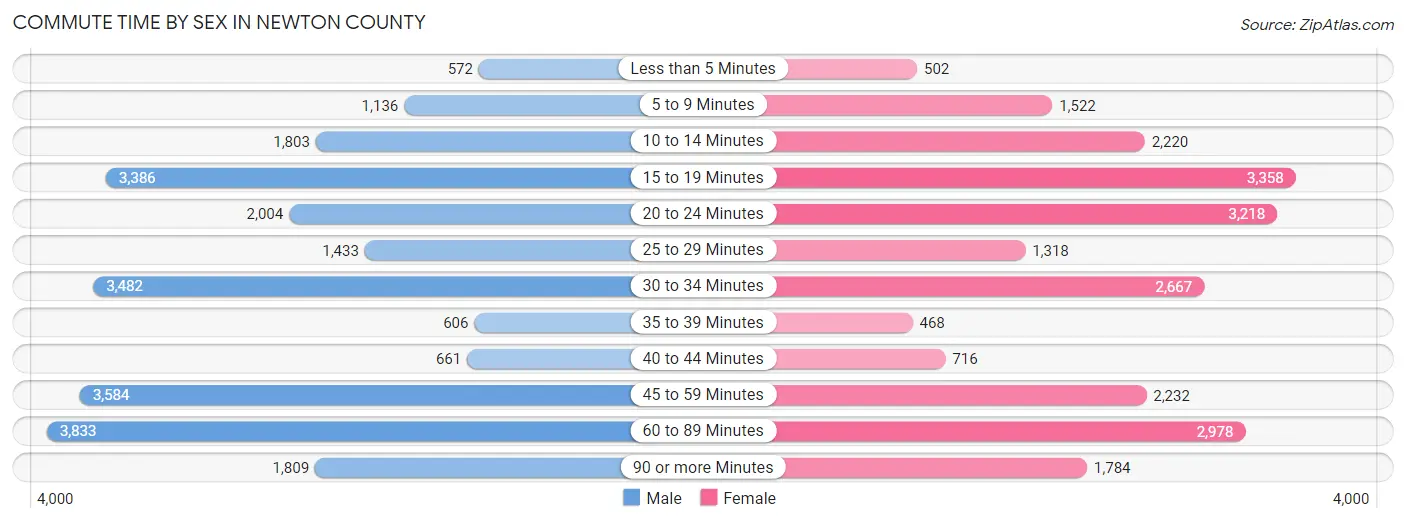
| Commute Time | Male | Female |
| Less than 5 Minutes | 572 (2.4%) | 502 (2.2%) |
| 5 to 9 Minutes | 1,136 (4.7%) | 1,522 (6.6%) |
| 10 to 14 Minutes | 1,803 (7.4%) | 2,220 (9.7%) |
| 15 to 19 Minutes | 3,386 (13.9%) | 3,358 (14.6%) |
| 20 to 24 Minutes | 2,004 (8.2%) | 3,218 (14.0%) |
| 25 to 29 Minutes | 1,433 (5.9%) | 1,318 (5.7%) |
| 30 to 34 Minutes | 3,482 (14.3%) | 2,667 (11.6%) |
| 35 to 39 Minutes | 606 (2.5%) | 468 (2.0%) |
| 40 to 44 Minutes | 661 (2.7%) | 716 (3.1%) |
| 45 to 59 Minutes | 3,584 (14.7%) | 2,232 (9.7%) |
| 60 to 89 Minutes | 3,833 (15.8%) | 2,978 (13.0%) |
| 90 or more Minutes | 1,809 (7.4%) | 1,784 (7.8%) |
Time of Departure to Work by Sex in Newton County
The most frequent times of departure to work in Newton County are 7:00 AM to 7:29 AM (3,212, 13.2%) for males and 6:00 AM to 6:29 AM (2,747, 11.9%) for females.
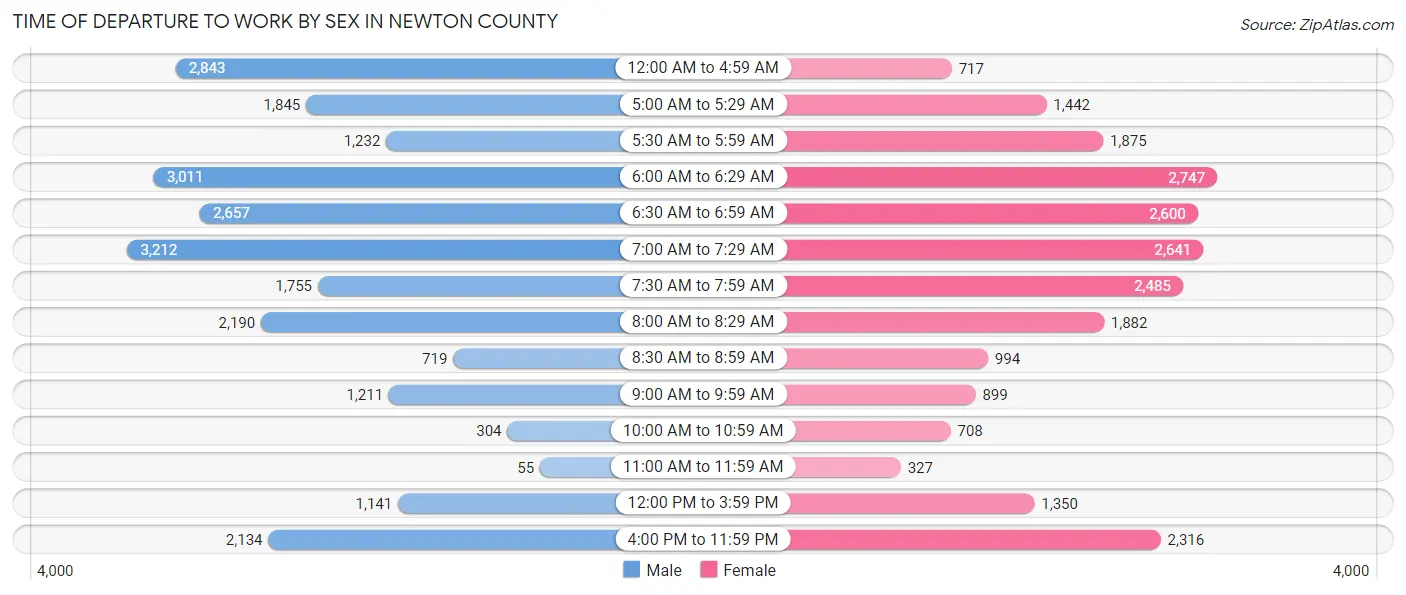
| Time of Departure | Male | Female |
| 12:00 AM to 4:59 AM | 2,843 (11.7%) | 717 (3.1%) |
| 5:00 AM to 5:29 AM | 1,845 (7.6%) | 1,442 (6.3%) |
| 5:30 AM to 5:59 AM | 1,232 (5.1%) | 1,875 (8.2%) |
| 6:00 AM to 6:29 AM | 3,011 (12.4%) | 2,747 (11.9%) |
| 6:30 AM to 6:59 AM | 2,657 (10.9%) | 2,600 (11.3%) |
| 7:00 AM to 7:29 AM | 3,212 (13.2%) | 2,641 (11.5%) |
| 7:30 AM to 7:59 AM | 1,755 (7.2%) | 2,485 (10.8%) |
| 8:00 AM to 8:29 AM | 2,190 (9.0%) | 1,882 (8.2%) |
| 8:30 AM to 8:59 AM | 719 (3.0%) | 994 (4.3%) |
| 9:00 AM to 9:59 AM | 1,211 (5.0%) | 899 (3.9%) |
| 10:00 AM to 10:59 AM | 304 (1.3%) | 708 (3.1%) |
| 11:00 AM to 11:59 AM | 55 (0.2%) | 327 (1.4%) |
| 12:00 PM to 3:59 PM | 1,141 (4.7%) | 1,350 (5.9%) |
| 4:00 PM to 11:59 PM | 2,134 (8.8%) | 2,316 (10.1%) |
| Total | 24,309 (100.0%) | 22,983 (100.0%) |
Housing Occupancy in Newton County
Occupancy by Ownership in Newton County
Of the total 39,906 dwellings in Newton County, owner-occupied units account for 28,958 (72.6%), while renter-occupied units make up 10,948 (27.4%).
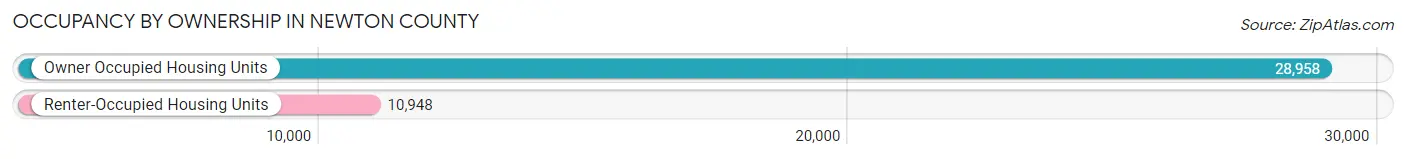
| Occupancy | # Housing Units | % Housing Units |
| Owner Occupied Housing Units | 28,958 | 72.6% |
| Renter-Occupied Housing Units | 10,948 | 27.4% |
| Total Occupied Housing Units | 39,906 | 100.0% |
Occupancy by Household Size in Newton County
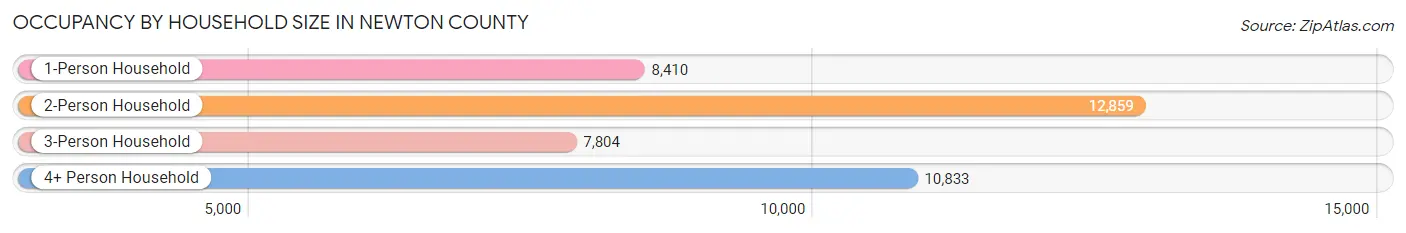
| Household Size | # Housing Units | % Housing Units |
| 1-Person Household | 8,410 | 21.1% |
| 2-Person Household | 12,859 | 32.2% |
| 3-Person Household | 7,804 | 19.6% |
| 4+ Person Household | 10,833 | 27.2% |
| Total Housing Units | 39,906 | 100.0% |
Occupancy by Ownership by Household Size in Newton County
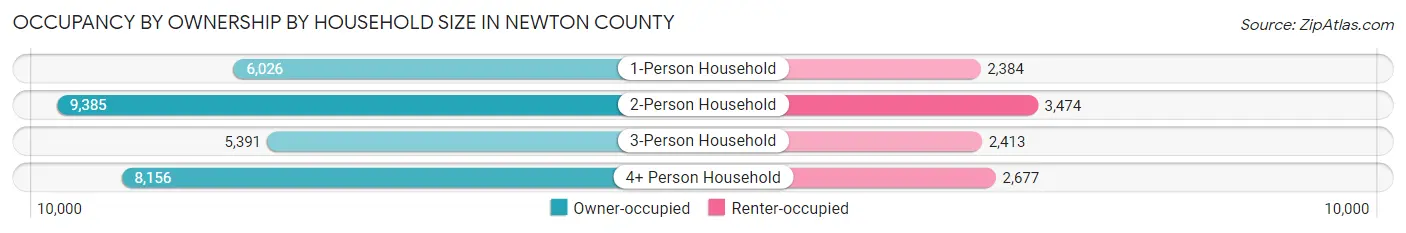
| Household Size | Owner-occupied | Renter-occupied |
| 1-Person Household | 6,026 (71.7%) | 2,384 (28.3%) |
| 2-Person Household | 9,385 (73.0%) | 3,474 (27.0%) |
| 3-Person Household | 5,391 (69.1%) | 2,413 (30.9%) |
| 4+ Person Household | 8,156 (75.3%) | 2,677 (24.7%) |
| Total Housing Units | 28,958 (72.6%) | 10,948 (27.4%) |
Occupancy by Educational Attainment in Newton County
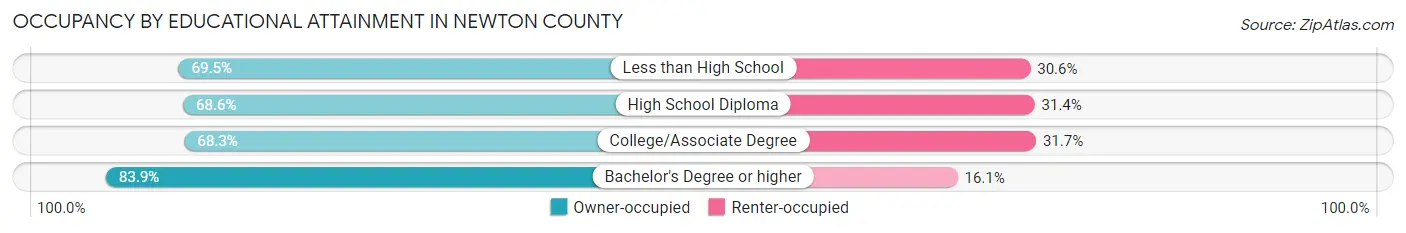
| Household Size | Owner-occupied | Renter-occupied |
| Less than High School | 2,391 (69.5%) | 1,052 (30.5%) |
| High School Diploma | 7,908 (68.6%) | 3,622 (31.4%) |
| College/Associate Degree | 9,892 (68.3%) | 4,588 (31.7%) |
| Bachelor's Degree or higher | 8,767 (83.9%) | 1,686 (16.1%) |
Occupancy by Age of Householder in Newton County
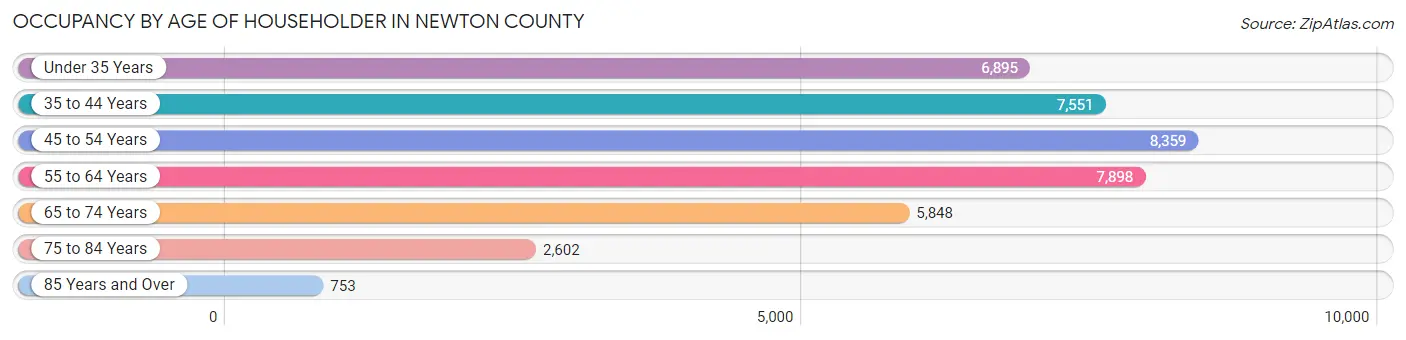
| Age Bracket | # Households | % Households |
| Under 35 Years | 6,895 | 17.3% |
| 35 to 44 Years | 7,551 | 18.9% |
| 45 to 54 Years | 8,359 | 20.9% |
| 55 to 64 Years | 7,898 | 19.8% |
| 65 to 74 Years | 5,848 | 14.6% |
| 75 to 84 Years | 2,602 | 6.5% |
| 85 Years and Over | 753 | 1.9% |
| Total | 39,906 | 100.0% |
Housing Finances in Newton County
Median Income by Occupancy in Newton County
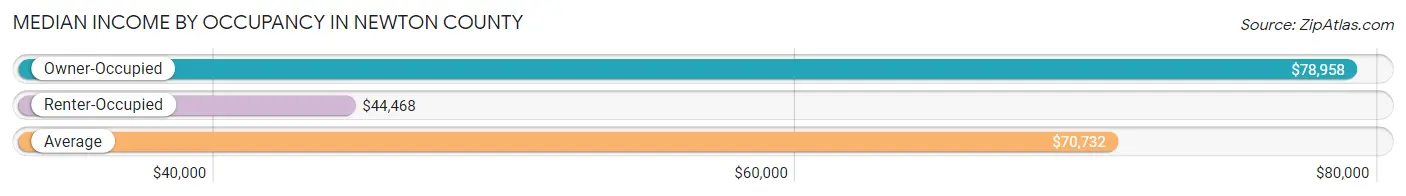
| Occupancy Type | # Households | Median Income |
| Owner-Occupied | 28,958 (72.6%) | $78,958 |
| Renter-Occupied | 10,948 (27.4%) | $44,468 |
| Average | 39,906 (100.0%) | $70,732 |
Occupancy by Householder Income Bracket in Newton County
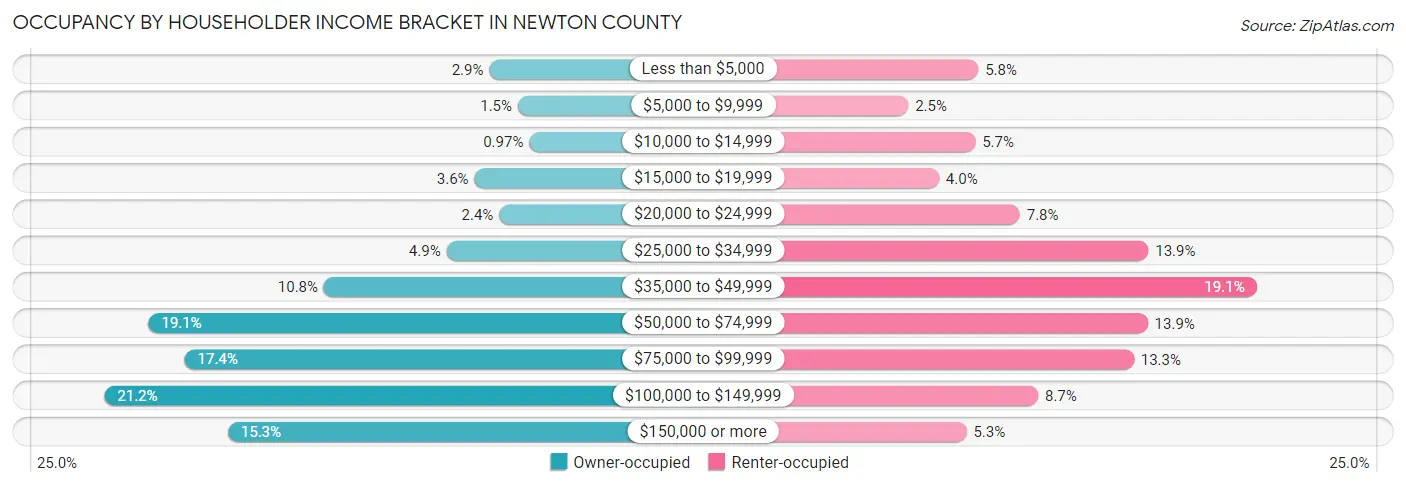
| Income Bracket | Owner-occupied | Renter-occupied |
| Less than $5,000 | 831 (2.9%) | 639 (5.8%) |
| $5,000 to $9,999 | 436 (1.5%) | 275 (2.5%) |
| $10,000 to $14,999 | 280 (1.0%) | 624 (5.7%) |
| $15,000 to $19,999 | 1,038 (3.6%) | 435 (4.0%) |
| $20,000 to $24,999 | 696 (2.4%) | 856 (7.8%) |
| $25,000 to $34,999 | 1,423 (4.9%) | 1,526 (13.9%) |
| $35,000 to $49,999 | 3,114 (10.7%) | 2,090 (19.1%) |
| $50,000 to $74,999 | 5,531 (19.1%) | 1,523 (13.9%) |
| $75,000 to $99,999 | 5,034 (17.4%) | 1,451 (13.3%) |
| $100,000 to $149,999 | 6,140 (21.2%) | 951 (8.7%) |
| $150,000 or more | 4,435 (15.3%) | 578 (5.3%) |
| Total | 28,958 (100.0%) | 10,948 (100.0%) |
Monthly Housing Cost Tiers in Newton County
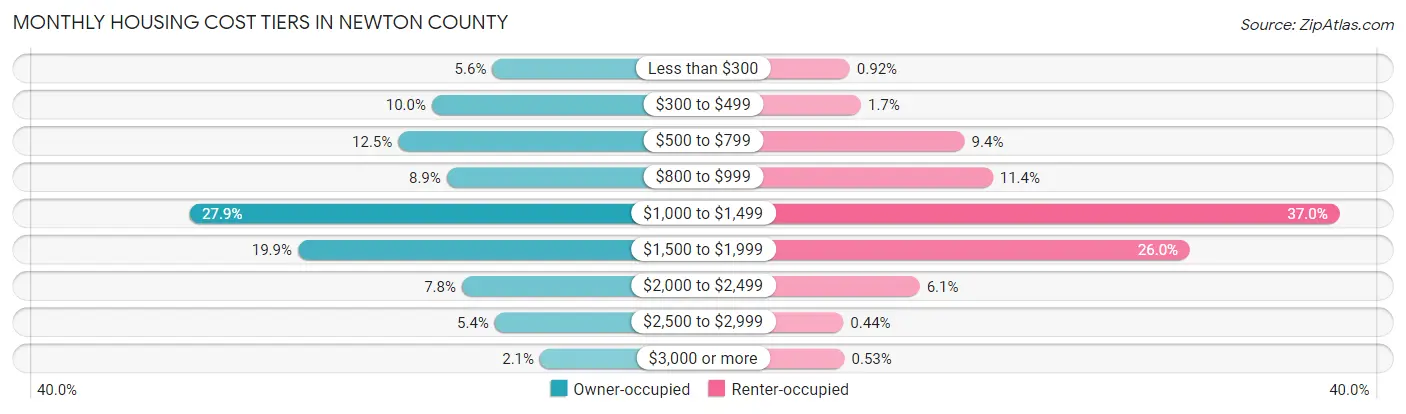
| Monthly Cost | Owner-occupied | Renter-occupied |
| Less than $300 | 1,610 (5.6%) | 101 (0.9%) |
| $300 to $499 | 2,900 (10.0%) | 190 (1.7%) |
| $500 to $799 | 3,618 (12.5%) | 1,026 (9.4%) |
| $800 to $999 | 2,583 (8.9%) | 1,252 (11.4%) |
| $1,000 to $1,499 | 8,077 (27.9%) | 4,049 (37.0%) |
| $1,500 to $1,999 | 5,757 (19.9%) | 2,842 (26.0%) |
| $2,000 to $2,499 | 2,260 (7.8%) | 663 (6.1%) |
| $2,500 to $2,999 | 1,558 (5.4%) | 48 (0.4%) |
| $3,000 or more | 595 (2.1%) | 58 (0.5%) |
| Total | 28,958 (100.0%) | 10,948 (100.0%) |
Physical Housing Characteristics in Newton County
Housing Structures in Newton County
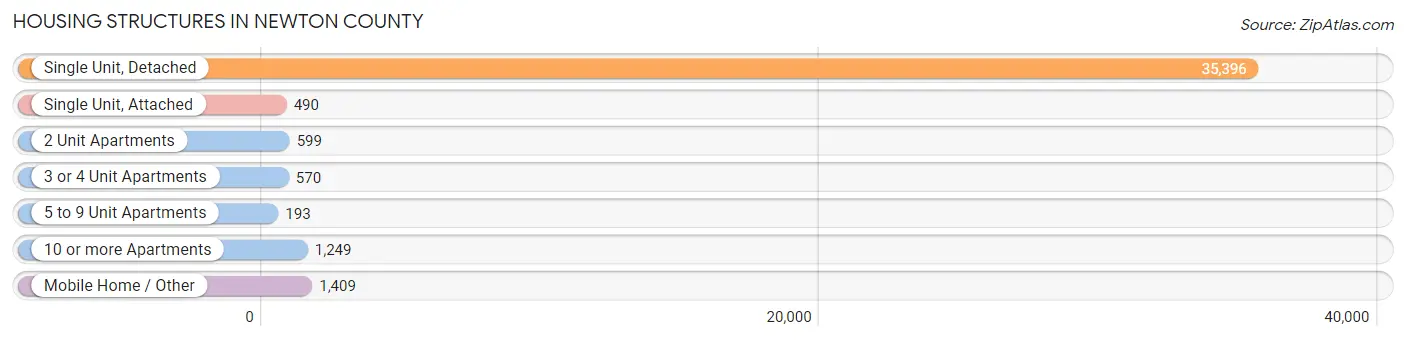
| Structure Type | # Housing Units | % Housing Units |
| Single Unit, Detached | 35,396 | 88.7% |
| Single Unit, Attached | 490 | 1.2% |
| 2 Unit Apartments | 599 | 1.5% |
| 3 or 4 Unit Apartments | 570 | 1.4% |
| 5 to 9 Unit Apartments | 193 | 0.5% |
| 10 or more Apartments | 1,249 | 3.1% |
| Mobile Home / Other | 1,409 | 3.5% |
| Total | 39,906 | 100.0% |
Housing Structures by Occupancy in Newton County
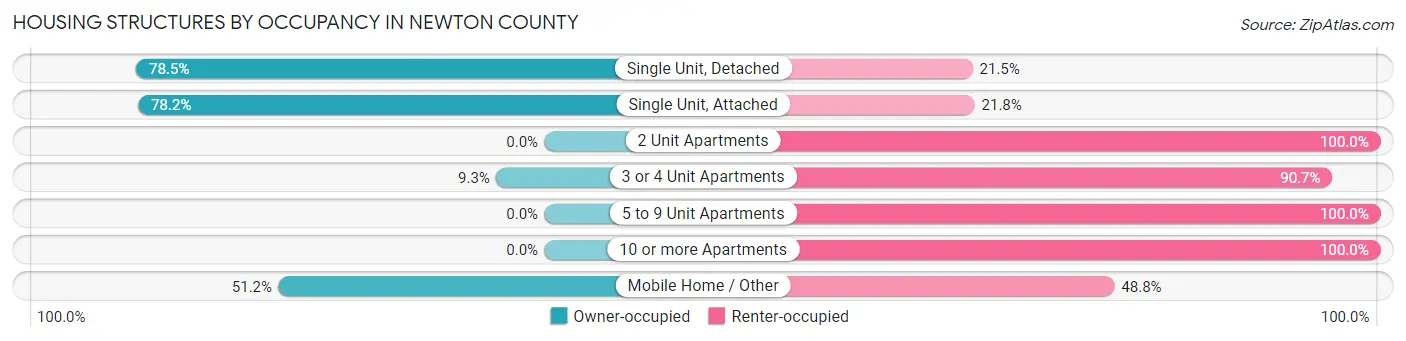
| Structure Type | Owner-occupied | Renter-occupied |
| Single Unit, Detached | 27,800 (78.5%) | 7,596 (21.5%) |
| Single Unit, Attached | 383 (78.2%) | 107 (21.8%) |
| 2 Unit Apartments | 0 (0.0%) | 599 (100.0%) |
| 3 or 4 Unit Apartments | 53 (9.3%) | 517 (90.7%) |
| 5 to 9 Unit Apartments | 0 (0.0%) | 193 (100.0%) |
| 10 or more Apartments | 0 (0.0%) | 1,249 (100.0%) |
| Mobile Home / Other | 722 (51.2%) | 687 (48.8%) |
| Total | 28,958 (72.6%) | 10,948 (27.4%) |
Housing Structures by Number of Rooms in Newton County
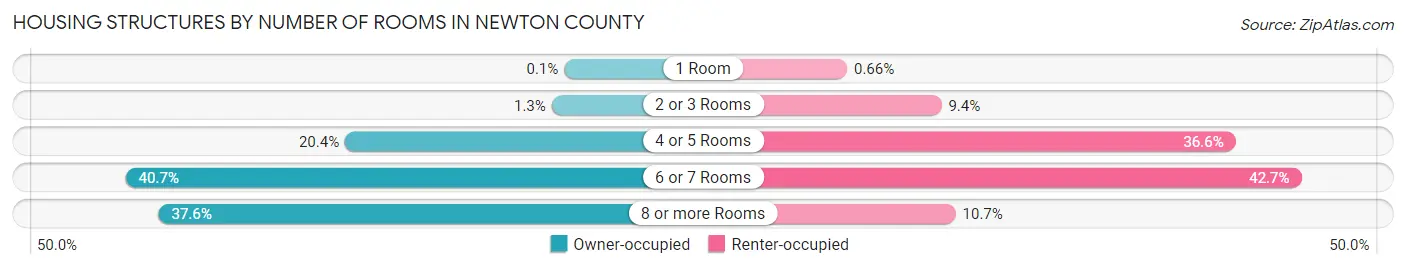
| Number of Rooms | Owner-occupied | Renter-occupied |
| 1 Room | 30 (0.1%) | 72 (0.7%) |
| 2 or 3 Rooms | 365 (1.3%) | 1,028 (9.4%) |
| 4 or 5 Rooms | 5,898 (20.4%) | 4,005 (36.6%) |
| 6 or 7 Rooms | 11,773 (40.7%) | 4,672 (42.7%) |
| 8 or more Rooms | 10,892 (37.6%) | 1,171 (10.7%) |
| Total | 28,958 (100.0%) | 10,948 (100.0%) |
Housing Structure by Heating Type in Newton County
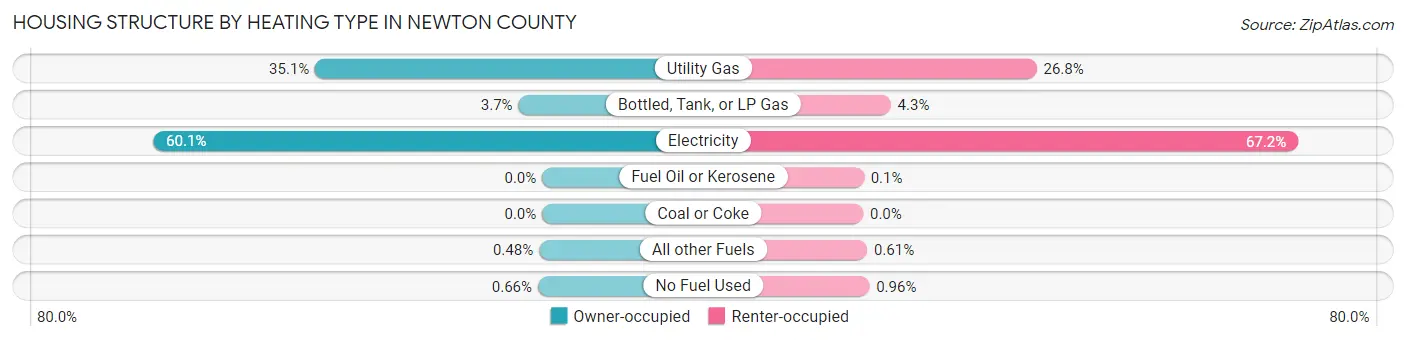
| Heating Type | Owner-occupied | Renter-occupied |
| Utility Gas | 10,158 (35.1%) | 2,936 (26.8%) |
| Bottled, Tank, or LP Gas | 1,061 (3.7%) | 468 (4.3%) |
| Electricity | 17,410 (60.1%) | 7,361 (67.2%) |
| Fuel Oil or Kerosene | 0 (0.0%) | 11 (0.1%) |
| Coal or Coke | 0 (0.0%) | 0 (0.0%) |
| All other Fuels | 139 (0.5%) | 67 (0.6%) |
| No Fuel Used | 190 (0.7%) | 105 (1.0%) |
| Total | 28,958 (100.0%) | 10,948 (100.0%) |
Household Vehicle Usage in Newton County
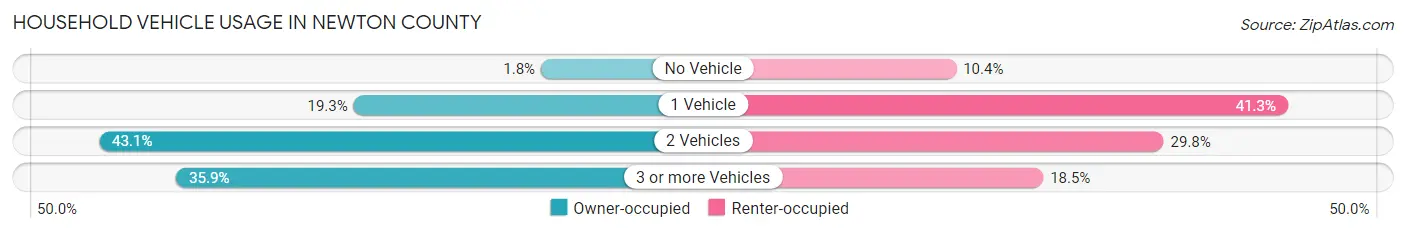
| Vehicles per Household | Owner-occupied | Renter-occupied |
| No Vehicle | 522 (1.8%) | 1,138 (10.4%) |
| 1 Vehicle | 5,587 (19.3%) | 4,526 (41.3%) |
| 2 Vehicles | 12,467 (43.0%) | 3,257 (29.7%) |
| 3 or more Vehicles | 10,382 (35.8%) | 2,027 (18.5%) |
| Total | 28,958 (100.0%) | 10,948 (100.0%) |
Real Estate & Mortgages in Newton County
Real Estate and Mortgage Overview in Newton County
| Characteristic | Without Mortgage | With Mortgage |
| Housing Units | 7,920 | 21,038 |
| Median Property Value | $191,700 | $202,800 |
| Median Household Income | $62,987 | $3,729 |
| Monthly Housing Costs | $468 | $595 |
| Real Estate Taxes | $1,465 | $409 |
Property Value by Mortgage Status in Newton County
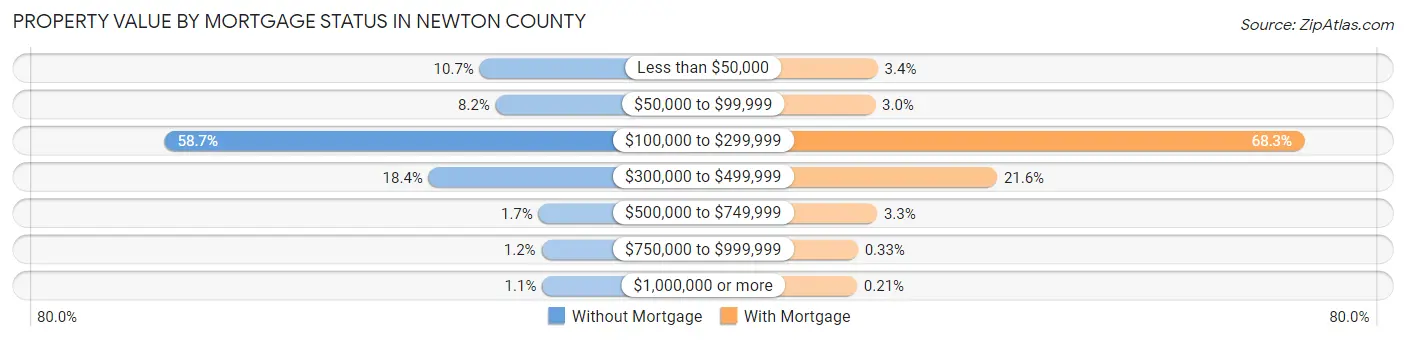
| Property Value | Without Mortgage | With Mortgage |
| Less than $50,000 | 844 (10.7%) | 708 (3.4%) |
| $50,000 to $99,999 | 651 (8.2%) | 626 (3.0%) |
| $100,000 to $299,999 | 4,646 (58.7%) | 14,372 (68.3%) |
| $300,000 to $499,999 | 1,460 (18.4%) | 4,534 (21.5%) |
| $500,000 to $749,999 | 132 (1.7%) | 685 (3.3%) |
| $750,000 to $999,999 | 98 (1.2%) | 69 (0.3%) |
| $1,000,000 or more | 89 (1.1%) | 44 (0.2%) |
| Total | 7,920 (100.0%) | 21,038 (100.0%) |
Household Income by Mortgage Status in Newton County
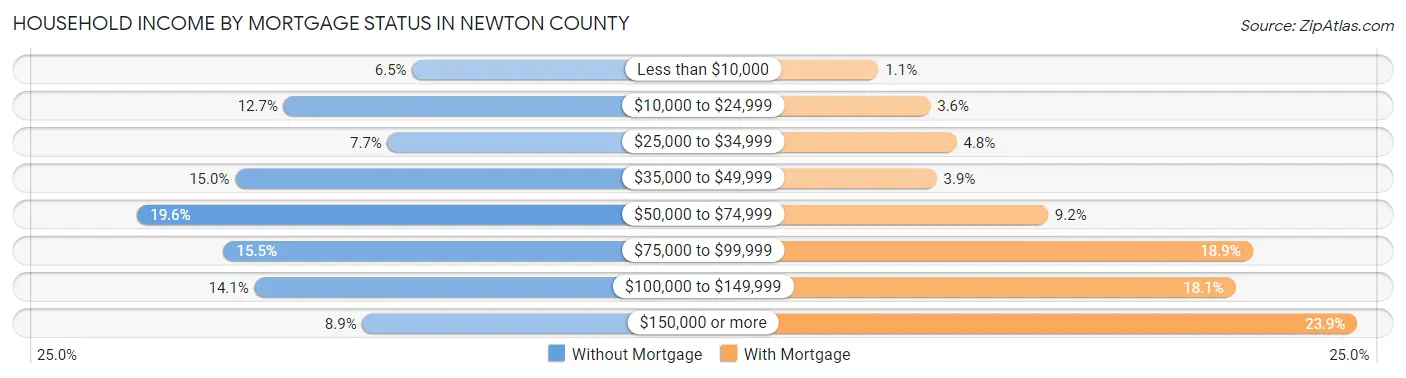
| Household Income | Without Mortgage | With Mortgage |
| Less than $10,000 | 517 (6.5%) | 229 (1.1%) |
| $10,000 to $24,999 | 1,003 (12.7%) | 750 (3.6%) |
| $25,000 to $34,999 | 611 (7.7%) | 1,011 (4.8%) |
| $35,000 to $49,999 | 1,186 (15.0%) | 812 (3.9%) |
| $50,000 to $74,999 | 1,555 (19.6%) | 1,928 (9.2%) |
| $75,000 to $99,999 | 1,229 (15.5%) | 3,976 (18.9%) |
| $100,000 to $149,999 | 1,113 (14.1%) | 3,805 (18.1%) |
| $150,000 or more | 706 (8.9%) | 5,027 (23.9%) |
| Total | 7,920 (100.0%) | 21,038 (100.0%) |
Property Value to Household Income Ratio in Newton County
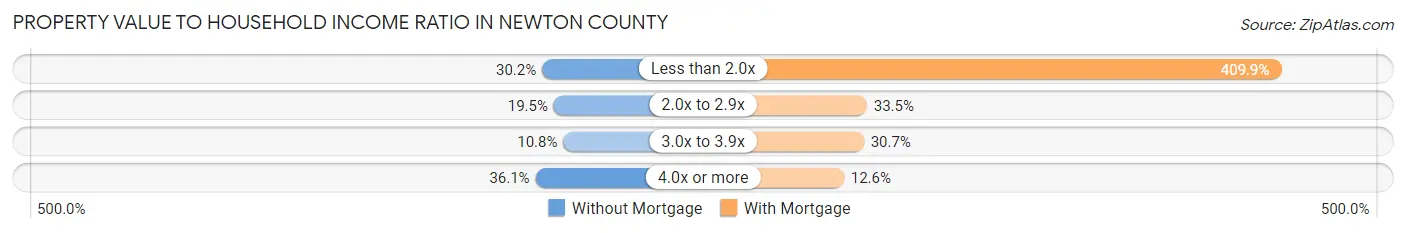
| Value-to-Income Ratio | Without Mortgage | With Mortgage |
| Less than 2.0x | 2,389 (30.2%) | 86,226 (409.9%) |
| 2.0x to 2.9x | 1,544 (19.5%) | 7,049 (33.5%) |
| 3.0x to 3.9x | 856 (10.8%) | 6,455 (30.7%) |
| 4.0x or more | 2,860 (36.1%) | 2,643 (12.6%) |
| Total | 7,920 (100.0%) | 21,038 (100.0%) |
Real Estate Taxes by Mortgage Status in Newton County
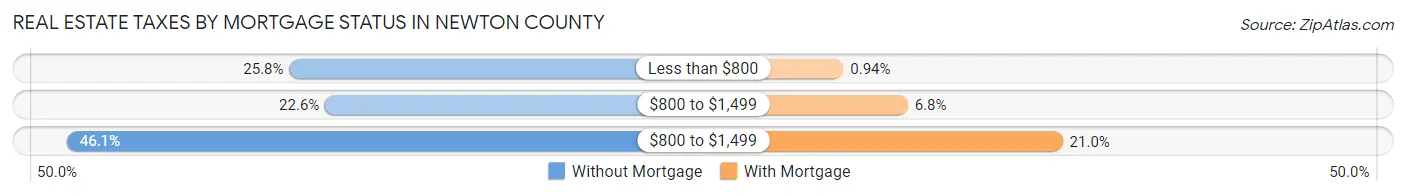
| Property Taxes | Without Mortgage | With Mortgage |
| Less than $800 | 2,045 (25.8%) | 197 (0.9%) |
| $800 to $1,499 | 1,786 (22.6%) | 1,435 (6.8%) |
| $800 to $1,499 | 3,654 (46.1%) | 4,411 (21.0%) |
| Total | 7,920 (100.0%) | 21,038 (100.0%) |
Health & Disability in Newton County
Health Insurance Coverage by Age in Newton County
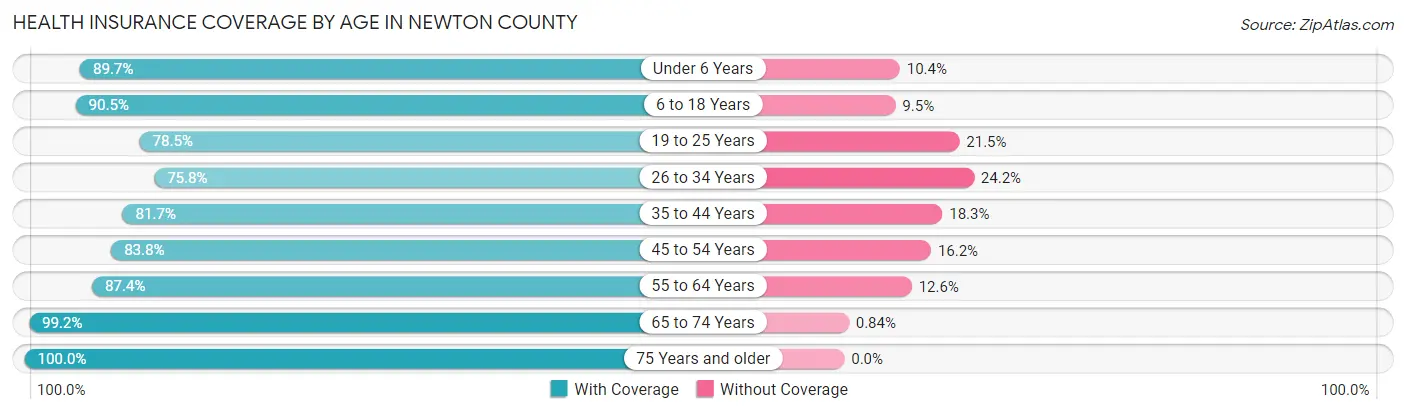
| Age Bracket | With Coverage | Without Coverage |
| Under 6 Years | 7,712 (89.6%) | 890 (10.3%) |
| 6 to 18 Years | 20,157 (90.5%) | 2,124 (9.5%) |
| 19 to 25 Years | 7,750 (78.5%) | 2,118 (21.5%) |
| 26 to 34 Years | 10,263 (75.8%) | 3,272 (24.2%) |
| 35 to 44 Years | 11,756 (81.7%) | 2,628 (18.3%) |
| 45 to 54 Years | 13,037 (83.8%) | 2,512 (16.2%) |
| 55 to 64 Years | 11,812 (87.4%) | 1,698 (12.6%) |
| 65 to 74 Years | 9,253 (99.2%) | 78 (0.8%) |
| 75 Years and older | 5,342 (100.0%) | 0 (0.0%) |
| Total | 97,082 (86.4%) | 15,320 (13.6%) |
Health Insurance Coverage by Citizenship Status in Newton County
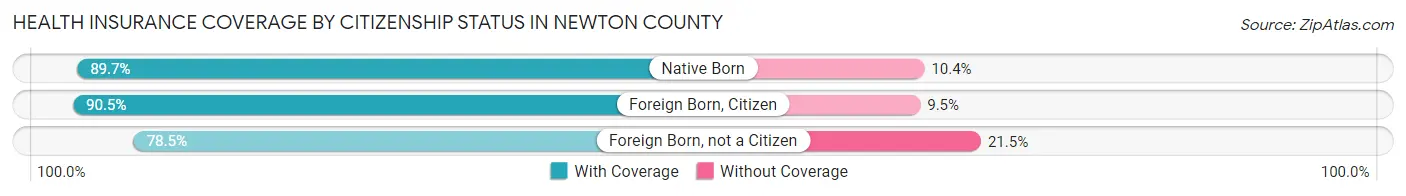
| Citizenship Status | With Coverage | Without Coverage |
| Native Born | 7,712 (89.6%) | 890 (10.3%) |
| Foreign Born, Citizen | 20,157 (90.5%) | 2,124 (9.5%) |
| Foreign Born, not a Citizen | 7,750 (78.5%) | 2,118 (21.5%) |
Health Insurance Coverage by Household Income in Newton County
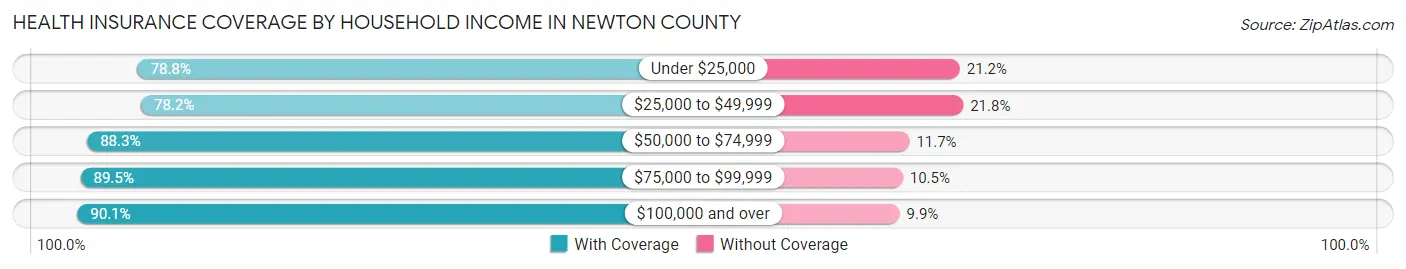
| Household Income | With Coverage | Without Coverage |
| Under $25,000 | 9,685 (78.8%) | 2,603 (21.2%) |
| $25,000 to $49,999 | 15,386 (78.2%) | 4,294 (21.8%) |
| $50,000 to $74,999 | 16,799 (88.3%) | 2,235 (11.7%) |
| $75,000 to $99,999 | 17,712 (89.5%) | 2,076 (10.5%) |
| $100,000 and over | 36,982 (90.1%) | 4,058 (9.9%) |
Public vs Private Health Insurance Coverage by Age in Newton County
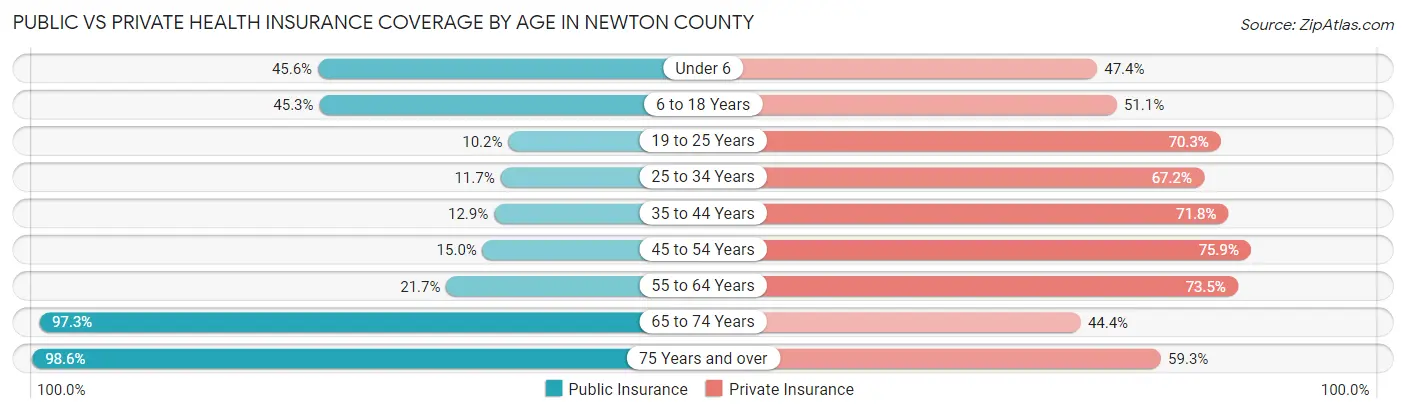
| Age Bracket | Public Insurance | Private Insurance |
| Under 6 | 3,918 (45.6%) | 4,079 (47.4%) |
| 6 to 18 Years | 10,092 (45.3%) | 11,381 (51.1%) |
| 19 to 25 Years | 1,009 (10.2%) | 6,939 (70.3%) |
| 25 to 34 Years | 1,579 (11.7%) | 9,091 (67.2%) |
| 35 to 44 Years | 1,850 (12.9%) | 10,320 (71.8%) |
| 45 to 54 Years | 2,330 (15.0%) | 11,802 (75.9%) |
| 55 to 64 Years | 2,936 (21.7%) | 9,927 (73.5%) |
| 65 to 74 Years | 9,082 (97.3%) | 4,142 (44.4%) |
| 75 Years and over | 5,266 (98.6%) | 3,167 (59.3%) |
| Total | 38,062 (33.9%) | 70,848 (63.0%) |
Disability Status by Sex by Age in Newton County
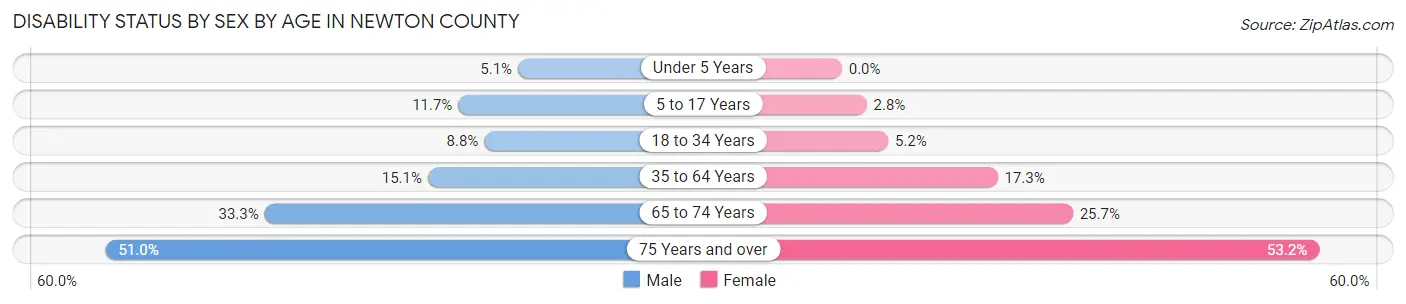
| Age Bracket | Male | Female |
| Under 5 Years | 174 (5.1%) | 0 (0.0%) |
| 5 to 17 Years | 1,311 (11.7%) | 298 (2.8%) |
| 18 to 34 Years | 1,073 (8.8%) | 680 (5.1%) |
| 35 to 64 Years | 3,014 (15.1%) | 4,071 (17.3%) |
| 65 to 74 Years | 1,366 (33.3%) | 1,344 (25.7%) |
| 75 Years and over | 1,078 (51.0%) | 1,716 (53.2%) |
Disability Class by Sex by Age in Newton County
Disability Class: Hearing Difficulty
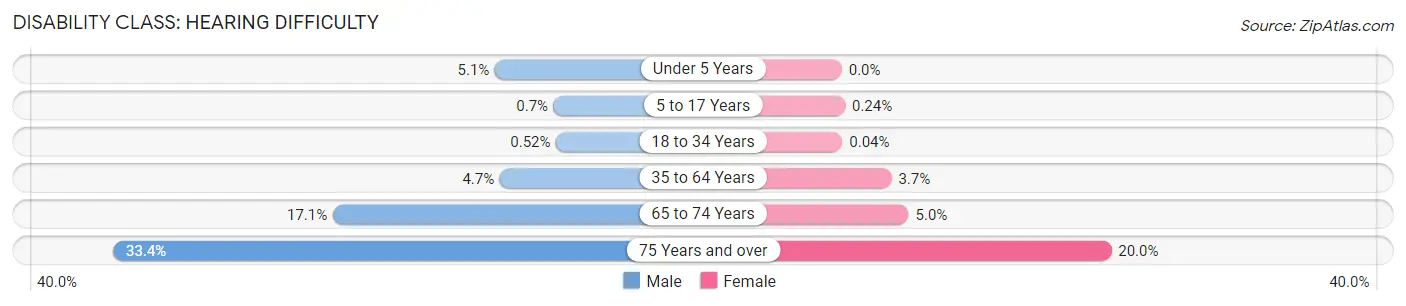
| Age Bracket | Male | Female |
| Under 5 Years | 174 (5.1%) | 0 (0.0%) |
| 5 to 17 Years | 78 (0.7%) | 26 (0.2%) |
| 18 to 34 Years | 63 (0.5%) | 5 (0.0%) |
| 35 to 64 Years | 939 (4.7%) | 867 (3.7%) |
| 65 to 74 Years | 702 (17.1%) | 259 (5.0%) |
| 75 Years and over | 707 (33.4%) | 646 (20.0%) |
Disability Class: Vision Difficulty
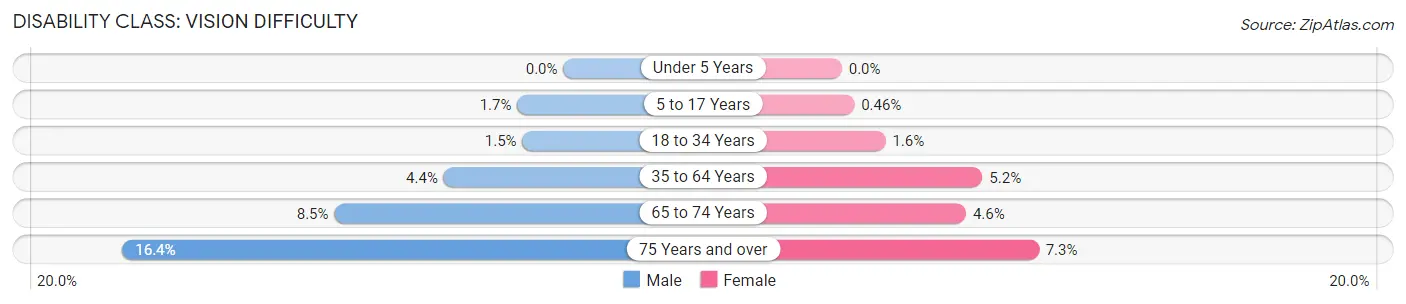
| Age Bracket | Male | Female |
| Under 5 Years | 0 (0.0%) | 0 (0.0%) |
| 5 to 17 Years | 191 (1.7%) | 50 (0.5%) |
| 18 to 34 Years | 185 (1.5%) | 214 (1.6%) |
| 35 to 64 Years | 887 (4.4%) | 1,226 (5.2%) |
| 65 to 74 Years | 349 (8.5%) | 241 (4.6%) |
| 75 Years and over | 346 (16.4%) | 236 (7.3%) |
Disability Class: Cognitive Difficulty
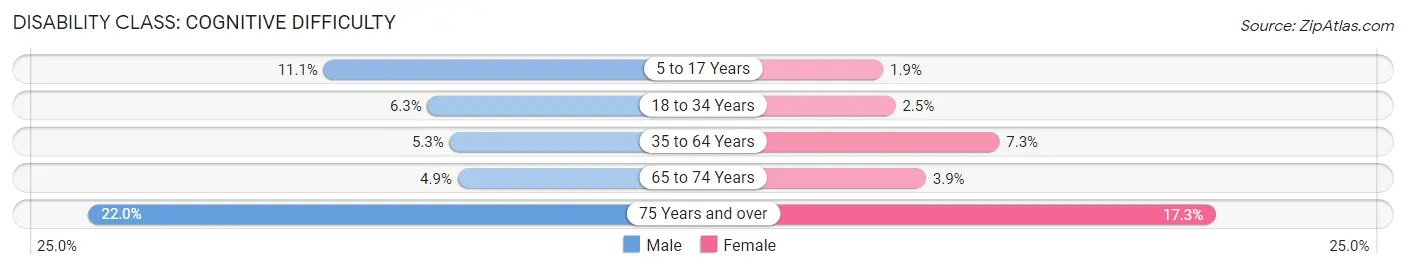
| Age Bracket | Male | Female |
| 5 to 17 Years | 1,245 (11.1%) | 207 (1.9%) |
| 18 to 34 Years | 766 (6.3%) | 329 (2.5%) |
| 35 to 64 Years | 1,054 (5.3%) | 1,717 (7.3%) |
| 65 to 74 Years | 201 (4.9%) | 204 (3.9%) |
| 75 Years and over | 466 (22.0%) | 559 (17.3%) |
Disability Class: Ambulatory Difficulty
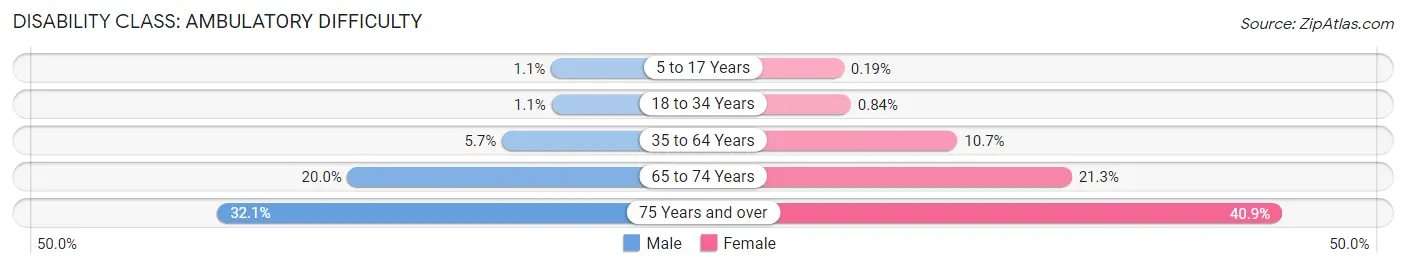
| Age Bracket | Male | Female |
| 5 to 17 Years | 127 (1.1%) | 20 (0.2%) |
| 18 to 34 Years | 134 (1.1%) | 111 (0.8%) |
| 35 to 64 Years | 1,136 (5.7%) | 2,519 (10.7%) |
| 65 to 74 Years | 822 (20.0%) | 1,115 (21.3%) |
| 75 Years and over | 679 (32.1%) | 1,319 (40.9%) |
Disability Class: Self-Care Difficulty
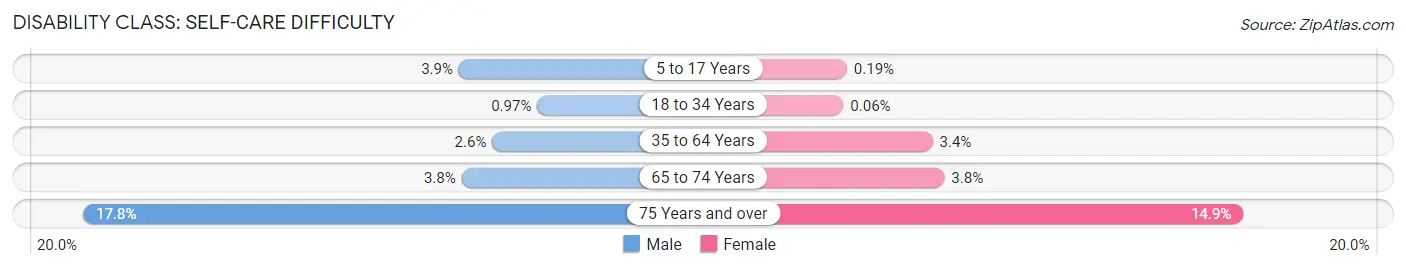
| Age Bracket | Male | Female |
| 5 to 17 Years | 434 (3.9%) | 20 (0.2%) |
| 18 to 34 Years | 118 (1.0%) | 8 (0.1%) |
| 35 to 64 Years | 527 (2.6%) | 791 (3.4%) |
| 65 to 74 Years | 155 (3.8%) | 199 (3.8%) |
| 75 Years and over | 377 (17.8%) | 481 (14.9%) |
Technology Access in Newton County
Computing Device Access in Newton County
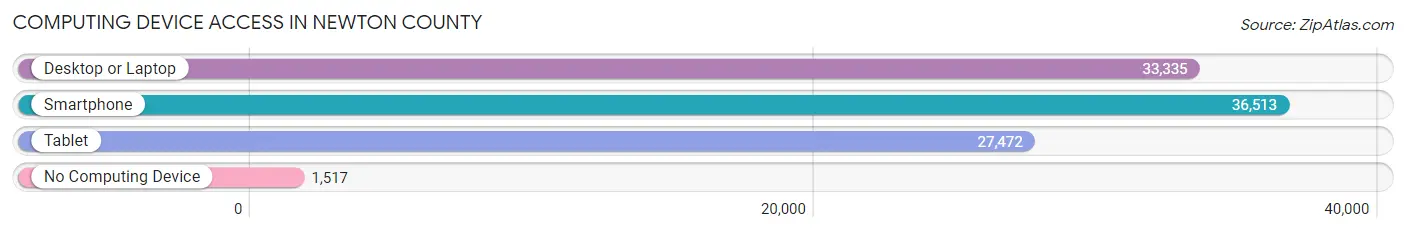
| Device Type | # Households | % Households |
| Desktop or Laptop | 33,335 | 83.5% |
| Smartphone | 36,513 | 91.5% |
| Tablet | 27,472 | 68.8% |
| No Computing Device | 1,517 | 3.8% |
| Total | 39,906 | 100.0% |
Internet Access in Newton County
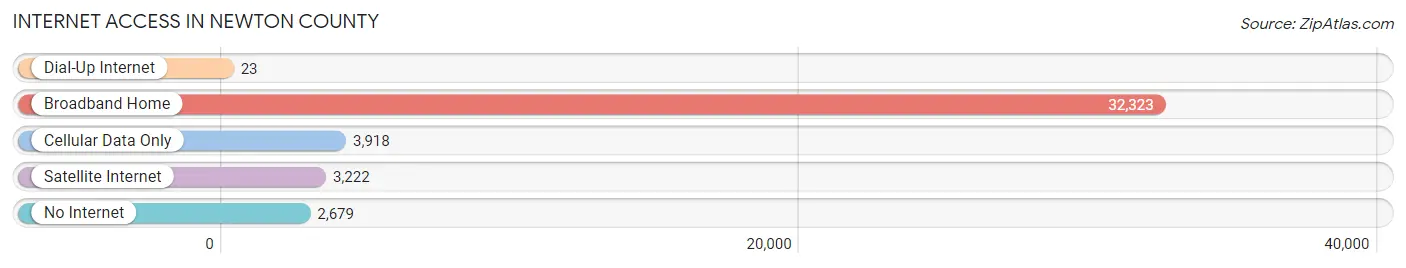
| Internet Type | # Households | % Households |
| Dial-Up Internet | 23 | 0.1% |
| Broadband Home | 32,323 | 81.0% |
| Cellular Data Only | 3,918 | 9.8% |
| Satellite Internet | 3,222 | 8.1% |
| No Internet | 2,679 | 6.7% |
| Total | 39,906 | 100.0% |
Newton County Summary
Newton County is a county located in the north-central part of the U.S. state of Georgia. As of the 2010 census, the population was 99,958. The county seat is Covington. Newton County is included in the Atlanta-Sandy Springs-Roswell, GA Metropolitan Statistical Area.
History
Newton County was created on December 24, 1821, from a portion of Henry County. It was named for Sgt. John Newton, who served under Gen. Francis Marion, the "Swamp Fox", in the American Revolutionary War. During the American Civil War, the county provided the Lamar Infantry, which was a part of Cobb's Legion.
Geography
Newton County is located in the Piedmont region of Georgia. The county is bordered by Rockdale County to the north, Walton County to the east, Morgan County to the south, and Jasper County to the west. The county is located approximately 45 miles east of Atlanta.
The county is divided into two distinct regions by the Yellow River, which runs through the center of the county. The northern portion of the county is located in the Upper Ocmulgee River sub-basin of the Altamaha River basin, while the southern portion is located in the Upper Oconee River sub-basin of the same Altamaha River basin.
The county is home to the Georgia International Horse Park, which hosted equestrian events during the 1996 Summer Olympics.
Economy
Newton County is home to a variety of industries, including manufacturing, healthcare, retail, and tourism. The county is home to several large employers, including Baxter International, Georgia-Pacific, and Siemens.
The county is also home to several tourist attractions, including the Georgia International Horse Park, the Newton County Historical Society, and the Newton County Arts Association.
Demographics
As of the 2010 United States Census, there were 99,958 people, 36,845 households, and 26,845 families residing in the county. The population density was 246.3 inhabitants per square mile (95.0/km2). There were 40,817 housing units at an average density of 100.3 per square mile (38.7/km2). The racial makeup of the county was 68.2% white, 25.2% black or African American, 0.5% Asian, 0.3% American Indian, 4.2% from other races, and 1.6% from two or more races. Those of Hispanic or Latino origin made up 8.2% of the population.
In terms of ancestry, 16.2% were American, 11.2% were Irish, 10.2% were German, and 8.2% were English. Of the 36,845 households, 37.3% had children under the age of 18 living with them, 51.2% were married couples living together, 15.2% had a female householder with no husband present, 27.2% were non-families, and 22.2% of all households were made up of individuals. The average household size was 2.68 and the average family size was 3.13.
The median age in the county was 36.2 years. 25.7% of residents were under the age of 18; 8.7% were between the ages of 18 and 24; 27.2% were from 25 to 44; 25.7% were from 45 to 64; and 12.7% were 65 years of age or older. The gender makeup of the county was 48.2% male and 51.8% female.
Income
The median income for a household in the county was $45,853 and the median income for a family was $53,890. Males had a median income of $38,890 versus $30,845 for females. The per capita income for the county was $21,945. About 11.2% of families and 14.2% of the population were below the poverty line, including 19.2% of those under age 18 and 11.2% of those age 65 or over.
Common Questions
What is the Total Population of Newton County?
Total Population of Newton County is 113,298.
What is the Total Male Population of Newton County?
Total Male Population of Newton County is 53,614.
What is the Total Female Population of Newton County?
Total Female Population of Newton County is 59,684.
What is the Ratio of Males per 100 Females in Newton County?
There are 89.83 Males per 100 Females in Newton County.
What is the Ratio of Females per 100 Males in Newton County?
There are 111.32 Females per 100 Males in Newton County.
What is the Median Population Age in Newton County?
Median Population Age in Newton County is 36.4 Years.
What is the Average Family Size in Newton County
Average Family Size in Newton County is 3.3 People.
What is the Average Household Size in Newton County
Average Household Size in Newton County is 2.8 People.
What is Per Capita Income in Newton County?
Per Capita income in Newton County is $30,101.
What is the Median Family Income in Newton County?
Median Family Income in Newton County is $75,725.
What is the Median Household income in Newton County?
Median Household Income in Newton County is $70,732.
What is Income or Wage Gap in Newton County?
Income or Wage Gap in Newton County is 23.5%.
Women in Newton County earn 76.5 cents for every dollar earned by a man.
What is Family Income Deficit in Newton County?
Family Income Deficit in Newton County is $11,151.
Families that are below poverty line in Newton County earn $11,151 less on average than the poverty threshold level.
What is Inequality or Gini Index in Newton County?
Inequality or Gini Index in Newton County is 0.41.
How Large is the Labor Force in Newton County?
There are 56,618 People in the Labor Forcein in Newton County.
What is the Percentage of People in the Labor Force in Newton County?
64.7% of People are in the Labor Force in Newton County.
What is the Unemployment Rate in Newton County?
Unemployment Rate in Newton County is 6.6%.