Carroll County, GA
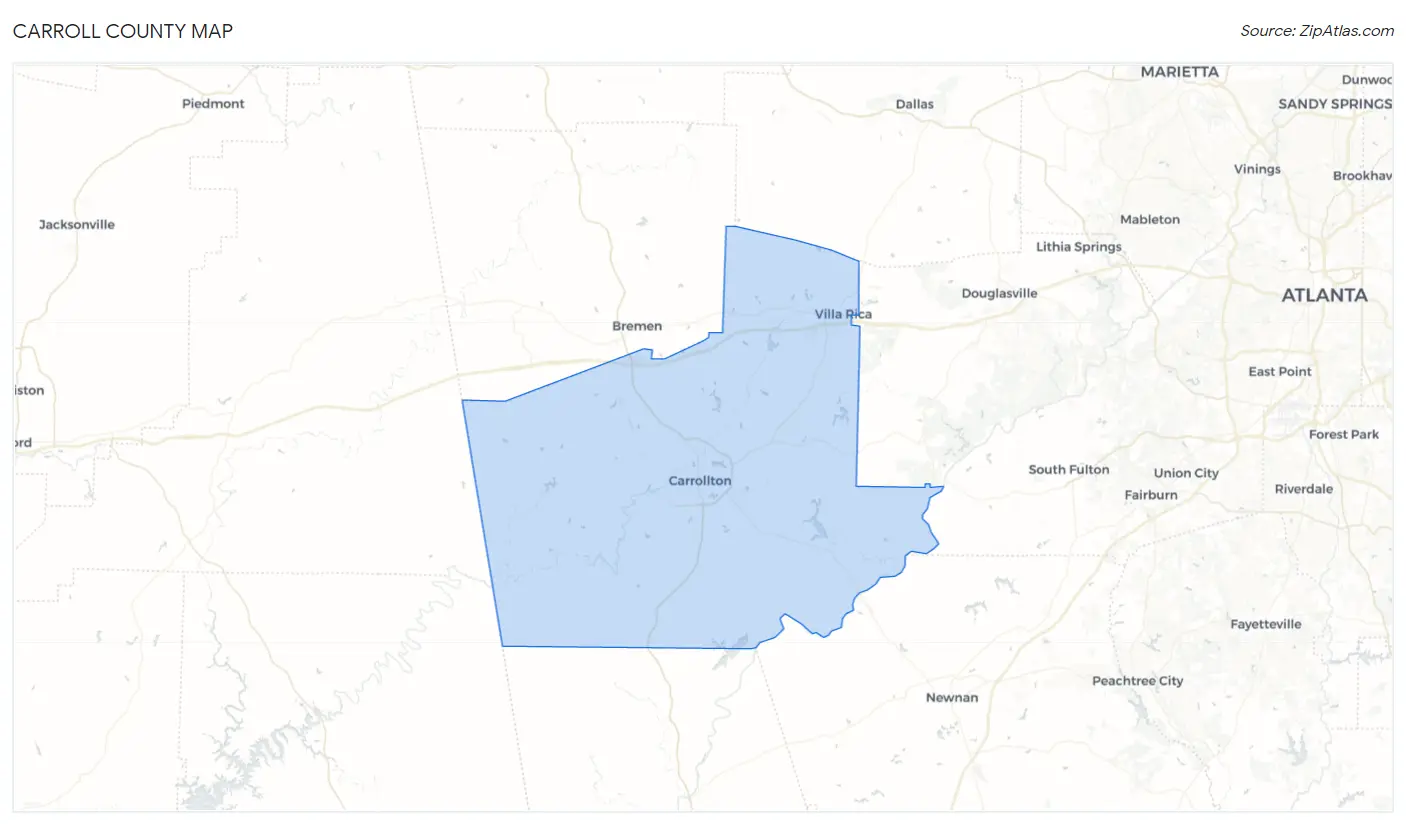
Carroll County Map
Carroll County Overview
120,060
TOTAL POPULATION
58,690
MALE POPULATION
61,370
FEMALE POPULATION
95.63
MALES / 100 FEMALES
104.57
FEMALES / 100 MALES
35.2
MEDIAN AGE
3.1
AVG FAMILY SIZE
2.7
AVG HOUSEHOLD SIZE
$30,827
PER CAPITA INCOME
$79,624
AVG FAMILY INCOME
$66,895
AVG HOUSEHOLD INCOME
31.6%
WAGE / INCOME GAP [ % ]
68.4¢/ $1
WAGE / INCOME GAP [ $ ]
$9,705
FAMILY INCOME DEFICIT
0.44
INEQUALITY / GINI INDEX
59,708
LABOR FORCE [ PEOPLE ]
62.9%
PERCENT IN LABOR FORCE
5.9%
UNEMPLOYMENT RATE
Race in Carroll County
The most populous races in Carroll County are White / Caucasian (85,441 | 71.2%), Black / African American (24,231 | 20.2%), and Hispanic or Latino (8,950 | 7.4%).
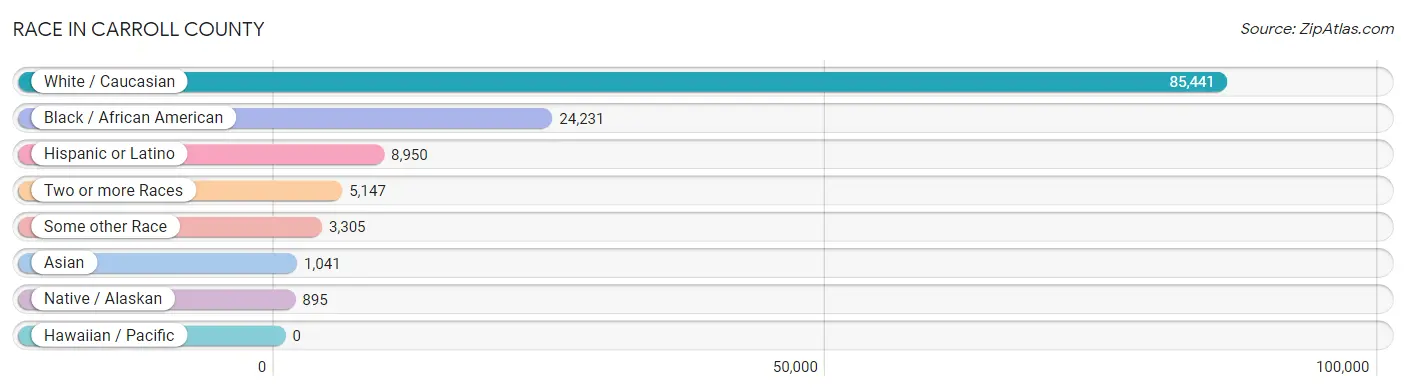
| Race | # Population | % Population |
| Asian | 1,041 | 0.9% |
| Black / African American | 24,231 | 20.2% |
| Hawaiian / Pacific | 0 | 0.0% |
| Hispanic or Latino | 8,950 | 7.4% |
| Native / Alaskan | 895 | 0.7% |
| White / Caucasian | 85,441 | 71.2% |
| Two or more Races | 5,147 | 4.3% |
| Some other Race | 3,305 | 2.8% |
| Total | 120,060 | 100.0% |
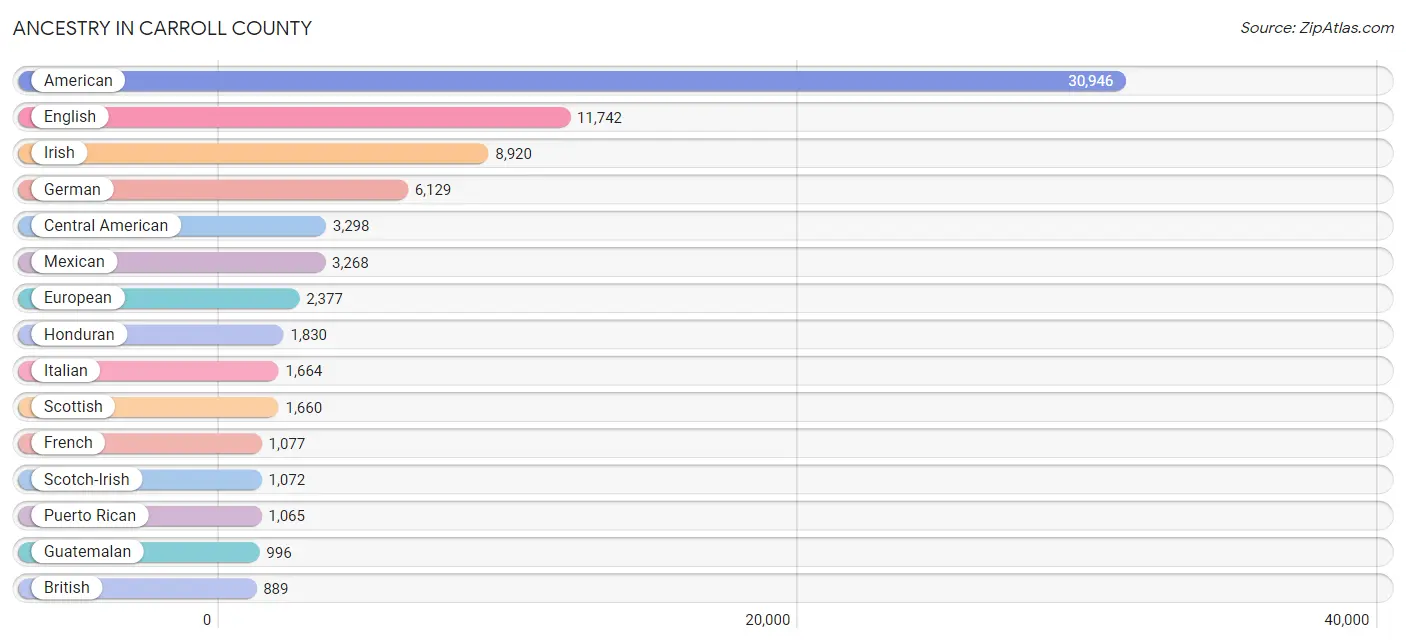
Ancestry in Carroll County
The most populous ancestries reported in Carroll County are American (30,946 | 25.8%), English (11,742 | 9.8%), Irish (8,920 | 7.4%), German (6,129 | 5.1%), and Central American (3,298 | 2.8%), together accounting for 50.8% of all Carroll County residents.
| Ancestry | # Population | % Population |
| Afghan | 3 | 0.0% |
| African | 252 | 0.2% |
| Aleut | 11 | 0.0% |
| American | 30,946 | 25.8% |
| Arab | 40 | 0.0% |
| Argentinean | 2 | 0.0% |
| Armenian | 21 | 0.0% |
| Australian | 8 | 0.0% |
| Austrian | 68 | 0.1% |
| Bahamian | 6 | 0.0% |
| Belgian | 27 | 0.0% |
| Belizean | 16 | 0.0% |
| Bhutanese | 219 | 0.2% |
| Blackfeet | 3 | 0.0% |
| Bolivian | 25 | 0.0% |
| Brazilian | 54 | 0.0% |
| British | 889 | 0.7% |
| British West Indian | 85 | 0.1% |
| Burmese | 80 | 0.1% |
| Canadian | 417 | 0.4% |
| Cape Verdean | 5 | 0.0% |
| Celtic | 17 | 0.0% |
| Central American | 3,298 | 2.8% |
| Central American Indian | 723 | 0.6% |
| Cherokee | 315 | 0.3% |
| Chilean | 46 | 0.0% |
| Chippewa | 27 | 0.0% |
| Colombian | 24 | 0.0% |
| Costa Rican | 6 | 0.0% |
| Creek | 52 | 0.0% |
| Croatian | 4 | 0.0% |
| Cuban | 371 | 0.3% |
| Czech | 195 | 0.2% |
| Czechoslovakian | 27 | 0.0% |
| Dominican | 95 | 0.1% |
| Dutch | 869 | 0.7% |
| Eastern European | 336 | 0.3% |
| Ecuadorian | 31 | 0.0% |
| English | 11,742 | 9.8% |
| Ethiopian | 23 | 0.0% |
| European | 2,377 | 2.0% |
| Filipino | 1 | 0.0% |
| Finnish | 60 | 0.1% |
| French | 1,077 | 0.9% |
| French Canadian | 433 | 0.4% |
| German | 6,129 | 5.1% |
| Ghanaian | 73 | 0.1% |
| Greek | 38 | 0.0% |
| Guatemalan | 996 | 0.8% |
| Haitian | 158 | 0.1% |
| Honduran | 1,830 | 1.5% |
| Hungarian | 45 | 0.0% |
| Icelander | 13 | 0.0% |
| Indian (Asian) | 112 | 0.1% |
| Indonesian | 36 | 0.0% |
| Iranian | 33 | 0.0% |
| Irish | 8,920 | 7.4% |
| Italian | 1,664 | 1.4% |
| Jamaican | 80 | 0.1% |
| Japanese | 80 | 0.1% |
| Kenyan | 24 | 0.0% |
| Korean | 155 | 0.1% |
| Laotian | 29 | 0.0% |
| Latvian | 26 | 0.0% |
| Lebanese | 40 | 0.0% |
| Liberian | 53 | 0.0% |
| Lithuanian | 46 | 0.0% |
| Malaysian | 115 | 0.1% |
| Mexican | 3,268 | 2.7% |
| Native Hawaiian | 46 | 0.0% |
| Navajo | 13 | 0.0% |
| Nicaraguan | 153 | 0.1% |
| Nigerian | 145 | 0.1% |
| Northern European | 206 | 0.2% |
| Norwegian | 299 | 0.3% |
| Pakistani | 208 | 0.2% |
| Peruvian | 48 | 0.0% |
| Polish | 638 | 0.5% |
| Portuguese | 76 | 0.1% |
| Puerto Rican | 1,065 | 0.9% |
| Russian | 157 | 0.1% |
| Salvadoran | 313 | 0.3% |
| Scandinavian | 605 | 0.5% |
| Scotch-Irish | 1,072 | 0.9% |
| Scottish | 1,660 | 1.4% |
| Seminole | 19 | 0.0% |
| Sierra Leonean | 11 | 0.0% |
| Slavic | 4 | 0.0% |
| Slovak | 126 | 0.1% |
| Slovene | 7 | 0.0% |
| South American | 353 | 0.3% |
| Spaniard | 258 | 0.2% |
| Spanish | 37 | 0.0% |
| Sri Lankan | 89 | 0.1% |
| Subsaharan African | 839 | 0.7% |
| Swedish | 284 | 0.2% |
| Swiss | 6 | 0.0% |
| Thai | 417 | 0.4% |
| Trinidadian and Tobagonian | 144 | 0.1% |
| Ukrainian | 44 | 0.0% |
| Venezuelan | 177 | 0.2% |
| Welsh | 197 | 0.2% |
| West Indian | 49 | 0.0% |
| Zimbabwean | 19 | 0.0% | View All 104 Rows |
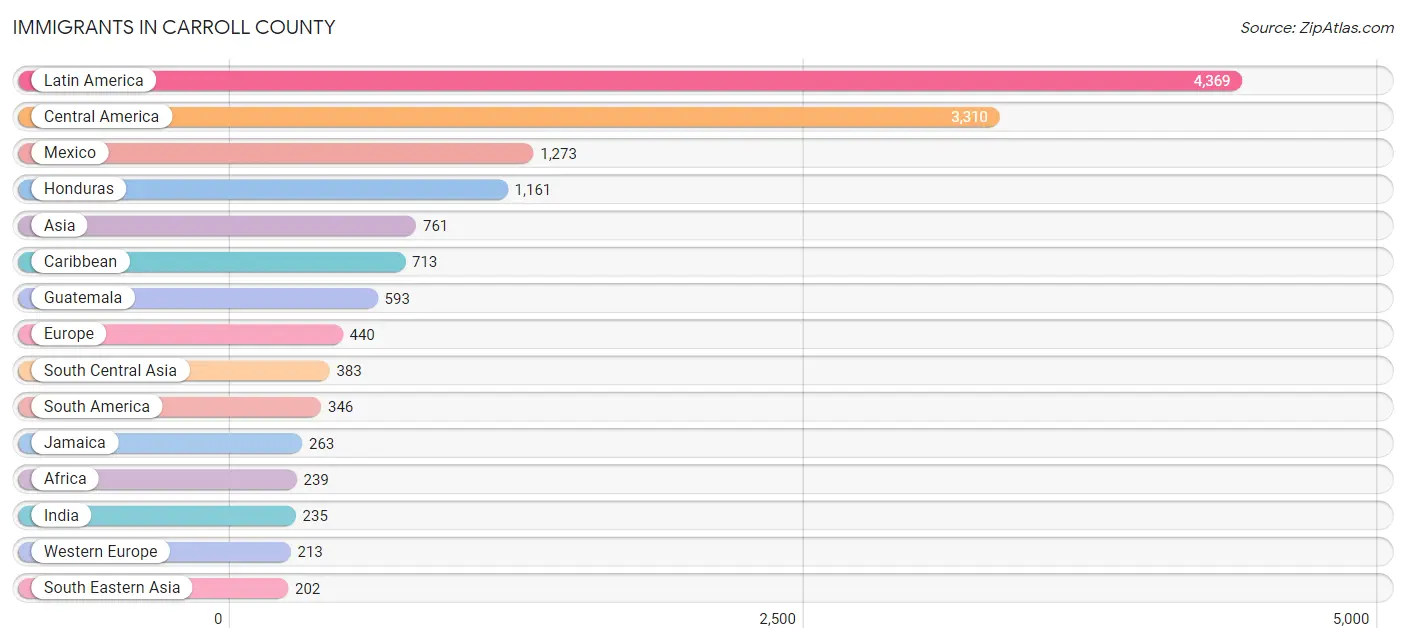
Immigrants in Carroll County
The most numerous immigrant groups reported in Carroll County came from Latin America (4,369 | 3.6%), Central America (3,310 | 2.8%), Mexico (1,273 | 1.1%), Honduras (1,161 | 1.0%), and Asia (761 | 0.6%), together accounting for 9.1% of all Carroll County residents.
| Immigration Origin | # Population | % Population |
| Afghanistan | 3 | 0.0% |
| Africa | 239 | 0.2% |
| Argentina | 2 | 0.0% |
| Asia | 761 | 0.6% |
| Austria | 13 | 0.0% |
| Belize | 16 | 0.0% |
| Bolivia | 25 | 0.0% |
| Brazil | 73 | 0.1% |
| Cameroon | 3 | 0.0% |
| Caribbean | 713 | 0.6% |
| Central America | 3,310 | 2.8% |
| Chile | 46 | 0.0% |
| China | 103 | 0.1% |
| Costa Rica | 6 | 0.0% |
| Cuba | 6 | 0.0% |
| Dominican Republic | 58 | 0.1% |
| Eastern Africa | 11 | 0.0% |
| Eastern Asia | 176 | 0.2% |
| Eastern Europe | 52 | 0.0% |
| El Salvador | 99 | 0.1% |
| England | 90 | 0.1% |
| Ethiopia | 8 | 0.0% |
| Europe | 440 | 0.4% |
| France | 28 | 0.0% |
| Germany | 161 | 0.1% |
| Ghana | 49 | 0.0% |
| Guatemala | 593 | 0.5% |
| Haiti | 164 | 0.1% |
| Honduras | 1,161 | 1.0% |
| India | 235 | 0.2% |
| Iran | 10 | 0.0% |
| Italy | 13 | 0.0% |
| Jamaica | 263 | 0.2% |
| Japan | 30 | 0.0% |
| Kazakhstan | 50 | 0.0% |
| Kenya | 3 | 0.0% |
| Korea | 43 | 0.0% |
| Laos | 43 | 0.0% |
| Latin America | 4,369 | 3.6% |
| Malaysia | 47 | 0.0% |
| Mexico | 1,273 | 1.1% |
| Middle Africa | 22 | 0.0% |
| Nepal | 85 | 0.1% |
| Netherlands | 11 | 0.0% |
| Nicaragua | 153 | 0.1% |
| Nigeria | 14 | 0.0% |
| Northern Europe | 135 | 0.1% |
| Panama | 9 | 0.0% |
| Peru | 25 | 0.0% |
| Philippines | 44 | 0.0% |
| Poland | 17 | 0.0% |
| Russia | 35 | 0.0% |
| Scotland | 8 | 0.0% |
| South America | 346 | 0.3% |
| South Central Asia | 383 | 0.3% |
| South Eastern Asia | 202 | 0.2% |
| Southern Europe | 40 | 0.0% |
| Spain | 27 | 0.0% |
| Taiwan | 1 | 0.0% |
| Thailand | 14 | 0.0% |
| Trinidad and Tobago | 137 | 0.1% |
| Venezuela | 175 | 0.2% |
| Vietnam | 45 | 0.0% |
| Western Africa | 187 | 0.2% |
| Western Europe | 213 | 0.2% |
| Zaire | 19 | 0.0% | View All 66 Rows |
Sex and Age in Carroll County
Sex and Age in Carroll County
The most populous age groups in Carroll County are 20 to 24 Years (5,044 | 8.6%) for men and 20 to 24 Years (5,353 | 8.7%) for women.
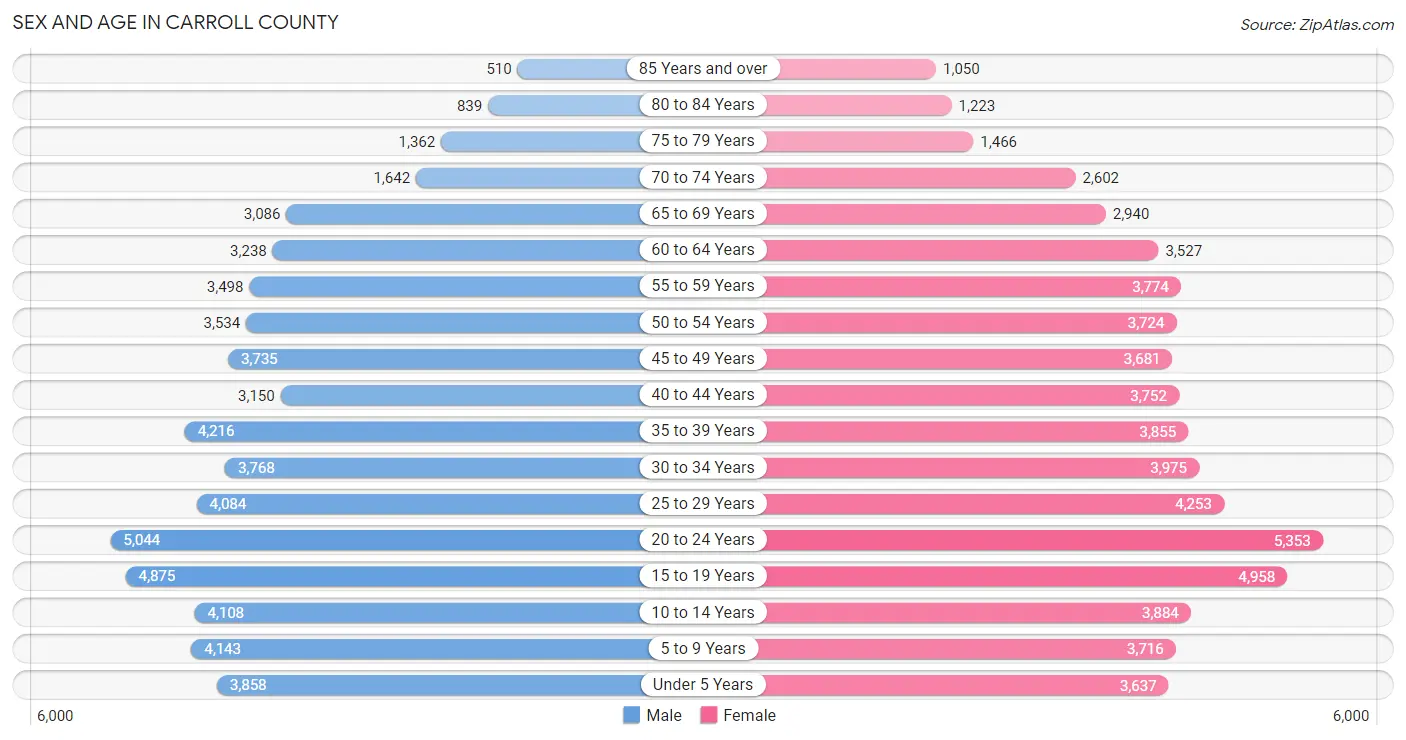
| Age Bracket | Male | Female |
| Under 5 Years | 3,858 (6.6%) | 3,637 (5.9%) |
| 5 to 9 Years | 4,143 (7.1%) | 3,716 (6.1%) |
| 10 to 14 Years | 4,108 (7.0%) | 3,884 (6.3%) |
| 15 to 19 Years | 4,875 (8.3%) | 4,958 (8.1%) |
| 20 to 24 Years | 5,044 (8.6%) | 5,353 (8.7%) |
| 25 to 29 Years | 4,084 (7.0%) | 4,253 (6.9%) |
| 30 to 34 Years | 3,768 (6.4%) | 3,975 (6.5%) |
| 35 to 39 Years | 4,216 (7.2%) | 3,855 (6.3%) |
| 40 to 44 Years | 3,150 (5.4%) | 3,752 (6.1%) |
| 45 to 49 Years | 3,735 (6.4%) | 3,681 (6.0%) |
| 50 to 54 Years | 3,534 (6.0%) | 3,724 (6.1%) |
| 55 to 59 Years | 3,498 (6.0%) | 3,774 (6.1%) |
| 60 to 64 Years | 3,238 (5.5%) | 3,527 (5.8%) |
| 65 to 69 Years | 3,086 (5.3%) | 2,940 (4.8%) |
| 70 to 74 Years | 1,642 (2.8%) | 2,602 (4.2%) |
| 75 to 79 Years | 1,362 (2.3%) | 1,466 (2.4%) |
| 80 to 84 Years | 839 (1.4%) | 1,223 (2.0%) |
| 85 Years and over | 510 (0.9%) | 1,050 (1.7%) |
| Total | 58,690 (100.0%) | 61,370 (100.0%) |
Families and Households in Carroll County
Median Family Size in Carroll County
The median family size in Carroll County is 3.14 persons per family, with single female/mother families (6,912 | 22.5%) accounting for the largest median family size of 3.19 persons per family. On the other hand, single male/father families (2,599 | 8.5%) represent the smallest median family size with 2.88 persons per family.
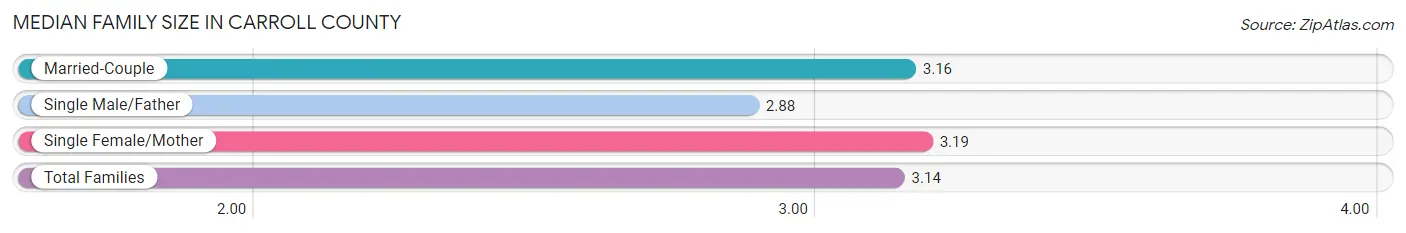
| Family Type | # Families | Family Size |
| Married-Couple | 21,208 (69.0%) | 3.16 |
| Single Male/Father | 2,599 (8.5%) | 2.88 |
| Single Female/Mother | 6,912 (22.5%) | 3.19 |
| Total Families | 30,719 (100.0%) | 3.14 |
Median Household Size in Carroll County
The median household size in Carroll County is 2.72 persons per household, with single female/mother households (6,912 | 16.1%) accounting for the largest median household size of 3.48 persons per household. non-family households (12,277 | 28.5%) represent the smallest median household size with 1.34 persons per household.
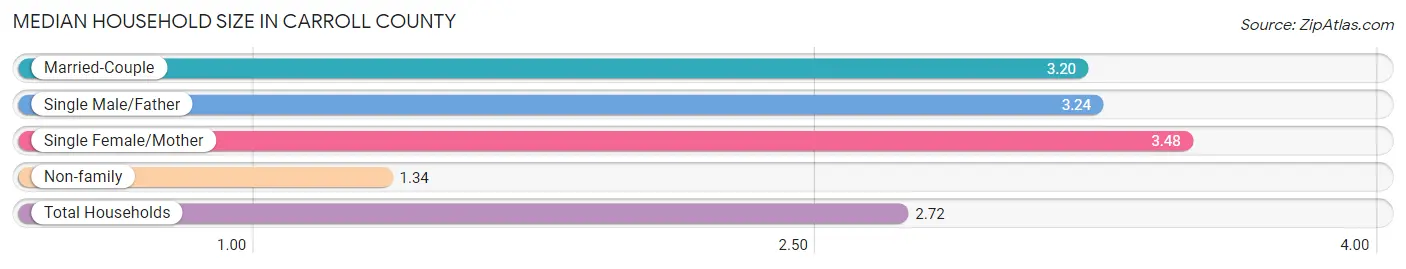
| Household Type | # Households | Household Size |
| Married-Couple | 21,208 (49.3%) | 3.20 |
| Single Male/Father | 2,599 (6.0%) | 3.24 |
| Single Female/Mother | 6,912 (16.1%) | 3.48 |
| Non-family | 12,277 (28.5%) | 1.34 |
| Total Households | 42,996 (100.0%) | 2.72 |
Household Size by Marriage Status in Carroll County
Out of a total of 42,996 households in Carroll County, 30,719 (71.5%) are family households, while 12,277 (28.5%) are nonfamily households. The most numerous type of family households are 2-person households, comprising 12,398, and the most common type of nonfamily households are 1-person households, comprising 9,732.
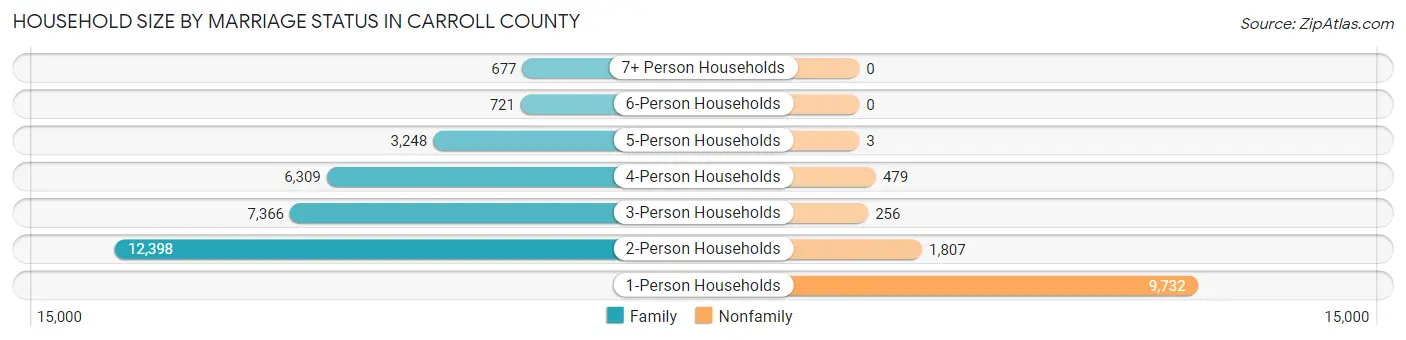
| Household Size | Family Households | Nonfamily Households |
| 1-Person Households | - | 9,732 (22.6%) |
| 2-Person Households | 12,398 (28.8%) | 1,807 (4.2%) |
| 3-Person Households | 7,366 (17.1%) | 256 (0.6%) |
| 4-Person Households | 6,309 (14.7%) | 479 (1.1%) |
| 5-Person Households | 3,248 (7.5%) | 3 (0.0%) |
| 6-Person Households | 721 (1.7%) | 0 (0.0%) |
| 7+ Person Households | 677 (1.6%) | 0 (0.0%) |
| Total | 30,719 (71.5%) | 12,277 (28.5%) |
Female Fertility in Carroll County
Fertility by Age in Carroll County
Average fertility rate in Carroll County is 66.0 births per 1,000 women. Women in the age bracket of 20 to 34 years have the highest fertility rate with 112.0 births per 1,000 women. Women in the age bracket of 20 to 34 years acount for 75.2% of all women with births.
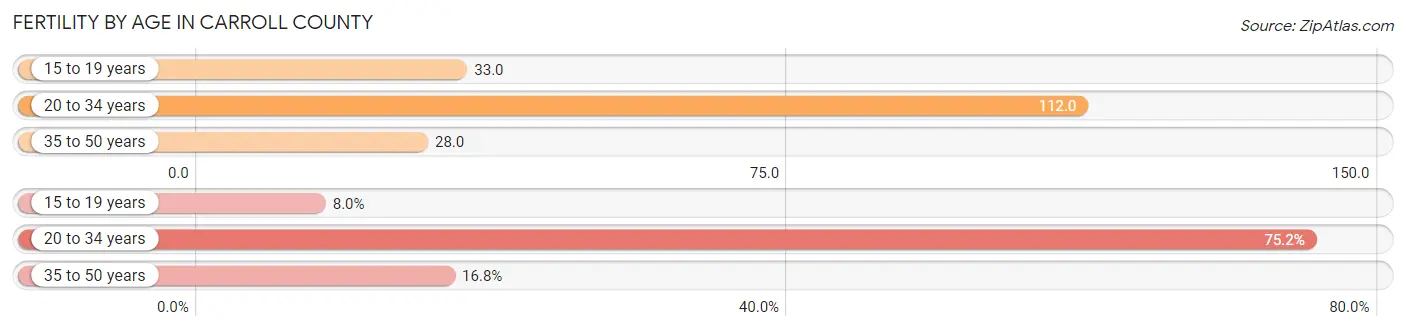
| Age Bracket | Women with Births | Births / 1,000 Women |
| 15 to 19 years | 162 (8.0%) | 33.0 |
| 20 to 34 years | 1,525 (75.2%) | 112.0 |
| 35 to 50 years | 340 (16.8%) | 28.0 |
| Total | 2,027 (100.0%) | 66.0 |
Fertility by Age by Marriage Status in Carroll County
55.9% of women with births (2,027) in Carroll County are married. The highest percentage of unmarried women with births falls into 15 to 19 years age bracket with 91.4% of them unmarried at the time of birth, while the lowest percentage of unmarried women with births belong to 35 to 50 years age bracket with 16.8% of them unmarried.
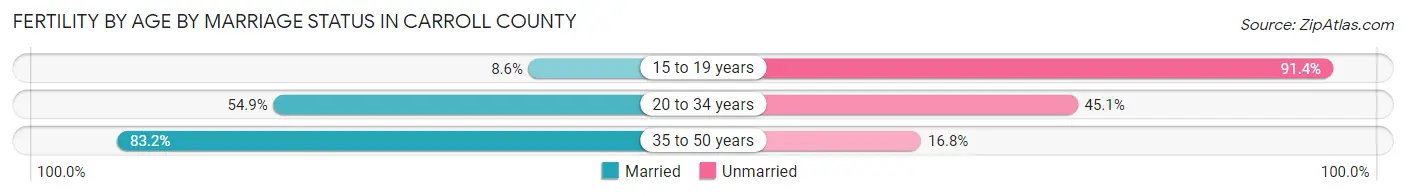
| Age Bracket | Married | Unmarried |
| 15 to 19 years | 14 (8.6%) | 148 (91.4%) |
| 20 to 34 years | 837 (54.9%) | 688 (45.1%) |
| 35 to 50 years | 283 (83.2%) | 57 (16.8%) |
| Total | 1,133 (55.9%) | 894 (44.1%) |
Fertility by Education in Carroll County
Average fertility rate in Carroll County is 66.0 births per 1,000 women. Women with the education attainment of bachelor's degree have the highest fertility rate of 83.0 births per 1,000 women, while women with the education attainment of graduate degree have the lowest fertility at 7.0 births per 1,000 women. Women with the education attainment of college or associate's degree represent 34.5% of all women with births.
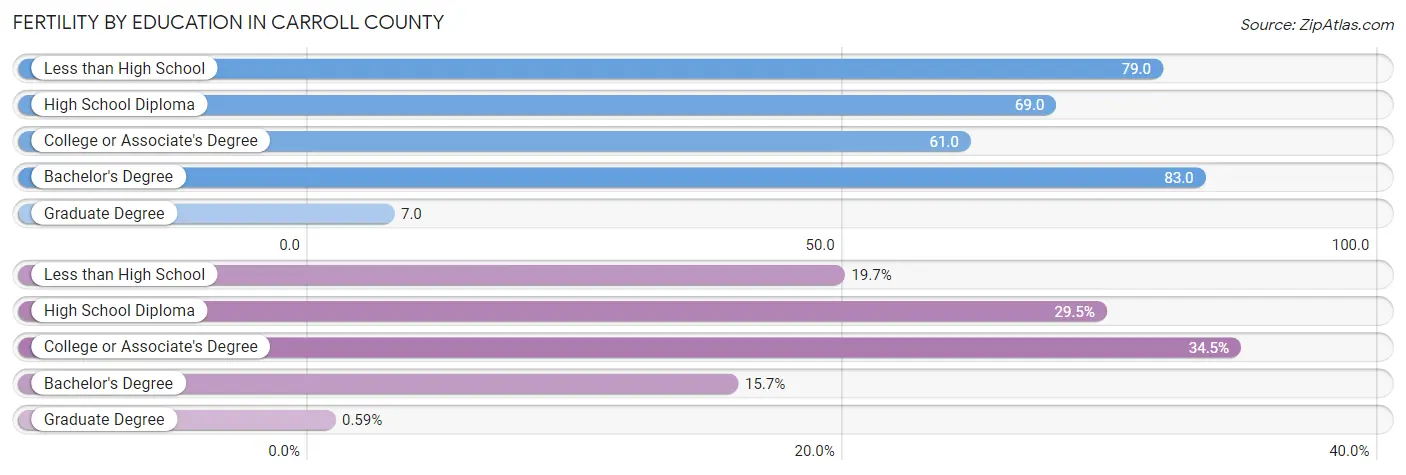
| Educational Attainment | Women with Births | Births / 1,000 Women |
| Less than High School | 399 (19.7%) | 79.0 |
| High School Diploma | 598 (29.5%) | 69.0 |
| College or Associate's Degree | 700 (34.5%) | 61.0 |
| Bachelor's Degree | 318 (15.7%) | 83.0 |
| Graduate Degree | 12 (0.6%) | 7.0 |
| Total | 2,027 (100.0%) | 66.0 |
Fertility by Education by Marriage Status in Carroll County
44.1% of women with births in Carroll County are unmarried. Women with the educational attainment of graduate degree are most likely to be married with 100.0% of them married at childbirth, while women with the educational attainment of high school diploma are least likely to be married with 67.1% of them unmarried at childbirth.
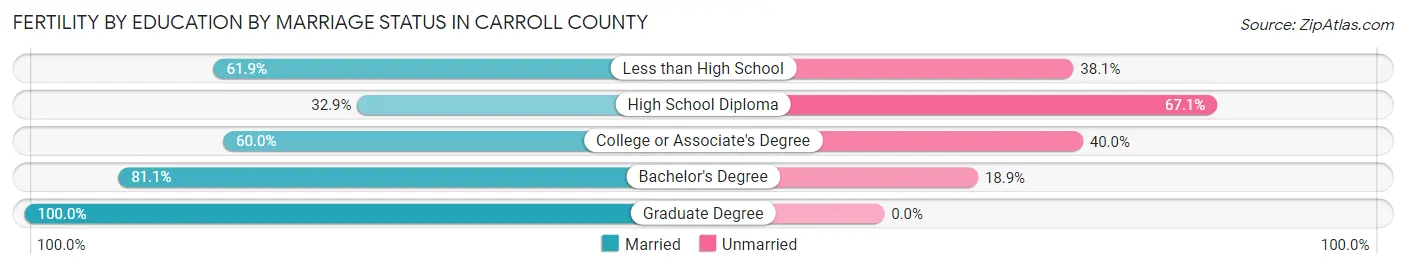
| Educational Attainment | Married | Unmarried |
| Less than High School | 247 (61.9%) | 152 (38.1%) |
| High School Diploma | 197 (32.9%) | 401 (67.1%) |
| College or Associate's Degree | 420 (60.0%) | 280 (40.0%) |
| Bachelor's Degree | 258 (81.1%) | 60 (18.9%) |
| Graduate Degree | 12 (100.0%) | 0 (0.0%) |
| Total | 1,133 (55.9%) | 894 (44.1%) |
Income in Carroll County
Income Overview in Carroll County
Per Capita Income in Carroll County is $30,827, while median incomes of families and households are $79,624 and $66,895 respectively.
| Characteristic | Number | Measure |
| Per Capita Income | 120,060 | $30,827 |
| Median Family Income | 30,719 | $79,624 |
| Mean Family Income | 30,719 | $95,107 |
| Median Household Income | 42,996 | $66,895 |
| Mean Household Income | 42,996 | $84,126 |
| Income Deficit | 30,719 | $9,705 |
| Wage / Income Gap (%) | 120,060 | 31.60% |
| Wage / Income Gap ($) | 120,060 | 68.40¢ per $1 |
| Gini / Inequality Index | 120,060 | 0.44 |
Earnings by Sex in Carroll County
Average Earnings in Carroll County are $35,441, $42,291 for men and $28,929 for women, a difference of 31.6%.
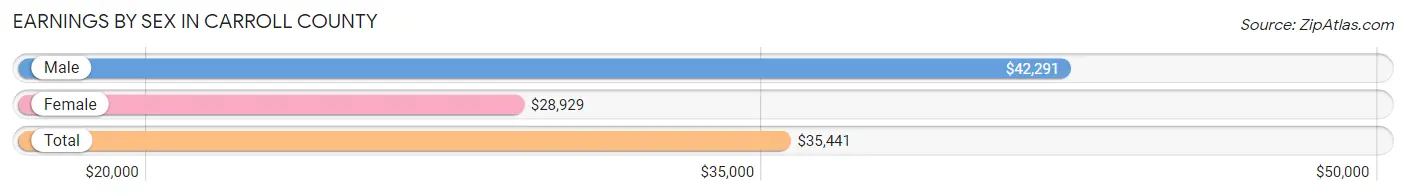
| Sex | Number | Average Earnings |
| Male | 32,935 (52.1%) | $42,291 |
| Female | 30,283 (47.9%) | $28,929 |
| Total | 63,218 (100.0%) | $35,441 |
Earnings by Sex by Income Bracket in Carroll County
The most common earnings brackets in Carroll County are $100,000+ for men (3,735 | 11.3%) and $25,000 to $29,999 for women (2,715 | 9.0%).
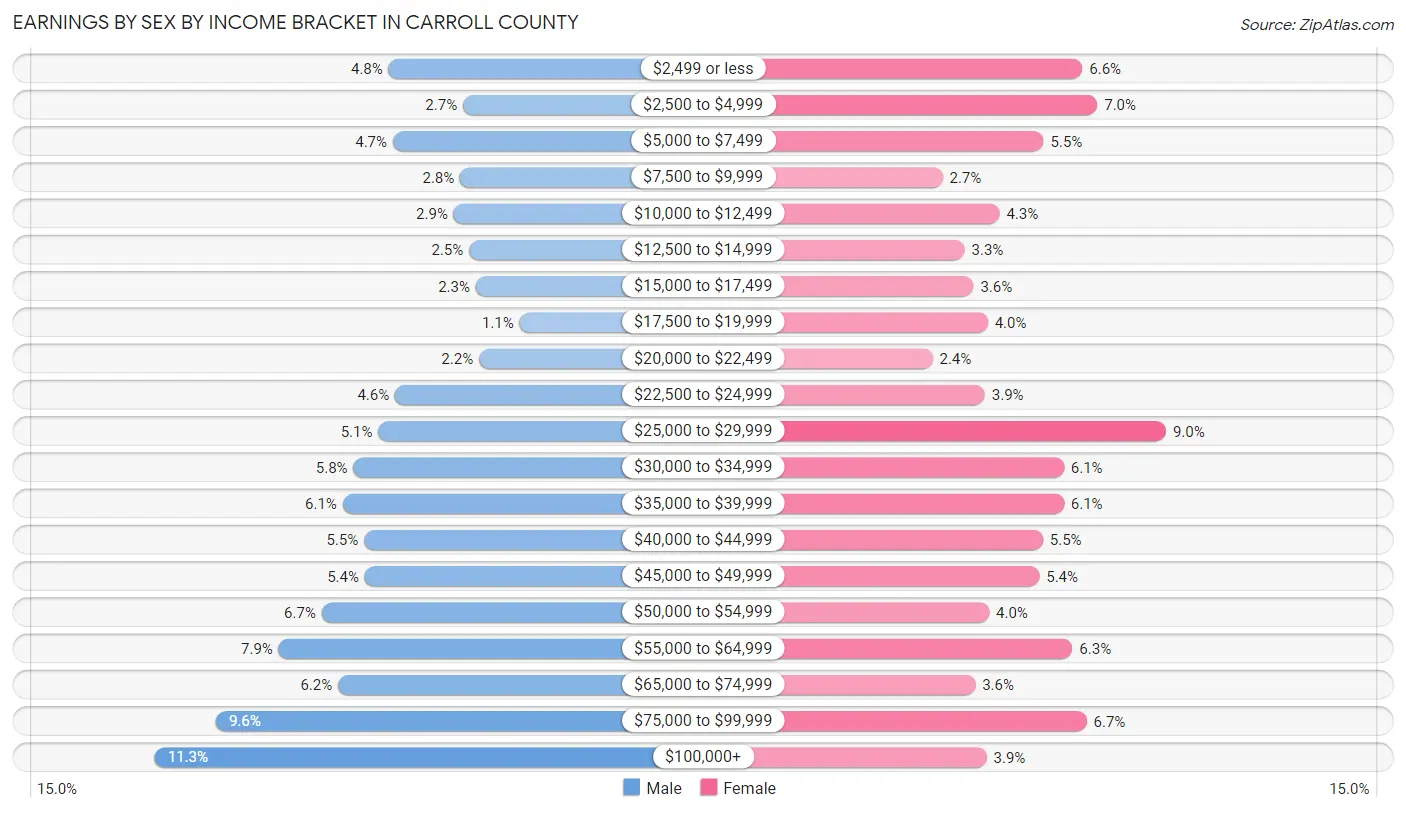
| Income | Male | Female |
| $2,499 or less | 1,570 (4.8%) | 2,004 (6.6%) |
| $2,500 to $4,999 | 882 (2.7%) | 2,131 (7.0%) |
| $5,000 to $7,499 | 1,533 (4.6%) | 1,676 (5.5%) |
| $7,500 to $9,999 | 910 (2.8%) | 814 (2.7%) |
| $10,000 to $12,499 | 968 (2.9%) | 1,300 (4.3%) |
| $12,500 to $14,999 | 827 (2.5%) | 1,003 (3.3%) |
| $15,000 to $17,499 | 765 (2.3%) | 1,079 (3.6%) |
| $17,500 to $19,999 | 358 (1.1%) | 1,200 (4.0%) |
| $20,000 to $22,499 | 735 (2.2%) | 730 (2.4%) |
| $22,500 to $24,999 | 1,512 (4.6%) | 1,174 (3.9%) |
| $25,000 to $29,999 | 1,667 (5.1%) | 2,715 (9.0%) |
| $30,000 to $34,999 | 1,897 (5.8%) | 1,848 (6.1%) |
| $35,000 to $39,999 | 1,996 (6.1%) | 1,846 (6.1%) |
| $40,000 to $44,999 | 1,799 (5.5%) | 1,668 (5.5%) |
| $45,000 to $49,999 | 1,793 (5.4%) | 1,638 (5.4%) |
| $50,000 to $54,999 | 2,190 (6.7%) | 1,211 (4.0%) |
| $55,000 to $64,999 | 2,590 (7.9%) | 1,921 (6.3%) |
| $65,000 to $74,999 | 2,040 (6.2%) | 1,094 (3.6%) |
| $75,000 to $99,999 | 3,168 (9.6%) | 2,042 (6.7%) |
| $100,000+ | 3,735 (11.3%) | 1,189 (3.9%) |
| Total | 32,935 (100.0%) | 30,283 (100.0%) |
Earnings by Sex by Educational Attainment in Carroll County
Average earnings in Carroll County are $49,880 for men and $36,061 for women, a difference of 27.7%. Men with an educational attainment of graduate degree enjoy the highest average annual earnings of $92,240, while those with less than high school education earn the least with $31,215. Women with an educational attainment of graduate degree earn the most with the average annual earnings of $65,457, while those with less than high school education have the smallest earnings of $23,150.
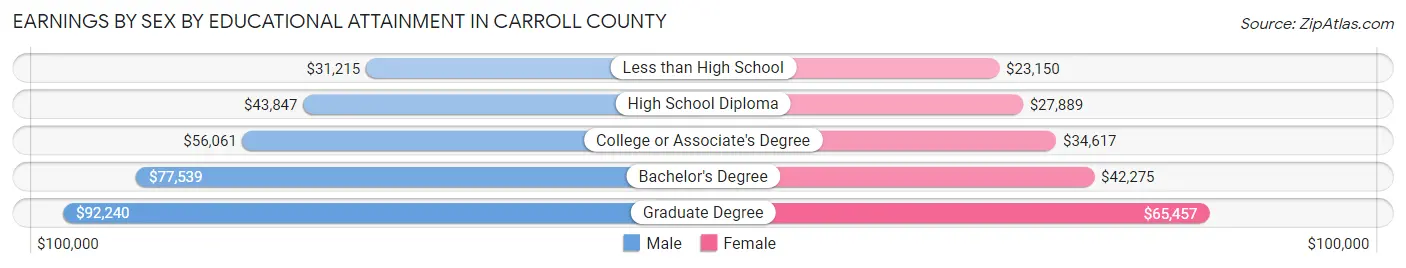
| Educational Attainment | Male Income | Female Income |
| Less than High School | $31,215 | $23,150 |
| High School Diploma | $43,847 | $27,889 |
| College or Associate's Degree | $56,061 | $34,617 |
| Bachelor's Degree | $77,539 | $42,275 |
| Graduate Degree | $92,240 | $65,457 |
| Total | $49,880 | $36,061 |
Family Income in Carroll County
Family Income Brackets in Carroll County
According to the Carroll County family income data, there are 6,666 families falling into the $100,000 to $149,999 income range, which is the most common income bracket and makes up 21.7% of all families. Conversely, the $10,000 to $14,999 income bracket is the least frequent group with only 676 families (2.2%) belonging to this category.
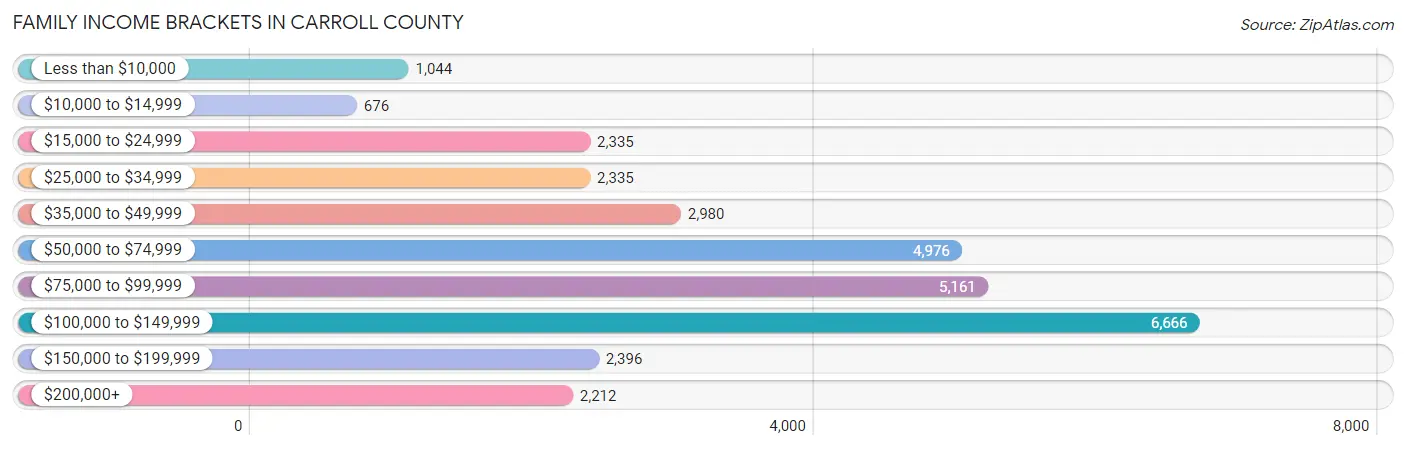
| Income Bracket | # Families | % Families |
| Less than $10,000 | 1,044 | 3.4% |
| $10,000 to $14,999 | 676 | 2.2% |
| $15,000 to $24,999 | 2,335 | 7.6% |
| $25,000 to $34,999 | 2,335 | 7.6% |
| $35,000 to $49,999 | 2,980 | 9.7% |
| $50,000 to $74,999 | 4,976 | 16.2% |
| $75,000 to $99,999 | 5,161 | 16.8% |
| $100,000 to $149,999 | 6,666 | 21.7% |
| $150,000 to $199,999 | 2,396 | 7.8% |
| $200,000+ | 2,212 | 7.2% |
Family Income by Famaliy Size in Carroll County
6-person families (531 | 1.7%) account for the highest median family income in Carroll County with $100,972 per family, while 2-person families (13,332 | 43.4%) have the highest median income of $36,574 per family member.
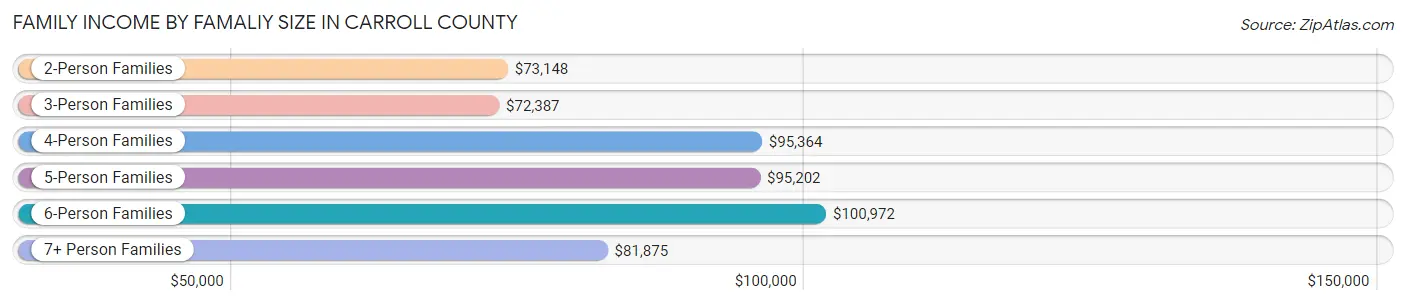
| Income Bracket | # Families | Median Income |
| 2-Person Families | 13,332 (43.4%) | $73,148 |
| 3-Person Families | 7,527 (24.5%) | $72,387 |
| 4-Person Families | 5,927 (19.3%) | $95,364 |
| 5-Person Families | 2,930 (9.5%) | $95,202 |
| 6-Person Families | 531 (1.7%) | $100,972 |
| 7+ Person Families | 472 (1.5%) | $81,875 |
| Total | 30,719 (100.0%) | $79,624 |
Family Income by Number of Earners in Carroll County
The median family income in Carroll County is $79,624, with families comprising 3+ earners (3,656) having the highest median family income of $128,863, while families with no earners (4,423) have the lowest median family income of $36,915, accounting for 11.9% and 14.4% of families, respectively.
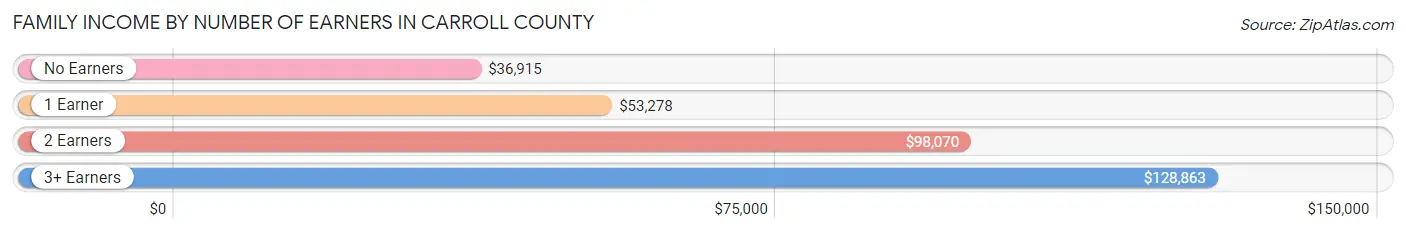
| Number of Earners | # Families | Median Income |
| No Earners | 4,423 (14.4%) | $36,915 |
| 1 Earner | 10,854 (35.3%) | $53,278 |
| 2 Earners | 11,786 (38.4%) | $98,070 |
| 3+ Earners | 3,656 (11.9%) | $128,863 |
| Total | 30,719 (100.0%) | $79,624 |
Household Income in Carroll County
Household Income Brackets in Carroll County
With 7,653 households falling in the category, the $100,000 to $149,999 income range is the most frequent in Carroll County, accounting for 17.8% of all households. In contrast, only 1,505 households (3.5%) fall into the $10,000 to $14,999 income bracket, making it the least populous group.
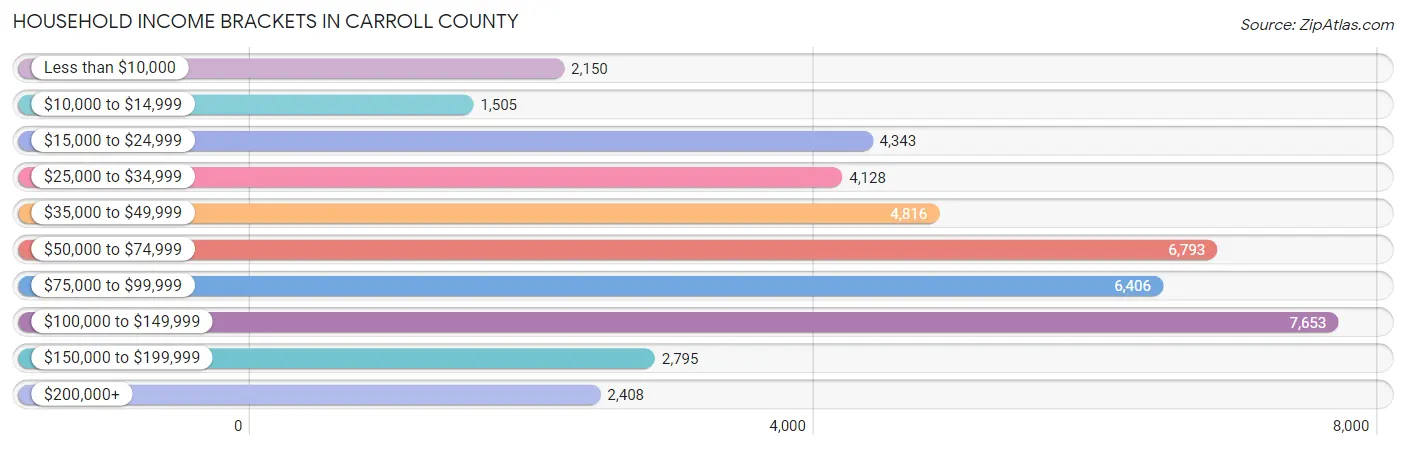
| Income Bracket | # Households | % Households |
| Less than $10,000 | 2,150 | 5.0% |
| $10,000 to $14,999 | 1,505 | 3.5% |
| $15,000 to $24,999 | 4,343 | 10.1% |
| $25,000 to $34,999 | 4,128 | 9.6% |
| $35,000 to $49,999 | 4,816 | 11.2% |
| $50,000 to $74,999 | 6,793 | 15.8% |
| $75,000 to $99,999 | 6,406 | 14.9% |
| $100,000 to $149,999 | 7,653 | 17.8% |
| $150,000 to $199,999 | 2,795 | 6.5% |
| $200,000+ | 2,408 | 5.6% |
Household Income by Householder Age in Carroll County
The median household income in Carroll County is $66,895, with the highest median household income of $77,182 found in the 45 to 64 years age bracket for the primary householder. A total of 15,970 households (37.1%) fall into this category. Meanwhile, the 15 to 24 years age bracket for the primary householder has the lowest median household income of $44,577, with 2,317 households (5.4%) in this group.
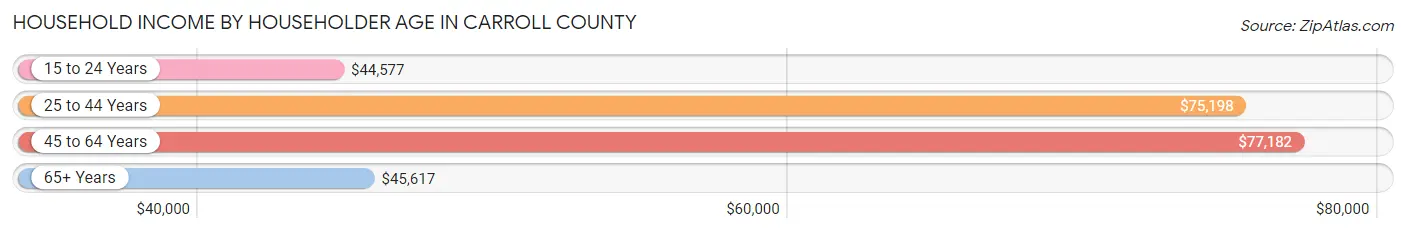
| Income Bracket | # Households | Median Income |
| 15 to 24 Years | 2,317 (5.4%) | $44,577 |
| 25 to 44 Years | 14,362 (33.4%) | $75,198 |
| 45 to 64 Years | 15,970 (37.1%) | $77,182 |
| 65+ Years | 10,347 (24.1%) | $45,617 |
| Total | 42,996 (100.0%) | $66,895 |
Poverty in Carroll County
Income Below Poverty by Sex and Age in Carroll County
With 15.3% poverty level for males and 18.4% for females among the residents of Carroll County, under 5 year old males and 18 to 24 year old females are the most vulnerable to poverty, with 1,200 males (31.2%) and 2,294 females (34.3%) in their respective age groups living below the poverty level.
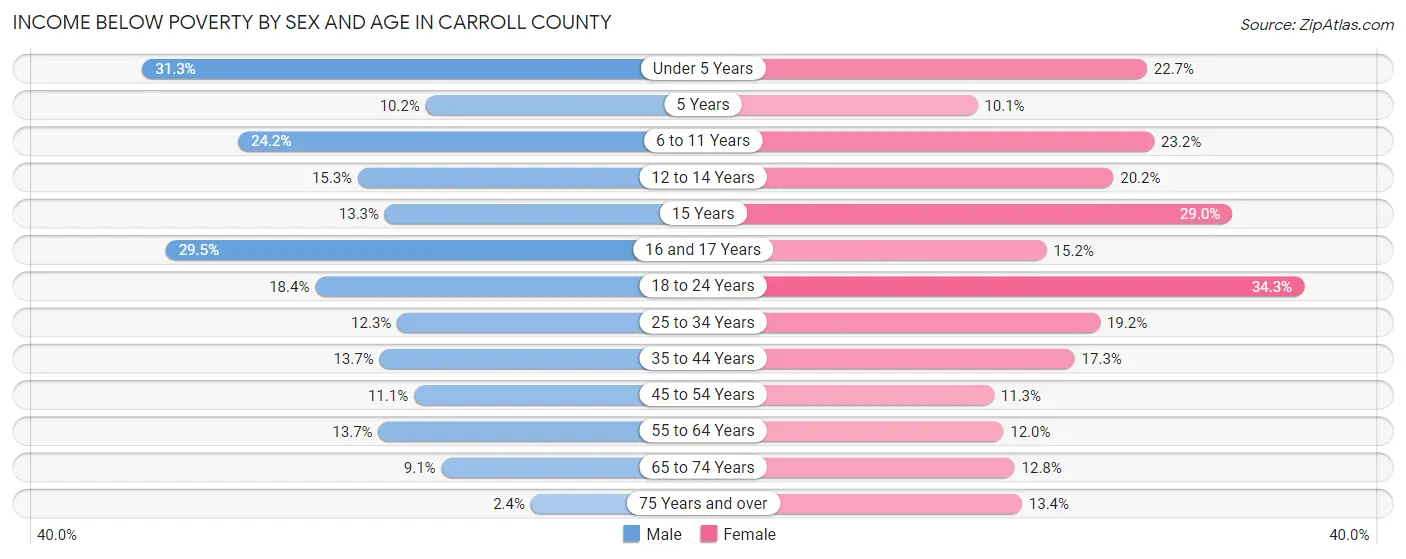
| Age Bracket | Male | Female |
| Under 5 Years | 1,200 (31.2%) | 799 (22.7%) |
| 5 Years | 90 (10.2%) | 68 (10.1%) |
| 6 to 11 Years | 1,129 (24.1%) | 1,050 (23.2%) |
| 12 to 14 Years | 381 (15.2%) | 422 (20.2%) |
| 15 Years | 99 (13.3%) | 302 (29.0%) |
| 16 and 17 Years | 503 (29.5%) | 223 (15.2%) |
| 18 to 24 Years | 1,180 (18.4%) | 2,294 (34.3%) |
| 25 to 34 Years | 938 (12.3%) | 1,566 (19.2%) |
| 35 to 44 Years | 985 (13.7%) | 1,313 (17.3%) |
| 45 to 54 Years | 802 (11.1%) | 835 (11.3%) |
| 55 to 64 Years | 918 (13.7%) | 874 (12.0%) |
| 65 to 74 Years | 421 (9.0%) | 701 (12.8%) |
| 75 Years and over | 65 (2.4%) | 483 (13.4%) |
| Total | 8,711 (15.3%) | 10,930 (18.4%) |
Income Above Poverty by Sex and Age in Carroll County
According to the poverty statistics in Carroll County, males aged 75 years and over and females aged 5 years are the age groups that are most secure financially, with 97.6% of males and 89.9% of females in these age groups living above the poverty line.
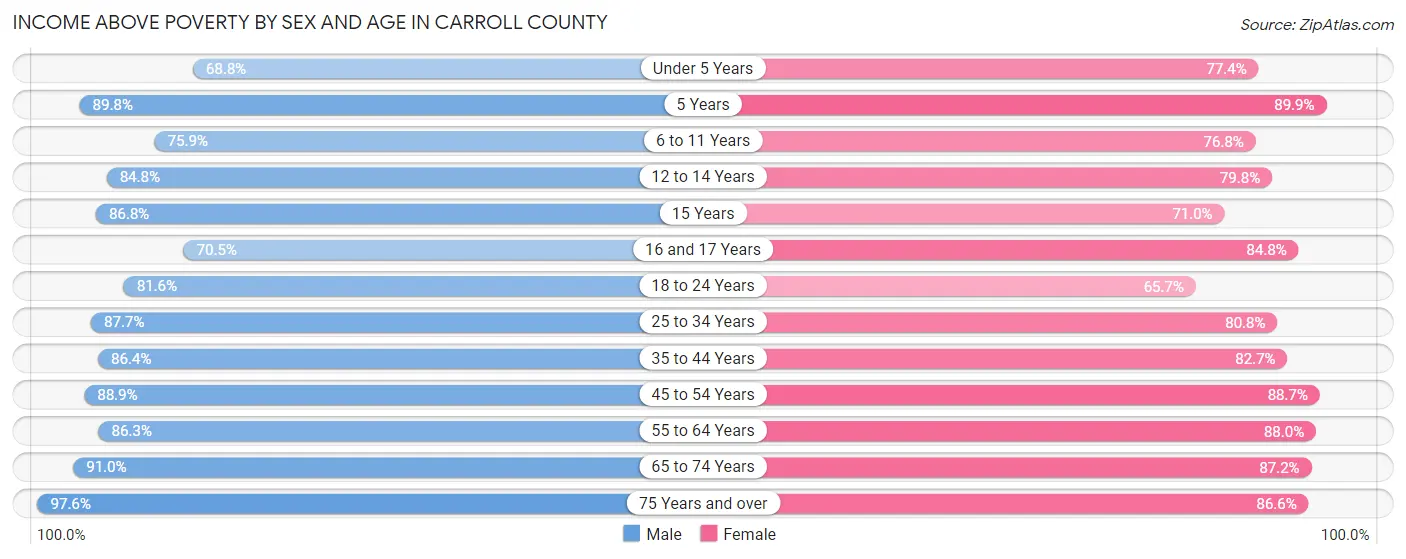
| Age Bracket | Male | Female |
| Under 5 Years | 2,640 (68.8%) | 2,728 (77.3%) |
| 5 Years | 791 (89.8%) | 607 (89.9%) |
| 6 to 11 Years | 3,545 (75.8%) | 3,478 (76.8%) |
| 12 to 14 Years | 2,118 (84.8%) | 1,671 (79.8%) |
| 15 Years | 648 (86.8%) | 740 (71.0%) |
| 16 and 17 Years | 1,201 (70.5%) | 1,243 (84.8%) |
| 18 to 24 Years | 5,225 (81.6%) | 4,392 (65.7%) |
| 25 to 34 Years | 6,664 (87.7%) | 6,603 (80.8%) |
| 35 to 44 Years | 6,230 (86.4%) | 6,279 (82.7%) |
| 45 to 54 Years | 6,427 (88.9%) | 6,562 (88.7%) |
| 55 to 64 Years | 5,770 (86.3%) | 6,414 (88.0%) |
| 65 to 74 Years | 4,233 (90.9%) | 4,763 (87.2%) |
| 75 Years and over | 2,626 (97.6%) | 3,129 (86.6%) |
| Total | 48,118 (84.7%) | 48,609 (81.6%) |
Income Below Poverty Among Married-Couple Families in Carroll County
The poverty statistics for married-couple families in Carroll County show that 6.9% or 1,463 of the total 21,208 families live below the poverty line. Families with 3 or 4 children have the highest poverty rate of 28.1%, comprising of 427 families. On the other hand, families with 5 or more children have the lowest poverty rate of 4.0%, which includes 7 families.
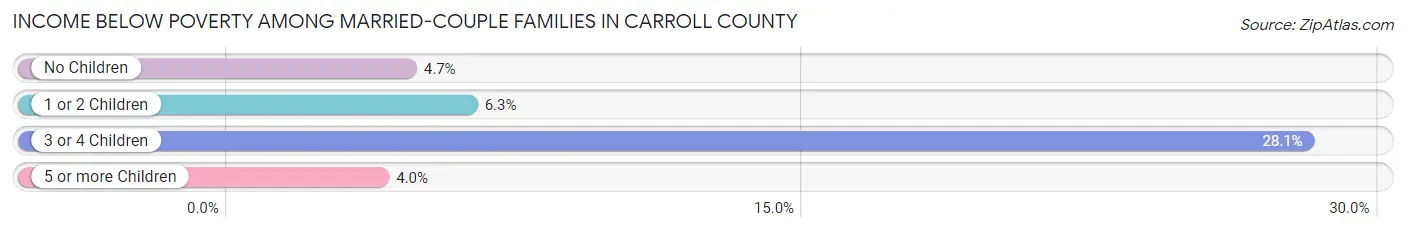
| Children | Above Poverty | Below Poverty |
| No Children | 11,565 (95.3%) | 567 (4.7%) |
| 1 or 2 Children | 6,918 (93.7%) | 462 (6.3%) |
| 3 or 4 Children | 1,092 (71.9%) | 427 (28.1%) |
| 5 or more Children | 170 (96.1%) | 7 (4.0%) |
| Total | 19,745 (93.1%) | 1,463 (6.9%) |
Income Below Poverty Among Single-Parent Households in Carroll County
According to the poverty data in Carroll County, 20.8% or 541 single-father households and 30.2% or 2,089 single-mother households are living below the poverty line. Among single-father households, those with 5 or more children have the highest poverty rate, with 34 households (100.0%) experiencing poverty. Likewise, among single-mother households, those with 5 or more children have the highest poverty rate, with 71 households (100.0%) falling below the poverty line.
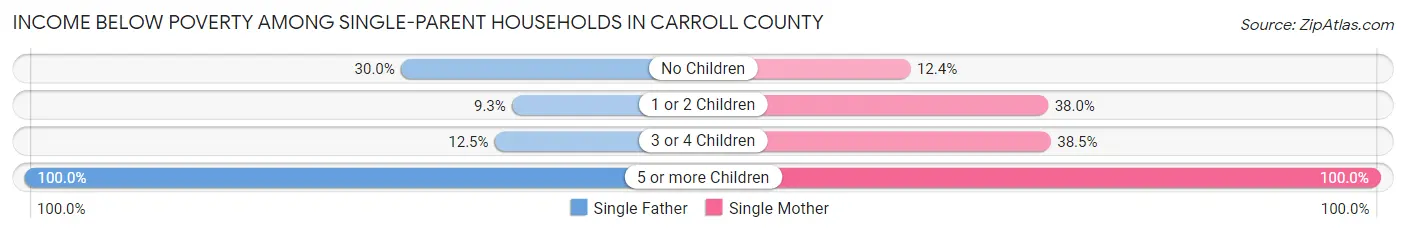
| Children | Single Father | Single Mother |
| No Children | 382 (30.0%) | 282 (12.3%) |
| 1 or 2 Children | 105 (9.3%) | 1,377 (38.0%) |
| 3 or 4 Children | 20 (12.5%) | 359 (38.5%) |
| 5 or more Children | 34 (100.0%) | 71 (100.0%) |
| Total | 541 (20.8%) | 2,089 (30.2%) |
Income Below Poverty Among Married-Couple vs Single-Parent Households in Carroll County
The poverty data for Carroll County shows that 1,463 of the married-couple family households (6.9%) and 2,630 of the single-parent households (27.7%) are living below the poverty level. Within the married-couple family households, those with 3 or 4 children have the highest poverty rate, with 427 households (28.1%) falling below the poverty line. Among the single-parent households, those with 5 or more children have the highest poverty rate, with 105 household (100.0%) living below poverty.
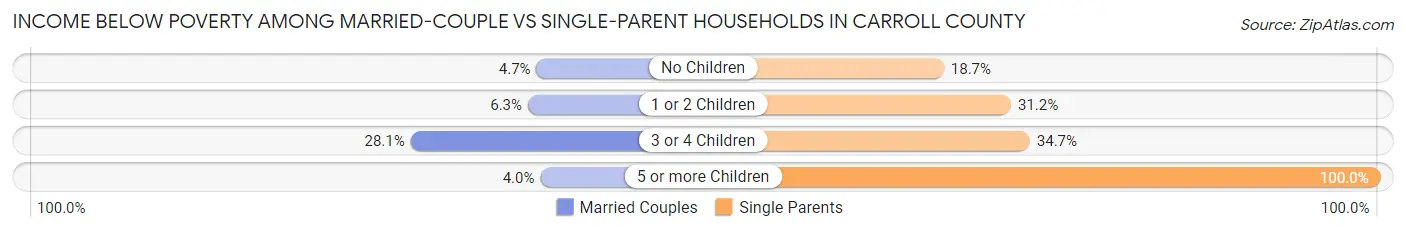
| Children | Married-Couple Families | Single-Parent Households |
| No Children | 567 (4.7%) | 664 (18.7%) |
| 1 or 2 Children | 462 (6.3%) | 1,482 (31.2%) |
| 3 or 4 Children | 427 (28.1%) | 379 (34.7%) |
| 5 or more Children | 7 (4.0%) | 105 (100.0%) |
| Total | 1,463 (6.9%) | 2,630 (27.7%) |
Employment Characteristics in Carroll County
Employment by Class of Employer in Carroll County
Among the 54,488 employed individuals in Carroll County, private company employees (39,257 | 72.1%), local government employees (4,070 | 7.5%), and not-for-profit organizations (2,859 | 5.2%) make up the most common classes of employment.
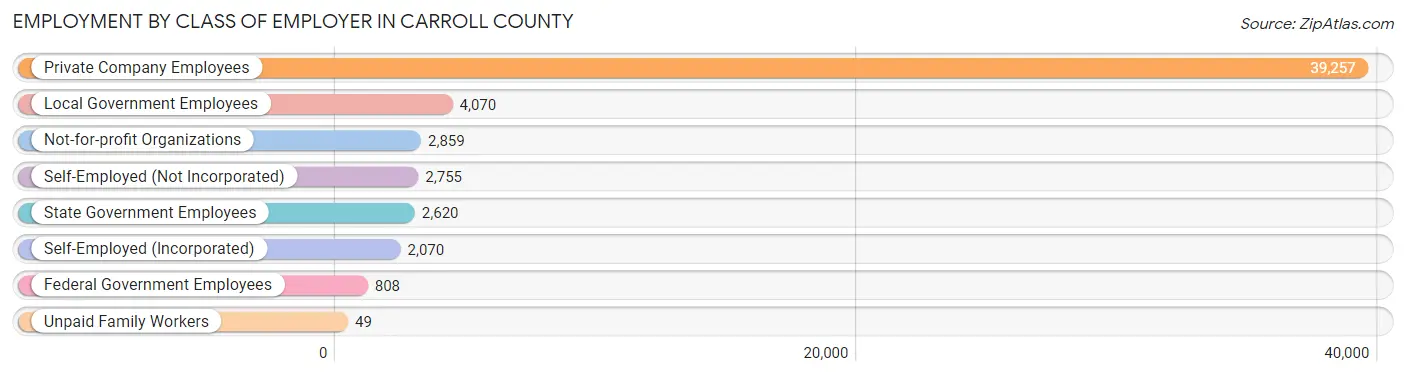
| Employer Class | # Employees | % Employees |
| Private Company Employees | 39,257 | 72.1% |
| Self-Employed (Incorporated) | 2,070 | 3.8% |
| Self-Employed (Not Incorporated) | 2,755 | 5.1% |
| Not-for-profit Organizations | 2,859 | 5.2% |
| Local Government Employees | 4,070 | 7.5% |
| State Government Employees | 2,620 | 4.8% |
| Federal Government Employees | 808 | 1.5% |
| Unpaid Family Workers | 49 | 0.1% |
| Total | 54,488 | 100.0% |
Employment Status by Age in Carroll County
According to the labor force statistics for Carroll County, out of the total population over 16 years of age (94,925), 62.9% or 59,708 individuals are in the labor force, with 5.9% or 3,523 of them unemployed. The age group with the highest labor force participation rate is 25 to 29 years, with 85.4% or 7,120 individuals in the labor force. Within the labor force, the 16 to 19 years age range has the highest percentage of unemployed individuals, with 19.5% or 681 of them being unemployed.
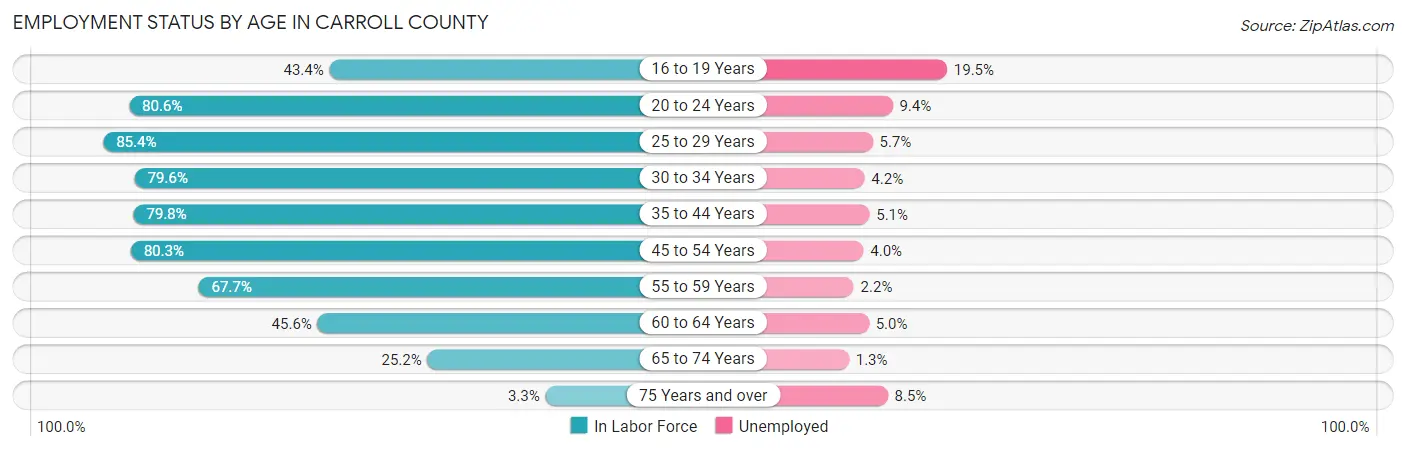
| Age Bracket | In Labor Force | Unemployed |
| 16 to 19 Years | 3,491 (43.4%) | 681 (19.5%) |
| 20 to 24 Years | 8,380 (80.6%) | 788 (9.4%) |
| 25 to 29 Years | 7,120 (85.4%) | 406 (5.7%) |
| 30 to 34 Years | 6,163 (79.6%) | 259 (4.2%) |
| 35 to 44 Years | 11,948 (79.8%) | 609 (5.1%) |
| 45 to 54 Years | 11,783 (80.3%) | 471 (4.0%) |
| 55 to 59 Years | 4,923 (67.7%) | 108 (2.2%) |
| 60 to 64 Years | 3,085 (45.6%) | 154 (5.0%) |
| 65 to 74 Years | 2,588 (25.2%) | 34 (1.3%) |
| 75 Years and over | 213 (3.3%) | 18 (8.5%) |
| Total | 59,708 (62.9%) | 3,523 (5.9%) |
Employment Status by Educational Attainment in Carroll County
According to labor force statistics for Carroll County, 75.3% of individuals (45,002) out of the total population between 25 and 64 years of age (59,764) are in the labor force, with 4.5% or 2,025 of them being unemployed. The group with the highest labor force participation rate are those with the educational attainment of bachelor's degree or higher, with 85.5% or 11,053 individuals in the labor force. Within the labor force, individuals with less than high school education have the highest percentage of unemployment, with 9.6% or 490 of them being unemployed.
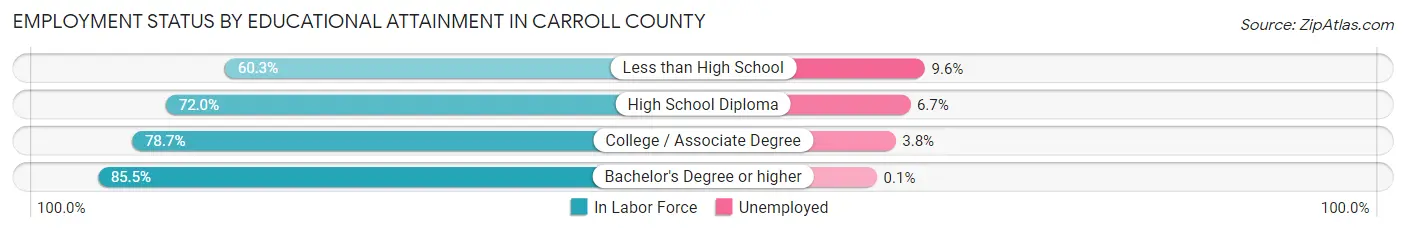
| Educational Attainment | In Labor Force | Unemployed |
| Less than High School | 5,107 (60.3%) | 813 (9.6%) |
| High School Diploma | 14,383 (72.0%) | 1,338 (6.7%) |
| College / Associate Degree | 14,474 (78.7%) | 699 (3.8%) |
| Bachelor's Degree or higher | 11,053 (85.5%) | 13 (0.1%) |
| Total | 45,002 (75.3%) | 2,689 (4.5%) |
Employment Occupations by Sex in Carroll County
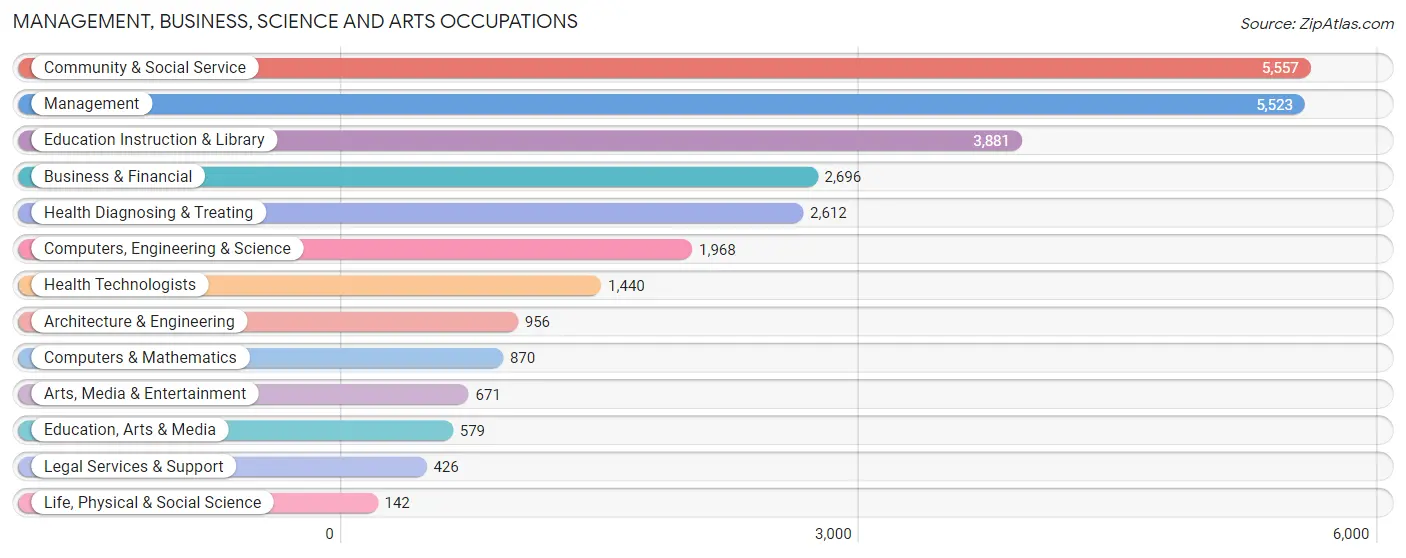
Management, Business, Science and Arts Occupations
The most common Management, Business, Science and Arts occupations in Carroll County are Community & Social Service (5,557 | 9.9%), Management (5,523 | 9.8%), Education Instruction & Library (3,881 | 6.9%), Business & Financial (2,696 | 4.8%), and Health Diagnosing & Treating (2,612 | 4.7%).
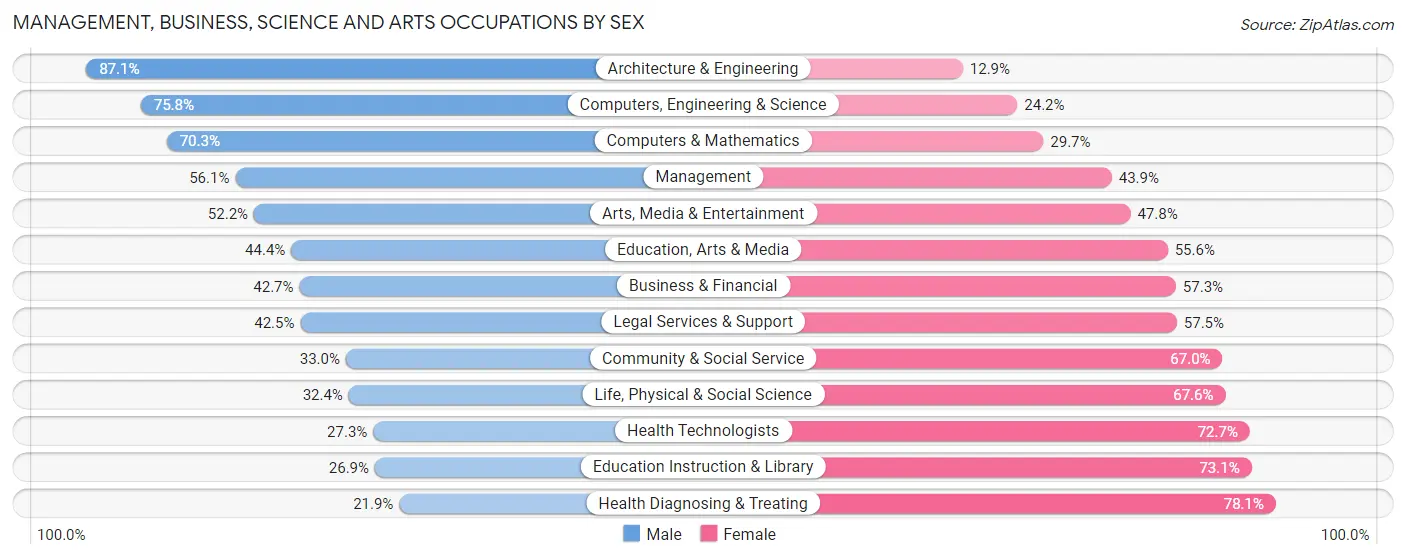
Management, Business, Science and Arts Occupations by Sex
Within the Management, Business, Science and Arts occupations in Carroll County, the most male-oriented occupations are Architecture & Engineering (87.1%), Computers, Engineering & Science (75.8%), and Computers & Mathematics (70.3%), while the most female-oriented occupations are Health Diagnosing & Treating (78.1%), Education Instruction & Library (73.1%), and Health Technologists (72.7%).
| Occupation | Male | Female |
| Management | 3,096 (56.1%) | 2,427 (43.9%) |
| Business & Financial | 1,151 (42.7%) | 1,545 (57.3%) |
| Computers, Engineering & Science | 1,491 (75.8%) | 477 (24.2%) |
| Computers & Mathematics | 612 (70.3%) | 258 (29.7%) |
| Architecture & Engineering | 833 (87.1%) | 123 (12.9%) |
| Life, Physical & Social Science | 46 (32.4%) | 96 (67.6%) |
| Community & Social Service | 1,833 (33.0%) | 3,724 (67.0%) |
| Education, Arts & Media | 257 (44.4%) | 322 (55.6%) |
| Legal Services & Support | 181 (42.5%) | 245 (57.5%) |
| Education Instruction & Library | 1,045 (26.9%) | 2,836 (73.1%) |
| Arts, Media & Entertainment | 350 (52.2%) | 321 (47.8%) |
| Health Diagnosing & Treating | 571 (21.9%) | 2,041 (78.1%) |
| Health Technologists | 393 (27.3%) | 1,047 (72.7%) |
| Total (Category) | 8,142 (44.4%) | 10,214 (55.6%) |
| Total (Overall) | 28,846 (51.4%) | 27,256 (48.6%) |
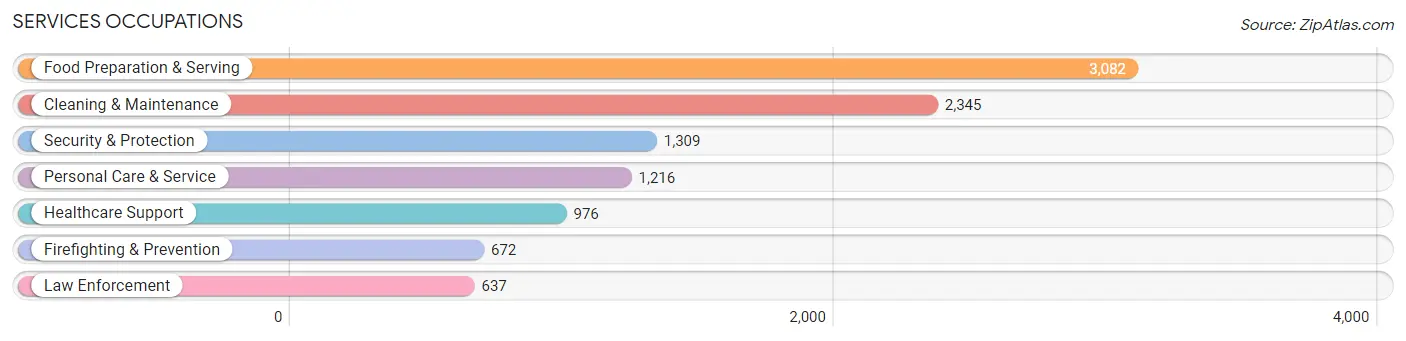
Services Occupations
The most common Services occupations in Carroll County are Food Preparation & Serving (3,082 | 5.5%), Cleaning & Maintenance (2,345 | 4.2%), Security & Protection (1,309 | 2.3%), Personal Care & Service (1,216 | 2.2%), and Healthcare Support (976 | 1.7%).
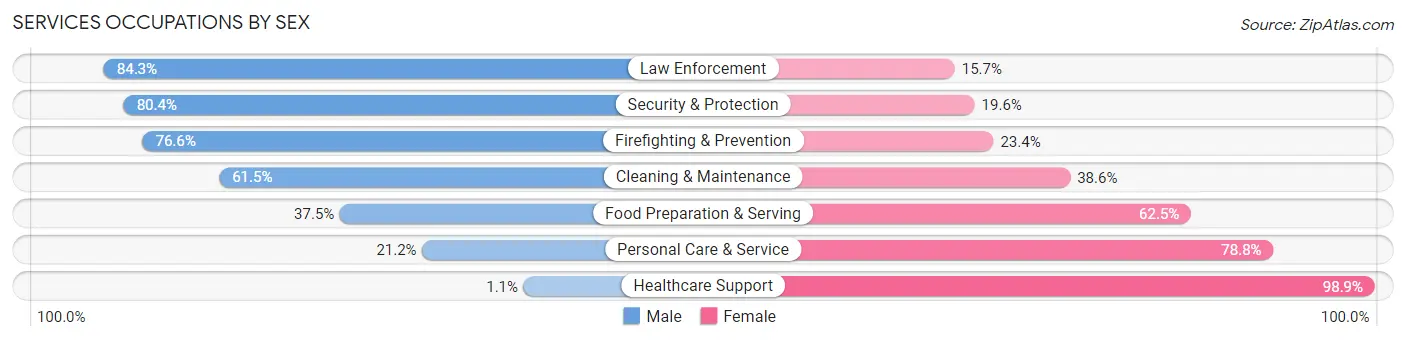
Services Occupations by Sex
Within the Services occupations in Carroll County, the most male-oriented occupations are Law Enforcement (84.3%), Security & Protection (80.4%), and Firefighting & Prevention (76.6%), while the most female-oriented occupations are Healthcare Support (98.9%), Personal Care & Service (78.8%), and Food Preparation & Serving (62.5%).
| Occupation | Male | Female |
| Healthcare Support | 11 (1.1%) | 965 (98.9%) |
| Security & Protection | 1,052 (80.4%) | 257 (19.6%) |
| Firefighting & Prevention | 515 (76.6%) | 157 (23.4%) |
| Law Enforcement | 537 (84.3%) | 100 (15.7%) |
| Food Preparation & Serving | 1,156 (37.5%) | 1,926 (62.5%) |
| Cleaning & Maintenance | 1,441 (61.5%) | 904 (38.6%) |
| Personal Care & Service | 258 (21.2%) | 958 (78.8%) |
| Total (Category) | 3,918 (43.9%) | 5,010 (56.1%) |
| Total (Overall) | 28,846 (51.4%) | 27,256 (48.6%) |
Sales and Office Occupations
The most common Sales and Office occupations in Carroll County are Office & Administration (6,920 | 12.3%), and Sales & Related (5,513 | 9.8%).
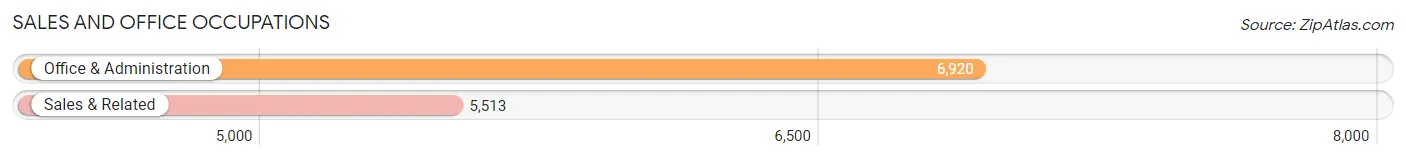
Sales and Office Occupations by Sex
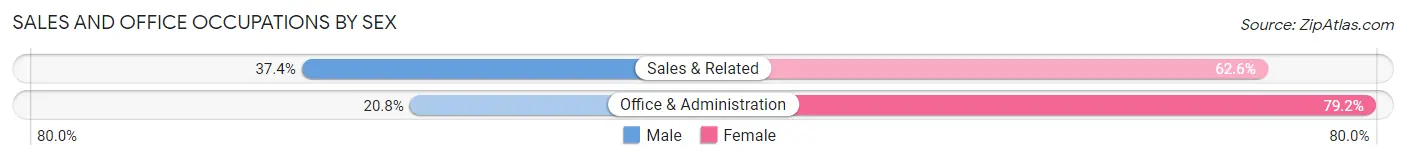
| Occupation | Male | Female |
| Sales & Related | 2,062 (37.4%) | 3,451 (62.6%) |
| Office & Administration | 1,438 (20.8%) | 5,482 (79.2%) |
| Total (Category) | 3,500 (28.1%) | 8,933 (71.9%) |
| Total (Overall) | 28,846 (51.4%) | 27,256 (48.6%) |
Natural Resources, Construction and Maintenance Occupations
The most common Natural Resources, Construction and Maintenance occupations in Carroll County are Installation, Maintenance & Repair (2,941 | 5.2%), Construction & Extraction (2,652 | 4.7%), and Farming, Fishing & Forestry (282 | 0.5%).
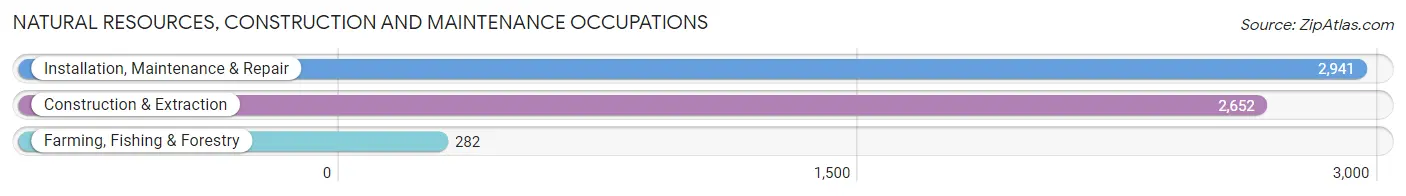
Natural Resources, Construction and Maintenance Occupations by Sex
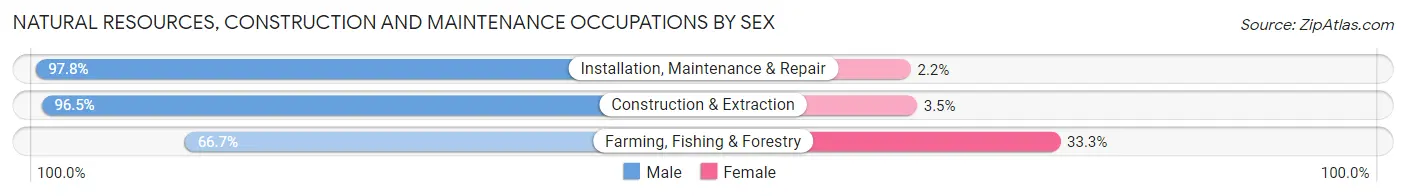
| Occupation | Male | Female |
| Farming, Fishing & Forestry | 188 (66.7%) | 94 (33.3%) |
| Construction & Extraction | 2,559 (96.5%) | 93 (3.5%) |
| Installation, Maintenance & Repair | 2,876 (97.8%) | 65 (2.2%) |
| Total (Category) | 5,623 (95.7%) | 252 (4.3%) |
| Total (Overall) | 28,846 (51.4%) | 27,256 (48.6%) |
Production, Transportation and Moving Occupations
The most common Production, Transportation and Moving occupations in Carroll County are Production (5,519 | 9.8%), Material Moving (2,668 | 4.8%), and Transportation (2,323 | 4.1%).
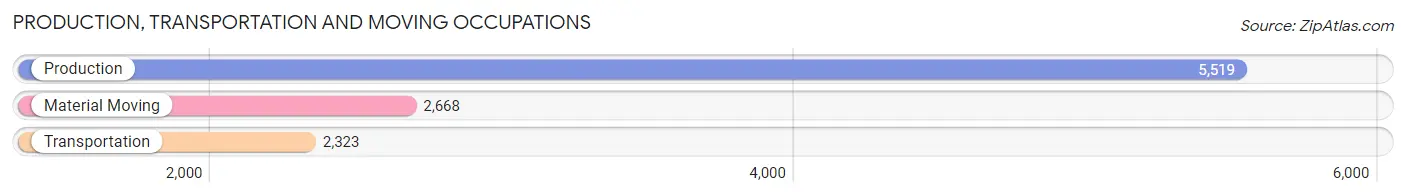
Production, Transportation and Moving Occupations by Sex
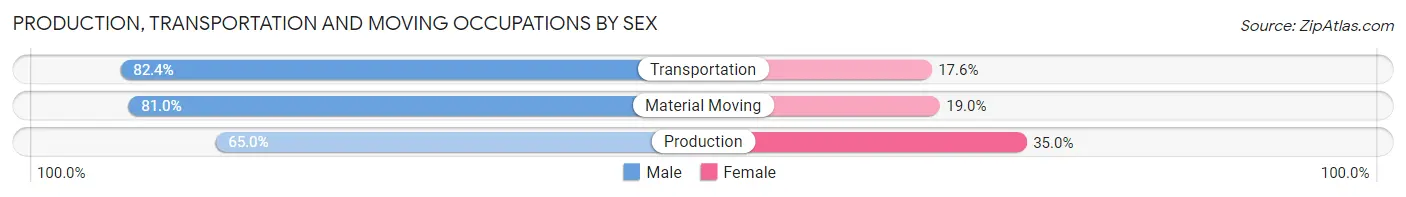
| Occupation | Male | Female |
| Production | 3,588 (65.0%) | 1,931 (35.0%) |
| Transportation | 1,915 (82.4%) | 408 (17.6%) |
| Material Moving | 2,160 (81.0%) | 508 (19.0%) |
| Total (Category) | 7,663 (72.9%) | 2,847 (27.1%) |
| Total (Overall) | 28,846 (51.4%) | 27,256 (48.6%) |
Employment Industries by Sex in Carroll County
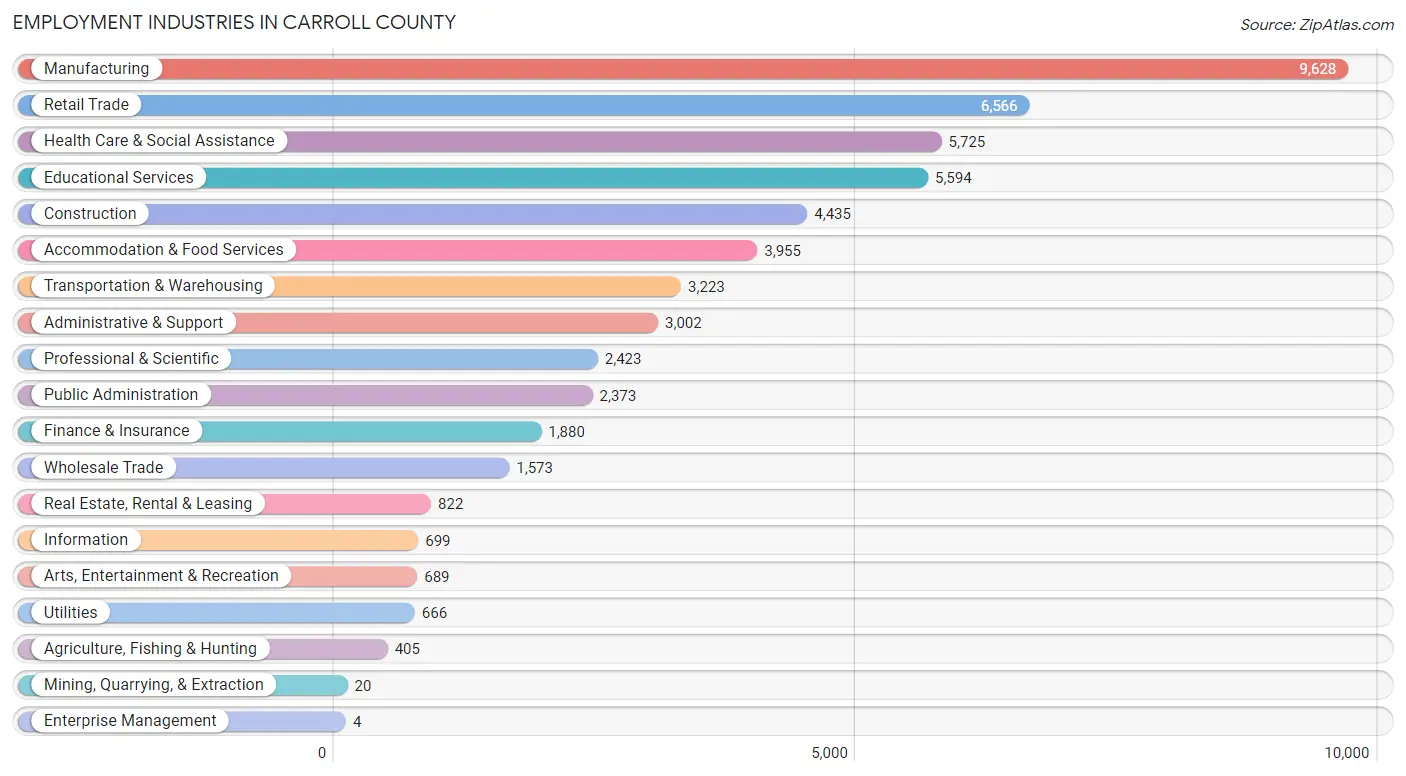
Employment Industries in Carroll County
The major employment industries in Carroll County include Manufacturing (9,628 | 17.2%), Retail Trade (6,566 | 11.7%), Health Care & Social Assistance (5,725 | 10.2%), Educational Services (5,594 | 10.0%), and Construction (4,435 | 7.9%).
Employment Industries by Sex in Carroll County
The Carroll County industries that see more men than women are Mining, Quarrying, & Extraction (100.0%), Construction (86.0%), and Utilities (83.3%), whereas the industries that tend to have a higher number of women are Health Care & Social Assistance (84.5%), Enterprise Management (75.0%), and Finance & Insurance (70.2%).
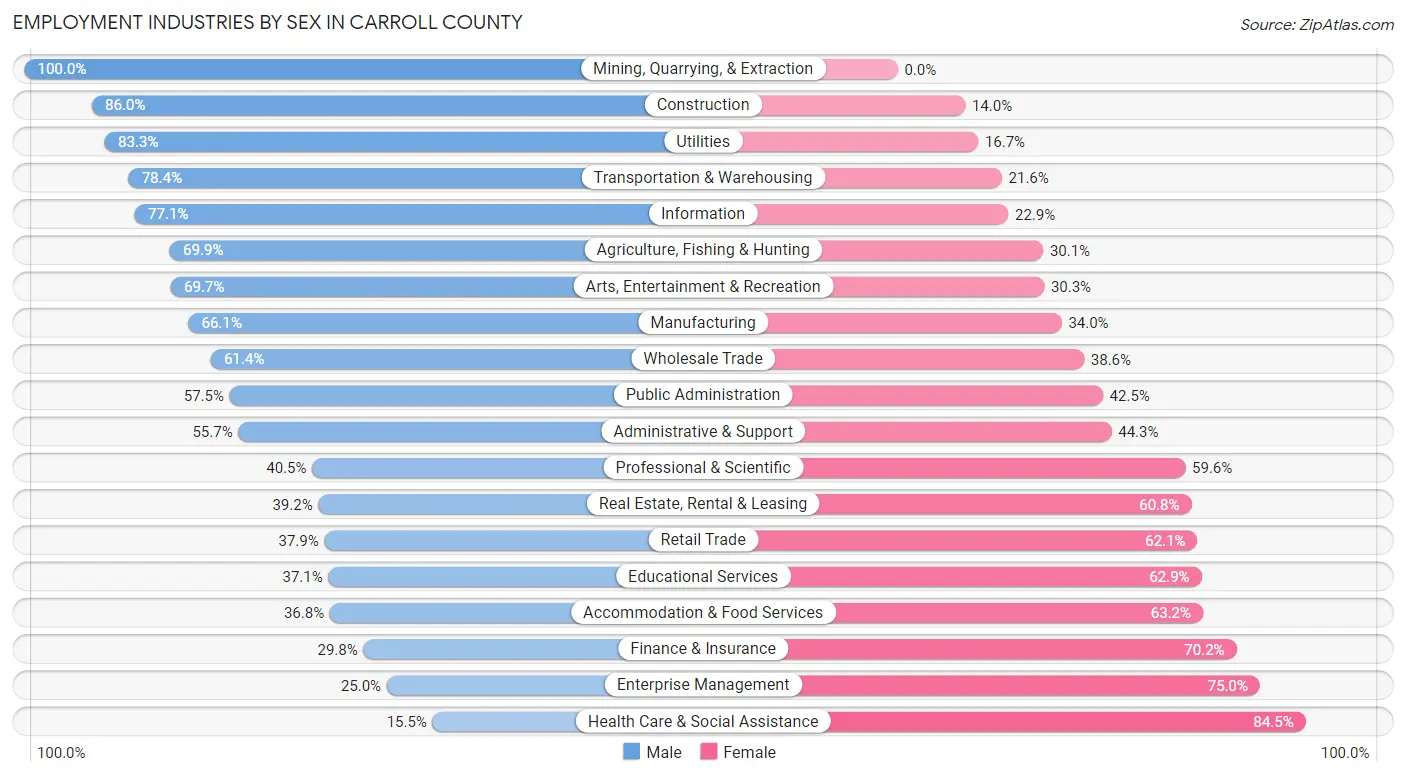
| Industry | Male | Female |
| Agriculture, Fishing & Hunting | 283 (69.9%) | 122 (30.1%) |
| Mining, Quarrying, & Extraction | 20 (100.0%) | 0 (0.0%) |
| Construction | 3,815 (86.0%) | 620 (14.0%) |
| Manufacturing | 6,359 (66.0%) | 3,269 (34.0%) |
| Wholesale Trade | 966 (61.4%) | 607 (38.6%) |
| Retail Trade | 2,489 (37.9%) | 4,077 (62.1%) |
| Transportation & Warehousing | 2,528 (78.4%) | 695 (21.6%) |
| Utilities | 555 (83.3%) | 111 (16.7%) |
| Information | 539 (77.1%) | 160 (22.9%) |
| Finance & Insurance | 561 (29.8%) | 1,319 (70.2%) |
| Real Estate, Rental & Leasing | 322 (39.2%) | 500 (60.8%) |
| Professional & Scientific | 980 (40.5%) | 1,443 (59.6%) |
| Enterprise Management | 1 (25.0%) | 3 (75.0%) |
| Administrative & Support | 1,673 (55.7%) | 1,329 (44.3%) |
| Educational Services | 2,074 (37.1%) | 3,520 (62.9%) |
| Health Care & Social Assistance | 889 (15.5%) | 4,836 (84.5%) |
| Arts, Entertainment & Recreation | 480 (69.7%) | 209 (30.3%) |
| Accommodation & Food Services | 1,455 (36.8%) | 2,500 (63.2%) |
| Public Administration | 1,365 (57.5%) | 1,008 (42.5%) |
| Total | 28,846 (51.4%) | 27,256 (48.6%) |
Education in Carroll County
School Enrollment in Carroll County
The most common levels of schooling among the 32,835 students in Carroll County are college / undergraduate (8,959 | 27.3%), high school (6,388 | 19.5%), and elementary school (6,343 | 19.3%).
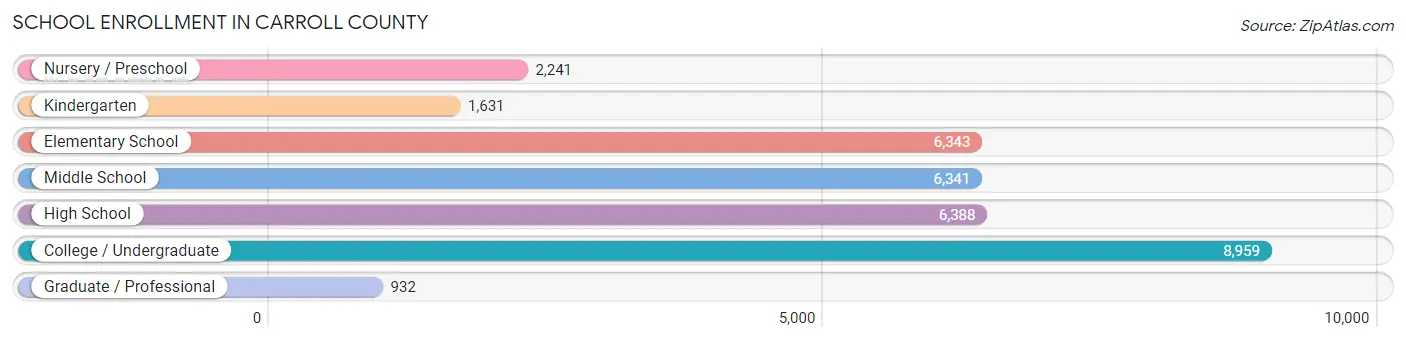
| School Level | # Students | % Students |
| Nursery / Preschool | 2,241 | 6.8% |
| Kindergarten | 1,631 | 5.0% |
| Elementary School | 6,343 | 19.3% |
| Middle School | 6,341 | 19.3% |
| High School | 6,388 | 19.5% |
| College / Undergraduate | 8,959 | 27.3% |
| Graduate / Professional | 932 | 2.8% |
| Total | 32,835 | 100.0% |
School Enrollment by Age by Funding Source in Carroll County
Out of a total of 32,835 students who are enrolled in schools in Carroll County, 2,528 (7.7%) attend a private institution, while the remaining 30,307 (92.3%) are enrolled in public schools. The age group of 3 to 4 year olds has the highest likelihood of being enrolled in private schools, with 455 (28.2% in the age bracket) enrolled. Conversely, the age group of 20 to 24 year olds has the lowest likelihood of being enrolled in a private school, with 4,066 (96.1% in the age bracket) attending a public institution.
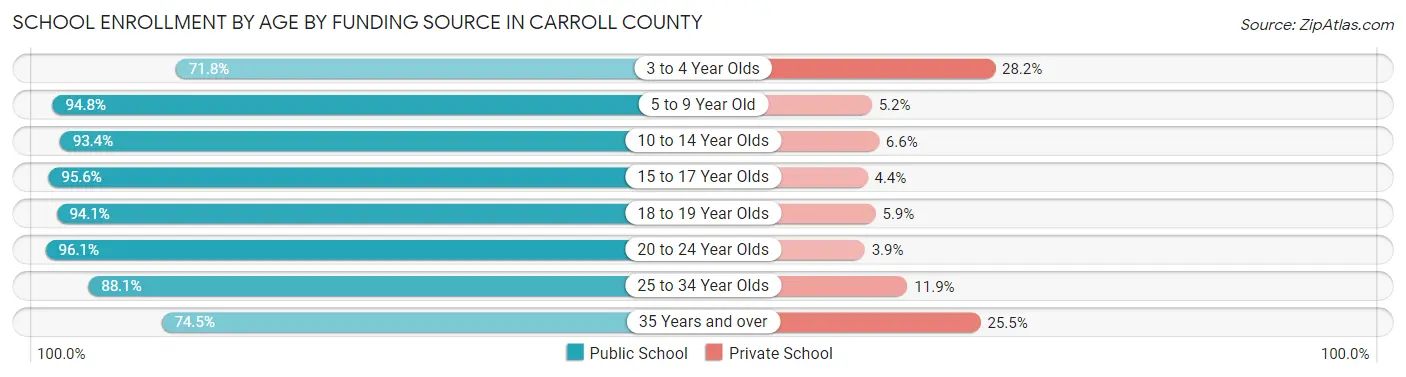
| Age Bracket | Public School | Private School |
| 3 to 4 Year Olds | 1,159 (71.8%) | 455 (28.2%) |
| 5 to 9 Year Old | 7,019 (94.8%) | 387 (5.2%) |
| 10 to 14 Year Olds | 7,338 (93.4%) | 515 (6.6%) |
| 15 to 17 Year Olds | 4,540 (95.6%) | 211 (4.4%) |
| 18 to 19 Year Olds | 3,326 (94.1%) | 210 (5.9%) |
| 20 to 24 Year Olds | 4,066 (96.1%) | 166 (3.9%) |
| 25 to 34 Year Olds | 1,856 (88.1%) | 250 (11.9%) |
| 35 Years and over | 996 (74.5%) | 341 (25.5%) |
| Total | 30,307 (92.3%) | 2,528 (7.7%) |
Educational Attainment by Field of Study in Carroll County
Business (4,071 | 23.8%), education (2,932 | 17.2%), science & technology (1,430 | 8.4%), social sciences (1,207 | 7.1%), and bio, nature & agricultural (1,168 | 6.8%) are the most common fields of study among 17,095 individuals in Carroll County who have obtained a bachelor's degree or higher.
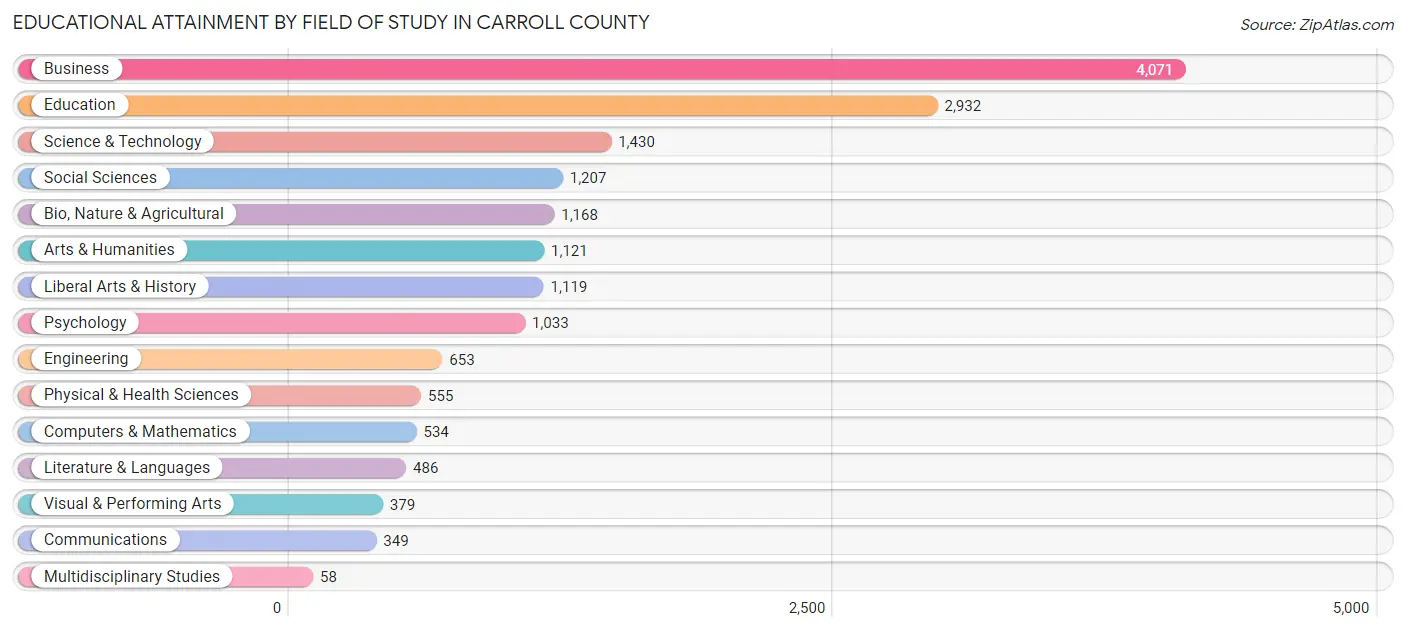
| Field of Study | # Graduates | % Graduates |
| Computers & Mathematics | 534 | 3.1% |
| Bio, Nature & Agricultural | 1,168 | 6.8% |
| Physical & Health Sciences | 555 | 3.3% |
| Psychology | 1,033 | 6.0% |
| Social Sciences | 1,207 | 7.1% |
| Engineering | 653 | 3.8% |
| Multidisciplinary Studies | 58 | 0.3% |
| Science & Technology | 1,430 | 8.4% |
| Business | 4,071 | 23.8% |
| Education | 2,932 | 17.2% |
| Literature & Languages | 486 | 2.8% |
| Liberal Arts & History | 1,119 | 6.6% |
| Visual & Performing Arts | 379 | 2.2% |
| Communications | 349 | 2.0% |
| Arts & Humanities | 1,121 | 6.6% |
| Total | 17,095 | 100.0% |
Transportation & Commute in Carroll County
Vehicle Availability by Sex in Carroll County
The most prevalent vehicle ownership categories in Carroll County are males with 2 vehicles (10,686, accounting for 38.7%) and females with 2 vehicles (8,439, making up 41.1%).
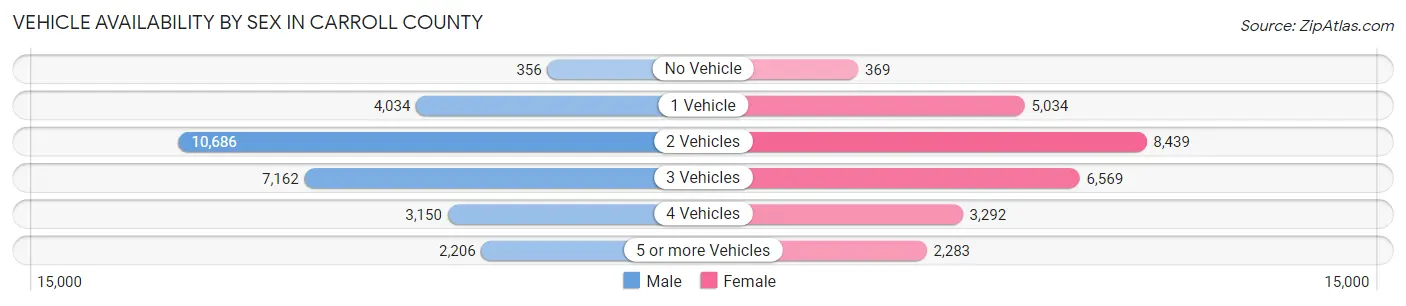
| Vehicles Available | Male | Female |
| No Vehicle | 356 (1.3%) | 369 (1.4%) |
| 1 Vehicle | 4,034 (14.6%) | 5,034 (19.4%) |
| 2 Vehicles | 10,686 (38.7%) | 8,439 (32.5%) |
| 3 Vehicles | 7,162 (26.0%) | 6,569 (25.3%) |
| 4 Vehicles | 3,150 (11.4%) | 3,292 (12.7%) |
| 5 or more Vehicles | 2,206 (8.0%) | 2,283 (8.8%) |
| Total | 27,594 (100.0%) | 25,986 (100.0%) |
Commute Time in Carroll County
The most frequently occuring commute durations in Carroll County are 20 to 24 minutes (7,012 commuters, 13.9%), 15 to 19 minutes (6,586 commuters, 13.1%), and 30 to 34 minutes (6,356 commuters, 12.6%).
| Commute Time | # Commuters | % Commuters |
| Less than 5 Minutes | 1,555 | 3.1% |
| 5 to 9 Minutes | 5,447 | 10.8% |
| 10 to 14 Minutes | 6,088 | 12.1% |
| 15 to 19 Minutes | 6,586 | 13.1% |
| 20 to 24 Minutes | 7,012 | 13.9% |
| 25 to 29 Minutes | 2,807 | 5.6% |
| 30 to 34 Minutes | 6,356 | 12.6% |
| 35 to 39 Minutes | 1,251 | 2.5% |
| 40 to 44 Minutes | 1,980 | 3.9% |
| 45 to 59 Minutes | 4,821 | 9.6% |
| 60 to 89 Minutes | 4,503 | 8.9% |
| 90 or more Minutes | 1,938 | 3.8% |
Commute Time by Sex in Carroll County
The most common commute times in Carroll County are 30 to 34 minutes (3,487 commuters, 13.3%) for males and 20 to 24 minutes (3,705 commuters, 15.3%) for females.
| Commute Time | Male | Female |
| Less than 5 Minutes | 692 (2.6%) | 863 (3.6%) |
| 5 to 9 Minutes | 2,735 (10.4%) | 2,712 (11.2%) |
| 10 to 14 Minutes | 2,466 (9.4%) | 3,622 (15.0%) |
| 15 to 19 Minutes | 3,479 (13.3%) | 3,107 (12.9%) |
| 20 to 24 Minutes | 3,307 (12.6%) | 3,705 (15.3%) |
| 25 to 29 Minutes | 1,363 (5.2%) | 1,444 (6.0%) |
| 30 to 34 Minutes | 3,487 (13.3%) | 2,869 (11.9%) |
| 35 to 39 Minutes | 672 (2.6%) | 579 (2.4%) |
| 40 to 44 Minutes | 1,150 (4.4%) | 830 (3.4%) |
| 45 to 59 Minutes | 2,397 (9.1%) | 2,424 (10.0%) |
| 60 to 89 Minutes | 2,991 (11.4%) | 1,512 (6.3%) |
| 90 or more Minutes | 1,450 (5.5%) | 488 (2.0%) |
Time of Departure to Work by Sex in Carroll County
The most frequent times of departure to work in Carroll County are 7:00 AM to 7:29 AM (3,417, 13.1%) for males and 7:00 AM to 7:29 AM (3,869, 16.0%) for females.
| Time of Departure | Male | Female |
| 12:00 AM to 4:59 AM | 2,650 (10.1%) | 1,221 (5.1%) |
| 5:00 AM to 5:29 AM | 2,256 (8.6%) | 984 (4.1%) |
| 5:30 AM to 5:59 AM | 2,456 (9.4%) | 911 (3.8%) |
| 6:00 AM to 6:29 AM | 2,516 (9.6%) | 1,510 (6.2%) |
| 6:30 AM to 6:59 AM | 2,941 (11.2%) | 2,984 (12.3%) |
| 7:00 AM to 7:29 AM | 3,417 (13.1%) | 3,869 (16.0%) |
| 7:30 AM to 7:59 AM | 2,226 (8.5%) | 3,378 (14.0%) |
| 8:00 AM to 8:29 AM | 1,717 (6.6%) | 1,926 (8.0%) |
| 8:30 AM to 8:59 AM | 722 (2.8%) | 1,272 (5.3%) |
| 9:00 AM to 9:59 AM | 1,097 (4.2%) | 1,495 (6.2%) |
| 10:00 AM to 10:59 AM | 535 (2.0%) | 467 (1.9%) |
| 11:00 AM to 11:59 AM | 459 (1.8%) | 275 (1.1%) |
| 12:00 PM to 3:59 PM | 1,493 (5.7%) | 1,745 (7.2%) |
| 4:00 PM to 11:59 PM | 1,704 (6.5%) | 2,118 (8.8%) |
| Total | 26,189 (100.0%) | 24,155 (100.0%) |
Housing Occupancy in Carroll County
Occupancy by Ownership in Carroll County
Of the total 42,996 dwellings in Carroll County, owner-occupied units account for 29,339 (68.2%), while renter-occupied units make up 13,657 (31.8%).
| Occupancy | # Housing Units | % Housing Units |
| Owner Occupied Housing Units | 29,339 | 68.2% |
| Renter-Occupied Housing Units | 13,657 | 31.8% |
| Total Occupied Housing Units | 42,996 | 100.0% |
Occupancy by Household Size in Carroll County
| Household Size | # Housing Units | % Housing Units |
| 1-Person Household | 9,732 | 22.6% |
| 2-Person Household | 14,205 | 33.0% |
| 3-Person Household | 7,622 | 17.7% |
| 4+ Person Household | 11,437 | 26.6% |
| Total Housing Units | 42,996 | 100.0% |
Occupancy by Ownership by Household Size in Carroll County
| Household Size | Owner-occupied | Renter-occupied |
| 1-Person Household | 5,753 (59.1%) | 3,979 (40.9%) |
| 2-Person Household | 10,375 (73.0%) | 3,830 (27.0%) |
| 3-Person Household | 5,395 (70.8%) | 2,227 (29.2%) |
| 4+ Person Household | 7,816 (68.3%) | 3,621 (31.7%) |
| Total Housing Units | 29,339 (68.2%) | 13,657 (31.8%) |
Occupancy by Educational Attainment in Carroll County
| Household Size | Owner-occupied | Renter-occupied |
| Less than High School | 3,662 (59.8%) | 2,466 (40.2%) |
| High School Diploma | 8,889 (67.3%) | 4,311 (32.7%) |
| College/Associate Degree | 8,966 (64.8%) | 4,861 (35.2%) |
| Bachelor's Degree or higher | 7,822 (79.5%) | 2,019 (20.5%) |
Occupancy by Age of Householder in Carroll County
| Age Bracket | # Households | % Households |
| Under 35 Years | 9,045 | 21.0% |
| 35 to 44 Years | 7,634 | 17.8% |
| 45 to 54 Years | 8,271 | 19.2% |
| 55 to 64 Years | 7,699 | 17.9% |
| 65 to 74 Years | 6,023 | 14.0% |
| 75 to 84 Years | 3,262 | 7.6% |
| 85 Years and Over | 1,062 | 2.5% |
| Total | 42,996 | 100.0% |
Housing Finances in Carroll County
Median Income by Occupancy in Carroll County
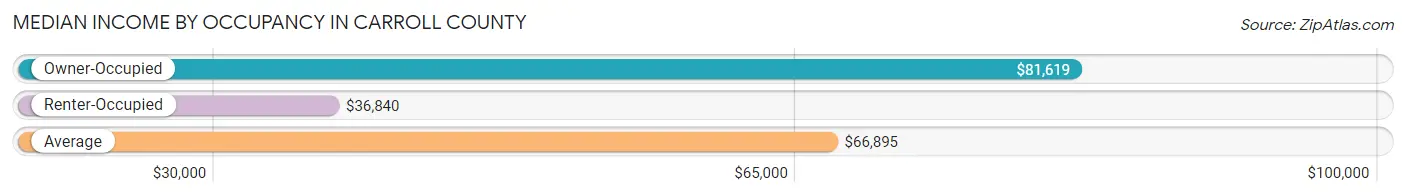
| Occupancy Type | # Households | Median Income |
| Owner-Occupied | 29,339 (68.2%) | $81,619 |
| Renter-Occupied | 13,657 (31.8%) | $36,840 |
| Average | 42,996 (100.0%) | $66,895 |
Occupancy by Householder Income Bracket in Carroll County
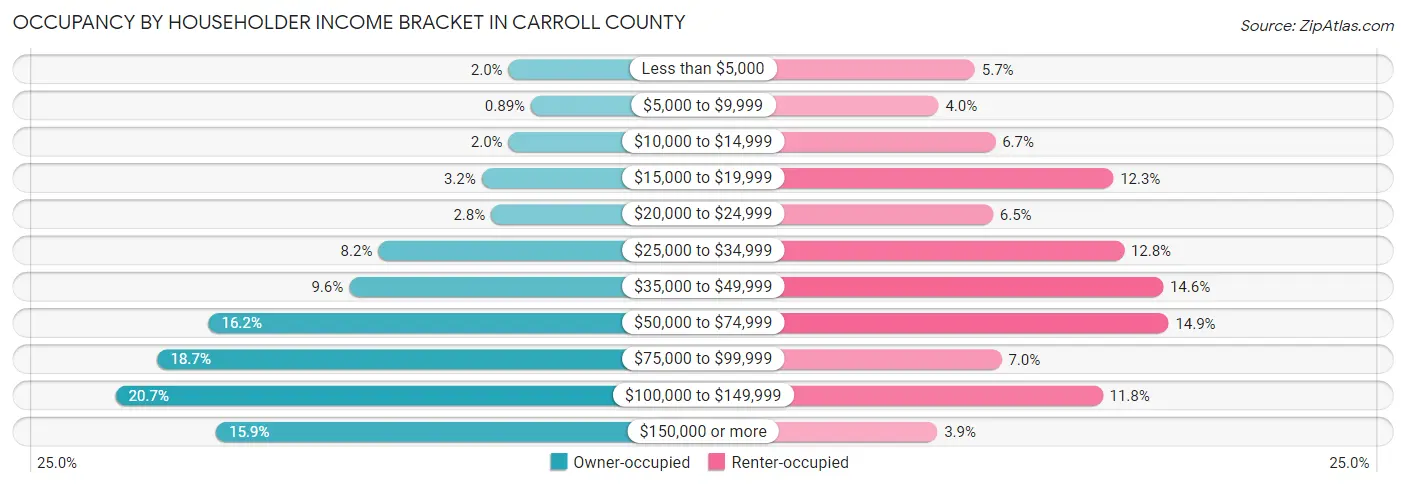
| Income Bracket | Owner-occupied | Renter-occupied |
| Less than $5,000 | 575 (2.0%) | 776 (5.7%) |
| $5,000 to $9,999 | 261 (0.9%) | 539 (4.0%) |
| $10,000 to $14,999 | 576 (2.0%) | 908 (6.7%) |
| $15,000 to $19,999 | 950 (3.2%) | 1,676 (12.3%) |
| $20,000 to $24,999 | 819 (2.8%) | 893 (6.5%) |
| $25,000 to $34,999 | 2,393 (8.2%) | 1,745 (12.8%) |
| $35,000 to $49,999 | 2,801 (9.6%) | 1,999 (14.6%) |
| $50,000 to $74,999 | 4,764 (16.2%) | 2,035 (14.9%) |
| $75,000 to $99,999 | 5,478 (18.7%) | 949 (7.0%) |
| $100,000 to $149,999 | 6,063 (20.7%) | 1,606 (11.8%) |
| $150,000 or more | 4,659 (15.9%) | 531 (3.9%) |
| Total | 29,339 (100.0%) | 13,657 (100.0%) |
Monthly Housing Cost Tiers in Carroll County
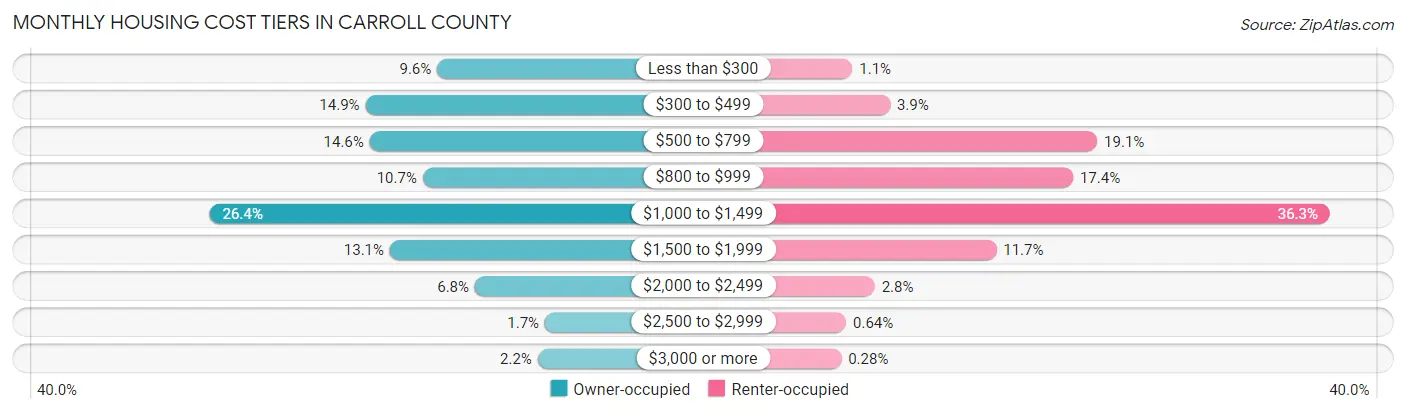
| Monthly Cost | Owner-occupied | Renter-occupied |
| Less than $300 | 2,822 (9.6%) | 150 (1.1%) |
| $300 to $499 | 4,371 (14.9%) | 528 (3.9%) |
| $500 to $799 | 4,281 (14.6%) | 2,612 (19.1%) |
| $800 to $999 | 3,134 (10.7%) | 2,370 (17.3%) |
| $1,000 to $1,499 | 7,739 (26.4%) | 4,952 (36.3%) |
| $1,500 to $1,999 | 3,844 (13.1%) | 1,598 (11.7%) |
| $2,000 to $2,499 | 2,006 (6.8%) | 376 (2.8%) |
| $2,500 to $2,999 | 494 (1.7%) | 88 (0.6%) |
| $3,000 or more | 648 (2.2%) | 38 (0.3%) |
| Total | 29,339 (100.0%) | 13,657 (100.0%) |
Physical Housing Characteristics in Carroll County
Housing Structures in Carroll County
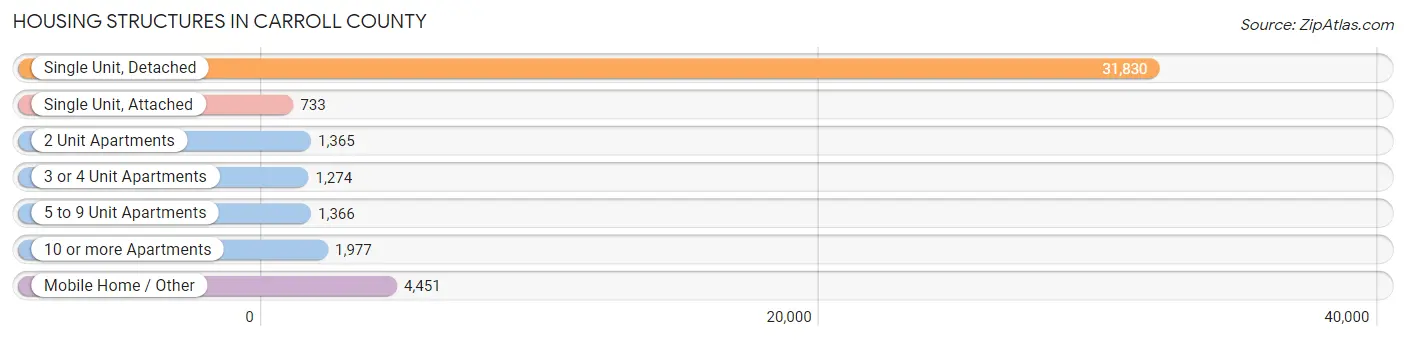
| Structure Type | # Housing Units | % Housing Units |
| Single Unit, Detached | 31,830 | 74.0% |
| Single Unit, Attached | 733 | 1.7% |
| 2 Unit Apartments | 1,365 | 3.2% |
| 3 or 4 Unit Apartments | 1,274 | 3.0% |
| 5 to 9 Unit Apartments | 1,366 | 3.2% |
| 10 or more Apartments | 1,977 | 4.6% |
| Mobile Home / Other | 4,451 | 10.3% |
| Total | 42,996 | 100.0% |
Housing Structures by Occupancy in Carroll County
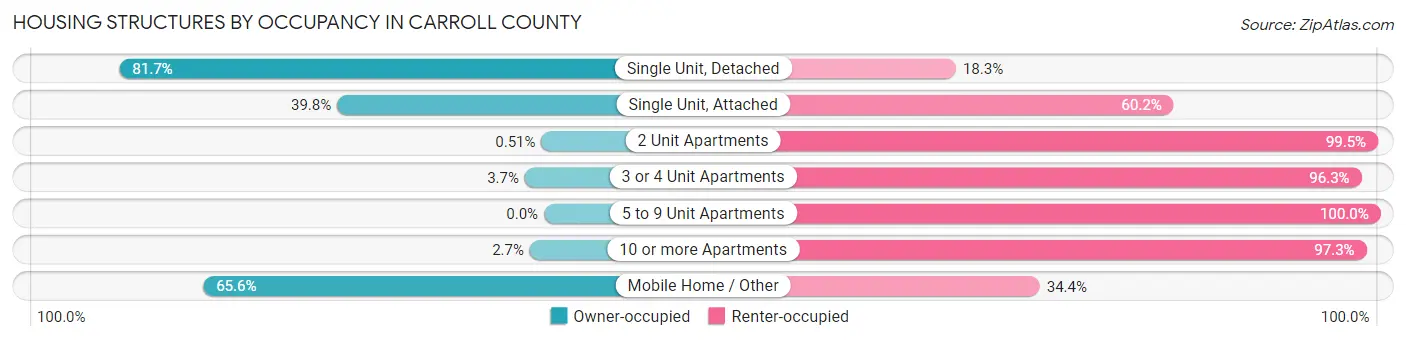
| Structure Type | Owner-occupied | Renter-occupied |
| Single Unit, Detached | 26,019 (81.7%) | 5,811 (18.3%) |
| Single Unit, Attached | 292 (39.8%) | 441 (60.2%) |
| 2 Unit Apartments | 7 (0.5%) | 1,358 (99.5%) |
| 3 or 4 Unit Apartments | 47 (3.7%) | 1,227 (96.3%) |
| 5 to 9 Unit Apartments | 0 (0.0%) | 1,366 (100.0%) |
| 10 or more Apartments | 54 (2.7%) | 1,923 (97.3%) |
| Mobile Home / Other | 2,920 (65.6%) | 1,531 (34.4%) |
| Total | 29,339 (68.2%) | 13,657 (31.8%) |
Housing Structures by Number of Rooms in Carroll County
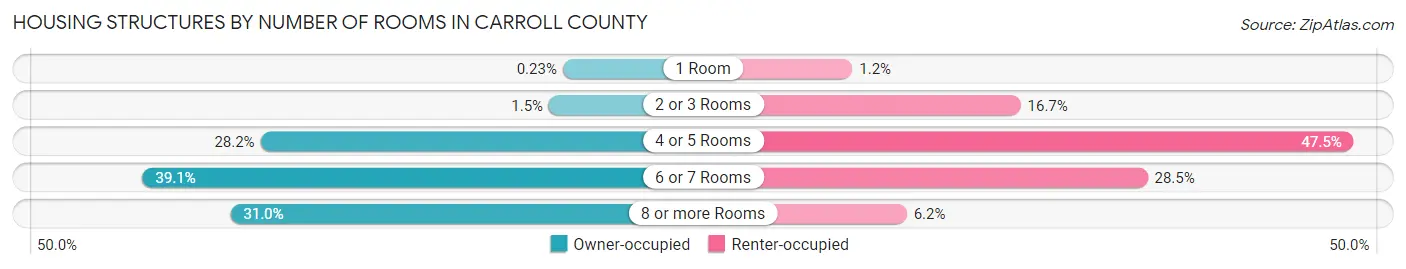
| Number of Rooms | Owner-occupied | Renter-occupied |
| 1 Room | 68 (0.2%) | 157 (1.1%) |
| 2 or 3 Rooms | 443 (1.5%) | 2,282 (16.7%) |
| 4 or 5 Rooms | 8,272 (28.2%) | 6,489 (47.5%) |
| 6 or 7 Rooms | 11,471 (39.1%) | 3,885 (28.4%) |
| 8 or more Rooms | 9,085 (31.0%) | 844 (6.2%) |
| Total | 29,339 (100.0%) | 13,657 (100.0%) |
Housing Structure by Heating Type in Carroll County
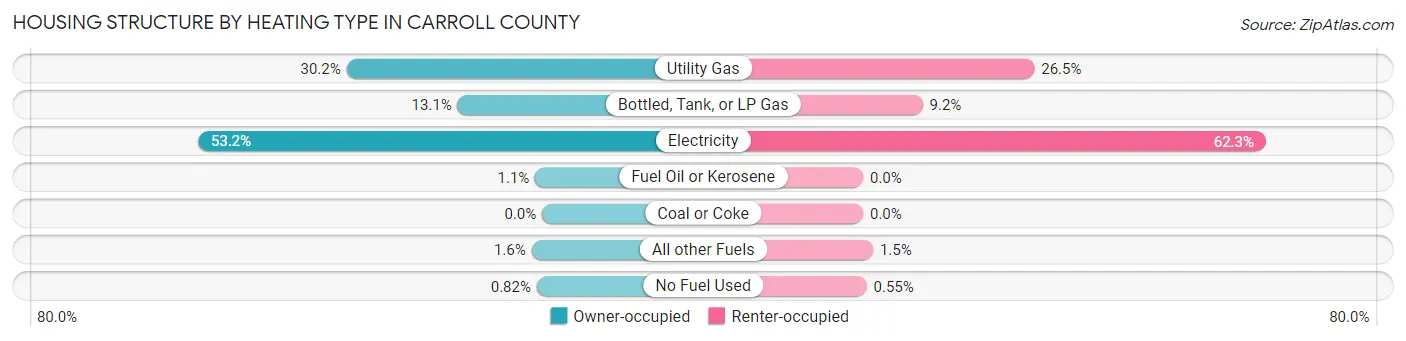
| Heating Type | Owner-occupied | Renter-occupied |
| Utility Gas | 8,869 (30.2%) | 3,615 (26.5%) |
| Bottled, Tank, or LP Gas | 3,828 (13.1%) | 1,257 (9.2%) |
| Electricity | 15,611 (53.2%) | 8,501 (62.3%) |
| Fuel Oil or Kerosene | 313 (1.1%) | 0 (0.0%) |
| Coal or Coke | 0 (0.0%) | 0 (0.0%) |
| All other Fuels | 477 (1.6%) | 209 (1.5%) |
| No Fuel Used | 241 (0.8%) | 75 (0.5%) |
| Total | 29,339 (100.0%) | 13,657 (100.0%) |
Household Vehicle Usage in Carroll County
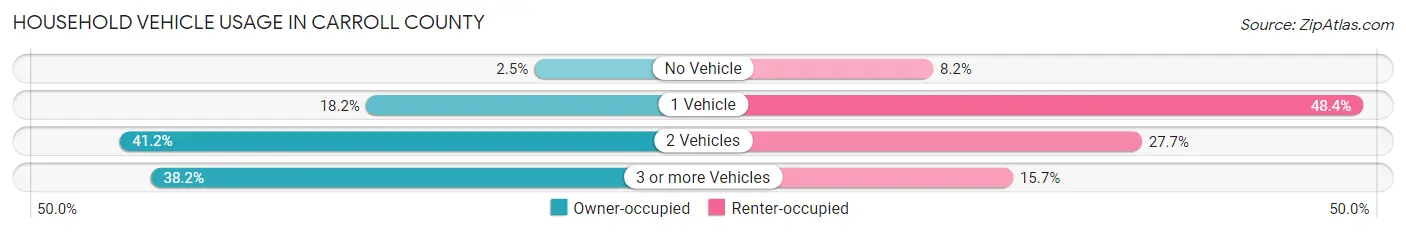
| Vehicles per Household | Owner-occupied | Renter-occupied |
| No Vehicle | 720 (2.5%) | 1,124 (8.2%) |
| 1 Vehicle | 5,327 (18.2%) | 6,605 (48.4%) |
| 2 Vehicles | 12,073 (41.1%) | 3,785 (27.7%) |
| 3 or more Vehicles | 11,219 (38.2%) | 2,143 (15.7%) |
| Total | 29,339 (100.0%) | 13,657 (100.0%) |
Real Estate & Mortgages in Carroll County
Real Estate and Mortgage Overview in Carroll County
| Characteristic | Without Mortgage | With Mortgage |
| Housing Units | 11,581 | 17,758 |
| Median Property Value | $181,700 | $205,700 |
| Median Household Income | $70,268 | $3,077 |
| Monthly Housing Costs | $443 | $632 |
| Real Estate Taxes | $814 | $427 |
Property Value by Mortgage Status in Carroll County
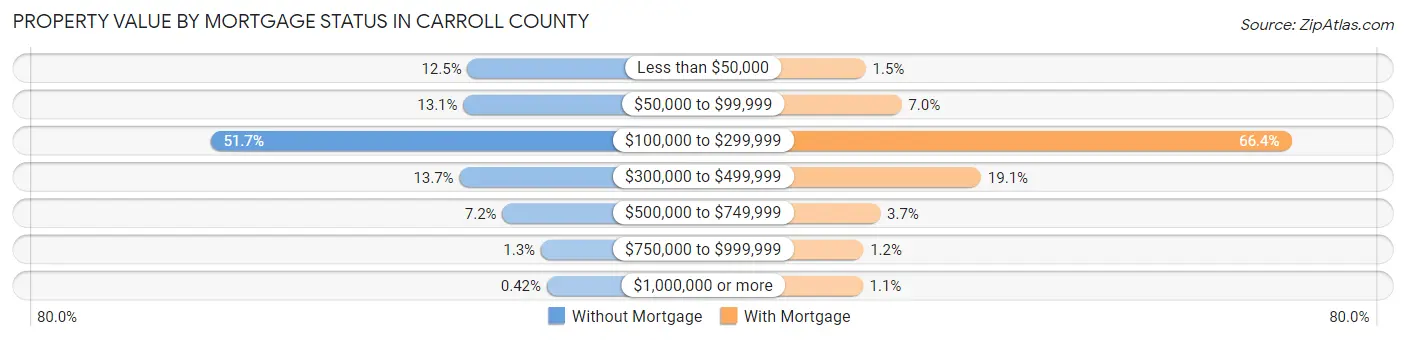
| Property Value | Without Mortgage | With Mortgage |
| Less than $50,000 | 1,449 (12.5%) | 271 (1.5%) |
| $50,000 to $99,999 | 1,522 (13.1%) | 1,241 (7.0%) |
| $100,000 to $299,999 | 5,984 (51.7%) | 11,792 (66.4%) |
| $300,000 to $499,999 | 1,591 (13.7%) | 3,391 (19.1%) |
| $500,000 to $749,999 | 833 (7.2%) | 664 (3.7%) |
| $750,000 to $999,999 | 153 (1.3%) | 207 (1.2%) |
| $1,000,000 or more | 49 (0.4%) | 192 (1.1%) |
| Total | 11,581 (100.0%) | 17,758 (100.0%) |
Household Income by Mortgage Status in Carroll County
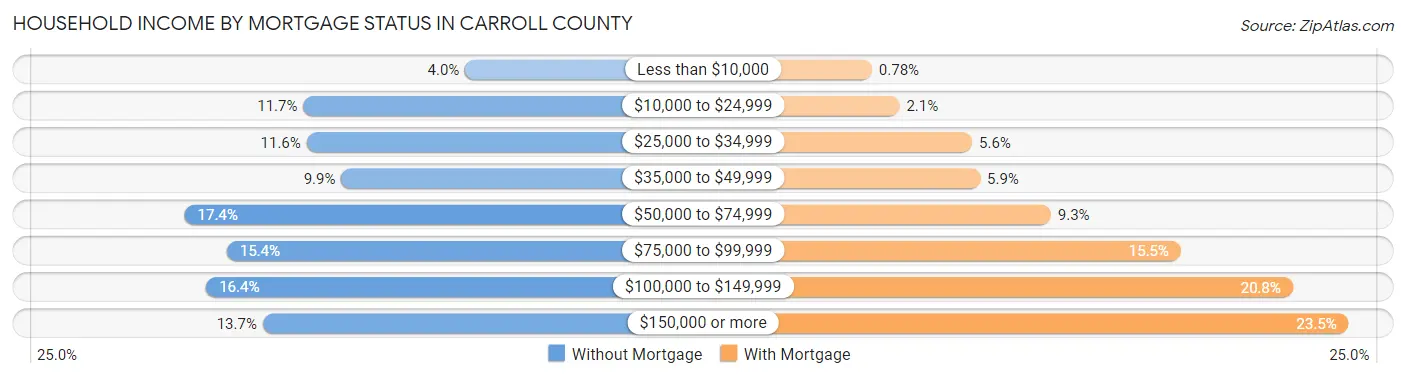
| Household Income | Without Mortgage | With Mortgage |
| Less than $10,000 | 465 (4.0%) | 138 (0.8%) |
| $10,000 to $24,999 | 1,359 (11.7%) | 371 (2.1%) |
| $25,000 to $34,999 | 1,340 (11.6%) | 986 (5.6%) |
| $35,000 to $49,999 | 1,149 (9.9%) | 1,053 (5.9%) |
| $50,000 to $74,999 | 2,013 (17.4%) | 1,652 (9.3%) |
| $75,000 to $99,999 | 1,780 (15.4%) | 2,751 (15.5%) |
| $100,000 to $149,999 | 1,893 (16.4%) | 3,698 (20.8%) |
| $150,000 or more | 1,582 (13.7%) | 4,170 (23.5%) |
| Total | 11,581 (100.0%) | 17,758 (100.0%) |
Property Value to Household Income Ratio in Carroll County
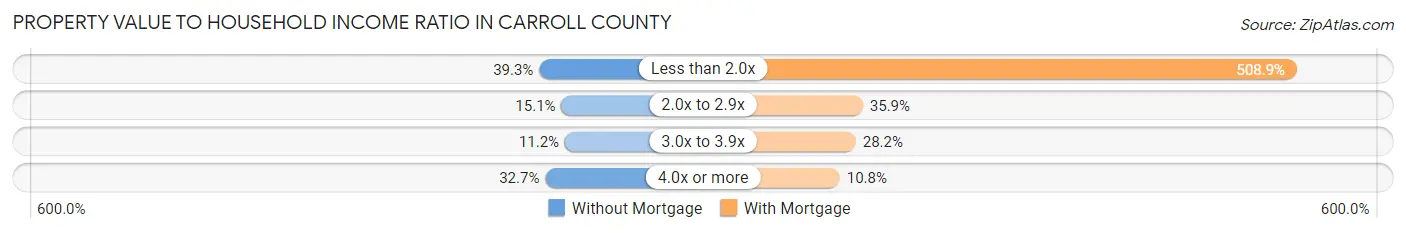
| Value-to-Income Ratio | Without Mortgage | With Mortgage |
| Less than 2.0x | 4,547 (39.3%) | 90,366 (508.9%) |
| 2.0x to 2.9x | 1,743 (15.0%) | 6,379 (35.9%) |
| 3.0x to 3.9x | 1,296 (11.2%) | 5,015 (28.2%) |
| 4.0x or more | 3,786 (32.7%) | 1,911 (10.8%) |
| Total | 11,581 (100.0%) | 17,758 (100.0%) |
Real Estate Taxes by Mortgage Status in Carroll County
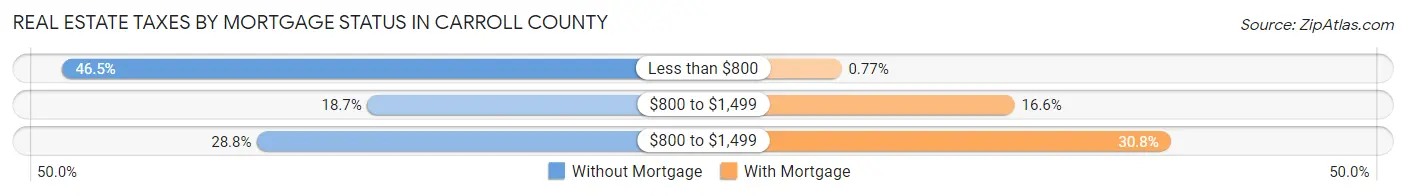
| Property Taxes | Without Mortgage | With Mortgage |
| Less than $800 | 5,390 (46.5%) | 137 (0.8%) |
| $800 to $1,499 | 2,163 (18.7%) | 2,945 (16.6%) |
| $800 to $1,499 | 3,329 (28.7%) | 5,473 (30.8%) |
| Total | 11,581 (100.0%) | 17,758 (100.0%) |
Health & Disability in Carroll County
Health Insurance Coverage by Age in Carroll County
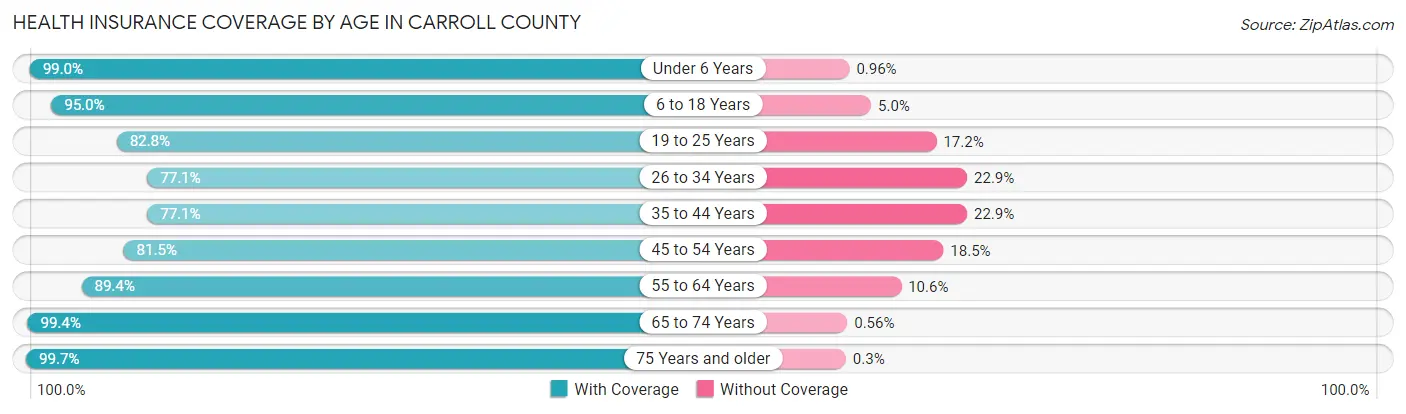
| Age Bracket | With Coverage | Without Coverage |
| Under 6 Years | 9,054 (99.0%) | 88 (1.0%) |
| 6 to 18 Years | 20,257 (95.0%) | 1,065 (5.0%) |
| 19 to 25 Years | 11,917 (82.8%) | 2,473 (17.2%) |
| 26 to 34 Years | 11,023 (77.1%) | 3,274 (22.9%) |
| 35 to 44 Years | 11,417 (77.1%) | 3,390 (22.9%) |
| 45 to 54 Years | 11,923 (81.5%) | 2,703 (18.5%) |
| 55 to 64 Years | 12,492 (89.4%) | 1,484 (10.6%) |
| 65 to 74 Years | 10,061 (99.4%) | 57 (0.6%) |
| 75 Years and older | 6,284 (99.7%) | 19 (0.3%) |
| Total | 104,428 (87.8%) | 14,553 (12.2%) |
Health Insurance Coverage by Citizenship Status in Carroll County
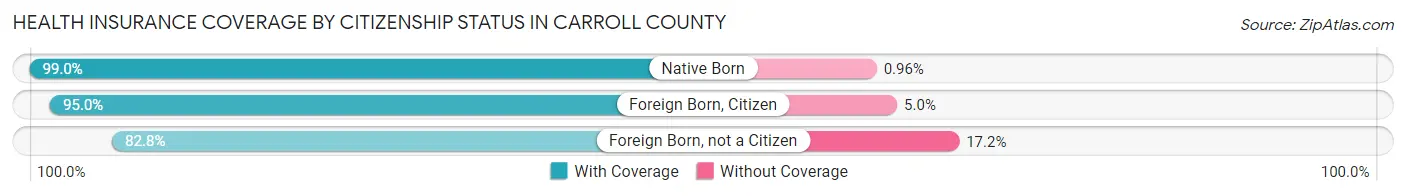
| Citizenship Status | With Coverage | Without Coverage |
| Native Born | 9,054 (99.0%) | 88 (1.0%) |
| Foreign Born, Citizen | 20,257 (95.0%) | 1,065 (5.0%) |
| Foreign Born, not a Citizen | 11,917 (82.8%) | 2,473 (17.2%) |
Health Insurance Coverage by Household Income in Carroll County
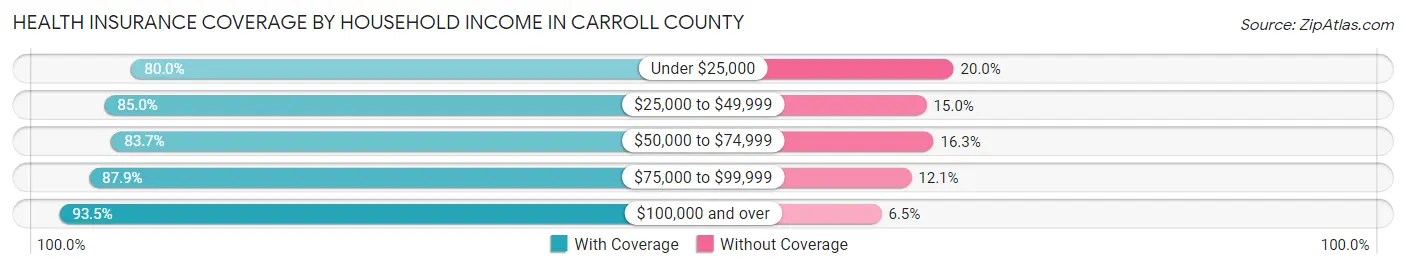
| Household Income | With Coverage | Without Coverage |
| Under $25,000 | 12,594 (80.0%) | 3,150 (20.0%) |
| $25,000 to $49,999 | 17,962 (85.0%) | 3,161 (15.0%) |
| $50,000 to $74,999 | 14,922 (83.7%) | 2,897 (16.3%) |
| $75,000 to $99,999 | 16,759 (87.9%) | 2,308 (12.1%) |
| $100,000 and over | 40,246 (93.5%) | 2,802 (6.5%) |
Public vs Private Health Insurance Coverage by Age in Carroll County
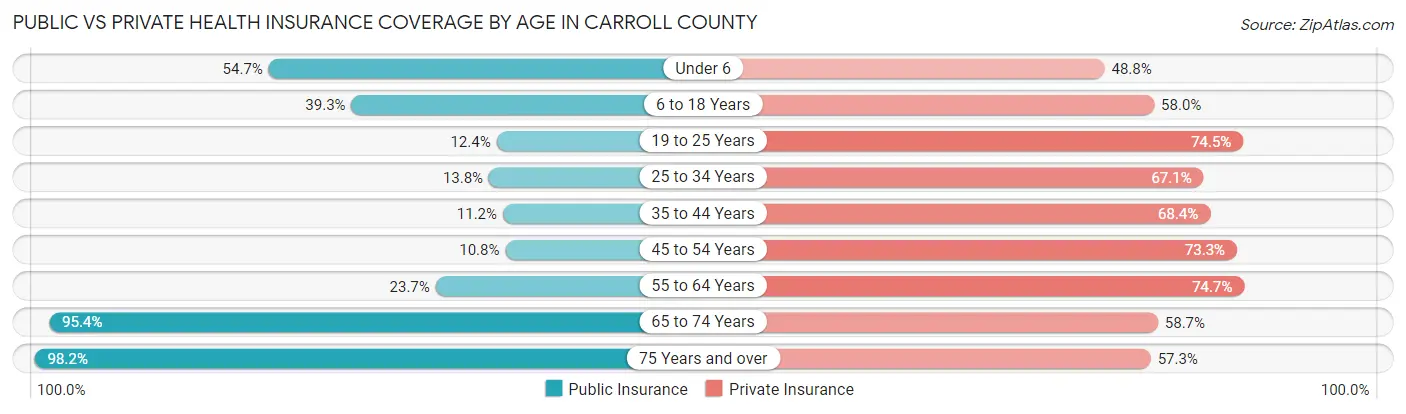
| Age Bracket | Public Insurance | Private Insurance |
| Under 6 | 5,001 (54.7%) | 4,459 (48.8%) |
| 6 to 18 Years | 8,389 (39.3%) | 12,363 (58.0%) |
| 19 to 25 Years | 1,786 (12.4%) | 10,720 (74.5%) |
| 25 to 34 Years | 1,975 (13.8%) | 9,597 (67.1%) |
| 35 to 44 Years | 1,663 (11.2%) | 10,122 (68.4%) |
| 45 to 54 Years | 1,577 (10.8%) | 10,727 (73.3%) |
| 55 to 64 Years | 3,314 (23.7%) | 10,439 (74.7%) |
| 65 to 74 Years | 9,657 (95.4%) | 5,936 (58.7%) |
| 75 Years and over | 6,187 (98.2%) | 3,614 (57.3%) |
| Total | 39,549 (33.2%) | 77,977 (65.5%) |
Disability Status by Sex by Age in Carroll County
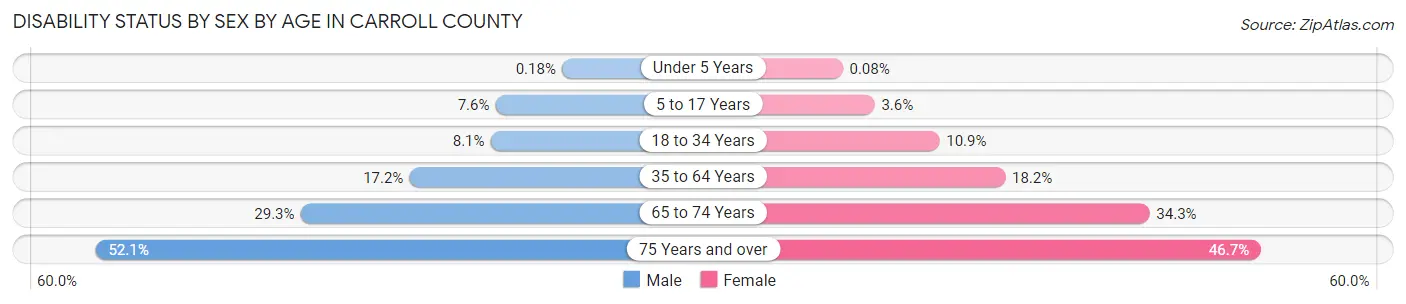
| Age Bracket | Male | Female |
| Under 5 Years | 7 (0.2%) | 3 (0.1%) |
| 5 to 17 Years | 811 (7.6%) | 370 (3.6%) |
| 18 to 34 Years | 1,210 (8.1%) | 1,729 (10.9%) |
| 35 to 64 Years | 3,629 (17.2%) | 4,050 (18.2%) |
| 65 to 74 Years | 1,363 (29.3%) | 1,872 (34.3%) |
| 75 Years and over | 1,402 (52.1%) | 1,686 (46.7%) |
Disability Class by Sex by Age in Carroll County
Disability Class: Hearing Difficulty
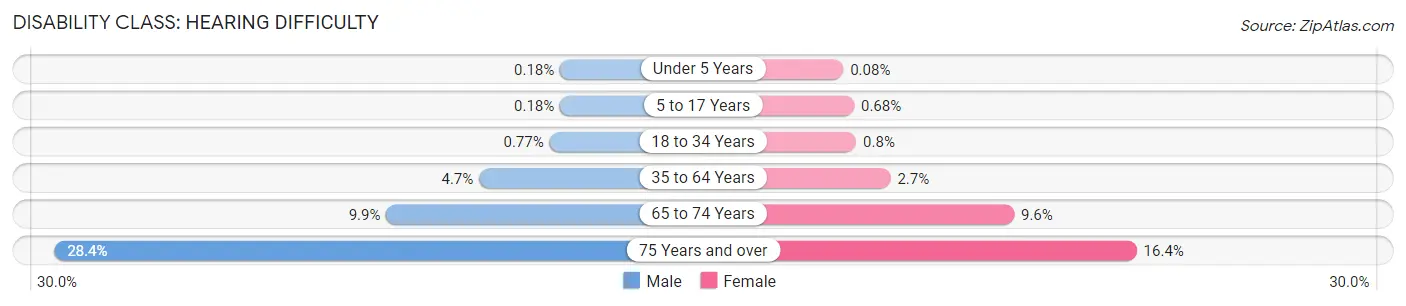
| Age Bracket | Male | Female |
| Under 5 Years | 7 (0.2%) | 3 (0.1%) |
| 5 to 17 Years | 19 (0.2%) | 69 (0.7%) |
| 18 to 34 Years | 115 (0.8%) | 127 (0.8%) |
| 35 to 64 Years | 992 (4.7%) | 603 (2.7%) |
| 65 to 74 Years | 459 (9.9%) | 524 (9.6%) |
| 75 Years and over | 763 (28.3%) | 593 (16.4%) |
Disability Class: Vision Difficulty
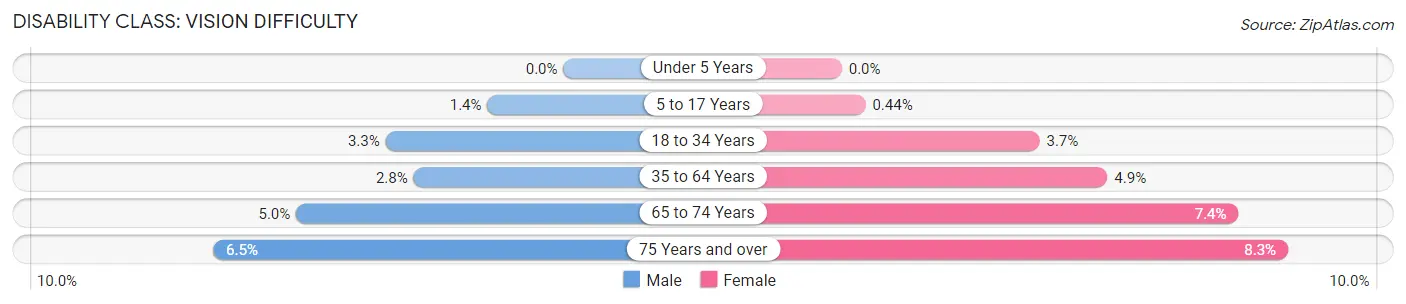
| Age Bracket | Male | Female |
| Under 5 Years | 0 (0.0%) | 0 (0.0%) |
| 5 to 17 Years | 151 (1.4%) | 45 (0.4%) |
| 18 to 34 Years | 491 (3.3%) | 584 (3.7%) |
| 35 to 64 Years | 588 (2.8%) | 1,099 (4.9%) |
| 65 to 74 Years | 231 (5.0%) | 402 (7.4%) |
| 75 Years and over | 175 (6.5%) | 299 (8.3%) |
Disability Class: Cognitive Difficulty
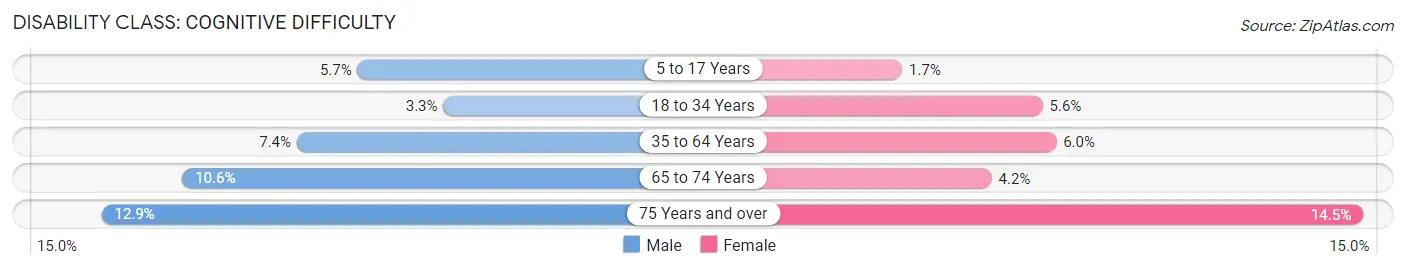
| Age Bracket | Male | Female |
| 5 to 17 Years | 613 (5.7%) | 171 (1.7%) |
| 18 to 34 Years | 497 (3.3%) | 889 (5.6%) |
| 35 to 64 Years | 1,569 (7.4%) | 1,329 (6.0%) |
| 65 to 74 Years | 494 (10.6%) | 228 (4.2%) |
| 75 Years and over | 346 (12.9%) | 524 (14.5%) |
Disability Class: Ambulatory Difficulty
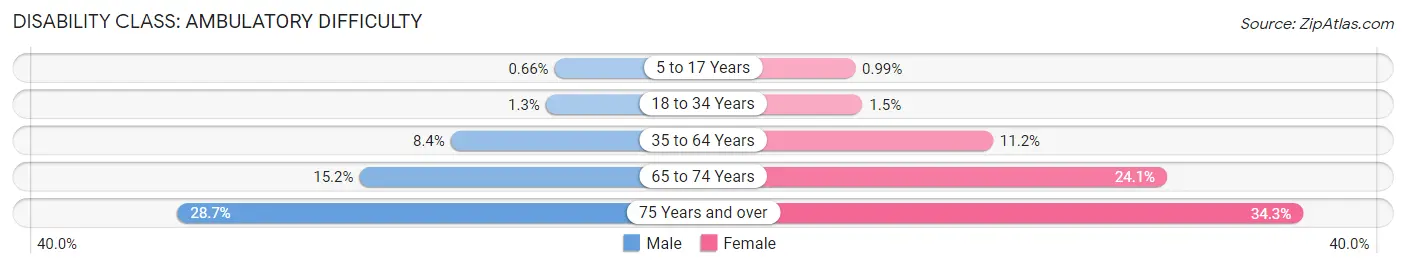
| Age Bracket | Male | Female |
| 5 to 17 Years | 71 (0.7%) | 101 (1.0%) |
| 18 to 34 Years | 195 (1.3%) | 243 (1.5%) |
| 35 to 64 Years | 1,768 (8.4%) | 2,499 (11.2%) |
| 65 to 74 Years | 705 (15.1%) | 1,319 (24.1%) |
| 75 Years and over | 771 (28.6%) | 1,237 (34.3%) |
Disability Class: Self-Care Difficulty
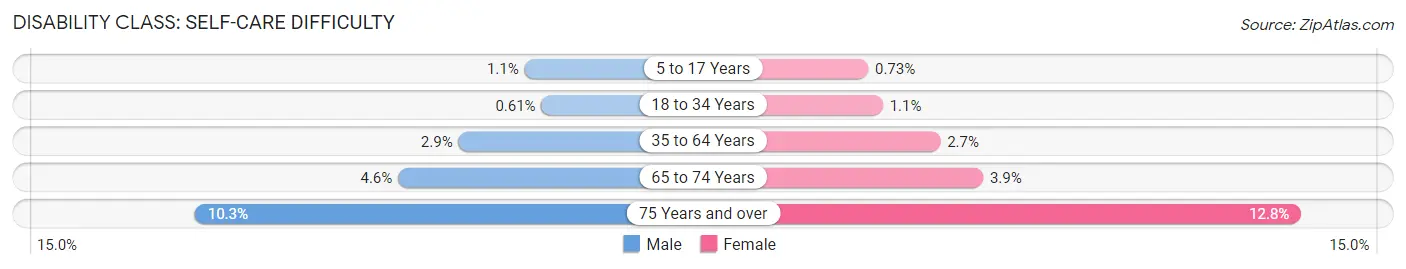
| Age Bracket | Male | Female |
| 5 to 17 Years | 116 (1.1%) | 74 (0.7%) |
| 18 to 34 Years | 91 (0.6%) | 182 (1.1%) |
| 35 to 64 Years | 617 (2.9%) | 610 (2.7%) |
| 65 to 74 Years | 214 (4.6%) | 215 (3.9%) |
| 75 Years and over | 276 (10.3%) | 462 (12.8%) |
Technology Access in Carroll County
Computing Device Access in Carroll County
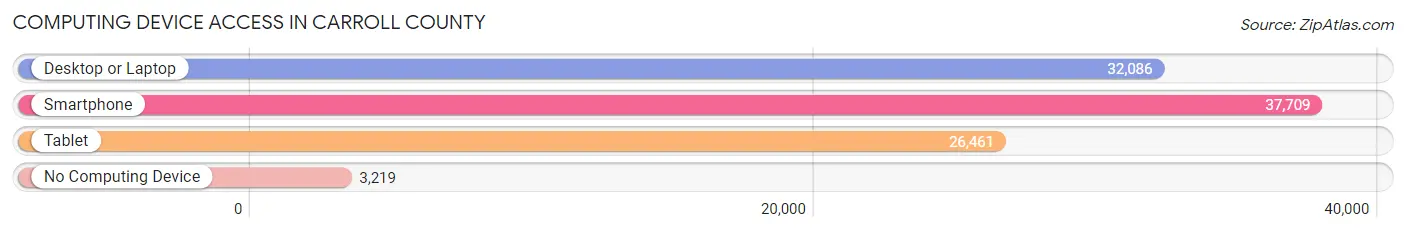
| Device Type | # Households | % Households |
| Desktop or Laptop | 32,086 | 74.6% |
| Smartphone | 37,709 | 87.7% |
| Tablet | 26,461 | 61.5% |
| No Computing Device | 3,219 | 7.5% |
| Total | 42,996 | 100.0% |
Internet Access in Carroll County
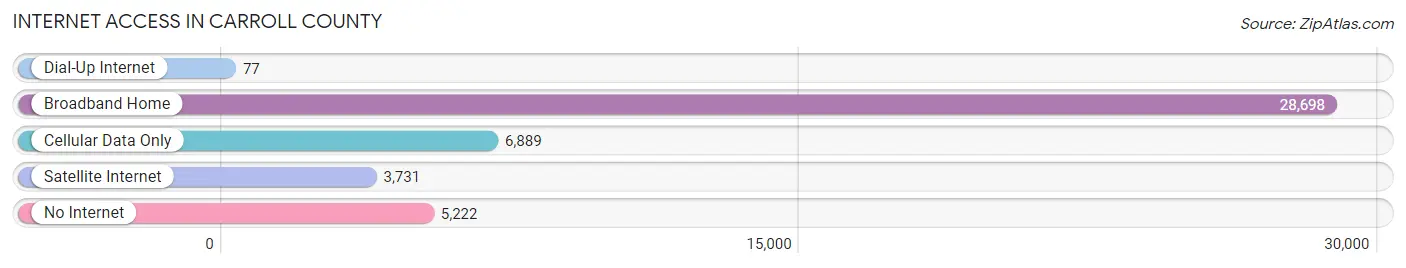
| Internet Type | # Households | % Households |
| Dial-Up Internet | 77 | 0.2% |
| Broadband Home | 28,698 | 66.7% |
| Cellular Data Only | 6,889 | 16.0% |
| Satellite Internet | 3,731 | 8.7% |
| No Internet | 5,222 | 12.1% |
| Total | 42,996 | 100.0% |
Carroll County Summary
Carroll County is located in the northwestern part of the state of Georgia, and is part of the Atlanta metropolitan area. It is bordered by Fulton, Douglas, Paulding, Haralson, and Heard counties. The county seat is Carrollton, and the county has a total area of 439 square miles. As of the 2010 census, the population was approximately 110,527.
History
Carroll County was created in 1826 from parts of the original Cherokee County. It was named for Charles Carroll of Carrollton, the last surviving signer of the Declaration of Independence. The county was originally divided into nine districts, and the first county seat was at Old Carrollton. In 1829, the county seat was moved to Villa Rica, and in 1844 it was moved to Carrollton.
During the Civil War, Carroll County was the site of several battles, including the Battle of Brown's Mill and the Battle of Villa Rica. After the war, the county experienced a period of growth and development, with the establishment of several new towns and industries.
Geography
Carroll County is located in the foothills of the Appalachian Mountains, and is part of the Piedmont region of Georgia. The county is mostly rural, with rolling hills and forests. The Chattahoochee River forms the northern border of the county, and the Etowah River forms the western border. The county is home to several state parks, including Sweetwater Creek State Park and McIntosh Reserve.
Economy
The economy of Carroll County is largely based on agriculture and manufacturing. The county is home to several large poultry processing plants, as well as a number of smaller agricultural operations. The county also has a growing tourism industry, with several wineries, golf courses, and other attractions.
Demographics
As of the 2010 census, the population of Carroll County was 110,527. The racial makeup of the county was 79.3% White, 15.3% African American, 0.5% Native American, 1.7% Asian, 0.1% Pacific Islander, 1.7% from other races, and 1.4% from two or more races. Hispanic or Latino of any race were 4.2% of the population.
The median household income in the county was $45,945, and the median family income was $54,945. The per capita income was $22,945. About 11.3% of the population was below the poverty line.
The largest cities in the county are Carrollton, Villa Rica, and Temple. The county is served by the Carroll County School System, which includes 11 elementary schools, four middle schools, and four high schools. The county is also home to several colleges and universities, including the University of West Georgia and West Georgia Technical College.
Common Questions
What is the Total Population of Carroll County?
Total Population of Carroll County is 120,060.
What is the Total Male Population of Carroll County?
Total Male Population of Carroll County is 58,690.
What is the Total Female Population of Carroll County?
Total Female Population of Carroll County is 61,370.
What is the Ratio of Males per 100 Females in Carroll County?
There are 95.63 Males per 100 Females in Carroll County.
What is the Ratio of Females per 100 Males in Carroll County?
There are 104.57 Females per 100 Males in Carroll County.
What is the Median Population Age in Carroll County?
Median Population Age in Carroll County is 35.2 Years.
What is the Average Family Size in Carroll County
Average Family Size in Carroll County is 3.1 People.
What is the Average Household Size in Carroll County
Average Household Size in Carroll County is 2.7 People.
What is Per Capita Income in Carroll County?
Per Capita income in Carroll County is $30,827.
What is the Median Family Income in Carroll County?
Median Family Income in Carroll County is $79,624.
What is the Median Household income in Carroll County?
Median Household Income in Carroll County is $66,895.
What is Income or Wage Gap in Carroll County?
Income or Wage Gap in Carroll County is 31.6%.
Women in Carroll County earn 68.4 cents for every dollar earned by a man.
What is Family Income Deficit in Carroll County?
Family Income Deficit in Carroll County is $9,705.
Families that are below poverty line in Carroll County earn $9,705 less on average than the poverty threshold level.
What is Inequality or Gini Index in Carroll County?
Inequality or Gini Index in Carroll County is 0.44.
How Large is the Labor Force in Carroll County?
There are 59,708 People in the Labor Forcein in Carroll County.
What is the Percentage of People in the Labor Force in Carroll County?
62.9% of People are in the Labor Force in Carroll County.
What is the Unemployment Rate in Carroll County?
Unemployment Rate in Carroll County is 5.9%.