Richmond County, GA
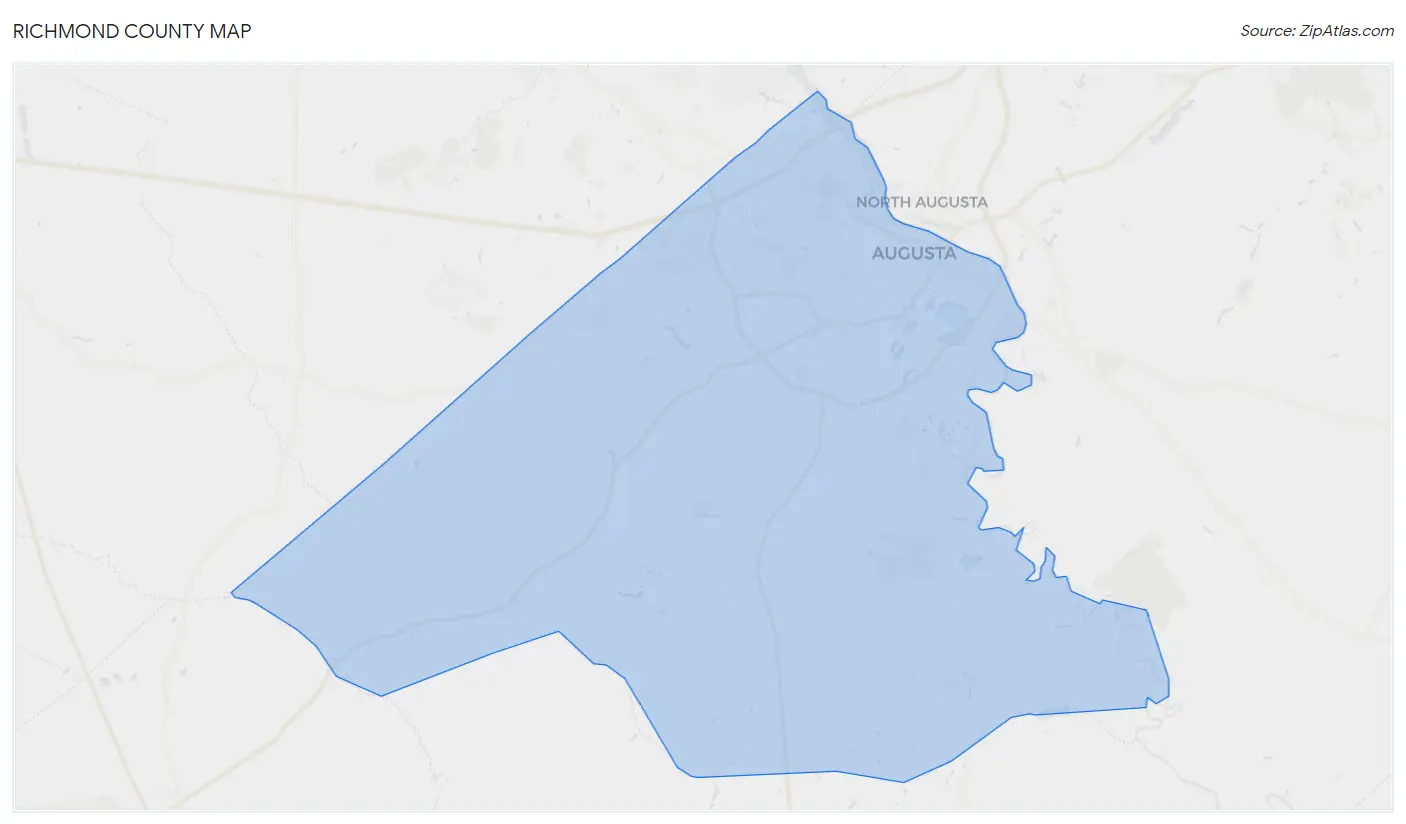
Richmond County Map
Richmond County Overview
206,153
TOTAL POPULATION
99,791
MALE POPULATION
106,362
FEMALE POPULATION
93.82
MALES / 100 FEMALES
106.58
FEMALES / 100 MALES
34.8
MEDIAN AGE
3.5
AVG FAMILY SIZE
2.6
AVG HOUSEHOLD SIZE
$28,480
PER CAPITA INCOME
$60,993
AVG FAMILY INCOME
$50,605
AVG HOUSEHOLD INCOME
18.1%
WAGE / INCOME GAP [ % ]
81.9¢/ $1
WAGE / INCOME GAP [ $ ]
$12,286
FAMILY INCOME DEFICIT
0.49
INEQUALITY / GINI INDEX
101,433
LABOR FORCE [ PEOPLE ]
61.9%
PERCENT IN LABOR FORCE
8.3%
UNEMPLOYMENT RATE
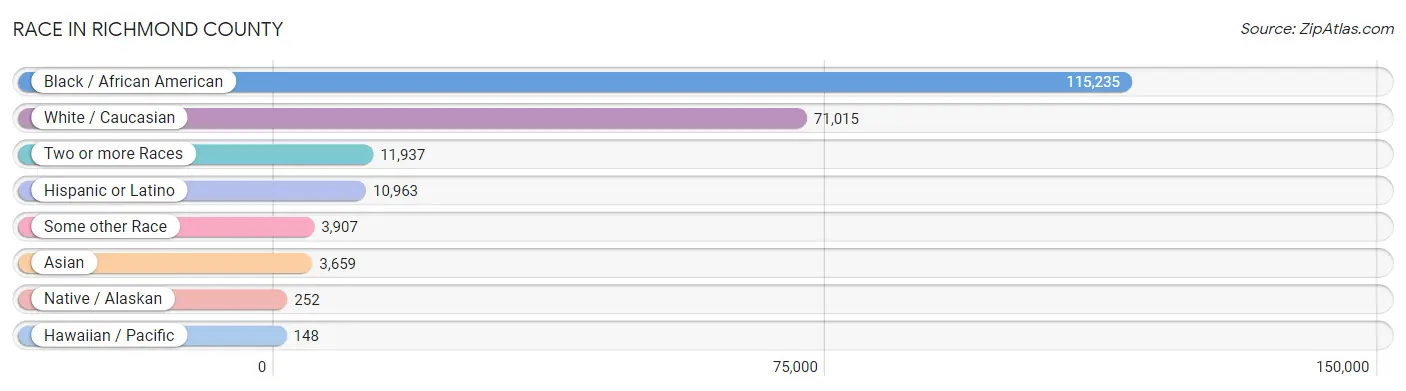
Race in Richmond County
The most populous races in Richmond County are Black / African American (115,235 | 55.9%), White / Caucasian (71,015 | 34.4%), and Two or more Races (11,937 | 5.8%).
| Race | # Population | % Population |
| Asian | 3,659 | 1.8% |
| Black / African American | 115,235 | 55.9% |
| Hawaiian / Pacific | 148 | 0.1% |
| Hispanic or Latino | 10,963 | 5.3% |
| Native / Alaskan | 252 | 0.1% |
| White / Caucasian | 71,015 | 34.4% |
| Two or more Races | 11,937 | 5.8% |
| Some other Race | 3,907 | 1.9% |
| Total | 206,153 | 100.0% |
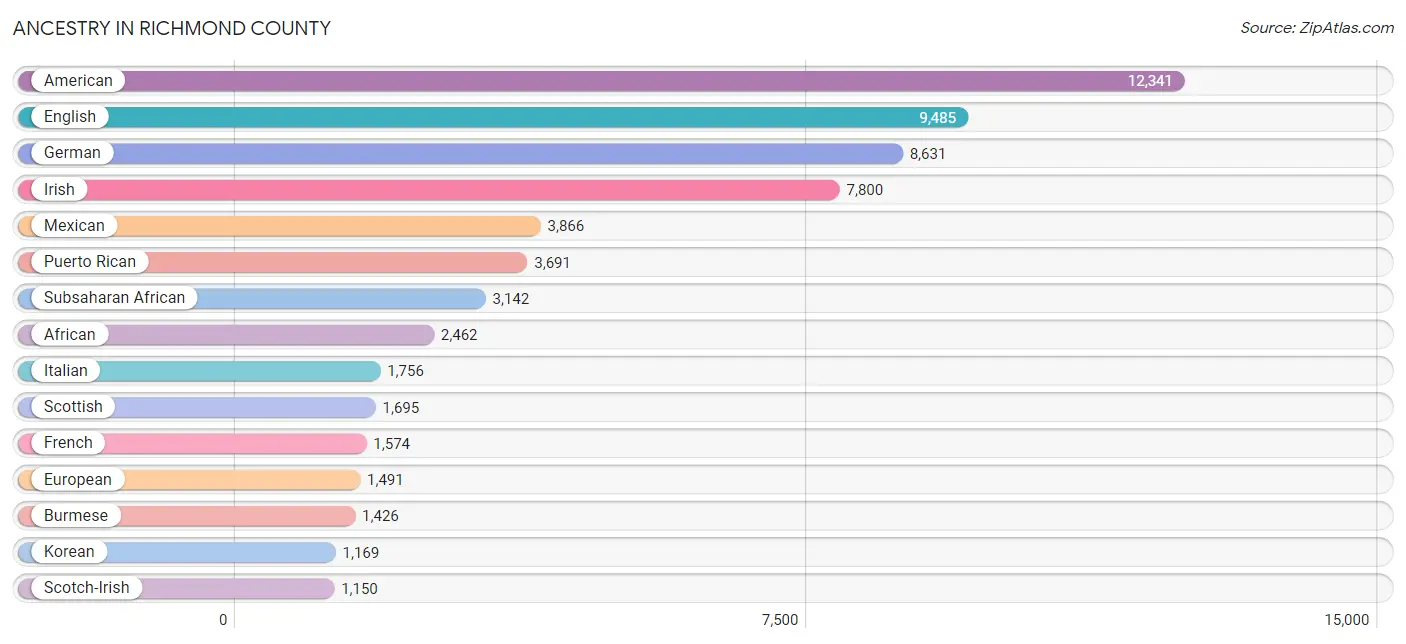
Ancestry in Richmond County
The most populous ancestries reported in Richmond County are American (12,341 | 6.0%), English (9,485 | 4.6%), German (8,631 | 4.2%), Irish (7,800 | 3.8%), and Mexican (3,866 | 1.9%), together accounting for 20.4% of all Richmond County residents.
| Ancestry | # Population | % Population |
| Afghan | 26 | 0.0% |
| African | 2,462 | 1.2% |
| Alaska Native | 2 | 0.0% |
| Albanian | 17 | 0.0% |
| American | 12,341 | 6.0% |
| Apache | 2 | 0.0% |
| Arab | 316 | 0.2% |
| Argentinean | 22 | 0.0% |
| Assyrian / Chaldean / Syriac | 173 | 0.1% |
| Austrian | 85 | 0.0% |
| Barbadian | 38 | 0.0% |
| Belgian | 10 | 0.0% |
| Belizean | 71 | 0.0% |
| Bermudan | 4 | 0.0% |
| Bhutanese | 388 | 0.2% |
| Blackfeet | 97 | 0.1% |
| Brazilian | 191 | 0.1% |
| British | 526 | 0.3% |
| British West Indian | 44 | 0.0% |
| Burmese | 1,426 | 0.7% |
| Cajun | 28 | 0.0% |
| Cambodian | 50 | 0.0% |
| Canadian | 62 | 0.0% |
| Central American | 925 | 0.4% |
| Central American Indian | 176 | 0.1% |
| Cherokee | 816 | 0.4% |
| Chickasaw | 20 | 0.0% |
| Chilean | 57 | 0.0% |
| Chippewa | 19 | 0.0% |
| Choctaw | 28 | 0.0% |
| Colombian | 207 | 0.1% |
| Comanche | 17 | 0.0% |
| Costa Rican | 41 | 0.0% |
| Cree | 13 | 0.0% |
| Creek | 64 | 0.0% |
| Croatian | 4 | 0.0% |
| Cuban | 317 | 0.2% |
| Czech | 49 | 0.0% |
| Czechoslovakian | 36 | 0.0% |
| Danish | 109 | 0.1% |
| Dominican | 472 | 0.2% |
| Dutch | 482 | 0.2% |
| Eastern European | 183 | 0.1% |
| Ecuadorian | 94 | 0.1% |
| Egyptian | 37 | 0.0% |
| English | 9,485 | 4.6% |
| Estonian | 12 | 0.0% |
| European | 1,491 | 0.7% |
| Finnish | 42 | 0.0% |
| French | 1,574 | 0.8% |
| French Canadian | 397 | 0.2% |
| German | 8,631 | 4.2% |
| Ghanaian | 11 | 0.0% |
| Greek | 276 | 0.1% |
| Guamanian / Chamorro | 55 | 0.0% |
| Guatemalan | 50 | 0.0% |
| Guyanese | 82 | 0.0% |
| Haitian | 289 | 0.1% |
| Honduran | 208 | 0.1% |
| Hungarian | 204 | 0.1% |
| Icelander | 7 | 0.0% |
| Indian (Asian) | 976 | 0.5% |
| Iranian | 100 | 0.1% |
| Irish | 7,800 | 3.8% |
| Iroquois | 5 | 0.0% |
| Israeli | 93 | 0.1% |
| Italian | 1,756 | 0.9% |
| Jamaican | 415 | 0.2% |
| Japanese | 55 | 0.0% |
| Jordanian | 3 | 0.0% |
| Korean | 1,169 | 0.6% |
| Lebanese | 34 | 0.0% |
| Lithuanian | 34 | 0.0% |
| Lumbee | 22 | 0.0% |
| Luxembourger | 21 | 0.0% |
| Malaysian | 62 | 0.0% |
| Maltese | 11 | 0.0% |
| Mexican | 3,866 | 1.9% |
| Mexican American Indian | 73 | 0.0% |
| Moroccan | 67 | 0.0% |
| Native Hawaiian | 92 | 0.0% |
| Nicaraguan | 29 | 0.0% |
| Nigerian | 494 | 0.2% |
| Northern European | 65 | 0.0% |
| Norwegian | 570 | 0.3% |
| Pakistani | 72 | 0.0% |
| Panamanian | 492 | 0.2% |
| Pennsylvania German | 9 | 0.0% |
| Peruvian | 6 | 0.0% |
| Pima | 14 | 0.0% |
| Polish | 1,090 | 0.5% |
| Portuguese | 272 | 0.1% |
| Potawatomi | 5 | 0.0% |
| Puerto Rican | 3,691 | 1.8% |
| Romanian | 33 | 0.0% |
| Russian | 251 | 0.1% |
| Salvadoran | 105 | 0.1% |
| Samoan | 257 | 0.1% |
| Scandinavian | 38 | 0.0% |
| Scotch-Irish | 1,150 | 0.6% |
| Scottish | 1,695 | 0.8% |
| Seminole | 59 | 0.0% |
| Senegalese | 59 | 0.0% |
| Serbian | 10 | 0.0% |
| Sioux | 52 | 0.0% |
| Slavic | 10 | 0.0% |
| Slovak | 115 | 0.1% |
| Slovene | 21 | 0.0% |
| South African | 24 | 0.0% |
| South American | 451 | 0.2% |
| Spaniard | 498 | 0.2% |
| Spanish | 577 | 0.3% |
| Sri Lankan | 322 | 0.2% |
| Subsaharan African | 3,142 | 1.5% |
| Swedish | 273 | 0.1% |
| Swiss | 121 | 0.1% |
| Syrian | 155 | 0.1% |
| Thai | 967 | 0.5% |
| Trinidadian and Tobagonian | 44 | 0.0% |
| Turkish | 27 | 0.0% |
| U.S. Virgin Islander | 27 | 0.0% |
| Ugandan | 10 | 0.0% |
| Ukrainian | 102 | 0.1% |
| Uruguayan | 42 | 0.0% |
| Venezuelan | 23 | 0.0% |
| Welsh | 415 | 0.2% |
| West Indian | 204 | 0.1% |
| Yugoslavian | 8 | 0.0% |
| Zimbabwean | 20 | 0.0% | View All 129 Rows |
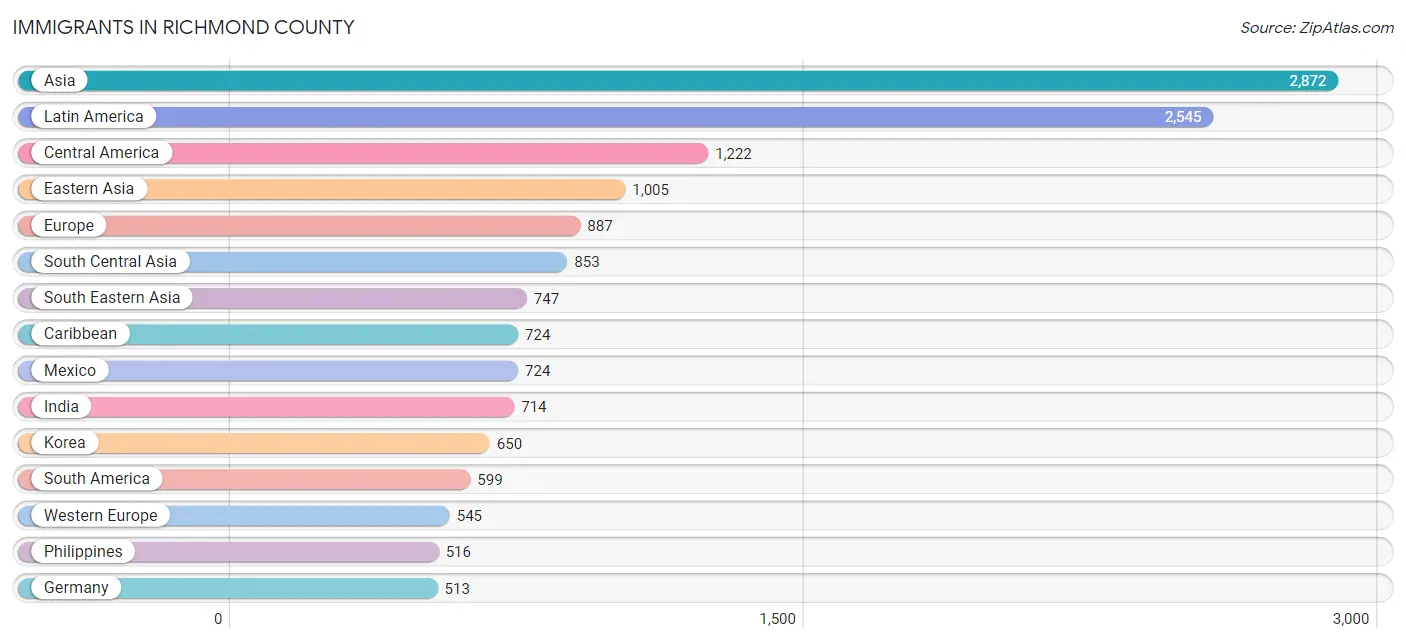
Immigrants in Richmond County
The most numerous immigrant groups reported in Richmond County came from Asia (2,872 | 1.4%), Latin America (2,545 | 1.2%), Central America (1,222 | 0.6%), Eastern Asia (1,005 | 0.5%), and Europe (887 | 0.4%), together accounting for 4.1% of all Richmond County residents.
| Immigration Origin | # Population | % Population |
| Africa | 397 | 0.2% |
| Albania | 17 | 0.0% |
| Argentina | 22 | 0.0% |
| Asia | 2,872 | 1.4% |
| Australia | 4 | 0.0% |
| Austria | 16 | 0.0% |
| Barbados | 42 | 0.0% |
| Belize | 39 | 0.0% |
| Brazil | 72 | 0.0% |
| Cambodia | 53 | 0.0% |
| Cameroon | 3 | 0.0% |
| Canada | 130 | 0.1% |
| Caribbean | 724 | 0.4% |
| Central America | 1,222 | 0.6% |
| Chile | 92 | 0.0% |
| China | 299 | 0.2% |
| Colombia | 141 | 0.1% |
| Costa Rica | 21 | 0.0% |
| Cuba | 60 | 0.0% |
| Czechoslovakia | 17 | 0.0% |
| Dominican Republic | 188 | 0.1% |
| Eastern Africa | 63 | 0.0% |
| Eastern Asia | 1,005 | 0.5% |
| Eastern Europe | 158 | 0.1% |
| Egypt | 37 | 0.0% |
| El Salvador | 46 | 0.0% |
| England | 41 | 0.0% |
| Ethiopia | 8 | 0.0% |
| Europe | 887 | 0.4% |
| France | 16 | 0.0% |
| Germany | 513 | 0.3% |
| Ghana | 82 | 0.0% |
| Guyana | 79 | 0.0% |
| Haiti | 135 | 0.1% |
| Honduras | 36 | 0.0% |
| Hong Kong | 14 | 0.0% |
| India | 714 | 0.4% |
| Iran | 96 | 0.1% |
| Iraq | 48 | 0.0% |
| Ireland | 32 | 0.0% |
| Israel | 7 | 0.0% |
| Italy | 7 | 0.0% |
| Jamaica | 209 | 0.1% |
| Japan | 56 | 0.0% |
| Kenya | 32 | 0.0% |
| Korea | 650 | 0.3% |
| Kuwait | 49 | 0.0% |
| Laos | 13 | 0.0% |
| Latin America | 2,545 | 1.2% |
| Lebanon | 10 | 0.0% |
| Malaysia | 7 | 0.0% |
| Mexico | 724 | 0.4% |
| Middle Africa | 3 | 0.0% |
| Moldova | 4 | 0.0% |
| Nicaragua | 9 | 0.0% |
| Nigeria | 72 | 0.0% |
| Northern Africa | 44 | 0.0% |
| Northern Europe | 166 | 0.1% |
| Oceania | 107 | 0.1% |
| Pakistan | 12 | 0.0% |
| Panama | 347 | 0.2% |
| Peru | 145 | 0.1% |
| Philippines | 516 | 0.3% |
| Poland | 28 | 0.0% |
| Romania | 7 | 0.0% |
| Russia | 64 | 0.0% |
| Saudi Arabia | 100 | 0.1% |
| Singapore | 17 | 0.0% |
| South Africa | 53 | 0.0% |
| South America | 599 | 0.3% |
| South Central Asia | 853 | 0.4% |
| South Eastern Asia | 747 | 0.4% |
| Southern Europe | 18 | 0.0% |
| Spain | 11 | 0.0% |
| Sri Lanka | 31 | 0.0% |
| Taiwan | 26 | 0.0% |
| Thailand | 21 | 0.0% |
| Trinidad and Tobago | 22 | 0.0% |
| Turkey | 39 | 0.0% |
| Uganda | 10 | 0.0% |
| Ukraine | 14 | 0.0% |
| Uruguay | 13 | 0.0% |
| Venezuela | 35 | 0.0% |
| Vietnam | 120 | 0.1% |
| West Indies | 24 | 0.0% |
| Western Africa | 192 | 0.1% |
| Western Asia | 267 | 0.1% |
| Western Europe | 545 | 0.3% | View All 88 Rows |
Sex and Age in Richmond County
Sex and Age in Richmond County
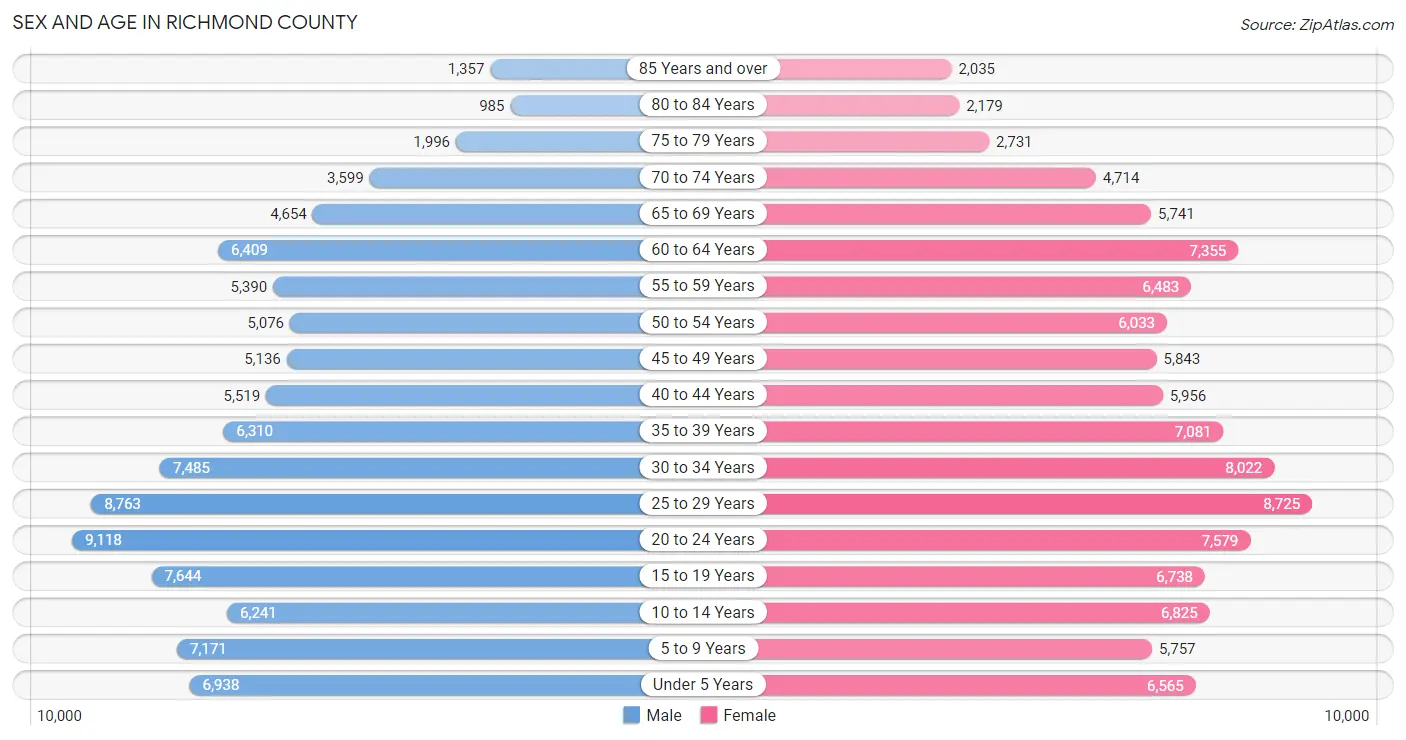
The most populous age groups in Richmond County are 20 to 24 Years (9,118 | 9.1%) for men and 25 to 29 Years (8,725 | 8.2%) for women.
| Age Bracket | Male | Female |
| Under 5 Years | 6,938 (7.0%) | 6,565 (6.2%) |
| 5 to 9 Years | 7,171 (7.2%) | 5,757 (5.4%) |
| 10 to 14 Years | 6,241 (6.2%) | 6,825 (6.4%) |
| 15 to 19 Years | 7,644 (7.7%) | 6,738 (6.3%) |
| 20 to 24 Years | 9,118 (9.1%) | 7,579 (7.1%) |
| 25 to 29 Years | 8,763 (8.8%) | 8,725 (8.2%) |
| 30 to 34 Years | 7,485 (7.5%) | 8,022 (7.5%) |
| 35 to 39 Years | 6,310 (6.3%) | 7,081 (6.7%) |
| 40 to 44 Years | 5,519 (5.5%) | 5,956 (5.6%) |
| 45 to 49 Years | 5,136 (5.1%) | 5,843 (5.5%) |
| 50 to 54 Years | 5,076 (5.1%) | 6,033 (5.7%) |
| 55 to 59 Years | 5,390 (5.4%) | 6,483 (6.1%) |
| 60 to 64 Years | 6,409 (6.4%) | 7,355 (6.9%) |
| 65 to 69 Years | 4,654 (4.7%) | 5,741 (5.4%) |
| 70 to 74 Years | 3,599 (3.6%) | 4,714 (4.4%) |
| 75 to 79 Years | 1,996 (2.0%) | 2,731 (2.6%) |
| 80 to 84 Years | 985 (1.0%) | 2,179 (2.1%) |
| 85 Years and over | 1,357 (1.4%) | 2,035 (1.9%) |
| Total | 99,791 (100.0%) | 106,362 (100.0%) |
Families and Households in Richmond County
Median Family Size in Richmond County
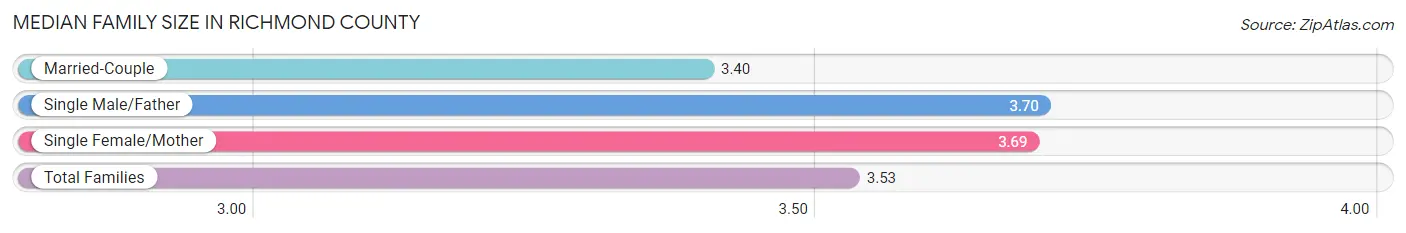
The median family size in Richmond County is 3.53 persons per family, with single male/father families (3,286 | 7.7%) accounting for the largest median family size of 3.7 persons per family. On the other hand, married-couple families (22,994 | 53.9%) represent the smallest median family size with 3.40 persons per family.
| Family Type | # Families | Family Size |
| Married-Couple | 22,994 (53.9%) | 3.40 |
| Single Male/Father | 3,286 (7.7%) | 3.70 |
| Single Female/Mother | 16,380 (38.4%) | 3.69 |
| Total Families | 42,660 (100.0%) | 3.53 |
Median Household Size in Richmond County
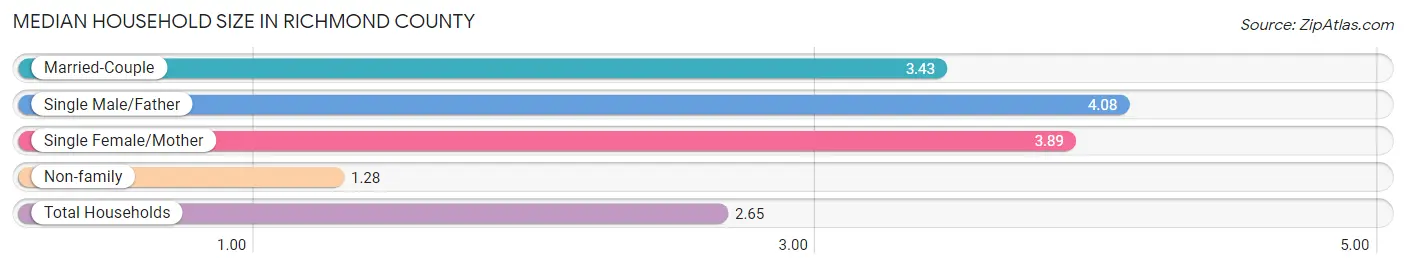
The median household size in Richmond County is 2.65 persons per household, with single male/father households (3,286 | 4.4%) accounting for the largest median household size of 4.08 persons per household. non-family households (31,368 | 42.4%) represent the smallest median household size with 1.28 persons per household.
| Household Type | # Households | Household Size |
| Married-Couple | 22,994 (31.1%) | 3.43 |
| Single Male/Father | 3,286 (4.4%) | 4.08 |
| Single Female/Mother | 16,380 (22.1%) | 3.89 |
| Non-family | 31,368 (42.4%) | 1.28 |
| Total Households | 74,028 (100.0%) | 2.65 |
Household Size by Marriage Status in Richmond County
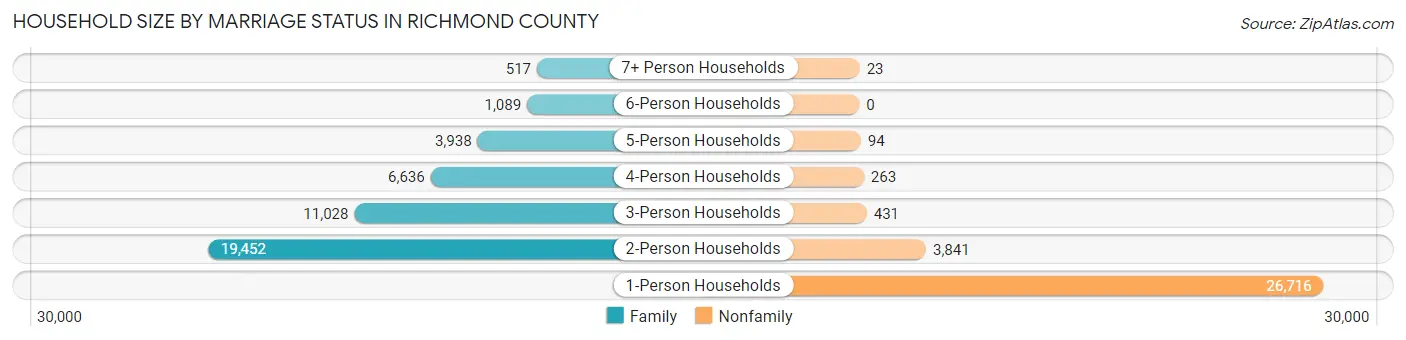
Out of a total of 74,028 households in Richmond County, 42,660 (57.6%) are family households, while 31,368 (42.4%) are nonfamily households. The most numerous type of family households are 2-person households, comprising 19,452, and the most common type of nonfamily households are 1-person households, comprising 26,716.
| Household Size | Family Households | Nonfamily Households |
| 1-Person Households | - | 26,716 (36.1%) |
| 2-Person Households | 19,452 (26.3%) | 3,841 (5.2%) |
| 3-Person Households | 11,028 (14.9%) | 431 (0.6%) |
| 4-Person Households | 6,636 (9.0%) | 263 (0.4%) |
| 5-Person Households | 3,938 (5.3%) | 94 (0.1%) |
| 6-Person Households | 1,089 (1.5%) | 0 (0.0%) |
| 7+ Person Households | 517 (0.7%) | 23 (0.0%) |
| Total | 42,660 (57.6%) | 31,368 (42.4%) |
Female Fertility in Richmond County
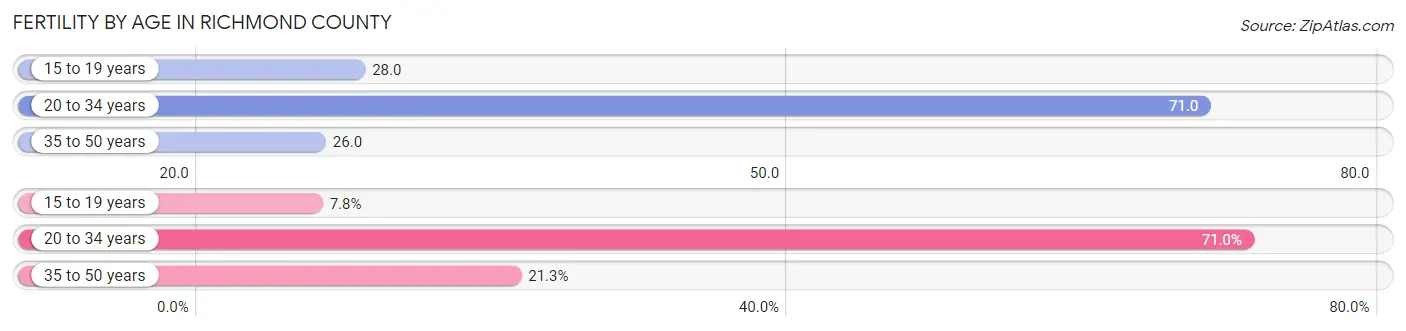
Fertility by Age in Richmond County
Average fertility rate in Richmond County is 47.0 births per 1,000 women. Women in the age bracket of 20 to 34 years have the highest fertility rate with 71.0 births per 1,000 women. Women in the age bracket of 20 to 34 years acount for 71.0% of all women with births.
| Age Bracket | Women with Births | Births / 1,000 Women |
| 15 to 19 years | 188 (7.8%) | 28.0 |
| 20 to 34 years | 1,716 (71.0%) | 71.0 |
| 35 to 50 years | 514 (21.3%) | 26.0 |
| Total | 2,418 (100.0%) | 47.0 |
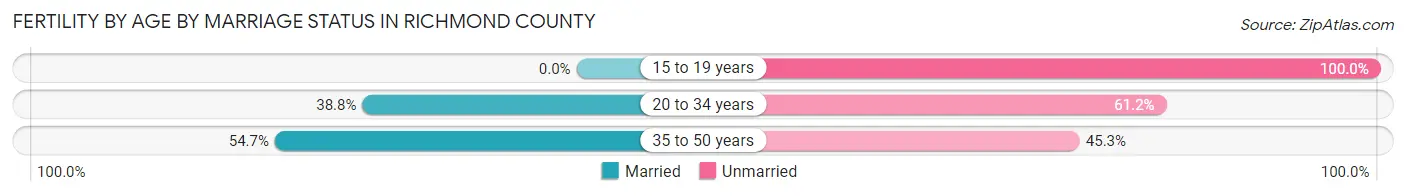
Fertility by Age by Marriage Status in Richmond County
39.2% of women with births (2,418) in Richmond County are married. The highest percentage of unmarried women with births falls into 15 to 19 years age bracket with 100.0% of them unmarried at the time of birth, while the lowest percentage of unmarried women with births belong to 35 to 50 years age bracket with 45.3% of them unmarried.
| Age Bracket | Married | Unmarried |
| 15 to 19 years | 0 (0.0%) | 188 (100.0%) |
| 20 to 34 years | 666 (38.8%) | 1,050 (61.2%) |
| 35 to 50 years | 281 (54.7%) | 233 (45.3%) |
| Total | 948 (39.2%) | 1,470 (60.8%) |
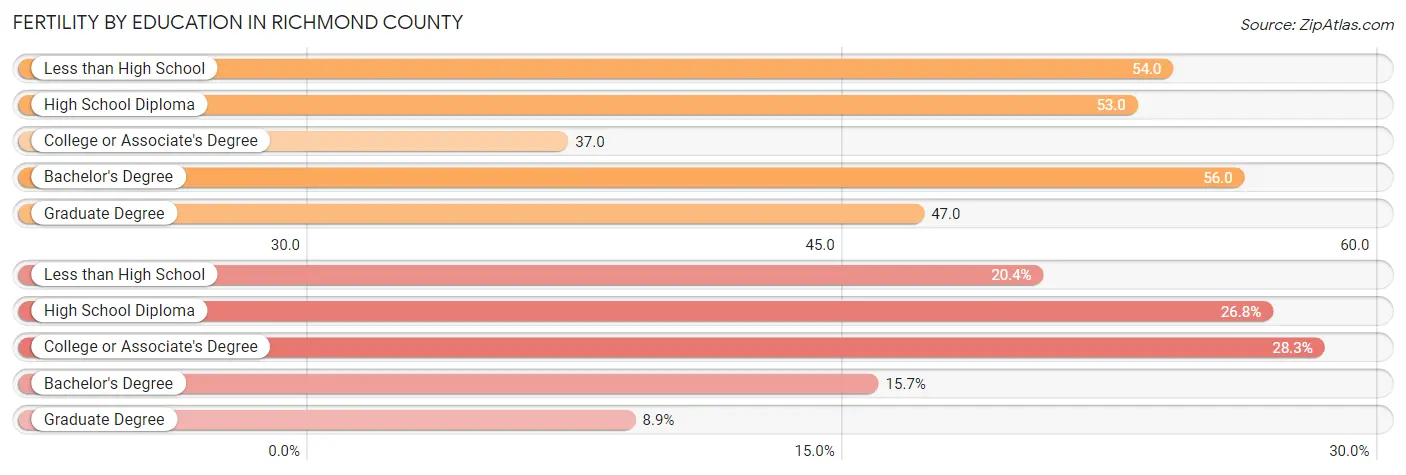
Fertility by Education in Richmond County
Average fertility rate in Richmond County is 47.0 births per 1,000 women. Women with the education attainment of bachelor's degree have the highest fertility rate of 56.0 births per 1,000 women, while women with the education attainment of college or associate's degree have the lowest fertility at 37.0 births per 1,000 women. Women with the education attainment of college or associate's degree represent 28.2% of all women with births.
| Educational Attainment | Women with Births | Births / 1,000 Women |
| Less than High School | 492 (20.3%) | 54.0 |
| High School Diploma | 648 (26.8%) | 53.0 |
| College or Associate's Degree | 683 (28.2%) | 37.0 |
| Bachelor's Degree | 380 (15.7%) | 56.0 |
| Graduate Degree | 215 (8.9%) | 47.0 |
| Total | 2,418 (100.0%) | 47.0 |
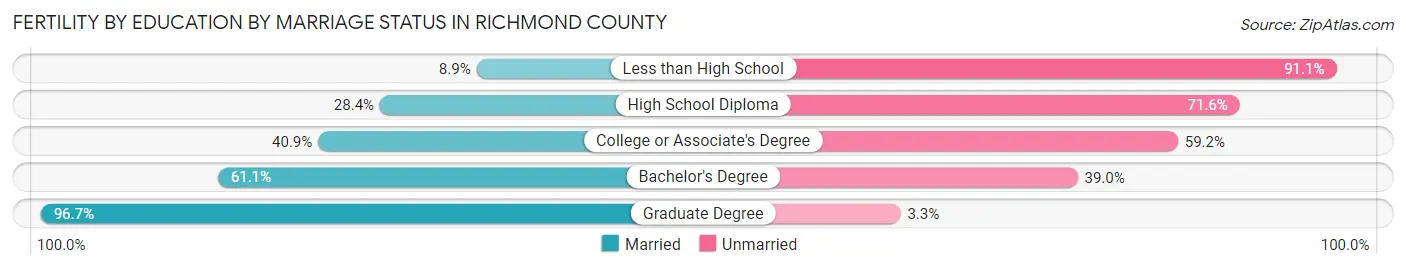
Fertility by Education by Marriage Status in Richmond County
60.8% of women with births in Richmond County are unmarried. Women with the educational attainment of graduate degree are most likely to be married with 96.7% of them married at childbirth, while women with the educational attainment of less than high school are least likely to be married with 91.1% of them unmarried at childbirth.
| Educational Attainment | Married | Unmarried |
| Less than High School | 44 (8.9%) | 448 (91.1%) |
| High School Diploma | 184 (28.4%) | 464 (71.6%) |
| College or Associate's Degree | 279 (40.8%) | 404 (59.2%) |
| Bachelor's Degree | 232 (61.1%) | 148 (39.0%) |
| Graduate Degree | 208 (96.7%) | 7 (3.3%) |
| Total | 948 (39.2%) | 1,470 (60.8%) |
Income in Richmond County
Income Overview in Richmond County
Per Capita Income in Richmond County is $28,480, while median incomes of families and households are $60,993 and $50,605 respectively.
| Characteristic | Number | Measure |
| Per Capita Income | 206,153 | $28,480 |
| Median Family Income | 42,660 | $60,993 |
| Mean Family Income | 42,660 | $84,183 |
| Median Household Income | 74,028 | $50,605 |
| Mean Household Income | 74,028 | $70,310 |
| Income Deficit | 42,660 | $12,286 |
| Wage / Income Gap (%) | 206,153 | 18.13% |
| Wage / Income Gap ($) | 206,153 | 81.87¢ per $1 |
| Gini / Inequality Index | 206,153 | 0.49 |
Earnings by Sex in Richmond County
Average Earnings in Richmond County are $30,866, $34,204 for men and $28,003 for women, a difference of 18.1%.
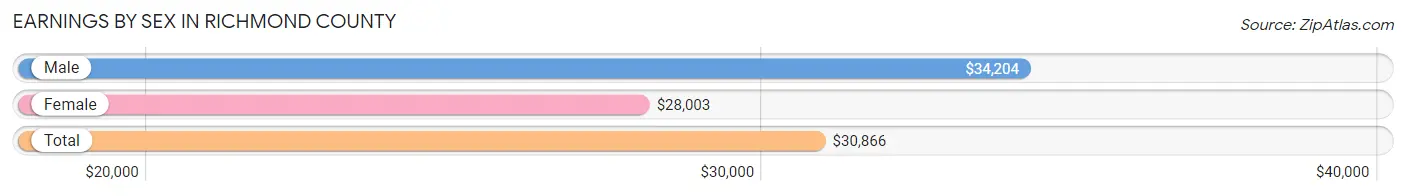
| Sex | Number | Average Earnings |
| Male | 51,707 (50.5%) | $34,204 |
| Female | 50,762 (49.5%) | $28,003 |
| Total | 102,469 (100.0%) | $30,866 |
Earnings by Sex by Income Bracket in Richmond County
The most common earnings brackets in Richmond County are $100,000+ for men (4,962 | 9.6%) and $25,000 to $29,999 for women (4,739 | 9.3%).
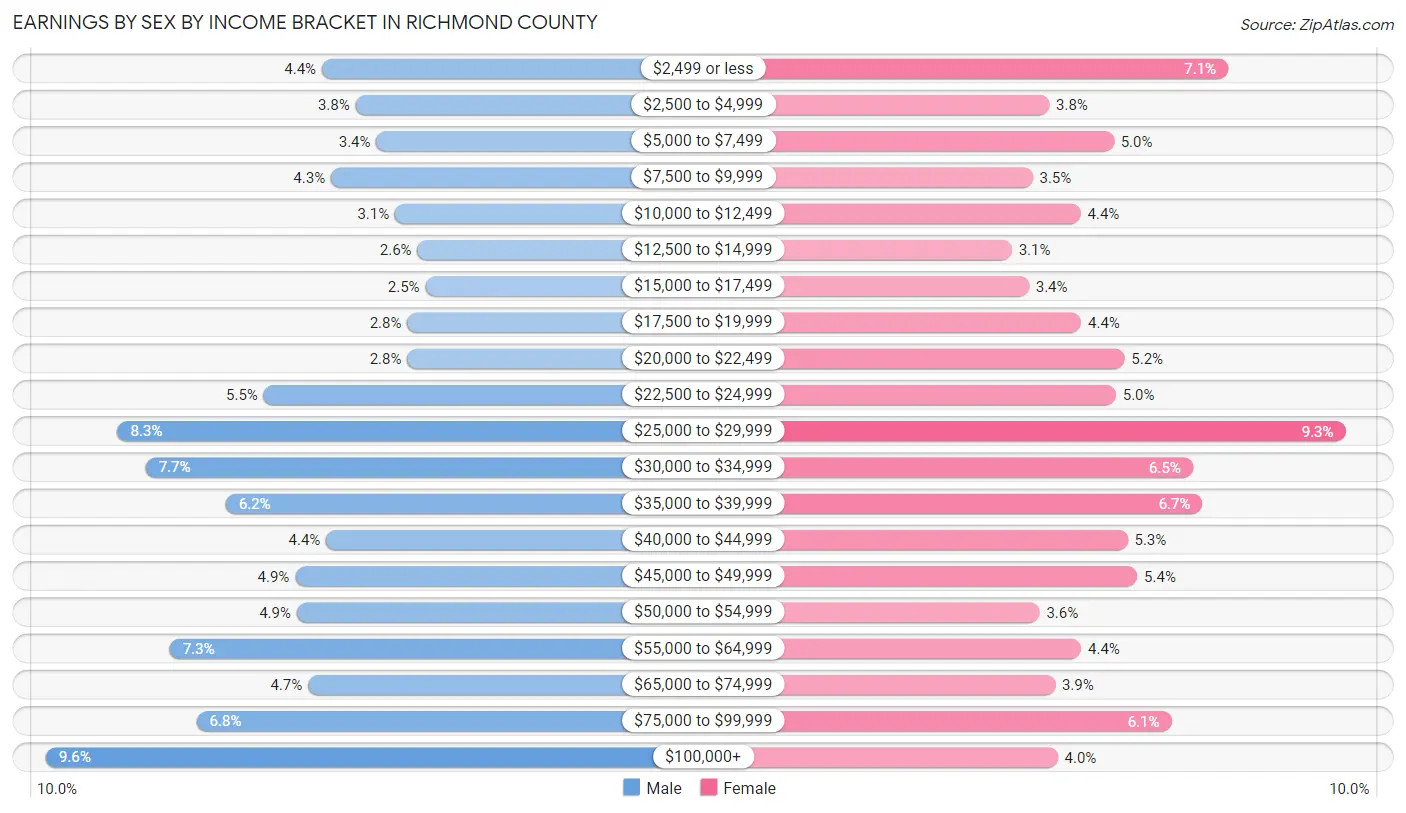
| Income | Male | Female |
| $2,499 or less | 2,292 (4.4%) | 3,624 (7.1%) |
| $2,500 to $4,999 | 1,963 (3.8%) | 1,922 (3.8%) |
| $5,000 to $7,499 | 1,763 (3.4%) | 2,537 (5.0%) |
| $7,500 to $9,999 | 2,205 (4.3%) | 1,766 (3.5%) |
| $10,000 to $12,499 | 1,584 (3.1%) | 2,223 (4.4%) |
| $12,500 to $14,999 | 1,365 (2.6%) | 1,567 (3.1%) |
| $15,000 to $17,499 | 1,289 (2.5%) | 1,729 (3.4%) |
| $17,500 to $19,999 | 1,462 (2.8%) | 2,229 (4.4%) |
| $20,000 to $22,499 | 1,461 (2.8%) | 2,638 (5.2%) |
| $22,500 to $24,999 | 2,856 (5.5%) | 2,557 (5.0%) |
| $25,000 to $29,999 | 4,271 (8.3%) | 4,739 (9.3%) |
| $30,000 to $34,999 | 3,995 (7.7%) | 3,288 (6.5%) |
| $35,000 to $39,999 | 3,221 (6.2%) | 3,380 (6.7%) |
| $40,000 to $44,999 | 2,247 (4.3%) | 2,671 (5.3%) |
| $45,000 to $49,999 | 2,547 (4.9%) | 2,762 (5.4%) |
| $50,000 to $54,999 | 2,534 (4.9%) | 1,831 (3.6%) |
| $55,000 to $64,999 | 3,762 (7.3%) | 2,229 (4.4%) |
| $65,000 to $74,999 | 2,424 (4.7%) | 1,978 (3.9%) |
| $75,000 to $99,999 | 3,504 (6.8%) | 3,088 (6.1%) |
| $100,000+ | 4,962 (9.6%) | 2,004 (4.0%) |
| Total | 51,707 (100.0%) | 50,762 (100.0%) |
Earnings by Sex by Educational Attainment in Richmond County
Average earnings in Richmond County are $39,841 for men and $32,129 for women, a difference of 19.4%. Men with an educational attainment of graduate degree enjoy the highest average annual earnings of $78,599, while those with less than high school education earn the least with $27,594. Women with an educational attainment of graduate degree earn the most with the average annual earnings of $56,623, while those with less than high school education have the smallest earnings of $15,631.
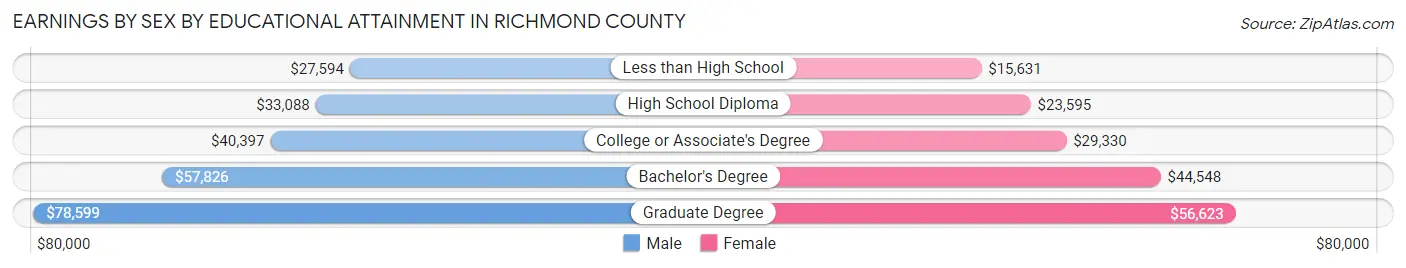
| Educational Attainment | Male Income | Female Income |
| Less than High School | $27,594 | $15,631 |
| High School Diploma | $33,088 | $23,595 |
| College or Associate's Degree | $40,397 | $29,330 |
| Bachelor's Degree | $57,826 | $44,548 |
| Graduate Degree | $78,599 | $56,623 |
| Total | $39,841 | $32,129 |
Family Income in Richmond County
Family Income Brackets in Richmond County
According to the Richmond County family income data, there are 7,807 families falling into the $50,000 to $74,999 income range, which is the most common income bracket and makes up 18.3% of all families. Conversely, the $10,000 to $14,999 income bracket is the least frequent group with only 1,450 families (3.4%) belonging to this category.
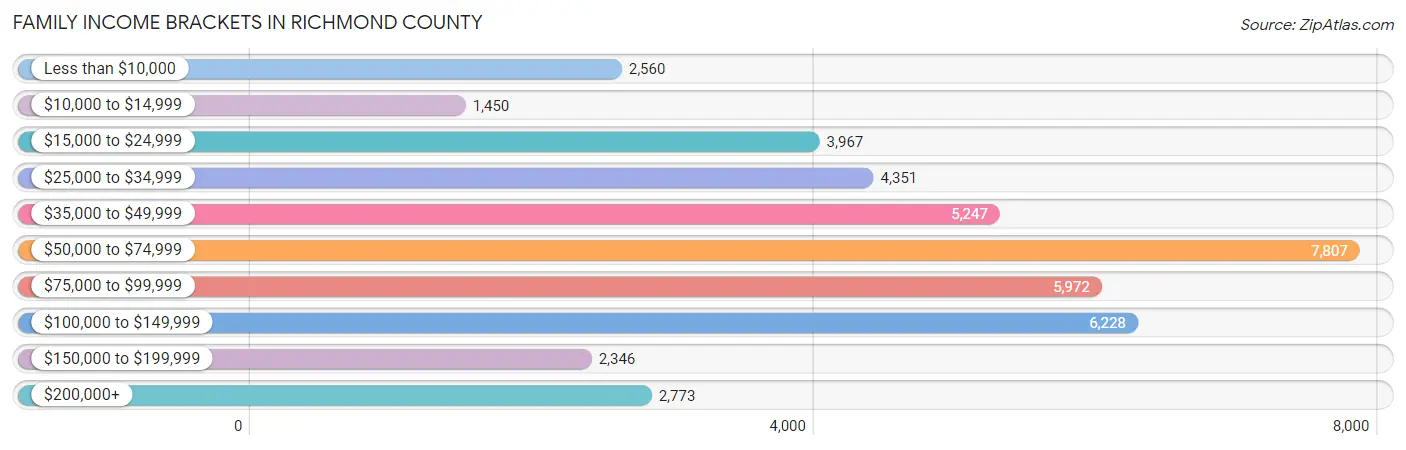
| Income Bracket | # Families | % Families |
| Less than $10,000 | 2,560 | 6.0% |
| $10,000 to $14,999 | 1,450 | 3.4% |
| $15,000 to $24,999 | 3,967 | 9.3% |
| $25,000 to $34,999 | 4,351 | 10.2% |
| $35,000 to $49,999 | 5,247 | 12.3% |
| $50,000 to $74,999 | 7,807 | 18.3% |
| $75,000 to $99,999 | 5,972 | 14.0% |
| $100,000 to $149,999 | 6,228 | 14.6% |
| $150,000 to $199,999 | 2,346 | 5.5% |
| $200,000+ | 2,773 | 6.5% |
Family Income by Famaliy Size in Richmond County
7+ person families (339 | 0.8%) account for the highest median family income in Richmond County with $125,293 per family, while 2-person families (21,127 | 49.5%) have the highest median income of $29,255 per family member.
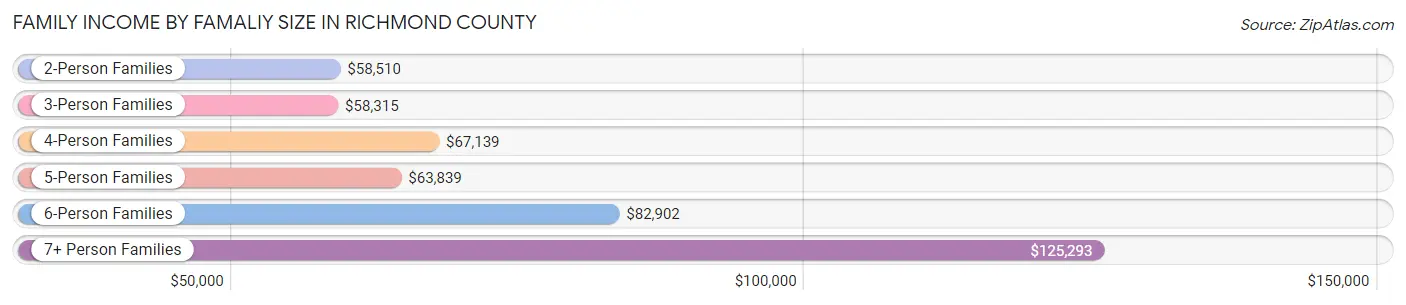
| Income Bracket | # Families | Median Income |
| 2-Person Families | 21,127 (49.5%) | $58,510 |
| 3-Person Families | 10,294 (24.1%) | $58,315 |
| 4-Person Families | 6,456 (15.1%) | $67,139 |
| 5-Person Families | 3,479 (8.2%) | $63,839 |
| 6-Person Families | 965 (2.3%) | $82,902 |
| 7+ Person Families | 339 (0.8%) | $125,293 |
| Total | 42,660 (100.0%) | $60,993 |
Family Income by Number of Earners in Richmond County
The median family income in Richmond County is $60,993, with families comprising 3+ earners (3,526) having the highest median family income of $131,357, while families with no earners (6,484) have the lowest median family income of $37,273, accounting for 8.3% and 15.2% of families, respectively.
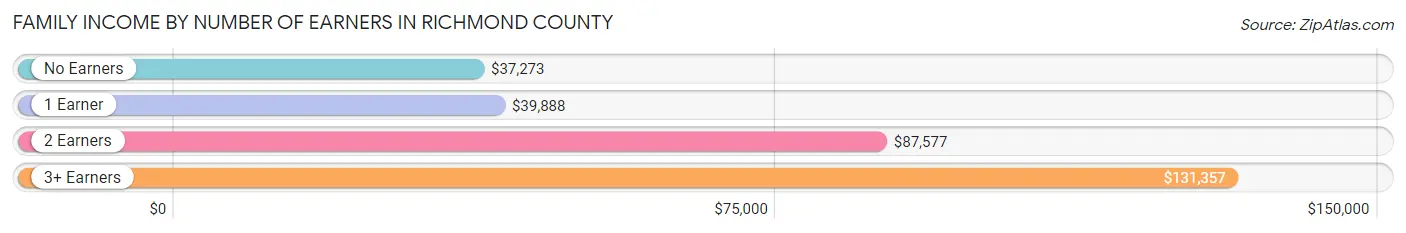
| Number of Earners | # Families | Median Income |
| No Earners | 6,484 (15.2%) | $37,273 |
| 1 Earner | 18,700 (43.8%) | $39,888 |
| 2 Earners | 13,950 (32.7%) | $87,577 |
| 3+ Earners | 3,526 (8.3%) | $131,357 |
| Total | 42,660 (100.0%) | $60,993 |
Household Income in Richmond County
Household Income Brackets in Richmond County
With 12,733 households falling in the category, the $50,000 to $74,999 income range is the most frequent in Richmond County, accounting for 17.2% of all households. In contrast, only 2,961 households (4.0%) fall into the $150,000 to $199,999 income bracket, making it the least populous group.
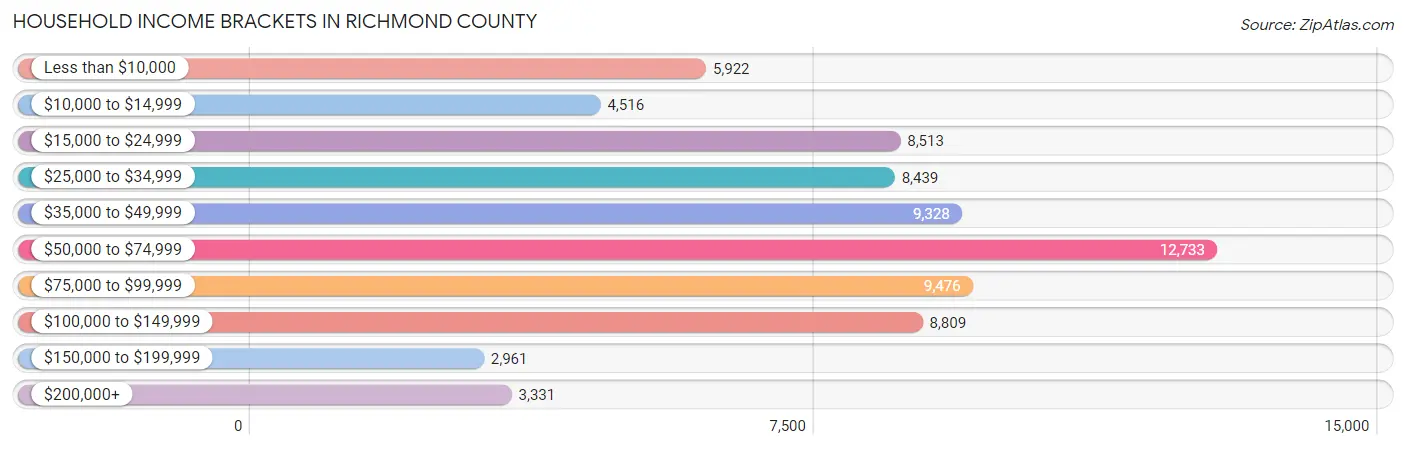
| Income Bracket | # Households | % Households |
| Less than $10,000 | 5,922 | 8.0% |
| $10,000 to $14,999 | 4,516 | 6.1% |
| $15,000 to $24,999 | 8,513 | 11.5% |
| $25,000 to $34,999 | 8,439 | 11.4% |
| $35,000 to $49,999 | 9,328 | 12.6% |
| $50,000 to $74,999 | 12,733 | 17.2% |
| $75,000 to $99,999 | 9,476 | 12.8% |
| $100,000 to $149,999 | 8,809 | 11.9% |
| $150,000 to $199,999 | 2,961 | 4.0% |
| $200,000+ | 3,331 | 4.5% |
Household Income by Householder Age in Richmond County
The median household income in Richmond County is $50,605, with the highest median household income of $59,536 found in the 45 to 64 years age bracket for the primary householder. A total of 26,070 households (35.2%) fall into this category. Meanwhile, the 15 to 24 years age bracket for the primary householder has the lowest median household income of $31,208, with 2,755 households (3.7%) in this group.
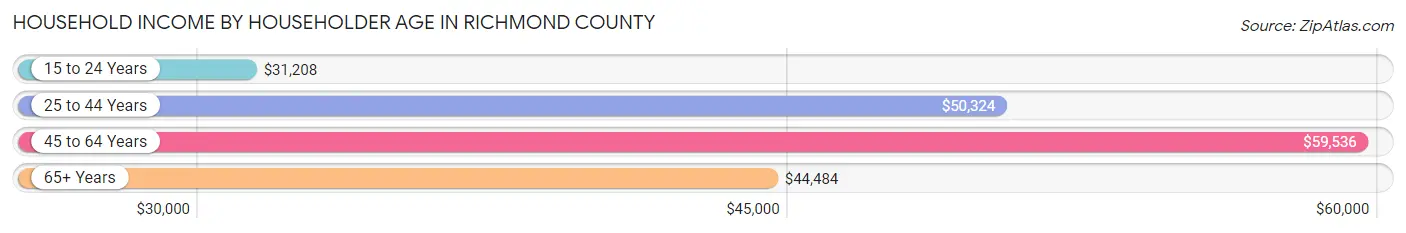
| Income Bracket | # Households | Median Income |
| 15 to 24 Years | 2,755 (3.7%) | $31,208 |
| 25 to 44 Years | 25,524 (34.5%) | $50,324 |
| 45 to 64 Years | 26,070 (35.2%) | $59,536 |
| 65+ Years | 19,679 (26.6%) | $44,484 |
| Total | 74,028 (100.0%) | $50,605 |
Poverty in Richmond County
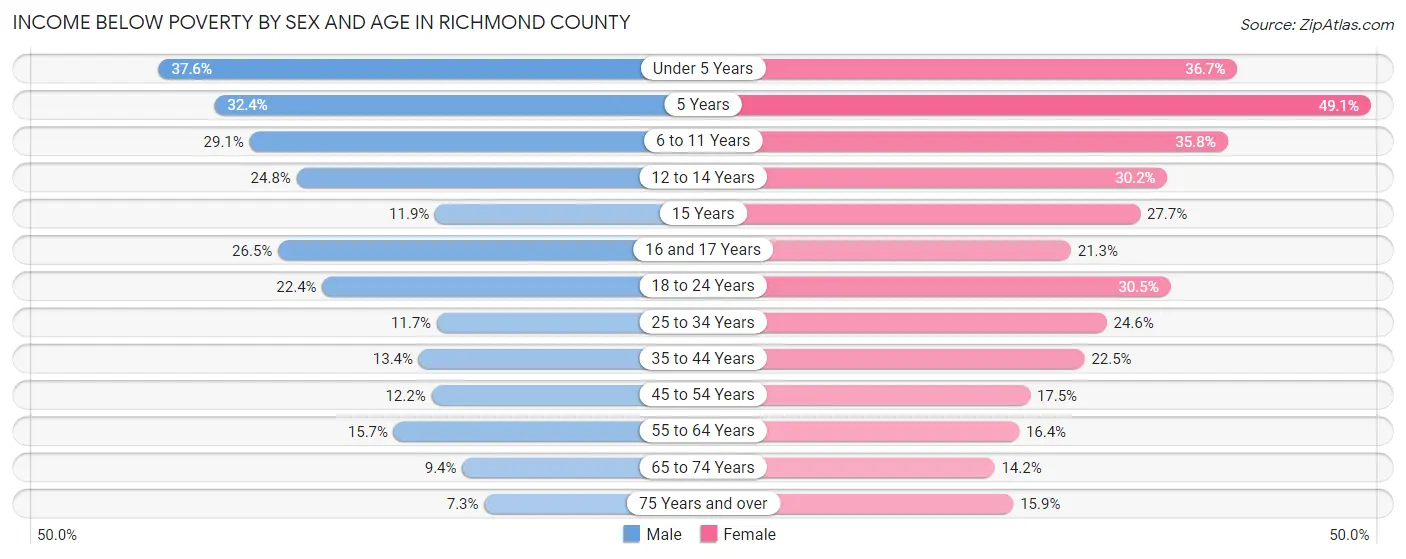
Income Below Poverty by Sex and Age in Richmond County
With 17.8% poverty level for males and 23.3% for females among the residents of Richmond County, under 5 year old males and 5 year old females are the most vulnerable to poverty, with 2,540 males (37.6%) and 512 females (49.1%) in their respective age groups living below the poverty level.
| Age Bracket | Male | Female |
| Under 5 Years | 2,540 (37.6%) | 2,395 (36.7%) |
| 5 Years | 339 (32.4%) | 512 (49.1%) |
| 6 to 11 Years | 2,462 (29.1%) | 2,606 (35.8%) |
| 12 to 14 Years | 927 (24.7%) | 1,173 (30.2%) |
| 15 Years | 191 (11.9%) | 320 (27.7%) |
| 16 and 17 Years | 604 (26.5%) | 541 (21.2%) |
| 18 to 24 Years | 2,103 (22.4%) | 2,858 (30.5%) |
| 25 to 34 Years | 1,715 (11.7%) | 4,032 (24.6%) |
| 35 to 44 Years | 1,500 (13.4%) | 2,917 (22.5%) |
| 45 to 54 Years | 1,211 (12.2%) | 2,068 (17.5%) |
| 55 to 64 Years | 1,785 (15.7%) | 2,259 (16.4%) |
| 65 to 74 Years | 746 (9.4%) | 1,453 (14.2%) |
| 75 Years and over | 296 (7.3%) | 1,053 (15.9%) |
| Total | 16,419 (17.8%) | 24,187 (23.3%) |
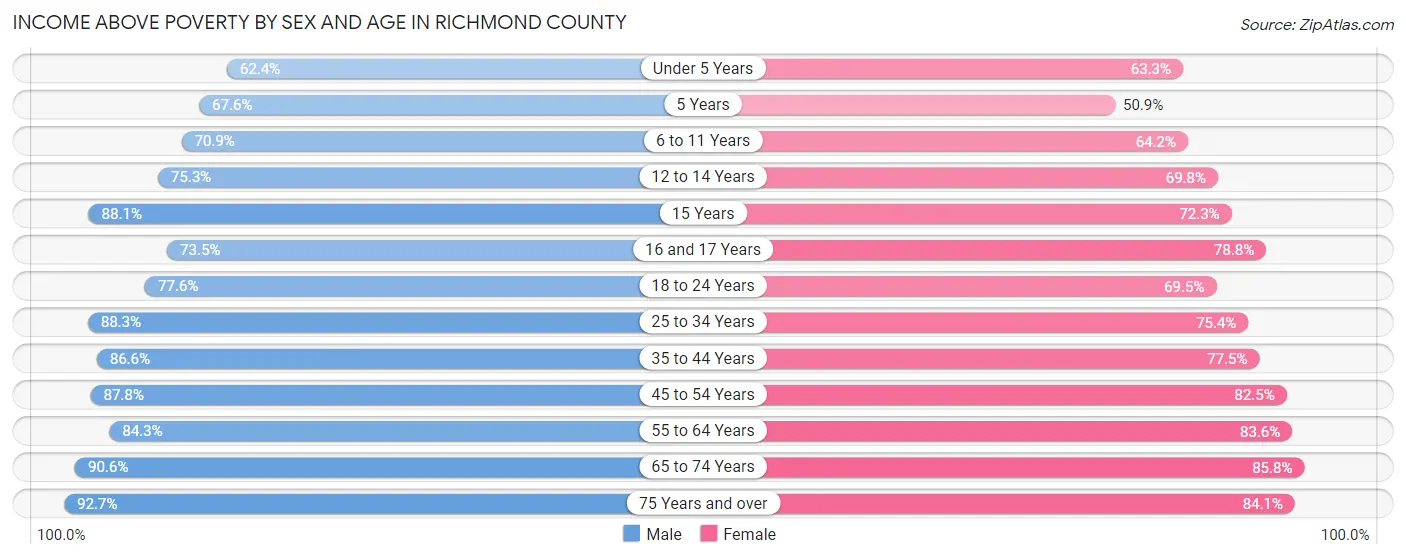
Income Above Poverty by Sex and Age in Richmond County
According to the poverty statistics in Richmond County, males aged 75 years and over and females aged 65 to 74 years are the age groups that are most secure financially, with 92.7% of males and 85.8% of females in these age groups living above the poverty line.
| Age Bracket | Male | Female |
| Under 5 Years | 4,223 (62.4%) | 4,130 (63.3%) |
| 5 Years | 708 (67.6%) | 531 (50.9%) |
| 6 to 11 Years | 5,994 (70.9%) | 4,676 (64.2%) |
| 12 to 14 Years | 2,818 (75.2%) | 2,708 (69.8%) |
| 15 Years | 1,414 (88.1%) | 836 (72.3%) |
| 16 and 17 Years | 1,678 (73.5%) | 2,005 (78.7%) |
| 18 to 24 Years | 7,302 (77.6%) | 6,511 (69.5%) |
| 25 to 34 Years | 12,909 (88.3%) | 12,380 (75.4%) |
| 35 to 44 Years | 9,688 (86.6%) | 10,038 (77.5%) |
| 45 to 54 Years | 8,684 (87.8%) | 9,777 (82.5%) |
| 55 to 64 Years | 9,564 (84.3%) | 11,482 (83.6%) |
| 65 to 74 Years | 7,212 (90.6%) | 8,801 (85.8%) |
| 75 Years and over | 3,743 (92.7%) | 5,566 (84.1%) |
| Total | 75,937 (82.2%) | 79,441 (76.7%) |
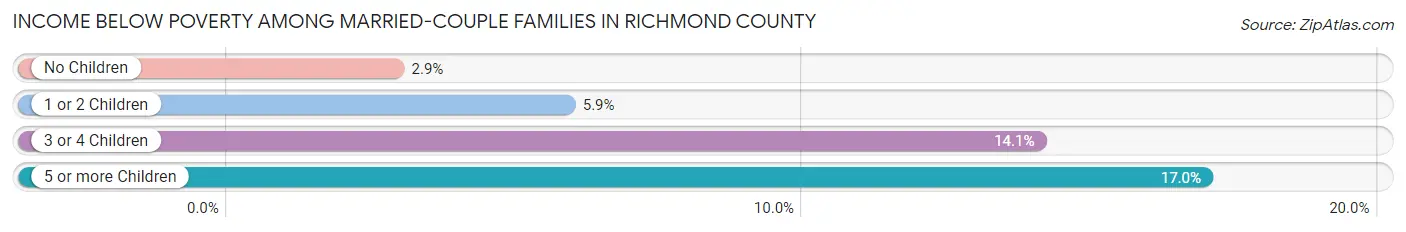
Income Below Poverty Among Married-Couple Families in Richmond County
The poverty statistics for married-couple families in Richmond County show that 4.5% or 1,047 of the total 22,994 families live below the poverty line. Families with 5 or more children have the highest poverty rate of 17.0%, comprising of 28 families. On the other hand, families with no children have the lowest poverty rate of 2.9%, which includes 437 families.
| Children | Above Poverty | Below Poverty |
| No Children | 14,611 (97.1%) | 437 (2.9%) |
| 1 or 2 Children | 5,892 (94.1%) | 368 (5.9%) |
| 3 or 4 Children | 1,307 (85.9%) | 214 (14.1%) |
| 5 or more Children | 137 (83.0%) | 28 (17.0%) |
| Total | 21,947 (95.5%) | 1,047 (4.5%) |
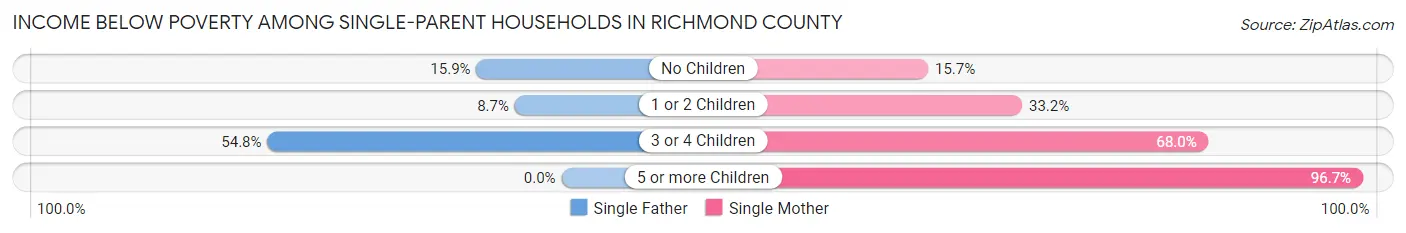
Income Below Poverty Among Single-Parent Households in Richmond County
According to the poverty data in Richmond County, 16.1% or 529 single-father households and 33.2% or 5,435 single-mother households are living below the poverty line. Among single-father households, those with 3 or 4 children have the highest poverty rate, with 126 households (54.8%) experiencing poverty. Likewise, among single-mother households, those with 5 or more children have the highest poverty rate, with 206 households (96.7%) falling below the poverty line.
| Children | Single Father | Single Mother |
| No Children | 304 (15.9%) | 848 (15.7%) |
| 1 or 2 Children | 99 (8.7%) | 2,812 (33.2%) |
| 3 or 4 Children | 126 (54.8%) | 1,569 (67.9%) |
| 5 or more Children | 0 (0.0%) | 206 (96.7%) |
| Total | 529 (16.1%) | 5,435 (33.2%) |
Income Below Poverty Among Married-Couple vs Single-Parent Households in Richmond County
The poverty data for Richmond County shows that 1,047 of the married-couple family households (4.5%) and 5,964 of the single-parent households (30.3%) are living below the poverty level. Within the married-couple family households, those with 5 or more children have the highest poverty rate, with 28 households (17.0%) falling below the poverty line. Among the single-parent households, those with 5 or more children have the highest poverty rate, with 206 household (96.7%) living below poverty.
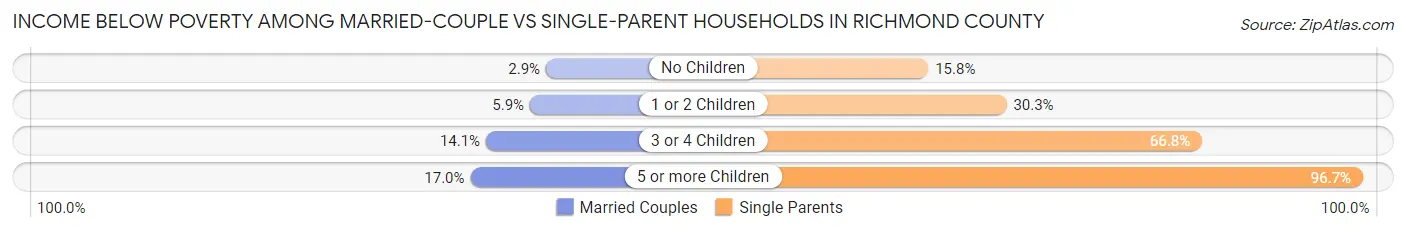
| Children | Married-Couple Families | Single-Parent Households |
| No Children | 437 (2.9%) | 1,152 (15.8%) |
| 1 or 2 Children | 368 (5.9%) | 2,911 (30.3%) |
| 3 or 4 Children | 214 (14.1%) | 1,695 (66.8%) |
| 5 or more Children | 28 (17.0%) | 206 (96.7%) |
| Total | 1,047 (4.5%) | 5,964 (30.3%) |
Employment Characteristics in Richmond County
Employment by Class of Employer in Richmond County
Among the 91,150 employed individuals in Richmond County, private company employees (58,526 | 64.2%), federal government employees (11,959 | 13.1%), and state government employees (6,014 | 6.6%) make up the most common classes of employment.
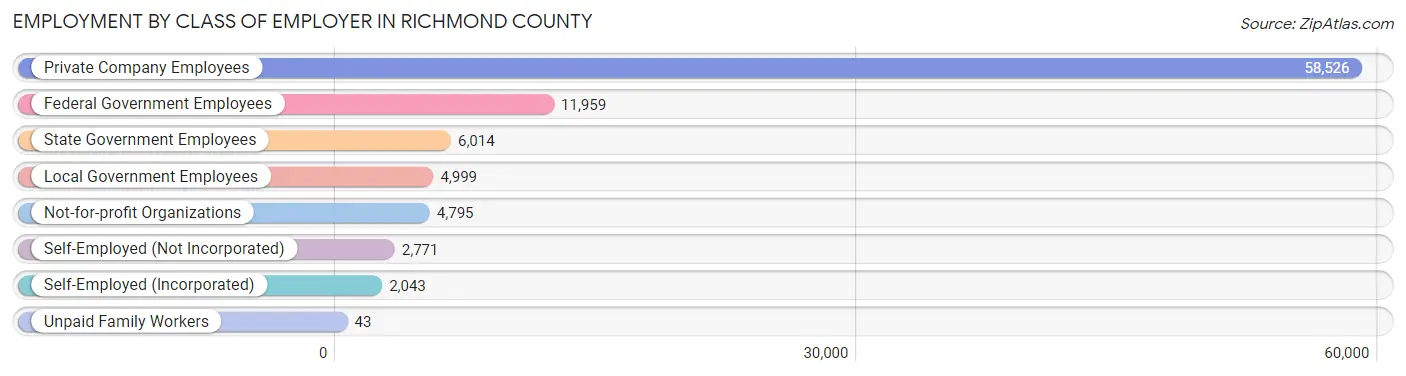
| Employer Class | # Employees | % Employees |
| Private Company Employees | 58,526 | 64.2% |
| Self-Employed (Incorporated) | 2,043 | 2.2% |
| Self-Employed (Not Incorporated) | 2,771 | 3.0% |
| Not-for-profit Organizations | 4,795 | 5.3% |
| Local Government Employees | 4,999 | 5.5% |
| State Government Employees | 6,014 | 6.6% |
| Federal Government Employees | 11,959 | 13.1% |
| Unpaid Family Workers | 43 | 0.1% |
| Total | 91,150 | 100.0% |
Employment Status by Age in Richmond County
According to the labor force statistics for Richmond County, out of the total population over 16 years of age (163,866), 61.9% or 101,433 individuals are in the labor force, with 8.3% or 8,419 of them unemployed. The age group with the highest labor force participation rate is 25 to 29 years, with 85.4% or 14,935 individuals in the labor force. Within the labor force, the 20 to 24 years age range has the highest percentage of unemployed individuals, with 13.4% or 1,734 of them being unemployed.
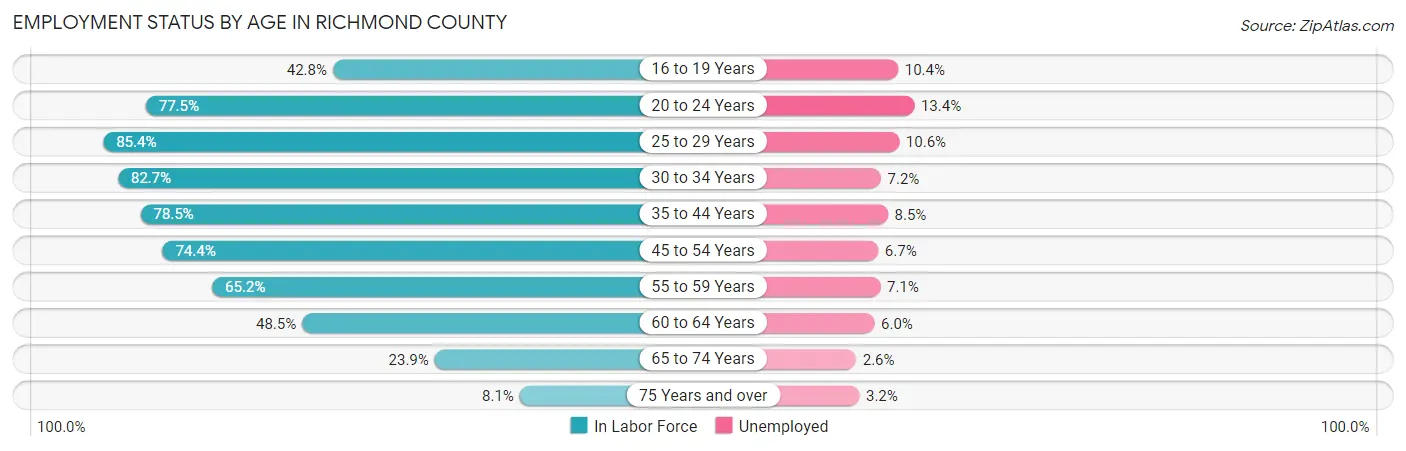
| Age Bracket | In Labor Force | Unemployed |
| 16 to 19 Years | 4,961 (42.8%) | 516 (10.4%) |
| 20 to 24 Years | 12,940 (77.5%) | 1,734 (13.4%) |
| 25 to 29 Years | 14,935 (85.4%) | 1,583 (10.6%) |
| 30 to 34 Years | 12,824 (82.7%) | 923 (7.2%) |
| 35 to 44 Years | 19,520 (78.5%) | 1,659 (8.5%) |
| 45 to 54 Years | 16,433 (74.4%) | 1,101 (6.7%) |
| 55 to 59 Years | 7,741 (65.2%) | 550 (7.1%) |
| 60 to 64 Years | 6,676 (48.5%) | 401 (6.0%) |
| 65 to 74 Years | 4,471 (23.9%) | 116 (2.6%) |
| 75 Years and over | 914 (8.1%) | 29 (3.2%) |
| Total | 101,433 (61.9%) | 8,419 (8.3%) |
Employment Status by Educational Attainment in Richmond County
According to labor force statistics for Richmond County, 74.0% of individuals (78,134) out of the total population between 25 and 64 years of age (105,586) are in the labor force, with 7.9% or 6,173 of them being unemployed. The group with the highest labor force participation rate are those with the educational attainment of bachelor's degree or higher, with 86.9% or 21,973 individuals in the labor force. Within the labor force, individuals with less than high school education have the highest percentage of unemployment, with 11.6% or 644 of them being unemployed.
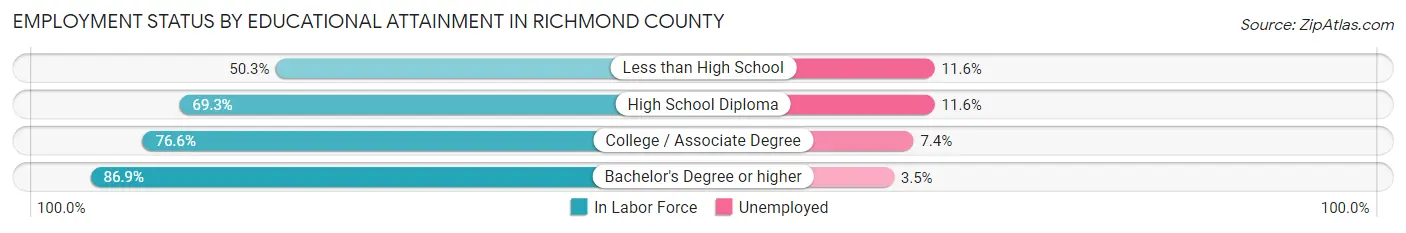
| Educational Attainment | In Labor Force | Unemployed |
| Less than High School | 5,555 (50.3%) | 1,281 (11.6%) |
| High School Diploma | 23,124 (69.3%) | 3,871 (11.6%) |
| College / Associate Degree | 27,491 (76.6%) | 2,656 (7.4%) |
| Bachelor's Degree or higher | 21,973 (86.9%) | 885 (3.5%) |
| Total | 78,134 (74.0%) | 8,341 (7.9%) |
Employment Occupations by Sex in Richmond County
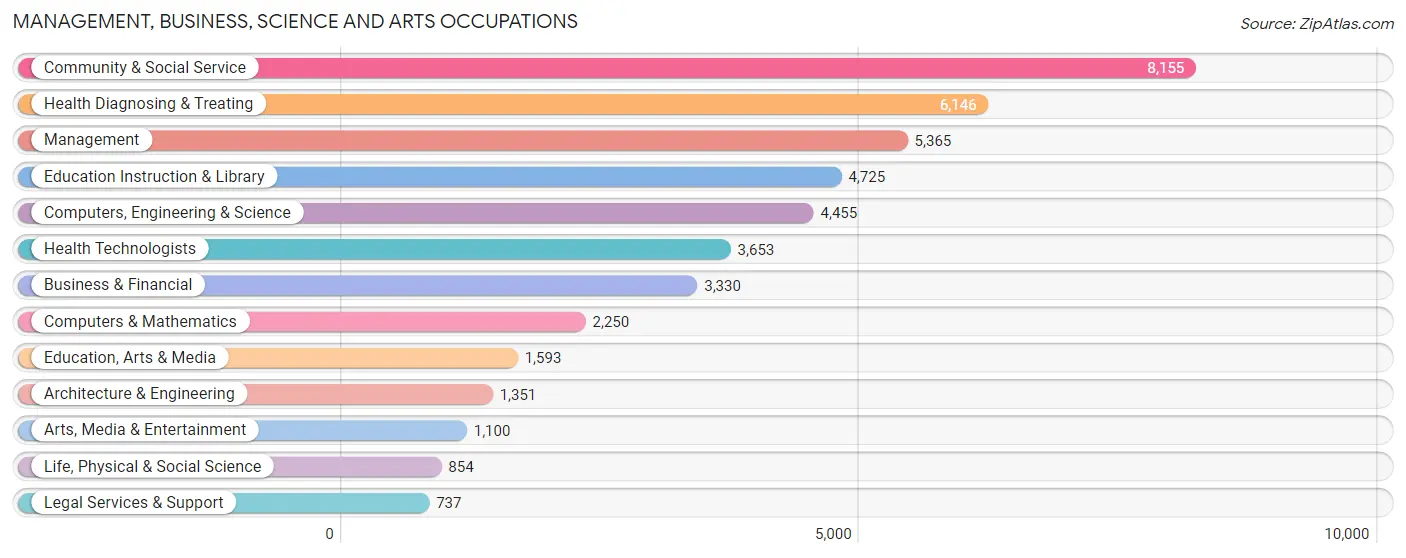
Management, Business, Science and Arts Occupations
The most common Management, Business, Science and Arts occupations in Richmond County are Community & Social Service (8,155 | 9.4%), Health Diagnosing & Treating (6,146 | 7.1%), Management (5,365 | 6.2%), Education Instruction & Library (4,725 | 5.4%), and Computers, Engineering & Science (4,455 | 5.1%).
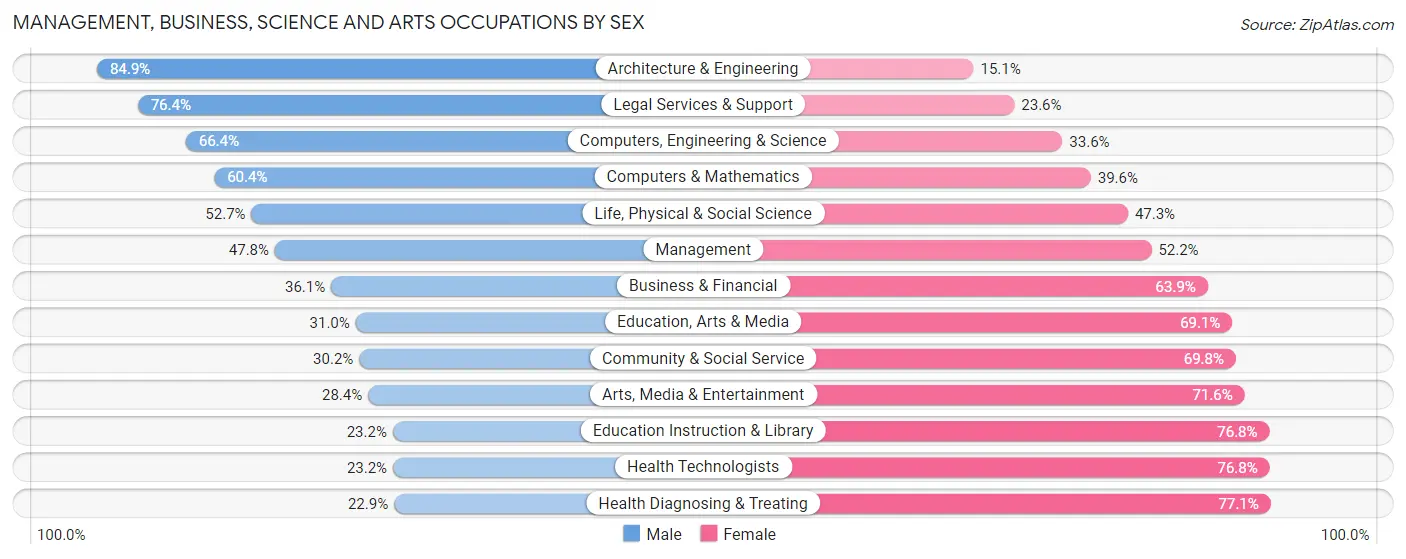
Management, Business, Science and Arts Occupations by Sex
Within the Management, Business, Science and Arts occupations in Richmond County, the most male-oriented occupations are Architecture & Engineering (84.9%), Legal Services & Support (76.4%), and Computers, Engineering & Science (66.4%), while the most female-oriented occupations are Health Diagnosing & Treating (77.1%), Health Technologists (76.8%), and Education Instruction & Library (76.8%).
| Occupation | Male | Female |
| Management | 2,564 (47.8%) | 2,801 (52.2%) |
| Business & Financial | 1,201 (36.1%) | 2,129 (63.9%) |
| Computers, Engineering & Science | 2,957 (66.4%) | 1,498 (33.6%) |
| Computers & Mathematics | 1,360 (60.4%) | 890 (39.6%) |
| Architecture & Engineering | 1,147 (84.9%) | 204 (15.1%) |
| Life, Physical & Social Science | 450 (52.7%) | 404 (47.3%) |
| Community & Social Service | 2,464 (30.2%) | 5,691 (69.8%) |
| Education, Arts & Media | 493 (30.9%) | 1,100 (69.1%) |
| Legal Services & Support | 563 (76.4%) | 174 (23.6%) |
| Education Instruction & Library | 1,096 (23.2%) | 3,629 (76.8%) |
| Arts, Media & Entertainment | 312 (28.4%) | 788 (71.6%) |
| Health Diagnosing & Treating | 1,410 (22.9%) | 4,736 (77.1%) |
| Health Technologists | 846 (23.2%) | 2,807 (76.8%) |
| Total (Category) | 10,596 (38.6%) | 16,855 (61.4%) |
| Total (Overall) | 41,860 (48.3%) | 44,772 (51.7%) |
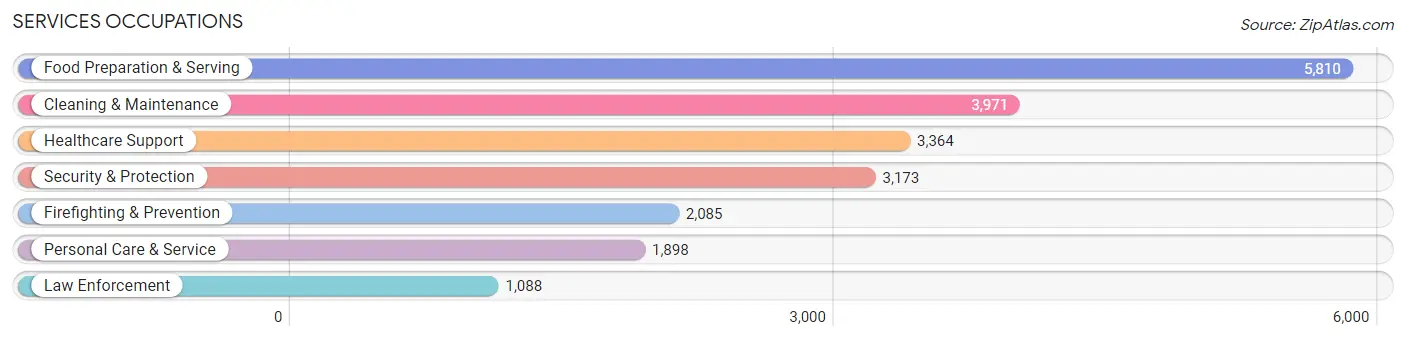
Services Occupations
The most common Services occupations in Richmond County are Food Preparation & Serving (5,810 | 6.7%), Cleaning & Maintenance (3,971 | 4.6%), Healthcare Support (3,364 | 3.9%), Security & Protection (3,173 | 3.7%), and Firefighting & Prevention (2,085 | 2.4%).
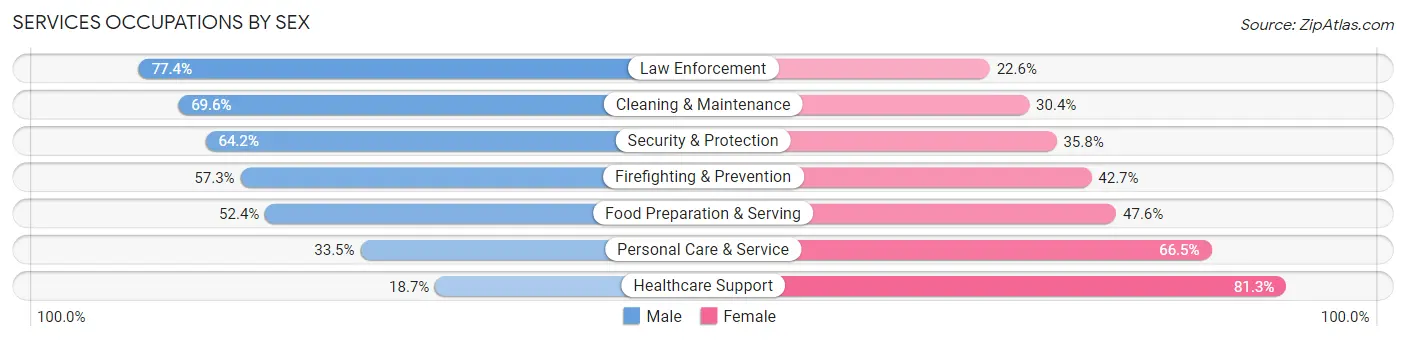
Services Occupations by Sex
Within the Services occupations in Richmond County, the most male-oriented occupations are Law Enforcement (77.4%), Cleaning & Maintenance (69.6%), and Security & Protection (64.2%), while the most female-oriented occupations are Healthcare Support (81.3%), Personal Care & Service (66.5%), and Food Preparation & Serving (47.6%).
| Occupation | Male | Female |
| Healthcare Support | 629 (18.7%) | 2,735 (81.3%) |
| Security & Protection | 2,036 (64.2%) | 1,137 (35.8%) |
| Firefighting & Prevention | 1,194 (57.3%) | 891 (42.7%) |
| Law Enforcement | 842 (77.4%) | 246 (22.6%) |
| Food Preparation & Serving | 3,042 (52.4%) | 2,768 (47.6%) |
| Cleaning & Maintenance | 2,763 (69.6%) | 1,208 (30.4%) |
| Personal Care & Service | 636 (33.5%) | 1,262 (66.5%) |
| Total (Category) | 9,106 (50.0%) | 9,110 (50.0%) |
| Total (Overall) | 41,860 (48.3%) | 44,772 (51.7%) |
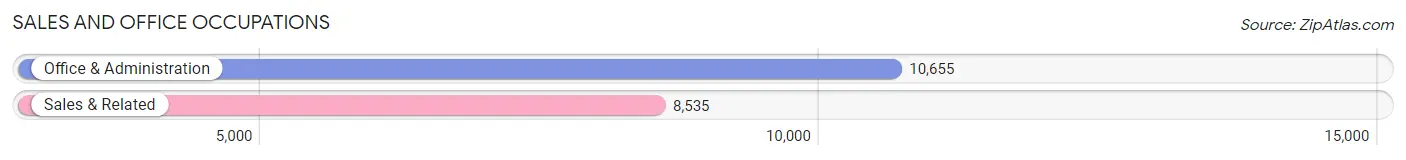
Sales and Office Occupations
The most common Sales and Office occupations in Richmond County are Office & Administration (10,655 | 12.3%), and Sales & Related (8,535 | 9.9%).
Sales and Office Occupations by Sex
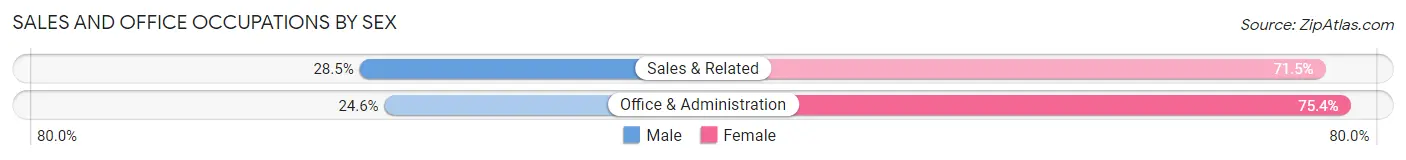
| Occupation | Male | Female |
| Sales & Related | 2,431 (28.5%) | 6,104 (71.5%) |
| Office & Administration | 2,625 (24.6%) | 8,030 (75.4%) |
| Total (Category) | 5,056 (26.4%) | 14,134 (73.7%) |
| Total (Overall) | 41,860 (48.3%) | 44,772 (51.7%) |
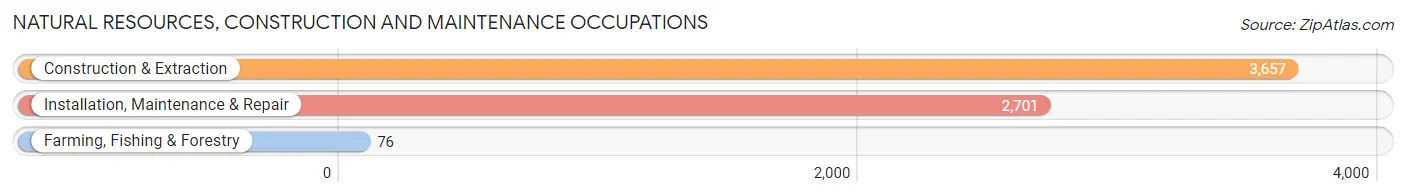
Natural Resources, Construction and Maintenance Occupations
The most common Natural Resources, Construction and Maintenance occupations in Richmond County are Construction & Extraction (3,657 | 4.2%), Installation, Maintenance & Repair (2,701 | 3.1%), and Farming, Fishing & Forestry (76 | 0.1%).
Natural Resources, Construction and Maintenance Occupations by Sex
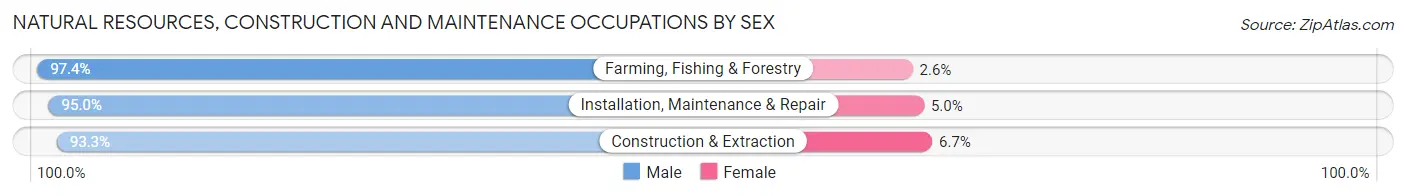
| Occupation | Male | Female |
| Farming, Fishing & Forestry | 74 (97.4%) | 2 (2.6%) |
| Construction & Extraction | 3,412 (93.3%) | 245 (6.7%) |
| Installation, Maintenance & Repair | 2,566 (95.0%) | 135 (5.0%) |
| Total (Category) | 6,052 (94.1%) | 382 (5.9%) |
| Total (Overall) | 41,860 (48.3%) | 44,772 (51.7%) |
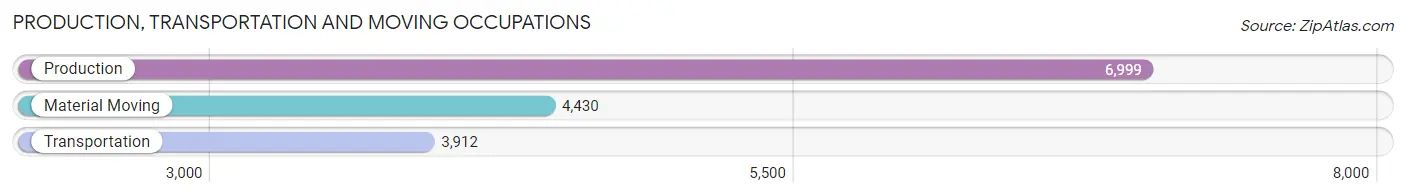
Production, Transportation and Moving Occupations
The most common Production, Transportation and Moving occupations in Richmond County are Production (6,999 | 8.1%), Material Moving (4,430 | 5.1%), and Transportation (3,912 | 4.5%).
Production, Transportation and Moving Occupations by Sex
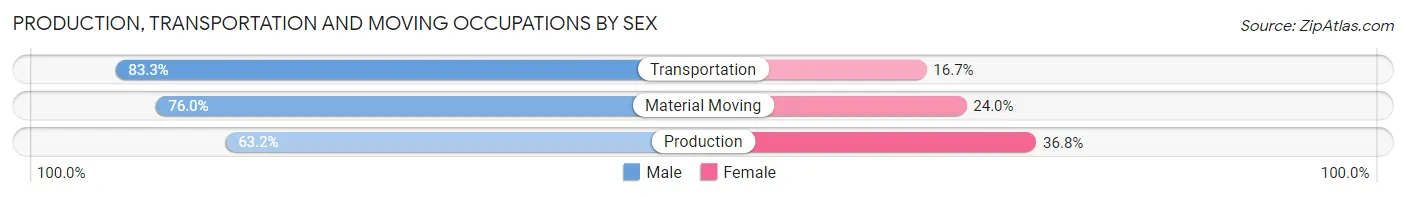
| Occupation | Male | Female |
| Production | 4,423 (63.2%) | 2,576 (36.8%) |
| Transportation | 3,260 (83.3%) | 652 (16.7%) |
| Material Moving | 3,367 (76.0%) | 1,063 (24.0%) |
| Total (Category) | 11,050 (72.0%) | 4,291 (28.0%) |
| Total (Overall) | 41,860 (48.3%) | 44,772 (51.7%) |
Employment Industries by Sex in Richmond County
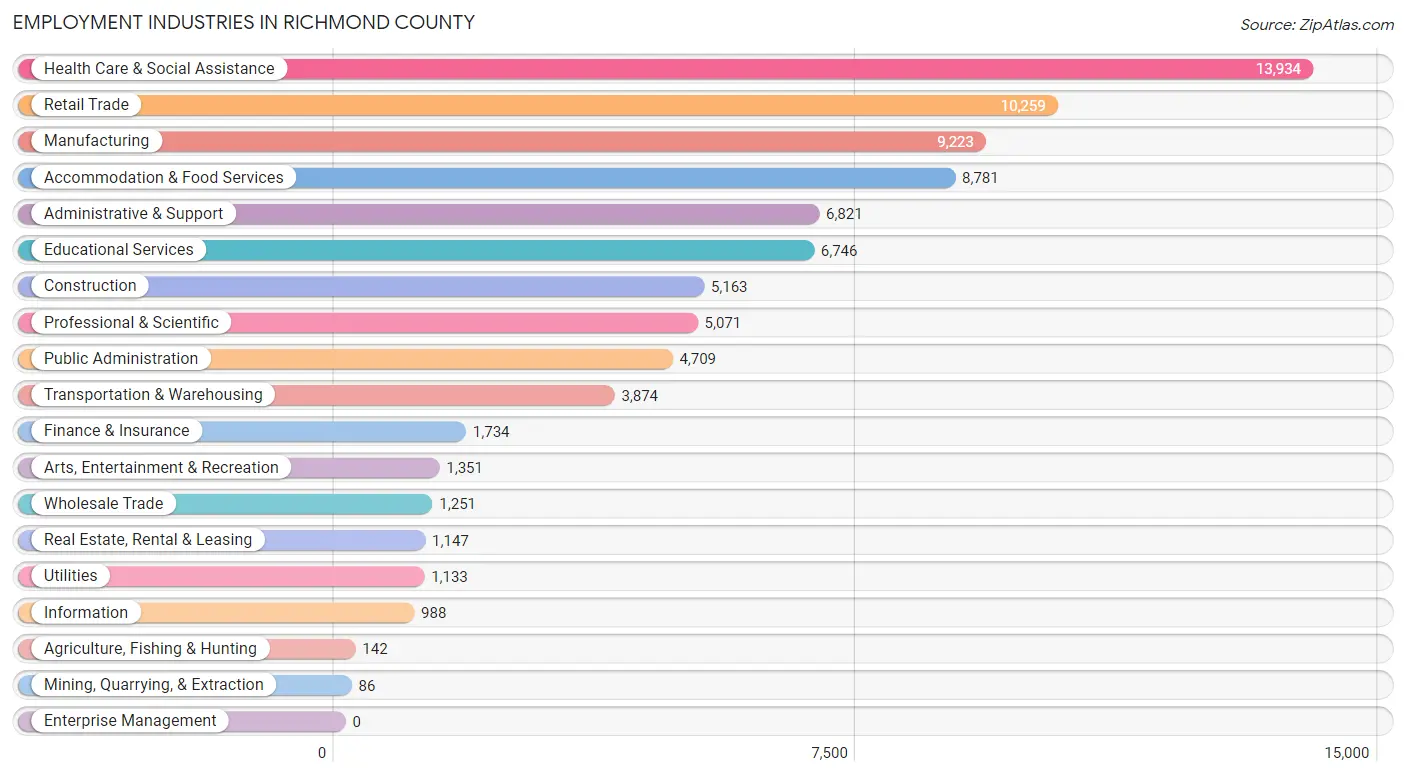
Employment Industries in Richmond County
The major employment industries in Richmond County include Health Care & Social Assistance (13,934 | 16.1%), Retail Trade (10,259 | 11.8%), Manufacturing (9,223 | 10.6%), Accommodation & Food Services (8,781 | 10.1%), and Administrative & Support (6,821 | 7.9%).
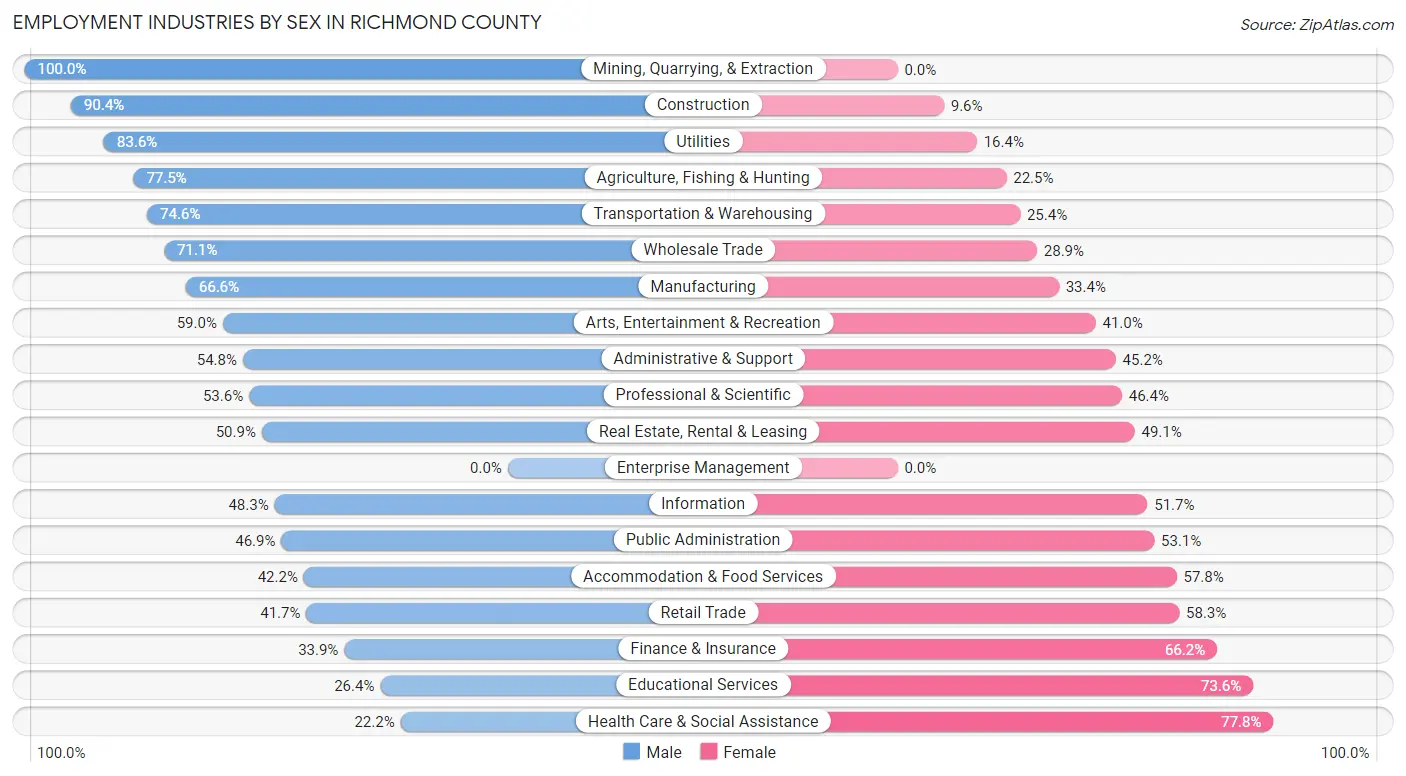
Employment Industries by Sex in Richmond County
The Richmond County industries that see more men than women are Mining, Quarrying, & Extraction (100.0%), Construction (90.4%), and Utilities (83.6%), whereas the industries that tend to have a higher number of women are Health Care & Social Assistance (77.8%), Educational Services (73.6%), and Finance & Insurance (66.1%).
| Industry | Male | Female |
| Agriculture, Fishing & Hunting | 110 (77.5%) | 32 (22.5%) |
| Mining, Quarrying, & Extraction | 86 (100.0%) | 0 (0.0%) |
| Construction | 4,668 (90.4%) | 495 (9.6%) |
| Manufacturing | 6,143 (66.6%) | 3,080 (33.4%) |
| Wholesale Trade | 890 (71.1%) | 361 (28.9%) |
| Retail Trade | 4,278 (41.7%) | 5,981 (58.3%) |
| Transportation & Warehousing | 2,891 (74.6%) | 983 (25.4%) |
| Utilities | 947 (83.6%) | 186 (16.4%) |
| Information | 477 (48.3%) | 511 (51.7%) |
| Finance & Insurance | 587 (33.9%) | 1,147 (66.1%) |
| Real Estate, Rental & Leasing | 584 (50.9%) | 563 (49.1%) |
| Professional & Scientific | 2,716 (53.6%) | 2,355 (46.4%) |
| Enterprise Management | 0 (0.0%) | 0 (0.0%) |
| Administrative & Support | 3,740 (54.8%) | 3,081 (45.2%) |
| Educational Services | 1,780 (26.4%) | 4,966 (73.6%) |
| Health Care & Social Assistance | 3,094 (22.2%) | 10,840 (77.8%) |
| Arts, Entertainment & Recreation | 797 (59.0%) | 554 (41.0%) |
| Accommodation & Food Services | 3,707 (42.2%) | 5,074 (57.8%) |
| Public Administration | 2,207 (46.9%) | 2,502 (53.1%) |
| Total | 41,860 (48.3%) | 44,772 (51.7%) |
Education in Richmond County
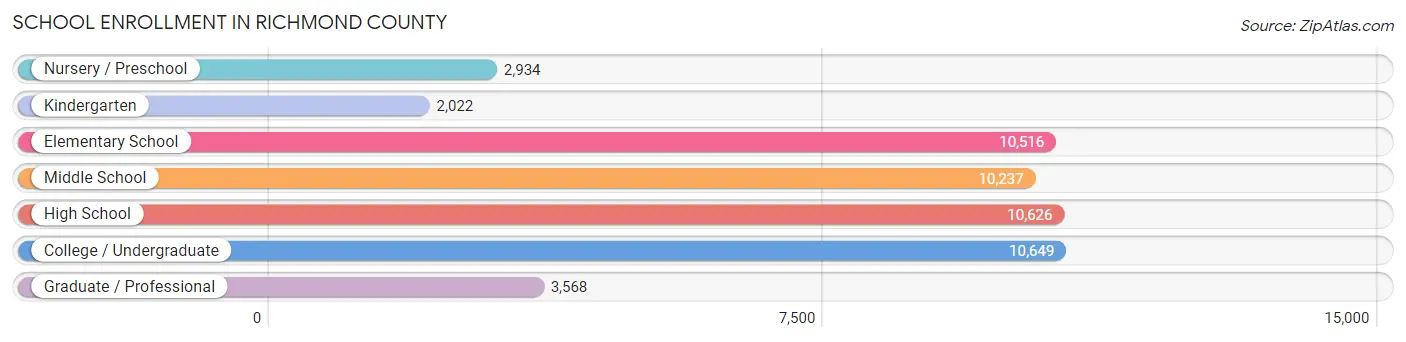
School Enrollment in Richmond County
The most common levels of schooling among the 50,552 students in Richmond County are college / undergraduate (10,649 | 21.1%), high school (10,626 | 21.0%), and elementary school (10,516 | 20.8%).
| School Level | # Students | % Students |
| Nursery / Preschool | 2,934 | 5.8% |
| Kindergarten | 2,022 | 4.0% |
| Elementary School | 10,516 | 20.8% |
| Middle School | 10,237 | 20.3% |
| High School | 10,626 | 21.0% |
| College / Undergraduate | 10,649 | 21.1% |
| Graduate / Professional | 3,568 | 7.1% |
| Total | 50,552 | 100.0% |
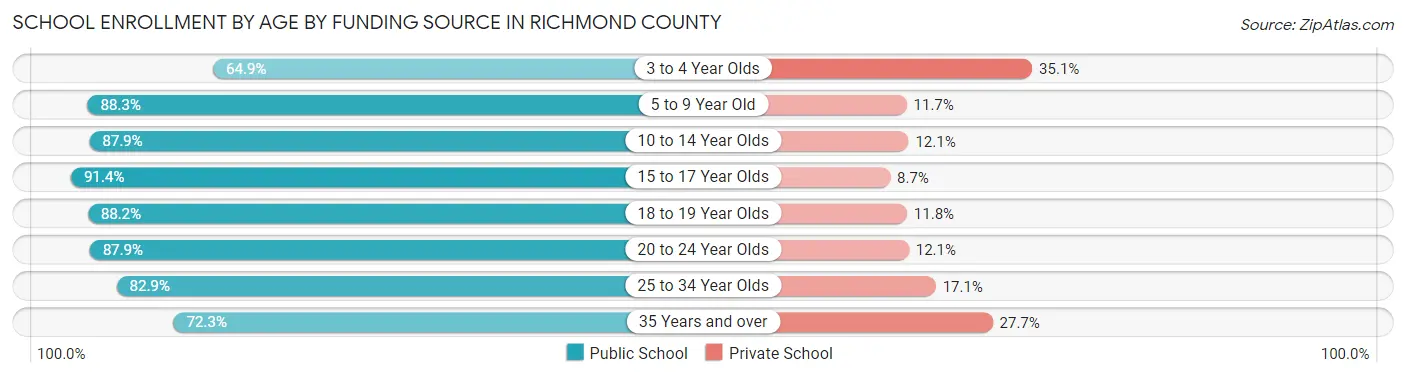
School Enrollment by Age by Funding Source in Richmond County
Out of a total of 50,552 students who are enrolled in schools in Richmond County, 7,077 (14.0%) attend a private institution, while the remaining 43,475 (86.0%) are enrolled in public schools. The age group of 3 to 4 year olds has the highest likelihood of being enrolled in private schools, with 811 (35.1% in the age bracket) enrolled. Conversely, the age group of 15 to 17 year olds has the lowest likelihood of being enrolled in a private school, with 6,579 (91.3% in the age bracket) attending a public institution.
| Age Bracket | Public School | Private School |
| 3 to 4 Year Olds | 1,499 (64.9%) | 811 (35.1%) |
| 5 to 9 Year Old | 9,985 (88.3%) | 1,325 (11.7%) |
| 10 to 14 Year Olds | 11,307 (87.9%) | 1,552 (12.1%) |
| 15 to 17 Year Olds | 6,579 (91.3%) | 623 (8.6%) |
| 18 to 19 Year Olds | 3,078 (88.2%) | 411 (11.8%) |
| 20 to 24 Year Olds | 5,181 (87.9%) | 715 (12.1%) |
| 25 to 34 Year Olds | 3,568 (82.9%) | 738 (17.1%) |
| 35 Years and over | 2,298 (72.3%) | 882 (27.7%) |
| Total | 43,475 (86.0%) | 7,077 (14.0%) |
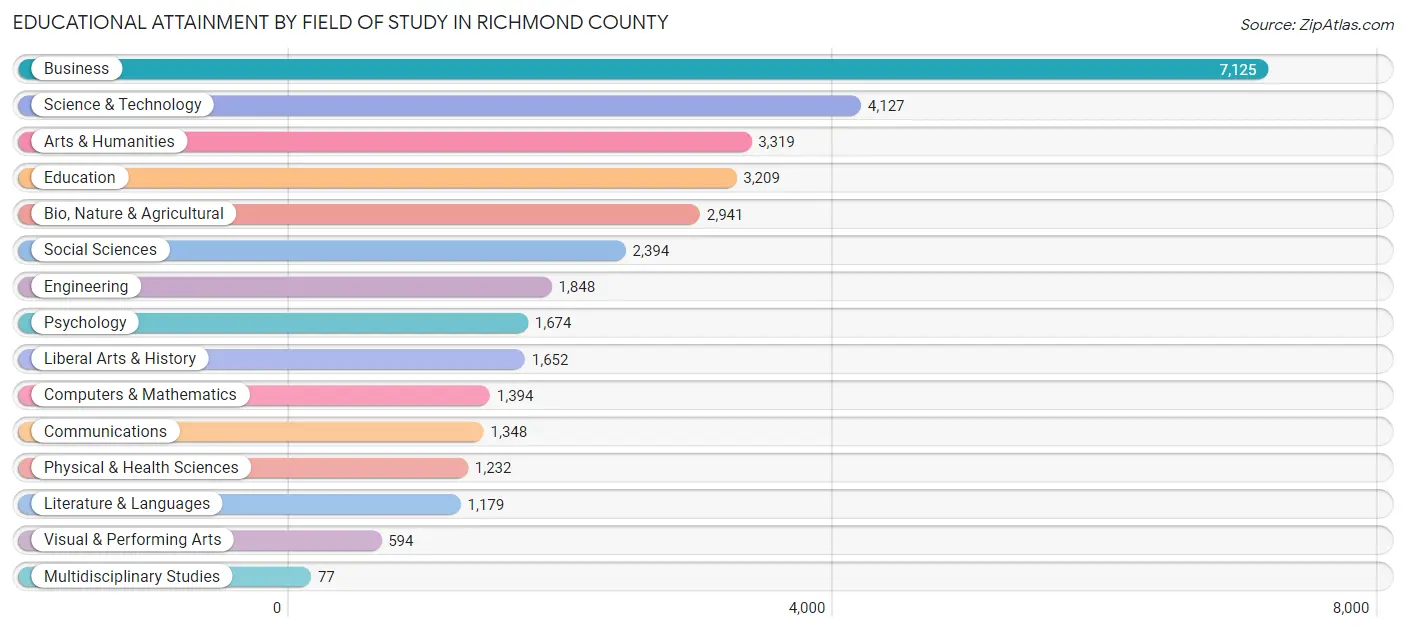
Educational Attainment by Field of Study in Richmond County
Business (7,125 | 20.9%), science & technology (4,127 | 12.1%), arts & humanities (3,319 | 9.7%), education (3,209 | 9.4%), and bio, nature & agricultural (2,941 | 8.6%) are the most common fields of study among 34,113 individuals in Richmond County who have obtained a bachelor's degree or higher.
| Field of Study | # Graduates | % Graduates |
| Computers & Mathematics | 1,394 | 4.1% |
| Bio, Nature & Agricultural | 2,941 | 8.6% |
| Physical & Health Sciences | 1,232 | 3.6% |
| Psychology | 1,674 | 4.9% |
| Social Sciences | 2,394 | 7.0% |
| Engineering | 1,848 | 5.4% |
| Multidisciplinary Studies | 77 | 0.2% |
| Science & Technology | 4,127 | 12.1% |
| Business | 7,125 | 20.9% |
| Education | 3,209 | 9.4% |
| Literature & Languages | 1,179 | 3.5% |
| Liberal Arts & History | 1,652 | 4.8% |
| Visual & Performing Arts | 594 | 1.7% |
| Communications | 1,348 | 4.0% |
| Arts & Humanities | 3,319 | 9.7% |
| Total | 34,113 | 100.0% |
Transportation & Commute in Richmond County
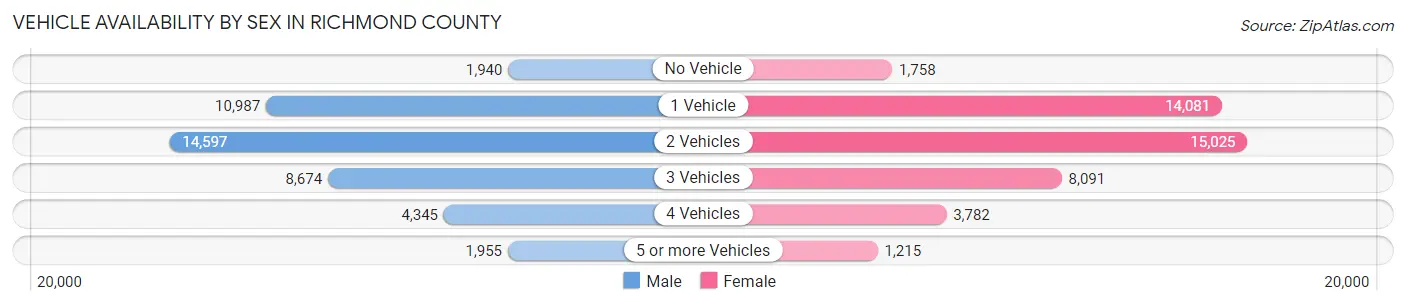
Vehicle Availability by Sex in Richmond County
The most prevalent vehicle ownership categories in Richmond County are males with 2 vehicles (14,597, accounting for 34.4%) and females with 2 vehicles (15,025, making up 33.2%).
| Vehicles Available | Male | Female |
| No Vehicle | 1,940 (4.6%) | 1,758 (4.0%) |
| 1 Vehicle | 10,987 (25.9%) | 14,081 (32.0%) |
| 2 Vehicles | 14,597 (34.4%) | 15,025 (34.2%) |
| 3 Vehicles | 8,674 (20.4%) | 8,091 (18.4%) |
| 4 Vehicles | 4,345 (10.2%) | 3,782 (8.6%) |
| 5 or more Vehicles | 1,955 (4.6%) | 1,215 (2.8%) |
| Total | 42,498 (100.0%) | 43,952 (100.0%) |
Commute Time in Richmond County
The most frequently occuring commute durations in Richmond County are 15 to 19 minutes (18,370 commuters, 21.7%), 20 to 24 minutes (15,310 commuters, 18.1%), and 10 to 14 minutes (13,202 commuters, 15.6%).
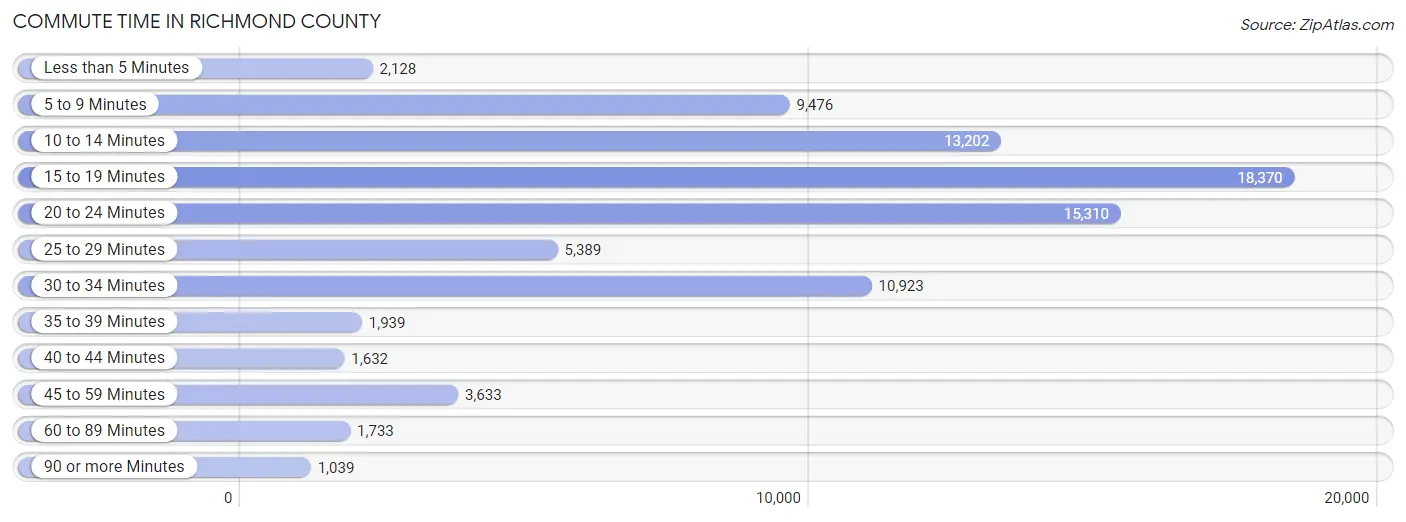
| Commute Time | # Commuters | % Commuters |
| Less than 5 Minutes | 2,128 | 2.5% |
| 5 to 9 Minutes | 9,476 | 11.2% |
| 10 to 14 Minutes | 13,202 | 15.6% |
| 15 to 19 Minutes | 18,370 | 21.7% |
| 20 to 24 Minutes | 15,310 | 18.1% |
| 25 to 29 Minutes | 5,389 | 6.4% |
| 30 to 34 Minutes | 10,923 | 12.9% |
| 35 to 39 Minutes | 1,939 | 2.3% |
| 40 to 44 Minutes | 1,632 | 1.9% |
| 45 to 59 Minutes | 3,633 | 4.3% |
| 60 to 89 Minutes | 1,733 | 2.0% |
| 90 or more Minutes | 1,039 | 1.2% |
Commute Time by Sex in Richmond County
The most common commute times in Richmond County are 15 to 19 minutes (8,578 commuters, 19.9%) for males and 15 to 19 minutes (9,792 commuters, 23.5%) for females.
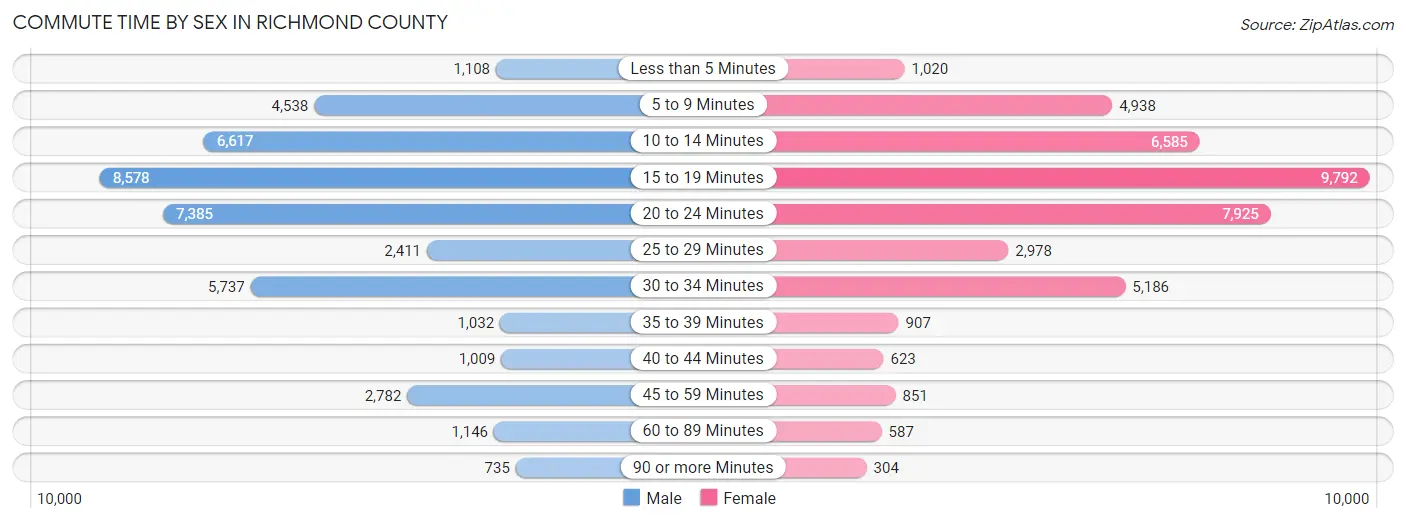
| Commute Time | Male | Female |
| Less than 5 Minutes | 1,108 (2.6%) | 1,020 (2.5%) |
| 5 to 9 Minutes | 4,538 (10.5%) | 4,938 (11.8%) |
| 10 to 14 Minutes | 6,617 (15.4%) | 6,585 (15.8%) |
| 15 to 19 Minutes | 8,578 (19.9%) | 9,792 (23.5%) |
| 20 to 24 Minutes | 7,385 (17.1%) | 7,925 (19.0%) |
| 25 to 29 Minutes | 2,411 (5.6%) | 2,978 (7.1%) |
| 30 to 34 Minutes | 5,737 (13.3%) | 5,186 (12.4%) |
| 35 to 39 Minutes | 1,032 (2.4%) | 907 (2.2%) |
| 40 to 44 Minutes | 1,009 (2.3%) | 623 (1.5%) |
| 45 to 59 Minutes | 2,782 (6.5%) | 851 (2.0%) |
| 60 to 89 Minutes | 1,146 (2.7%) | 587 (1.4%) |
| 90 or more Minutes | 735 (1.7%) | 304 (0.7%) |
Time of Departure to Work by Sex in Richmond County
The most frequent times of departure to work in Richmond County are 4:00 PM to 11:59 PM (5,970, 13.9%) for males and 7:00 AM to 7:29 AM (6,996, 16.8%) for females.
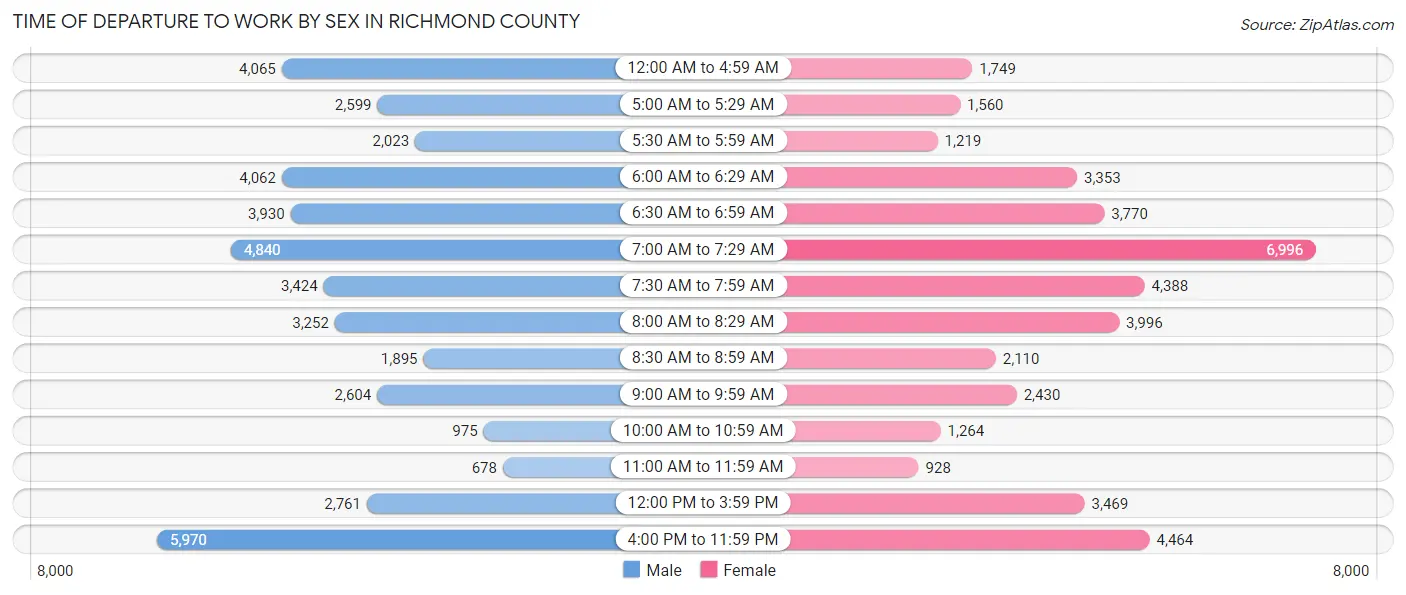
| Time of Departure | Male | Female |
| 12:00 AM to 4:59 AM | 4,065 (9.4%) | 1,749 (4.2%) |
| 5:00 AM to 5:29 AM | 2,599 (6.0%) | 1,560 (3.7%) |
| 5:30 AM to 5:59 AM | 2,023 (4.7%) | 1,219 (2.9%) |
| 6:00 AM to 6:29 AM | 4,062 (9.4%) | 3,353 (8.0%) |
| 6:30 AM to 6:59 AM | 3,930 (9.1%) | 3,770 (9.0%) |
| 7:00 AM to 7:29 AM | 4,840 (11.2%) | 6,996 (16.8%) |
| 7:30 AM to 7:59 AM | 3,424 (8.0%) | 4,388 (10.5%) |
| 8:00 AM to 8:29 AM | 3,252 (7.5%) | 3,996 (9.6%) |
| 8:30 AM to 8:59 AM | 1,895 (4.4%) | 2,110 (5.1%) |
| 9:00 AM to 9:59 AM | 2,604 (6.0%) | 2,430 (5.8%) |
| 10:00 AM to 10:59 AM | 975 (2.3%) | 1,264 (3.0%) |
| 11:00 AM to 11:59 AM | 678 (1.6%) | 928 (2.2%) |
| 12:00 PM to 3:59 PM | 2,761 (6.4%) | 3,469 (8.3%) |
| 4:00 PM to 11:59 PM | 5,970 (13.9%) | 4,464 (10.7%) |
| Total | 43,078 (100.0%) | 41,696 (100.0%) |
Housing Occupancy in Richmond County
Occupancy by Ownership in Richmond County
Of the total 74,028 dwellings in Richmond County, owner-occupied units account for 38,018 (51.4%), while renter-occupied units make up 36,010 (48.6%).
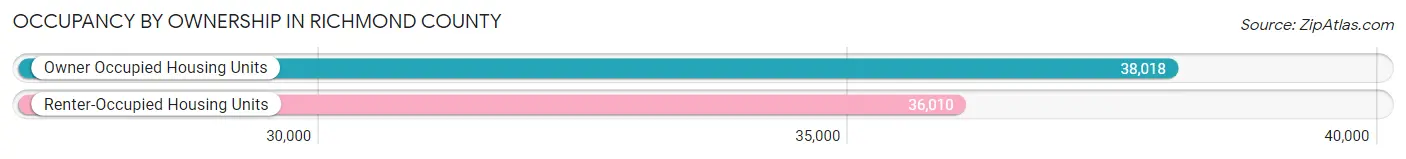
| Occupancy | # Housing Units | % Housing Units |
| Owner Occupied Housing Units | 38,018 | 51.4% |
| Renter-Occupied Housing Units | 36,010 | 48.6% |
| Total Occupied Housing Units | 74,028 | 100.0% |
Occupancy by Household Size in Richmond County
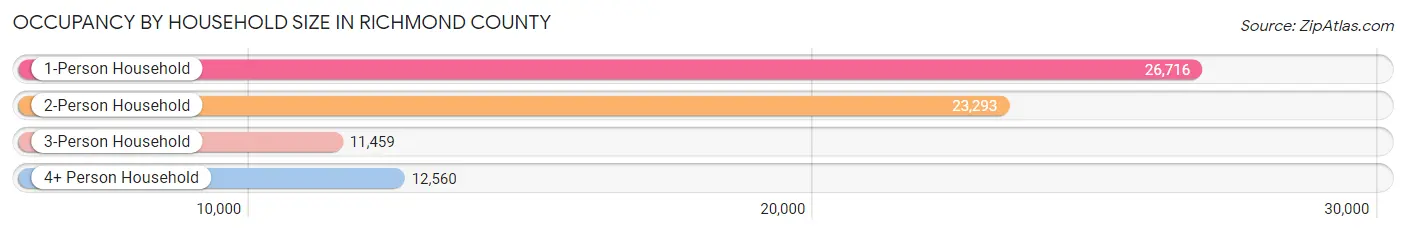
| Household Size | # Housing Units | % Housing Units |
| 1-Person Household | 26,716 | 36.1% |
| 2-Person Household | 23,293 | 31.5% |
| 3-Person Household | 11,459 | 15.5% |
| 4+ Person Household | 12,560 | 17.0% |
| Total Housing Units | 74,028 | 100.0% |
Occupancy by Ownership by Household Size in Richmond County
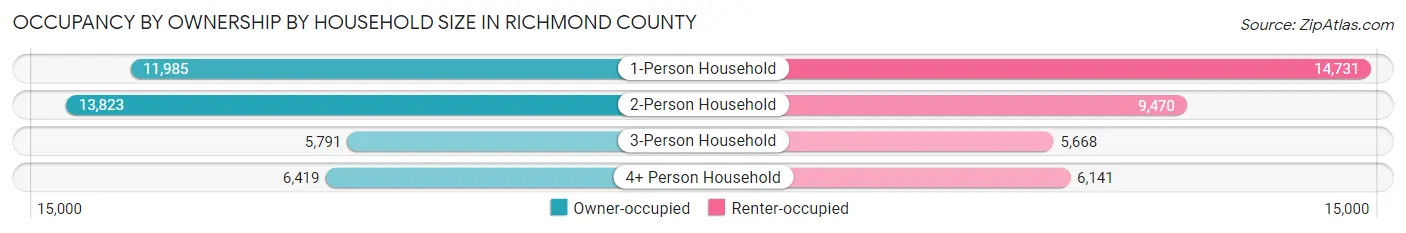
| Household Size | Owner-occupied | Renter-occupied |
| 1-Person Household | 11,985 (44.9%) | 14,731 (55.1%) |
| 2-Person Household | 13,823 (59.3%) | 9,470 (40.7%) |
| 3-Person Household | 5,791 (50.5%) | 5,668 (49.5%) |
| 4+ Person Household | 6,419 (51.1%) | 6,141 (48.9%) |
| Total Housing Units | 38,018 (51.4%) | 36,010 (48.6%) |
Occupancy by Educational Attainment in Richmond County
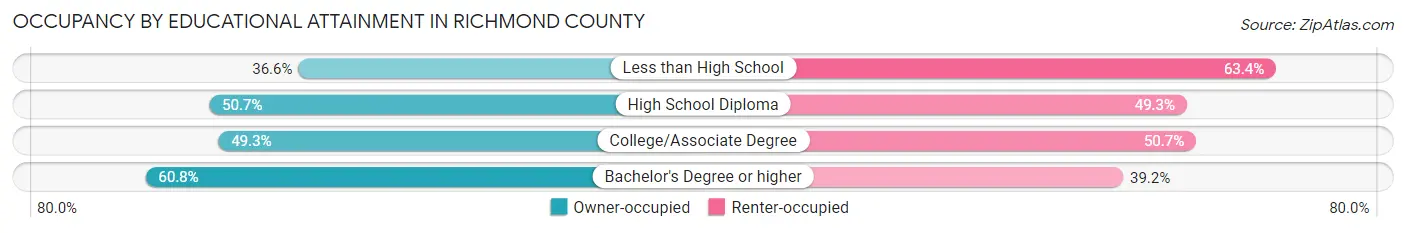
| Household Size | Owner-occupied | Renter-occupied |
| Less than High School | 3,049 (36.6%) | 5,285 (63.4%) |
| High School Diploma | 10,901 (50.7%) | 10,584 (49.3%) |
| College/Associate Degree | 12,057 (49.3%) | 12,409 (50.7%) |
| Bachelor's Degree or higher | 12,011 (60.8%) | 7,732 (39.2%) |
Occupancy by Age of Householder in Richmond County
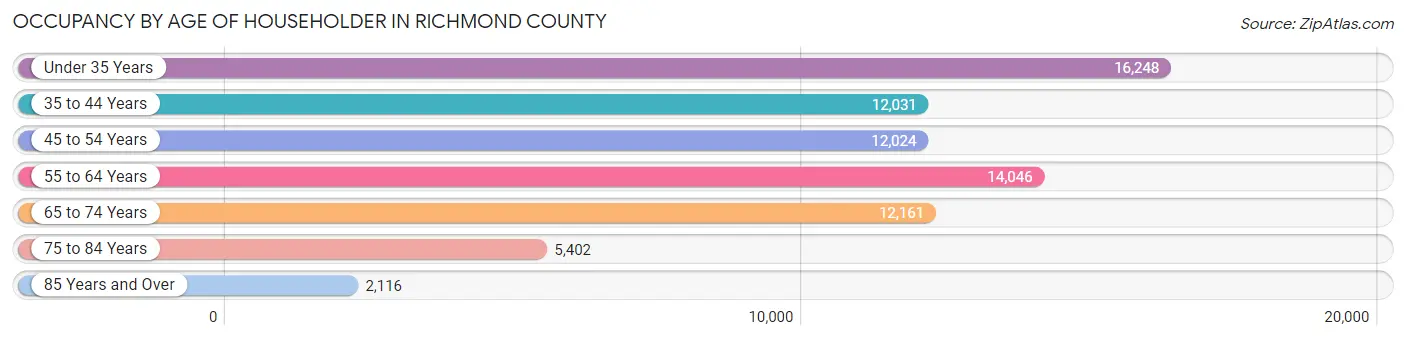
| Age Bracket | # Households | % Households |
| Under 35 Years | 16,248 | 22.0% |
| 35 to 44 Years | 12,031 | 16.3% |
| 45 to 54 Years | 12,024 | 16.2% |
| 55 to 64 Years | 14,046 | 19.0% |
| 65 to 74 Years | 12,161 | 16.4% |
| 75 to 84 Years | 5,402 | 7.3% |
| 85 Years and Over | 2,116 | 2.9% |
| Total | 74,028 | 100.0% |
Housing Finances in Richmond County
Median Income by Occupancy in Richmond County
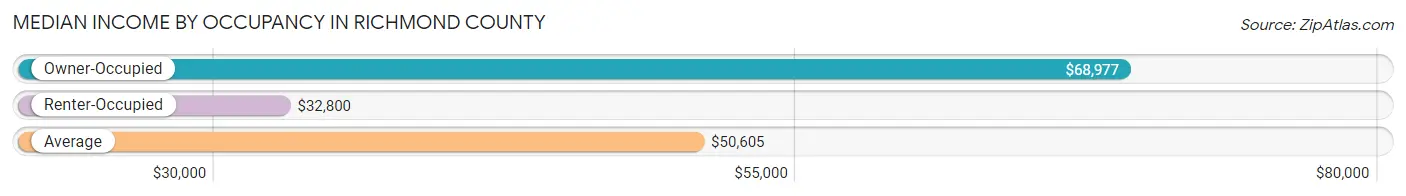
| Occupancy Type | # Households | Median Income |
| Owner-Occupied | 38,018 (51.4%) | $68,977 |
| Renter-Occupied | 36,010 (48.6%) | $32,800 |
| Average | 74,028 (100.0%) | $50,605 |
Occupancy by Householder Income Bracket in Richmond County
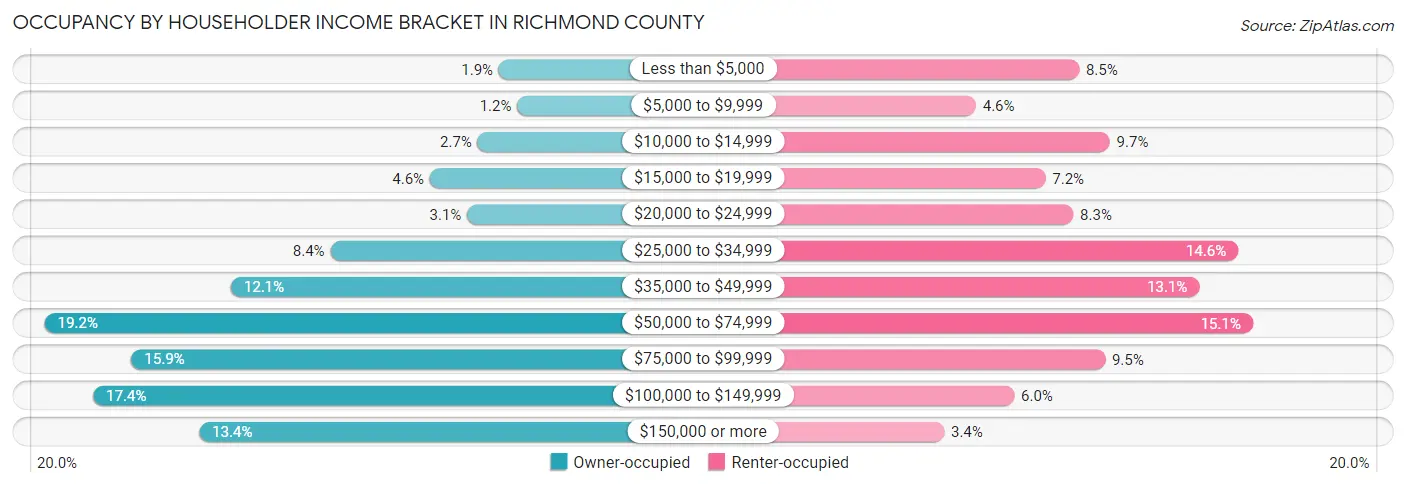
| Income Bracket | Owner-occupied | Renter-occupied |
| Less than $5,000 | 732 (1.9%) | 3,064 (8.5%) |
| $5,000 to $9,999 | 469 (1.2%) | 1,651 (4.6%) |
| $10,000 to $14,999 | 1,041 (2.7%) | 3,487 (9.7%) |
| $15,000 to $19,999 | 1,735 (4.6%) | 2,605 (7.2%) |
| $20,000 to $24,999 | 1,195 (3.1%) | 2,987 (8.3%) |
| $25,000 to $34,999 | 3,173 (8.4%) | 5,245 (14.6%) |
| $35,000 to $49,999 | 4,614 (12.1%) | 4,712 (13.1%) |
| $50,000 to $74,999 | 7,315 (19.2%) | 5,447 (15.1%) |
| $75,000 to $99,999 | 6,058 (15.9%) | 3,422 (9.5%) |
| $100,000 to $149,999 | 6,612 (17.4%) | 2,175 (6.0%) |
| $150,000 or more | 5,074 (13.4%) | 1,215 (3.4%) |
| Total | 38,018 (100.0%) | 36,010 (100.0%) |
Monthly Housing Cost Tiers in Richmond County
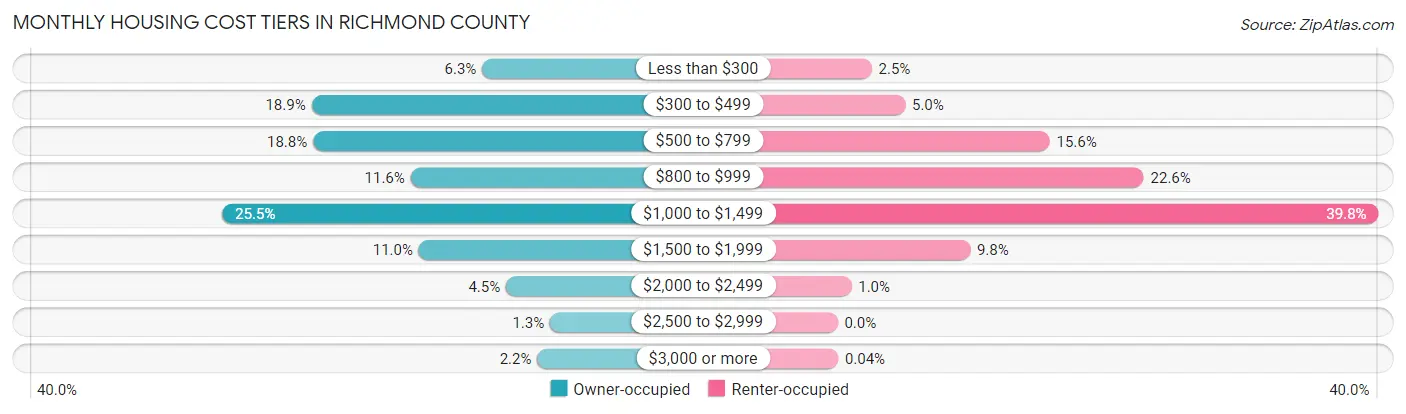
| Monthly Cost | Owner-occupied | Renter-occupied |
| Less than $300 | 2,394 (6.3%) | 909 (2.5%) |
| $300 to $499 | 7,173 (18.9%) | 1,793 (5.0%) |
| $500 to $799 | 7,133 (18.8%) | 5,624 (15.6%) |
| $800 to $999 | 4,398 (11.6%) | 8,122 (22.6%) |
| $1,000 to $1,499 | 9,676 (25.5%) | 14,346 (39.8%) |
| $1,500 to $1,999 | 4,171 (11.0%) | 3,513 (9.8%) |
| $2,000 to $2,499 | 1,726 (4.5%) | 367 (1.0%) |
| $2,500 to $2,999 | 494 (1.3%) | 0 (0.0%) |
| $3,000 or more | 853 (2.2%) | 13 (0.0%) |
| Total | 38,018 (100.0%) | 36,010 (100.0%) |
Physical Housing Characteristics in Richmond County
Housing Structures in Richmond County
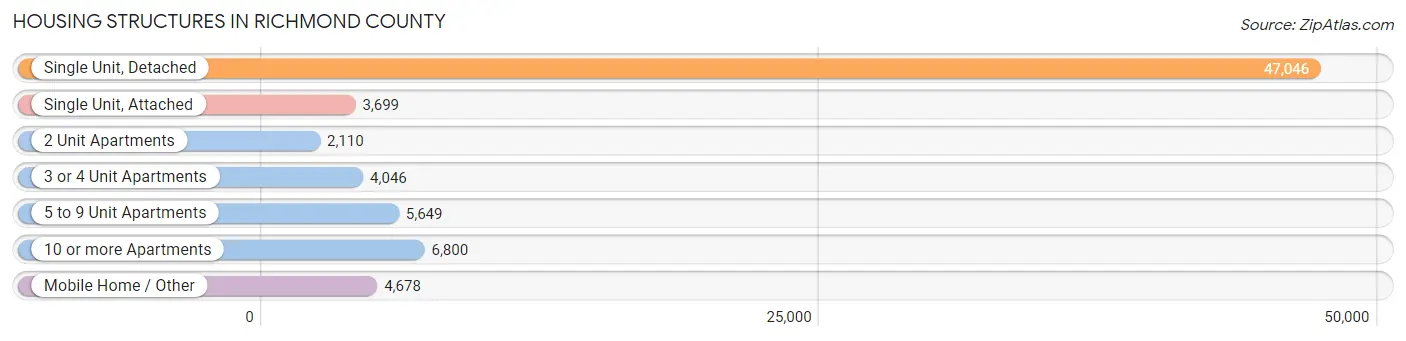
| Structure Type | # Housing Units | % Housing Units |
| Single Unit, Detached | 47,046 | 63.5% |
| Single Unit, Attached | 3,699 | 5.0% |
| 2 Unit Apartments | 2,110 | 2.9% |
| 3 or 4 Unit Apartments | 4,046 | 5.5% |
| 5 to 9 Unit Apartments | 5,649 | 7.6% |
| 10 or more Apartments | 6,800 | 9.2% |
| Mobile Home / Other | 4,678 | 6.3% |
| Total | 74,028 | 100.0% |
Housing Structures by Occupancy in Richmond County
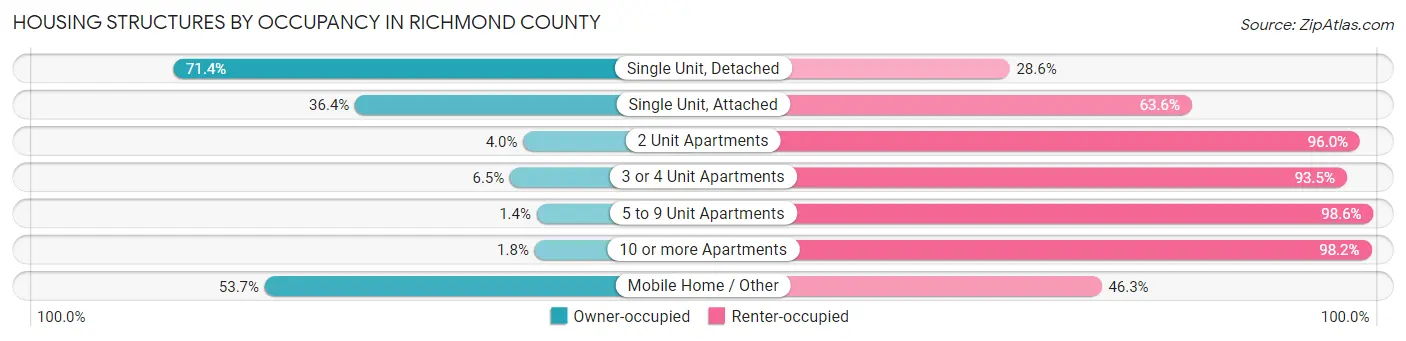
| Structure Type | Owner-occupied | Renter-occupied |
| Single Unit, Detached | 33,612 (71.4%) | 13,434 (28.6%) |
| Single Unit, Attached | 1,345 (36.4%) | 2,354 (63.6%) |
| 2 Unit Apartments | 84 (4.0%) | 2,026 (96.0%) |
| 3 or 4 Unit Apartments | 264 (6.5%) | 3,782 (93.5%) |
| 5 to 9 Unit Apartments | 78 (1.4%) | 5,571 (98.6%) |
| 10 or more Apartments | 121 (1.8%) | 6,679 (98.2%) |
| Mobile Home / Other | 2,514 (53.7%) | 2,164 (46.3%) |
| Total | 38,018 (51.4%) | 36,010 (48.6%) |
Housing Structures by Number of Rooms in Richmond County
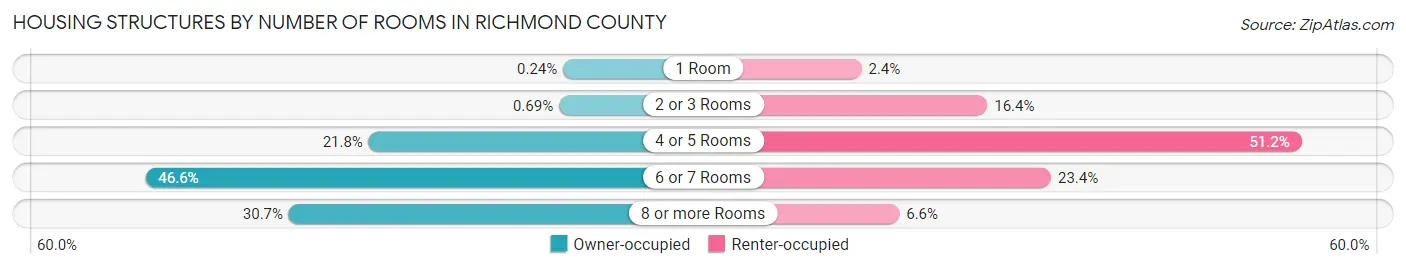
| Number of Rooms | Owner-occupied | Renter-occupied |
| 1 Room | 93 (0.2%) | 864 (2.4%) |
| 2 or 3 Rooms | 261 (0.7%) | 5,893 (16.4%) |
| 4 or 5 Rooms | 8,291 (21.8%) | 18,443 (51.2%) |
| 6 or 7 Rooms | 17,711 (46.6%) | 8,437 (23.4%) |
| 8 or more Rooms | 11,662 (30.7%) | 2,373 (6.6%) |
| Total | 38,018 (100.0%) | 36,010 (100.0%) |
Housing Structure by Heating Type in Richmond County
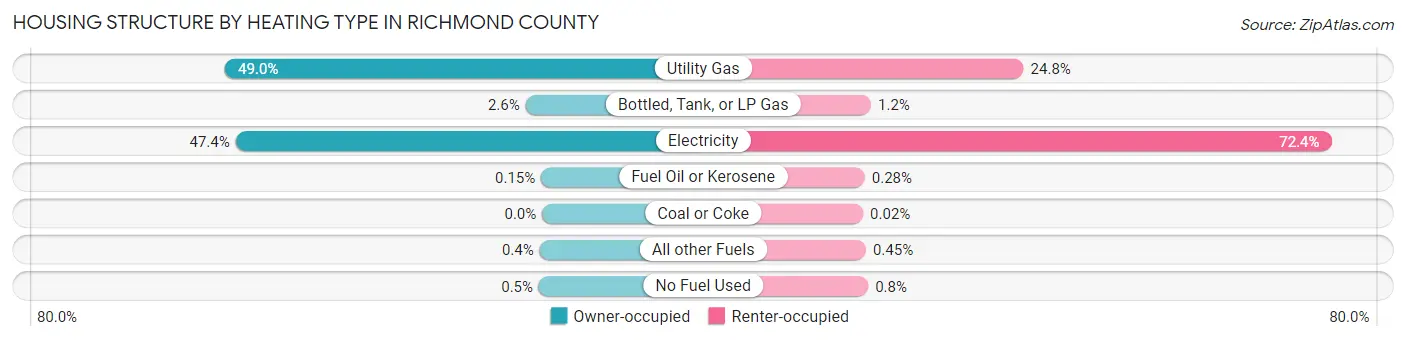
| Heating Type | Owner-occupied | Renter-occupied |
| Utility Gas | 18,632 (49.0%) | 8,941 (24.8%) |
| Bottled, Tank, or LP Gas | 972 (2.6%) | 445 (1.2%) |
| Electricity | 18,017 (47.4%) | 26,066 (72.4%) |
| Fuel Oil or Kerosene | 56 (0.2%) | 102 (0.3%) |
| Coal or Coke | 0 (0.0%) | 7 (0.0%) |
| All other Fuels | 151 (0.4%) | 162 (0.4%) |
| No Fuel Used | 190 (0.5%) | 287 (0.8%) |
| Total | 38,018 (100.0%) | 36,010 (100.0%) |
Household Vehicle Usage in Richmond County
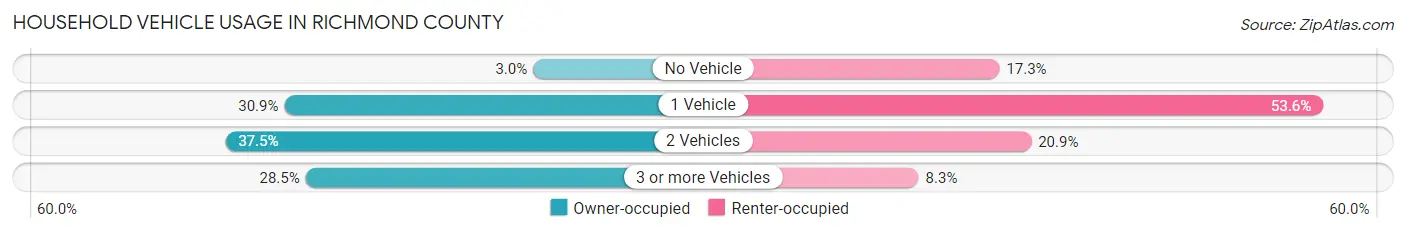
| Vehicles per Household | Owner-occupied | Renter-occupied |
| No Vehicle | 1,156 (3.0%) | 6,233 (17.3%) |
| 1 Vehicle | 11,751 (30.9%) | 19,287 (53.6%) |
| 2 Vehicles | 14,266 (37.5%) | 7,515 (20.9%) |
| 3 or more Vehicles | 10,845 (28.5%) | 2,975 (8.3%) |
| Total | 38,018 (100.0%) | 36,010 (100.0%) |
Real Estate & Mortgages in Richmond County
Real Estate and Mortgage Overview in Richmond County
| Characteristic | Without Mortgage | With Mortgage |
| Housing Units | 15,718 | 22,300 |
| Median Property Value | $112,800 | $158,600 |
| Median Household Income | $53,463 | $3,573 |
| Monthly Housing Costs | $450 | $822 |
| Real Estate Taxes | $974 | $928 |
Property Value by Mortgage Status in Richmond County
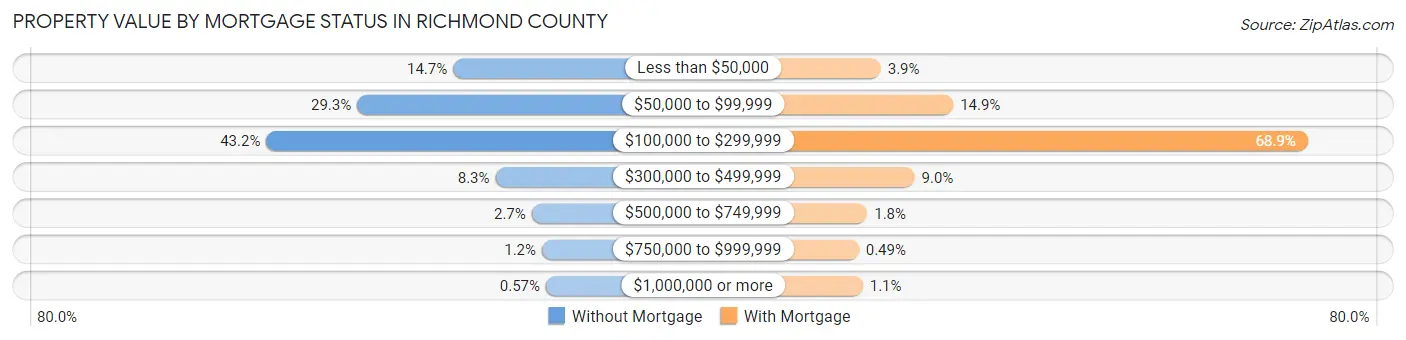
| Property Value | Without Mortgage | With Mortgage |
| Less than $50,000 | 2,313 (14.7%) | 858 (3.8%) |
| $50,000 to $99,999 | 4,612 (29.3%) | 3,318 (14.9%) |
| $100,000 to $299,999 | 6,787 (43.2%) | 15,363 (68.9%) |
| $300,000 to $499,999 | 1,299 (8.3%) | 2,007 (9.0%) |
| $500,000 to $749,999 | 431 (2.7%) | 399 (1.8%) |
| $750,000 to $999,999 | 186 (1.2%) | 110 (0.5%) |
| $1,000,000 or more | 90 (0.6%) | 245 (1.1%) |
| Total | 15,718 (100.0%) | 22,300 (100.0%) |
Household Income by Mortgage Status in Richmond County
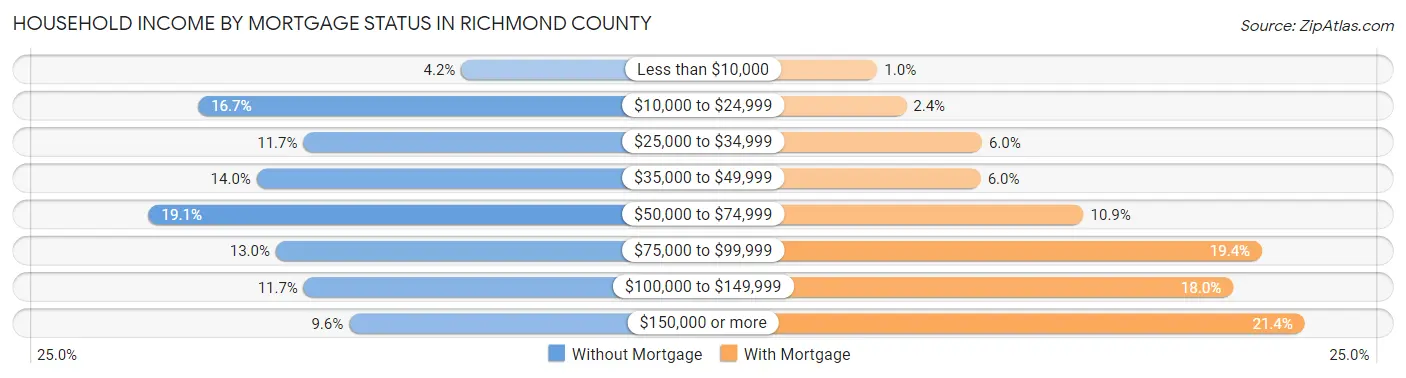
| Household Income | Without Mortgage | With Mortgage |
| Less than $10,000 | 662 (4.2%) | 233 (1.0%) |
| $10,000 to $24,999 | 2,629 (16.7%) | 539 (2.4%) |
| $25,000 to $34,999 | 1,844 (11.7%) | 1,342 (6.0%) |
| $35,000 to $49,999 | 2,192 (14.0%) | 1,329 (6.0%) |
| $50,000 to $74,999 | 3,000 (19.1%) | 2,422 (10.9%) |
| $75,000 to $99,999 | 2,049 (13.0%) | 4,315 (19.4%) |
| $100,000 to $149,999 | 1,841 (11.7%) | 4,009 (18.0%) |
| $150,000 or more | 1,501 (9.6%) | 4,771 (21.4%) |
| Total | 15,718 (100.0%) | 22,300 (100.0%) |
Property Value to Household Income Ratio in Richmond County
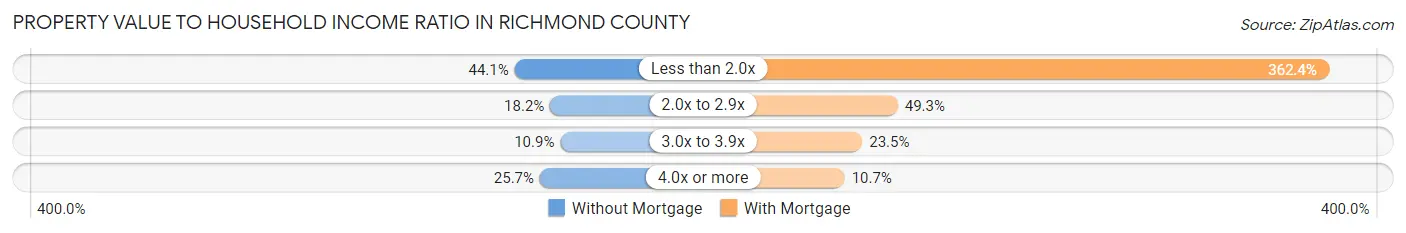
| Value-to-Income Ratio | Without Mortgage | With Mortgage |
| Less than 2.0x | 6,930 (44.1%) | 80,809 (362.4%) |
| 2.0x to 2.9x | 2,866 (18.2%) | 11,001 (49.3%) |
| 3.0x to 3.9x | 1,715 (10.9%) | 5,240 (23.5%) |
| 4.0x or more | 4,037 (25.7%) | 2,395 (10.7%) |
| Total | 15,718 (100.0%) | 22,300 (100.0%) |
Real Estate Taxes by Mortgage Status in Richmond County
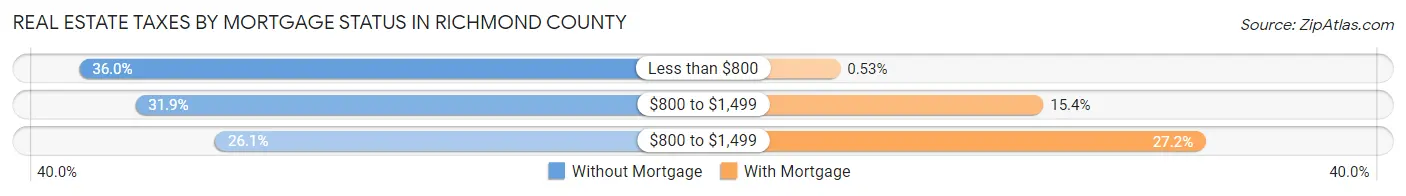
| Property Taxes | Without Mortgage | With Mortgage |
| Less than $800 | 5,659 (36.0%) | 119 (0.5%) |
| $800 to $1,499 | 5,015 (31.9%) | 3,425 (15.4%) |
| $800 to $1,499 | 4,100 (26.1%) | 6,060 (27.2%) |
| Total | 15,718 (100.0%) | 22,300 (100.0%) |
Health & Disability in Richmond County
Health Insurance Coverage by Age in Richmond County
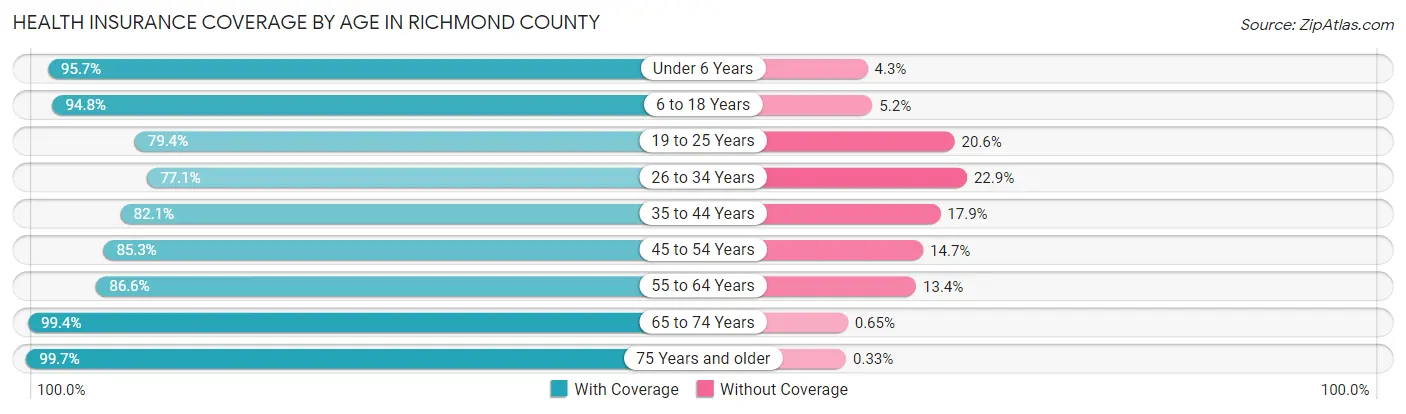
| Age Bracket | With Coverage | Without Coverage |
| Under 6 Years | 15,030 (95.7%) | 682 (4.3%) |
| 6 to 18 Years | 32,509 (94.8%) | 1,798 (5.2%) |
| 19 to 25 Years | 15,449 (79.4%) | 4,002 (20.6%) |
| 26 to 34 Years | 20,338 (77.1%) | 6,034 (22.9%) |
| 35 to 44 Years | 19,266 (82.1%) | 4,205 (17.9%) |
| 45 to 54 Years | 18,407 (85.3%) | 3,175 (14.7%) |
| 55 to 64 Years | 21,729 (86.6%) | 3,358 (13.4%) |
| 65 to 74 Years | 18,094 (99.4%) | 118 (0.6%) |
| 75 Years and older | 10,623 (99.7%) | 35 (0.3%) |
| Total | 171,445 (88.0%) | 23,407 (12.0%) |
Health Insurance Coverage by Citizenship Status in Richmond County
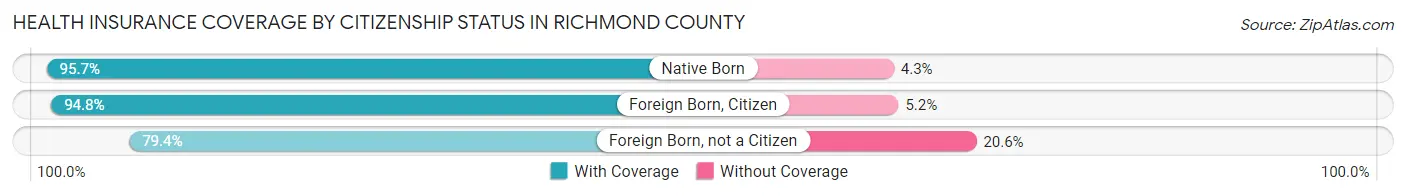
| Citizenship Status | With Coverage | Without Coverage |
| Native Born | 15,030 (95.7%) | 682 (4.3%) |
| Foreign Born, Citizen | 32,509 (94.8%) | 1,798 (5.2%) |
| Foreign Born, not a Citizen | 15,449 (79.4%) | 4,002 (20.6%) |
Health Insurance Coverage by Household Income in Richmond County
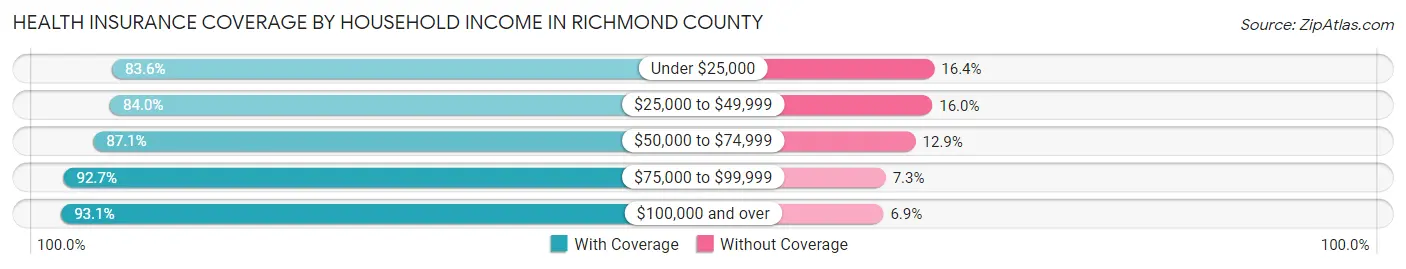
| Household Income | With Coverage | Without Coverage |
| Under $25,000 | 33,376 (83.6%) | 6,553 (16.4%) |
| $25,000 to $49,999 | 34,394 (84.0%) | 6,560 (16.0%) |
| $50,000 to $74,999 | 29,927 (87.1%) | 4,427 (12.9%) |
| $75,000 to $99,999 | 26,516 (92.7%) | 2,087 (7.3%) |
| $100,000 and over | 45,756 (93.1%) | 3,374 (6.9%) |
Public vs Private Health Insurance Coverage by Age in Richmond County
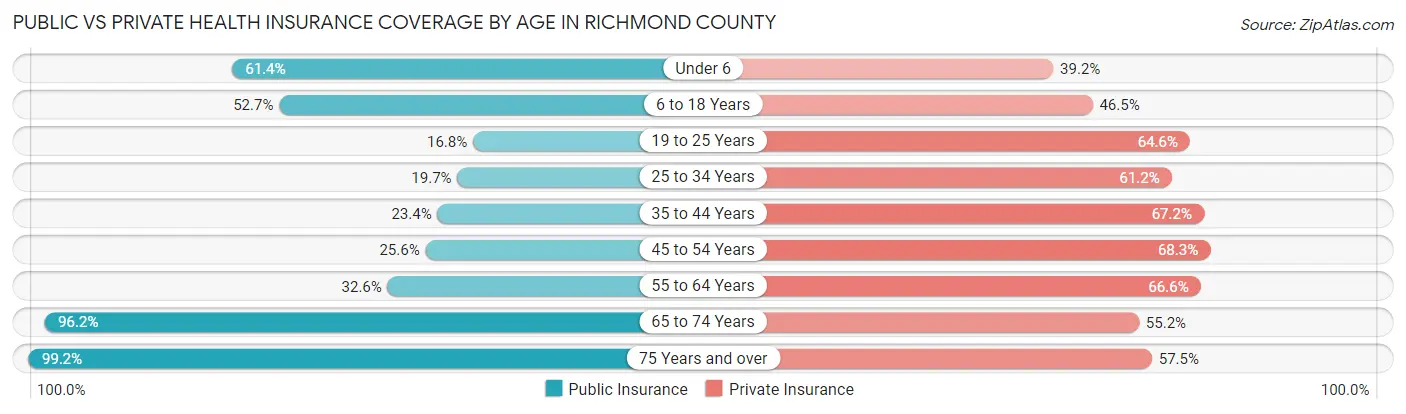
| Age Bracket | Public Insurance | Private Insurance |
| Under 6 | 9,654 (61.4%) | 6,164 (39.2%) |
| 6 to 18 Years | 18,094 (52.7%) | 15,963 (46.5%) |
| 19 to 25 Years | 3,262 (16.8%) | 12,563 (64.6%) |
| 25 to 34 Years | 5,186 (19.7%) | 16,139 (61.2%) |
| 35 to 44 Years | 5,483 (23.4%) | 15,765 (67.2%) |
| 45 to 54 Years | 5,522 (25.6%) | 14,749 (68.3%) |
| 55 to 64 Years | 8,184 (32.6%) | 16,700 (66.6%) |
| 65 to 74 Years | 17,522 (96.2%) | 10,044 (55.1%) |
| 75 Years and over | 10,573 (99.2%) | 6,133 (57.5%) |
| Total | 83,480 (42.8%) | 114,220 (58.6%) |
Disability Status by Sex by Age in Richmond County
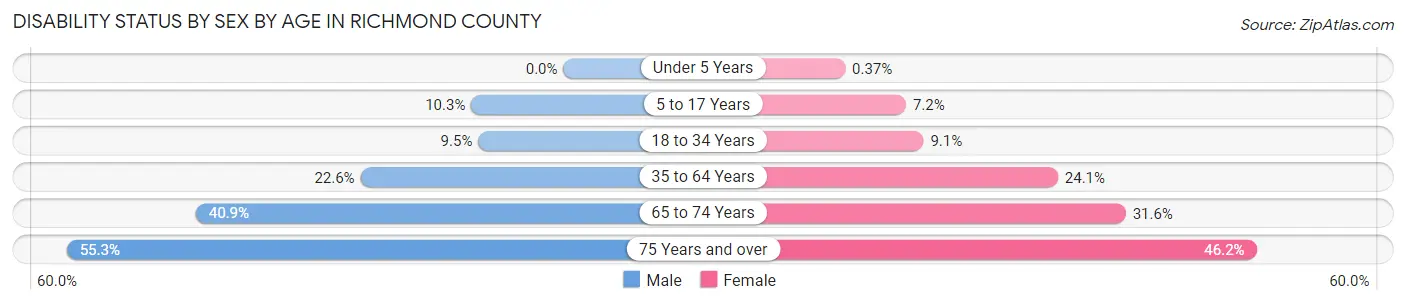
| Age Bracket | Male | Female |
| Under 5 Years | 0 (0.0%) | 24 (0.4%) |
| 5 to 17 Years | 1,775 (10.3%) | 1,164 (7.1%) |
| 18 to 34 Years | 2,166 (9.5%) | 2,357 (9.1%) |
| 35 to 64 Years | 7,164 (22.6%) | 9,251 (24.1%) |
| 65 to 74 Years | 3,257 (40.9%) | 3,242 (31.6%) |
| 75 Years and over | 2,234 (55.3%) | 3,056 (46.2%) |
Disability Class by Sex by Age in Richmond County
Disability Class: Hearing Difficulty
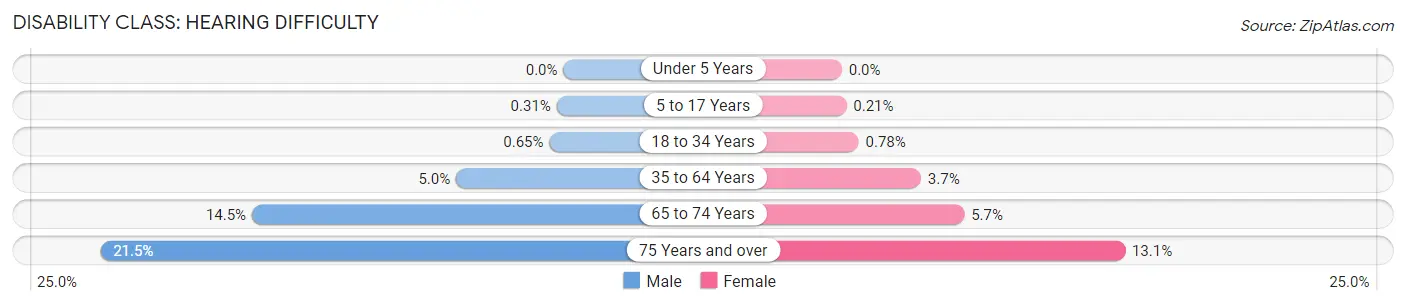
| Age Bracket | Male | Female |
| Under 5 Years | 0 (0.0%) | 0 (0.0%) |
| 5 to 17 Years | 53 (0.3%) | 35 (0.2%) |
| 18 to 34 Years | 149 (0.6%) | 201 (0.8%) |
| 35 to 64 Years | 1,577 (5.0%) | 1,411 (3.7%) |
| 65 to 74 Years | 1,150 (14.4%) | 582 (5.7%) |
| 75 Years and over | 868 (21.5%) | 870 (13.1%) |
Disability Class: Vision Difficulty
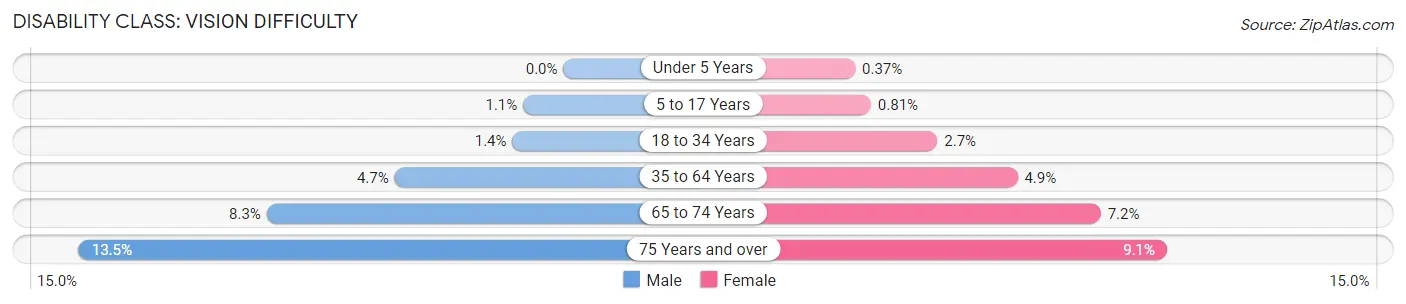
| Age Bracket | Male | Female |
| Under 5 Years | 0 (0.0%) | 24 (0.4%) |
| 5 to 17 Years | 193 (1.1%) | 132 (0.8%) |
| 18 to 34 Years | 325 (1.4%) | 688 (2.7%) |
| 35 to 64 Years | 1,488 (4.7%) | 1,881 (4.9%) |
| 65 to 74 Years | 657 (8.3%) | 739 (7.2%) |
| 75 Years and over | 545 (13.5%) | 599 (9.0%) |
Disability Class: Cognitive Difficulty
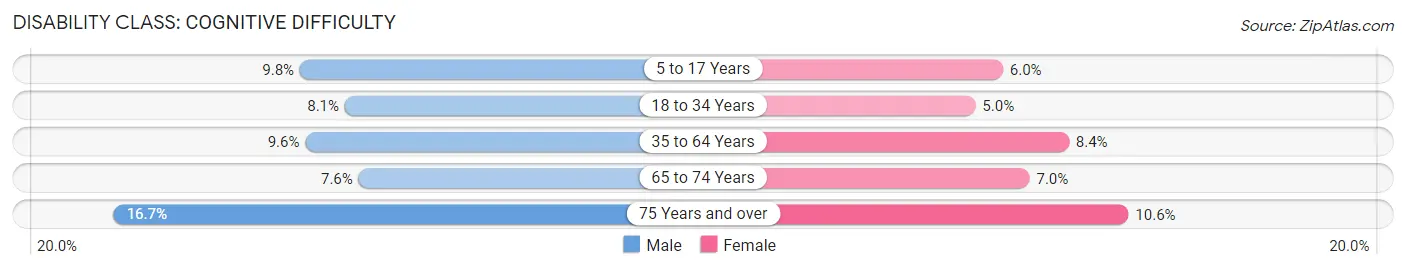
| Age Bracket | Male | Female |
| 5 to 17 Years | 1,691 (9.8%) | 974 (6.0%) |
| 18 to 34 Years | 1,853 (8.1%) | 1,285 (5.0%) |
| 35 to 64 Years | 3,035 (9.6%) | 3,242 (8.4%) |
| 65 to 74 Years | 605 (7.6%) | 715 (7.0%) |
| 75 Years and over | 674 (16.7%) | 704 (10.6%) |
Disability Class: Ambulatory Difficulty
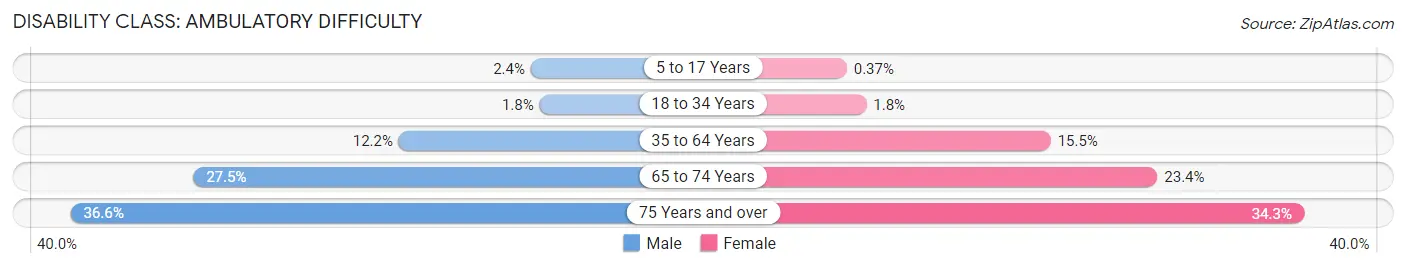
| Age Bracket | Male | Female |
| 5 to 17 Years | 419 (2.4%) | 61 (0.4%) |
| 18 to 34 Years | 405 (1.8%) | 472 (1.8%) |
| 35 to 64 Years | 3,874 (12.2%) | 5,962 (15.5%) |
| 65 to 74 Years | 2,187 (27.5%) | 2,402 (23.4%) |
| 75 Years and over | 1,478 (36.6%) | 2,270 (34.3%) |
Disability Class: Self-Care Difficulty
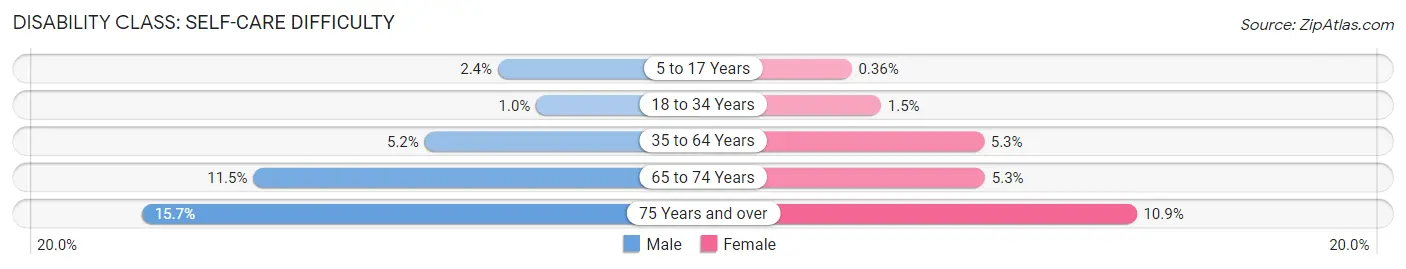
| Age Bracket | Male | Female |
| 5 to 17 Years | 421 (2.4%) | 58 (0.4%) |
| 18 to 34 Years | 230 (1.0%) | 376 (1.5%) |
| 35 to 64 Years | 1,633 (5.1%) | 2,027 (5.3%) |
| 65 to 74 Years | 916 (11.5%) | 545 (5.3%) |
| 75 Years and over | 632 (15.7%) | 724 (10.9%) |
Technology Access in Richmond County
Computing Device Access in Richmond County
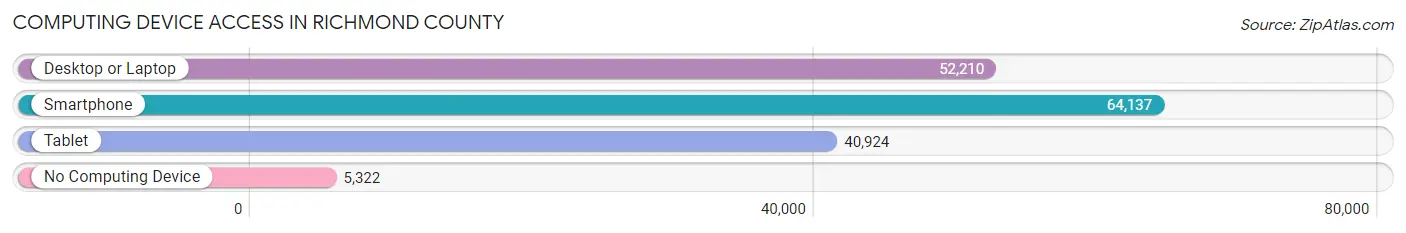
| Device Type | # Households | % Households |
| Desktop or Laptop | 52,210 | 70.5% |
| Smartphone | 64,137 | 86.6% |
| Tablet | 40,924 | 55.3% |
| No Computing Device | 5,322 | 7.2% |
| Total | 74,028 | 100.0% |
Internet Access in Richmond County
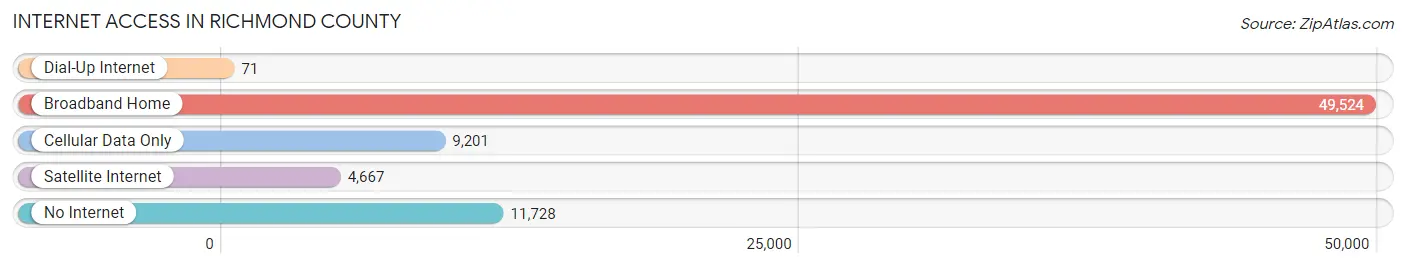
| Internet Type | # Households | % Households |
| Dial-Up Internet | 71 | 0.1% |
| Broadband Home | 49,524 | 66.9% |
| Cellular Data Only | 9,201 | 12.4% |
| Satellite Internet | 4,667 | 6.3% |
| No Internet | 11,728 | 15.8% |
| Total | 74,028 | 100.0% |
Richmond County Summary
Richmond County, Georgia is located in the east-central part of the state, and is part of the Augusta-Richmond County Metropolitan Statistical Area. It is bordered by Columbia County to the north, Burke County to the west, Jefferson County to the south, and McDuffie County to the east. The county seat is Augusta, which is also the second-largest city in the state. Richmond County is home to a population of approximately 200,000 people, and covers an area of 326 square miles.
History
Richmond County was established in 1777, and was named after Charles Lennox, the Duke of Richmond. The county was originally part of St. Paul’s Parish, which was established in 1758. The county was divided into two parishes in 1777, and the county seat was established in Augusta in 1779.
During the American Revolution, Augusta was a major supply center for the Continental Army. The city was also the site of the Battle of Augusta in 1781, which was a major victory for the American forces.
In the 19th century, Augusta became a major cotton-producing center, and the city was home to several large cotton mills. The city also became a major railroad hub, and was the site of the first Confederate ironclad warship, the CSS Georgia.
In the 20th century, Augusta became a major center for the military, with the establishment of Fort Gordon in 1941. The city also became a major center for medical research, with the establishment of the Medical College of Georgia in 1828.
Geography
Richmond County is located in the east-central part of the state, and is part of the Augusta-Richmond County Metropolitan Statistical Area. It is bordered by Columbia County to the north, Burke County to the west, Jefferson County to the south, and McDuffie County to the east. The county seat is Augusta, which is also the second-largest city in the state.
The terrain of Richmond County is mostly flat, with some rolling hills in the northern part of the county. The Savannah River forms the western border of the county, and the Ogeechee River forms the eastern border. The county is home to several lakes, including Clarks Hill Lake, Thurmond Lake, and J. Strom Thurmond Lake.
Economy
Richmond County’s economy is largely based on the military, healthcare, and tourism industries. Fort Gordon is the largest employer in the county, and is home to the U.S. Army Cyber Command. The Medical College of Georgia is also a major employer in the county, and is home to several medical research facilities.
The county is also home to several major tourist attractions, including the Augusta National Golf Club, the Augusta Museum of History, and the Morris Museum of Art. The county is also home to several major festivals, including the Augusta Jazz Festival and the Augusta Blues Festival.
Demographics
As of the 2010 census, Richmond County had a population of 200,549 people. The racial makeup of the county was 57.3% White, 36.2% African American, 0.5% Native American, 1.7% Asian, 0.1% Pacific Islander, 1.7% from other races, and 2.5% from two or more races. Hispanic or Latino of any race were 4.3% of the population.
The median income for a household in the county was $41,945, and the median income for a family was $50,945. The per capita income for the county was $21,945. About 17.3% of the population was below the poverty line.
Common Questions
What is the Total Population of Richmond County?
Total Population of Richmond County is 206,153.
What is the Total Male Population of Richmond County?
Total Male Population of Richmond County is 99,791.
What is the Total Female Population of Richmond County?
Total Female Population of Richmond County is 106,362.
What is the Ratio of Males per 100 Females in Richmond County?
There are 93.82 Males per 100 Females in Richmond County.
What is the Ratio of Females per 100 Males in Richmond County?
There are 106.58 Females per 100 Males in Richmond County.
What is the Median Population Age in Richmond County?
Median Population Age in Richmond County is 34.8 Years.
What is the Average Family Size in Richmond County
Average Family Size in Richmond County is 3.5 People.
What is the Average Household Size in Richmond County
Average Household Size in Richmond County is 2.6 People.
What is Per Capita Income in Richmond County?
Per Capita income in Richmond County is $28,480.
What is the Median Family Income in Richmond County?
Median Family Income in Richmond County is $60,993.
What is the Median Household income in Richmond County?
Median Household Income in Richmond County is $50,605.
What is Income or Wage Gap in Richmond County?
Income or Wage Gap in Richmond County is 18.1%.
Women in Richmond County earn 81.9 cents for every dollar earned by a man.
What is Family Income Deficit in Richmond County?
Family Income Deficit in Richmond County is $12,286.
Families that are below poverty line in Richmond County earn $12,286 less on average than the poverty threshold level.
What is Inequality or Gini Index in Richmond County?
Inequality or Gini Index in Richmond County is 0.49.
How Large is the Labor Force in Richmond County?
There are 101,433 People in the Labor Forcein in Richmond County.
What is the Percentage of People in the Labor Force in Richmond County?
61.9% of People are in the Labor Force in Richmond County.
What is the Unemployment Rate in Richmond County?
Unemployment Rate in Richmond County is 8.3%.