Clayton County, GA
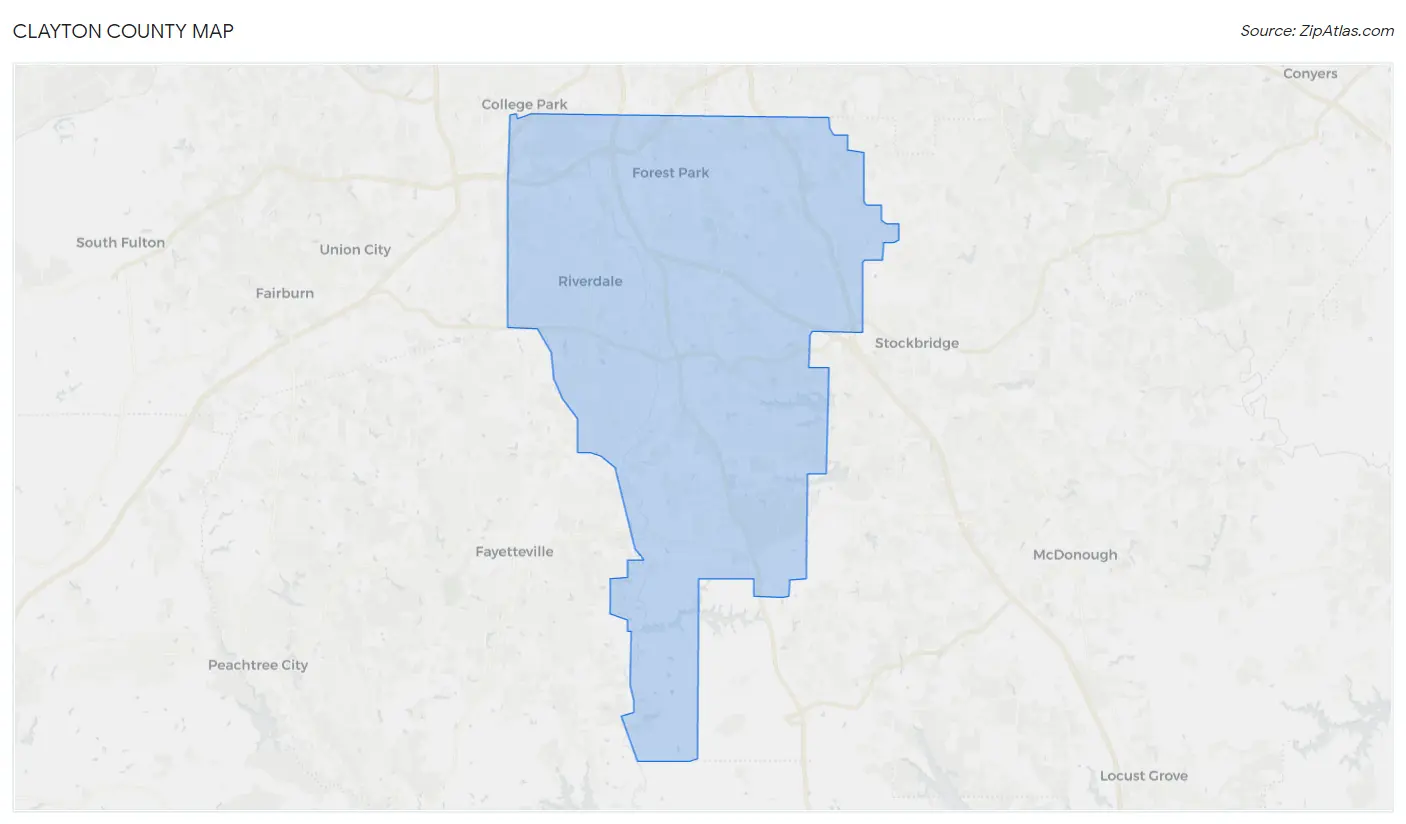
Clayton County Map
Clayton County Overview
296,312
TOTAL POPULATION
139,076
MALE POPULATION
157,236
FEMALE POPULATION
88.45
MALES / 100 FEMALES
113.06
FEMALES / 100 MALES
33.0
MEDIAN AGE
3.4
AVG FAMILY SIZE
2.8
AVG HOUSEHOLD SIZE
$25,549
PER CAPITA INCOME
$62,391
AVG FAMILY INCOME
$56,207
AVG HOUSEHOLD INCOME
15.6%
WAGE / INCOME GAP [ % ]
84.4¢/ $1
WAGE / INCOME GAP [ $ ]
$11,485
FAMILY INCOME DEFICIT
0.42
INEQUALITY / GINI INDEX
148,561
LABOR FORCE [ PEOPLE ]
66.2%
PERCENT IN LABOR FORCE
6.8%
UNEMPLOYMENT RATE
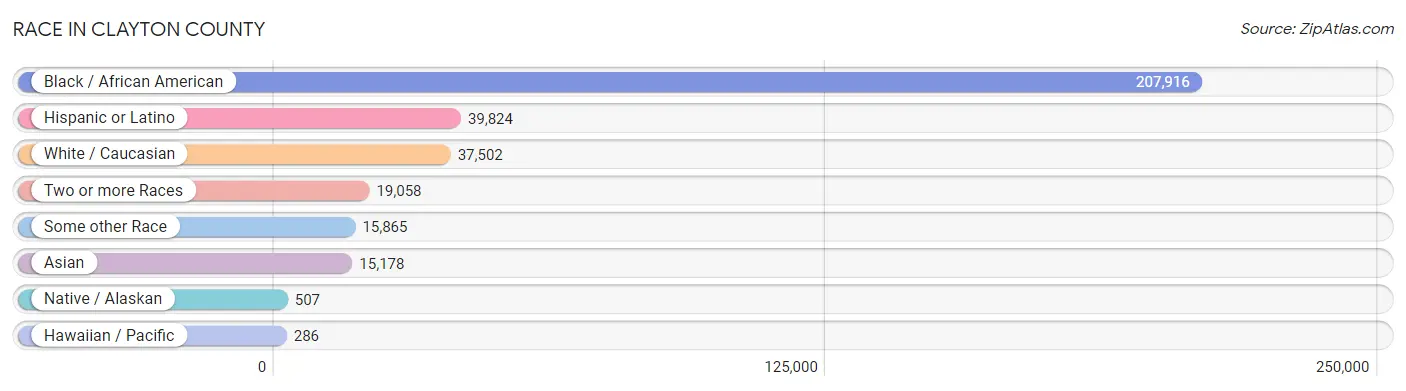
Race in Clayton County
The most populous races in Clayton County are Black / African American (207,916 | 70.2%), Hispanic or Latino (39,824 | 13.4%), and White / Caucasian (37,502 | 12.7%).
| Race | # Population | % Population |
| Asian | 15,178 | 5.1% |
| Black / African American | 207,916 | 70.2% |
| Hawaiian / Pacific | 286 | 0.1% |
| Hispanic or Latino | 39,824 | 13.4% |
| Native / Alaskan | 507 | 0.2% |
| White / Caucasian | 37,502 | 12.7% |
| Two or more Races | 19,058 | 6.4% |
| Some other Race | 15,865 | 5.3% |
| Total | 296,312 | 100.0% |
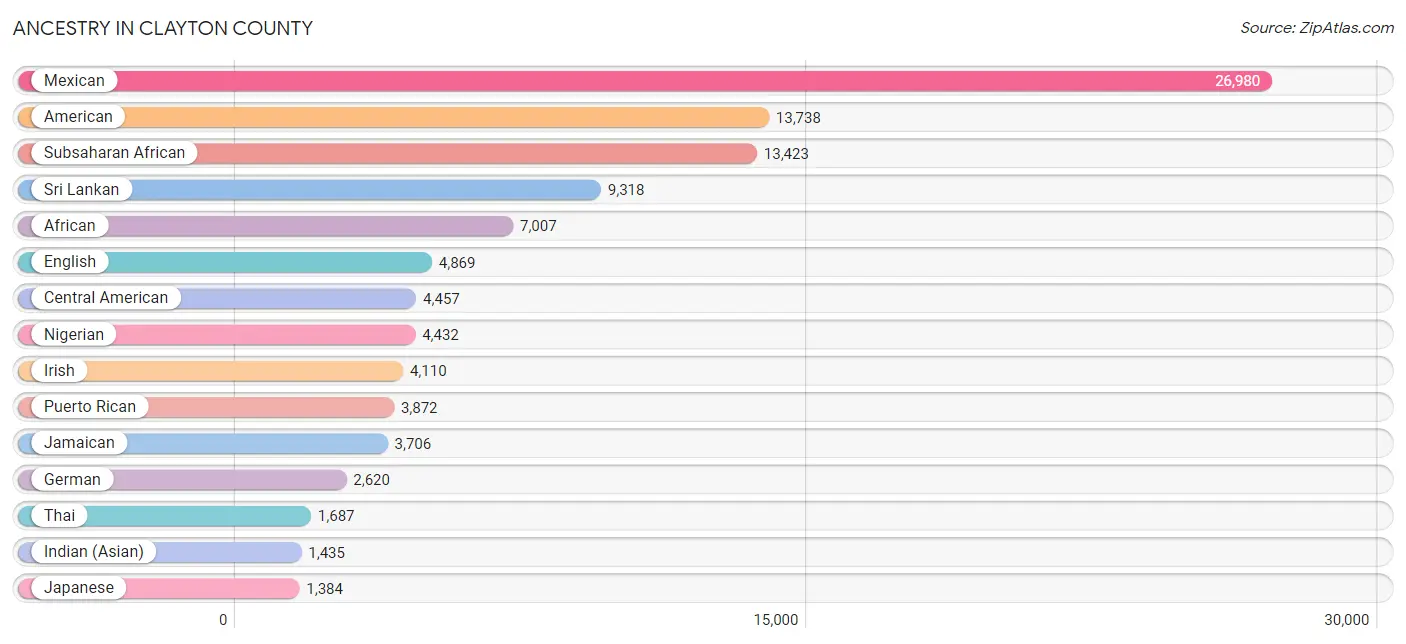
Ancestry in Clayton County
The most populous ancestries reported in Clayton County are Mexican (26,980 | 9.1%), American (13,738 | 4.6%), Subsaharan African (13,423 | 4.5%), Sri Lankan (9,318 | 3.1%), and African (7,007 | 2.4%), together accounting for 23.8% of all Clayton County residents.
| Ancestry | # Population | % Population |
| African | 7,007 | 2.4% |
| American | 13,738 | 4.6% |
| Apache | 72 | 0.0% |
| Arab | 310 | 0.1% |
| Argentinean | 7 | 0.0% |
| Austrian | 49 | 0.0% |
| Bahamian | 52 | 0.0% |
| Barbadian | 278 | 0.1% |
| Belgian | 8 | 0.0% |
| Belizean | 95 | 0.0% |
| Bermudan | 35 | 0.0% |
| Bhutanese | 403 | 0.1% |
| Blackfeet | 405 | 0.1% |
| Brazilian | 19 | 0.0% |
| British | 333 | 0.1% |
| British West Indian | 183 | 0.1% |
| Burmese | 241 | 0.1% |
| Cajun | 14 | 0.0% |
| Canadian | 3 | 0.0% |
| Cape Verdean | 64 | 0.0% |
| Central American | 4,457 | 1.5% |
| Central American Indian | 115 | 0.0% |
| Cherokee | 1,008 | 0.3% |
| Chilean | 66 | 0.0% |
| Chippewa | 21 | 0.0% |
| Choctaw | 271 | 0.1% |
| Colombian | 109 | 0.0% |
| Costa Rican | 18 | 0.0% |
| Creek | 62 | 0.0% |
| Croatian | 9 | 0.0% |
| Cuban | 738 | 0.3% |
| Czech | 43 | 0.0% |
| Danish | 57 | 0.0% |
| Dominican | 1,185 | 0.4% |
| Dutch | 157 | 0.1% |
| Eastern European | 13 | 0.0% |
| Ecuadorian | 11 | 0.0% |
| Egyptian | 270 | 0.1% |
| English | 4,869 | 1.6% |
| Ethiopian | 328 | 0.1% |
| European | 606 | 0.2% |
| French | 769 | 0.3% |
| French Canadian | 70 | 0.0% |
| German | 2,620 | 0.9% |
| Ghanaian | 832 | 0.3% |
| Greek | 25 | 0.0% |
| Guamanian / Chamorro | 257 | 0.1% |
| Guatemalan | 1,265 | 0.4% |
| Guyanese | 499 | 0.2% |
| Haitian | 1,329 | 0.4% |
| Honduran | 818 | 0.3% |
| Hopi | 113 | 0.0% |
| Hungarian | 102 | 0.0% |
| Icelander | 22 | 0.0% |
| Indian (Asian) | 1,435 | 0.5% |
| Iranian | 22 | 0.0% |
| Irish | 4,110 | 1.4% |
| Iroquois | 10 | 0.0% |
| Israeli | 473 | 0.2% |
| Italian | 801 | 0.3% |
| Jamaican | 3,706 | 1.3% |
| Japanese | 1,384 | 0.5% |
| Korean | 1,381 | 0.5% |
| Laotian | 44 | 0.0% |
| Lebanese | 16 | 0.0% |
| Liberian | 93 | 0.0% |
| Malaysian | 1,250 | 0.4% |
| Mexican | 26,980 | 9.1% |
| Mexican American Indian | 265 | 0.1% |
| Mongolian | 19 | 0.0% |
| Native Hawaiian | 83 | 0.0% |
| Navajo | 52 | 0.0% |
| Nicaraguan | 69 | 0.0% |
| Nigerian | 4,432 | 1.5% |
| Northern European | 106 | 0.0% |
| Norwegian | 62 | 0.0% |
| Pakistani | 159 | 0.1% |
| Panamanian | 1,164 | 0.4% |
| Pennsylvania German | 13 | 0.0% |
| Peruvian | 113 | 0.0% |
| Polish | 480 | 0.2% |
| Portuguese | 75 | 0.0% |
| Puerto Rican | 3,872 | 1.3% |
| Romanian | 77 | 0.0% |
| Russian | 125 | 0.0% |
| Salvadoran | 1,123 | 0.4% |
| Samoan | 19 | 0.0% |
| Scandinavian | 107 | 0.0% |
| Scotch-Irish | 753 | 0.3% |
| Scottish | 697 | 0.2% |
| Senegalese | 100 | 0.0% |
| Slavic | 10 | 0.0% |
| Slovak | 20 | 0.0% |
| Somali | 25 | 0.0% |
| South American | 944 | 0.3% |
| Spaniard | 134 | 0.1% |
| Spanish | 449 | 0.2% |
| Sri Lankan | 9,318 | 3.1% |
| Subsaharan African | 13,423 | 4.5% |
| Sudanese | 163 | 0.1% |
| Swedish | 125 | 0.0% |
| Swiss | 38 | 0.0% |
| Thai | 1,687 | 0.6% |
| Tongan | 8 | 0.0% |
| Trinidadian and Tobagonian | 803 | 0.3% |
| U.S. Virgin Islander | 189 | 0.1% |
| Ukrainian | 36 | 0.0% |
| Uruguayan | 211 | 0.1% |
| Venezuelan | 427 | 0.1% |
| Welsh | 372 | 0.1% |
| West Indian | 795 | 0.3% |
| Zimbabwean | 40 | 0.0% | View All 112 Rows |
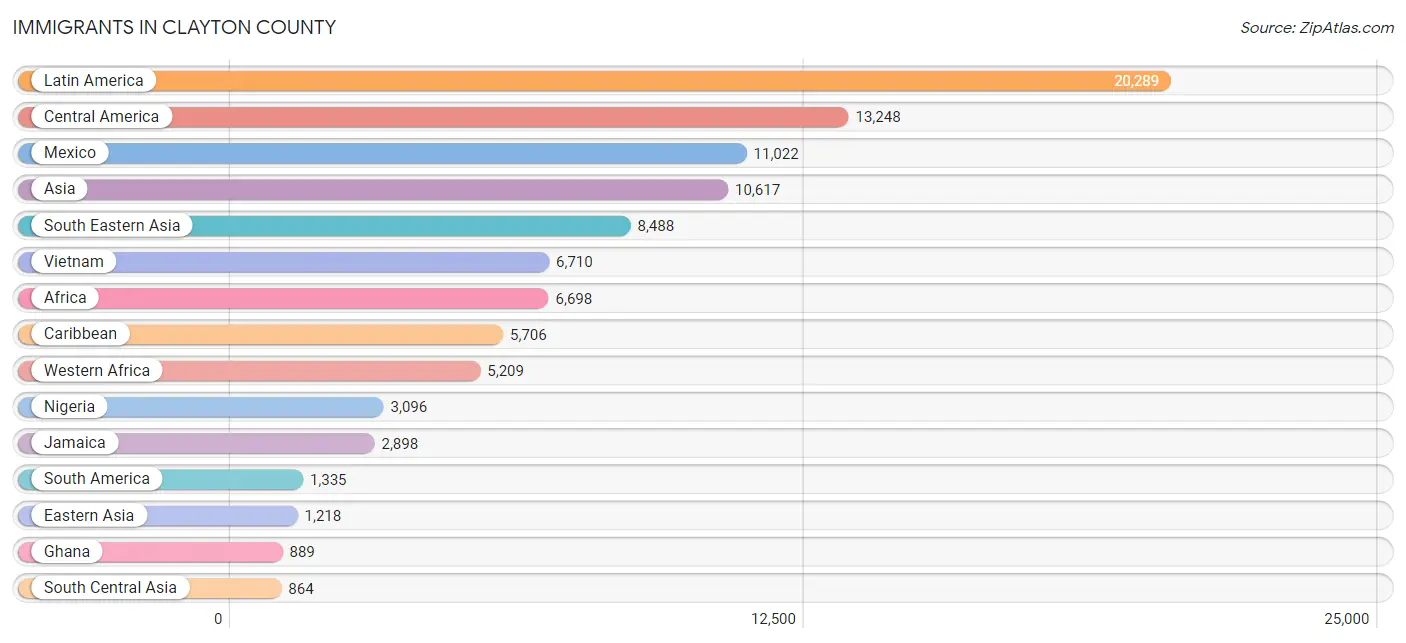
Immigrants in Clayton County
The most numerous immigrant groups reported in Clayton County came from Latin America (20,289 | 6.9%), Central America (13,248 | 4.5%), Mexico (11,022 | 3.7%), Asia (10,617 | 3.6%), and South Eastern Asia (8,488 | 2.9%), together accounting for 21.5% of all Clayton County residents.
| Immigration Origin | # Population | % Population |
| Africa | 6,698 | 2.3% |
| Argentina | 7 | 0.0% |
| Asia | 10,617 | 3.6% |
| Austria | 8 | 0.0% |
| Bahamas | 108 | 0.0% |
| Barbados | 94 | 0.0% |
| Belize | 71 | 0.0% |
| Brazil | 15 | 0.0% |
| Cambodia | 621 | 0.2% |
| Cameroon | 447 | 0.2% |
| Canada | 130 | 0.0% |
| Caribbean | 5,706 | 1.9% |
| Central America | 13,248 | 4.5% |
| Chile | 22 | 0.0% |
| China | 858 | 0.3% |
| Colombia | 142 | 0.1% |
| Cuba | 471 | 0.2% |
| Dominica | 51 | 0.0% |
| Dominican Republic | 565 | 0.2% |
| Eastern Africa | 353 | 0.1% |
| Eastern Asia | 1,218 | 0.4% |
| Eastern Europe | 54 | 0.0% |
| Ecuador | 11 | 0.0% |
| Egypt | 106 | 0.0% |
| El Salvador | 684 | 0.2% |
| England | 83 | 0.0% |
| Ethiopia | 163 | 0.1% |
| Europe | 416 | 0.1% |
| France | 46 | 0.0% |
| Germany | 115 | 0.0% |
| Ghana | 889 | 0.3% |
| Grenada | 52 | 0.0% |
| Guatemala | 525 | 0.2% |
| Guyana | 427 | 0.1% |
| Haiti | 601 | 0.2% |
| Honduras | 396 | 0.1% |
| Hong Kong | 6 | 0.0% |
| India | 819 | 0.3% |
| Indonesia | 44 | 0.0% |
| Israel | 24 | 0.0% |
| Italy | 2 | 0.0% |
| Jamaica | 2,898 | 1.0% |
| Japan | 139 | 0.1% |
| Kenya | 106 | 0.0% |
| Korea | 221 | 0.1% |
| Laos | 510 | 0.2% |
| Latin America | 20,289 | 6.9% |
| Liberia | 222 | 0.1% |
| Mexico | 11,022 | 3.7% |
| Middle Africa | 538 | 0.2% |
| Netherlands | 26 | 0.0% |
| Nicaragua | 69 | 0.0% |
| Nigeria | 3,096 | 1.0% |
| Northern Africa | 214 | 0.1% |
| Northern Europe | 155 | 0.1% |
| Pakistan | 45 | 0.0% |
| Panama | 481 | 0.2% |
| Peru | 113 | 0.0% |
| Philippines | 484 | 0.2% |
| Poland | 6 | 0.0% |
| Romania | 48 | 0.0% |
| Senegal | 81 | 0.0% |
| Sierra Leone | 316 | 0.1% |
| South America | 1,335 | 0.4% |
| South Central Asia | 864 | 0.3% |
| South Eastern Asia | 8,488 | 2.9% |
| Southern Europe | 4 | 0.0% |
| Spain | 2 | 0.0% |
| Sudan | 108 | 0.0% |
| Switzerland | 8 | 0.0% |
| Taiwan | 21 | 0.0% |
| Thailand | 119 | 0.0% |
| Trinidad and Tobago | 472 | 0.2% |
| Turkey | 23 | 0.0% |
| Uruguay | 231 | 0.1% |
| Venezuela | 350 | 0.1% |
| Vietnam | 6,710 | 2.3% |
| West Indies | 37 | 0.0% |
| Western Africa | 5,209 | 1.8% |
| Western Asia | 47 | 0.0% |
| Western Europe | 203 | 0.1% |
| Zaire | 15 | 0.0% |
| Zimbabwe | 40 | 0.0% | View All 83 Rows |
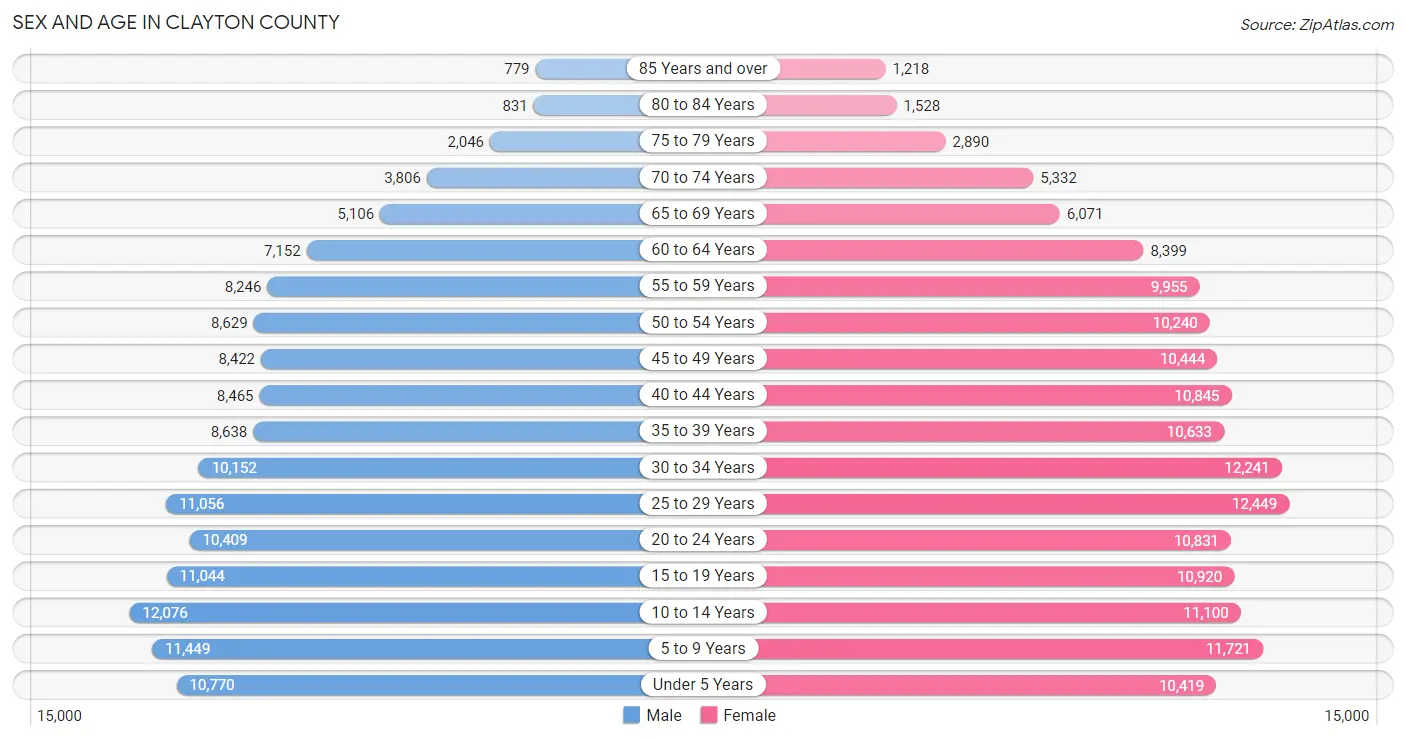
Sex and Age in Clayton County
Sex and Age in Clayton County
The most populous age groups in Clayton County are 10 to 14 Years (12,076 | 8.7%) for men and 25 to 29 Years (12,449 | 7.9%) for women.
| Age Bracket | Male | Female |
| Under 5 Years | 10,770 (7.7%) | 10,419 (6.6%) |
| 5 to 9 Years | 11,449 (8.2%) | 11,721 (7.4%) |
| 10 to 14 Years | 12,076 (8.7%) | 11,100 (7.1%) |
| 15 to 19 Years | 11,044 (7.9%) | 10,920 (6.9%) |
| 20 to 24 Years | 10,409 (7.5%) | 10,831 (6.9%) |
| 25 to 29 Years | 11,056 (8.0%) | 12,449 (7.9%) |
| 30 to 34 Years | 10,152 (7.3%) | 12,241 (7.8%) |
| 35 to 39 Years | 8,638 (6.2%) | 10,633 (6.8%) |
| 40 to 44 Years | 8,465 (6.1%) | 10,845 (6.9%) |
| 45 to 49 Years | 8,422 (6.1%) | 10,444 (6.6%) |
| 50 to 54 Years | 8,629 (6.2%) | 10,240 (6.5%) |
| 55 to 59 Years | 8,246 (5.9%) | 9,955 (6.3%) |
| 60 to 64 Years | 7,152 (5.1%) | 8,399 (5.3%) |
| 65 to 69 Years | 5,106 (3.7%) | 6,071 (3.9%) |
| 70 to 74 Years | 3,806 (2.7%) | 5,332 (3.4%) |
| 75 to 79 Years | 2,046 (1.5%) | 2,890 (1.8%) |
| 80 to 84 Years | 831 (0.6%) | 1,528 (1.0%) |
| 85 Years and over | 779 (0.6%) | 1,218 (0.8%) |
| Total | 139,076 (100.0%) | 157,236 (100.0%) |
Families and Households in Clayton County
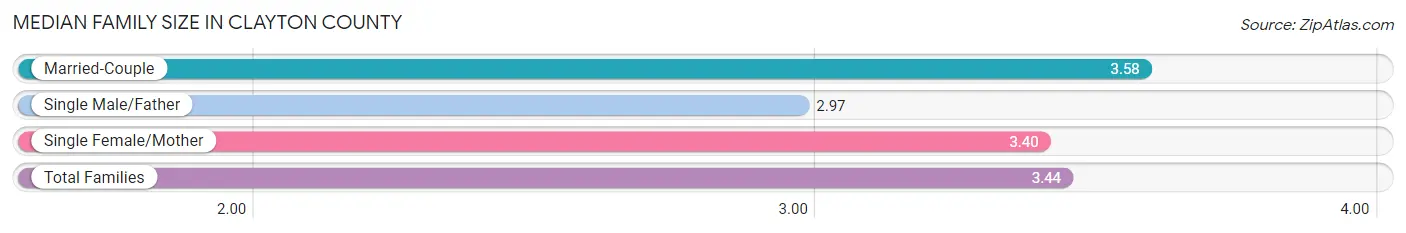
Median Family Size in Clayton County
The median family size in Clayton County is 3.44 persons per family, with married-couple families (35,014 | 50.3%) accounting for the largest median family size of 3.58 persons per family. On the other hand, single male/father families (7,378 | 10.6%) represent the smallest median family size with 2.97 persons per family.
| Family Type | # Families | Family Size |
| Married-Couple | 35,014 (50.3%) | 3.58 |
| Single Male/Father | 7,378 (10.6%) | 2.97 |
| Single Female/Mother | 27,279 (39.2%) | 3.40 |
| Total Families | 69,671 (100.0%) | 3.44 |
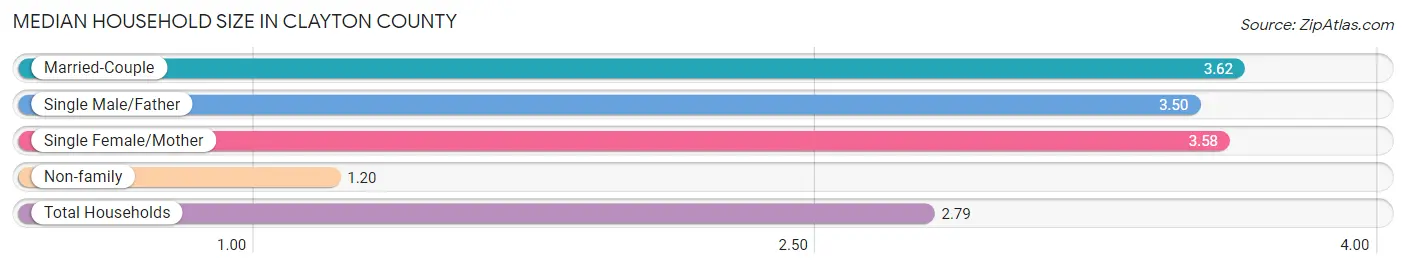
Median Household Size in Clayton County
The median household size in Clayton County is 2.79 persons per household, with married-couple households (35,014 | 33.4%) accounting for the largest median household size of 3.62 persons per household. non-family households (35,149 | 33.5%) represent the smallest median household size with 1.20 persons per household.
| Household Type | # Households | Household Size |
| Married-Couple | 35,014 (33.4%) | 3.62 |
| Single Male/Father | 7,378 (7.0%) | 3.50 |
| Single Female/Mother | 27,279 (26.0%) | 3.58 |
| Non-family | 35,149 (33.5%) | 1.20 |
| Total Households | 104,820 (100.0%) | 2.79 |
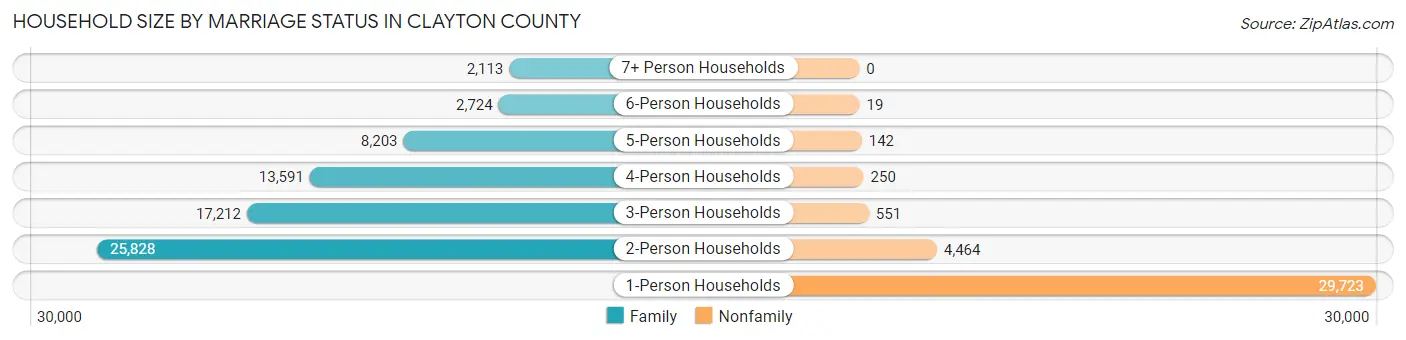
Household Size by Marriage Status in Clayton County
Out of a total of 104,820 households in Clayton County, 69,671 (66.5%) are family households, while 35,149 (33.5%) are nonfamily households. The most numerous type of family households are 2-person households, comprising 25,828, and the most common type of nonfamily households are 1-person households, comprising 29,723.
| Household Size | Family Households | Nonfamily Households |
| 1-Person Households | - | 29,723 (28.4%) |
| 2-Person Households | 25,828 (24.6%) | 4,464 (4.3%) |
| 3-Person Households | 17,212 (16.4%) | 551 (0.5%) |
| 4-Person Households | 13,591 (13.0%) | 250 (0.2%) |
| 5-Person Households | 8,203 (7.8%) | 142 (0.1%) |
| 6-Person Households | 2,724 (2.6%) | 19 (0.0%) |
| 7+ Person Households | 2,113 (2.0%) | 0 (0.0%) |
| Total | 69,671 (66.5%) | 35,149 (33.5%) |
Female Fertility in Clayton County
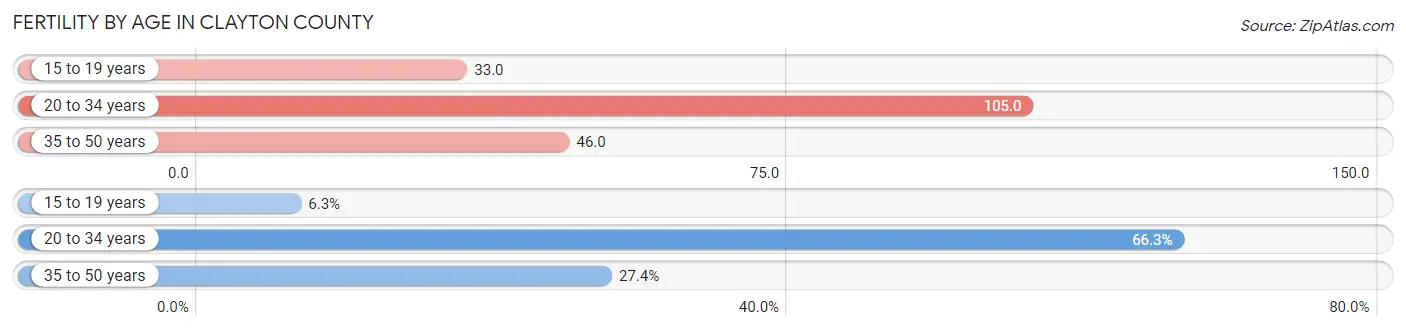
Fertility by Age in Clayton County
Average fertility rate in Clayton County is 71.0 births per 1,000 women. Women in the age bracket of 20 to 34 years have the highest fertility rate with 105.0 births per 1,000 women. Women in the age bracket of 20 to 34 years acount for 66.2% of all women with births.
| Age Bracket | Women with Births | Births / 1,000 Women |
| 15 to 19 years | 357 (6.3%) | 33.0 |
| 20 to 34 years | 3,737 (66.2%) | 105.0 |
| 35 to 50 years | 1,547 (27.4%) | 46.0 |
| Total | 5,641 (100.0%) | 71.0 |
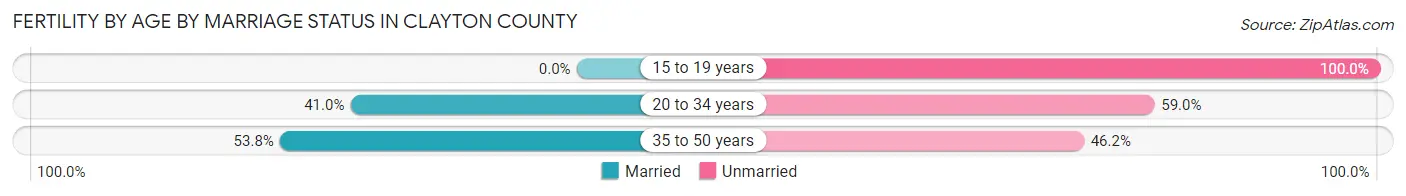
Fertility by Age by Marriage Status in Clayton County
41.9% of women with births (5,641) in Clayton County are married. The highest percentage of unmarried women with births falls into 15 to 19 years age bracket with 100.0% of them unmarried at the time of birth, while the lowest percentage of unmarried women with births belong to 35 to 50 years age bracket with 46.2% of them unmarried.
| Age Bracket | Married | Unmarried |
| 15 to 19 years | 0 (0.0%) | 357 (100.0%) |
| 20 to 34 years | 1,532 (41.0%) | 2,205 (59.0%) |
| 35 to 50 years | 832 (53.8%) | 715 (46.2%) |
| Total | 2,364 (41.9%) | 3,277 (58.1%) |
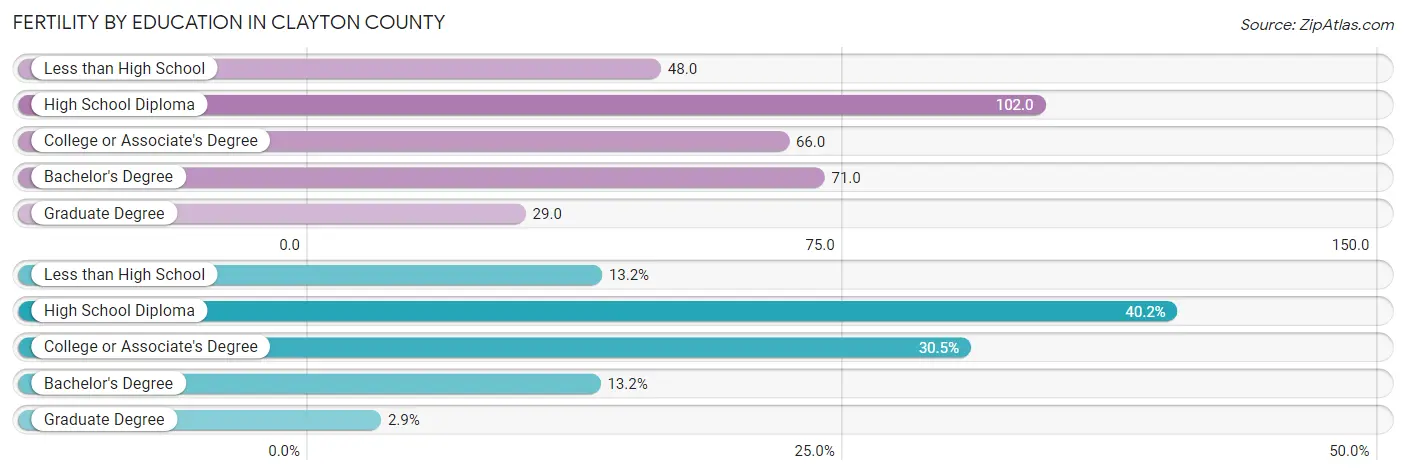
Fertility by Education in Clayton County
Average fertility rate in Clayton County is 71.0 births per 1,000 women. Women with the education attainment of high school diploma have the highest fertility rate of 102.0 births per 1,000 women, while women with the education attainment of graduate degree have the lowest fertility at 29.0 births per 1,000 women. Women with the education attainment of high school diploma represent 40.2% of all women with births.
| Educational Attainment | Women with Births | Births / 1,000 Women |
| Less than High School | 747 (13.2%) | 48.0 |
| High School Diploma | 2,267 (40.2%) | 102.0 |
| College or Associate's Degree | 1,721 (30.5%) | 66.0 |
| Bachelor's Degree | 743 (13.2%) | 71.0 |
| Graduate Degree | 163 (2.9%) | 29.0 |
| Total | 5,641 (100.0%) | 71.0 |
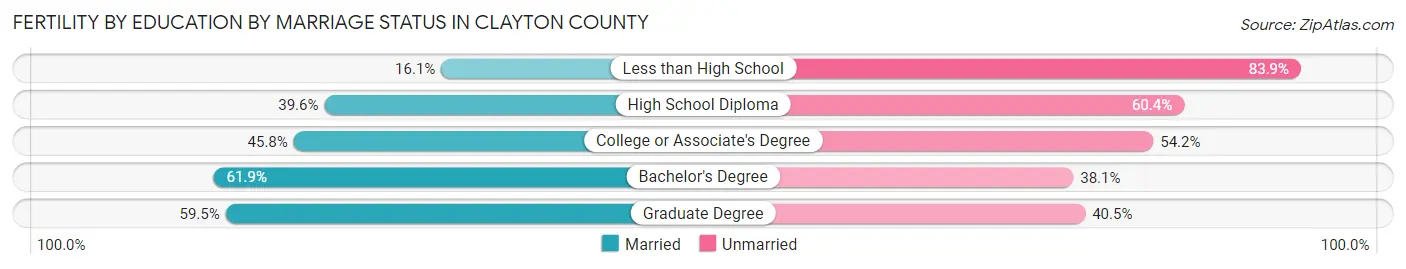
Fertility by Education by Marriage Status in Clayton County
58.1% of women with births in Clayton County are unmarried. Women with the educational attainment of bachelor's degree are most likely to be married with 61.9% of them married at childbirth, while women with the educational attainment of less than high school are least likely to be married with 83.9% of them unmarried at childbirth.
| Educational Attainment | Married | Unmarried |
| Less than High School | 120 (16.1%) | 627 (83.9%) |
| High School Diploma | 898 (39.6%) | 1,369 (60.4%) |
| College or Associate's Degree | 788 (45.8%) | 933 (54.2%) |
| Bachelor's Degree | 460 (61.9%) | 283 (38.1%) |
| Graduate Degree | 97 (59.5%) | 66 (40.5%) |
| Total | 2,364 (41.9%) | 3,277 (58.1%) |
Income in Clayton County
Income Overview in Clayton County
Per Capita Income in Clayton County is $25,549, while median incomes of families and households are $62,391 and $56,207 respectively.
| Characteristic | Number | Measure |
| Per Capita Income | 296,312 | $25,549 |
| Median Family Income | 69,671 | $62,391 |
| Mean Family Income | 69,671 | $78,558 |
| Median Household Income | 104,820 | $56,207 |
| Mean Household Income | 104,820 | $70,517 |
| Income Deficit | 69,671 | $11,485 |
| Wage / Income Gap (%) | 296,312 | 15.56% |
| Wage / Income Gap ($) | 296,312 | 84.44¢ per $1 |
| Gini / Inequality Index | 296,312 | 0.42 |
Earnings by Sex in Clayton County
Average Earnings in Clayton County are $33,808, $36,773 for men and $31,050 for women, a difference of 15.6%.
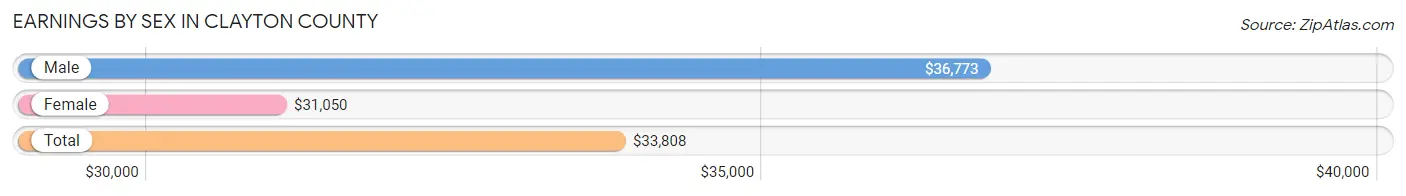
| Sex | Number | Average Earnings |
| Male | 70,943 (47.2%) | $36,773 |
| Female | 79,324 (52.8%) | $31,050 |
| Total | 150,267 (100.0%) | $33,808 |
Earnings by Sex by Income Bracket in Clayton County
The most common earnings brackets in Clayton County are $30,000 to $34,999 for men (6,150 | 8.7%) and $25,000 to $29,999 for women (7,851 | 9.9%).
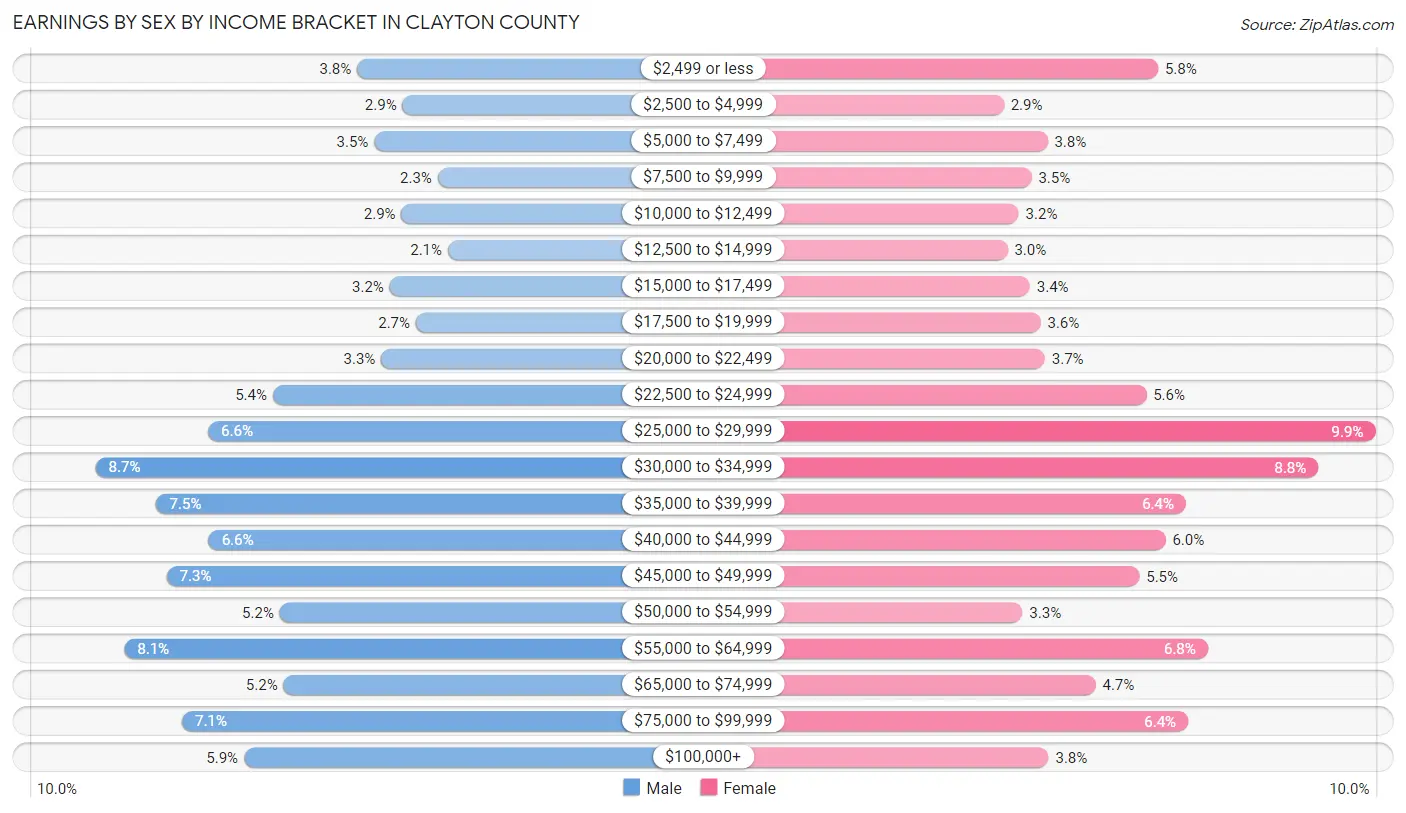
| Income | Male | Female |
| $2,499 or less | 2,677 (3.8%) | 4,621 (5.8%) |
| $2,500 to $4,999 | 2,073 (2.9%) | 2,333 (2.9%) |
| $5,000 to $7,499 | 2,447 (3.5%) | 2,980 (3.8%) |
| $7,500 to $9,999 | 1,600 (2.3%) | 2,742 (3.5%) |
| $10,000 to $12,499 | 2,087 (2.9%) | 2,556 (3.2%) |
| $12,500 to $14,999 | 1,469 (2.1%) | 2,391 (3.0%) |
| $15,000 to $17,499 | 2,245 (3.2%) | 2,724 (3.4%) |
| $17,500 to $19,999 | 1,891 (2.7%) | 2,880 (3.6%) |
| $20,000 to $22,499 | 2,354 (3.3%) | 2,942 (3.7%) |
| $22,500 to $24,999 | 3,798 (5.3%) | 4,447 (5.6%) |
| $25,000 to $29,999 | 4,655 (6.6%) | 7,851 (9.9%) |
| $30,000 to $34,999 | 6,150 (8.7%) | 7,003 (8.8%) |
| $35,000 to $39,999 | 5,340 (7.5%) | 5,040 (6.4%) |
| $40,000 to $44,999 | 4,648 (6.6%) | 4,735 (6.0%) |
| $45,000 to $49,999 | 5,208 (7.3%) | 4,350 (5.5%) |
| $50,000 to $54,999 | 3,700 (5.2%) | 2,607 (3.3%) |
| $55,000 to $64,999 | 5,765 (8.1%) | 5,364 (6.8%) |
| $65,000 to $74,999 | 3,651 (5.1%) | 3,694 (4.7%) |
| $75,000 to $99,999 | 5,004 (7.0%) | 5,066 (6.4%) |
| $100,000+ | 4,181 (5.9%) | 2,998 (3.8%) |
| Total | 70,943 (100.0%) | 79,324 (100.0%) |
Earnings by Sex by Educational Attainment in Clayton County
Average earnings in Clayton County are $40,735 for men and $34,111 for women, a difference of 16.3%. Men with an educational attainment of graduate degree enjoy the highest average annual earnings of $57,031, while those with less than high school education earn the least with $37,016. Women with an educational attainment of graduate degree earn the most with the average annual earnings of $61,517, while those with less than high school education have the smallest earnings of $23,992.
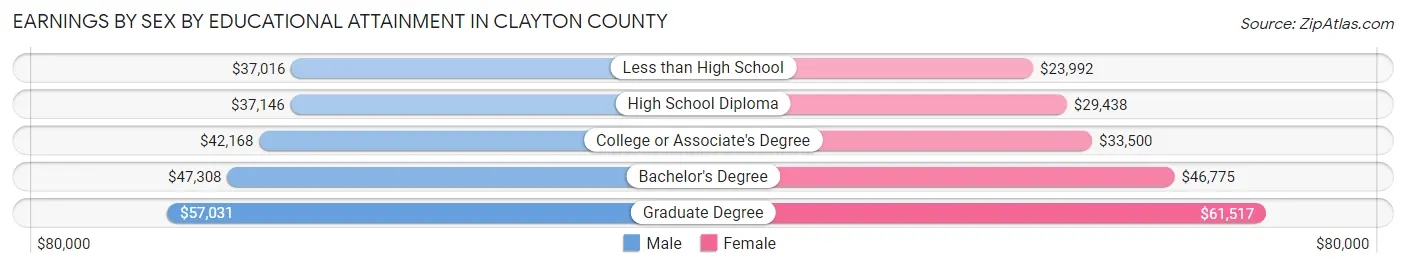
| Educational Attainment | Male Income | Female Income |
| Less than High School | $37,016 | $23,992 |
| High School Diploma | $37,146 | $29,438 |
| College or Associate's Degree | $42,168 | $33,500 |
| Bachelor's Degree | $47,308 | $46,775 |
| Graduate Degree | $57,031 | $61,517 |
| Total | $40,735 | $34,111 |
Family Income in Clayton County
Family Income Brackets in Clayton County
According to the Clayton County family income data, there are 13,934 families falling into the $50,000 to $74,999 income range, which is the most common income bracket and makes up 20.0% of all families. Conversely, the $10,000 to $14,999 income bracket is the least frequent group with only 1,742 families (2.5%) belonging to this category.
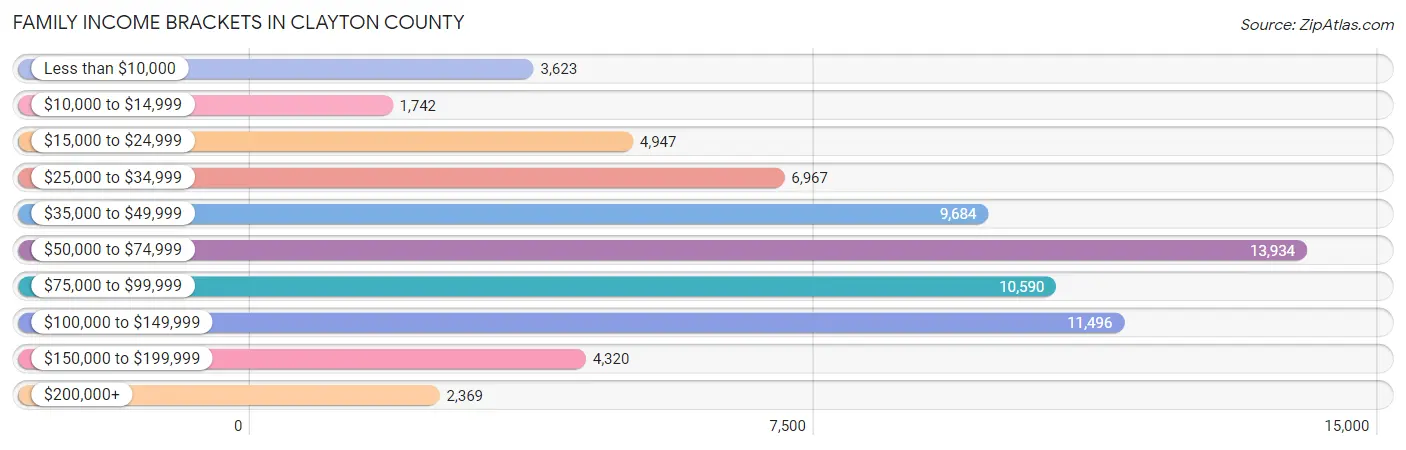
| Income Bracket | # Families | % Families |
| Less than $10,000 | 3,623 | 5.2% |
| $10,000 to $14,999 | 1,742 | 2.5% |
| $15,000 to $24,999 | 4,947 | 7.1% |
| $25,000 to $34,999 | 6,967 | 10.0% |
| $35,000 to $49,999 | 9,684 | 13.9% |
| $50,000 to $74,999 | 13,934 | 20.0% |
| $75,000 to $99,999 | 10,590 | 15.2% |
| $100,000 to $149,999 | 11,496 | 16.5% |
| $150,000 to $199,999 | 4,320 | 6.2% |
| $200,000+ | 2,369 | 3.4% |
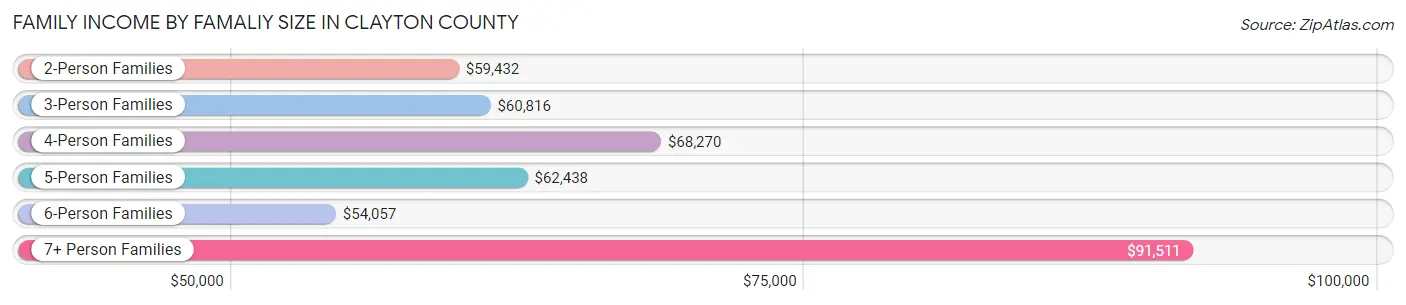
Family Income by Famaliy Size in Clayton County
7+ person families (1,843 | 2.6%) account for the highest median family income in Clayton County with $91,511 per family, while 2-person families (30,004 | 43.1%) have the highest median income of $29,716 per family member.
| Income Bracket | # Families | Median Income |
| 2-Person Families | 30,004 (43.1%) | $59,432 |
| 3-Person Families | 16,396 (23.5%) | $60,816 |
| 4-Person Families | 11,980 (17.2%) | $68,270 |
| 5-Person Families | 6,896 (9.9%) | $62,438 |
| 6-Person Families | 2,552 (3.7%) | $54,057 |
| 7+ Person Families | 1,843 (2.6%) | $91,511 |
| Total | 69,671 (100.0%) | $62,391 |
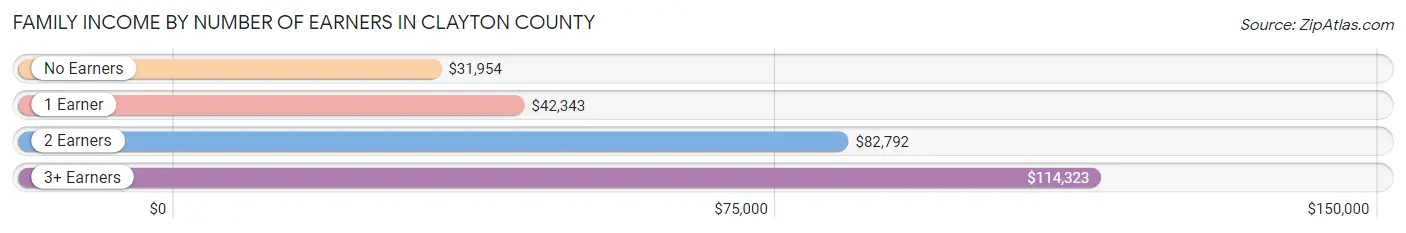
Family Income by Number of Earners in Clayton County
The median family income in Clayton County is $62,391, with families comprising 3+ earners (8,476) having the highest median family income of $114,323, while families with no earners (7,982) have the lowest median family income of $31,954, accounting for 12.2% and 11.5% of families, respectively.
| Number of Earners | # Families | Median Income |
| No Earners | 7,982 (11.5%) | $31,954 |
| 1 Earner | 27,147 (39.0%) | $42,343 |
| 2 Earners | 26,066 (37.4%) | $82,792 |
| 3+ Earners | 8,476 (12.2%) | $114,323 |
| Total | 69,671 (100.0%) | $62,391 |
Household Income in Clayton County
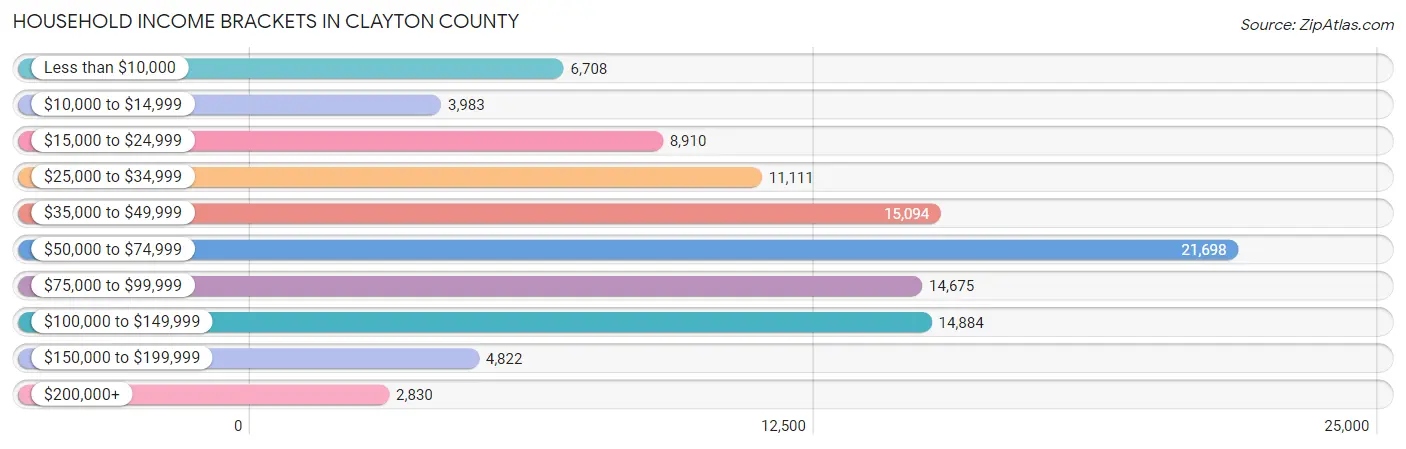
Household Income Brackets in Clayton County
With 21,698 households falling in the category, the $50,000 to $74,999 income range is the most frequent in Clayton County, accounting for 20.7% of all households. In contrast, only 2,830 households (2.7%) fall into the $200,000+ income bracket, making it the least populous group.
| Income Bracket | # Households | % Households |
| Less than $10,000 | 6,708 | 6.4% |
| $10,000 to $14,999 | 3,983 | 3.8% |
| $15,000 to $24,999 | 8,910 | 8.5% |
| $25,000 to $34,999 | 11,111 | 10.6% |
| $35,000 to $49,999 | 15,094 | 14.4% |
| $50,000 to $74,999 | 21,698 | 20.7% |
| $75,000 to $99,999 | 14,675 | 14.0% |
| $100,000 to $149,999 | 14,884 | 14.2% |
| $150,000 to $199,999 | 4,822 | 4.6% |
| $200,000+ | 2,830 | 2.7% |
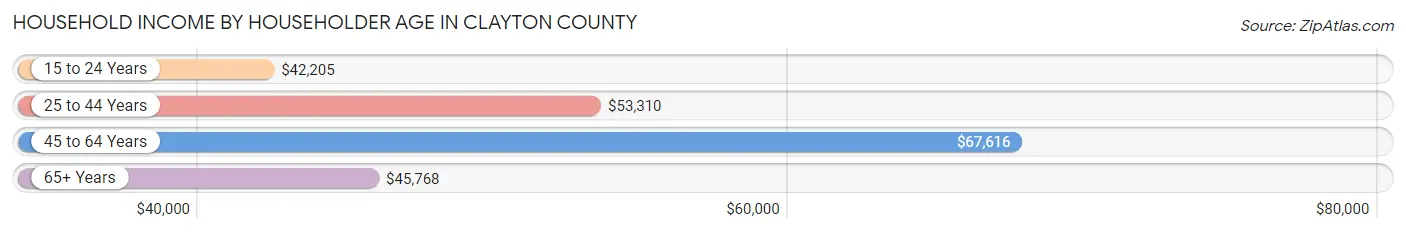
Household Income by Householder Age in Clayton County
The median household income in Clayton County is $56,207, with the highest median household income of $67,616 found in the 45 to 64 years age bracket for the primary householder. A total of 42,733 households (40.8%) fall into this category. Meanwhile, the 15 to 24 years age bracket for the primary householder has the lowest median household income of $42,205, with 3,588 households (3.4%) in this group.
| Income Bracket | # Households | Median Income |
| 15 to 24 Years | 3,588 (3.4%) | $42,205 |
| 25 to 44 Years | 39,584 (37.8%) | $53,310 |
| 45 to 64 Years | 42,733 (40.8%) | $67,616 |
| 65+ Years | 18,915 (18.0%) | $45,768 |
| Total | 104,820 (100.0%) | $56,207 |
Poverty in Clayton County
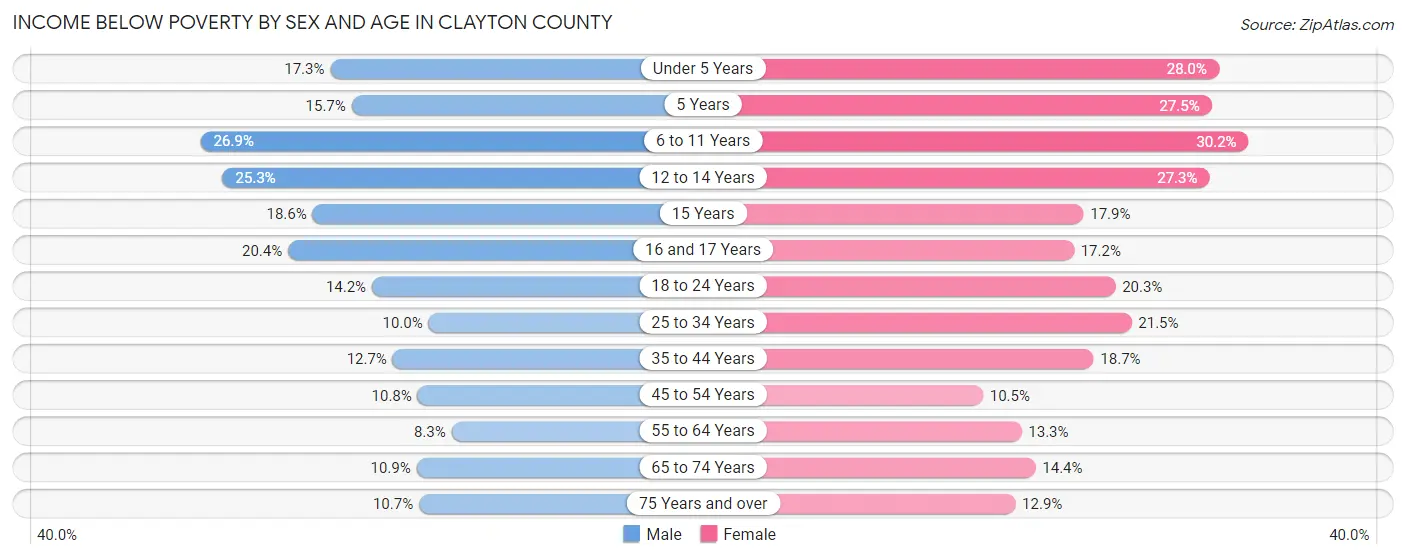
Income Below Poverty by Sex and Age in Clayton County
With 14.4% poverty level for males and 19.1% for females among the residents of Clayton County, 6 to 11 year old males and 6 to 11 year old females are the most vulnerable to poverty, with 3,555 males (26.9%) and 4,197 females (30.2%) in their respective age groups living below the poverty level.
| Age Bracket | Male | Female |
| Under 5 Years | 1,860 (17.3%) | 2,890 (28.0%) |
| 5 Years | 427 (15.7%) | 544 (27.5%) |
| 6 to 11 Years | 3,555 (26.9%) | 4,197 (30.2%) |
| 12 to 14 Years | 1,874 (25.3%) | 1,755 (27.3%) |
| 15 Years | 474 (18.6%) | 324 (17.9%) |
| 16 and 17 Years | 902 (20.4%) | 857 (17.2%) |
| 18 to 24 Years | 1,989 (14.2%) | 2,904 (20.3%) |
| 25 to 34 Years | 2,052 (10.0%) | 5,283 (21.5%) |
| 35 to 44 Years | 2,111 (12.7%) | 4,003 (18.7%) |
| 45 to 54 Years | 1,780 (10.8%) | 2,161 (10.5%) |
| 55 to 64 Years | 1,255 (8.3%) | 2,443 (13.3%) |
| 65 to 74 Years | 961 (10.9%) | 1,630 (14.4%) |
| 75 Years and over | 383 (10.7%) | 699 (12.9%) |
| Total | 19,623 (14.4%) | 29,690 (19.1%) |
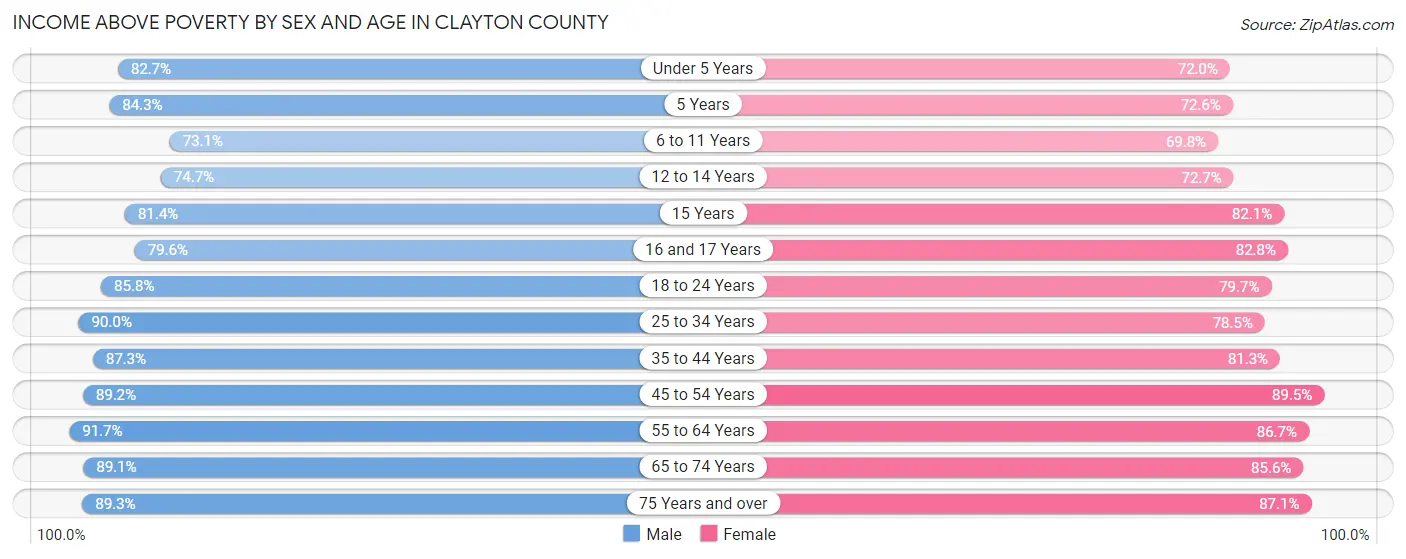
Income Above Poverty by Sex and Age in Clayton County
According to the poverty statistics in Clayton County, males aged 55 to 64 years and females aged 45 to 54 years are the age groups that are most secure financially, with 91.7% of males and 89.5% of females in these age groups living above the poverty line.
| Age Bracket | Male | Female |
| Under 5 Years | 8,891 (82.7%) | 7,434 (72.0%) |
| 5 Years | 2,289 (84.3%) | 1,438 (72.6%) |
| 6 to 11 Years | 9,640 (73.1%) | 9,707 (69.8%) |
| 12 to 14 Years | 5,531 (74.7%) | 4,679 (72.7%) |
| 15 Years | 2,071 (81.4%) | 1,483 (82.1%) |
| 16 and 17 Years | 3,510 (79.6%) | 4,119 (82.8%) |
| 18 to 24 Years | 12,008 (85.8%) | 11,402 (79.7%) |
| 25 to 34 Years | 18,443 (90.0%) | 19,287 (78.5%) |
| 35 to 44 Years | 14,553 (87.3%) | 17,427 (81.3%) |
| 45 to 54 Years | 14,666 (89.2%) | 18,472 (89.5%) |
| 55 to 64 Years | 13,870 (91.7%) | 15,880 (86.7%) |
| 65 to 74 Years | 7,858 (89.1%) | 9,714 (85.6%) |
| 75 Years and over | 3,189 (89.3%) | 4,731 (87.1%) |
| Total | 116,519 (85.6%) | 125,773 (80.9%) |
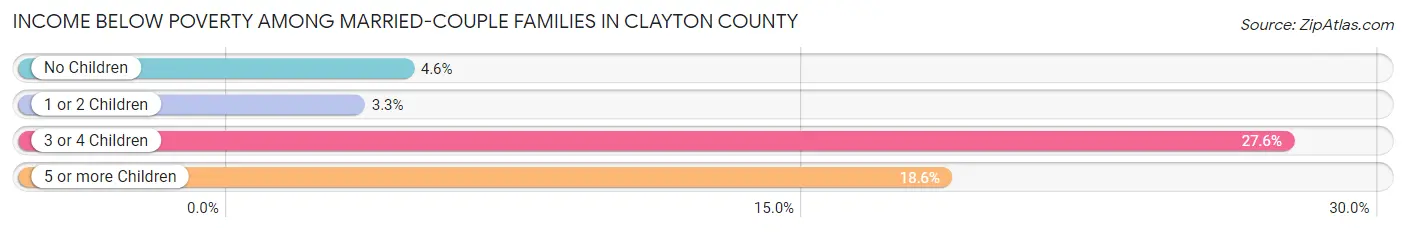
Income Below Poverty Among Married-Couple Families in Clayton County
The poverty statistics for married-couple families in Clayton County show that 6.7% or 2,361 of the total 35,014 families live below the poverty line. Families with 3 or 4 children have the highest poverty rate of 27.6%, comprising of 1,045 families. On the other hand, families with 1 or 2 children have the lowest poverty rate of 3.3%, which includes 383 families.
| Children | Above Poverty | Below Poverty |
| No Children | 18,552 (95.4%) | 892 (4.6%) |
| 1 or 2 Children | 11,176 (96.7%) | 383 (3.3%) |
| 3 or 4 Children | 2,746 (72.4%) | 1,045 (27.6%) |
| 5 or more Children | 179 (81.4%) | 41 (18.6%) |
| Total | 32,653 (93.3%) | 2,361 (6.7%) |
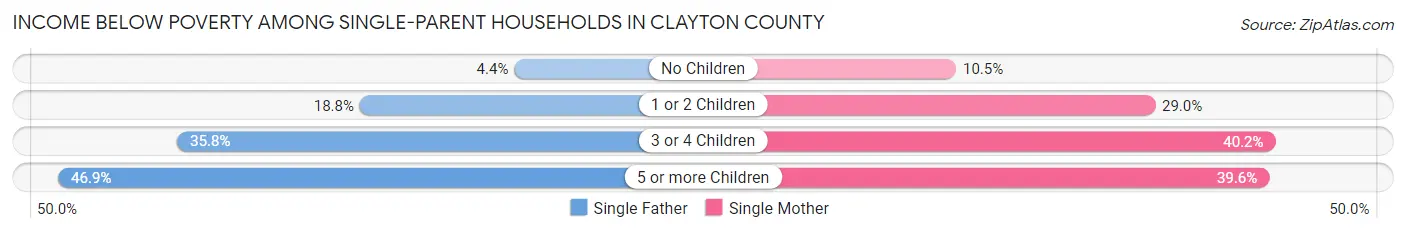
Income Below Poverty Among Single-Parent Households in Clayton County
According to the poverty data in Clayton County, 12.1% or 892 single-father households and 23.6% or 6,429 single-mother households are living below the poverty line. Among single-father households, those with 5 or more children have the highest poverty rate, with 30 households (46.9%) experiencing poverty. Likewise, among single-mother households, those with 3 or 4 children have the highest poverty rate, with 1,588 households (40.2%) falling below the poverty line.
| Children | Single Father | Single Mother |
| No Children | 175 (4.4%) | 1,106 (10.5%) |
| 1 or 2 Children | 561 (18.8%) | 3,611 (29.0%) |
| 3 or 4 Children | 126 (35.8%) | 1,588 (40.2%) |
| 5 or more Children | 30 (46.9%) | 124 (39.6%) |
| Total | 892 (12.1%) | 6,429 (23.6%) |
Income Below Poverty Among Married-Couple vs Single-Parent Households in Clayton County
The poverty data for Clayton County shows that 2,361 of the married-couple family households (6.7%) and 7,321 of the single-parent households (21.1%) are living below the poverty level. Within the married-couple family households, those with 3 or 4 children have the highest poverty rate, with 1,045 households (27.6%) falling below the poverty line. Among the single-parent households, those with 5 or more children have the highest poverty rate, with 154 household (40.8%) living below poverty.
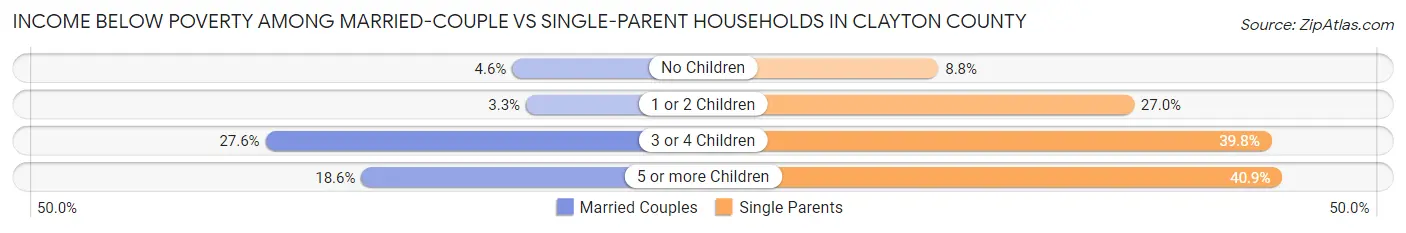
| Children | Married-Couple Families | Single-Parent Households |
| No Children | 892 (4.6%) | 1,281 (8.8%) |
| 1 or 2 Children | 383 (3.3%) | 4,172 (27.0%) |
| 3 or 4 Children | 1,045 (27.6%) | 1,714 (39.8%) |
| 5 or more Children | 41 (18.6%) | 154 (40.8%) |
| Total | 2,361 (6.7%) | 7,321 (21.1%) |
Employment Characteristics in Clayton County
Employment by Class of Employer in Clayton County
Among the 134,762 employed individuals in Clayton County, private company employees (97,555 | 72.4%), local government employees (9,733 | 7.2%), and not-for-profit organizations (7,693 | 5.7%) make up the most common classes of employment.
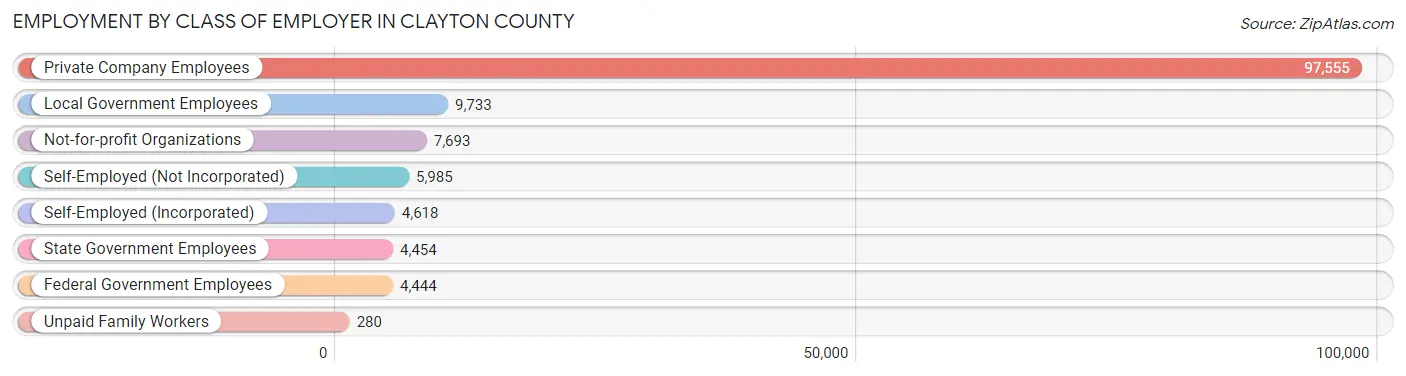
| Employer Class | # Employees | % Employees |
| Private Company Employees | 97,555 | 72.4% |
| Self-Employed (Incorporated) | 4,618 | 3.4% |
| Self-Employed (Not Incorporated) | 5,985 | 4.4% |
| Not-for-profit Organizations | 7,693 | 5.7% |
| Local Government Employees | 9,733 | 7.2% |
| State Government Employees | 4,454 | 3.3% |
| Federal Government Employees | 4,444 | 3.3% |
| Unpaid Family Workers | 280 | 0.2% |
| Total | 134,762 | 100.0% |
Employment Status by Age in Clayton County
According to the labor force statistics for Clayton County, out of the total population over 16 years of age (224,412), 66.2% or 148,561 individuals are in the labor force, with 6.8% or 10,102 of them unemployed. The age group with the highest labor force participation rate is 25 to 29 years, with 83.5% or 19,627 individuals in the labor force. Within the labor force, the 20 to 24 years age range has the highest percentage of unemployed individuals, with 14.9% or 2,351 of them being unemployed.
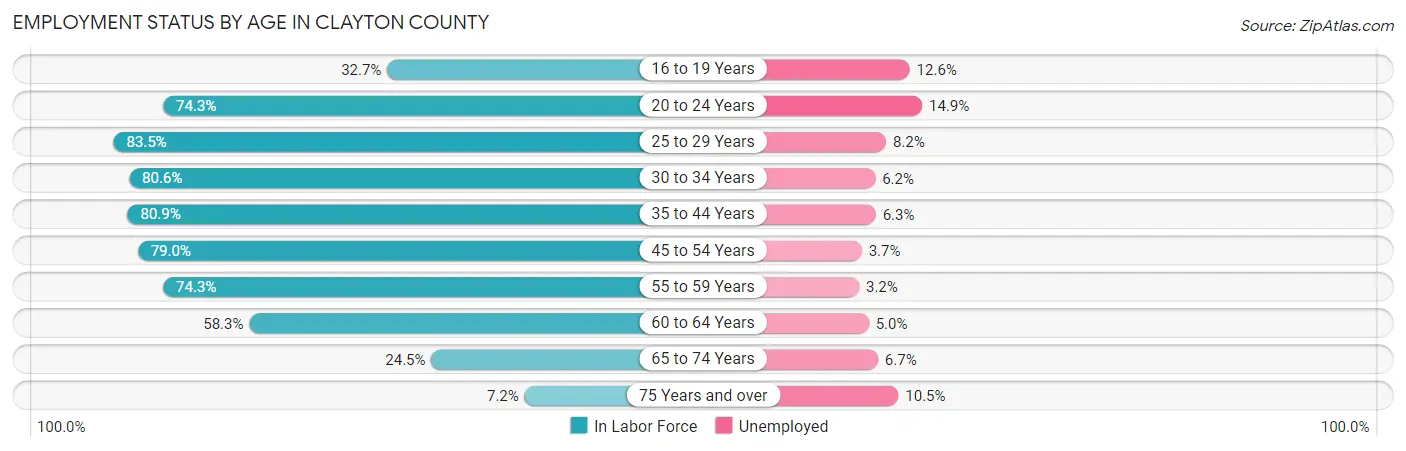
| Age Bracket | In Labor Force | Unemployed |
| 16 to 19 Years | 5,755 (32.7%) | 725 (12.6%) |
| 20 to 24 Years | 15,781 (74.3%) | 2,351 (14.9%) |
| 25 to 29 Years | 19,627 (83.5%) | 1,609 (8.2%) |
| 30 to 34 Years | 18,049 (80.6%) | 1,119 (6.2%) |
| 35 to 44 Years | 31,212 (80.9%) | 1,966 (6.3%) |
| 45 to 54 Years | 29,811 (79.0%) | 1,103 (3.7%) |
| 55 to 59 Years | 13,523 (74.3%) | 433 (3.2%) |
| 60 to 64 Years | 9,066 (58.3%) | 453 (5.0%) |
| 65 to 74 Years | 4,977 (24.5%) | 333 (6.7%) |
| 75 Years and over | 669 (7.2%) | 70 (10.5%) |
| Total | 148,561 (66.2%) | 10,102 (6.8%) |
Employment Status by Educational Attainment in Clayton County
According to labor force statistics for Clayton County, 77.8% of individuals (121,342) out of the total population between 25 and 64 years of age (155,966) are in the labor force, with 5.5% or 6,674 of them being unemployed. The group with the highest labor force participation rate are those with the educational attainment of bachelor's degree or higher, with 87.2% or 28,348 individuals in the labor force. Within the labor force, individuals with less than high school education have the highest percentage of unemployment, with 6.6% or 838 of them being unemployed.
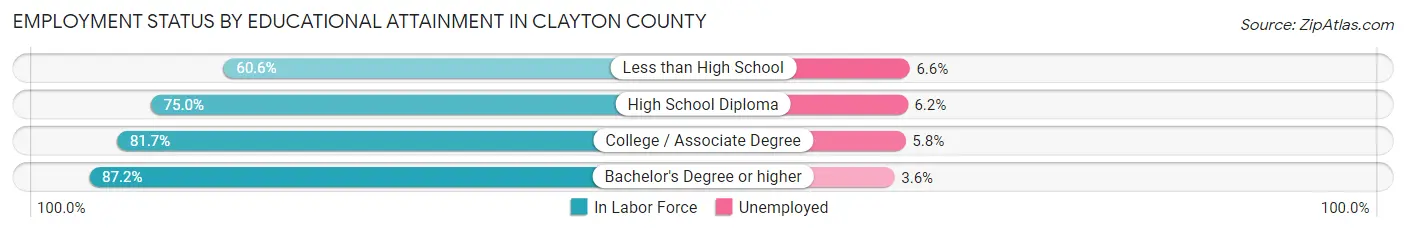
| Educational Attainment | In Labor Force | Unemployed |
| Less than High School | 12,704 (60.6%) | 1,384 (6.6%) |
| High School Diploma | 39,216 (75.0%) | 3,242 (6.2%) |
| College / Associate Degree | 41,018 (81.7%) | 2,912 (5.8%) |
| Bachelor's Degree or higher | 28,348 (87.2%) | 1,170 (3.6%) |
| Total | 121,342 (77.8%) | 8,578 (5.5%) |
Employment Occupations by Sex in Clayton County
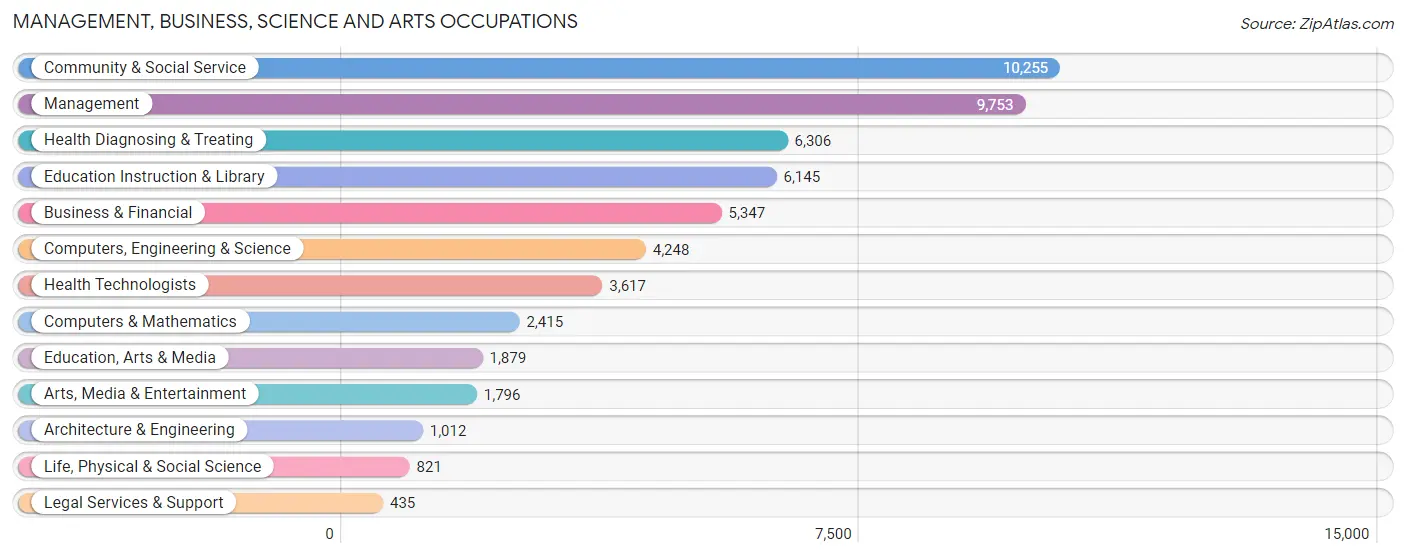
Management, Business, Science and Arts Occupations
The most common Management, Business, Science and Arts occupations in Clayton County are Community & Social Service (10,255 | 7.4%), Management (9,753 | 7.1%), Health Diagnosing & Treating (6,306 | 4.6%), Education Instruction & Library (6,145 | 4.4%), and Business & Financial (5,347 | 3.9%).
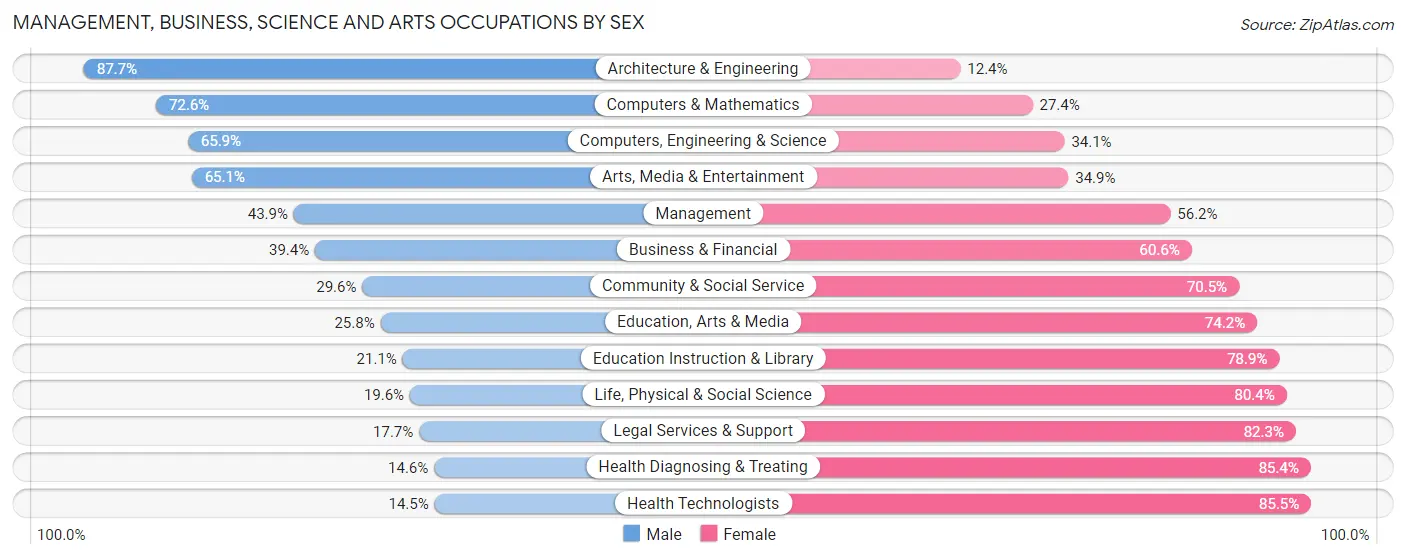
Management, Business, Science and Arts Occupations by Sex
Within the Management, Business, Science and Arts occupations in Clayton County, the most male-oriented occupations are Architecture & Engineering (87.6%), Computers & Mathematics (72.6%), and Computers, Engineering & Science (65.9%), while the most female-oriented occupations are Health Technologists (85.5%), Health Diagnosing & Treating (85.4%), and Legal Services & Support (82.3%).
| Occupation | Male | Female |
| Management | 4,277 (43.9%) | 5,476 (56.1%) |
| Business & Financial | 2,107 (39.4%) | 3,240 (60.6%) |
| Computers, Engineering & Science | 2,801 (65.9%) | 1,447 (34.1%) |
| Computers & Mathematics | 1,753 (72.6%) | 662 (27.4%) |
| Architecture & Engineering | 887 (87.6%) | 125 (12.3%) |
| Life, Physical & Social Science | 161 (19.6%) | 660 (80.4%) |
| Community & Social Service | 3,030 (29.5%) | 7,225 (70.5%) |
| Education, Arts & Media | 484 (25.8%) | 1,395 (74.2%) |
| Legal Services & Support | 77 (17.7%) | 358 (82.3%) |
| Education Instruction & Library | 1,299 (21.1%) | 4,846 (78.9%) |
| Arts, Media & Entertainment | 1,170 (65.1%) | 626 (34.9%) |
| Health Diagnosing & Treating | 919 (14.6%) | 5,387 (85.4%) |
| Health Technologists | 524 (14.5%) | 3,093 (85.5%) |
| Total (Category) | 13,134 (36.6%) | 22,775 (63.4%) |
| Total (Overall) | 65,173 (47.2%) | 72,833 (52.8%) |
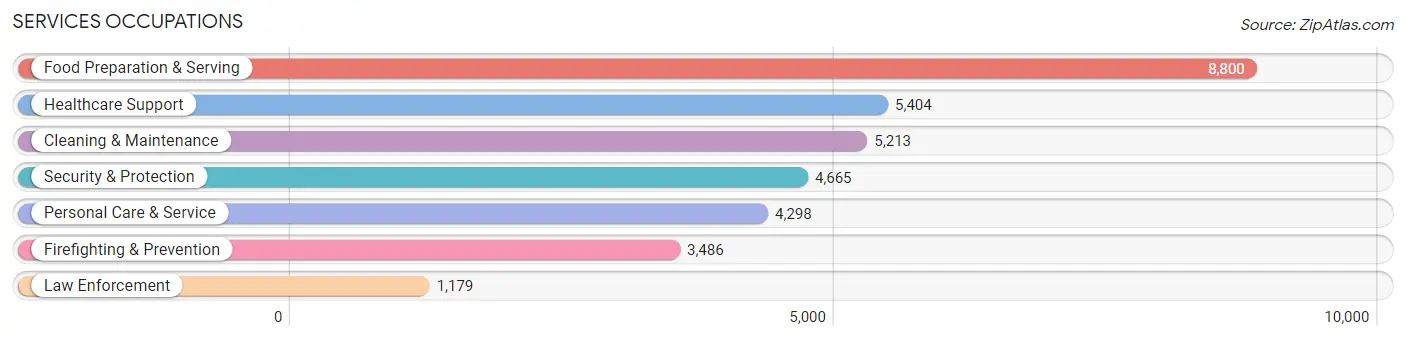
Services Occupations
The most common Services occupations in Clayton County are Food Preparation & Serving (8,800 | 6.4%), Healthcare Support (5,404 | 3.9%), Cleaning & Maintenance (5,213 | 3.8%), Security & Protection (4,665 | 3.4%), and Personal Care & Service (4,298 | 3.1%).
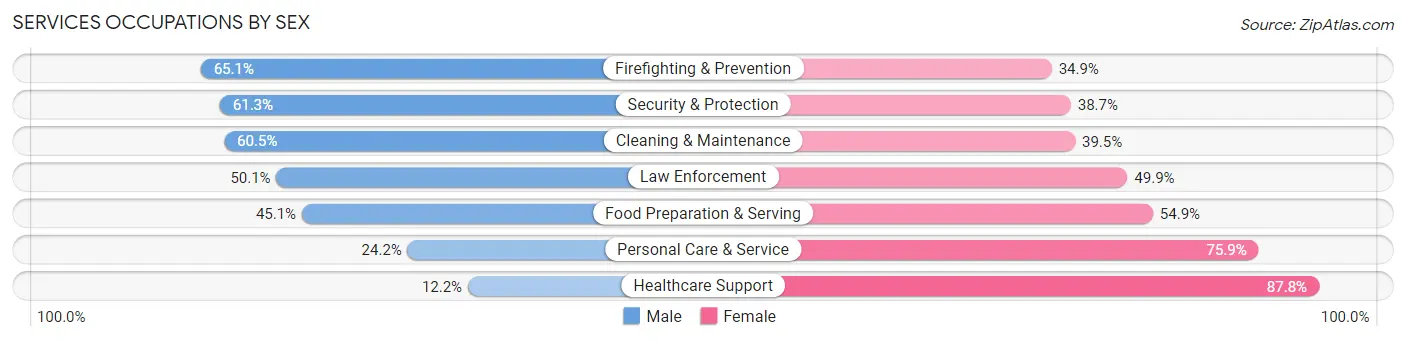
Services Occupations by Sex
Within the Services occupations in Clayton County, the most male-oriented occupations are Firefighting & Prevention (65.1%), Security & Protection (61.3%), and Cleaning & Maintenance (60.5%), while the most female-oriented occupations are Healthcare Support (87.8%), Personal Care & Service (75.8%), and Food Preparation & Serving (54.9%).
| Occupation | Male | Female |
| Healthcare Support | 660 (12.2%) | 4,744 (87.8%) |
| Security & Protection | 2,861 (61.3%) | 1,804 (38.7%) |
| Firefighting & Prevention | 2,270 (65.1%) | 1,216 (34.9%) |
| Law Enforcement | 591 (50.1%) | 588 (49.9%) |
| Food Preparation & Serving | 3,967 (45.1%) | 4,833 (54.9%) |
| Cleaning & Maintenance | 3,154 (60.5%) | 2,059 (39.5%) |
| Personal Care & Service | 1,038 (24.1%) | 3,260 (75.8%) |
| Total (Category) | 11,680 (41.2%) | 16,700 (58.8%) |
| Total (Overall) | 65,173 (47.2%) | 72,833 (52.8%) |
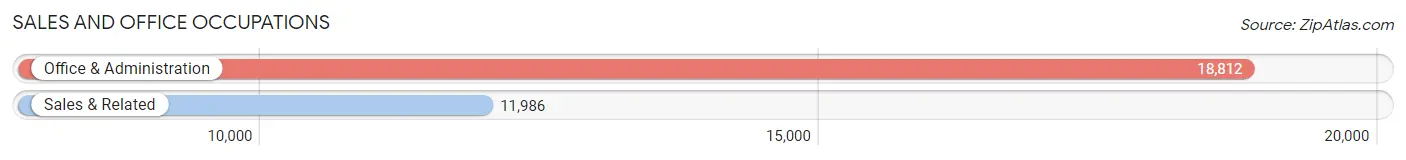
Sales and Office Occupations
The most common Sales and Office occupations in Clayton County are Office & Administration (18,812 | 13.6%), and Sales & Related (11,986 | 8.7%).
Sales and Office Occupations by Sex
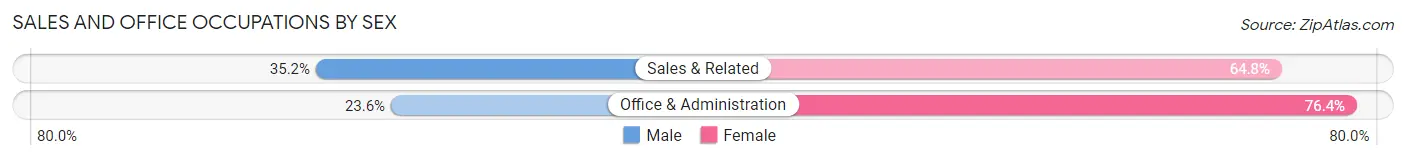
| Occupation | Male | Female |
| Sales & Related | 4,218 (35.2%) | 7,768 (64.8%) |
| Office & Administration | 4,447 (23.6%) | 14,365 (76.4%) |
| Total (Category) | 8,665 (28.1%) | 22,133 (71.9%) |
| Total (Overall) | 65,173 (47.2%) | 72,833 (52.8%) |
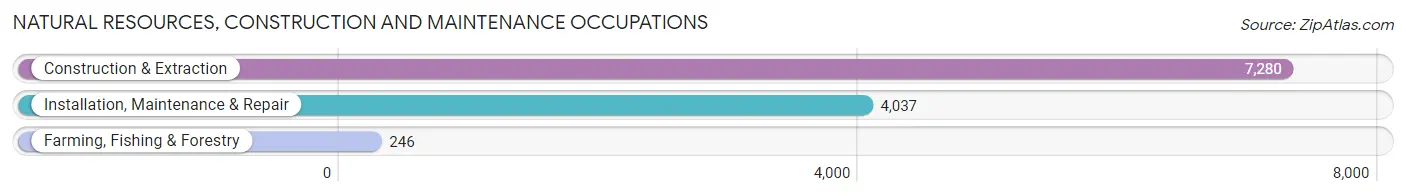
Natural Resources, Construction and Maintenance Occupations
The most common Natural Resources, Construction and Maintenance occupations in Clayton County are Construction & Extraction (7,280 | 5.3%), Installation, Maintenance & Repair (4,037 | 2.9%), and Farming, Fishing & Forestry (246 | 0.2%).
Natural Resources, Construction and Maintenance Occupations by Sex
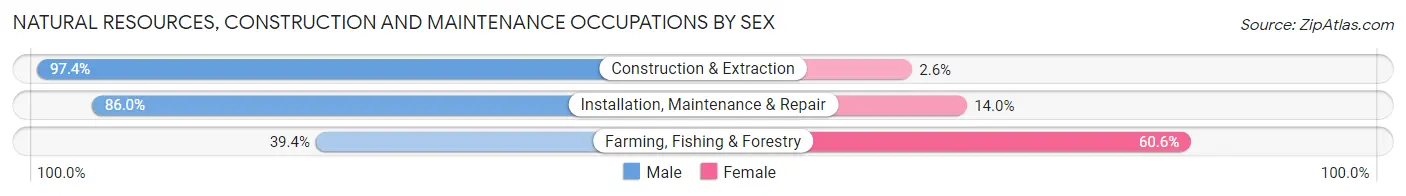
| Occupation | Male | Female |
| Farming, Fishing & Forestry | 97 (39.4%) | 149 (60.6%) |
| Construction & Extraction | 7,092 (97.4%) | 188 (2.6%) |
| Installation, Maintenance & Repair | 3,472 (86.0%) | 565 (14.0%) |
| Total (Category) | 10,661 (92.2%) | 902 (7.8%) |
| Total (Overall) | 65,173 (47.2%) | 72,833 (52.8%) |
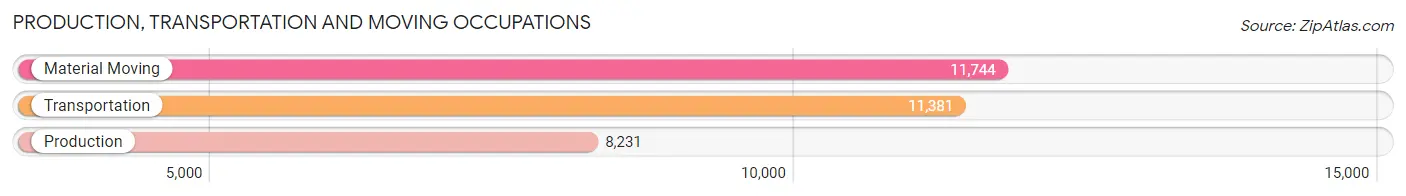
Production, Transportation and Moving Occupations
The most common Production, Transportation and Moving occupations in Clayton County are Material Moving (11,744 | 8.5%), Transportation (11,381 | 8.3%), and Production (8,231 | 6.0%).
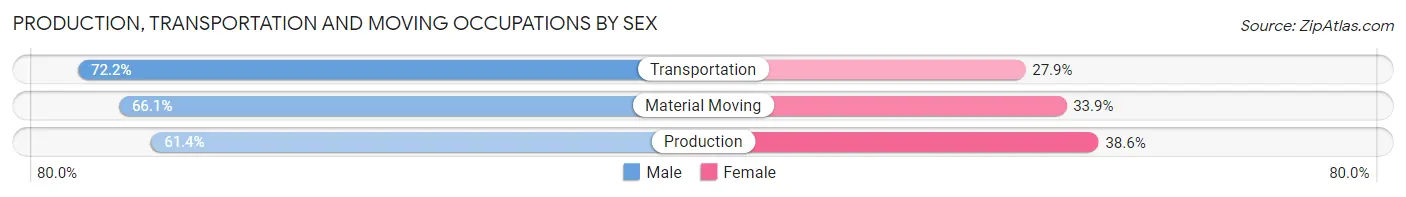
Production, Transportation and Moving Occupations by Sex
| Occupation | Male | Female |
| Production | 5,054 (61.4%) | 3,177 (38.6%) |
| Transportation | 8,211 (72.2%) | 3,170 (27.9%) |
| Material Moving | 7,768 (66.1%) | 3,976 (33.9%) |
| Total (Category) | 21,033 (67.1%) | 10,323 (32.9%) |
| Total (Overall) | 65,173 (47.2%) | 72,833 (52.8%) |
Employment Industries by Sex in Clayton County
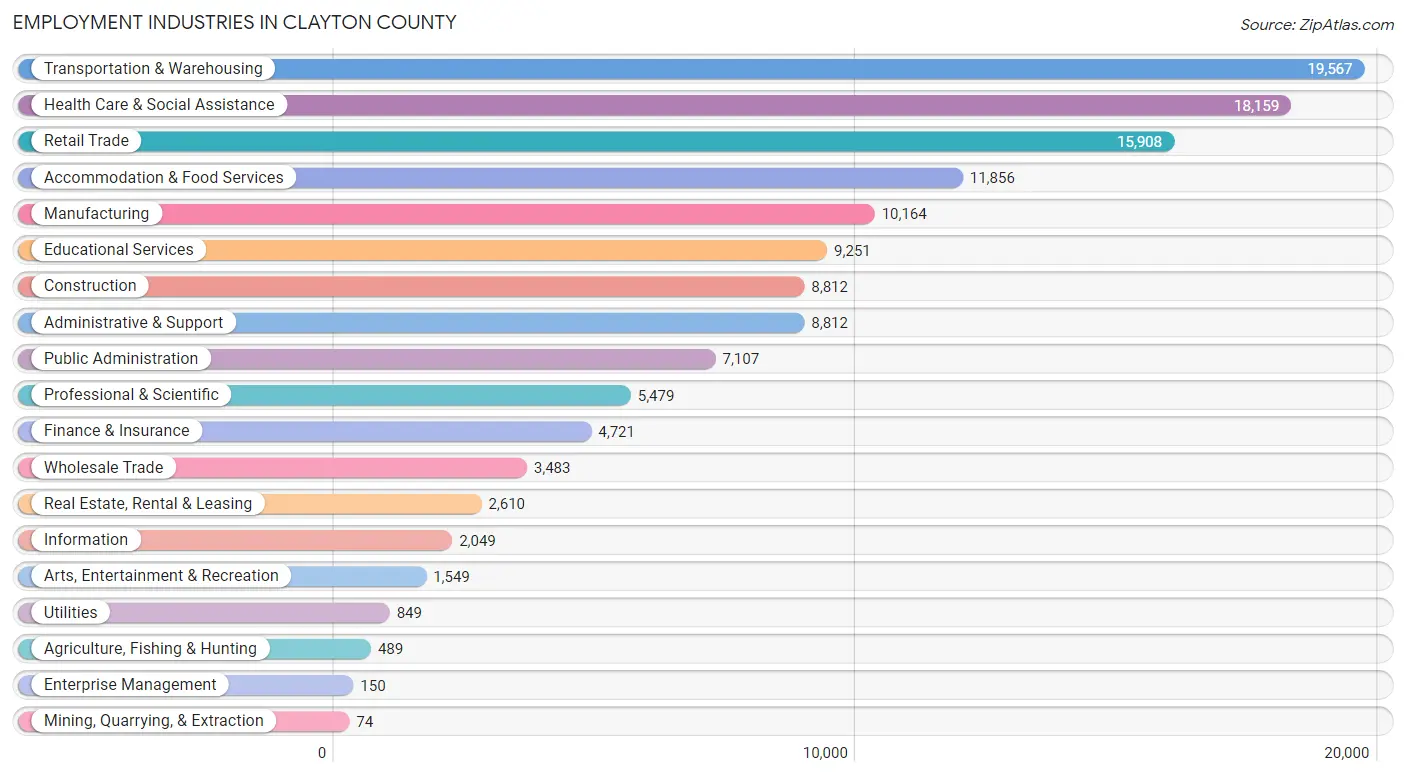
Employment Industries in Clayton County
The major employment industries in Clayton County include Transportation & Warehousing (19,567 | 14.2%), Health Care & Social Assistance (18,159 | 13.2%), Retail Trade (15,908 | 11.5%), Accommodation & Food Services (11,856 | 8.6%), and Manufacturing (10,164 | 7.4%).
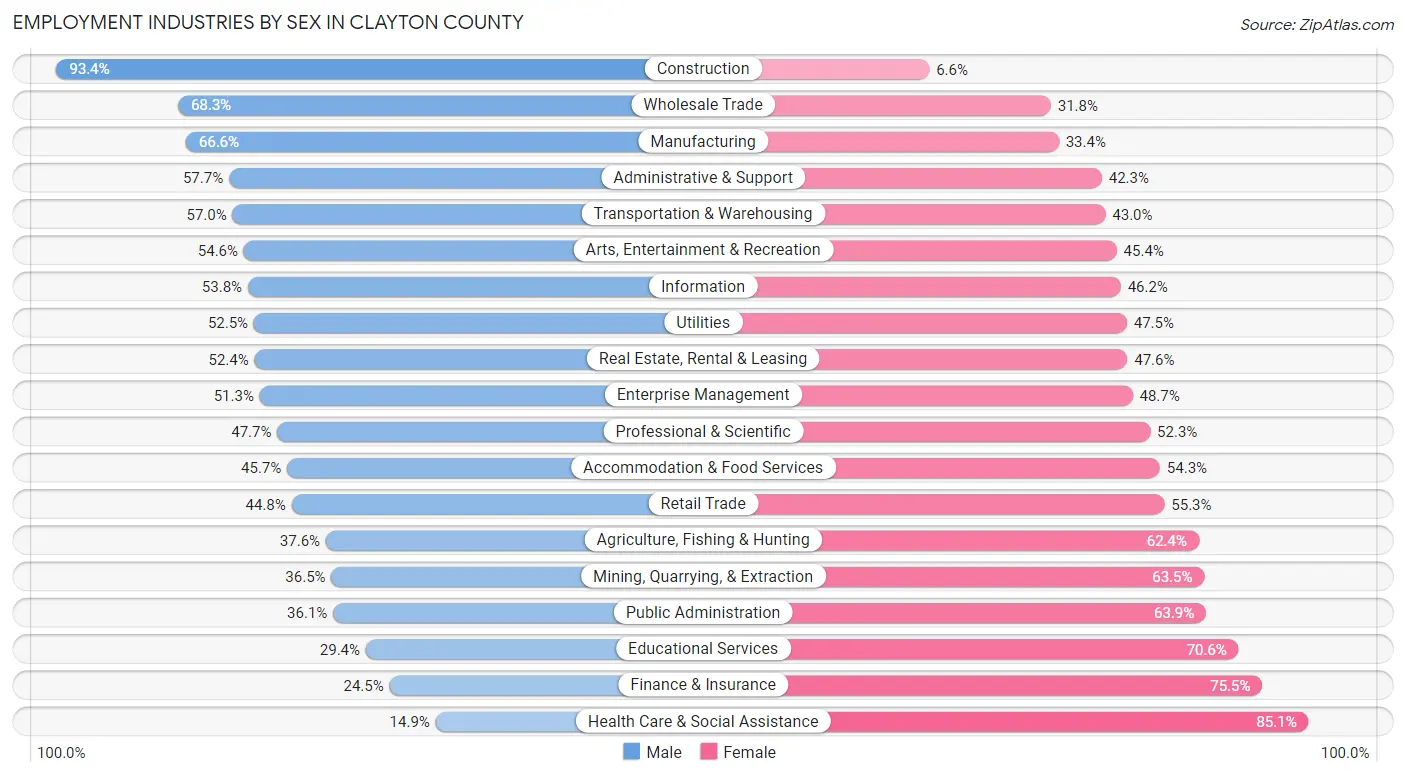
Employment Industries by Sex in Clayton County
The Clayton County industries that see more men than women are Construction (93.4%), Wholesale Trade (68.2%), and Manufacturing (66.6%), whereas the industries that tend to have a higher number of women are Health Care & Social Assistance (85.1%), Finance & Insurance (75.5%), and Educational Services (70.6%).
| Industry | Male | Female |
| Agriculture, Fishing & Hunting | 184 (37.6%) | 305 (62.4%) |
| Mining, Quarrying, & Extraction | 27 (36.5%) | 47 (63.5%) |
| Construction | 8,232 (93.4%) | 580 (6.6%) |
| Manufacturing | 6,770 (66.6%) | 3,394 (33.4%) |
| Wholesale Trade | 2,377 (68.2%) | 1,106 (31.8%) |
| Retail Trade | 7,119 (44.8%) | 8,789 (55.2%) |
| Transportation & Warehousing | 11,146 (57.0%) | 8,421 (43.0%) |
| Utilities | 446 (52.5%) | 403 (47.5%) |
| Information | 1,102 (53.8%) | 947 (46.2%) |
| Finance & Insurance | 1,155 (24.5%) | 3,566 (75.5%) |
| Real Estate, Rental & Leasing | 1,368 (52.4%) | 1,242 (47.6%) |
| Professional & Scientific | 2,613 (47.7%) | 2,866 (52.3%) |
| Enterprise Management | 77 (51.3%) | 73 (48.7%) |
| Administrative & Support | 5,084 (57.7%) | 3,728 (42.3%) |
| Educational Services | 2,717 (29.4%) | 6,534 (70.6%) |
| Health Care & Social Assistance | 2,709 (14.9%) | 15,450 (85.1%) |
| Arts, Entertainment & Recreation | 846 (54.6%) | 703 (45.4%) |
| Accommodation & Food Services | 5,415 (45.7%) | 6,441 (54.3%) |
| Public Administration | 2,568 (36.1%) | 4,539 (63.9%) |
| Total | 65,173 (47.2%) | 72,833 (52.8%) |
Education in Clayton County
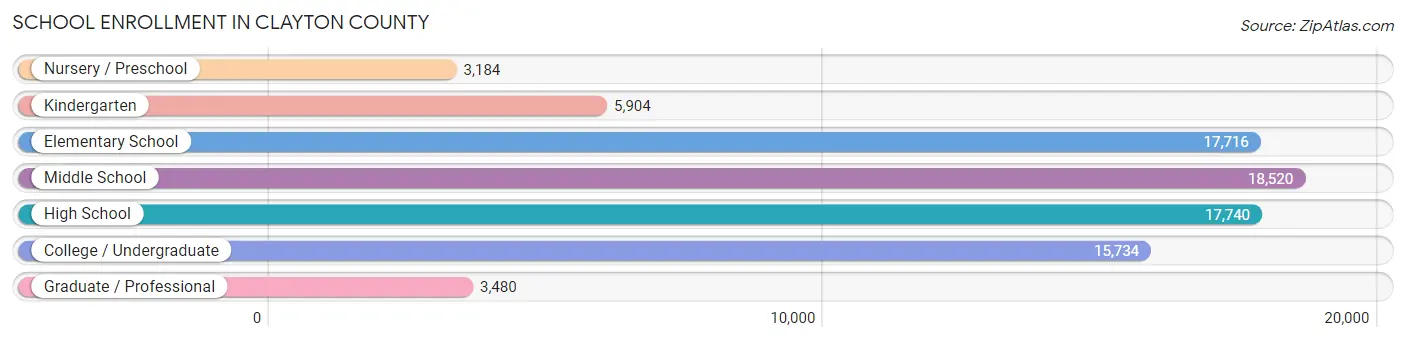
School Enrollment in Clayton County
The most common levels of schooling among the 82,278 students in Clayton County are middle school (18,520 | 22.5%), high school (17,740 | 21.6%), and elementary school (17,716 | 21.5%).
| School Level | # Students | % Students |
| Nursery / Preschool | 3,184 | 3.9% |
| Kindergarten | 5,904 | 7.2% |
| Elementary School | 17,716 | 21.5% |
| Middle School | 18,520 | 22.5% |
| High School | 17,740 | 21.6% |
| College / Undergraduate | 15,734 | 19.1% |
| Graduate / Professional | 3,480 | 4.2% |
| Total | 82,278 | 100.0% |
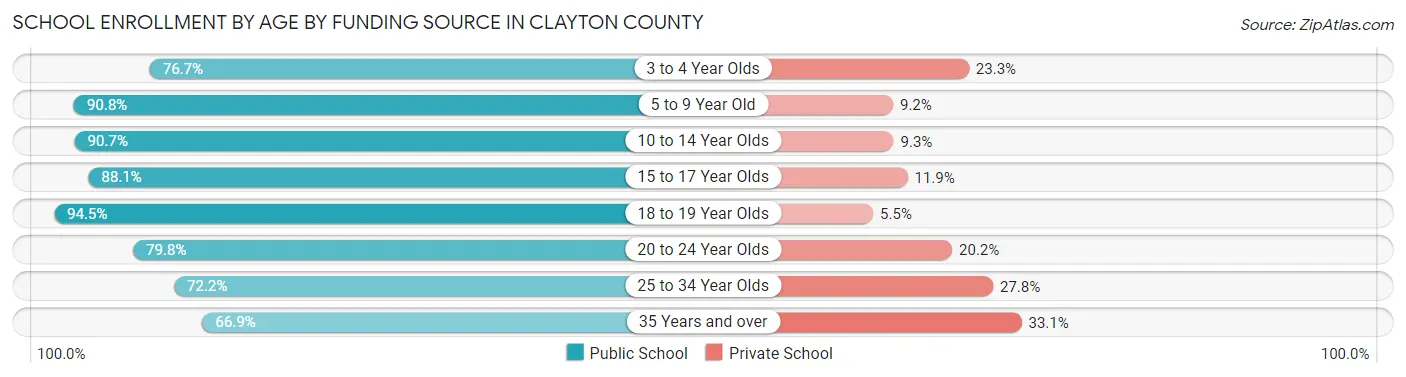
School Enrollment by Age by Funding Source in Clayton County
Out of a total of 82,278 students who are enrolled in schools in Clayton County, 11,190 (13.6%) attend a private institution, while the remaining 71,088 (86.4%) are enrolled in public schools. The age group of 35 years and over has the highest likelihood of being enrolled in private schools, with 1,837 (33.1% in the age bracket) enrolled. Conversely, the age group of 18 to 19 year olds has the lowest likelihood of being enrolled in a private school, with 4,630 (94.5% in the age bracket) attending a public institution.
| Age Bracket | Public School | Private School |
| 3 to 4 Year Olds | 2,218 (76.7%) | 675 (23.3%) |
| 5 to 9 Year Old | 19,949 (90.8%) | 2,018 (9.2%) |
| 10 to 14 Year Olds | 20,319 (90.7%) | 2,083 (9.3%) |
| 15 to 17 Year Olds | 11,432 (88.1%) | 1,543 (11.9%) |
| 18 to 19 Year Olds | 4,630 (94.5%) | 269 (5.5%) |
| 20 to 24 Year Olds | 4,959 (79.8%) | 1,255 (20.2%) |
| 25 to 34 Year Olds | 3,885 (72.2%) | 1,498 (27.8%) |
| 35 Years and over | 3,708 (66.9%) | 1,837 (33.1%) |
| Total | 71,088 (86.4%) | 11,190 (13.6%) |
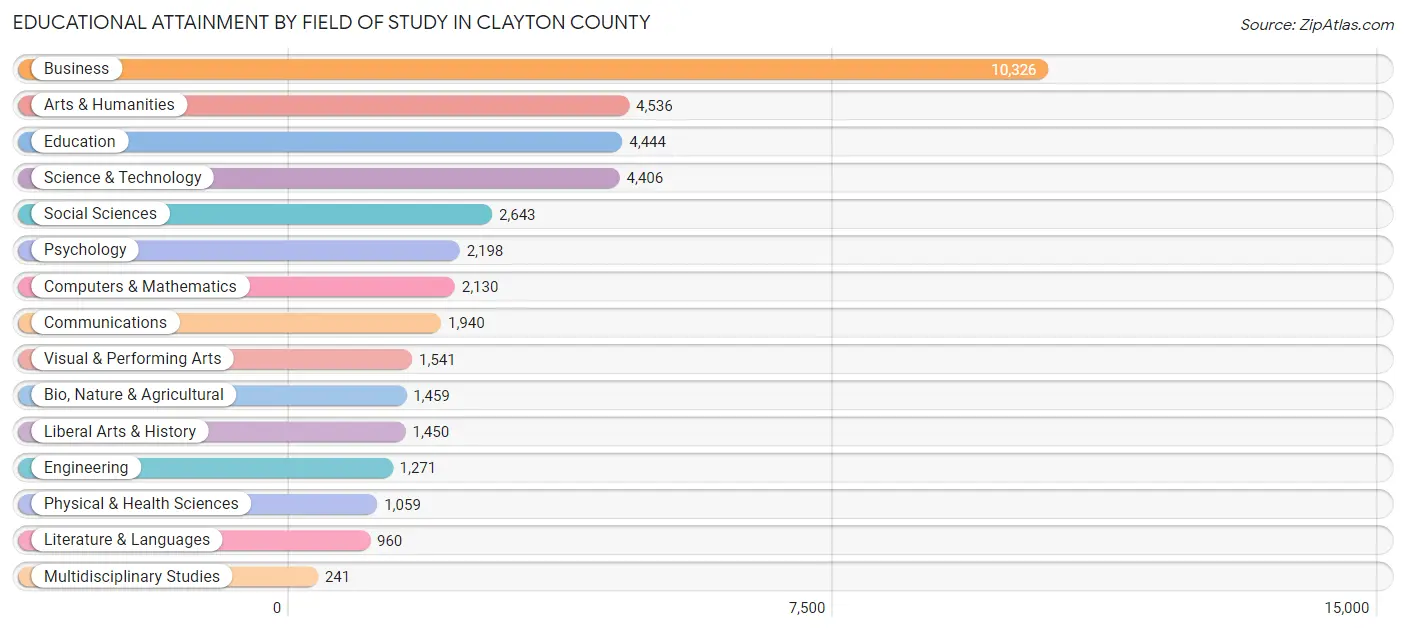
Educational Attainment by Field of Study in Clayton County
Business (10,326 | 25.4%), arts & humanities (4,536 | 11.2%), education (4,444 | 10.9%), science & technology (4,406 | 10.8%), and social sciences (2,643 | 6.5%) are the most common fields of study among 40,604 individuals in Clayton County who have obtained a bachelor's degree or higher.
| Field of Study | # Graduates | % Graduates |
| Computers & Mathematics | 2,130 | 5.2% |
| Bio, Nature & Agricultural | 1,459 | 3.6% |
| Physical & Health Sciences | 1,059 | 2.6% |
| Psychology | 2,198 | 5.4% |
| Social Sciences | 2,643 | 6.5% |
| Engineering | 1,271 | 3.1% |
| Multidisciplinary Studies | 241 | 0.6% |
| Science & Technology | 4,406 | 10.8% |
| Business | 10,326 | 25.4% |
| Education | 4,444 | 10.9% |
| Literature & Languages | 960 | 2.4% |
| Liberal Arts & History | 1,450 | 3.6% |
| Visual & Performing Arts | 1,541 | 3.8% |
| Communications | 1,940 | 4.8% |
| Arts & Humanities | 4,536 | 11.2% |
| Total | 40,604 | 100.0% |
Transportation & Commute in Clayton County
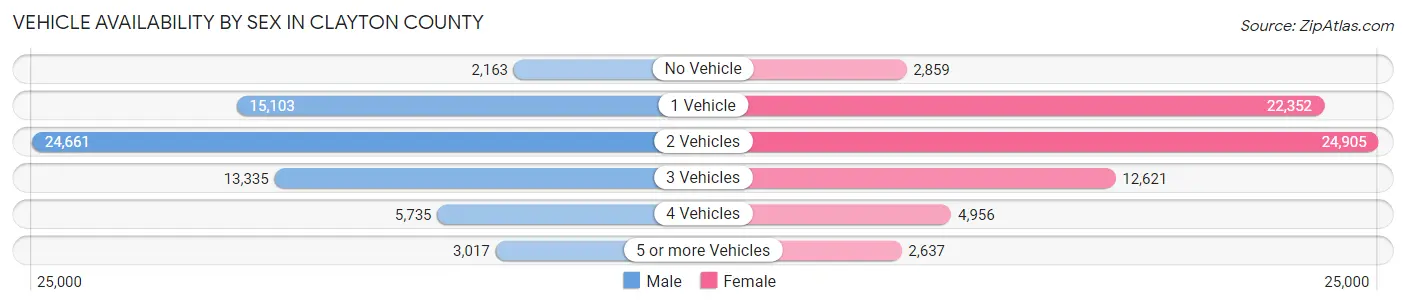
Vehicle Availability by Sex in Clayton County
The most prevalent vehicle ownership categories in Clayton County are males with 2 vehicles (24,661, accounting for 38.5%) and females with 2 vehicles (24,905, making up 35.1%).
| Vehicles Available | Male | Female |
| No Vehicle | 2,163 (3.4%) | 2,859 (4.1%) |
| 1 Vehicle | 15,103 (23.6%) | 22,352 (31.8%) |
| 2 Vehicles | 24,661 (38.5%) | 24,905 (35.4%) |
| 3 Vehicles | 13,335 (20.8%) | 12,621 (17.9%) |
| 4 Vehicles | 5,735 (9.0%) | 4,956 (7.0%) |
| 5 or more Vehicles | 3,017 (4.7%) | 2,637 (3.7%) |
| Total | 64,014 (100.0%) | 70,330 (100.0%) |
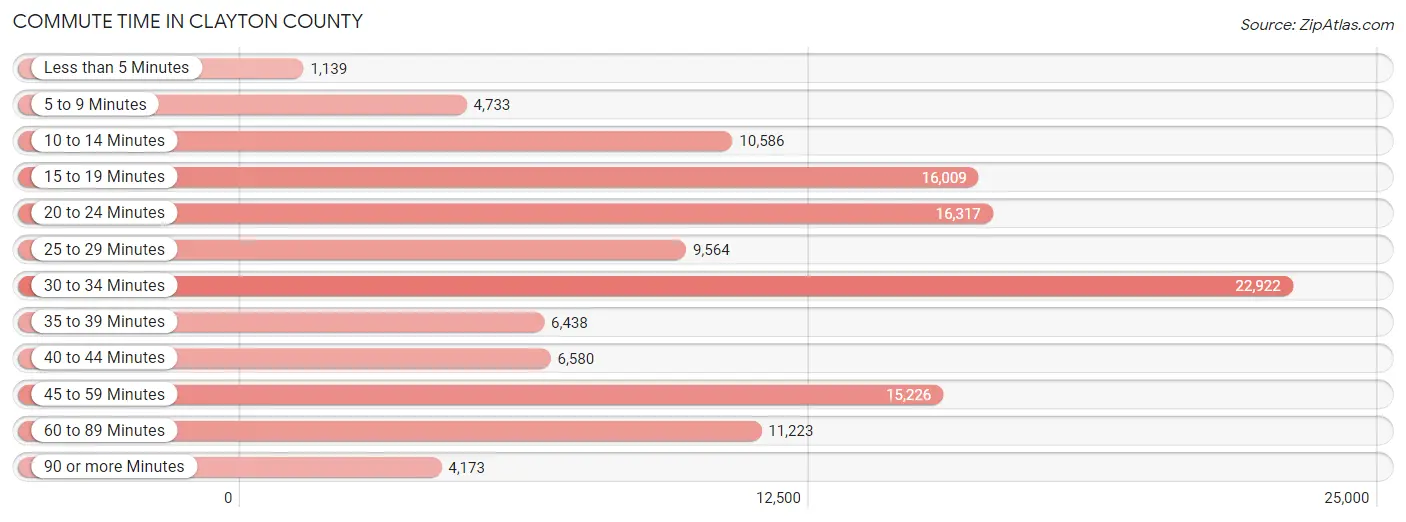
Commute Time in Clayton County
The most frequently occuring commute durations in Clayton County are 30 to 34 minutes (22,922 commuters, 18.3%), 20 to 24 minutes (16,317 commuters, 13.1%), and 15 to 19 minutes (16,009 commuters, 12.8%).
| Commute Time | # Commuters | % Commuters |
| Less than 5 Minutes | 1,139 | 0.9% |
| 5 to 9 Minutes | 4,733 | 3.8% |
| 10 to 14 Minutes | 10,586 | 8.5% |
| 15 to 19 Minutes | 16,009 | 12.8% |
| 20 to 24 Minutes | 16,317 | 13.1% |
| 25 to 29 Minutes | 9,564 | 7.7% |
| 30 to 34 Minutes | 22,922 | 18.3% |
| 35 to 39 Minutes | 6,438 | 5.1% |
| 40 to 44 Minutes | 6,580 | 5.3% |
| 45 to 59 Minutes | 15,226 | 12.2% |
| 60 to 89 Minutes | 11,223 | 9.0% |
| 90 or more Minutes | 4,173 | 3.3% |
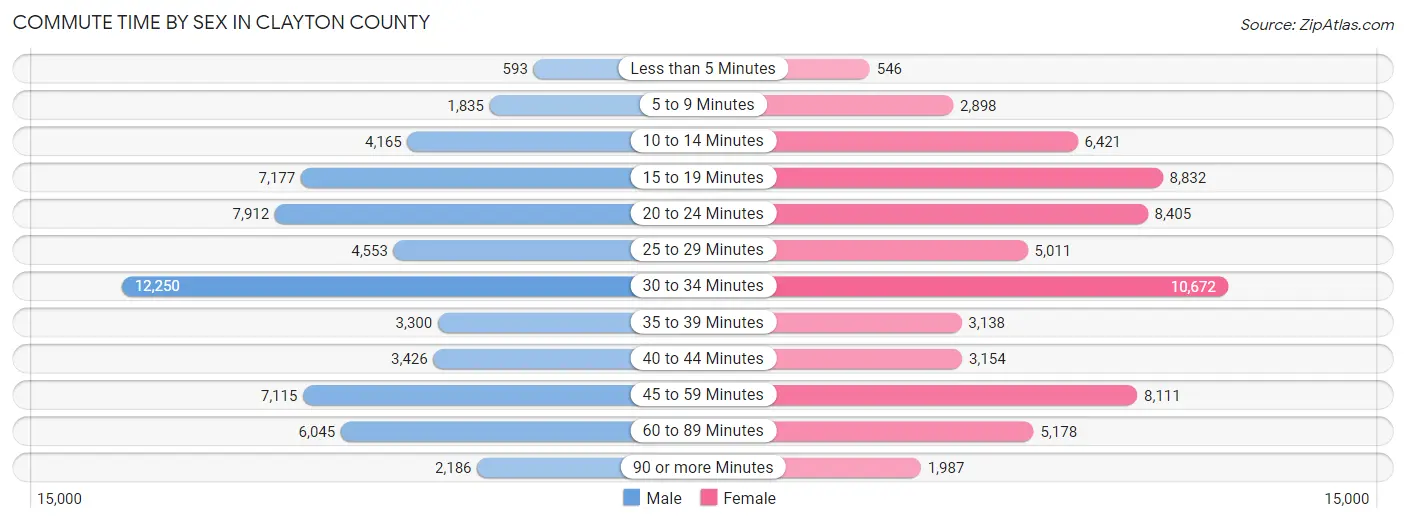
Commute Time by Sex in Clayton County
The most common commute times in Clayton County are 30 to 34 minutes (12,250 commuters, 20.2%) for males and 30 to 34 minutes (10,672 commuters, 16.6%) for females.
| Commute Time | Male | Female |
| Less than 5 Minutes | 593 (1.0%) | 546 (0.9%) |
| 5 to 9 Minutes | 1,835 (3.0%) | 2,898 (4.5%) |
| 10 to 14 Minutes | 4,165 (6.9%) | 6,421 (10.0%) |
| 15 to 19 Minutes | 7,177 (11.8%) | 8,832 (13.7%) |
| 20 to 24 Minutes | 7,912 (13.1%) | 8,405 (13.1%) |
| 25 to 29 Minutes | 4,553 (7.5%) | 5,011 (7.8%) |
| 30 to 34 Minutes | 12,250 (20.2%) | 10,672 (16.6%) |
| 35 to 39 Minutes | 3,300 (5.4%) | 3,138 (4.9%) |
| 40 to 44 Minutes | 3,426 (5.7%) | 3,154 (4.9%) |
| 45 to 59 Minutes | 7,115 (11.7%) | 8,111 (12.6%) |
| 60 to 89 Minutes | 6,045 (10.0%) | 5,178 (8.1%) |
| 90 or more Minutes | 2,186 (3.6%) | 1,987 (3.1%) |
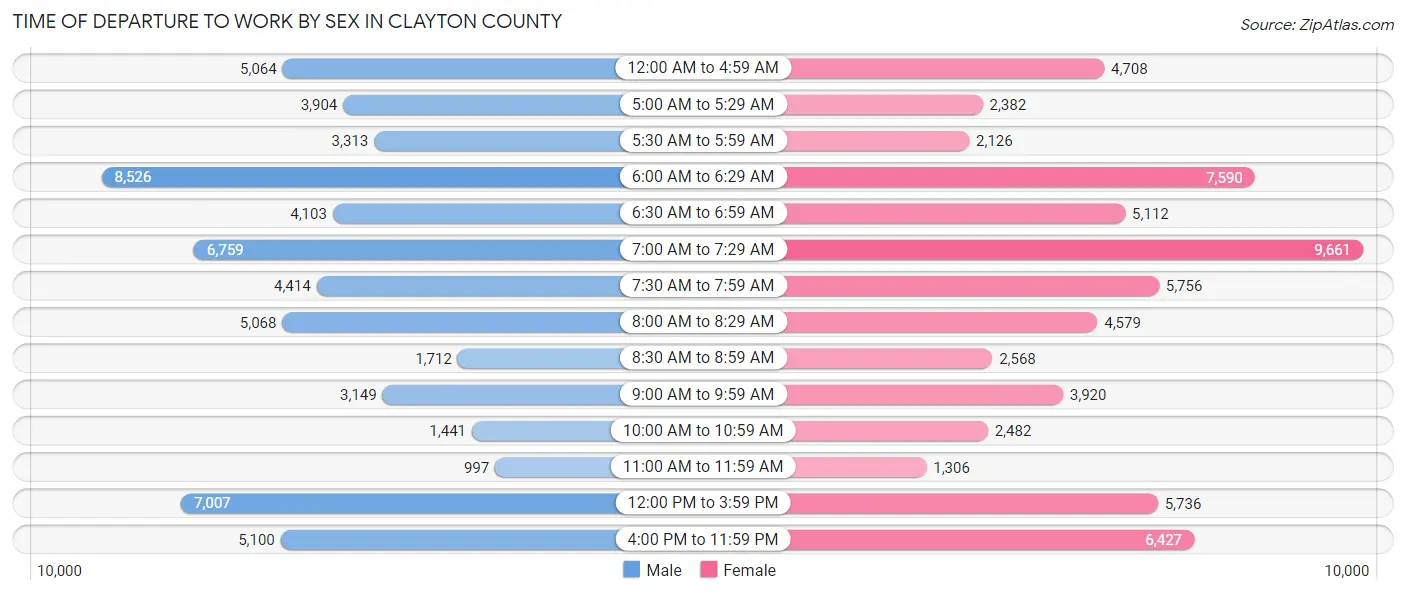
Time of Departure to Work by Sex in Clayton County
The most frequent times of departure to work in Clayton County are 6:00 AM to 6:29 AM (8,526, 14.1%) for males and 7:00 AM to 7:29 AM (9,661, 15.0%) for females.
| Time of Departure | Male | Female |
| 12:00 AM to 4:59 AM | 5,064 (8.4%) | 4,708 (7.3%) |
| 5:00 AM to 5:29 AM | 3,904 (6.5%) | 2,382 (3.7%) |
| 5:30 AM to 5:59 AM | 3,313 (5.5%) | 2,126 (3.3%) |
| 6:00 AM to 6:29 AM | 8,526 (14.1%) | 7,590 (11.8%) |
| 6:30 AM to 6:59 AM | 4,103 (6.8%) | 5,112 (7.9%) |
| 7:00 AM to 7:29 AM | 6,759 (11.2%) | 9,661 (15.0%) |
| 7:30 AM to 7:59 AM | 4,414 (7.3%) | 5,756 (8.9%) |
| 8:00 AM to 8:29 AM | 5,068 (8.4%) | 4,579 (7.1%) |
| 8:30 AM to 8:59 AM | 1,712 (2.8%) | 2,568 (4.0%) |
| 9:00 AM to 9:59 AM | 3,149 (5.2%) | 3,920 (6.1%) |
| 10:00 AM to 10:59 AM | 1,441 (2.4%) | 2,482 (3.9%) |
| 11:00 AM to 11:59 AM | 997 (1.7%) | 1,306 (2.0%) |
| 12:00 PM to 3:59 PM | 7,007 (11.6%) | 5,736 (8.9%) |
| 4:00 PM to 11:59 PM | 5,100 (8.4%) | 6,427 (10.0%) |
| Total | 60,557 (100.0%) | 64,353 (100.0%) |
Housing Occupancy in Clayton County
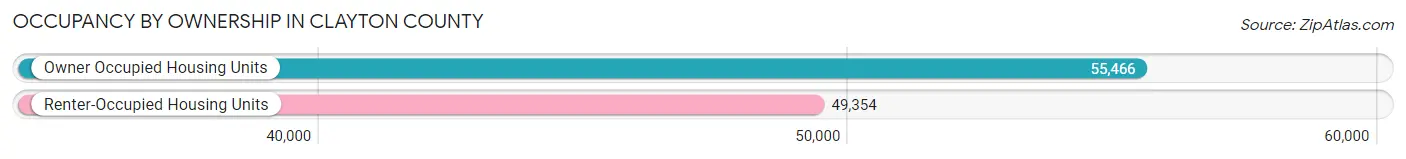
Occupancy by Ownership in Clayton County
Of the total 104,820 dwellings in Clayton County, owner-occupied units account for 55,466 (52.9%), while renter-occupied units make up 49,354 (47.1%).
| Occupancy | # Housing Units | % Housing Units |
| Owner Occupied Housing Units | 55,466 | 52.9% |
| Renter-Occupied Housing Units | 49,354 | 47.1% |
| Total Occupied Housing Units | 104,820 | 100.0% |
Occupancy by Household Size in Clayton County
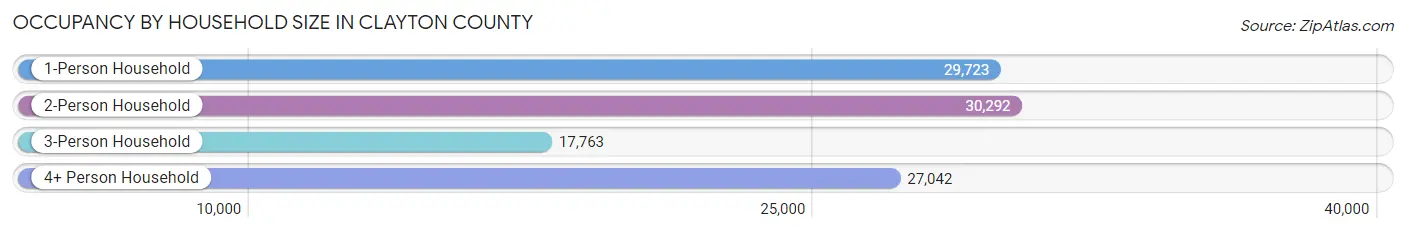
| Household Size | # Housing Units | % Housing Units |
| 1-Person Household | 29,723 | 28.4% |
| 2-Person Household | 30,292 | 28.9% |
| 3-Person Household | 17,763 | 17.0% |
| 4+ Person Household | 27,042 | 25.8% |
| Total Housing Units | 104,820 | 100.0% |
Occupancy by Ownership by Household Size in Clayton County
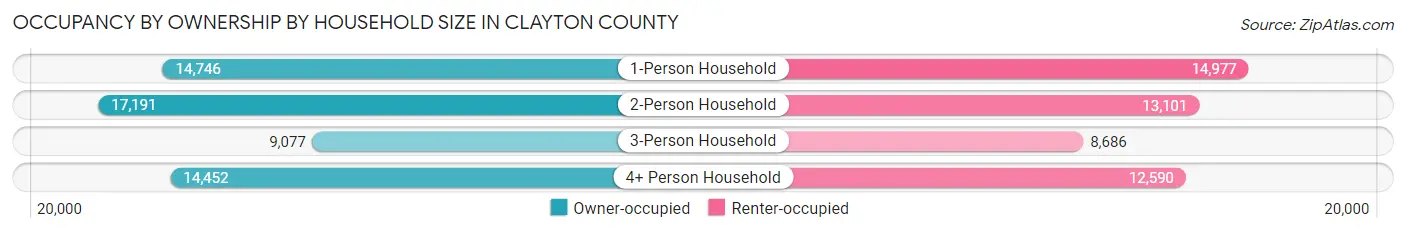
| Household Size | Owner-occupied | Renter-occupied |
| 1-Person Household | 14,746 (49.6%) | 14,977 (50.4%) |
| 2-Person Household | 17,191 (56.8%) | 13,101 (43.2%) |
| 3-Person Household | 9,077 (51.1%) | 8,686 (48.9%) |
| 4+ Person Household | 14,452 (53.4%) | 12,590 (46.6%) |
| Total Housing Units | 55,466 (52.9%) | 49,354 (47.1%) |
Occupancy by Educational Attainment in Clayton County
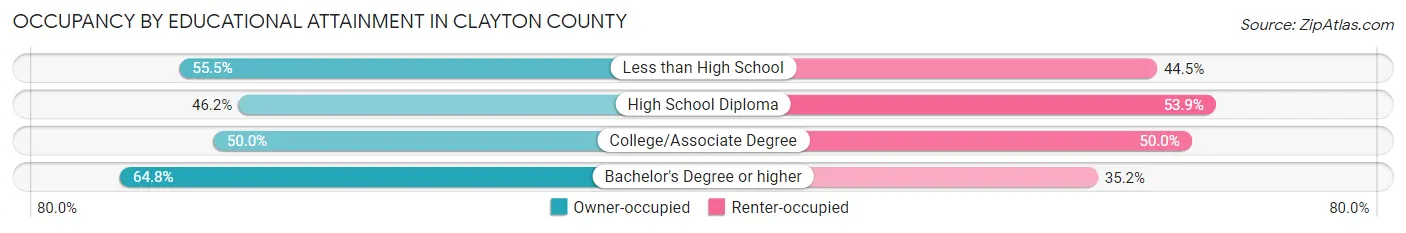
| Household Size | Owner-occupied | Renter-occupied |
| Less than High School | 6,562 (55.5%) | 5,269 (44.5%) |
| High School Diploma | 14,658 (46.2%) | 17,106 (53.8%) |
| College/Associate Degree | 18,323 (50.0%) | 18,346 (50.0%) |
| Bachelor's Degree or higher | 15,923 (64.8%) | 8,633 (35.2%) |
Occupancy by Age of Householder in Clayton County
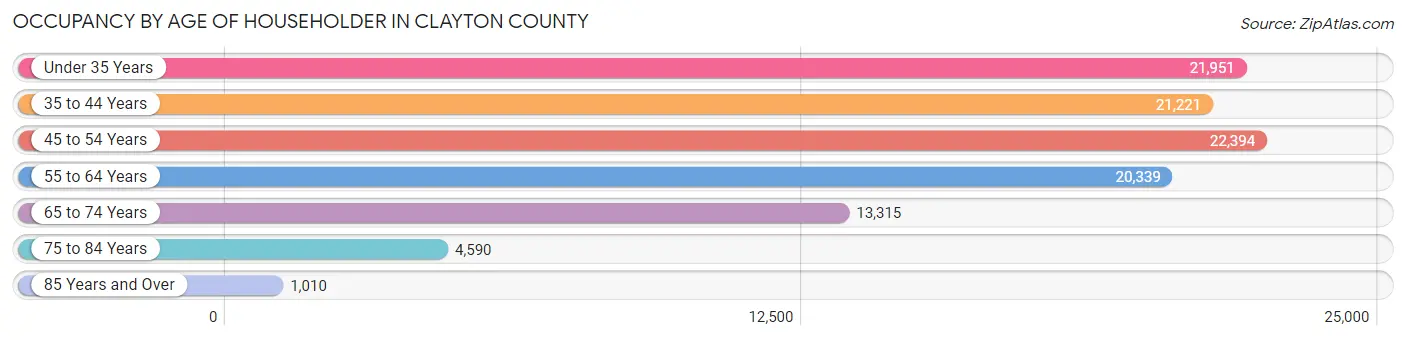
| Age Bracket | # Households | % Households |
| Under 35 Years | 21,951 | 20.9% |
| 35 to 44 Years | 21,221 | 20.3% |
| 45 to 54 Years | 22,394 | 21.4% |
| 55 to 64 Years | 20,339 | 19.4% |
| 65 to 74 Years | 13,315 | 12.7% |
| 75 to 84 Years | 4,590 | 4.4% |
| 85 Years and Over | 1,010 | 1.0% |
| Total | 104,820 | 100.0% |
Housing Finances in Clayton County
Median Income by Occupancy in Clayton County
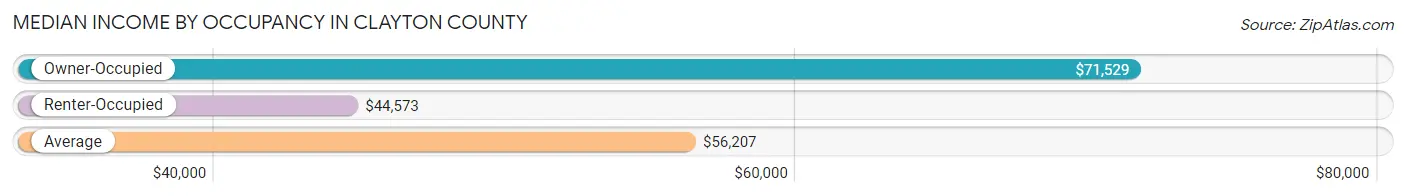
| Occupancy Type | # Households | Median Income |
| Owner-Occupied | 55,466 (52.9%) | $71,529 |
| Renter-Occupied | 49,354 (47.1%) | $44,573 |
| Average | 104,820 (100.0%) | $56,207 |
Occupancy by Householder Income Bracket in Clayton County
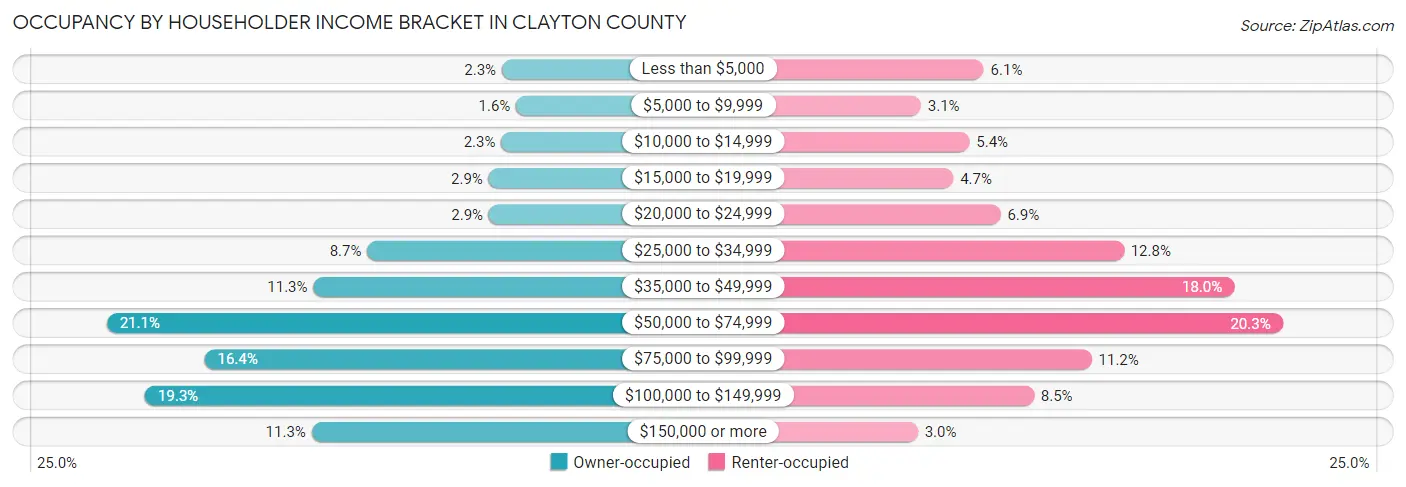
| Income Bracket | Owner-occupied | Renter-occupied |
| Less than $5,000 | 1,257 (2.3%) | 3,013 (6.1%) |
| $5,000 to $9,999 | 880 (1.6%) | 1,535 (3.1%) |
| $10,000 to $14,999 | 1,276 (2.3%) | 2,676 (5.4%) |
| $15,000 to $19,999 | 1,608 (2.9%) | 2,294 (4.6%) |
| $20,000 to $24,999 | 1,604 (2.9%) | 3,405 (6.9%) |
| $25,000 to $34,999 | 4,814 (8.7%) | 6,302 (12.8%) |
| $35,000 to $49,999 | 6,240 (11.3%) | 8,894 (18.0%) |
| $50,000 to $74,999 | 11,700 (21.1%) | 10,035 (20.3%) |
| $75,000 to $99,999 | 9,111 (16.4%) | 5,549 (11.2%) |
| $100,000 to $149,999 | 10,689 (19.3%) | 4,192 (8.5%) |
| $150,000 or more | 6,287 (11.3%) | 1,459 (3.0%) |
| Total | 55,466 (100.0%) | 49,354 (100.0%) |
Monthly Housing Cost Tiers in Clayton County
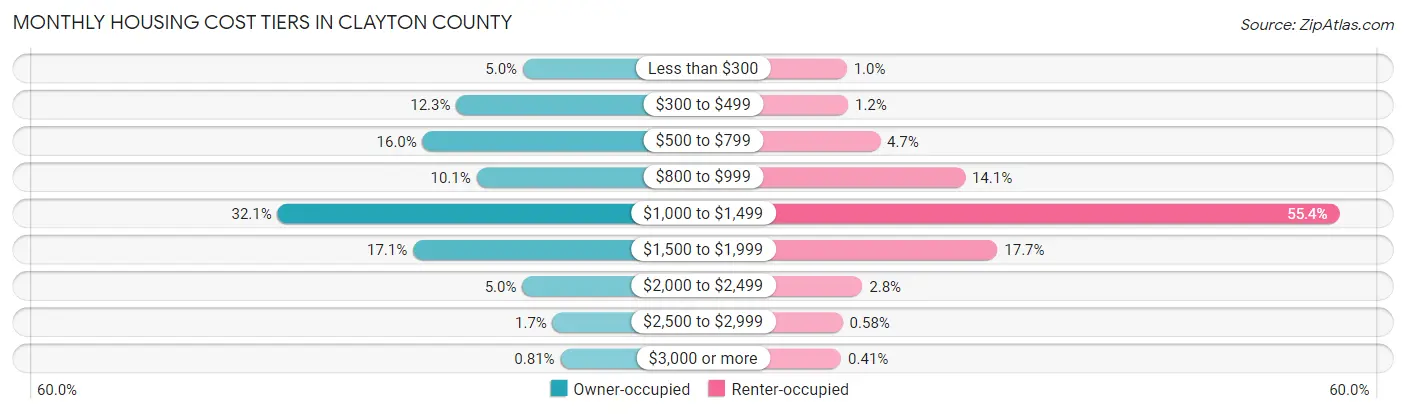
| Monthly Cost | Owner-occupied | Renter-occupied |
| Less than $300 | 2,746 (5.0%) | 507 (1.0%) |
| $300 to $499 | 6,826 (12.3%) | 576 (1.2%) |
| $500 to $799 | 8,892 (16.0%) | 2,325 (4.7%) |
| $800 to $999 | 5,584 (10.1%) | 6,952 (14.1%) |
| $1,000 to $1,499 | 17,784 (32.1%) | 27,364 (55.4%) |
| $1,500 to $1,999 | 9,478 (17.1%) | 8,719 (17.7%) |
| $2,000 to $2,499 | 2,787 (5.0%) | 1,358 (2.8%) |
| $2,500 to $2,999 | 920 (1.7%) | 288 (0.6%) |
| $3,000 or more | 449 (0.8%) | 200 (0.4%) |
| Total | 55,466 (100.0%) | 49,354 (100.0%) |
Physical Housing Characteristics in Clayton County
Housing Structures in Clayton County
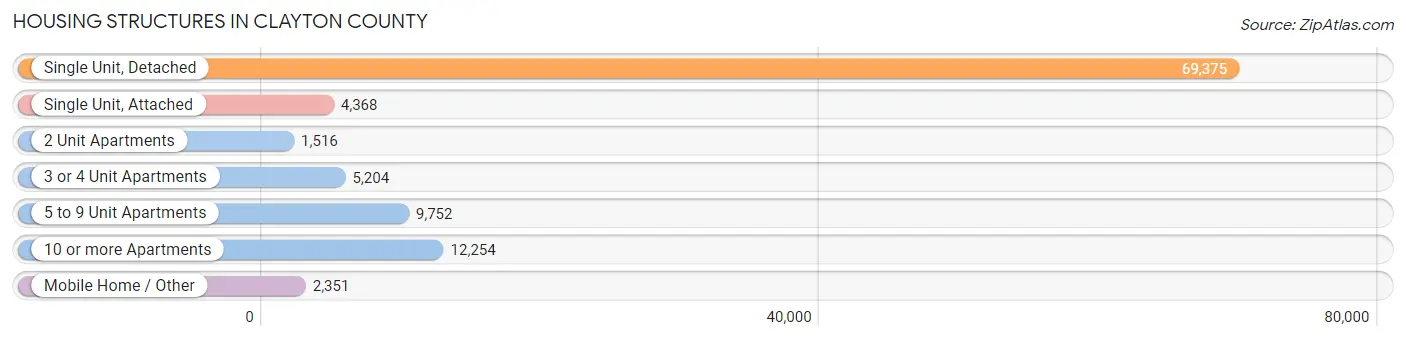
| Structure Type | # Housing Units | % Housing Units |
| Single Unit, Detached | 69,375 | 66.2% |
| Single Unit, Attached | 4,368 | 4.2% |
| 2 Unit Apartments | 1,516 | 1.5% |
| 3 or 4 Unit Apartments | 5,204 | 5.0% |
| 5 to 9 Unit Apartments | 9,752 | 9.3% |
| 10 or more Apartments | 12,254 | 11.7% |
| Mobile Home / Other | 2,351 | 2.2% |
| Total | 104,820 | 100.0% |
Housing Structures by Occupancy in Clayton County
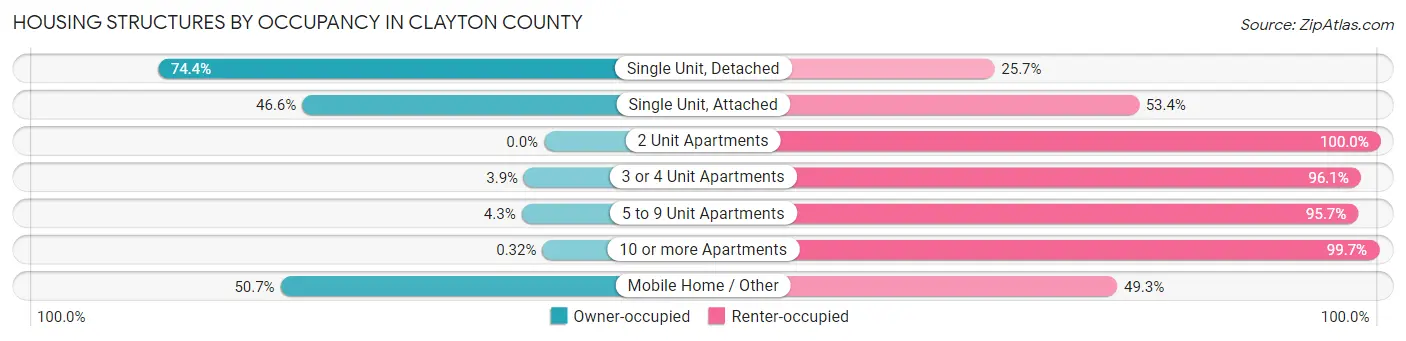
| Structure Type | Owner-occupied | Renter-occupied |
| Single Unit, Detached | 51,577 (74.4%) | 17,798 (25.7%) |
| Single Unit, Attached | 2,034 (46.6%) | 2,334 (53.4%) |
| 2 Unit Apartments | 0 (0.0%) | 1,516 (100.0%) |
| 3 or 4 Unit Apartments | 201 (3.9%) | 5,003 (96.1%) |
| 5 to 9 Unit Apartments | 422 (4.3%) | 9,330 (95.7%) |
| 10 or more Apartments | 39 (0.3%) | 12,215 (99.7%) |
| Mobile Home / Other | 1,193 (50.7%) | 1,158 (49.3%) |
| Total | 55,466 (52.9%) | 49,354 (47.1%) |
Housing Structures by Number of Rooms in Clayton County
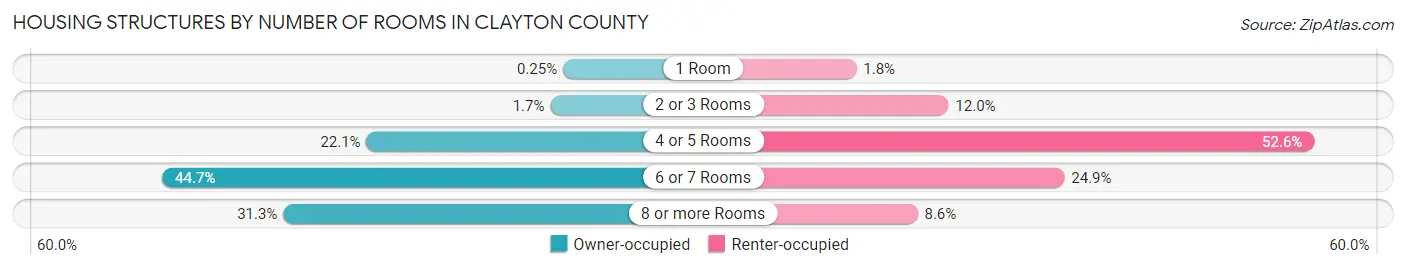
| Number of Rooms | Owner-occupied | Renter-occupied |
| 1 Room | 140 (0.3%) | 900 (1.8%) |
| 2 or 3 Rooms | 919 (1.7%) | 5,940 (12.0%) |
| 4 or 5 Rooms | 12,234 (22.1%) | 25,974 (52.6%) |
| 6 or 7 Rooms | 24,811 (44.7%) | 12,293 (24.9%) |
| 8 or more Rooms | 17,362 (31.3%) | 4,247 (8.6%) |
| Total | 55,466 (100.0%) | 49,354 (100.0%) |
Housing Structure by Heating Type in Clayton County
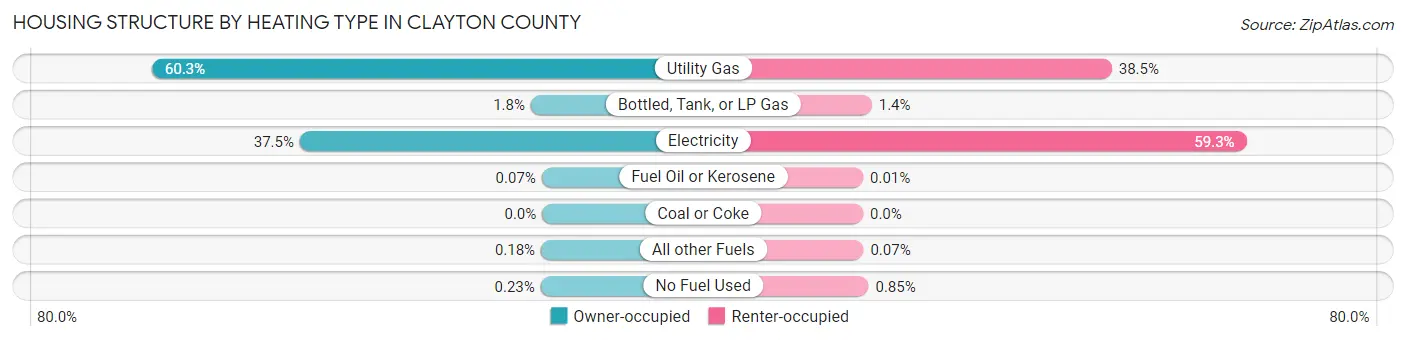
| Heating Type | Owner-occupied | Renter-occupied |
| Utility Gas | 33,458 (60.3%) | 18,977 (38.5%) |
| Bottled, Tank, or LP Gas | 968 (1.8%) | 666 (1.3%) |
| Electricity | 20,777 (37.5%) | 29,249 (59.3%) |
| Fuel Oil or Kerosene | 37 (0.1%) | 7 (0.0%) |
| Coal or Coke | 0 (0.0%) | 0 (0.0%) |
| All other Fuels | 100 (0.2%) | 35 (0.1%) |
| No Fuel Used | 126 (0.2%) | 420 (0.9%) |
| Total | 55,466 (100.0%) | 49,354 (100.0%) |
Household Vehicle Usage in Clayton County
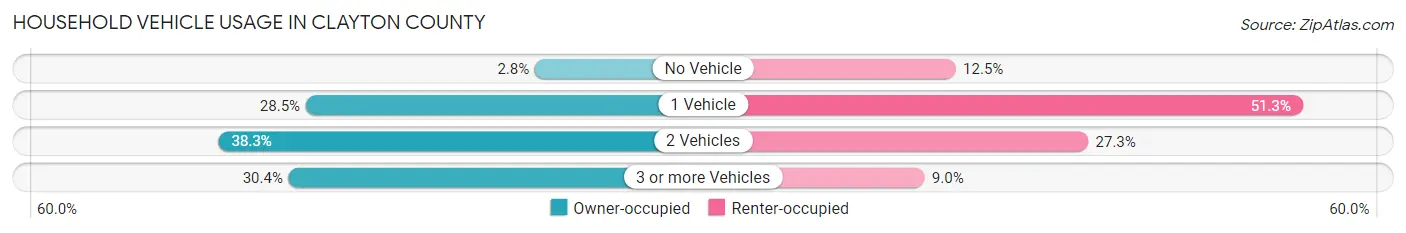
| Vehicles per Household | Owner-occupied | Renter-occupied |
| No Vehicle | 1,563 (2.8%) | 6,149 (12.5%) |
| 1 Vehicle | 15,803 (28.5%) | 25,311 (51.3%) |
| 2 Vehicles | 21,235 (38.3%) | 13,474 (27.3%) |
| 3 or more Vehicles | 16,865 (30.4%) | 4,420 (9.0%) |
| Total | 55,466 (100.0%) | 49,354 (100.0%) |
Real Estate & Mortgages in Clayton County
Real Estate and Mortgage Overview in Clayton County
| Characteristic | Without Mortgage | With Mortgage |
| Housing Units | 17,221 | 38,245 |
| Median Property Value | $145,600 | $174,800 |
| Median Household Income | $65,171 | $4,004 |
| Monthly Housing Costs | $490 | $412 |
| Real Estate Taxes | $1,322 | $1,343 |
Property Value by Mortgage Status in Clayton County
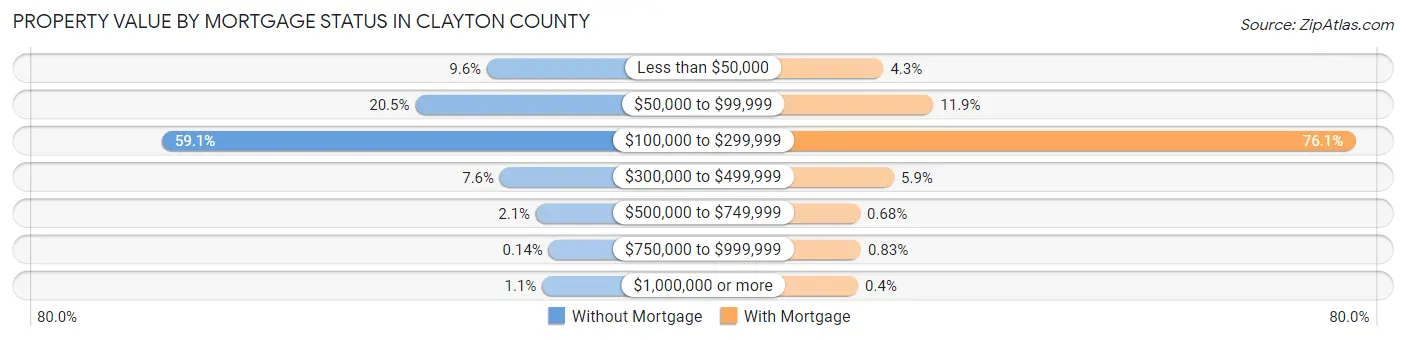
| Property Value | Without Mortgage | With Mortgage |
| Less than $50,000 | 1,644 (9.6%) | 1,626 (4.3%) |
| $50,000 to $99,999 | 3,523 (20.5%) | 4,536 (11.9%) |
| $100,000 to $299,999 | 10,172 (59.1%) | 29,108 (76.1%) |
| $300,000 to $499,999 | 1,306 (7.6%) | 2,245 (5.9%) |
| $500,000 to $749,999 | 358 (2.1%) | 259 (0.7%) |
| $750,000 to $999,999 | 24 (0.1%) | 317 (0.8%) |
| $1,000,000 or more | 194 (1.1%) | 154 (0.4%) |
| Total | 17,221 (100.0%) | 38,245 (100.0%) |
Household Income by Mortgage Status in Clayton County
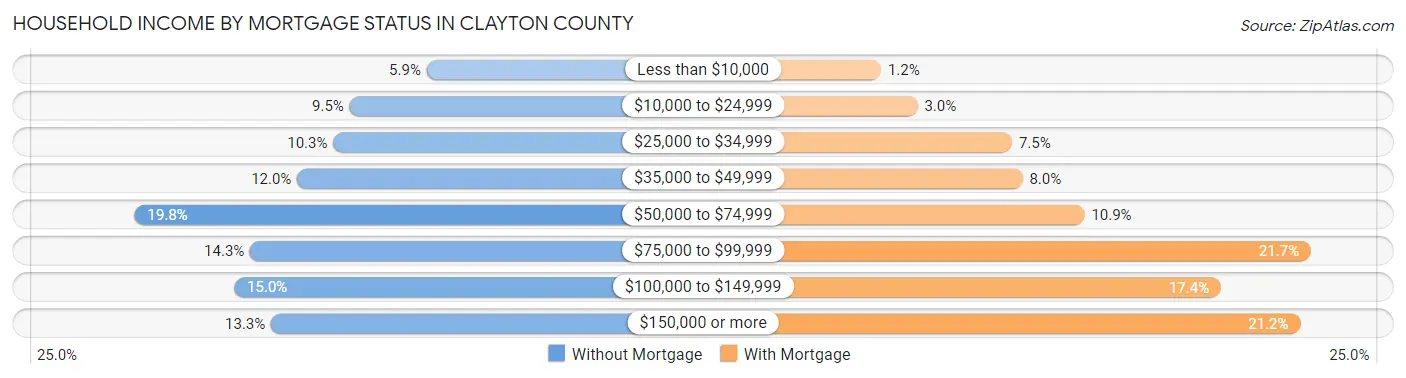
| Household Income | Without Mortgage | With Mortgage |
| Less than $10,000 | 1,008 (5.9%) | 464 (1.2%) |
| $10,000 to $24,999 | 1,639 (9.5%) | 1,129 (2.9%) |
| $25,000 to $34,999 | 1,774 (10.3%) | 2,849 (7.4%) |
| $35,000 to $49,999 | 2,070 (12.0%) | 3,040 (8.0%) |
| $50,000 to $74,999 | 3,404 (19.8%) | 4,170 (10.9%) |
| $75,000 to $99,999 | 2,455 (14.3%) | 8,296 (21.7%) |
| $100,000 to $149,999 | 2,588 (15.0%) | 6,656 (17.4%) |
| $150,000 or more | 2,283 (13.3%) | 8,101 (21.2%) |
| Total | 17,221 (100.0%) | 38,245 (100.0%) |
Property Value to Household Income Ratio in Clayton County
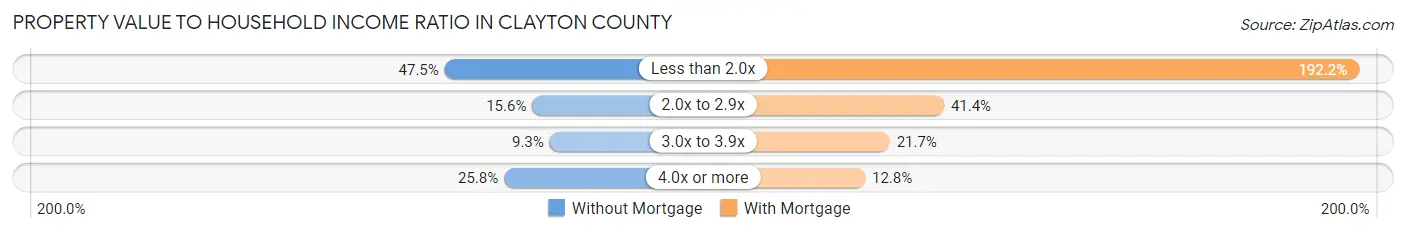
| Value-to-Income Ratio | Without Mortgage | With Mortgage |
| Less than 2.0x | 8,172 (47.4%) | 73,511 (192.2%) |
| 2.0x to 2.9x | 2,689 (15.6%) | 15,839 (41.4%) |
| 3.0x to 3.9x | 1,603 (9.3%) | 8,303 (21.7%) |
| 4.0x or more | 4,450 (25.8%) | 4,878 (12.8%) |
| Total | 17,221 (100.0%) | 38,245 (100.0%) |
Real Estate Taxes by Mortgage Status in Clayton County
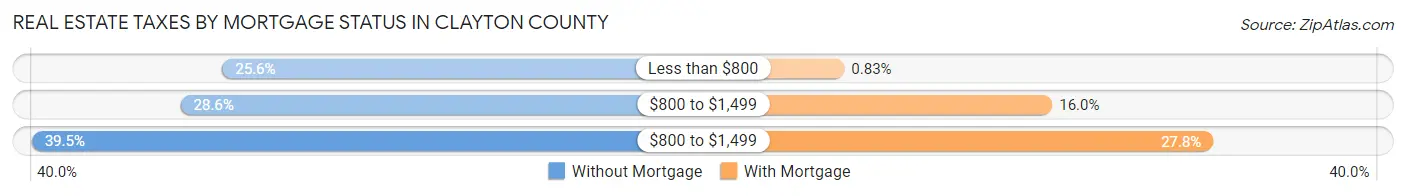
| Property Taxes | Without Mortgage | With Mortgage |
| Less than $800 | 4,400 (25.6%) | 318 (0.8%) |
| $800 to $1,499 | 4,927 (28.6%) | 6,128 (16.0%) |
| $800 to $1,499 | 6,798 (39.5%) | 10,619 (27.8%) |
| Total | 17,221 (100.0%) | 38,245 (100.0%) |
Health & Disability in Clayton County
Health Insurance Coverage by Age in Clayton County
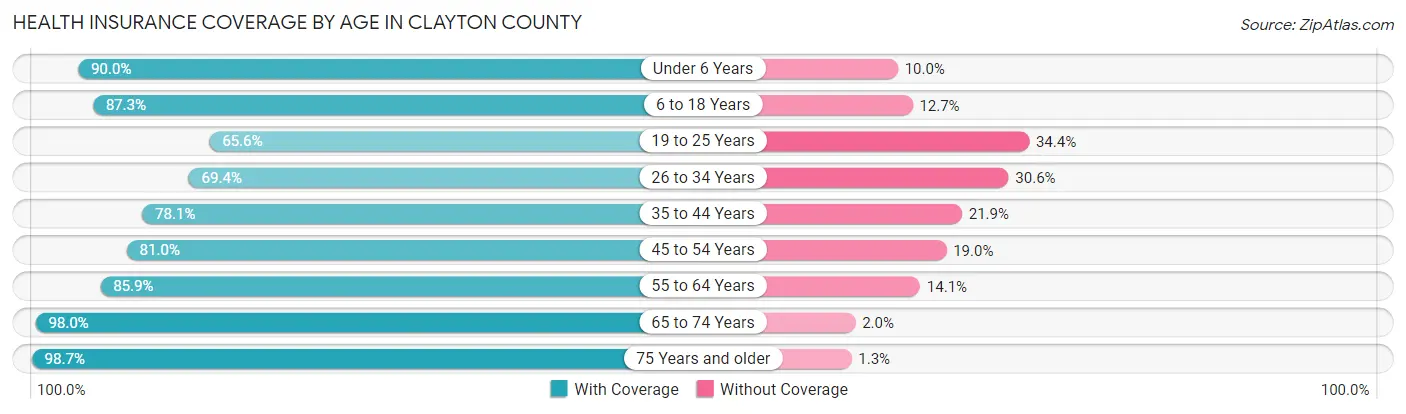
| Age Bracket | With Coverage | Without Coverage |
| Under 6 Years | 23,313 (90.0%) | 2,579 (10.0%) |
| 6 to 18 Years | 52,489 (87.3%) | 7,643 (12.7%) |
| 19 to 25 Years | 18,750 (65.6%) | 9,851 (34.4%) |
| 26 to 34 Years | 28,301 (69.4%) | 12,480 (30.6%) |
| 35 to 44 Years | 29,613 (78.1%) | 8,309 (21.9%) |
| 45 to 54 Years | 30,096 (81.0%) | 7,065 (19.0%) |
| 55 to 64 Years | 28,747 (85.9%) | 4,719 (14.1%) |
| 65 to 74 Years | 19,754 (98.0%) | 409 (2.0%) |
| 75 Years and older | 8,883 (98.7%) | 119 (1.3%) |
| Total | 239,946 (81.9%) | 53,174 (18.1%) |
Health Insurance Coverage by Citizenship Status in Clayton County
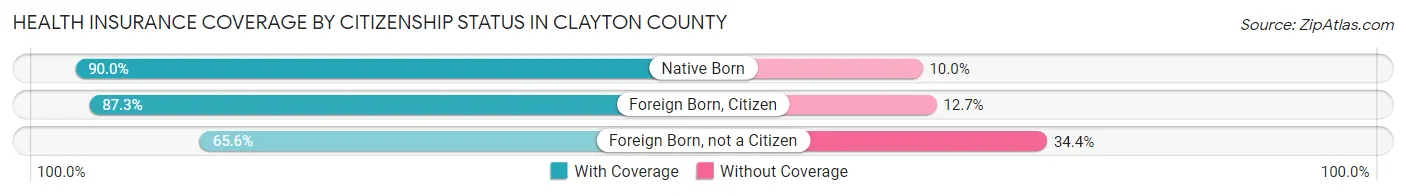
| Citizenship Status | With Coverage | Without Coverage |
| Native Born | 23,313 (90.0%) | 2,579 (10.0%) |
| Foreign Born, Citizen | 52,489 (87.3%) | 7,643 (12.7%) |
| Foreign Born, not a Citizen | 18,750 (65.6%) | 9,851 (34.4%) |
Health Insurance Coverage by Household Income in Clayton County
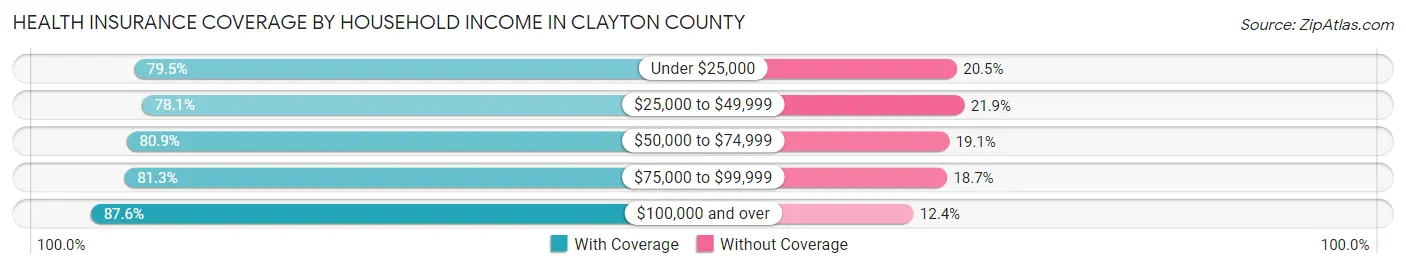
| Household Income | With Coverage | Without Coverage |
| Under $25,000 | 32,287 (79.5%) | 8,335 (20.5%) |
| $25,000 to $49,999 | 51,781 (78.1%) | 14,543 (21.9%) |
| $50,000 to $74,999 | 50,002 (80.9%) | 11,796 (19.1%) |
| $75,000 to $99,999 | 37,693 (81.3%) | 8,650 (18.7%) |
| $100,000 and over | 67,252 (87.6%) | 9,510 (12.4%) |
Public vs Private Health Insurance Coverage by Age in Clayton County
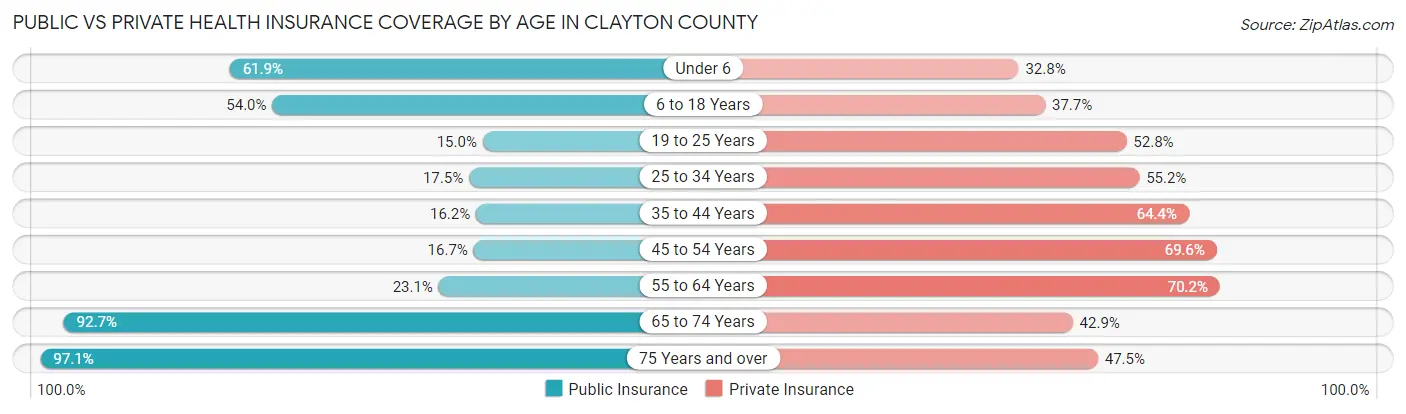
| Age Bracket | Public Insurance | Private Insurance |
| Under 6 | 16,032 (61.9%) | 8,492 (32.8%) |
| 6 to 18 Years | 32,477 (54.0%) | 22,689 (37.7%) |
| 19 to 25 Years | 4,278 (15.0%) | 15,110 (52.8%) |
| 25 to 34 Years | 7,145 (17.5%) | 22,511 (55.2%) |
| 35 to 44 Years | 6,146 (16.2%) | 24,423 (64.4%) |
| 45 to 54 Years | 6,189 (16.7%) | 25,863 (69.6%) |
| 55 to 64 Years | 7,744 (23.1%) | 23,476 (70.2%) |
| 65 to 74 Years | 18,700 (92.7%) | 8,640 (42.8%) |
| 75 Years and over | 8,737 (97.1%) | 4,277 (47.5%) |
| Total | 107,448 (36.7%) | 155,481 (53.0%) |
Disability Status by Sex by Age in Clayton County
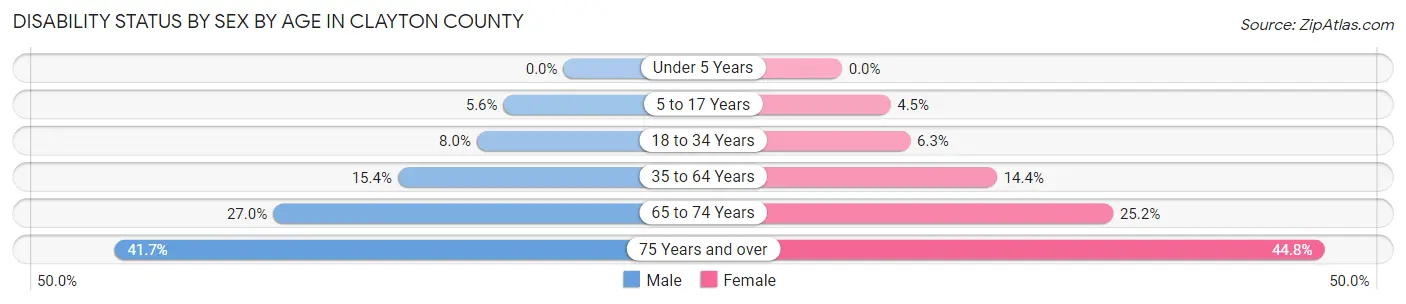
| Age Bracket | Male | Female |
| Under 5 Years | 0 (0.0%) | 0 (0.0%) |
| 5 to 17 Years | 1,697 (5.6%) | 1,333 (4.5%) |
| 18 to 34 Years | 2,787 (8.0%) | 2,500 (6.3%) |
| 35 to 64 Years | 7,403 (15.4%) | 8,681 (14.4%) |
| 65 to 74 Years | 2,377 (27.0%) | 2,855 (25.2%) |
| 75 Years and over | 1,488 (41.7%) | 2,431 (44.8%) |
Disability Class by Sex by Age in Clayton County
Disability Class: Hearing Difficulty
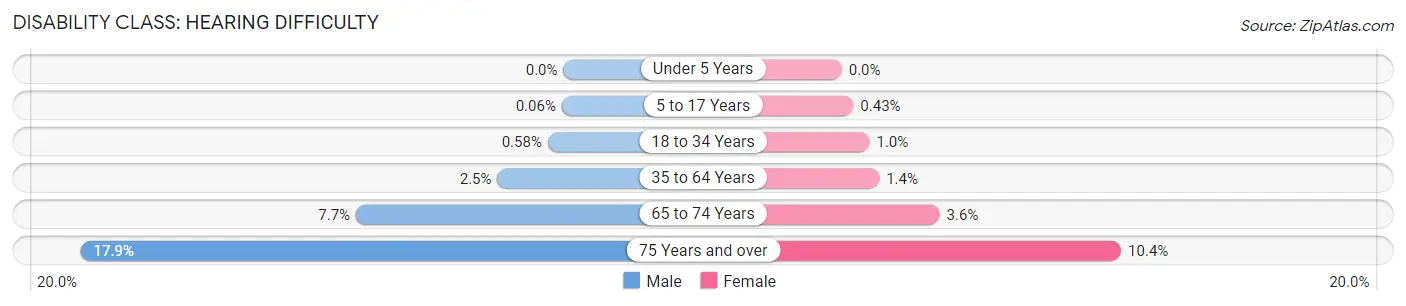
| Age Bracket | Male | Female |
| Under 5 Years | 0 (0.0%) | 0 (0.0%) |
| 5 to 17 Years | 19 (0.1%) | 128 (0.4%) |
| 18 to 34 Years | 202 (0.6%) | 405 (1.0%) |
| 35 to 64 Years | 1,181 (2.5%) | 842 (1.4%) |
| 65 to 74 Years | 679 (7.7%) | 412 (3.6%) |
| 75 Years and over | 640 (17.9%) | 563 (10.4%) |
Disability Class: Vision Difficulty
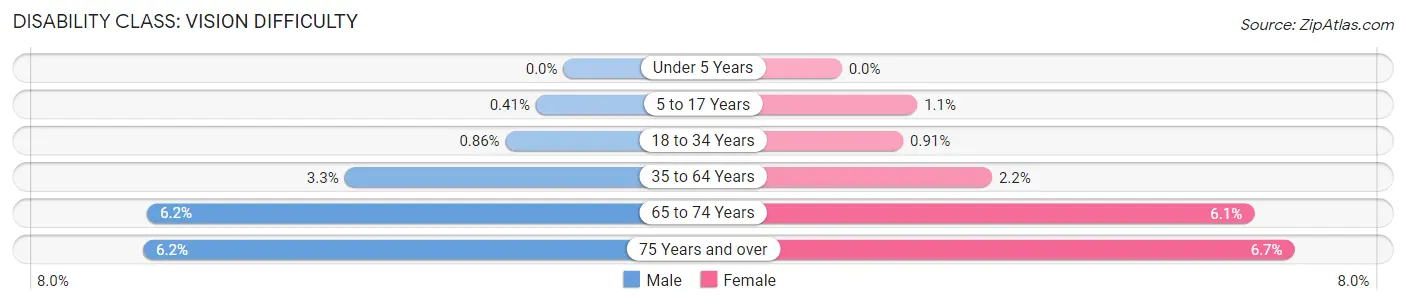
| Age Bracket | Male | Female |
| Under 5 Years | 0 (0.0%) | 0 (0.0%) |
| 5 to 17 Years | 126 (0.4%) | 332 (1.1%) |
| 18 to 34 Years | 299 (0.9%) | 360 (0.9%) |
| 35 to 64 Years | 1,563 (3.3%) | 1,346 (2.2%) |
| 65 to 74 Years | 545 (6.2%) | 694 (6.1%) |
| 75 Years and over | 223 (6.2%) | 365 (6.7%) |
Disability Class: Cognitive Difficulty
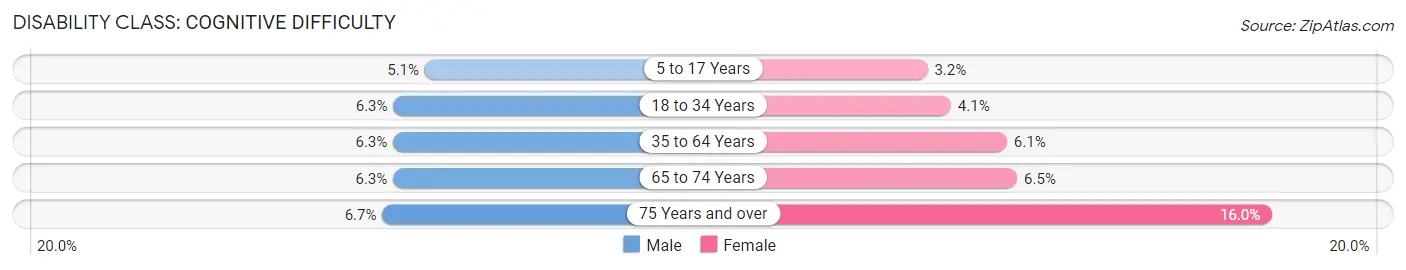
| Age Bracket | Male | Female |
| 5 to 17 Years | 1,566 (5.1%) | 942 (3.2%) |
| 18 to 34 Years | 2,188 (6.3%) | 1,599 (4.1%) |
| 35 to 64 Years | 3,046 (6.3%) | 3,704 (6.1%) |
| 65 to 74 Years | 557 (6.3%) | 739 (6.5%) |
| 75 Years and over | 240 (6.7%) | 867 (16.0%) |
Disability Class: Ambulatory Difficulty
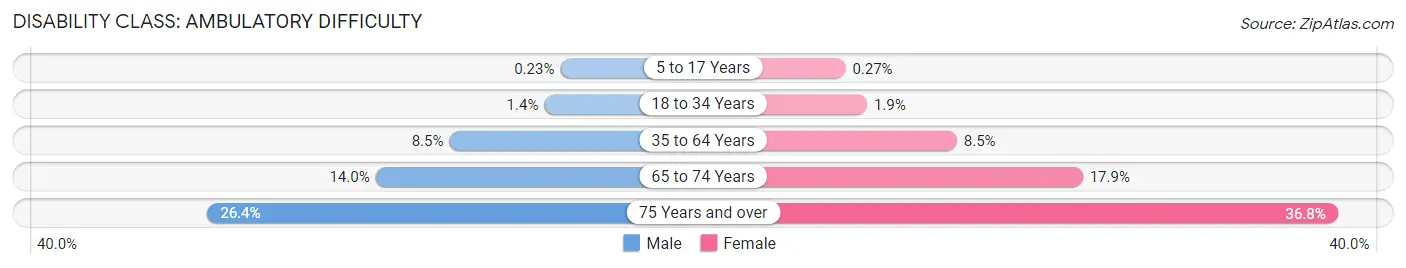
| Age Bracket | Male | Female |
| 5 to 17 Years | 69 (0.2%) | 80 (0.3%) |
| 18 to 34 Years | 493 (1.4%) | 739 (1.9%) |
| 35 to 64 Years | 4,077 (8.5%) | 5,156 (8.5%) |
| 65 to 74 Years | 1,230 (14.0%) | 2,030 (17.9%) |
| 75 Years and over | 944 (26.4%) | 1,999 (36.8%) |
Disability Class: Self-Care Difficulty
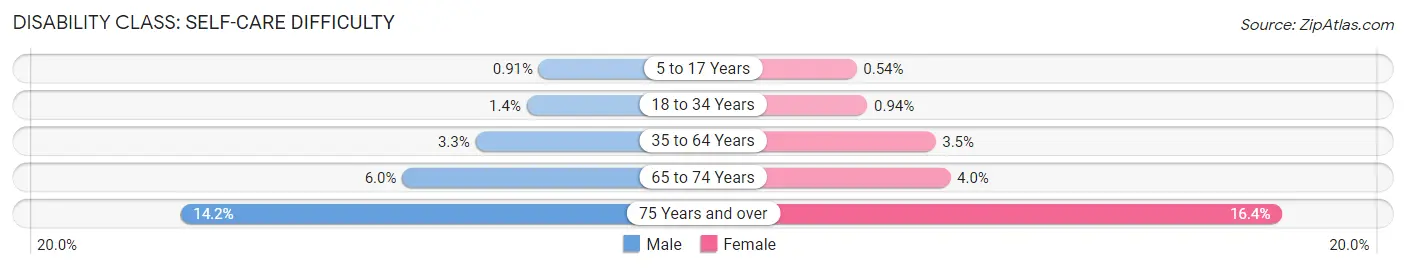
| Age Bracket | Male | Female |
| 5 to 17 Years | 278 (0.9%) | 160 (0.5%) |
| 18 to 34 Years | 472 (1.4%) | 371 (0.9%) |
| 35 to 64 Years | 1,569 (3.3%) | 2,093 (3.5%) |
| 65 to 74 Years | 527 (6.0%) | 456 (4.0%) |
| 75 Years and over | 508 (14.2%) | 888 (16.4%) |
Technology Access in Clayton County
Computing Device Access in Clayton County
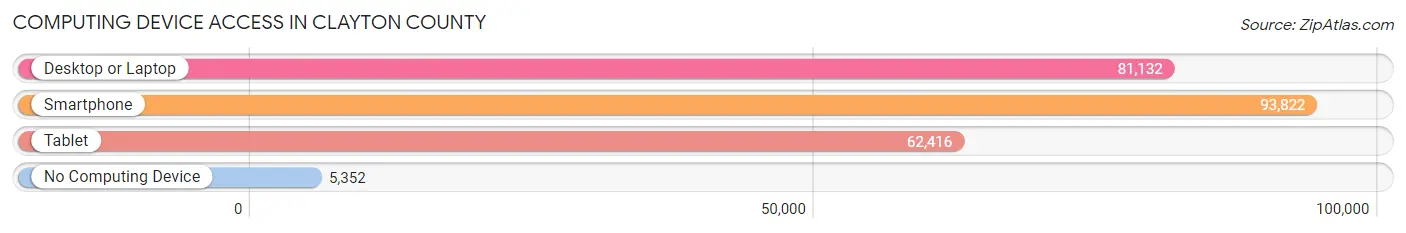
| Device Type | # Households | % Households |
| Desktop or Laptop | 81,132 | 77.4% |
| Smartphone | 93,822 | 89.5% |
| Tablet | 62,416 | 59.6% |
| No Computing Device | 5,352 | 5.1% |
| Total | 104,820 | 100.0% |
Internet Access in Clayton County
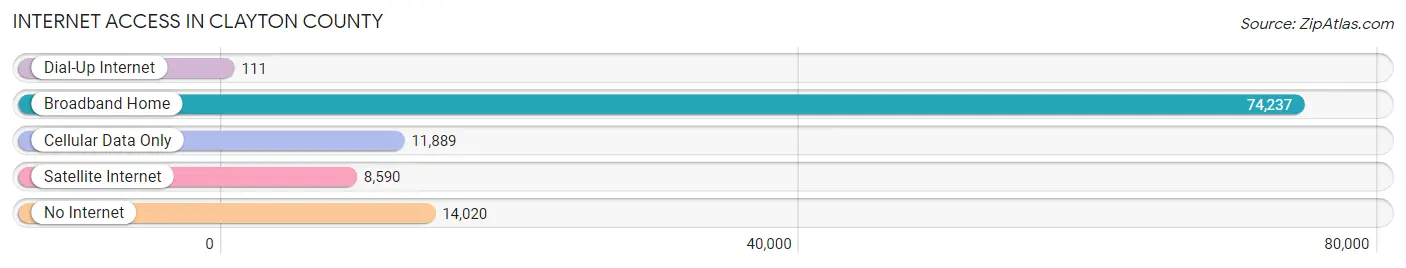
| Internet Type | # Households | % Households |
| Dial-Up Internet | 111 | 0.1% |
| Broadband Home | 74,237 | 70.8% |
| Cellular Data Only | 11,889 | 11.3% |
| Satellite Internet | 8,590 | 8.2% |
| No Internet | 14,020 | 13.4% |
| Total | 104,820 | 100.0% |
Clayton County Summary
Clayton County, Georgia is located in the south-central part of the state, just south of Atlanta. It is bordered by Fulton County to the north, Fayette County to the east, Henry County to the south, and Spalding County to the west. The county seat is Jonesboro, and the county is part of the Atlanta metropolitan area.
History
Clayton County was created in 1858 from parts of Fayette and Henry counties. It was named for Augustin Smith Clayton, a prominent lawyer and politician who served in the Georgia House of Representatives and the U.S. House of Representatives.
The county was home to several Native American tribes prior to European settlement, including the Creek, Cherokee, and Shawnee. The area was first settled by Europeans in the early 19th century, and the county was officially established in 1858.
During the Civil War, Clayton County was the site of several battles, including the Battle of Jonesboro in 1864. After the war, the county experienced a period of growth and development, with the establishment of several towns and cities, including Jonesboro, Morrow, and Forest Park.
Geography
Clayton County covers an area of approximately 144 square miles. It is located in the Piedmont region of Georgia, and is characterized by rolling hills and forests. The county is drained by the Flint River and its tributaries.
The county is home to several parks and recreational areas, including the Clayton County International Park, the Clayton County Nature Center, and the Clayton County Water Authority Reservoir.
Economy
The economy of Clayton County is largely based on services and retail. The county is home to several major employers, including Hartsfield-Jackson Atlanta International Airport, Delta Air Lines, and the Clayton County Public Schools.
The county also has a thriving agricultural sector, with crops such as corn, soybeans, and cotton being grown in the area.
Demographics
As of the 2010 census, Clayton County had a population of 259,424. The racial makeup of the county was 57.2% African American, 33.3% White, 5.2% Hispanic or Latino, 2.3% Asian, and 1.9% from other races.
The median household income in the county was $45,945, and the median family income was $54,817. The per capita income was $22,845.
Conclusion
Clayton County, Georgia is a diverse and vibrant county located in the south-central part of the state. It has a rich history, and is home to several major employers and attractions. The county has a diverse population, and a strong economy based on services and retail.
Common Questions
What is the Total Population of Clayton County?
Total Population of Clayton County is 296,312.
What is the Total Male Population of Clayton County?
Total Male Population of Clayton County is 139,076.
What is the Total Female Population of Clayton County?
Total Female Population of Clayton County is 157,236.
What is the Ratio of Males per 100 Females in Clayton County?
There are 88.45 Males per 100 Females in Clayton County.
What is the Ratio of Females per 100 Males in Clayton County?
There are 113.06 Females per 100 Males in Clayton County.
What is the Median Population Age in Clayton County?
Median Population Age in Clayton County is 33.0 Years.
What is the Average Family Size in Clayton County
Average Family Size in Clayton County is 3.4 People.
What is the Average Household Size in Clayton County
Average Household Size in Clayton County is 2.8 People.
What is Per Capita Income in Clayton County?
Per Capita income in Clayton County is $25,549.
What is the Median Family Income in Clayton County?
Median Family Income in Clayton County is $62,391.
What is the Median Household income in Clayton County?
Median Household Income in Clayton County is $56,207.
What is Income or Wage Gap in Clayton County?
Income or Wage Gap in Clayton County is 15.6%.
Women in Clayton County earn 84.4 cents for every dollar earned by a man.
What is Family Income Deficit in Clayton County?
Family Income Deficit in Clayton County is $11,485.
Families that are below poverty line in Clayton County earn $11,485 less on average than the poverty threshold level.
What is Inequality or Gini Index in Clayton County?
Inequality or Gini Index in Clayton County is 0.42.
How Large is the Labor Force in Clayton County?
There are 148,561 People in the Labor Forcein in Clayton County.
What is the Percentage of People in the Labor Force in Clayton County?
66.2% of People are in the Labor Force in Clayton County.
What is the Unemployment Rate in Clayton County?
Unemployment Rate in Clayton County is 6.8%.