Lowndes County, GA
Lowndes County Map
Lowndes County Overview
118,257
TOTAL POPULATION
57,335
MALE POPULATION
60,922
FEMALE POPULATION
94.11
MALES / 100 FEMALES
106.26
FEMALES / 100 MALES
30.9
MEDIAN AGE
3.3
AVG FAMILY SIZE
2.6
AVG HOUSEHOLD SIZE
$27,553
PER CAPITA INCOME
$72,081
AVG FAMILY INCOME
$52,821
AVG HOUSEHOLD INCOME
29.2%
WAGE / INCOME GAP [ % ]
70.8¢/ $1
WAGE / INCOME GAP [ $ ]
$14,768
FAMILY INCOME DEFICIT
0.49
INEQUALITY / GINI INDEX
55,791
LABOR FORCE [ PEOPLE ]
60.1%
PERCENT IN LABOR FORCE
5.1%
UNEMPLOYMENT RATE
Lowndes County Area Codes
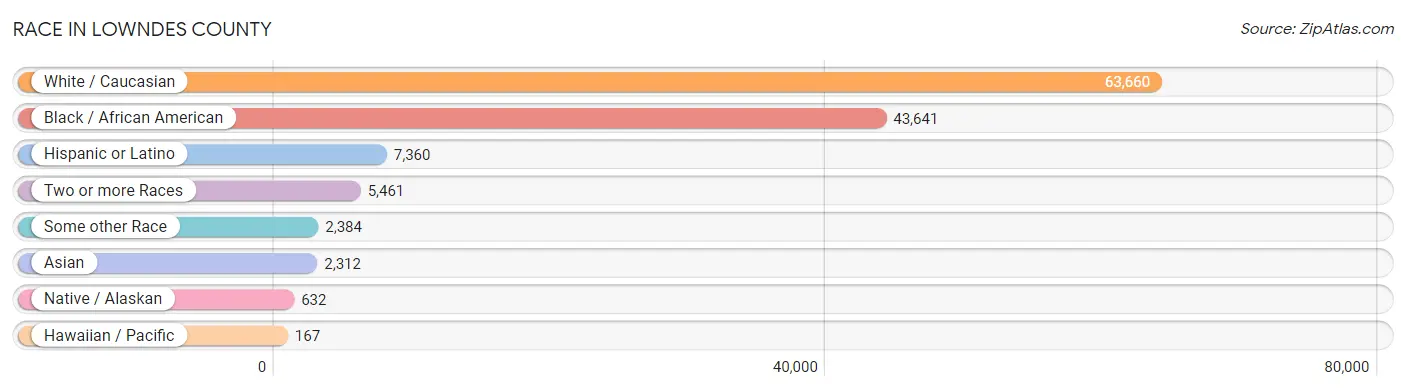
Race in Lowndes County
The most populous races in Lowndes County are White / Caucasian (63,660 | 53.8%), Black / African American (43,641 | 36.9%), and Hispanic or Latino (7,360 | 6.2%).
| Race | # Population | % Population |
| Asian | 2,312 | 2.0% |
| Black / African American | 43,641 | 36.9% |
| Hawaiian / Pacific | 167 | 0.1% |
| Hispanic or Latino | 7,360 | 6.2% |
| Native / Alaskan | 632 | 0.5% |
| White / Caucasian | 63,660 | 53.8% |
| Two or more Races | 5,461 | 4.6% |
| Some other Race | 2,384 | 2.0% |
| Total | 118,257 | 100.0% |
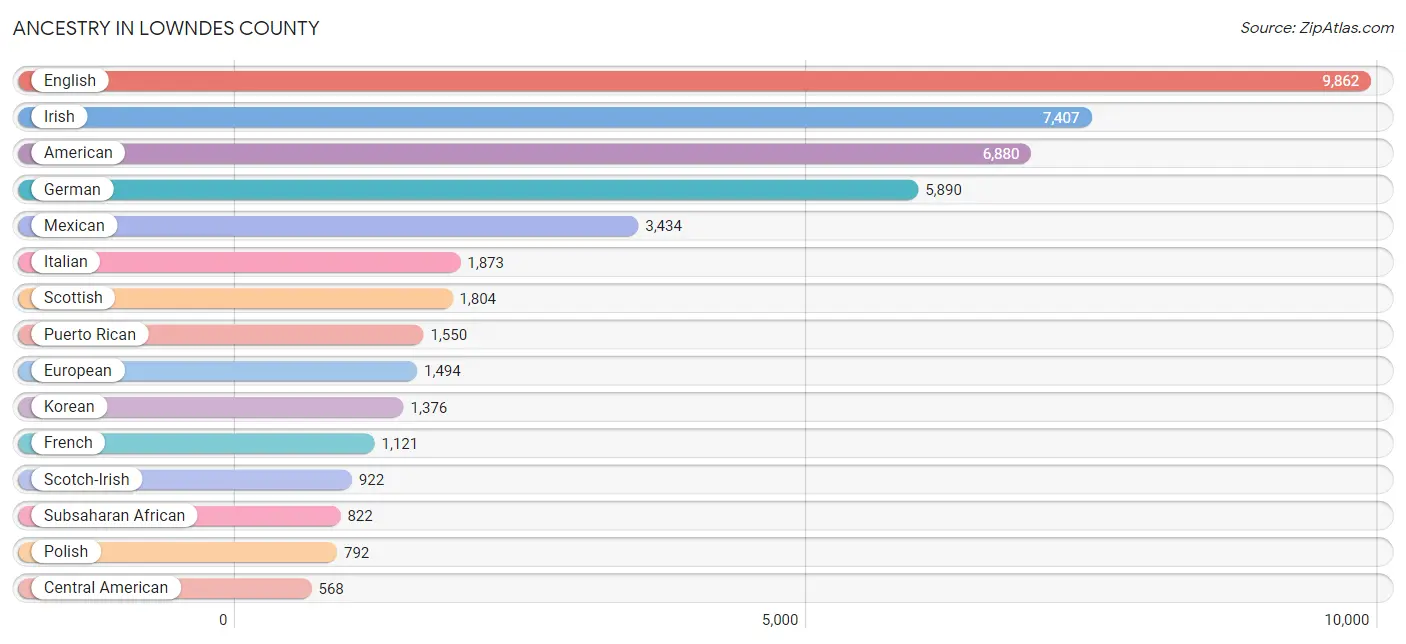
Ancestry in Lowndes County
The most populous ancestries reported in Lowndes County are English (9,862 | 8.3%), Irish (7,407 | 6.3%), American (6,880 | 5.8%), German (5,890 | 5.0%), and Mexican (3,434 | 2.9%), together accounting for 28.3% of all Lowndes County residents.
| Ancestry | # Population | % Population |
| African | 521 | 0.4% |
| American | 6,880 | 5.8% |
| Arab | 231 | 0.2% |
| Argentinean | 4 | 0.0% |
| Australian | 2 | 0.0% |
| Austrian | 104 | 0.1% |
| Bahamian | 45 | 0.0% |
| Barbadian | 20 | 0.0% |
| Belgian | 22 | 0.0% |
| Belizean | 15 | 0.0% |
| Bhutanese | 199 | 0.2% |
| Bolivian | 14 | 0.0% |
| Brazilian | 5 | 0.0% |
| British | 522 | 0.4% |
| Burmese | 376 | 0.3% |
| Canadian | 132 | 0.1% |
| Celtic | 16 | 0.0% |
| Central American | 568 | 0.5% |
| Central American Indian | 378 | 0.3% |
| Cherokee | 341 | 0.3% |
| Chilean | 33 | 0.0% |
| Chinese | 17 | 0.0% |
| Chippewa | 12 | 0.0% |
| Choctaw | 32 | 0.0% |
| Colombian | 277 | 0.2% |
| Creek | 35 | 0.0% |
| Croatian | 31 | 0.0% |
| Crow | 59 | 0.1% |
| Cuban | 548 | 0.5% |
| Czech | 35 | 0.0% |
| Czechoslovakian | 14 | 0.0% |
| Danish | 148 | 0.1% |
| Dominican | 167 | 0.1% |
| Dutch | 465 | 0.4% |
| Dutch West Indian | 19 | 0.0% |
| Eastern European | 166 | 0.1% |
| Ecuadorian | 51 | 0.0% |
| Egyptian | 39 | 0.0% |
| English | 9,862 | 8.3% |
| European | 1,494 | 1.3% |
| Filipino | 21 | 0.0% |
| Finnish | 48 | 0.0% |
| French | 1,121 | 0.9% |
| French American Indian | 41 | 0.0% |
| French Canadian | 317 | 0.3% |
| German | 5,890 | 5.0% |
| Ghanaian | 111 | 0.1% |
| Greek | 79 | 0.1% |
| Guatemalan | 404 | 0.3% |
| Guyanese | 95 | 0.1% |
| Haitian | 193 | 0.2% |
| Honduran | 35 | 0.0% |
| Hungarian | 149 | 0.1% |
| Icelander | 28 | 0.0% |
| Indian (Asian) | 348 | 0.3% |
| Irish | 7,407 | 6.3% |
| Israeli | 16 | 0.0% |
| Italian | 1,873 | 1.6% |
| Jamaican | 164 | 0.1% |
| Korean | 1,376 | 1.2% |
| Laotian | 6 | 0.0% |
| Lebanese | 157 | 0.1% |
| Lithuanian | 41 | 0.0% |
| Malaysian | 30 | 0.0% |
| Mexican | 3,434 | 2.9% |
| Mexican American Indian | 198 | 0.2% |
| Native Hawaiian | 188 | 0.2% |
| Navajo | 21 | 0.0% |
| Nicaraguan | 23 | 0.0% |
| Nigerian | 190 | 0.2% |
| Northern European | 71 | 0.1% |
| Norwegian | 230 | 0.2% |
| Pakistani | 248 | 0.2% |
| Palestinian | 2 | 0.0% |
| Panamanian | 73 | 0.1% |
| Pennsylvania German | 133 | 0.1% |
| Peruvian | 18 | 0.0% |
| Polish | 792 | 0.7% |
| Portuguese | 118 | 0.1% |
| Puerto Rican | 1,550 | 1.3% |
| Romanian | 129 | 0.1% |
| Russian | 148 | 0.1% |
| Salvadoran | 33 | 0.0% |
| Samoan | 44 | 0.0% |
| Scandinavian | 248 | 0.2% |
| Scotch-Irish | 922 | 0.8% |
| Scottish | 1,804 | 1.5% |
| Seminole | 71 | 0.1% |
| Slavic | 8 | 0.0% |
| Slovak | 70 | 0.1% |
| South American | 512 | 0.4% |
| South American Indian | 8 | 0.0% |
| Spaniard | 63 | 0.1% |
| Spanish | 284 | 0.2% |
| Sri Lankan | 277 | 0.2% |
| Subsaharan African | 822 | 0.7% |
| Swedish | 272 | 0.2% |
| Swiss | 50 | 0.0% |
| Thai | 208 | 0.2% |
| Tongan | 44 | 0.0% |
| Trinidadian and Tobagonian | 28 | 0.0% |
| Turkish | 13 | 0.0% |
| Ukrainian | 12 | 0.0% |
| Venezuelan | 115 | 0.1% |
| Welsh | 515 | 0.4% |
| West Indian | 7 | 0.0% |
| Yugoslavian | 33 | 0.0% | View All 107 Rows |
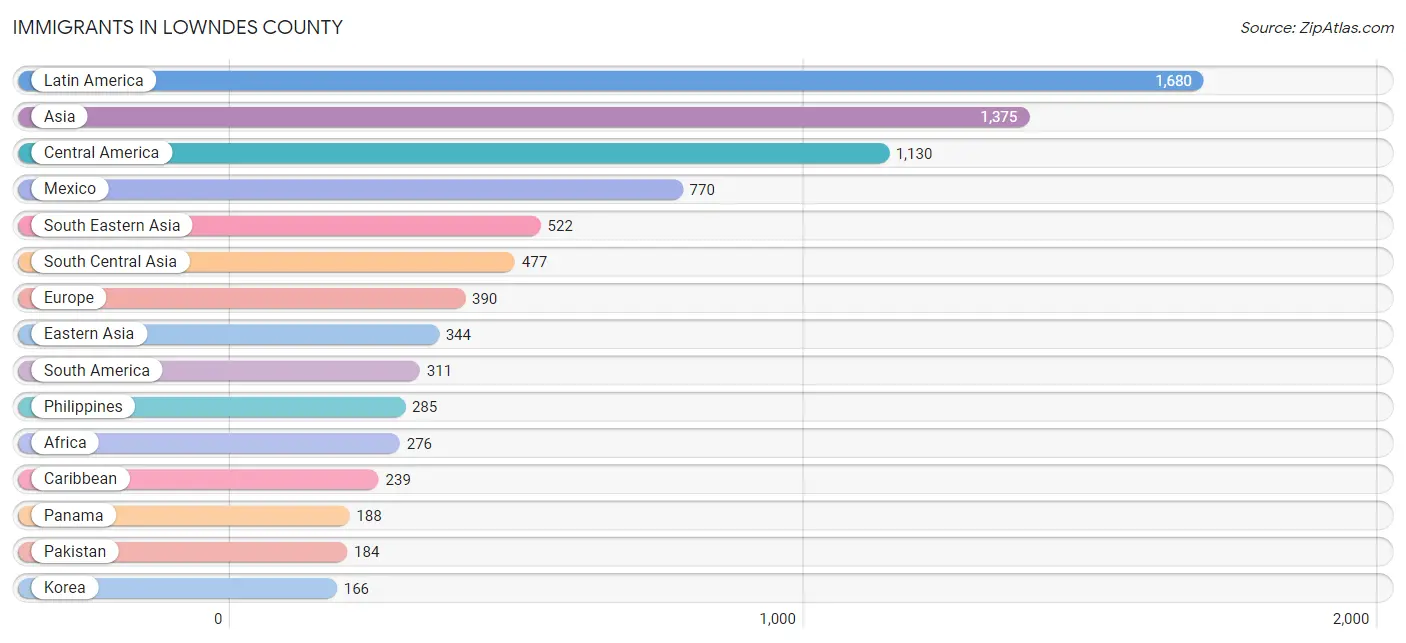
Immigrants in Lowndes County
The most numerous immigrant groups reported in Lowndes County came from Latin America (1,680 | 1.4%), Asia (1,375 | 1.2%), Central America (1,130 | 1.0%), Mexico (770 | 0.6%), and South Eastern Asia (522 | 0.4%), together accounting for 4.6% of all Lowndes County residents.
| Immigration Origin | # Population | % Population |
| Africa | 276 | 0.2% |
| Asia | 1,375 | 1.2% |
| Austria | 10 | 0.0% |
| Bahamas | 2 | 0.0% |
| Barbados | 20 | 0.0% |
| Belgium | 8 | 0.0% |
| Belize | 15 | 0.0% |
| Bolivia | 3 | 0.0% |
| Brazil | 5 | 0.0% |
| Canada | 96 | 0.1% |
| Caribbean | 239 | 0.2% |
| Central America | 1,130 | 1.0% |
| China | 65 | 0.1% |
| Colombia | 45 | 0.0% |
| Cuba | 55 | 0.1% |
| Czechoslovakia | 19 | 0.0% |
| Dominica | 12 | 0.0% |
| Dominican Republic | 19 | 0.0% |
| Eastern Africa | 20 | 0.0% |
| Eastern Asia | 344 | 0.3% |
| Eastern Europe | 54 | 0.1% |
| Ecuador | 10 | 0.0% |
| Egypt | 23 | 0.0% |
| El Salvador | 18 | 0.0% |
| England | 36 | 0.0% |
| Europe | 390 | 0.3% |
| Germany | 128 | 0.1% |
| Ghana | 111 | 0.1% |
| Guatemala | 93 | 0.1% |
| Guyana | 115 | 0.1% |
| Haiti | 30 | 0.0% |
| Honduras | 3 | 0.0% |
| Hong Kong | 11 | 0.0% |
| India | 137 | 0.1% |
| Italy | 23 | 0.0% |
| Jamaica | 75 | 0.1% |
| Japan | 113 | 0.1% |
| Korea | 166 | 0.1% |
| Laos | 30 | 0.0% |
| Latin America | 1,680 | 1.4% |
| Mexico | 770 | 0.6% |
| Nepal | 57 | 0.1% |
| Nicaragua | 10 | 0.0% |
| Nigeria | 12 | 0.0% |
| Northern Africa | 23 | 0.0% |
| Northern Europe | 136 | 0.1% |
| Pakistan | 184 | 0.2% |
| Panama | 188 | 0.2% |
| Peru | 18 | 0.0% |
| Philippines | 285 | 0.2% |
| Poland | 6 | 0.0% |
| Russia | 29 | 0.0% |
| Sierra Leone | 18 | 0.0% |
| South Africa | 71 | 0.1% |
| South America | 311 | 0.3% |
| South Central Asia | 477 | 0.4% |
| South Eastern Asia | 522 | 0.4% |
| Southern Europe | 54 | 0.1% |
| Spain | 31 | 0.0% |
| Taiwan | 21 | 0.0% |
| Thailand | 128 | 0.1% |
| Trinidad and Tobago | 7 | 0.0% |
| Turkey | 13 | 0.0% |
| Venezuela | 108 | 0.1% |
| Vietnam | 79 | 0.1% |
| Western Africa | 141 | 0.1% |
| Western Asia | 13 | 0.0% |
| Western Europe | 146 | 0.1% | View All 68 Rows |
Sex and Age in Lowndes County
Sex and Age in Lowndes County
The most populous age groups in Lowndes County are 20 to 24 Years (7,693 | 13.4%) for men and 20 to 24 Years (7,418 | 12.2%) for women.
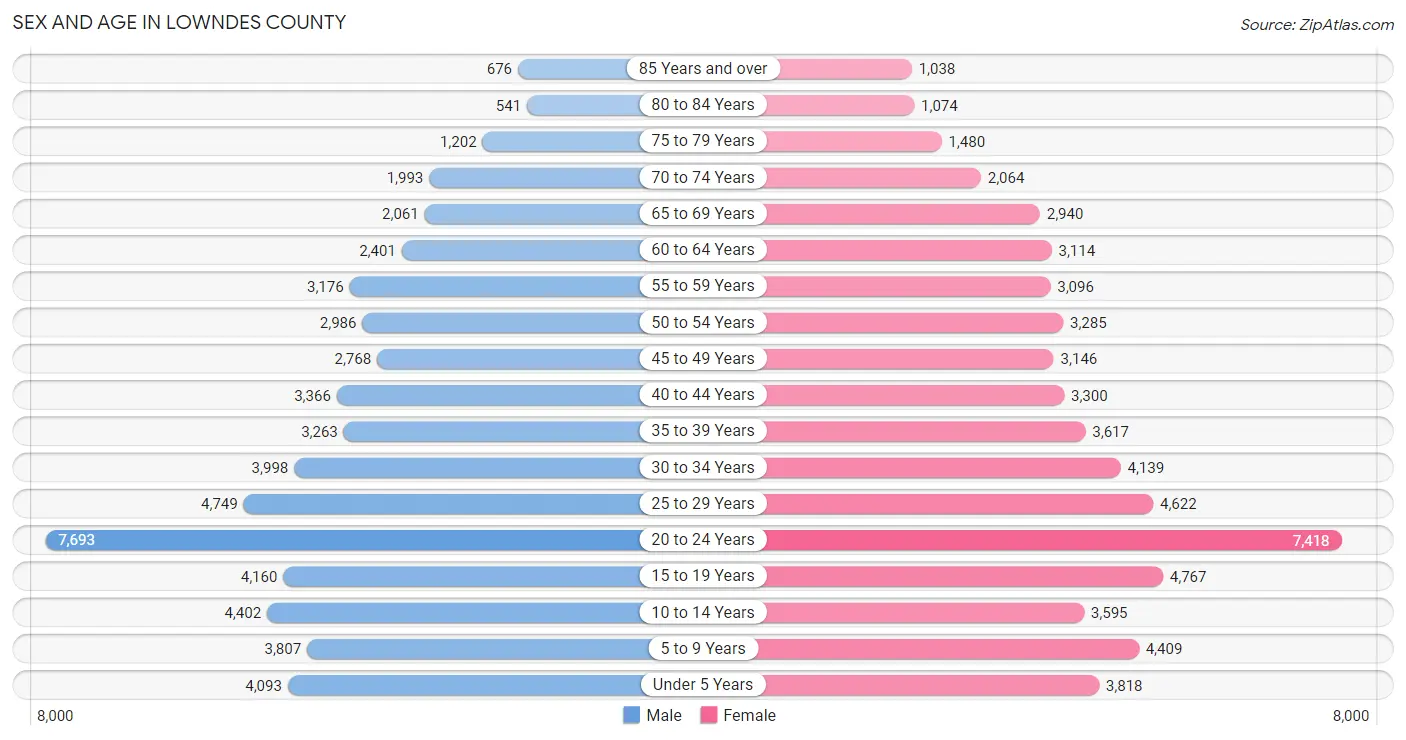
| Age Bracket | Male | Female |
| Under 5 Years | 4,093 (7.1%) | 3,818 (6.3%) |
| 5 to 9 Years | 3,807 (6.6%) | 4,409 (7.2%) |
| 10 to 14 Years | 4,402 (7.7%) | 3,595 (5.9%) |
| 15 to 19 Years | 4,160 (7.3%) | 4,767 (7.8%) |
| 20 to 24 Years | 7,693 (13.4%) | 7,418 (12.2%) |
| 25 to 29 Years | 4,749 (8.3%) | 4,622 (7.6%) |
| 30 to 34 Years | 3,998 (7.0%) | 4,139 (6.8%) |
| 35 to 39 Years | 3,263 (5.7%) | 3,617 (5.9%) |
| 40 to 44 Years | 3,366 (5.9%) | 3,300 (5.4%) |
| 45 to 49 Years | 2,768 (4.8%) | 3,146 (5.2%) |
| 50 to 54 Years | 2,986 (5.2%) | 3,285 (5.4%) |
| 55 to 59 Years | 3,176 (5.5%) | 3,096 (5.1%) |
| 60 to 64 Years | 2,401 (4.2%) | 3,114 (5.1%) |
| 65 to 69 Years | 2,061 (3.6%) | 2,940 (4.8%) |
| 70 to 74 Years | 1,993 (3.5%) | 2,064 (3.4%) |
| 75 to 79 Years | 1,202 (2.1%) | 1,480 (2.4%) |
| 80 to 84 Years | 541 (0.9%) | 1,074 (1.8%) |
| 85 Years and over | 676 (1.2%) | 1,038 (1.7%) |
| Total | 57,335 (100.0%) | 60,922 (100.0%) |
Families and Households in Lowndes County
Median Family Size in Lowndes County
The median family size in Lowndes County is 3.31 persons per family, with single female/mother families (6,892 | 25.4%) accounting for the largest median family size of 3.72 persons per family. On the other hand, single male/father families (1,808 | 6.7%) represent the smallest median family size with 2.79 persons per family.
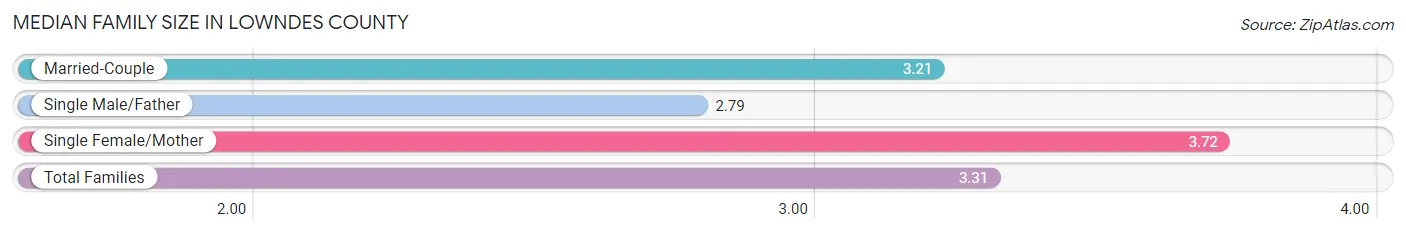
| Family Type | # Families | Family Size |
| Married-Couple | 18,482 (68.0%) | 3.21 |
| Single Male/Father | 1,808 (6.7%) | 2.79 |
| Single Female/Mother | 6,892 (25.4%) | 3.72 |
| Total Families | 27,182 (100.0%) | 3.31 |
Median Household Size in Lowndes County
The median household size in Lowndes County is 2.61 persons per household, with single female/mother households (6,892 | 15.8%) accounting for the largest median household size of 3.9 persons per household. non-family households (16,538 | 37.8%) represent the smallest median household size with 1.30 persons per household.
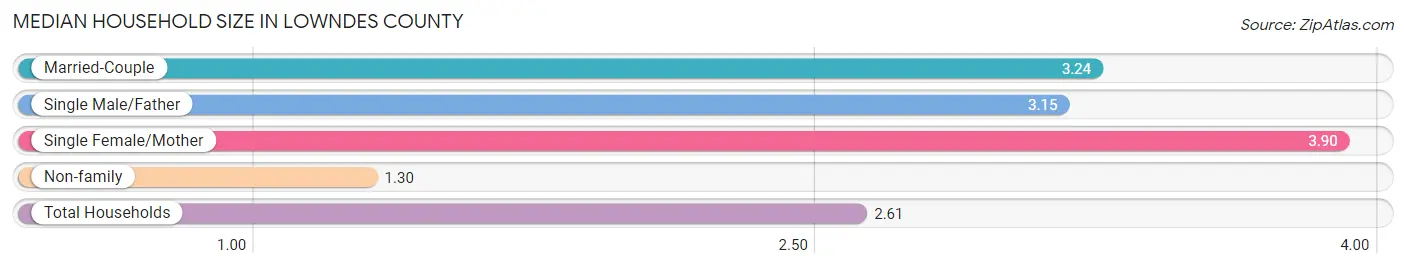
| Household Type | # Households | Household Size |
| Married-Couple | 18,482 (42.3%) | 3.24 |
| Single Male/Father | 1,808 (4.1%) | 3.15 |
| Single Female/Mother | 6,892 (15.8%) | 3.90 |
| Non-family | 16,538 (37.8%) | 1.30 |
| Total Households | 43,720 (100.0%) | 2.61 |
Household Size by Marriage Status in Lowndes County
Out of a total of 43,720 households in Lowndes County, 27,182 (62.2%) are family households, while 16,538 (37.8%) are nonfamily households. The most numerous type of family households are 2-person households, comprising 11,786, and the most common type of nonfamily households are 1-person households, comprising 13,379.
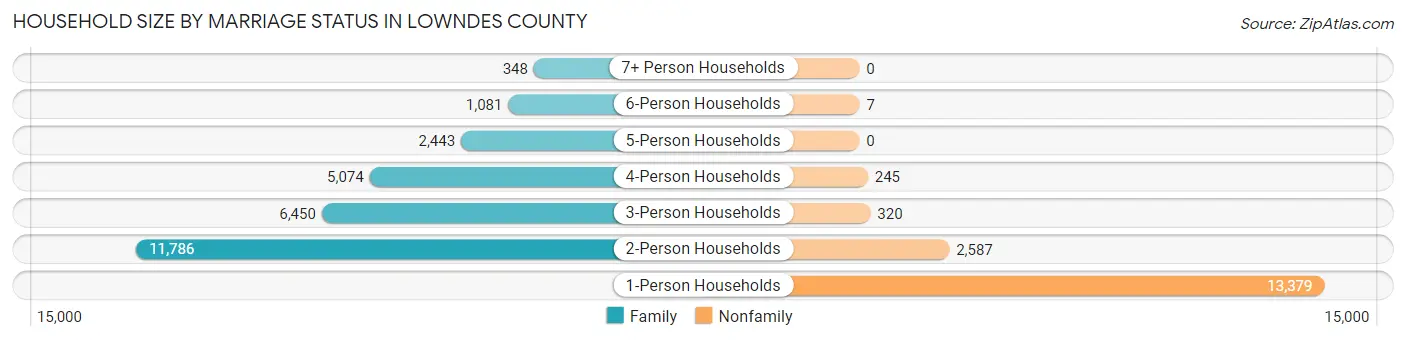
| Household Size | Family Households | Nonfamily Households |
| 1-Person Households | - | 13,379 (30.6%) |
| 2-Person Households | 11,786 (27.0%) | 2,587 (5.9%) |
| 3-Person Households | 6,450 (14.7%) | 320 (0.7%) |
| 4-Person Households | 5,074 (11.6%) | 245 (0.6%) |
| 5-Person Households | 2,443 (5.6%) | 0 (0.0%) |
| 6-Person Households | 1,081 (2.5%) | 7 (0.0%) |
| 7+ Person Households | 348 (0.8%) | 0 (0.0%) |
| Total | 27,182 (62.2%) | 16,538 (37.8%) |
Female Fertility in Lowndes County
Fertility by Age in Lowndes County
Average fertility rate in Lowndes County is 63.0 births per 1,000 women. Women in the age bracket of 20 to 34 years have the highest fertility rate with 102.0 births per 1,000 women. Women in the age bracket of 20 to 34 years acount for 82.6% of all women with births.
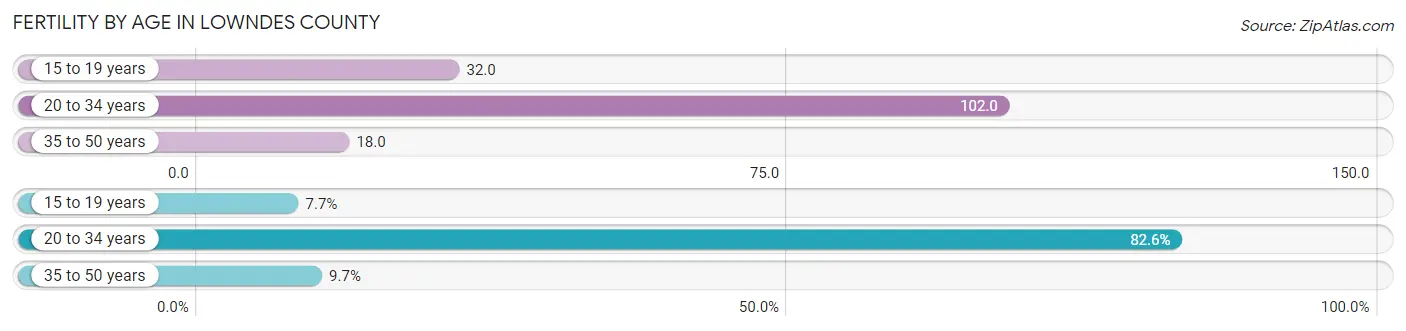
| Age Bracket | Women with Births | Births / 1,000 Women |
| 15 to 19 years | 154 (7.7%) | 32.0 |
| 20 to 34 years | 1,657 (82.6%) | 102.0 |
| 35 to 50 years | 194 (9.7%) | 18.0 |
| Total | 2,005 (100.0%) | 63.0 |
Fertility by Age by Marriage Status in Lowndes County
63.1% of women with births (2,005) in Lowndes County are married. The highest percentage of unmarried women with births falls into 15 to 19 years age bracket with 100.0% of them unmarried at the time of birth, while the lowest percentage of unmarried women with births belong to 35 to 50 years age bracket with 0.0% of them unmarried.
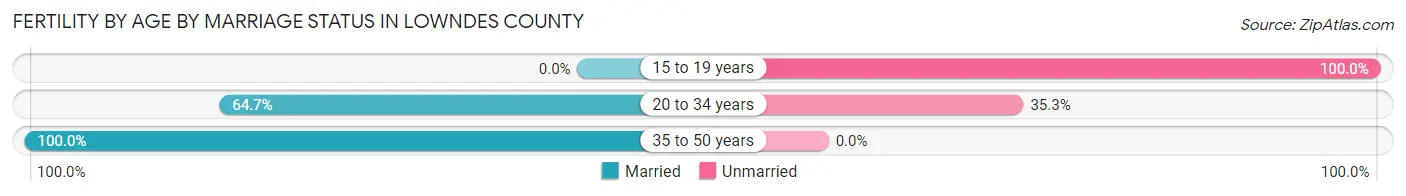
| Age Bracket | Married | Unmarried |
| 15 to 19 years | 0 (0.0%) | 154 (100.0%) |
| 20 to 34 years | 1,072 (64.7%) | 585 (35.3%) |
| 35 to 50 years | 194 (100.0%) | 0 (0.0%) |
| Total | 1,265 (63.1%) | 740 (36.9%) |
Fertility by Education in Lowndes County
Average fertility rate in Lowndes County is 63.0 births per 1,000 women. Women with the education attainment of graduate degree have the highest fertility rate of 148.0 births per 1,000 women, while women with the education attainment of less than high school have the lowest fertility at 24.0 births per 1,000 women. Women with the education attainment of high school diploma represent 38.2% of all women with births.
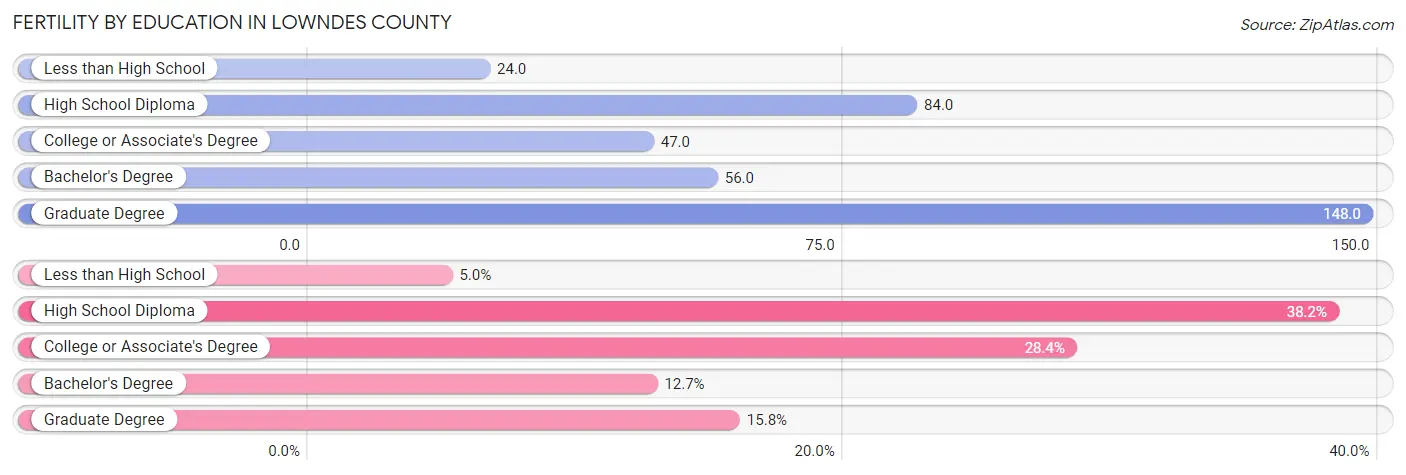
| Educational Attainment | Women with Births | Births / 1,000 Women |
| Less than High School | 100 (5.0%) | 24.0 |
| High School Diploma | 766 (38.2%) | 84.0 |
| College or Associate's Degree | 569 (28.4%) | 47.0 |
| Bachelor's Degree | 254 (12.7%) | 56.0 |
| Graduate Degree | 316 (15.8%) | 148.0 |
| Total | 2,005 (100.0%) | 63.0 |
Fertility by Education by Marriage Status in Lowndes County
36.9% of women with births in Lowndes County are unmarried. Women with the educational attainment of bachelor's degree are most likely to be married with 100.0% of them married at childbirth, while women with the educational attainment of less than high school are least likely to be married with 76.0% of them unmarried at childbirth.
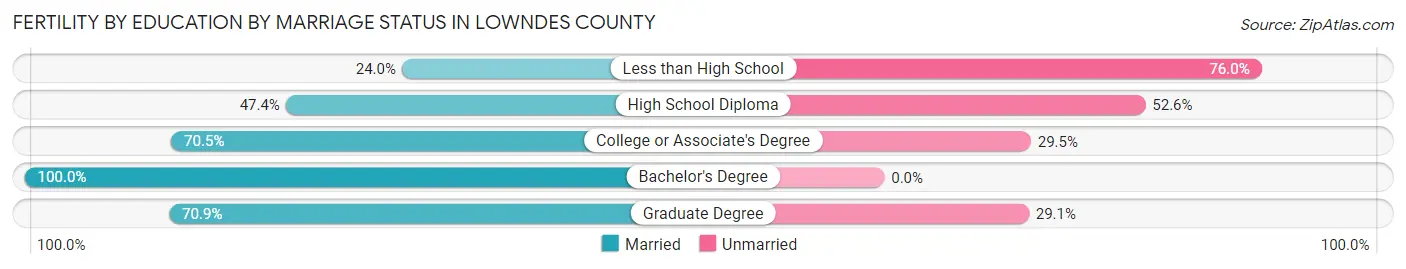
| Educational Attainment | Married | Unmarried |
| Less than High School | 24 (24.0%) | 76 (76.0%) |
| High School Diploma | 363 (47.4%) | 403 (52.6%) |
| College or Associate's Degree | 401 (70.5%) | 168 (29.5%) |
| Bachelor's Degree | 254 (100.0%) | 0 (0.0%) |
| Graduate Degree | 224 (70.9%) | 92 (29.1%) |
| Total | 1,265 (63.1%) | 740 (36.9%) |
Income in Lowndes County
Income Overview in Lowndes County
Per Capita Income in Lowndes County is $27,553, while median incomes of families and households are $72,081 and $52,821 respectively.
| Characteristic | Number | Measure |
| Per Capita Income | 118,257 | $27,553 |
| Median Family Income | 27,182 | $72,081 |
| Mean Family Income | 27,182 | $87,567 |
| Median Household Income | 43,720 | $52,821 |
| Mean Household Income | 43,720 | $70,840 |
| Income Deficit | 27,182 | $14,768 |
| Wage / Income Gap (%) | 118,257 | 29.17% |
| Wage / Income Gap ($) | 118,257 | 70.83¢ per $1 |
| Gini / Inequality Index | 118,257 | 0.49 |
Earnings by Sex in Lowndes County
Average Earnings in Lowndes County are $33,360, $39,565 for men and $28,024 for women, a difference of 29.2%.
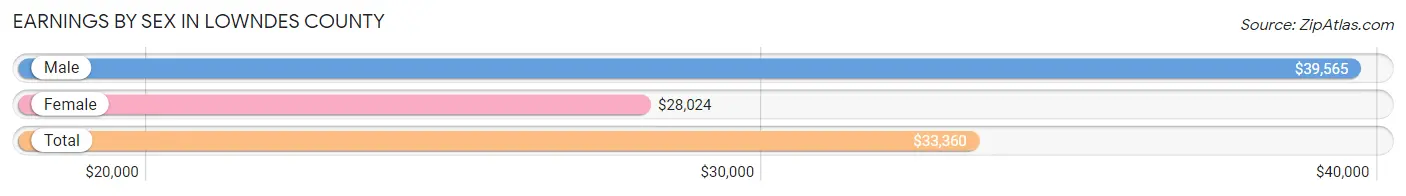
| Sex | Number | Average Earnings |
| Male | 29,676 (51.1%) | $39,565 |
| Female | 28,412 (48.9%) | $28,024 |
| Total | 58,088 (100.0%) | $33,360 |
Earnings by Sex by Income Bracket in Lowndes County
The most common earnings brackets in Lowndes County are $100,000+ for men (2,965 | 10.0%) and $25,000 to $29,999 for women (3,084 | 10.8%).
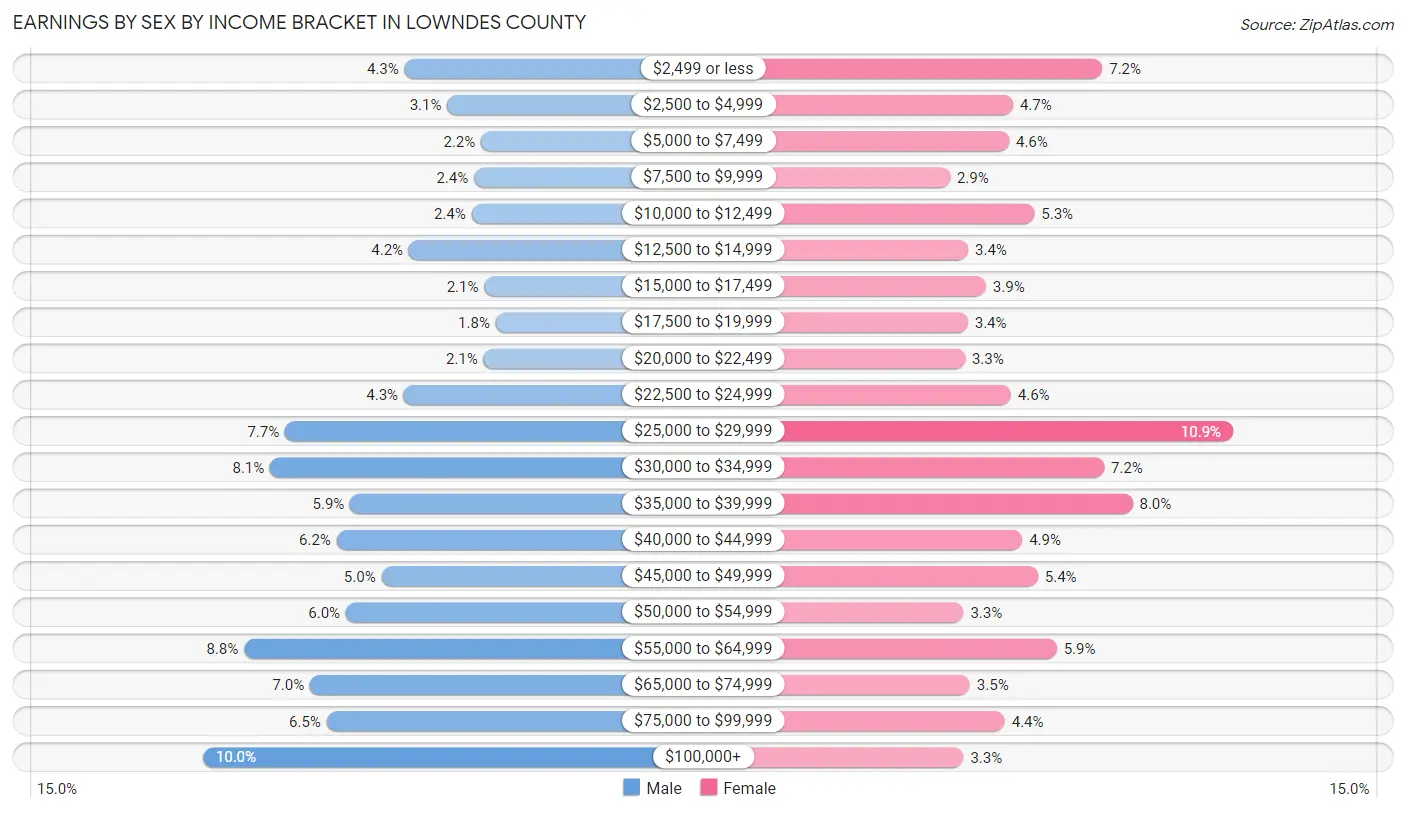
| Income | Male | Female |
| $2,499 or less | 1,283 (4.3%) | 2,039 (7.2%) |
| $2,500 to $4,999 | 925 (3.1%) | 1,328 (4.7%) |
| $5,000 to $7,499 | 645 (2.2%) | 1,295 (4.6%) |
| $7,500 to $9,999 | 703 (2.4%) | 824 (2.9%) |
| $10,000 to $12,499 | 723 (2.4%) | 1,496 (5.3%) |
| $12,500 to $14,999 | 1,247 (4.2%) | 969 (3.4%) |
| $15,000 to $17,499 | 616 (2.1%) | 1,110 (3.9%) |
| $17,500 to $19,999 | 521 (1.8%) | 965 (3.4%) |
| $20,000 to $22,499 | 624 (2.1%) | 943 (3.3%) |
| $22,500 to $24,999 | 1,288 (4.3%) | 1,311 (4.6%) |
| $25,000 to $29,999 | 2,279 (7.7%) | 3,084 (10.8%) |
| $30,000 to $34,999 | 2,403 (8.1%) | 2,055 (7.2%) |
| $35,000 to $39,999 | 1,736 (5.9%) | 2,282 (8.0%) |
| $40,000 to $44,999 | 1,848 (6.2%) | 1,400 (4.9%) |
| $45,000 to $49,999 | 1,474 (5.0%) | 1,526 (5.4%) |
| $50,000 to $54,999 | 1,772 (6.0%) | 931 (3.3%) |
| $55,000 to $64,999 | 2,619 (8.8%) | 1,677 (5.9%) |
| $65,000 to $74,999 | 2,072 (7.0%) | 982 (3.5%) |
| $75,000 to $99,999 | 1,933 (6.5%) | 1,262 (4.4%) |
| $100,000+ | 2,965 (10.0%) | 933 (3.3%) |
| Total | 29,676 (100.0%) | 28,412 (100.0%) |
Earnings by Sex by Educational Attainment in Lowndes County
Average earnings in Lowndes County are $50,107 for men and $33,578 for women, a difference of 33.0%. Men with an educational attainment of graduate degree enjoy the highest average annual earnings of $73,836, while those with less than high school education earn the least with $29,974. Women with an educational attainment of graduate degree earn the most with the average annual earnings of $57,247, while those with less than high school education have the smallest earnings of $16,634.
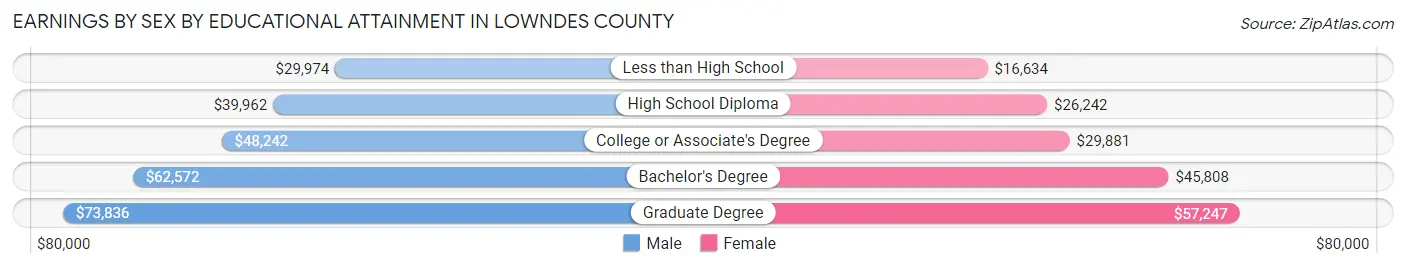
| Educational Attainment | Male Income | Female Income |
| Less than High School | $29,974 | $16,634 |
| High School Diploma | $39,962 | $26,242 |
| College or Associate's Degree | $48,242 | $29,881 |
| Bachelor's Degree | $62,572 | $45,808 |
| Graduate Degree | $73,836 | $57,247 |
| Total | $50,107 | $33,578 |
Family Income in Lowndes County
Family Income Brackets in Lowndes County
According to the Lowndes County family income data, there are 5,219 families falling into the $100,000 to $149,999 income range, which is the most common income bracket and makes up 19.2% of all families. Conversely, the $10,000 to $14,999 income bracket is the least frequent group with only 544 families (2.0%) belonging to this category.
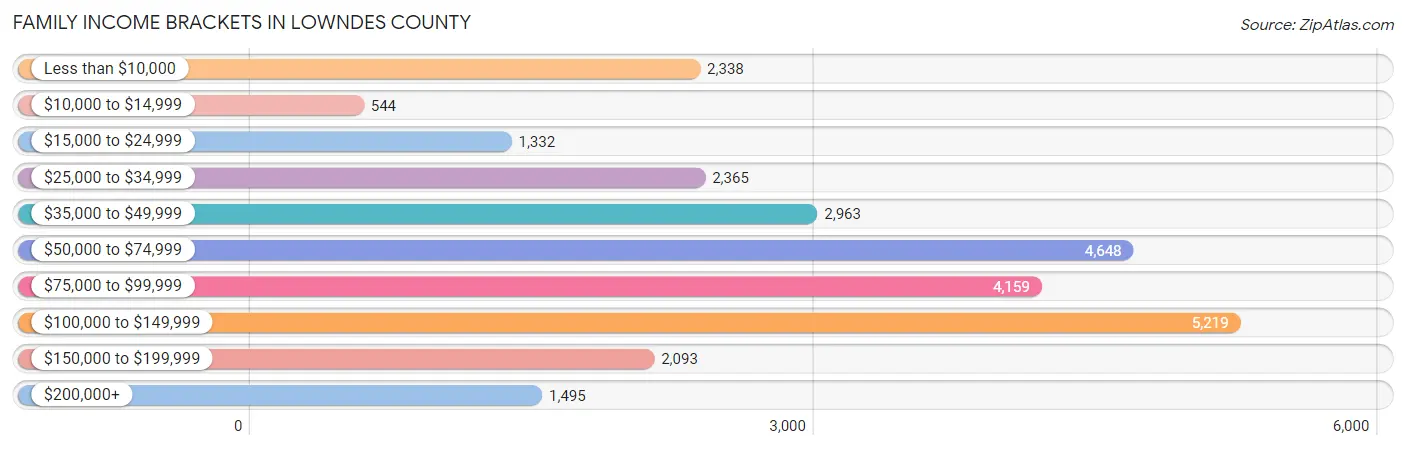
| Income Bracket | # Families | % Families |
| Less than $10,000 | 2,338 | 8.6% |
| $10,000 to $14,999 | 544 | 2.0% |
| $15,000 to $24,999 | 1,332 | 4.9% |
| $25,000 to $34,999 | 2,365 | 8.7% |
| $35,000 to $49,999 | 2,963 | 10.9% |
| $50,000 to $74,999 | 4,648 | 17.1% |
| $75,000 to $99,999 | 4,159 | 15.3% |
| $100,000 to $149,999 | 5,219 | 19.2% |
| $150,000 to $199,999 | 2,093 | 7.7% |
| $200,000+ | 1,495 | 5.5% |
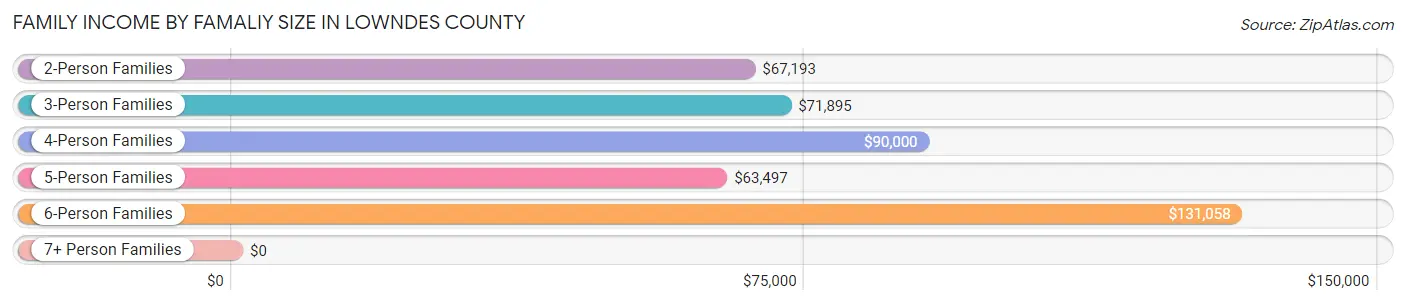
Family Income by Famaliy Size in Lowndes County
6-person families (901 | 3.3%) account for the highest median family income in Lowndes County with $131,058 per family, while 2-person families (12,466 | 45.9%) have the highest median income of $33,596 per family member.
| Income Bracket | # Families | Median Income |
| 2-Person Families | 12,466 (45.9%) | $67,193 |
| 3-Person Families | 6,420 (23.6%) | $71,895 |
| 4-Person Families | 4,678 (17.2%) | $90,000 |
| 5-Person Families | 2,451 (9.0%) | $63,497 |
| 6-Person Families | 901 (3.3%) | $131,058 |
| 7+ Person Families | 266 (1.0%) | $0 |
| Total | 27,182 (100.0%) | $72,081 |
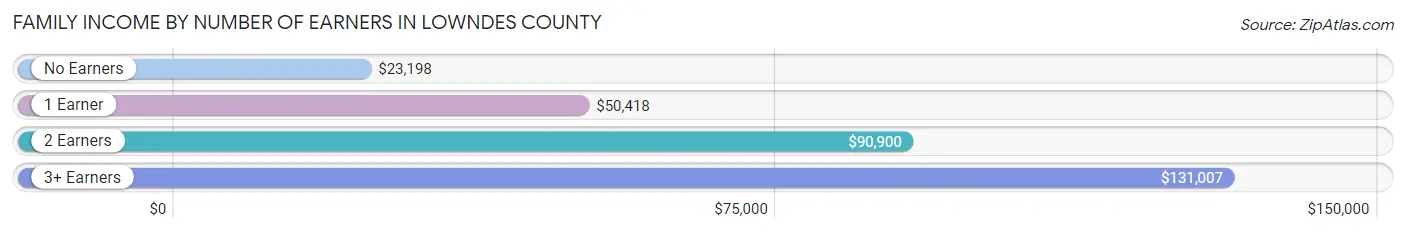
Family Income by Number of Earners in Lowndes County
The median family income in Lowndes County is $72,081, with families comprising 3+ earners (2,129) having the highest median family income of $131,007, while families with no earners (4,581) have the lowest median family income of $23,198, accounting for 7.8% and 16.9% of families, respectively.
| Number of Earners | # Families | Median Income |
| No Earners | 4,581 (16.9%) | $23,198 |
| 1 Earner | 9,598 (35.3%) | $50,418 |
| 2 Earners | 10,874 (40.0%) | $90,900 |
| 3+ Earners | 2,129 (7.8%) | $131,007 |
| Total | 27,182 (100.0%) | $72,081 |
Household Income in Lowndes County
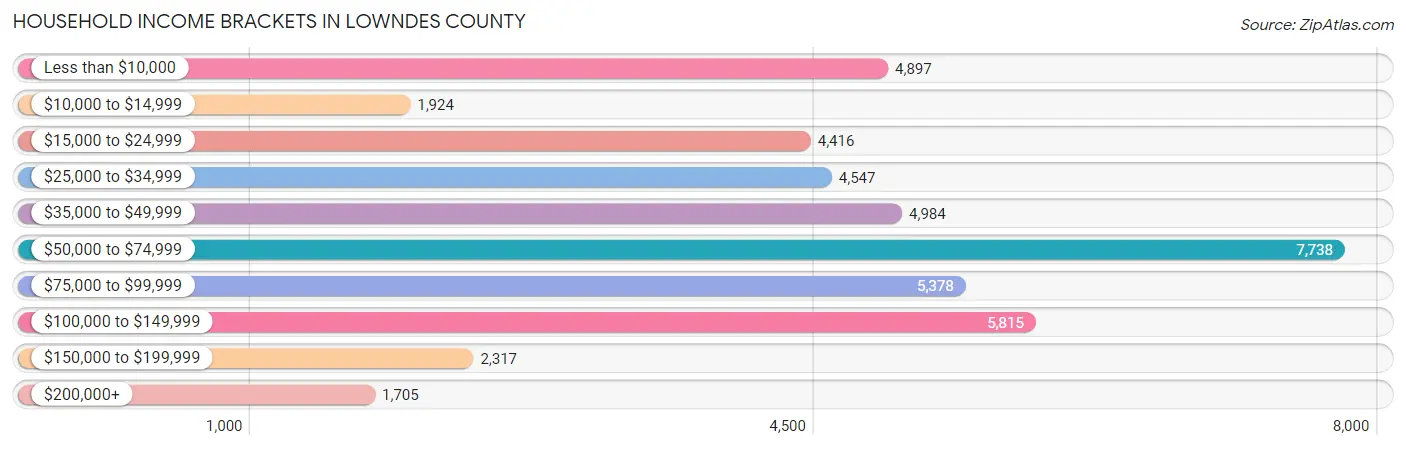
Household Income Brackets in Lowndes County
With 7,738 households falling in the category, the $50,000 to $74,999 income range is the most frequent in Lowndes County, accounting for 17.7% of all households. In contrast, only 1,705 households (3.9%) fall into the $200,000+ income bracket, making it the least populous group.
| Income Bracket | # Households | % Households |
| Less than $10,000 | 4,897 | 11.2% |
| $10,000 to $14,999 | 1,924 | 4.4% |
| $15,000 to $24,999 | 4,416 | 10.1% |
| $25,000 to $34,999 | 4,547 | 10.4% |
| $35,000 to $49,999 | 4,984 | 11.4% |
| $50,000 to $74,999 | 7,738 | 17.7% |
| $75,000 to $99,999 | 5,378 | 12.3% |
| $100,000 to $149,999 | 5,815 | 13.3% |
| $150,000 to $199,999 | 2,317 | 5.3% |
| $200,000+ | 1,705 | 3.9% |
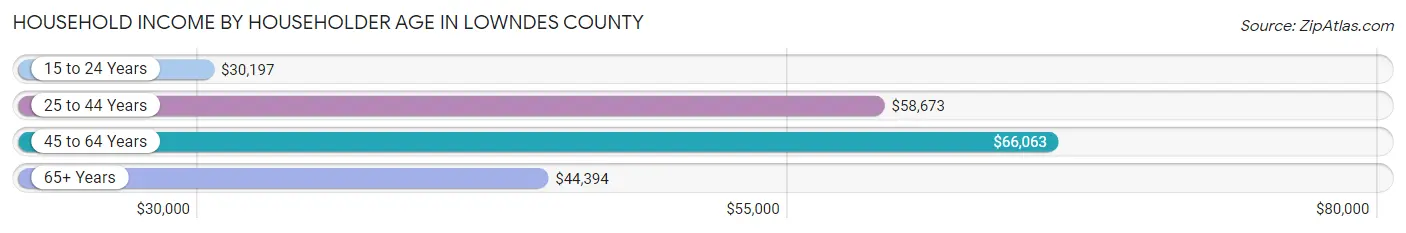
Household Income by Householder Age in Lowndes County
The median household income in Lowndes County is $52,821, with the highest median household income of $66,063 found in the 45 to 64 years age bracket for the primary householder. A total of 13,289 households (30.4%) fall into this category. Meanwhile, the 15 to 24 years age bracket for the primary householder has the lowest median household income of $30,197, with 5,233 households (12.0%) in this group.
| Income Bracket | # Households | Median Income |
| 15 to 24 Years | 5,233 (12.0%) | $30,197 |
| 25 to 44 Years | 15,440 (35.3%) | $58,673 |
| 45 to 64 Years | 13,289 (30.4%) | $66,063 |
| 65+ Years | 9,758 (22.3%) | $44,394 |
| Total | 43,720 (100.0%) | $52,821 |
Poverty in Lowndes County
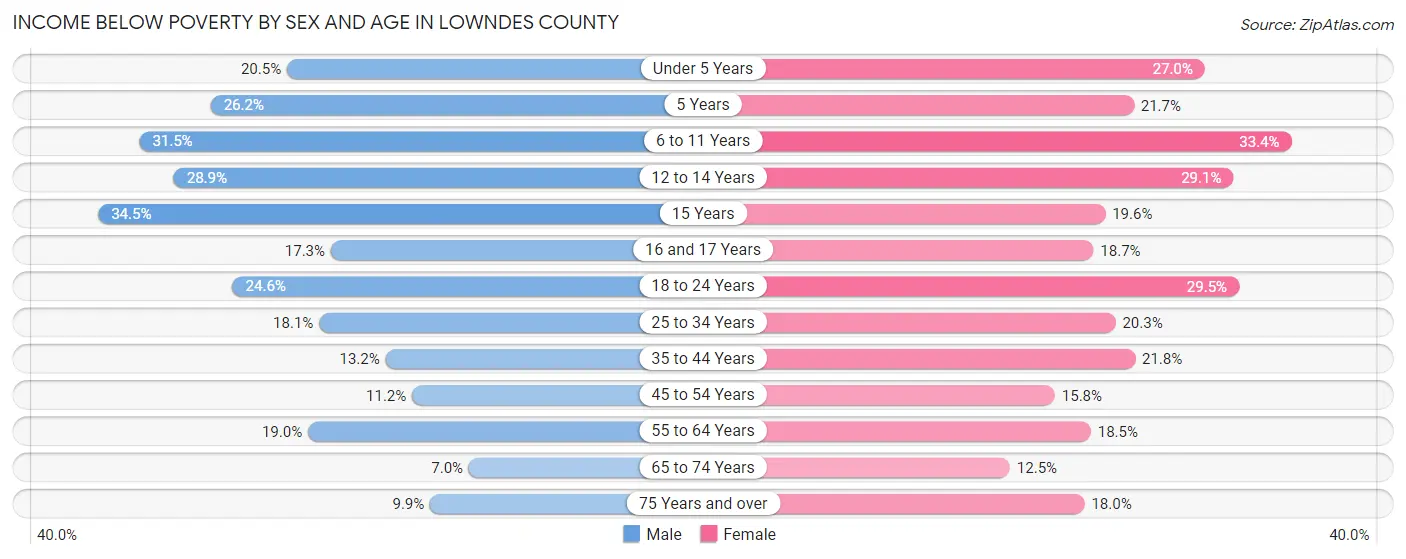
Income Below Poverty by Sex and Age in Lowndes County
With 18.9% poverty level for males and 22.2% for females among the residents of Lowndes County, 15 year old males and 6 to 11 year old females are the most vulnerable to poverty, with 222 males (34.5%) and 1,688 females (33.4%) in their respective age groups living below the poverty level.
| Age Bracket | Male | Female |
| Under 5 Years | 826 (20.5%) | 997 (27.0%) |
| 5 Years | 233 (26.2%) | 165 (21.7%) |
| 6 to 11 Years | 1,493 (31.5%) | 1,688 (33.4%) |
| 12 to 14 Years | 701 (28.9%) | 594 (29.1%) |
| 15 Years | 222 (34.5%) | 124 (19.6%) |
| 16 and 17 Years | 266 (17.3%) | 302 (18.7%) |
| 18 to 24 Years | 2,128 (24.5%) | 2,669 (29.5%) |
| 25 to 34 Years | 1,478 (18.1%) | 1,752 (20.3%) |
| 35 to 44 Years | 798 (13.2%) | 1,500 (21.8%) |
| 45 to 54 Years | 620 (11.2%) | 1,017 (15.8%) |
| 55 to 64 Years | 1,034 (19.0%) | 1,147 (18.5%) |
| 65 to 74 Years | 280 (7.0%) | 617 (12.5%) |
| 75 Years and over | 233 (9.9%) | 623 (18.0%) |
| Total | 10,312 (18.9%) | 13,195 (22.2%) |
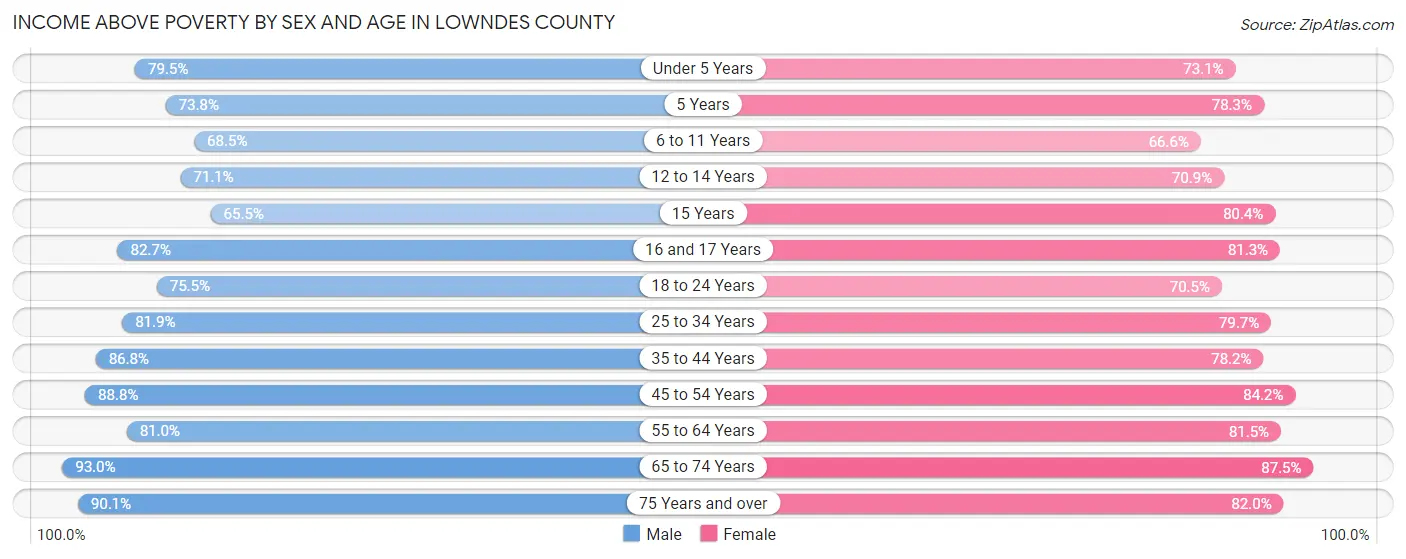
Income Above Poverty by Sex and Age in Lowndes County
According to the poverty statistics in Lowndes County, males aged 65 to 74 years and females aged 65 to 74 years are the age groups that are most secure financially, with 93.0% of males and 87.5% of females in these age groups living above the poverty line.
| Age Bracket | Male | Female |
| Under 5 Years | 3,200 (79.5%) | 2,702 (73.1%) |
| 5 Years | 657 (73.8%) | 596 (78.3%) |
| 6 to 11 Years | 3,251 (68.5%) | 3,369 (66.6%) |
| 12 to 14 Years | 1,723 (71.1%) | 1,450 (70.9%) |
| 15 Years | 421 (65.5%) | 510 (80.4%) |
| 16 and 17 Years | 1,275 (82.7%) | 1,315 (81.3%) |
| 18 to 24 Years | 6,539 (75.4%) | 6,386 (70.5%) |
| 25 to 34 Years | 6,676 (81.9%) | 6,872 (79.7%) |
| 35 to 44 Years | 5,248 (86.8%) | 5,389 (78.2%) |
| 45 to 54 Years | 4,901 (88.8%) | 5,411 (84.2%) |
| 55 to 64 Years | 4,421 (81.0%) | 5,055 (81.5%) |
| 65 to 74 Years | 3,716 (93.0%) | 4,328 (87.5%) |
| 75 Years and over | 2,122 (90.1%) | 2,834 (82.0%) |
| Total | 44,150 (81.1%) | 46,217 (77.8%) |
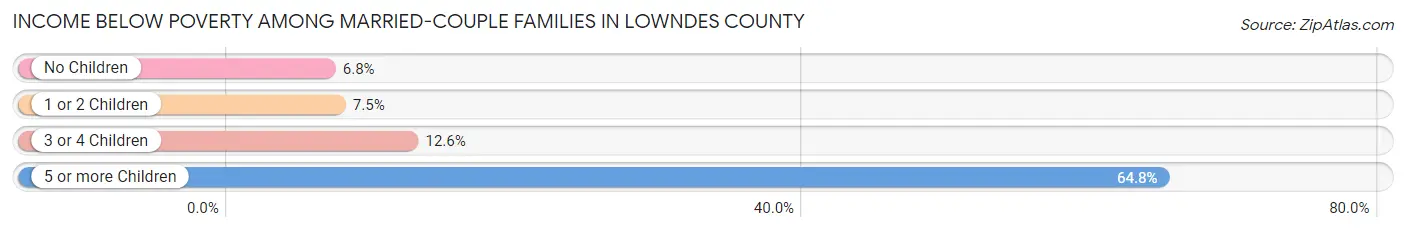
Income Below Poverty Among Married-Couple Families in Lowndes County
The poverty statistics for married-couple families in Lowndes County show that 7.9% or 1,455 of the total 18,482 families live below the poverty line. Families with 5 or more children have the highest poverty rate of 64.8%, comprising of 59 families. On the other hand, families with no children have the lowest poverty rate of 6.8%, which includes 736 families.
| Children | Above Poverty | Below Poverty |
| No Children | 10,070 (93.2%) | 736 (6.8%) |
| 1 or 2 Children | 5,367 (92.5%) | 436 (7.5%) |
| 3 or 4 Children | 1,558 (87.4%) | 224 (12.6%) |
| 5 or more Children | 32 (35.2%) | 59 (64.8%) |
| Total | 17,027 (92.1%) | 1,455 (7.9%) |
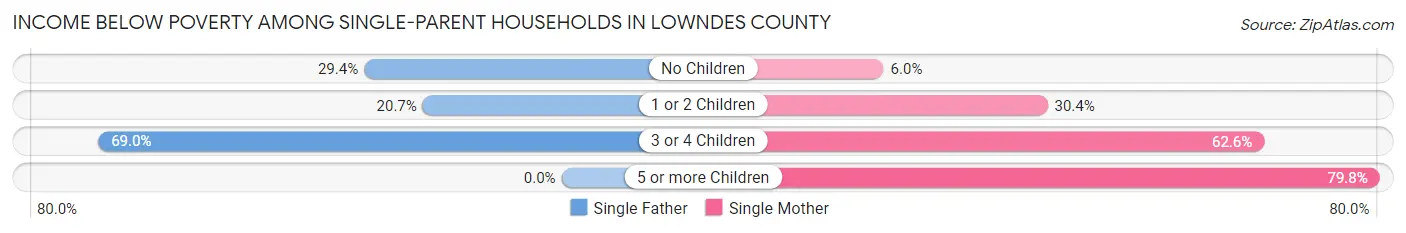
Income Below Poverty Among Single-Parent Households in Lowndes County
According to the poverty data in Lowndes County, 26.8% or 485 single-father households and 31.0% or 2,138 single-mother households are living below the poverty line. Among single-father households, those with 3 or 4 children have the highest poverty rate, with 78 households (69.0%) experiencing poverty. Likewise, among single-mother households, those with 5 or more children have the highest poverty rate, with 103 households (79.8%) falling below the poverty line.
| Children | Single Father | Single Mother |
| No Children | 191 (29.4%) | 114 (6.0%) |
| 1 or 2 Children | 216 (20.7%) | 1,051 (30.4%) |
| 3 or 4 Children | 78 (69.0%) | 870 (62.6%) |
| 5 or more Children | 0 (0.0%) | 103 (79.8%) |
| Total | 485 (26.8%) | 2,138 (31.0%) |
Income Below Poverty Among Married-Couple vs Single-Parent Households in Lowndes County
The poverty data for Lowndes County shows that 1,455 of the married-couple family households (7.9%) and 2,623 of the single-parent households (30.1%) are living below the poverty level. Within the married-couple family households, those with 5 or more children have the highest poverty rate, with 59 households (64.8%) falling below the poverty line. Among the single-parent households, those with 5 or more children have the highest poverty rate, with 103 household (78.6%) living below poverty.
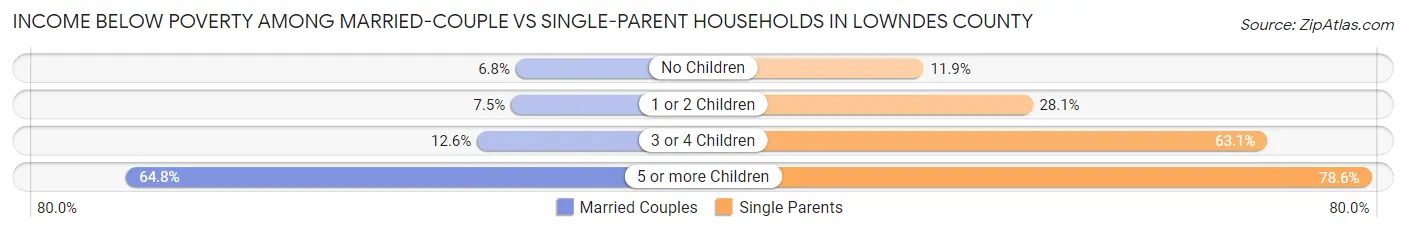
| Children | Married-Couple Families | Single-Parent Households |
| No Children | 736 (6.8%) | 305 (11.9%) |
| 1 or 2 Children | 436 (7.5%) | 1,267 (28.1%) |
| 3 or 4 Children | 224 (12.6%) | 948 (63.1%) |
| 5 or more Children | 59 (64.8%) | 103 (78.6%) |
| Total | 1,455 (7.9%) | 2,623 (30.1%) |
Employment Characteristics in Lowndes County
Employment by Class of Employer in Lowndes County
Among the 52,388 employed individuals in Lowndes County, private company employees (33,587 | 64.1%), federal government employees (5,018 | 9.6%), and state government employees (3,753 | 7.2%) make up the most common classes of employment.
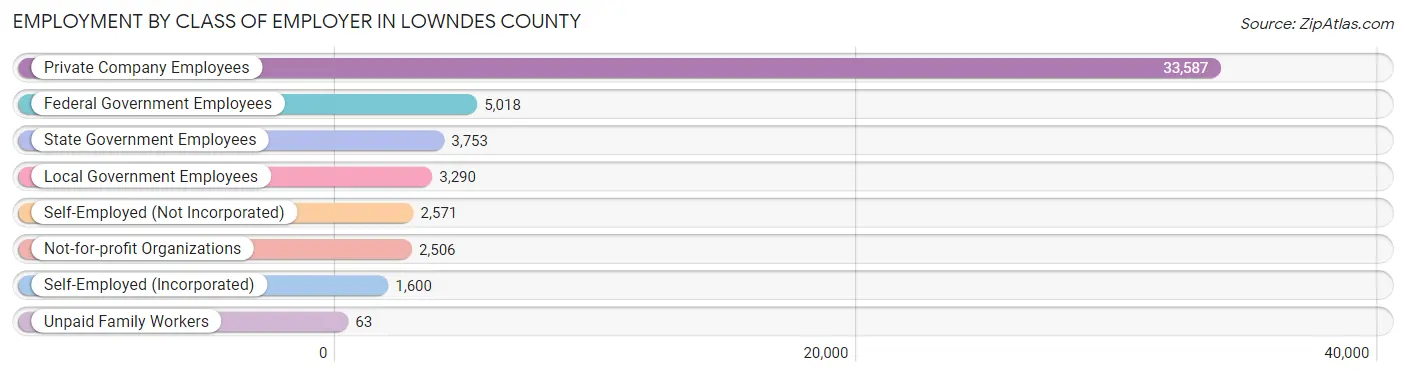
| Employer Class | # Employees | % Employees |
| Private Company Employees | 33,587 | 64.1% |
| Self-Employed (Incorporated) | 1,600 | 3.0% |
| Self-Employed (Not Incorporated) | 2,571 | 4.9% |
| Not-for-profit Organizations | 2,506 | 4.8% |
| Local Government Employees | 3,290 | 6.3% |
| State Government Employees | 3,753 | 7.2% |
| Federal Government Employees | 5,018 | 9.6% |
| Unpaid Family Workers | 63 | 0.1% |
| Total | 52,388 | 100.0% |
Employment Status by Age in Lowndes County
According to the labor force statistics for Lowndes County, out of the total population over 16 years of age (92,830), 60.1% or 55,791 individuals are in the labor force, with 5.1% or 2,845 of them unemployed. The age group with the highest labor force participation rate is 30 to 34 years, with 75.9% or 6,176 individuals in the labor force. Within the labor force, the 16 to 19 years age range has the highest percentage of unemployed individuals, with 14.1% or 347 of them being unemployed.
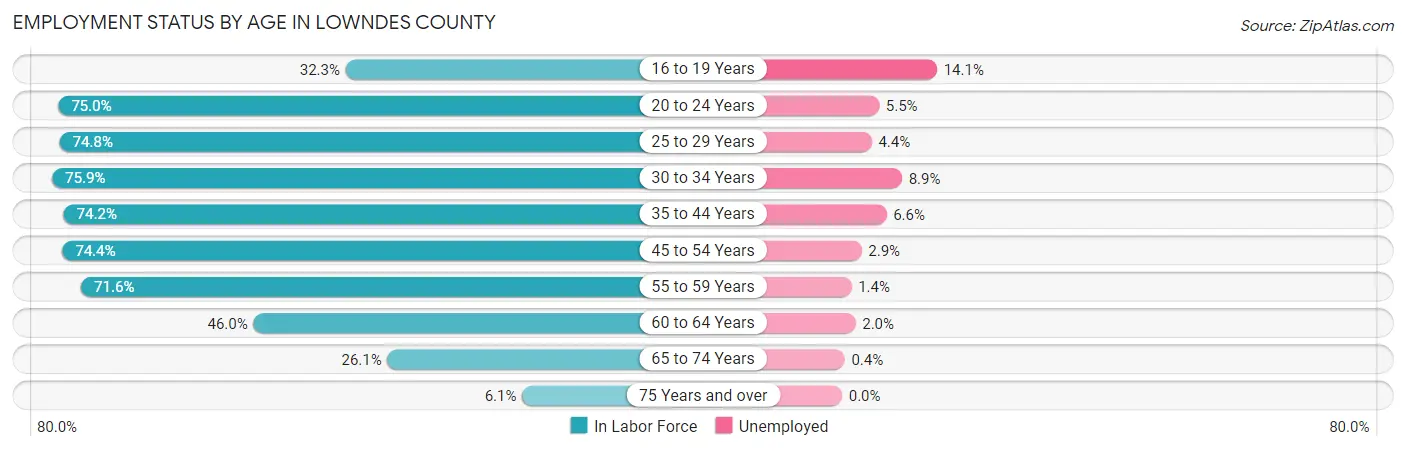
| Age Bracket | In Labor Force | Unemployed |
| 16 to 19 Years | 2,463 (32.3%) | 347 (14.1%) |
| 20 to 24 Years | 11,333 (75.0%) | 623 (5.5%) |
| 25 to 29 Years | 7,010 (74.8%) | 308 (4.4%) |
| 30 to 34 Years | 6,176 (75.9%) | 550 (8.9%) |
| 35 to 44 Years | 10,051 (74.2%) | 663 (6.6%) |
| 45 to 54 Years | 9,066 (74.4%) | 263 (2.9%) |
| 55 to 59 Years | 4,491 (71.6%) | 63 (1.4%) |
| 60 to 64 Years | 2,537 (46.0%) | 51 (2.0%) |
| 65 to 74 Years | 2,364 (26.1%) | 9 (0.4%) |
| 75 Years and over | 367 (6.1%) | 0 (0.0%) |
| Total | 55,791 (60.1%) | 2,845 (5.1%) |
Employment Status by Educational Attainment in Lowndes County
According to labor force statistics for Lowndes County, 71.4% of individuals (39,289) out of the total population between 25 and 64 years of age (55,026) are in the labor force, with 4.8% or 1,886 of them being unemployed. The group with the highest labor force participation rate are those with the educational attainment of bachelor's degree or higher, with 84.3% or 12,103 individuals in the labor force. Within the labor force, individuals with high school diploma education have the highest percentage of unemployment, with 6.7% or 717 of them being unemployed.
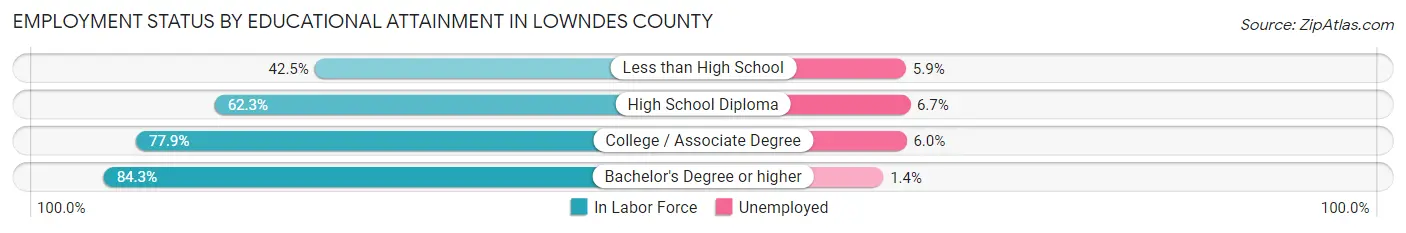
| Educational Attainment | In Labor Force | Unemployed |
| Less than High School | 2,138 (42.5%) | 297 (5.9%) |
| High School Diploma | 10,701 (62.3%) | 1,151 (6.7%) |
| College / Associate Degree | 14,383 (77.9%) | 1,108 (6.0%) |
| Bachelor's Degree or higher | 12,103 (84.3%) | 201 (1.4%) |
| Total | 39,289 (71.4%) | 2,641 (4.8%) |
Employment Occupations by Sex in Lowndes County
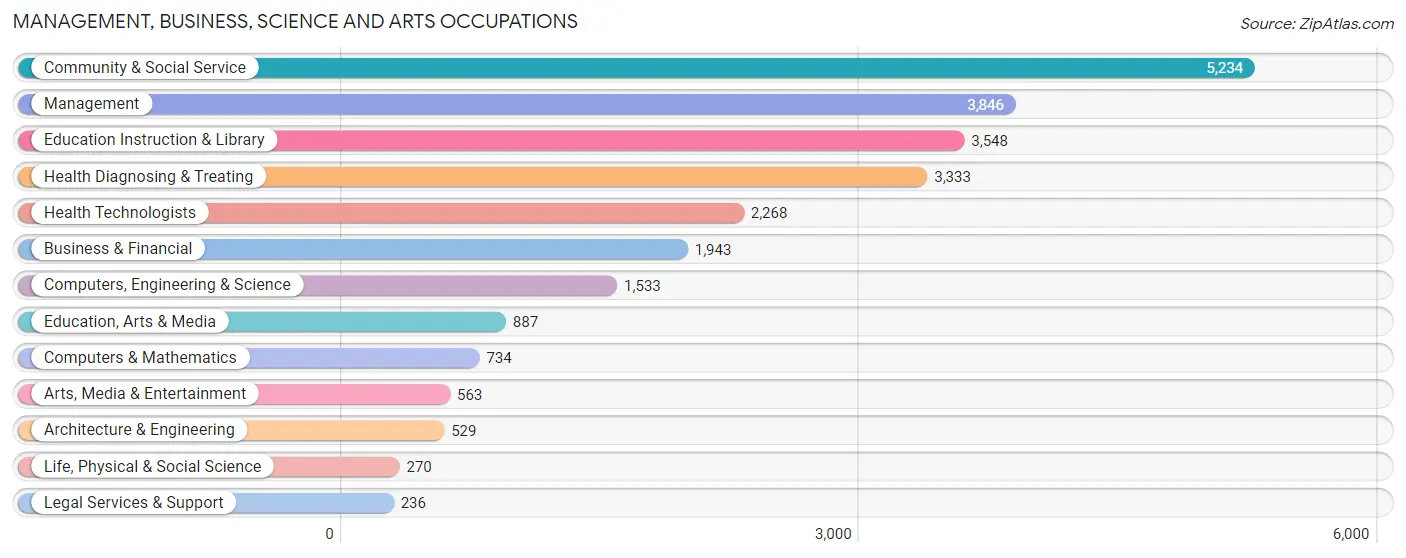
Management, Business, Science and Arts Occupations
The most common Management, Business, Science and Arts occupations in Lowndes County are Community & Social Service (5,234 | 10.5%), Management (3,846 | 7.7%), Education Instruction & Library (3,548 | 7.1%), Health Diagnosing & Treating (3,333 | 6.7%), and Health Technologists (2,268 | 4.5%).
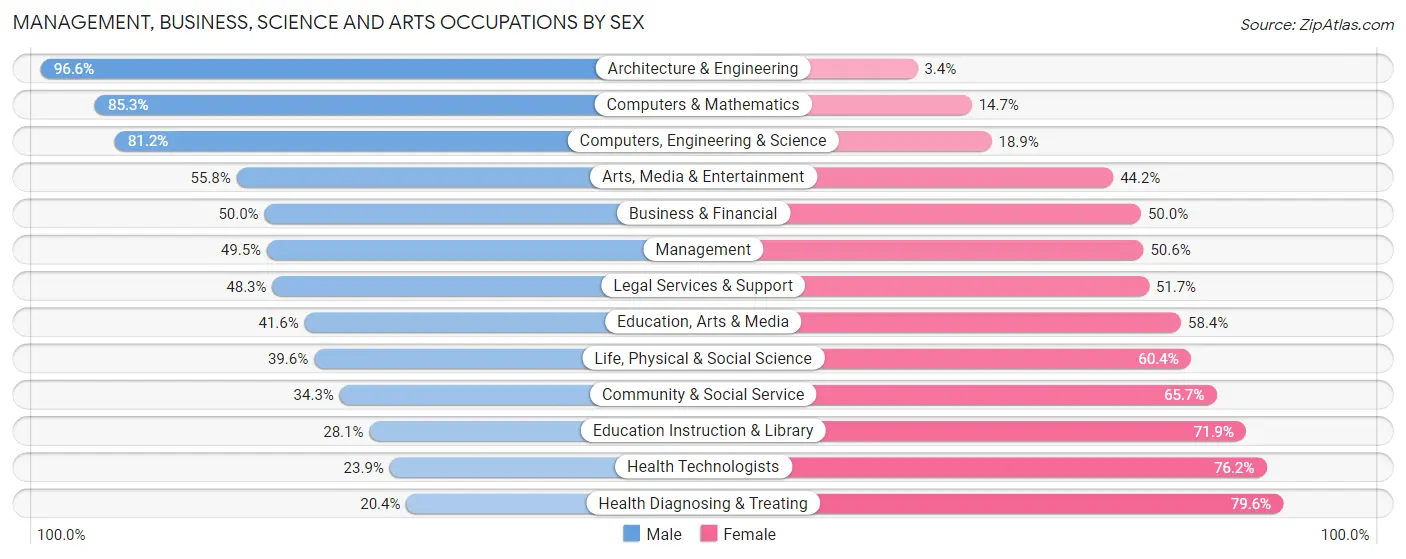
Management, Business, Science and Arts Occupations by Sex
Within the Management, Business, Science and Arts occupations in Lowndes County, the most male-oriented occupations are Architecture & Engineering (96.6%), Computers & Mathematics (85.3%), and Computers, Engineering & Science (81.1%), while the most female-oriented occupations are Health Diagnosing & Treating (79.6%), Health Technologists (76.1%), and Education Instruction & Library (71.9%).
| Occupation | Male | Female |
| Management | 1,902 (49.4%) | 1,944 (50.5%) |
| Business & Financial | 971 (50.0%) | 972 (50.0%) |
| Computers, Engineering & Science | 1,244 (81.1%) | 289 (18.9%) |
| Computers & Mathematics | 626 (85.3%) | 108 (14.7%) |
| Architecture & Engineering | 511 (96.6%) | 18 (3.4%) |
| Life, Physical & Social Science | 107 (39.6%) | 163 (60.4%) |
| Community & Social Service | 1,794 (34.3%) | 3,440 (65.7%) |
| Education, Arts & Media | 369 (41.6%) | 518 (58.4%) |
| Legal Services & Support | 114 (48.3%) | 122 (51.7%) |
| Education Instruction & Library | 997 (28.1%) | 2,551 (71.9%) |
| Arts, Media & Entertainment | 314 (55.8%) | 249 (44.2%) |
| Health Diagnosing & Treating | 679 (20.4%) | 2,654 (79.6%) |
| Health Technologists | 541 (23.8%) | 1,727 (76.1%) |
| Total (Category) | 6,590 (41.5%) | 9,299 (58.5%) |
| Total (Overall) | 24,764 (49.7%) | 25,030 (50.3%) |
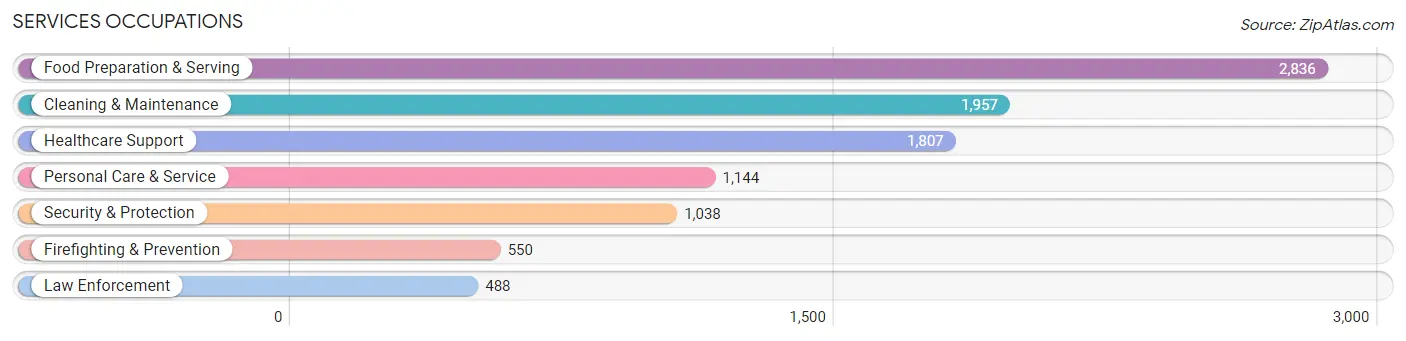
Services Occupations
The most common Services occupations in Lowndes County are Food Preparation & Serving (2,836 | 5.7%), Cleaning & Maintenance (1,957 | 3.9%), Healthcare Support (1,807 | 3.6%), Personal Care & Service (1,144 | 2.3%), and Security & Protection (1,038 | 2.1%).
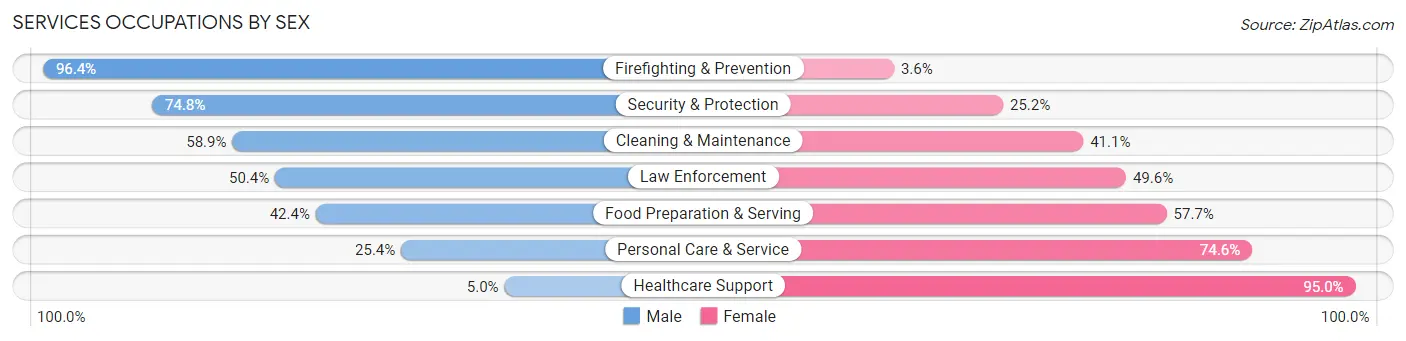
Services Occupations by Sex
Within the Services occupations in Lowndes County, the most male-oriented occupations are Firefighting & Prevention (96.4%), Security & Protection (74.8%), and Cleaning & Maintenance (58.9%), while the most female-oriented occupations are Healthcare Support (95.0%), Personal Care & Service (74.6%), and Food Preparation & Serving (57.7%).
| Occupation | Male | Female |
| Healthcare Support | 90 (5.0%) | 1,717 (95.0%) |
| Security & Protection | 776 (74.8%) | 262 (25.2%) |
| Firefighting & Prevention | 530 (96.4%) | 20 (3.6%) |
| Law Enforcement | 246 (50.4%) | 242 (49.6%) |
| Food Preparation & Serving | 1,201 (42.3%) | 1,635 (57.7%) |
| Cleaning & Maintenance | 1,152 (58.9%) | 805 (41.1%) |
| Personal Care & Service | 291 (25.4%) | 853 (74.6%) |
| Total (Category) | 3,510 (40.0%) | 5,272 (60.0%) |
| Total (Overall) | 24,764 (49.7%) | 25,030 (50.3%) |
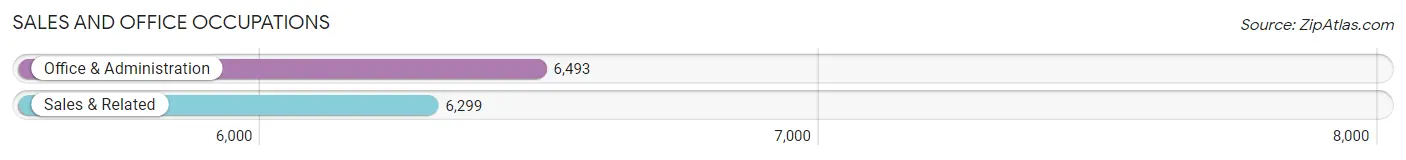
Sales and Office Occupations
The most common Sales and Office occupations in Lowndes County are Office & Administration (6,493 | 13.0%), and Sales & Related (6,299 | 12.7%).
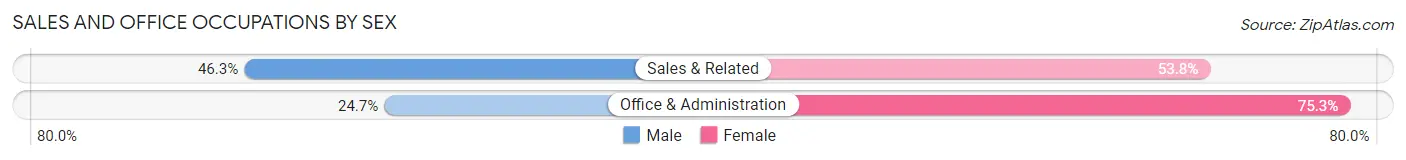
Sales and Office Occupations by Sex
| Occupation | Male | Female |
| Sales & Related | 2,913 (46.3%) | 3,386 (53.7%) |
| Office & Administration | 1,604 (24.7%) | 4,889 (75.3%) |
| Total (Category) | 4,517 (35.3%) | 8,275 (64.7%) |
| Total (Overall) | 24,764 (49.7%) | 25,030 (50.3%) |
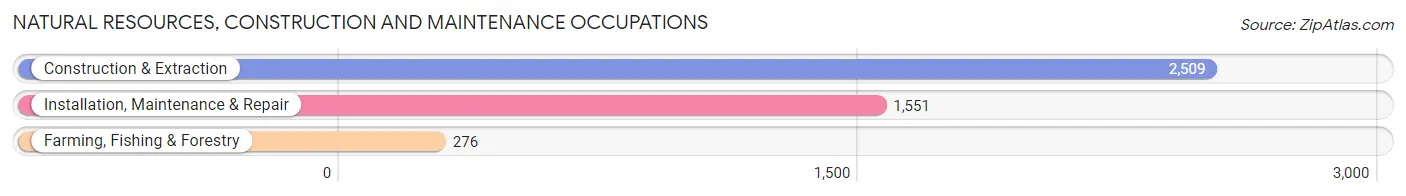
Natural Resources, Construction and Maintenance Occupations
The most common Natural Resources, Construction and Maintenance occupations in Lowndes County are Construction & Extraction (2,509 | 5.0%), Installation, Maintenance & Repair (1,551 | 3.1%), and Farming, Fishing & Forestry (276 | 0.5%).
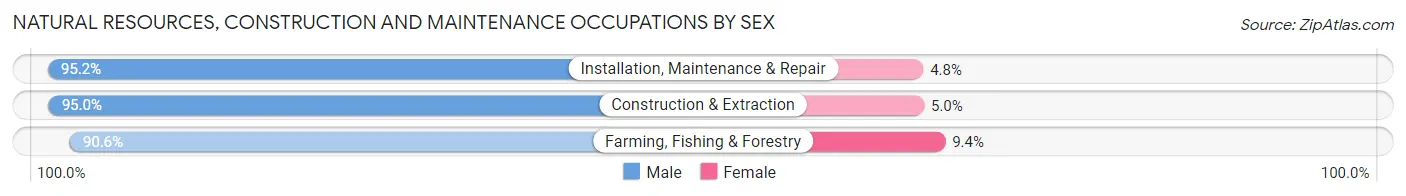
Natural Resources, Construction and Maintenance Occupations by Sex
| Occupation | Male | Female |
| Farming, Fishing & Forestry | 250 (90.6%) | 26 (9.4%) |
| Construction & Extraction | 2,383 (95.0%) | 126 (5.0%) |
| Installation, Maintenance & Repair | 1,476 (95.2%) | 75 (4.8%) |
| Total (Category) | 4,109 (94.8%) | 227 (5.2%) |
| Total (Overall) | 24,764 (49.7%) | 25,030 (50.3%) |
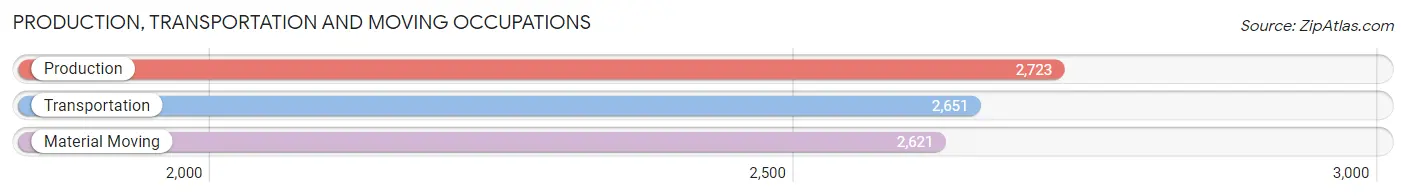
Production, Transportation and Moving Occupations
The most common Production, Transportation and Moving occupations in Lowndes County are Production (2,723 | 5.5%), Transportation (2,651 | 5.3%), and Material Moving (2,621 | 5.3%).
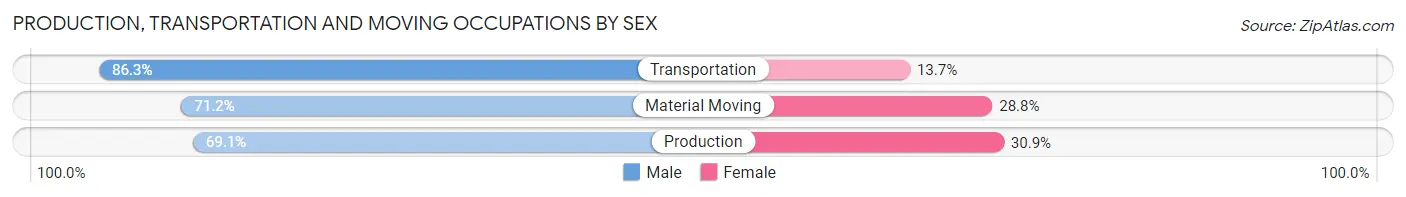
Production, Transportation and Moving Occupations by Sex
| Occupation | Male | Female |
| Production | 1,882 (69.1%) | 841 (30.9%) |
| Transportation | 2,289 (86.3%) | 362 (13.7%) |
| Material Moving | 1,867 (71.2%) | 754 (28.8%) |
| Total (Category) | 6,038 (75.5%) | 1,957 (24.5%) |
| Total (Overall) | 24,764 (49.7%) | 25,030 (50.3%) |
Employment Industries by Sex in Lowndes County
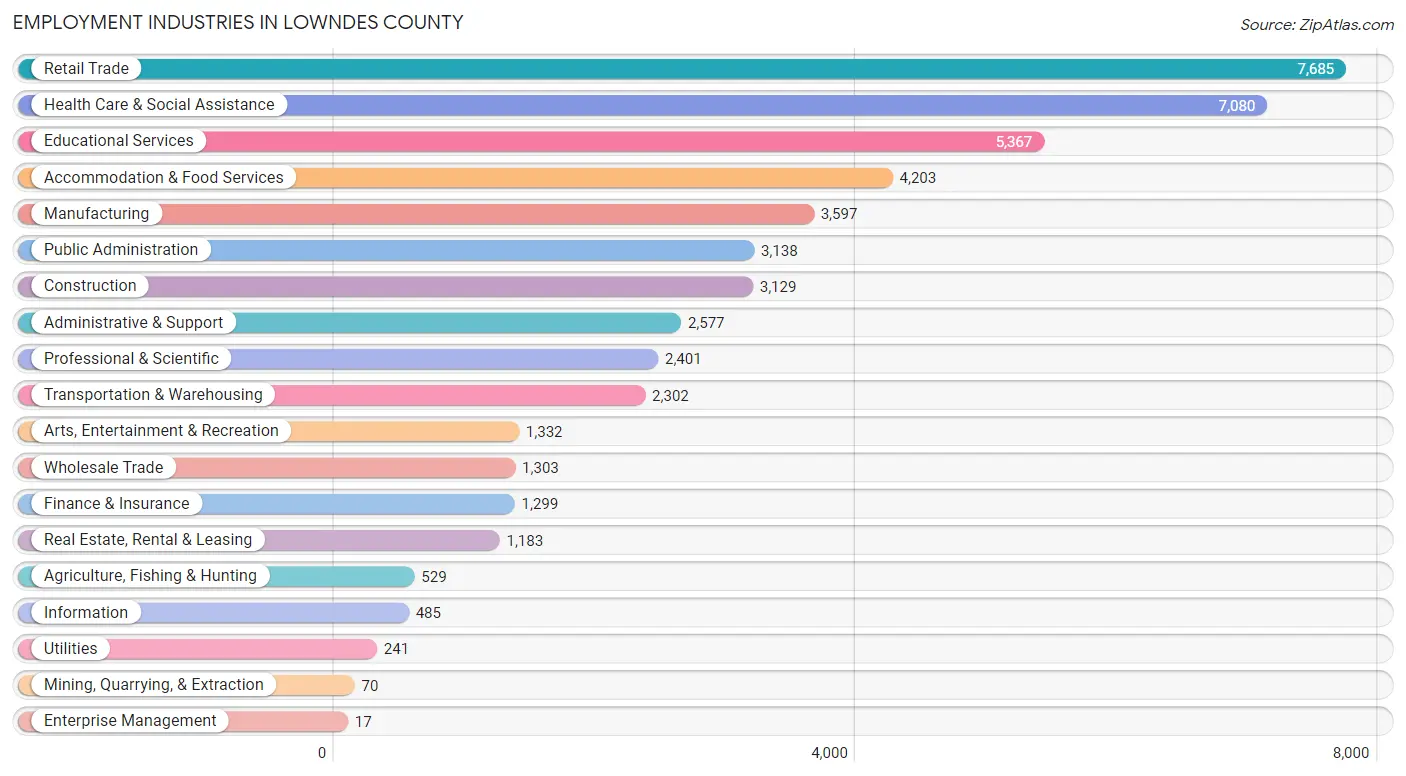
Employment Industries in Lowndes County
The major employment industries in Lowndes County include Retail Trade (7,685 | 15.4%), Health Care & Social Assistance (7,080 | 14.2%), Educational Services (5,367 | 10.8%), Accommodation & Food Services (4,203 | 8.4%), and Manufacturing (3,597 | 7.2%).
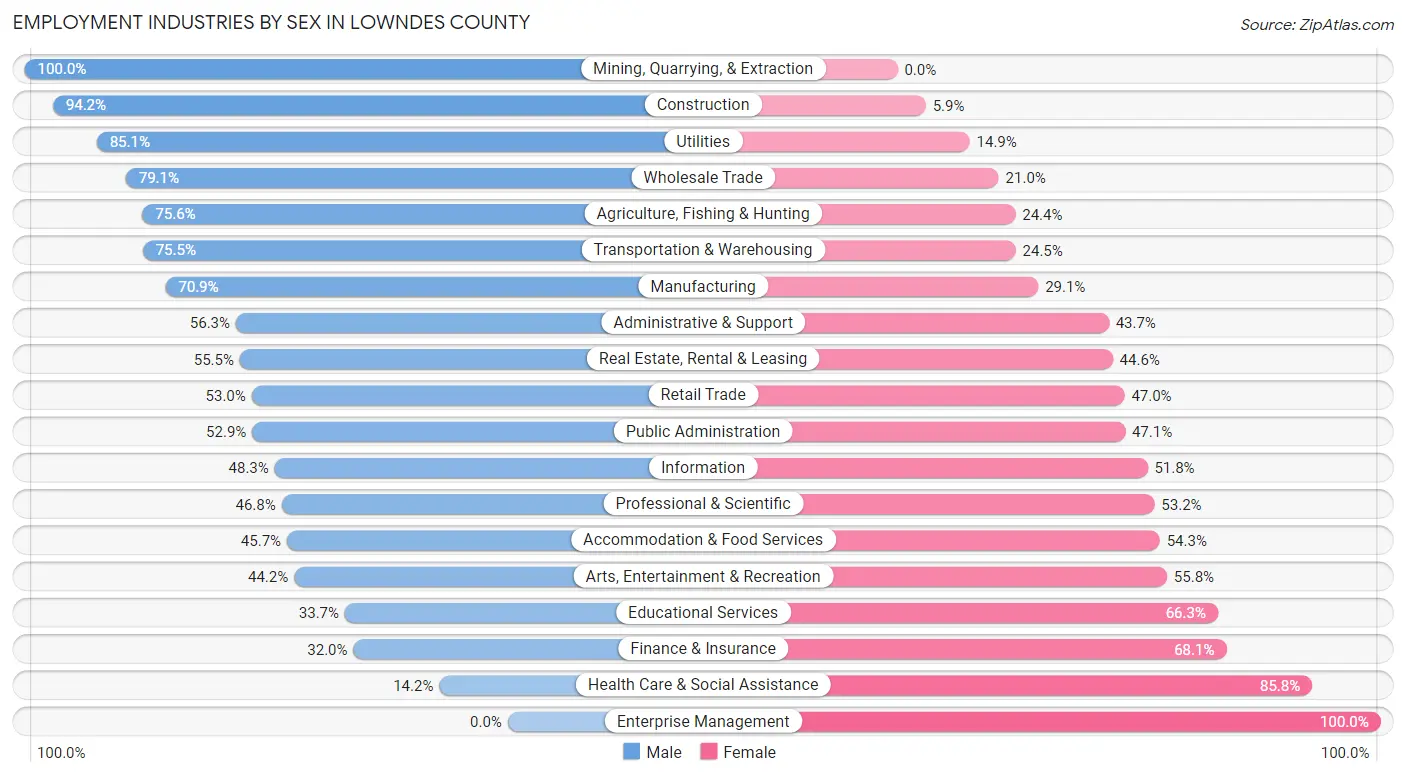
Employment Industries by Sex in Lowndes County
The Lowndes County industries that see more men than women are Mining, Quarrying, & Extraction (100.0%), Construction (94.2%), and Utilities (85.1%), whereas the industries that tend to have a higher number of women are Enterprise Management (100.0%), Health Care & Social Assistance (85.8%), and Finance & Insurance (68.0%).
| Industry | Male | Female |
| Agriculture, Fishing & Hunting | 400 (75.6%) | 129 (24.4%) |
| Mining, Quarrying, & Extraction | 70 (100.0%) | 0 (0.0%) |
| Construction | 2,946 (94.2%) | 183 (5.9%) |
| Manufacturing | 2,549 (70.9%) | 1,048 (29.1%) |
| Wholesale Trade | 1,030 (79.0%) | 273 (20.9%) |
| Retail Trade | 4,074 (53.0%) | 3,611 (47.0%) |
| Transportation & Warehousing | 1,739 (75.5%) | 563 (24.5%) |
| Utilities | 205 (85.1%) | 36 (14.9%) |
| Information | 234 (48.2%) | 251 (51.7%) |
| Finance & Insurance | 415 (32.0%) | 884 (68.0%) |
| Real Estate, Rental & Leasing | 656 (55.4%) | 527 (44.6%) |
| Professional & Scientific | 1,124 (46.8%) | 1,277 (53.2%) |
| Enterprise Management | 0 (0.0%) | 17 (100.0%) |
| Administrative & Support | 1,450 (56.3%) | 1,127 (43.7%) |
| Educational Services | 1,809 (33.7%) | 3,558 (66.3%) |
| Health Care & Social Assistance | 1,004 (14.2%) | 6,076 (85.8%) |
| Arts, Entertainment & Recreation | 589 (44.2%) | 743 (55.8%) |
| Accommodation & Food Services | 1,921 (45.7%) | 2,282 (54.3%) |
| Public Administration | 1,660 (52.9%) | 1,478 (47.1%) |
| Total | 24,764 (49.7%) | 25,030 (50.3%) |
Education in Lowndes County
School Enrollment in Lowndes County
The most common levels of schooling among the 34,835 students in Lowndes County are college / undergraduate (10,196 | 29.3%), elementary school (6,564 | 18.8%), and middle school (6,328 | 18.2%).
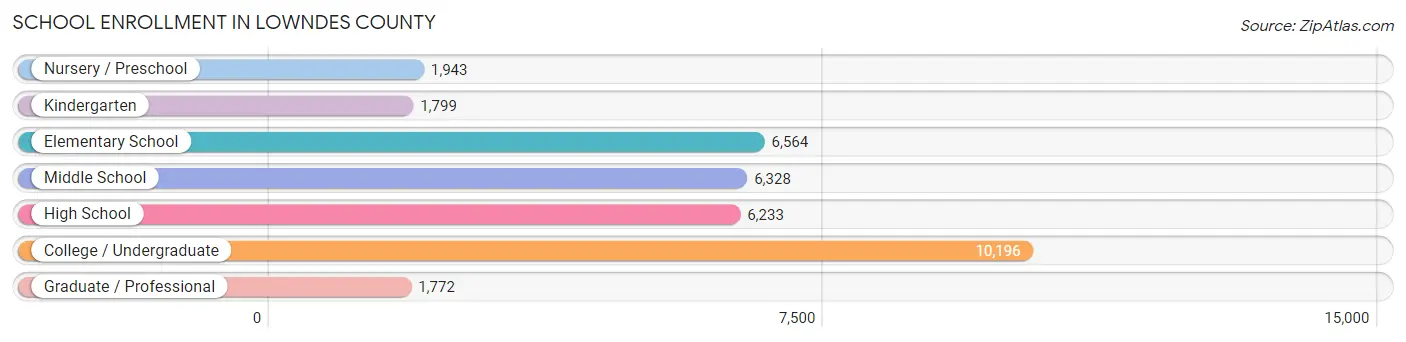
| School Level | # Students | % Students |
| Nursery / Preschool | 1,943 | 5.6% |
| Kindergarten | 1,799 | 5.2% |
| Elementary School | 6,564 | 18.8% |
| Middle School | 6,328 | 18.2% |
| High School | 6,233 | 17.9% |
| College / Undergraduate | 10,196 | 29.3% |
| Graduate / Professional | 1,772 | 5.1% |
| Total | 34,835 | 100.0% |
School Enrollment by Age by Funding Source in Lowndes County
Out of a total of 34,835 students who are enrolled in schools in Lowndes County, 3,031 (8.7%) attend a private institution, while the remaining 31,804 (91.3%) are enrolled in public schools. The age group of 3 to 4 year olds has the highest likelihood of being enrolled in private schools, with 320 (23.0% in the age bracket) enrolled. Conversely, the age group of 18 to 19 year olds has the lowest likelihood of being enrolled in a private school, with 3,074 (95.4% in the age bracket) attending a public institution.
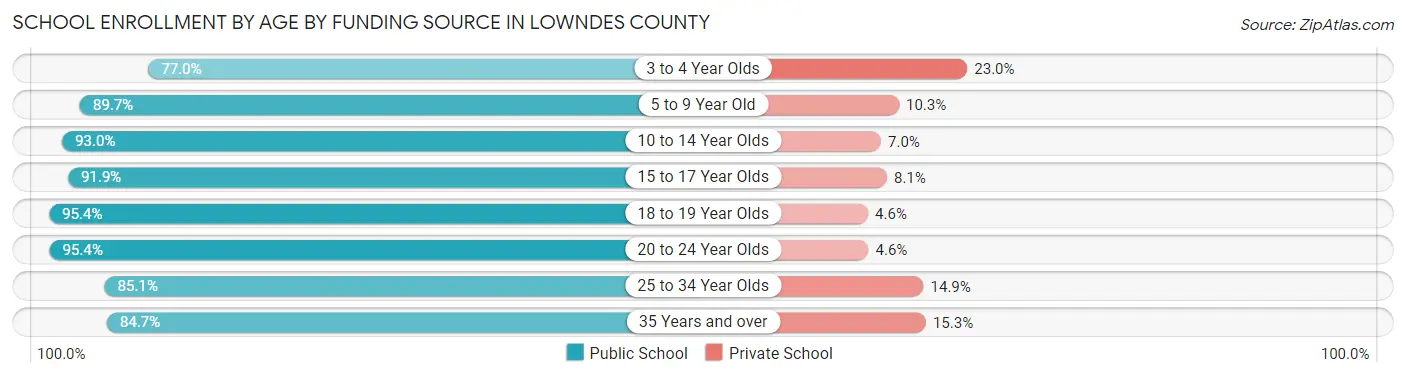
| Age Bracket | Public School | Private School |
| 3 to 4 Year Olds | 1,069 (77.0%) | 320 (23.0%) |
| 5 to 9 Year Old | 7,067 (89.7%) | 812 (10.3%) |
| 10 to 14 Year Olds | 7,249 (93.0%) | 543 (7.0%) |
| 15 to 17 Year Olds | 4,017 (91.9%) | 353 (8.1%) |
| 18 to 19 Year Olds | 3,074 (95.4%) | 147 (4.6%) |
| 20 to 24 Year Olds | 6,249 (95.4%) | 304 (4.6%) |
| 25 to 34 Year Olds | 1,869 (85.1%) | 327 (14.9%) |
| 35 Years and over | 1,215 (84.7%) | 220 (15.3%) |
| Total | 31,804 (91.3%) | 3,031 (8.7%) |
Educational Attainment by Field of Study in Lowndes County
Education (4,184 | 21.9%), business (3,051 | 16.0%), science & technology (2,188 | 11.5%), arts & humanities (1,783 | 9.3%), and bio, nature & agricultural (1,291 | 6.8%) are the most common fields of study among 19,082 individuals in Lowndes County who have obtained a bachelor's degree or higher.
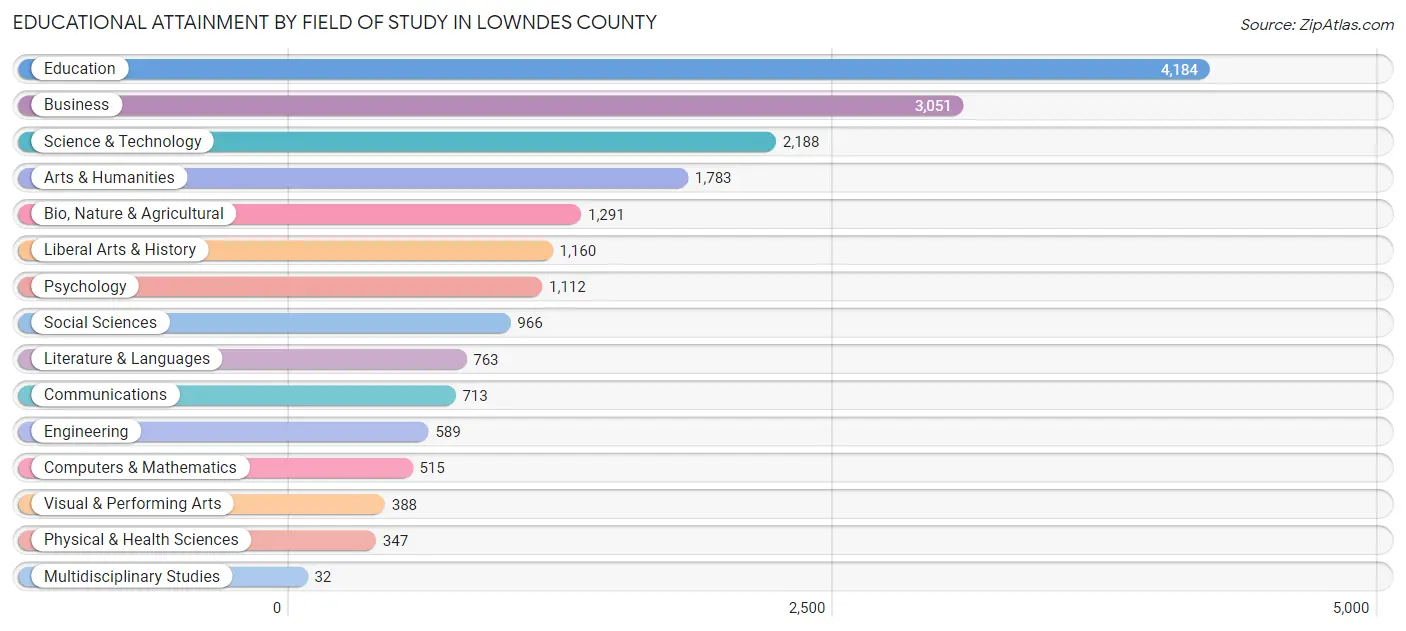
| Field of Study | # Graduates | % Graduates |
| Computers & Mathematics | 515 | 2.7% |
| Bio, Nature & Agricultural | 1,291 | 6.8% |
| Physical & Health Sciences | 347 | 1.8% |
| Psychology | 1,112 | 5.8% |
| Social Sciences | 966 | 5.1% |
| Engineering | 589 | 3.1% |
| Multidisciplinary Studies | 32 | 0.2% |
| Science & Technology | 2,188 | 11.5% |
| Business | 3,051 | 16.0% |
| Education | 4,184 | 21.9% |
| Literature & Languages | 763 | 4.0% |
| Liberal Arts & History | 1,160 | 6.1% |
| Visual & Performing Arts | 388 | 2.0% |
| Communications | 713 | 3.7% |
| Arts & Humanities | 1,783 | 9.3% |
| Total | 19,082 | 100.0% |
Transportation & Commute in Lowndes County
Vehicle Availability by Sex in Lowndes County
The most prevalent vehicle ownership categories in Lowndes County are males with 2 vehicles (11,787, accounting for 44.3%) and females with 2 vehicles (9,307, making up 47.5%).
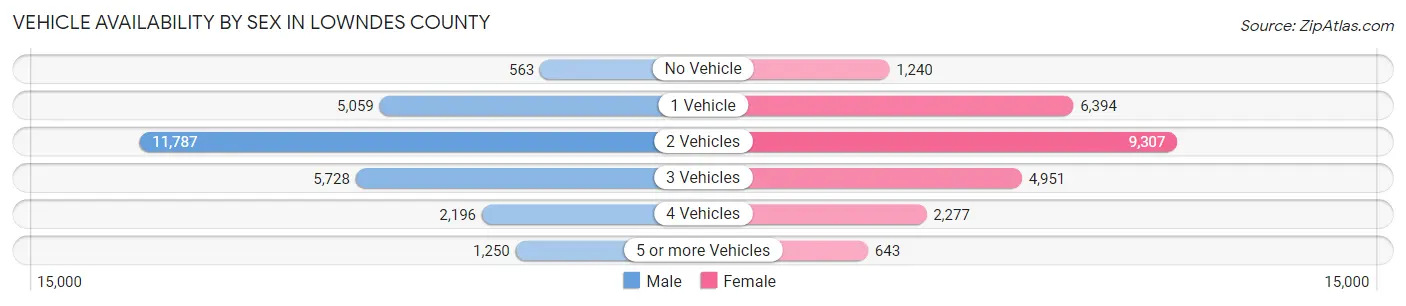
| Vehicles Available | Male | Female |
| No Vehicle | 563 (2.1%) | 1,240 (5.0%) |
| 1 Vehicle | 5,059 (19.0%) | 6,394 (25.8%) |
| 2 Vehicles | 11,787 (44.3%) | 9,307 (37.5%) |
| 3 Vehicles | 5,728 (21.5%) | 4,951 (20.0%) |
| 4 Vehicles | 2,196 (8.3%) | 2,277 (9.2%) |
| 5 or more Vehicles | 1,250 (4.7%) | 643 (2.6%) |
| Total | 26,583 (100.0%) | 24,812 (100.0%) |
Commute Time in Lowndes County
The most frequently occuring commute durations in Lowndes County are 15 to 19 minutes (11,204 commuters, 22.3%), 10 to 14 minutes (9,840 commuters, 19.6%), and 20 to 24 minutes (8,788 commuters, 17.5%).
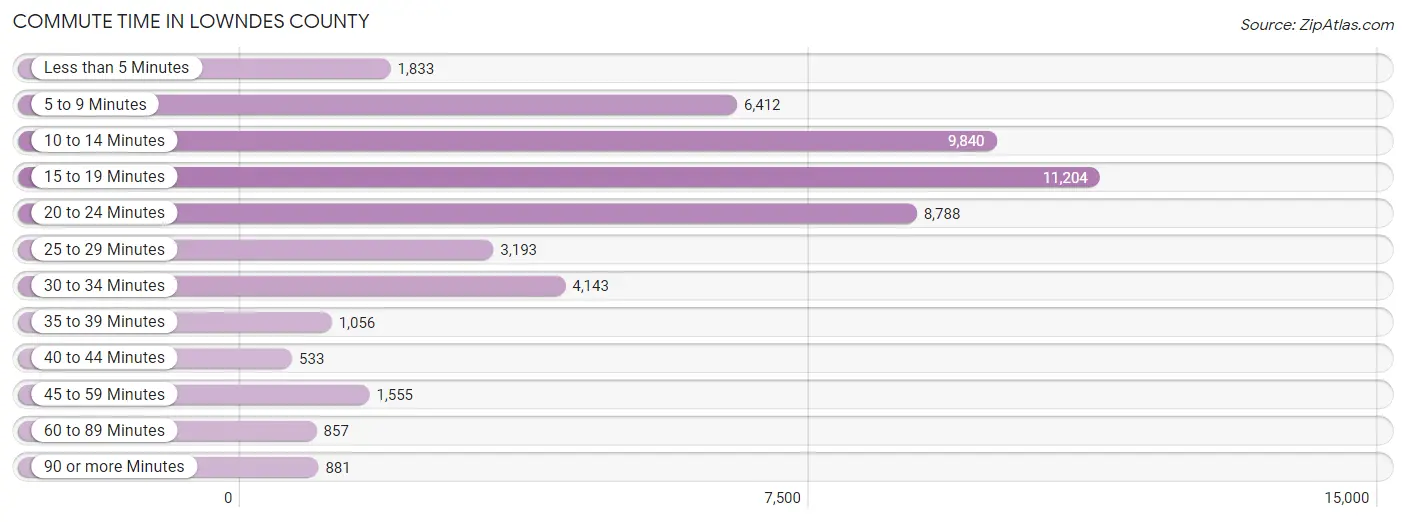
| Commute Time | # Commuters | % Commuters |
| Less than 5 Minutes | 1,833 | 3.6% |
| 5 to 9 Minutes | 6,412 | 12.8% |
| 10 to 14 Minutes | 9,840 | 19.6% |
| 15 to 19 Minutes | 11,204 | 22.3% |
| 20 to 24 Minutes | 8,788 | 17.5% |
| 25 to 29 Minutes | 3,193 | 6.4% |
| 30 to 34 Minutes | 4,143 | 8.2% |
| 35 to 39 Minutes | 1,056 | 2.1% |
| 40 to 44 Minutes | 533 | 1.1% |
| 45 to 59 Minutes | 1,555 | 3.1% |
| 60 to 89 Minutes | 857 | 1.7% |
| 90 or more Minutes | 881 | 1.8% |
Commute Time by Sex in Lowndes County
The most common commute times in Lowndes County are 15 to 19 minutes (5,209 commuters, 19.7%) for males and 15 to 19 minutes (5,995 commuters, 25.2%) for females.
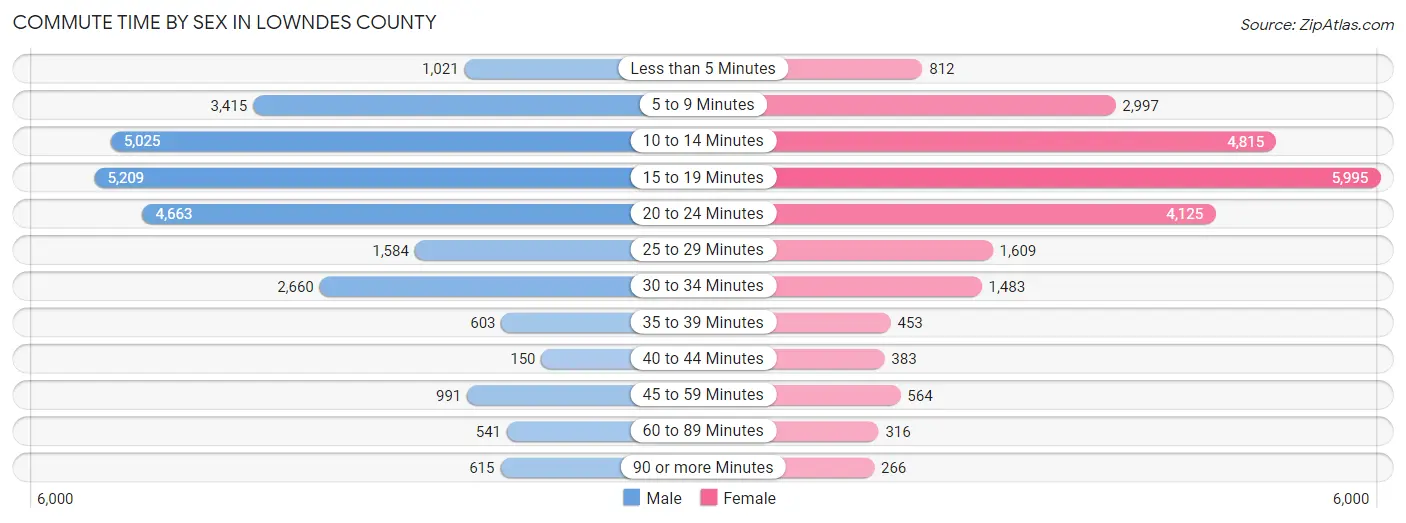
| Commute Time | Male | Female |
| Less than 5 Minutes | 1,021 (3.9%) | 812 (3.4%) |
| 5 to 9 Minutes | 3,415 (12.9%) | 2,997 (12.6%) |
| 10 to 14 Minutes | 5,025 (19.0%) | 4,815 (20.2%) |
| 15 to 19 Minutes | 5,209 (19.7%) | 5,995 (25.2%) |
| 20 to 24 Minutes | 4,663 (17.6%) | 4,125 (17.3%) |
| 25 to 29 Minutes | 1,584 (6.0%) | 1,609 (6.8%) |
| 30 to 34 Minutes | 2,660 (10.1%) | 1,483 (6.2%) |
| 35 to 39 Minutes | 603 (2.3%) | 453 (1.9%) |
| 40 to 44 Minutes | 150 (0.6%) | 383 (1.6%) |
| 45 to 59 Minutes | 991 (3.7%) | 564 (2.4%) |
| 60 to 89 Minutes | 541 (2.0%) | 316 (1.3%) |
| 90 or more Minutes | 615 (2.3%) | 266 (1.1%) |
Time of Departure to Work by Sex in Lowndes County
The most frequent times of departure to work in Lowndes County are 7:00 AM to 7:29 AM (4,881, 18.4%) for males and 7:00 AM to 7:29 AM (3,895, 16.4%) for females.
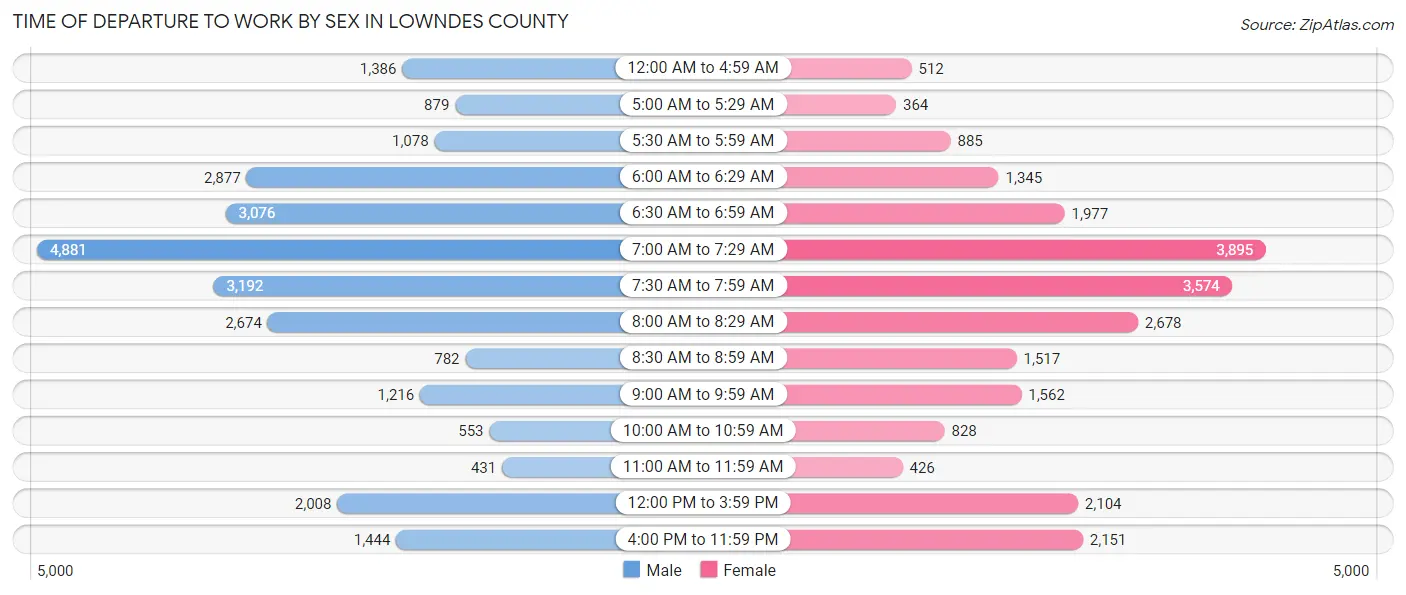
| Time of Departure | Male | Female |
| 12:00 AM to 4:59 AM | 1,386 (5.2%) | 512 (2.1%) |
| 5:00 AM to 5:29 AM | 879 (3.3%) | 364 (1.5%) |
| 5:30 AM to 5:59 AM | 1,078 (4.1%) | 885 (3.7%) |
| 6:00 AM to 6:29 AM | 2,877 (10.9%) | 1,345 (5.7%) |
| 6:30 AM to 6:59 AM | 3,076 (11.6%) | 1,977 (8.3%) |
| 7:00 AM to 7:29 AM | 4,881 (18.4%) | 3,895 (16.4%) |
| 7:30 AM to 7:59 AM | 3,192 (12.1%) | 3,574 (15.0%) |
| 8:00 AM to 8:29 AM | 2,674 (10.1%) | 2,678 (11.2%) |
| 8:30 AM to 8:59 AM | 782 (2.9%) | 1,517 (6.4%) |
| 9:00 AM to 9:59 AM | 1,216 (4.6%) | 1,562 (6.6%) |
| 10:00 AM to 10:59 AM | 553 (2.1%) | 828 (3.5%) |
| 11:00 AM to 11:59 AM | 431 (1.6%) | 426 (1.8%) |
| 12:00 PM to 3:59 PM | 2,008 (7.6%) | 2,104 (8.8%) |
| 4:00 PM to 11:59 PM | 1,444 (5.4%) | 2,151 (9.0%) |
| Total | 26,477 (100.0%) | 23,818 (100.0%) |
Housing Occupancy in Lowndes County
Occupancy by Ownership in Lowndes County
Of the total 43,720 dwellings in Lowndes County, owner-occupied units account for 23,792 (54.4%), while renter-occupied units make up 19,928 (45.6%).
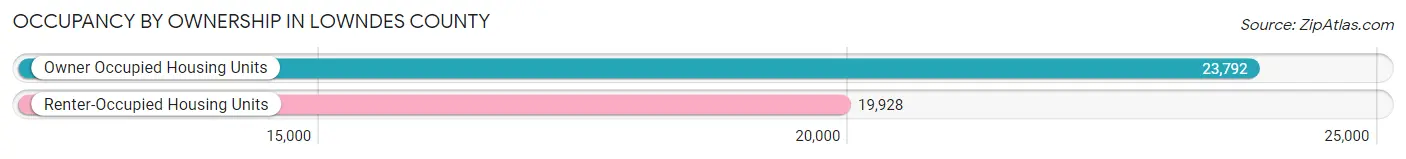
| Occupancy | # Housing Units | % Housing Units |
| Owner Occupied Housing Units | 23,792 | 54.4% |
| Renter-Occupied Housing Units | 19,928 | 45.6% |
| Total Occupied Housing Units | 43,720 | 100.0% |
Occupancy by Household Size in Lowndes County
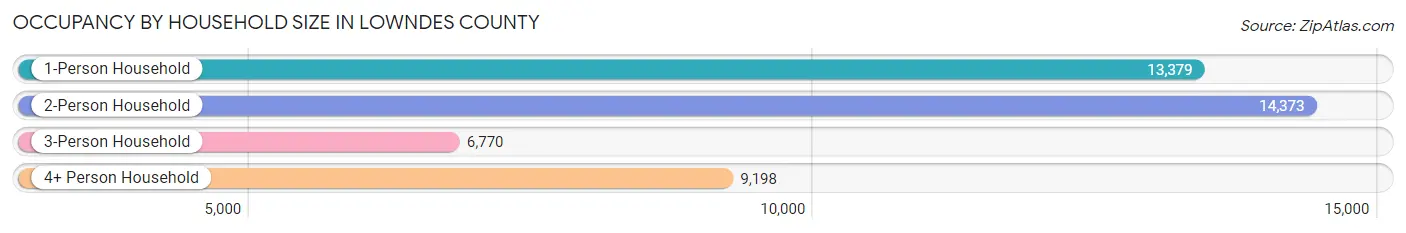
| Household Size | # Housing Units | % Housing Units |
| 1-Person Household | 13,379 | 30.6% |
| 2-Person Household | 14,373 | 32.9% |
| 3-Person Household | 6,770 | 15.5% |
| 4+ Person Household | 9,198 | 21.0% |
| Total Housing Units | 43,720 | 100.0% |
Occupancy by Ownership by Household Size in Lowndes County
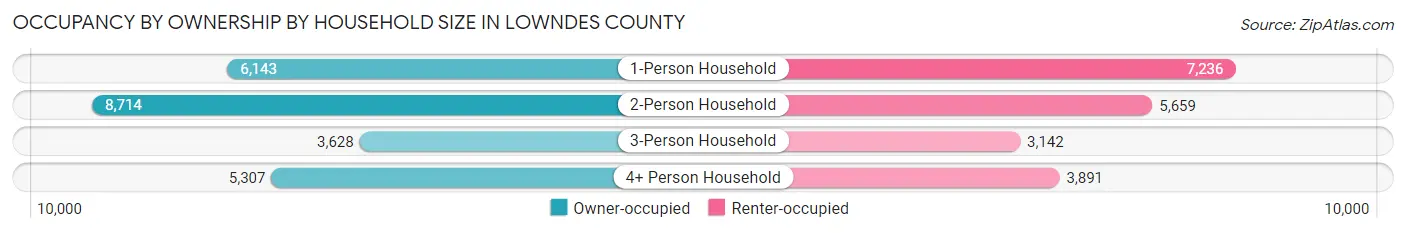
| Household Size | Owner-occupied | Renter-occupied |
| 1-Person Household | 6,143 (45.9%) | 7,236 (54.1%) |
| 2-Person Household | 8,714 (60.6%) | 5,659 (39.4%) |
| 3-Person Household | 3,628 (53.6%) | 3,142 (46.4%) |
| 4+ Person Household | 5,307 (57.7%) | 3,891 (42.3%) |
| Total Housing Units | 23,792 (54.4%) | 19,928 (45.6%) |
Occupancy by Educational Attainment in Lowndes County
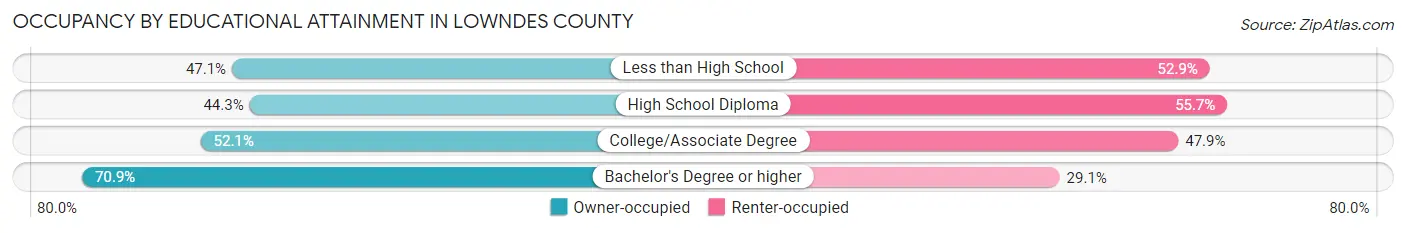
| Household Size | Owner-occupied | Renter-occupied |
| Less than High School | 1,834 (47.1%) | 2,059 (52.9%) |
| High School Diploma | 5,392 (44.3%) | 6,772 (55.7%) |
| College/Associate Degree | 8,430 (52.1%) | 7,757 (47.9%) |
| Bachelor's Degree or higher | 8,136 (70.9%) | 3,340 (29.1%) |
Occupancy by Age of Householder in Lowndes County
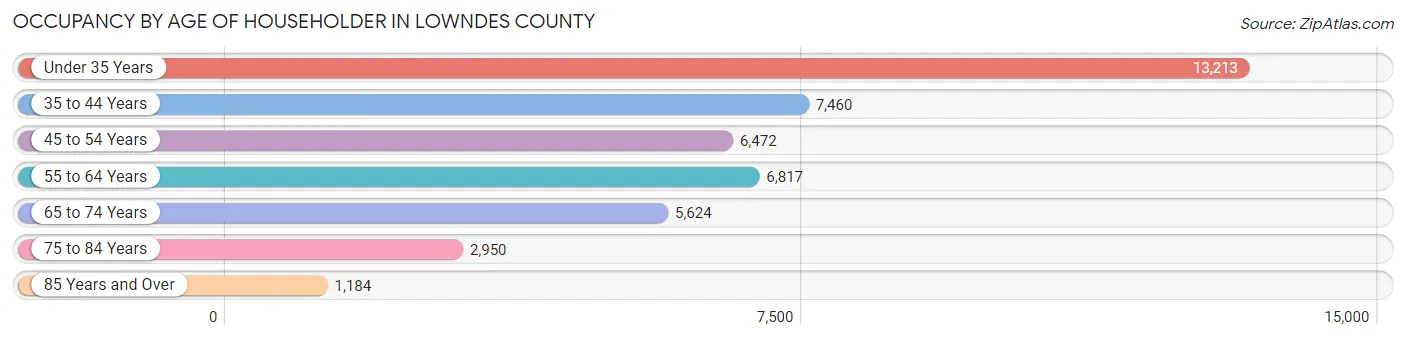
| Age Bracket | # Households | % Households |
| Under 35 Years | 13,213 | 30.2% |
| 35 to 44 Years | 7,460 | 17.1% |
| 45 to 54 Years | 6,472 | 14.8% |
| 55 to 64 Years | 6,817 | 15.6% |
| 65 to 74 Years | 5,624 | 12.9% |
| 75 to 84 Years | 2,950 | 6.8% |
| 85 Years and Over | 1,184 | 2.7% |
| Total | 43,720 | 100.0% |
Housing Finances in Lowndes County
Median Income by Occupancy in Lowndes County
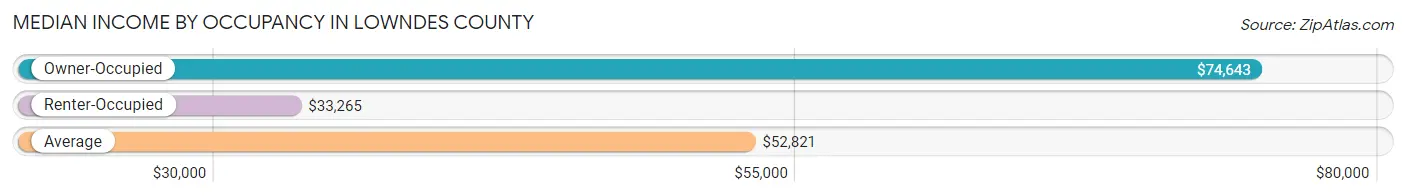
| Occupancy Type | # Households | Median Income |
| Owner-Occupied | 23,792 (54.4%) | $74,643 |
| Renter-Occupied | 19,928 (45.6%) | $33,265 |
| Average | 43,720 (100.0%) | $52,821 |
Occupancy by Householder Income Bracket in Lowndes County
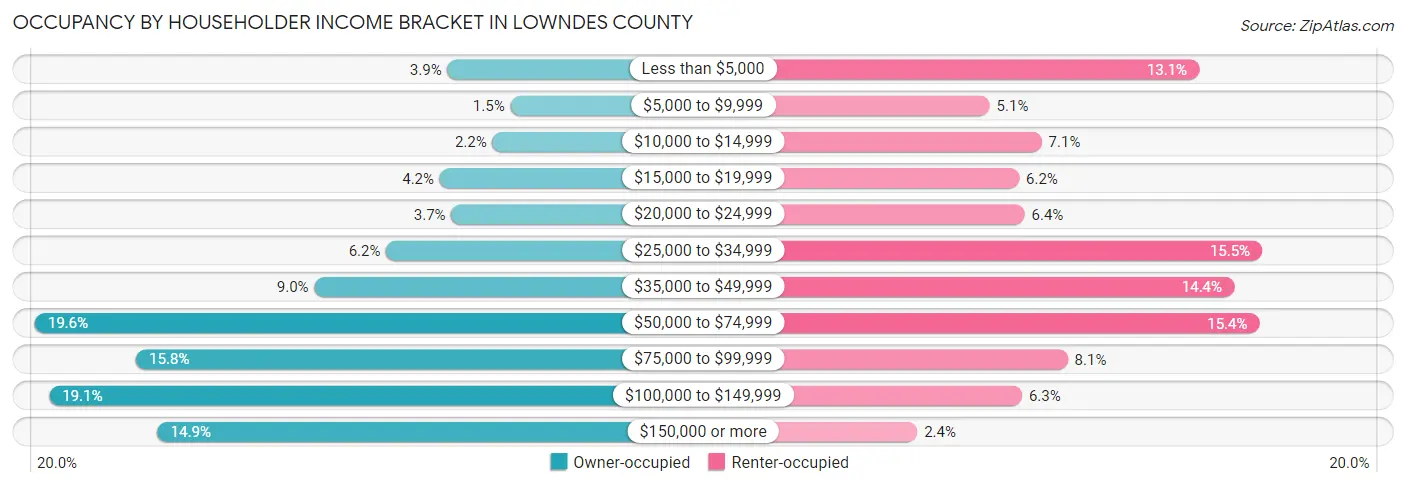
| Income Bracket | Owner-occupied | Renter-occupied |
| Less than $5,000 | 926 (3.9%) | 2,607 (13.1%) |
| $5,000 to $9,999 | 354 (1.5%) | 1,019 (5.1%) |
| $10,000 to $14,999 | 517 (2.2%) | 1,413 (7.1%) |
| $15,000 to $19,999 | 995 (4.2%) | 1,242 (6.2%) |
| $20,000 to $24,999 | 890 (3.7%) | 1,283 (6.4%) |
| $25,000 to $34,999 | 1,481 (6.2%) | 3,085 (15.5%) |
| $35,000 to $49,999 | 2,131 (9.0%) | 2,872 (14.4%) |
| $50,000 to $74,999 | 4,665 (19.6%) | 3,064 (15.4%) |
| $75,000 to $99,999 | 3,747 (15.8%) | 1,610 (8.1%) |
| $100,000 to $149,999 | 4,534 (19.1%) | 1,264 (6.3%) |
| $150,000 or more | 3,552 (14.9%) | 469 (2.4%) |
| Total | 23,792 (100.0%) | 19,928 (100.0%) |
Monthly Housing Cost Tiers in Lowndes County
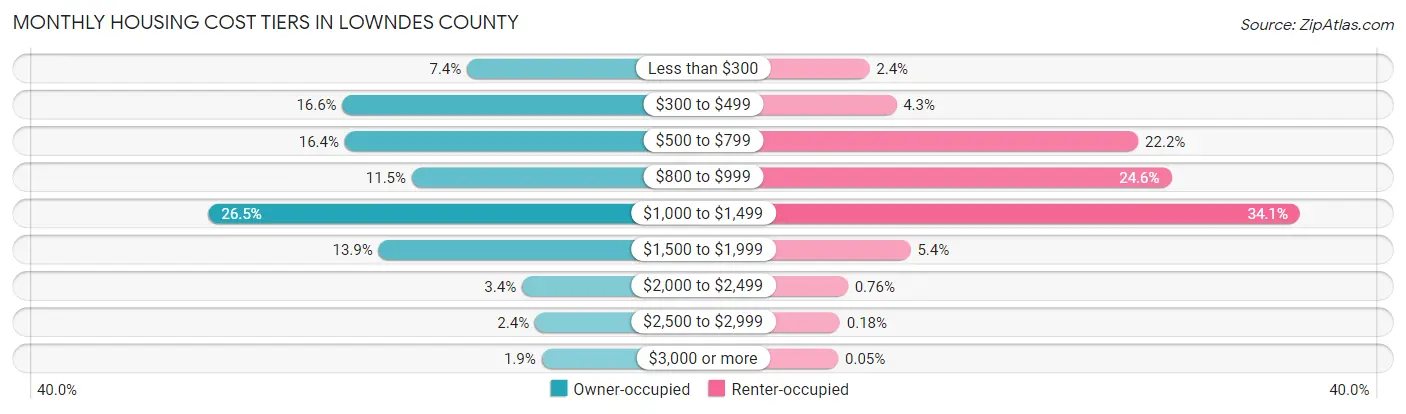
| Monthly Cost | Owner-occupied | Renter-occupied |
| Less than $300 | 1,762 (7.4%) | 468 (2.4%) |
| $300 to $499 | 3,947 (16.6%) | 862 (4.3%) |
| $500 to $799 | 3,907 (16.4%) | 4,414 (22.2%) |
| $800 to $999 | 2,732 (11.5%) | 4,900 (24.6%) |
| $1,000 to $1,499 | 6,296 (26.5%) | 6,785 (34.1%) |
| $1,500 to $1,999 | 3,314 (13.9%) | 1,072 (5.4%) |
| $2,000 to $2,499 | 801 (3.4%) | 152 (0.8%) |
| $2,500 to $2,999 | 573 (2.4%) | 36 (0.2%) |
| $3,000 or more | 460 (1.9%) | 10 (0.1%) |
| Total | 23,792 (100.0%) | 19,928 (100.0%) |
Physical Housing Characteristics in Lowndes County
Housing Structures in Lowndes County
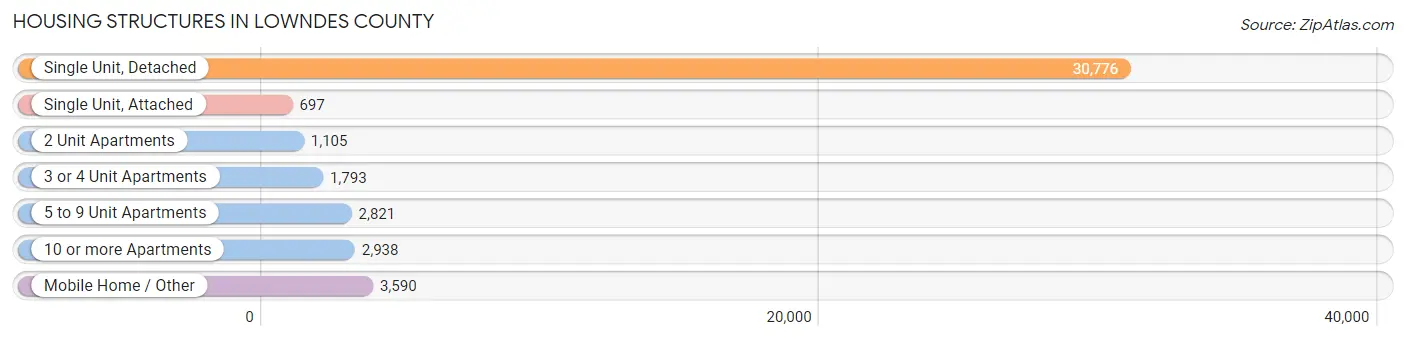
| Structure Type | # Housing Units | % Housing Units |
| Single Unit, Detached | 30,776 | 70.4% |
| Single Unit, Attached | 697 | 1.6% |
| 2 Unit Apartments | 1,105 | 2.5% |
| 3 or 4 Unit Apartments | 1,793 | 4.1% |
| 5 to 9 Unit Apartments | 2,821 | 6.5% |
| 10 or more Apartments | 2,938 | 6.7% |
| Mobile Home / Other | 3,590 | 8.2% |
| Total | 43,720 | 100.0% |
Housing Structures by Occupancy in Lowndes County
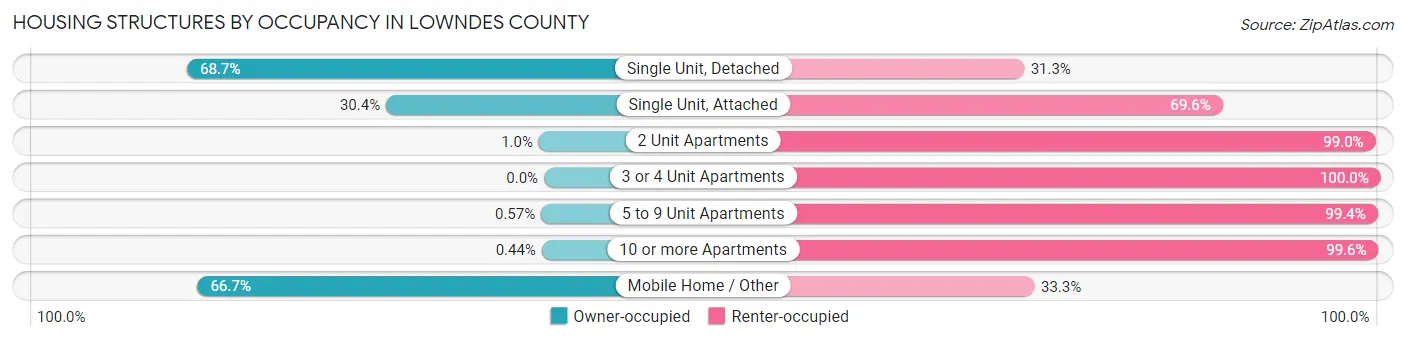
| Structure Type | Owner-occupied | Renter-occupied |
| Single Unit, Detached | 21,145 (68.7%) | 9,631 (31.3%) |
| Single Unit, Attached | 212 (30.4%) | 485 (69.6%) |
| 2 Unit Apartments | 11 (1.0%) | 1,094 (99.0%) |
| 3 or 4 Unit Apartments | 0 (0.0%) | 1,793 (100.0%) |
| 5 to 9 Unit Apartments | 16 (0.6%) | 2,805 (99.4%) |
| 10 or more Apartments | 13 (0.4%) | 2,925 (99.6%) |
| Mobile Home / Other | 2,395 (66.7%) | 1,195 (33.3%) |
| Total | 23,792 (54.4%) | 19,928 (45.6%) |
Housing Structures by Number of Rooms in Lowndes County
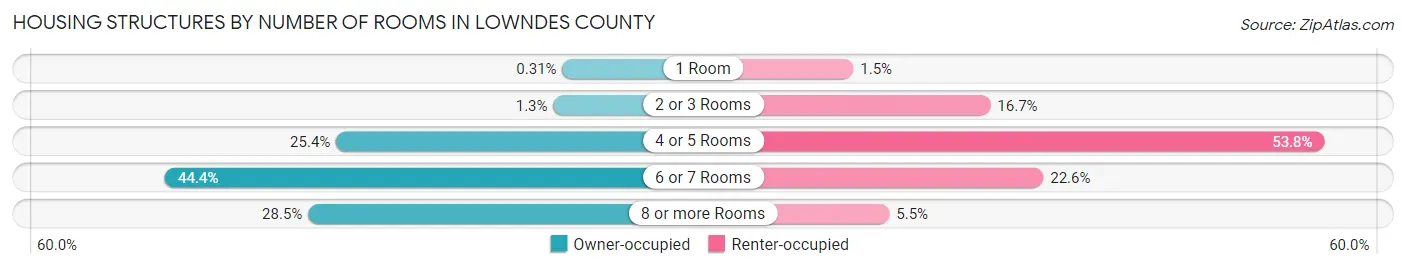
| Number of Rooms | Owner-occupied | Renter-occupied |
| 1 Room | 74 (0.3%) | 296 (1.5%) |
| 2 or 3 Rooms | 315 (1.3%) | 3,327 (16.7%) |
| 4 or 5 Rooms | 6,049 (25.4%) | 10,712 (53.7%) |
| 6 or 7 Rooms | 10,566 (44.4%) | 4,498 (22.6%) |
| 8 or more Rooms | 6,788 (28.5%) | 1,095 (5.5%) |
| Total | 23,792 (100.0%) | 19,928 (100.0%) |
Housing Structure by Heating Type in Lowndes County
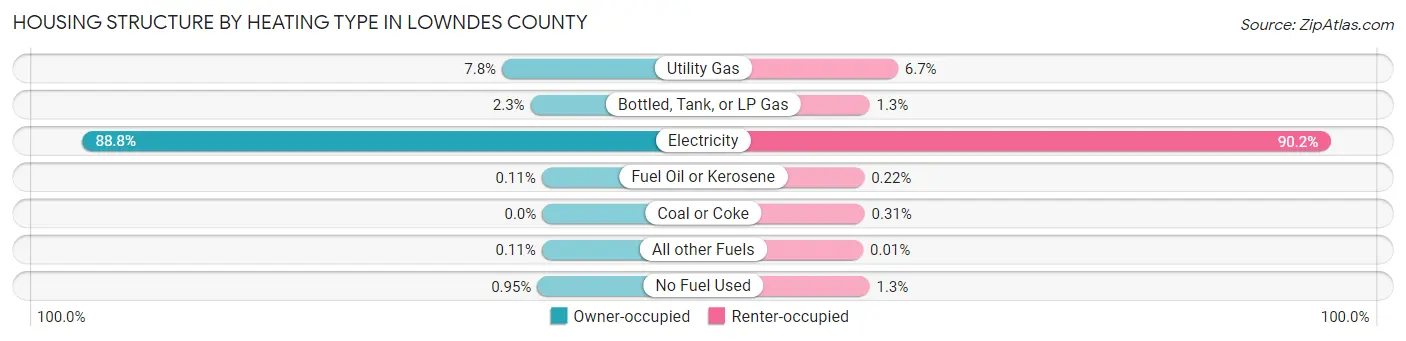
| Heating Type | Owner-occupied | Renter-occupied |
| Utility Gas | 1,849 (7.8%) | 1,340 (6.7%) |
| Bottled, Tank, or LP Gas | 537 (2.3%) | 250 (1.3%) |
| Electricity | 21,126 (88.8%) | 17,980 (90.2%) |
| Fuel Oil or Kerosene | 27 (0.1%) | 44 (0.2%) |
| Coal or Coke | 0 (0.0%) | 62 (0.3%) |
| All other Fuels | 27 (0.1%) | 2 (0.0%) |
| No Fuel Used | 226 (0.9%) | 250 (1.3%) |
| Total | 23,792 (100.0%) | 19,928 (100.0%) |
Household Vehicle Usage in Lowndes County
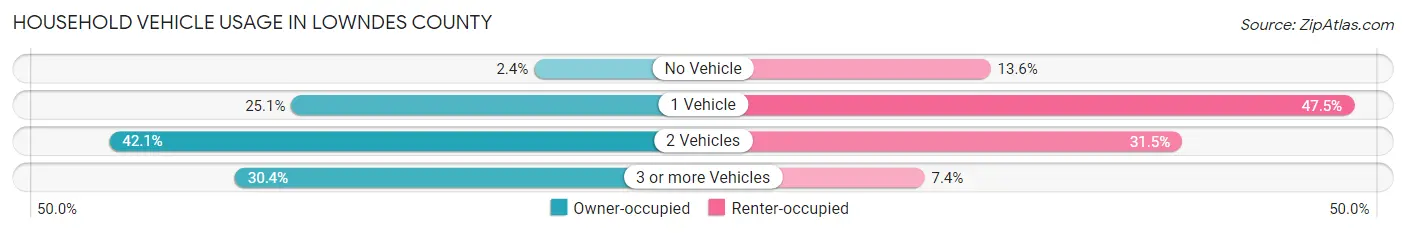
| Vehicles per Household | Owner-occupied | Renter-occupied |
| No Vehicle | 580 (2.4%) | 2,710 (13.6%) |
| 1 Vehicle | 5,975 (25.1%) | 9,467 (47.5%) |
| 2 Vehicles | 10,012 (42.1%) | 6,270 (31.5%) |
| 3 or more Vehicles | 7,225 (30.4%) | 1,481 (7.4%) |
| Total | 23,792 (100.0%) | 19,928 (100.0%) |
Real Estate & Mortgages in Lowndes County
Real Estate and Mortgage Overview in Lowndes County
| Characteristic | Without Mortgage | With Mortgage |
| Housing Units | 9,003 | 14,789 |
| Median Property Value | $154,000 | $189,500 |
| Median Household Income | $56,238 | $2,588 |
| Monthly Housing Costs | $442 | $460 |
| Real Estate Taxes | $1,388 | $364 |
Property Value by Mortgage Status in Lowndes County
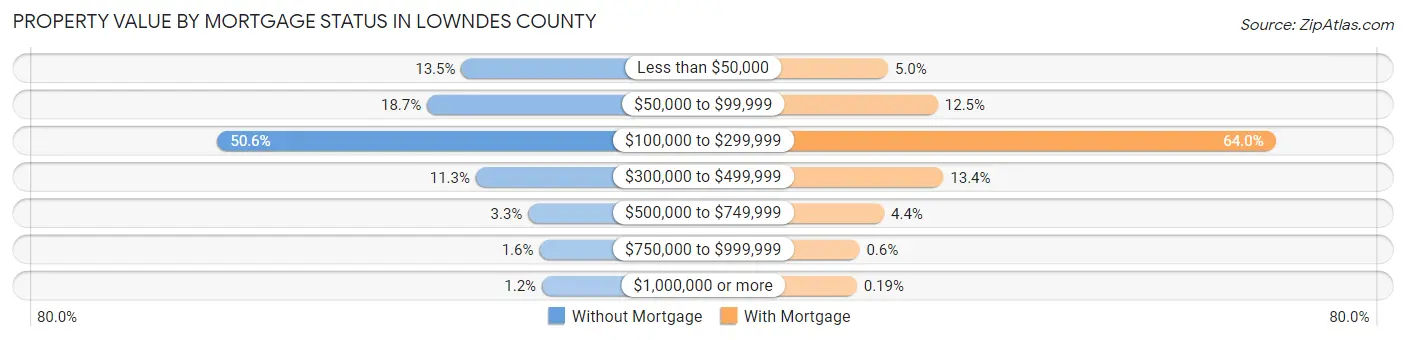
| Property Value | Without Mortgage | With Mortgage |
| Less than $50,000 | 1,212 (13.5%) | 732 (5.0%) |
| $50,000 to $99,999 | 1,681 (18.7%) | 1,855 (12.5%) |
| $100,000 to $299,999 | 4,557 (50.6%) | 9,463 (64.0%) |
| $300,000 to $499,999 | 1,013 (11.3%) | 1,979 (13.4%) |
| $500,000 to $749,999 | 294 (3.3%) | 644 (4.3%) |
| $750,000 to $999,999 | 141 (1.6%) | 88 (0.6%) |
| $1,000,000 or more | 105 (1.2%) | 28 (0.2%) |
| Total | 9,003 (100.0%) | 14,789 (100.0%) |
Household Income by Mortgage Status in Lowndes County
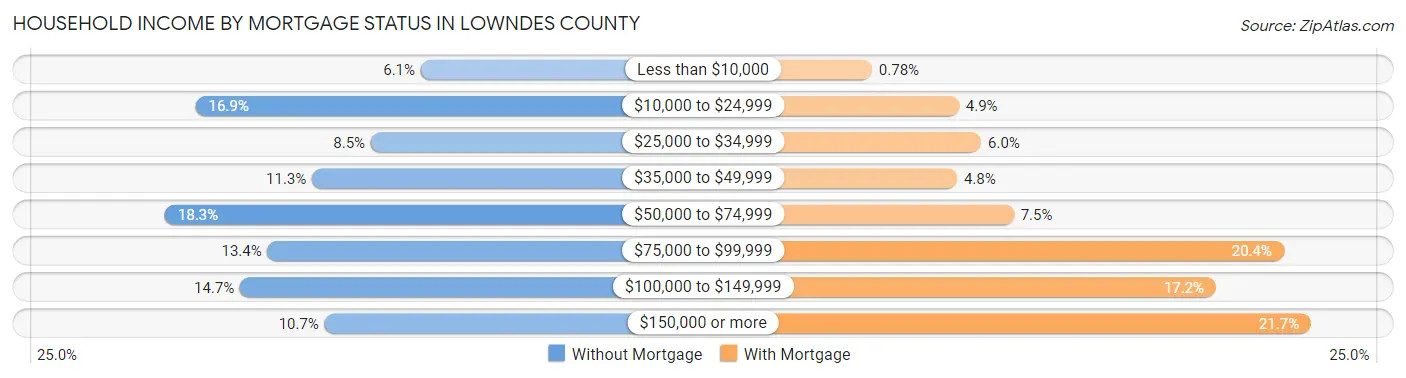
| Household Income | Without Mortgage | With Mortgage |
| Less than $10,000 | 552 (6.1%) | 116 (0.8%) |
| $10,000 to $24,999 | 1,518 (16.9%) | 728 (4.9%) |
| $25,000 to $34,999 | 766 (8.5%) | 884 (6.0%) |
| $35,000 to $49,999 | 1,018 (11.3%) | 715 (4.8%) |
| $50,000 to $74,999 | 1,649 (18.3%) | 1,113 (7.5%) |
| $75,000 to $99,999 | 1,209 (13.4%) | 3,016 (20.4%) |
| $100,000 to $149,999 | 1,327 (14.7%) | 2,538 (17.2%) |
| $150,000 or more | 964 (10.7%) | 3,207 (21.7%) |
| Total | 9,003 (100.0%) | 14,789 (100.0%) |
Property Value to Household Income Ratio in Lowndes County
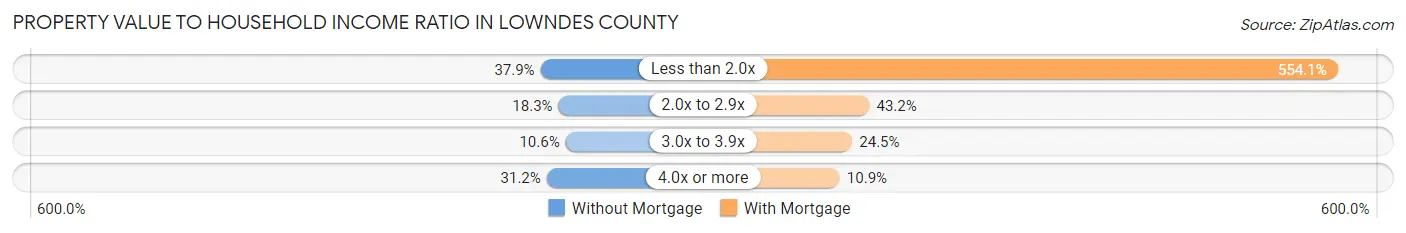
| Value-to-Income Ratio | Without Mortgage | With Mortgage |
| Less than 2.0x | 3,412 (37.9%) | 81,951 (554.1%) |
| 2.0x to 2.9x | 1,649 (18.3%) | 6,386 (43.2%) |
| 3.0x to 3.9x | 956 (10.6%) | 3,617 (24.5%) |
| 4.0x or more | 2,805 (31.2%) | 1,610 (10.9%) |
| Total | 9,003 (100.0%) | 14,789 (100.0%) |
Real Estate Taxes by Mortgage Status in Lowndes County
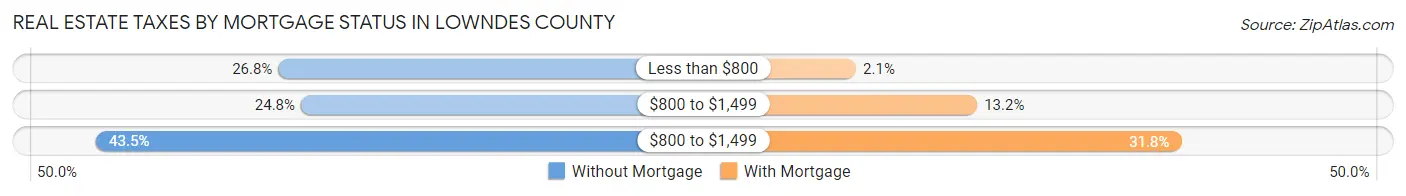
| Property Taxes | Without Mortgage | With Mortgage |
| Less than $800 | 2,416 (26.8%) | 312 (2.1%) |
| $800 to $1,499 | 2,230 (24.8%) | 1,948 (13.2%) |
| $800 to $1,499 | 3,913 (43.5%) | 4,703 (31.8%) |
| Total | 9,003 (100.0%) | 14,789 (100.0%) |
Health & Disability in Lowndes County
Health Insurance Coverage by Age in Lowndes County
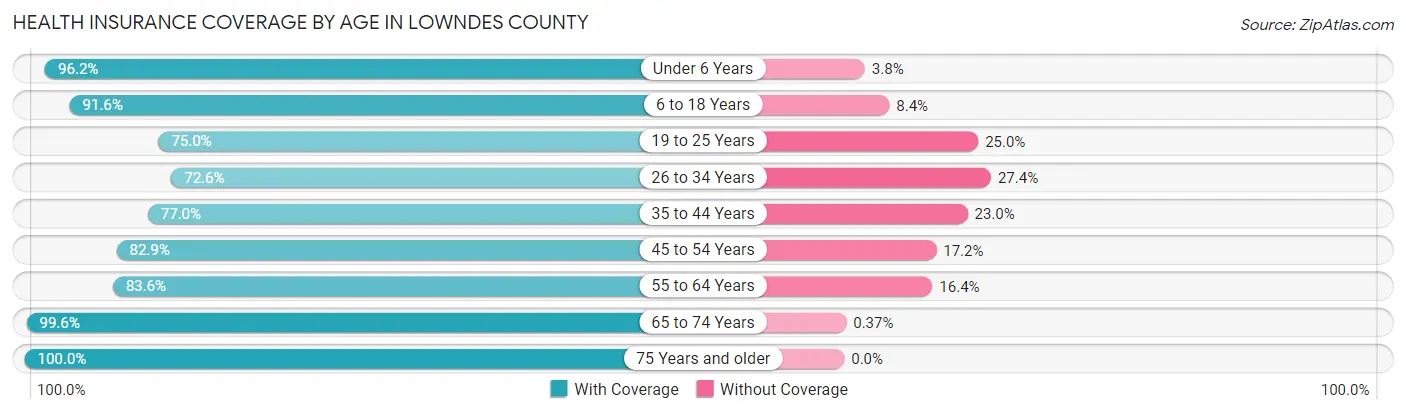
| Age Bracket | With Coverage | Without Coverage |
| Under 6 Years | 9,225 (96.2%) | 368 (3.8%) |
| 6 to 18 Years | 19,553 (91.6%) | 1,794 (8.4%) |
| 19 to 25 Years | 13,179 (75.0%) | 4,385 (25.0%) |
| 26 to 34 Years | 9,794 (72.6%) | 3,689 (27.4%) |
| 35 to 44 Years | 9,600 (77.0%) | 2,865 (23.0%) |
| 45 to 54 Years | 9,843 (82.9%) | 2,038 (17.2%) |
| 55 to 64 Years | 9,694 (83.6%) | 1,906 (16.4%) |
| 65 to 74 Years | 8,908 (99.6%) | 33 (0.4%) |
| 75 Years and older | 5,812 (100.0%) | 0 (0.0%) |
| Total | 95,608 (84.8%) | 17,078 (15.2%) |
Health Insurance Coverage by Citizenship Status in Lowndes County
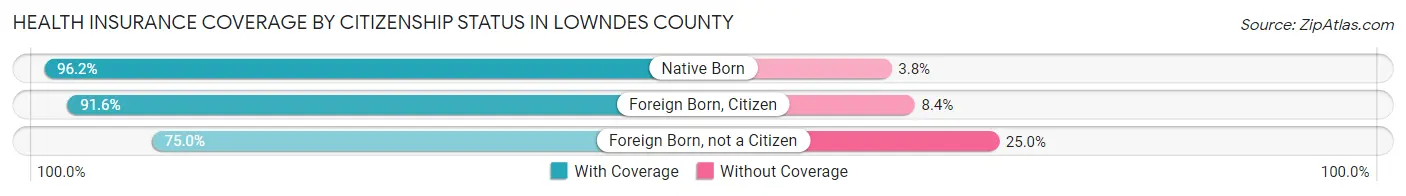
| Citizenship Status | With Coverage | Without Coverage |
| Native Born | 9,225 (96.2%) | 368 (3.8%) |
| Foreign Born, Citizen | 19,553 (91.6%) | 1,794 (8.4%) |
| Foreign Born, not a Citizen | 13,179 (75.0%) | 4,385 (25.0%) |
Health Insurance Coverage by Household Income in Lowndes County
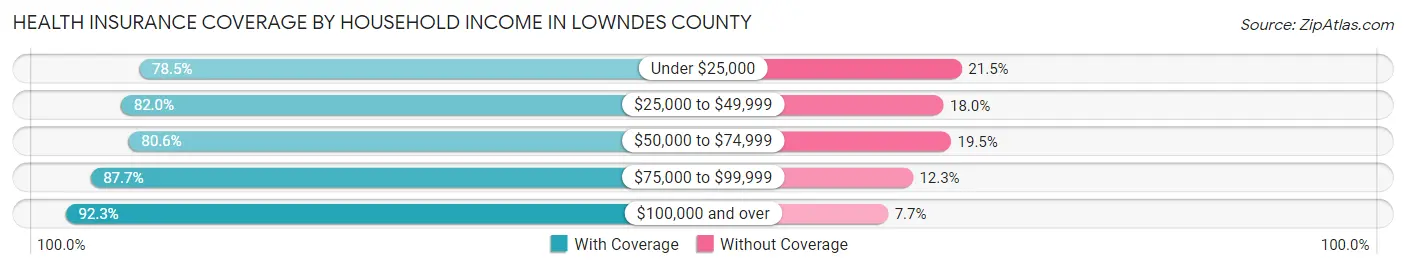
| Household Income | With Coverage | Without Coverage |
| Under $25,000 | 17,359 (78.5%) | 4,747 (21.5%) |
| $25,000 to $49,999 | 18,029 (82.0%) | 3,965 (18.0%) |
| $50,000 to $74,999 | 15,805 (80.5%) | 3,817 (19.5%) |
| $75,000 to $99,999 | 13,195 (87.7%) | 1,850 (12.3%) |
| $100,000 and over | 30,034 (92.3%) | 2,492 (7.7%) |
Public vs Private Health Insurance Coverage by Age in Lowndes County
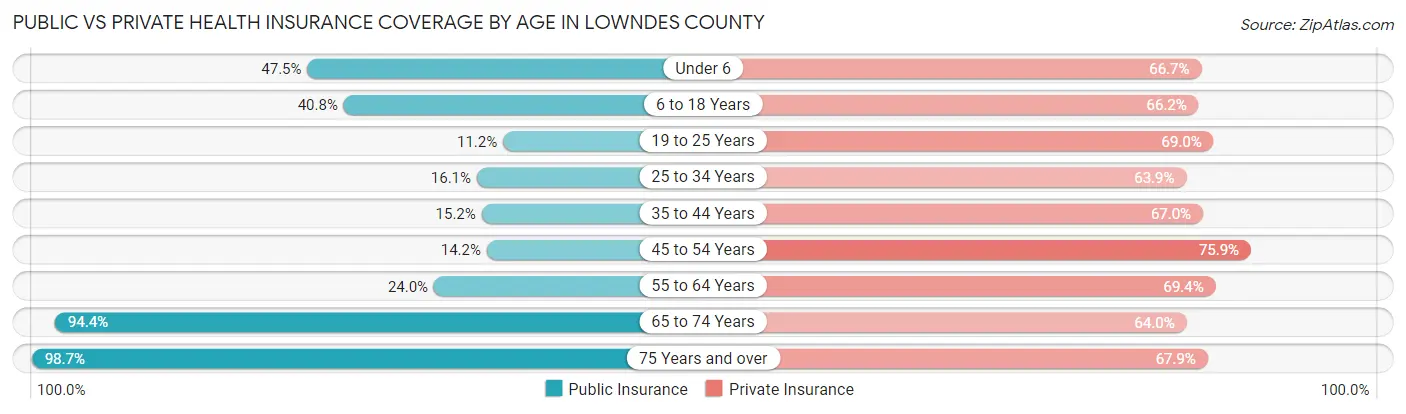
| Age Bracket | Public Insurance | Private Insurance |
| Under 6 | 4,559 (47.5%) | 6,401 (66.7%) |
| 6 to 18 Years | 8,701 (40.8%) | 14,136 (66.2%) |
| 19 to 25 Years | 1,966 (11.2%) | 12,123 (69.0%) |
| 25 to 34 Years | 2,165 (16.1%) | 8,621 (63.9%) |
| 35 to 44 Years | 1,891 (15.2%) | 8,355 (67.0%) |
| 45 to 54 Years | 1,688 (14.2%) | 9,023 (75.9%) |
| 55 to 64 Years | 2,786 (24.0%) | 8,047 (69.4%) |
| 65 to 74 Years | 8,438 (94.4%) | 5,721 (64.0%) |
| 75 Years and over | 5,735 (98.7%) | 3,947 (67.9%) |
| Total | 37,929 (33.7%) | 76,374 (67.8%) |
Disability Status by Sex by Age in Lowndes County
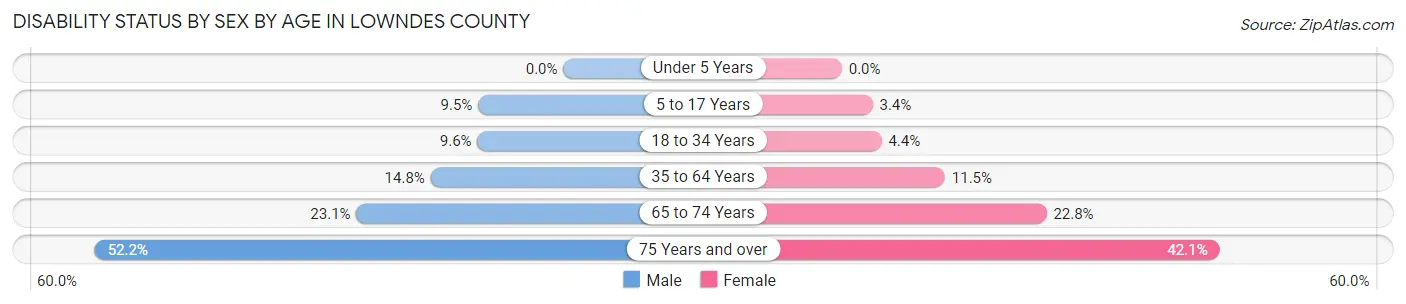
| Age Bracket | Male | Female |
| Under 5 Years | 0 (0.0%) | 0 (0.0%) |
| 5 to 17 Years | 984 (9.5%) | 351 (3.4%) |
| 18 to 34 Years | 1,457 (9.6%) | 806 (4.4%) |
| 35 to 64 Years | 2,448 (14.8%) | 2,225 (11.5%) |
| 65 to 74 Years | 921 (23.1%) | 1,127 (22.8%) |
| 75 Years and over | 1,229 (52.2%) | 1,454 (42.1%) |
Disability Class by Sex by Age in Lowndes County
Disability Class: Hearing Difficulty
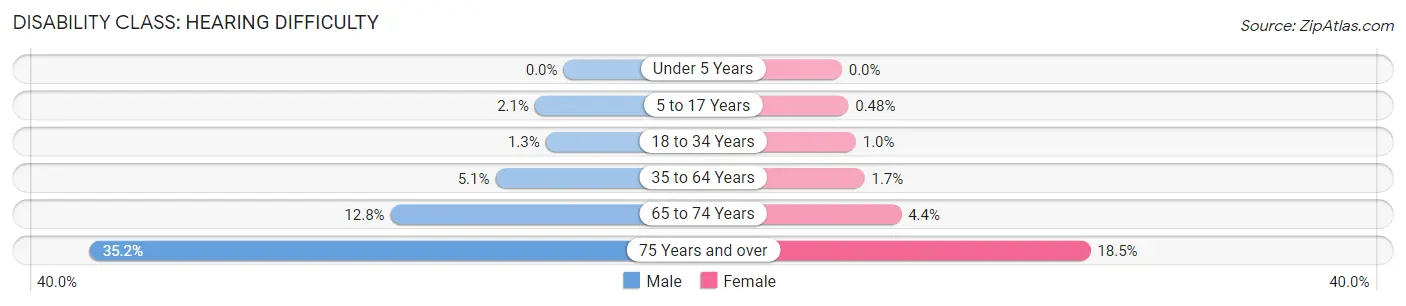
| Age Bracket | Male | Female |
| Under 5 Years | 0 (0.0%) | 0 (0.0%) |
| 5 to 17 Years | 220 (2.1%) | 49 (0.5%) |
| 18 to 34 Years | 201 (1.3%) | 189 (1.0%) |
| 35 to 64 Years | 837 (5.1%) | 327 (1.7%) |
| 65 to 74 Years | 513 (12.8%) | 218 (4.4%) |
| 75 Years and over | 828 (35.2%) | 638 (18.5%) |
Disability Class: Vision Difficulty
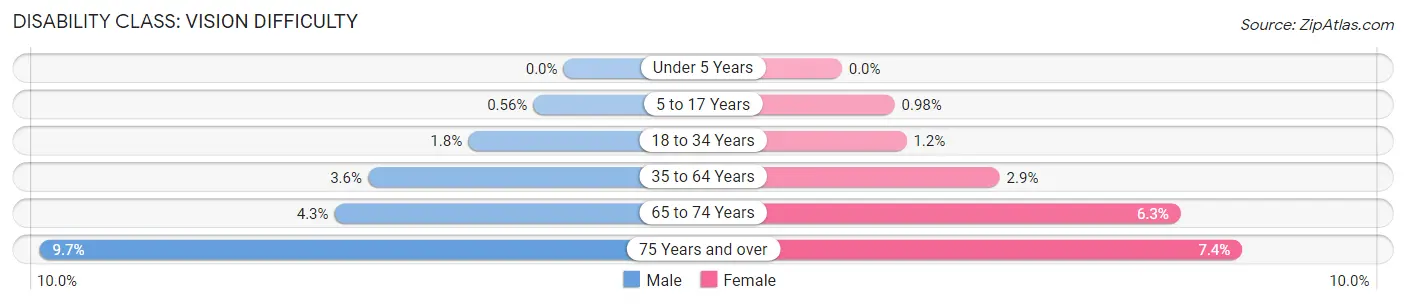
| Age Bracket | Male | Female |
| Under 5 Years | 0 (0.0%) | 0 (0.0%) |
| 5 to 17 Years | 58 (0.6%) | 100 (1.0%) |
| 18 to 34 Years | 270 (1.8%) | 218 (1.2%) |
| 35 to 64 Years | 602 (3.6%) | 567 (2.9%) |
| 65 to 74 Years | 170 (4.3%) | 311 (6.3%) |
| 75 Years and over | 229 (9.7%) | 257 (7.4%) |
Disability Class: Cognitive Difficulty
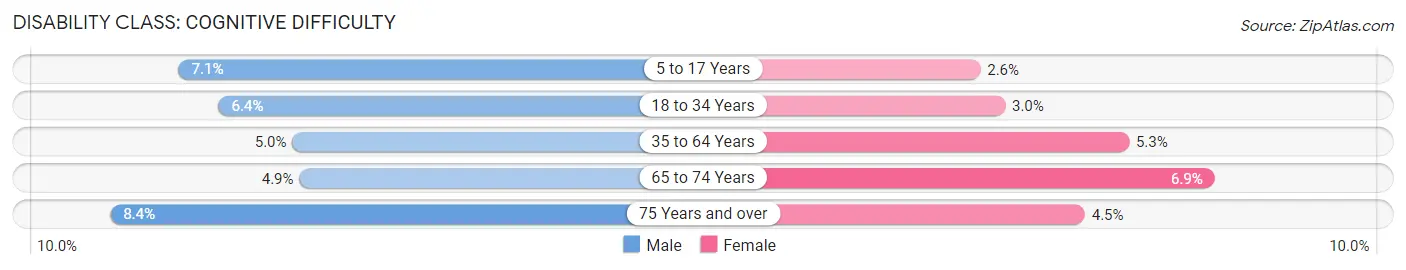
| Age Bracket | Male | Female |
| 5 to 17 Years | 740 (7.1%) | 263 (2.6%) |
| 18 to 34 Years | 974 (6.4%) | 553 (3.0%) |
| 35 to 64 Years | 833 (5.0%) | 1,032 (5.3%) |
| 65 to 74 Years | 196 (4.9%) | 342 (6.9%) |
| 75 Years and over | 198 (8.4%) | 156 (4.5%) |
Disability Class: Ambulatory Difficulty
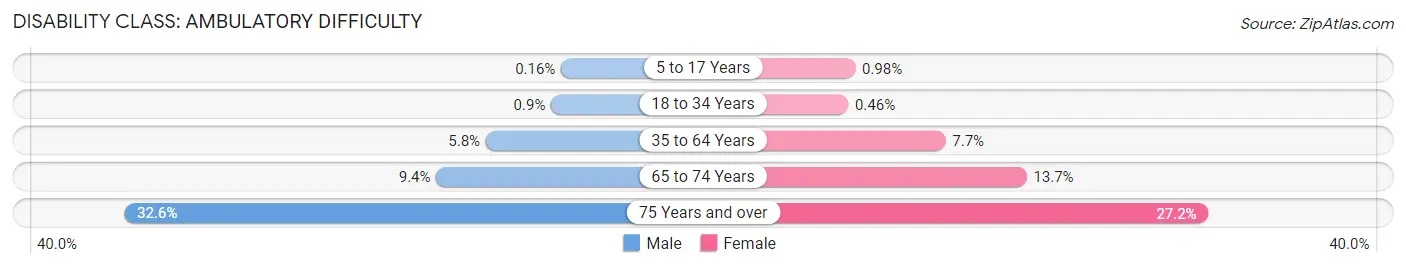
| Age Bracket | Male | Female |
| 5 to 17 Years | 17 (0.2%) | 100 (1.0%) |
| 18 to 34 Years | 137 (0.9%) | 83 (0.5%) |
| 35 to 64 Years | 953 (5.8%) | 1,490 (7.7%) |
| 65 to 74 Years | 377 (9.4%) | 678 (13.7%) |
| 75 Years and over | 768 (32.6%) | 941 (27.2%) |
Disability Class: Self-Care Difficulty
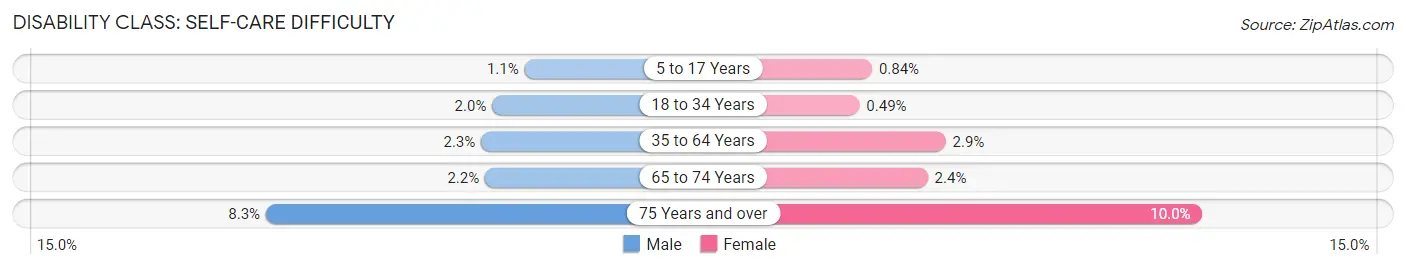
| Age Bracket | Male | Female |
| 5 to 17 Years | 112 (1.1%) | 86 (0.8%) |
| 18 to 34 Years | 302 (2.0%) | 89 (0.5%) |
| 35 to 64 Years | 379 (2.3%) | 561 (2.9%) |
| 65 to 74 Years | 87 (2.2%) | 118 (2.4%) |
| 75 Years and over | 195 (8.3%) | 347 (10.0%) |
Technology Access in Lowndes County
Computing Device Access in Lowndes County
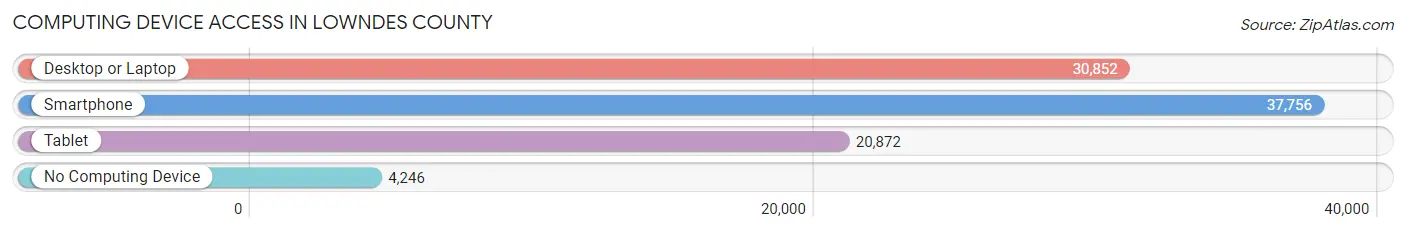
| Device Type | # Households | % Households |
| Desktop or Laptop | 30,852 | 70.6% |
| Smartphone | 37,756 | 86.4% |
| Tablet | 20,872 | 47.7% |
| No Computing Device | 4,246 | 9.7% |
| Total | 43,720 | 100.0% |
Internet Access in Lowndes County
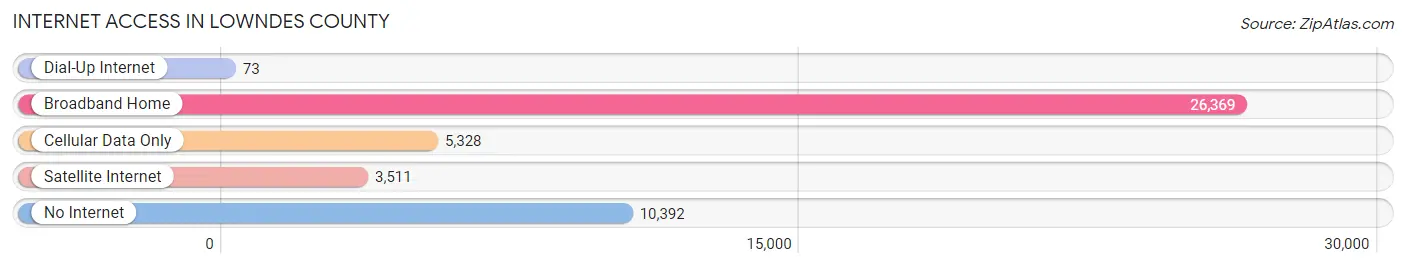
| Internet Type | # Households | % Households |
| Dial-Up Internet | 73 | 0.2% |
| Broadband Home | 26,369 | 60.3% |
| Cellular Data Only | 5,328 | 12.2% |
| Satellite Internet | 3,511 | 8.0% |
| No Internet | 10,392 | 23.8% |
| Total | 43,720 | 100.0% |
Lowndes County Summary
Lowndes County is located in the south-central part of the state of Georgia, in the United States. It is part of the Valdosta Metropolitan Statistical Area. The county seat is Valdosta, which is also the largest city in the county. Lowndes County was created in 1825 from a portion of Irwin County. The county is named for William Jones Lowndes, a member of the United States House of Representatives from South Carolina.
Geography
Lowndes County is located in the southern part of Georgia, and is bordered by Brooks County to the north, Echols County to the east, Lanier County to the south, and Berrien and Cook counties to the west. The county has a total area of 545 square miles, of which 543 square miles is land and 2 square miles (0.4%) is water. The county is located in the flatwoods region of Georgia, and is mostly covered in pine and hardwood forests. The Withlacoochee River forms the western border of the county, and the Alapaha River forms the eastern border.
The county is home to several state parks, including Reed Bingham State Park, which is located on the banks of the Withlacoochee River. The park offers camping, fishing, boating, and other outdoor activities.
Demographics
As of the 2010 United States Census, there were 109,233 people, 40,845 households, and 28,845 families living in the county. The population density was 201.2 people per square mile. The racial makeup of the county was 63.2% White, 28.3% Black or African American, 0.4% Native American, 1.2% Asian, 0.1% Pacific Islander, 5.2% from other races, and 1.6% from two or more races. 10.7% of the population were Hispanic or Latino of any race.
The median income for a household in the county was $37,845, and the median income for a family was $45,945. The per capita income for the county was $19,845. About 17.2% of families and 21.2% of the population were below the poverty line, including 30.2% of those under age 18 and 13.2% of those age 65 or over.
Economy
Lowndes County is home to several major industries, including agriculture, manufacturing, and tourism. The county is the largest producer of peanuts in the state of Georgia, and is also a major producer of cotton, corn, and soybeans. The county is home to several manufacturing companies, including Georgia-Pacific, which produces paper products, and MillerCoors, which produces beer.
The county is also a major tourist destination, with several attractions, including Wild Adventures Theme Park, which is located in Valdosta. The park offers rides, shows, and other attractions. The county is also home to several state parks, which offer camping, fishing, boating, and other outdoor activities.
Lowndes County is also home to several colleges and universities, including Valdosta State University, which is the largest university in the county. The university offers a variety of degree programs, and is home to the Valdosta State Blazers, the university's NCAA Division II athletic teams.
Conclusion
Lowndes County is a diverse county located in the south-central part of the state of Georgia. The county is home to several major industries, including agriculture, manufacturing, and tourism. The county is also home to several state parks, which offer camping, fishing, boating, and other outdoor activities. The county is also home to several colleges and universities, including Valdosta State University, which is the largest university in the county. Lowndes County is a great place to live, work, and play.
Common Questions
What is the Total Population of Lowndes County?
Total Population of Lowndes County is 118,257.
What is the Total Male Population of Lowndes County?
Total Male Population of Lowndes County is 57,335.
What is the Total Female Population of Lowndes County?
Total Female Population of Lowndes County is 60,922.
What is the Ratio of Males per 100 Females in Lowndes County?
There are 94.11 Males per 100 Females in Lowndes County.
What is the Ratio of Females per 100 Males in Lowndes County?
There are 106.26 Females per 100 Males in Lowndes County.
What is the Median Population Age in Lowndes County?
Median Population Age in Lowndes County is 30.9 Years.
What is the Average Family Size in Lowndes County
Average Family Size in Lowndes County is 3.3 People.
What is the Average Household Size in Lowndes County
Average Household Size in Lowndes County is 2.6 People.
What is Per Capita Income in Lowndes County?
Per Capita income in Lowndes County is $27,553.
What is the Median Family Income in Lowndes County?
Median Family Income in Lowndes County is $72,081.
What is the Median Household income in Lowndes County?
Median Household Income in Lowndes County is $52,821.
What is Income or Wage Gap in Lowndes County?
Income or Wage Gap in Lowndes County is 29.2%.
Women in Lowndes County earn 70.8 cents for every dollar earned by a man.
What is Family Income Deficit in Lowndes County?
Family Income Deficit in Lowndes County is $14,768.
Families that are below poverty line in Lowndes County earn $14,768 less on average than the poverty threshold level.
What is Inequality or Gini Index in Lowndes County?
Inequality or Gini Index in Lowndes County is 0.49.
How Large is the Labor Force in Lowndes County?
There are 55,791 People in the Labor Forcein in Lowndes County.
What is the Percentage of People in the Labor Force in Lowndes County?
60.1% of People are in the Labor Force in Lowndes County.
What is the Unemployment Rate in Lowndes County?
Unemployment Rate in Lowndes County is 5.1%.