Bartow County, GA
Bartow County Map
Bartow County Overview
109,410
TOTAL POPULATION
54,685
MALE POPULATION
54,725
FEMALE POPULATION
99.93
MALES / 100 FEMALES
100.07
FEMALES / 100 MALES
38.2
MEDIAN AGE
3.3
AVG FAMILY SIZE
2.8
AVG HOUSEHOLD SIZE
$32,102
PER CAPITA INCOME
$87,480
AVG FAMILY INCOME
$74,812
AVG HOUSEHOLD INCOME
31.4%
WAGE / INCOME GAP [ % ]
68.6¢/ $1
WAGE / INCOME GAP [ $ ]
$11,288
FAMILY INCOME DEFICIT
0.41
INEQUALITY / GINI INDEX
55,241
LABOR FORCE [ PEOPLE ]
63.8%
PERCENT IN LABOR FORCE
5.5%
UNEMPLOYMENT RATE
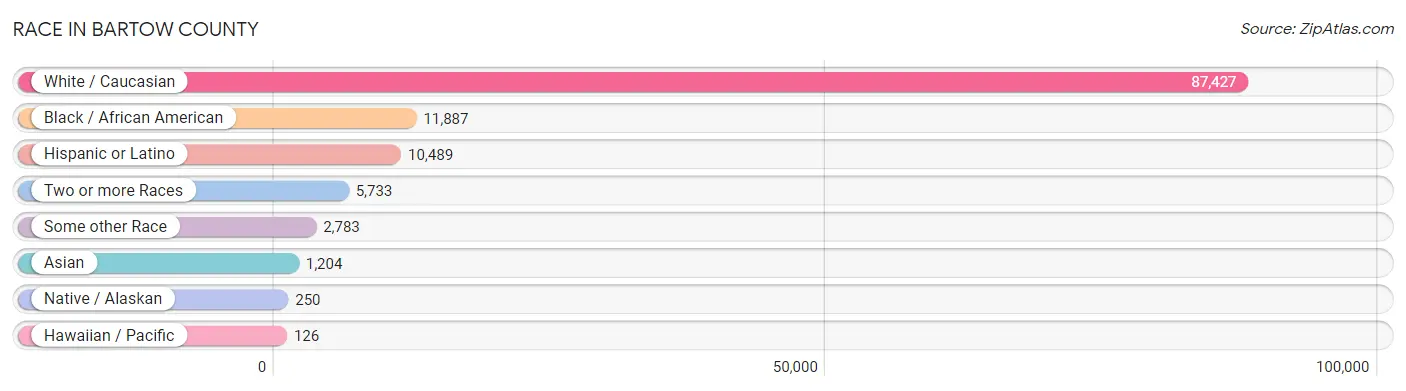
Race in Bartow County
The most populous races in Bartow County are White / Caucasian (87,427 | 79.9%), Black / African American (11,887 | 10.9%), and Hispanic or Latino (10,489 | 9.6%).
| Race | # Population | % Population |
| Asian | 1,204 | 1.1% |
| Black / African American | 11,887 | 10.9% |
| Hawaiian / Pacific | 126 | 0.1% |
| Hispanic or Latino | 10,489 | 9.6% |
| Native / Alaskan | 250 | 0.2% |
| White / Caucasian | 87,427 | 79.9% |
| Two or more Races | 5,733 | 5.2% |
| Some other Race | 2,783 | 2.5% |
| Total | 109,410 | 100.0% |
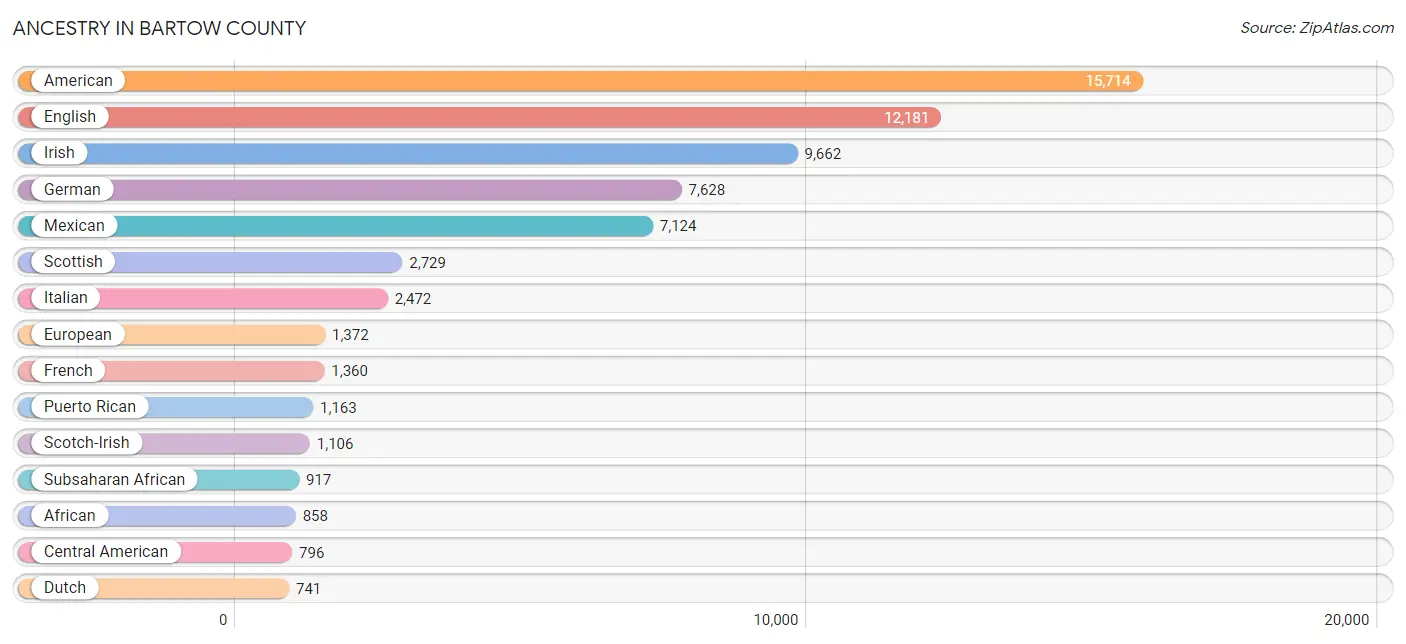
Ancestry in Bartow County
The most populous ancestries reported in Bartow County are American (15,714 | 14.4%), English (12,181 | 11.1%), Irish (9,662 | 8.8%), German (7,628 | 7.0%), and Mexican (7,124 | 6.5%), together accounting for 47.8% of all Bartow County residents.
| Ancestry | # Population | % Population |
| African | 858 | 0.8% |
| American | 15,714 | 14.4% |
| Arab | 200 | 0.2% |
| Argentinean | 14 | 0.0% |
| Austrian | 21 | 0.0% |
| Belgian | 22 | 0.0% |
| Bhutanese | 8 | 0.0% |
| Blackfeet | 148 | 0.1% |
| Bolivian | 62 | 0.1% |
| Brazilian | 34 | 0.0% |
| British | 729 | 0.7% |
| Burmese | 49 | 0.0% |
| Canadian | 104 | 0.1% |
| Central American | 796 | 0.7% |
| Central American Indian | 108 | 0.1% |
| Cherokee | 598 | 0.5% |
| Chickasaw | 19 | 0.0% |
| Choctaw | 61 | 0.1% |
| Colombian | 74 | 0.1% |
| Comanche | 23 | 0.0% |
| Costa Rican | 33 | 0.0% |
| Croatian | 5 | 0.0% |
| Cuban | 176 | 0.2% |
| Czech | 44 | 0.0% |
| Czechoslovakian | 18 | 0.0% |
| Danish | 289 | 0.3% |
| Dominican | 256 | 0.2% |
| Dutch | 741 | 0.7% |
| Dutch West Indian | 20 | 0.0% |
| Eastern European | 171 | 0.2% |
| Ecuadorian | 55 | 0.1% |
| Egyptian | 154 | 0.1% |
| English | 12,181 | 11.1% |
| European | 1,372 | 1.3% |
| Filipino | 37 | 0.0% |
| Finnish | 73 | 0.1% |
| French | 1,360 | 1.2% |
| French Canadian | 151 | 0.1% |
| German | 7,628 | 7.0% |
| Greek | 154 | 0.1% |
| Guatemalan | 363 | 0.3% |
| Haitian | 226 | 0.2% |
| Hungarian | 52 | 0.1% |
| Indian (Asian) | 37 | 0.0% |
| Irish | 9,662 | 8.8% |
| Iroquois | 1 | 0.0% |
| Italian | 2,472 | 2.3% |
| Jamaican | 187 | 0.2% |
| Kenyan | 6 | 0.0% |
| Korean | 585 | 0.5% |
| Lithuanian | 14 | 0.0% |
| Macedonian | 31 | 0.0% |
| Mexican | 7,124 | 6.5% |
| Mexican American Indian | 148 | 0.1% |
| Mongolian | 33 | 0.0% |
| Native Hawaiian | 112 | 0.1% |
| Nicaraguan | 27 | 0.0% |
| Northern European | 81 | 0.1% |
| Norwegian | 343 | 0.3% |
| Palestinian | 26 | 0.0% |
| Panamanian | 59 | 0.1% |
| Paraguayan | 88 | 0.1% |
| Pennsylvania German | 71 | 0.1% |
| Peruvian | 29 | 0.0% |
| Polish | 579 | 0.5% |
| Portuguese | 80 | 0.1% |
| Puerto Rican | 1,163 | 1.1% |
| Romanian | 77 | 0.1% |
| Russian | 221 | 0.2% |
| Salvadoran | 314 | 0.3% |
| Samoan | 28 | 0.0% |
| Scandinavian | 142 | 0.1% |
| Scotch-Irish | 1,106 | 1.0% |
| Scottish | 2,729 | 2.5% |
| Shoshone | 9 | 0.0% |
| Slovak | 74 | 0.1% |
| Slovene | 38 | 0.0% |
| South American | 399 | 0.4% |
| Spaniard | 78 | 0.1% |
| Sri Lankan | 46 | 0.0% |
| Subsaharan African | 917 | 0.8% |
| Swedish | 408 | 0.4% |
| Swiss | 68 | 0.1% |
| Thai | 226 | 0.2% |
| Tongan | 18 | 0.0% |
| Trinidadian and Tobagonian | 9 | 0.0% |
| Ukrainian | 96 | 0.1% |
| Venezuelan | 61 | 0.1% |
| Welsh | 741 | 0.7% |
| Yugoslavian | 34 | 0.0% | View All 90 Rows |
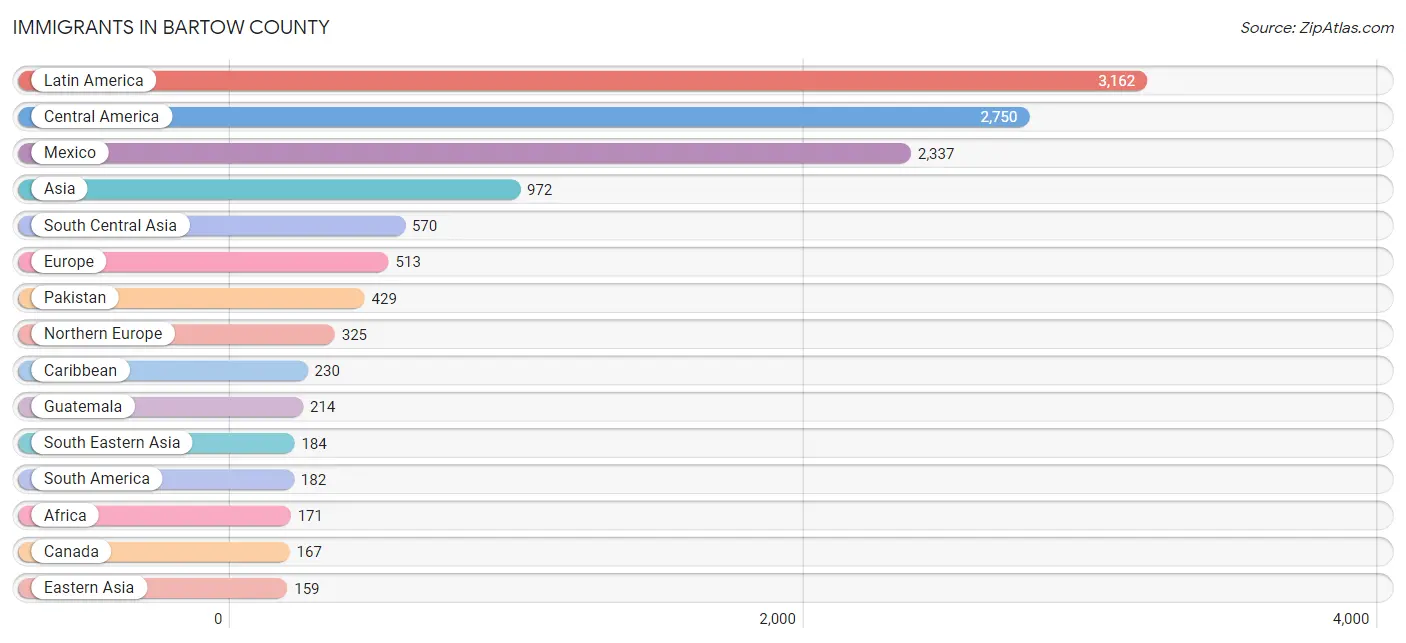
Immigrants in Bartow County
The most numerous immigrant groups reported in Bartow County came from Latin America (3,162 | 2.9%), Central America (2,750 | 2.5%), Mexico (2,337 | 2.1%), Asia (972 | 0.9%), and South Central Asia (570 | 0.5%), together accounting for 8.9% of all Bartow County residents.
| Immigration Origin | # Population | % Population |
| Africa | 171 | 0.2% |
| Asia | 972 | 0.9% |
| Bolivia | 9 | 0.0% |
| Bosnia and Herzegovina | 22 | 0.0% |
| Brazil | 10 | 0.0% |
| Canada | 167 | 0.2% |
| Caribbean | 230 | 0.2% |
| Central America | 2,750 | 2.5% |
| China | 38 | 0.0% |
| Colombia | 65 | 0.1% |
| Costa Rica | 33 | 0.0% |
| Denmark | 84 | 0.1% |
| Dominican Republic | 31 | 0.0% |
| Eastern Asia | 159 | 0.2% |
| Eastern Europe | 144 | 0.1% |
| Ecuador | 8 | 0.0% |
| Egypt | 19 | 0.0% |
| El Salvador | 135 | 0.1% |
| England | 54 | 0.1% |
| Europe | 513 | 0.5% |
| France | 10 | 0.0% |
| Germany | 2 | 0.0% |
| Guatemala | 214 | 0.2% |
| Haiti | 100 | 0.1% |
| India | 81 | 0.1% |
| Iraq | 20 | 0.0% |
| Italy | 14 | 0.0% |
| Jamaica | 86 | 0.1% |
| Japan | 89 | 0.1% |
| Korea | 32 | 0.0% |
| Latin America | 3,162 | 2.9% |
| Mexico | 2,337 | 2.1% |
| North Macedonia | 16 | 0.0% |
| Northern Africa | 19 | 0.0% |
| Northern Europe | 325 | 0.3% |
| Oceania | 26 | 0.0% |
| Pakistan | 429 | 0.4% |
| Panama | 31 | 0.0% |
| Peru | 29 | 0.0% |
| Philippines | 153 | 0.1% |
| Portugal | 18 | 0.0% |
| Russia | 47 | 0.0% |
| Scotland | 21 | 0.0% |
| South Africa | 15 | 0.0% |
| South America | 182 | 0.2% |
| South Central Asia | 570 | 0.5% |
| South Eastern Asia | 184 | 0.2% |
| Southern Europe | 32 | 0.0% |
| Sri Lanka | 47 | 0.0% |
| Taiwan | 37 | 0.0% |
| Trinidad and Tobago | 13 | 0.0% |
| Turkey | 31 | 0.0% |
| Ukraine | 59 | 0.1% |
| Venezuela | 61 | 0.1% |
| Vietnam | 31 | 0.0% |
| Western Africa | 48 | 0.0% |
| Western Asia | 59 | 0.1% |
| Western Europe | 12 | 0.0% | View All 58 Rows |
Sex and Age in Bartow County
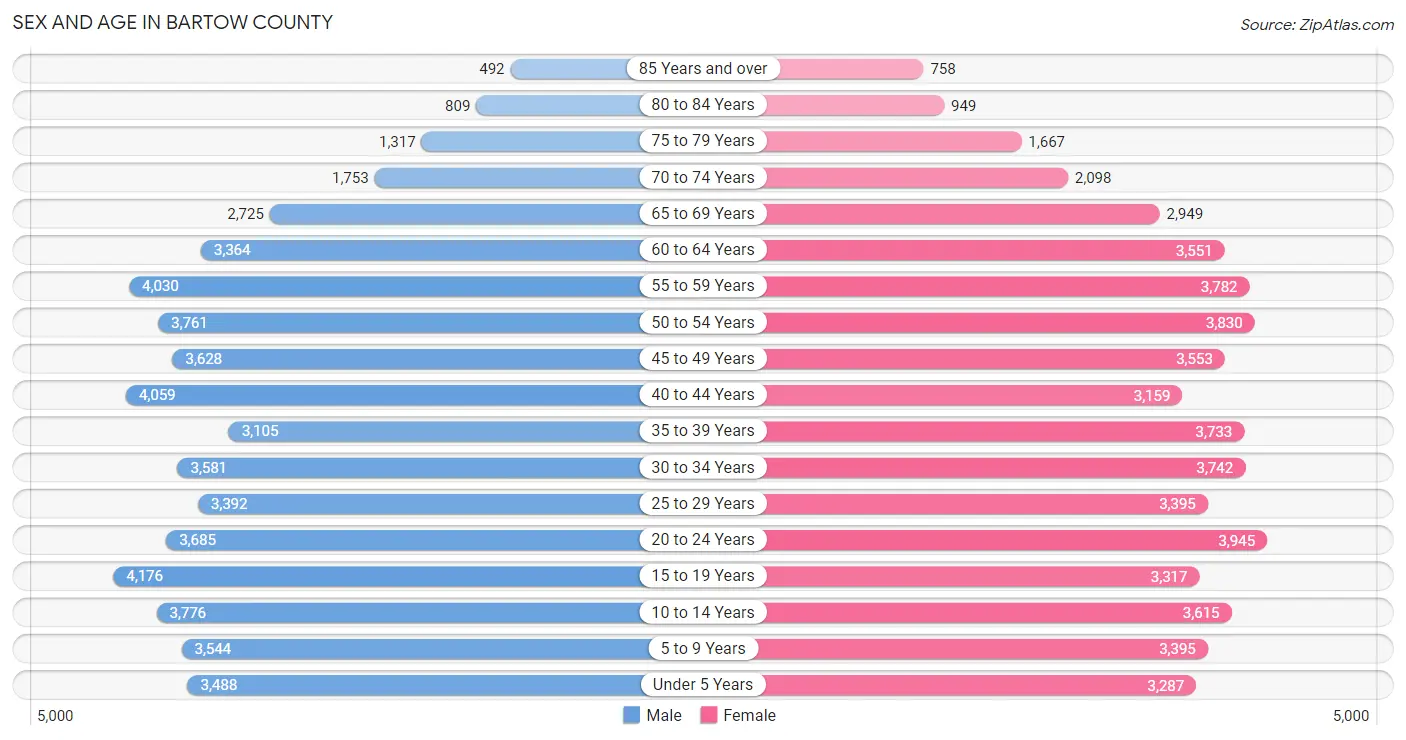
Sex and Age in Bartow County
The most populous age groups in Bartow County are 15 to 19 Years (4,176 | 7.6%) for men and 20 to 24 Years (3,945 | 7.2%) for women.
| Age Bracket | Male | Female |
| Under 5 Years | 3,488 (6.4%) | 3,287 (6.0%) |
| 5 to 9 Years | 3,544 (6.5%) | 3,395 (6.2%) |
| 10 to 14 Years | 3,776 (6.9%) | 3,615 (6.6%) |
| 15 to 19 Years | 4,176 (7.6%) | 3,317 (6.1%) |
| 20 to 24 Years | 3,685 (6.7%) | 3,945 (7.2%) |
| 25 to 29 Years | 3,392 (6.2%) | 3,395 (6.2%) |
| 30 to 34 Years | 3,581 (6.6%) | 3,742 (6.8%) |
| 35 to 39 Years | 3,105 (5.7%) | 3,733 (6.8%) |
| 40 to 44 Years | 4,059 (7.4%) | 3,159 (5.8%) |
| 45 to 49 Years | 3,628 (6.6%) | 3,553 (6.5%) |
| 50 to 54 Years | 3,761 (6.9%) | 3,830 (7.0%) |
| 55 to 59 Years | 4,030 (7.4%) | 3,782 (6.9%) |
| 60 to 64 Years | 3,364 (6.1%) | 3,551 (6.5%) |
| 65 to 69 Years | 2,725 (5.0%) | 2,949 (5.4%) |
| 70 to 74 Years | 1,753 (3.2%) | 2,098 (3.8%) |
| 75 to 79 Years | 1,317 (2.4%) | 1,667 (3.0%) |
| 80 to 84 Years | 809 (1.5%) | 949 (1.7%) |
| 85 Years and over | 492 (0.9%) | 758 (1.4%) |
| Total | 54,685 (100.0%) | 54,725 (100.0%) |
Families and Households in Bartow County
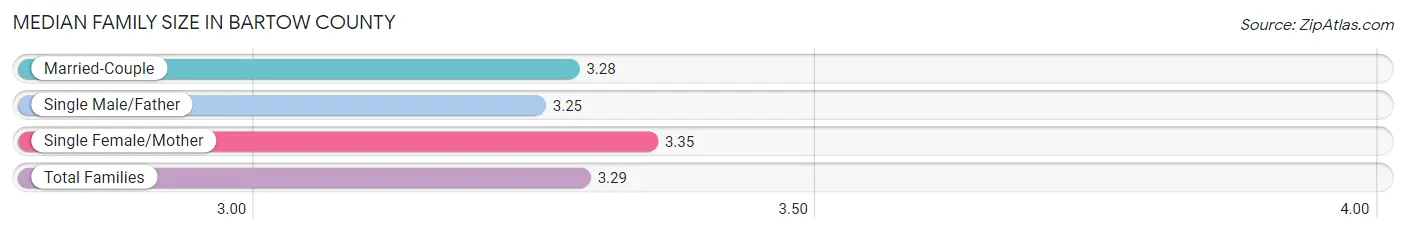
Median Family Size in Bartow County
The median family size in Bartow County is 3.29 persons per family, with single female/mother families (4,566 | 16.1%) accounting for the largest median family size of 3.35 persons per family. On the other hand, single male/father families (2,042 | 7.2%) represent the smallest median family size with 3.25 persons per family.
| Family Type | # Families | Family Size |
| Married-Couple | 21,848 (76.8%) | 3.28 |
| Single Male/Father | 2,042 (7.2%) | 3.25 |
| Single Female/Mother | 4,566 (16.1%) | 3.35 |
| Total Families | 28,456 (100.0%) | 3.29 |
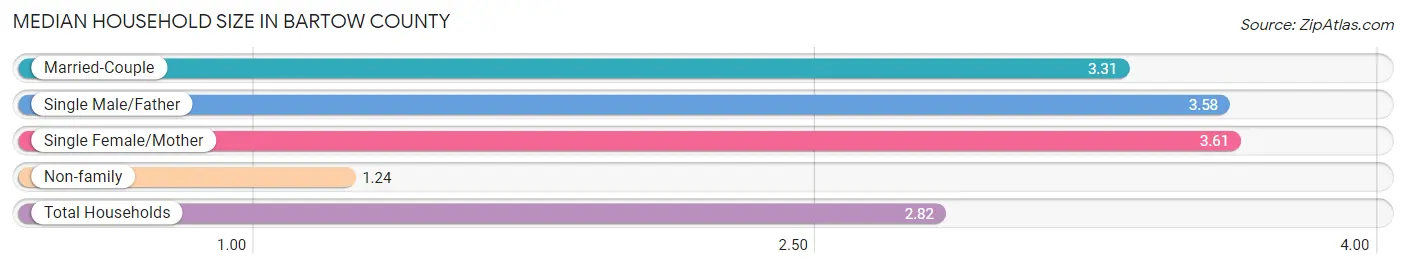
Median Household Size in Bartow County
The median household size in Bartow County is 2.82 persons per household, with single female/mother households (4,566 | 11.9%) accounting for the largest median household size of 3.61 persons per household. non-family households (9,973 | 26.0%) represent the smallest median household size with 1.24 persons per household.
| Household Type | # Households | Household Size |
| Married-Couple | 21,848 (56.9%) | 3.31 |
| Single Male/Father | 2,042 (5.3%) | 3.58 |
| Single Female/Mother | 4,566 (11.9%) | 3.61 |
| Non-family | 9,973 (26.0%) | 1.24 |
| Total Households | 38,429 (100.0%) | 2.82 |
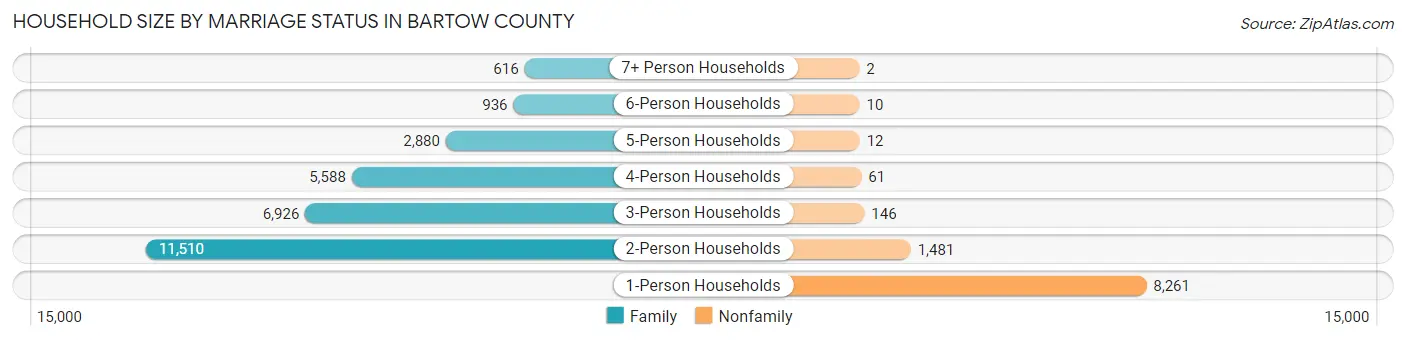
Household Size by Marriage Status in Bartow County
Out of a total of 38,429 households in Bartow County, 28,456 (74.1%) are family households, while 9,973 (26.0%) are nonfamily households. The most numerous type of family households are 2-person households, comprising 11,510, and the most common type of nonfamily households are 1-person households, comprising 8,261.
| Household Size | Family Households | Nonfamily Households |
| 1-Person Households | - | 8,261 (21.5%) |
| 2-Person Households | 11,510 (29.9%) | 1,481 (3.8%) |
| 3-Person Households | 6,926 (18.0%) | 146 (0.4%) |
| 4-Person Households | 5,588 (14.5%) | 61 (0.2%) |
| 5-Person Households | 2,880 (7.5%) | 12 (0.0%) |
| 6-Person Households | 936 (2.4%) | 10 (0.0%) |
| 7+ Person Households | 616 (1.6%) | 2 (0.0%) |
| Total | 28,456 (74.1%) | 9,973 (26.0%) |
Female Fertility in Bartow County
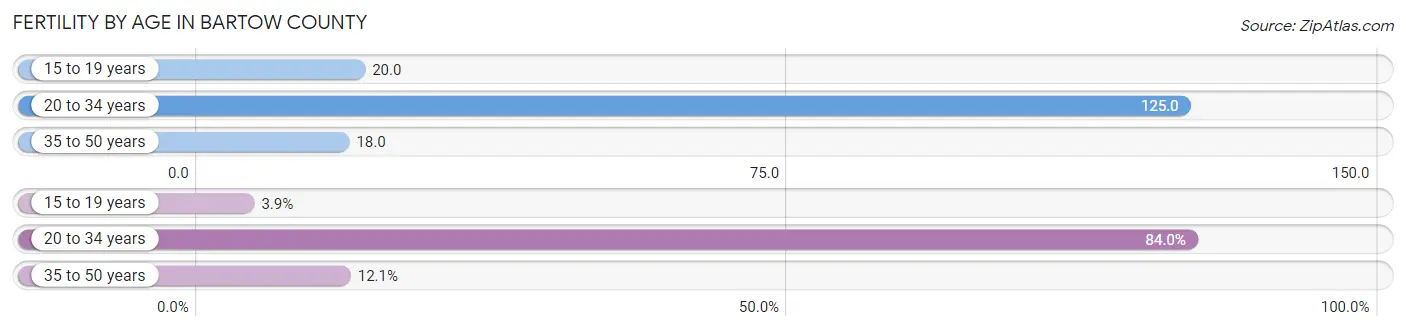
Fertility by Age in Bartow County
Average fertility rate in Bartow County is 64.0 births per 1,000 women. Women in the age bracket of 20 to 34 years have the highest fertility rate with 125.0 births per 1,000 women. Women in the age bracket of 20 to 34 years acount for 84.0% of all women with births.
| Age Bracket | Women with Births | Births / 1,000 Women |
| 15 to 19 years | 65 (3.9%) | 20.0 |
| 20 to 34 years | 1,386 (84.0%) | 125.0 |
| 35 to 50 years | 200 (12.1%) | 18.0 |
| Total | 1,651 (100.0%) | 64.0 |
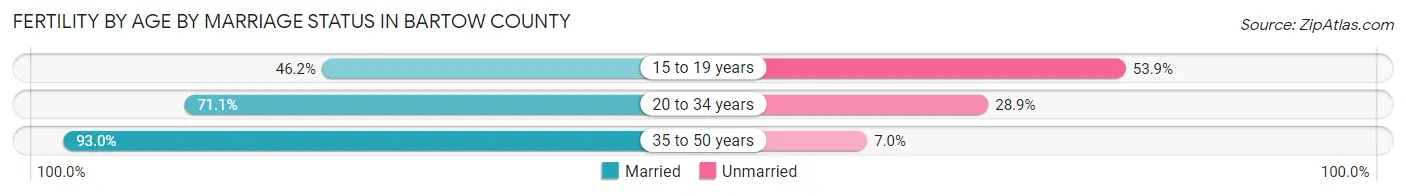
Fertility by Age by Marriage Status in Bartow County
72.8% of women with births (1,651) in Bartow County are married. The highest percentage of unmarried women with births falls into 15 to 19 years age bracket with 53.8% of them unmarried at the time of birth, while the lowest percentage of unmarried women with births belong to 35 to 50 years age bracket with 7.0% of them unmarried.
| Age Bracket | Married | Unmarried |
| 15 to 19 years | 30 (46.2%) | 35 (53.8%) |
| 20 to 34 years | 985 (71.1%) | 401 (28.9%) |
| 35 to 50 years | 186 (93.0%) | 14 (7.0%) |
| Total | 1,202 (72.8%) | 449 (27.2%) |
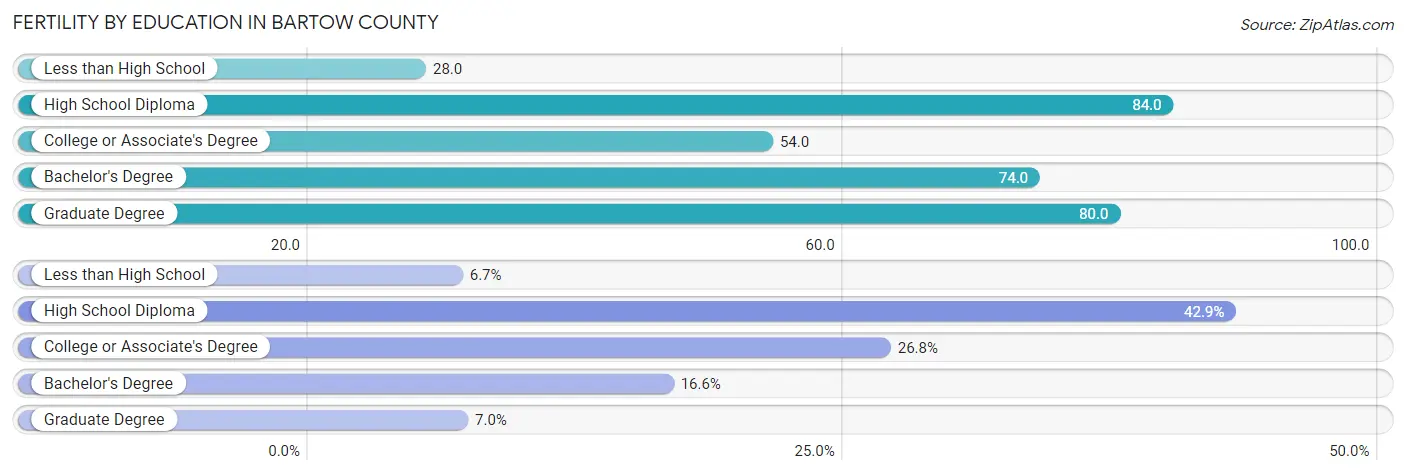
Fertility by Education in Bartow County
Average fertility rate in Bartow County is 64.0 births per 1,000 women. Women with the education attainment of high school diploma have the highest fertility rate of 84.0 births per 1,000 women, while women with the education attainment of less than high school have the lowest fertility at 28.0 births per 1,000 women. Women with the education attainment of high school diploma represent 42.9% of all women with births.
| Educational Attainment | Women with Births | Births / 1,000 Women |
| Less than High School | 111 (6.7%) | 28.0 |
| High School Diploma | 709 (42.9%) | 84.0 |
| College or Associate's Degree | 442 (26.8%) | 54.0 |
| Bachelor's Degree | 274 (16.6%) | 74.0 |
| Graduate Degree | 115 (7.0%) | 80.0 |
| Total | 1,651 (100.0%) | 64.0 |
Fertility by Education by Marriage Status in Bartow County
27.2% of women with births in Bartow County are unmarried. Women with the educational attainment of graduate degree are most likely to be married with 100.0% of them married at childbirth, while women with the educational attainment of less than high school are least likely to be married with 41.4% of them unmarried at childbirth.

| Educational Attainment | Married | Unmarried |
| Less than High School | 65 (58.6%) | 46 (41.4%) |
| High School Diploma | 467 (65.9%) | 242 (34.1%) |
| College or Associate's Degree | 344 (77.8%) | 98 (22.2%) |
| Bachelor's Degree | 211 (77.0%) | 63 (23.0%) |
| Graduate Degree | 115 (100.0%) | 0 (0.0%) |
| Total | 1,202 (72.8%) | 449 (27.2%) |
Income in Bartow County
Income Overview in Bartow County
Per Capita Income in Bartow County is $32,102, while median incomes of families and households are $87,480 and $74,812 respectively.
| Characteristic | Number | Measure |
| Per Capita Income | 109,410 | $32,102 |
| Median Family Income | 28,456 | $87,480 |
| Mean Family Income | 28,456 | $100,879 |
| Median Household Income | 38,429 | $74,812 |
| Mean Household Income | 38,429 | $89,775 |
| Income Deficit | 28,456 | $11,288 |
| Wage / Income Gap (%) | 109,410 | 31.44% |
| Wage / Income Gap ($) | 109,410 | 68.56¢ per $1 |
| Gini / Inequality Index | 109,410 | 0.41 |
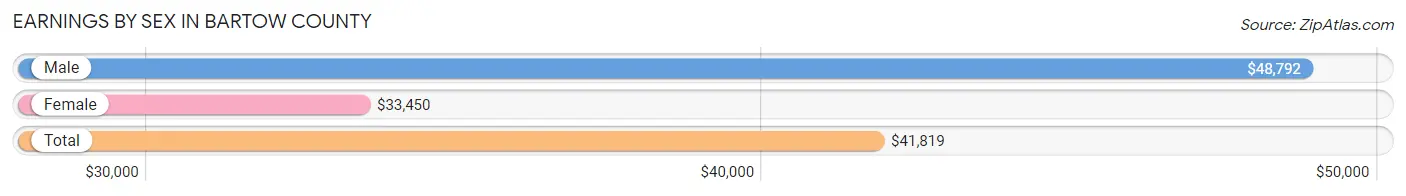
Earnings by Sex in Bartow County
Average Earnings in Bartow County are $41,819, $48,792 for men and $33,450 for women, a difference of 31.4%.
| Sex | Number | Average Earnings |
| Male | 30,606 (54.2%) | $48,792 |
| Female | 25,900 (45.8%) | $33,450 |
| Total | 56,506 (100.0%) | $41,819 |
Earnings by Sex by Income Bracket in Bartow County
The most common earnings brackets in Bartow County are $75,000 to $99,999 for men (3,874 | 12.7%) and $25,000 to $29,999 for women (2,433 | 9.4%).
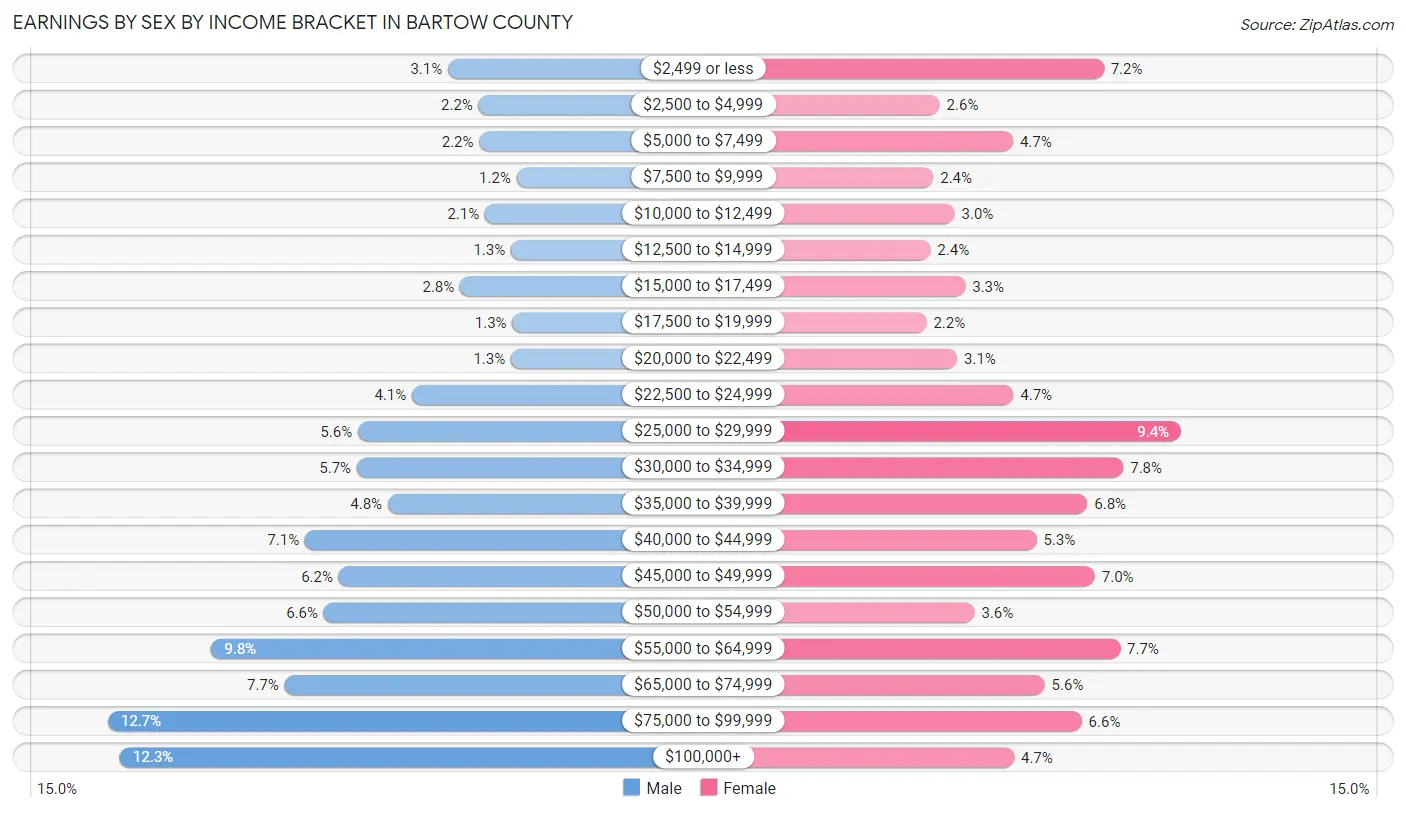
| Income | Male | Female |
| $2,499 or less | 948 (3.1%) | 1,871 (7.2%) |
| $2,500 to $4,999 | 687 (2.2%) | 675 (2.6%) |
| $5,000 to $7,499 | 678 (2.2%) | 1,210 (4.7%) |
| $7,500 to $9,999 | 358 (1.2%) | 630 (2.4%) |
| $10,000 to $12,499 | 632 (2.1%) | 784 (3.0%) |
| $12,500 to $14,999 | 408 (1.3%) | 609 (2.4%) |
| $15,000 to $17,499 | 846 (2.8%) | 862 (3.3%) |
| $17,500 to $19,999 | 394 (1.3%) | 581 (2.2%) |
| $20,000 to $22,499 | 406 (1.3%) | 804 (3.1%) |
| $22,500 to $24,999 | 1,258 (4.1%) | 1,212 (4.7%) |
| $25,000 to $29,999 | 1,724 (5.6%) | 2,433 (9.4%) |
| $30,000 to $34,999 | 1,733 (5.7%) | 2,012 (7.8%) |
| $35,000 to $39,999 | 1,465 (4.8%) | 1,750 (6.8%) |
| $40,000 to $44,999 | 2,180 (7.1%) | 1,380 (5.3%) |
| $45,000 to $49,999 | 1,887 (6.2%) | 1,804 (7.0%) |
| $50,000 to $54,999 | 2,017 (6.6%) | 929 (3.6%) |
| $55,000 to $64,999 | 2,985 (9.8%) | 1,988 (7.7%) |
| $65,000 to $74,999 | 2,355 (7.7%) | 1,439 (5.6%) |
| $75,000 to $99,999 | 3,874 (12.7%) | 1,709 (6.6%) |
| $100,000+ | 3,771 (12.3%) | 1,218 (4.7%) |
| Total | 30,606 (100.0%) | 25,900 (100.0%) |
Earnings by Sex by Educational Attainment in Bartow County
Average earnings in Bartow County are $53,024 for men and $37,073 for women, a difference of 30.1%. Men with an educational attainment of graduate degree enjoy the highest average annual earnings of $84,292, while those with less than high school education earn the least with $40,612. Women with an educational attainment of graduate degree earn the most with the average annual earnings of $62,829, while those with less than high school education have the smallest earnings of $24,499.
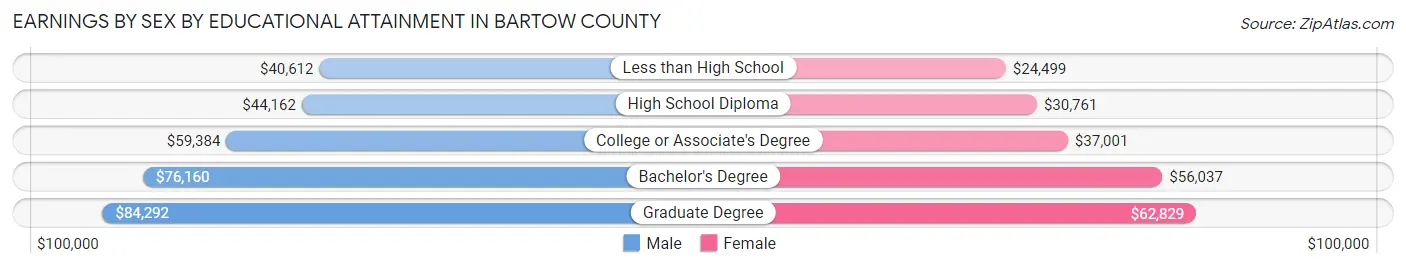
| Educational Attainment | Male Income | Female Income |
| Less than High School | $40,612 | $24,499 |
| High School Diploma | $44,162 | $30,761 |
| College or Associate's Degree | $59,384 | $37,001 |
| Bachelor's Degree | $76,160 | $56,037 |
| Graduate Degree | $84,292 | $62,829 |
| Total | $53,024 | $37,073 |
Family Income in Bartow County
Family Income Brackets in Bartow County
According to the Bartow County family income data, there are 6,972 families falling into the $100,000 to $149,999 income range, which is the most common income bracket and makes up 24.5% of all families. Conversely, the $10,000 to $14,999 income bracket is the least frequent group with only 341 families (1.2%) belonging to this category.
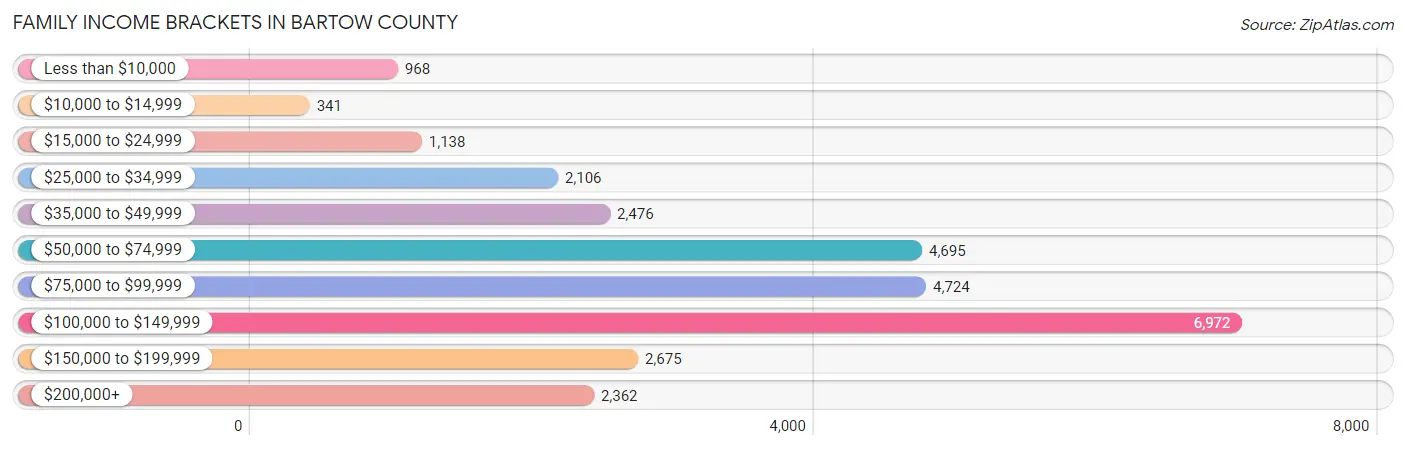
| Income Bracket | # Families | % Families |
| Less than $10,000 | 968 | 3.4% |
| $10,000 to $14,999 | 341 | 1.2% |
| $15,000 to $24,999 | 1,138 | 4.0% |
| $25,000 to $34,999 | 2,106 | 7.4% |
| $35,000 to $49,999 | 2,476 | 8.7% |
| $50,000 to $74,999 | 4,695 | 16.5% |
| $75,000 to $99,999 | 4,724 | 16.6% |
| $100,000 to $149,999 | 6,972 | 24.5% |
| $150,000 to $199,999 | 2,675 | 9.4% |
| $200,000+ | 2,362 | 8.3% |
Family Income by Famaliy Size in Bartow County
5-person families (2,491 | 8.7%) account for the highest median family income in Bartow County with $103,295 per family, while 2-person families (12,133 | 42.6%) have the highest median income of $38,083 per family member.
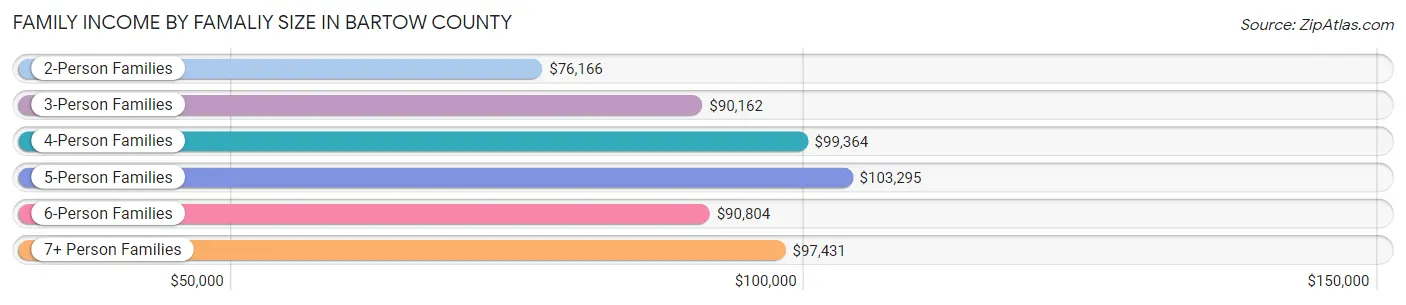
| Income Bracket | # Families | Median Income |
| 2-Person Families | 12,133 (42.6%) | $76,166 |
| 3-Person Families | 7,024 (24.7%) | $90,162 |
| 4-Person Families | 5,424 (19.1%) | $99,364 |
| 5-Person Families | 2,491 (8.7%) | $103,295 |
| 6-Person Families | 897 (3.2%) | $90,804 |
| 7+ Person Families | 487 (1.7%) | $97,431 |
| Total | 28,456 (100.0%) | $87,480 |
Family Income by Number of Earners in Bartow County
The median family income in Bartow County is $87,480, with families comprising 3+ earners (3,550) having the highest median family income of $137,419, while families with no earners (4,016) have the lowest median family income of $40,378, accounting for 12.5% and 14.1% of families, respectively.
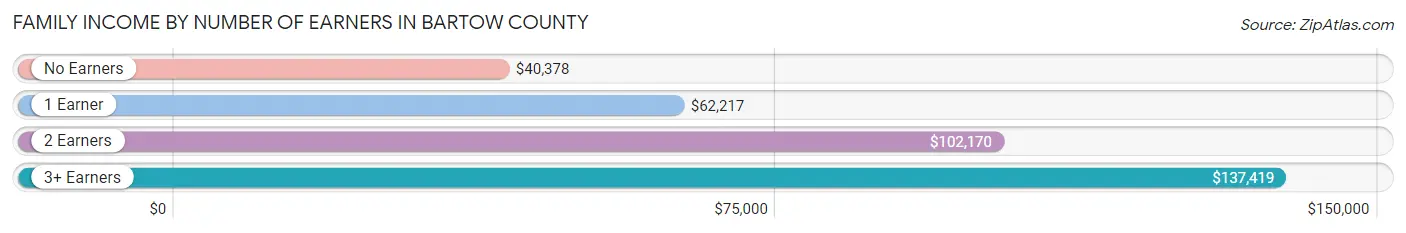
| Number of Earners | # Families | Median Income |
| No Earners | 4,016 (14.1%) | $40,378 |
| 1 Earner | 8,427 (29.6%) | $62,217 |
| 2 Earners | 12,463 (43.8%) | $102,170 |
| 3+ Earners | 3,550 (12.5%) | $137,419 |
| Total | 28,456 (100.0%) | $87,480 |
Household Income in Bartow County
Household Income Brackets in Bartow County
With 7,993 households falling in the category, the $100,000 to $149,999 income range is the most frequent in Bartow County, accounting for 20.8% of all households. In contrast, only 1,038 households (2.7%) fall into the $10,000 to $14,999 income bracket, making it the least populous group.
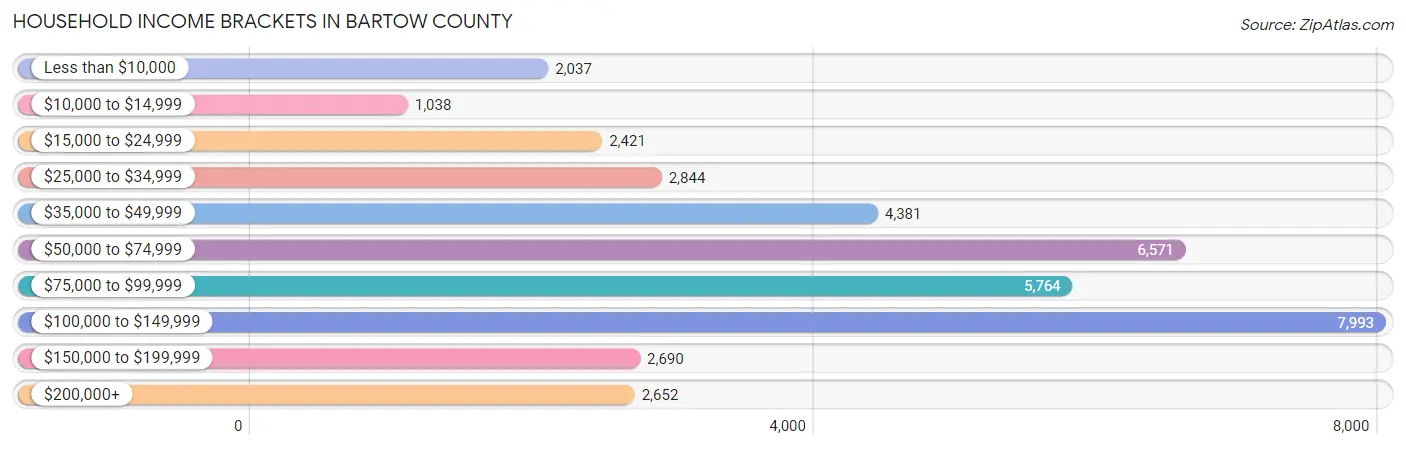
| Income Bracket | # Households | % Households |
| Less than $10,000 | 2,037 | 5.3% |
| $10,000 to $14,999 | 1,038 | 2.7% |
| $15,000 to $24,999 | 2,421 | 6.3% |
| $25,000 to $34,999 | 2,844 | 7.4% |
| $35,000 to $49,999 | 4,381 | 11.4% |
| $50,000 to $74,999 | 6,571 | 17.1% |
| $75,000 to $99,999 | 5,764 | 15.0% |
| $100,000 to $149,999 | 7,993 | 20.8% |
| $150,000 to $199,999 | 2,690 | 7.0% |
| $200,000+ | 2,652 | 6.9% |
Household Income by Householder Age in Bartow County
The median household income in Bartow County is $74,812, with the highest median household income of $89,560 found in the 45 to 64 years age bracket for the primary householder. A total of 15,890 households (41.3%) fall into this category. Meanwhile, the 65+ years age bracket for the primary householder has the lowest median household income of $42,903, with 8,570 households (22.3%) in this group.
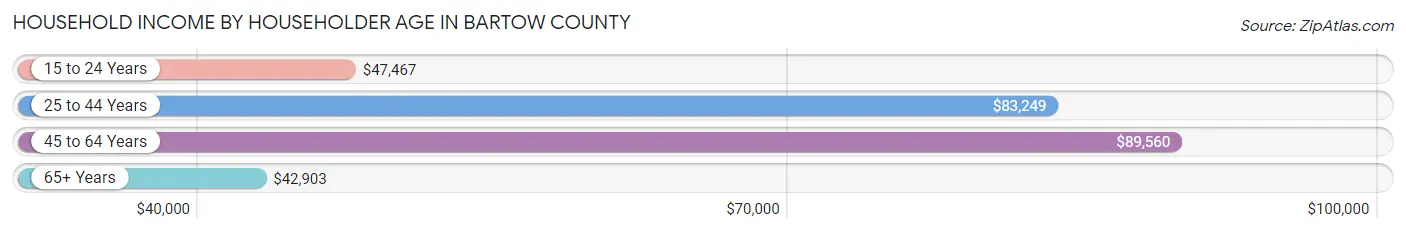
| Income Bracket | # Households | Median Income |
| 15 to 24 Years | 925 (2.4%) | $47,467 |
| 25 to 44 Years | 13,044 (33.9%) | $83,249 |
| 45 to 64 Years | 15,890 (41.3%) | $89,560 |
| 65+ Years | 8,570 (22.3%) | $42,903 |
| Total | 38,429 (100.0%) | $74,812 |
Poverty in Bartow County
Income Below Poverty by Sex and Age in Bartow County
With 10.7% poverty level for males and 10.9% for females among the residents of Bartow County, 15 year old males and 18 to 24 year old females are the most vulnerable to poverty, with 240 males (22.7%) and 749 females (14.5%) in their respective age groups living below the poverty level.
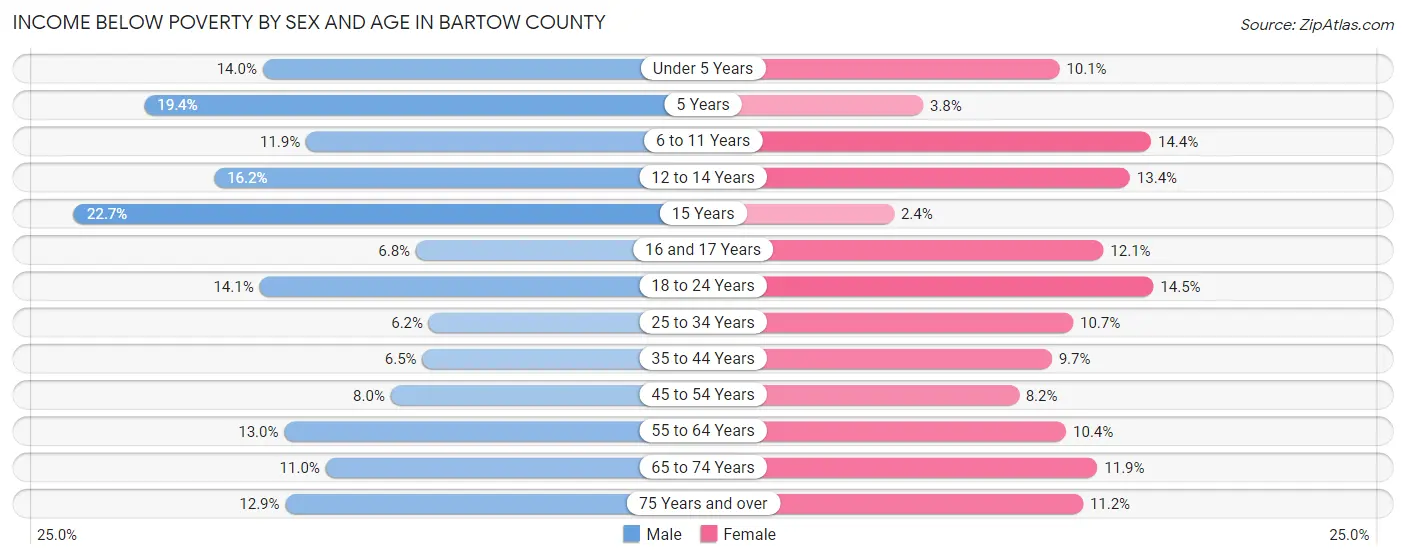
| Age Bracket | Male | Female |
| Under 5 Years | 480 (14.0%) | 325 (10.1%) |
| 5 Years | 90 (19.4%) | 23 (3.8%) |
| 6 to 11 Years | 527 (11.9%) | 600 (14.3%) |
| 12 to 14 Years | 376 (16.2%) | 287 (13.4%) |
| 15 Years | 240 (22.7%) | 16 (2.4%) |
| 16 and 17 Years | 109 (6.8%) | 170 (12.1%) |
| 18 to 24 Years | 720 (14.1%) | 749 (14.5%) |
| 25 to 34 Years | 425 (6.2%) | 762 (10.7%) |
| 35 to 44 Years | 460 (6.5%) | 668 (9.7%) |
| 45 to 54 Years | 585 (8.0%) | 604 (8.2%) |
| 55 to 64 Years | 950 (13.0%) | 763 (10.4%) |
| 65 to 74 Years | 490 (11.0%) | 589 (11.9%) |
| 75 Years and over | 332 (12.9%) | 360 (11.2%) |
| Total | 5,784 (10.7%) | 5,916 (10.9%) |
Income Above Poverty by Sex and Age in Bartow County
According to the poverty statistics in Bartow County, males aged 25 to 34 years and females aged 15 years are the age groups that are most secure financially, with 93.8% of males and 97.6% of females in these age groups living above the poverty line.
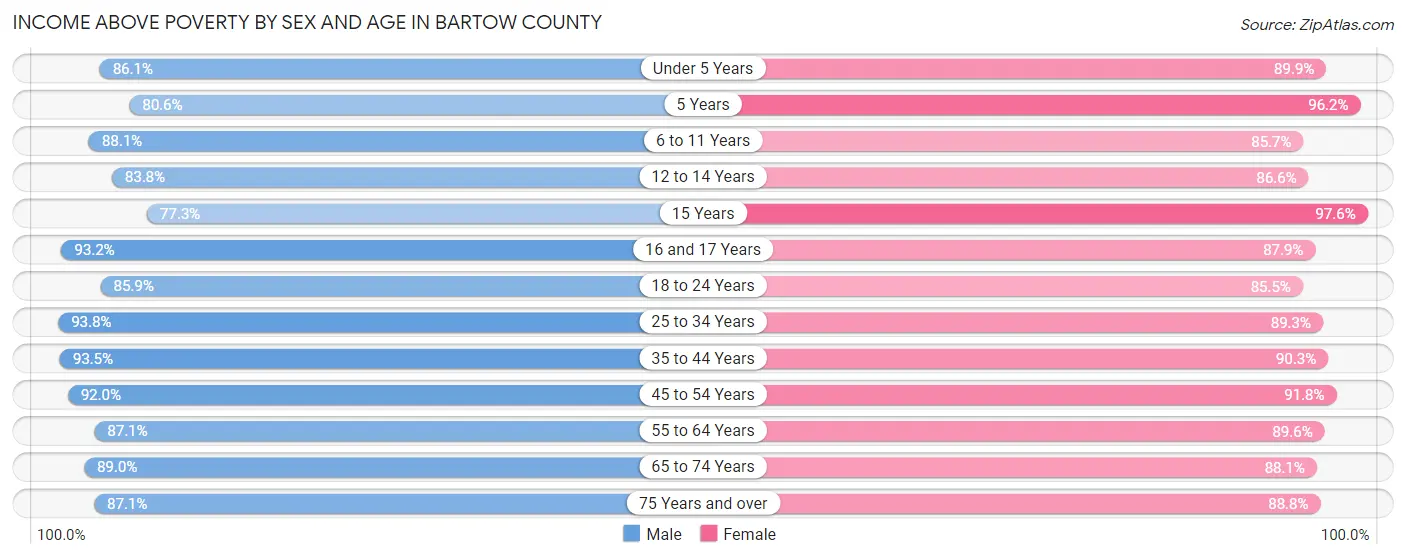
| Age Bracket | Male | Female |
| Under 5 Years | 2,960 (86.1%) | 2,892 (89.9%) |
| 5 Years | 373 (80.6%) | 587 (96.2%) |
| 6 to 11 Years | 3,885 (88.1%) | 3,580 (85.7%) |
| 12 to 14 Years | 1,945 (83.8%) | 1,859 (86.6%) |
| 15 Years | 817 (77.3%) | 646 (97.6%) |
| 16 and 17 Years | 1,485 (93.2%) | 1,230 (87.9%) |
| 18 to 24 Years | 4,388 (85.9%) | 4,430 (85.5%) |
| 25 to 34 Years | 6,391 (93.8%) | 6,340 (89.3%) |
| 35 to 44 Years | 6,578 (93.5%) | 6,191 (90.3%) |
| 45 to 54 Years | 6,717 (92.0%) | 6,750 (91.8%) |
| 55 to 64 Years | 6,384 (87.1%) | 6,569 (89.6%) |
| 65 to 74 Years | 3,953 (89.0%) | 4,376 (88.1%) |
| 75 Years and over | 2,242 (87.1%) | 2,856 (88.8%) |
| Total | 48,118 (89.3%) | 48,306 (89.1%) |
Income Below Poverty Among Married-Couple Families in Bartow County
The poverty statistics for married-couple families in Bartow County show that 4.9% or 1,070 of the total 21,848 families live below the poverty line. Families with 3 or 4 children have the highest poverty rate of 10.7%, comprising of 199 families. On the other hand, families with 5 or more children have the lowest poverty rate of 0.0%, which includes 0 families.
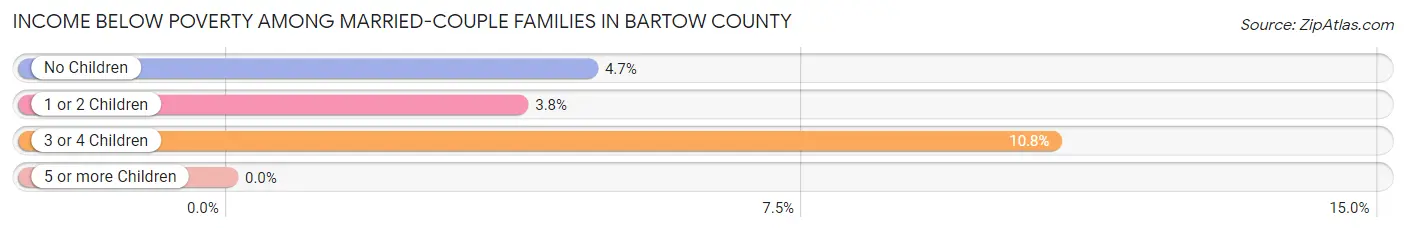
| Children | Above Poverty | Below Poverty |
| No Children | 12,029 (95.3%) | 593 (4.7%) |
| 1 or 2 Children | 7,066 (96.2%) | 278 (3.8%) |
| 3 or 4 Children | 1,653 (89.2%) | 199 (10.7%) |
| 5 or more Children | 30 (100.0%) | 0 (0.0%) |
| Total | 20,778 (95.1%) | 1,070 (4.9%) |
Income Below Poverty Among Single-Parent Households in Bartow County
According to the poverty data in Bartow County, 16.7% or 341 single-father households and 21.0% or 960 single-mother households are living below the poverty line. Among single-father households, those with 1 or 2 children have the highest poverty rate, with 191 households (20.4%) experiencing poverty. Likewise, among single-mother households, those with 3 or 4 children have the highest poverty rate, with 256 households (55.9%) falling below the poverty line.
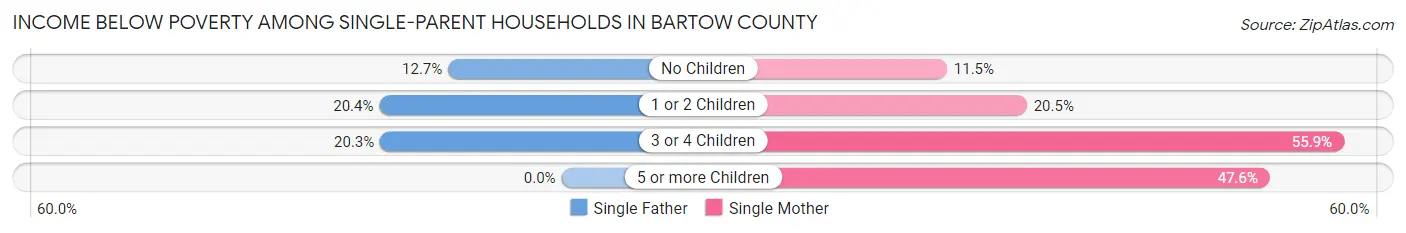
| Children | Single Father | Single Mother |
| No Children | 120 (12.7%) | 191 (11.5%) |
| 1 or 2 Children | 191 (20.4%) | 493 (20.5%) |
| 3 or 4 Children | 30 (20.3%) | 256 (55.9%) |
| 5 or more Children | 0 (0.0%) | 20 (47.6%) |
| Total | 341 (16.7%) | 960 (21.0%) |
Income Below Poverty Among Married-Couple vs Single-Parent Households in Bartow County
The poverty data for Bartow County shows that 1,070 of the married-couple family households (4.9%) and 1,301 of the single-parent households (19.7%) are living below the poverty level. Within the married-couple family households, those with 3 or 4 children have the highest poverty rate, with 199 households (10.7%) falling below the poverty line. Among the single-parent households, those with 3 or 4 children have the highest poverty rate, with 286 household (47.2%) living below poverty.
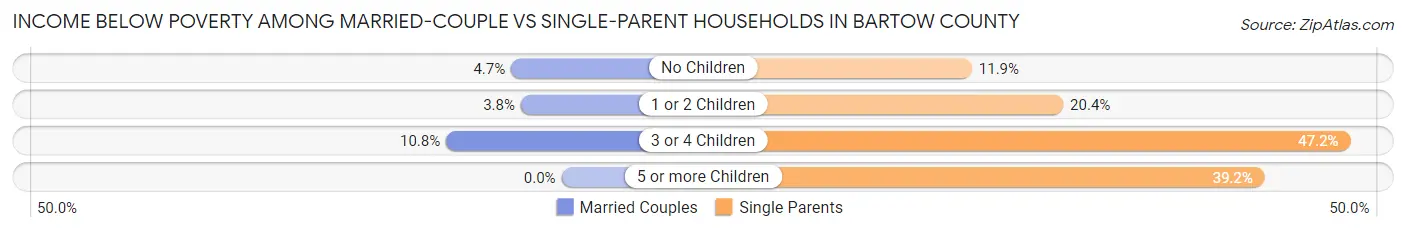
| Children | Married-Couple Families | Single-Parent Households |
| No Children | 593 (4.7%) | 311 (11.9%) |
| 1 or 2 Children | 278 (3.8%) | 684 (20.4%) |
| 3 or 4 Children | 199 (10.7%) | 286 (47.2%) |
| 5 or more Children | 0 (0.0%) | 20 (39.2%) |
| Total | 1,070 (4.9%) | 1,301 (19.7%) |
Employment Characteristics in Bartow County
Employment by Class of Employer in Bartow County
Among the 51,272 employed individuals in Bartow County, private company employees (37,559 | 73.3%), local government employees (4,928 | 9.6%), and self-employed (not incorporated) (2,490 | 4.9%) make up the most common classes of employment.
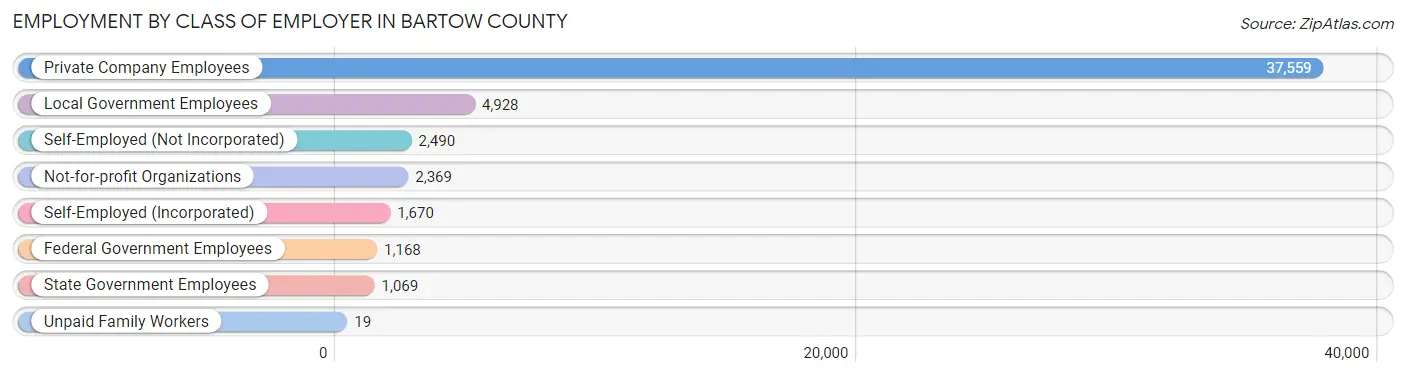
| Employer Class | # Employees | % Employees |
| Private Company Employees | 37,559 | 73.3% |
| Self-Employed (Incorporated) | 1,670 | 3.3% |
| Self-Employed (Not Incorporated) | 2,490 | 4.9% |
| Not-for-profit Organizations | 2,369 | 4.6% |
| Local Government Employees | 4,928 | 9.6% |
| State Government Employees | 1,069 | 2.1% |
| Federal Government Employees | 1,168 | 2.3% |
| Unpaid Family Workers | 19 | 0.0% |
| Total | 51,272 | 100.0% |
Employment Status by Age in Bartow County
According to the labor force statistics for Bartow County, out of the total population over 16 years of age (86,585), 63.8% or 55,241 individuals are in the labor force, with 5.5% or 3,038 of them unemployed. The age group with the highest labor force participation rate is 35 to 44 years, with 84.3% or 11,849 individuals in the labor force. Within the labor force, the 16 to 19 years age range has the highest percentage of unemployed individuals, with 19.4% or 515 of them being unemployed.
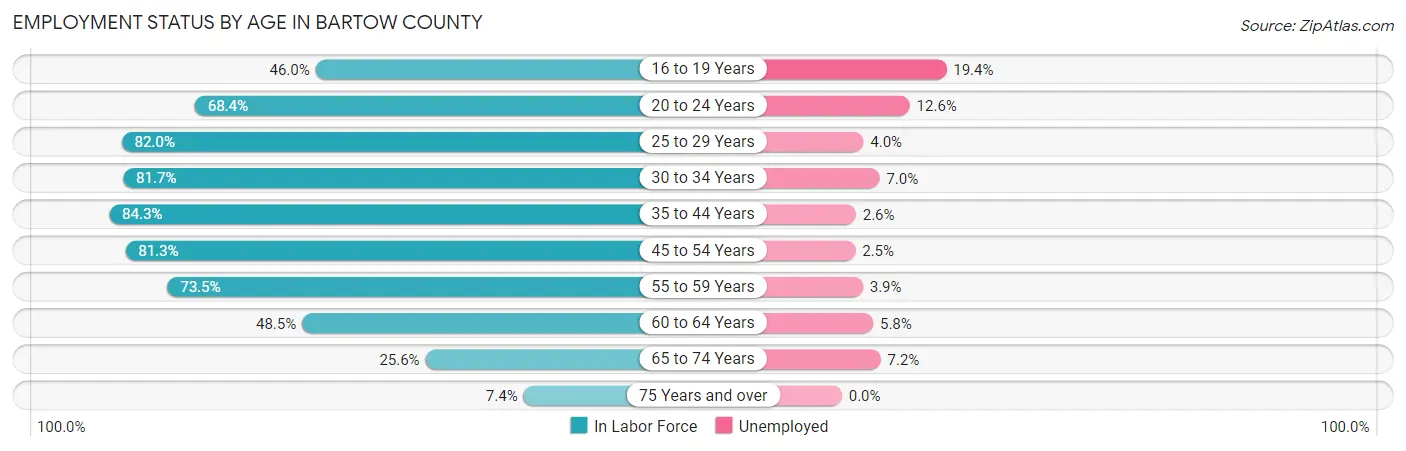
| Age Bracket | In Labor Force | Unemployed |
| 16 to 19 Years | 2,656 (46.0%) | 515 (19.4%) |
| 20 to 24 Years | 5,219 (68.4%) | 658 (12.6%) |
| 25 to 29 Years | 5,565 (82.0%) | 223 (4.0%) |
| 30 to 34 Years | 5,983 (81.7%) | 419 (7.0%) |
| 35 to 44 Years | 11,849 (84.3%) | 308 (2.6%) |
| 45 to 54 Years | 12,010 (81.3%) | 300 (2.5%) |
| 55 to 59 Years | 5,742 (73.5%) | 224 (3.9%) |
| 60 to 64 Years | 3,354 (48.5%) | 195 (5.8%) |
| 65 to 74 Years | 2,438 (25.6%) | 176 (7.2%) |
| 75 Years and over | 443 (7.4%) | 0 (0.0%) |
| Total | 55,241 (63.8%) | 3,038 (5.5%) |
Employment Status by Educational Attainment in Bartow County
According to labor force statistics for Bartow County, 77.2% of individuals (44,517) out of the total population between 25 and 64 years of age (57,665) are in the labor force, with 3.7% or 1,647 of them being unemployed. The group with the highest labor force participation rate are those with the educational attainment of bachelor's degree or higher, with 89.3% or 11,302 individuals in the labor force. Within the labor force, individuals with college / associate degree education have the highest percentage of unemployment, with 4.3% or 596 of them being unemployed.
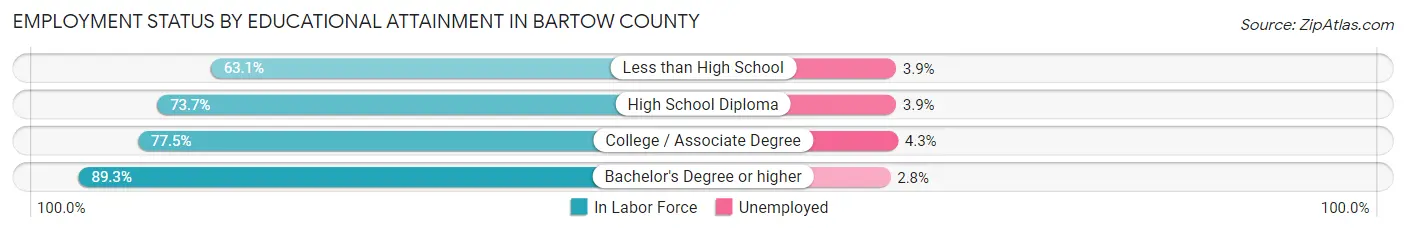
| Educational Attainment | In Labor Force | Unemployed |
| Less than High School | 3,923 (63.1%) | 242 (3.9%) |
| High School Diploma | 15,416 (73.7%) | 816 (3.9%) |
| College / Associate Degree | 13,853 (77.5%) | 769 (4.3%) |
| Bachelor's Degree or higher | 11,302 (89.3%) | 354 (2.8%) |
| Total | 44,517 (77.2%) | 2,134 (3.7%) |
Employment Occupations by Sex in Bartow County
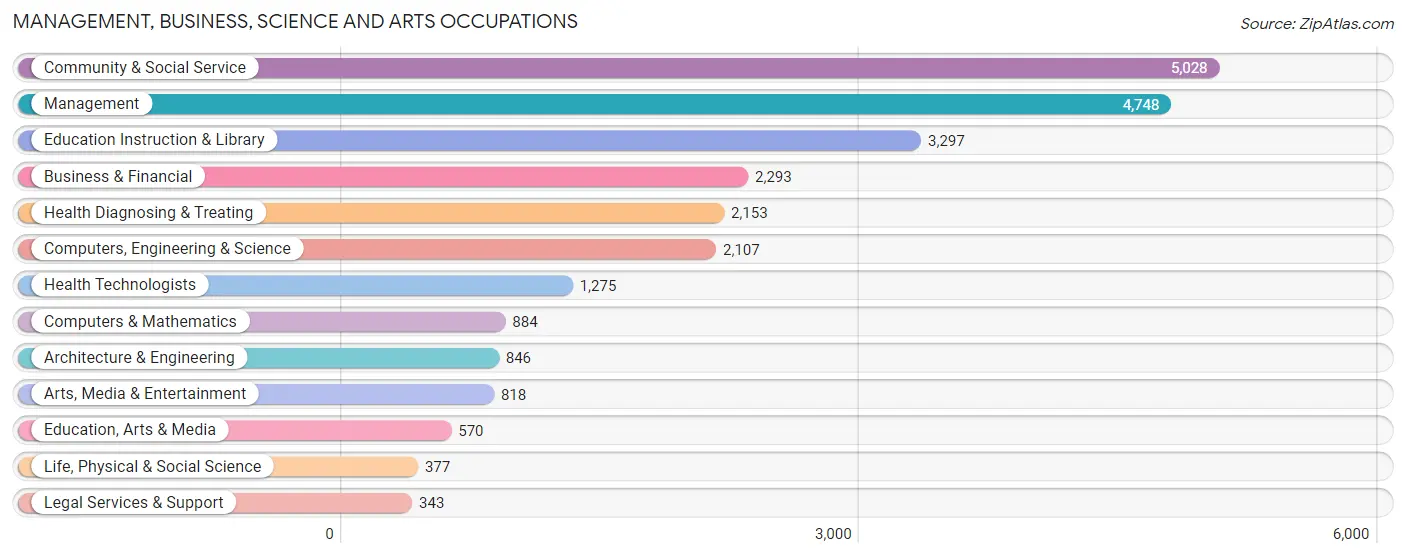
Management, Business, Science and Arts Occupations
The most common Management, Business, Science and Arts occupations in Bartow County are Community & Social Service (5,028 | 9.6%), Management (4,748 | 9.1%), Education Instruction & Library (3,297 | 6.3%), Business & Financial (2,293 | 4.4%), and Health Diagnosing & Treating (2,153 | 4.1%).
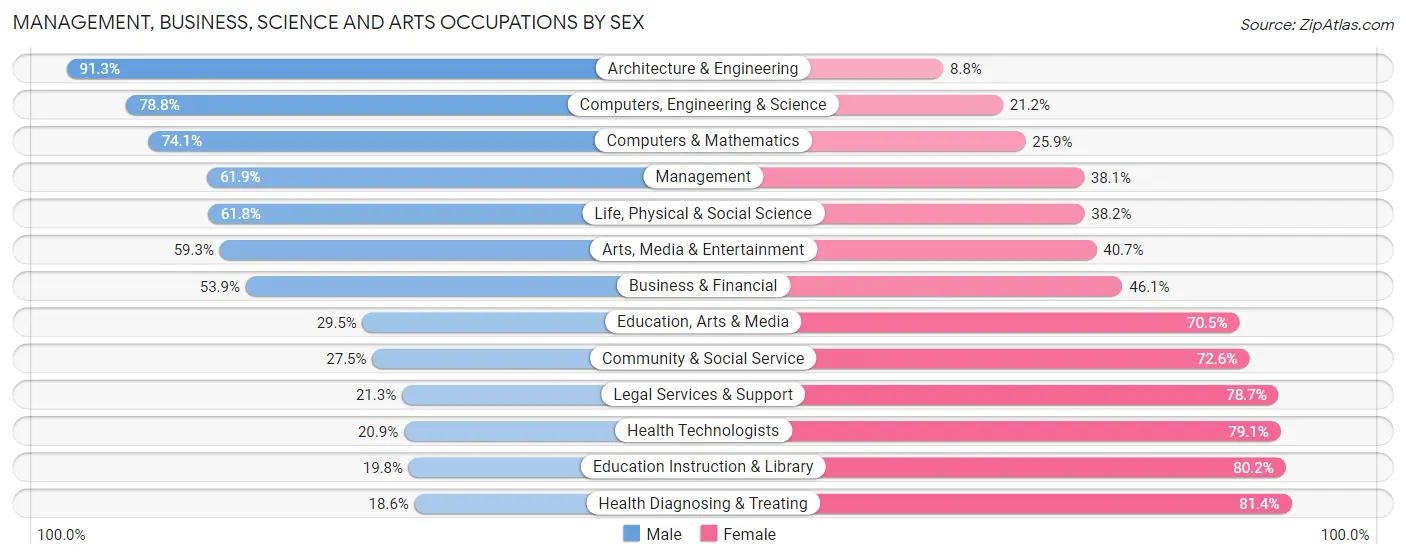
Management, Business, Science and Arts Occupations by Sex
Within the Management, Business, Science and Arts occupations in Bartow County, the most male-oriented occupations are Architecture & Engineering (91.2%), Computers, Engineering & Science (78.8%), and Computers & Mathematics (74.1%), while the most female-oriented occupations are Health Diagnosing & Treating (81.4%), Education Instruction & Library (80.2%), and Health Technologists (79.1%).
| Occupation | Male | Female |
| Management | 2,939 (61.9%) | 1,809 (38.1%) |
| Business & Financial | 1,235 (53.9%) | 1,058 (46.1%) |
| Computers, Engineering & Science | 1,660 (78.8%) | 447 (21.2%) |
| Computers & Mathematics | 655 (74.1%) | 229 (25.9%) |
| Architecture & Engineering | 772 (91.2%) | 74 (8.7%) |
| Life, Physical & Social Science | 233 (61.8%) | 144 (38.2%) |
| Community & Social Service | 1,380 (27.5%) | 3,648 (72.6%) |
| Education, Arts & Media | 168 (29.5%) | 402 (70.5%) |
| Legal Services & Support | 73 (21.3%) | 270 (78.7%) |
| Education Instruction & Library | 654 (19.8%) | 2,643 (80.2%) |
| Arts, Media & Entertainment | 485 (59.3%) | 333 (40.7%) |
| Health Diagnosing & Treating | 401 (18.6%) | 1,752 (81.4%) |
| Health Technologists | 266 (20.9%) | 1,009 (79.1%) |
| Total (Category) | 7,615 (46.6%) | 8,714 (53.4%) |
| Total (Overall) | 28,458 (54.6%) | 23,674 (45.4%) |
Services Occupations
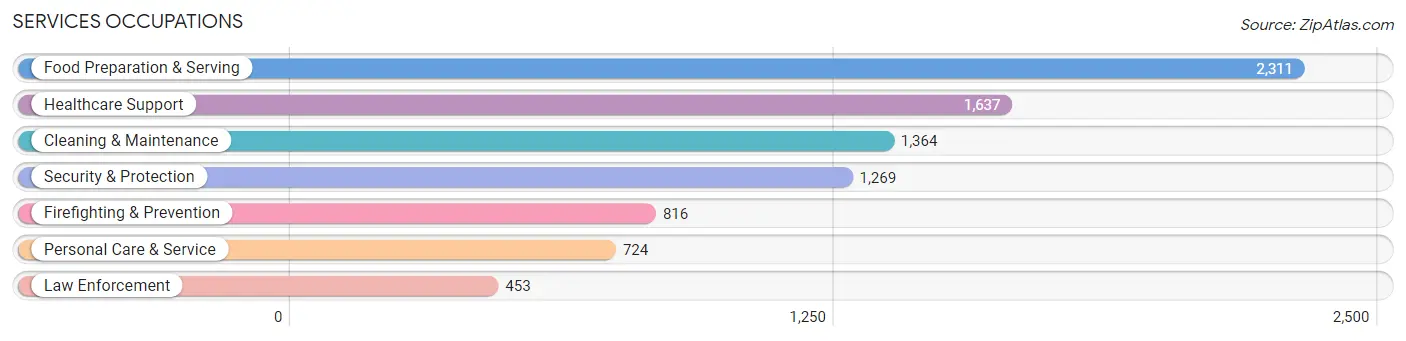
The most common Services occupations in Bartow County are Food Preparation & Serving (2,311 | 4.4%), Healthcare Support (1,637 | 3.1%), Cleaning & Maintenance (1,364 | 2.6%), Security & Protection (1,269 | 2.4%), and Firefighting & Prevention (816 | 1.6%).
Services Occupations by Sex
Within the Services occupations in Bartow County, the most male-oriented occupations are Firefighting & Prevention (91.4%), Security & Protection (83.0%), and Law Enforcement (67.8%), while the most female-oriented occupations are Personal Care & Service (95.3%), Healthcare Support (93.5%), and Food Preparation & Serving (60.8%).
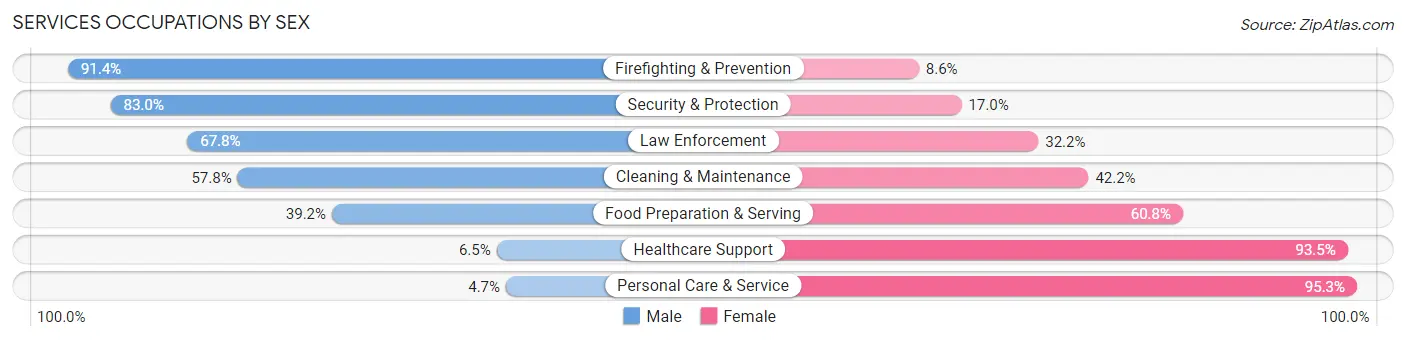
| Occupation | Male | Female |
| Healthcare Support | 107 (6.5%) | 1,530 (93.5%) |
| Security & Protection | 1,053 (83.0%) | 216 (17.0%) |
| Firefighting & Prevention | 746 (91.4%) | 70 (8.6%) |
| Law Enforcement | 307 (67.8%) | 146 (32.2%) |
| Food Preparation & Serving | 905 (39.2%) | 1,406 (60.8%) |
| Cleaning & Maintenance | 789 (57.8%) | 575 (42.2%) |
| Personal Care & Service | 34 (4.7%) | 690 (95.3%) |
| Total (Category) | 2,888 (39.5%) | 4,417 (60.5%) |
| Total (Overall) | 28,458 (54.6%) | 23,674 (45.4%) |
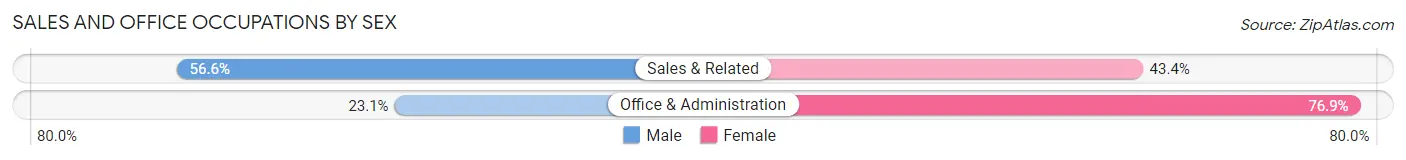
Sales and Office Occupations
The most common Sales and Office occupations in Bartow County are Office & Administration (6,753 | 13.0%), and Sales & Related (6,520 | 12.5%).

Sales and Office Occupations by Sex
| Occupation | Male | Female |
| Sales & Related | 3,690 (56.6%) | 2,830 (43.4%) |
| Office & Administration | 1,560 (23.1%) | 5,193 (76.9%) |
| Total (Category) | 5,250 (39.6%) | 8,023 (60.5%) |
| Total (Overall) | 28,458 (54.6%) | 23,674 (45.4%) |
Natural Resources, Construction and Maintenance Occupations
The most common Natural Resources, Construction and Maintenance occupations in Bartow County are Construction & Extraction (3,179 | 6.1%), Installation, Maintenance & Repair (2,366 | 4.5%), and Farming, Fishing & Forestry (178 | 0.3%).
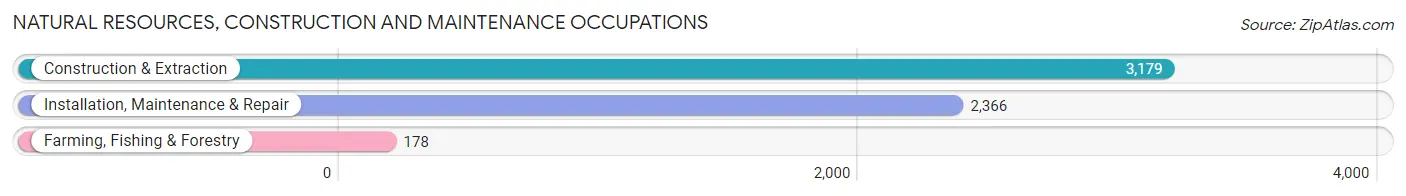
Natural Resources, Construction and Maintenance Occupations by Sex
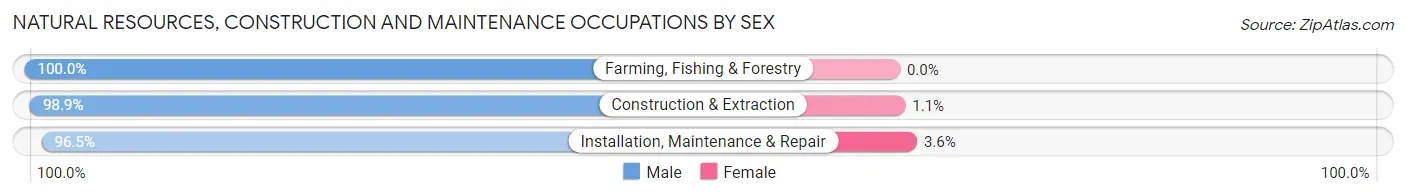
| Occupation | Male | Female |
| Farming, Fishing & Forestry | 178 (100.0%) | 0 (0.0%) |
| Construction & Extraction | 3,143 (98.9%) | 36 (1.1%) |
| Installation, Maintenance & Repair | 2,282 (96.5%) | 84 (3.5%) |
| Total (Category) | 5,603 (97.9%) | 120 (2.1%) |
| Total (Overall) | 28,458 (54.6%) | 23,674 (45.4%) |
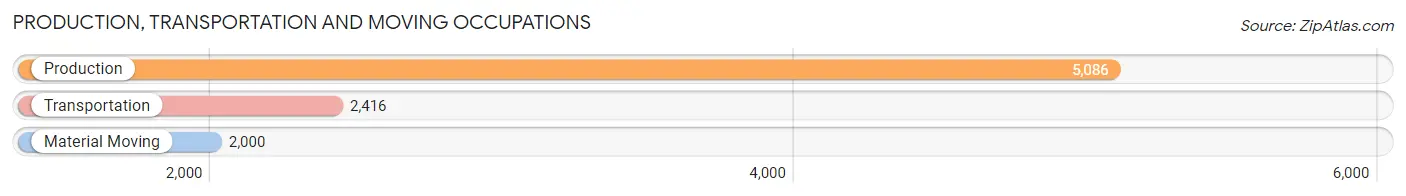
Production, Transportation and Moving Occupations
The most common Production, Transportation and Moving occupations in Bartow County are Production (5,086 | 9.8%), Transportation (2,416 | 4.6%), and Material Moving (2,000 | 3.8%).
Production, Transportation and Moving Occupations by Sex
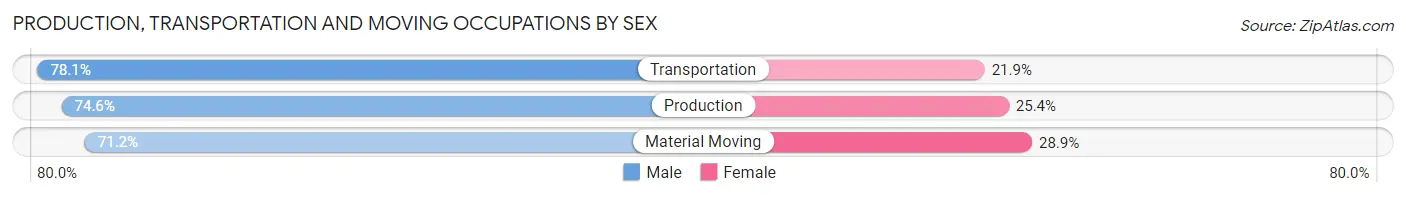
| Occupation | Male | Female |
| Production | 3,792 (74.6%) | 1,294 (25.4%) |
| Transportation | 1,887 (78.1%) | 529 (21.9%) |
| Material Moving | 1,423 (71.2%) | 577 (28.8%) |
| Total (Category) | 7,102 (74.7%) | 2,400 (25.3%) |
| Total (Overall) | 28,458 (54.6%) | 23,674 (45.4%) |
Employment Industries by Sex in Bartow County
Employment Industries in Bartow County
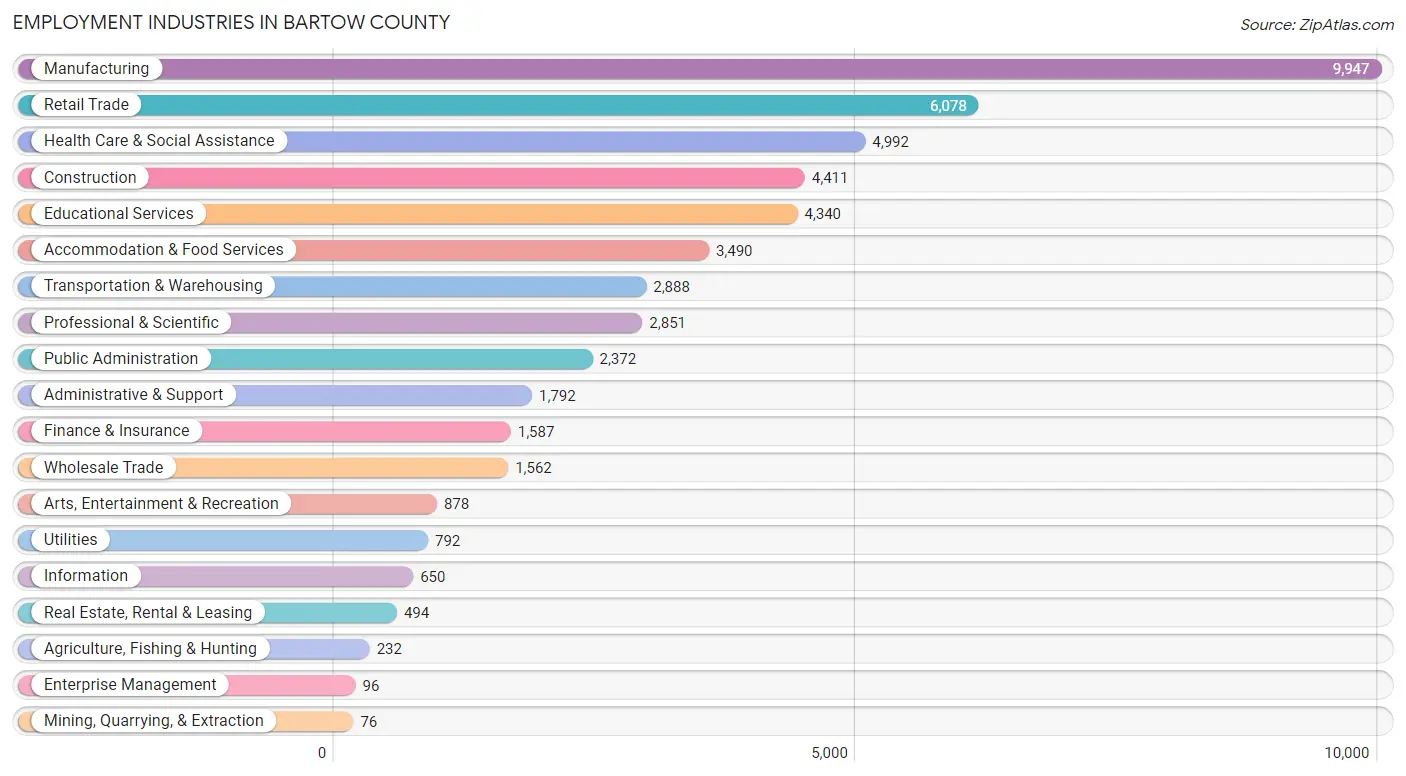
The major employment industries in Bartow County include Manufacturing (9,947 | 19.1%), Retail Trade (6,078 | 11.7%), Health Care & Social Assistance (4,992 | 9.6%), Construction (4,411 | 8.5%), and Educational Services (4,340 | 8.3%).
Employment Industries by Sex in Bartow County
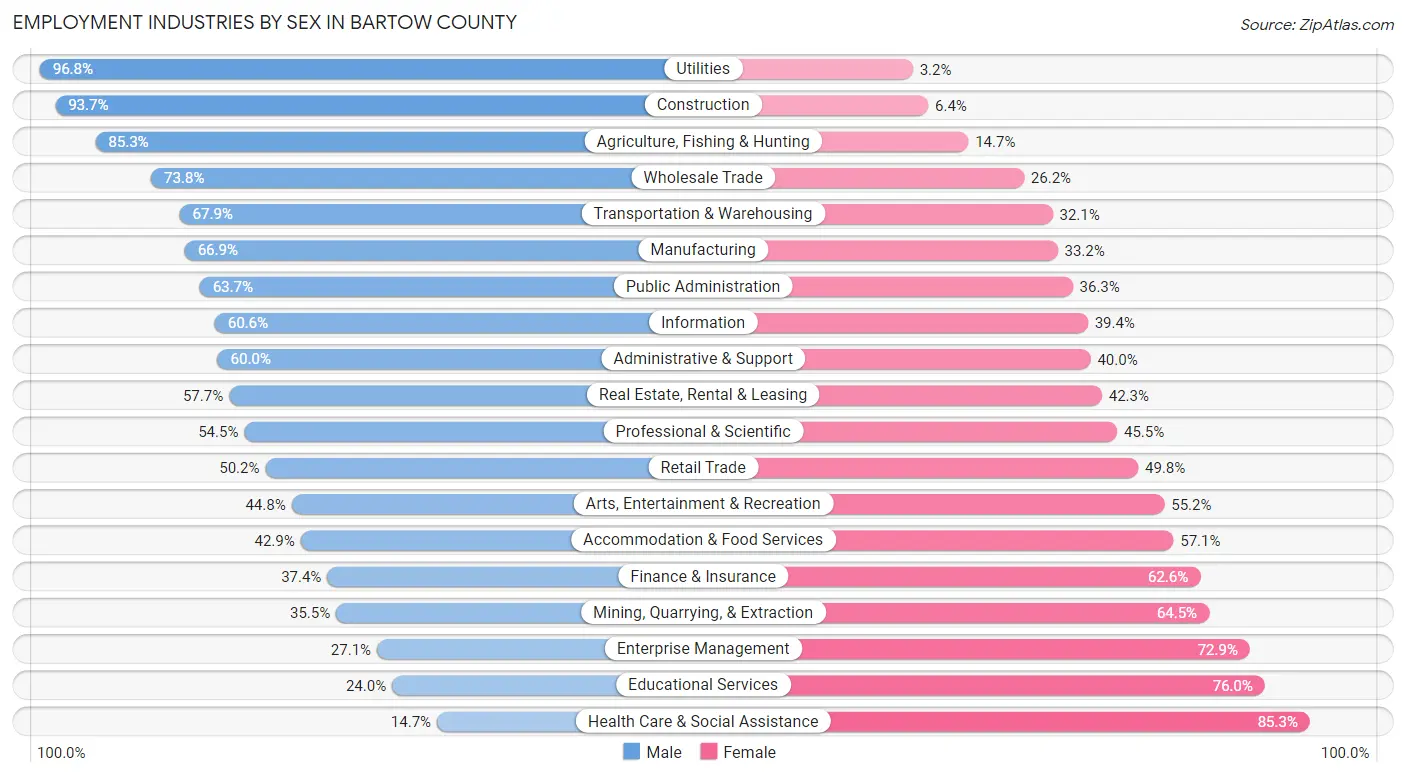
The Bartow County industries that see more men than women are Utilities (96.8%), Construction (93.6%), and Agriculture, Fishing & Hunting (85.3%), whereas the industries that tend to have a higher number of women are Health Care & Social Assistance (85.3%), Educational Services (76.0%), and Enterprise Management (72.9%).
| Industry | Male | Female |
| Agriculture, Fishing & Hunting | 198 (85.3%) | 34 (14.7%) |
| Mining, Quarrying, & Extraction | 27 (35.5%) | 49 (64.5%) |
| Construction | 4,131 (93.6%) | 280 (6.4%) |
| Manufacturing | 6,650 (66.8%) | 3,297 (33.2%) |
| Wholesale Trade | 1,153 (73.8%) | 409 (26.2%) |
| Retail Trade | 3,050 (50.2%) | 3,028 (49.8%) |
| Transportation & Warehousing | 1,961 (67.9%) | 927 (32.1%) |
| Utilities | 767 (96.8%) | 25 (3.2%) |
| Information | 394 (60.6%) | 256 (39.4%) |
| Finance & Insurance | 593 (37.4%) | 994 (62.6%) |
| Real Estate, Rental & Leasing | 285 (57.7%) | 209 (42.3%) |
| Professional & Scientific | 1,555 (54.5%) | 1,296 (45.5%) |
| Enterprise Management | 26 (27.1%) | 70 (72.9%) |
| Administrative & Support | 1,076 (60.0%) | 716 (40.0%) |
| Educational Services | 1,040 (24.0%) | 3,300 (76.0%) |
| Health Care & Social Assistance | 732 (14.7%) | 4,260 (85.3%) |
| Arts, Entertainment & Recreation | 393 (44.8%) | 485 (55.2%) |
| Accommodation & Food Services | 1,497 (42.9%) | 1,993 (57.1%) |
| Public Administration | 1,512 (63.7%) | 860 (36.3%) |
| Total | 28,458 (54.6%) | 23,674 (45.4%) |
Education in Bartow County
School Enrollment in Bartow County
The most common levels of schooling among the 25,649 students in Bartow County are high school (6,390 | 24.9%), elementary school (6,017 | 23.5%), and middle school (5,598 | 21.8%).

| School Level | # Students | % Students |
| Nursery / Preschool | 1,586 | 6.2% |
| Kindergarten | 1,019 | 4.0% |
| Elementary School | 6,017 | 23.5% |
| Middle School | 5,598 | 21.8% |
| High School | 6,390 | 24.9% |
| College / Undergraduate | 4,114 | 16.0% |
| Graduate / Professional | 925 | 3.6% |
| Total | 25,649 | 100.0% |
School Enrollment by Age by Funding Source in Bartow County
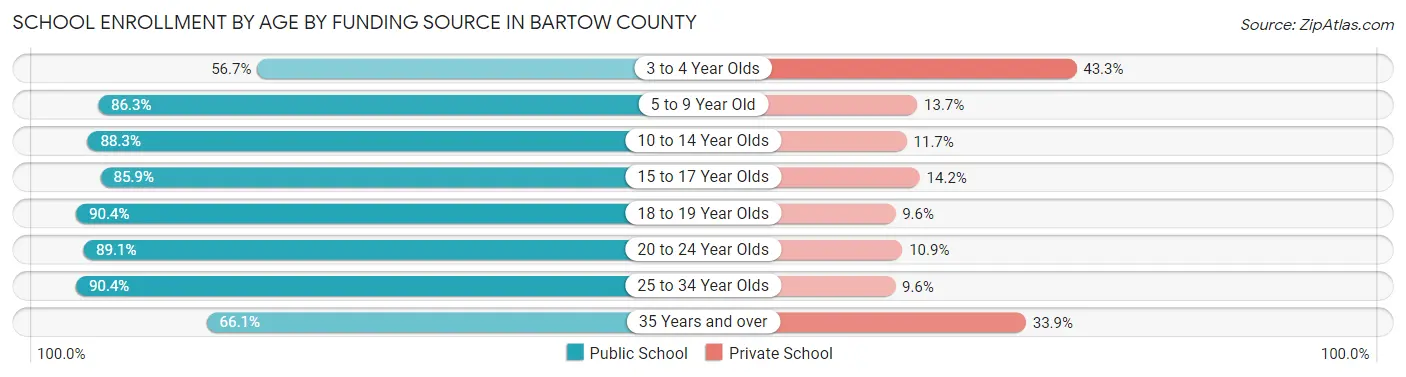
Out of a total of 25,649 students who are enrolled in schools in Bartow County, 3,796 (14.8%) attend a private institution, while the remaining 21,853 (85.2%) are enrolled in public schools. The age group of 3 to 4 year olds has the highest likelihood of being enrolled in private schools, with 520 (43.3% in the age bracket) enrolled. Conversely, the age group of 25 to 34 year olds has the lowest likelihood of being enrolled in a private school, with 1,247 (90.4% in the age bracket) attending a public institution.
| Age Bracket | Public School | Private School |
| 3 to 4 Year Olds | 680 (56.7%) | 520 (43.3%) |
| 5 to 9 Year Old | 5,547 (86.3%) | 879 (13.7%) |
| 10 to 14 Year Olds | 6,398 (88.3%) | 849 (11.7%) |
| 15 to 17 Year Olds | 3,906 (85.9%) | 644 (14.1%) |
| 18 to 19 Year Olds | 1,393 (90.4%) | 148 (9.6%) |
| 20 to 24 Year Olds | 1,879 (89.1%) | 230 (10.9%) |
| 25 to 34 Year Olds | 1,247 (90.4%) | 132 (9.6%) |
| 35 Years and over | 791 (66.1%) | 406 (33.9%) |
| Total | 21,853 (85.2%) | 3,796 (14.8%) |
Educational Attainment by Field of Study in Bartow County
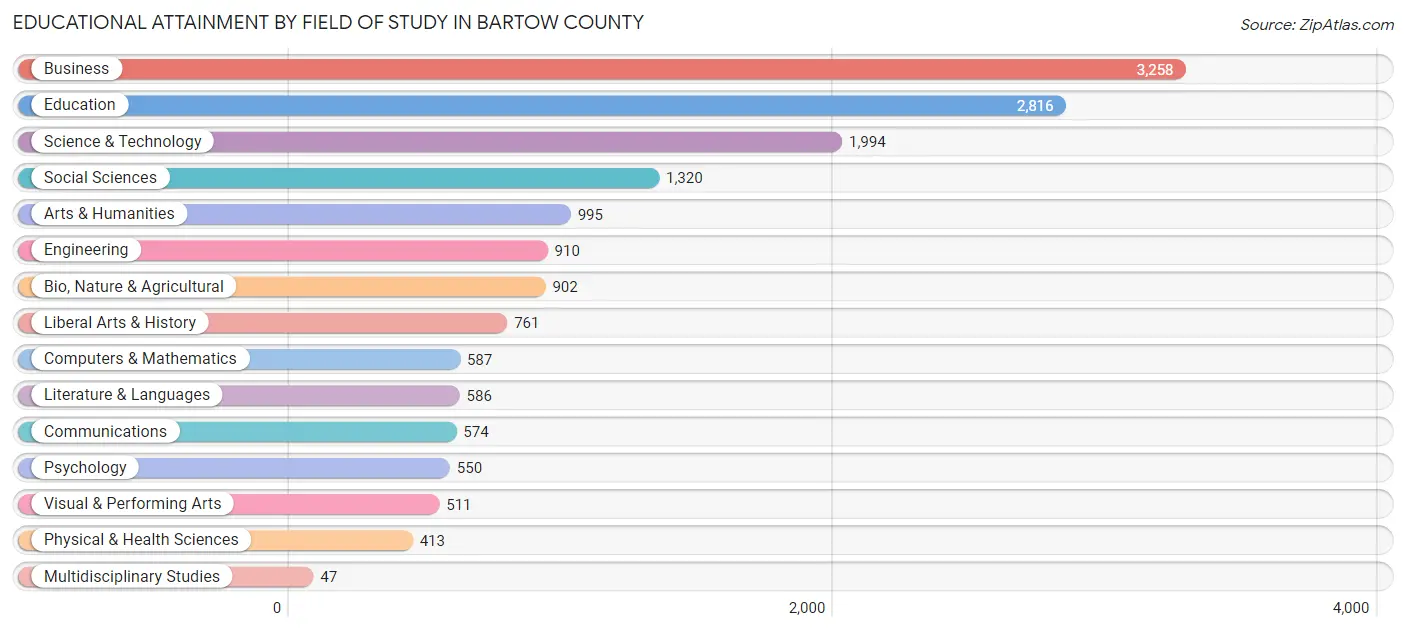
Business (3,258 | 20.1%), education (2,816 | 17.4%), science & technology (1,994 | 12.3%), social sciences (1,320 | 8.1%), and arts & humanities (995 | 6.1%) are the most common fields of study among 16,224 individuals in Bartow County who have obtained a bachelor's degree or higher.
| Field of Study | # Graduates | % Graduates |
| Computers & Mathematics | 587 | 3.6% |
| Bio, Nature & Agricultural | 902 | 5.6% |
| Physical & Health Sciences | 413 | 2.5% |
| Psychology | 550 | 3.4% |
| Social Sciences | 1,320 | 8.1% |
| Engineering | 910 | 5.6% |
| Multidisciplinary Studies | 47 | 0.3% |
| Science & Technology | 1,994 | 12.3% |
| Business | 3,258 | 20.1% |
| Education | 2,816 | 17.4% |
| Literature & Languages | 586 | 3.6% |
| Liberal Arts & History | 761 | 4.7% |
| Visual & Performing Arts | 511 | 3.2% |
| Communications | 574 | 3.5% |
| Arts & Humanities | 995 | 6.1% |
| Total | 16,224 | 100.0% |
Transportation & Commute in Bartow County
Vehicle Availability by Sex in Bartow County
The most prevalent vehicle ownership categories in Bartow County are males with 2 vehicles (11,147, accounting for 39.6%) and females with 2 vehicles (9,995, making up 48.3%).
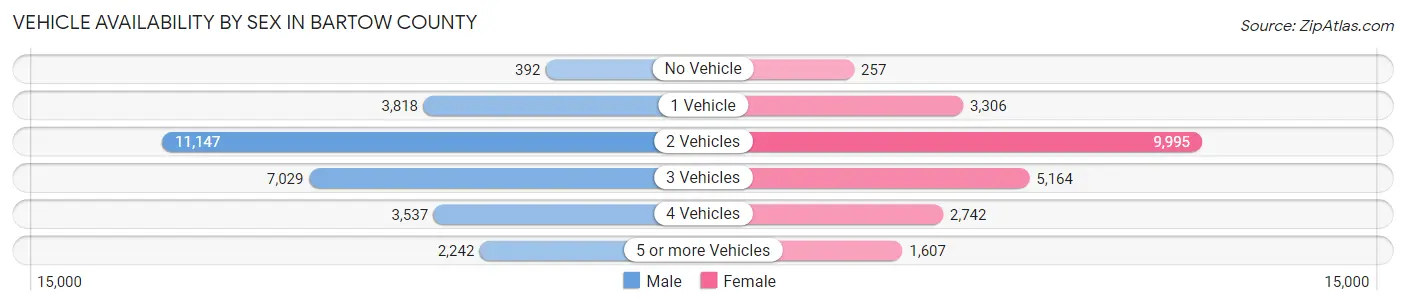
| Vehicles Available | Male | Female |
| No Vehicle | 392 (1.4%) | 257 (1.1%) |
| 1 Vehicle | 3,818 (13.6%) | 3,306 (14.3%) |
| 2 Vehicles | 11,147 (39.6%) | 9,995 (43.3%) |
| 3 Vehicles | 7,029 (25.0%) | 5,164 (22.4%) |
| 4 Vehicles | 3,537 (12.6%) | 2,742 (11.9%) |
| 5 or more Vehicles | 2,242 (8.0%) | 1,607 (7.0%) |
| Total | 28,165 (100.0%) | 23,071 (100.0%) |
Commute Time in Bartow County
The most frequently occuring commute durations in Bartow County are 15 to 19 minutes (7,407 commuters, 15.9%), 30 to 34 minutes (6,369 commuters, 13.7%), and 20 to 24 minutes (5,709 commuters, 12.2%).
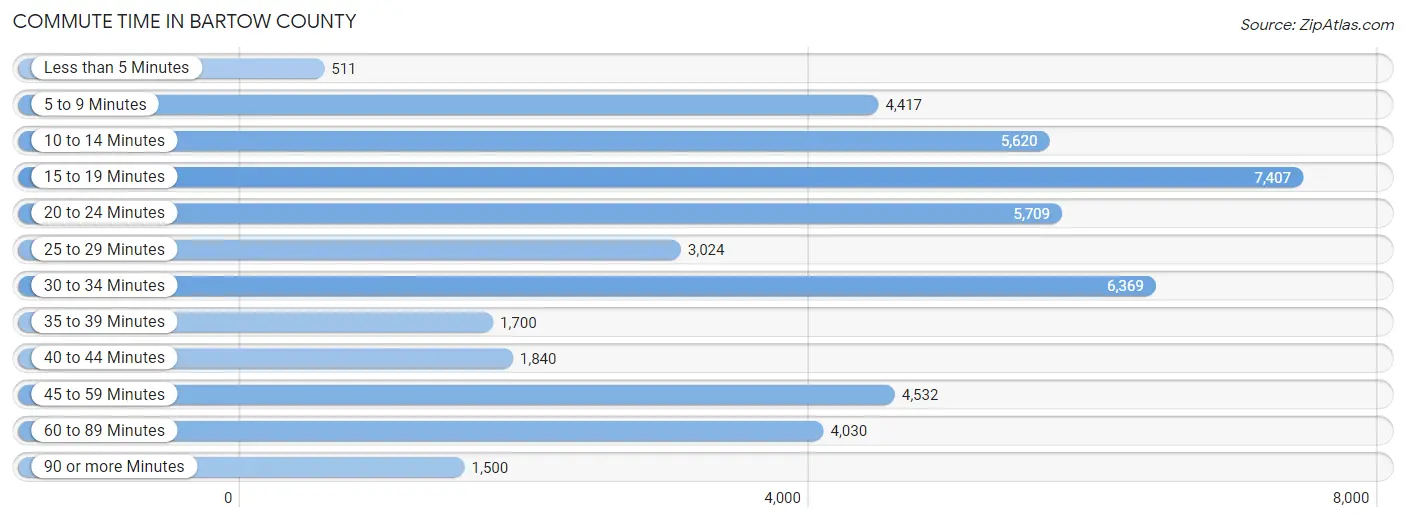
| Commute Time | # Commuters | % Commuters |
| Less than 5 Minutes | 511 | 1.1% |
| 5 to 9 Minutes | 4,417 | 9.5% |
| 10 to 14 Minutes | 5,620 | 12.0% |
| 15 to 19 Minutes | 7,407 | 15.9% |
| 20 to 24 Minutes | 5,709 | 12.2% |
| 25 to 29 Minutes | 3,024 | 6.5% |
| 30 to 34 Minutes | 6,369 | 13.7% |
| 35 to 39 Minutes | 1,700 | 3.6% |
| 40 to 44 Minutes | 1,840 | 3.9% |
| 45 to 59 Minutes | 4,532 | 9.7% |
| 60 to 89 Minutes | 4,030 | 8.6% |
| 90 or more Minutes | 1,500 | 3.2% |
Commute Time by Sex in Bartow County
The most common commute times in Bartow County are 30 to 34 minutes (3,901 commuters, 15.2%) for males and 15 to 19 minutes (4,068 commuters, 19.3%) for females.
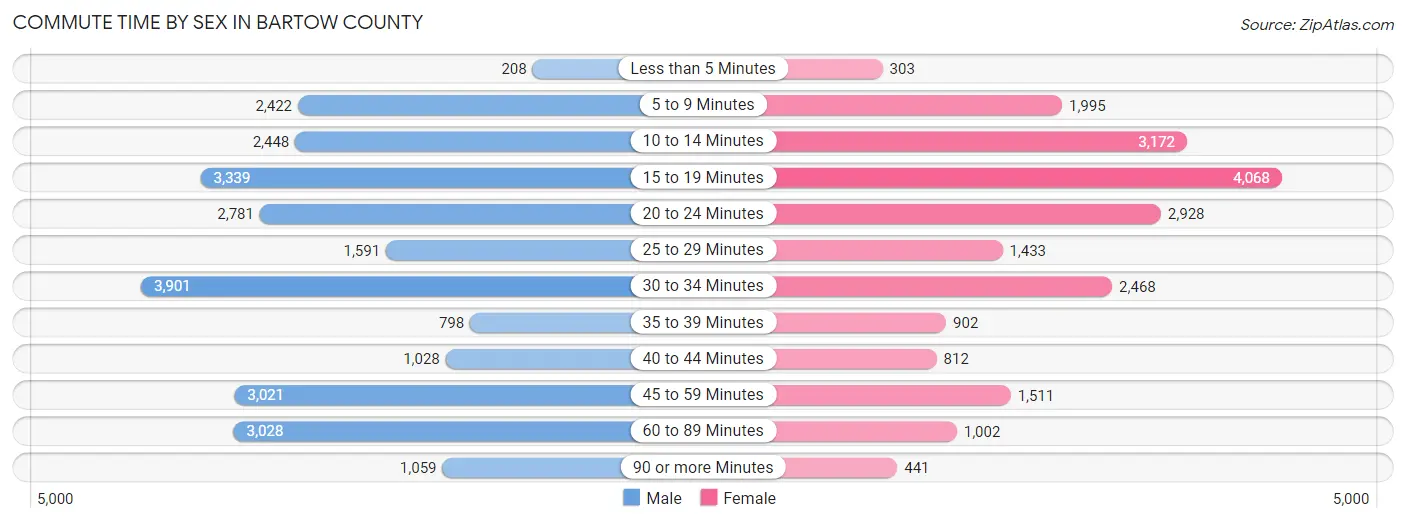
| Commute Time | Male | Female |
| Less than 5 Minutes | 208 (0.8%) | 303 (1.4%) |
| 5 to 9 Minutes | 2,422 (9.5%) | 1,995 (9.5%) |
| 10 to 14 Minutes | 2,448 (9.6%) | 3,172 (15.1%) |
| 15 to 19 Minutes | 3,339 (13.0%) | 4,068 (19.3%) |
| 20 to 24 Minutes | 2,781 (10.8%) | 2,928 (13.9%) |
| 25 to 29 Minutes | 1,591 (6.2%) | 1,433 (6.8%) |
| 30 to 34 Minutes | 3,901 (15.2%) | 2,468 (11.7%) |
| 35 to 39 Minutes | 798 (3.1%) | 902 (4.3%) |
| 40 to 44 Minutes | 1,028 (4.0%) | 812 (3.9%) |
| 45 to 59 Minutes | 3,021 (11.8%) | 1,511 (7.2%) |
| 60 to 89 Minutes | 3,028 (11.8%) | 1,002 (4.8%) |
| 90 or more Minutes | 1,059 (4.1%) | 441 (2.1%) |
Time of Departure to Work by Sex in Bartow County
The most frequent times of departure to work in Bartow County are 7:00 AM to 7:29 AM (4,586, 17.9%) for males and 7:00 AM to 7:29 AM (4,291, 20.4%) for females.
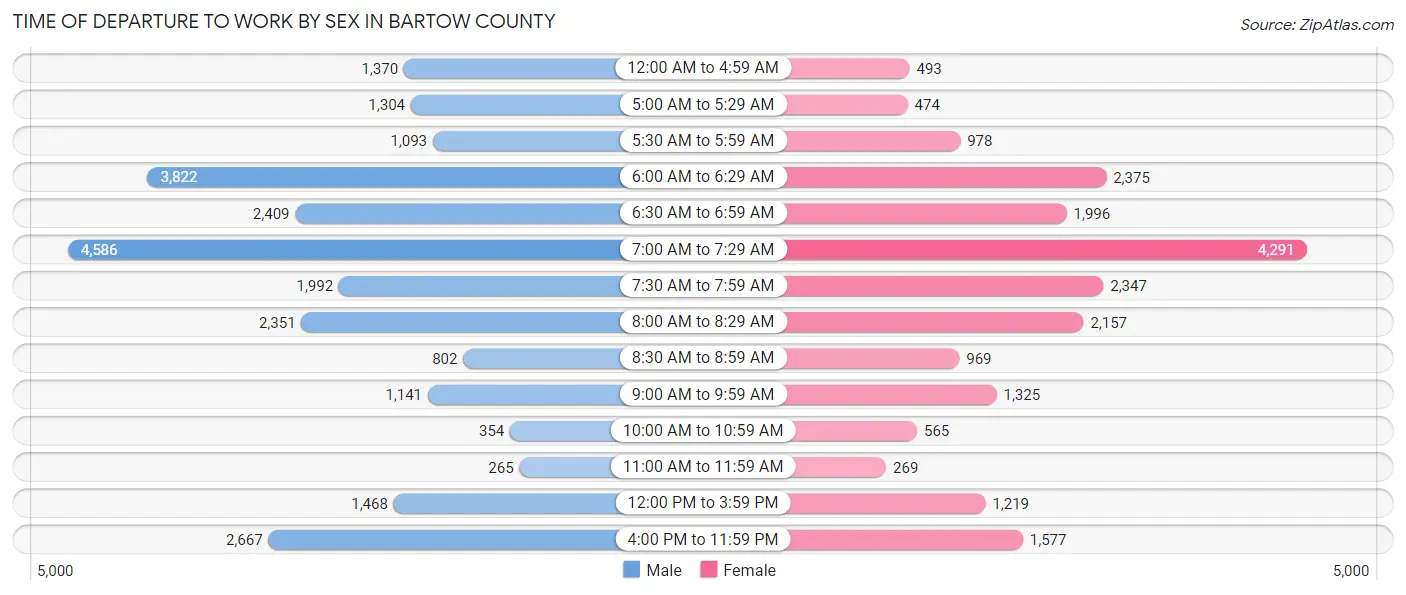
| Time of Departure | Male | Female |
| 12:00 AM to 4:59 AM | 1,370 (5.3%) | 493 (2.3%) |
| 5:00 AM to 5:29 AM | 1,304 (5.1%) | 474 (2.2%) |
| 5:30 AM to 5:59 AM | 1,093 (4.3%) | 978 (4.6%) |
| 6:00 AM to 6:29 AM | 3,822 (14.9%) | 2,375 (11.3%) |
| 6:30 AM to 6:59 AM | 2,409 (9.4%) | 1,996 (9.5%) |
| 7:00 AM to 7:29 AM | 4,586 (17.9%) | 4,291 (20.4%) |
| 7:30 AM to 7:59 AM | 1,992 (7.8%) | 2,347 (11.2%) |
| 8:00 AM to 8:29 AM | 2,351 (9.2%) | 2,157 (10.2%) |
| 8:30 AM to 8:59 AM | 802 (3.1%) | 969 (4.6%) |
| 9:00 AM to 9:59 AM | 1,141 (4.4%) | 1,325 (6.3%) |
| 10:00 AM to 10:59 AM | 354 (1.4%) | 565 (2.7%) |
| 11:00 AM to 11:59 AM | 265 (1.0%) | 269 (1.3%) |
| 12:00 PM to 3:59 PM | 1,468 (5.7%) | 1,219 (5.8%) |
| 4:00 PM to 11:59 PM | 2,667 (10.4%) | 1,577 (7.5%) |
| Total | 25,624 (100.0%) | 21,035 (100.0%) |
Housing Occupancy in Bartow County
Occupancy by Ownership in Bartow County
Of the total 38,429 dwellings in Bartow County, owner-occupied units account for 27,974 (72.8%), while renter-occupied units make up 10,455 (27.2%).
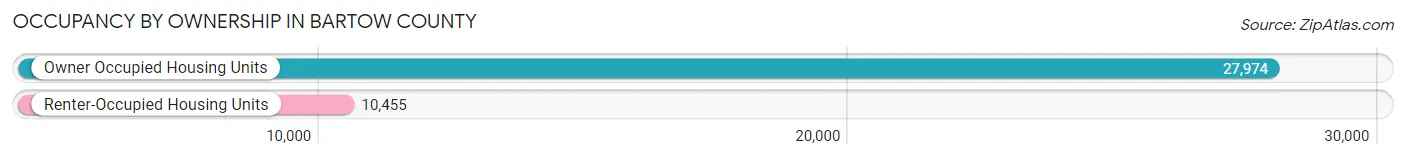
| Occupancy | # Housing Units | % Housing Units |
| Owner Occupied Housing Units | 27,974 | 72.8% |
| Renter-Occupied Housing Units | 10,455 | 27.2% |
| Total Occupied Housing Units | 38,429 | 100.0% |
Occupancy by Household Size in Bartow County

| Household Size | # Housing Units | % Housing Units |
| 1-Person Household | 8,261 | 21.5% |
| 2-Person Household | 12,991 | 33.8% |
| 3-Person Household | 7,072 | 18.4% |
| 4+ Person Household | 10,105 | 26.3% |
| Total Housing Units | 38,429 | 100.0% |
Occupancy by Ownership by Household Size in Bartow County
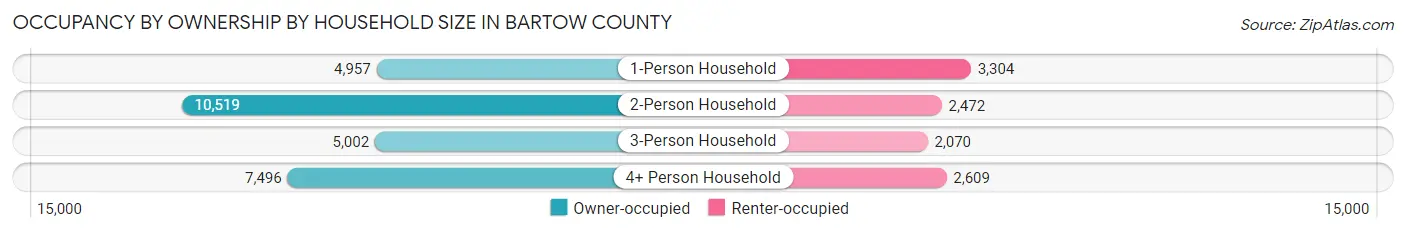
| Household Size | Owner-occupied | Renter-occupied |
| 1-Person Household | 4,957 (60.0%) | 3,304 (40.0%) |
| 2-Person Household | 10,519 (81.0%) | 2,472 (19.0%) |
| 3-Person Household | 5,002 (70.7%) | 2,070 (29.3%) |
| 4+ Person Household | 7,496 (74.2%) | 2,609 (25.8%) |
| Total Housing Units | 27,974 (72.8%) | 10,455 (27.2%) |
Occupancy by Educational Attainment in Bartow County
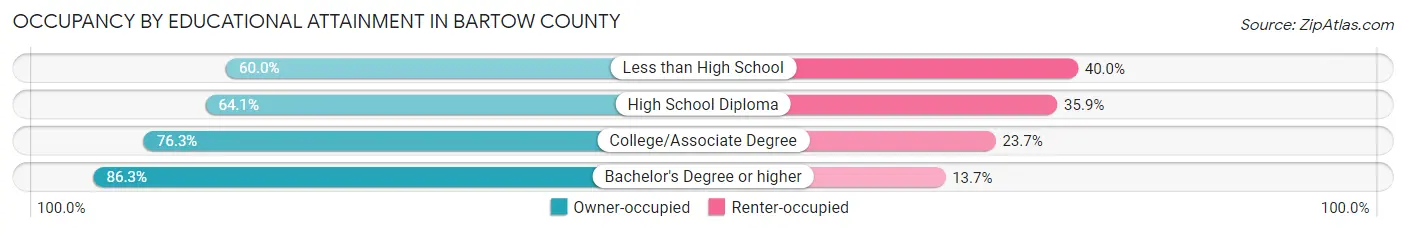
| Household Size | Owner-occupied | Renter-occupied |
| Less than High School | 2,586 (60.0%) | 1,722 (40.0%) |
| High School Diploma | 8,173 (64.1%) | 4,573 (35.9%) |
| College/Associate Degree | 9,451 (76.3%) | 2,929 (23.7%) |
| Bachelor's Degree or higher | 7,764 (86.3%) | 1,231 (13.7%) |
Occupancy by Age of Householder in Bartow County
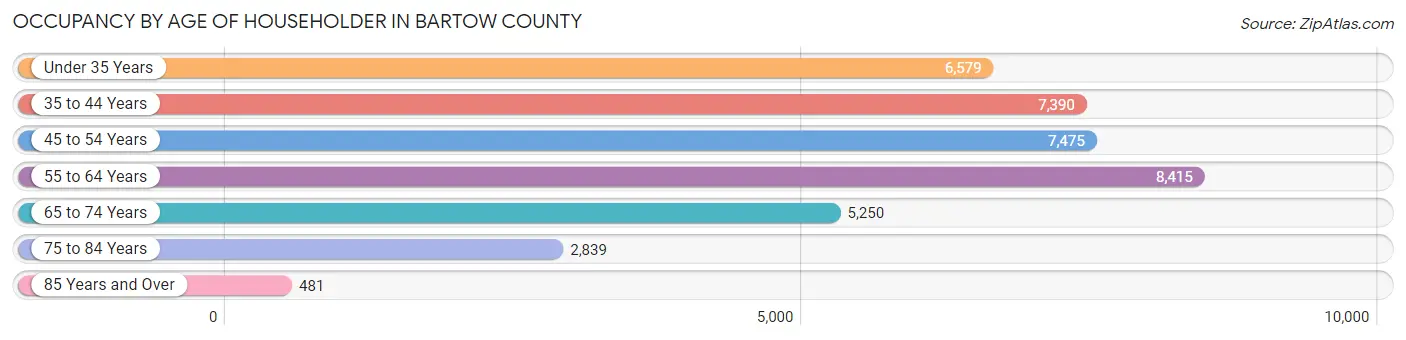
| Age Bracket | # Households | % Households |
| Under 35 Years | 6,579 | 17.1% |
| 35 to 44 Years | 7,390 | 19.2% |
| 45 to 54 Years | 7,475 | 19.5% |
| 55 to 64 Years | 8,415 | 21.9% |
| 65 to 74 Years | 5,250 | 13.7% |
| 75 to 84 Years | 2,839 | 7.4% |
| 85 Years and Over | 481 | 1.3% |
| Total | 38,429 | 100.0% |
Housing Finances in Bartow County
Median Income by Occupancy in Bartow County
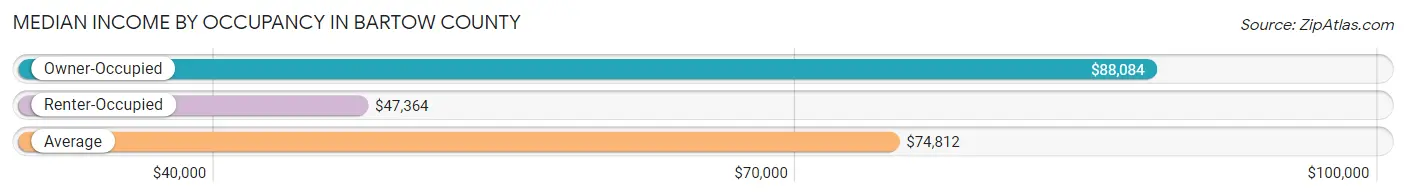
| Occupancy Type | # Households | Median Income |
| Owner-Occupied | 27,974 (72.8%) | $88,084 |
| Renter-Occupied | 10,455 (27.2%) | $47,364 |
| Average | 38,429 (100.0%) | $74,812 |
Occupancy by Householder Income Bracket in Bartow County
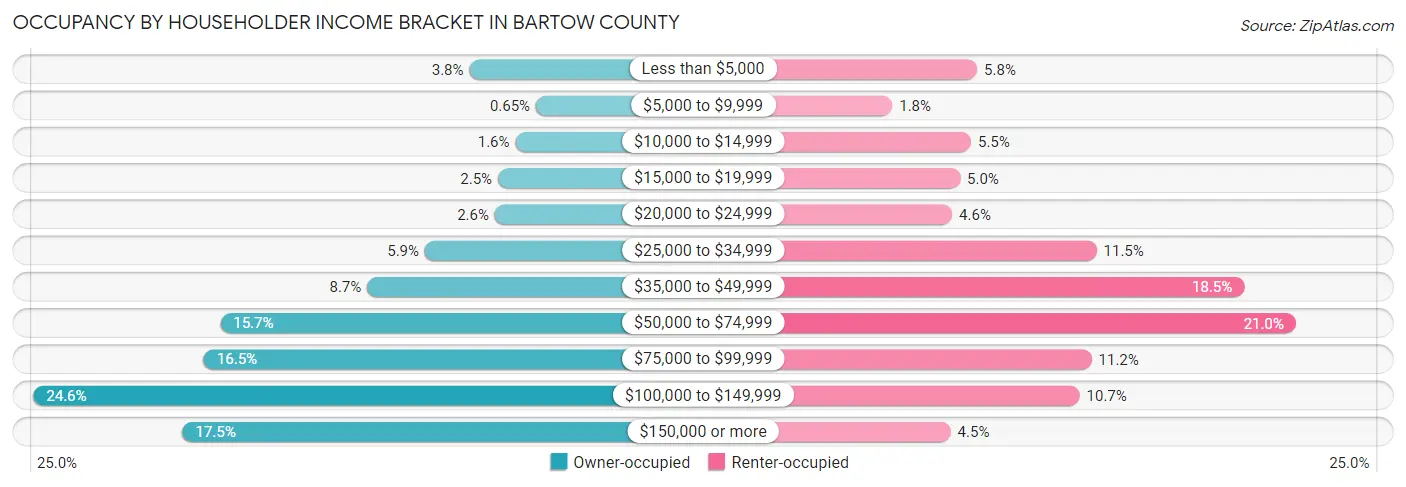
| Income Bracket | Owner-occupied | Renter-occupied |
| Less than $5,000 | 1,069 (3.8%) | 605 (5.8%) |
| $5,000 to $9,999 | 181 (0.6%) | 183 (1.8%) |
| $10,000 to $14,999 | 456 (1.6%) | 575 (5.5%) |
| $15,000 to $19,999 | 689 (2.5%) | 521 (5.0%) |
| $20,000 to $24,999 | 730 (2.6%) | 481 (4.6%) |
| $25,000 to $34,999 | 1,662 (5.9%) | 1,200 (11.5%) |
| $35,000 to $49,999 | 2,432 (8.7%) | 1,934 (18.5%) |
| $50,000 to $74,999 | 4,386 (15.7%) | 2,191 (21.0%) |
| $75,000 to $99,999 | 4,604 (16.5%) | 1,175 (11.2%) |
| $100,000 to $149,999 | 6,875 (24.6%) | 1,116 (10.7%) |
| $150,000 or more | 4,890 (17.5%) | 474 (4.5%) |
| Total | 27,974 (100.0%) | 10,455 (100.0%) |
Monthly Housing Cost Tiers in Bartow County
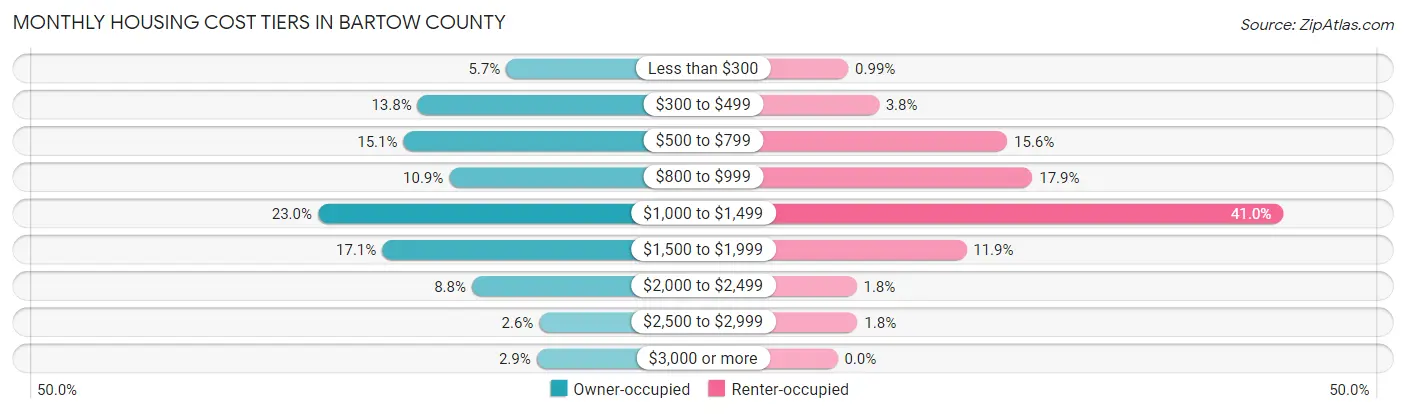
| Monthly Cost | Owner-occupied | Renter-occupied |
| Less than $300 | 1,588 (5.7%) | 103 (1.0%) |
| $300 to $499 | 3,870 (13.8%) | 397 (3.8%) |
| $500 to $799 | 4,235 (15.1%) | 1,633 (15.6%) |
| $800 to $999 | 3,055 (10.9%) | 1,876 (17.9%) |
| $1,000 to $1,499 | 6,436 (23.0%) | 4,290 (41.0%) |
| $1,500 to $1,999 | 4,781 (17.1%) | 1,240 (11.9%) |
| $2,000 to $2,499 | 2,469 (8.8%) | 184 (1.8%) |
| $2,500 to $2,999 | 736 (2.6%) | 192 (1.8%) |
| $3,000 or more | 804 (2.9%) | 0 (0.0%) |
| Total | 27,974 (100.0%) | 10,455 (100.0%) |
Physical Housing Characteristics in Bartow County
Housing Structures in Bartow County
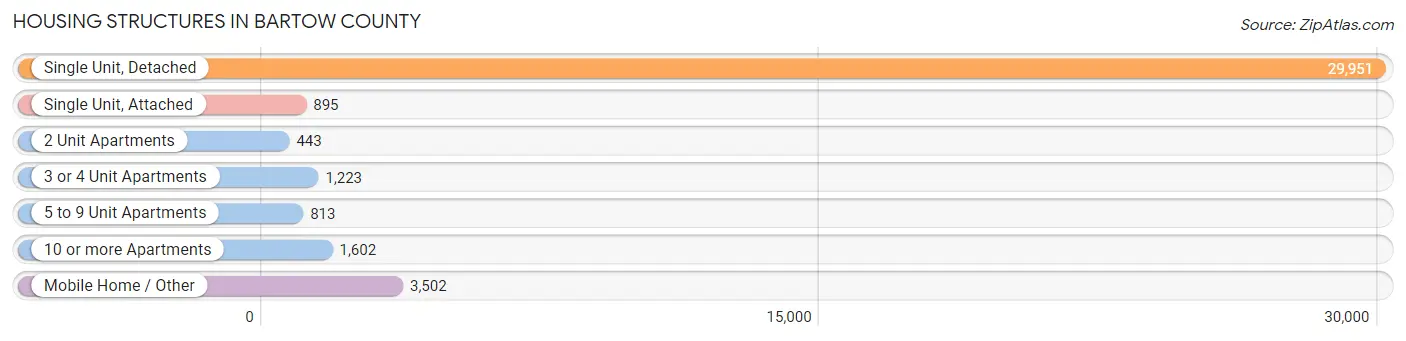
| Structure Type | # Housing Units | % Housing Units |
| Single Unit, Detached | 29,951 | 77.9% |
| Single Unit, Attached | 895 | 2.3% |
| 2 Unit Apartments | 443 | 1.1% |
| 3 or 4 Unit Apartments | 1,223 | 3.2% |
| 5 to 9 Unit Apartments | 813 | 2.1% |
| 10 or more Apartments | 1,602 | 4.2% |
| Mobile Home / Other | 3,502 | 9.1% |
| Total | 38,429 | 100.0% |
Housing Structures by Occupancy in Bartow County
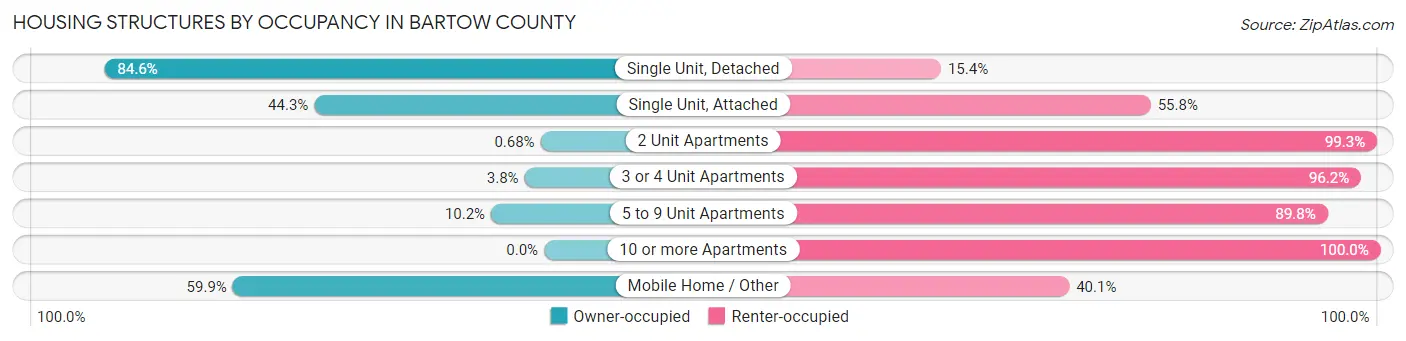
| Structure Type | Owner-occupied | Renter-occupied |
| Single Unit, Detached | 25,347 (84.6%) | 4,604 (15.4%) |
| Single Unit, Attached | 396 (44.3%) | 499 (55.7%) |
| 2 Unit Apartments | 3 (0.7%) | 440 (99.3%) |
| 3 or 4 Unit Apartments | 46 (3.8%) | 1,177 (96.2%) |
| 5 to 9 Unit Apartments | 83 (10.2%) | 730 (89.8%) |
| 10 or more Apartments | 0 (0.0%) | 1,602 (100.0%) |
| Mobile Home / Other | 2,099 (59.9%) | 1,403 (40.1%) |
| Total | 27,974 (72.8%) | 10,455 (27.2%) |
Housing Structures by Number of Rooms in Bartow County
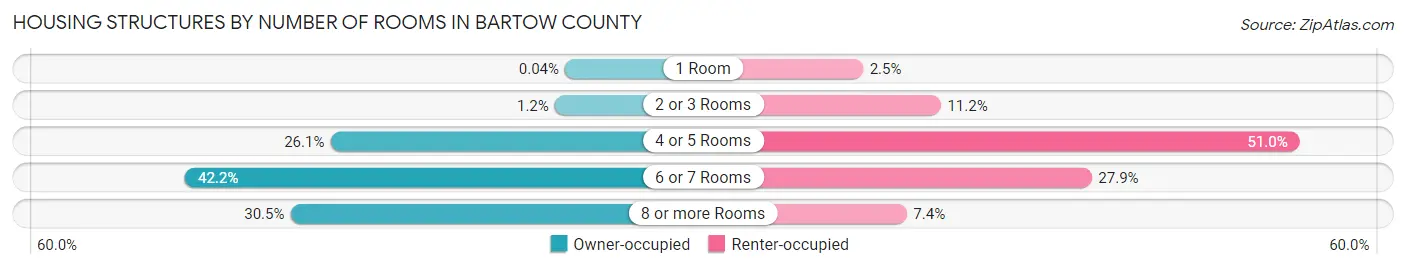
| Number of Rooms | Owner-occupied | Renter-occupied |
| 1 Room | 12 (0.0%) | 265 (2.5%) |
| 2 or 3 Rooms | 331 (1.2%) | 1,167 (11.2%) |
| 4 or 5 Rooms | 7,296 (26.1%) | 5,333 (51.0%) |
| 6 or 7 Rooms | 11,801 (42.2%) | 2,918 (27.9%) |
| 8 or more Rooms | 8,534 (30.5%) | 772 (7.4%) |
| Total | 27,974 (100.0%) | 10,455 (100.0%) |
Housing Structure by Heating Type in Bartow County
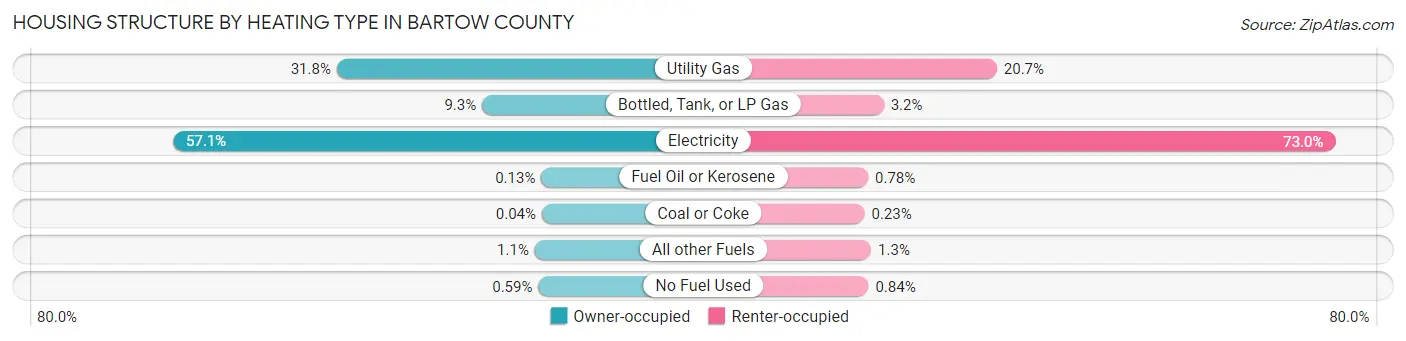
| Heating Type | Owner-occupied | Renter-occupied |
| Utility Gas | 8,882 (31.8%) | 2,163 (20.7%) |
| Bottled, Tank, or LP Gas | 2,595 (9.3%) | 334 (3.2%) |
| Electricity | 15,966 (57.1%) | 7,633 (73.0%) |
| Fuel Oil or Kerosene | 37 (0.1%) | 82 (0.8%) |
| Coal or Coke | 10 (0.0%) | 24 (0.2%) |
| All other Fuels | 319 (1.1%) | 131 (1.3%) |
| No Fuel Used | 165 (0.6%) | 88 (0.8%) |
| Total | 27,974 (100.0%) | 10,455 (100.0%) |
Household Vehicle Usage in Bartow County
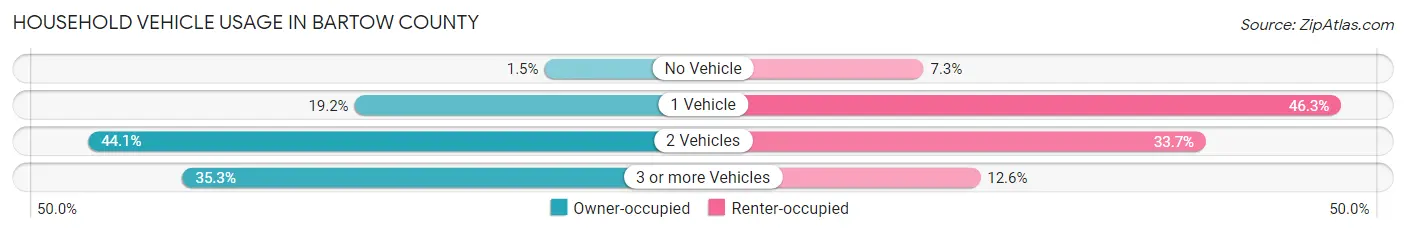
| Vehicles per Household | Owner-occupied | Renter-occupied |
| No Vehicle | 414 (1.5%) | 767 (7.3%) |
| 1 Vehicle | 5,374 (19.2%) | 4,843 (46.3%) |
| 2 Vehicles | 12,325 (44.1%) | 3,523 (33.7%) |
| 3 or more Vehicles | 9,861 (35.2%) | 1,322 (12.6%) |
| Total | 27,974 (100.0%) | 10,455 (100.0%) |
Real Estate & Mortgages in Bartow County
Real Estate and Mortgage Overview in Bartow County
| Characteristic | Without Mortgage | With Mortgage |
| Housing Units | 10,385 | 17,589 |
| Median Property Value | $211,200 | $252,000 |
| Median Household Income | $61,152 | $3,570 |
| Monthly Housing Costs | $494 | $792 |
| Real Estate Taxes | $1,386 | $592 |
Property Value by Mortgage Status in Bartow County
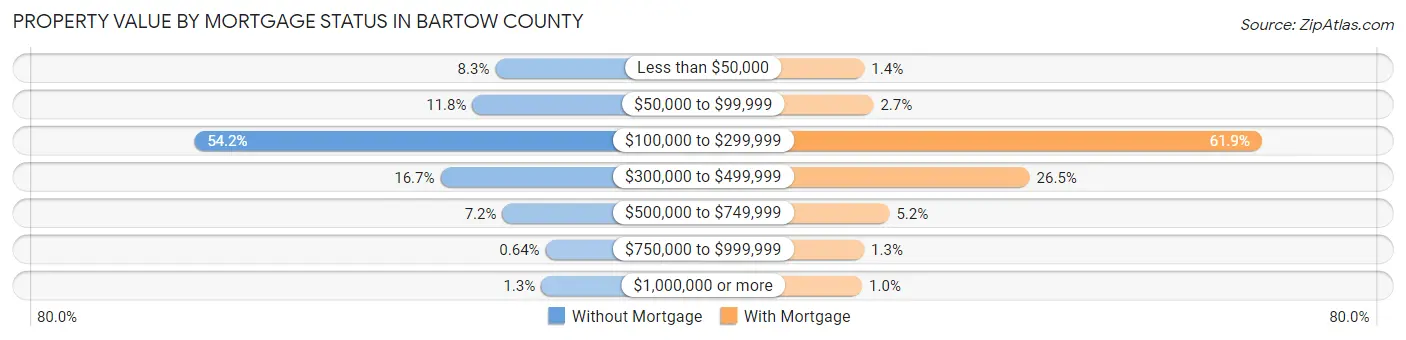
| Property Value | Without Mortgage | With Mortgage |
| Less than $50,000 | 860 (8.3%) | 237 (1.3%) |
| $50,000 to $99,999 | 1,223 (11.8%) | 481 (2.7%) |
| $100,000 to $299,999 | 5,623 (54.1%) | 10,888 (61.9%) |
| $300,000 to $499,999 | 1,729 (16.7%) | 4,666 (26.5%) |
| $500,000 to $749,999 | 749 (7.2%) | 910 (5.2%) |
| $750,000 to $999,999 | 66 (0.6%) | 230 (1.3%) |
| $1,000,000 or more | 135 (1.3%) | 177 (1.0%) |
| Total | 10,385 (100.0%) | 17,589 (100.0%) |
Household Income by Mortgage Status in Bartow County
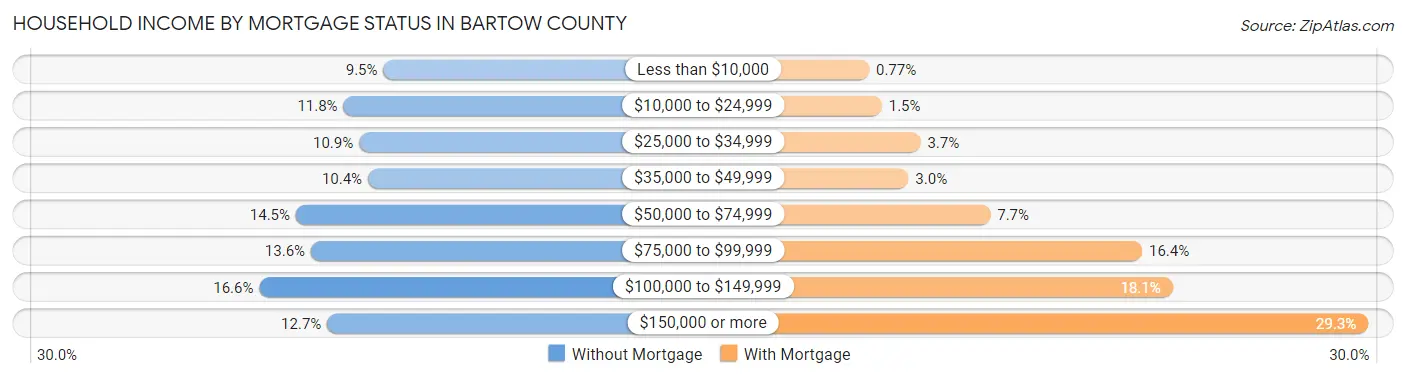
| Household Income | Without Mortgage | With Mortgage |
| Less than $10,000 | 987 (9.5%) | 136 (0.8%) |
| $10,000 to $24,999 | 1,223 (11.8%) | 263 (1.5%) |
| $25,000 to $34,999 | 1,131 (10.9%) | 652 (3.7%) |
| $35,000 to $49,999 | 1,078 (10.4%) | 531 (3.0%) |
| $50,000 to $74,999 | 1,506 (14.5%) | 1,354 (7.7%) |
| $75,000 to $99,999 | 1,417 (13.6%) | 2,880 (16.4%) |
| $100,000 to $149,999 | 1,723 (16.6%) | 3,187 (18.1%) |
| $150,000 or more | 1,320 (12.7%) | 5,152 (29.3%) |
| Total | 10,385 (100.0%) | 17,589 (100.0%) |
Property Value to Household Income Ratio in Bartow County
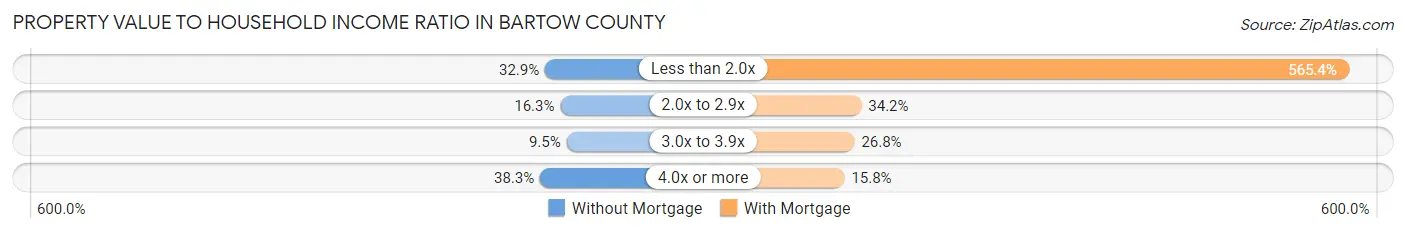
| Value-to-Income Ratio | Without Mortgage | With Mortgage |
| Less than 2.0x | 3,413 (32.9%) | 99,441 (565.4%) |
| 2.0x to 2.9x | 1,691 (16.3%) | 6,023 (34.2%) |
| 3.0x to 3.9x | 983 (9.5%) | 4,705 (26.8%) |
| 4.0x or more | 3,978 (38.3%) | 2,783 (15.8%) |
| Total | 10,385 (100.0%) | 17,589 (100.0%) |
Real Estate Taxes by Mortgage Status in Bartow County
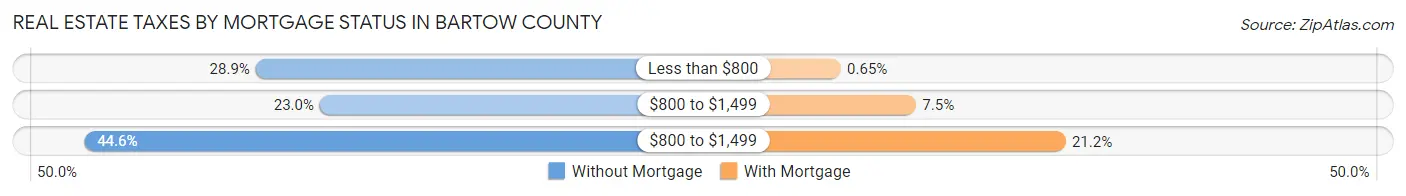
| Property Taxes | Without Mortgage | With Mortgage |
| Less than $800 | 3,001 (28.9%) | 114 (0.6%) |
| $800 to $1,499 | 2,393 (23.0%) | 1,323 (7.5%) |
| $800 to $1,499 | 4,626 (44.6%) | 3,725 (21.2%) |
| Total | 10,385 (100.0%) | 17,589 (100.0%) |
Health & Disability in Bartow County
Health Insurance Coverage by Age in Bartow County
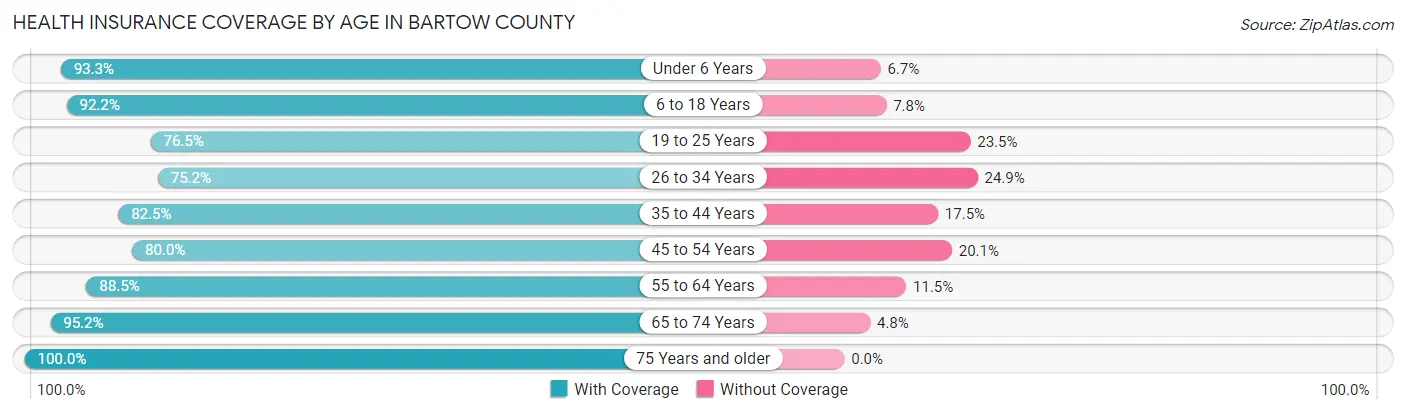
| Age Bracket | With Coverage | Without Coverage |
| Under 6 Years | 7,319 (93.3%) | 529 (6.7%) |
| 6 to 18 Years | 18,043 (92.2%) | 1,530 (7.8%) |
| 19 to 25 Years | 7,441 (76.5%) | 2,285 (23.5%) |
| 26 to 34 Years | 9,641 (75.1%) | 3,188 (24.8%) |
| 35 to 44 Years | 11,406 (82.5%) | 2,412 (17.5%) |
| 45 to 54 Years | 11,718 (79.9%) | 2,938 (20.1%) |
| 55 to 64 Years | 12,975 (88.5%) | 1,691 (11.5%) |
| 65 to 74 Years | 8,956 (95.2%) | 452 (4.8%) |
| 75 Years and older | 5,790 (100.0%) | 0 (0.0%) |
| Total | 93,289 (86.1%) | 15,025 (13.9%) |
Health Insurance Coverage by Citizenship Status in Bartow County

| Citizenship Status | With Coverage | Without Coverage |
| Native Born | 7,319 (93.3%) | 529 (6.7%) |
| Foreign Born, Citizen | 18,043 (92.2%) | 1,530 (7.8%) |
| Foreign Born, not a Citizen | 7,441 (76.5%) | 2,285 (23.5%) |
Health Insurance Coverage by Household Income in Bartow County
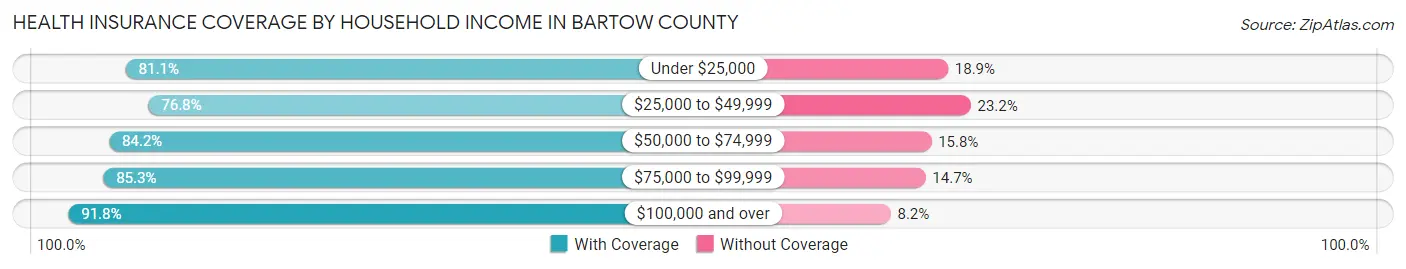
| Household Income | With Coverage | Without Coverage |
| Under $25,000 | 8,364 (81.1%) | 1,954 (18.9%) |
| $25,000 to $49,999 | 12,853 (76.8%) | 3,881 (23.2%) |
| $50,000 to $74,999 | 14,872 (84.2%) | 2,793 (15.8%) |
| $75,000 to $99,999 | 15,180 (85.3%) | 2,622 (14.7%) |
| $100,000 and over | 41,979 (91.8%) | 3,747 (8.2%) |
Public vs Private Health Insurance Coverage by Age in Bartow County

| Age Bracket | Public Insurance | Private Insurance |
| Under 6 | 2,974 (37.9%) | 4,791 (61.1%) |
| 6 to 18 Years | 6,660 (34.0%) | 12,040 (61.5%) |
| 19 to 25 Years | 1,045 (10.7%) | 6,559 (67.4%) |
| 25 to 34 Years | 1,275 (9.9%) | 8,765 (68.3%) |
| 35 to 44 Years | 1,108 (8.0%) | 10,931 (79.1%) |
| 45 to 54 Years | 883 (6.0%) | 11,059 (75.5%) |
| 55 to 64 Years | 2,939 (20.0%) | 10,868 (74.1%) |
| 65 to 74 Years | 8,311 (88.3%) | 4,847 (51.5%) |
| 75 Years and over | 5,711 (98.6%) | 3,063 (52.9%) |
| Total | 30,906 (28.5%) | 72,923 (67.3%) |
Disability Status by Sex by Age in Bartow County
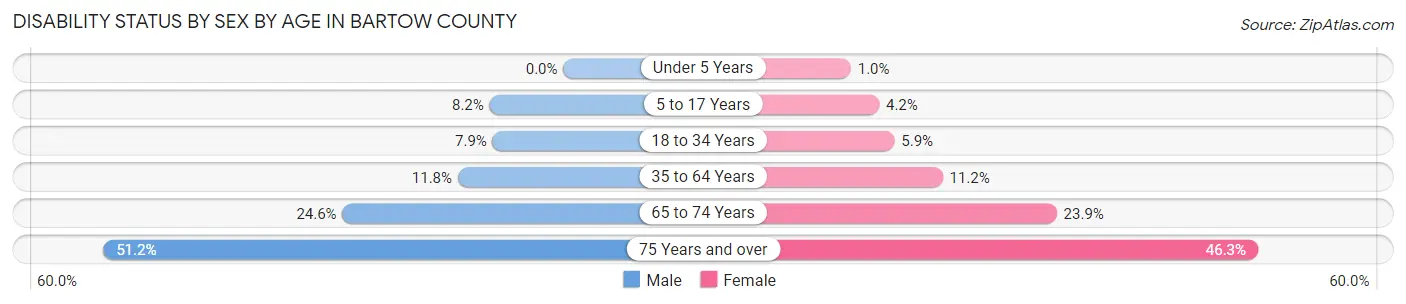
| Age Bracket | Male | Female |
| Under 5 Years | 0 (0.0%) | 33 (1.0%) |
| 5 to 17 Years | 818 (8.2%) | 376 (4.2%) |
| 18 to 34 Years | 935 (7.9%) | 718 (5.9%) |
| 35 to 64 Years | 2,537 (11.7%) | 2,417 (11.2%) |
| 65 to 74 Years | 1,093 (24.6%) | 1,188 (23.9%) |
| 75 Years and over | 1,319 (51.2%) | 1,490 (46.3%) |
Disability Class by Sex by Age in Bartow County
Disability Class: Hearing Difficulty
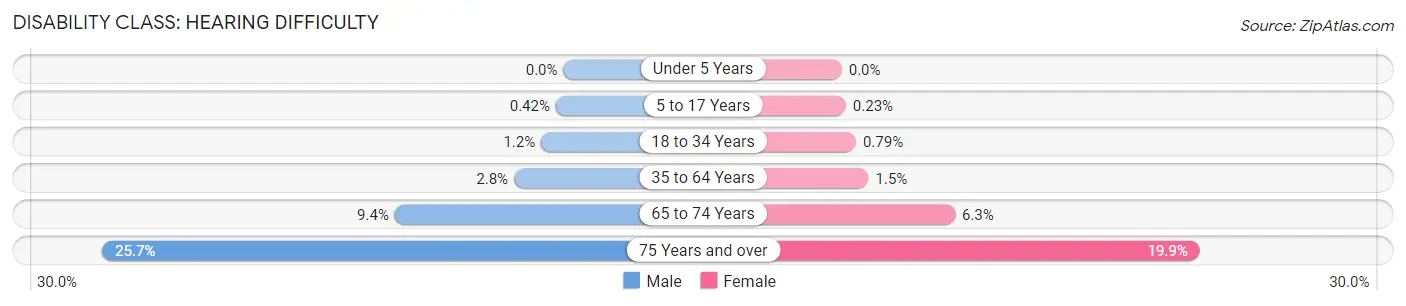
| Age Bracket | Male | Female |
| Under 5 Years | 0 (0.0%) | 0 (0.0%) |
| 5 to 17 Years | 42 (0.4%) | 21 (0.2%) |
| 18 to 34 Years | 147 (1.2%) | 97 (0.8%) |
| 35 to 64 Years | 593 (2.8%) | 321 (1.5%) |
| 65 to 74 Years | 417 (9.4%) | 313 (6.3%) |
| 75 Years and over | 661 (25.7%) | 641 (19.9%) |
Disability Class: Vision Difficulty
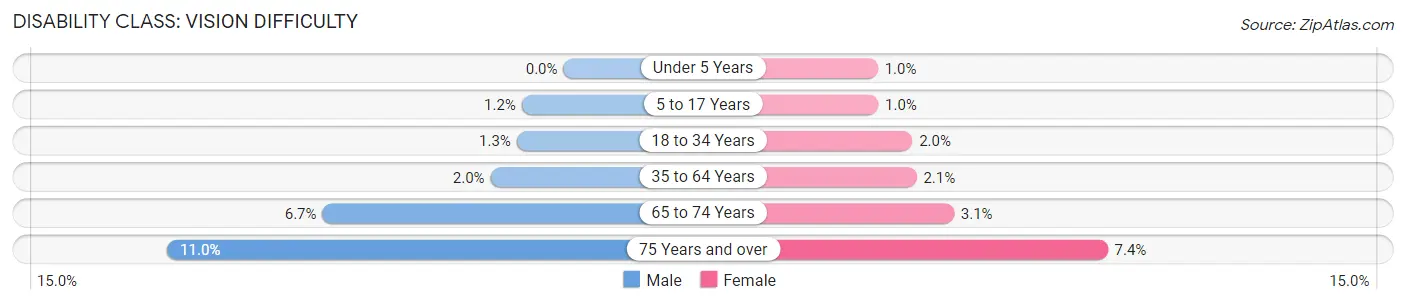
| Age Bracket | Male | Female |
| Under 5 Years | 0 (0.0%) | 33 (1.0%) |
| 5 to 17 Years | 116 (1.2%) | 92 (1.0%) |
| 18 to 34 Years | 154 (1.3%) | 241 (2.0%) |
| 35 to 64 Years | 439 (2.0%) | 449 (2.1%) |
| 65 to 74 Years | 298 (6.7%) | 155 (3.1%) |
| 75 Years and over | 284 (11.0%) | 238 (7.4%) |
Disability Class: Cognitive Difficulty
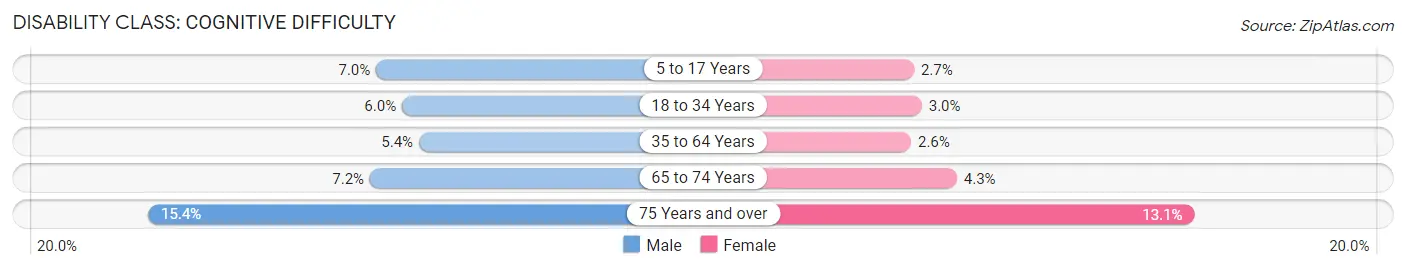
| Age Bracket | Male | Female |
| 5 to 17 Years | 693 (7.0%) | 243 (2.7%) |
| 18 to 34 Years | 712 (6.0%) | 365 (3.0%) |
| 35 to 64 Years | 1,158 (5.4%) | 553 (2.6%) |
| 65 to 74 Years | 319 (7.2%) | 212 (4.3%) |
| 75 Years and over | 397 (15.4%) | 421 (13.1%) |
Disability Class: Ambulatory Difficulty
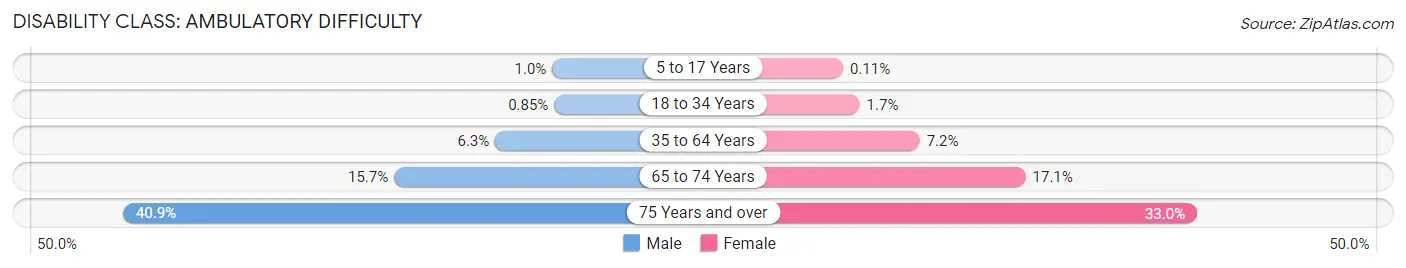
| Age Bracket | Male | Female |
| 5 to 17 Years | 104 (1.0%) | 10 (0.1%) |
| 18 to 34 Years | 101 (0.9%) | 204 (1.7%) |
| 35 to 64 Years | 1,367 (6.3%) | 1,558 (7.2%) |
| 65 to 74 Years | 698 (15.7%) | 847 (17.1%) |
| 75 Years and over | 1,052 (40.9%) | 1,060 (33.0%) |
Disability Class: Self-Care Difficulty
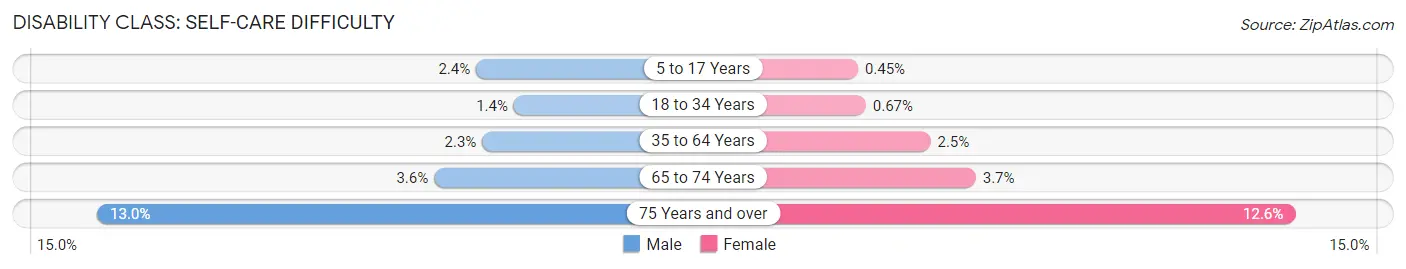
| Age Bracket | Male | Female |
| 5 to 17 Years | 242 (2.4%) | 41 (0.4%) |
| 18 to 34 Years | 164 (1.4%) | 82 (0.7%) |
| 35 to 64 Years | 487 (2.3%) | 532 (2.5%) |
| 65 to 74 Years | 160 (3.6%) | 185 (3.7%) |
| 75 Years and over | 334 (13.0%) | 406 (12.6%) |
Technology Access in Bartow County
Computing Device Access in Bartow County
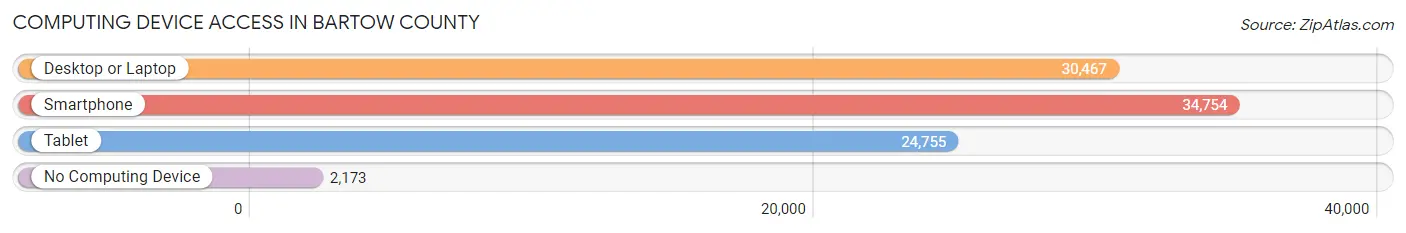
| Device Type | # Households | % Households |
| Desktop or Laptop | 30,467 | 79.3% |
| Smartphone | 34,754 | 90.4% |
| Tablet | 24,755 | 64.4% |
| No Computing Device | 2,173 | 5.7% |
| Total | 38,429 | 100.0% |
Internet Access in Bartow County
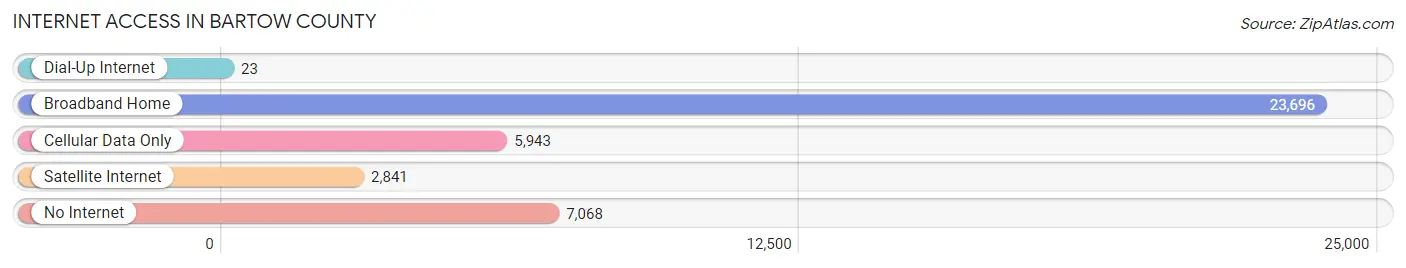
| Internet Type | # Households | % Households |
| Dial-Up Internet | 23 | 0.1% |
| Broadband Home | 23,696 | 61.7% |
| Cellular Data Only | 5,943 | 15.5% |
| Satellite Internet | 2,841 | 7.4% |
| No Internet | 7,068 | 18.4% |
| Total | 38,429 | 100.0% |
Bartow County Summary
Bartow County is located in the northwestern part of the state of Georgia, in the foothills of the Appalachian Mountains. It is bordered by Cherokee, Cobb, Floyd, Gordon, Paulding, and Polk counties. The county seat is Cartersville, and the county is named after Francis S. Bartow, a Confederate soldier and the first Confederate officer to die in the Civil War.
Geography
Bartow County covers an area of 437 square miles, of which 431 square miles is land and 6 square miles is water. The county is located in the foothills of the Appalachian Mountains, and is part of the Coosa River Basin. The Etowah River runs through the county, and Lake Allatoona is located in the northern part of the county. The terrain is mostly hilly, with some flat areas in the northern part of the county. The highest point in the county is Pine Mountain, which has an elevation of 1,717 feet.
Demographics
As of the 2010 census, Bartow County had a population of 100,157. The racial makeup of the county was 79.2% White, 15.3% African American, 0.5% Native American, 1.7% Asian, 0.1% Pacific Islander, 1.7% from other races, and 1.5% from two or more races. Hispanic or Latino of any race were 4.2% of the population.
The median household income in the county was $48,845, and the median family income was $58,837. The per capita income was $24,845. About 11.2% of the population was below the poverty line.
Economy
Bartow County is home to several major industries, including manufacturing, agriculture, and tourism. The county is home to several large manufacturing companies, including Shaw Industries, which produces carpets and rugs, and Mohawk Industries, which produces flooring products. The county is also home to several agricultural operations, including poultry farms, cattle farms, and vegetable farms.
Tourism is also an important part of the county's economy. The county is home to several popular attractions, including the Etowah Indian Mounds State Historic Site, the Booth Western Art Museum, and the Tellus Science Museum.
History
Bartow County was created in 1832 from parts of Cherokee and Floyd counties. The county was named after Francis S. Bartow, a Confederate soldier and the first Confederate officer to die in the Civil War.
During the Civil War, Bartow County was the site of several battles, including the Battle of Allatoona Pass and the Battle of Dallas. After the war, the county experienced a period of economic growth, as the railroad was built through the county and several manufacturing companies were established.
In the late 19th and early 20th centuries, the county was home to several prominent African-American leaders, including educator and civil rights activist W.E.B. Du Bois and civil rights leader John Lewis.
Today, Bartow County is a thriving community with a diverse economy and a rich history. The county is home to several major industries, including manufacturing, agriculture, and tourism. The county is also home to several popular attractions, including the Etowah Indian Mounds State Historic Site, the Booth Western Art Museum, and the Tellus Science Museum.
Common Questions
What is the Total Population of Bartow County?
Total Population of Bartow County is 109,410.
What is the Total Male Population of Bartow County?
Total Male Population of Bartow County is 54,685.
What is the Total Female Population of Bartow County?
Total Female Population of Bartow County is 54,725.
What is the Ratio of Males per 100 Females in Bartow County?
There are 99.93 Males per 100 Females in Bartow County.
What is the Ratio of Females per 100 Males in Bartow County?
There are 100.07 Females per 100 Males in Bartow County.
What is the Median Population Age in Bartow County?
Median Population Age in Bartow County is 38.2 Years.
What is the Average Family Size in Bartow County
Average Family Size in Bartow County is 3.3 People.
What is the Average Household Size in Bartow County
Average Household Size in Bartow County is 2.8 People.
What is Per Capita Income in Bartow County?
Per Capita income in Bartow County is $32,102.
What is the Median Family Income in Bartow County?
Median Family Income in Bartow County is $87,480.
What is the Median Household income in Bartow County?
Median Household Income in Bartow County is $74,812.
What is Income or Wage Gap in Bartow County?
Income or Wage Gap in Bartow County is 31.4%.
Women in Bartow County earn 68.6 cents for every dollar earned by a man.
What is Family Income Deficit in Bartow County?
Family Income Deficit in Bartow County is $11,288.
Families that are below poverty line in Bartow County earn $11,288 less on average than the poverty threshold level.
What is Inequality or Gini Index in Bartow County?
Inequality or Gini Index in Bartow County is 0.41.
How Large is the Labor Force in Bartow County?
There are 55,241 People in the Labor Forcein in Bartow County.
What is the Percentage of People in the Labor Force in Bartow County?
63.8% of People are in the Labor Force in Bartow County.
What is the Unemployment Rate in Bartow County?
Unemployment Rate in Bartow County is 5.5%.