Henry County, GA
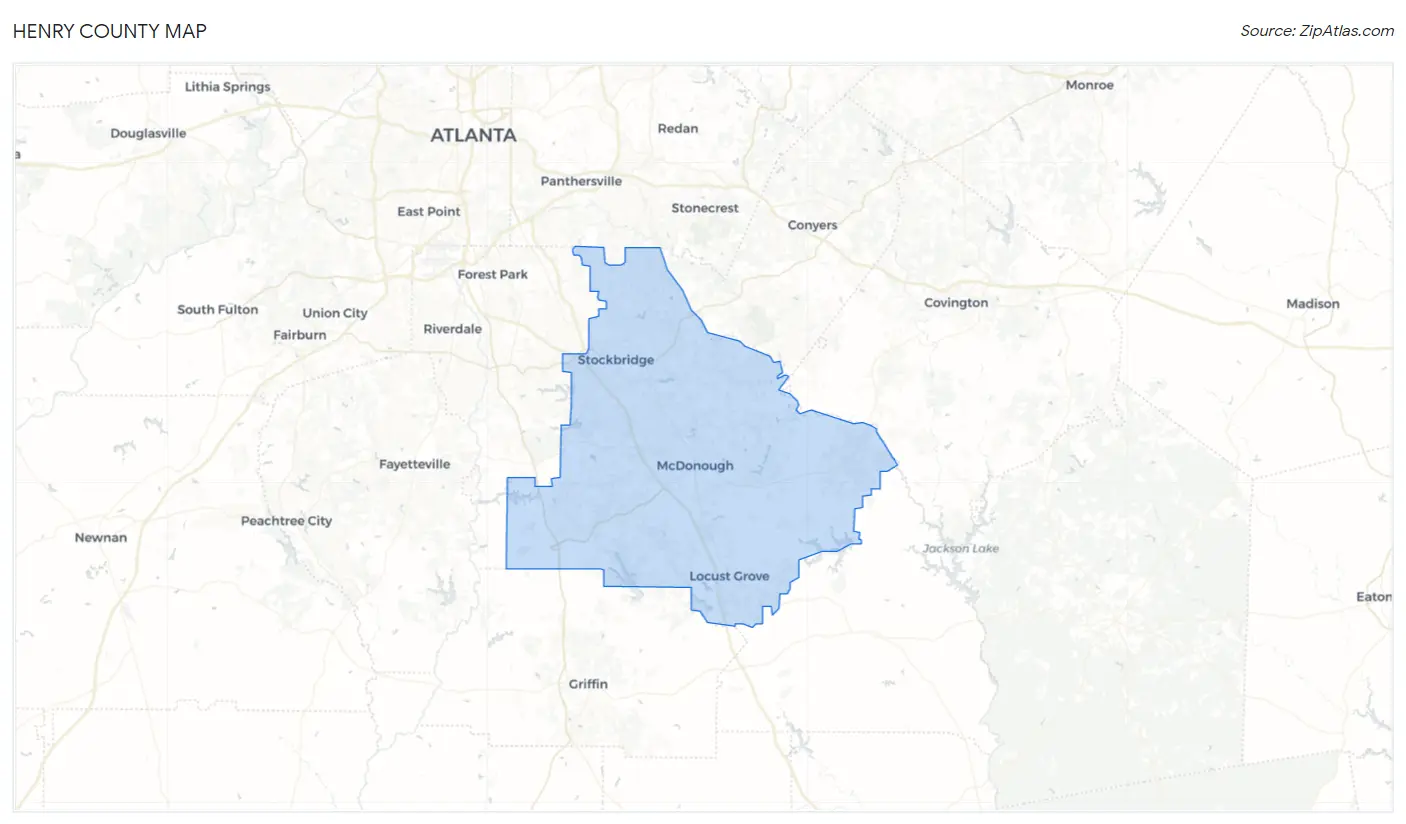
Henry County Map
Henry County Overview
240,853
TOTAL POPULATION
115,211
MALE POPULATION
125,642
FEMALE POPULATION
91.70
MALES / 100 FEMALES
109.05
FEMALES / 100 MALES
36.9
MEDIAN AGE
3.4
AVG FAMILY SIZE
2.9
AVG HOUSEHOLD SIZE
$35,065
PER CAPITA INCOME
$88,355
AVG FAMILY INCOME
$79,663
AVG HOUSEHOLD INCOME
24.8%
WAGE / INCOME GAP [ % ]
75.2¢/ $1
WAGE / INCOME GAP [ $ ]
$9,485
FAMILY INCOME DEFICIT
0.38
INEQUALITY / GINI INDEX
125,571
LABOR FORCE [ PEOPLE ]
66.5%
PERCENT IN LABOR FORCE
5.3%
UNEMPLOYMENT RATE
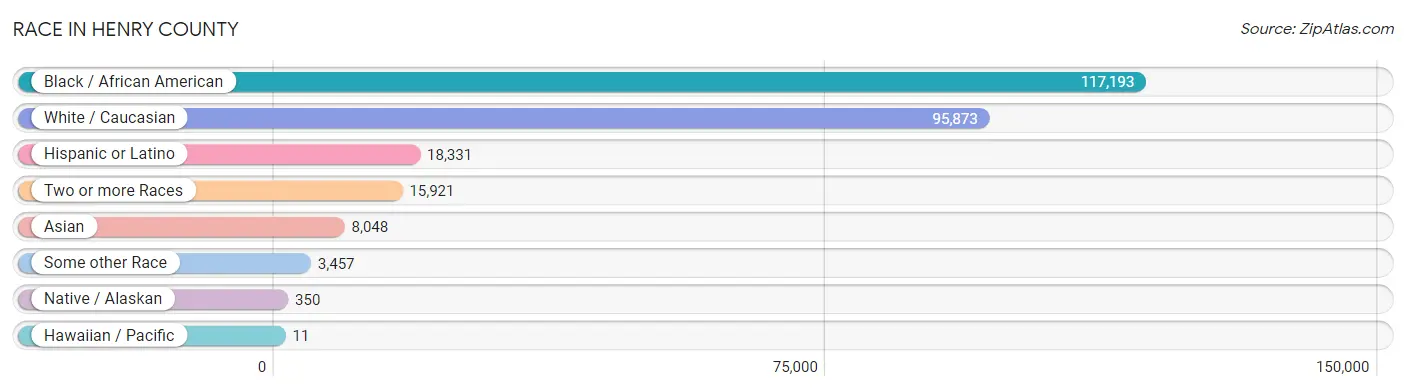
Race in Henry County
The most populous races in Henry County are Black / African American (117,193 | 48.7%), White / Caucasian (95,873 | 39.8%), and Hispanic or Latino (18,331 | 7.6%).
| Race | # Population | % Population |
| Asian | 8,048 | 3.3% |
| Black / African American | 117,193 | 48.7% |
| Hawaiian / Pacific | 11 | 0.0% |
| Hispanic or Latino | 18,331 | 7.6% |
| Native / Alaskan | 350 | 0.2% |
| White / Caucasian | 95,873 | 39.8% |
| Two or more Races | 15,921 | 6.6% |
| Some other Race | 3,457 | 1.4% |
| Total | 240,853 | 100.0% |
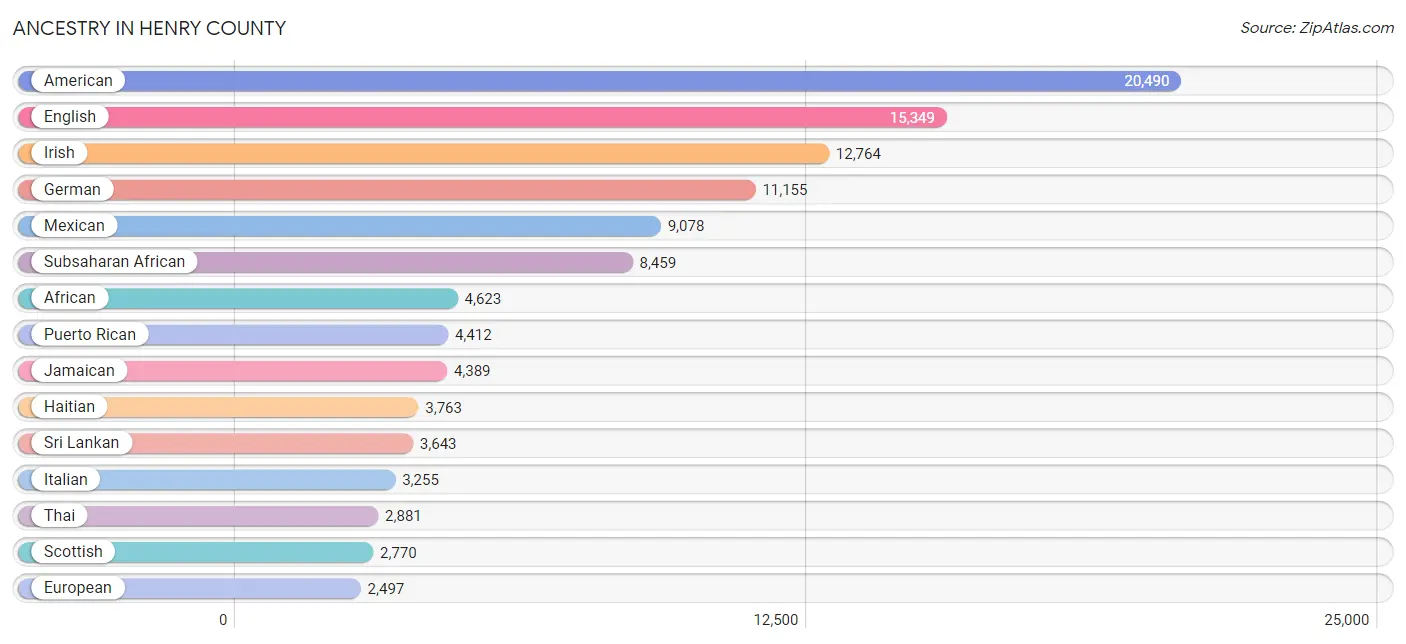
Ancestry in Henry County
The most populous ancestries reported in Henry County are American (20,490 | 8.5%), English (15,349 | 6.4%), Irish (12,764 | 5.3%), German (11,155 | 4.6%), and Mexican (9,078 | 3.8%), together accounting for 28.6% of all Henry County residents.
| Ancestry | # Population | % Population |
| African | 4,623 | 1.9% |
| American | 20,490 | 8.5% |
| Apache | 114 | 0.1% |
| Arab | 785 | 0.3% |
| Arapaho | 100 | 0.0% |
| Argentinean | 93 | 0.0% |
| Armenian | 145 | 0.1% |
| Australian | 14 | 0.0% |
| Austrian | 22 | 0.0% |
| Bahamian | 119 | 0.1% |
| Barbadian | 602 | 0.3% |
| Belgian | 22 | 0.0% |
| Belizean | 139 | 0.1% |
| Bhutanese | 344 | 0.1% |
| Blackfeet | 42 | 0.0% |
| Brazilian | 54 | 0.0% |
| British | 851 | 0.4% |
| British West Indian | 339 | 0.1% |
| Burmese | 362 | 0.2% |
| Canadian | 222 | 0.1% |
| Central American | 2,072 | 0.9% |
| Central American Indian | 235 | 0.1% |
| Cherokee | 747 | 0.3% |
| Chilean | 181 | 0.1% |
| Chinese | 7 | 0.0% |
| Choctaw | 62 | 0.0% |
| Colombian | 239 | 0.1% |
| Costa Rican | 36 | 0.0% |
| Creek | 116 | 0.1% |
| Croatian | 94 | 0.0% |
| Cuban | 564 | 0.2% |
| Czech | 67 | 0.0% |
| Czechoslovakian | 22 | 0.0% |
| Danish | 196 | 0.1% |
| Dominican | 652 | 0.3% |
| Dutch | 1,432 | 0.6% |
| Eastern European | 496 | 0.2% |
| Ecuadorian | 223 | 0.1% |
| Egyptian | 144 | 0.1% |
| English | 15,349 | 6.4% |
| Ethiopian | 684 | 0.3% |
| European | 2,497 | 1.0% |
| Filipino | 15 | 0.0% |
| Finnish | 44 | 0.0% |
| French | 1,562 | 0.6% |
| French Canadian | 436 | 0.2% |
| German | 11,155 | 4.6% |
| Ghanaian | 283 | 0.1% |
| Greek | 753 | 0.3% |
| Guatemalan | 72 | 0.0% |
| Guyanese | 984 | 0.4% |
| Haitian | 3,763 | 1.6% |
| Honduran | 1,340 | 0.6% |
| Hungarian | 80 | 0.0% |
| Icelander | 28 | 0.0% |
| Indian (Asian) | 731 | 0.3% |
| Indonesian | 8 | 0.0% |
| Irish | 12,764 | 5.3% |
| Israeli | 180 | 0.1% |
| Italian | 3,255 | 1.3% |
| Jamaican | 4,389 | 1.8% |
| Japanese | 153 | 0.1% |
| Kenyan | 75 | 0.0% |
| Korean | 1,266 | 0.5% |
| Laotian | 4 | 0.0% |
| Lebanese | 241 | 0.1% |
| Liberian | 535 | 0.2% |
| Lithuanian | 13 | 0.0% |
| Luxembourger | 12 | 0.0% |
| Macedonian | 15 | 0.0% |
| Malaysian | 124 | 0.1% |
| Mexican | 9,078 | 3.8% |
| Mexican American Indian | 108 | 0.0% |
| Moroccan | 163 | 0.1% |
| Native Hawaiian | 59 | 0.0% |
| Navajo | 27 | 0.0% |
| Nicaraguan | 55 | 0.0% |
| Nigerian | 1,720 | 0.7% |
| Northern European | 55 | 0.0% |
| Norwegian | 357 | 0.2% |
| Pakistani | 136 | 0.1% |
| Palestinian | 191 | 0.1% |
| Panamanian | 166 | 0.1% |
| Peruvian | 134 | 0.1% |
| Polish | 1,534 | 0.6% |
| Portuguese | 202 | 0.1% |
| Puerto Rican | 4,412 | 1.8% |
| Russian | 174 | 0.1% |
| Salvadoran | 403 | 0.2% |
| Samoan | 90 | 0.0% |
| Scandinavian | 417 | 0.2% |
| Scotch-Irish | 1,801 | 0.7% |
| Scottish | 2,770 | 1.1% |
| Seminole | 12 | 0.0% |
| Senegalese | 32 | 0.0% |
| Serbian | 25 | 0.0% |
| Sierra Leonean | 139 | 0.1% |
| Slavic | 7 | 0.0% |
| Slovak | 8 | 0.0% |
| South African | 22 | 0.0% |
| South American | 1,178 | 0.5% |
| Spaniard | 238 | 0.1% |
| Spanish | 75 | 0.0% |
| Sri Lankan | 3,643 | 1.5% |
| Subsaharan African | 8,459 | 3.5% |
| Swedish | 553 | 0.2% |
| Swiss | 122 | 0.1% |
| Syrian | 13 | 0.0% |
| Thai | 2,881 | 1.2% |
| Tongan | 9 | 0.0% |
| Trinidadian and Tobagonian | 444 | 0.2% |
| U.S. Virgin Islander | 18 | 0.0% |
| Ukrainian | 140 | 0.1% |
| Uruguayan | 187 | 0.1% |
| Venezuelan | 121 | 0.1% |
| Vietnamese | 61 | 0.0% |
| Welsh | 668 | 0.3% |
| West Indian | 594 | 0.3% |
| Yugoslavian | 37 | 0.0% | View All 119 Rows |
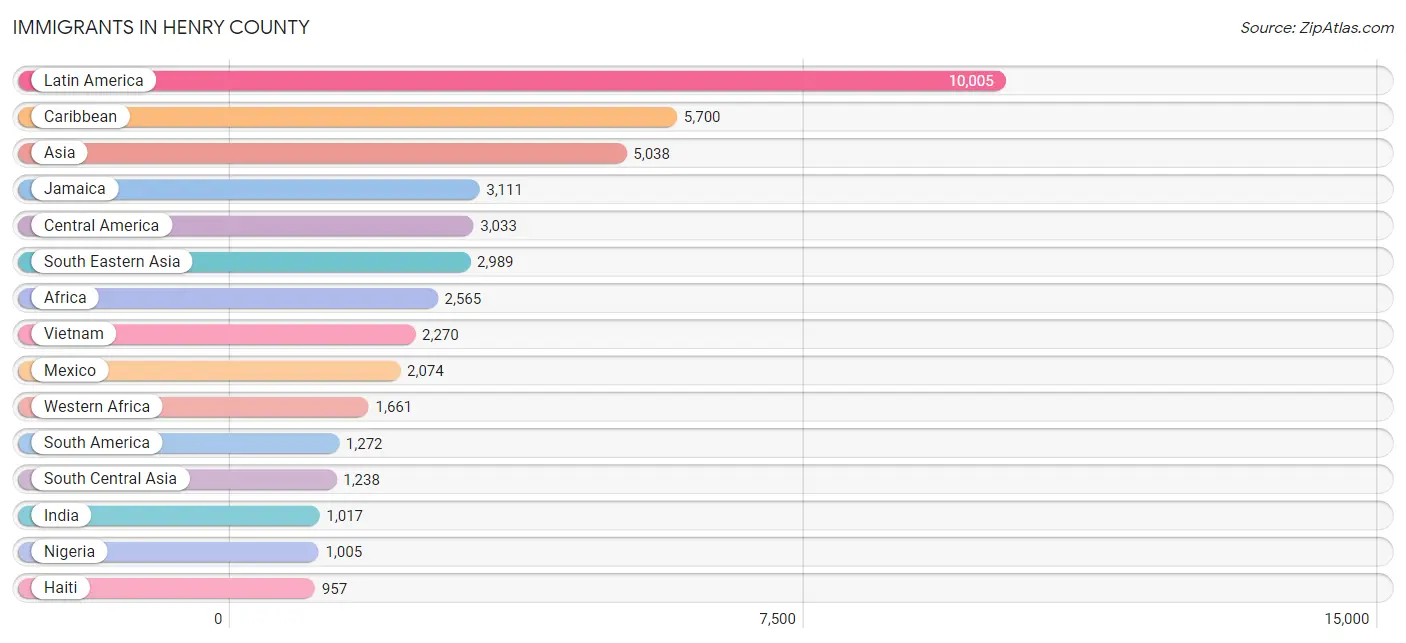
Immigrants in Henry County
The most numerous immigrant groups reported in Henry County came from Latin America (10,005 | 4.2%), Caribbean (5,700 | 2.4%), Asia (5,038 | 2.1%), Jamaica (3,111 | 1.3%), and Central America (3,033 | 1.3%), together accounting for 11.2% of all Henry County residents.
| Immigration Origin | # Population | % Population |
| Africa | 2,565 | 1.1% |
| Armenia | 11 | 0.0% |
| Asia | 5,038 | 2.1% |
| Australia | 37 | 0.0% |
| Austria | 20 | 0.0% |
| Bahamas | 152 | 0.1% |
| Bangladesh | 32 | 0.0% |
| Barbados | 160 | 0.1% |
| Belize | 178 | 0.1% |
| Bosnia and Herzegovina | 8 | 0.0% |
| Brazil | 46 | 0.0% |
| Cambodia | 60 | 0.0% |
| Cameroon | 53 | 0.0% |
| Canada | 319 | 0.1% |
| Caribbean | 5,700 | 2.4% |
| Central America | 3,033 | 1.3% |
| Chile | 49 | 0.0% |
| China | 371 | 0.2% |
| Colombia | 62 | 0.0% |
| Cuba | 150 | 0.1% |
| Dominican Republic | 329 | 0.1% |
| Eastern Africa | 561 | 0.2% |
| Eastern Asia | 682 | 0.3% |
| Eastern Europe | 114 | 0.1% |
| Ecuador | 168 | 0.1% |
| Egypt | 43 | 0.0% |
| El Salvador | 80 | 0.0% |
| England | 128 | 0.1% |
| Ethiopia | 382 | 0.2% |
| Europe | 642 | 0.3% |
| France | 13 | 0.0% |
| Germany | 219 | 0.1% |
| Ghana | 278 | 0.1% |
| Grenada | 63 | 0.0% |
| Guatemala | 73 | 0.0% |
| Guyana | 633 | 0.3% |
| Haiti | 957 | 0.4% |
| Honduras | 471 | 0.2% |
| Hong Kong | 43 | 0.0% |
| Hungary | 14 | 0.0% |
| India | 1,017 | 0.4% |
| Italy | 47 | 0.0% |
| Jamaica | 3,111 | 1.3% |
| Japan | 21 | 0.0% |
| Jordan | 33 | 0.0% |
| Kenya | 95 | 0.0% |
| Korea | 290 | 0.1% |
| Laos | 142 | 0.1% |
| Latin America | 10,005 | 4.2% |
| Lebanon | 85 | 0.0% |
| Liberia | 213 | 0.1% |
| Malaysia | 28 | 0.0% |
| Mexico | 2,074 | 0.9% |
| Middle Africa | 53 | 0.0% |
| Morocco | 153 | 0.1% |
| Netherlands | 9 | 0.0% |
| Nicaragua | 55 | 0.0% |
| Nigeria | 1,005 | 0.4% |
| Northern Africa | 196 | 0.1% |
| Northern Europe | 209 | 0.1% |
| Oceania | 40 | 0.0% |
| Pakistan | 189 | 0.1% |
| Panama | 102 | 0.0% |
| Peru | 129 | 0.1% |
| Philippines | 464 | 0.2% |
| Russia | 10 | 0.0% |
| Scotland | 7 | 0.0% |
| Senegal | 32 | 0.0% |
| Sierra Leone | 99 | 0.0% |
| South Africa | 70 | 0.0% |
| South America | 1,272 | 0.5% |
| South Central Asia | 1,238 | 0.5% |
| South Eastern Asia | 2,989 | 1.2% |
| Southern Europe | 47 | 0.0% |
| St. Vincent and the Grenadines | 36 | 0.0% |
| Switzerland | 11 | 0.0% |
| Taiwan | 39 | 0.0% |
| Thailand | 25 | 0.0% |
| Trinidad and Tobago | 315 | 0.1% |
| Uganda | 8 | 0.0% |
| Ukraine | 21 | 0.0% |
| Uruguay | 131 | 0.1% |
| Venezuela | 54 | 0.0% |
| Vietnam | 2,270 | 0.9% |
| Western Africa | 1,661 | 0.7% |
| Western Asia | 129 | 0.1% |
| Western Europe | 272 | 0.1% | View All 87 Rows |
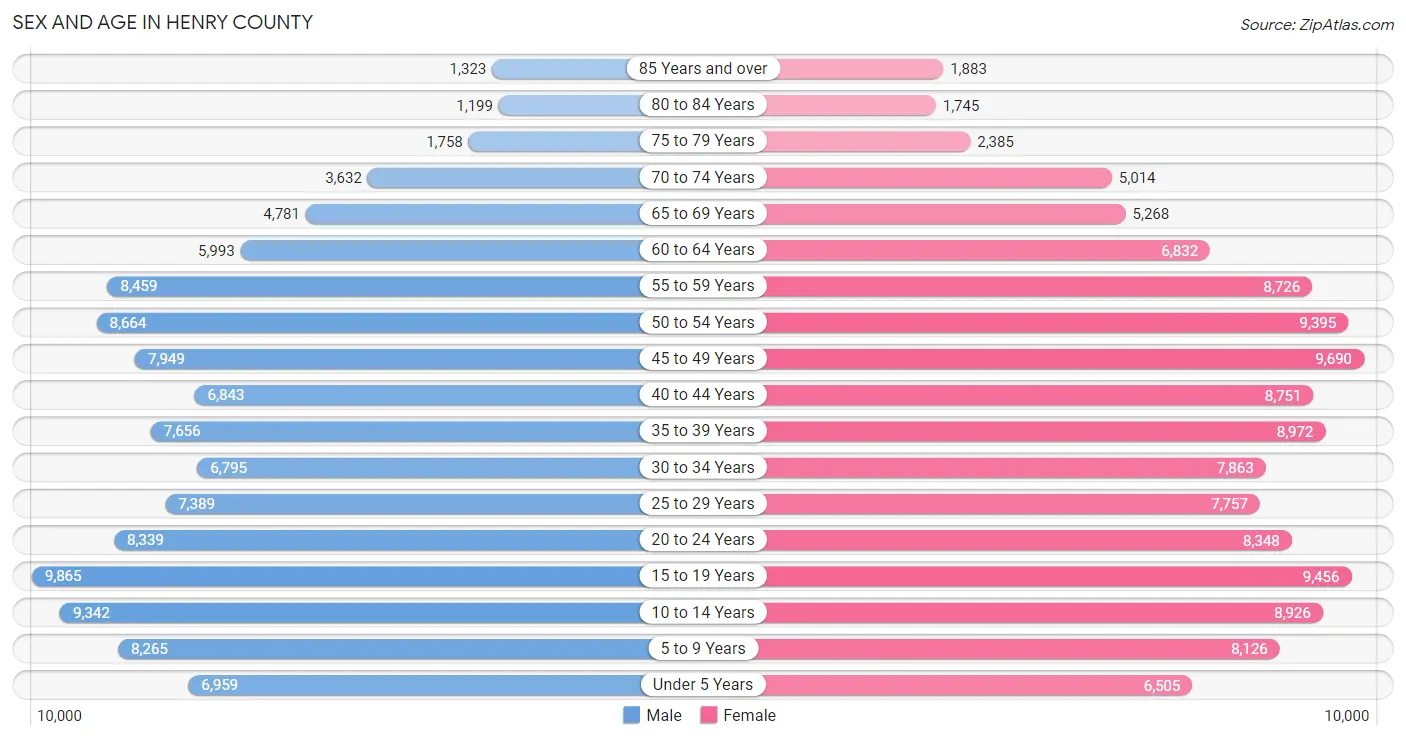
Sex and Age in Henry County
Sex and Age in Henry County
The most populous age groups in Henry County are 15 to 19 Years (9,865 | 8.6%) for men and 45 to 49 Years (9,690 | 7.7%) for women.
| Age Bracket | Male | Female |
| Under 5 Years | 6,959 (6.0%) | 6,505 (5.2%) |
| 5 to 9 Years | 8,265 (7.2%) | 8,126 (6.5%) |
| 10 to 14 Years | 9,342 (8.1%) | 8,926 (7.1%) |
| 15 to 19 Years | 9,865 (8.6%) | 9,456 (7.5%) |
| 20 to 24 Years | 8,339 (7.2%) | 8,348 (6.6%) |
| 25 to 29 Years | 7,389 (6.4%) | 7,757 (6.2%) |
| 30 to 34 Years | 6,795 (5.9%) | 7,863 (6.3%) |
| 35 to 39 Years | 7,656 (6.7%) | 8,972 (7.1%) |
| 40 to 44 Years | 6,843 (5.9%) | 8,751 (7.0%) |
| 45 to 49 Years | 7,949 (6.9%) | 9,690 (7.7%) |
| 50 to 54 Years | 8,664 (7.5%) | 9,395 (7.5%) |
| 55 to 59 Years | 8,459 (7.3%) | 8,726 (7.0%) |
| 60 to 64 Years | 5,993 (5.2%) | 6,832 (5.4%) |
| 65 to 69 Years | 4,781 (4.2%) | 5,268 (4.2%) |
| 70 to 74 Years | 3,632 (3.2%) | 5,014 (4.0%) |
| 75 to 79 Years | 1,758 (1.5%) | 2,385 (1.9%) |
| 80 to 84 Years | 1,199 (1.0%) | 1,745 (1.4%) |
| 85 Years and over | 1,323 (1.1%) | 1,883 (1.5%) |
| Total | 115,211 (100.0%) | 125,642 (100.0%) |
Families and Households in Henry County
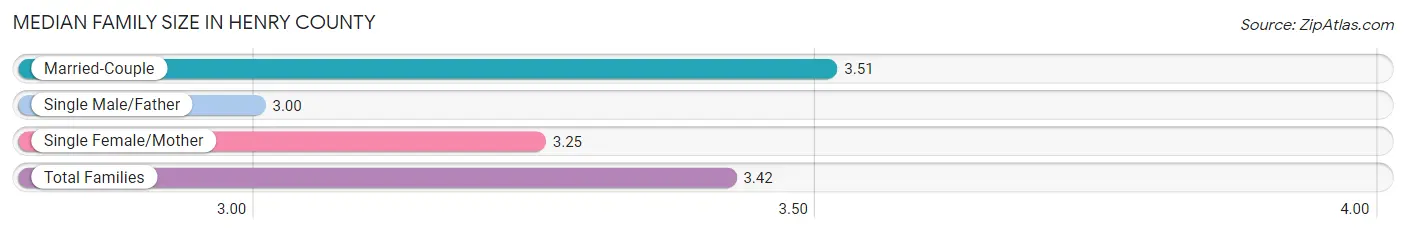
Median Family Size in Henry County
The median family size in Henry County is 3.42 persons per family, with married-couple families (42,233 | 69.8%) accounting for the largest median family size of 3.51 persons per family. On the other hand, single male/father families (3,826 | 6.3%) represent the smallest median family size with 3.00 persons per family.
| Family Type | # Families | Family Size |
| Married-Couple | 42,233 (69.8%) | 3.51 |
| Single Male/Father | 3,826 (6.3%) | 3.00 |
| Single Female/Mother | 14,417 (23.8%) | 3.25 |
| Total Families | 60,476 (100.0%) | 3.42 |
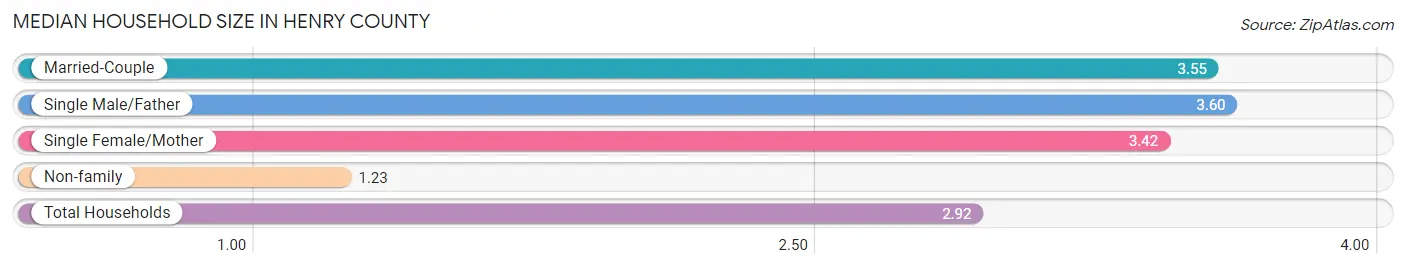
Median Household Size in Henry County
The median household size in Henry County is 2.92 persons per household, with single male/father households (3,826 | 4.6%) accounting for the largest median household size of 3.6 persons per household. non-family households (21,756 | 26.5%) represent the smallest median household size with 1.23 persons per household.
| Household Type | # Households | Household Size |
| Married-Couple | 42,233 (51.4%) | 3.55 |
| Single Male/Father | 3,826 (4.6%) | 3.60 |
| Single Female/Mother | 14,417 (17.5%) | 3.42 |
| Non-family | 21,756 (26.5%) | 1.23 |
| Total Households | 82,232 (100.0%) | 2.92 |
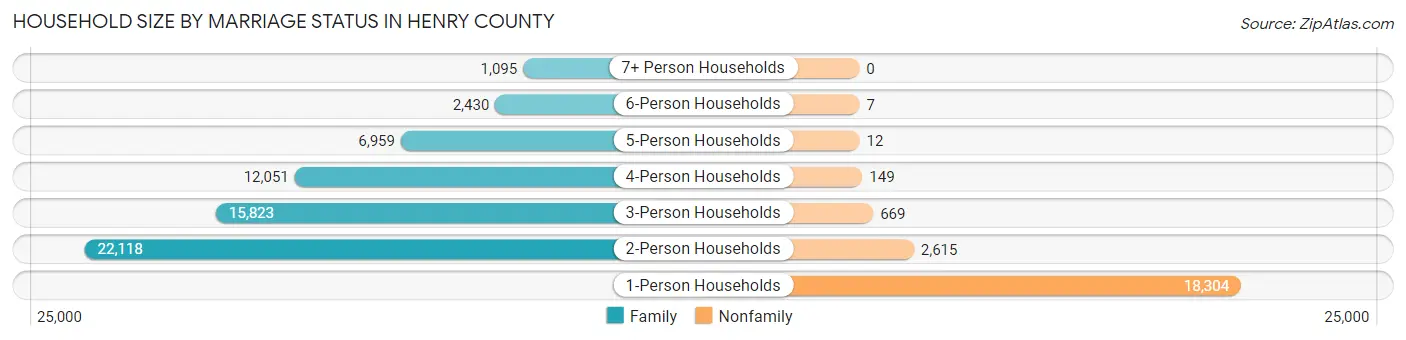
Household Size by Marriage Status in Henry County
Out of a total of 82,232 households in Henry County, 60,476 (73.5%) are family households, while 21,756 (26.5%) are nonfamily households. The most numerous type of family households are 2-person households, comprising 22,118, and the most common type of nonfamily households are 1-person households, comprising 18,304.
| Household Size | Family Households | Nonfamily Households |
| 1-Person Households | - | 18,304 (22.3%) |
| 2-Person Households | 22,118 (26.9%) | 2,615 (3.2%) |
| 3-Person Households | 15,823 (19.2%) | 669 (0.8%) |
| 4-Person Households | 12,051 (14.6%) | 149 (0.2%) |
| 5-Person Households | 6,959 (8.5%) | 12 (0.0%) |
| 6-Person Households | 2,430 (3.0%) | 7 (0.0%) |
| 7+ Person Households | 1,095 (1.3%) | 0 (0.0%) |
| Total | 60,476 (73.5%) | 21,756 (26.5%) |
Female Fertility in Henry County
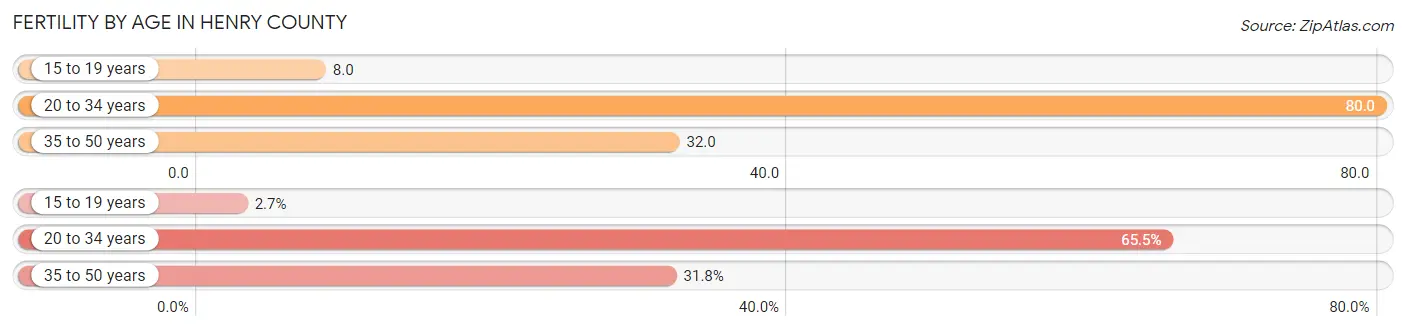
Fertility by Age in Henry County
Average fertility rate in Henry County is 47.0 births per 1,000 women. Women in the age bracket of 20 to 34 years have the highest fertility rate with 80.0 births per 1,000 women. Women in the age bracket of 20 to 34 years acount for 65.5% of all women with births.
| Age Bracket | Women with Births | Births / 1,000 Women |
| 15 to 19 years | 79 (2.7%) | 8.0 |
| 20 to 34 years | 1,924 (65.5%) | 80.0 |
| 35 to 50 years | 934 (31.8%) | 32.0 |
| Total | 2,937 (100.0%) | 47.0 |
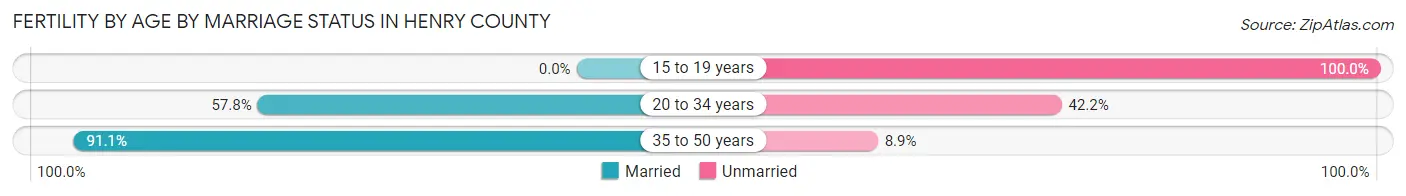
Fertility by Age by Marriage Status in Henry County
66.9% of women with births (2,937) in Henry County are married. The highest percentage of unmarried women with births falls into 15 to 19 years age bracket with 100.0% of them unmarried at the time of birth, while the lowest percentage of unmarried women with births belong to 35 to 50 years age bracket with 8.9% of them unmarried.
| Age Bracket | Married | Unmarried |
| 15 to 19 years | 0 (0.0%) | 79 (100.0%) |
| 20 to 34 years | 1,112 (57.8%) | 812 (42.2%) |
| 35 to 50 years | 851 (91.1%) | 83 (8.9%) |
| Total | 1,965 (66.9%) | 972 (33.1%) |
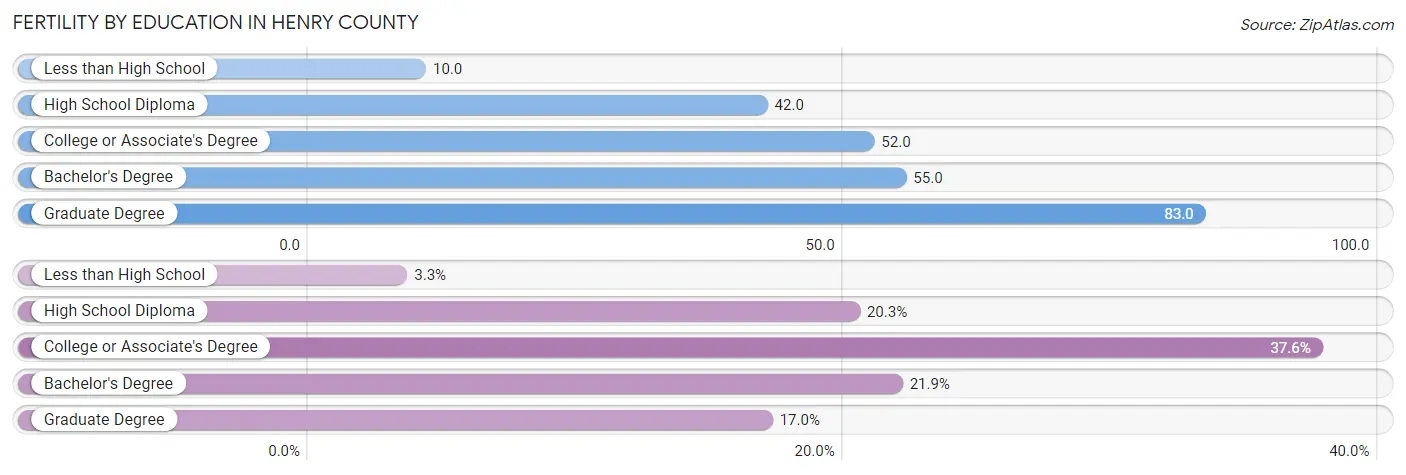
Fertility by Education in Henry County
Average fertility rate in Henry County is 47.0 births per 1,000 women. Women with the education attainment of graduate degree have the highest fertility rate of 83.0 births per 1,000 women, while women with the education attainment of less than high school have the lowest fertility at 10.0 births per 1,000 women. Women with the education attainment of college or associate's degree represent 37.6% of all women with births.
| Educational Attainment | Women with Births | Births / 1,000 Women |
| Less than High School | 97 (3.3%) | 10.0 |
| High School Diploma | 595 (20.3%) | 42.0 |
| College or Associate's Degree | 1,104 (37.6%) | 52.0 |
| Bachelor's Degree | 642 (21.9%) | 55.0 |
| Graduate Degree | 499 (17.0%) | 83.0 |
| Total | 2,937 (100.0%) | 47.0 |
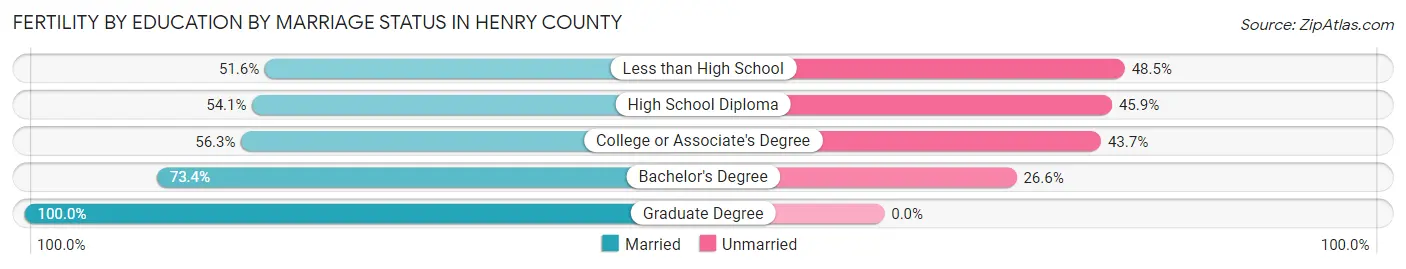
Fertility by Education by Marriage Status in Henry County
33.1% of women with births in Henry County are unmarried. Women with the educational attainment of graduate degree are most likely to be married with 100.0% of them married at childbirth, while women with the educational attainment of less than high school are least likely to be married with 48.4% of them unmarried at childbirth.
| Educational Attainment | Married | Unmarried |
| Less than High School | 50 (51.5%) | 47 (48.4%) |
| High School Diploma | 322 (54.1%) | 273 (45.9%) |
| College or Associate's Degree | 622 (56.3%) | 482 (43.7%) |
| Bachelor's Degree | 471 (73.4%) | 171 (26.6%) |
| Graduate Degree | 499 (100.0%) | 0 (0.0%) |
| Total | 1,965 (66.9%) | 972 (33.1%) |
Income in Henry County
Income Overview in Henry County
Per Capita Income in Henry County is $35,065, while median incomes of families and households are $88,355 and $79,663 respectively.
| Characteristic | Number | Measure |
| Per Capita Income | 240,853 | $35,065 |
| Median Family Income | 60,476 | $88,355 |
| Mean Family Income | 60,476 | $107,256 |
| Median Household Income | 82,232 | $79,663 |
| Mean Household Income | 82,232 | $98,501 |
| Income Deficit | 60,476 | $9,485 |
| Wage / Income Gap (%) | 240,853 | 24.81% |
| Wage / Income Gap ($) | 240,853 | 75.19¢ per $1 |
| Gini / Inequality Index | 240,853 | 0.38 |
Earnings by Sex in Henry County
Average Earnings in Henry County are $44,474, $50,189 for men and $37,736 for women, a difference of 24.8%.
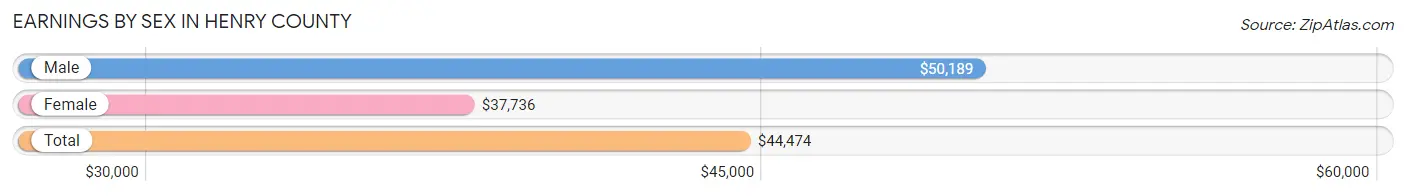
| Sex | Number | Average Earnings |
| Male | 64,250 (49.8%) | $50,189 |
| Female | 64,729 (50.2%) | $37,736 |
| Total | 128,979 (100.0%) | $44,474 |
Earnings by Sex by Income Bracket in Henry County
The most common earnings brackets in Henry County are $100,000+ for men (10,780 | 16.8%) and $75,000 to $99,999 for women (6,553 | 10.1%).
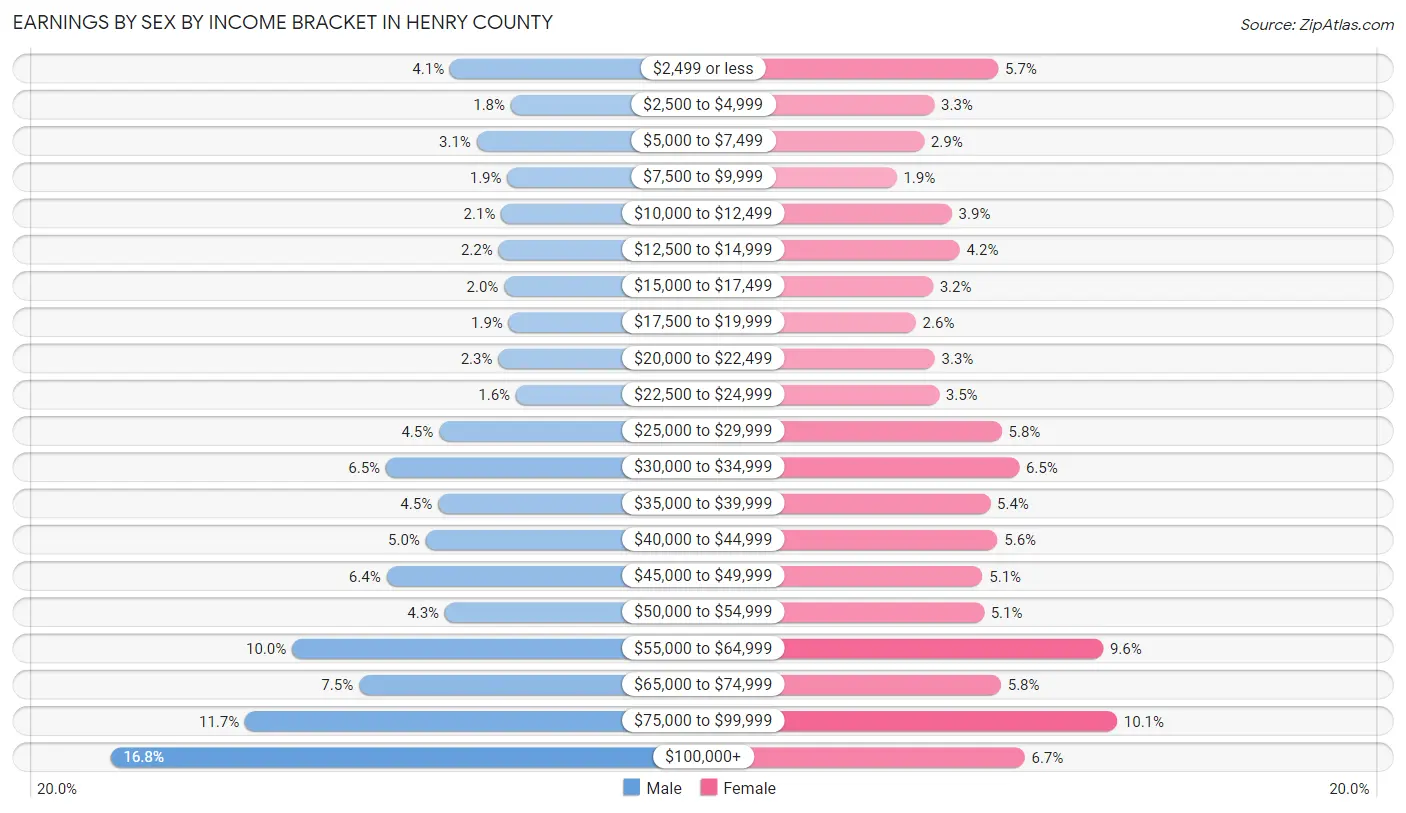
| Income | Male | Female |
| $2,499 or less | 2,607 (4.1%) | 3,671 (5.7%) |
| $2,500 to $4,999 | 1,142 (1.8%) | 2,115 (3.3%) |
| $5,000 to $7,499 | 1,969 (3.1%) | 1,871 (2.9%) |
| $7,500 to $9,999 | 1,229 (1.9%) | 1,204 (1.9%) |
| $10,000 to $12,499 | 1,378 (2.1%) | 2,547 (3.9%) |
| $12,500 to $14,999 | 1,438 (2.2%) | 2,735 (4.2%) |
| $15,000 to $17,499 | 1,306 (2.0%) | 2,084 (3.2%) |
| $17,500 to $19,999 | 1,198 (1.9%) | 1,671 (2.6%) |
| $20,000 to $22,499 | 1,448 (2.2%) | 2,132 (3.3%) |
| $22,500 to $24,999 | 1,021 (1.6%) | 2,230 (3.5%) |
| $25,000 to $29,999 | 2,875 (4.5%) | 3,753 (5.8%) |
| $30,000 to $34,999 | 4,152 (6.5%) | 4,176 (6.5%) |
| $35,000 to $39,999 | 2,895 (4.5%) | 3,476 (5.4%) |
| $40,000 to $44,999 | 3,194 (5.0%) | 3,650 (5.6%) |
| $45,000 to $49,999 | 4,136 (6.4%) | 3,287 (5.1%) |
| $50,000 to $54,999 | 2,729 (4.3%) | 3,322 (5.1%) |
| $55,000 to $64,999 | 6,412 (10.0%) | 6,211 (9.6%) |
| $65,000 to $74,999 | 4,799 (7.5%) | 3,732 (5.8%) |
| $75,000 to $99,999 | 7,542 (11.7%) | 6,553 (10.1%) |
| $100,000+ | 10,780 (16.8%) | 4,309 (6.7%) |
| Total | 64,250 (100.0%) | 64,729 (100.0%) |
Earnings by Sex by Educational Attainment in Henry County
Average earnings in Henry County are $56,712 for men and $43,836 for women, a difference of 22.7%. Men with an educational attainment of graduate degree enjoy the highest average annual earnings of $93,824, while those with high school diploma education earn the least with $46,748. Women with an educational attainment of graduate degree earn the most with the average annual earnings of $66,080, while those with less than high school education have the smallest earnings of $27,543.
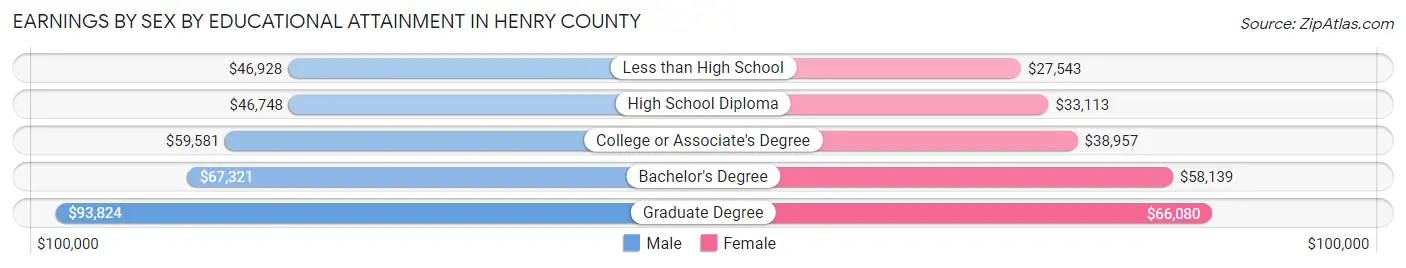
| Educational Attainment | Male Income | Female Income |
| Less than High School | $46,928 | $27,543 |
| High School Diploma | $46,748 | $33,113 |
| College or Associate's Degree | $59,581 | $38,957 |
| Bachelor's Degree | $67,321 | $58,139 |
| Graduate Degree | $93,824 | $66,080 |
| Total | $56,712 | $43,836 |
Family Income in Henry County
Family Income Brackets in Henry County
According to the Henry County family income data, there are 12,881 families falling into the $100,000 to $149,999 income range, which is the most common income bracket and makes up 21.3% of all families. Conversely, the $10,000 to $14,999 income bracket is the least frequent group with only 605 families (1.0%) belonging to this category.
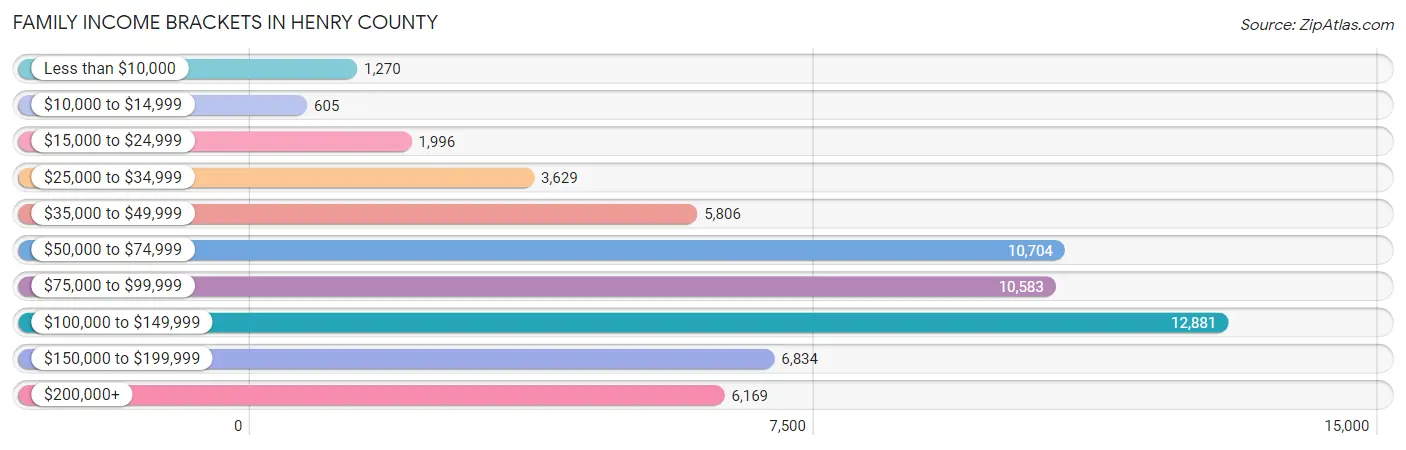
| Income Bracket | # Families | % Families |
| Less than $10,000 | 1,270 | 2.1% |
| $10,000 to $14,999 | 605 | 1.0% |
| $15,000 to $24,999 | 1,996 | 3.3% |
| $25,000 to $34,999 | 3,629 | 6.0% |
| $35,000 to $49,999 | 5,806 | 9.6% |
| $50,000 to $74,999 | 10,704 | 17.7% |
| $75,000 to $99,999 | 10,583 | 17.5% |
| $100,000 to $149,999 | 12,881 | 21.3% |
| $150,000 to $199,999 | 6,834 | 11.3% |
| $200,000+ | 6,169 | 10.2% |
Family Income by Famaliy Size in Henry County
6-person families (2,228 | 3.7%) account for the highest median family income in Henry County with $116,687 per family, while 2-person families (24,132 | 39.9%) have the highest median income of $38,506 per family member.
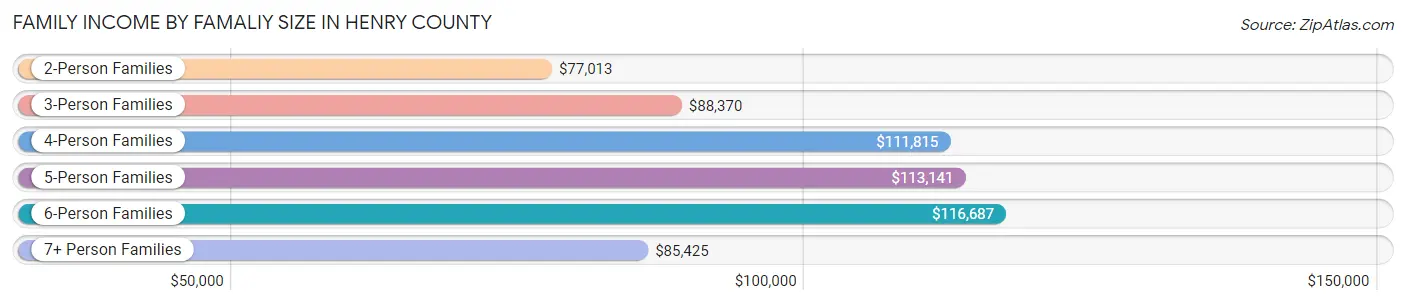
| Income Bracket | # Families | Median Income |
| 2-Person Families | 24,132 (39.9%) | $77,013 |
| 3-Person Families | 15,545 (25.7%) | $88,370 |
| 4-Person Families | 11,693 (19.3%) | $111,815 |
| 5-Person Families | 5,943 (9.8%) | $113,141 |
| 6-Person Families | 2,228 (3.7%) | $116,687 |
| 7+ Person Families | 935 (1.5%) | $85,425 |
| Total | 60,476 (100.0%) | $88,355 |
Family Income by Number of Earners in Henry County
The median family income in Henry County is $88,355, with families comprising 3+ earners (8,711) having the highest median family income of $146,554, while families with no earners (6,074) have the lowest median family income of $52,715, accounting for 14.4% and 10.0% of families, respectively.
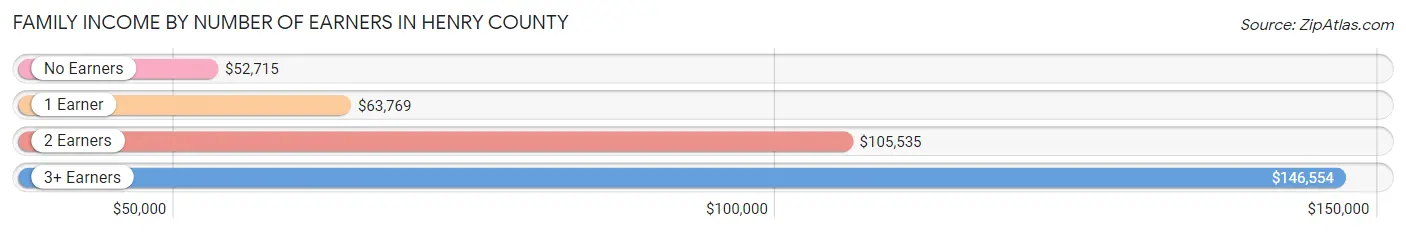
| Number of Earners | # Families | Median Income |
| No Earners | 6,074 (10.0%) | $52,715 |
| 1 Earner | 20,903 (34.6%) | $63,769 |
| 2 Earners | 24,788 (41.0%) | $105,535 |
| 3+ Earners | 8,711 (14.4%) | $146,554 |
| Total | 60,476 (100.0%) | $88,355 |
Household Income in Henry County
Household Income Brackets in Henry County
With 16,117 households falling in the category, the $50,000 to $74,999 income range is the most frequent in Henry County, accounting for 19.6% of all households. In contrast, only 1,480 households (1.8%) fall into the $10,000 to $14,999 income bracket, making it the least populous group.
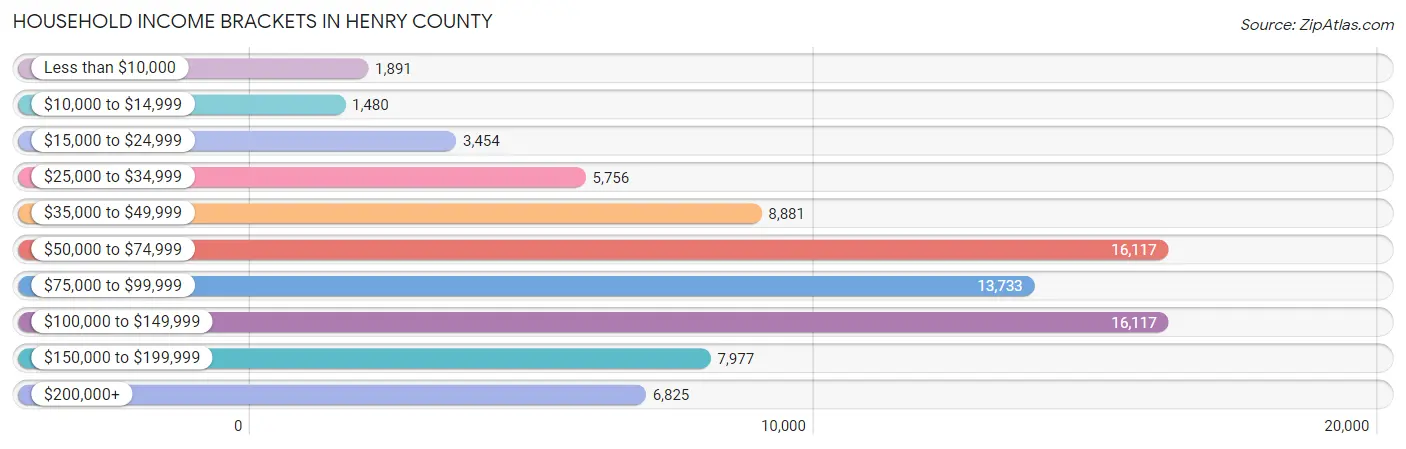
| Income Bracket | # Households | % Households |
| Less than $10,000 | 1,891 | 2.3% |
| $10,000 to $14,999 | 1,480 | 1.8% |
| $15,000 to $24,999 | 3,454 | 4.2% |
| $25,000 to $34,999 | 5,756 | 7.0% |
| $35,000 to $49,999 | 8,881 | 10.8% |
| $50,000 to $74,999 | 16,117 | 19.6% |
| $75,000 to $99,999 | 13,733 | 16.7% |
| $100,000 to $149,999 | 16,117 | 19.6% |
| $150,000 to $199,999 | 7,977 | 9.7% |
| $200,000+ | 6,825 | 8.3% |
Household Income by Householder Age in Henry County
The median household income in Henry County is $79,663, with the highest median household income of $94,513 found in the 45 to 64 years age bracket for the primary householder. A total of 36,369 households (44.2%) fall into this category. Meanwhile, the 65+ years age bracket for the primary householder has the lowest median household income of $57,578, with 17,296 households (21.0%) in this group.
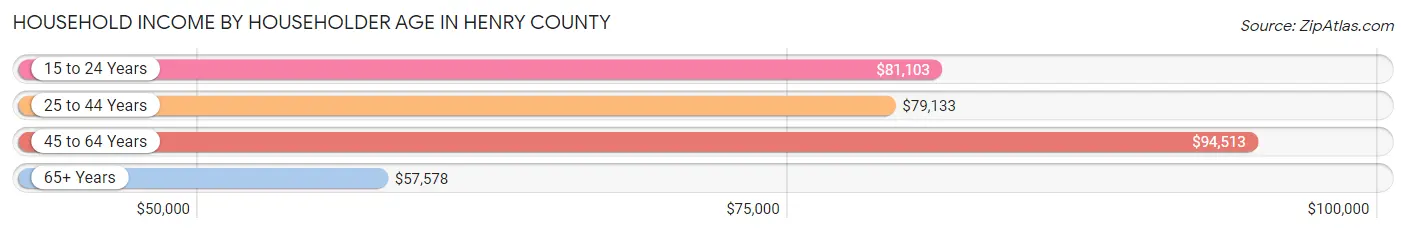
| Income Bracket | # Households | Median Income |
| 15 to 24 Years | 1,641 (2.0%) | $81,103 |
| 25 to 44 Years | 26,926 (32.7%) | $79,133 |
| 45 to 64 Years | 36,369 (44.2%) | $94,513 |
| 65+ Years | 17,296 (21.0%) | $57,578 |
| Total | 82,232 (100.0%) | $79,663 |
Poverty in Henry County
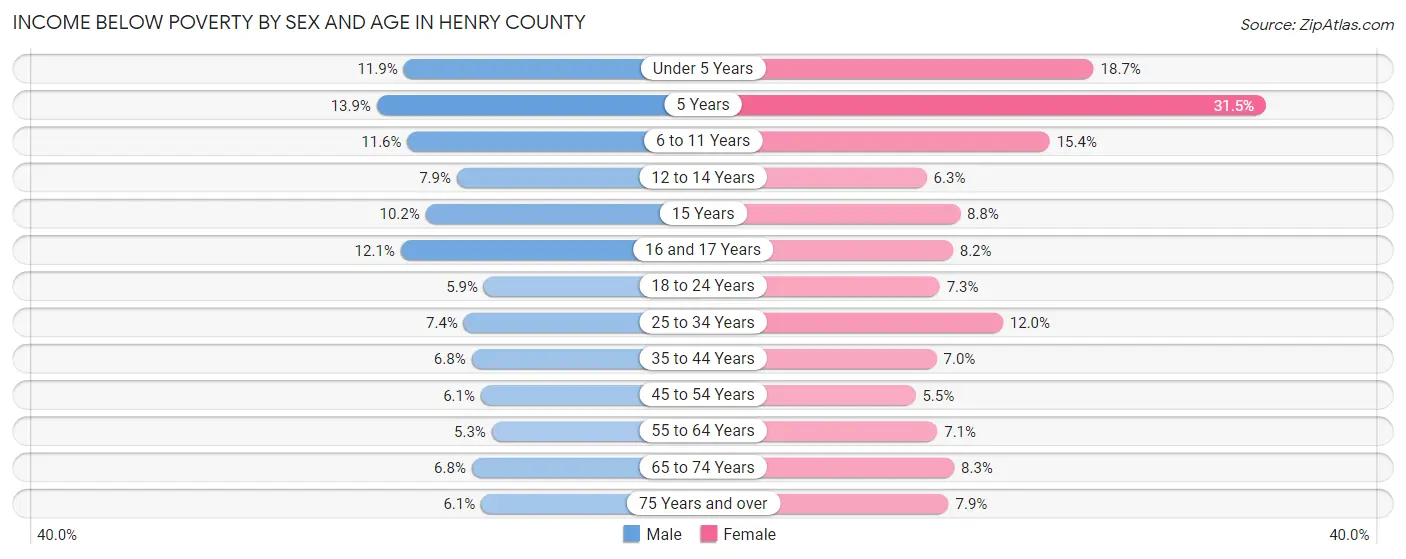
Income Below Poverty by Sex and Age in Henry County
With 7.6% poverty level for males and 9.2% for females among the residents of Henry County, 5 year old males and 5 year old females are the most vulnerable to poverty, with 230 males (13.9%) and 427 females (31.5%) in their respective age groups living below the poverty level.
| Age Bracket | Male | Female |
| Under 5 Years | 816 (11.9%) | 1,213 (18.7%) |
| 5 Years | 230 (13.9%) | 427 (31.5%) |
| 6 to 11 Years | 1,145 (11.6%) | 1,562 (15.4%) |
| 12 to 14 Years | 468 (7.9%) | 331 (6.3%) |
| 15 Years | 195 (10.2%) | 175 (8.8%) |
| 16 and 17 Years | 537 (12.1%) | 341 (8.2%) |
| 18 to 24 Years | 690 (5.9%) | 847 (7.3%) |
| 25 to 34 Years | 1,037 (7.4%) | 1,861 (12.0%) |
| 35 to 44 Years | 977 (6.8%) | 1,248 (7.0%) |
| 45 to 54 Years | 1,017 (6.1%) | 1,041 (5.5%) |
| 55 to 64 Years | 767 (5.3%) | 1,101 (7.1%) |
| 65 to 74 Years | 571 (6.8%) | 855 (8.3%) |
| 75 Years and over | 260 (6.1%) | 468 (7.9%) |
| Total | 8,710 (7.6%) | 11,470 (9.2%) |
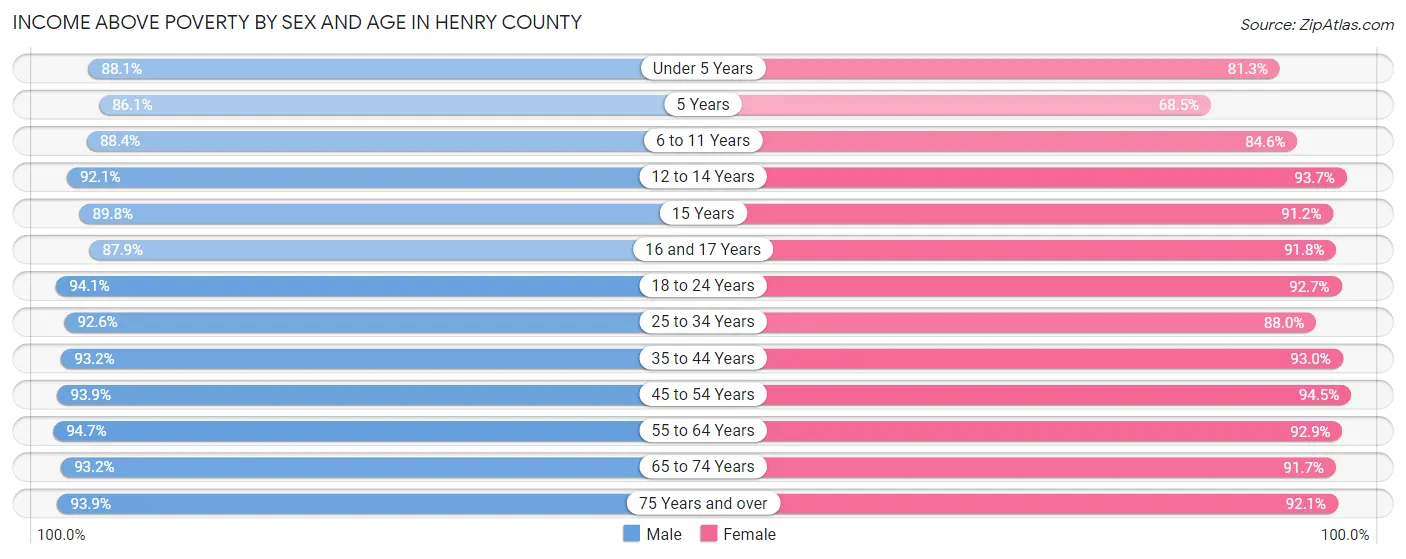
Income Above Poverty by Sex and Age in Henry County
According to the poverty statistics in Henry County, males aged 55 to 64 years and females aged 45 to 54 years are the age groups that are most secure financially, with 94.7% of males and 94.5% of females in these age groups living above the poverty line.
| Age Bracket | Male | Female |
| Under 5 Years | 6,058 (88.1%) | 5,273 (81.3%) |
| 5 Years | 1,429 (86.1%) | 929 (68.5%) |
| 6 to 11 Years | 8,743 (88.4%) | 8,552 (84.6%) |
| 12 to 14 Years | 5,445 (92.1%) | 4,927 (93.7%) |
| 15 Years | 1,712 (89.8%) | 1,818 (91.2%) |
| 16 and 17 Years | 3,909 (87.9%) | 3,799 (91.8%) |
| 18 to 24 Years | 10,999 (94.1%) | 10,811 (92.7%) |
| 25 to 34 Years | 12,978 (92.6%) | 13,705 (88.0%) |
| 35 to 44 Years | 13,357 (93.2%) | 16,475 (93.0%) |
| 45 to 54 Years | 15,584 (93.9%) | 17,997 (94.5%) |
| 55 to 64 Years | 13,651 (94.7%) | 14,422 (92.9%) |
| 65 to 74 Years | 7,826 (93.2%) | 9,396 (91.7%) |
| 75 Years and over | 3,995 (93.9%) | 5,430 (92.1%) |
| Total | 105,686 (92.4%) | 113,534 (90.8%) |
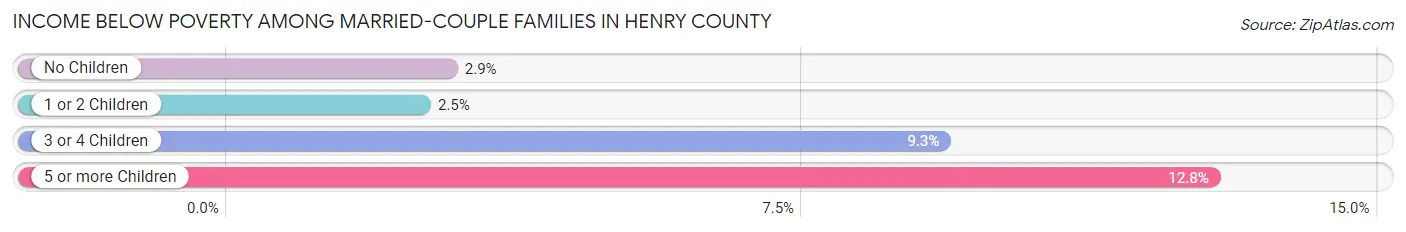
Income Below Poverty Among Married-Couple Families in Henry County
The poverty statistics for married-couple families in Henry County show that 3.5% or 1,463 of the total 42,233 families live below the poverty line. Families with 5 or more children have the highest poverty rate of 12.8%, comprising of 39 families. On the other hand, families with 1 or 2 children have the lowest poverty rate of 2.5%, which includes 376 families.
| Children | Above Poverty | Below Poverty |
| No Children | 22,112 (97.1%) | 653 (2.9%) |
| 1 or 2 Children | 14,547 (97.5%) | 376 (2.5%) |
| 3 or 4 Children | 3,846 (90.7%) | 395 (9.3%) |
| 5 or more Children | 265 (87.2%) | 39 (12.8%) |
| Total | 40,770 (96.5%) | 1,463 (3.5%) |
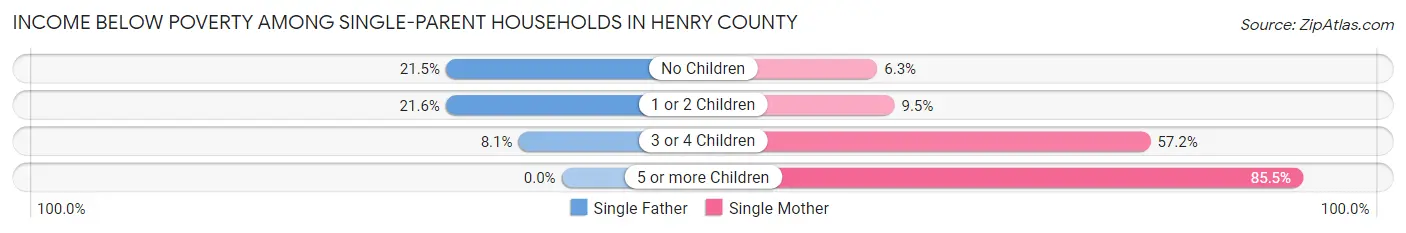
Income Below Poverty Among Single-Parent Households in Henry County
According to the poverty data in Henry County, 20.6% or 787 single-father households and 13.0% or 1,877 single-mother households are living below the poverty line. Among single-father households, those with 1 or 2 children have the highest poverty rate, with 343 households (21.6%) experiencing poverty. Likewise, among single-mother households, those with 5 or more children have the highest poverty rate, with 124 households (85.5%) falling below the poverty line.
| Children | Single Father | Single Mother |
| No Children | 423 (21.5%) | 357 (6.3%) |
| 1 or 2 Children | 343 (21.6%) | 697 (9.5%) |
| 3 or 4 Children | 21 (8.1%) | 699 (57.2%) |
| 5 or more Children | 0 (0.0%) | 124 (85.5%) |
| Total | 787 (20.6%) | 1,877 (13.0%) |
Income Below Poverty Among Married-Couple vs Single-Parent Households in Henry County
The poverty data for Henry County shows that 1,463 of the married-couple family households (3.5%) and 2,664 of the single-parent households (14.6%) are living below the poverty level. Within the married-couple family households, those with 5 or more children have the highest poverty rate, with 39 households (12.8%) falling below the poverty line. Among the single-parent households, those with 5 or more children have the highest poverty rate, with 124 household (80.0%) living below poverty.
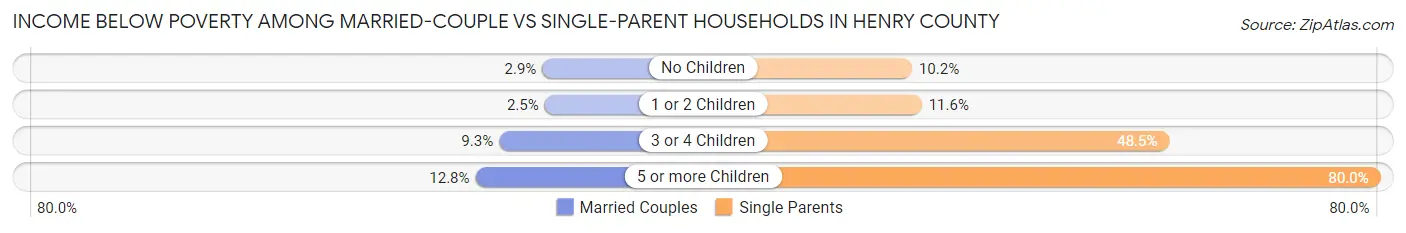
| Children | Married-Couple Families | Single-Parent Households |
| No Children | 653 (2.9%) | 780 (10.2%) |
| 1 or 2 Children | 376 (2.5%) | 1,040 (11.6%) |
| 3 or 4 Children | 395 (9.3%) | 720 (48.5%) |
| 5 or more Children | 39 (12.8%) | 124 (80.0%) |
| Total | 1,463 (3.5%) | 2,664 (14.6%) |
Employment Characteristics in Henry County
Employment by Class of Employer in Henry County
Among the 115,681 employed individuals in Henry County, private company employees (77,717 | 67.2%), local government employees (11,445 | 9.9%), and self-employed (not incorporated) (6,176 | 5.3%) make up the most common classes of employment.
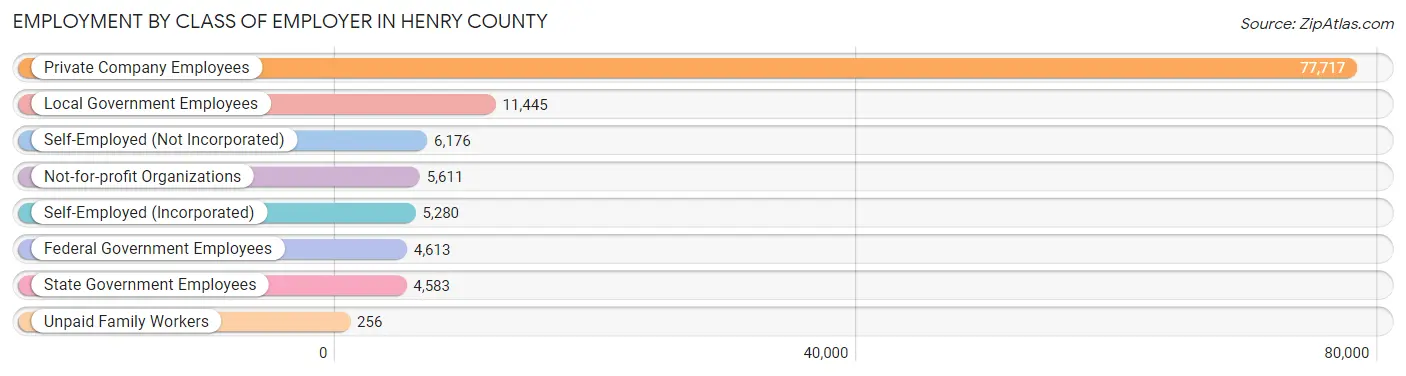
| Employer Class | # Employees | % Employees |
| Private Company Employees | 77,717 | 67.2% |
| Self-Employed (Incorporated) | 5,280 | 4.6% |
| Self-Employed (Not Incorporated) | 6,176 | 5.3% |
| Not-for-profit Organizations | 5,611 | 4.9% |
| Local Government Employees | 11,445 | 9.9% |
| State Government Employees | 4,583 | 4.0% |
| Federal Government Employees | 4,613 | 4.0% |
| Unpaid Family Workers | 256 | 0.2% |
| Total | 115,681 | 100.0% |
Employment Status by Age in Henry County
According to the labor force statistics for Henry County, out of the total population over 16 years of age (188,828), 66.5% or 125,571 individuals are in the labor force, with 5.3% or 6,655 of them unemployed. The age group with the highest labor force participation rate is 25 to 29 years, with 86.4% or 13,086 individuals in the labor force. Within the labor force, the 16 to 19 years age range has the highest percentage of unemployed individuals, with 22.5% or 985 of them being unemployed.
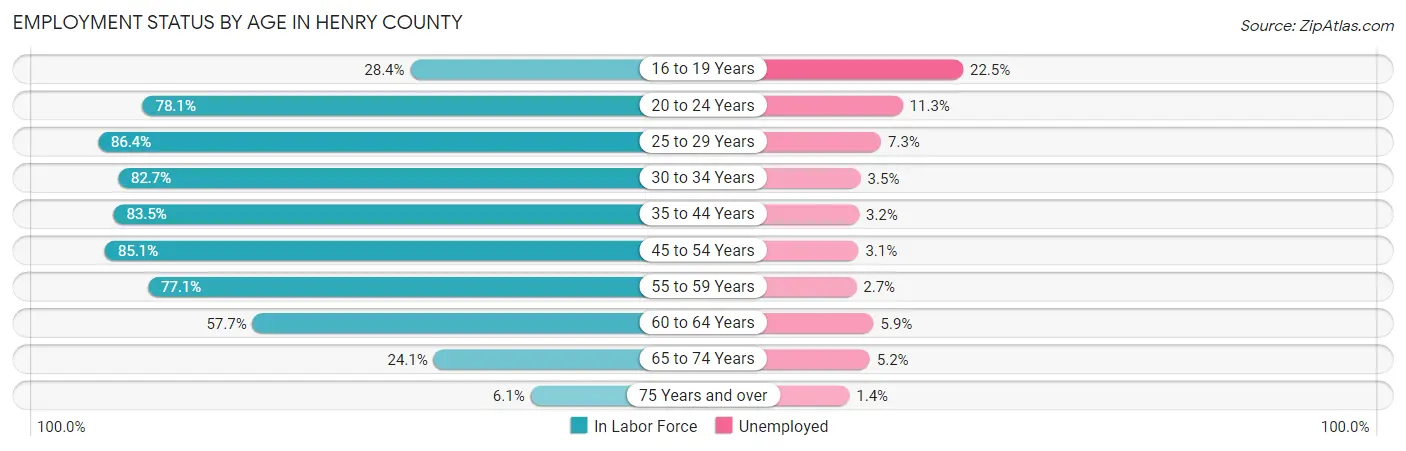
| Age Bracket | In Labor Force | Unemployed |
| 16 to 19 Years | 4,379 (28.4%) | 985 (22.5%) |
| 20 to 24 Years | 13,033 (78.1%) | 1,473 (11.3%) |
| 25 to 29 Years | 13,086 (86.4%) | 955 (7.3%) |
| 30 to 34 Years | 12,122 (82.7%) | 424 (3.5%) |
| 35 to 44 Years | 26,905 (83.5%) | 861 (3.2%) |
| 45 to 54 Years | 30,379 (85.1%) | 942 (3.1%) |
| 55 to 59 Years | 13,250 (77.1%) | 358 (2.7%) |
| 60 to 64 Years | 7,400 (57.7%) | 437 (5.9%) |
| 65 to 74 Years | 4,505 (24.1%) | 234 (5.2%) |
| 75 Years and over | 628 (6.1%) | 9 (1.4%) |
| Total | 125,571 (66.5%) | 6,655 (5.3%) |
Employment Status by Educational Attainment in Henry County
According to labor force statistics for Henry County, 80.7% of individuals (103,081) out of the total population between 25 and 64 years of age (127,734) are in the labor force, with 3.9% or 4,020 of them being unemployed. The group with the highest labor force participation rate are those with the educational attainment of bachelor's degree or higher, with 87.9% or 33,160 individuals in the labor force. Within the labor force, individuals with high school diploma education have the highest percentage of unemployment, with 5.1% or 1,535 of them being unemployed.
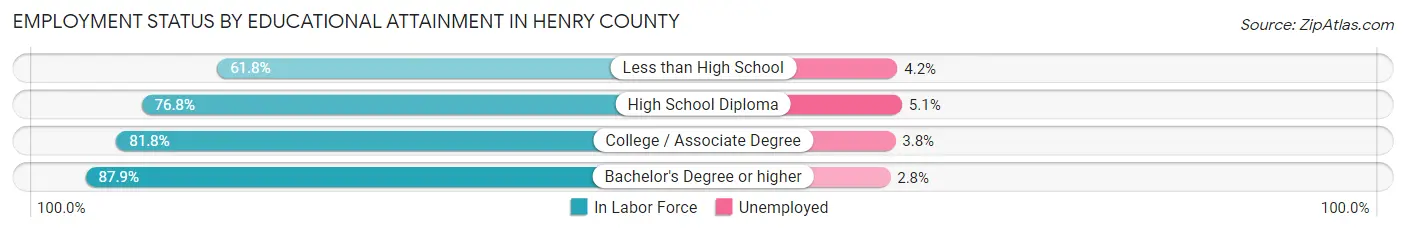
| Educational Attainment | In Labor Force | Unemployed |
| Less than High School | 5,241 (61.8%) | 356 (4.2%) |
| High School Diploma | 30,092 (76.8%) | 1,998 (5.1%) |
| College / Associate Degree | 34,639 (81.8%) | 1,609 (3.8%) |
| Bachelor's Degree or higher | 33,160 (87.9%) | 1,056 (2.8%) |
| Total | 103,081 (80.7%) | 4,982 (3.9%) |
Employment Occupations by Sex in Henry County
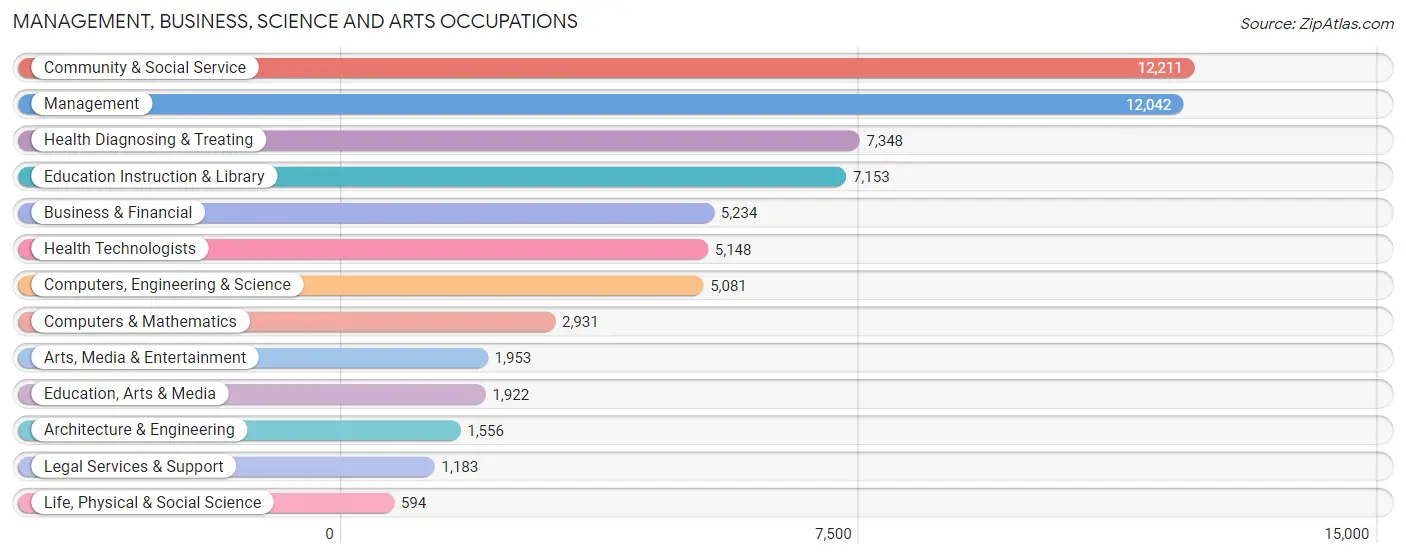
Management, Business, Science and Arts Occupations
The most common Management, Business, Science and Arts occupations in Henry County are Community & Social Service (12,211 | 10.3%), Management (12,042 | 10.2%), Health Diagnosing & Treating (7,348 | 6.2%), Education Instruction & Library (7,153 | 6.0%), and Business & Financial (5,234 | 4.4%).
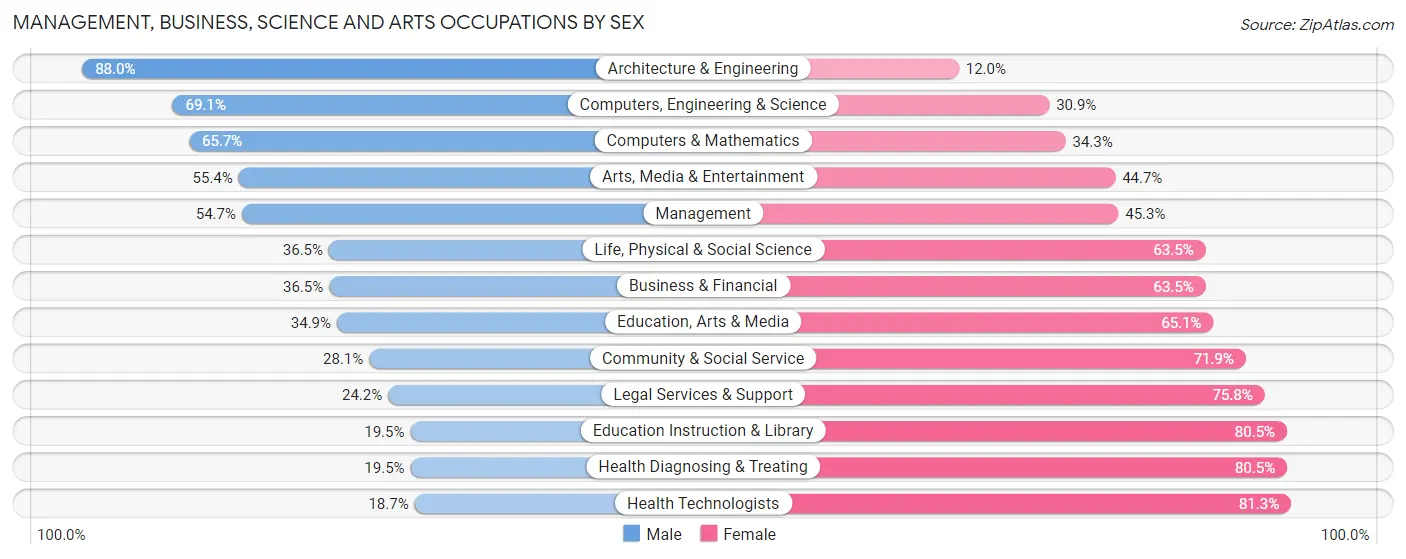
Management, Business, Science and Arts Occupations by Sex
Within the Management, Business, Science and Arts occupations in Henry County, the most male-oriented occupations are Architecture & Engineering (88.0%), Computers, Engineering & Science (69.1%), and Computers & Mathematics (65.7%), while the most female-oriented occupations are Health Technologists (81.3%), Health Diagnosing & Treating (80.5%), and Education Instruction & Library (80.5%).
| Occupation | Male | Female |
| Management | 6,587 (54.7%) | 5,455 (45.3%) |
| Business & Financial | 1,910 (36.5%) | 3,324 (63.5%) |
| Computers, Engineering & Science | 3,512 (69.1%) | 1,569 (30.9%) |
| Computers & Mathematics | 1,926 (65.7%) | 1,005 (34.3%) |
| Architecture & Engineering | 1,369 (88.0%) | 187 (12.0%) |
| Life, Physical & Social Science | 217 (36.5%) | 377 (63.5%) |
| Community & Social Service | 3,435 (28.1%) | 8,776 (71.9%) |
| Education, Arts & Media | 670 (34.9%) | 1,252 (65.1%) |
| Legal Services & Support | 286 (24.2%) | 897 (75.8%) |
| Education Instruction & Library | 1,398 (19.5%) | 5,755 (80.5%) |
| Arts, Media & Entertainment | 1,081 (55.3%) | 872 (44.7%) |
| Health Diagnosing & Treating | 1,434 (19.5%) | 5,914 (80.5%) |
| Health Technologists | 961 (18.7%) | 4,187 (81.3%) |
| Total (Category) | 16,878 (40.3%) | 25,038 (59.7%) |
| Total (Overall) | 59,581 (50.3%) | 58,742 (49.6%) |
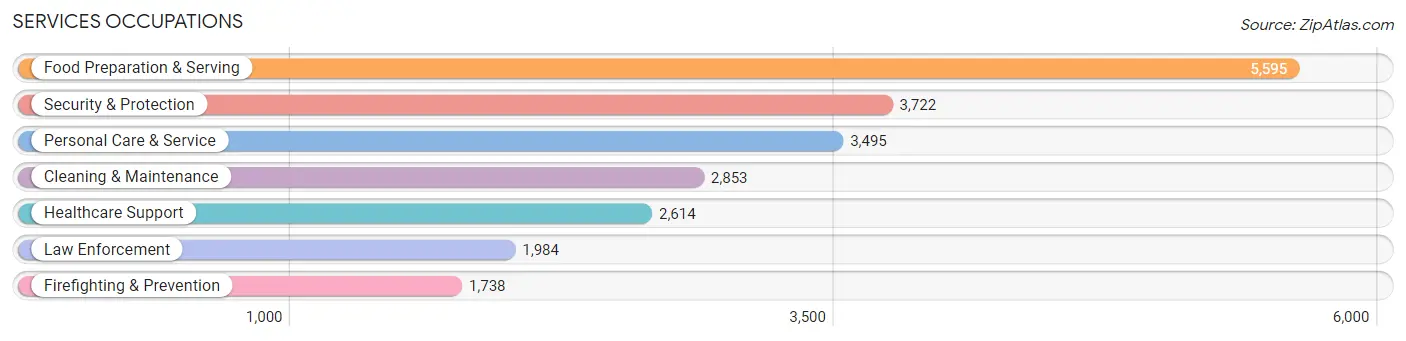
Services Occupations
The most common Services occupations in Henry County are Food Preparation & Serving (5,595 | 4.7%), Security & Protection (3,722 | 3.2%), Personal Care & Service (3,495 | 2.9%), Cleaning & Maintenance (2,853 | 2.4%), and Healthcare Support (2,614 | 2.2%).
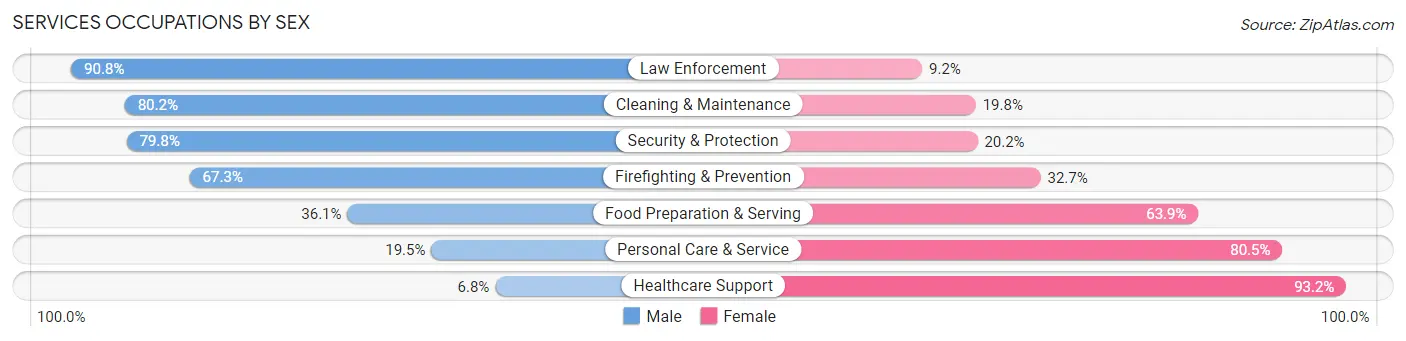
Services Occupations by Sex
Within the Services occupations in Henry County, the most male-oriented occupations are Law Enforcement (90.8%), Cleaning & Maintenance (80.2%), and Security & Protection (79.8%), while the most female-oriented occupations are Healthcare Support (93.2%), Personal Care & Service (80.5%), and Food Preparation & Serving (63.9%).
| Occupation | Male | Female |
| Healthcare Support | 178 (6.8%) | 2,436 (93.2%) |
| Security & Protection | 2,971 (79.8%) | 751 (20.2%) |
| Firefighting & Prevention | 1,170 (67.3%) | 568 (32.7%) |
| Law Enforcement | 1,801 (90.8%) | 183 (9.2%) |
| Food Preparation & Serving | 2,019 (36.1%) | 3,576 (63.9%) |
| Cleaning & Maintenance | 2,287 (80.2%) | 566 (19.8%) |
| Personal Care & Service | 680 (19.5%) | 2,815 (80.5%) |
| Total (Category) | 8,135 (44.5%) | 10,144 (55.5%) |
| Total (Overall) | 59,581 (50.3%) | 58,742 (49.6%) |
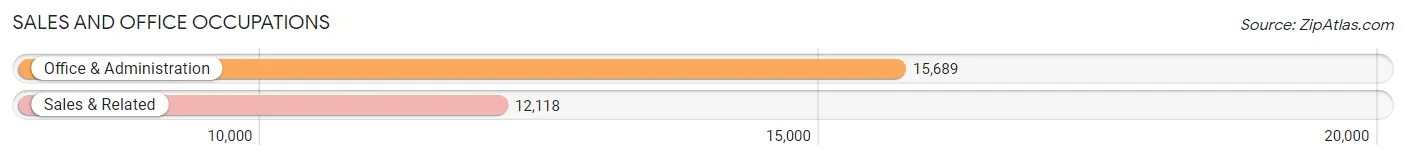
Sales and Office Occupations
The most common Sales and Office occupations in Henry County are Office & Administration (15,689 | 13.3%), and Sales & Related (12,118 | 10.2%).
Sales and Office Occupations by Sex
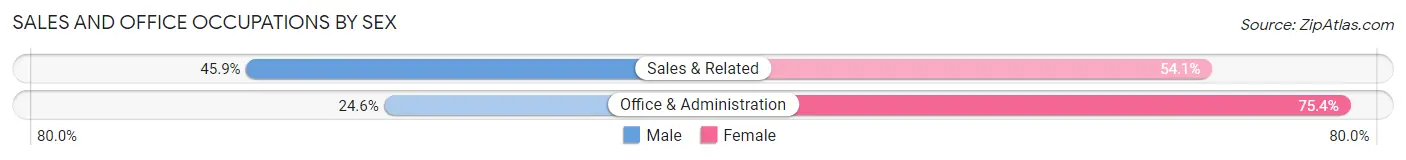
| Occupation | Male | Female |
| Sales & Related | 5,560 (45.9%) | 6,558 (54.1%) |
| Office & Administration | 3,864 (24.6%) | 11,825 (75.4%) |
| Total (Category) | 9,424 (33.9%) | 18,383 (66.1%) |
| Total (Overall) | 59,581 (50.3%) | 58,742 (49.6%) |
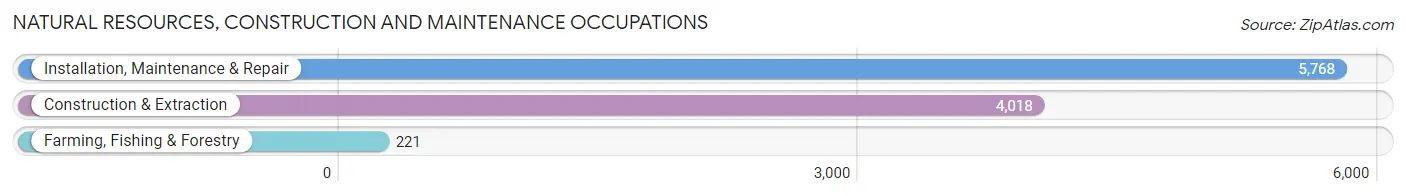
Natural Resources, Construction and Maintenance Occupations
The most common Natural Resources, Construction and Maintenance occupations in Henry County are Installation, Maintenance & Repair (5,768 | 4.9%), Construction & Extraction (4,018 | 3.4%), and Farming, Fishing & Forestry (221 | 0.2%).
Natural Resources, Construction and Maintenance Occupations by Sex
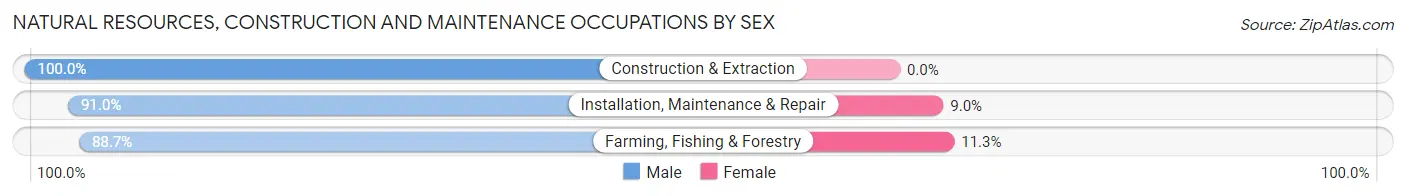
| Occupation | Male | Female |
| Farming, Fishing & Forestry | 196 (88.7%) | 25 (11.3%) |
| Construction & Extraction | 4,018 (100.0%) | 0 (0.0%) |
| Installation, Maintenance & Repair | 5,247 (91.0%) | 521 (9.0%) |
| Total (Category) | 9,461 (94.5%) | 546 (5.5%) |
| Total (Overall) | 59,581 (50.3%) | 58,742 (49.6%) |
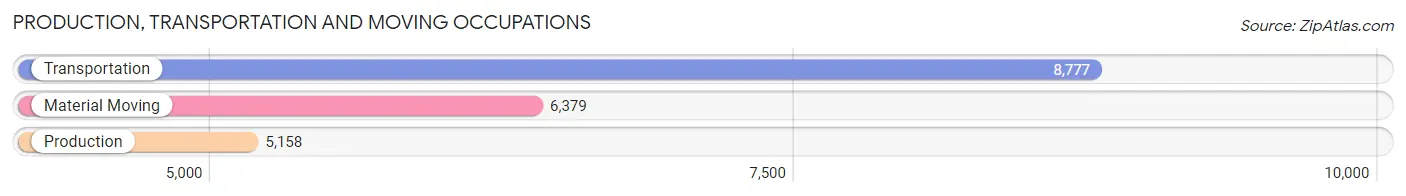
Production, Transportation and Moving Occupations
The most common Production, Transportation and Moving occupations in Henry County are Transportation (8,777 | 7.4%), Material Moving (6,379 | 5.4%), and Production (5,158 | 4.4%).
Production, Transportation and Moving Occupations by Sex
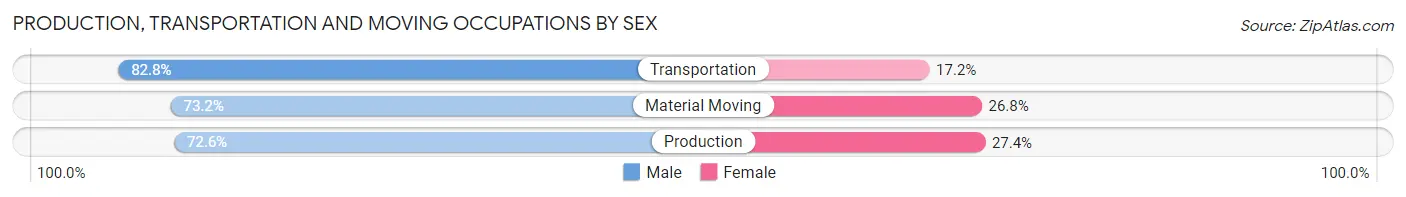
| Occupation | Male | Female |
| Production | 3,744 (72.6%) | 1,414 (27.4%) |
| Transportation | 7,269 (82.8%) | 1,508 (17.2%) |
| Material Moving | 4,670 (73.2%) | 1,709 (26.8%) |
| Total (Category) | 15,683 (77.2%) | 4,631 (22.8%) |
| Total (Overall) | 59,581 (50.3%) | 58,742 (49.6%) |
Employment Industries by Sex in Henry County
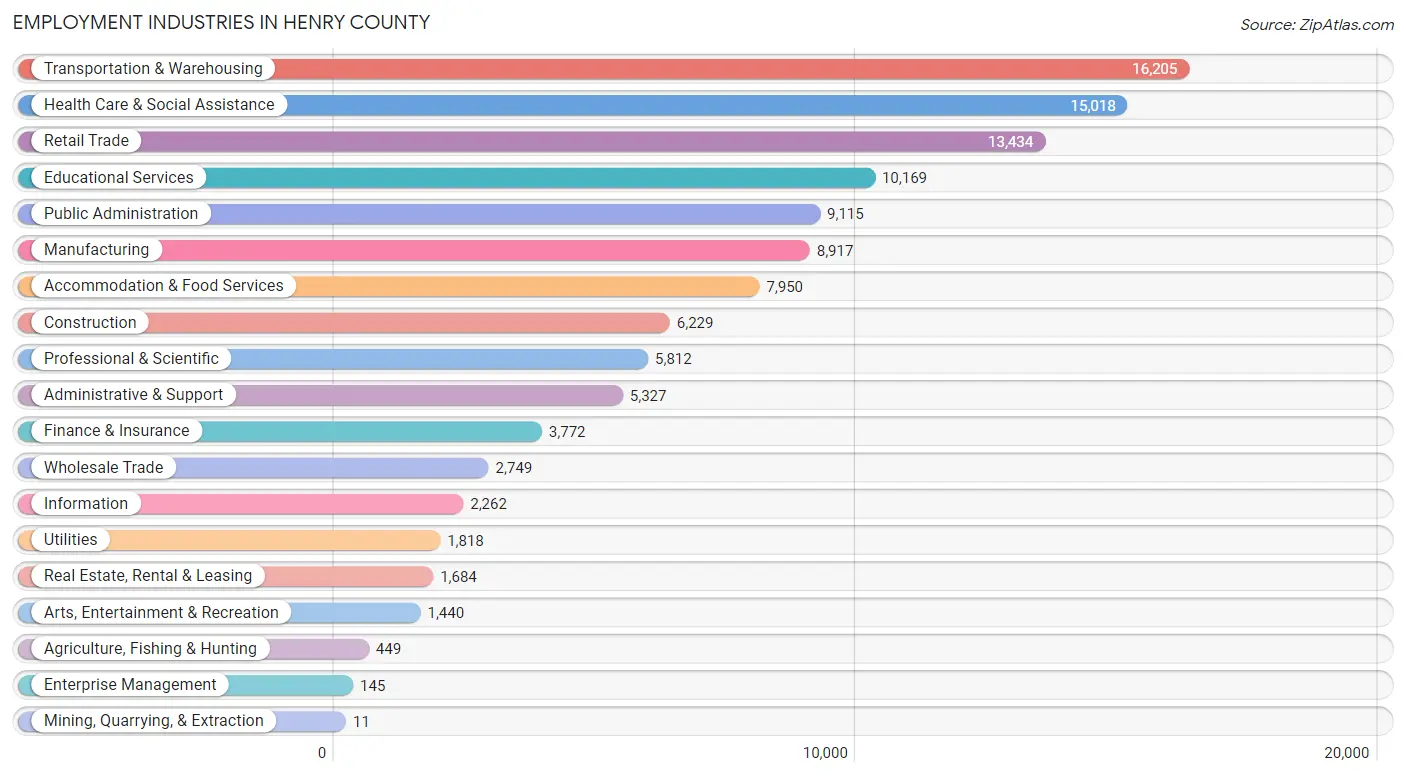
Employment Industries in Henry County
The major employment industries in Henry County include Transportation & Warehousing (16,205 | 13.7%), Health Care & Social Assistance (15,018 | 12.7%), Retail Trade (13,434 | 11.4%), Educational Services (10,169 | 8.6%), and Public Administration (9,115 | 7.7%).
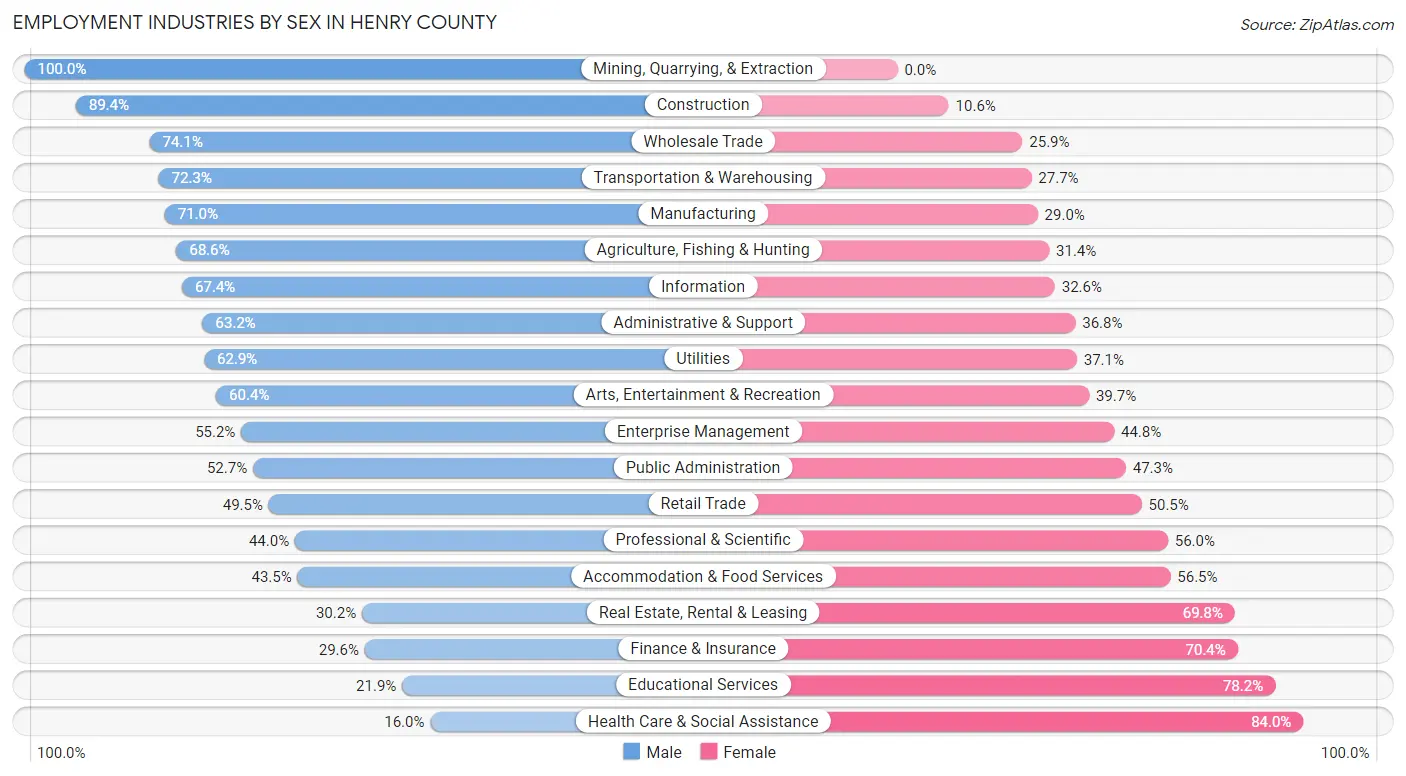
Employment Industries by Sex in Henry County
The Henry County industries that see more men than women are Mining, Quarrying, & Extraction (100.0%), Construction (89.4%), and Wholesale Trade (74.1%), whereas the industries that tend to have a higher number of women are Health Care & Social Assistance (84.0%), Educational Services (78.1%), and Finance & Insurance (70.4%).
| Industry | Male | Female |
| Agriculture, Fishing & Hunting | 308 (68.6%) | 141 (31.4%) |
| Mining, Quarrying, & Extraction | 11 (100.0%) | 0 (0.0%) |
| Construction | 5,569 (89.4%) | 660 (10.6%) |
| Manufacturing | 6,328 (71.0%) | 2,589 (29.0%) |
| Wholesale Trade | 2,038 (74.1%) | 711 (25.9%) |
| Retail Trade | 6,644 (49.5%) | 6,790 (50.5%) |
| Transportation & Warehousing | 11,712 (72.3%) | 4,493 (27.7%) |
| Utilities | 1,143 (62.9%) | 675 (37.1%) |
| Information | 1,525 (67.4%) | 737 (32.6%) |
| Finance & Insurance | 1,116 (29.6%) | 2,656 (70.4%) |
| Real Estate, Rental & Leasing | 508 (30.2%) | 1,176 (69.8%) |
| Professional & Scientific | 2,559 (44.0%) | 3,253 (56.0%) |
| Enterprise Management | 80 (55.2%) | 65 (44.8%) |
| Administrative & Support | 3,366 (63.2%) | 1,961 (36.8%) |
| Educational Services | 2,222 (21.8%) | 7,947 (78.1%) |
| Health Care & Social Assistance | 2,406 (16.0%) | 12,612 (84.0%) |
| Arts, Entertainment & Recreation | 869 (60.4%) | 571 (39.7%) |
| Accommodation & Food Services | 3,458 (43.5%) | 4,492 (56.5%) |
| Public Administration | 4,806 (52.7%) | 4,309 (47.3%) |
| Total | 59,581 (50.3%) | 58,742 (49.6%) |
Education in Henry County
School Enrollment in Henry County
The most common levels of schooling among the 65,145 students in Henry County are high school (16,785 | 25.8%), middle school (14,556 | 22.3%), and elementary school (13,359 | 20.5%).
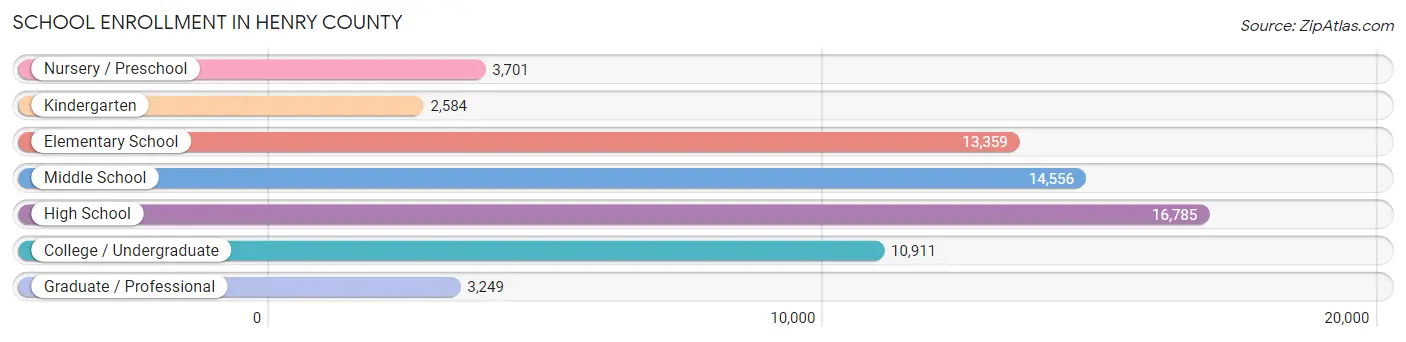
| School Level | # Students | % Students |
| Nursery / Preschool | 3,701 | 5.7% |
| Kindergarten | 2,584 | 4.0% |
| Elementary School | 13,359 | 20.5% |
| Middle School | 14,556 | 22.3% |
| High School | 16,785 | 25.8% |
| College / Undergraduate | 10,911 | 16.8% |
| Graduate / Professional | 3,249 | 5.0% |
| Total | 65,145 | 100.0% |
School Enrollment by Age by Funding Source in Henry County
Out of a total of 65,145 students who are enrolled in schools in Henry County, 10,358 (15.9%) attend a private institution, while the remaining 54,787 (84.1%) are enrolled in public schools. The age group of 3 to 4 year olds has the highest likelihood of being enrolled in private schools, with 1,403 (54.1% in the age bracket) enrolled. Conversely, the age group of 15 to 17 year olds has the lowest likelihood of being enrolled in a private school, with 10,988 (90.7% in the age bracket) attending a public institution.
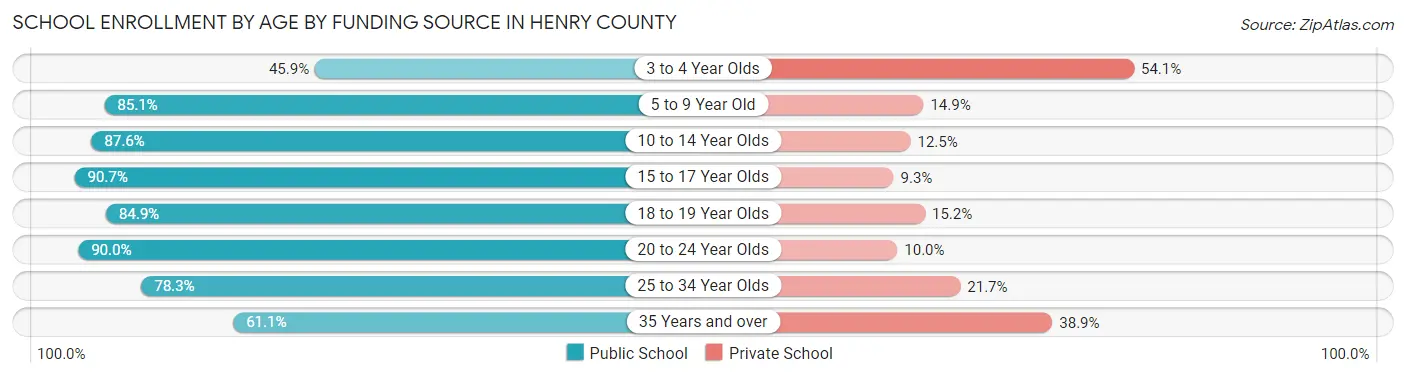
| Age Bracket | Public School | Private School |
| 3 to 4 Year Olds | 1,191 (45.9%) | 1,403 (54.1%) |
| 5 to 9 Year Old | 13,142 (85.1%) | 2,295 (14.9%) |
| 10 to 14 Year Olds | 15,702 (87.5%) | 2,233 (12.4%) |
| 15 to 17 Year Olds | 10,988 (90.7%) | 1,127 (9.3%) |
| 18 to 19 Year Olds | 4,087 (84.9%) | 730 (15.1%) |
| 20 to 24 Year Olds | 5,401 (90.0%) | 600 (10.0%) |
| 25 to 34 Year Olds | 2,027 (78.3%) | 563 (21.7%) |
| 35 Years and over | 2,235 (61.1%) | 1,421 (38.9%) |
| Total | 54,787 (84.1%) | 10,358 (15.9%) |
Educational Attainment by Field of Study in Henry County
Business (10,661 | 23.4%), education (5,961 | 13.1%), science & technology (5,399 | 11.9%), arts & humanities (3,864 | 8.5%), and psychology (2,966 | 6.5%) are the most common fields of study among 45,502 individuals in Henry County who have obtained a bachelor's degree or higher.
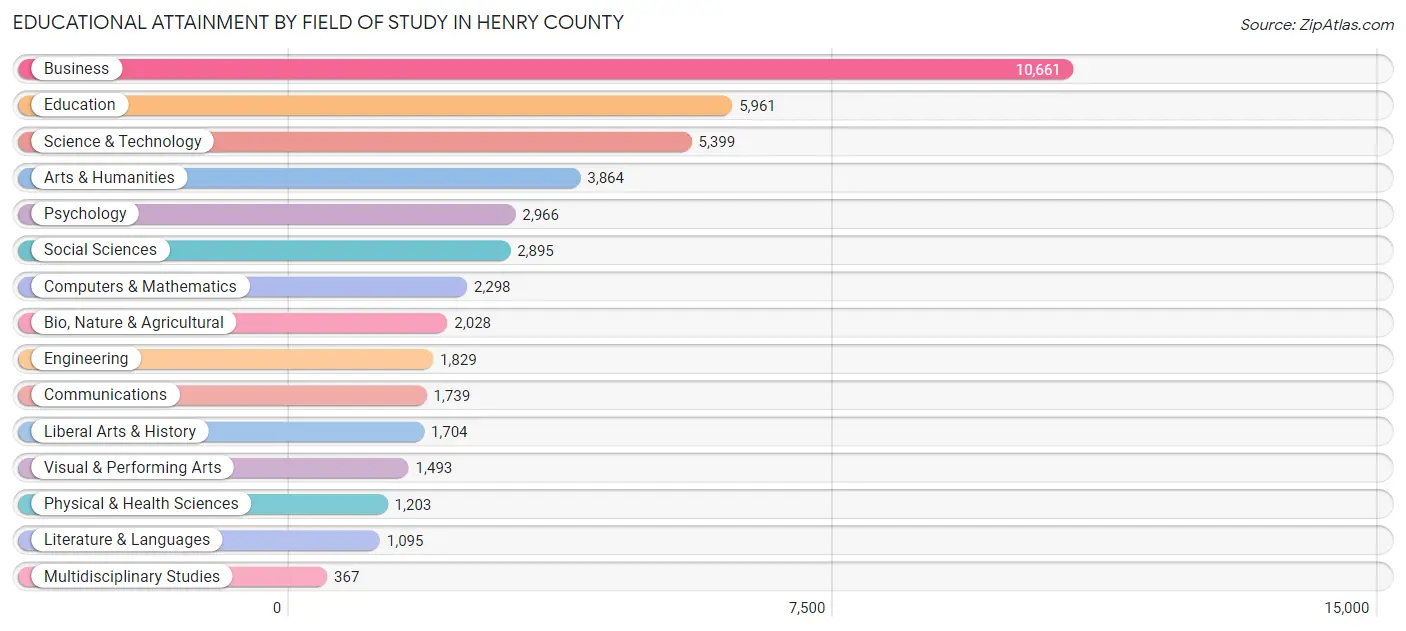
| Field of Study | # Graduates | % Graduates |
| Computers & Mathematics | 2,298 | 5.1% |
| Bio, Nature & Agricultural | 2,028 | 4.5% |
| Physical & Health Sciences | 1,203 | 2.6% |
| Psychology | 2,966 | 6.5% |
| Social Sciences | 2,895 | 6.4% |
| Engineering | 1,829 | 4.0% |
| Multidisciplinary Studies | 367 | 0.8% |
| Science & Technology | 5,399 | 11.9% |
| Business | 10,661 | 23.4% |
| Education | 5,961 | 13.1% |
| Literature & Languages | 1,095 | 2.4% |
| Liberal Arts & History | 1,704 | 3.7% |
| Visual & Performing Arts | 1,493 | 3.3% |
| Communications | 1,739 | 3.8% |
| Arts & Humanities | 3,864 | 8.5% |
| Total | 45,502 | 100.0% |
Transportation & Commute in Henry County
Vehicle Availability by Sex in Henry County
The most prevalent vehicle ownership categories in Henry County are males with 2 vehicles (23,910, accounting for 40.6%) and females with 2 vehicles (21,422, making up 42.1%).
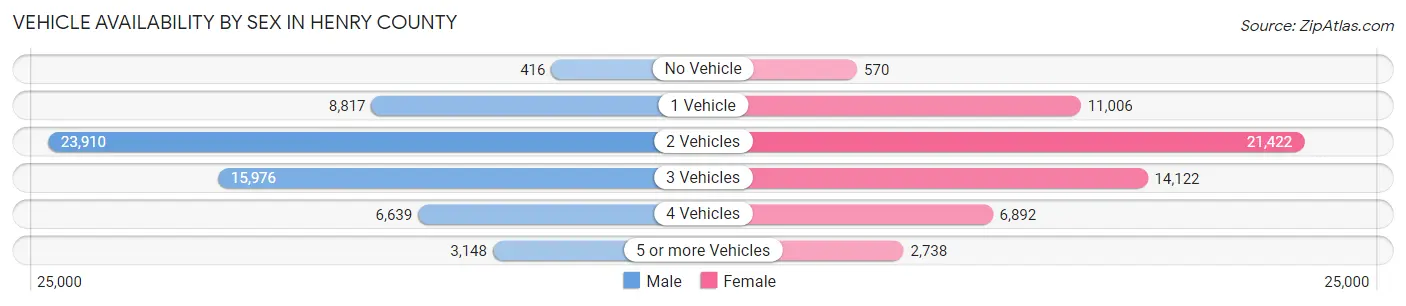
| Vehicles Available | Male | Female |
| No Vehicle | 416 (0.7%) | 570 (1.0%) |
| 1 Vehicle | 8,817 (15.0%) | 11,006 (19.4%) |
| 2 Vehicles | 23,910 (40.6%) | 21,422 (37.8%) |
| 3 Vehicles | 15,976 (27.1%) | 14,122 (24.9%) |
| 4 Vehicles | 6,639 (11.3%) | 6,892 (12.1%) |
| 5 or more Vehicles | 3,148 (5.3%) | 2,738 (4.8%) |
| Total | 58,906 (100.0%) | 56,750 (100.0%) |
Commute Time in Henry County
The most frequently occuring commute durations in Henry County are 30 to 34 minutes (14,689 commuters, 14.5%), 15 to 19 minutes (14,332 commuters, 14.1%), and 45 to 59 minutes (13,890 commuters, 13.7%).
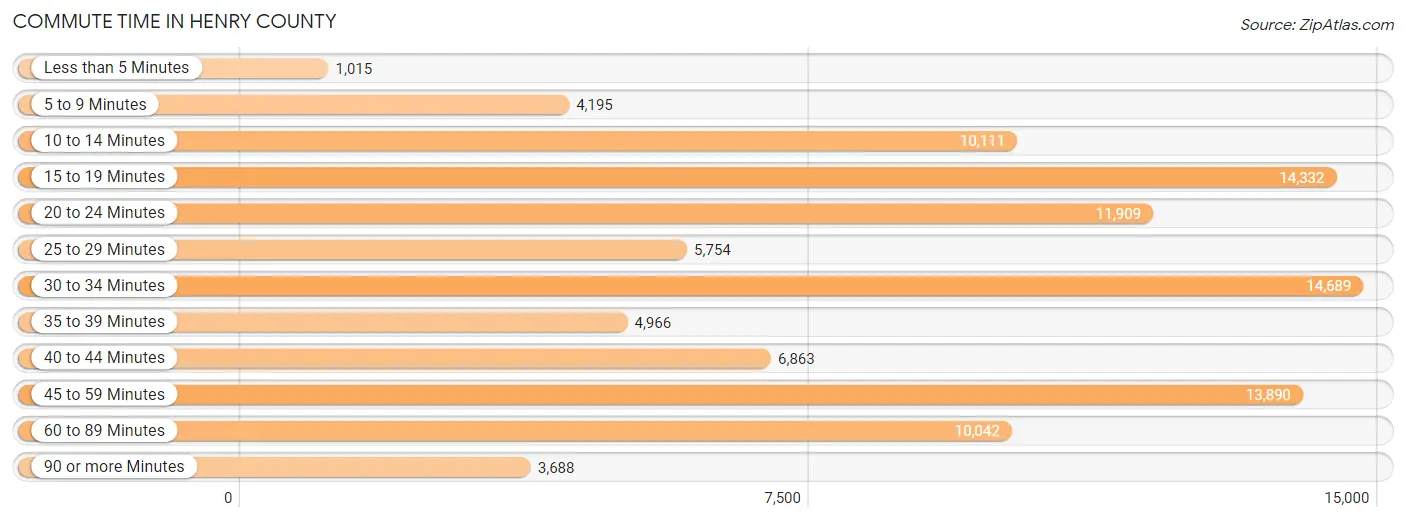
| Commute Time | # Commuters | % Commuters |
| Less than 5 Minutes | 1,015 | 1.0% |
| 5 to 9 Minutes | 4,195 | 4.1% |
| 10 to 14 Minutes | 10,111 | 10.0% |
| 15 to 19 Minutes | 14,332 | 14.1% |
| 20 to 24 Minutes | 11,909 | 11.7% |
| 25 to 29 Minutes | 5,754 | 5.7% |
| 30 to 34 Minutes | 14,689 | 14.5% |
| 35 to 39 Minutes | 4,966 | 4.9% |
| 40 to 44 Minutes | 6,863 | 6.8% |
| 45 to 59 Minutes | 13,890 | 13.7% |
| 60 to 89 Minutes | 10,042 | 9.9% |
| 90 or more Minutes | 3,688 | 3.6% |
Commute Time by Sex in Henry County
The most common commute times in Henry County are 30 to 34 minutes (9,104 commuters, 17.4%) for males and 15 to 19 minutes (8,002 commuters, 16.2%) for females.
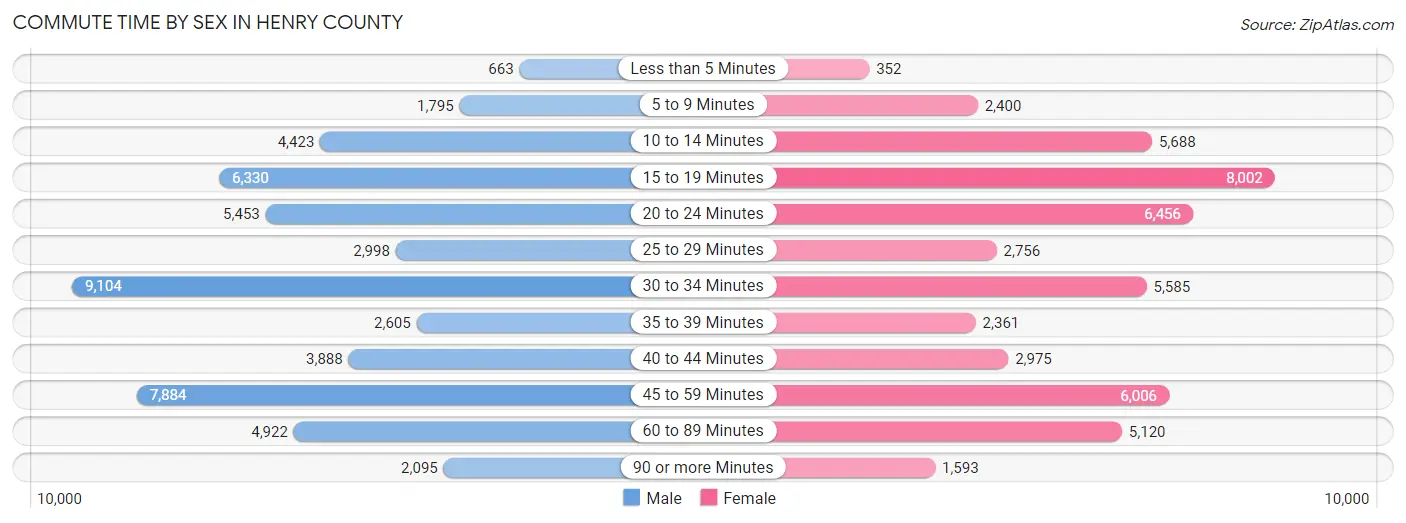
| Commute Time | Male | Female |
| Less than 5 Minutes | 663 (1.3%) | 352 (0.7%) |
| 5 to 9 Minutes | 1,795 (3.4%) | 2,400 (4.9%) |
| 10 to 14 Minutes | 4,423 (8.5%) | 5,688 (11.5%) |
| 15 to 19 Minutes | 6,330 (12.1%) | 8,002 (16.2%) |
| 20 to 24 Minutes | 5,453 (10.4%) | 6,456 (13.1%) |
| 25 to 29 Minutes | 2,998 (5.8%) | 2,756 (5.6%) |
| 30 to 34 Minutes | 9,104 (17.4%) | 5,585 (11.3%) |
| 35 to 39 Minutes | 2,605 (5.0%) | 2,361 (4.8%) |
| 40 to 44 Minutes | 3,888 (7.4%) | 2,975 (6.0%) |
| 45 to 59 Minutes | 7,884 (15.1%) | 6,006 (12.2%) |
| 60 to 89 Minutes | 4,922 (9.4%) | 5,120 (10.4%) |
| 90 or more Minutes | 2,095 (4.0%) | 1,593 (3.2%) |
Time of Departure to Work by Sex in Henry County
The most frequent times of departure to work in Henry County are 7:00 AM to 7:29 AM (6,751, 12.9%) for males and 7:00 AM to 7:29 AM (8,235, 16.7%) for females.
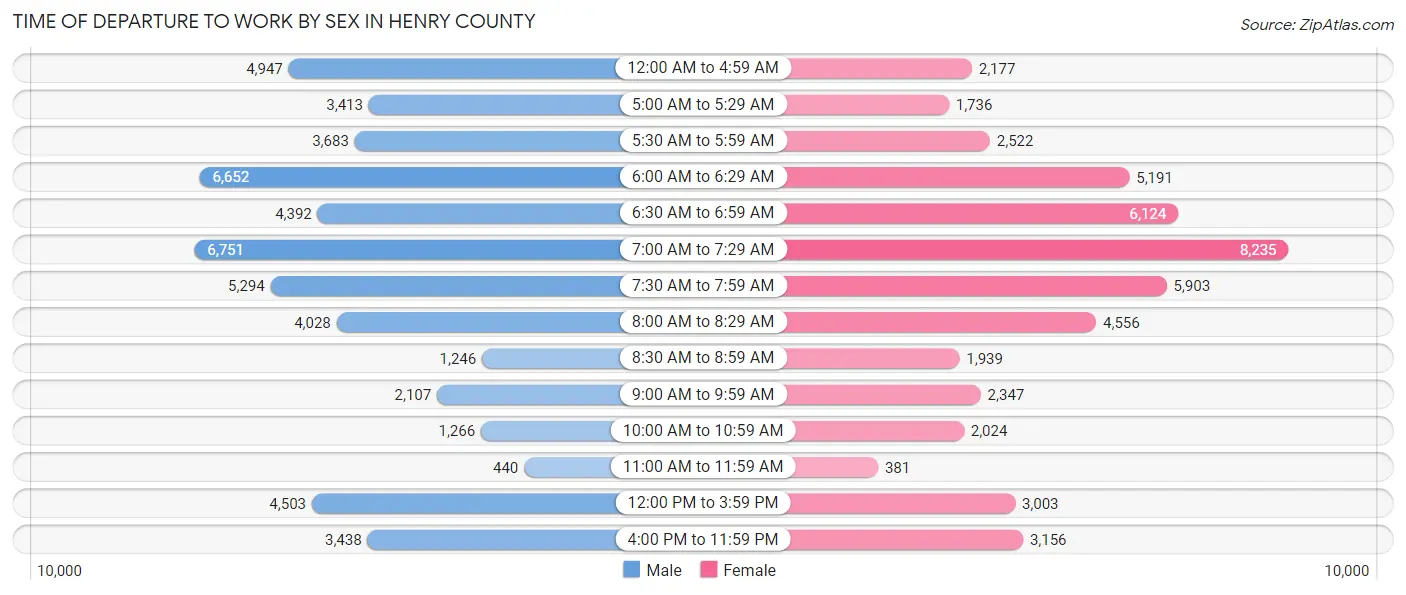
| Time of Departure | Male | Female |
| 12:00 AM to 4:59 AM | 4,947 (9.5%) | 2,177 (4.4%) |
| 5:00 AM to 5:29 AM | 3,413 (6.5%) | 1,736 (3.5%) |
| 5:30 AM to 5:59 AM | 3,683 (7.1%) | 2,522 (5.1%) |
| 6:00 AM to 6:29 AM | 6,652 (12.8%) | 5,191 (10.5%) |
| 6:30 AM to 6:59 AM | 4,392 (8.4%) | 6,124 (12.4%) |
| 7:00 AM to 7:29 AM | 6,751 (12.9%) | 8,235 (16.7%) |
| 7:30 AM to 7:59 AM | 5,294 (10.2%) | 5,903 (12.0%) |
| 8:00 AM to 8:29 AM | 4,028 (7.7%) | 4,556 (9.2%) |
| 8:30 AM to 8:59 AM | 1,246 (2.4%) | 1,939 (3.9%) |
| 9:00 AM to 9:59 AM | 2,107 (4.0%) | 2,347 (4.8%) |
| 10:00 AM to 10:59 AM | 1,266 (2.4%) | 2,024 (4.1%) |
| 11:00 AM to 11:59 AM | 440 (0.8%) | 381 (0.8%) |
| 12:00 PM to 3:59 PM | 4,503 (8.6%) | 3,003 (6.1%) |
| 4:00 PM to 11:59 PM | 3,438 (6.6%) | 3,156 (6.4%) |
| Total | 52,160 (100.0%) | 49,294 (100.0%) |
Housing Occupancy in Henry County
Occupancy by Ownership in Henry County
Of the total 82,232 dwellings in Henry County, owner-occupied units account for 59,397 (72.2%), while renter-occupied units make up 22,835 (27.8%).
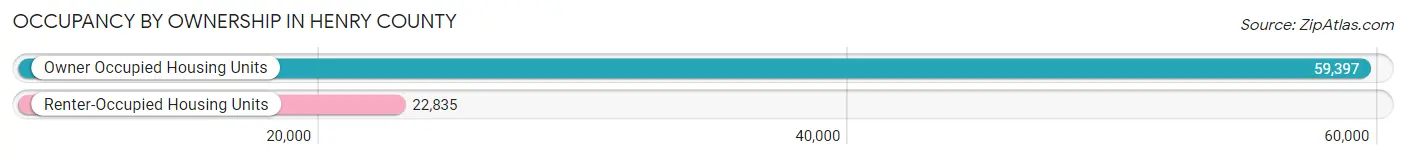
| Occupancy | # Housing Units | % Housing Units |
| Owner Occupied Housing Units | 59,397 | 72.2% |
| Renter-Occupied Housing Units | 22,835 | 27.8% |
| Total Occupied Housing Units | 82,232 | 100.0% |
Occupancy by Household Size in Henry County

| Household Size | # Housing Units | % Housing Units |
| 1-Person Household | 18,304 | 22.3% |
| 2-Person Household | 24,733 | 30.1% |
| 3-Person Household | 16,492 | 20.1% |
| 4+ Person Household | 22,703 | 27.6% |
| Total Housing Units | 82,232 | 100.0% |
Occupancy by Ownership by Household Size in Henry County
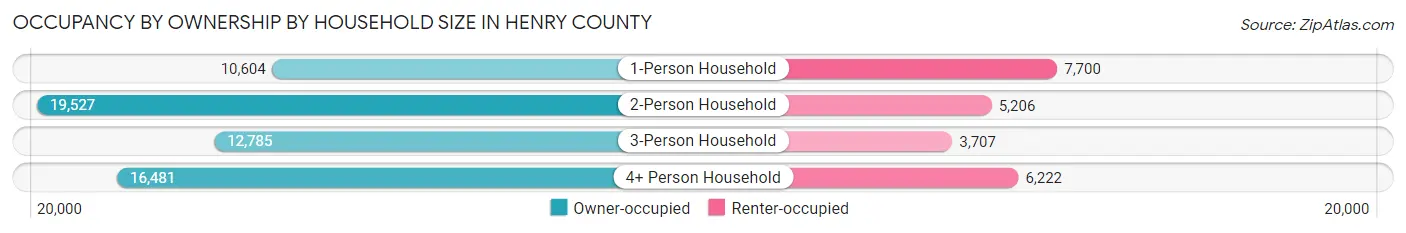
| Household Size | Owner-occupied | Renter-occupied |
| 1-Person Household | 10,604 (57.9%) | 7,700 (42.1%) |
| 2-Person Household | 19,527 (78.9%) | 5,206 (21.0%) |
| 3-Person Household | 12,785 (77.5%) | 3,707 (22.5%) |
| 4+ Person Household | 16,481 (72.6%) | 6,222 (27.4%) |
| Total Housing Units | 59,397 (72.2%) | 22,835 (27.8%) |
Occupancy by Educational Attainment in Henry County
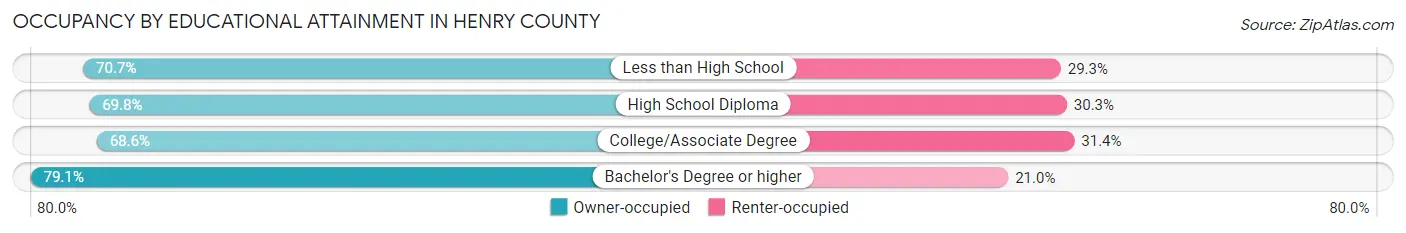
| Household Size | Owner-occupied | Renter-occupied |
| Less than High School | 3,116 (70.7%) | 1,290 (29.3%) |
| High School Diploma | 15,766 (69.8%) | 6,838 (30.2%) |
| College/Associate Degree | 20,505 (68.6%) | 9,404 (31.4%) |
| Bachelor's Degree or higher | 20,010 (79.0%) | 5,303 (20.9%) |
Occupancy by Age of Householder in Henry County
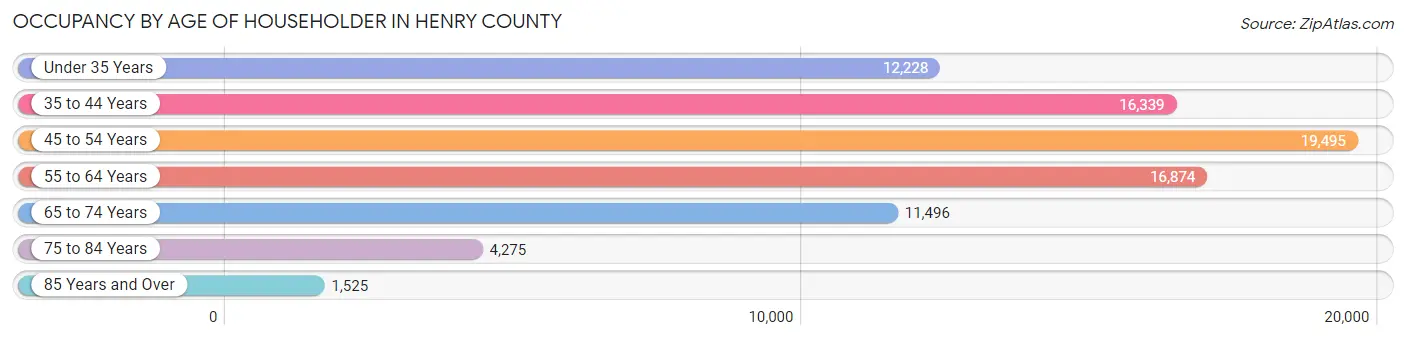
| Age Bracket | # Households | % Households |
| Under 35 Years | 12,228 | 14.9% |
| 35 to 44 Years | 16,339 | 19.9% |
| 45 to 54 Years | 19,495 | 23.7% |
| 55 to 64 Years | 16,874 | 20.5% |
| 65 to 74 Years | 11,496 | 14.0% |
| 75 to 84 Years | 4,275 | 5.2% |
| 85 Years and Over | 1,525 | 1.8% |
| Total | 82,232 | 100.0% |
Housing Finances in Henry County
Median Income by Occupancy in Henry County
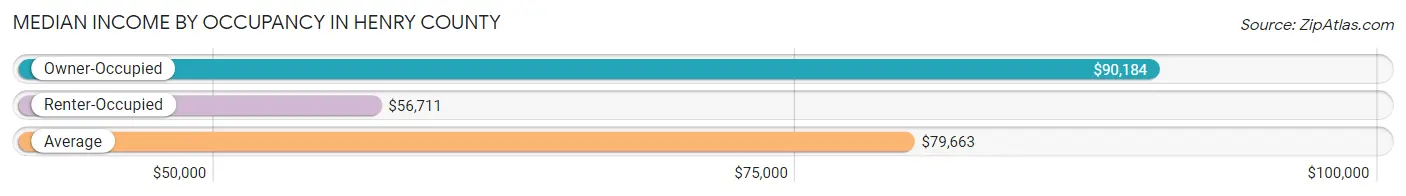
| Occupancy Type | # Households | Median Income |
| Owner-Occupied | 59,397 (72.2%) | $90,184 |
| Renter-Occupied | 22,835 (27.8%) | $56,711 |
| Average | 82,232 (100.0%) | $79,663 |
Occupancy by Householder Income Bracket in Henry County
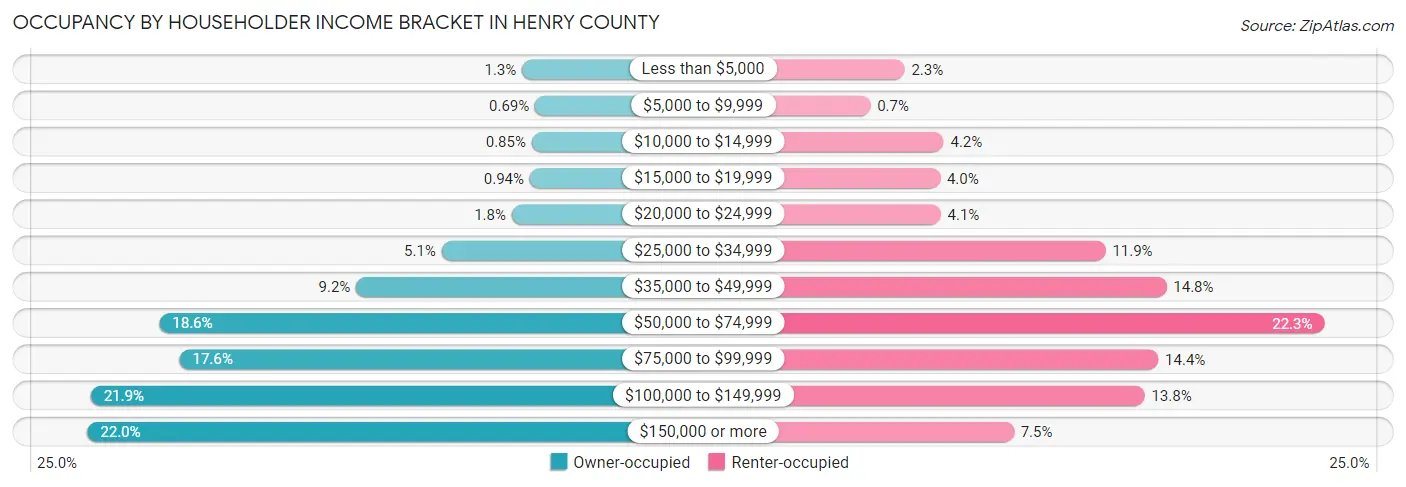
| Income Bracket | Owner-occupied | Renter-occupied |
| Less than $5,000 | 781 (1.3%) | 531 (2.3%) |
| $5,000 to $9,999 | 412 (0.7%) | 160 (0.7%) |
| $10,000 to $14,999 | 505 (0.9%) | 957 (4.2%) |
| $15,000 to $19,999 | 557 (0.9%) | 917 (4.0%) |
| $20,000 to $24,999 | 1,068 (1.8%) | 925 (4.1%) |
| $25,000 to $34,999 | 3,055 (5.1%) | 2,718 (11.9%) |
| $35,000 to $49,999 | 5,469 (9.2%) | 3,379 (14.8%) |
| $50,000 to $74,999 | 11,037 (18.6%) | 5,096 (22.3%) |
| $75,000 to $99,999 | 10,465 (17.6%) | 3,290 (14.4%) |
| $100,000 to $149,999 | 12,977 (21.8%) | 3,143 (13.8%) |
| $150,000 or more | 13,071 (22.0%) | 1,719 (7.5%) |
| Total | 59,397 (100.0%) | 22,835 (100.0%) |
Monthly Housing Cost Tiers in Henry County
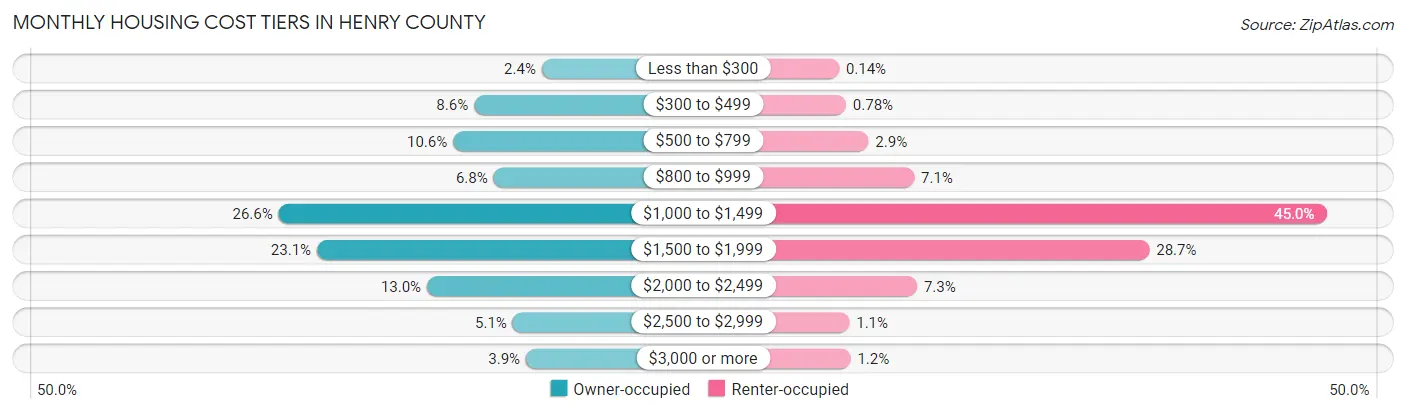
| Monthly Cost | Owner-occupied | Renter-occupied |
| Less than $300 | 1,421 (2.4%) | 33 (0.1%) |
| $300 to $499 | 5,128 (8.6%) | 179 (0.8%) |
| $500 to $799 | 6,275 (10.6%) | 651 (2.9%) |
| $800 to $999 | 4,059 (6.8%) | 1,613 (7.1%) |
| $1,000 to $1,499 | 15,809 (26.6%) | 10,279 (45.0%) |
| $1,500 to $1,999 | 13,715 (23.1%) | 6,556 (28.7%) |
| $2,000 to $2,499 | 7,696 (13.0%) | 1,671 (7.3%) |
| $2,500 to $2,999 | 3,010 (5.1%) | 248 (1.1%) |
| $3,000 or more | 2,284 (3.8%) | 275 (1.2%) |
| Total | 59,397 (100.0%) | 22,835 (100.0%) |
Physical Housing Characteristics in Henry County
Housing Structures in Henry County
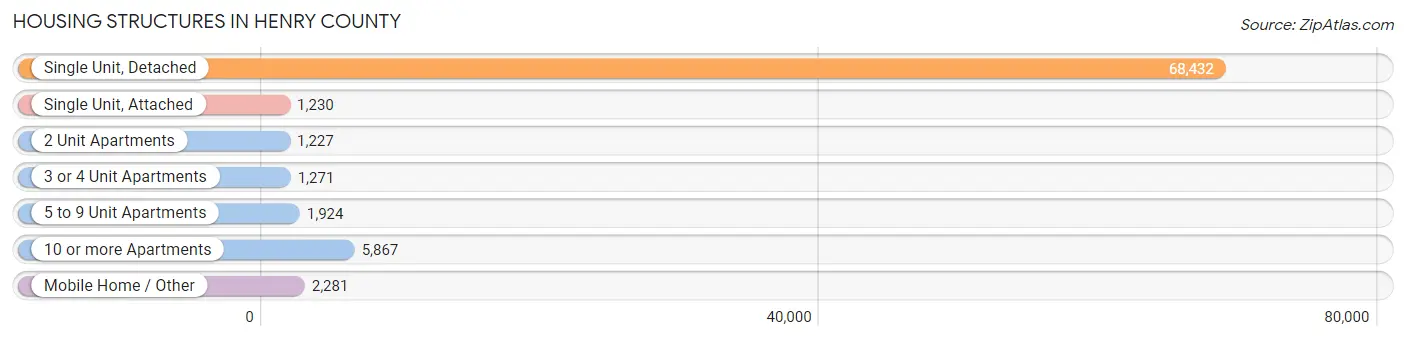
| Structure Type | # Housing Units | % Housing Units |
| Single Unit, Detached | 68,432 | 83.2% |
| Single Unit, Attached | 1,230 | 1.5% |
| 2 Unit Apartments | 1,227 | 1.5% |
| 3 or 4 Unit Apartments | 1,271 | 1.5% |
| 5 to 9 Unit Apartments | 1,924 | 2.3% |
| 10 or more Apartments | 5,867 | 7.1% |
| Mobile Home / Other | 2,281 | 2.8% |
| Total | 82,232 | 100.0% |
Housing Structures by Occupancy in Henry County
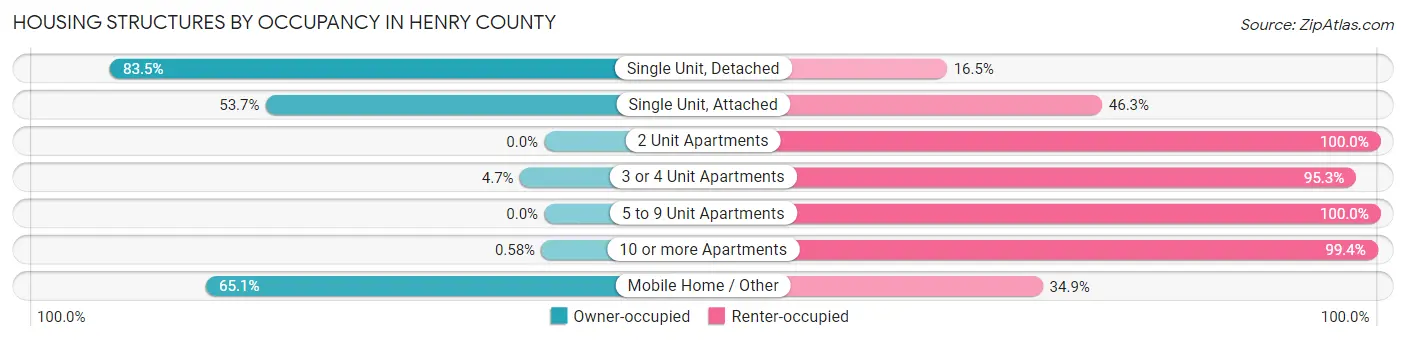
| Structure Type | Owner-occupied | Renter-occupied |
| Single Unit, Detached | 57,159 (83.5%) | 11,273 (16.5%) |
| Single Unit, Attached | 660 (53.7%) | 570 (46.3%) |
| 2 Unit Apartments | 0 (0.0%) | 1,227 (100.0%) |
| 3 or 4 Unit Apartments | 60 (4.7%) | 1,211 (95.3%) |
| 5 to 9 Unit Apartments | 0 (0.0%) | 1,924 (100.0%) |
| 10 or more Apartments | 34 (0.6%) | 5,833 (99.4%) |
| Mobile Home / Other | 1,484 (65.1%) | 797 (34.9%) |
| Total | 59,397 (72.2%) | 22,835 (27.8%) |
Housing Structures by Number of Rooms in Henry County
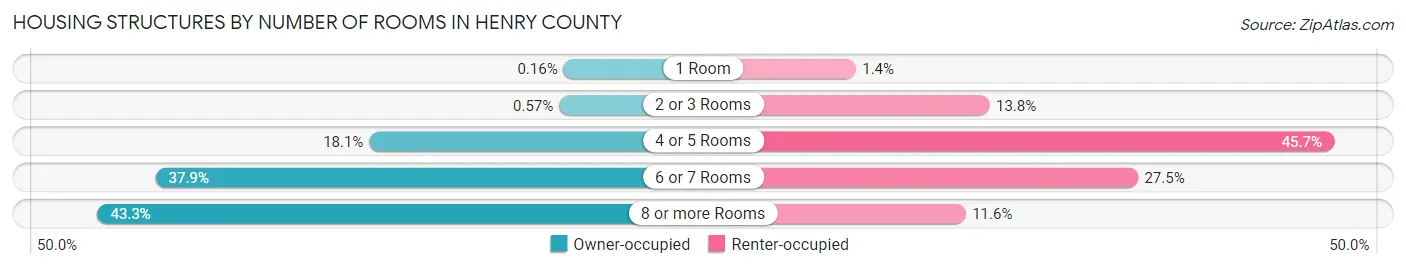
| Number of Rooms | Owner-occupied | Renter-occupied |
| 1 Room | 95 (0.2%) | 325 (1.4%) |
| 2 or 3 Rooms | 337 (0.6%) | 3,150 (13.8%) |
| 4 or 5 Rooms | 10,766 (18.1%) | 10,428 (45.7%) |
| 6 or 7 Rooms | 22,501 (37.9%) | 6,285 (27.5%) |
| 8 or more Rooms | 25,698 (43.3%) | 2,647 (11.6%) |
| Total | 59,397 (100.0%) | 22,835 (100.0%) |
Housing Structure by Heating Type in Henry County
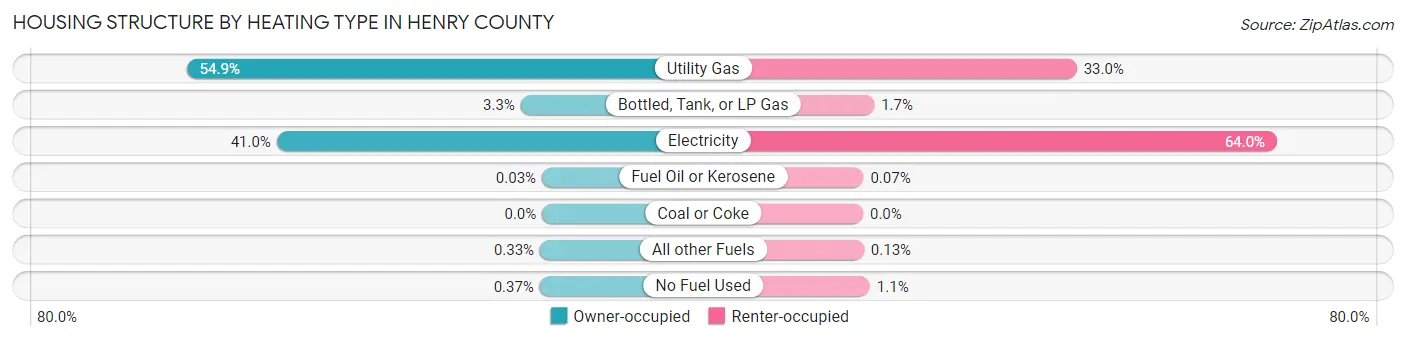
| Heating Type | Owner-occupied | Renter-occupied |
| Utility Gas | 32,630 (54.9%) | 7,543 (33.0%) |
| Bottled, Tank, or LP Gas | 1,964 (3.3%) | 394 (1.7%) |
| Electricity | 24,368 (41.0%) | 14,609 (64.0%) |
| Fuel Oil or Kerosene | 20 (0.0%) | 17 (0.1%) |
| Coal or Coke | 0 (0.0%) | 0 (0.0%) |
| All other Fuels | 195 (0.3%) | 29 (0.1%) |
| No Fuel Used | 220 (0.4%) | 243 (1.1%) |
| Total | 59,397 (100.0%) | 22,835 (100.0%) |
Household Vehicle Usage in Henry County
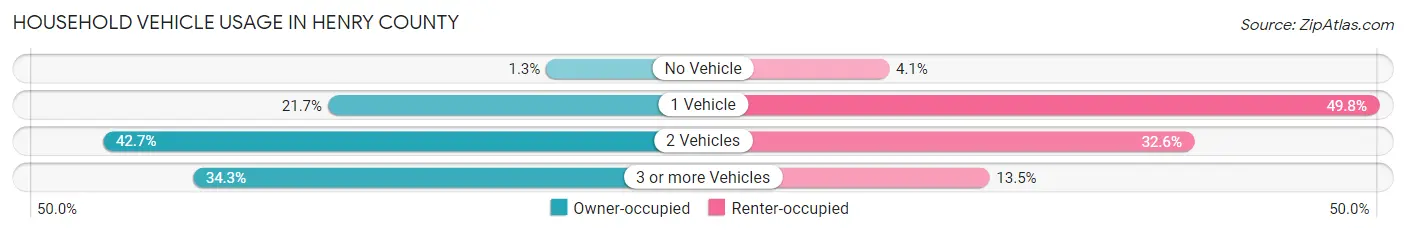
| Vehicles per Household | Owner-occupied | Renter-occupied |
| No Vehicle | 785 (1.3%) | 940 (4.1%) |
| 1 Vehicle | 12,886 (21.7%) | 11,378 (49.8%) |
| 2 Vehicles | 25,352 (42.7%) | 7,436 (32.6%) |
| 3 or more Vehicles | 20,374 (34.3%) | 3,081 (13.5%) |
| Total | 59,397 (100.0%) | 22,835 (100.0%) |
Real Estate & Mortgages in Henry County
Real Estate and Mortgage Overview in Henry County
| Characteristic | Without Mortgage | With Mortgage |
| Housing Units | 13,660 | 45,737 |
| Median Property Value | $233,700 | $248,500 |
| Median Household Income | $72,118 | $10,957 |
| Monthly Housing Costs | $518 | $2,228 |
| Real Estate Taxes | $1,655 | $984 |
Property Value by Mortgage Status in Henry County
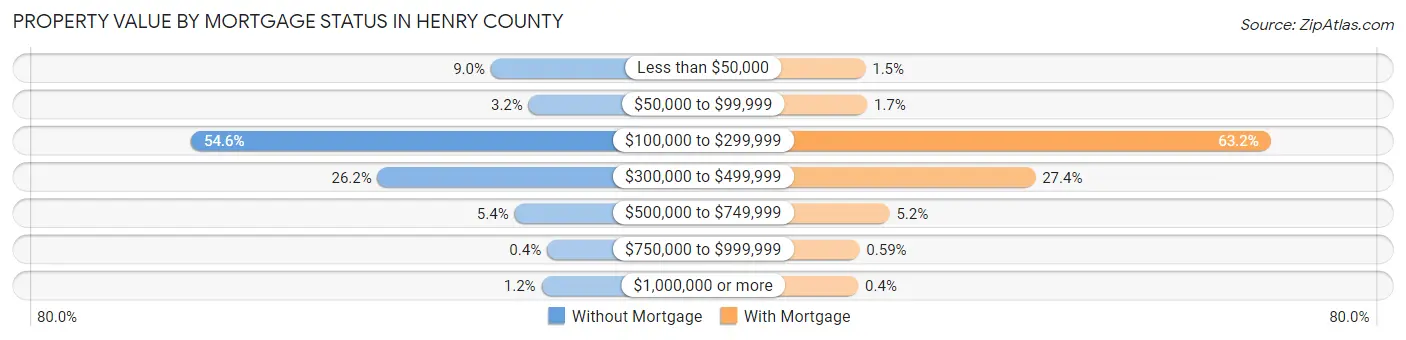
| Property Value | Without Mortgage | With Mortgage |
| Less than $50,000 | 1,224 (9.0%) | 676 (1.5%) |
| $50,000 to $99,999 | 437 (3.2%) | 796 (1.7%) |
| $100,000 to $299,999 | 7,462 (54.6%) | 28,919 (63.2%) |
| $300,000 to $499,999 | 3,582 (26.2%) | 12,525 (27.4%) |
| $500,000 to $749,999 | 731 (5.3%) | 2,366 (5.2%) |
| $750,000 to $999,999 | 54 (0.4%) | 270 (0.6%) |
| $1,000,000 or more | 170 (1.2%) | 185 (0.4%) |
| Total | 13,660 (100.0%) | 45,737 (100.0%) |
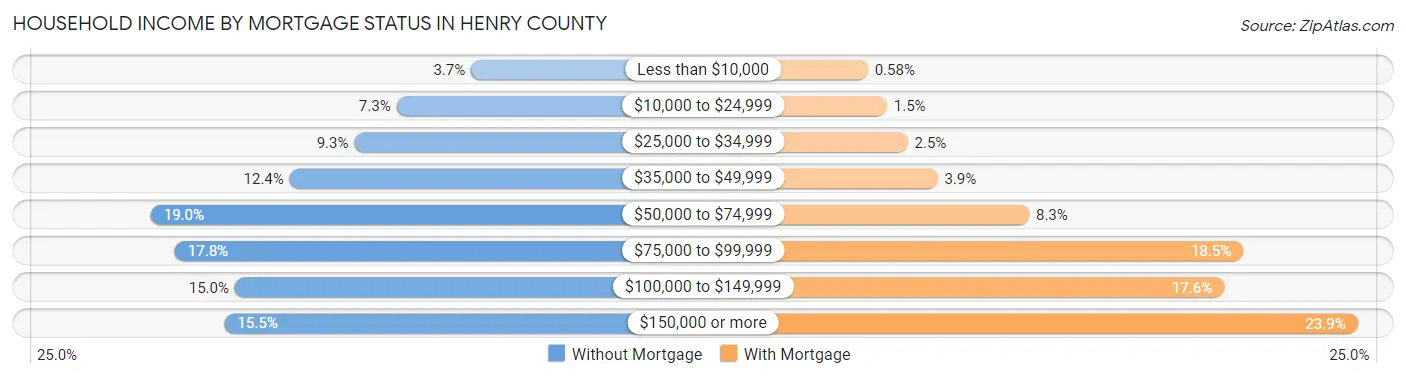
Household Income by Mortgage Status in Henry County
| Household Income | Without Mortgage | With Mortgage |
| Less than $10,000 | 511 (3.7%) | 265 (0.6%) |
| $10,000 to $24,999 | 996 (7.3%) | 682 (1.5%) |
| $25,000 to $34,999 | 1,270 (9.3%) | 1,134 (2.5%) |
| $35,000 to $49,999 | 1,691 (12.4%) | 1,785 (3.9%) |
| $50,000 to $74,999 | 2,594 (19.0%) | 3,778 (8.3%) |
| $75,000 to $99,999 | 2,437 (17.8%) | 8,443 (18.5%) |
| $100,000 to $149,999 | 2,047 (15.0%) | 8,028 (17.5%) |
| $150,000 or more | 2,114 (15.5%) | 10,930 (23.9%) |
| Total | 13,660 (100.0%) | 45,737 (100.0%) |
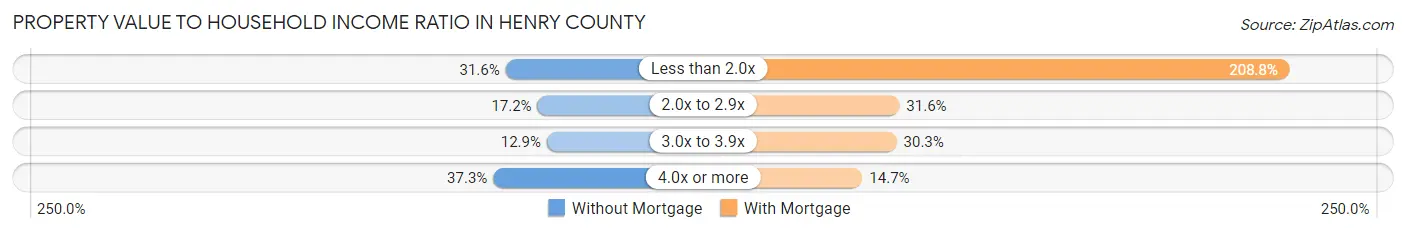
Property Value to Household Income Ratio in Henry County
| Value-to-Income Ratio | Without Mortgage | With Mortgage |
| Less than 2.0x | 4,322 (31.6%) | 95,486 (208.8%) |
| 2.0x to 2.9x | 2,343 (17.2%) | 14,431 (31.6%) |
| 3.0x to 3.9x | 1,764 (12.9%) | 13,850 (30.3%) |
| 4.0x or more | 5,091 (37.3%) | 6,742 (14.7%) |
| Total | 13,660 (100.0%) | 45,737 (100.0%) |
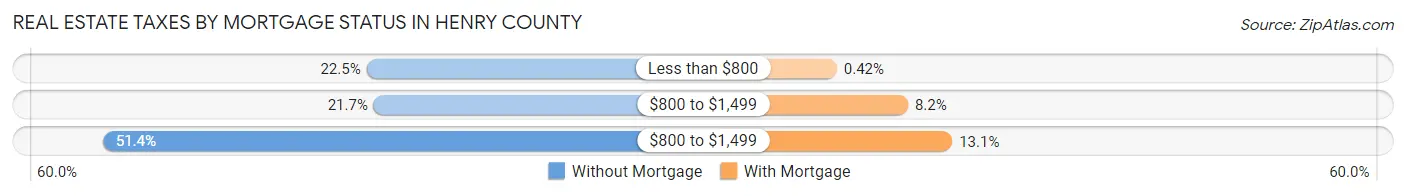
Real Estate Taxes by Mortgage Status in Henry County
| Property Taxes | Without Mortgage | With Mortgage |
| Less than $800 | 3,078 (22.5%) | 190 (0.4%) |
| $800 to $1,499 | 2,970 (21.7%) | 3,757 (8.2%) |
| $800 to $1,499 | 7,025 (51.4%) | 5,972 (13.1%) |
| Total | 13,660 (100.0%) | 45,737 (100.0%) |
Health & Disability in Henry County
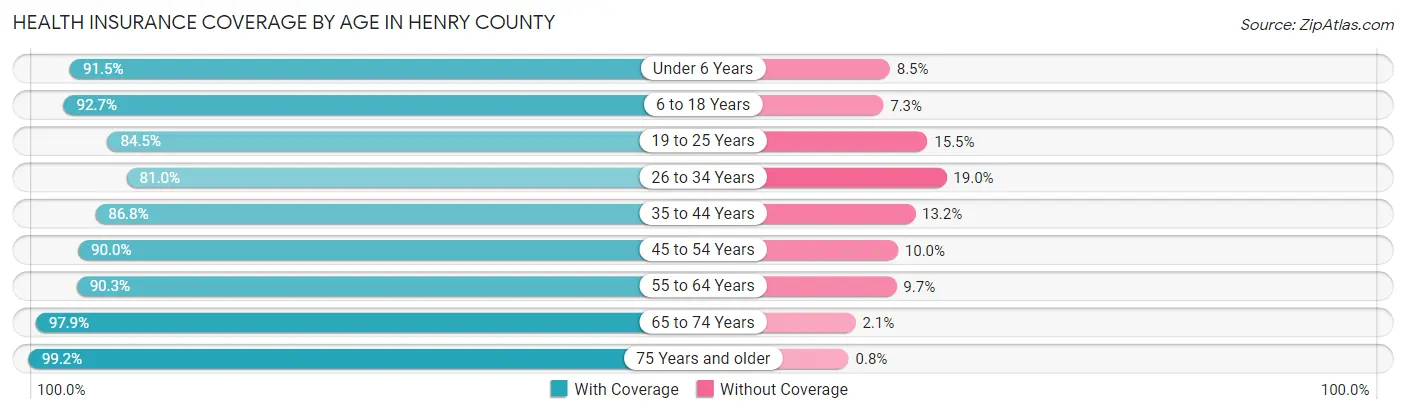
Health Insurance Coverage by Age in Henry County
| Age Bracket | With Coverage | Without Coverage |
| Under 6 Years | 15,162 (91.5%) | 1,405 (8.5%) |
| 6 to 18 Years | 43,989 (92.7%) | 3,449 (7.3%) |
| 19 to 25 Years | 18,917 (84.5%) | 3,467 (15.5%) |
| 26 to 34 Years | 21,702 (81.0%) | 5,103 (19.0%) |
| 35 to 44 Years | 27,621 (86.8%) | 4,196 (13.2%) |
| 45 to 54 Years | 31,997 (90.0%) | 3,551 (10.0%) |
| 55 to 64 Years | 27,030 (90.3%) | 2,911 (9.7%) |
| 65 to 74 Years | 18,259 (97.9%) | 389 (2.1%) |
| 75 Years and older | 10,072 (99.2%) | 81 (0.8%) |
| Total | 214,749 (89.7%) | 24,552 (10.3%) |
Health Insurance Coverage by Citizenship Status in Henry County
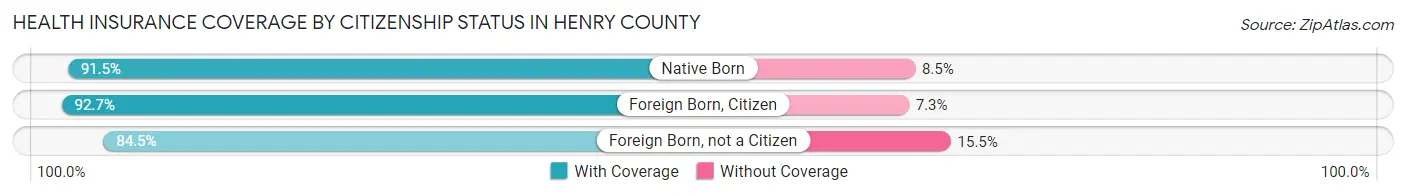
| Citizenship Status | With Coverage | Without Coverage |
| Native Born | 15,162 (91.5%) | 1,405 (8.5%) |
| Foreign Born, Citizen | 43,989 (92.7%) | 3,449 (7.3%) |
| Foreign Born, not a Citizen | 18,917 (84.5%) | 3,467 (15.5%) |
Health Insurance Coverage by Household Income in Henry County
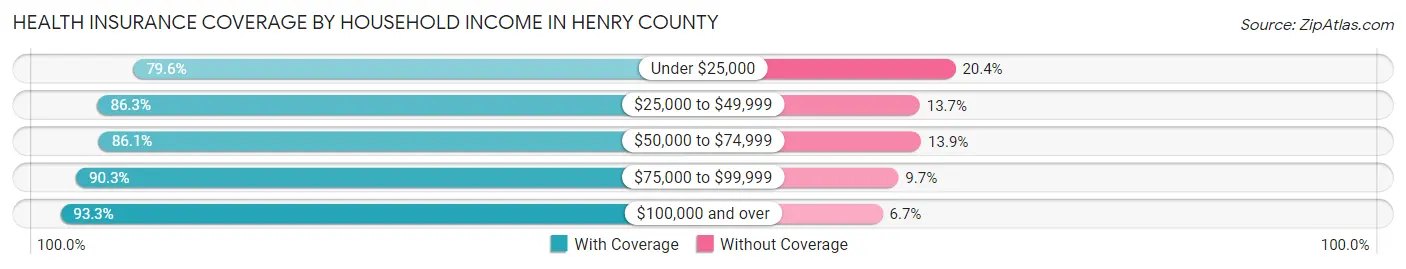
| Household Income | With Coverage | Without Coverage |
| Under $25,000 | 10,874 (79.6%) | 2,780 (20.4%) |
| $25,000 to $49,999 | 31,006 (86.3%) | 4,914 (13.7%) |
| $50,000 to $74,999 | 35,025 (86.1%) | 5,669 (13.9%) |
| $75,000 to $99,999 | 35,013 (90.3%) | 3,749 (9.7%) |
| $100,000 and over | 102,796 (93.3%) | 7,397 (6.7%) |
Public vs Private Health Insurance Coverage by Age in Henry County
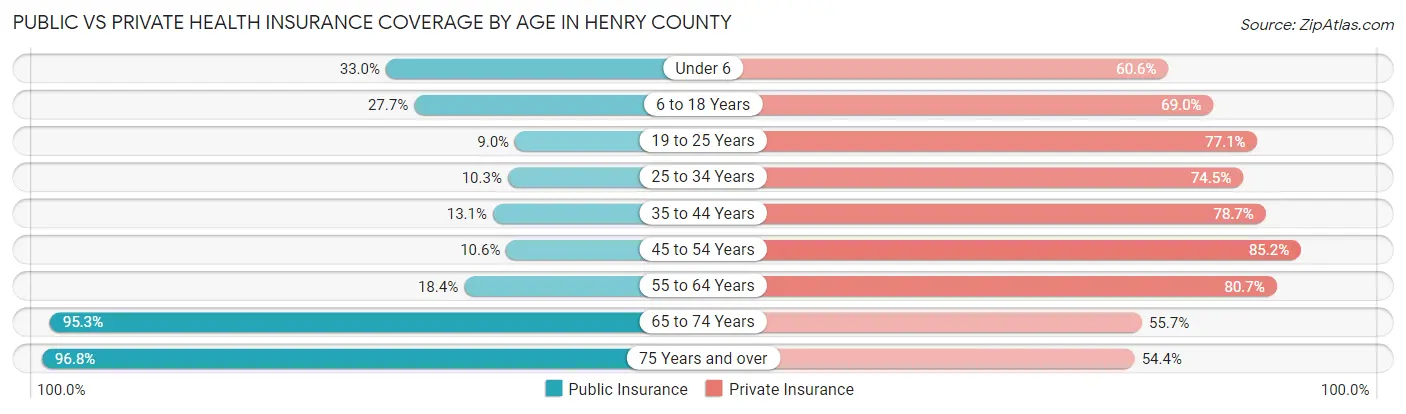
| Age Bracket | Public Insurance | Private Insurance |
| Under 6 | 5,461 (33.0%) | 10,039 (60.6%) |
| 6 to 18 Years | 13,151 (27.7%) | 32,717 (69.0%) |
| 19 to 25 Years | 2,010 (9.0%) | 17,268 (77.1%) |
| 25 to 34 Years | 2,766 (10.3%) | 19,960 (74.5%) |
| 35 to 44 Years | 4,169 (13.1%) | 25,026 (78.7%) |
| 45 to 54 Years | 3,767 (10.6%) | 30,297 (85.2%) |
| 55 to 64 Years | 5,522 (18.4%) | 24,158 (80.7%) |
| 65 to 74 Years | 17,774 (95.3%) | 10,393 (55.7%) |
| 75 Years and over | 9,826 (96.8%) | 5,520 (54.4%) |
| Total | 64,446 (26.9%) | 175,378 (73.3%) |
Disability Status by Sex by Age in Henry County
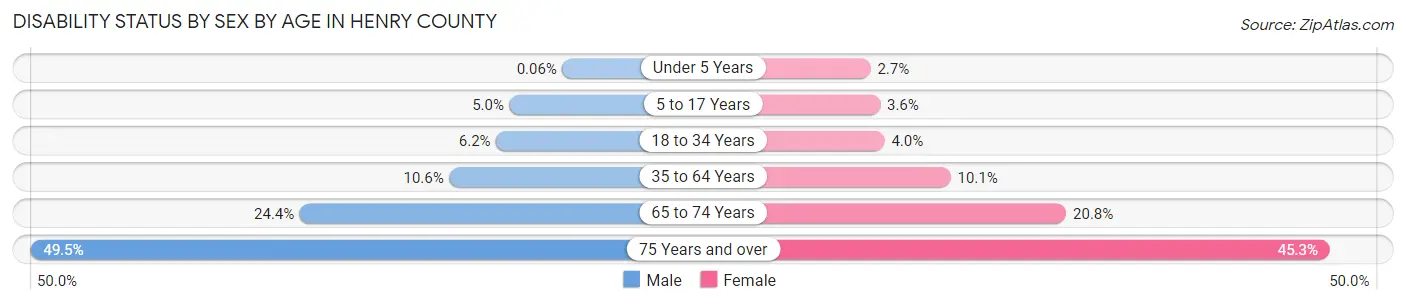
| Age Bracket | Male | Female |
| Under 5 Years | 4 (0.1%) | 173 (2.7%) |
| 5 to 17 Years | 1,191 (5.0%) | 823 (3.5%) |
| 18 to 34 Years | 1,586 (6.2%) | 1,072 (4.0%) |
| 35 to 64 Years | 4,762 (10.6%) | 5,268 (10.1%) |
| 65 to 74 Years | 2,051 (24.4%) | 2,134 (20.8%) |
| 75 Years and over | 2,105 (49.5%) | 2,671 (45.3%) |
Disability Class by Sex by Age in Henry County
Disability Class: Hearing Difficulty
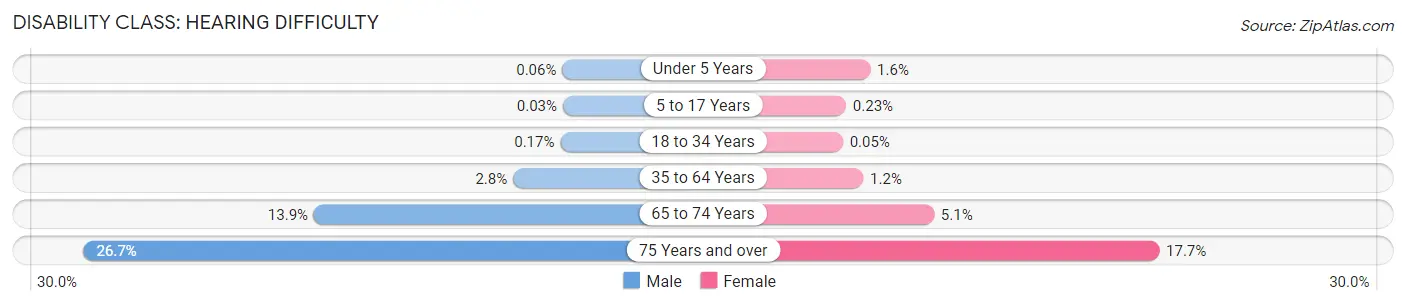
| Age Bracket | Male | Female |
| Under 5 Years | 4 (0.1%) | 103 (1.6%) |
| 5 to 17 Years | 8 (0.0%) | 54 (0.2%) |
| 18 to 34 Years | 43 (0.2%) | 14 (0.1%) |
| 35 to 64 Years | 1,264 (2.8%) | 619 (1.2%) |
| 65 to 74 Years | 1,166 (13.9%) | 526 (5.1%) |
| 75 Years and over | 1,137 (26.7%) | 1,042 (17.7%) |
Disability Class: Vision Difficulty
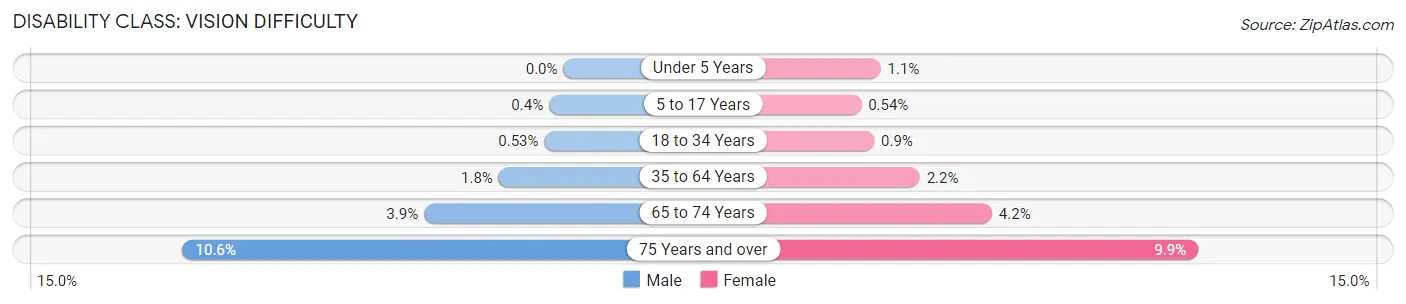
| Age Bracket | Male | Female |
| Under 5 Years | 0 (0.0%) | 70 (1.1%) |
| 5 to 17 Years | 96 (0.4%) | 126 (0.5%) |
| 18 to 34 Years | 136 (0.5%) | 244 (0.9%) |
| 35 to 64 Years | 812 (1.8%) | 1,135 (2.2%) |
| 65 to 74 Years | 326 (3.9%) | 428 (4.2%) |
| 75 Years and over | 451 (10.6%) | 585 (9.9%) |
Disability Class: Cognitive Difficulty
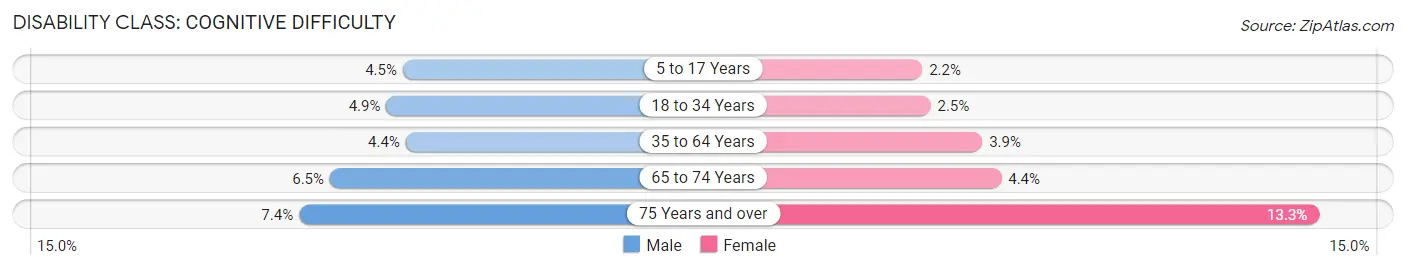
| Age Bracket | Male | Female |
| 5 to 17 Years | 1,070 (4.5%) | 520 (2.2%) |
| 18 to 34 Years | 1,260 (4.9%) | 667 (2.5%) |
| 35 to 64 Years | 1,979 (4.4%) | 2,044 (3.9%) |
| 65 to 74 Years | 546 (6.5%) | 455 (4.4%) |
| 75 Years and over | 313 (7.4%) | 784 (13.3%) |
Disability Class: Ambulatory Difficulty
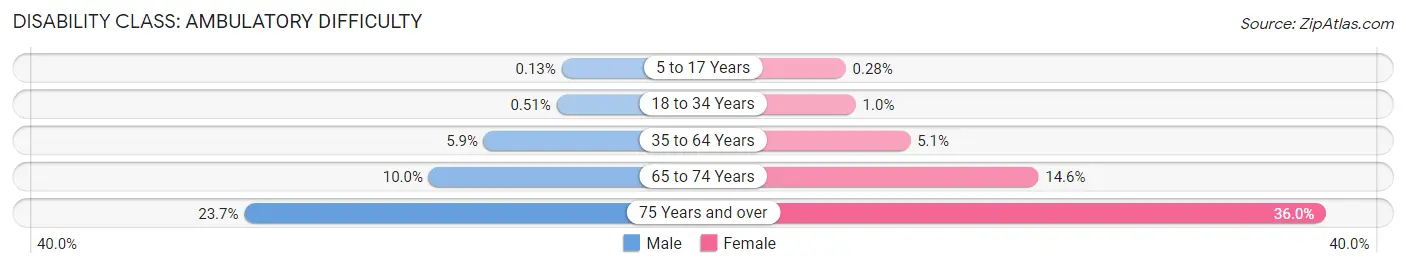
| Age Bracket | Male | Female |
| 5 to 17 Years | 32 (0.1%) | 65 (0.3%) |
| 18 to 34 Years | 131 (0.5%) | 279 (1.0%) |
| 35 to 64 Years | 2,661 (5.9%) | 2,651 (5.1%) |
| 65 to 74 Years | 839 (10.0%) | 1,496 (14.6%) |
| 75 Years and over | 1,008 (23.7%) | 2,121 (36.0%) |
Disability Class: Self-Care Difficulty
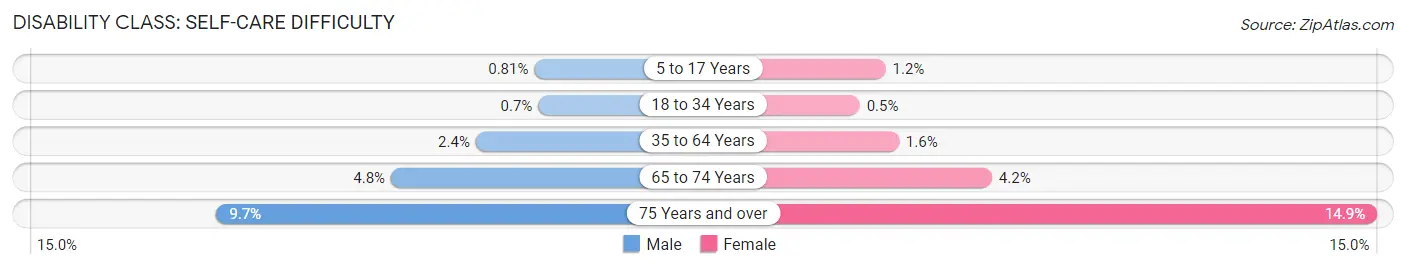
| Age Bracket | Male | Female |
| 5 to 17 Years | 194 (0.8%) | 283 (1.2%) |
| 18 to 34 Years | 178 (0.7%) | 135 (0.5%) |
| 35 to 64 Years | 1,102 (2.4%) | 832 (1.6%) |
| 65 to 74 Years | 403 (4.8%) | 428 (4.2%) |
| 75 Years and over | 411 (9.7%) | 879 (14.9%) |
Technology Access in Henry County
Computing Device Access in Henry County
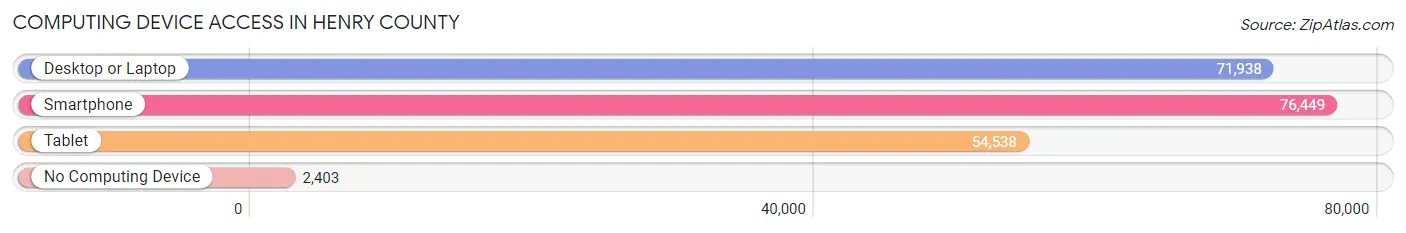
| Device Type | # Households | % Households |
| Desktop or Laptop | 71,938 | 87.5% |
| Smartphone | 76,449 | 93.0% |
| Tablet | 54,538 | 66.3% |
| No Computing Device | 2,403 | 2.9% |
| Total | 82,232 | 100.0% |
Internet Access in Henry County

| Internet Type | # Households | % Households |
| Dial-Up Internet | 135 | 0.2% |
| Broadband Home | 62,495 | 76.0% |
| Cellular Data Only | 8,005 | 9.7% |
| Satellite Internet | 6,757 | 8.2% |
| No Internet | 8,062 | 9.8% |
| Total | 82,232 | 100.0% |
Henry County Summary
Henry County, Georgia is located in the north-central part of the state, approximately 25 miles south of Atlanta. It is bordered by Clayton, Fayette, Spalding, Butts, and Newton counties. The county seat is McDonough, and the county is named after Patrick Henry, a Revolutionary War patriot and one of the Founding Fathers of the United States.
Geography
Henry County covers an area of approximately 243 square miles, with a population of over 212,000 people. The county is mostly flat, with some rolling hills in the northern part. The county is drained by the Ocmulgee River, which forms the western boundary of the county. The county is also home to several lakes, including Lake Jackson, Lake Dow, and Lake Tara.
Climate
Henry County has a humid subtropical climate, with hot, humid summers and mild winters. The average annual temperature is around 64°F, with an average high of around 87°F in the summer and an average low of around 41°F in the winter. The average annual precipitation is around 50 inches, with most of it falling in the summer months.
Economy
Henry County has a diverse economy, with a mix of manufacturing, retail, and service industries. The county is home to several large companies, including Tanger Outlets, Georgia-Pacific, and Home Depot. The county is also home to several smaller businesses, including restaurants, shops, and other services.
The county is also home to several educational institutions, including Georgia Military College, Georgia Perimeter College, and Southern Crescent Technical College.
Demographics
As of the 2010 census, Henry County had a population of 203,922 people. The racial makeup of the county was 68.3% White, 24.2% African American, 4.2% Hispanic or Latino, 2.2% Asian, and 0.7% Native American. The median household income was $60,845, and the median family income was $71,845.
Conclusion
Henry County, Georgia is a diverse county with a mix of economic and demographic characteristics. It is home to several large companies, educational institutions, and smaller businesses. The county has a humid subtropical climate, with hot, humid summers and mild winters. The population of the county is over 212,000 people, with a median household income of $60,845. Henry County is a great place to live, work, and play.
Common Questions
What is the Total Population of Henry County?
Total Population of Henry County is 240,853.
What is the Total Male Population of Henry County?
Total Male Population of Henry County is 115,211.
What is the Total Female Population of Henry County?
Total Female Population of Henry County is 125,642.
What is the Ratio of Males per 100 Females in Henry County?
There are 91.70 Males per 100 Females in Henry County.
What is the Ratio of Females per 100 Males in Henry County?
There are 109.05 Females per 100 Males in Henry County.
What is the Median Population Age in Henry County?
Median Population Age in Henry County is 36.9 Years.
What is the Average Family Size in Henry County
Average Family Size in Henry County is 3.4 People.
What is the Average Household Size in Henry County
Average Household Size in Henry County is 2.9 People.
What is Per Capita Income in Henry County?
Per Capita income in Henry County is $35,065.
What is the Median Family Income in Henry County?
Median Family Income in Henry County is $88,355.
What is the Median Household income in Henry County?
Median Household Income in Henry County is $79,663.
What is Income or Wage Gap in Henry County?
Income or Wage Gap in Henry County is 24.8%.
Women in Henry County earn 75.2 cents for every dollar earned by a man.
What is Family Income Deficit in Henry County?
Family Income Deficit in Henry County is $9,485.
Families that are below poverty line in Henry County earn $9,485 less on average than the poverty threshold level.
What is Inequality or Gini Index in Henry County?
Inequality or Gini Index in Henry County is 0.38.
How Large is the Labor Force in Henry County?
There are 125,571 People in the Labor Forcein in Henry County.
What is the Percentage of People in the Labor Force in Henry County?
66.5% of People are in the Labor Force in Henry County.
What is the Unemployment Rate in Henry County?
Unemployment Rate in Henry County is 5.3%.