Gwinnett County, GA
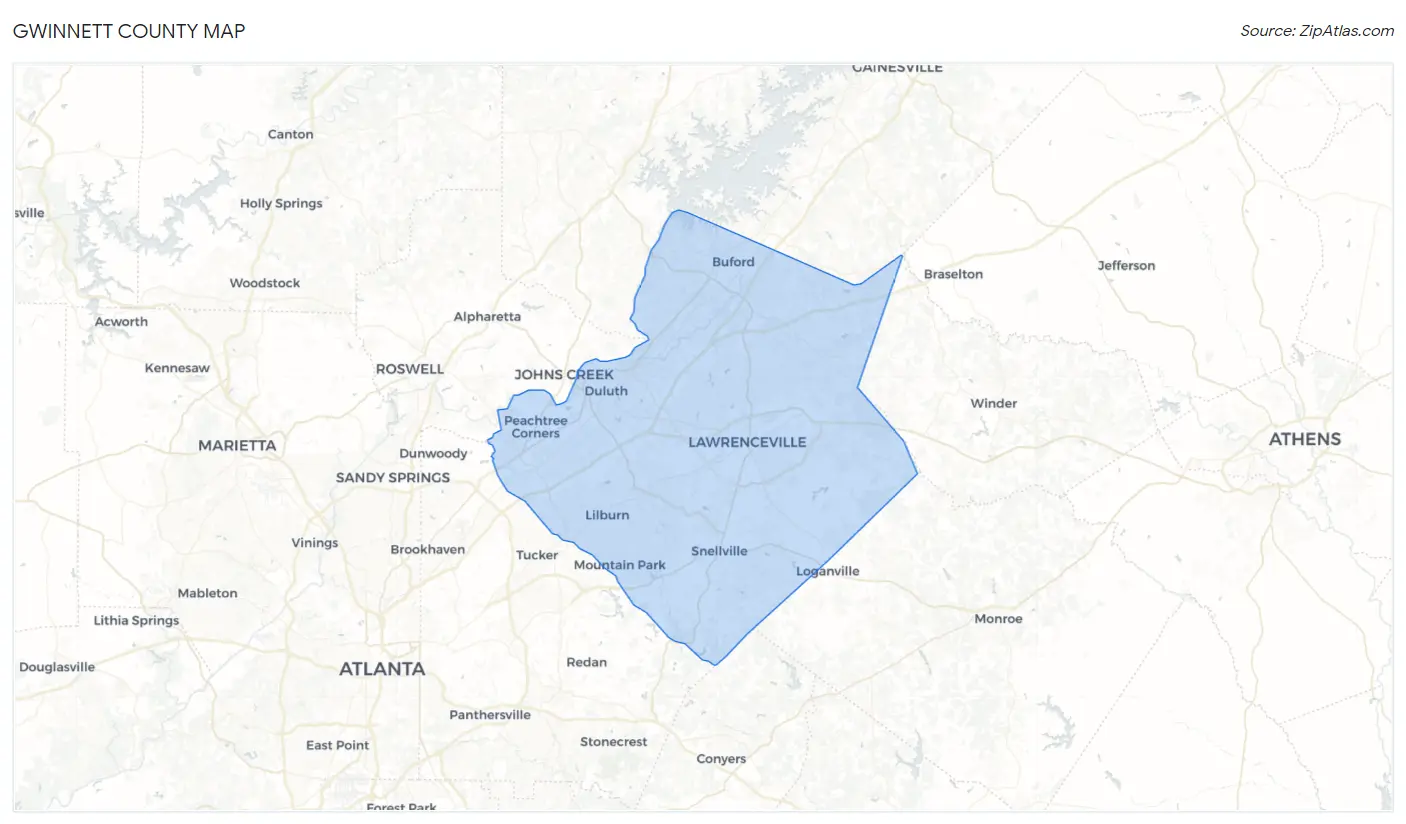
Gwinnett County Map
Gwinnett County Overview
957,977
TOTAL POPULATION
470,667
MALE POPULATION
487,310
FEMALE POPULATION
96.58
MALES / 100 FEMALES
103.54
FEMALES / 100 MALES
35.7
MEDIAN AGE
3.5
AVG FAMILY SIZE
3.0
AVG HOUSEHOLD SIZE
$36,778
PER CAPITA INCOME
$94,411
AVG FAMILY INCOME
$82,296
AVG HOUSEHOLD INCOME
23.4%
WAGE / INCOME GAP [ % ]
76.6¢/ $1
WAGE / INCOME GAP [ $ ]
$10,647
FAMILY INCOME DEFICIT
0.44
INEQUALITY / GINI INDEX
503,930
LABOR FORCE [ PEOPLE ]
68.4%
PERCENT IN LABOR FORCE
4.1%
UNEMPLOYMENT RATE
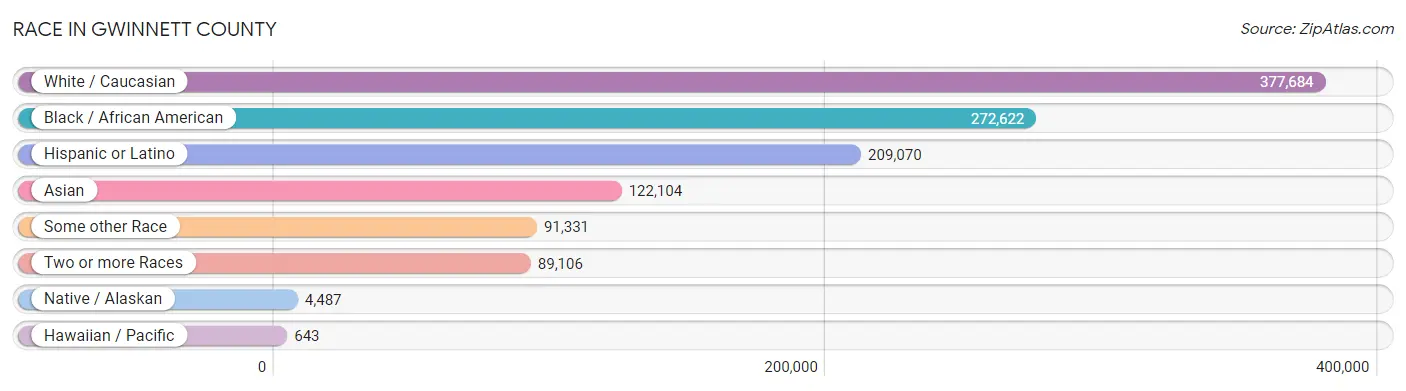
Race in Gwinnett County
The most populous races in Gwinnett County are White / Caucasian (377,684 | 39.4%), Black / African American (272,622 | 28.5%), and Hispanic or Latino (209,070 | 21.8%).
| Race | # Population | % Population |
| Asian | 122,104 | 12.8% |
| Black / African American | 272,622 | 28.5% |
| Hawaiian / Pacific | 643 | 0.1% |
| Hispanic or Latino | 209,070 | 21.8% |
| Native / Alaskan | 4,487 | 0.5% |
| White / Caucasian | 377,684 | 39.4% |
| Two or more Races | 89,106 | 9.3% |
| Some other Race | 91,331 | 9.5% |
| Total | 957,977 | 100.0% |
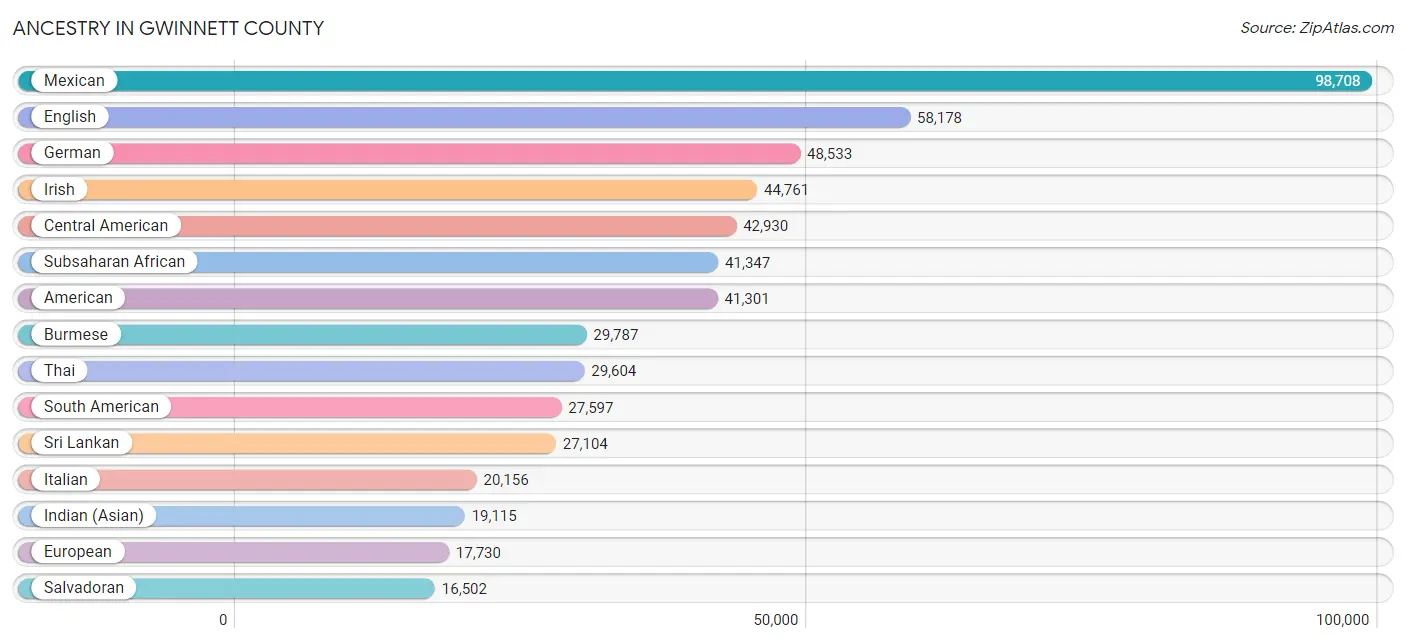
Ancestry in Gwinnett County
The most populous ancestries reported in Gwinnett County are Mexican (98,708 | 10.3%), English (58,178 | 6.1%), German (48,533 | 5.1%), Irish (44,761 | 4.7%), and Central American (42,930 | 4.5%), together accounting for 30.6% of all Gwinnett County residents.
| Ancestry | # Population | % Population |
| Afghan | 741 | 0.1% |
| African | 13,825 | 1.4% |
| Alaska Native | 8 | 0.0% |
| Alaskan Athabascan | 13 | 0.0% |
| Albanian | 354 | 0.0% |
| American | 41,301 | 4.3% |
| Apache | 142 | 0.0% |
| Arab | 5,165 | 0.5% |
| Argentinean | 426 | 0.0% |
| Armenian | 487 | 0.1% |
| Assyrian / Chaldean / Syriac | 46 | 0.0% |
| Australian | 126 | 0.0% |
| Austrian | 544 | 0.1% |
| Bahamian | 399 | 0.0% |
| Bangladeshi | 1,447 | 0.2% |
| Barbadian | 705 | 0.1% |
| Basque | 62 | 0.0% |
| Belgian | 431 | 0.0% |
| Belizean | 272 | 0.0% |
| Bermudan | 312 | 0.0% |
| Bhutanese | 2,960 | 0.3% |
| Blackfeet | 293 | 0.0% |
| Bolivian | 136 | 0.0% |
| Brazilian | 971 | 0.1% |
| British | 5,003 | 0.5% |
| British West Indian | 841 | 0.1% |
| Bulgarian | 638 | 0.1% |
| Burmese | 29,787 | 3.1% |
| Cajun | 402 | 0.0% |
| Cambodian | 40 | 0.0% |
| Canadian | 1,055 | 0.1% |
| Cape Verdean | 179 | 0.0% |
| Celtic | 320 | 0.0% |
| Central American | 42,930 | 4.5% |
| Central American Indian | 858 | 0.1% |
| Cherokee | 2,290 | 0.2% |
| Chickasaw | 16 | 0.0% |
| Chilean | 416 | 0.0% |
| Chinese | 121 | 0.0% |
| Chippewa | 77 | 0.0% |
| Choctaw | 106 | 0.0% |
| Colombian | 11,076 | 1.2% |
| Comanche | 85 | 0.0% |
| Costa Rican | 1,948 | 0.2% |
| Creek | 151 | 0.0% |
| Croatian | 448 | 0.1% |
| Crow | 13 | 0.0% |
| Cuban | 5,066 | 0.5% |
| Cypriot | 29 | 0.0% |
| Czech | 1,555 | 0.2% |
| Czechoslovakian | 194 | 0.0% |
| Danish | 1,870 | 0.2% |
| Delaware | 29 | 0.0% |
| Dominican | 10,182 | 1.1% |
| Dutch | 4,939 | 0.5% |
| Eastern European | 1,506 | 0.2% |
| Ecuadorian | 2,131 | 0.2% |
| Egyptian | 635 | 0.1% |
| English | 58,178 | 6.1% |
| Estonian | 15 | 0.0% |
| Ethiopian | 6,529 | 0.7% |
| European | 17,730 | 1.8% |
| Filipino | 1,143 | 0.1% |
| Finnish | 569 | 0.1% |
| French | 9,629 | 1.0% |
| French American Indian | 32 | 0.0% |
| French Canadian | 2,649 | 0.3% |
| German | 48,533 | 5.1% |
| German Russian | 12 | 0.0% |
| Ghanaian | 2,912 | 0.3% |
| Greek | 1,316 | 0.1% |
| Guamanian / Chamorro | 214 | 0.0% |
| Guatemalan | 12,887 | 1.3% |
| Guyanese | 2,383 | 0.3% |
| Haitian | 8,752 | 0.9% |
| Honduran | 8,367 | 0.9% |
| Hungarian | 1,792 | 0.2% |
| Icelander | 131 | 0.0% |
| Indian (Asian) | 19,115 | 2.0% |
| Indonesian | 1,244 | 0.1% |
| Inupiat | 52 | 0.0% |
| Iranian | 1,752 | 0.2% |
| Iraqi | 1,027 | 0.1% |
| Irish | 44,761 | 4.7% |
| Iroquois | 93 | 0.0% |
| Israeli | 131 | 0.0% |
| Italian | 20,156 | 2.1% |
| Jamaican | 14,546 | 1.5% |
| Japanese | 2,249 | 0.2% |
| Jordanian | 246 | 0.0% |
| Kenyan | 229 | 0.0% |
| Korean | 5,893 | 0.6% |
| Laotian | 1,198 | 0.1% |
| Latvian | 71 | 0.0% |
| Lebanese | 1,192 | 0.1% |
| Liberian | 1,502 | 0.2% |
| Lithuanian | 487 | 0.1% |
| Lumbee | 14 | 0.0% |
| Luxembourger | 22 | 0.0% |
| Macedonian | 53 | 0.0% |
| Malaysian | 1,470 | 0.2% |
| Maltese | 104 | 0.0% |
| Menominee | 2 | 0.0% |
| Mexican | 98,708 | 10.3% |
| Mexican American Indian | 2,614 | 0.3% |
| Mongolian | 116 | 0.0% |
| Moroccan | 390 | 0.0% |
| Native Hawaiian | 852 | 0.1% |
| Navajo | 121 | 0.0% |
| Nicaraguan | 2,020 | 0.2% |
| Nigerian | 10,241 | 1.1% |
| Northern European | 919 | 0.1% |
| Norwegian | 3,378 | 0.4% |
| Okinawan | 368 | 0.0% |
| Osage | 27 | 0.0% |
| Paiute | 32 | 0.0% |
| Pakistani | 1,002 | 0.1% |
| Palestinian | 187 | 0.0% |
| Panamanian | 1,150 | 0.1% |
| Paraguayan | 97 | 0.0% |
| Pennsylvania German | 159 | 0.0% |
| Peruvian | 2,794 | 0.3% |
| Polish | 11,315 | 1.2% |
| Portuguese | 1,306 | 0.1% |
| Pueblo | 30 | 0.0% |
| Puerto Rican | 16,004 | 1.7% |
| Puget Sound Salish | 78 | 0.0% |
| Romanian | 5,351 | 0.6% |
| Russian | 2,949 | 0.3% |
| Salvadoran | 16,502 | 1.7% |
| Samoan | 73 | 0.0% |
| Scandinavian | 981 | 0.1% |
| Scotch-Irish | 7,305 | 0.8% |
| Scottish | 12,734 | 1.3% |
| Seminole | 69 | 0.0% |
| Serbian | 155 | 0.0% |
| Shoshone | 16 | 0.0% |
| Sierra Leonean | 127 | 0.0% |
| Sioux | 135 | 0.0% |
| Slavic | 210 | 0.0% |
| Slovak | 521 | 0.1% |
| Slovene | 122 | 0.0% |
| Somali | 1,295 | 0.1% |
| South African | 194 | 0.0% |
| South American | 27,597 | 2.9% |
| South American Indian | 532 | 0.1% |
| Spaniard | 1,178 | 0.1% |
| Spanish | 552 | 0.1% |
| Sri Lankan | 27,104 | 2.8% |
| Subsaharan African | 41,347 | 4.3% |
| Sudanese | 303 | 0.0% |
| Swedish | 3,208 | 0.3% |
| Swiss | 1,087 | 0.1% |
| Syrian | 222 | 0.0% |
| Thai | 29,604 | 3.1% |
| Tongan | 23 | 0.0% |
| Trinidadian and Tobagonian | 1,195 | 0.1% |
| Turkish | 219 | 0.0% |
| U.S. Virgin Islander | 267 | 0.0% |
| Ugandan | 140 | 0.0% |
| Ukrainian | 2,089 | 0.2% |
| Uruguayan | 1,252 | 0.1% |
| Venezuelan | 9,202 | 1.0% |
| Vietnamese | 3,201 | 0.3% |
| Welsh | 3,234 | 0.3% |
| West Indian | 1,499 | 0.2% |
| Yugoslavian | 3,949 | 0.4% |
| Zimbabwean | 119 | 0.0% | View All 168 Rows |
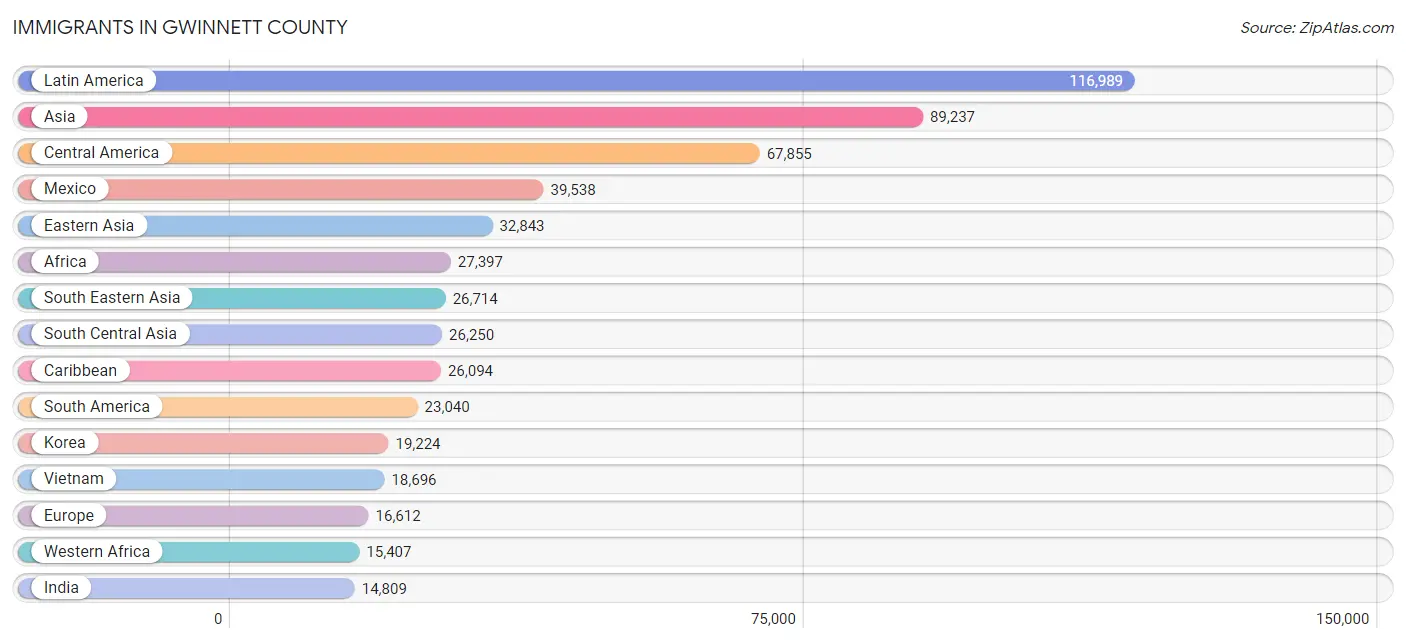
Immigrants in Gwinnett County
The most numerous immigrant groups reported in Gwinnett County came from Latin America (116,989 | 12.2%), Asia (89,237 | 9.3%), Central America (67,855 | 7.1%), Mexico (39,538 | 4.1%), and Eastern Asia (32,843 | 3.4%), together accounting for 36.2% of all Gwinnett County residents.
| Immigration Origin | # Population | % Population |
| Afghanistan | 949 | 0.1% |
| Africa | 27,397 | 2.9% |
| Argentina | 427 | 0.0% |
| Armenia | 101 | 0.0% |
| Asia | 89,237 | 9.3% |
| Australia | 146 | 0.0% |
| Austria | 69 | 0.0% |
| Bahamas | 318 | 0.0% |
| Bangladesh | 3,502 | 0.4% |
| Barbados | 162 | 0.0% |
| Belarus | 78 | 0.0% |
| Belgium | 64 | 0.0% |
| Belize | 115 | 0.0% |
| Bolivia | 116 | 0.0% |
| Bosnia and Herzegovina | 2,638 | 0.3% |
| Brazil | 1,071 | 0.1% |
| Bulgaria | 349 | 0.0% |
| Cabo Verde | 17 | 0.0% |
| Cambodia | 764 | 0.1% |
| Cameroon | 867 | 0.1% |
| Canada | 2,064 | 0.2% |
| Caribbean | 26,094 | 2.7% |
| Central America | 67,855 | 7.1% |
| Chile | 228 | 0.0% |
| China | 12,410 | 1.3% |
| Colombia | 7,869 | 0.8% |
| Congo | 464 | 0.1% |
| Costa Rica | 1,216 | 0.1% |
| Croatia | 321 | 0.0% |
| Cuba | 2,919 | 0.3% |
| Czechoslovakia | 371 | 0.0% |
| Denmark | 195 | 0.0% |
| Dominica | 258 | 0.0% |
| Dominican Republic | 5,440 | 0.6% |
| Eastern Africa | 8,641 | 0.9% |
| Eastern Asia | 32,843 | 3.4% |
| Eastern Europe | 10,784 | 1.1% |
| Ecuador | 1,084 | 0.1% |
| Egypt | 334 | 0.0% |
| El Salvador | 10,609 | 1.1% |
| England | 969 | 0.1% |
| Eritrea | 481 | 0.1% |
| Ethiopia | 5,677 | 0.6% |
| Europe | 16,612 | 1.7% |
| Fiji | 12 | 0.0% |
| France | 192 | 0.0% |
| Germany | 1,517 | 0.2% |
| Ghana | 4,044 | 0.4% |
| Greece | 36 | 0.0% |
| Grenada | 22 | 0.0% |
| Guatemala | 7,094 | 0.7% |
| Guyana | 1,547 | 0.2% |
| Haiti | 4,375 | 0.5% |
| Honduras | 6,878 | 0.7% |
| Hong Kong | 735 | 0.1% |
| Hungary | 153 | 0.0% |
| India | 14,809 | 1.5% |
| Indonesia | 914 | 0.1% |
| Iran | 1,211 | 0.1% |
| Iraq | 1,336 | 0.1% |
| Ireland | 86 | 0.0% |
| Israel | 133 | 0.0% |
| Italy | 186 | 0.0% |
| Jamaica | 9,421 | 1.0% |
| Japan | 1,209 | 0.1% |
| Jordan | 281 | 0.0% |
| Kazakhstan | 215 | 0.0% |
| Kenya | 838 | 0.1% |
| Korea | 19,224 | 2.0% |
| Kuwait | 150 | 0.0% |
| Laos | 886 | 0.1% |
| Latin America | 116,989 | 12.2% |
| Latvia | 11 | 0.0% |
| Lebanon | 588 | 0.1% |
| Liberia | 1,173 | 0.1% |
| Lithuania | 11 | 0.0% |
| Malaysia | 894 | 0.1% |
| Mexico | 39,538 | 4.1% |
| Micronesia | 42 | 0.0% |
| Middle Africa | 1,677 | 0.2% |
| Moldova | 396 | 0.0% |
| Morocco | 298 | 0.0% |
| Nepal | 518 | 0.1% |
| Netherlands | 134 | 0.0% |
| Nicaragua | 1,134 | 0.1% |
| Nigeria | 7,974 | 0.8% |
| Northern Africa | 1,037 | 0.1% |
| Northern Europe | 3,001 | 0.3% |
| Oceania | 277 | 0.0% |
| Pakistan | 3,917 | 0.4% |
| Panama | 957 | 0.1% |
| Peru | 2,212 | 0.2% |
| Philippines | 2,306 | 0.2% |
| Poland | 790 | 0.1% |
| Portugal | 38 | 0.0% |
| Romania | 3,415 | 0.4% |
| Russia | 582 | 0.1% |
| Saudi Arabia | 179 | 0.0% |
| Scotland | 101 | 0.0% |
| Senegal | 22 | 0.0% |
| Serbia | 208 | 0.0% |
| Sierra Leone | 107 | 0.0% |
| Singapore | 407 | 0.0% |
| Somalia | 245 | 0.0% |
| South Africa | 285 | 0.0% |
| South America | 23,040 | 2.4% |
| South Central Asia | 26,250 | 2.7% |
| South Eastern Asia | 26,714 | 2.8% |
| Southern Europe | 687 | 0.1% |
| Spain | 427 | 0.0% |
| Sri Lanka | 44 | 0.0% |
| St. Vincent and the Grenadines | 164 | 0.0% |
| Sudan | 342 | 0.0% |
| Sweden | 296 | 0.0% |
| Switzerland | 125 | 0.0% |
| Syria | 64 | 0.0% |
| Taiwan | 1,546 | 0.2% |
| Thailand | 729 | 0.1% |
| Trinidad and Tobago | 1,592 | 0.2% |
| Turkey | 106 | 0.0% |
| Uganda | 234 | 0.0% |
| Ukraine | 960 | 0.1% |
| Uruguay | 1,079 | 0.1% |
| Uzbekistan | 135 | 0.0% |
| Venezuela | 7,264 | 0.8% |
| Vietnam | 18,696 | 1.9% |
| West Indies | 155 | 0.0% |
| Western Africa | 15,407 | 1.6% |
| Western Asia | 3,259 | 0.3% |
| Western Europe | 2,116 | 0.2% |
| Yemen | 36 | 0.0% |
| Zaire | 346 | 0.0% |
| Zimbabwe | 170 | 0.0% | View All 133 Rows |
Sex and Age in Gwinnett County
Sex and Age in Gwinnett County
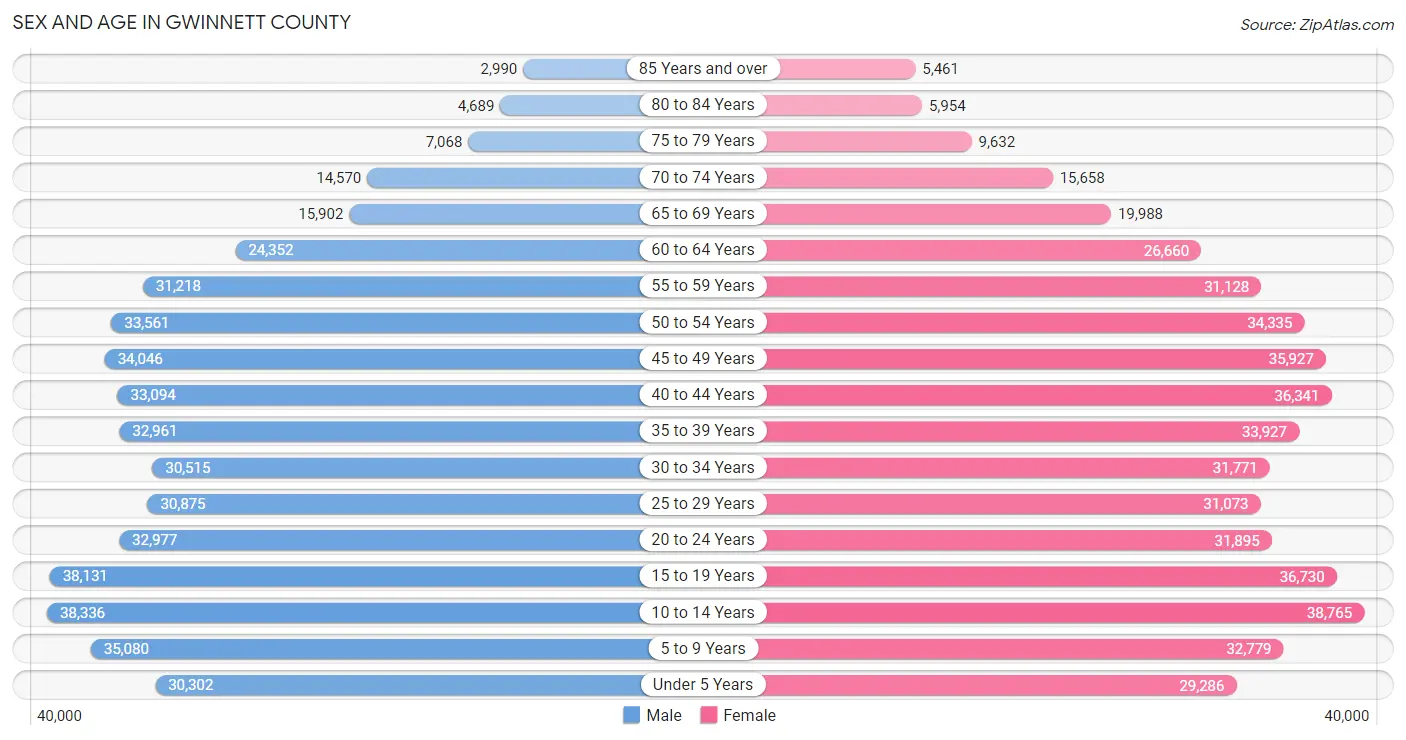
The most populous age groups in Gwinnett County are 10 to 14 Years (38,336 | 8.2%) for men and 10 to 14 Years (38,765 | 8.0%) for women.
| Age Bracket | Male | Female |
| Under 5 Years | 30,302 (6.4%) | 29,286 (6.0%) |
| 5 to 9 Years | 35,080 (7.4%) | 32,779 (6.7%) |
| 10 to 14 Years | 38,336 (8.2%) | 38,765 (8.0%) |
| 15 to 19 Years | 38,131 (8.1%) | 36,730 (7.5%) |
| 20 to 24 Years | 32,977 (7.0%) | 31,895 (6.6%) |
| 25 to 29 Years | 30,875 (6.6%) | 31,073 (6.4%) |
| 30 to 34 Years | 30,515 (6.5%) | 31,771 (6.5%) |
| 35 to 39 Years | 32,961 (7.0%) | 33,927 (7.0%) |
| 40 to 44 Years | 33,094 (7.0%) | 36,341 (7.5%) |
| 45 to 49 Years | 34,046 (7.2%) | 35,927 (7.4%) |
| 50 to 54 Years | 33,561 (7.1%) | 34,335 (7.0%) |
| 55 to 59 Years | 31,218 (6.6%) | 31,128 (6.4%) |
| 60 to 64 Years | 24,352 (5.2%) | 26,660 (5.5%) |
| 65 to 69 Years | 15,902 (3.4%) | 19,988 (4.1%) |
| 70 to 74 Years | 14,570 (3.1%) | 15,658 (3.2%) |
| 75 to 79 Years | 7,068 (1.5%) | 9,632 (2.0%) |
| 80 to 84 Years | 4,689 (1.0%) | 5,954 (1.2%) |
| 85 Years and over | 2,990 (0.6%) | 5,461 (1.1%) |
| Total | 470,667 (100.0%) | 487,310 (100.0%) |
Families and Households in Gwinnett County
Median Family Size in Gwinnett County
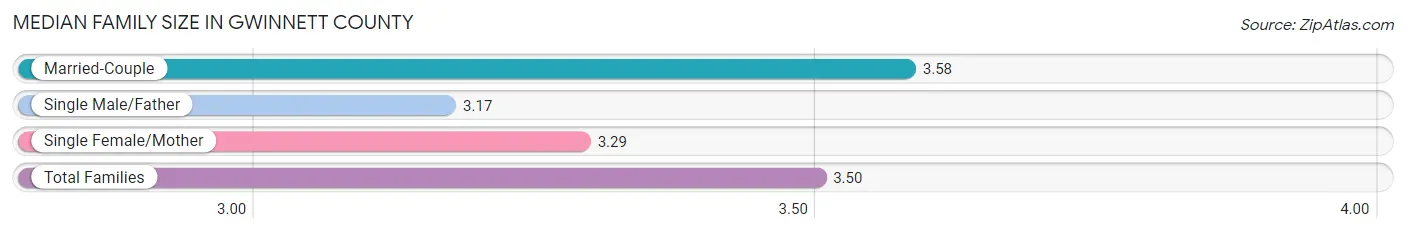
The median family size in Gwinnett County is 3.50 persons per family, with married-couple families (175,781 | 74.1%) accounting for the largest median family size of 3.58 persons per family. On the other hand, single male/father families (17,360 | 7.3%) represent the smallest median family size with 3.17 persons per family.
| Family Type | # Families | Family Size |
| Married-Couple | 175,781 (74.1%) | 3.58 |
| Single Male/Father | 17,360 (7.3%) | 3.17 |
| Single Female/Mother | 44,149 (18.6%) | 3.29 |
| Total Families | 237,290 (100.0%) | 3.50 |
Median Household Size in Gwinnett County
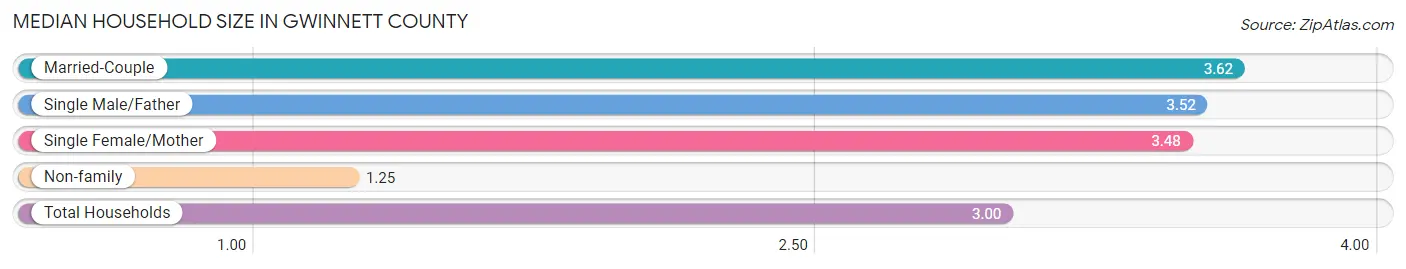
The median household size in Gwinnett County is 3.00 persons per household, with married-couple households (175,781 | 55.3%) accounting for the largest median household size of 3.62 persons per household. non-family households (80,681 | 25.4%) represent the smallest median household size with 1.25 persons per household.
| Household Type | # Households | Household Size |
| Married-Couple | 175,781 (55.3%) | 3.62 |
| Single Male/Father | 17,360 (5.5%) | 3.52 |
| Single Female/Mother | 44,149 (13.9%) | 3.48 |
| Non-family | 80,681 (25.4%) | 1.25 |
| Total Households | 317,971 (100.0%) | 3.00 |
Household Size by Marriage Status in Gwinnett County
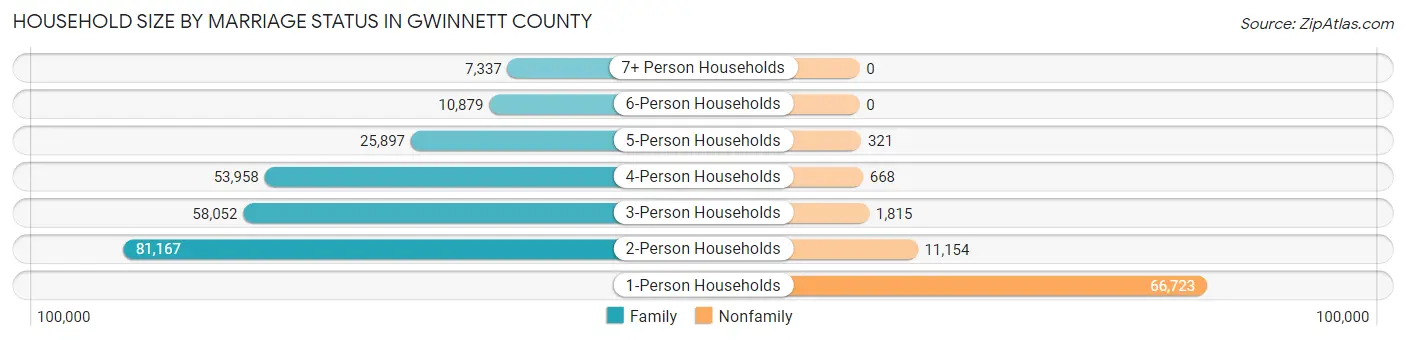
Out of a total of 317,971 households in Gwinnett County, 237,290 (74.6%) are family households, while 80,681 (25.4%) are nonfamily households. The most numerous type of family households are 2-person households, comprising 81,167, and the most common type of nonfamily households are 1-person households, comprising 66,723.
| Household Size | Family Households | Nonfamily Households |
| 1-Person Households | - | 66,723 (21.0%) |
| 2-Person Households | 81,167 (25.5%) | 11,154 (3.5%) |
| 3-Person Households | 58,052 (18.3%) | 1,815 (0.6%) |
| 4-Person Households | 53,958 (17.0%) | 668 (0.2%) |
| 5-Person Households | 25,897 (8.1%) | 321 (0.1%) |
| 6-Person Households | 10,879 (3.4%) | 0 (0.0%) |
| 7+ Person Households | 7,337 (2.3%) | 0 (0.0%) |
| Total | 237,290 (74.6%) | 80,681 (25.4%) |
Female Fertility in Gwinnett County
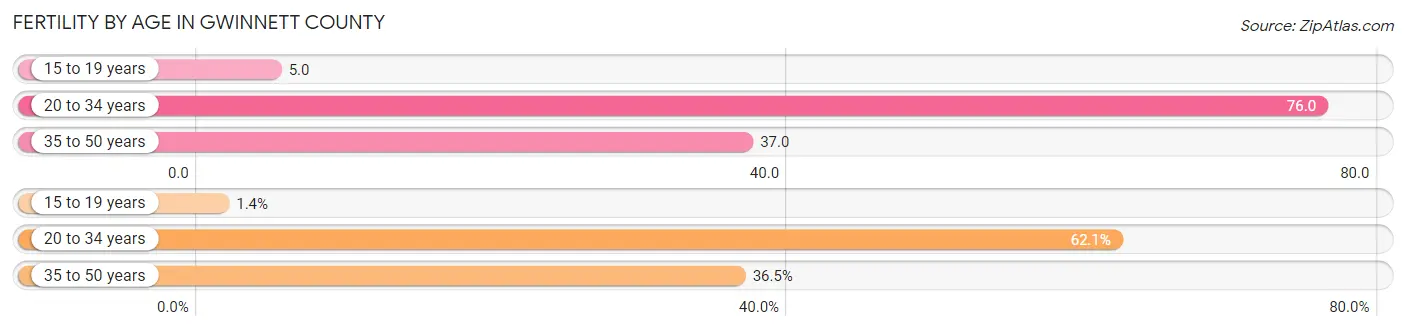
Fertility by Age in Gwinnett County
Average fertility rate in Gwinnett County is 47.0 births per 1,000 women. Women in the age bracket of 20 to 34 years have the highest fertility rate with 76.0 births per 1,000 women. Women in the age bracket of 20 to 34 years acount for 62.1% of all women with births.
| Age Bracket | Women with Births | Births / 1,000 Women |
| 15 to 19 years | 166 (1.4%) | 5.0 |
| 20 to 34 years | 7,161 (62.1%) | 76.0 |
| 35 to 50 years | 4,209 (36.5%) | 37.0 |
| Total | 11,536 (100.0%) | 47.0 |
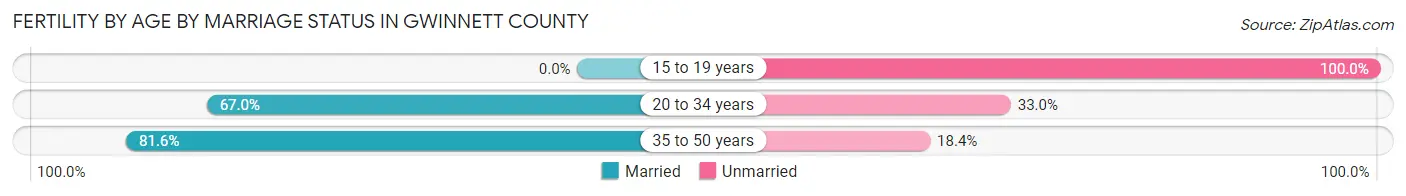
Fertility by Age by Marriage Status in Gwinnett County
71.4% of women with births (11,536) in Gwinnett County are married. The highest percentage of unmarried women with births falls into 15 to 19 years age bracket with 100.0% of them unmarried at the time of birth, while the lowest percentage of unmarried women with births belong to 35 to 50 years age bracket with 18.4% of them unmarried.
| Age Bracket | Married | Unmarried |
| 15 to 19 years | 0 (0.0%) | 166 (100.0%) |
| 20 to 34 years | 4,798 (67.0%) | 2,363 (33.0%) |
| 35 to 50 years | 3,435 (81.6%) | 774 (18.4%) |
| Total | 8,237 (71.4%) | 3,299 (28.6%) |
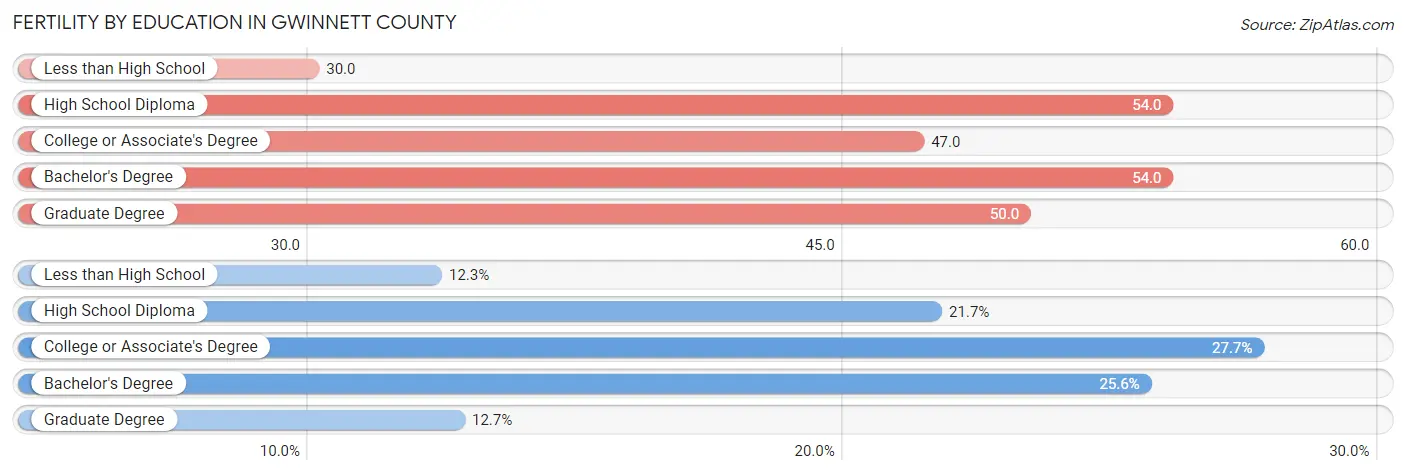
Fertility by Education in Gwinnett County
Average fertility rate in Gwinnett County is 47.0 births per 1,000 women. Women with the education attainment of high school diploma have the highest fertility rate of 54.0 births per 1,000 women, while women with the education attainment of less than high school have the lowest fertility at 30.0 births per 1,000 women. Women with the education attainment of college or associate's degree represent 27.7% of all women with births.
| Educational Attainment | Women with Births | Births / 1,000 Women |
| Less than High School | 1,419 (12.3%) | 30.0 |
| High School Diploma | 2,500 (21.7%) | 54.0 |
| College or Associate's Degree | 3,196 (27.7%) | 47.0 |
| Bachelor's Degree | 2,952 (25.6%) | 54.0 |
| Graduate Degree | 1,469 (12.7%) | 50.0 |
| Total | 11,536 (100.0%) | 47.0 |
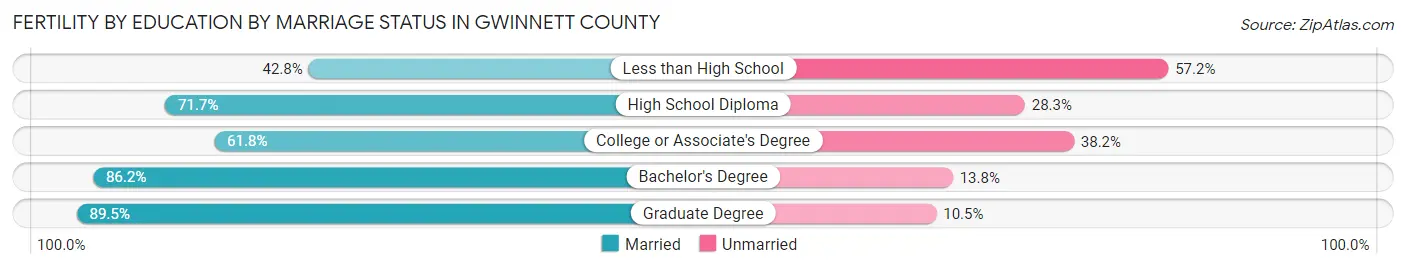
Fertility by Education by Marriage Status in Gwinnett County
28.6% of women with births in Gwinnett County are unmarried. Women with the educational attainment of graduate degree are most likely to be married with 89.5% of them married at childbirth, while women with the educational attainment of less than high school are least likely to be married with 57.2% of them unmarried at childbirth.
| Educational Attainment | Married | Unmarried |
| Less than High School | 607 (42.8%) | 812 (57.2%) |
| High School Diploma | 1,792 (71.7%) | 708 (28.3%) |
| College or Associate's Degree | 1,975 (61.8%) | 1,221 (38.2%) |
| Bachelor's Degree | 2,545 (86.2%) | 407 (13.8%) |
| Graduate Degree | 1,315 (89.5%) | 154 (10.5%) |
| Total | 8,237 (71.4%) | 3,299 (28.6%) |
Income in Gwinnett County
Income Overview in Gwinnett County
Per Capita Income in Gwinnett County is $36,778, while median incomes of families and households are $94,411 and $82,296 respectively.
| Characteristic | Number | Measure |
| Per Capita Income | 957,977 | $36,778 |
| Median Family Income | 237,290 | $94,411 |
| Mean Family Income | 237,290 | $118,606 |
| Median Household Income | 317,971 | $82,296 |
| Mean Household Income | 317,971 | $107,962 |
| Income Deficit | 237,290 | $10,647 |
| Wage / Income Gap (%) | 957,977 | 23.41% |
| Wage / Income Gap ($) | 957,977 | 76.59¢ per $1 |
| Gini / Inequality Index | 957,977 | 0.44 |
Earnings by Sex in Gwinnett County
Average Earnings in Gwinnett County are $42,414, $47,592 for men and $36,449 for women, a difference of 23.4%.
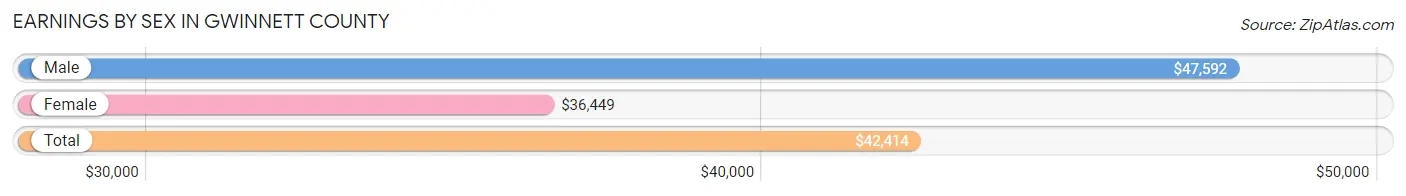
| Sex | Number | Average Earnings |
| Male | 273,171 (52.3%) | $47,592 |
| Female | 248,701 (47.7%) | $36,449 |
| Total | 521,872 (100.0%) | $42,414 |
Earnings by Sex by Income Bracket in Gwinnett County
The most common earnings brackets in Gwinnett County are $100,000+ for men (49,937 | 18.3%) and $75,000 to $99,999 for women (23,386 | 9.4%).
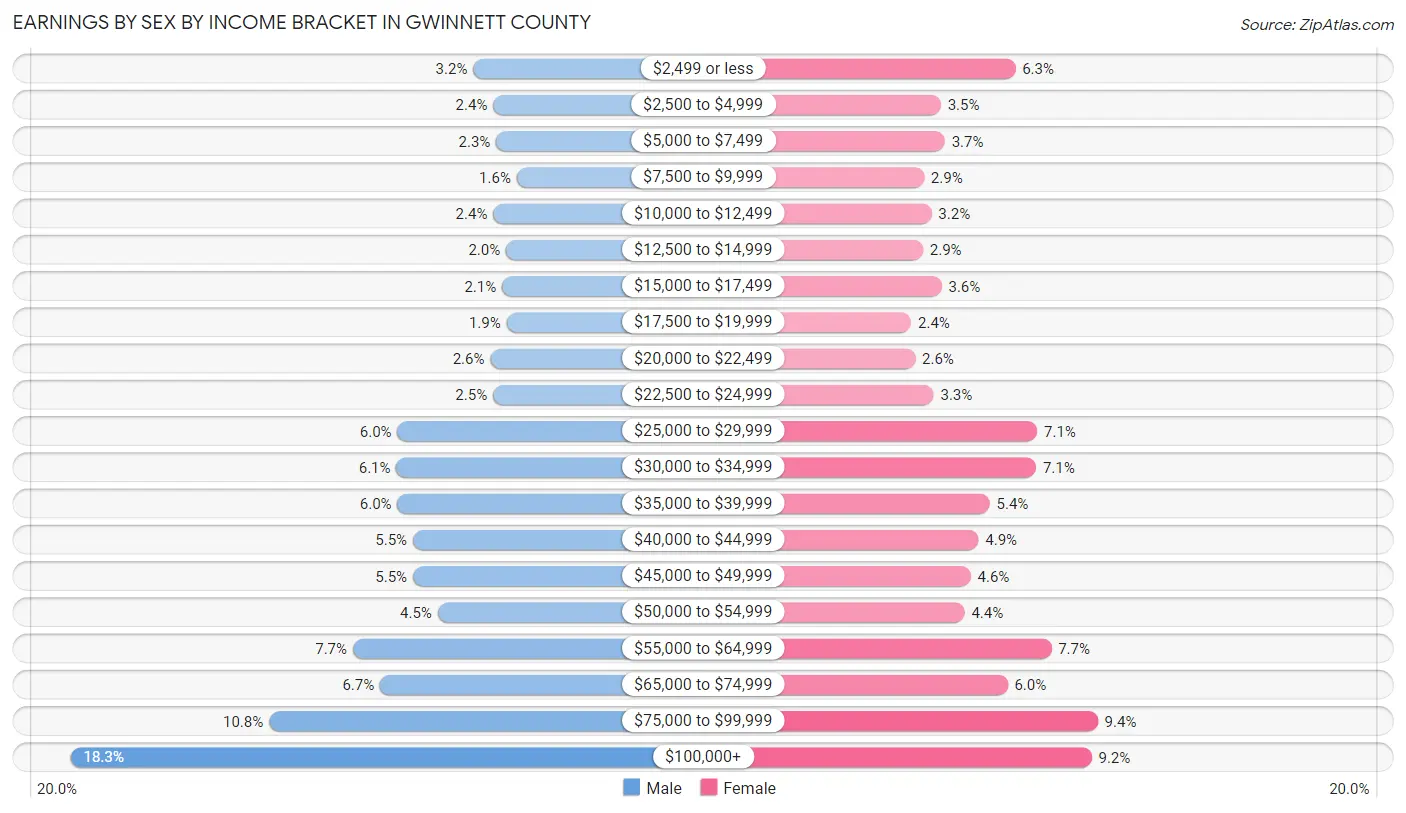
| Income | Male | Female |
| $2,499 or less | 8,702 (3.2%) | 15,688 (6.3%) |
| $2,500 to $4,999 | 6,672 (2.4%) | 8,764 (3.5%) |
| $5,000 to $7,499 | 6,365 (2.3%) | 9,118 (3.7%) |
| $7,500 to $9,999 | 4,254 (1.6%) | 7,186 (2.9%) |
| $10,000 to $12,499 | 6,677 (2.4%) | 7,882 (3.2%) |
| $12,500 to $14,999 | 5,359 (2.0%) | 7,084 (2.9%) |
| $15,000 to $17,499 | 5,754 (2.1%) | 8,836 (3.5%) |
| $17,500 to $19,999 | 5,294 (1.9%) | 5,996 (2.4%) |
| $20,000 to $22,499 | 6,960 (2.5%) | 6,379 (2.6%) |
| $22,500 to $24,999 | 6,702 (2.5%) | 8,091 (3.3%) |
| $25,000 to $29,999 | 16,463 (6.0%) | 17,739 (7.1%) |
| $30,000 to $34,999 | 16,569 (6.1%) | 17,643 (7.1%) |
| $35,000 to $39,999 | 16,462 (6.0%) | 13,312 (5.3%) |
| $40,000 to $44,999 | 14,879 (5.4%) | 12,263 (4.9%) |
| $45,000 to $49,999 | 14,879 (5.4%) | 11,533 (4.6%) |
| $50,000 to $54,999 | 12,356 (4.5%) | 10,977 (4.4%) |
| $55,000 to $64,999 | 21,026 (7.7%) | 19,040 (7.7%) |
| $65,000 to $74,999 | 18,237 (6.7%) | 14,973 (6.0%) |
| $75,000 to $99,999 | 29,624 (10.8%) | 23,386 (9.4%) |
| $100,000+ | 49,937 (18.3%) | 22,811 (9.2%) |
| Total | 273,171 (100.0%) | 248,701 (100.0%) |
Earnings by Sex by Educational Attainment in Gwinnett County
Average earnings in Gwinnett County are $54,436 for men and $42,241 for women, a difference of 22.4%. Men with an educational attainment of graduate degree enjoy the highest average annual earnings of $88,583, while those with less than high school education earn the least with $35,554. Women with an educational attainment of graduate degree earn the most with the average annual earnings of $69,112, while those with less than high school education have the smallest earnings of $25,333.
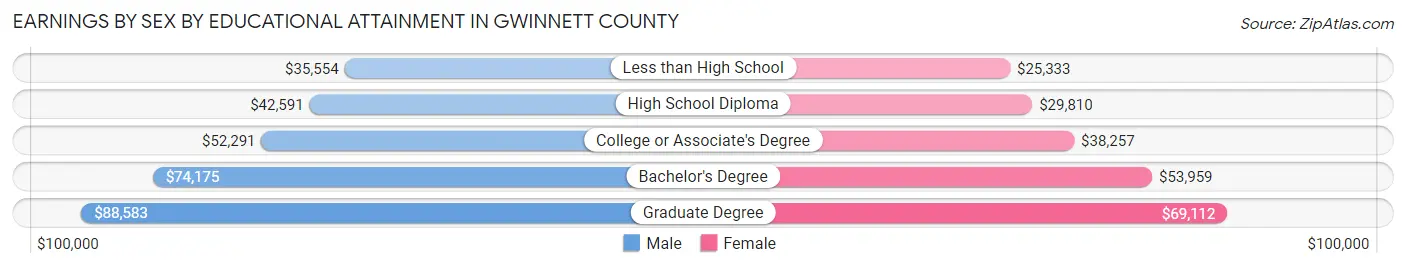
| Educational Attainment | Male Income | Female Income |
| Less than High School | $35,554 | $25,333 |
| High School Diploma | $42,591 | $29,810 |
| College or Associate's Degree | $52,291 | $38,257 |
| Bachelor's Degree | $74,175 | $53,959 |
| Graduate Degree | $88,583 | $69,112 |
| Total | $54,436 | $42,241 |
Family Income in Gwinnett County
Family Income Brackets in Gwinnett County
According to the Gwinnett County family income data, there are 51,255 families falling into the $100,000 to $149,999 income range, which is the most common income bracket and makes up 21.6% of all families. Conversely, the $10,000 to $14,999 income bracket is the least frequent group with only 3,322 families (1.4%) belonging to this category.
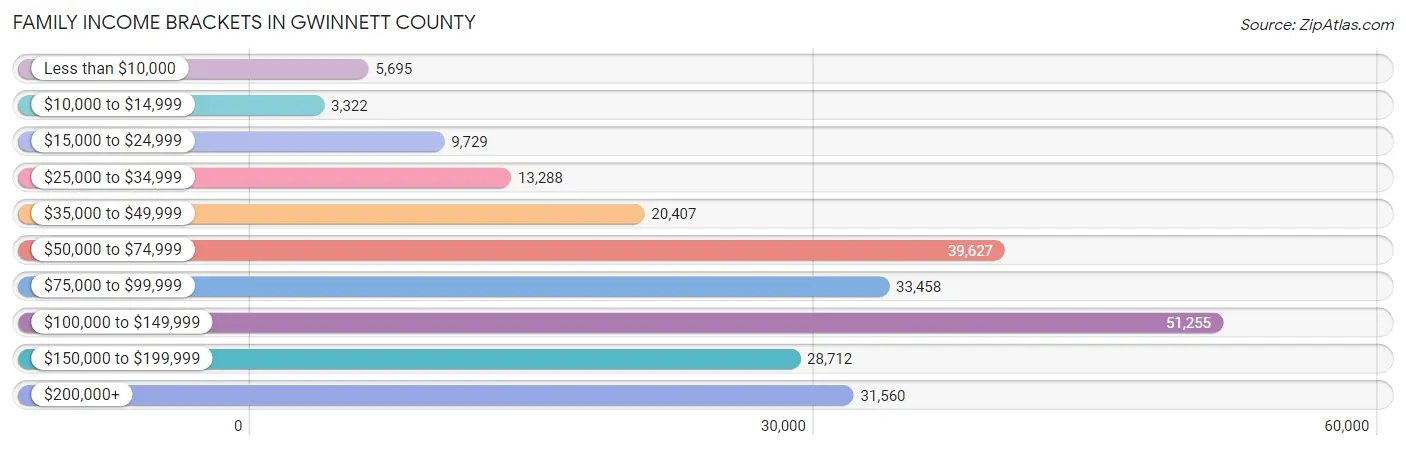
| Income Bracket | # Families | % Families |
| Less than $10,000 | 5,695 | 2.4% |
| $10,000 to $14,999 | 3,322 | 1.4% |
| $15,000 to $24,999 | 9,729 | 4.1% |
| $25,000 to $34,999 | 13,288 | 5.6% |
| $35,000 to $49,999 | 20,407 | 8.6% |
| $50,000 to $74,999 | 39,627 | 16.7% |
| $75,000 to $99,999 | 33,458 | 14.1% |
| $100,000 to $149,999 | 51,255 | 21.6% |
| $150,000 to $199,999 | 28,712 | 12.1% |
| $200,000+ | 31,560 | 13.3% |
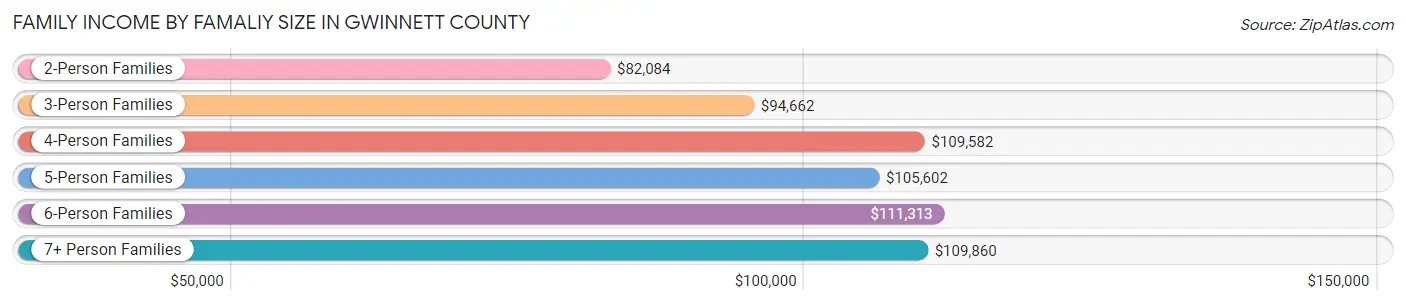
Family Income by Famaliy Size in Gwinnett County
6-person families (9,948 | 4.2%) account for the highest median family income in Gwinnett County with $111,313 per family, while 2-person families (87,385 | 36.8%) have the highest median income of $41,042 per family member.
| Income Bracket | # Families | Median Income |
| 2-Person Families | 87,385 (36.8%) | $82,084 |
| 3-Person Families | 57,327 (24.2%) | $94,662 |
| 4-Person Families | 51,971 (21.9%) | $109,582 |
| 5-Person Families | 24,351 (10.3%) | $105,602 |
| 6-Person Families | 9,948 (4.2%) | $111,313 |
| 7+ Person Families | 6,308 (2.7%) | $109,860 |
| Total | 237,290 (100.0%) | $94,411 |
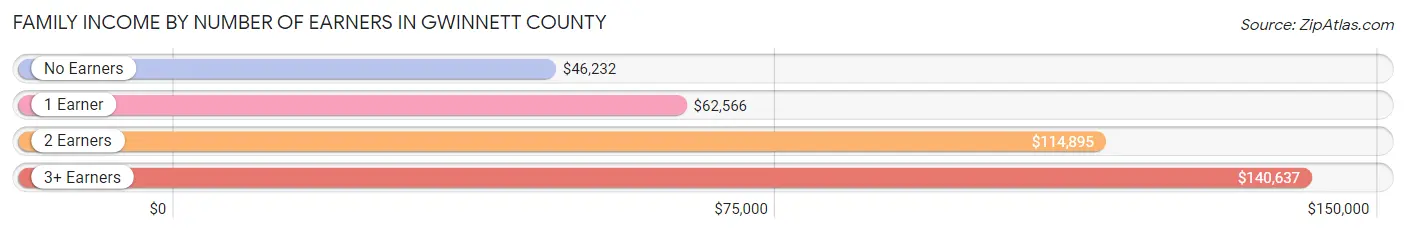
Family Income by Number of Earners in Gwinnett County
The median family income in Gwinnett County is $94,411, with families comprising 3+ earners (37,792) having the highest median family income of $140,637, while families with no earners (21,179) have the lowest median family income of $46,232, accounting for 15.9% and 8.9% of families, respectively.
| Number of Earners | # Families | Median Income |
| No Earners | 21,179 (8.9%) | $46,232 |
| 1 Earner | 71,881 (30.3%) | $62,566 |
| 2 Earners | 106,438 (44.9%) | $114,895 |
| 3+ Earners | 37,792 (15.9%) | $140,637 |
| Total | 237,290 (100.0%) | $94,411 |
Household Income in Gwinnett County
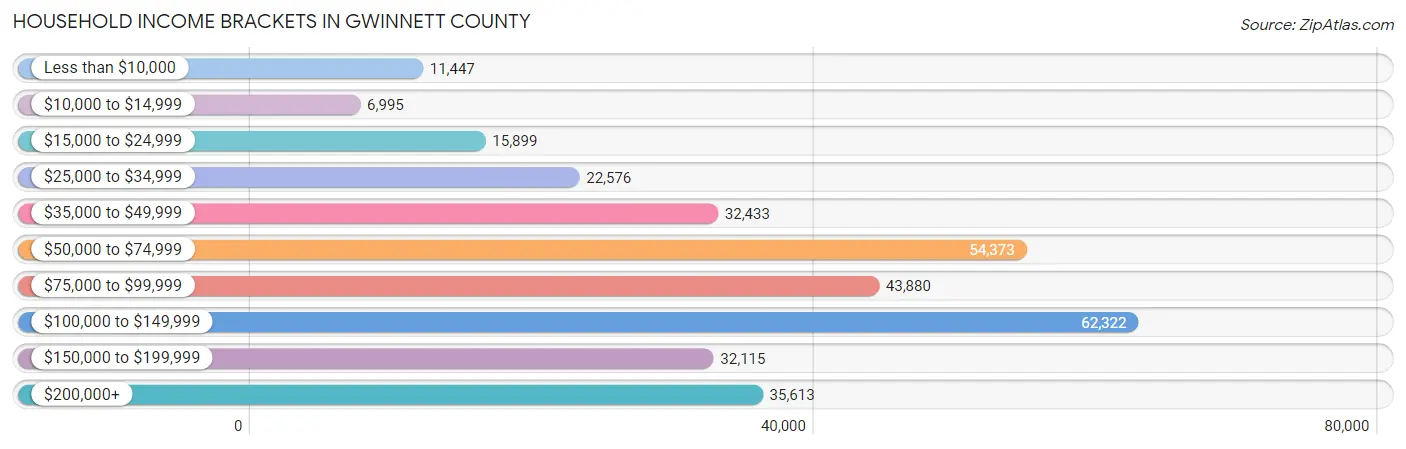
Household Income Brackets in Gwinnett County
With 62,322 households falling in the category, the $100,000 to $149,999 income range is the most frequent in Gwinnett County, accounting for 19.6% of all households. In contrast, only 6,995 households (2.2%) fall into the $10,000 to $14,999 income bracket, making it the least populous group.
| Income Bracket | # Households | % Households |
| Less than $10,000 | 11,447 | 3.6% |
| $10,000 to $14,999 | 6,995 | 2.2% |
| $15,000 to $24,999 | 15,899 | 5.0% |
| $25,000 to $34,999 | 22,576 | 7.1% |
| $35,000 to $49,999 | 32,433 | 10.2% |
| $50,000 to $74,999 | 54,373 | 17.1% |
| $75,000 to $99,999 | 43,880 | 13.8% |
| $100,000 to $149,999 | 62,322 | 19.6% |
| $150,000 to $199,999 | 32,115 | 10.1% |
| $200,000+ | 35,613 | 11.2% |
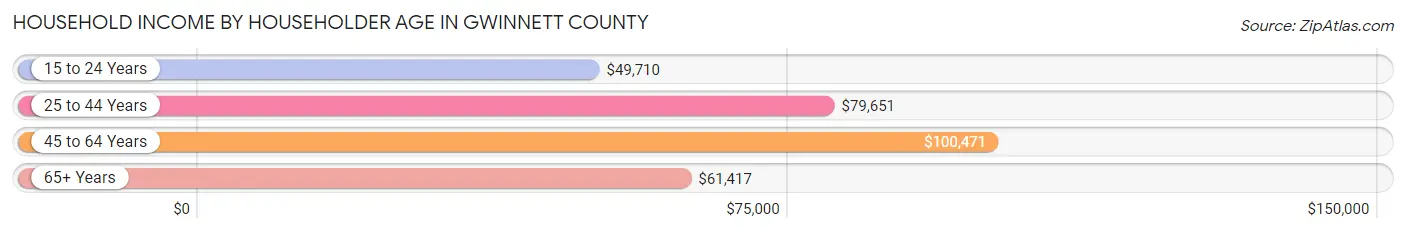
Household Income by Householder Age in Gwinnett County
The median household income in Gwinnett County is $82,296, with the highest median household income of $100,471 found in the 45 to 64 years age bracket for the primary householder. A total of 135,819 households (42.7%) fall into this category. Meanwhile, the 15 to 24 years age bracket for the primary householder has the lowest median household income of $49,710, with 10,986 households (3.5%) in this group.
| Income Bracket | # Households | Median Income |
| 15 to 24 Years | 10,986 (3.5%) | $49,710 |
| 25 to 44 Years | 117,100 (36.8%) | $79,651 |
| 45 to 64 Years | 135,819 (42.7%) | $100,471 |
| 65+ Years | 54,066 (17.0%) | $61,417 |
| Total | 317,971 (100.0%) | $82,296 |
Poverty in Gwinnett County
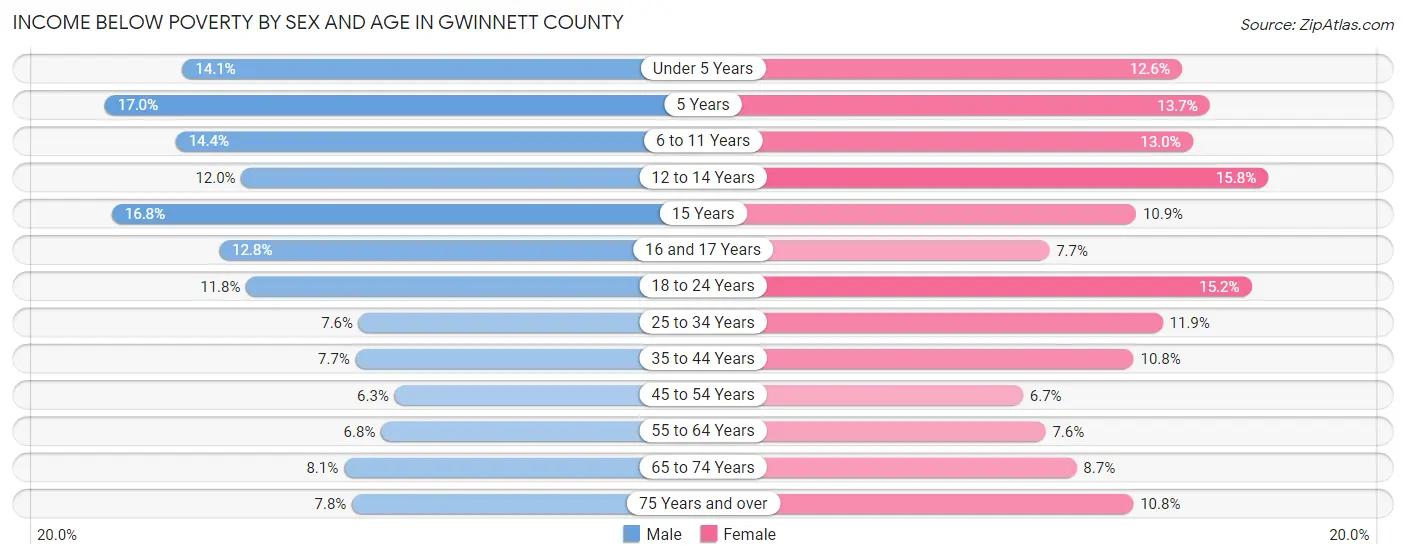
Income Below Poverty by Sex and Age in Gwinnett County
With 9.5% poverty level for males and 10.7% for females among the residents of Gwinnett County, 5 year old males and 12 to 14 year old females are the most vulnerable to poverty, with 1,271 males (17.0%) and 3,677 females (15.8%) in their respective age groups living below the poverty level.
| Age Bracket | Male | Female |
| Under 5 Years | 4,252 (14.1%) | 3,650 (12.6%) |
| 5 Years | 1,271 (17.0%) | 910 (13.7%) |
| 6 to 11 Years | 5,987 (14.4%) | 5,301 (13.0%) |
| 12 to 14 Years | 2,822 (11.9%) | 3,677 (15.8%) |
| 15 Years | 1,359 (16.8%) | 936 (10.9%) |
| 16 and 17 Years | 2,056 (12.8%) | 1,158 (7.7%) |
| 18 to 24 Years | 5,472 (11.8%) | 6,820 (15.2%) |
| 25 to 34 Years | 4,599 (7.6%) | 7,467 (11.9%) |
| 35 to 44 Years | 5,030 (7.7%) | 7,596 (10.8%) |
| 45 to 54 Years | 4,201 (6.3%) | 4,721 (6.7%) |
| 55 to 64 Years | 3,734 (6.8%) | 4,366 (7.6%) |
| 65 to 74 Years | 2,464 (8.1%) | 3,087 (8.7%) |
| 75 Years and over | 1,137 (7.8%) | 2,218 (10.8%) |
| Total | 44,384 (9.5%) | 51,907 (10.7%) |
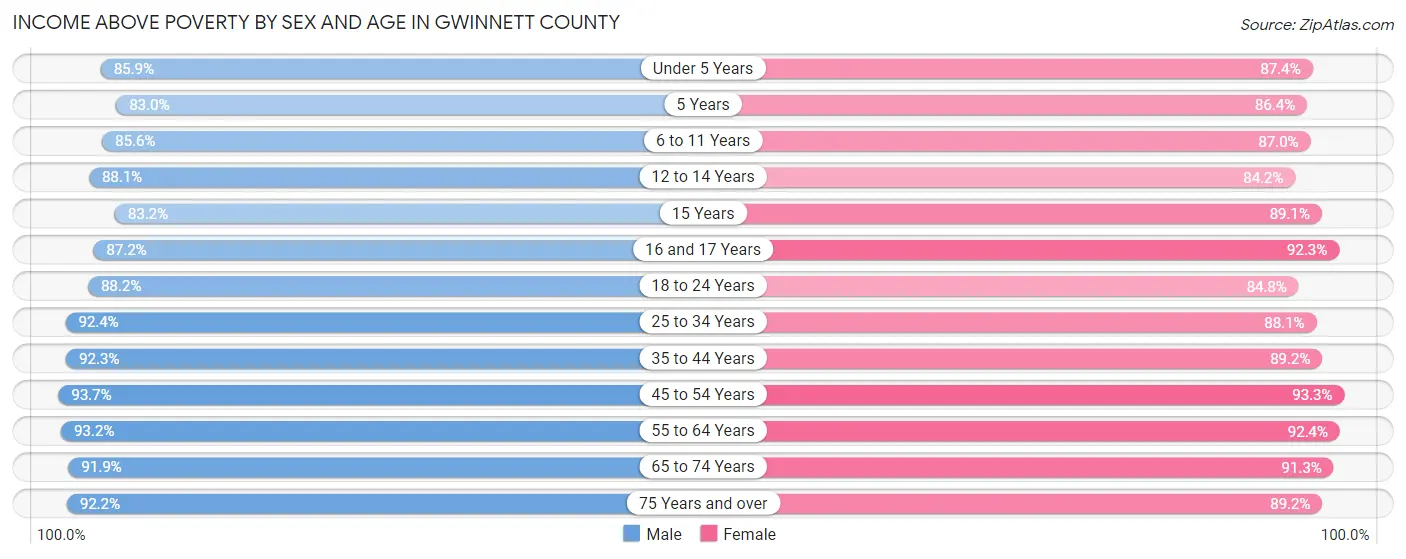
Income Above Poverty by Sex and Age in Gwinnett County
According to the poverty statistics in Gwinnett County, males aged 45 to 54 years and females aged 45 to 54 years are the age groups that are most secure financially, with 93.7% of males and 93.3% of females in these age groups living above the poverty line.
| Age Bracket | Male | Female |
| Under 5 Years | 25,812 (85.9%) | 25,277 (87.4%) |
| 5 Years | 6,198 (83.0%) | 5,755 (86.4%) |
| 6 to 11 Years | 35,630 (85.6%) | 35,403 (87.0%) |
| 12 to 14 Years | 20,785 (88.0%) | 19,564 (84.2%) |
| 15 Years | 6,748 (83.2%) | 7,637 (89.1%) |
| 16 and 17 Years | 14,034 (87.2%) | 13,880 (92.3%) |
| 18 to 24 Years | 41,009 (88.2%) | 38,042 (84.8%) |
| 25 to 34 Years | 55,963 (92.4%) | 55,254 (88.1%) |
| 35 to 44 Years | 60,223 (92.3%) | 62,550 (89.2%) |
| 45 to 54 Years | 62,929 (93.7%) | 65,517 (93.3%) |
| 55 to 64 Years | 51,503 (93.2%) | 53,360 (92.4%) |
| 65 to 74 Years | 27,804 (91.9%) | 32,360 (91.3%) |
| 75 Years and over | 13,371 (92.2%) | 18,284 (89.2%) |
| Total | 422,009 (90.5%) | 432,883 (89.3%) |
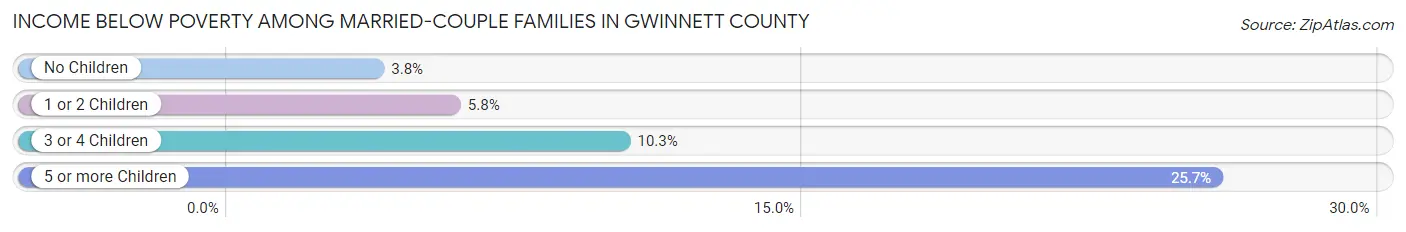
Income Below Poverty Among Married-Couple Families in Gwinnett County
The poverty statistics for married-couple families in Gwinnett County show that 5.4% or 9,514 of the total 175,781 families live below the poverty line. Families with 5 or more children have the highest poverty rate of 25.7%, comprising of 391 families. On the other hand, families with no children have the lowest poverty rate of 3.8%, which includes 3,299 families.
| Children | Above Poverty | Below Poverty |
| No Children | 83,096 (96.2%) | 3,299 (3.8%) |
| 1 or 2 Children | 67,668 (94.2%) | 4,183 (5.8%) |
| 3 or 4 Children | 14,374 (89.7%) | 1,641 (10.2%) |
| 5 or more Children | 1,129 (74.3%) | 391 (25.7%) |
| Total | 166,267 (94.6%) | 9,514 (5.4%) |
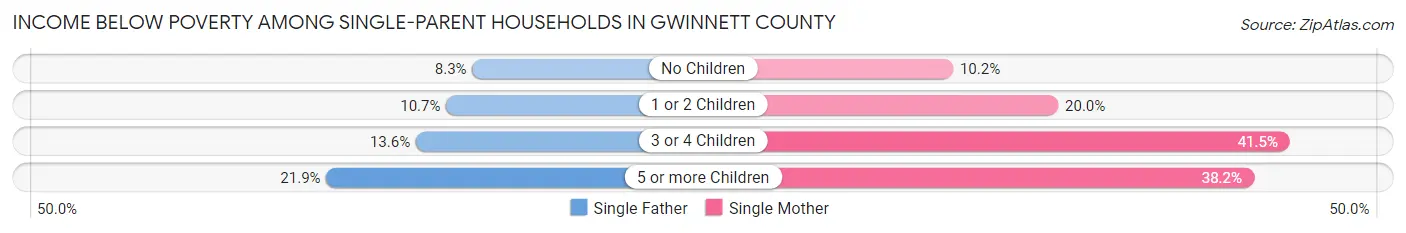
Income Below Poverty Among Single-Parent Households in Gwinnett County
According to the poverty data in Gwinnett County, 10.0% or 1,727 single-father households and 18.4% or 8,106 single-mother households are living below the poverty line. Among single-father households, those with 5 or more children have the highest poverty rate, with 51 households (21.9%) experiencing poverty. Likewise, among single-mother households, those with 3 or 4 children have the highest poverty rate, with 1,590 households (41.5%) falling below the poverty line.
| Children | Single Father | Single Mother |
| No Children | 689 (8.3%) | 1,653 (10.2%) |
| 1 or 2 Children | 789 (10.7%) | 4,753 (20.0%) |
| 3 or 4 Children | 198 (13.6%) | 1,590 (41.5%) |
| 5 or more Children | 51 (21.9%) | 110 (38.2%) |
| Total | 1,727 (10.0%) | 8,106 (18.4%) |
Income Below Poverty Among Married-Couple vs Single-Parent Households in Gwinnett County
The poverty data for Gwinnett County shows that 9,514 of the married-couple family households (5.4%) and 9,833 of the single-parent households (16.0%) are living below the poverty level. Within the married-couple family households, those with 5 or more children have the highest poverty rate, with 391 households (25.7%) falling below the poverty line. Among the single-parent households, those with 3 or 4 children have the highest poverty rate, with 1,788 household (33.8%) living below poverty.
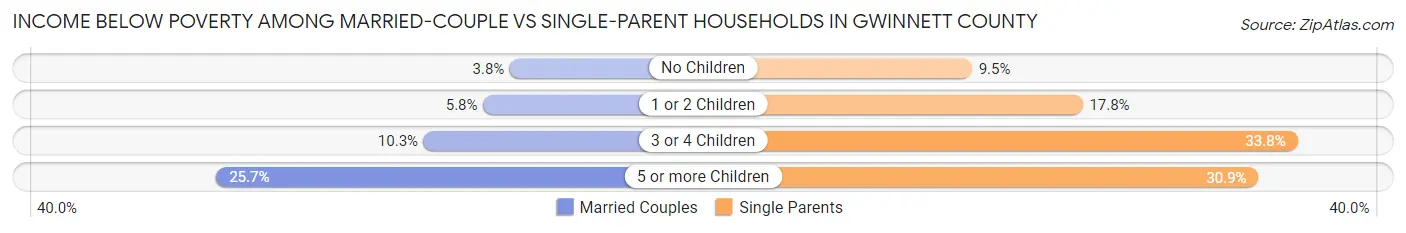
| Children | Married-Couple Families | Single-Parent Households |
| No Children | 3,299 (3.8%) | 2,342 (9.5%) |
| 1 or 2 Children | 4,183 (5.8%) | 5,542 (17.8%) |
| 3 or 4 Children | 1,641 (10.2%) | 1,788 (33.8%) |
| 5 or more Children | 391 (25.7%) | 161 (30.9%) |
| Total | 9,514 (5.4%) | 9,833 (16.0%) |
Employment Characteristics in Gwinnett County
Employment by Class of Employer in Gwinnett County
Among the 464,985 employed individuals in Gwinnett County, private company employees (335,858 | 72.2%), local government employees (29,415 | 6.3%), and not-for-profit organizations (27,993 | 6.0%) make up the most common classes of employment.
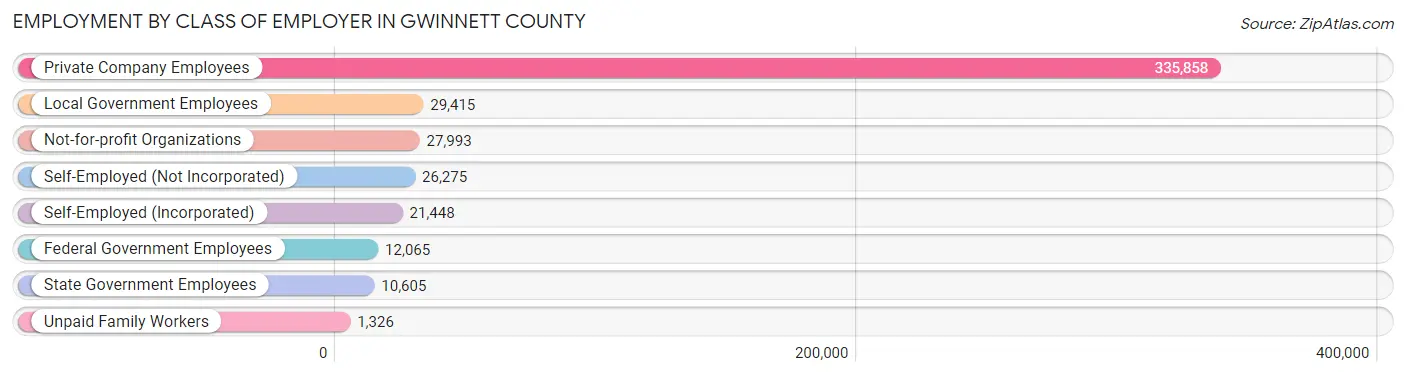
| Employer Class | # Employees | % Employees |
| Private Company Employees | 335,858 | 72.2% |
| Self-Employed (Incorporated) | 21,448 | 4.6% |
| Self-Employed (Not Incorporated) | 26,275 | 5.7% |
| Not-for-profit Organizations | 27,993 | 6.0% |
| Local Government Employees | 29,415 | 6.3% |
| State Government Employees | 10,605 | 2.3% |
| Federal Government Employees | 12,065 | 2.6% |
| Unpaid Family Workers | 1,326 | 0.3% |
| Total | 464,985 | 100.0% |
Employment Status by Age in Gwinnett County
According to the labor force statistics for Gwinnett County, out of the total population over 16 years of age (736,740), 68.4% or 503,930 individuals are in the labor force, with 4.1% or 20,661 of them unemployed. The age group with the highest labor force participation rate is 45 to 54 years, with 85.6% or 118,016 individuals in the labor force. Within the labor force, the 16 to 19 years age range has the highest percentage of unemployed individuals, with 8.9% or 1,724 of them being unemployed.
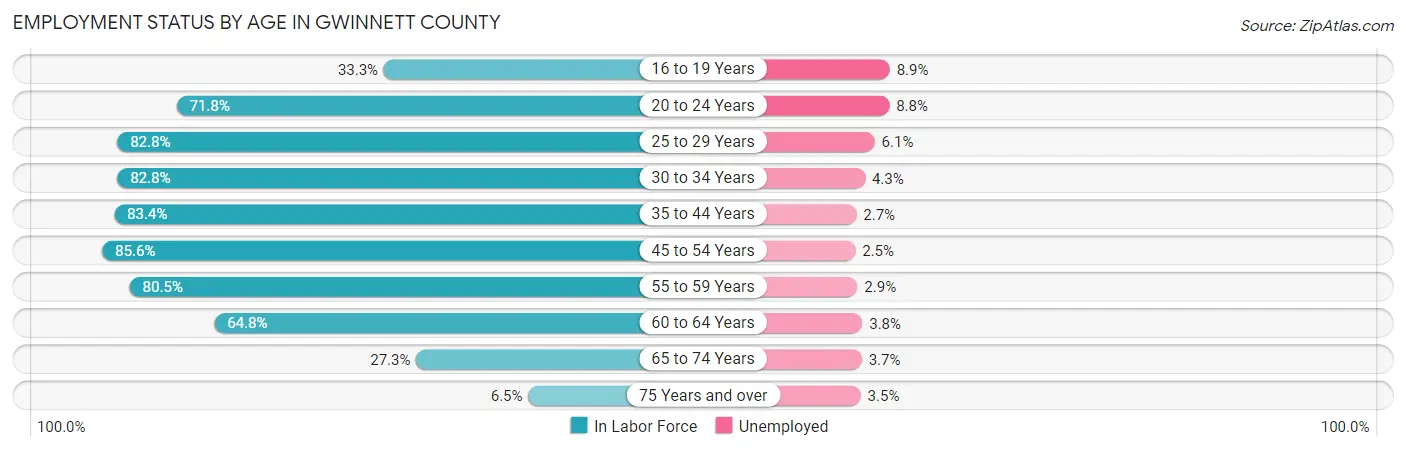
| Age Bracket | In Labor Force | Unemployed |
| 16 to 19 Years | 19,371 (33.3%) | 1,724 (8.9%) |
| 20 to 24 Years | 46,578 (71.8%) | 4,099 (8.8%) |
| 25 to 29 Years | 51,293 (82.8%) | 3,129 (6.1%) |
| 30 to 34 Years | 51,573 (82.8%) | 2,218 (4.3%) |
| 35 to 44 Years | 113,693 (83.4%) | 3,070 (2.7%) |
| 45 to 54 Years | 118,016 (85.6%) | 2,950 (2.5%) |
| 55 to 59 Years | 50,189 (80.5%) | 1,455 (2.9%) |
| 60 to 64 Years | 33,056 (64.8%) | 1,256 (3.8%) |
| 65 to 74 Years | 18,050 (27.3%) | 668 (3.7%) |
| 75 Years and over | 2,327 (6.5%) | 81 (3.5%) |
| Total | 503,930 (68.4%) | 20,661 (4.1%) |
Employment Status by Educational Attainment in Gwinnett County
According to labor force statistics for Gwinnett County, 81.6% of individuals (417,616) out of the total population between 25 and 64 years of age (511,784) are in the labor force, with 3.4% or 14,199 of them being unemployed. The group with the highest labor force participation rate are those with the educational attainment of bachelor's degree or higher, with 88.3% or 181,330 individuals in the labor force. Within the labor force, individuals with college / associate degree education have the highest percentage of unemployment, with 3.9% or 4,381 of them being unemployed.
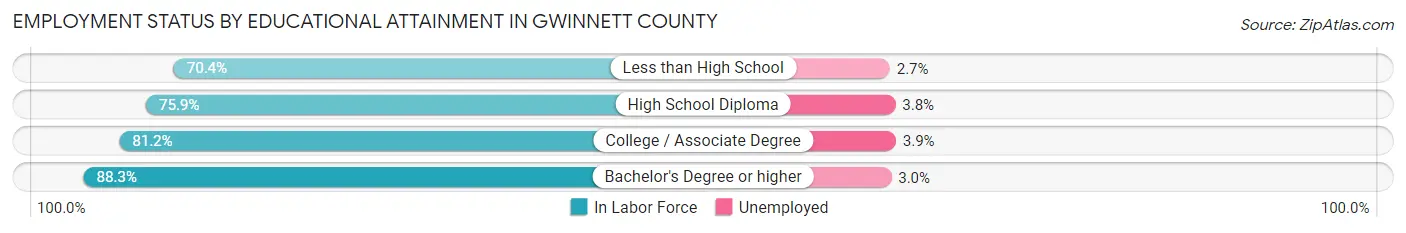
| Educational Attainment | In Labor Force | Unemployed |
| Less than High School | 42,220 (70.4%) | 1,619 (2.7%) |
| High School Diploma | 82,052 (75.9%) | 4,108 (3.8%) |
| College / Associate Degree | 112,341 (81.2%) | 5,396 (3.9%) |
| Bachelor's Degree or higher | 181,330 (88.3%) | 6,161 (3.0%) |
| Total | 417,616 (81.6%) | 17,401 (3.4%) |
Employment Occupations by Sex in Gwinnett County
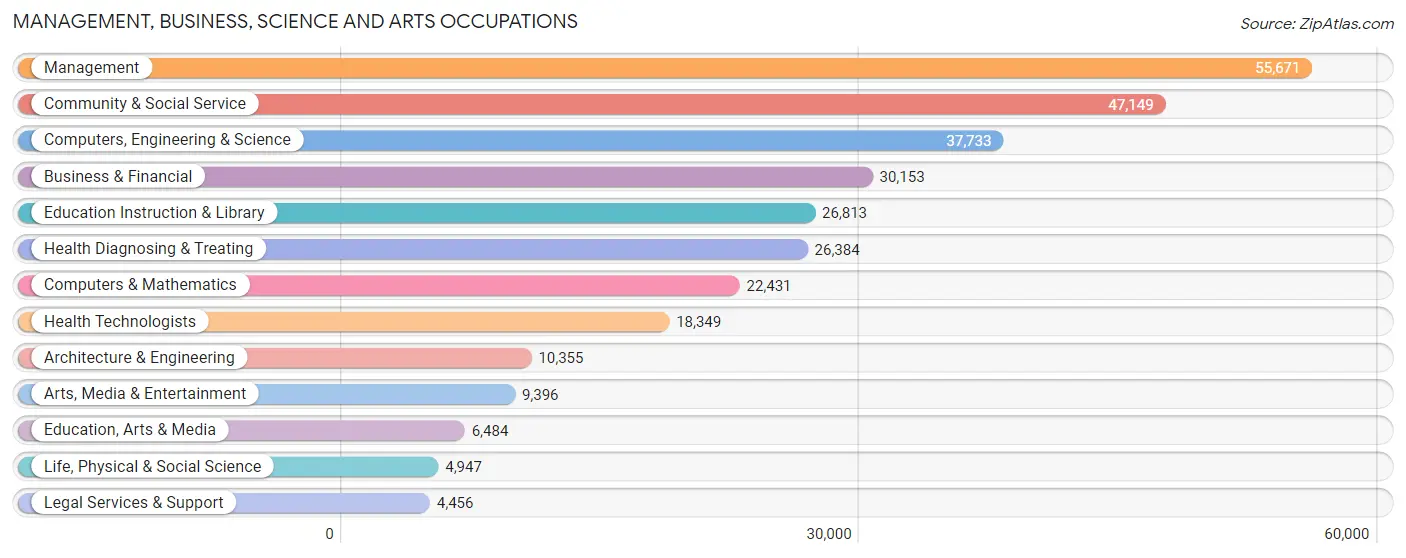
Management, Business, Science and Arts Occupations
The most common Management, Business, Science and Arts occupations in Gwinnett County are Management (55,671 | 11.5%), Community & Social Service (47,149 | 9.8%), Computers, Engineering & Science (37,733 | 7.8%), Business & Financial (30,153 | 6.2%), and Education Instruction & Library (26,813 | 5.6%).
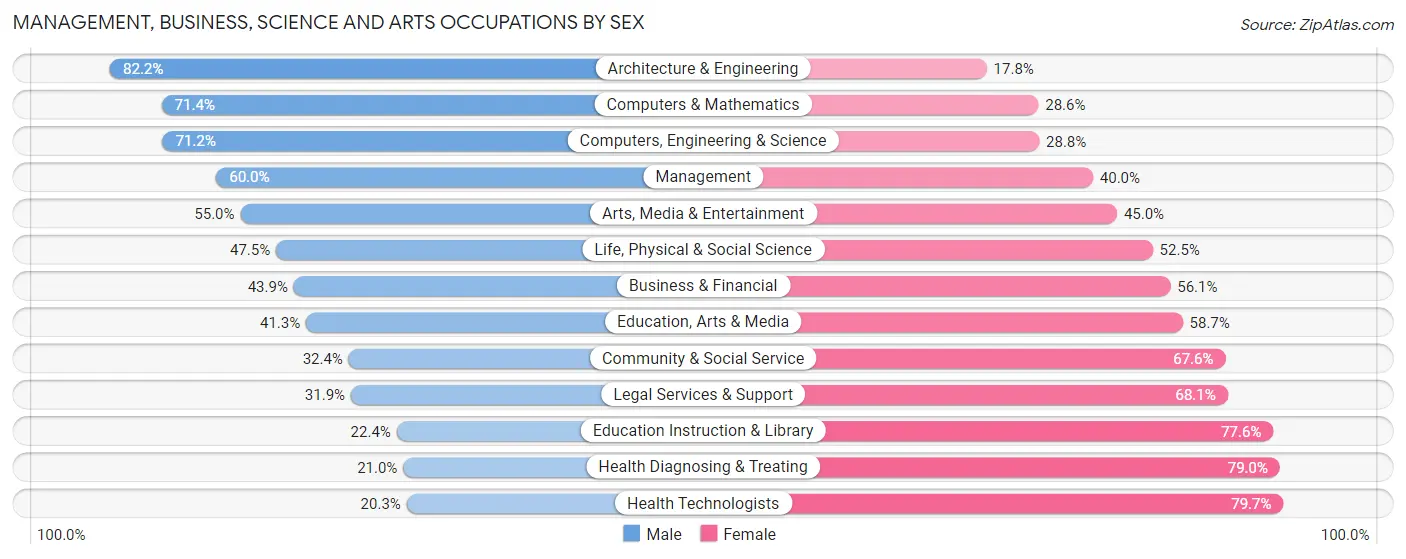
Management, Business, Science and Arts Occupations by Sex
Within the Management, Business, Science and Arts occupations in Gwinnett County, the most male-oriented occupations are Architecture & Engineering (82.2%), Computers & Mathematics (71.4%), and Computers, Engineering & Science (71.2%), while the most female-oriented occupations are Health Technologists (79.7%), Health Diagnosing & Treating (79.0%), and Education Instruction & Library (77.6%).
| Occupation | Male | Female |
| Management | 33,408 (60.0%) | 22,263 (40.0%) |
| Business & Financial | 13,224 (43.9%) | 16,929 (56.1%) |
| Computers, Engineering & Science | 26,877 (71.2%) | 10,856 (28.8%) |
| Computers & Mathematics | 16,016 (71.4%) | 6,415 (28.6%) |
| Architecture & Engineering | 8,509 (82.2%) | 1,846 (17.8%) |
| Life, Physical & Social Science | 2,352 (47.5%) | 2,595 (52.5%) |
| Community & Social Service | 15,271 (32.4%) | 31,878 (67.6%) |
| Education, Arts & Media | 2,677 (41.3%) | 3,807 (58.7%) |
| Legal Services & Support | 1,423 (31.9%) | 3,033 (68.1%) |
| Education Instruction & Library | 6,004 (22.4%) | 20,809 (77.6%) |
| Arts, Media & Entertainment | 5,167 (55.0%) | 4,229 (45.0%) |
| Health Diagnosing & Treating | 5,547 (21.0%) | 20,837 (79.0%) |
| Health Technologists | 3,725 (20.3%) | 14,624 (79.7%) |
| Total (Category) | 94,327 (47.9%) | 102,763 (52.1%) |
| Total (Overall) | 255,873 (53.0%) | 227,155 (47.0%) |
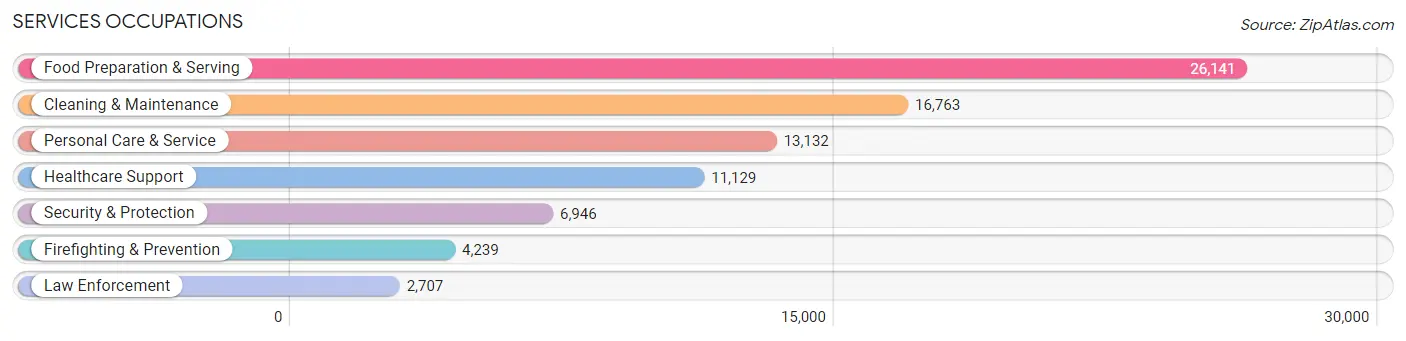
Services Occupations
The most common Services occupations in Gwinnett County are Food Preparation & Serving (26,141 | 5.4%), Cleaning & Maintenance (16,763 | 3.5%), Personal Care & Service (13,132 | 2.7%), Healthcare Support (11,129 | 2.3%), and Security & Protection (6,946 | 1.4%).
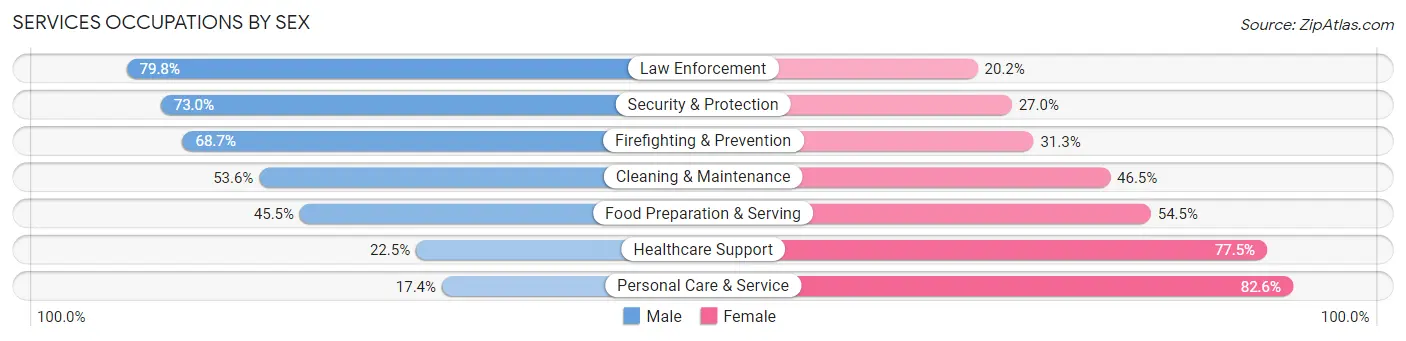
Services Occupations by Sex
Within the Services occupations in Gwinnett County, the most male-oriented occupations are Law Enforcement (79.8%), Security & Protection (73.0%), and Firefighting & Prevention (68.7%), while the most female-oriented occupations are Personal Care & Service (82.6%), Healthcare Support (77.5%), and Food Preparation & Serving (54.5%).
| Occupation | Male | Female |
| Healthcare Support | 2,504 (22.5%) | 8,625 (77.5%) |
| Security & Protection | 5,073 (73.0%) | 1,873 (27.0%) |
| Firefighting & Prevention | 2,913 (68.7%) | 1,326 (31.3%) |
| Law Enforcement | 2,160 (79.8%) | 547 (20.2%) |
| Food Preparation & Serving | 11,892 (45.5%) | 14,249 (54.5%) |
| Cleaning & Maintenance | 8,976 (53.5%) | 7,787 (46.5%) |
| Personal Care & Service | 2,282 (17.4%) | 10,850 (82.6%) |
| Total (Category) | 30,727 (41.5%) | 43,384 (58.5%) |
| Total (Overall) | 255,873 (53.0%) | 227,155 (47.0%) |
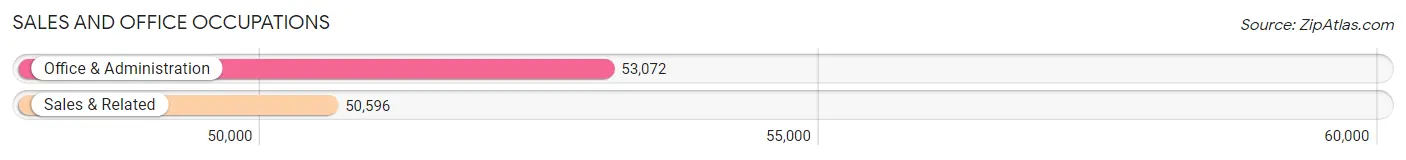
Sales and Office Occupations
The most common Sales and Office occupations in Gwinnett County are Office & Administration (53,072 | 11.0%), and Sales & Related (50,596 | 10.5%).
Sales and Office Occupations by Sex
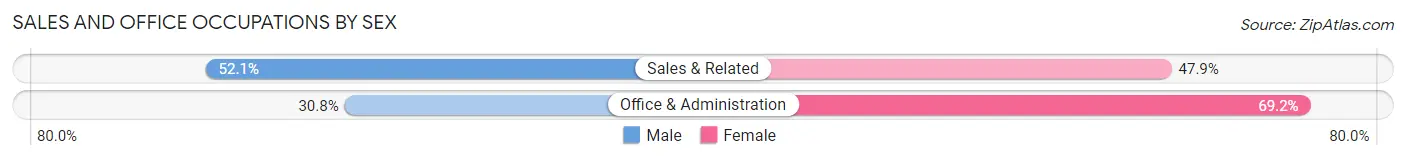
| Occupation | Male | Female |
| Sales & Related | 26,380 (52.1%) | 24,216 (47.9%) |
| Office & Administration | 16,340 (30.8%) | 36,732 (69.2%) |
| Total (Category) | 42,720 (41.2%) | 60,948 (58.8%) |
| Total (Overall) | 255,873 (53.0%) | 227,155 (47.0%) |
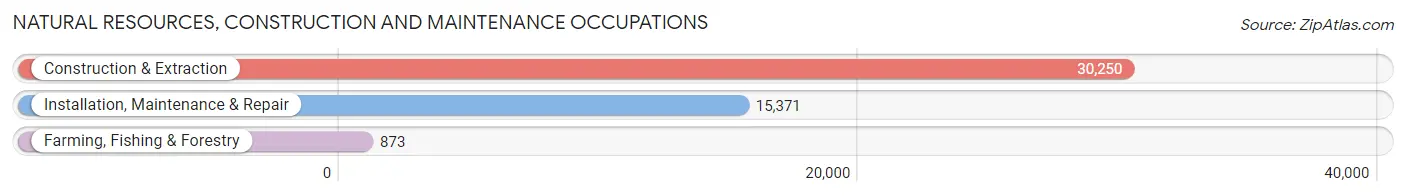
Natural Resources, Construction and Maintenance Occupations
The most common Natural Resources, Construction and Maintenance occupations in Gwinnett County are Construction & Extraction (30,250 | 6.3%), Installation, Maintenance & Repair (15,371 | 3.2%), and Farming, Fishing & Forestry (873 | 0.2%).
Natural Resources, Construction and Maintenance Occupations by Sex
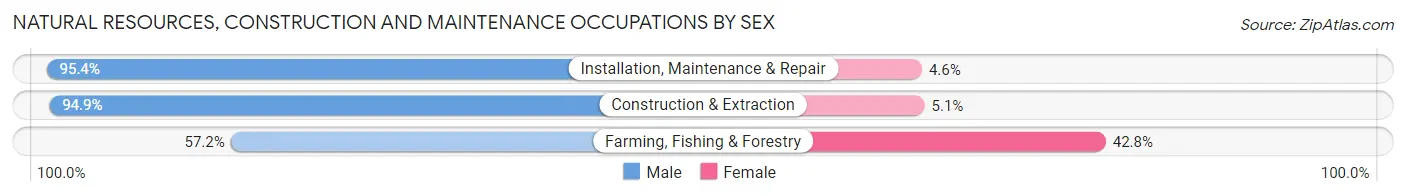
| Occupation | Male | Female |
| Farming, Fishing & Forestry | 499 (57.2%) | 374 (42.8%) |
| Construction & Extraction | 28,698 (94.9%) | 1,552 (5.1%) |
| Installation, Maintenance & Repair | 14,667 (95.4%) | 704 (4.6%) |
| Total (Category) | 43,864 (94.3%) | 2,630 (5.7%) |
| Total (Overall) | 255,873 (53.0%) | 227,155 (47.0%) |
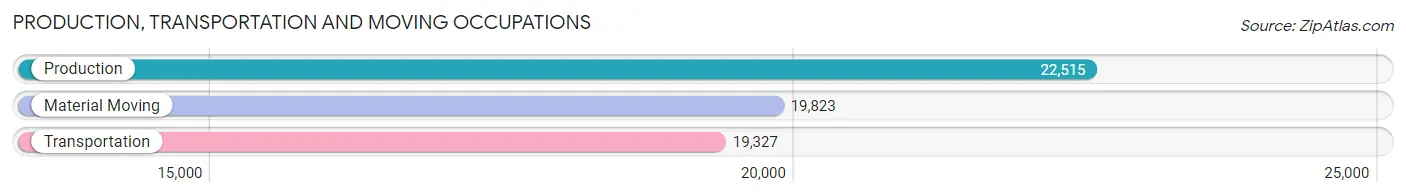
Production, Transportation and Moving Occupations
The most common Production, Transportation and Moving occupations in Gwinnett County are Production (22,515 | 4.7%), Material Moving (19,823 | 4.1%), and Transportation (19,327 | 4.0%).
Production, Transportation and Moving Occupations by Sex
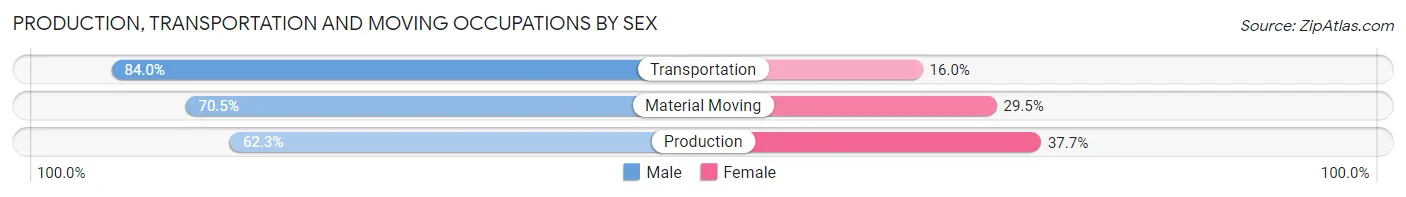
| Occupation | Male | Female |
| Production | 14,028 (62.3%) | 8,487 (37.7%) |
| Transportation | 16,239 (84.0%) | 3,088 (16.0%) |
| Material Moving | 13,968 (70.5%) | 5,855 (29.5%) |
| Total (Category) | 44,235 (71.7%) | 17,430 (28.3%) |
| Total (Overall) | 255,873 (53.0%) | 227,155 (47.0%) |
Employment Industries by Sex in Gwinnett County
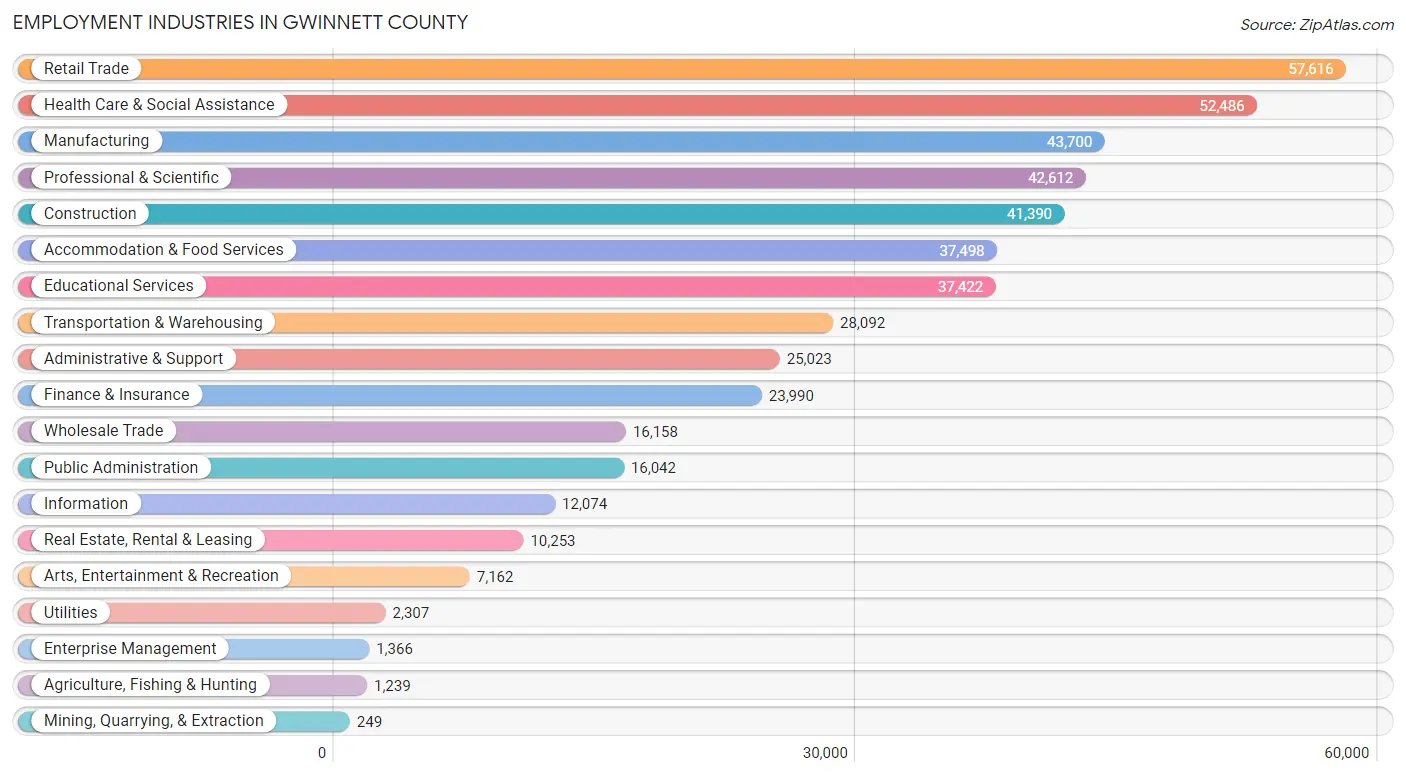
Employment Industries in Gwinnett County
The major employment industries in Gwinnett County include Retail Trade (57,616 | 11.9%), Health Care & Social Assistance (52,486 | 10.9%), Manufacturing (43,700 | 9.0%), Professional & Scientific (42,612 | 8.8%), and Construction (41,390 | 8.6%).
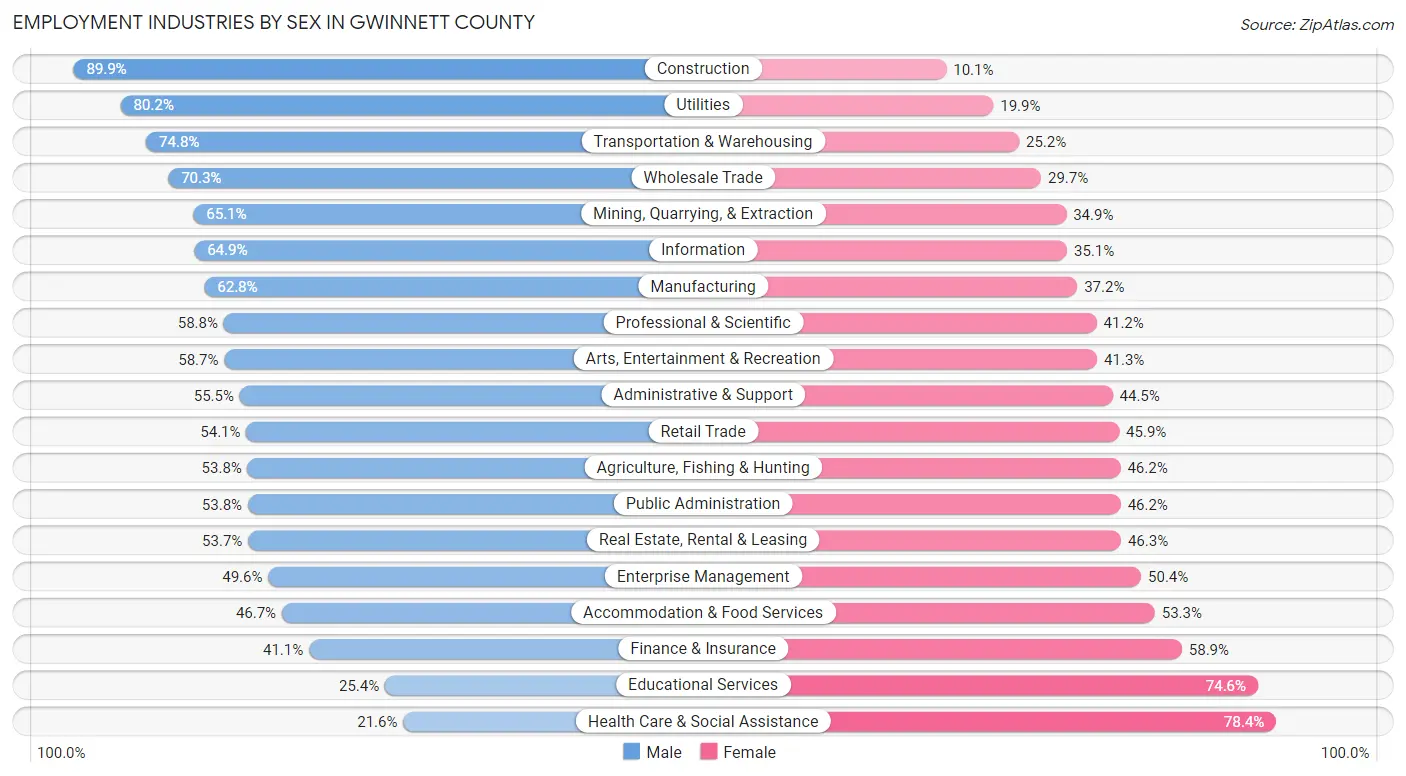
Employment Industries by Sex in Gwinnett County
The Gwinnett County industries that see more men than women are Construction (89.9%), Utilities (80.1%), and Transportation & Warehousing (74.8%), whereas the industries that tend to have a higher number of women are Health Care & Social Assistance (78.4%), Educational Services (74.6%), and Finance & Insurance (58.9%).
| Industry | Male | Female |
| Agriculture, Fishing & Hunting | 667 (53.8%) | 572 (46.2%) |
| Mining, Quarrying, & Extraction | 162 (65.1%) | 87 (34.9%) |
| Construction | 37,202 (89.9%) | 4,188 (10.1%) |
| Manufacturing | 27,434 (62.8%) | 16,266 (37.2%) |
| Wholesale Trade | 11,355 (70.3%) | 4,803 (29.7%) |
| Retail Trade | 31,168 (54.1%) | 26,448 (45.9%) |
| Transportation & Warehousing | 21,021 (74.8%) | 7,071 (25.2%) |
| Utilities | 1,849 (80.1%) | 458 (19.9%) |
| Information | 7,834 (64.9%) | 4,240 (35.1%) |
| Finance & Insurance | 9,866 (41.1%) | 14,124 (58.9%) |
| Real Estate, Rental & Leasing | 5,509 (53.7%) | 4,744 (46.3%) |
| Professional & Scientific | 25,043 (58.8%) | 17,569 (41.2%) |
| Enterprise Management | 677 (49.6%) | 689 (50.4%) |
| Administrative & Support | 13,877 (55.5%) | 11,146 (44.5%) |
| Educational Services | 9,504 (25.4%) | 27,918 (74.6%) |
| Health Care & Social Assistance | 11,343 (21.6%) | 41,143 (78.4%) |
| Arts, Entertainment & Recreation | 4,201 (58.7%) | 2,961 (41.3%) |
| Accommodation & Food Services | 17,523 (46.7%) | 19,975 (53.3%) |
| Public Administration | 8,628 (53.8%) | 7,414 (46.2%) |
| Total | 255,873 (53.0%) | 227,155 (47.0%) |
Education in Gwinnett County
School Enrollment in Gwinnett County
The most common levels of schooling among the 273,370 students in Gwinnett County are high school (65,565 | 24.0%), middle school (59,881 | 21.9%), and elementary school (52,545 | 19.2%).
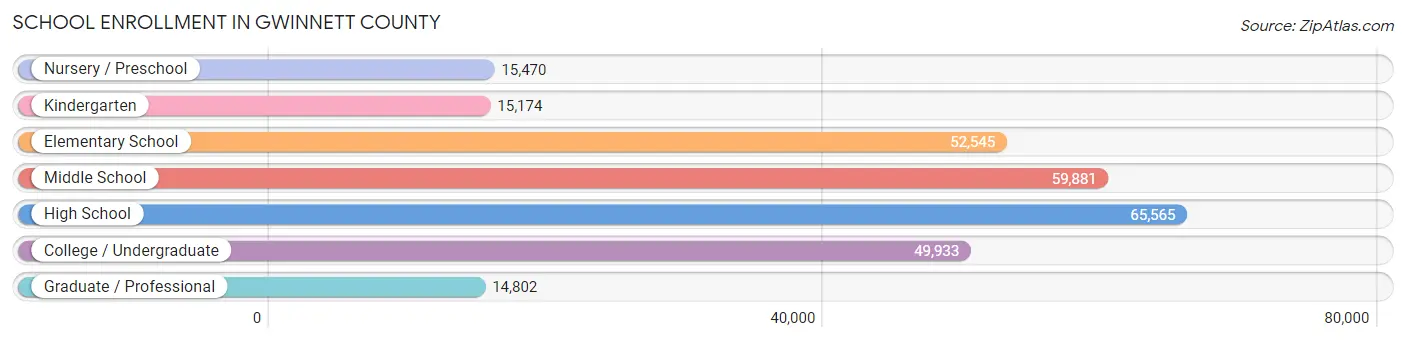
| School Level | # Students | % Students |
| Nursery / Preschool | 15,470 | 5.7% |
| Kindergarten | 15,174 | 5.6% |
| Elementary School | 52,545 | 19.2% |
| Middle School | 59,881 | 21.9% |
| High School | 65,565 | 24.0% |
| College / Undergraduate | 49,933 | 18.3% |
| Graduate / Professional | 14,802 | 5.4% |
| Total | 273,370 | 100.0% |
School Enrollment by Age by Funding Source in Gwinnett County
Out of a total of 273,370 students who are enrolled in schools in Gwinnett County, 36,632 (13.4%) attend a private institution, while the remaining 236,738 (86.6%) are enrolled in public schools. The age group of 35 years and over has the highest likelihood of being enrolled in private schools, with 5,953 (39.8% in the age bracket) enrolled. Conversely, the age group of 15 to 17 year olds has the lowest likelihood of being enrolled in a private school, with 42,830 (92.6% in the age bracket) attending a public institution.
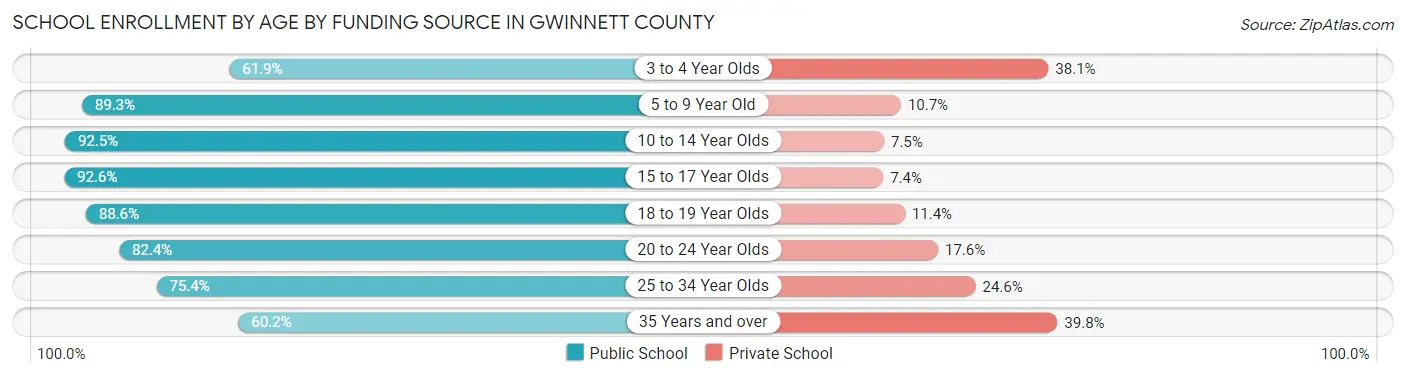
| Age Bracket | Public School | Private School |
| 3 to 4 Year Olds | 7,301 (61.9%) | 4,502 (38.1%) |
| 5 to 9 Year Old | 58,278 (89.3%) | 6,958 (10.7%) |
| 10 to 14 Year Olds | 69,932 (92.5%) | 5,688 (7.5%) |
| 15 to 17 Year Olds | 42,830 (92.6%) | 3,410 (7.4%) |
| 18 to 19 Year Olds | 17,760 (88.6%) | 2,288 (11.4%) |
| 20 to 24 Year Olds | 21,502 (82.4%) | 4,585 (17.6%) |
| 25 to 34 Year Olds | 10,095 (75.4%) | 3,286 (24.6%) |
| 35 Years and over | 9,002 (60.2%) | 5,953 (39.8%) |
| Total | 236,738 (86.6%) | 36,632 (13.4%) |
Educational Attainment by Field of Study in Gwinnett County
Business (64,577 | 25.6%), science & technology (25,893 | 10.3%), education (25,029 | 9.9%), engineering (22,270 | 8.8%), and computers & mathematics (19,704 | 7.8%) are the most common fields of study among 252,212 individuals in Gwinnett County who have obtained a bachelor's degree or higher.
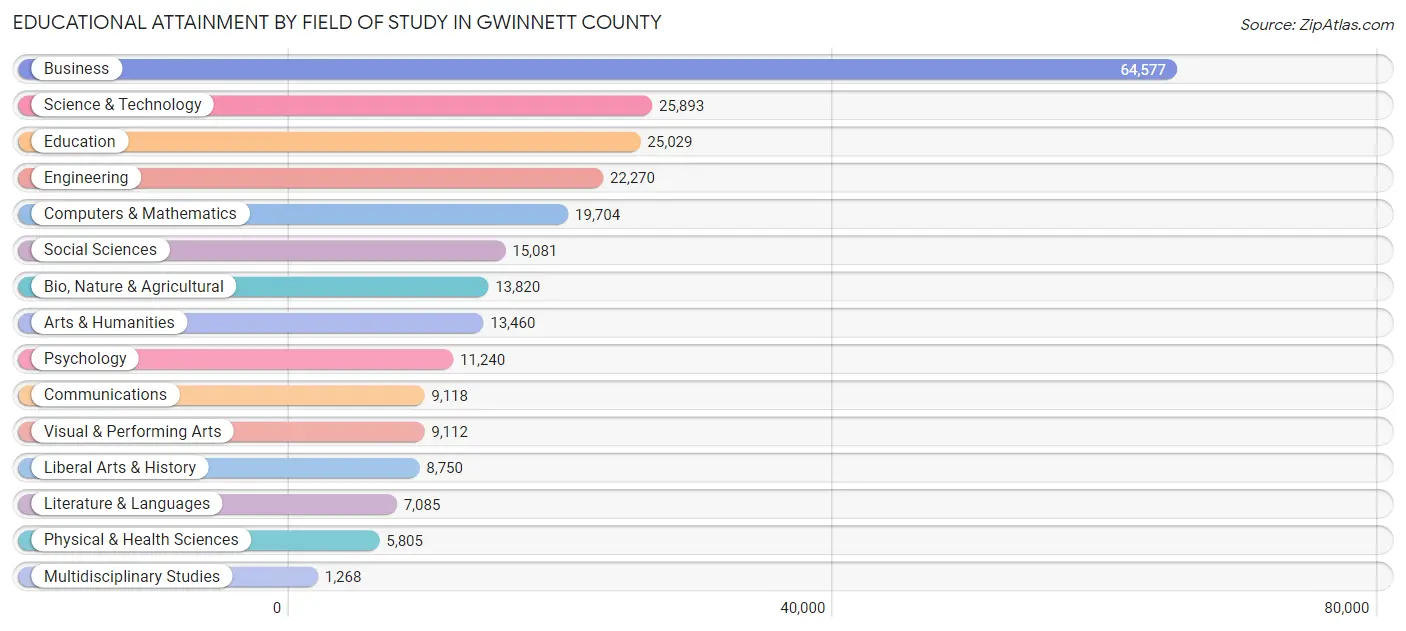
| Field of Study | # Graduates | % Graduates |
| Computers & Mathematics | 19,704 | 7.8% |
| Bio, Nature & Agricultural | 13,820 | 5.5% |
| Physical & Health Sciences | 5,805 | 2.3% |
| Psychology | 11,240 | 4.5% |
| Social Sciences | 15,081 | 6.0% |
| Engineering | 22,270 | 8.8% |
| Multidisciplinary Studies | 1,268 | 0.5% |
| Science & Technology | 25,893 | 10.3% |
| Business | 64,577 | 25.6% |
| Education | 25,029 | 9.9% |
| Literature & Languages | 7,085 | 2.8% |
| Liberal Arts & History | 8,750 | 3.5% |
| Visual & Performing Arts | 9,112 | 3.6% |
| Communications | 9,118 | 3.6% |
| Arts & Humanities | 13,460 | 5.3% |
| Total | 252,212 | 100.0% |
Transportation & Commute in Gwinnett County
Vehicle Availability by Sex in Gwinnett County
The most prevalent vehicle ownership categories in Gwinnett County are males with 2 vehicles (102,896, accounting for 41.7%) and females with 2 vehicles (88,232, making up 47.2%).
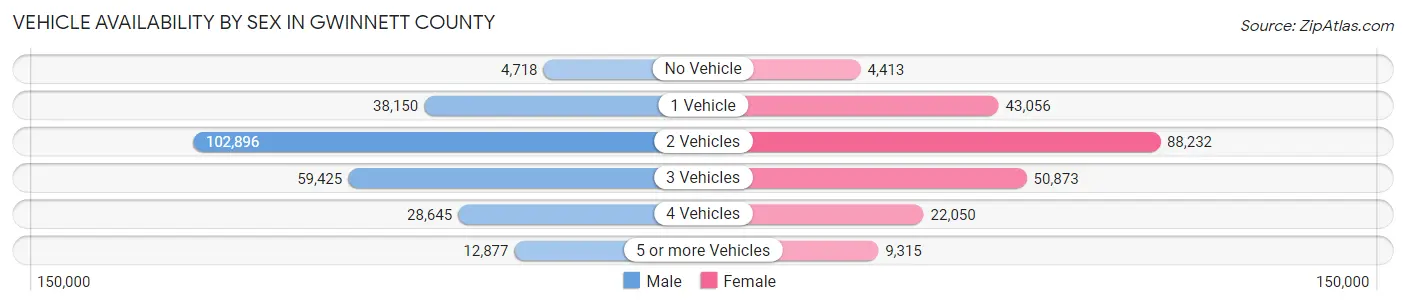
| Vehicles Available | Male | Female |
| No Vehicle | 4,718 (1.9%) | 4,413 (2.0%) |
| 1 Vehicle | 38,150 (15.5%) | 43,056 (19.8%) |
| 2 Vehicles | 102,896 (41.7%) | 88,232 (40.5%) |
| 3 Vehicles | 59,425 (24.1%) | 50,873 (23.3%) |
| 4 Vehicles | 28,645 (11.6%) | 22,050 (10.1%) |
| 5 or more Vehicles | 12,877 (5.2%) | 9,315 (4.3%) |
| Total | 246,711 (100.0%) | 217,939 (100.0%) |
Commute Time in Gwinnett County
The most frequently occuring commute durations in Gwinnett County are 30 to 34 minutes (63,119 commuters, 15.8%), 45 to 59 minutes (55,754 commuters, 14.0%), and 15 to 19 minutes (47,342 commuters, 11.8%).
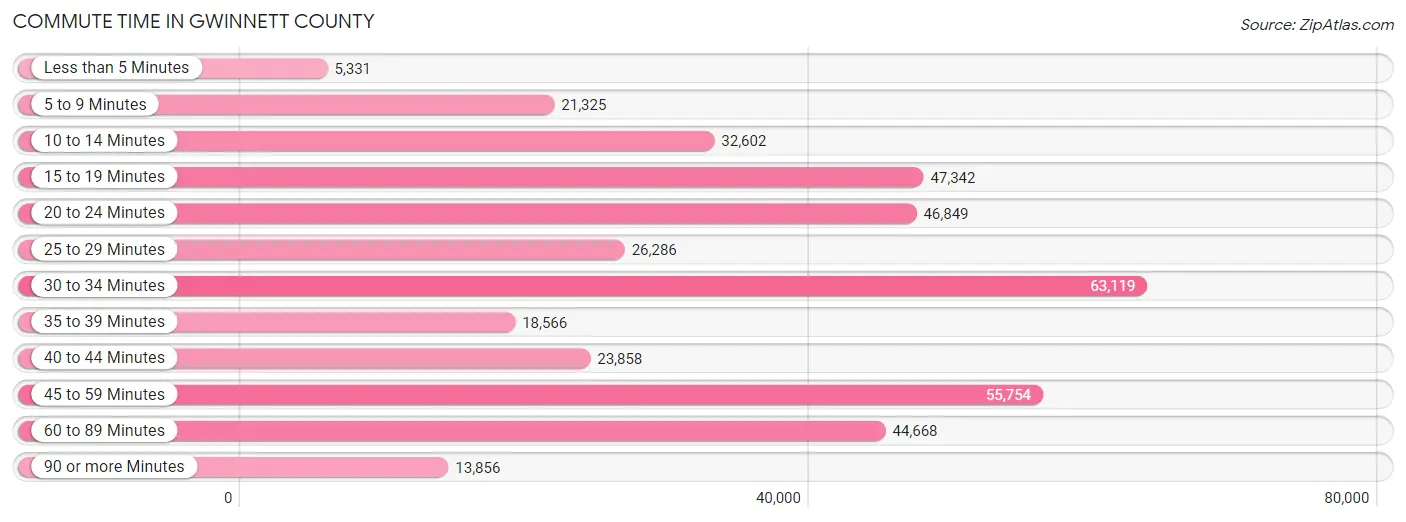
| Commute Time | # Commuters | % Commuters |
| Less than 5 Minutes | 5,331 | 1.3% |
| 5 to 9 Minutes | 21,325 | 5.3% |
| 10 to 14 Minutes | 32,602 | 8.2% |
| 15 to 19 Minutes | 47,342 | 11.8% |
| 20 to 24 Minutes | 46,849 | 11.7% |
| 25 to 29 Minutes | 26,286 | 6.6% |
| 30 to 34 Minutes | 63,119 | 15.8% |
| 35 to 39 Minutes | 18,566 | 4.6% |
| 40 to 44 Minutes | 23,858 | 6.0% |
| 45 to 59 Minutes | 55,754 | 14.0% |
| 60 to 89 Minutes | 44,668 | 11.2% |
| 90 or more Minutes | 13,856 | 3.5% |
Commute Time by Sex in Gwinnett County
The most common commute times in Gwinnett County are 30 to 34 minutes (34,660 commuters, 16.1%) for males and 30 to 34 minutes (28,459 commuters, 15.4%) for females.
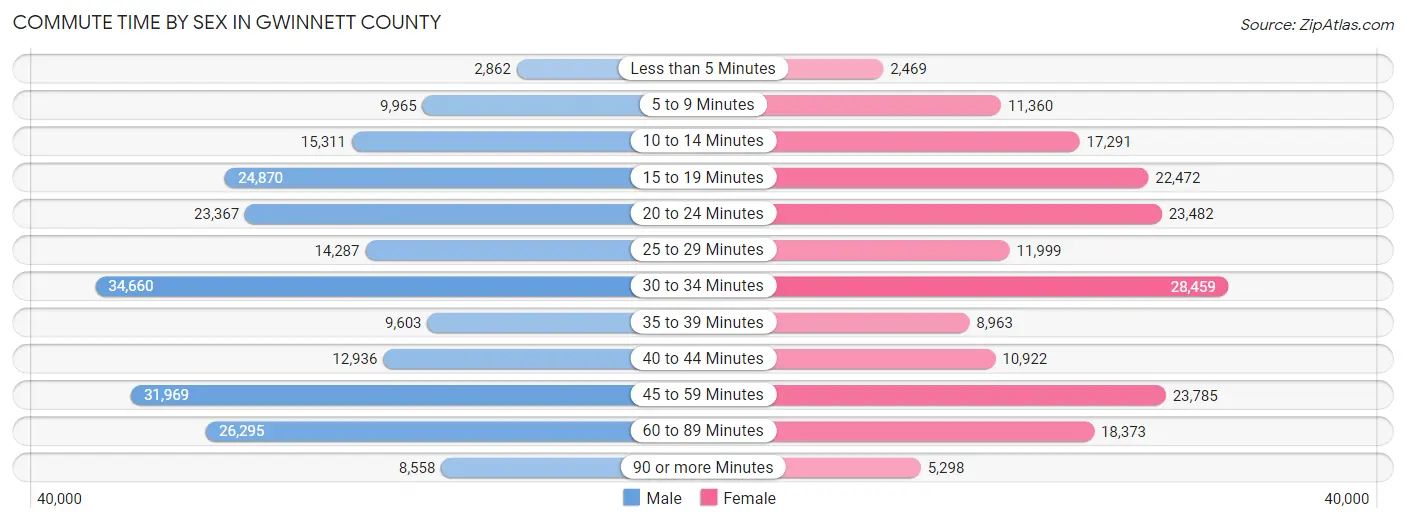
| Commute Time | Male | Female |
| Less than 5 Minutes | 2,862 (1.3%) | 2,469 (1.3%) |
| 5 to 9 Minutes | 9,965 (4.6%) | 11,360 (6.1%) |
| 10 to 14 Minutes | 15,311 (7.1%) | 17,291 (9.3%) |
| 15 to 19 Minutes | 24,870 (11.6%) | 22,472 (12.2%) |
| 20 to 24 Minutes | 23,367 (10.9%) | 23,482 (12.7%) |
| 25 to 29 Minutes | 14,287 (6.7%) | 11,999 (6.5%) |
| 30 to 34 Minutes | 34,660 (16.1%) | 28,459 (15.4%) |
| 35 to 39 Minutes | 9,603 (4.5%) | 8,963 (4.9%) |
| 40 to 44 Minutes | 12,936 (6.0%) | 10,922 (5.9%) |
| 45 to 59 Minutes | 31,969 (14.9%) | 23,785 (12.9%) |
| 60 to 89 Minutes | 26,295 (12.2%) | 18,373 (9.9%) |
| 90 or more Minutes | 8,558 (4.0%) | 5,298 (2.9%) |
Time of Departure to Work by Sex in Gwinnett County
The most frequent times of departure to work in Gwinnett County are 8:00 AM to 8:29 AM (31,402, 14.6%) for males and 8:00 AM to 8:29 AM (28,630, 15.5%) for females.
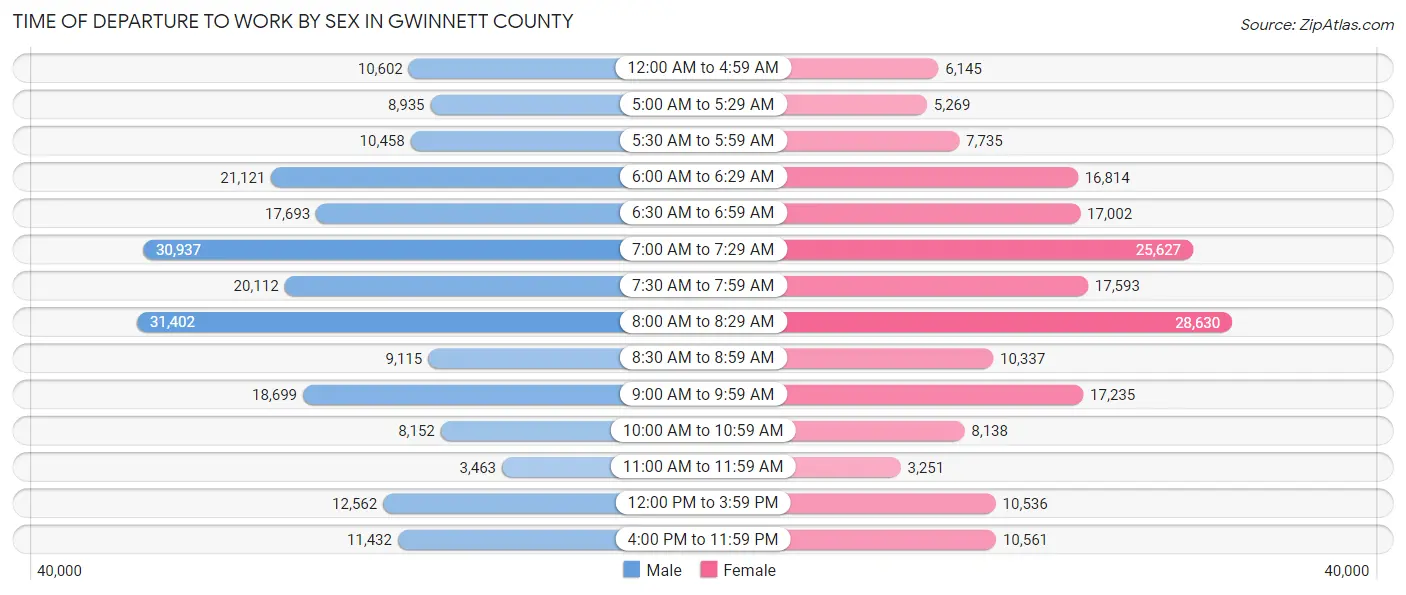
| Time of Departure | Male | Female |
| 12:00 AM to 4:59 AM | 10,602 (4.9%) | 6,145 (3.3%) |
| 5:00 AM to 5:29 AM | 8,935 (4.2%) | 5,269 (2.9%) |
| 5:30 AM to 5:59 AM | 10,458 (4.9%) | 7,735 (4.2%) |
| 6:00 AM to 6:29 AM | 21,121 (9.8%) | 16,814 (9.1%) |
| 6:30 AM to 6:59 AM | 17,693 (8.2%) | 17,002 (9.2%) |
| 7:00 AM to 7:29 AM | 30,937 (14.4%) | 25,627 (13.9%) |
| 7:30 AM to 7:59 AM | 20,112 (9.4%) | 17,593 (9.5%) |
| 8:00 AM to 8:29 AM | 31,402 (14.6%) | 28,630 (15.5%) |
| 8:30 AM to 8:59 AM | 9,115 (4.3%) | 10,337 (5.6%) |
| 9:00 AM to 9:59 AM | 18,699 (8.7%) | 17,235 (9.3%) |
| 10:00 AM to 10:59 AM | 8,152 (3.8%) | 8,138 (4.4%) |
| 11:00 AM to 11:59 AM | 3,463 (1.6%) | 3,251 (1.8%) |
| 12:00 PM to 3:59 PM | 12,562 (5.9%) | 10,536 (5.7%) |
| 4:00 PM to 11:59 PM | 11,432 (5.3%) | 10,561 (5.7%) |
| Total | 214,683 (100.0%) | 184,873 (100.0%) |
Housing Occupancy in Gwinnett County
Occupancy by Ownership in Gwinnett County
Of the total 317,971 dwellings in Gwinnett County, owner-occupied units account for 211,863 (66.6%), while renter-occupied units make up 106,108 (33.4%).
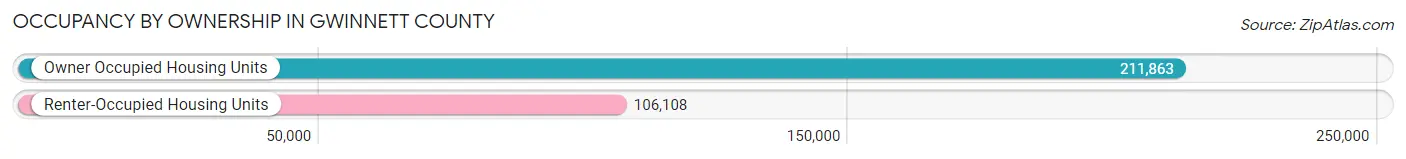
| Occupancy | # Housing Units | % Housing Units |
| Owner Occupied Housing Units | 211,863 | 66.6% |
| Renter-Occupied Housing Units | 106,108 | 33.4% |
| Total Occupied Housing Units | 317,971 | 100.0% |
Occupancy by Household Size in Gwinnett County
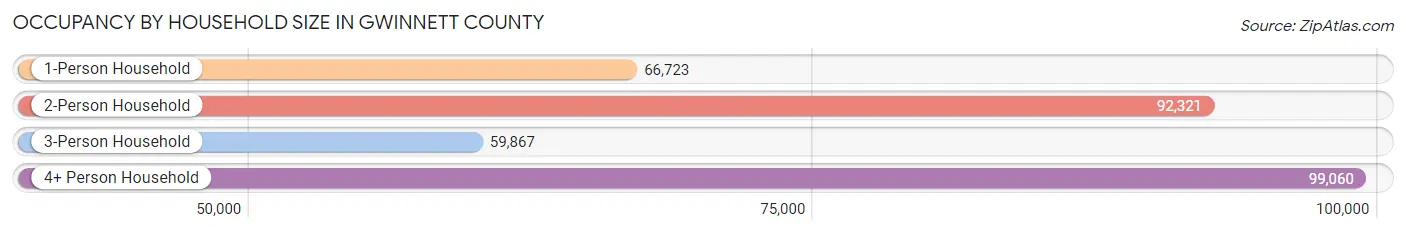
| Household Size | # Housing Units | % Housing Units |
| 1-Person Household | 66,723 | 21.0% |
| 2-Person Household | 92,321 | 29.0% |
| 3-Person Household | 59,867 | 18.8% |
| 4+ Person Household | 99,060 | 31.1% |
| Total Housing Units | 317,971 | 100.0% |
Occupancy by Ownership by Household Size in Gwinnett County
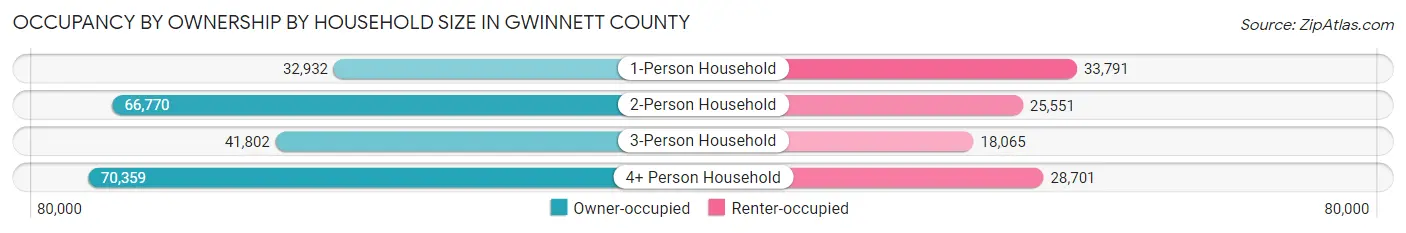
| Household Size | Owner-occupied | Renter-occupied |
| 1-Person Household | 32,932 (49.4%) | 33,791 (50.6%) |
| 2-Person Household | 66,770 (72.3%) | 25,551 (27.7%) |
| 3-Person Household | 41,802 (69.8%) | 18,065 (30.2%) |
| 4+ Person Household | 70,359 (71.0%) | 28,701 (29.0%) |
| Total Housing Units | 211,863 (66.6%) | 106,108 (33.4%) |
Occupancy by Educational Attainment in Gwinnett County
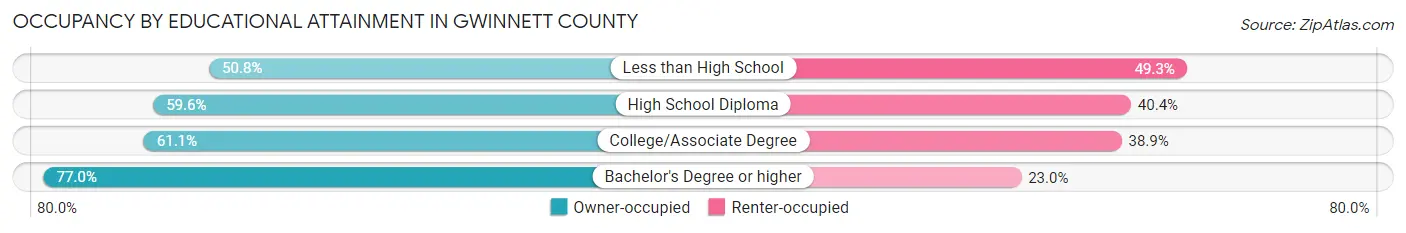
| Household Size | Owner-occupied | Renter-occupied |
| Less than High School | 15,432 (50.7%) | 14,977 (49.2%) |
| High School Diploma | 35,662 (59.6%) | 24,176 (40.4%) |
| College/Associate Degree | 55,888 (61.1%) | 35,616 (38.9%) |
| Bachelor's Degree or higher | 104,881 (77.0%) | 31,339 (23.0%) |
Occupancy by Age of Householder in Gwinnett County
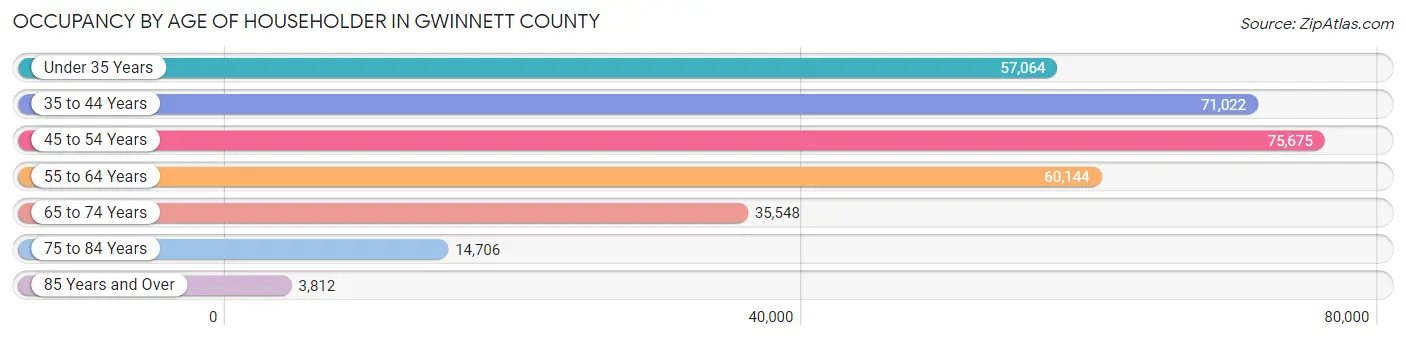
| Age Bracket | # Households | % Households |
| Under 35 Years | 57,064 | 17.9% |
| 35 to 44 Years | 71,022 | 22.3% |
| 45 to 54 Years | 75,675 | 23.8% |
| 55 to 64 Years | 60,144 | 18.9% |
| 65 to 74 Years | 35,548 | 11.2% |
| 75 to 84 Years | 14,706 | 4.6% |
| 85 Years and Over | 3,812 | 1.2% |
| Total | 317,971 | 100.0% |
Housing Finances in Gwinnett County
Median Income by Occupancy in Gwinnett County
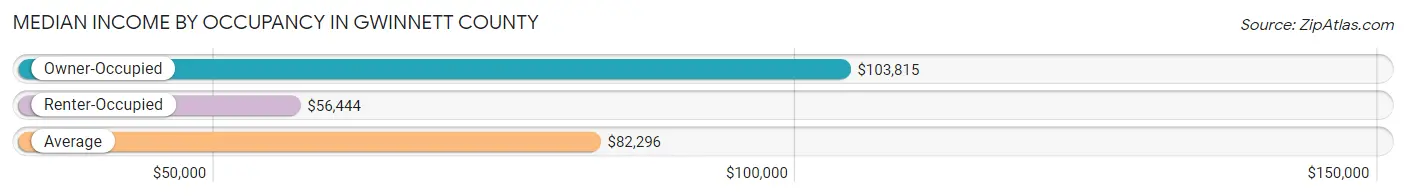
| Occupancy Type | # Households | Median Income |
| Owner-Occupied | 211,863 (66.6%) | $103,815 |
| Renter-Occupied | 106,108 (33.4%) | $56,444 |
| Average | 317,971 (100.0%) | $82,296 |
Occupancy by Householder Income Bracket in Gwinnett County
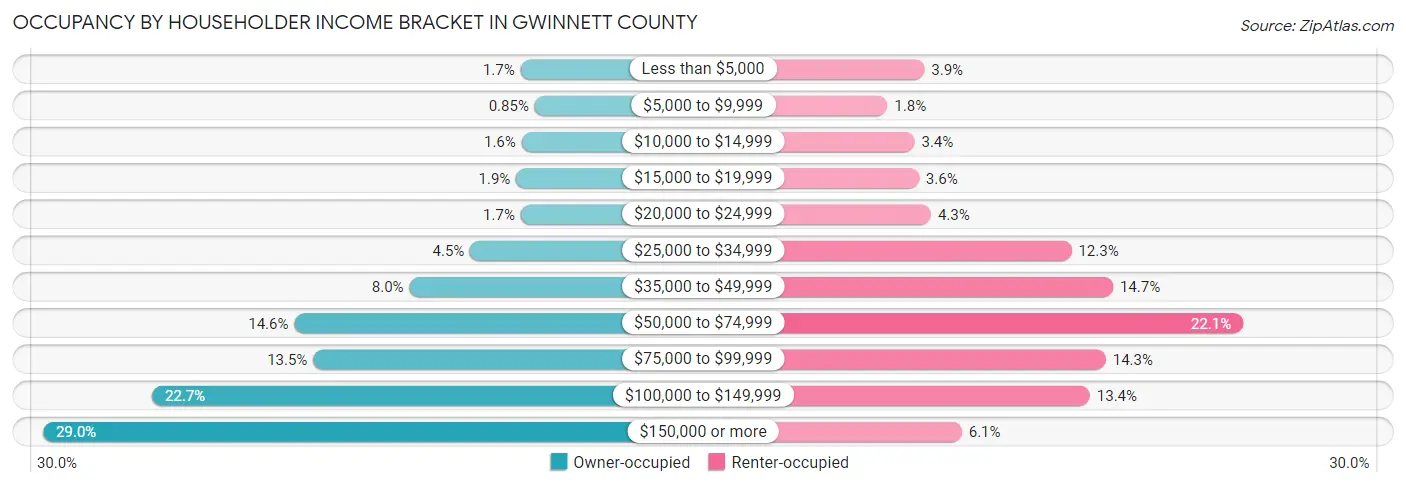
| Income Bracket | Owner-occupied | Renter-occupied |
| Less than $5,000 | 3,526 (1.7%) | 4,174 (3.9%) |
| $5,000 to $9,999 | 1,802 (0.9%) | 1,930 (1.8%) |
| $10,000 to $14,999 | 3,391 (1.6%) | 3,578 (3.4%) |
| $15,000 to $19,999 | 4,053 (1.9%) | 3,838 (3.6%) |
| $20,000 to $24,999 | 3,503 (1.7%) | 4,575 (4.3%) |
| $25,000 to $34,999 | 9,622 (4.5%) | 13,090 (12.3%) |
| $35,000 to $49,999 | 16,962 (8.0%) | 15,611 (14.7%) |
| $50,000 to $74,999 | 30,918 (14.6%) | 23,494 (22.1%) |
| $75,000 to $99,999 | 28,627 (13.5%) | 15,170 (14.3%) |
| $100,000 to $149,999 | 48,134 (22.7%) | 14,205 (13.4%) |
| $150,000 or more | 61,325 (28.9%) | 6,443 (6.1%) |
| Total | 211,863 (100.0%) | 106,108 (100.0%) |
Monthly Housing Cost Tiers in Gwinnett County
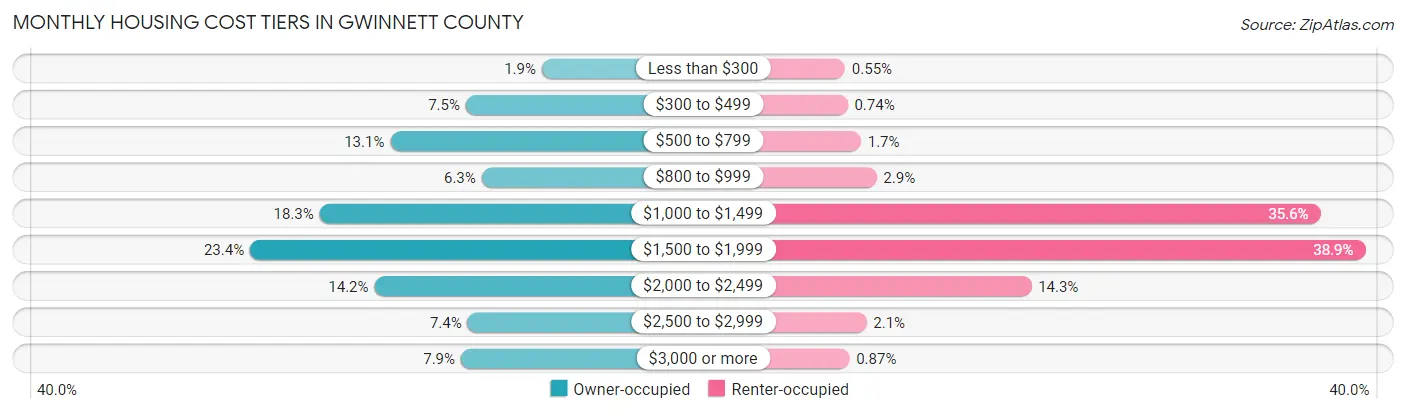
| Monthly Cost | Owner-occupied | Renter-occupied |
| Less than $300 | 4,047 (1.9%) | 587 (0.5%) |
| $300 to $499 | 15,912 (7.5%) | 787 (0.7%) |
| $500 to $799 | 27,685 (13.1%) | 1,826 (1.7%) |
| $800 to $999 | 13,431 (6.3%) | 3,045 (2.9%) |
| $1,000 to $1,499 | 38,735 (18.3%) | 37,743 (35.6%) |
| $1,500 to $1,999 | 49,566 (23.4%) | 41,250 (38.9%) |
| $2,000 to $2,499 | 30,172 (14.2%) | 15,139 (14.3%) |
| $2,500 to $2,999 | 15,643 (7.4%) | 2,258 (2.1%) |
| $3,000 or more | 16,672 (7.9%) | 923 (0.9%) |
| Total | 211,863 (100.0%) | 106,108 (100.0%) |
Physical Housing Characteristics in Gwinnett County
Housing Structures in Gwinnett County
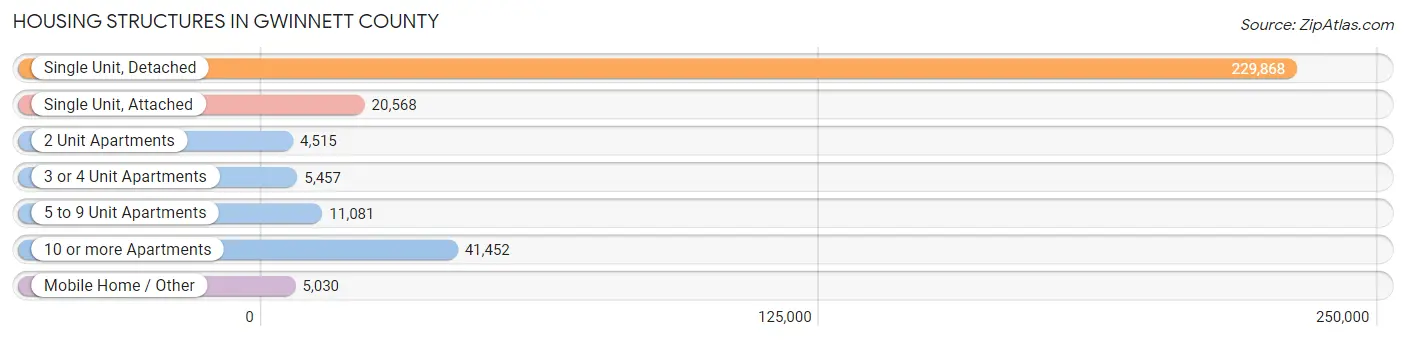
| Structure Type | # Housing Units | % Housing Units |
| Single Unit, Detached | 229,868 | 72.3% |
| Single Unit, Attached | 20,568 | 6.5% |
| 2 Unit Apartments | 4,515 | 1.4% |
| 3 or 4 Unit Apartments | 5,457 | 1.7% |
| 5 to 9 Unit Apartments | 11,081 | 3.5% |
| 10 or more Apartments | 41,452 | 13.0% |
| Mobile Home / Other | 5,030 | 1.6% |
| Total | 317,971 | 100.0% |
Housing Structures by Occupancy in Gwinnett County
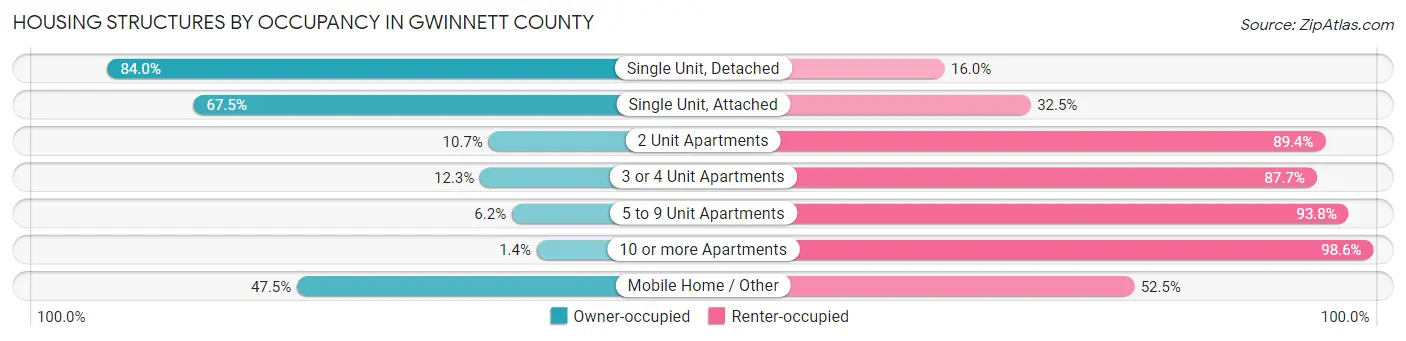
| Structure Type | Owner-occupied | Renter-occupied |
| Single Unit, Detached | 193,190 (84.0%) | 36,678 (16.0%) |
| Single Unit, Attached | 13,876 (67.5%) | 6,692 (32.5%) |
| 2 Unit Apartments | 481 (10.6%) | 4,034 (89.3%) |
| 3 or 4 Unit Apartments | 672 (12.3%) | 4,785 (87.7%) |
| 5 to 9 Unit Apartments | 683 (6.2%) | 10,398 (93.8%) |
| 10 or more Apartments | 570 (1.4%) | 40,882 (98.6%) |
| Mobile Home / Other | 2,391 (47.5%) | 2,639 (52.5%) |
| Total | 211,863 (66.6%) | 106,108 (33.4%) |
Housing Structures by Number of Rooms in Gwinnett County
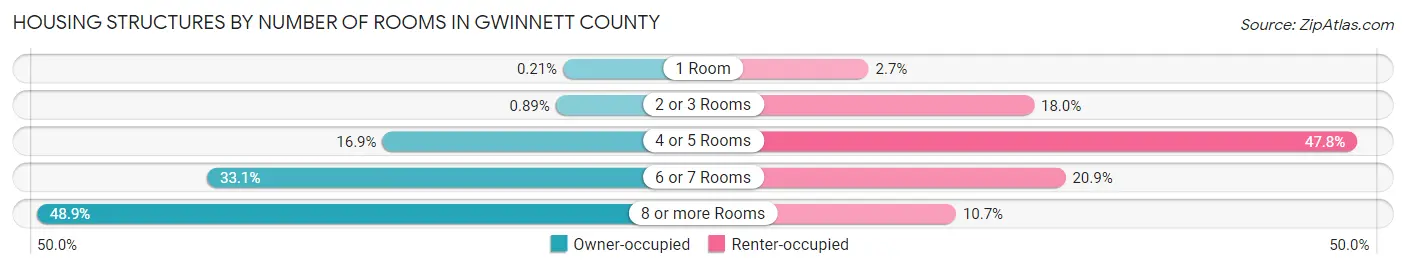
| Number of Rooms | Owner-occupied | Renter-occupied |
| 1 Room | 452 (0.2%) | 2,810 (2.6%) |
| 2 or 3 Rooms | 1,889 (0.9%) | 19,042 (17.9%) |
| 4 or 5 Rooms | 35,826 (16.9%) | 50,741 (47.8%) |
| 6 or 7 Rooms | 70,173 (33.1%) | 22,130 (20.9%) |
| 8 or more Rooms | 103,523 (48.9%) | 11,385 (10.7%) |
| Total | 211,863 (100.0%) | 106,108 (100.0%) |
Housing Structure by Heating Type in Gwinnett County
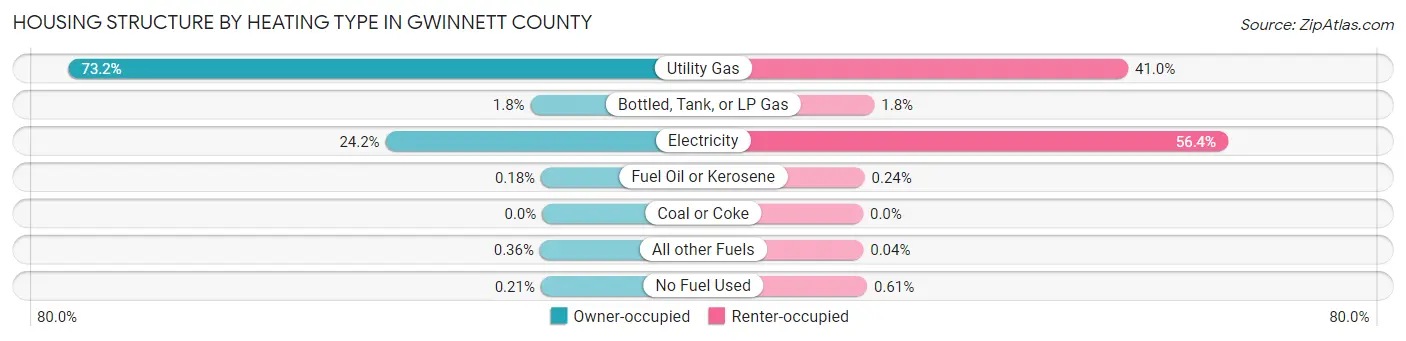
| Heating Type | Owner-occupied | Renter-occupied |
| Utility Gas | 155,150 (73.2%) | 43,477 (41.0%) |
| Bottled, Tank, or LP Gas | 3,810 (1.8%) | 1,855 (1.8%) |
| Electricity | 51,316 (24.2%) | 59,831 (56.4%) |
| Fuel Oil or Kerosene | 386 (0.2%) | 253 (0.2%) |
| Coal or Coke | 0 (0.0%) | 0 (0.0%) |
| All other Fuels | 764 (0.4%) | 40 (0.0%) |
| No Fuel Used | 437 (0.2%) | 652 (0.6%) |
| Total | 211,863 (100.0%) | 106,108 (100.0%) |
Household Vehicle Usage in Gwinnett County
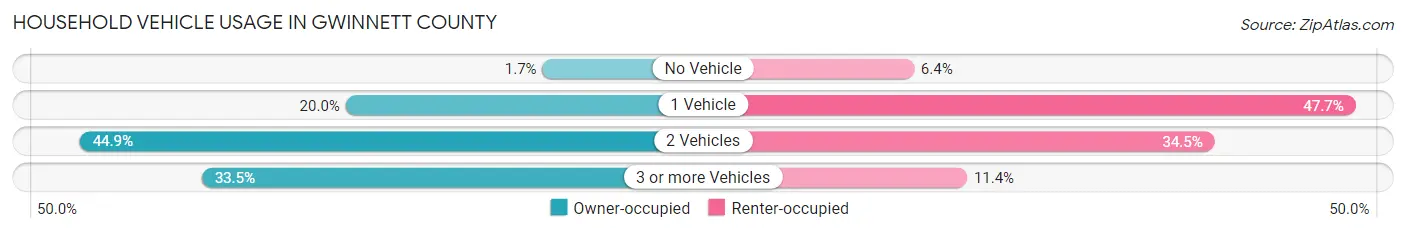
| Vehicles per Household | Owner-occupied | Renter-occupied |
| No Vehicle | 3,527 (1.7%) | 6,835 (6.4%) |
| 1 Vehicle | 42,432 (20.0%) | 50,582 (47.7%) |
| 2 Vehicles | 95,015 (44.9%) | 36,606 (34.5%) |
| 3 or more Vehicles | 70,889 (33.5%) | 12,085 (11.4%) |
| Total | 211,863 (100.0%) | 106,108 (100.0%) |
Real Estate & Mortgages in Gwinnett County
Real Estate and Mortgage Overview in Gwinnett County
| Characteristic | Without Mortgage | With Mortgage |
| Housing Units | 58,370 | 153,493 |
| Median Property Value | $290,200 | $314,400 |
| Median Household Income | $78,689 | $49,802 |
| Monthly Housing Costs | $604 | $16,518 |
| Real Estate Taxes | $2,646 | $2,531 |
Property Value by Mortgage Status in Gwinnett County
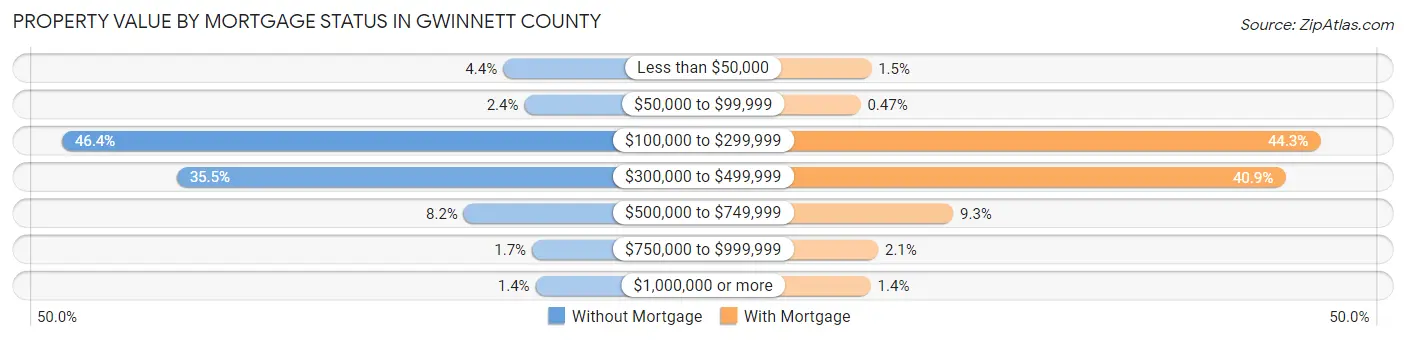
| Property Value | Without Mortgage | With Mortgage |
| Less than $50,000 | 2,589 (4.4%) | 2,284 (1.5%) |
| $50,000 to $99,999 | 1,404 (2.4%) | 719 (0.5%) |
| $100,000 to $299,999 | 27,106 (46.4%) | 67,920 (44.3%) |
| $300,000 to $499,999 | 20,730 (35.5%) | 62,816 (40.9%) |
| $500,000 to $749,999 | 4,776 (8.2%) | 14,255 (9.3%) |
| $750,000 to $999,999 | 978 (1.7%) | 3,288 (2.1%) |
| $1,000,000 or more | 787 (1.3%) | 2,211 (1.4%) |
| Total | 58,370 (100.0%) | 153,493 (100.0%) |
Household Income by Mortgage Status in Gwinnett County
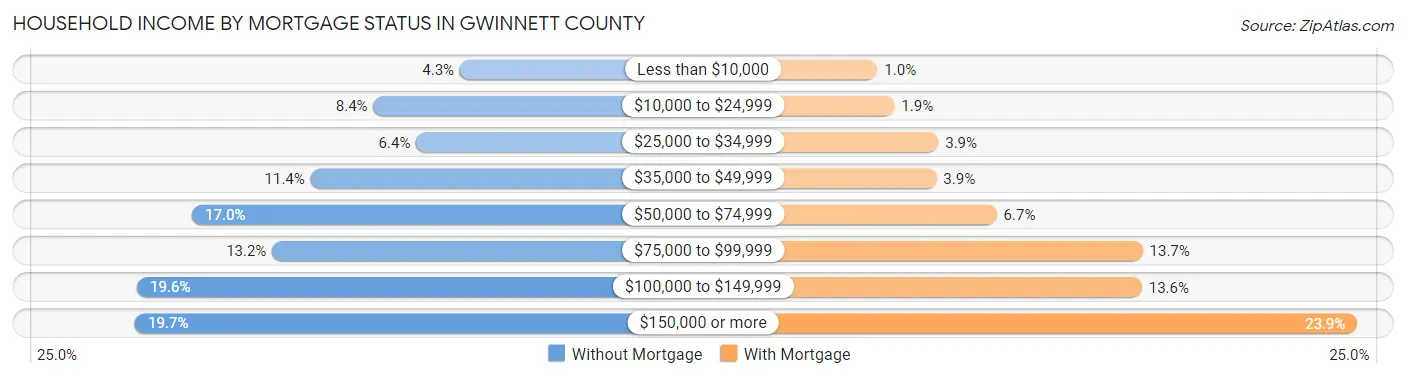
| Household Income | Without Mortgage | With Mortgage |
| Less than $10,000 | 2,495 (4.3%) | 1,604 (1.0%) |
| $10,000 to $24,999 | 4,898 (8.4%) | 2,833 (1.8%) |
| $25,000 to $34,999 | 3,707 (6.4%) | 6,049 (3.9%) |
| $35,000 to $49,999 | 6,640 (11.4%) | 5,915 (3.8%) |
| $50,000 to $74,999 | 9,936 (17.0%) | 10,322 (6.7%) |
| $75,000 to $99,999 | 7,709 (13.2%) | 20,982 (13.7%) |
| $100,000 to $149,999 | 11,462 (19.6%) | 20,918 (13.6%) |
| $150,000 or more | 11,523 (19.7%) | 36,672 (23.9%) |
| Total | 58,370 (100.0%) | 153,493 (100.0%) |
Property Value to Household Income Ratio in Gwinnett County
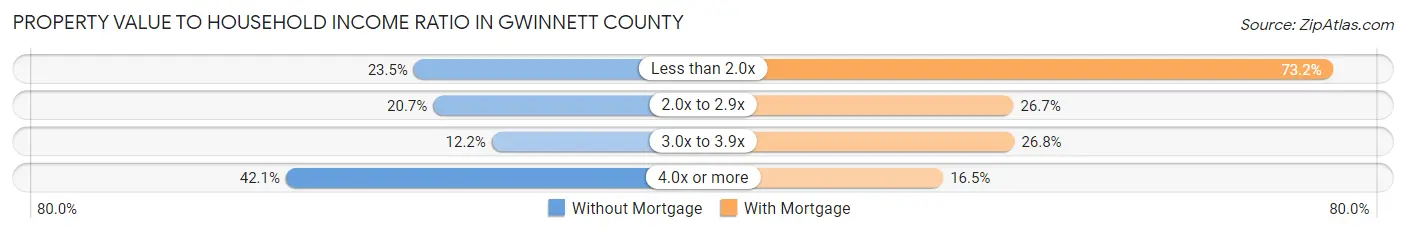
| Value-to-Income Ratio | Without Mortgage | With Mortgage |
| Less than 2.0x | 13,700 (23.5%) | 112,298 (73.2%) |
| 2.0x to 2.9x | 12,052 (20.6%) | 40,933 (26.7%) |
| 3.0x to 3.9x | 7,090 (12.1%) | 41,147 (26.8%) |
| 4.0x or more | 24,547 (42.0%) | 25,270 (16.5%) |
| Total | 58,370 (100.0%) | 153,493 (100.0%) |
Real Estate Taxes by Mortgage Status in Gwinnett County
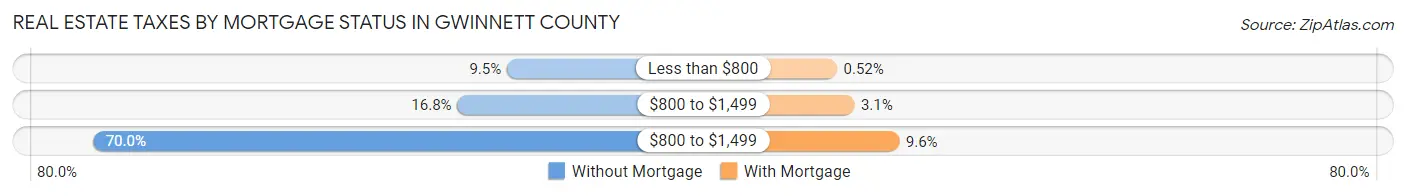
| Property Taxes | Without Mortgage | With Mortgage |
| Less than $800 | 5,551 (9.5%) | 794 (0.5%) |
| $800 to $1,499 | 9,785 (16.8%) | 4,698 (3.1%) |
| $800 to $1,499 | 40,884 (70.0%) | 14,773 (9.6%) |
| Total | 58,370 (100.0%) | 153,493 (100.0%) |
Health & Disability in Gwinnett County
Health Insurance Coverage by Age in Gwinnett County
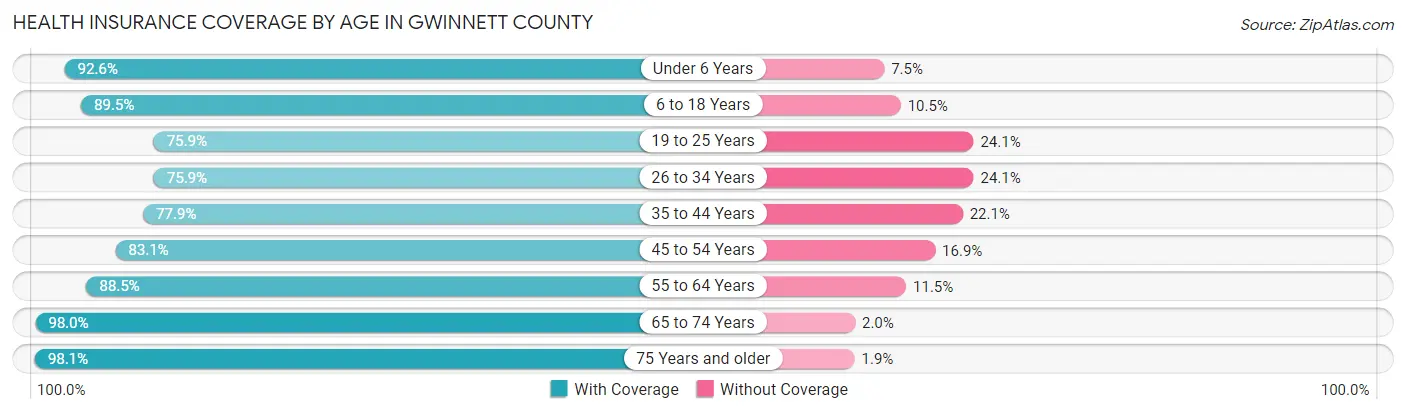
| Age Bracket | With Coverage | Without Coverage |
| Under 6 Years | 68,350 (92.5%) | 5,502 (7.4%) |
| 6 to 18 Years | 171,688 (89.5%) | 20,184 (10.5%) |
| 19 to 25 Years | 67,840 (75.9%) | 21,533 (24.1%) |
| 26 to 34 Years | 84,748 (75.9%) | 26,924 (24.1%) |
| 35 to 44 Years | 105,441 (77.9%) | 29,886 (22.1%) |
| 45 to 54 Years | 114,092 (83.1%) | 23,269 (16.9%) |
| 55 to 64 Years | 99,944 (88.5%) | 13,019 (11.5%) |
| 65 to 74 Years | 64,403 (98.0%) | 1,312 (2.0%) |
| 75 Years and older | 34,339 (98.1%) | 671 (1.9%) |
| Total | 810,845 (85.1%) | 142,300 (14.9%) |
Health Insurance Coverage by Citizenship Status in Gwinnett County
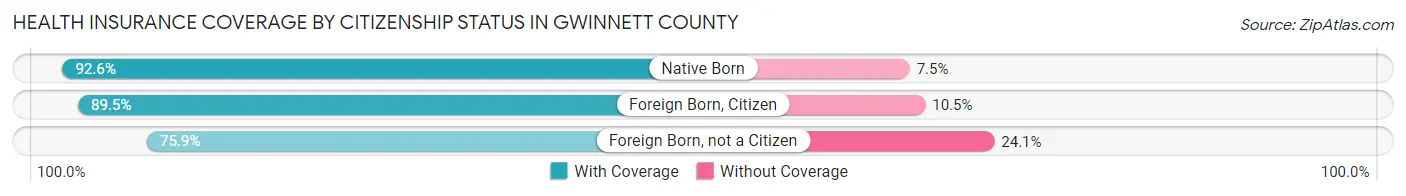
| Citizenship Status | With Coverage | Without Coverage |
| Native Born | 68,350 (92.5%) | 5,502 (7.4%) |
| Foreign Born, Citizen | 171,688 (89.5%) | 20,184 (10.5%) |
| Foreign Born, not a Citizen | 67,840 (75.9%) | 21,533 (24.1%) |
Health Insurance Coverage by Household Income in Gwinnett County
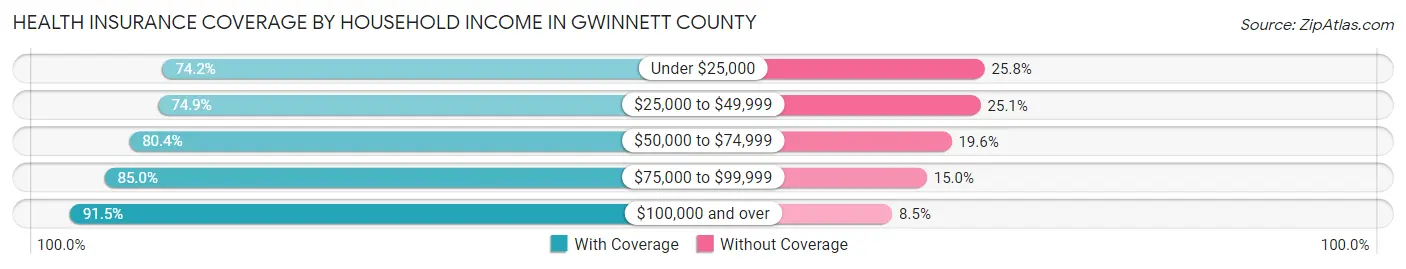
| Household Income | With Coverage | Without Coverage |
| Under $25,000 | 54,971 (74.2%) | 19,148 (25.8%) |
| $25,000 to $49,999 | 100,746 (74.9%) | 33,710 (25.1%) |
| $50,000 to $74,999 | 125,235 (80.4%) | 30,556 (19.6%) |
| $75,000 to $99,999 | 111,809 (85.0%) | 19,714 (15.0%) |
| $100,000 and over | 417,387 (91.5%) | 38,767 (8.5%) |
Public vs Private Health Insurance Coverage by Age in Gwinnett County
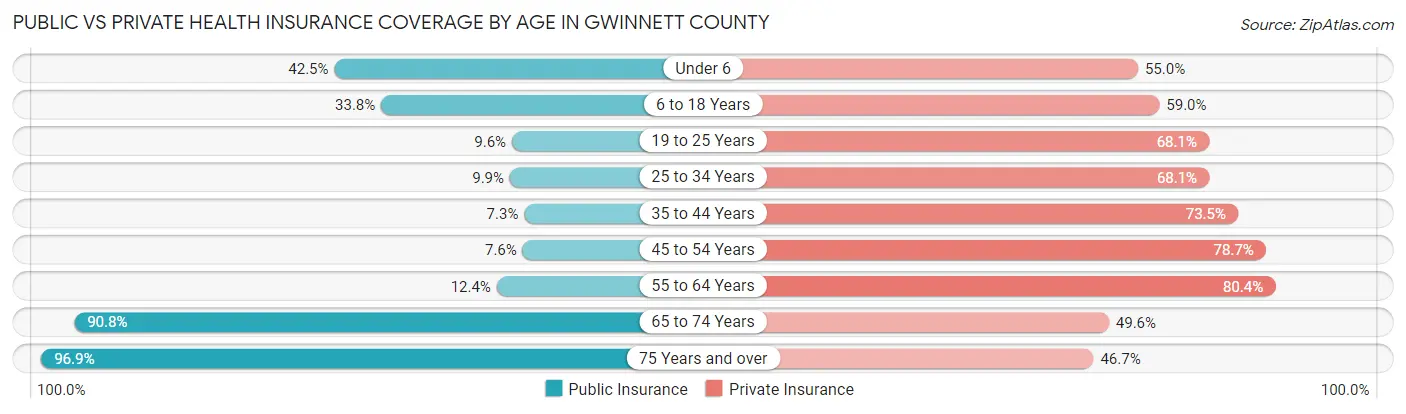
| Age Bracket | Public Insurance | Private Insurance |
| Under 6 | 31,394 (42.5%) | 40,605 (55.0%) |
| 6 to 18 Years | 64,914 (33.8%) | 113,112 (59.0%) |
| 19 to 25 Years | 8,536 (9.6%) | 60,859 (68.1%) |
| 25 to 34 Years | 11,093 (9.9%) | 76,097 (68.1%) |
| 35 to 44 Years | 9,829 (7.3%) | 99,455 (73.5%) |
| 45 to 54 Years | 10,389 (7.6%) | 108,056 (78.7%) |
| 55 to 64 Years | 13,972 (12.4%) | 90,833 (80.4%) |
| 65 to 74 Years | 59,665 (90.8%) | 32,573 (49.6%) |
| 75 Years and over | 33,929 (96.9%) | 16,355 (46.7%) |
| Total | 243,721 (25.6%) | 637,945 (66.9%) |
Disability Status by Sex by Age in Gwinnett County
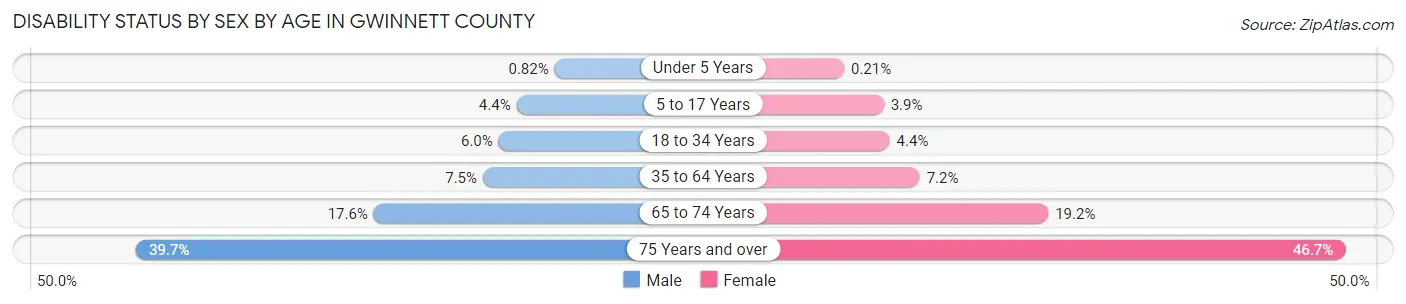
| Age Bracket | Male | Female |
| Under 5 Years | 249 (0.8%) | 62 (0.2%) |
| 5 to 17 Years | 4,251 (4.3%) | 3,699 (3.9%) |
| 18 to 34 Years | 6,421 (6.0%) | 4,780 (4.4%) |
| 35 to 64 Years | 14,001 (7.5%) | 14,316 (7.2%) |
| 65 to 74 Years | 5,328 (17.6%) | 6,793 (19.2%) |
| 75 Years and over | 5,754 (39.7%) | 9,577 (46.7%) |
Disability Class by Sex by Age in Gwinnett County
Disability Class: Hearing Difficulty
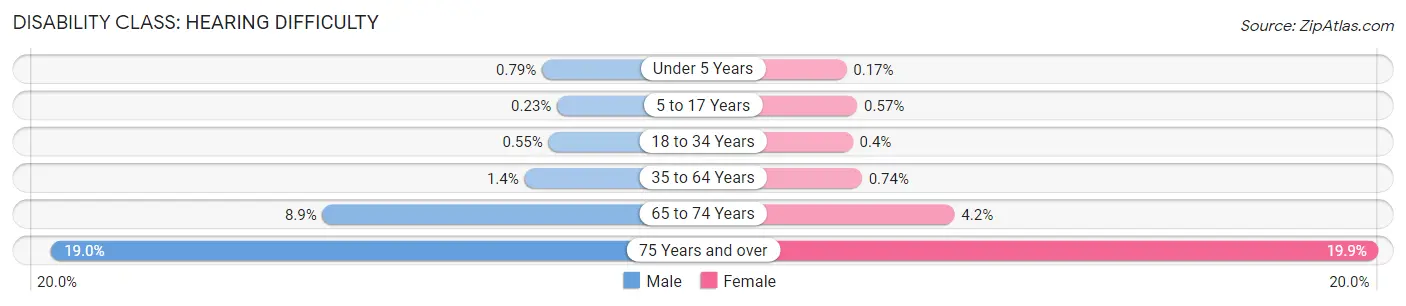
| Age Bracket | Male | Female |
| Under 5 Years | 240 (0.8%) | 50 (0.2%) |
| 5 to 17 Years | 220 (0.2%) | 538 (0.6%) |
| 18 to 34 Years | 588 (0.5%) | 431 (0.4%) |
| 35 to 64 Years | 2,703 (1.4%) | 1,472 (0.7%) |
| 65 to 74 Years | 2,707 (8.9%) | 1,481 (4.2%) |
| 75 Years and over | 2,758 (19.0%) | 4,086 (19.9%) |
Disability Class: Vision Difficulty
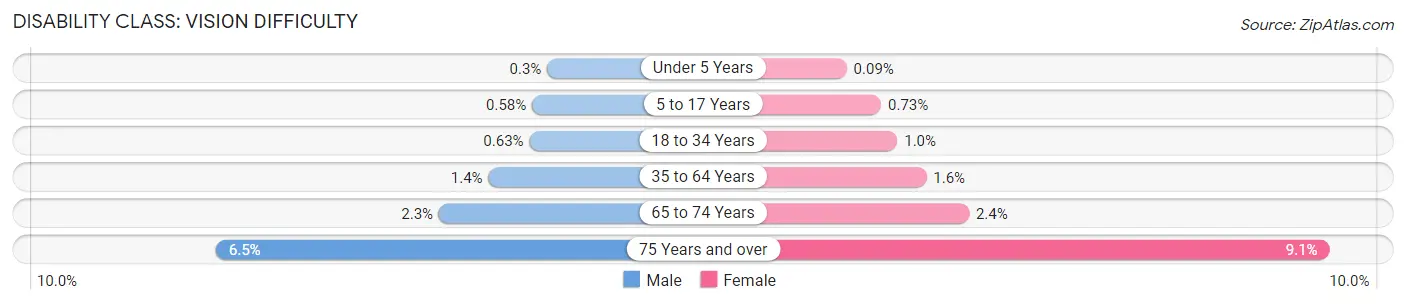
| Age Bracket | Male | Female |
| Under 5 Years | 91 (0.3%) | 25 (0.1%) |
| 5 to 17 Years | 562 (0.6%) | 695 (0.7%) |
| 18 to 34 Years | 675 (0.6%) | 1,109 (1.0%) |
| 35 to 64 Years | 2,616 (1.4%) | 3,101 (1.6%) |
| 65 to 74 Years | 698 (2.3%) | 838 (2.4%) |
| 75 Years and over | 936 (6.5%) | 1,856 (9.0%) |
Disability Class: Cognitive Difficulty
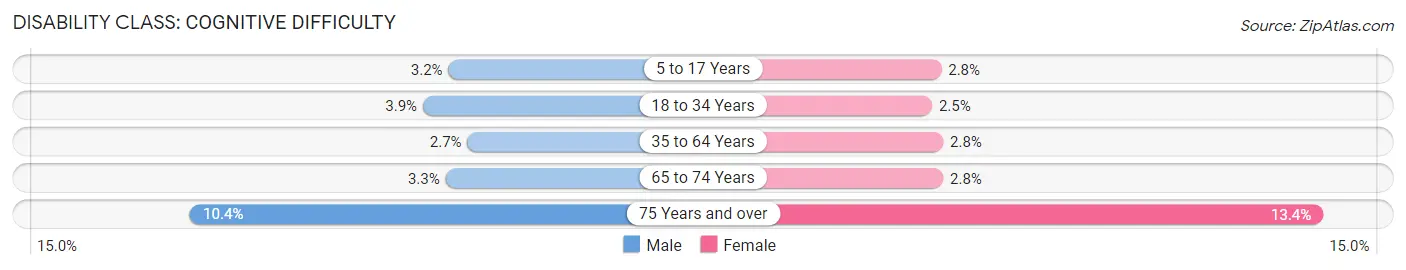
| Age Bracket | Male | Female |
| 5 to 17 Years | 3,121 (3.2%) | 2,640 (2.8%) |
| 18 to 34 Years | 4,171 (3.9%) | 2,701 (2.5%) |
| 35 to 64 Years | 5,006 (2.7%) | 5,588 (2.8%) |
| 65 to 74 Years | 992 (3.3%) | 1,001 (2.8%) |
| 75 Years and over | 1,507 (10.4%) | 2,747 (13.4%) |
Disability Class: Ambulatory Difficulty
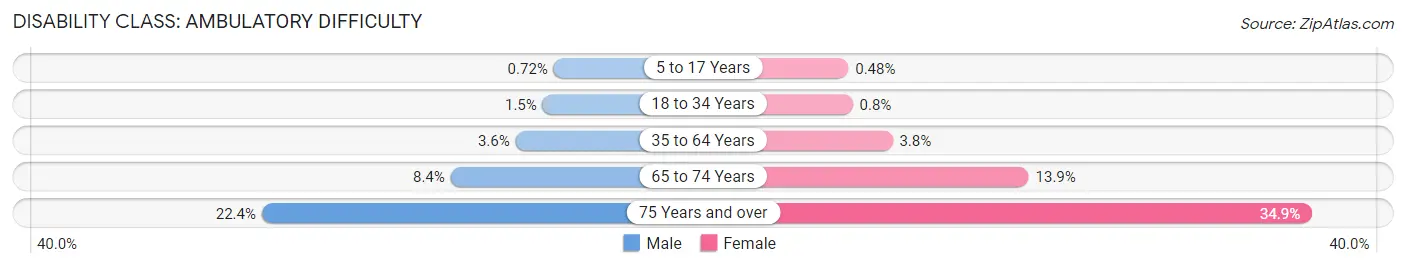
| Age Bracket | Male | Female |
| 5 to 17 Years | 698 (0.7%) | 455 (0.5%) |
| 18 to 34 Years | 1,644 (1.5%) | 858 (0.8%) |
| 35 to 64 Years | 6,664 (3.5%) | 7,454 (3.8%) |
| 65 to 74 Years | 2,533 (8.4%) | 4,918 (13.9%) |
| 75 Years and over | 3,248 (22.4%) | 7,158 (34.9%) |
Disability Class: Self-Care Difficulty
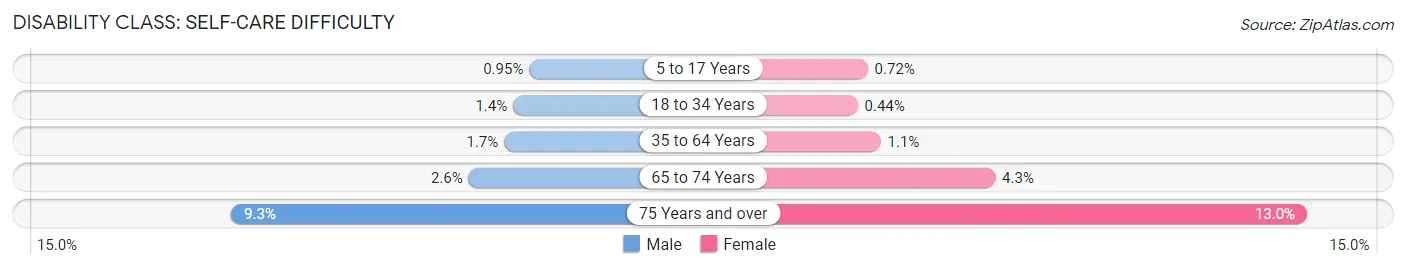
| Age Bracket | Male | Female |
| 5 to 17 Years | 929 (0.9%) | 682 (0.7%) |
| 18 to 34 Years | 1,493 (1.4%) | 474 (0.4%) |
| 35 to 64 Years | 3,088 (1.7%) | 2,141 (1.1%) |
| 65 to 74 Years | 800 (2.6%) | 1,514 (4.3%) |
| 75 Years and over | 1,342 (9.2%) | 2,656 (13.0%) |
Technology Access in Gwinnett County
Computing Device Access in Gwinnett County
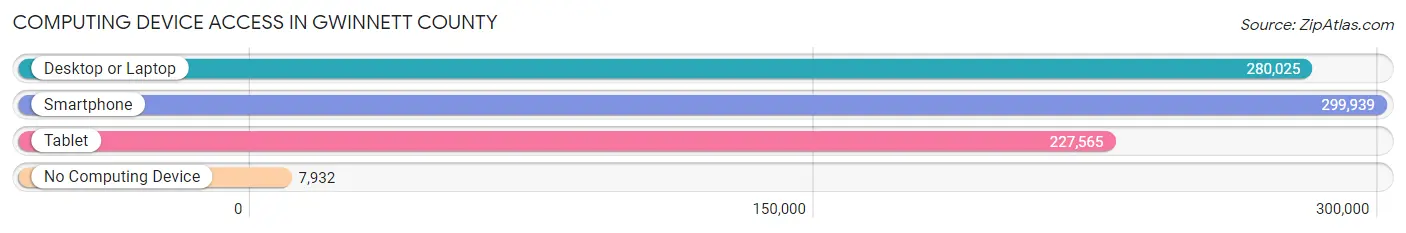
| Device Type | # Households | % Households |
| Desktop or Laptop | 280,025 | 88.1% |
| Smartphone | 299,939 | 94.3% |
| Tablet | 227,565 | 71.6% |
| No Computing Device | 7,932 | 2.5% |
| Total | 317,971 | 100.0% |
Internet Access in Gwinnett County
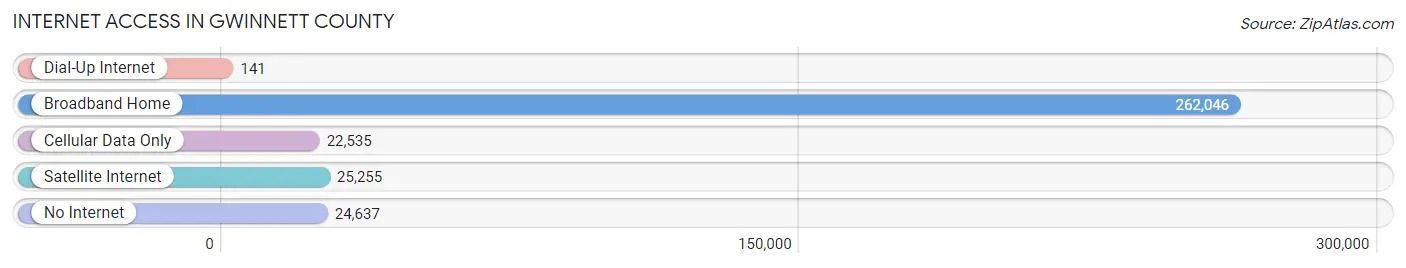
| Internet Type | # Households | % Households |
| Dial-Up Internet | 141 | 0.0% |
| Broadband Home | 262,046 | 82.4% |
| Cellular Data Only | 22,535 | 7.1% |
| Satellite Internet | 25,255 | 7.9% |
| No Internet | 24,637 | 7.7% |
| Total | 317,971 | 100.0% |
Gwinnett County Summary
Gwinnett County, Georgia is located in the northern part of the state, just outside of Atlanta. It is the second most populous county in the state, with a population of over 900,000 people. Gwinnett County is known for its diverse population, vibrant economy, and rich history.
Geography
Gwinnett County is located in the Piedmont region of Georgia, which is characterized by rolling hills and valleys. The county is bordered by the Chattahoochee River to the west, the Oconee River to the east, and the Apalachee River to the south. The county is divided into four distinct regions: the northern region, the central region, the eastern region, and the western region. The northern region is home to the cities of Lawrenceville and Buford, while the central region is home to the cities of Duluth and Suwanee. The eastern region is home to the cities of Dacula and Snellville, while the western region is home to the cities of Norcross and Lilburn.
History
Gwinnett County was established in 1818, and was named after Button Gwinnett, one of the signers of the Declaration of Independence. The county was originally part of the Cherokee Nation, and was home to many Native American tribes. In the early 1800s, the county was home to a large number of cotton plantations, and was a major producer of cotton. During the Civil War, the county was the site of several battles, including the Battle of Peachtree Creek. After the war, the county experienced a period of growth and development, and by the early 1900s, the county was home to several small towns and cities.
Economy
Gwinnett County is home to a vibrant and diverse economy. The county is home to several major corporations, including NCR Corporation, Primerica, and Waffle House. The county is also home to several major universities, including the University of Georgia, Georgia State University, and Georgia Tech. The county is also home to several major shopping centers, including the Mall of Georgia and the Gwinnett Place Mall.
Demographics
Gwinnett County is home to a diverse population. According to the 2010 census, the county had a population of 805,321 people. The racial makeup of the county was 57.2% White, 24.3% African American, 8.2% Asian, and 8.3% Hispanic or Latino. The median household income in the county was $60,879, and the median age was 35.7 years.
Gwinnett County is a vibrant and diverse county with a rich history and a vibrant economy. The county is home to a diverse population, and is a great place to live, work, and play.
Common Questions
What is the Total Population of Gwinnett County?
Total Population of Gwinnett County is 957,977.
What is the Total Male Population of Gwinnett County?
Total Male Population of Gwinnett County is 470,667.
What is the Total Female Population of Gwinnett County?
Total Female Population of Gwinnett County is 487,310.
What is the Ratio of Males per 100 Females in Gwinnett County?
There are 96.58 Males per 100 Females in Gwinnett County.
What is the Ratio of Females per 100 Males in Gwinnett County?
There are 103.54 Females per 100 Males in Gwinnett County.
What is the Median Population Age in Gwinnett County?
Median Population Age in Gwinnett County is 35.7 Years.
What is the Average Family Size in Gwinnett County
Average Family Size in Gwinnett County is 3.5 People.
What is the Average Household Size in Gwinnett County
Average Household Size in Gwinnett County is 3.0 People.
What is Per Capita Income in Gwinnett County?
Per Capita income in Gwinnett County is $36,778.
What is the Median Family Income in Gwinnett County?
Median Family Income in Gwinnett County is $94,411.
What is the Median Household income in Gwinnett County?
Median Household Income in Gwinnett County is $82,296.
What is Income or Wage Gap in Gwinnett County?
Income or Wage Gap in Gwinnett County is 23.4%.
Women in Gwinnett County earn 76.6 cents for every dollar earned by a man.
What is Family Income Deficit in Gwinnett County?
Family Income Deficit in Gwinnett County is $10,647.
Families that are below poverty line in Gwinnett County earn $10,647 less on average than the poverty threshold level.
What is Inequality or Gini Index in Gwinnett County?
Inequality or Gini Index in Gwinnett County is 0.44.
How Large is the Labor Force in Gwinnett County?
There are 503,930 People in the Labor Forcein in Gwinnett County.
What is the Percentage of People in the Labor Force in Gwinnett County?
68.4% of People are in the Labor Force in Gwinnett County.
What is the Unemployment Rate in Gwinnett County?
Unemployment Rate in Gwinnett County is 4.1%.