Chatham County, GA
Chatham County Map
Chatham County Overview
296,266
TOTAL POPULATION
142,685
MALE POPULATION
153,581
FEMALE POPULATION
92.91
MALES / 100 FEMALES
107.64
FEMALES / 100 MALES
36.7
MEDIAN AGE
3.1
AVG FAMILY SIZE
2.4
AVG HOUSEHOLD SIZE
$37,637
PER CAPITA INCOME
$81,441
AVG FAMILY INCOME
$66,171
AVG HOUSEHOLD INCOME
17.3%
WAGE / INCOME GAP [ % ]
82.7¢/ $1
WAGE / INCOME GAP [ $ ]
$12,048
FAMILY INCOME DEFICIT
0.48
INEQUALITY / GINI INDEX
155,625
LABOR FORCE [ PEOPLE ]
64.6%
PERCENT IN LABOR FORCE
6.3%
UNEMPLOYMENT RATE
Chatham County Area Codes
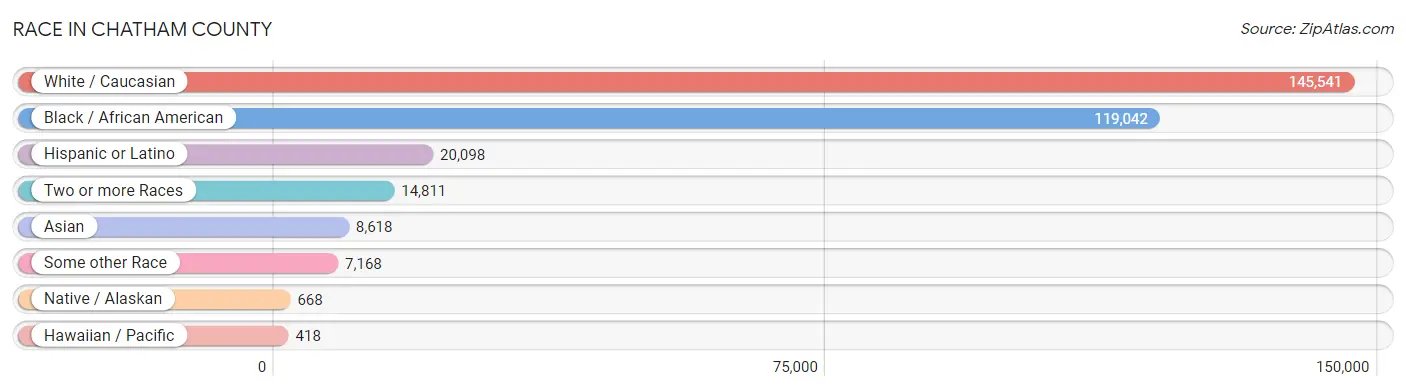
Race in Chatham County
The most populous races in Chatham County are White / Caucasian (145,541 | 49.1%), Black / African American (119,042 | 40.2%), and Hispanic or Latino (20,098 | 6.8%).
| Race | # Population | % Population |
| Asian | 8,618 | 2.9% |
| Black / African American | 119,042 | 40.2% |
| Hawaiian / Pacific | 418 | 0.1% |
| Hispanic or Latino | 20,098 | 6.8% |
| Native / Alaskan | 668 | 0.2% |
| White / Caucasian | 145,541 | 49.1% |
| Two or more Races | 14,811 | 5.0% |
| Some other Race | 7,168 | 2.4% |
| Total | 296,266 | 100.0% |
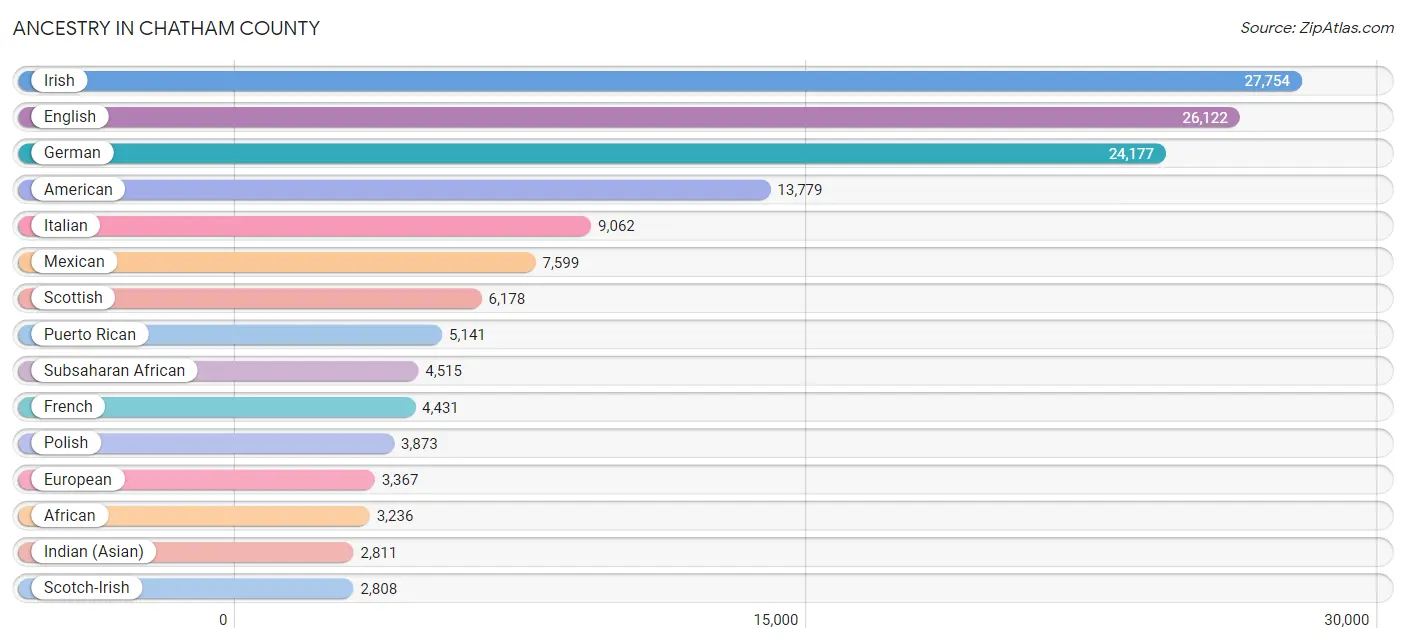
Ancestry in Chatham County
The most populous ancestries reported in Chatham County are Irish (27,754 | 9.4%), English (26,122 | 8.8%), German (24,177 | 8.2%), American (13,779 | 4.6%), and Italian (9,062 | 3.1%), together accounting for 34.1% of all Chatham County residents.
| Ancestry | # Population | % Population |
| African | 3,236 | 1.1% |
| Alsatian | 12 | 0.0% |
| American | 13,779 | 4.6% |
| Apache | 70 | 0.0% |
| Arab | 1,065 | 0.4% |
| Argentinean | 223 | 0.1% |
| Armenian | 72 | 0.0% |
| Australian | 68 | 0.0% |
| Austrian | 493 | 0.2% |
| Bahamian | 172 | 0.1% |
| Bangladeshi | 21 | 0.0% |
| Barbadian | 155 | 0.1% |
| Basque | 20 | 0.0% |
| Belgian | 92 | 0.0% |
| Belizean | 174 | 0.1% |
| Bhutanese | 544 | 0.2% |
| Blackfeet | 51 | 0.0% |
| Bolivian | 22 | 0.0% |
| Brazilian | 230 | 0.1% |
| British | 1,666 | 0.6% |
| British West Indian | 95 | 0.0% |
| Bulgarian | 22 | 0.0% |
| Burmese | 1,045 | 0.4% |
| Cajun | 56 | 0.0% |
| Canadian | 438 | 0.2% |
| Cape Verdean | 27 | 0.0% |
| Celtic | 11 | 0.0% |
| Central American | 2,791 | 0.9% |
| Central American Indian | 219 | 0.1% |
| Cherokee | 651 | 0.2% |
| Cheyenne | 22 | 0.0% |
| Chickasaw | 14 | 0.0% |
| Chilean | 23 | 0.0% |
| Chippewa | 65 | 0.0% |
| Choctaw | 66 | 0.0% |
| Colombian | 413 | 0.1% |
| Costa Rican | 22 | 0.0% |
| Cree | 4 | 0.0% |
| Creek | 30 | 0.0% |
| Croatian | 175 | 0.1% |
| Crow | 6 | 0.0% |
| Cuban | 1,380 | 0.5% |
| Cypriot | 10 | 0.0% |
| Czech | 536 | 0.2% |
| Czechoslovakian | 144 | 0.1% |
| Danish | 450 | 0.2% |
| Dominican | 389 | 0.1% |
| Dutch | 1,767 | 0.6% |
| Eastern European | 690 | 0.2% |
| Ecuadorian | 69 | 0.0% |
| Egyptian | 100 | 0.0% |
| English | 26,122 | 8.8% |
| Estonian | 27 | 0.0% |
| Ethiopian | 20 | 0.0% |
| European | 3,367 | 1.1% |
| Filipino | 46 | 0.0% |
| Finnish | 447 | 0.2% |
| French | 4,431 | 1.5% |
| French Canadian | 1,206 | 0.4% |
| German | 24,177 | 8.2% |
| German Russian | 138 | 0.1% |
| Ghanaian | 69 | 0.0% |
| Greek | 635 | 0.2% |
| Guamanian / Chamorro | 83 | 0.0% |
| Guatemalan | 789 | 0.3% |
| Guyanese | 224 | 0.1% |
| Haitian | 500 | 0.2% |
| Honduran | 1,215 | 0.4% |
| Hungarian | 911 | 0.3% |
| Indian (Asian) | 2,811 | 0.9% |
| Indonesian | 146 | 0.1% |
| Inupiat | 3 | 0.0% |
| Iranian | 308 | 0.1% |
| Irish | 27,754 | 9.4% |
| Iroquois | 34 | 0.0% |
| Israeli | 39 | 0.0% |
| Italian | 9,062 | 3.1% |
| Jamaican | 1,451 | 0.5% |
| Japanese | 78 | 0.0% |
| Kenyan | 65 | 0.0% |
| Korean | 1,867 | 0.6% |
| Laotian | 73 | 0.0% |
| Latvian | 112 | 0.0% |
| Lebanese | 665 | 0.2% |
| Liberian | 25 | 0.0% |
| Lithuanian | 751 | 0.3% |
| Macedonian | 2 | 0.0% |
| Malaysian | 313 | 0.1% |
| Maltese | 32 | 0.0% |
| Menominee | 8 | 0.0% |
| Mexican | 7,599 | 2.6% |
| Mexican American Indian | 40 | 0.0% |
| Mongolian | 55 | 0.0% |
| Moroccan | 23 | 0.0% |
| Native Hawaiian | 108 | 0.0% |
| Navajo | 75 | 0.0% |
| Nicaraguan | 155 | 0.1% |
| Nigerian | 514 | 0.2% |
| Northern European | 269 | 0.1% |
| Norwegian | 685 | 0.2% |
| Pakistani | 407 | 0.1% |
| Palestinian | 39 | 0.0% |
| Panamanian | 405 | 0.1% |
| Pennsylvania German | 31 | 0.0% |
| Peruvian | 97 | 0.0% |
| Polish | 3,873 | 1.3% |
| Portuguese | 622 | 0.2% |
| Potawatomi | 47 | 0.0% |
| Pueblo | 9 | 0.0% |
| Puerto Rican | 5,141 | 1.7% |
| Puget Sound Salish | 1 | 0.0% |
| Romanian | 133 | 0.0% |
| Russian | 1,236 | 0.4% |
| Salvadoran | 205 | 0.1% |
| Samoan | 65 | 0.0% |
| Scandinavian | 844 | 0.3% |
| Scotch-Irish | 2,808 | 0.9% |
| Scottish | 6,178 | 2.1% |
| Serbian | 46 | 0.0% |
| Sioux | 14 | 0.0% |
| Slavic | 130 | 0.0% |
| Slovak | 121 | 0.0% |
| Slovene | 57 | 0.0% |
| Somali | 336 | 0.1% |
| South African | 78 | 0.0% |
| South American | 1,127 | 0.4% |
| South American Indian | 22 | 0.0% |
| Spaniard | 456 | 0.2% |
| Spanish | 462 | 0.2% |
| Sri Lankan | 2,216 | 0.7% |
| Subsaharan African | 4,515 | 1.5% |
| Sudanese | 6 | 0.0% |
| Swedish | 1,550 | 0.5% |
| Swiss | 517 | 0.2% |
| Syrian | 26 | 0.0% |
| Thai | 1,777 | 0.6% |
| Tongan | 10 | 0.0% |
| Trinidadian and Tobagonian | 73 | 0.0% |
| Turkish | 58 | 0.0% |
| U.S. Virgin Islander | 32 | 0.0% |
| Ugandan | 17 | 0.0% |
| Ukrainian | 459 | 0.2% |
| Uruguayan | 7 | 0.0% |
| Venezuelan | 250 | 0.1% |
| Vietnamese | 4 | 0.0% |
| Welsh | 1,554 | 0.5% |
| West Indian | 435 | 0.2% |
| Yugoslavian | 40 | 0.0% |
| Zimbabwean | 44 | 0.0% | View All 149 Rows |
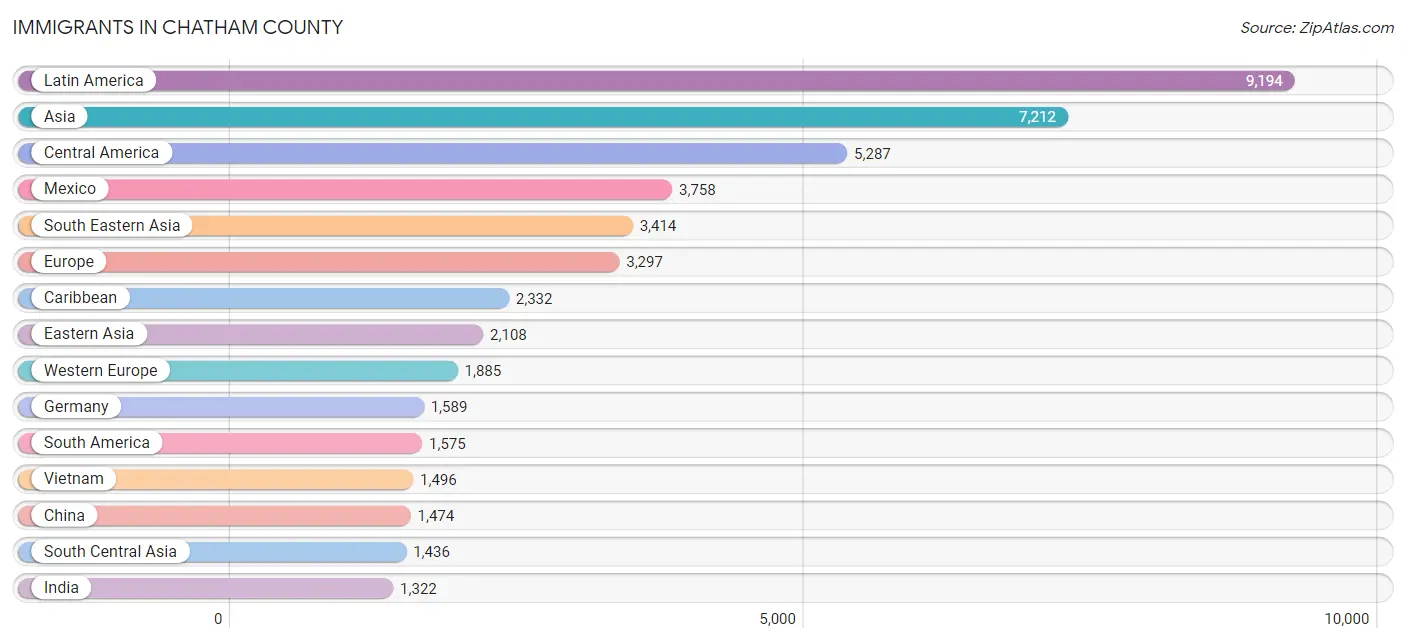
Immigrants in Chatham County
The most numerous immigrant groups reported in Chatham County came from Latin America (9,194 | 3.1%), Asia (7,212 | 2.4%), Central America (5,287 | 1.8%), Mexico (3,758 | 1.3%), and South Eastern Asia (3,414 | 1.1%), together accounting for 9.7% of all Chatham County residents.
| Immigration Origin | # Population | % Population |
| Africa | 1,175 | 0.4% |
| Argentina | 43 | 0.0% |
| Asia | 7,212 | 2.4% |
| Australia | 40 | 0.0% |
| Austria | 73 | 0.0% |
| Azores | 2 | 0.0% |
| Bahamas | 119 | 0.0% |
| Bangladesh | 4 | 0.0% |
| Barbados | 62 | 0.0% |
| Belarus | 51 | 0.0% |
| Belgium | 50 | 0.0% |
| Belize | 14 | 0.0% |
| Bolivia | 11 | 0.0% |
| Brazil | 420 | 0.1% |
| Bulgaria | 9 | 0.0% |
| Cambodia | 88 | 0.0% |
| Cameroon | 19 | 0.0% |
| Canada | 639 | 0.2% |
| Caribbean | 2,332 | 0.8% |
| Central America | 5,287 | 1.8% |
| Chile | 10 | 0.0% |
| China | 1,474 | 0.5% |
| Colombia | 279 | 0.1% |
| Congo | 15 | 0.0% |
| Costa Rica | 18 | 0.0% |
| Croatia | 53 | 0.0% |
| Cuba | 469 | 0.2% |
| Denmark | 15 | 0.0% |
| Dominica | 19 | 0.0% |
| Dominican Republic | 63 | 0.0% |
| Eastern Africa | 535 | 0.2% |
| Eastern Asia | 2,108 | 0.7% |
| Eastern Europe | 369 | 0.1% |
| Ecuador | 33 | 0.0% |
| Egypt | 44 | 0.0% |
| El Salvador | 97 | 0.0% |
| England | 329 | 0.1% |
| Ethiopia | 21 | 0.0% |
| Europe | 3,297 | 1.1% |
| France | 108 | 0.0% |
| Germany | 1,589 | 0.5% |
| Ghana | 159 | 0.1% |
| Greece | 15 | 0.0% |
| Grenada | 17 | 0.0% |
| Guatemala | 389 | 0.1% |
| Guyana | 339 | 0.1% |
| Haiti | 207 | 0.1% |
| Honduras | 713 | 0.2% |
| Hong Kong | 130 | 0.0% |
| India | 1,322 | 0.4% |
| Indonesia | 115 | 0.0% |
| Iran | 32 | 0.0% |
| Ireland | 168 | 0.1% |
| Israel | 44 | 0.0% |
| Italy | 60 | 0.0% |
| Jamaica | 1,074 | 0.4% |
| Japan | 64 | 0.0% |
| Kenya | 243 | 0.1% |
| Korea | 570 | 0.2% |
| Laos | 250 | 0.1% |
| Latin America | 9,194 | 3.1% |
| Lebanon | 34 | 0.0% |
| Liberia | 24 | 0.0% |
| Lithuania | 19 | 0.0% |
| Malaysia | 84 | 0.0% |
| Mexico | 3,758 | 1.3% |
| Micronesia | 265 | 0.1% |
| Middle Africa | 70 | 0.0% |
| Morocco | 28 | 0.0% |
| Nepal | 64 | 0.0% |
| Netherlands | 51 | 0.0% |
| Nicaragua | 66 | 0.0% |
| Nigeria | 56 | 0.0% |
| Northern Africa | 130 | 0.0% |
| Northern Europe | 966 | 0.3% |
| Norway | 12 | 0.0% |
| Oceania | 317 | 0.1% |
| Pakistan | 10 | 0.0% |
| Panama | 176 | 0.1% |
| Peru | 74 | 0.0% |
| Philippines | 1,075 | 0.4% |
| Portugal | 2 | 0.0% |
| Romania | 91 | 0.0% |
| Russia | 103 | 0.0% |
| Saudi Arabia | 83 | 0.0% |
| Scotland | 131 | 0.0% |
| Senegal | 10 | 0.0% |
| Somalia | 140 | 0.1% |
| South Africa | 114 | 0.0% |
| South America | 1,575 | 0.5% |
| South Central Asia | 1,436 | 0.5% |
| South Eastern Asia | 3,414 | 1.1% |
| Southern Europe | 77 | 0.0% |
| Sri Lanka | 4 | 0.0% |
| Sweden | 48 | 0.0% |
| Switzerland | 14 | 0.0% |
| Syria | 26 | 0.0% |
| Taiwan | 172 | 0.1% |
| Thailand | 230 | 0.1% |
| Trinidad and Tobago | 168 | 0.1% |
| Turkey | 26 | 0.0% |
| Uganda | 34 | 0.0% |
| Ukraine | 6 | 0.0% |
| Uruguay | 73 | 0.0% |
| Venezuela | 293 | 0.1% |
| Vietnam | 1,496 | 0.5% |
| West Indies | 31 | 0.0% |
| Western Africa | 301 | 0.1% |
| Western Asia | 254 | 0.1% |
| Western Europe | 1,885 | 0.6% |
| Yemen | 20 | 0.0% |
| Zaire | 32 | 0.0% |
| Zimbabwe | 87 | 0.0% | View All 113 Rows |
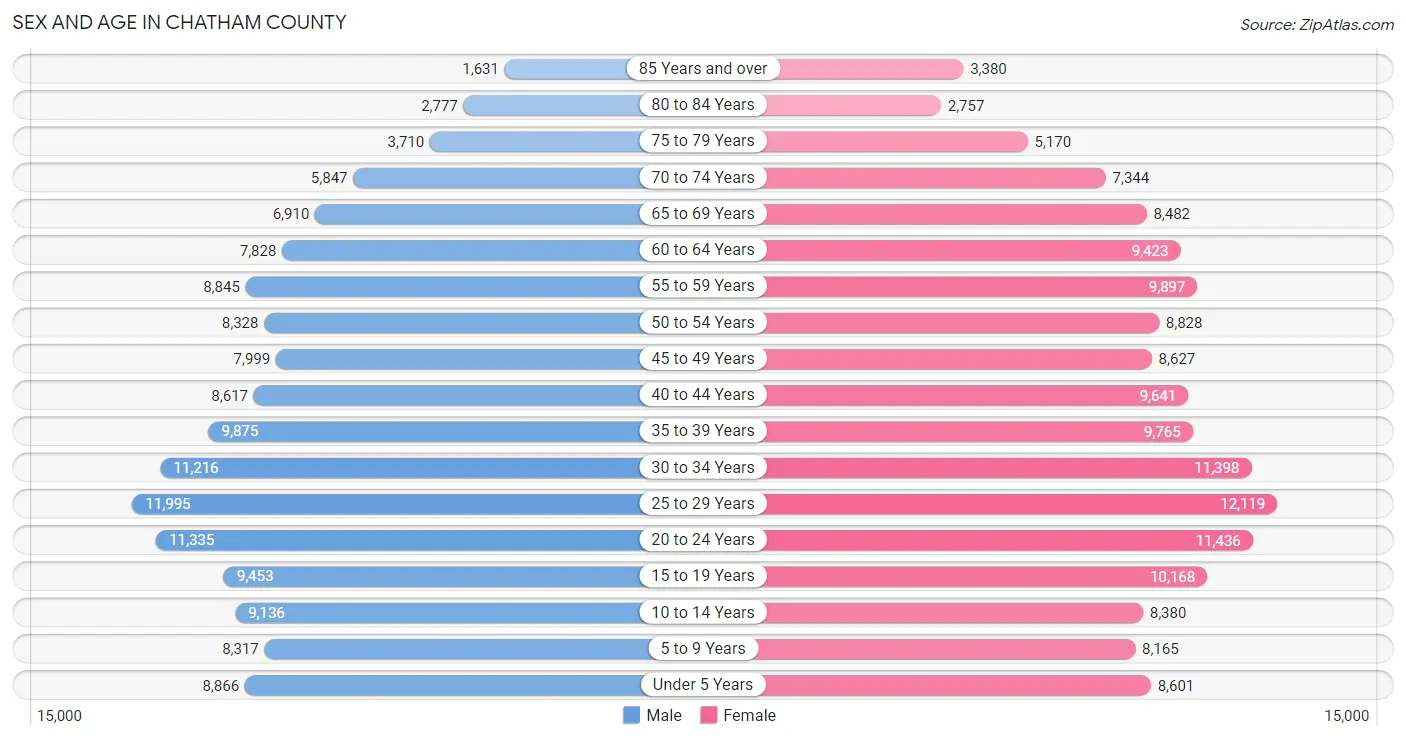
Sex and Age in Chatham County
Sex and Age in Chatham County
The most populous age groups in Chatham County are 25 to 29 Years (11,995 | 8.4%) for men and 25 to 29 Years (12,119 | 7.9%) for women.
| Age Bracket | Male | Female |
| Under 5 Years | 8,866 (6.2%) | 8,601 (5.6%) |
| 5 to 9 Years | 8,317 (5.8%) | 8,165 (5.3%) |
| 10 to 14 Years | 9,136 (6.4%) | 8,380 (5.5%) |
| 15 to 19 Years | 9,453 (6.6%) | 10,168 (6.6%) |
| 20 to 24 Years | 11,335 (7.9%) | 11,436 (7.4%) |
| 25 to 29 Years | 11,995 (8.4%) | 12,119 (7.9%) |
| 30 to 34 Years | 11,216 (7.9%) | 11,398 (7.4%) |
| 35 to 39 Years | 9,875 (6.9%) | 9,765 (6.4%) |
| 40 to 44 Years | 8,617 (6.0%) | 9,641 (6.3%) |
| 45 to 49 Years | 7,999 (5.6%) | 8,627 (5.6%) |
| 50 to 54 Years | 8,328 (5.8%) | 8,828 (5.8%) |
| 55 to 59 Years | 8,845 (6.2%) | 9,897 (6.4%) |
| 60 to 64 Years | 7,828 (5.5%) | 9,423 (6.1%) |
| 65 to 69 Years | 6,910 (4.8%) | 8,482 (5.5%) |
| 70 to 74 Years | 5,847 (4.1%) | 7,344 (4.8%) |
| 75 to 79 Years | 3,710 (2.6%) | 5,170 (3.4%) |
| 80 to 84 Years | 2,777 (1.9%) | 2,757 (1.8%) |
| 85 Years and over | 1,631 (1.1%) | 3,380 (2.2%) |
| Total | 142,685 (100.0%) | 153,581 (100.0%) |
Families and Households in Chatham County
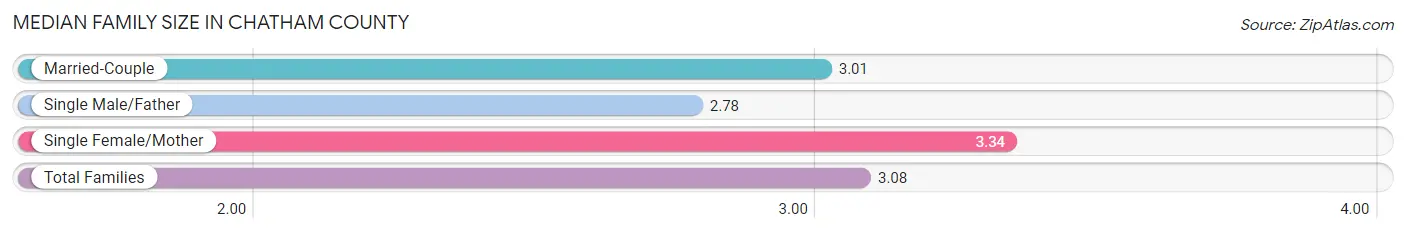
Median Family Size in Chatham County
The median family size in Chatham County is 3.08 persons per family, with single female/mother families (18,858 | 26.6%) accounting for the largest median family size of 3.34 persons per family. On the other hand, single male/father families (4,588 | 6.5%) represent the smallest median family size with 2.78 persons per family.
| Family Type | # Families | Family Size |
| Married-Couple | 47,412 (66.9%) | 3.01 |
| Single Male/Father | 4,588 (6.5%) | 2.78 |
| Single Female/Mother | 18,858 (26.6%) | 3.34 |
| Total Families | 70,858 (100.0%) | 3.08 |
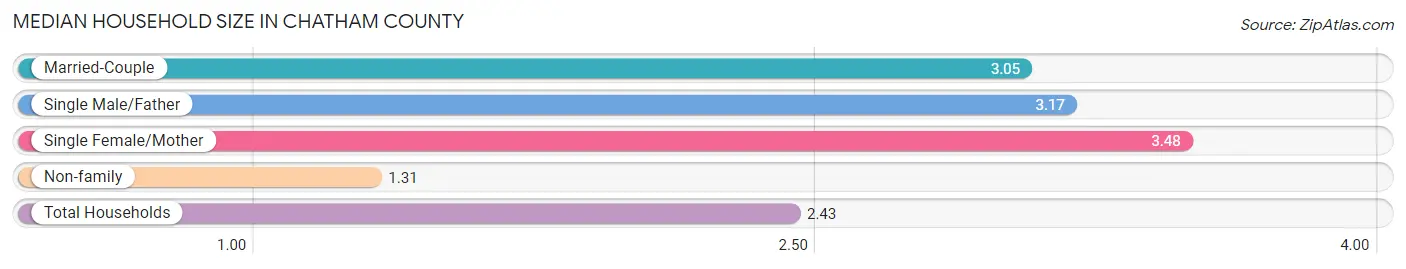
Median Household Size in Chatham County
The median household size in Chatham County is 2.43 persons per household, with single female/mother households (18,858 | 16.1%) accounting for the largest median household size of 3.48 persons per household. non-family households (46,525 | 39.6%) represent the smallest median household size with 1.31 persons per household.
| Household Type | # Households | Household Size |
| Married-Couple | 47,412 (40.4%) | 3.05 |
| Single Male/Father | 4,588 (3.9%) | 3.17 |
| Single Female/Mother | 18,858 (16.1%) | 3.48 |
| Non-family | 46,525 (39.6%) | 1.31 |
| Total Households | 117,383 (100.0%) | 2.43 |
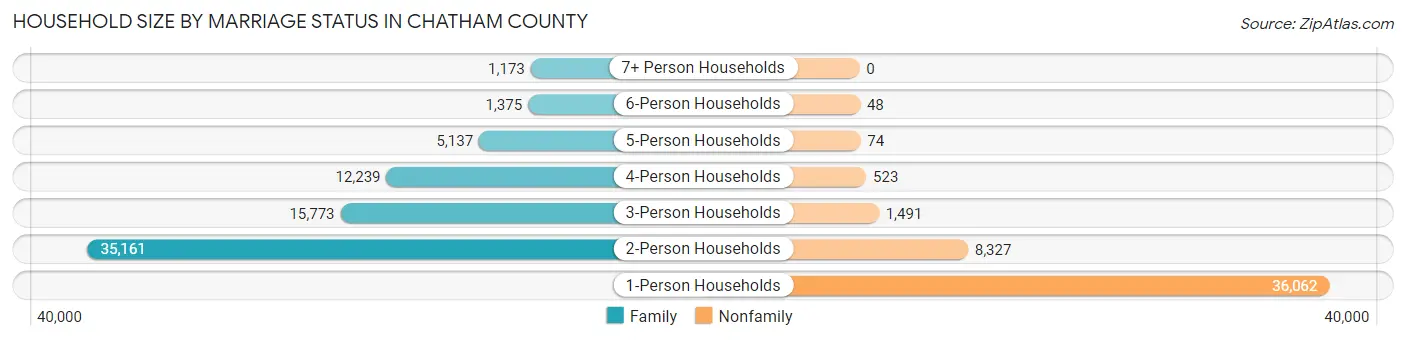
Household Size by Marriage Status in Chatham County
Out of a total of 117,383 households in Chatham County, 70,858 (60.4%) are family households, while 46,525 (39.6%) are nonfamily households. The most numerous type of family households are 2-person households, comprising 35,161, and the most common type of nonfamily households are 1-person households, comprising 36,062.
| Household Size | Family Households | Nonfamily Households |
| 1-Person Households | - | 36,062 (30.7%) |
| 2-Person Households | 35,161 (29.9%) | 8,327 (7.1%) |
| 3-Person Households | 15,773 (13.4%) | 1,491 (1.3%) |
| 4-Person Households | 12,239 (10.4%) | 523 (0.4%) |
| 5-Person Households | 5,137 (4.4%) | 74 (0.1%) |
| 6-Person Households | 1,375 (1.2%) | 48 (0.0%) |
| 7+ Person Households | 1,173 (1.0%) | 0 (0.0%) |
| Total | 70,858 (60.4%) | 46,525 (39.6%) |
Female Fertility in Chatham County
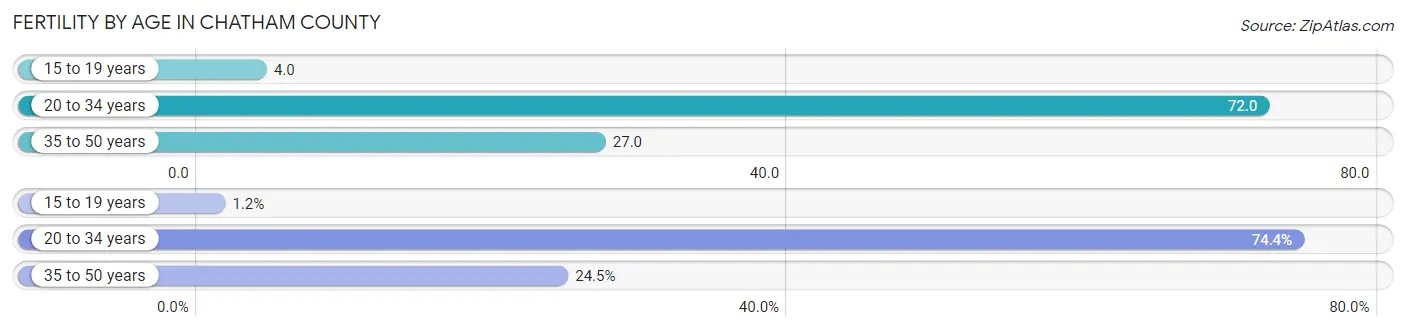
Fertility by Age in Chatham County
Average fertility rate in Chatham County is 45.0 births per 1,000 women. Women in the age bracket of 20 to 34 years have the highest fertility rate with 72.0 births per 1,000 women. Women in the age bracket of 20 to 34 years acount for 74.4% of all women with births.
| Age Bracket | Women with Births | Births / 1,000 Women |
| 15 to 19 years | 40 (1.2%) | 4.0 |
| 20 to 34 years | 2,518 (74.4%) | 72.0 |
| 35 to 50 years | 828 (24.4%) | 27.0 |
| Total | 3,386 (100.0%) | 45.0 |
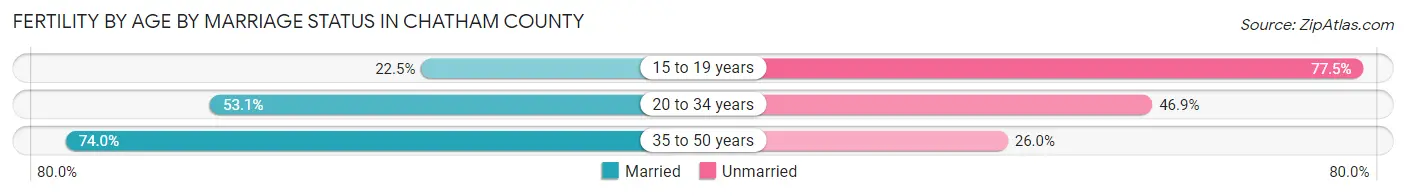
Fertility by Age by Marriage Status in Chatham County
57.9% of women with births (3,386) in Chatham County are married. The highest percentage of unmarried women with births falls into 15 to 19 years age bracket with 77.5% of them unmarried at the time of birth, while the lowest percentage of unmarried women with births belong to 35 to 50 years age bracket with 26.0% of them unmarried.
| Age Bracket | Married | Unmarried |
| 15 to 19 years | 9 (22.5%) | 31 (77.5%) |
| 20 to 34 years | 1,337 (53.1%) | 1,181 (46.9%) |
| 35 to 50 years | 613 (74.0%) | 215 (26.0%) |
| Total | 1,960 (57.9%) | 1,426 (42.1%) |
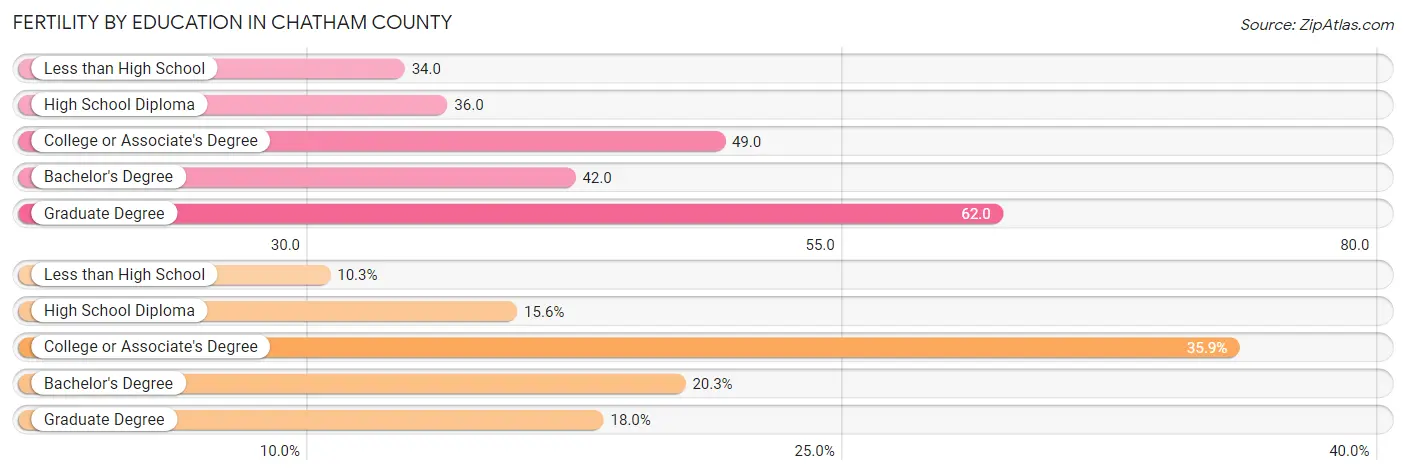
Fertility by Education in Chatham County
Average fertility rate in Chatham County is 45.0 births per 1,000 women. Women with the education attainment of graduate degree have the highest fertility rate of 62.0 births per 1,000 women, while women with the education attainment of less than high school have the lowest fertility at 34.0 births per 1,000 women. Women with the education attainment of college or associate's degree represent 35.8% of all women with births.
| Educational Attainment | Women with Births | Births / 1,000 Women |
| Less than High School | 349 (10.3%) | 34.0 |
| High School Diploma | 527 (15.6%) | 36.0 |
| College or Associate's Degree | 1,214 (35.8%) | 49.0 |
| Bachelor's Degree | 687 (20.3%) | 42.0 |
| Graduate Degree | 609 (18.0%) | 62.0 |
| Total | 3,386 (100.0%) | 45.0 |
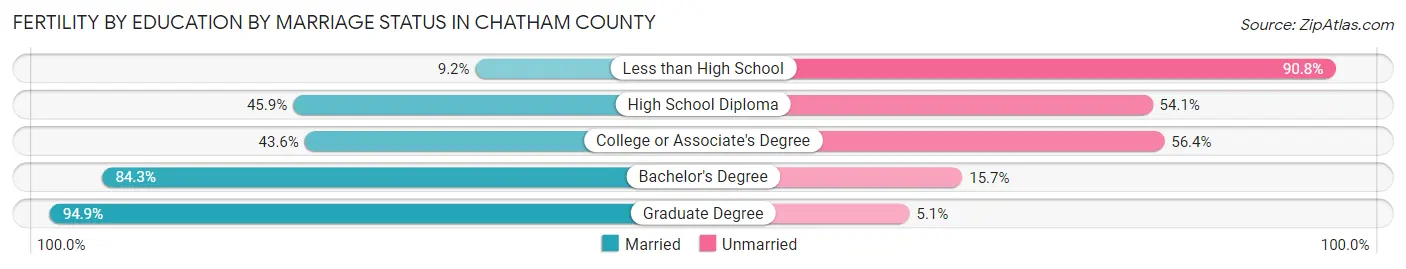
Fertility by Education by Marriage Status in Chatham County
42.1% of women with births in Chatham County are unmarried. Women with the educational attainment of graduate degree are most likely to be married with 94.9% of them married at childbirth, while women with the educational attainment of less than high school are least likely to be married with 90.8% of them unmarried at childbirth.
| Educational Attainment | Married | Unmarried |
| Less than High School | 32 (9.2%) | 317 (90.8%) |
| High School Diploma | 242 (45.9%) | 285 (54.1%) |
| College or Associate's Degree | 529 (43.6%) | 685 (56.4%) |
| Bachelor's Degree | 579 (84.3%) | 108 (15.7%) |
| Graduate Degree | 578 (94.9%) | 31 (5.1%) |
| Total | 1,960 (57.9%) | 1,426 (42.1%) |
Income in Chatham County
Income Overview in Chatham County
Per Capita Income in Chatham County is $37,637, while median incomes of families and households are $81,441 and $66,171 respectively.
| Characteristic | Number | Measure |
| Per Capita Income | 296,266 | $37,637 |
| Median Family Income | 70,858 | $81,441 |
| Mean Family Income | 70,858 | $110,229 |
| Median Household Income | 117,383 | $66,171 |
| Mean Household Income | 117,383 | $92,238 |
| Income Deficit | 70,858 | $12,048 |
| Wage / Income Gap (%) | 296,266 | 17.30% |
| Wage / Income Gap ($) | 296,266 | 82.70¢ per $1 |
| Gini / Inequality Index | 296,266 | 0.48 |
Earnings by Sex in Chatham County
Average Earnings in Chatham County are $35,235, $39,241 for men and $32,453 for women, a difference of 17.3%.
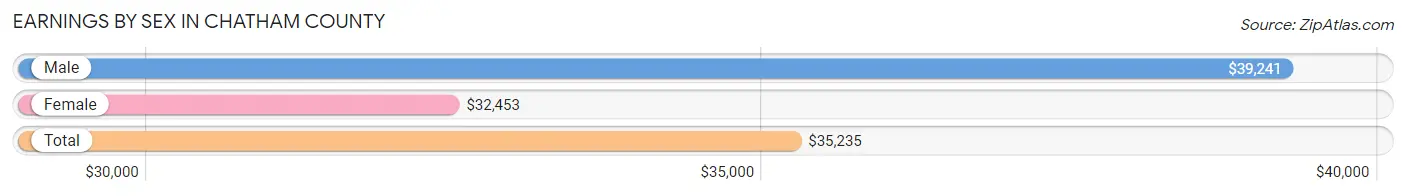
| Sex | Number | Average Earnings |
| Male | 82,150 (50.2%) | $39,241 |
| Female | 81,406 (49.8%) | $32,453 |
| Total | 163,556 (100.0%) | $35,235 |
Earnings by Sex by Income Bracket in Chatham County
The most common earnings brackets in Chatham County are $100,000+ for men (11,464 | 14.0%) and $25,000 to $29,999 for women (6,197 | 7.6%).
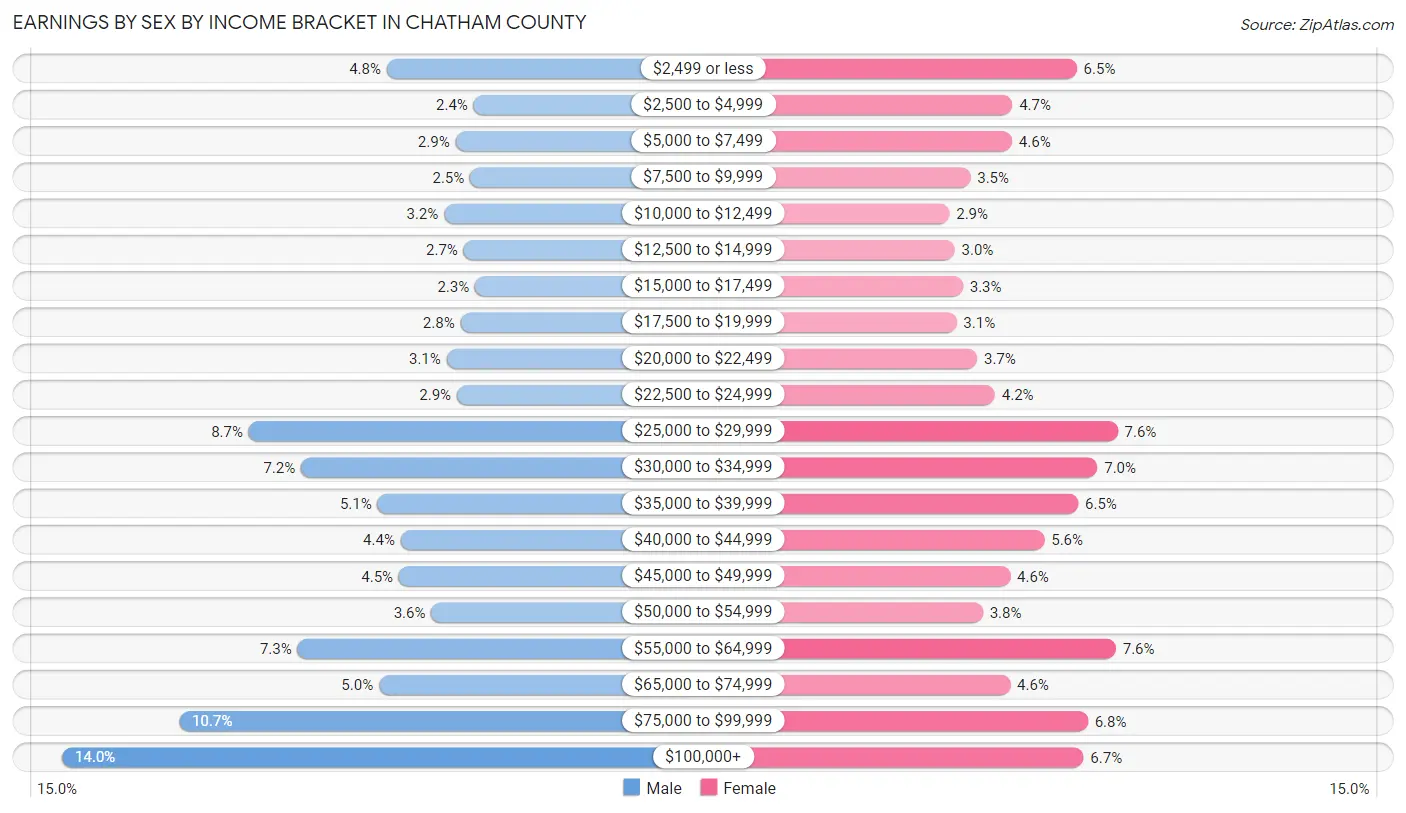
| Income | Male | Female |
| $2,499 or less | 3,961 (4.8%) | 5,257 (6.5%) |
| $2,500 to $4,999 | 1,956 (2.4%) | 3,788 (4.6%) |
| $5,000 to $7,499 | 2,372 (2.9%) | 3,778 (4.6%) |
| $7,500 to $9,999 | 2,040 (2.5%) | 2,821 (3.5%) |
| $10,000 to $12,499 | 2,634 (3.2%) | 2,345 (2.9%) |
| $12,500 to $14,999 | 2,188 (2.7%) | 2,469 (3.0%) |
| $15,000 to $17,499 | 1,920 (2.3%) | 2,656 (3.3%) |
| $17,500 to $19,999 | 2,259 (2.8%) | 2,510 (3.1%) |
| $20,000 to $22,499 | 2,578 (3.1%) | 2,979 (3.7%) |
| $22,500 to $24,999 | 2,341 (2.9%) | 3,383 (4.2%) |
| $25,000 to $29,999 | 7,144 (8.7%) | 6,197 (7.6%) |
| $30,000 to $34,999 | 5,939 (7.2%) | 5,734 (7.0%) |
| $35,000 to $39,999 | 4,173 (5.1%) | 5,294 (6.5%) |
| $40,000 to $44,999 | 3,640 (4.4%) | 4,520 (5.6%) |
| $45,000 to $49,999 | 3,683 (4.5%) | 3,740 (4.6%) |
| $50,000 to $54,999 | 2,935 (3.6%) | 3,113 (3.8%) |
| $55,000 to $64,999 | 6,022 (7.3%) | 6,158 (7.6%) |
| $65,000 to $74,999 | 4,144 (5.0%) | 3,740 (4.6%) |
| $75,000 to $99,999 | 8,757 (10.7%) | 5,508 (6.8%) |
| $100,000+ | 11,464 (14.0%) | 5,416 (6.7%) |
| Total | 82,150 (100.0%) | 81,406 (100.0%) |
Earnings by Sex by Educational Attainment in Chatham County
Average earnings in Chatham County are $46,194 for men and $37,647 for women, a difference of 18.5%. Men with an educational attainment of graduate degree enjoy the highest average annual earnings of $84,656, while those with less than high school education earn the least with $27,083. Women with an educational attainment of graduate degree earn the most with the average annual earnings of $58,599, while those with less than high school education have the smallest earnings of $25,190.
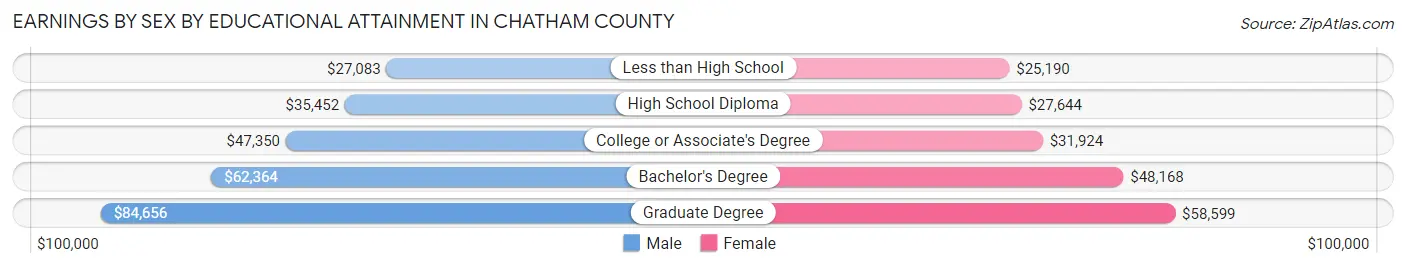
| Educational Attainment | Male Income | Female Income |
| Less than High School | $27,083 | $25,190 |
| High School Diploma | $35,452 | $27,644 |
| College or Associate's Degree | $47,350 | $31,924 |
| Bachelor's Degree | $62,364 | $48,168 |
| Graduate Degree | $84,656 | $58,599 |
| Total | $46,194 | $37,647 |
Family Income in Chatham County
Family Income Brackets in Chatham County
According to the Chatham County family income data, there are 13,888 families falling into the $100,000 to $149,999 income range, which is the most common income bracket and makes up 19.6% of all families. Conversely, the $10,000 to $14,999 income bracket is the least frequent group with only 1,417 families (2.0%) belonging to this category.
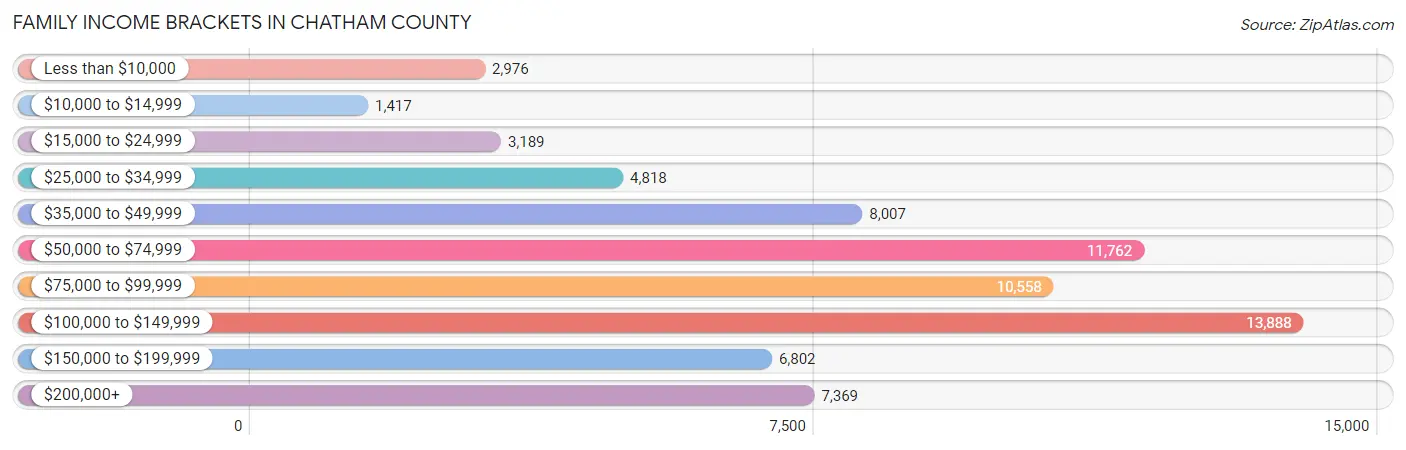
| Income Bracket | # Families | % Families |
| Less than $10,000 | 2,976 | 4.2% |
| $10,000 to $14,999 | 1,417 | 2.0% |
| $15,000 to $24,999 | 3,189 | 4.5% |
| $25,000 to $34,999 | 4,818 | 6.8% |
| $35,000 to $49,999 | 8,007 | 11.3% |
| $50,000 to $74,999 | 11,762 | 16.6% |
| $75,000 to $99,999 | 10,558 | 14.9% |
| $100,000 to $149,999 | 13,888 | 19.6% |
| $150,000 to $199,999 | 6,802 | 9.6% |
| $200,000+ | 7,369 | 10.4% |
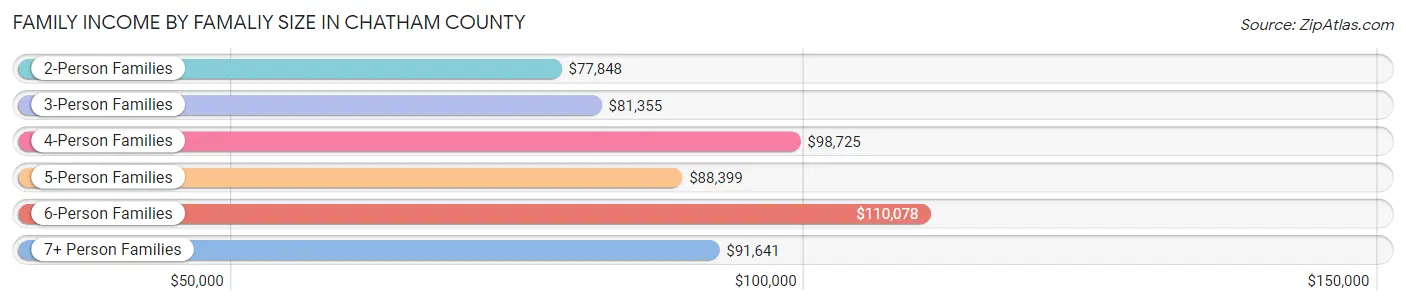
Family Income by Famaliy Size in Chatham County
6-person families (1,127 | 1.6%) account for the highest median family income in Chatham County with $110,078 per family, while 2-person families (37,430 | 52.8%) have the highest median income of $38,924 per family member.
| Income Bracket | # Families | Median Income |
| 2-Person Families | 37,430 (52.8%) | $77,848 |
| 3-Person Families | 15,055 (21.2%) | $81,355 |
| 4-Person Families | 11,344 (16.0%) | $98,725 |
| 5-Person Families | 4,913 (6.9%) | $88,399 |
| 6-Person Families | 1,127 (1.6%) | $110,078 |
| 7+ Person Families | 989 (1.4%) | $91,641 |
| Total | 70,858 (100.0%) | $81,441 |
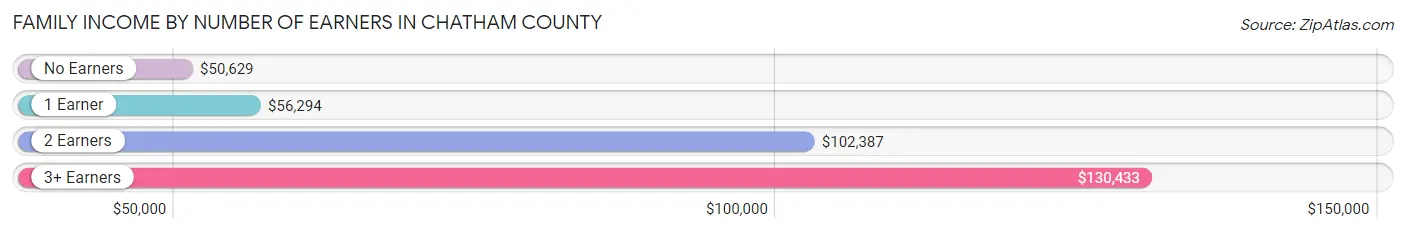
Family Income by Number of Earners in Chatham County
The median family income in Chatham County is $81,441, with families comprising 3+ earners (6,416) having the highest median family income of $130,433, while families with no earners (11,285) have the lowest median family income of $50,629, accounting for 9.0% and 15.9% of families, respectively.
| Number of Earners | # Families | Median Income |
| No Earners | 11,285 (15.9%) | $50,629 |
| 1 Earner | 23,007 (32.5%) | $56,294 |
| 2 Earners | 30,150 (42.5%) | $102,387 |
| 3+ Earners | 6,416 (9.0%) | $130,433 |
| Total | 70,858 (100.0%) | $81,441 |
Household Income in Chatham County
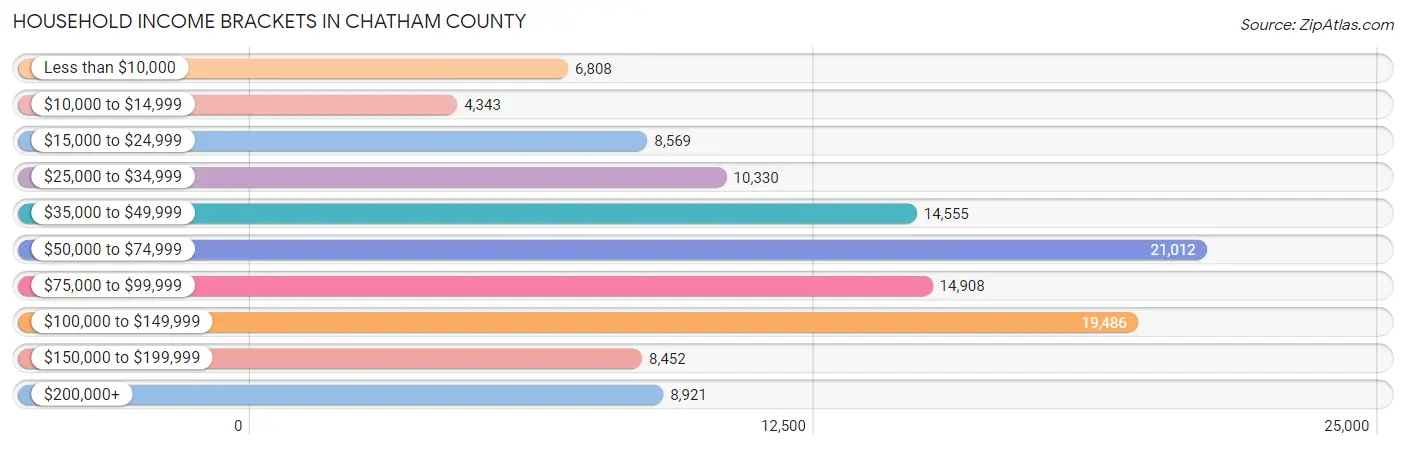
Household Income Brackets in Chatham County
With 21,012 households falling in the category, the $50,000 to $74,999 income range is the most frequent in Chatham County, accounting for 17.9% of all households. In contrast, only 4,343 households (3.7%) fall into the $10,000 to $14,999 income bracket, making it the least populous group.
| Income Bracket | # Households | % Households |
| Less than $10,000 | 6,808 | 5.8% |
| $10,000 to $14,999 | 4,343 | 3.7% |
| $15,000 to $24,999 | 8,569 | 7.3% |
| $25,000 to $34,999 | 10,330 | 8.8% |
| $35,000 to $49,999 | 14,555 | 12.4% |
| $50,000 to $74,999 | 21,012 | 17.9% |
| $75,000 to $99,999 | 14,908 | 12.7% |
| $100,000 to $149,999 | 19,486 | 16.6% |
| $150,000 to $199,999 | 8,452 | 7.2% |
| $200,000+ | 8,921 | 7.6% |
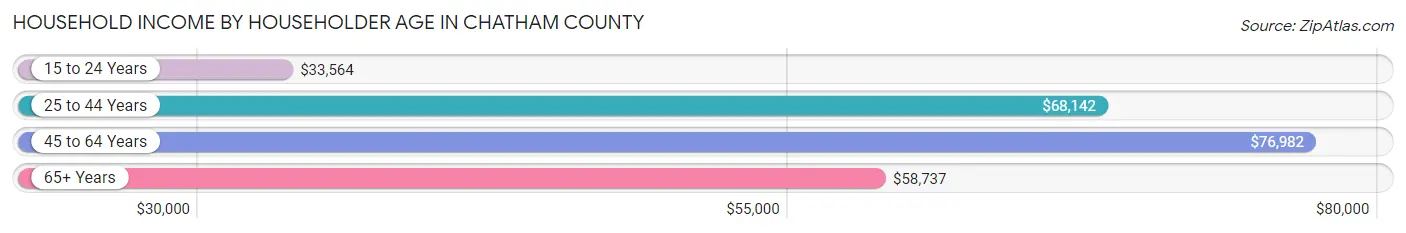
Household Income by Householder Age in Chatham County
The median household income in Chatham County is $66,171, with the highest median household income of $76,982 found in the 45 to 64 years age bracket for the primary householder. A total of 40,415 households (34.4%) fall into this category. Meanwhile, the 15 to 24 years age bracket for the primary householder has the lowest median household income of $33,564, with 6,256 households (5.3%) in this group.
| Income Bracket | # Households | Median Income |
| 15 to 24 Years | 6,256 (5.3%) | $33,564 |
| 25 to 44 Years | 40,331 (34.4%) | $68,142 |
| 45 to 64 Years | 40,415 (34.4%) | $76,982 |
| 65+ Years | 30,381 (25.9%) | $58,737 |
| Total | 117,383 (100.0%) | $66,171 |
Poverty in Chatham County
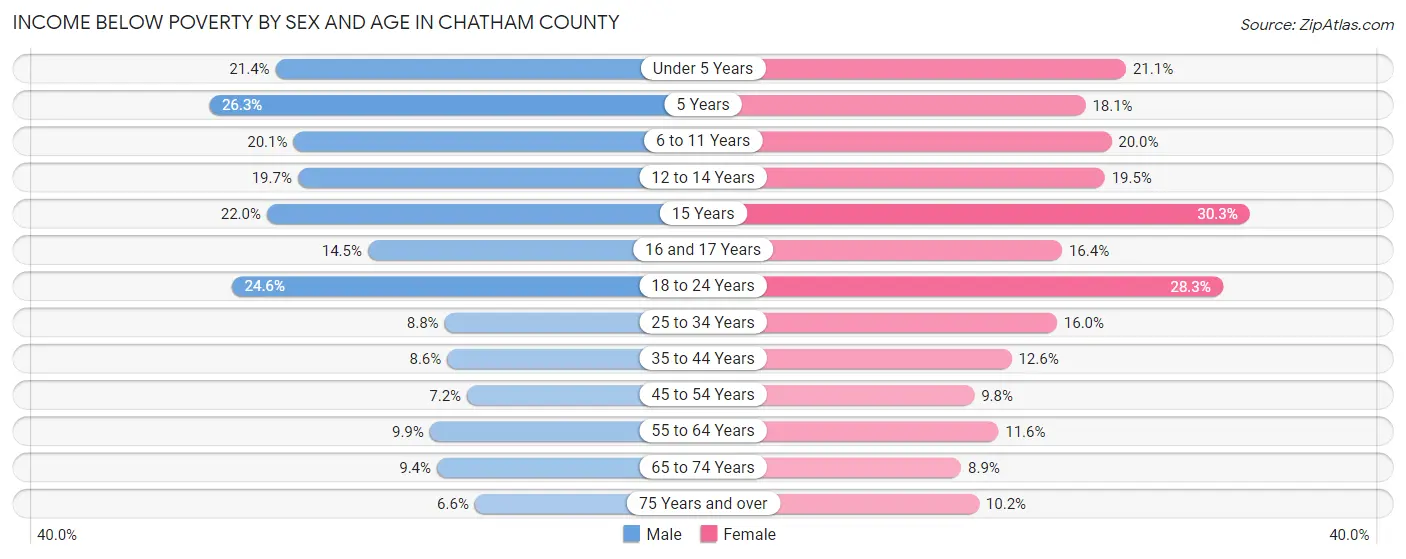
Income Below Poverty by Sex and Age in Chatham County
With 12.8% poverty level for males and 15.0% for females among the residents of Chatham County, 5 year old males and 15 year old females are the most vulnerable to poverty, with 367 males (26.3%) and 603 females (30.3%) in their respective age groups living below the poverty level.
| Age Bracket | Male | Female |
| Under 5 Years | 1,893 (21.4%) | 1,781 (21.1%) |
| 5 Years | 367 (26.3%) | 420 (18.1%) |
| 6 to 11 Years | 2,043 (20.1%) | 1,757 (20.0%) |
| 12 to 14 Years | 1,087 (19.7%) | 997 (19.5%) |
| 15 Years | 416 (22.0%) | 603 (30.3%) |
| 16 and 17 Years | 438 (14.5%) | 506 (16.4%) |
| 18 to 24 Years | 3,336 (24.6%) | 3,716 (28.3%) |
| 25 to 34 Years | 1,976 (8.8%) | 3,735 (16.0%) |
| 35 to 44 Years | 1,506 (8.6%) | 2,437 (12.6%) |
| 45 to 54 Years | 1,127 (7.2%) | 1,710 (9.8%) |
| 55 to 64 Years | 1,610 (9.9%) | 2,238 (11.6%) |
| 65 to 74 Years | 1,170 (9.4%) | 1,382 (8.9%) |
| 75 Years and over | 521 (6.6%) | 1,099 (10.2%) |
| Total | 17,490 (12.8%) | 22,381 (15.0%) |
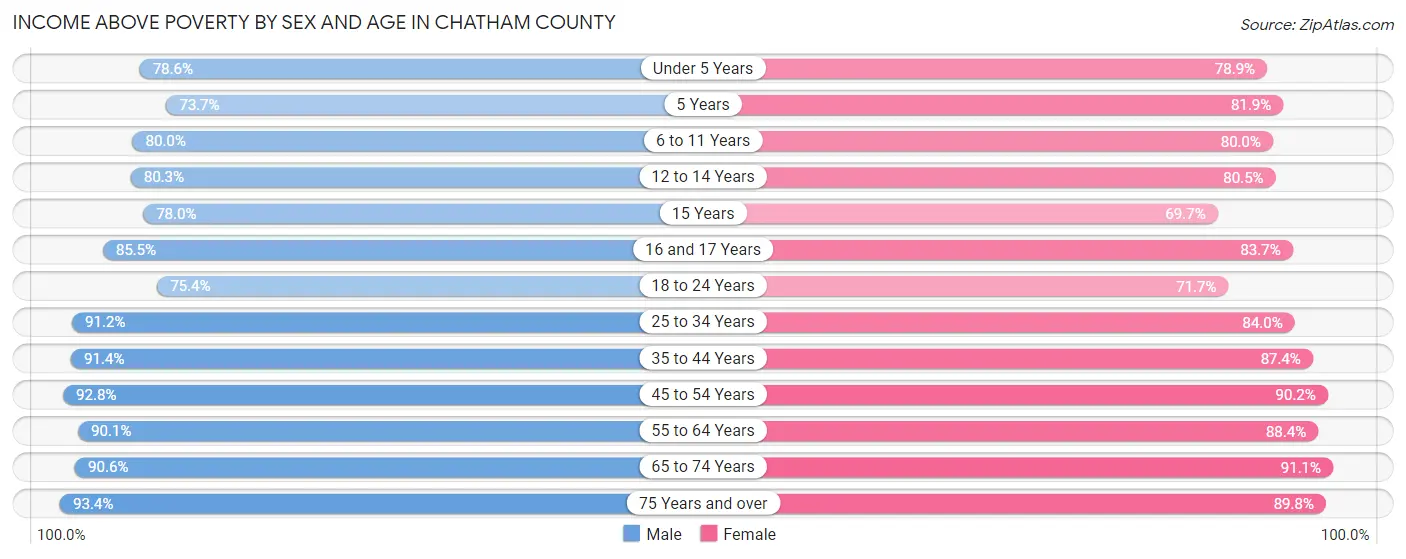
Income Above Poverty by Sex and Age in Chatham County
According to the poverty statistics in Chatham County, males aged 75 years and over and females aged 65 to 74 years are the age groups that are most secure financially, with 93.4% of males and 91.1% of females in these age groups living above the poverty line.
| Age Bracket | Male | Female |
| Under 5 Years | 6,963 (78.6%) | 6,661 (78.9%) |
| 5 Years | 1,028 (73.7%) | 1,902 (81.9%) |
| 6 to 11 Years | 8,146 (79.9%) | 7,023 (80.0%) |
| 12 to 14 Years | 4,424 (80.3%) | 4,111 (80.5%) |
| 15 Years | 1,473 (78.0%) | 1,389 (69.7%) |
| 16 and 17 Years | 2,578 (85.5%) | 2,589 (83.7%) |
| 18 to 24 Years | 10,206 (75.4%) | 9,427 (71.7%) |
| 25 to 34 Years | 20,398 (91.2%) | 19,653 (84.0%) |
| 35 to 44 Years | 15,937 (91.4%) | 16,911 (87.4%) |
| 45 to 54 Years | 14,616 (92.8%) | 15,684 (90.2%) |
| 55 to 64 Years | 14,601 (90.1%) | 17,017 (88.4%) |
| 65 to 74 Years | 11,288 (90.6%) | 14,216 (91.1%) |
| 75 Years and over | 7,402 (93.4%) | 9,699 (89.8%) |
| Total | 119,060 (87.2%) | 126,282 (85.0%) |
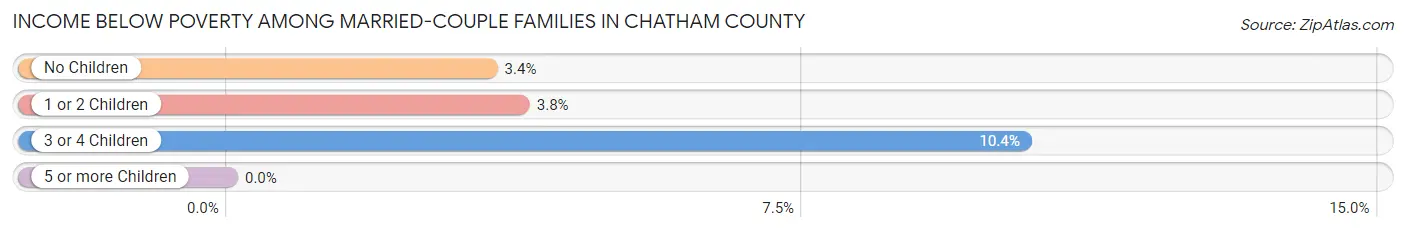
Income Below Poverty Among Married-Couple Families in Chatham County
The poverty statistics for married-couple families in Chatham County show that 3.9% or 1,828 of the total 47,412 families live below the poverty line. Families with 3 or 4 children have the highest poverty rate of 10.4%, comprising of 258 families. On the other hand, families with 5 or more children have the lowest poverty rate of 0.0%, which includes 0 families.
| Children | Above Poverty | Below Poverty |
| No Children | 29,733 (96.6%) | 1,042 (3.4%) |
| 1 or 2 Children | 13,340 (96.2%) | 528 (3.8%) |
| 3 or 4 Children | 2,233 (89.6%) | 258 (10.4%) |
| 5 or more Children | 278 (100.0%) | 0 (0.0%) |
| Total | 45,584 (96.1%) | 1,828 (3.9%) |
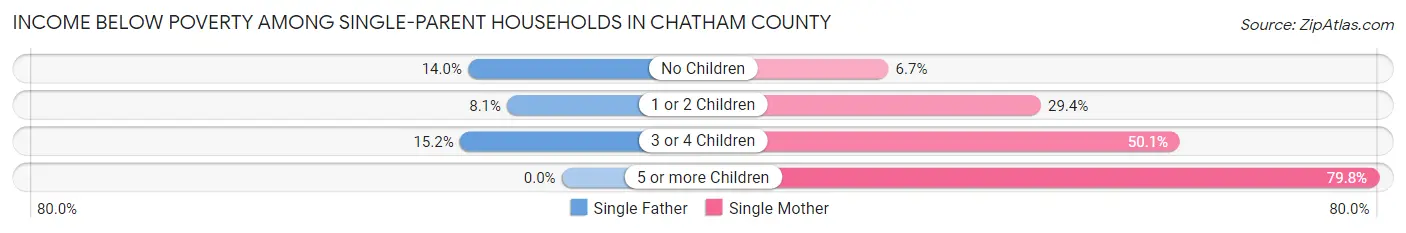
Income Below Poverty Among Single-Parent Households in Chatham County
According to the poverty data in Chatham County, 11.4% or 524 single-father households and 23.2% or 4,383 single-mother households are living below the poverty line. Among single-father households, those with 3 or 4 children have the highest poverty rate, with 26 households (15.2%) experiencing poverty. Likewise, among single-mother households, those with 5 or more children have the highest poverty rate, with 189 households (79.7%) falling below the poverty line.
| Children | Single Father | Single Mother |
| No Children | 340 (14.0%) | 500 (6.7%) |
| 1 or 2 Children | 158 (8.1%) | 2,693 (29.4%) |
| 3 or 4 Children | 26 (15.2%) | 1,001 (50.1%) |
| 5 or more Children | 0 (0.0%) | 189 (79.7%) |
| Total | 524 (11.4%) | 4,383 (23.2%) |
Income Below Poverty Among Married-Couple vs Single-Parent Households in Chatham County
The poverty data for Chatham County shows that 1,828 of the married-couple family households (3.9%) and 4,907 of the single-parent households (20.9%) are living below the poverty level. Within the married-couple family households, those with 3 or 4 children have the highest poverty rate, with 258 households (10.4%) falling below the poverty line. Among the single-parent households, those with 5 or more children have the highest poverty rate, with 189 household (67.5%) living below poverty.
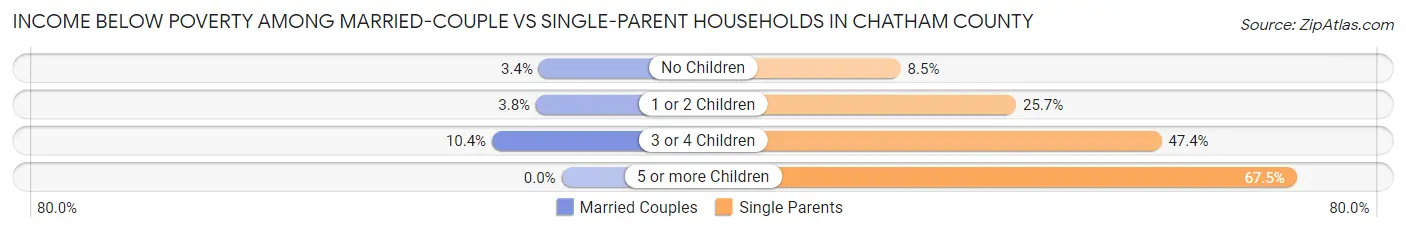
| Children | Married-Couple Families | Single-Parent Households |
| No Children | 1,042 (3.4%) | 840 (8.5%) |
| 1 or 2 Children | 528 (3.8%) | 2,851 (25.7%) |
| 3 or 4 Children | 258 (10.4%) | 1,027 (47.3%) |
| 5 or more Children | 0 (0.0%) | 189 (67.5%) |
| Total | 1,828 (3.9%) | 4,907 (20.9%) |
Employment Characteristics in Chatham County
Employment by Class of Employer in Chatham County
Among the 143,265 employed individuals in Chatham County, private company employees (93,803 | 65.5%), not-for-profit organizations (10,846 | 7.6%), and local government employees (10,753 | 7.5%) make up the most common classes of employment.
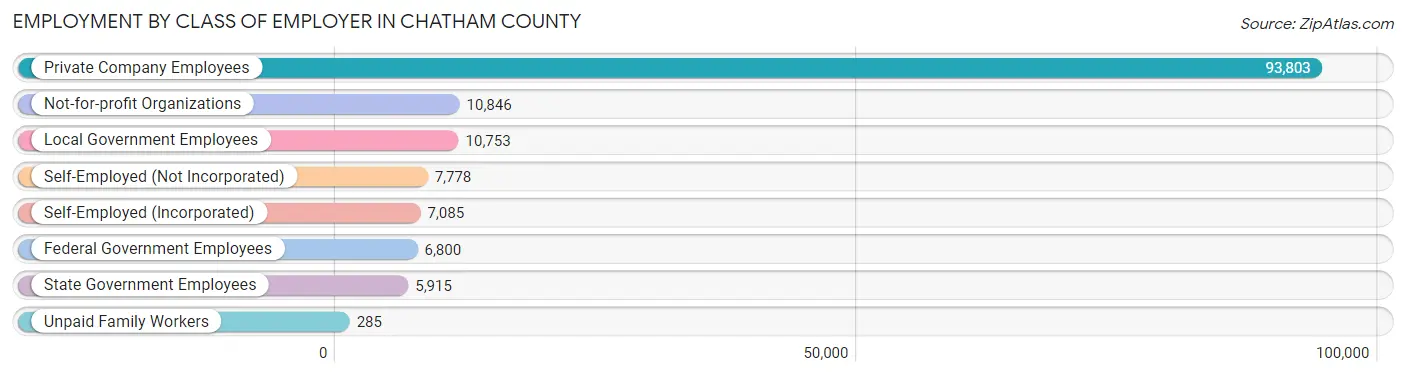
| Employer Class | # Employees | % Employees |
| Private Company Employees | 93,803 | 65.5% |
| Self-Employed (Incorporated) | 7,085 | 5.0% |
| Self-Employed (Not Incorporated) | 7,778 | 5.4% |
| Not-for-profit Organizations | 10,846 | 7.6% |
| Local Government Employees | 10,753 | 7.5% |
| State Government Employees | 5,915 | 4.1% |
| Federal Government Employees | 6,800 | 4.8% |
| Unpaid Family Workers | 285 | 0.2% |
| Total | 143,265 | 100.0% |
Employment Status by Age in Chatham County
According to the labor force statistics for Chatham County, out of the total population over 16 years of age (240,905), 64.6% or 155,625 individuals are in the labor force, with 6.3% or 9,804 of them unemployed. The age group with the highest labor force participation rate is 25 to 29 years, with 85.1% or 20,521 individuals in the labor force. Within the labor force, the 16 to 19 years age range has the highest percentage of unemployed individuals, with 20.7% or 1,432 of them being unemployed.
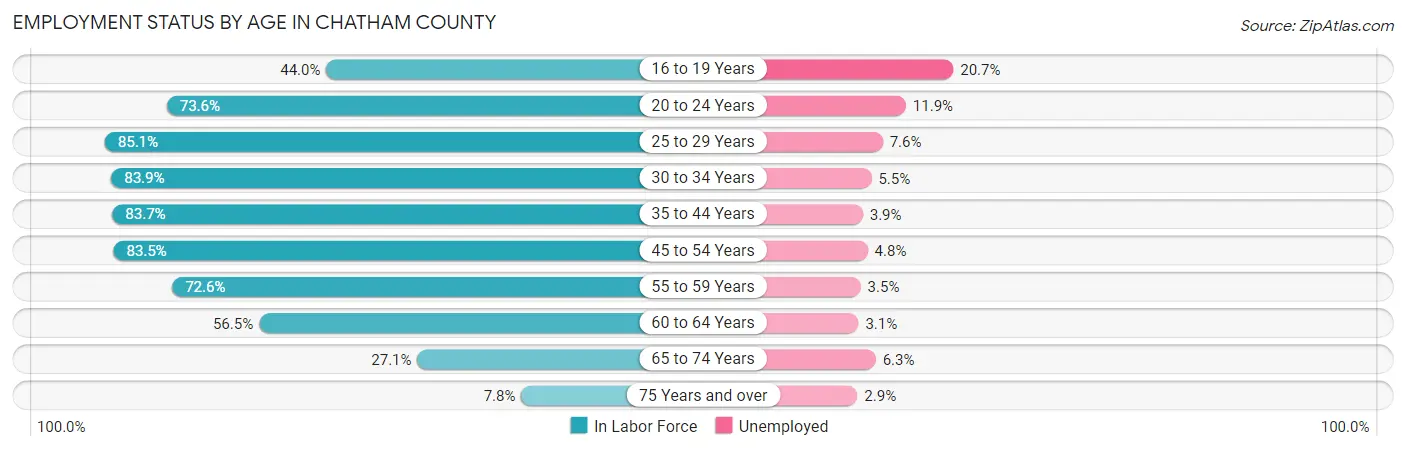
| Age Bracket | In Labor Force | Unemployed |
| 16 to 19 Years | 6,919 (44.0%) | 1,432 (20.7%) |
| 20 to 24 Years | 16,759 (73.6%) | 1,994 (11.9%) |
| 25 to 29 Years | 20,521 (85.1%) | 1,560 (7.6%) |
| 30 to 34 Years | 18,973 (83.9%) | 1,044 (5.5%) |
| 35 to 44 Years | 31,721 (83.7%) | 1,237 (3.9%) |
| 45 to 54 Years | 28,208 (83.5%) | 1,354 (4.8%) |
| 55 to 59 Years | 13,607 (72.6%) | 476 (3.5%) |
| 60 to 64 Years | 9,747 (56.5%) | 302 (3.1%) |
| 65 to 74 Years | 7,746 (27.1%) | 488 (6.3%) |
| 75 Years and over | 1,515 (7.8%) | 44 (2.9%) |
| Total | 155,625 (64.6%) | 9,804 (6.3%) |
Employment Status by Educational Attainment in Chatham County
According to labor force statistics for Chatham County, 79.5% of individuals (122,749) out of the total population between 25 and 64 years of age (154,401) are in the labor force, with 4.8% or 5,892 of them being unemployed. The group with the highest labor force participation rate are those with the educational attainment of bachelor's degree or higher, with 86.8% or 49,025 individuals in the labor force. Within the labor force, individuals with less than high school education have the highest percentage of unemployment, with 9.9% or 759 of them being unemployed.
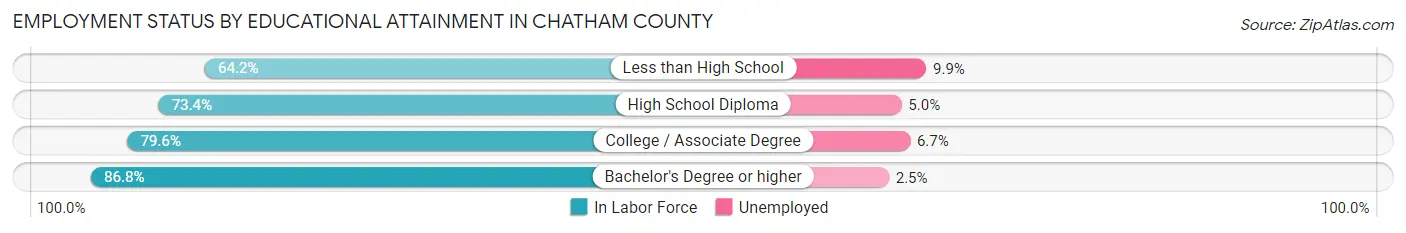
| Educational Attainment | In Labor Force | Unemployed |
| Less than High School | 7,665 (64.2%) | 1,182 (9.9%) |
| High School Diploma | 27,879 (73.4%) | 1,899 (5.0%) |
| College / Associate Degree | 38,207 (79.6%) | 3,216 (6.7%) |
| Bachelor's Degree or higher | 49,025 (86.8%) | 1,412 (2.5%) |
| Total | 122,749 (79.5%) | 7,411 (4.8%) |
Employment Occupations by Sex in Chatham County
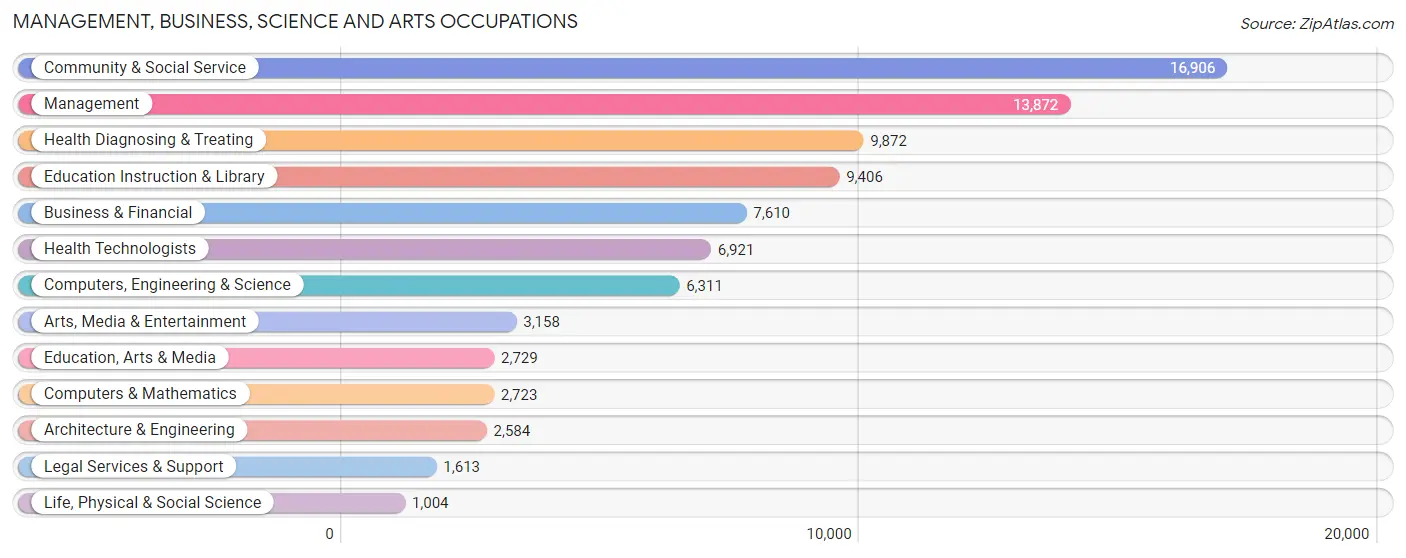
Management, Business, Science and Arts Occupations
The most common Management, Business, Science and Arts occupations in Chatham County are Community & Social Service (16,906 | 11.8%), Management (13,872 | 9.7%), Health Diagnosing & Treating (9,872 | 6.9%), Education Instruction & Library (9,406 | 6.6%), and Business & Financial (7,610 | 5.3%).
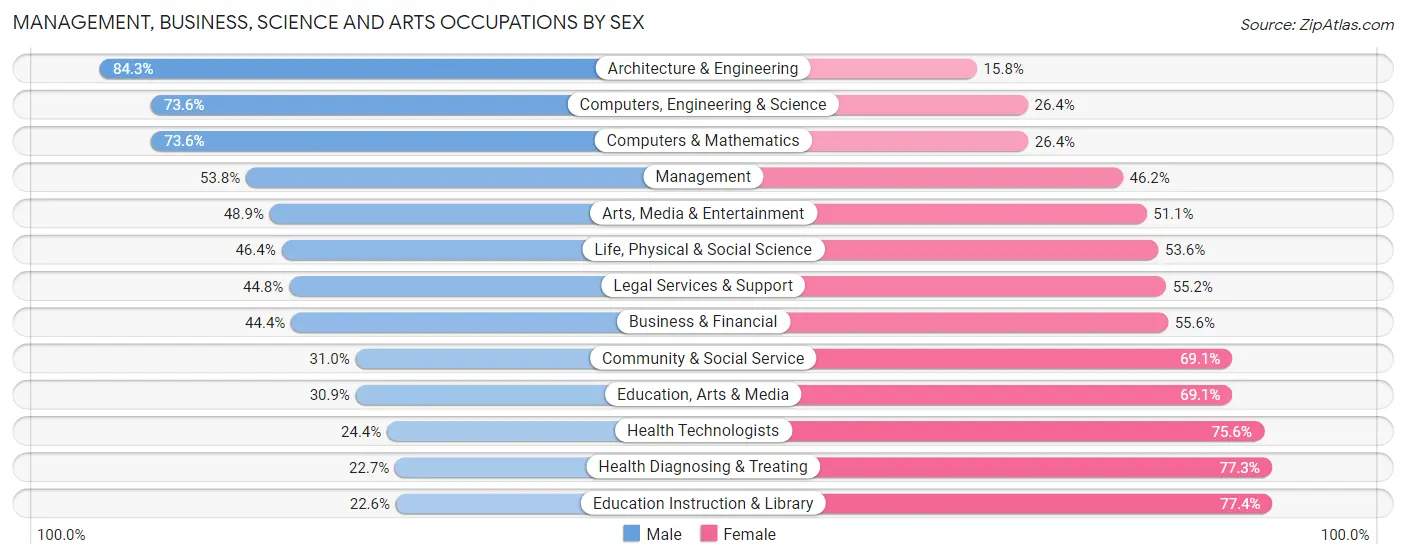
Management, Business, Science and Arts Occupations by Sex
Within the Management, Business, Science and Arts occupations in Chatham County, the most male-oriented occupations are Architecture & Engineering (84.3%), Computers, Engineering & Science (73.6%), and Computers & Mathematics (73.6%), while the most female-oriented occupations are Education Instruction & Library (77.4%), Health Diagnosing & Treating (77.3%), and Health Technologists (75.6%).
| Occupation | Male | Female |
| Management | 7,464 (53.8%) | 6,408 (46.2%) |
| Business & Financial | 3,378 (44.4%) | 4,232 (55.6%) |
| Computers, Engineering & Science | 4,646 (73.6%) | 1,665 (26.4%) |
| Computers & Mathematics | 2,003 (73.6%) | 720 (26.4%) |
| Architecture & Engineering | 2,177 (84.3%) | 407 (15.8%) |
| Life, Physical & Social Science | 466 (46.4%) | 538 (53.6%) |
| Community & Social Service | 5,232 (30.9%) | 11,674 (69.1%) |
| Education, Arts & Media | 844 (30.9%) | 1,885 (69.1%) |
| Legal Services & Support | 723 (44.8%) | 890 (55.2%) |
| Education Instruction & Library | 2,122 (22.6%) | 7,284 (77.4%) |
| Arts, Media & Entertainment | 1,543 (48.9%) | 1,615 (51.1%) |
| Health Diagnosing & Treating | 2,244 (22.7%) | 7,628 (77.3%) |
| Health Technologists | 1,687 (24.4%) | 5,234 (75.6%) |
| Total (Category) | 22,964 (42.1%) | 31,607 (57.9%) |
| Total (Overall) | 69,882 (49.0%) | 72,745 (51.0%) |
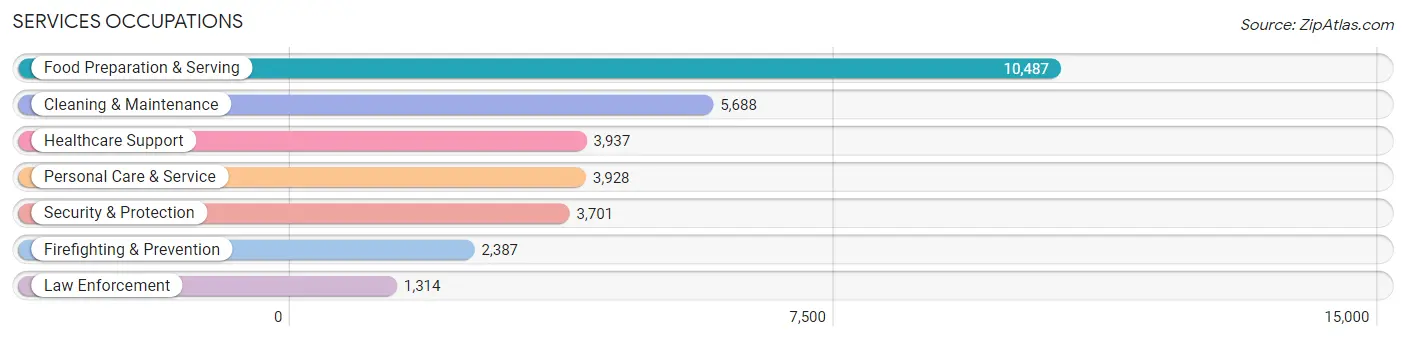
Services Occupations
The most common Services occupations in Chatham County are Food Preparation & Serving (10,487 | 7.3%), Cleaning & Maintenance (5,688 | 4.0%), Healthcare Support (3,937 | 2.8%), Personal Care & Service (3,928 | 2.8%), and Security & Protection (3,701 | 2.6%).
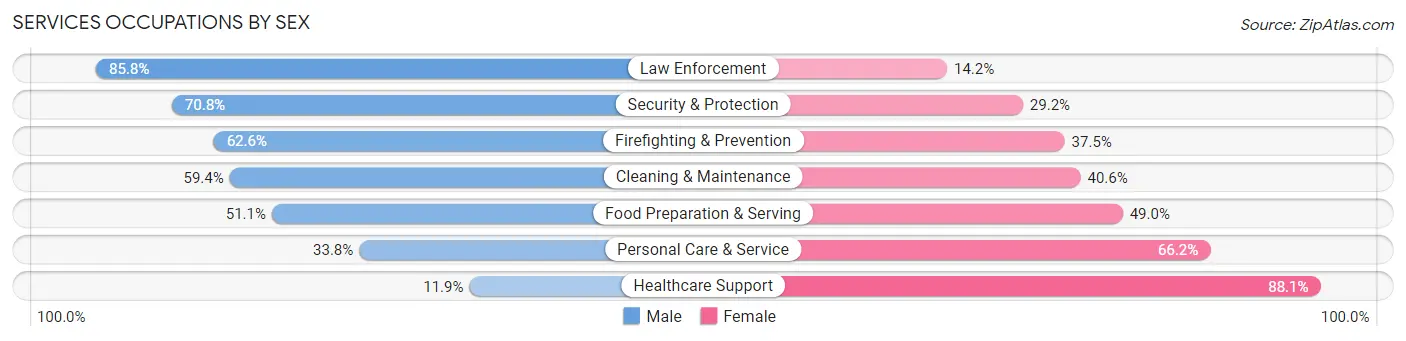
Services Occupations by Sex
Within the Services occupations in Chatham County, the most male-oriented occupations are Law Enforcement (85.8%), Security & Protection (70.8%), and Firefighting & Prevention (62.5%), while the most female-oriented occupations are Healthcare Support (88.1%), Personal Care & Service (66.2%), and Food Preparation & Serving (48.9%).
| Occupation | Male | Female |
| Healthcare Support | 470 (11.9%) | 3,467 (88.1%) |
| Security & Protection | 2,621 (70.8%) | 1,080 (29.2%) |
| Firefighting & Prevention | 1,493 (62.5%) | 894 (37.4%) |
| Law Enforcement | 1,128 (85.8%) | 186 (14.2%) |
| Food Preparation & Serving | 5,354 (51.0%) | 5,133 (48.9%) |
| Cleaning & Maintenance | 3,379 (59.4%) | 2,309 (40.6%) |
| Personal Care & Service | 1,326 (33.8%) | 2,602 (66.2%) |
| Total (Category) | 13,150 (47.4%) | 14,591 (52.6%) |
| Total (Overall) | 69,882 (49.0%) | 72,745 (51.0%) |
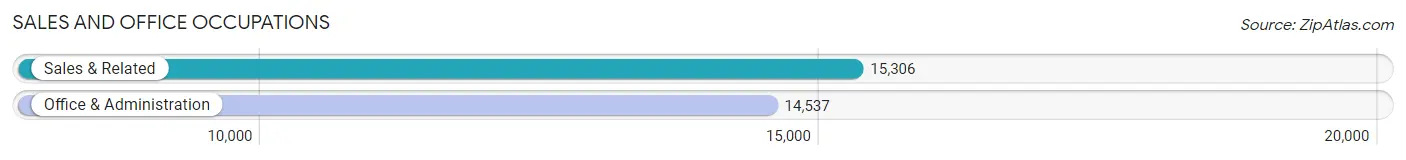
Sales and Office Occupations
The most common Sales and Office occupations in Chatham County are Sales & Related (15,306 | 10.7%), and Office & Administration (14,537 | 10.2%).
Sales and Office Occupations by Sex
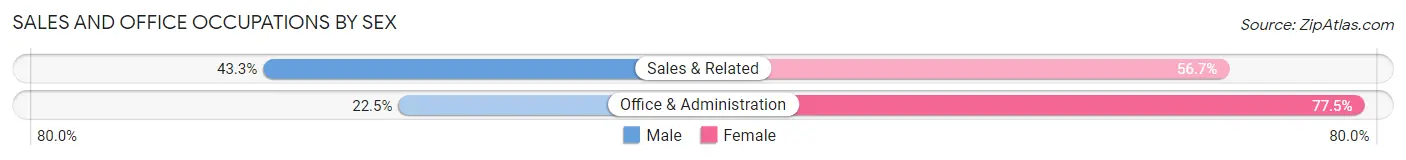
| Occupation | Male | Female |
| Sales & Related | 6,631 (43.3%) | 8,675 (56.7%) |
| Office & Administration | 3,272 (22.5%) | 11,265 (77.5%) |
| Total (Category) | 9,903 (33.2%) | 19,940 (66.8%) |
| Total (Overall) | 69,882 (49.0%) | 72,745 (51.0%) |
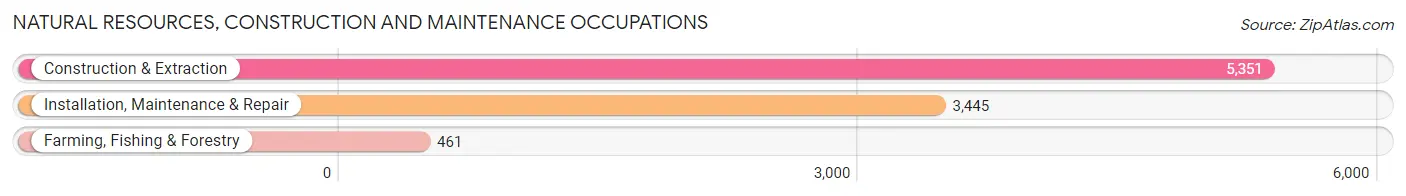
Natural Resources, Construction and Maintenance Occupations
The most common Natural Resources, Construction and Maintenance occupations in Chatham County are Construction & Extraction (5,351 | 3.7%), Installation, Maintenance & Repair (3,445 | 2.4%), and Farming, Fishing & Forestry (461 | 0.3%).
Natural Resources, Construction and Maintenance Occupations by Sex
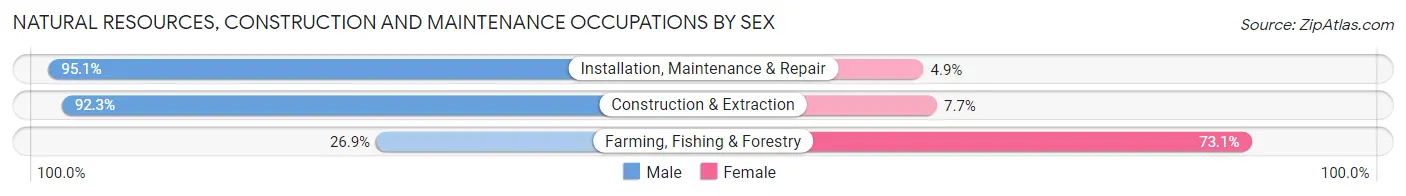
| Occupation | Male | Female |
| Farming, Fishing & Forestry | 124 (26.9%) | 337 (73.1%) |
| Construction & Extraction | 4,937 (92.3%) | 414 (7.7%) |
| Installation, Maintenance & Repair | 3,275 (95.1%) | 170 (4.9%) |
| Total (Category) | 8,336 (90.0%) | 921 (10.0%) |
| Total (Overall) | 69,882 (49.0%) | 72,745 (51.0%) |
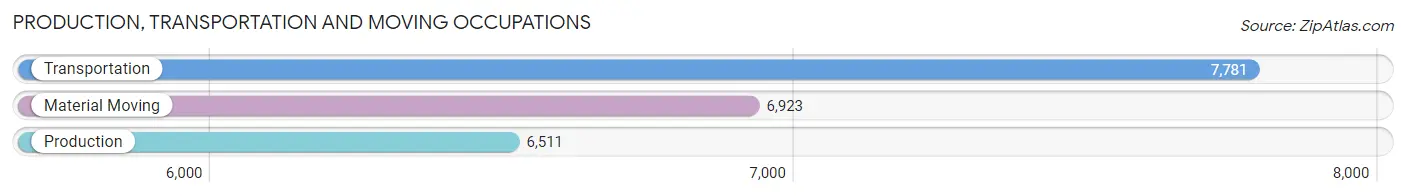
Production, Transportation and Moving Occupations
The most common Production, Transportation and Moving occupations in Chatham County are Transportation (7,781 | 5.5%), Material Moving (6,923 | 4.9%), and Production (6,511 | 4.6%).
Production, Transportation and Moving Occupations by Sex
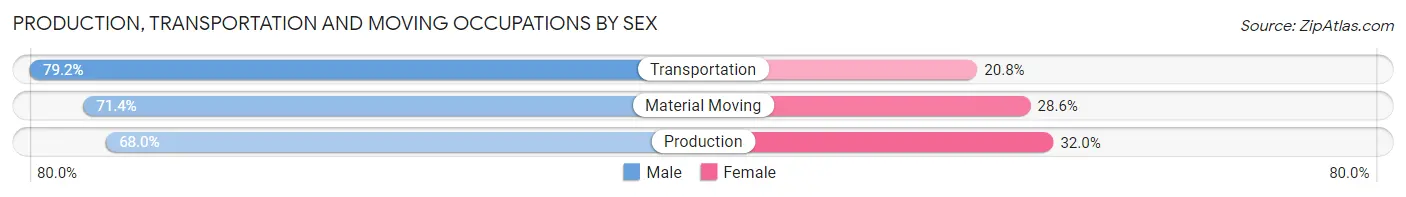
| Occupation | Male | Female |
| Production | 4,428 (68.0%) | 2,083 (32.0%) |
| Transportation | 6,161 (79.2%) | 1,620 (20.8%) |
| Material Moving | 4,940 (71.4%) | 1,983 (28.6%) |
| Total (Category) | 15,529 (73.2%) | 5,686 (26.8%) |
| Total (Overall) | 69,882 (49.0%) | 72,745 (51.0%) |
Employment Industries by Sex in Chatham County
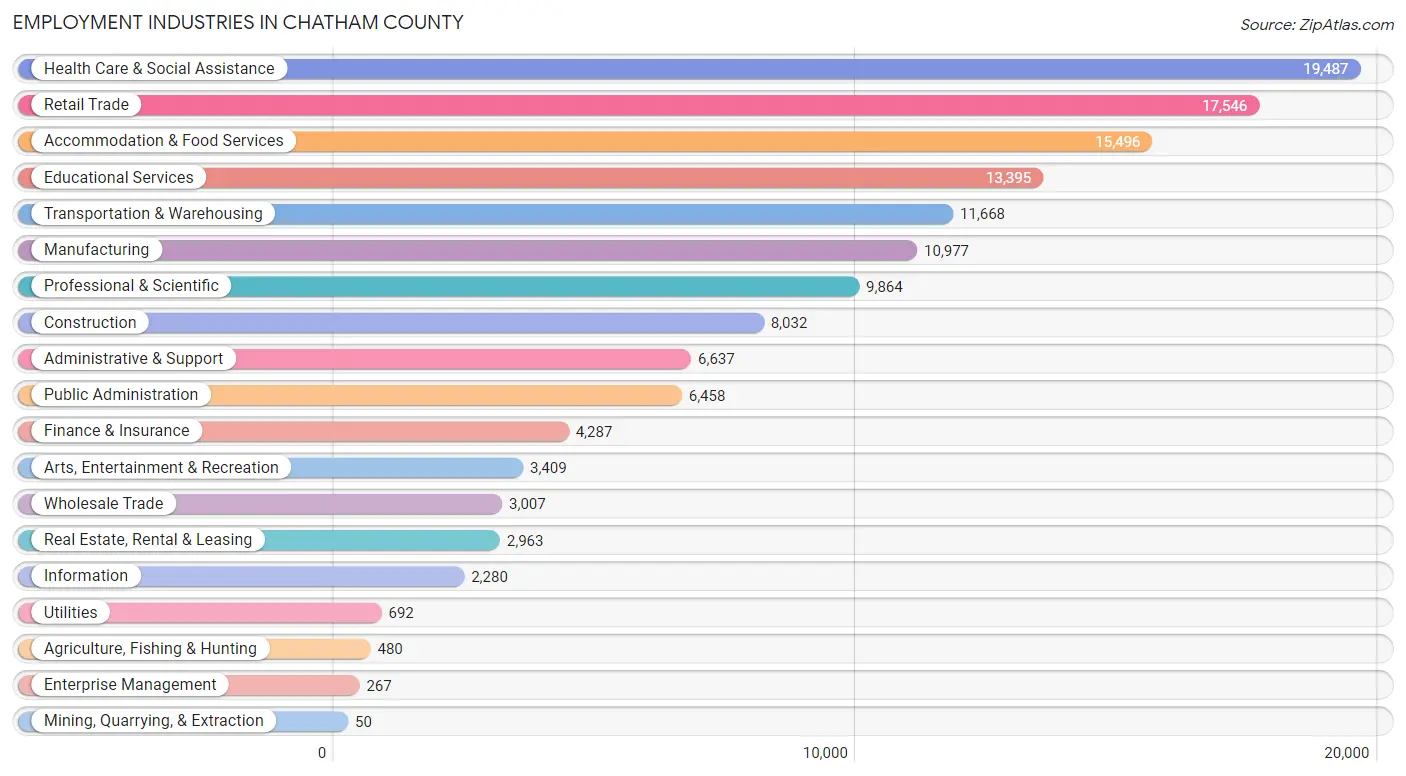
Employment Industries in Chatham County
The major employment industries in Chatham County include Health Care & Social Assistance (19,487 | 13.7%), Retail Trade (17,546 | 12.3%), Accommodation & Food Services (15,496 | 10.9%), Educational Services (13,395 | 9.4%), and Transportation & Warehousing (11,668 | 8.2%).
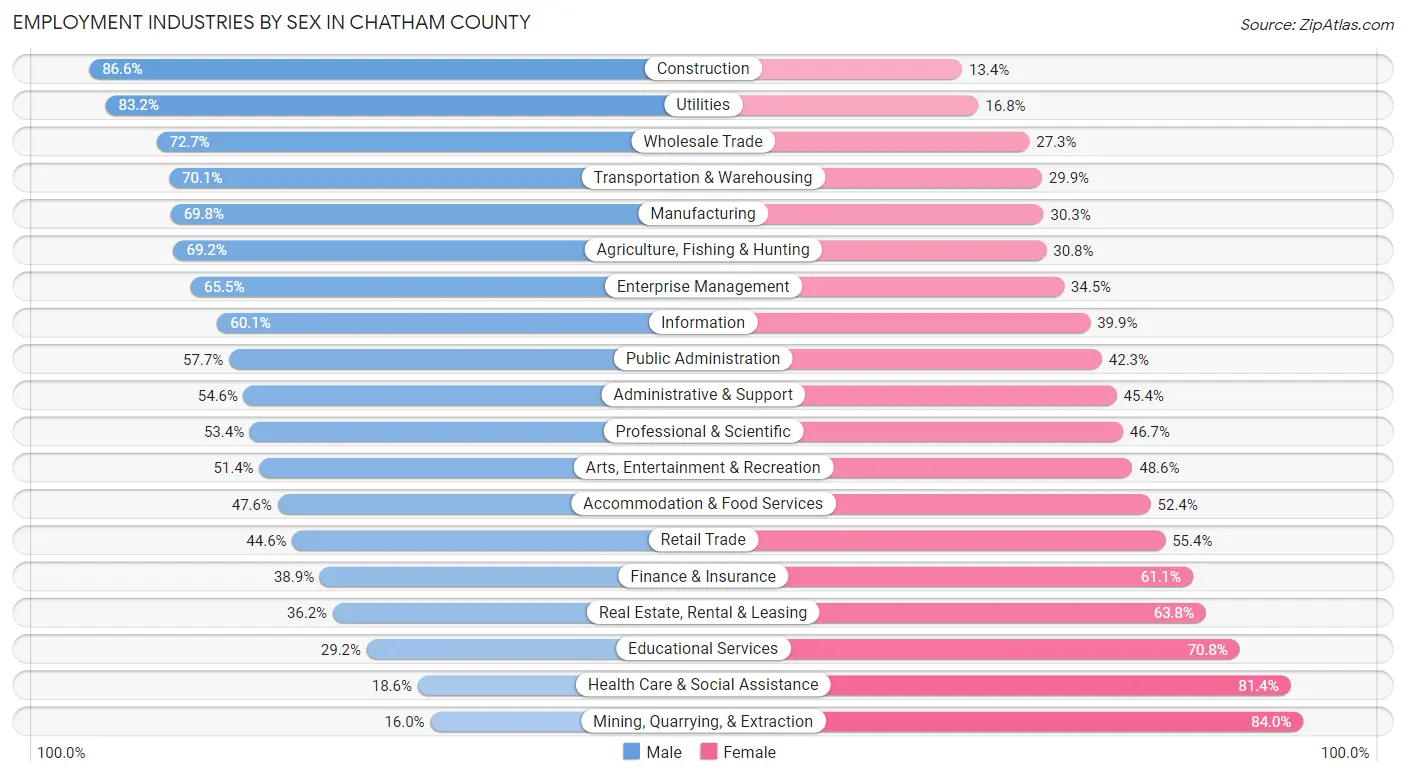
Employment Industries by Sex in Chatham County
The Chatham County industries that see more men than women are Construction (86.6%), Utilities (83.2%), and Wholesale Trade (72.7%), whereas the industries that tend to have a higher number of women are Mining, Quarrying, & Extraction (84.0%), Health Care & Social Assistance (81.4%), and Educational Services (70.8%).
| Industry | Male | Female |
| Agriculture, Fishing & Hunting | 332 (69.2%) | 148 (30.8%) |
| Mining, Quarrying, & Extraction | 8 (16.0%) | 42 (84.0%) |
| Construction | 6,957 (86.6%) | 1,075 (13.4%) |
| Manufacturing | 7,656 (69.8%) | 3,321 (30.2%) |
| Wholesale Trade | 2,186 (72.7%) | 821 (27.3%) |
| Retail Trade | 7,820 (44.6%) | 9,726 (55.4%) |
| Transportation & Warehousing | 8,178 (70.1%) | 3,490 (29.9%) |
| Utilities | 576 (83.2%) | 116 (16.8%) |
| Information | 1,370 (60.1%) | 910 (39.9%) |
| Finance & Insurance | 1,666 (38.9%) | 2,621 (61.1%) |
| Real Estate, Rental & Leasing | 1,072 (36.2%) | 1,891 (63.8%) |
| Professional & Scientific | 5,262 (53.3%) | 4,602 (46.7%) |
| Enterprise Management | 175 (65.5%) | 92 (34.5%) |
| Administrative & Support | 3,625 (54.6%) | 3,012 (45.4%) |
| Educational Services | 3,906 (29.2%) | 9,489 (70.8%) |
| Health Care & Social Assistance | 3,629 (18.6%) | 15,858 (81.4%) |
| Arts, Entertainment & Recreation | 1,752 (51.4%) | 1,657 (48.6%) |
| Accommodation & Food Services | 7,375 (47.6%) | 8,121 (52.4%) |
| Public Administration | 3,725 (57.7%) | 2,733 (42.3%) |
| Total | 69,882 (49.0%) | 72,745 (51.0%) |
Education in Chatham County
School Enrollment in Chatham County
The most common levels of schooling among the 75,049 students in Chatham County are college / undergraduate (20,041 | 26.7%), middle school (14,538 | 19.4%), and high school (14,015 | 18.7%).
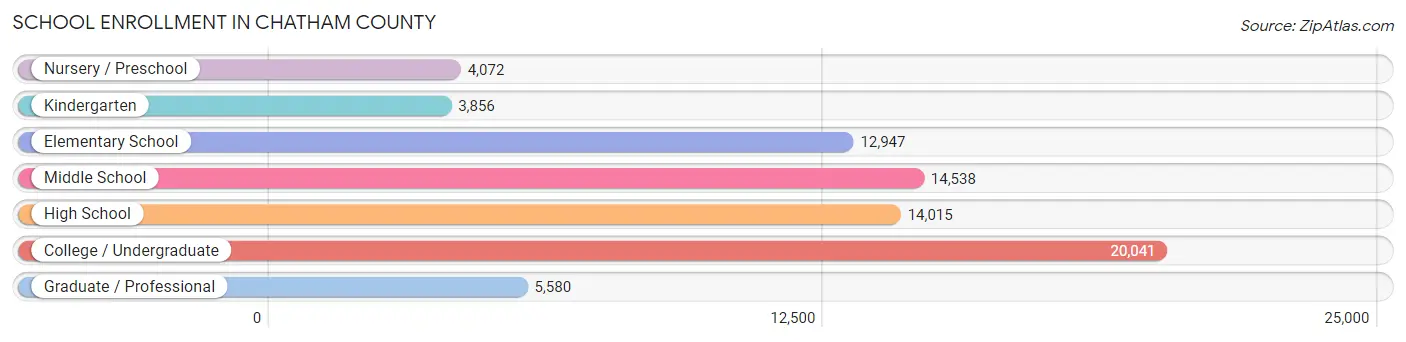
| School Level | # Students | % Students |
| Nursery / Preschool | 4,072 | 5.4% |
| Kindergarten | 3,856 | 5.1% |
| Elementary School | 12,947 | 17.2% |
| Middle School | 14,538 | 19.4% |
| High School | 14,015 | 18.7% |
| College / Undergraduate | 20,041 | 26.7% |
| Graduate / Professional | 5,580 | 7.4% |
| Total | 75,049 | 100.0% |
School Enrollment by Age by Funding Source in Chatham County
Out of a total of 75,049 students who are enrolled in schools in Chatham County, 20,864 (27.8%) attend a private institution, while the remaining 54,185 (72.2%) are enrolled in public schools. The age group of 3 to 4 year olds has the highest likelihood of being enrolled in private schools, with 1,524 (48.1% in the age bracket) enrolled. Conversely, the age group of 10 to 14 year olds has the lowest likelihood of being enrolled in a private school, with 14,887 (86.0% in the age bracket) attending a public institution.
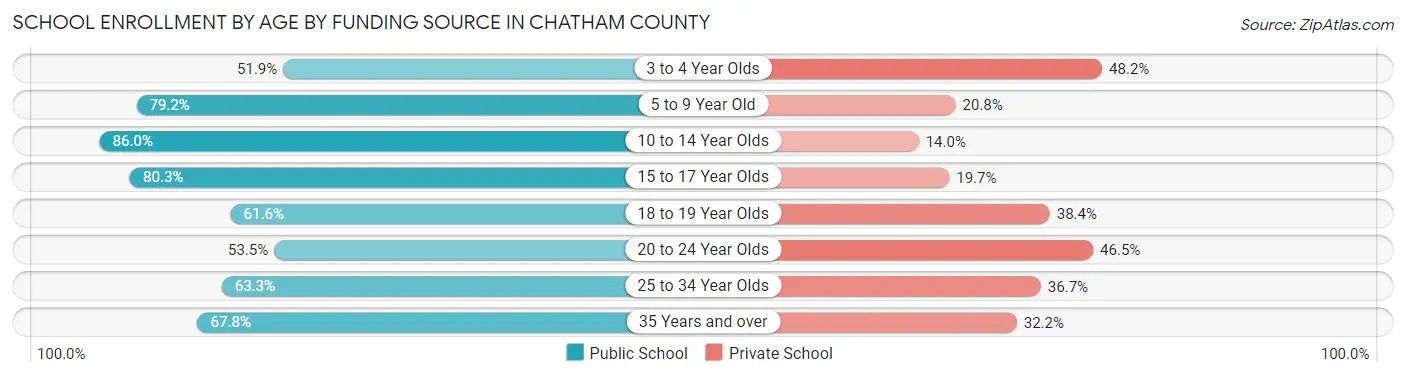
| Age Bracket | Public School | Private School |
| 3 to 4 Year Olds | 1,641 (51.8%) | 1,524 (48.1%) |
| 5 to 9 Year Old | 12,550 (79.2%) | 3,304 (20.8%) |
| 10 to 14 Year Olds | 14,887 (86.0%) | 2,419 (14.0%) |
| 15 to 17 Year Olds | 7,701 (80.3%) | 1,886 (19.7%) |
| 18 to 19 Year Olds | 4,304 (61.6%) | 2,682 (38.4%) |
| 20 to 24 Year Olds | 6,017 (53.5%) | 5,223 (46.5%) |
| 25 to 34 Year Olds | 4,407 (63.3%) | 2,559 (36.7%) |
| 35 Years and over | 2,673 (67.8%) | 1,272 (32.2%) |
| Total | 54,185 (72.2%) | 20,864 (27.8%) |
Educational Attainment by Field of Study in Chatham County
Business (15,577 | 19.9%), education (8,909 | 11.4%), science & technology (8,338 | 10.7%), social sciences (6,045 | 7.7%), and arts & humanities (5,211 | 6.7%) are the most common fields of study among 78,124 individuals in Chatham County who have obtained a bachelor's degree or higher.
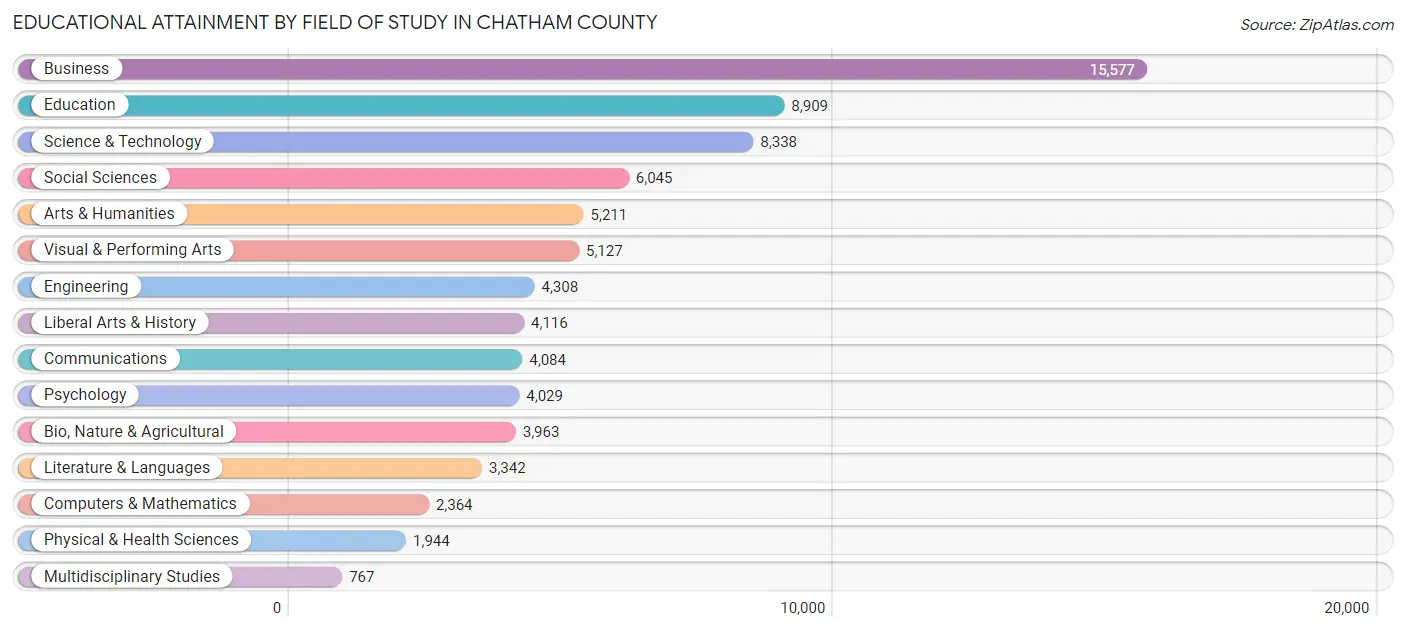
| Field of Study | # Graduates | % Graduates |
| Computers & Mathematics | 2,364 | 3.0% |
| Bio, Nature & Agricultural | 3,963 | 5.1% |
| Physical & Health Sciences | 1,944 | 2.5% |
| Psychology | 4,029 | 5.2% |
| Social Sciences | 6,045 | 7.7% |
| Engineering | 4,308 | 5.5% |
| Multidisciplinary Studies | 767 | 1.0% |
| Science & Technology | 8,338 | 10.7% |
| Business | 15,577 | 19.9% |
| Education | 8,909 | 11.4% |
| Literature & Languages | 3,342 | 4.3% |
| Liberal Arts & History | 4,116 | 5.3% |
| Visual & Performing Arts | 5,127 | 6.6% |
| Communications | 4,084 | 5.2% |
| Arts & Humanities | 5,211 | 6.7% |
| Total | 78,124 | 100.0% |
Transportation & Commute in Chatham County
Vehicle Availability by Sex in Chatham County
The most prevalent vehicle ownership categories in Chatham County are males with 2 vehicles (31,107, accounting for 44.0%) and females with 2 vehicles (30,585, making up 44.1%).
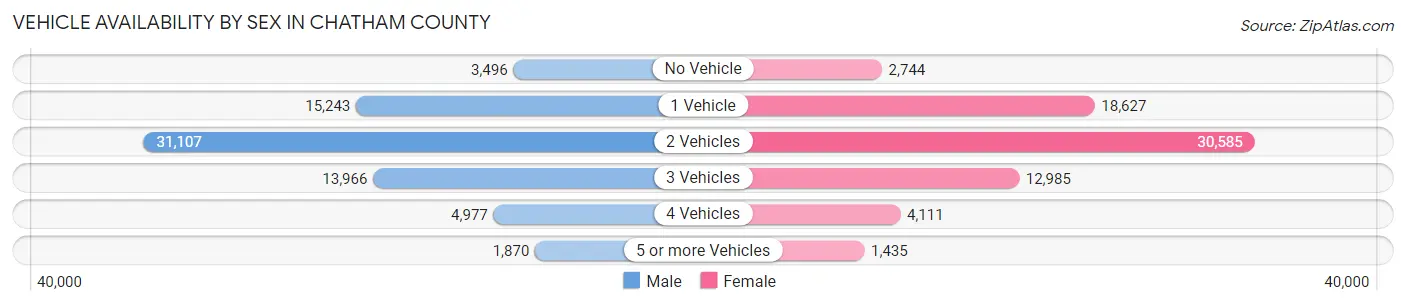
| Vehicles Available | Male | Female |
| No Vehicle | 3,496 (5.0%) | 2,744 (3.9%) |
| 1 Vehicle | 15,243 (21.6%) | 18,627 (26.4%) |
| 2 Vehicles | 31,107 (44.0%) | 30,585 (43.4%) |
| 3 Vehicles | 13,966 (19.8%) | 12,985 (18.4%) |
| 4 Vehicles | 4,977 (7.0%) | 4,111 (5.8%) |
| 5 or more Vehicles | 1,870 (2.6%) | 1,435 (2.0%) |
| Total | 70,659 (100.0%) | 70,487 (100.0%) |
Commute Time in Chatham County
The most frequently occuring commute durations in Chatham County are 15 to 19 minutes (25,352 commuters, 19.3%), 20 to 24 minutes (24,571 commuters, 18.7%), and 10 to 14 minutes (20,495 commuters, 15.6%).
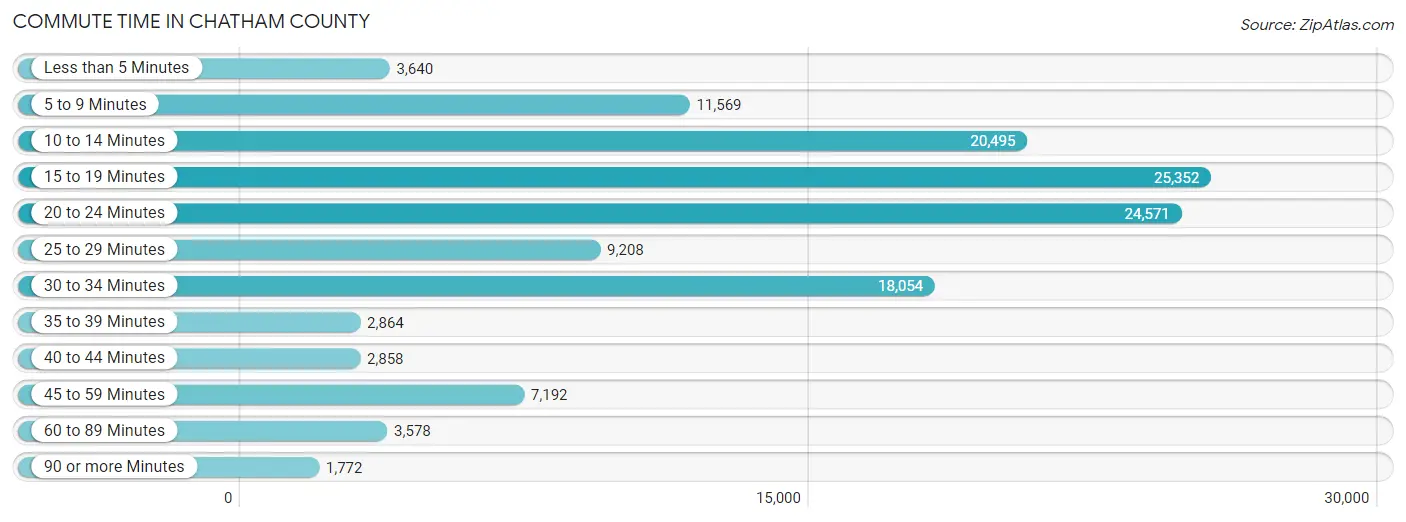
| Commute Time | # Commuters | % Commuters |
| Less than 5 Minutes | 3,640 | 2.8% |
| 5 to 9 Minutes | 11,569 | 8.8% |
| 10 to 14 Minutes | 20,495 | 15.6% |
| 15 to 19 Minutes | 25,352 | 19.3% |
| 20 to 24 Minutes | 24,571 | 18.7% |
| 25 to 29 Minutes | 9,208 | 7.0% |
| 30 to 34 Minutes | 18,054 | 13.8% |
| 35 to 39 Minutes | 2,864 | 2.2% |
| 40 to 44 Minutes | 2,858 | 2.2% |
| 45 to 59 Minutes | 7,192 | 5.5% |
| 60 to 89 Minutes | 3,578 | 2.7% |
| 90 or more Minutes | 1,772 | 1.3% |
Commute Time by Sex in Chatham County
The most common commute times in Chatham County are 20 to 24 minutes (13,121 commuters, 20.0%) for males and 15 to 19 minutes (12,524 commuters, 19.2%) for females.
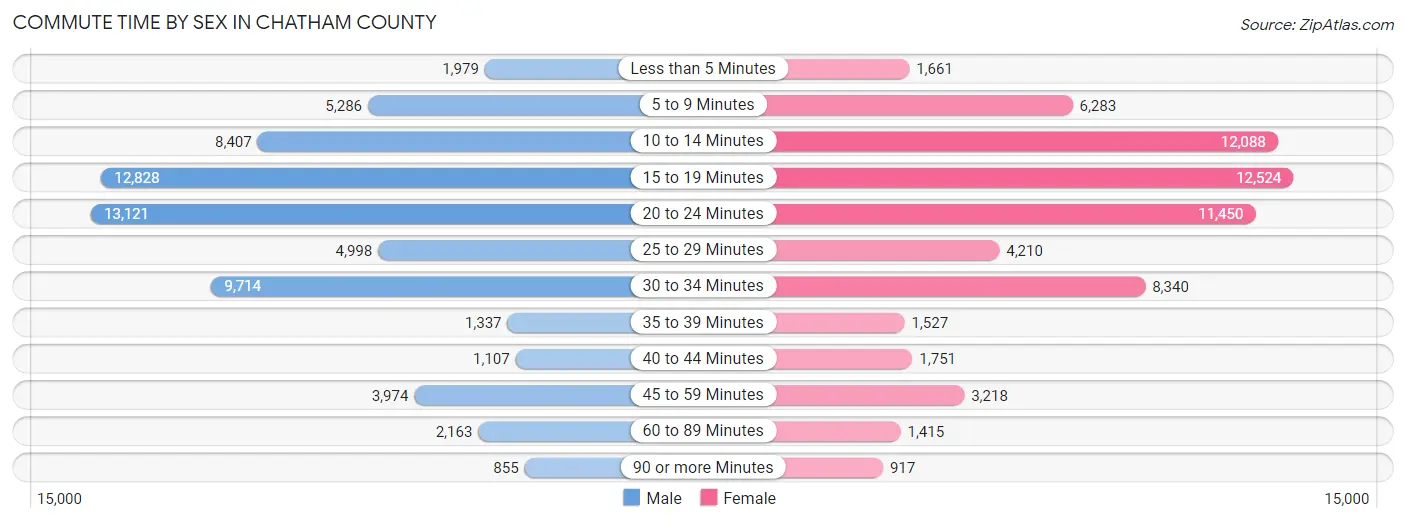
| Commute Time | Male | Female |
| Less than 5 Minutes | 1,979 (3.0%) | 1,661 (2.5%) |
| 5 to 9 Minutes | 5,286 (8.0%) | 6,283 (9.6%) |
| 10 to 14 Minutes | 8,407 (12.8%) | 12,088 (18.5%) |
| 15 to 19 Minutes | 12,828 (19.5%) | 12,524 (19.2%) |
| 20 to 24 Minutes | 13,121 (20.0%) | 11,450 (17.5%) |
| 25 to 29 Minutes | 4,998 (7.6%) | 4,210 (6.4%) |
| 30 to 34 Minutes | 9,714 (14.8%) | 8,340 (12.8%) |
| 35 to 39 Minutes | 1,337 (2.0%) | 1,527 (2.3%) |
| 40 to 44 Minutes | 1,107 (1.7%) | 1,751 (2.7%) |
| 45 to 59 Minutes | 3,974 (6.0%) | 3,218 (4.9%) |
| 60 to 89 Minutes | 2,163 (3.3%) | 1,415 (2.2%) |
| 90 or more Minutes | 855 (1.3%) | 917 (1.4%) |
Time of Departure to Work by Sex in Chatham County
The most frequent times of departure to work in Chatham County are 7:00 AM to 7:29 AM (10,050, 15.3%) for males and 7:00 AM to 7:29 AM (9,929, 15.2%) for females.
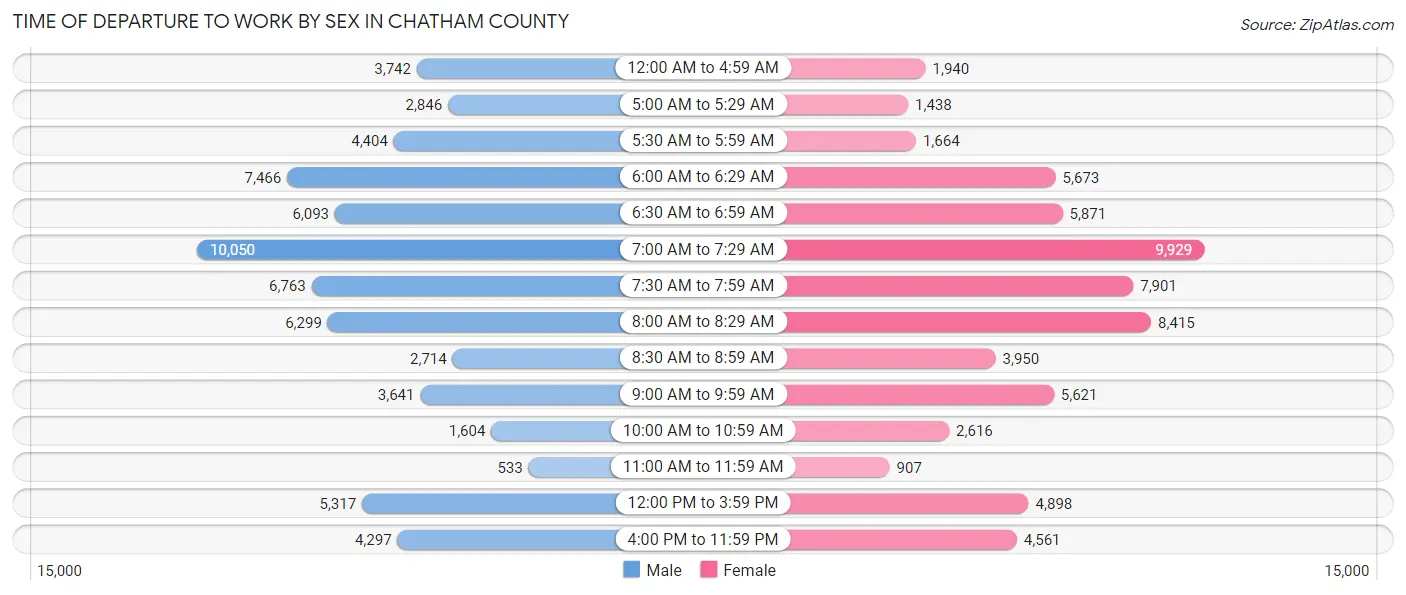
| Time of Departure | Male | Female |
| 12:00 AM to 4:59 AM | 3,742 (5.7%) | 1,940 (3.0%) |
| 5:00 AM to 5:29 AM | 2,846 (4.3%) | 1,438 (2.2%) |
| 5:30 AM to 5:59 AM | 4,404 (6.7%) | 1,664 (2.5%) |
| 6:00 AM to 6:29 AM | 7,466 (11.4%) | 5,673 (8.7%) |
| 6:30 AM to 6:59 AM | 6,093 (9.3%) | 5,871 (9.0%) |
| 7:00 AM to 7:29 AM | 10,050 (15.3%) | 9,929 (15.2%) |
| 7:30 AM to 7:59 AM | 6,763 (10.3%) | 7,901 (12.1%) |
| 8:00 AM to 8:29 AM | 6,299 (9.6%) | 8,415 (12.9%) |
| 8:30 AM to 8:59 AM | 2,714 (4.1%) | 3,950 (6.0%) |
| 9:00 AM to 9:59 AM | 3,641 (5.5%) | 5,621 (8.6%) |
| 10:00 AM to 10:59 AM | 1,604 (2.4%) | 2,616 (4.0%) |
| 11:00 AM to 11:59 AM | 533 (0.8%) | 907 (1.4%) |
| 12:00 PM to 3:59 PM | 5,317 (8.1%) | 4,898 (7.5%) |
| 4:00 PM to 11:59 PM | 4,297 (6.5%) | 4,561 (7.0%) |
| Total | 65,769 (100.0%) | 65,384 (100.0%) |
Housing Occupancy in Chatham County
Occupancy by Ownership in Chatham County
Of the total 117,383 dwellings in Chatham County, owner-occupied units account for 66,733 (56.9%), while renter-occupied units make up 50,650 (43.1%).
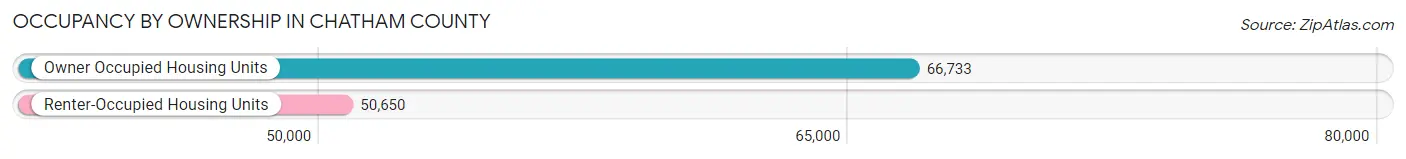
| Occupancy | # Housing Units | % Housing Units |
| Owner Occupied Housing Units | 66,733 | 56.9% |
| Renter-Occupied Housing Units | 50,650 | 43.1% |
| Total Occupied Housing Units | 117,383 | 100.0% |
Occupancy by Household Size in Chatham County
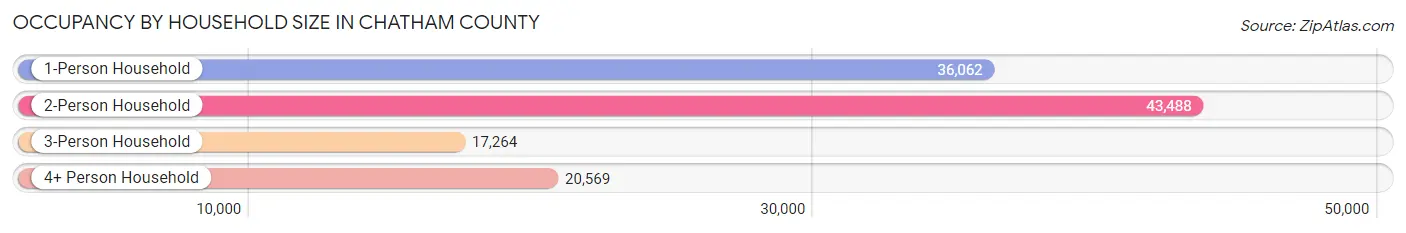
| Household Size | # Housing Units | % Housing Units |
| 1-Person Household | 36,062 | 30.7% |
| 2-Person Household | 43,488 | 37.0% |
| 3-Person Household | 17,264 | 14.7% |
| 4+ Person Household | 20,569 | 17.5% |
| Total Housing Units | 117,383 | 100.0% |
Occupancy by Ownership by Household Size in Chatham County
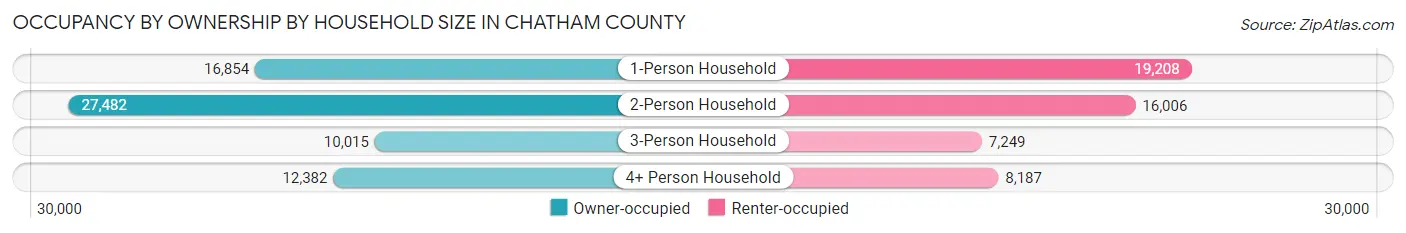
| Household Size | Owner-occupied | Renter-occupied |
| 1-Person Household | 16,854 (46.7%) | 19,208 (53.3%) |
| 2-Person Household | 27,482 (63.2%) | 16,006 (36.8%) |
| 3-Person Household | 10,015 (58.0%) | 7,249 (42.0%) |
| 4+ Person Household | 12,382 (60.2%) | 8,187 (39.8%) |
| Total Housing Units | 66,733 (56.9%) | 50,650 (43.1%) |
Occupancy by Educational Attainment in Chatham County
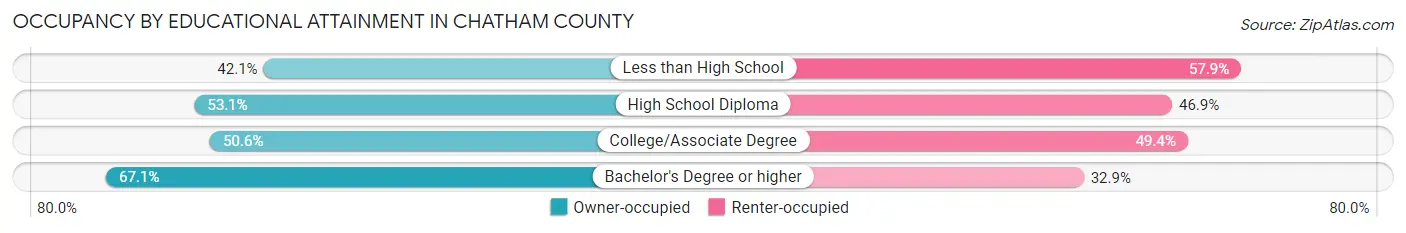
| Household Size | Owner-occupied | Renter-occupied |
| Less than High School | 3,369 (42.1%) | 4,629 (57.9%) |
| High School Diploma | 13,521 (53.1%) | 11,958 (46.9%) |
| College/Associate Degree | 19,765 (50.6%) | 19,301 (49.4%) |
| Bachelor's Degree or higher | 30,078 (67.1%) | 14,762 (32.9%) |
Occupancy by Age of Householder in Chatham County
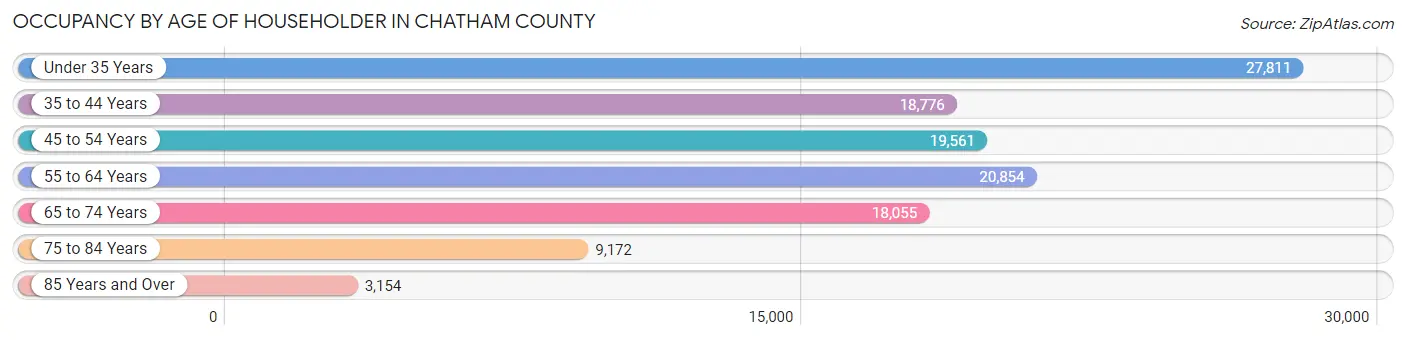
| Age Bracket | # Households | % Households |
| Under 35 Years | 27,811 | 23.7% |
| 35 to 44 Years | 18,776 | 16.0% |
| 45 to 54 Years | 19,561 | 16.7% |
| 55 to 64 Years | 20,854 | 17.8% |
| 65 to 74 Years | 18,055 | 15.4% |
| 75 to 84 Years | 9,172 | 7.8% |
| 85 Years and Over | 3,154 | 2.7% |
| Total | 117,383 | 100.0% |
Housing Finances in Chatham County
Median Income by Occupancy in Chatham County
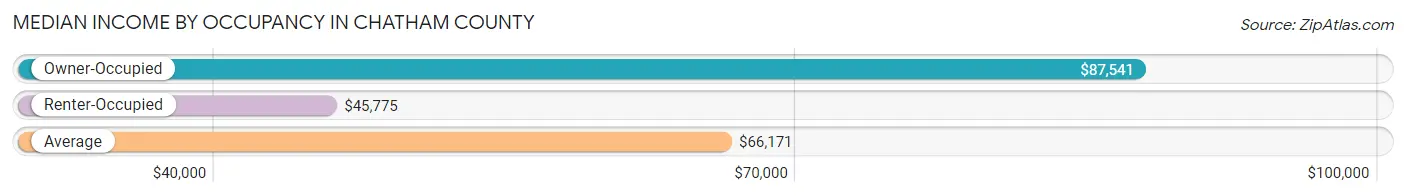
| Occupancy Type | # Households | Median Income |
| Owner-Occupied | 66,733 (56.9%) | $87,541 |
| Renter-Occupied | 50,650 (43.1%) | $45,775 |
| Average | 117,383 (100.0%) | $66,171 |
Occupancy by Householder Income Bracket in Chatham County
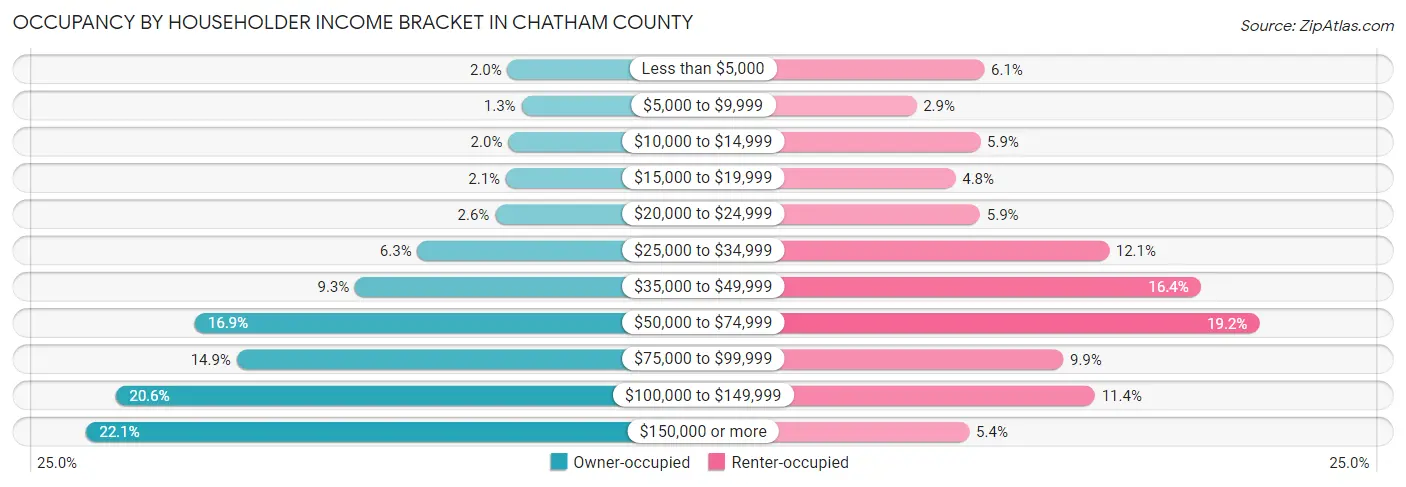
| Income Bracket | Owner-occupied | Renter-occupied |
| Less than $5,000 | 1,336 (2.0%) | 3,101 (6.1%) |
| $5,000 to $9,999 | 892 (1.3%) | 1,466 (2.9%) |
| $10,000 to $14,999 | 1,313 (2.0%) | 3,002 (5.9%) |
| $15,000 to $19,999 | 1,386 (2.1%) | 2,405 (4.8%) |
| $20,000 to $24,999 | 1,731 (2.6%) | 2,997 (5.9%) |
| $25,000 to $34,999 | 4,197 (6.3%) | 6,108 (12.1%) |
| $35,000 to $49,999 | 6,179 (9.3%) | 8,323 (16.4%) |
| $50,000 to $74,999 | 11,269 (16.9%) | 9,734 (19.2%) |
| $75,000 to $99,999 | 9,945 (14.9%) | 5,004 (9.9%) |
| $100,000 to $149,999 | 13,764 (20.6%) | 5,770 (11.4%) |
| $150,000 or more | 14,721 (22.1%) | 2,740 (5.4%) |
| Total | 66,733 (100.0%) | 50,650 (100.0%) |
Monthly Housing Cost Tiers in Chatham County
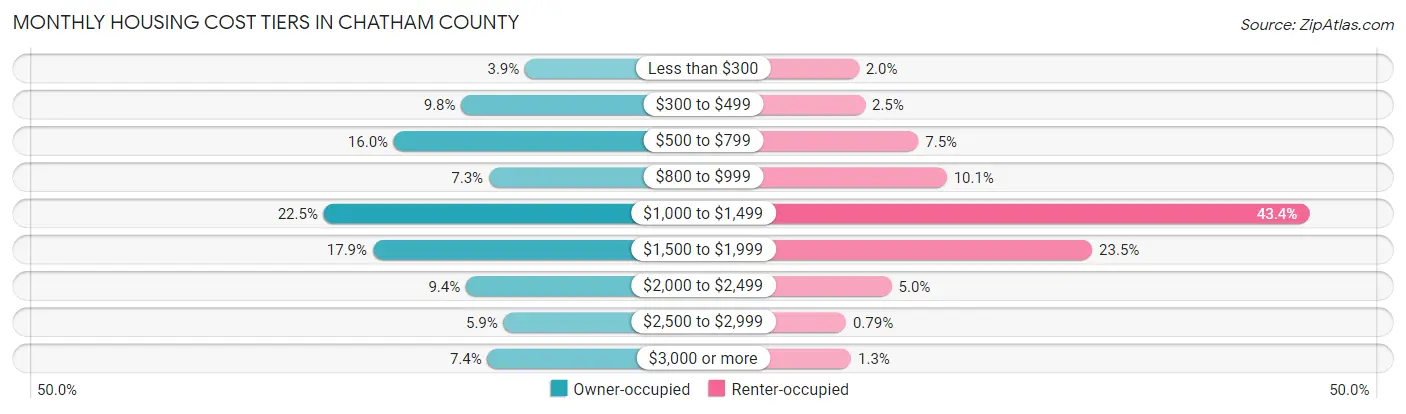
| Monthly Cost | Owner-occupied | Renter-occupied |
| Less than $300 | 2,618 (3.9%) | 994 (2.0%) |
| $300 to $499 | 6,533 (9.8%) | 1,289 (2.5%) |
| $500 to $799 | 10,676 (16.0%) | 3,771 (7.4%) |
| $800 to $999 | 4,835 (7.2%) | 5,094 (10.1%) |
| $1,000 to $1,499 | 14,991 (22.5%) | 21,992 (43.4%) |
| $1,500 to $1,999 | 11,972 (17.9%) | 11,877 (23.4%) |
| $2,000 to $2,499 | 6,244 (9.4%) | 2,526 (5.0%) |
| $2,500 to $2,999 | 3,936 (5.9%) | 401 (0.8%) |
| $3,000 or more | 4,928 (7.4%) | 639 (1.3%) |
| Total | 66,733 (100.0%) | 50,650 (100.0%) |
Physical Housing Characteristics in Chatham County
Housing Structures in Chatham County
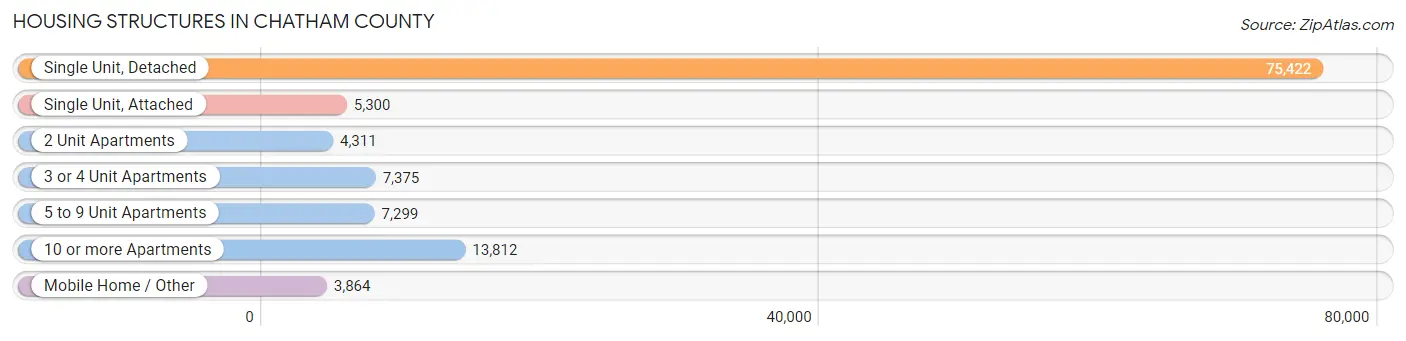
| Structure Type | # Housing Units | % Housing Units |
| Single Unit, Detached | 75,422 | 64.2% |
| Single Unit, Attached | 5,300 | 4.5% |
| 2 Unit Apartments | 4,311 | 3.7% |
| 3 or 4 Unit Apartments | 7,375 | 6.3% |
| 5 to 9 Unit Apartments | 7,299 | 6.2% |
| 10 or more Apartments | 13,812 | 11.8% |
| Mobile Home / Other | 3,864 | 3.3% |
| Total | 117,383 | 100.0% |
Housing Structures by Occupancy in Chatham County
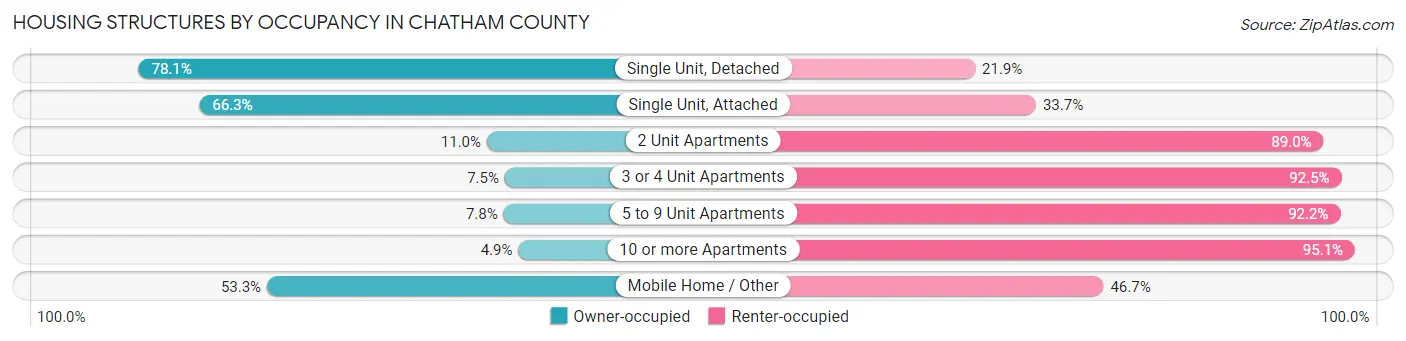
| Structure Type | Owner-occupied | Renter-occupied |
| Single Unit, Detached | 58,876 (78.1%) | 16,546 (21.9%) |
| Single Unit, Attached | 3,516 (66.3%) | 1,784 (33.7%) |
| 2 Unit Apartments | 474 (11.0%) | 3,837 (89.0%) |
| 3 or 4 Unit Apartments | 556 (7.5%) | 6,819 (92.5%) |
| 5 to 9 Unit Apartments | 568 (7.8%) | 6,731 (92.2%) |
| 10 or more Apartments | 682 (4.9%) | 13,130 (95.1%) |
| Mobile Home / Other | 2,061 (53.3%) | 1,803 (46.7%) |
| Total | 66,733 (56.9%) | 50,650 (43.1%) |
Housing Structures by Number of Rooms in Chatham County
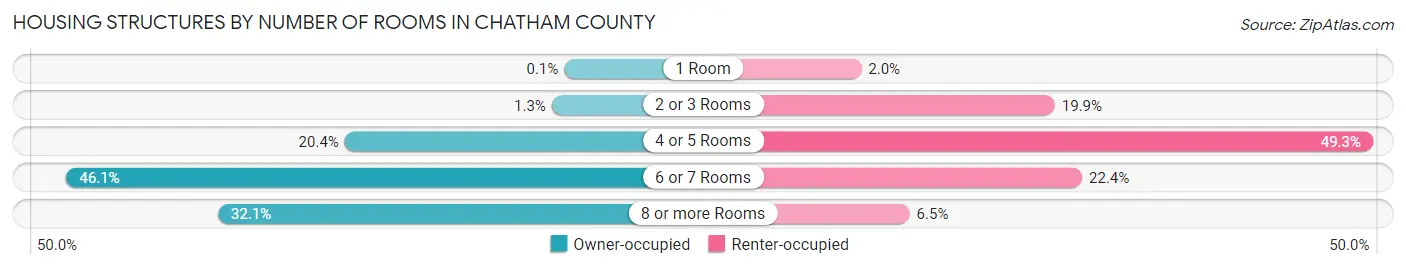
| Number of Rooms | Owner-occupied | Renter-occupied |
| 1 Room | 67 (0.1%) | 1,005 (2.0%) |
| 2 or 3 Rooms | 836 (1.3%) | 10,070 (19.9%) |
| 4 or 5 Rooms | 13,611 (20.4%) | 24,958 (49.3%) |
| 6 or 7 Rooms | 30,785 (46.1%) | 11,348 (22.4%) |
| 8 or more Rooms | 21,434 (32.1%) | 3,269 (6.5%) |
| Total | 66,733 (100.0%) | 50,650 (100.0%) |
Housing Structure by Heating Type in Chatham County
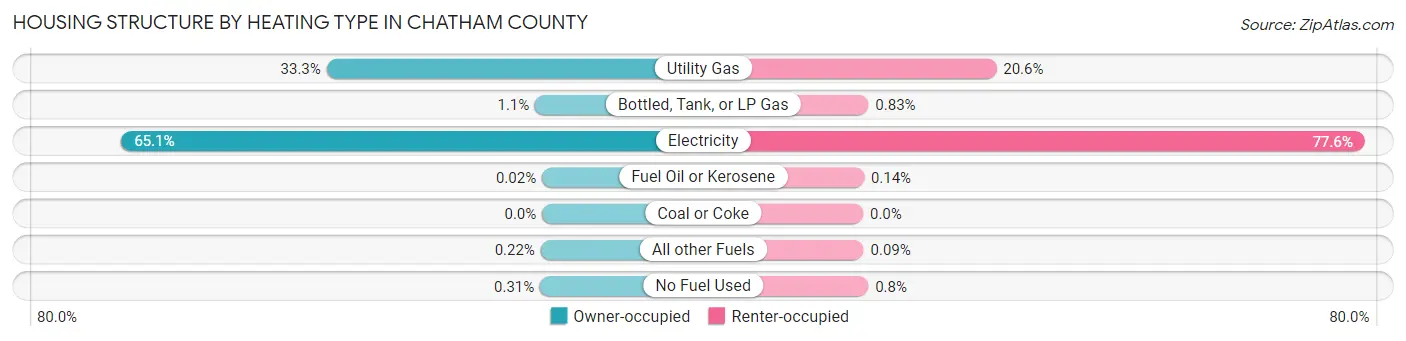
| Heating Type | Owner-occupied | Renter-occupied |
| Utility Gas | 22,227 (33.3%) | 10,436 (20.6%) |
| Bottled, Tank, or LP Gas | 724 (1.1%) | 418 (0.8%) |
| Electricity | 43,415 (65.1%) | 39,277 (77.5%) |
| Fuel Oil or Kerosene | 11 (0.0%) | 69 (0.1%) |
| Coal or Coke | 0 (0.0%) | 0 (0.0%) |
| All other Fuels | 149 (0.2%) | 44 (0.1%) |
| No Fuel Used | 207 (0.3%) | 406 (0.8%) |
| Total | 66,733 (100.0%) | 50,650 (100.0%) |
Household Vehicle Usage in Chatham County
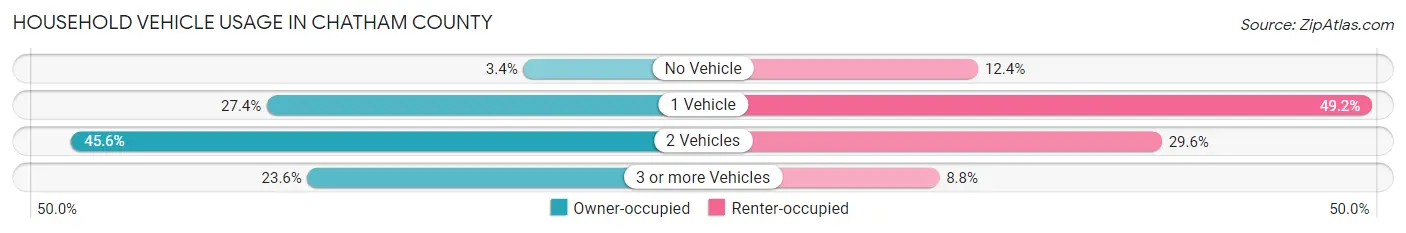
| Vehicles per Household | Owner-occupied | Renter-occupied |
| No Vehicle | 2,292 (3.4%) | 6,289 (12.4%) |
| 1 Vehicle | 18,258 (27.4%) | 24,927 (49.2%) |
| 2 Vehicles | 30,450 (45.6%) | 14,976 (29.6%) |
| 3 or more Vehicles | 15,733 (23.6%) | 4,458 (8.8%) |
| Total | 66,733 (100.0%) | 50,650 (100.0%) |
Real Estate & Mortgages in Chatham County
Real Estate and Mortgage Overview in Chatham County
| Characteristic | Without Mortgage | With Mortgage |
| Housing Units | 23,763 | 42,970 |
| Median Property Value | $233,100 | $264,700 |
| Median Household Income | $66,107 | $10,947 |
| Monthly Housing Costs | $579 | $4,771 |
| Real Estate Taxes | $2,051 | $1,626 |
Property Value by Mortgage Status in Chatham County
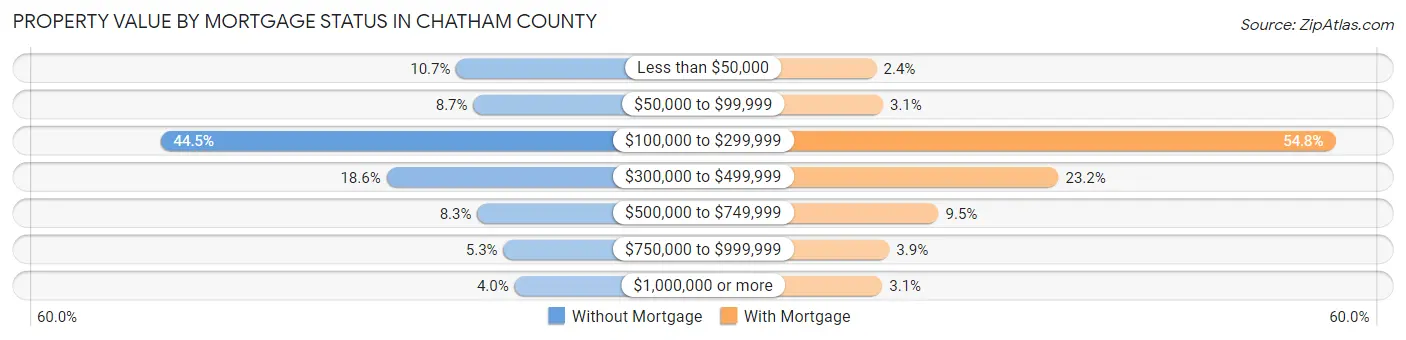
| Property Value | Without Mortgage | With Mortgage |
| Less than $50,000 | 2,532 (10.7%) | 1,037 (2.4%) |
| $50,000 to $99,999 | 2,069 (8.7%) | 1,349 (3.1%) |
| $100,000 to $299,999 | 10,563 (44.5%) | 23,561 (54.8%) |
| $300,000 to $499,999 | 4,429 (18.6%) | 9,968 (23.2%) |
| $500,000 to $749,999 | 1,962 (8.3%) | 4,076 (9.5%) |
| $750,000 to $999,999 | 1,254 (5.3%) | 1,662 (3.9%) |
| $1,000,000 or more | 954 (4.0%) | 1,317 (3.1%) |
| Total | 23,763 (100.0%) | 42,970 (100.0%) |
Household Income by Mortgage Status in Chatham County
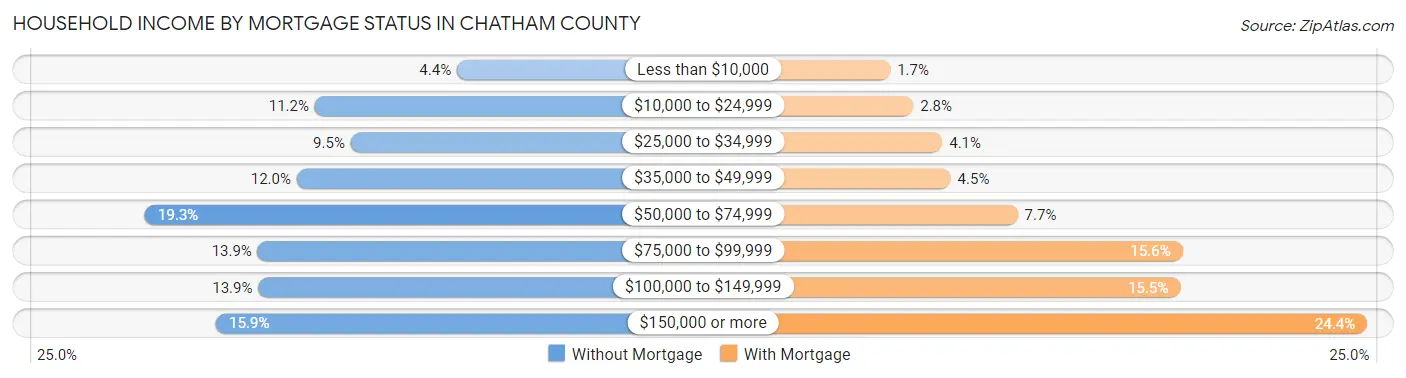
| Household Income | Without Mortgage | With Mortgage |
| Less than $10,000 | 1,048 (4.4%) | 707 (1.7%) |
| $10,000 to $24,999 | 2,656 (11.2%) | 1,180 (2.8%) |
| $25,000 to $34,999 | 2,250 (9.5%) | 1,774 (4.1%) |
| $35,000 to $49,999 | 2,860 (12.0%) | 1,947 (4.5%) |
| $50,000 to $74,999 | 4,578 (19.3%) | 3,319 (7.7%) |
| $75,000 to $99,999 | 3,302 (13.9%) | 6,691 (15.6%) |
| $100,000 to $149,999 | 3,295 (13.9%) | 6,643 (15.5%) |
| $150,000 or more | 3,774 (15.9%) | 10,469 (24.4%) |
| Total | 23,763 (100.0%) | 42,970 (100.0%) |
Property Value to Household Income Ratio in Chatham County
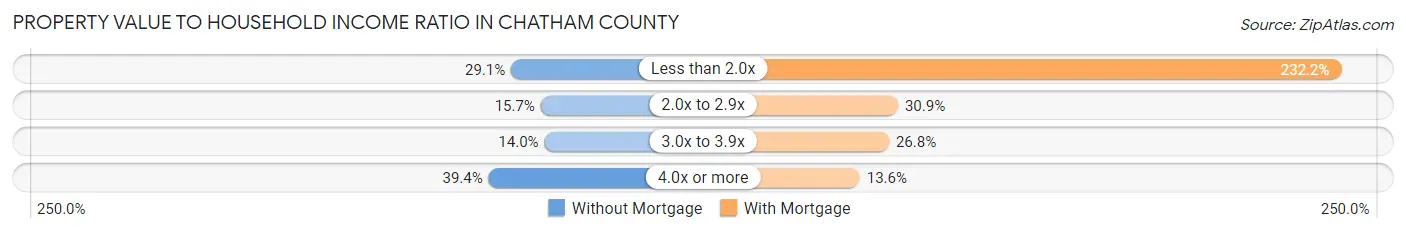
| Value-to-Income Ratio | Without Mortgage | With Mortgage |
| Less than 2.0x | 6,922 (29.1%) | 99,763 (232.2%) |
| 2.0x to 2.9x | 3,726 (15.7%) | 13,281 (30.9%) |
| 3.0x to 3.9x | 3,326 (14.0%) | 11,525 (26.8%) |
| 4.0x or more | 9,350 (39.4%) | 5,821 (13.6%) |
| Total | 23,763 (100.0%) | 42,970 (100.0%) |
Real Estate Taxes by Mortgage Status in Chatham County
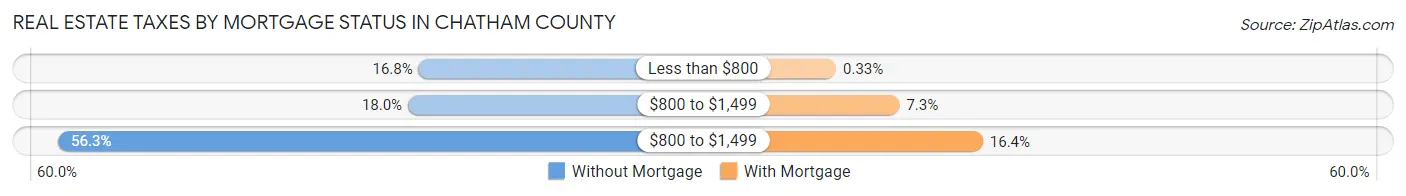
| Property Taxes | Without Mortgage | With Mortgage |
| Less than $800 | 3,999 (16.8%) | 143 (0.3%) |
| $800 to $1,499 | 4,275 (18.0%) | 3,130 (7.3%) |
| $800 to $1,499 | 13,386 (56.3%) | 7,056 (16.4%) |
| Total | 23,763 (100.0%) | 42,970 (100.0%) |
Health & Disability in Chatham County
Health Insurance Coverage by Age in Chatham County
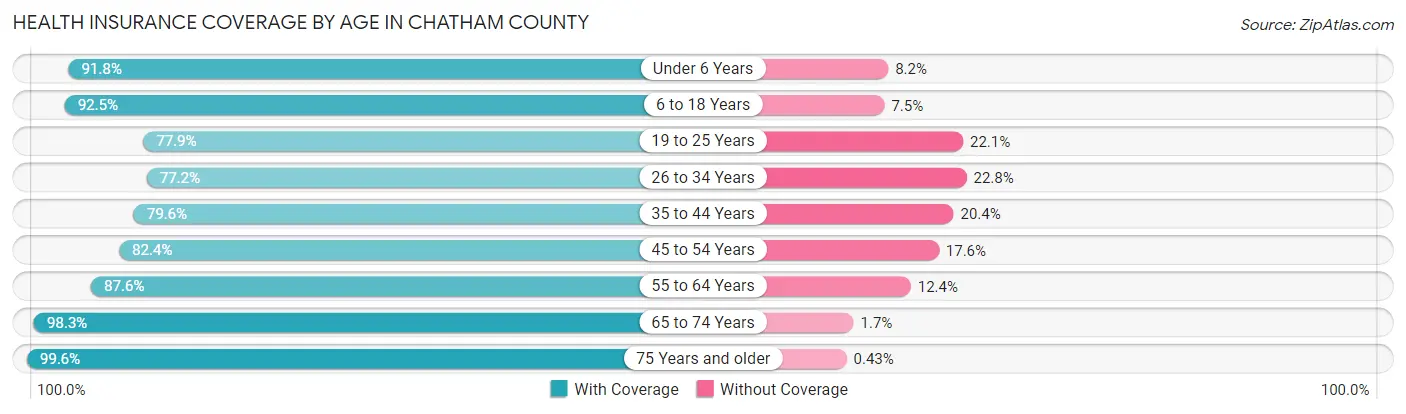
| Age Bracket | With Coverage | Without Coverage |
| Under 6 Years | 19,681 (91.8%) | 1,755 (8.2%) |
| 6 to 18 Years | 41,781 (92.5%) | 3,384 (7.5%) |
| 19 to 25 Years | 24,377 (77.9%) | 6,931 (22.1%) |
| 26 to 34 Years | 30,049 (77.2%) | 8,872 (22.8%) |
| 35 to 44 Years | 28,792 (79.6%) | 7,364 (20.4%) |
| 45 to 54 Years | 27,139 (82.4%) | 5,810 (17.6%) |
| 55 to 64 Years | 31,063 (87.6%) | 4,399 (12.4%) |
| 65 to 74 Years | 27,568 (98.3%) | 488 (1.7%) |
| 75 Years and older | 18,641 (99.6%) | 80 (0.4%) |
| Total | 249,091 (86.4%) | 39,083 (13.6%) |
Health Insurance Coverage by Citizenship Status in Chatham County
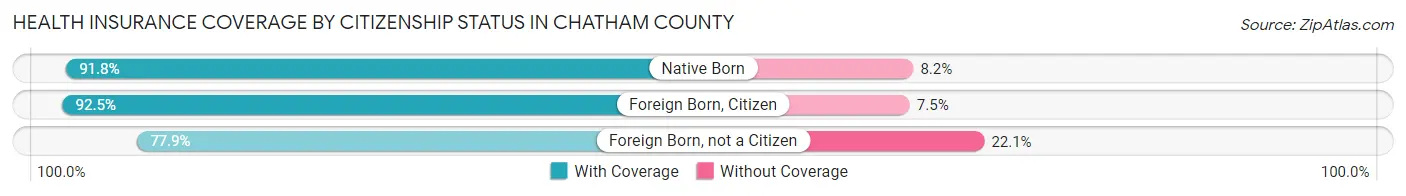
| Citizenship Status | With Coverage | Without Coverage |
| Native Born | 19,681 (91.8%) | 1,755 (8.2%) |
| Foreign Born, Citizen | 41,781 (92.5%) | 3,384 (7.5%) |
| Foreign Born, not a Citizen | 24,377 (77.9%) | 6,931 (22.1%) |
Health Insurance Coverage by Household Income in Chatham County
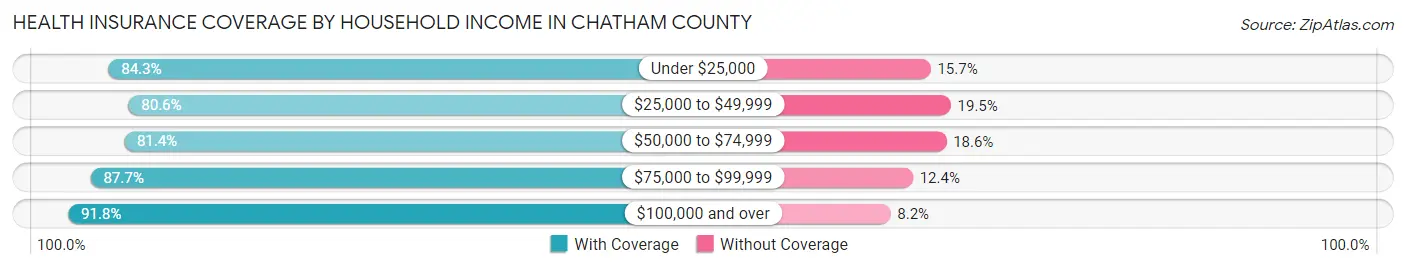
| Household Income | With Coverage | Without Coverage |
| Under $25,000 | 31,395 (84.3%) | 5,837 (15.7%) |
| $25,000 to $49,999 | 41,458 (80.5%) | 10,008 (19.5%) |
| $50,000 to $74,999 | 39,190 (81.4%) | 8,968 (18.6%) |
| $75,000 to $99,999 | 33,846 (87.6%) | 4,769 (12.3%) |
| $100,000 and over | 98,470 (91.8%) | 8,751 (8.2%) |
Public vs Private Health Insurance Coverage by Age in Chatham County
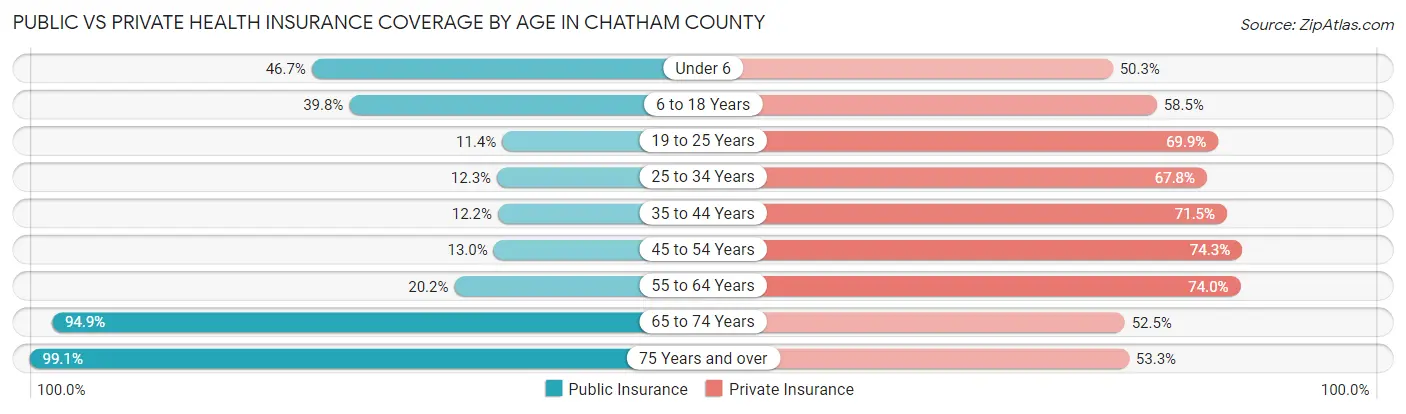
| Age Bracket | Public Insurance | Private Insurance |
| Under 6 | 10,013 (46.7%) | 10,778 (50.3%) |
| 6 to 18 Years | 17,955 (39.8%) | 26,401 (58.5%) |
| 19 to 25 Years | 3,561 (11.4%) | 21,872 (69.9%) |
| 25 to 34 Years | 4,798 (12.3%) | 26,373 (67.8%) |
| 35 to 44 Years | 4,399 (12.2%) | 25,839 (71.5%) |
| 45 to 54 Years | 4,269 (13.0%) | 24,475 (74.3%) |
| 55 to 64 Years | 7,178 (20.2%) | 26,236 (74.0%) |
| 65 to 74 Years | 26,630 (94.9%) | 14,731 (52.5%) |
| 75 Years and over | 18,547 (99.1%) | 9,977 (53.3%) |
| Total | 97,350 (33.8%) | 186,682 (64.8%) |
Disability Status by Sex by Age in Chatham County
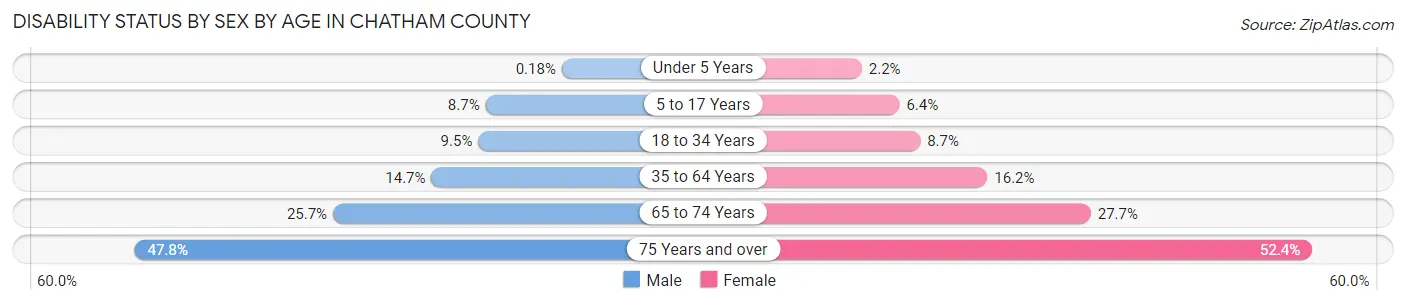
| Age Bracket | Male | Female |
| Under 5 Years | 16 (0.2%) | 192 (2.2%) |
| 5 to 17 Years | 1,937 (8.7%) | 1,392 (6.4%) |
| 18 to 34 Years | 3,364 (9.5%) | 3,481 (8.7%) |
| 35 to 64 Years | 7,158 (14.7%) | 9,056 (16.2%) |
| 65 to 74 Years | 3,197 (25.7%) | 4,326 (27.7%) |
| 75 Years and over | 3,783 (47.7%) | 5,655 (52.4%) |
Disability Class by Sex by Age in Chatham County
Disability Class: Hearing Difficulty
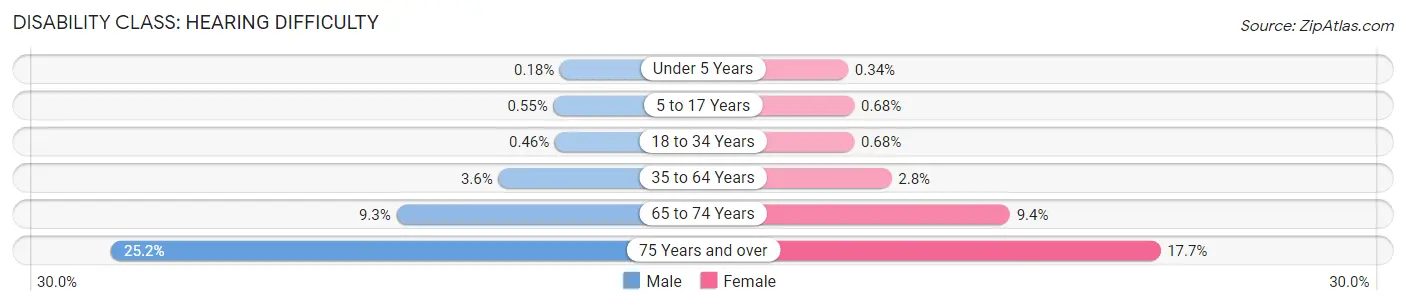
| Age Bracket | Male | Female |
| Under 5 Years | 16 (0.2%) | 29 (0.3%) |
| 5 to 17 Years | 123 (0.5%) | 147 (0.7%) |
| 18 to 34 Years | 163 (0.5%) | 270 (0.7%) |
| 35 to 64 Years | 1,759 (3.6%) | 1,541 (2.8%) |
| 65 to 74 Years | 1,157 (9.3%) | 1,458 (9.3%) |
| 75 Years and over | 1,995 (25.2%) | 1,914 (17.7%) |
Disability Class: Vision Difficulty
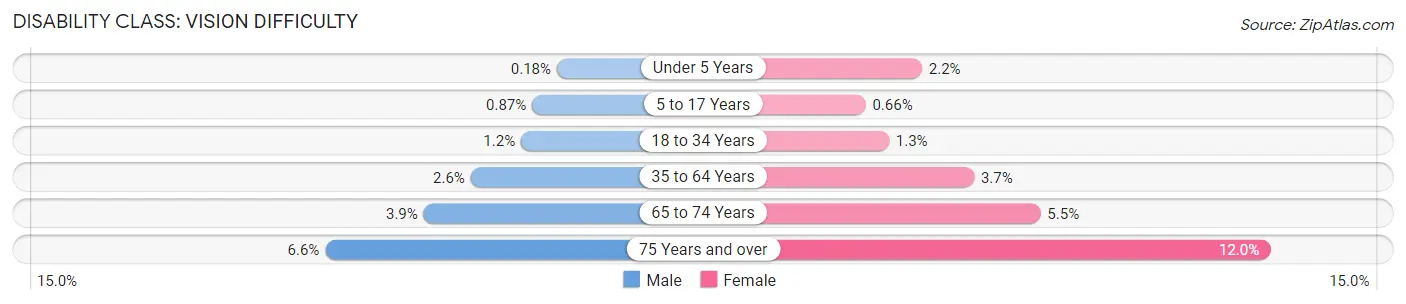
| Age Bracket | Male | Female |
| Under 5 Years | 16 (0.2%) | 192 (2.2%) |
| 5 to 17 Years | 195 (0.9%) | 144 (0.7%) |
| 18 to 34 Years | 417 (1.2%) | 523 (1.3%) |
| 35 to 64 Years | 1,258 (2.6%) | 2,054 (3.7%) |
| 65 to 74 Years | 485 (3.9%) | 862 (5.5%) |
| 75 Years and over | 525 (6.6%) | 1,290 (11.9%) |
Disability Class: Cognitive Difficulty
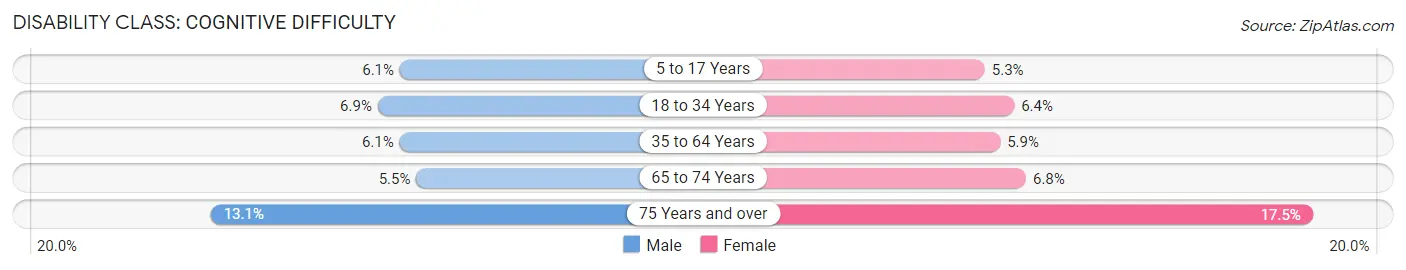
| Age Bracket | Male | Female |
| 5 to 17 Years | 1,356 (6.1%) | 1,152 (5.3%) |
| 18 to 34 Years | 2,444 (6.9%) | 2,549 (6.4%) |
| 35 to 64 Years | 2,962 (6.1%) | 3,287 (5.9%) |
| 65 to 74 Years | 680 (5.5%) | 1,067 (6.8%) |
| 75 Years and over | 1,037 (13.1%) | 1,888 (17.5%) |
Disability Class: Ambulatory Difficulty
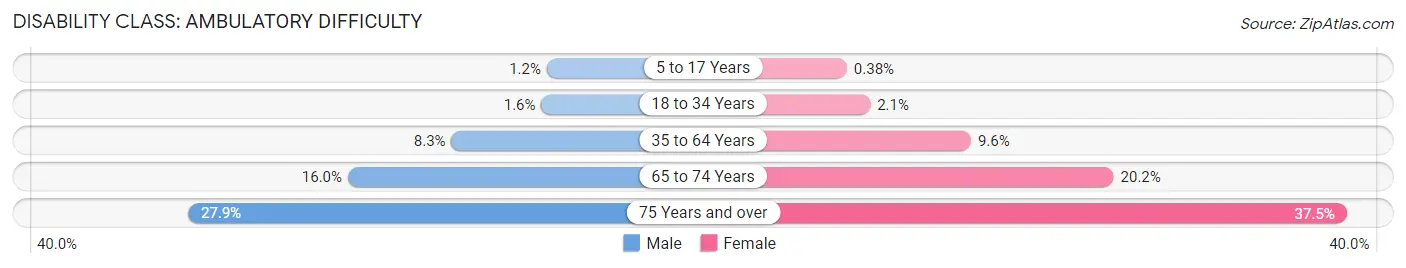
| Age Bracket | Male | Female |
| 5 to 17 Years | 274 (1.2%) | 82 (0.4%) |
| 18 to 34 Years | 580 (1.6%) | 840 (2.1%) |
| 35 to 64 Years | 4,044 (8.3%) | 5,360 (9.6%) |
| 65 to 74 Years | 1,993 (16.0%) | 3,147 (20.2%) |
| 75 Years and over | 2,208 (27.9%) | 4,047 (37.5%) |
Disability Class: Self-Care Difficulty
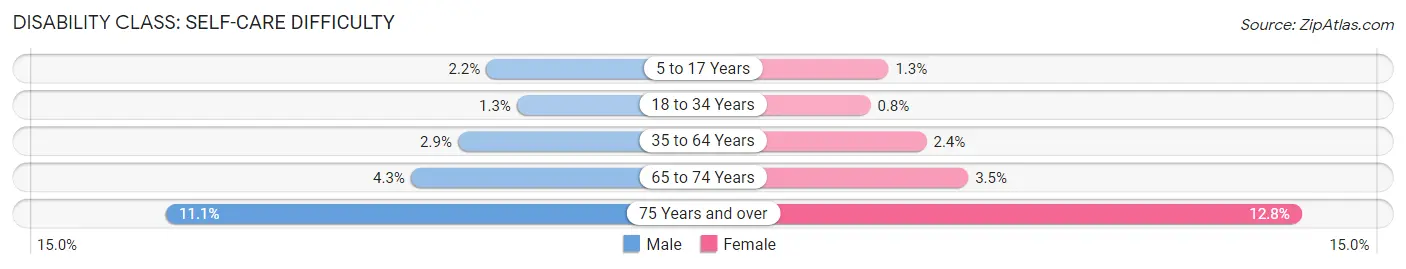
| Age Bracket | Male | Female |
| 5 to 17 Years | 481 (2.1%) | 281 (1.3%) |
| 18 to 34 Years | 460 (1.3%) | 318 (0.8%) |
| 35 to 64 Years | 1,433 (2.9%) | 1,321 (2.4%) |
| 65 to 74 Years | 530 (4.3%) | 549 (3.5%) |
| 75 Years and over | 876 (11.1%) | 1,382 (12.8%) |
Technology Access in Chatham County
Computing Device Access in Chatham County
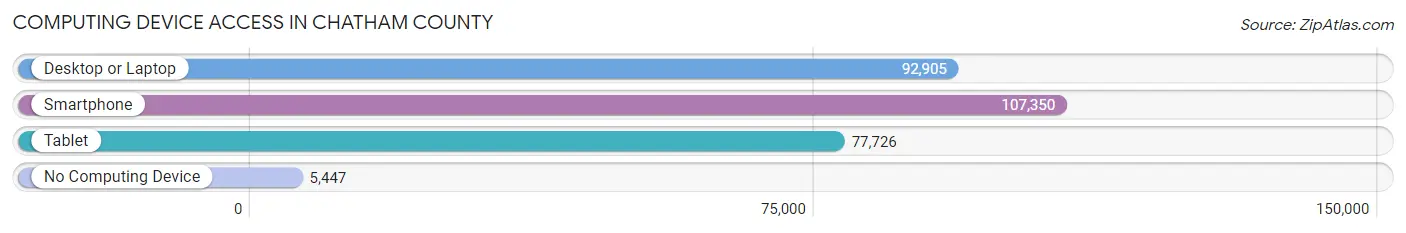
| Device Type | # Households | % Households |
| Desktop or Laptop | 92,905 | 79.1% |
| Smartphone | 107,350 | 91.4% |
| Tablet | 77,726 | 66.2% |
| No Computing Device | 5,447 | 4.6% |
| Total | 117,383 | 100.0% |
Internet Access in Chatham County
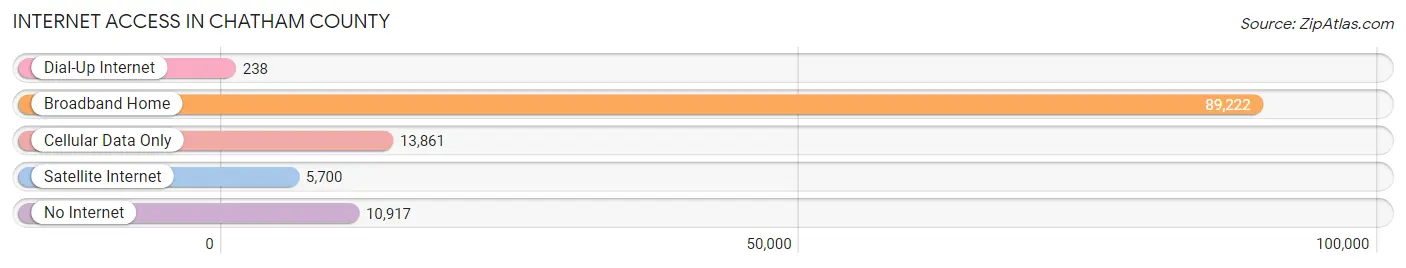
| Internet Type | # Households | % Households |
| Dial-Up Internet | 238 | 0.2% |
| Broadband Home | 89,222 | 76.0% |
| Cellular Data Only | 13,861 | 11.8% |
| Satellite Internet | 5,700 | 4.9% |
| No Internet | 10,917 | 9.3% |
| Total | 117,383 | 100.0% |
Chatham County Summary
Chatham County is located in the southeastern corner of the U.S. state of Georgia. It is bordered by the Atlantic Ocean to the east, Bryan County to the north, Effingham County to the west, and Liberty and McIntosh Counties to the south. The county seat is Savannah, the largest city in the county. Chatham County was created in 1777 from colonial parishes of St. John, St. Andrew, and St. James. It was named after William Pitt, 1st Earl of Chatham, a British statesman and Prime Minister.
Geography
Chatham County covers an area of 602 square miles, making it the second-largest county in Georgia by land area. The county is located in the Coastal Plain region of the state, with the majority of the land being flat and marshy. The Savannah River forms the eastern border of the county, and the Ogeechee River forms the western border. The county is home to several islands, including Ossabaw Island, Skidaway Island, and Wilmington Island.
The climate of Chatham County is humid subtropical, with hot, humid summers and mild winters. The average annual temperature is 64°F, and the average annual precipitation is 49.5 inches.
Demographics
As of the 2010 United States Census, there were 265,128 people, 106,906 households, and 68,845 families living in Chatham County. The population density was 441.3 people per square mile. The racial makeup of the county was 57.2% White, 33.7% Black or African American, 0.3% Native American, 2.7% Asian, 0.1% Pacific Islander, 4.2% from other races, and 2.0% from two or more races. Hispanic or Latino of any race were 8.7% of the population.
The median income for a household in Chatham County was $45,945, and the median income for a family was $54,817. The per capita income for the county was $25,945. About 11.2% of families and 14.7% of the population were below the poverty line, including 20.2% of those under age 18 and 10.2% of those age 65 or over.
Economy
Chatham County is home to a diverse economy, with a mix of manufacturing, services, and tourism. The county is home to several major employers, including Gulfstream Aerospace, JCB, and Georgia-Pacific. The Port of Savannah is the fourth-largest port in the United States by cargo volume, and is a major economic driver for the county. Tourism is also a major industry in Chatham County, with Savannah being a popular destination for both domestic and international travelers.
The county is home to several higher education institutions, including Savannah State University, South University, and Savannah Technical College. The county is also home to several hospitals, including Memorial University Medical Center and St. Joseph's/Candler.
Conclusion
Chatham County is a diverse and vibrant county located in the southeastern corner of Georgia. It is home to a mix of industries, including manufacturing, services, and tourism. The county is home to several major employers, and the Port of Savannah is a major economic driver for the region. The county is also home to several higher education institutions and hospitals.
Common Questions
What is the Total Population of Chatham County?
Total Population of Chatham County is 296,266.
What is the Total Male Population of Chatham County?
Total Male Population of Chatham County is 142,685.
What is the Total Female Population of Chatham County?
Total Female Population of Chatham County is 153,581.
What is the Ratio of Males per 100 Females in Chatham County?
There are 92.91 Males per 100 Females in Chatham County.
What is the Ratio of Females per 100 Males in Chatham County?
There are 107.64 Females per 100 Males in Chatham County.
What is the Median Population Age in Chatham County?
Median Population Age in Chatham County is 36.7 Years.
What is the Average Family Size in Chatham County
Average Family Size in Chatham County is 3.1 People.
What is the Average Household Size in Chatham County
Average Household Size in Chatham County is 2.4 People.
What is Per Capita Income in Chatham County?
Per Capita income in Chatham County is $37,637.
What is the Median Family Income in Chatham County?
Median Family Income in Chatham County is $81,441.
What is the Median Household income in Chatham County?
Median Household Income in Chatham County is $66,171.
What is Income or Wage Gap in Chatham County?
Income or Wage Gap in Chatham County is 17.3%.
Women in Chatham County earn 82.7 cents for every dollar earned by a man.
What is Family Income Deficit in Chatham County?
Family Income Deficit in Chatham County is $12,048.
Families that are below poverty line in Chatham County earn $12,048 less on average than the poverty threshold level.
What is Inequality or Gini Index in Chatham County?
Inequality or Gini Index in Chatham County is 0.48.
How Large is the Labor Force in Chatham County?
There are 155,625 People in the Labor Forcein in Chatham County.
What is the Percentage of People in the Labor Force in Chatham County?
64.6% of People are in the Labor Force in Chatham County.
What is the Unemployment Rate in Chatham County?
Unemployment Rate in Chatham County is 6.3%.