Fayette County, GA
Fayette County Map
Fayette County Overview
119,259
TOTAL POPULATION
58,066
MALE POPULATION
61,193
FEMALE POPULATION
94.89
MALES / 100 FEMALES
105.39
FEMALES / 100 MALES
43.2
MEDIAN AGE
3.1
AVG FAMILY SIZE
2.8
AVG HOUSEHOLD SIZE
$51,004
PER CAPITA INCOME
$122,500
AVG FAMILY INCOME
$105,910
AVG HOUSEHOLD INCOME
40.9%
WAGE / INCOME GAP [ % ]
59.1¢/ $1
WAGE / INCOME GAP [ $ ]
0.43
INEQUALITY / GINI INDEX
57,357
LABOR FORCE [ PEOPLE ]
59.8%
PERCENT IN LABOR FORCE
3.9%
UNEMPLOYMENT RATE
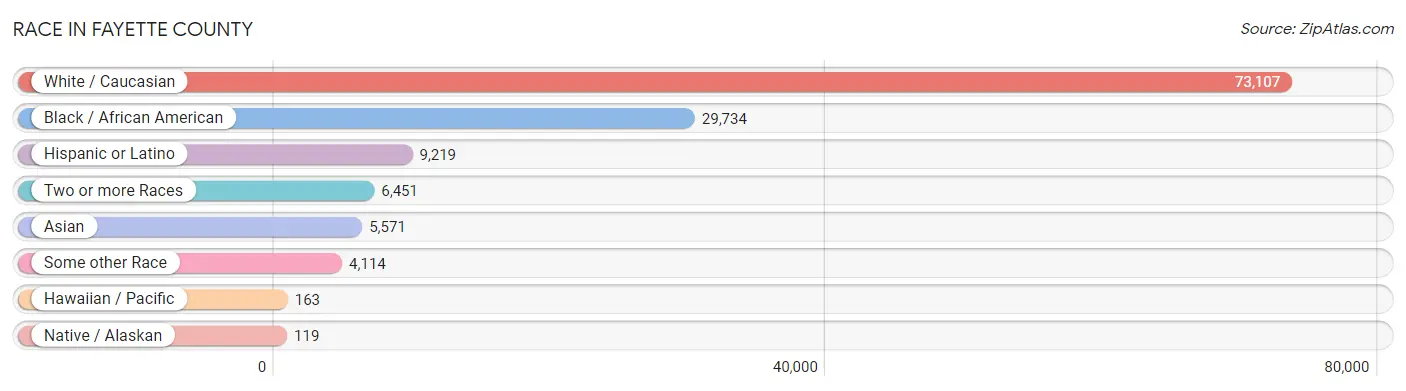
Race in Fayette County
The most populous races in Fayette County are White / Caucasian (73,107 | 61.3%), Black / African American (29,734 | 24.9%), and Hispanic or Latino (9,219 | 7.7%).
| Race | # Population | % Population |
| Asian | 5,571 | 4.7% |
| Black / African American | 29,734 | 24.9% |
| Hawaiian / Pacific | 163 | 0.1% |
| Hispanic or Latino | 9,219 | 7.7% |
| Native / Alaskan | 119 | 0.1% |
| White / Caucasian | 73,107 | 61.3% |
| Two or more Races | 6,451 | 5.4% |
| Some other Race | 4,114 | 3.5% |
| Total | 119,259 | 100.0% |
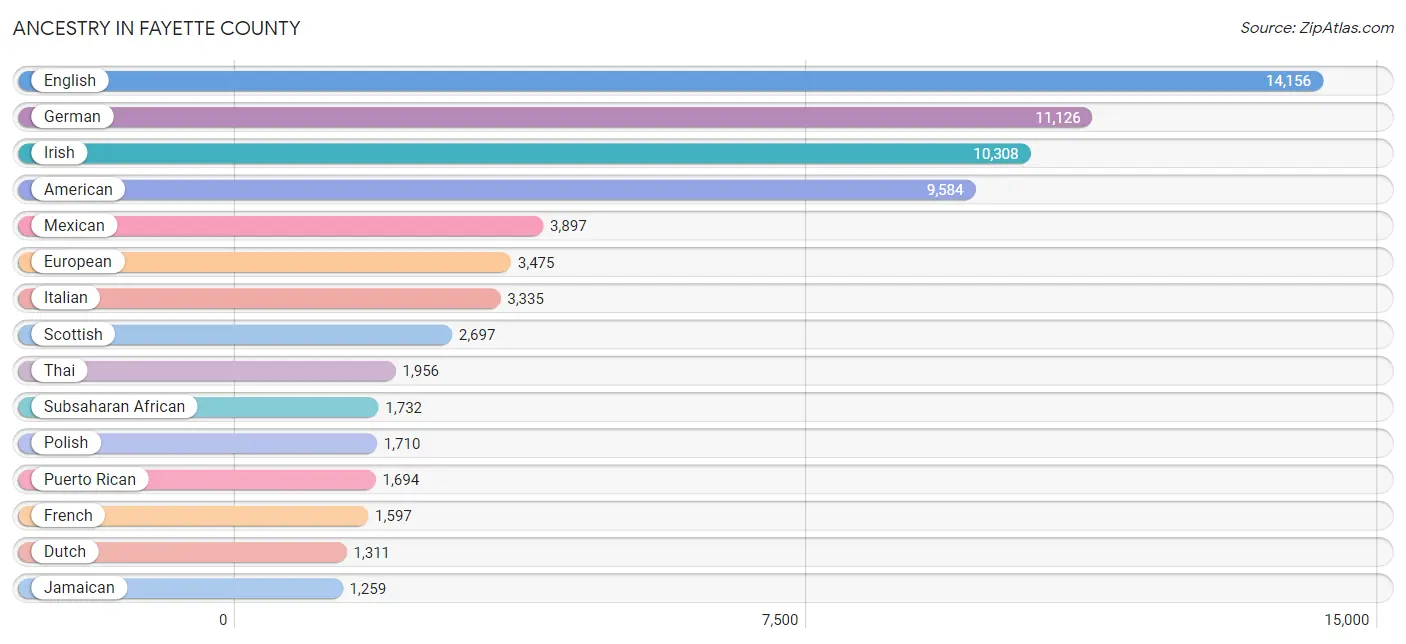
Ancestry in Fayette County
The most populous ancestries reported in Fayette County are English (14,156 | 11.9%), German (11,126 | 9.3%), Irish (10,308 | 8.6%), American (9,584 | 8.0%), and Mexican (3,897 | 3.3%), together accounting for 41.2% of all Fayette County residents.
| Ancestry | # Population | % Population |
| African | 717 | 0.6% |
| Albanian | 340 | 0.3% |
| American | 9,584 | 8.0% |
| Arab | 513 | 0.4% |
| Argentinean | 405 | 0.3% |
| Armenian | 22 | 0.0% |
| Austrian | 96 | 0.1% |
| Bahamian | 58 | 0.1% |
| Barbadian | 14 | 0.0% |
| Belgian | 113 | 0.1% |
| Belizean | 24 | 0.0% |
| Bhutanese | 1,077 | 0.9% |
| Blackfeet | 71 | 0.1% |
| Bolivian | 49 | 0.0% |
| Brazilian | 153 | 0.1% |
| British | 1,209 | 1.0% |
| British West Indian | 20 | 0.0% |
| Bulgarian | 15 | 0.0% |
| Burmese | 1,122 | 0.9% |
| Cajun | 12 | 0.0% |
| Cambodian | 48 | 0.0% |
| Canadian | 97 | 0.1% |
| Cape Verdean | 28 | 0.0% |
| Celtic | 13 | 0.0% |
| Central American | 1,035 | 0.9% |
| Central American Indian | 196 | 0.2% |
| Cherokee | 347 | 0.3% |
| Chilean | 1 | 0.0% |
| Choctaw | 24 | 0.0% |
| Colombian | 422 | 0.4% |
| Costa Rican | 38 | 0.0% |
| Creek | 86 | 0.1% |
| Cuban | 761 | 0.6% |
| Czech | 267 | 0.2% |
| Czechoslovakian | 131 | 0.1% |
| Danish | 154 | 0.1% |
| Delaware | 67 | 0.1% |
| Dominican | 151 | 0.1% |
| Dutch | 1,311 | 1.1% |
| Eastern European | 253 | 0.2% |
| Ecuadorian | 55 | 0.1% |
| Egyptian | 222 | 0.2% |
| English | 14,156 | 11.9% |
| Ethiopian | 13 | 0.0% |
| European | 3,475 | 2.9% |
| Filipino | 31 | 0.0% |
| Finnish | 206 | 0.2% |
| French | 1,597 | 1.3% |
| French Canadian | 526 | 0.4% |
| German | 11,126 | 9.3% |
| Greek | 357 | 0.3% |
| Guamanian / Chamorro | 279 | 0.2% |
| Guatemalan | 229 | 0.2% |
| Guyanese | 99 | 0.1% |
| Haitian | 571 | 0.5% |
| Honduran | 348 | 0.3% |
| Hungarian | 614 | 0.5% |
| Indian (Asian) | 800 | 0.7% |
| Indonesian | 26 | 0.0% |
| Iranian | 18 | 0.0% |
| Irish | 10,308 | 8.6% |
| Italian | 3,335 | 2.8% |
| Jamaican | 1,259 | 1.1% |
| Japanese | 122 | 0.1% |
| Korean | 1,102 | 0.9% |
| Laotian | 57 | 0.1% |
| Latvian | 24 | 0.0% |
| Lebanese | 96 | 0.1% |
| Lithuanian | 77 | 0.1% |
| Macedonian | 51 | 0.0% |
| Malaysian | 77 | 0.1% |
| Maltese | 15 | 0.0% |
| Mexican | 3,897 | 3.3% |
| Mexican American Indian | 17 | 0.0% |
| Mongolian | 39 | 0.0% |
| Moroccan | 41 | 0.0% |
| Native Hawaiian | 43 | 0.0% |
| Nicaraguan | 40 | 0.0% |
| Nigerian | 829 | 0.7% |
| Northern European | 293 | 0.3% |
| Norwegian | 896 | 0.7% |
| Pakistani | 126 | 0.1% |
| Palestinian | 13 | 0.0% |
| Panamanian | 177 | 0.2% |
| Pennsylvania German | 28 | 0.0% |
| Peruvian | 141 | 0.1% |
| Polish | 1,710 | 1.4% |
| Portuguese | 202 | 0.2% |
| Potawatomi | 8 | 0.0% |
| Puerto Rican | 1,694 | 1.4% |
| Romanian | 93 | 0.1% |
| Russian | 416 | 0.4% |
| Salvadoran | 178 | 0.2% |
| Scandinavian | 781 | 0.6% |
| Scotch-Irish | 1,166 | 1.0% |
| Scottish | 2,697 | 2.3% |
| Sierra Leonean | 17 | 0.0% |
| Sioux | 42 | 0.0% |
| Slavic | 28 | 0.0% |
| Slovak | 235 | 0.2% |
| Slovene | 7 | 0.0% |
| South African | 71 | 0.1% |
| South American | 1,244 | 1.0% |
| South American Indian | 17 | 0.0% |
| Spaniard | 112 | 0.1% |
| Spanish | 38 | 0.0% |
| Spanish American | 25 | 0.0% |
| Sri Lankan | 417 | 0.4% |
| Subsaharan African | 1,732 | 1.5% |
| Swedish | 599 | 0.5% |
| Swiss | 155 | 0.1% |
| Thai | 1,956 | 1.6% |
| Trinidadian and Tobagonian | 174 | 0.2% |
| Turkish | 85 | 0.1% |
| Ukrainian | 255 | 0.2% |
| Venezuelan | 171 | 0.1% |
| Welsh | 738 | 0.6% |
| West Indian | 185 | 0.2% |
| Zimbabwean | 58 | 0.1% | View All 119 Rows |
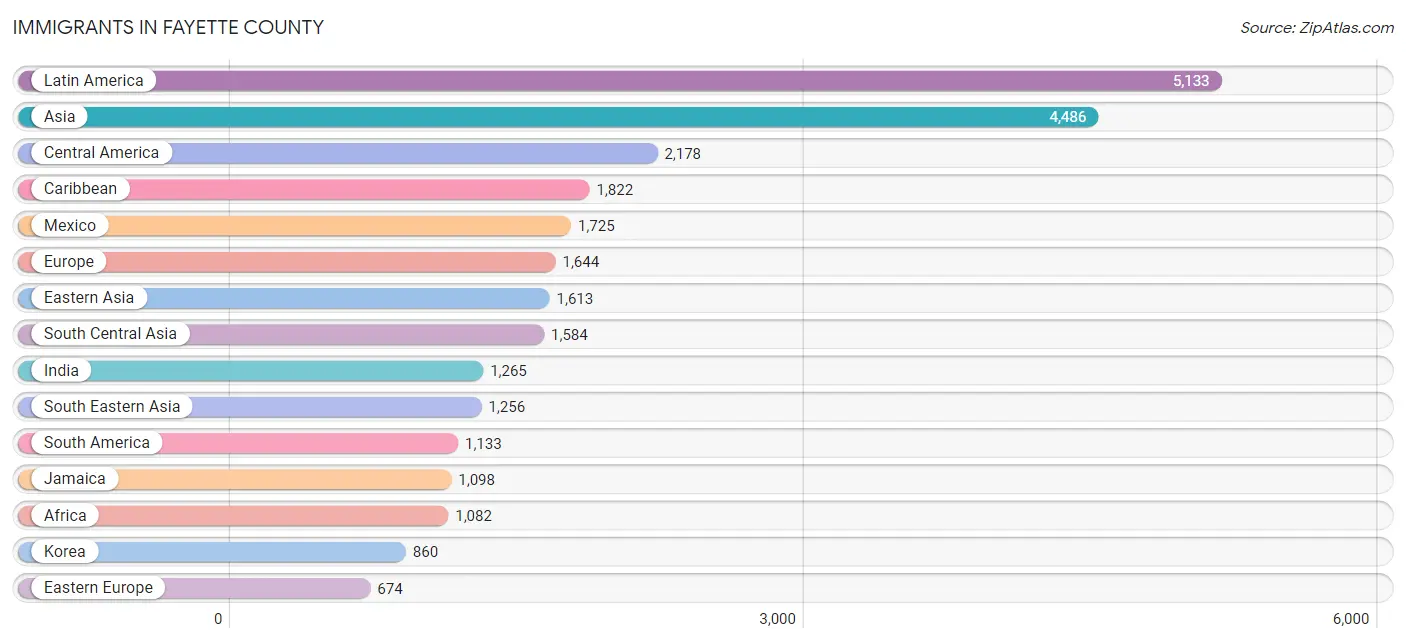
Immigrants in Fayette County
The most numerous immigrant groups reported in Fayette County came from Latin America (5,133 | 4.3%), Asia (4,486 | 3.8%), Central America (2,178 | 1.8%), Caribbean (1,822 | 1.5%), and Mexico (1,725 | 1.5%), together accounting for 12.9% of all Fayette County residents.
| Immigration Origin | # Population | % Population |
| Africa | 1,082 | 0.9% |
| Argentina | 173 | 0.2% |
| Asia | 4,486 | 3.8% |
| Australia | 10 | 0.0% |
| Bahamas | 29 | 0.0% |
| Bangladesh | 132 | 0.1% |
| Barbados | 28 | 0.0% |
| Bolivia | 57 | 0.1% |
| Brazil | 162 | 0.1% |
| Bulgaria | 15 | 0.0% |
| Cambodia | 84 | 0.1% |
| Cameroon | 68 | 0.1% |
| Canada | 440 | 0.4% |
| Caribbean | 1,822 | 1.5% |
| Central America | 2,178 | 1.8% |
| Chile | 1 | 0.0% |
| China | 395 | 0.3% |
| Colombia | 357 | 0.3% |
| Cuba | 116 | 0.1% |
| Czechoslovakia | 53 | 0.0% |
| Dominica | 23 | 0.0% |
| Dominican Republic | 90 | 0.1% |
| Eastern Africa | 84 | 0.1% |
| Eastern Asia | 1,613 | 1.3% |
| Eastern Europe | 674 | 0.6% |
| Ecuador | 55 | 0.1% |
| Egypt | 77 | 0.1% |
| El Salvador | 106 | 0.1% |
| England | 141 | 0.1% |
| Ethiopia | 13 | 0.0% |
| Europe | 1,644 | 1.4% |
| France | 27 | 0.0% |
| Germany | 335 | 0.3% |
| Ghana | 24 | 0.0% |
| Guatemala | 53 | 0.0% |
| Guyana | 67 | 0.1% |
| Haiti | 263 | 0.2% |
| Honduras | 222 | 0.2% |
| Hong Kong | 45 | 0.0% |
| Hungary | 30 | 0.0% |
| India | 1,265 | 1.1% |
| Indonesia | 75 | 0.1% |
| Iran | 18 | 0.0% |
| Ireland | 15 | 0.0% |
| Italy | 41 | 0.0% |
| Jamaica | 1,098 | 0.9% |
| Japan | 358 | 0.3% |
| Kenya | 12 | 0.0% |
| Korea | 860 | 0.7% |
| Laos | 23 | 0.0% |
| Latin America | 5,133 | 4.3% |
| Latvia | 10 | 0.0% |
| Lebanon | 6 | 0.0% |
| Malaysia | 70 | 0.1% |
| Mexico | 1,725 | 1.5% |
| Middle Africa | 68 | 0.1% |
| Morocco | 3 | 0.0% |
| Nepal | 42 | 0.0% |
| Netherlands | 179 | 0.2% |
| Nigeria | 531 | 0.4% |
| North Macedonia | 51 | 0.0% |
| Northern Africa | 110 | 0.1% |
| Northern Europe | 335 | 0.3% |
| Oceania | 37 | 0.0% |
| Pakistan | 108 | 0.1% |
| Panama | 72 | 0.1% |
| Peru | 96 | 0.1% |
| Philippines | 629 | 0.5% |
| Poland | 142 | 0.1% |
| Portugal | 10 | 0.0% |
| Romania | 11 | 0.0% |
| Russia | 39 | 0.0% |
| Scotland | 34 | 0.0% |
| Sierra Leone | 36 | 0.0% |
| Singapore | 44 | 0.0% |
| South Africa | 159 | 0.1% |
| South America | 1,133 | 0.9% |
| South Central Asia | 1,584 | 1.3% |
| South Eastern Asia | 1,256 | 1.1% |
| Southern Europe | 94 | 0.1% |
| Spain | 28 | 0.0% |
| Sri Lanka | 19 | 0.0% |
| Taiwan | 57 | 0.1% |
| Thailand | 117 | 0.1% |
| Trinidad and Tobago | 116 | 0.1% |
| Turkey | 27 | 0.0% |
| Ukraine | 66 | 0.1% |
| Venezuela | 165 | 0.1% |
| Vietnam | 202 | 0.2% |
| West Indies | 14 | 0.0% |
| Western Africa | 645 | 0.5% |
| Western Asia | 33 | 0.0% |
| Western Europe | 541 | 0.4% |
| Zimbabwe | 58 | 0.1% | View All 94 Rows |
Sex and Age in Fayette County
Sex and Age in Fayette County
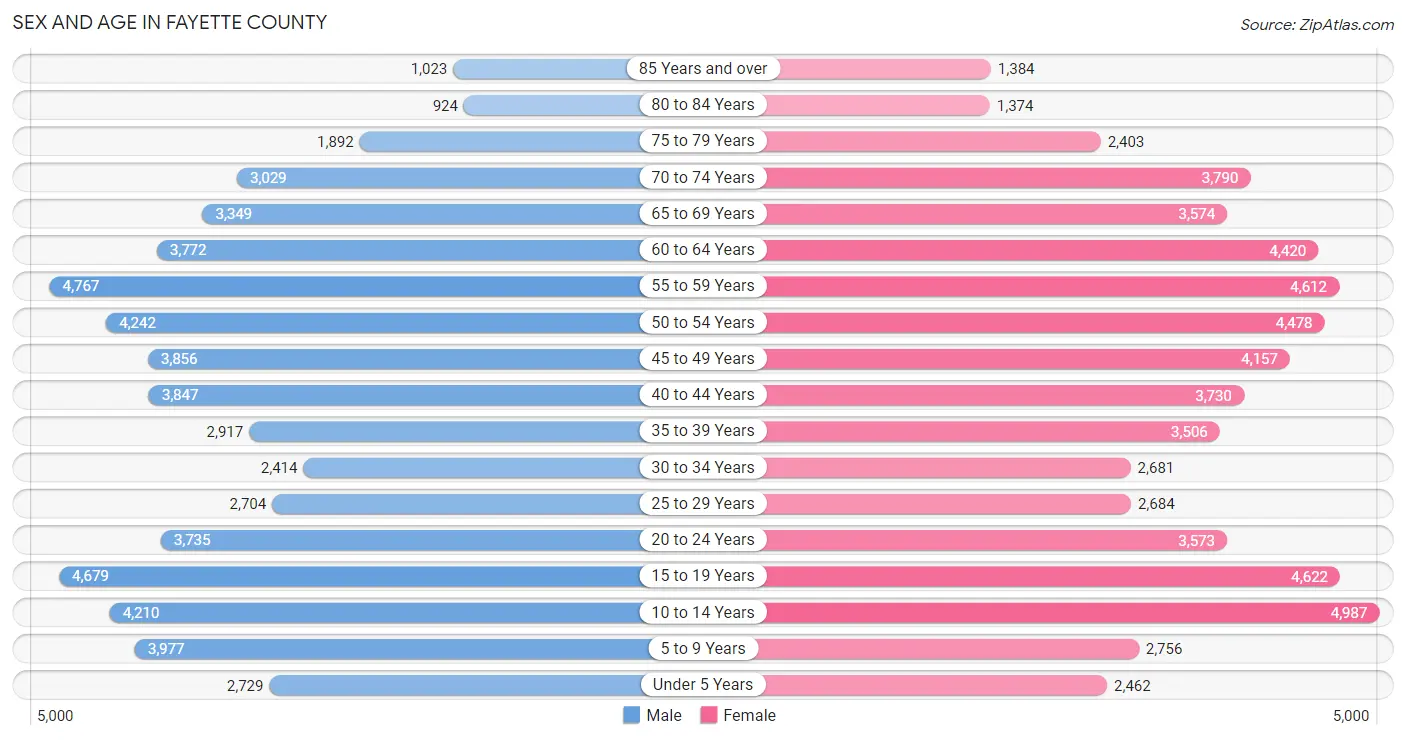
The most populous age groups in Fayette County are 55 to 59 Years (4,767 | 8.2%) for men and 10 to 14 Years (4,987 | 8.2%) for women.
| Age Bracket | Male | Female |
| Under 5 Years | 2,729 (4.7%) | 2,462 (4.0%) |
| 5 to 9 Years | 3,977 (6.9%) | 2,756 (4.5%) |
| 10 to 14 Years | 4,210 (7.2%) | 4,987 (8.2%) |
| 15 to 19 Years | 4,679 (8.1%) | 4,622 (7.5%) |
| 20 to 24 Years | 3,735 (6.4%) | 3,573 (5.8%) |
| 25 to 29 Years | 2,704 (4.7%) | 2,684 (4.4%) |
| 30 to 34 Years | 2,414 (4.2%) | 2,681 (4.4%) |
| 35 to 39 Years | 2,917 (5.0%) | 3,506 (5.7%) |
| 40 to 44 Years | 3,847 (6.6%) | 3,730 (6.1%) |
| 45 to 49 Years | 3,856 (6.6%) | 4,157 (6.8%) |
| 50 to 54 Years | 4,242 (7.3%) | 4,478 (7.3%) |
| 55 to 59 Years | 4,767 (8.2%) | 4,612 (7.5%) |
| 60 to 64 Years | 3,772 (6.5%) | 4,420 (7.2%) |
| 65 to 69 Years | 3,349 (5.8%) | 3,574 (5.8%) |
| 70 to 74 Years | 3,029 (5.2%) | 3,790 (6.2%) |
| 75 to 79 Years | 1,892 (3.3%) | 2,403 (3.9%) |
| 80 to 84 Years | 924 (1.6%) | 1,374 (2.2%) |
| 85 Years and over | 1,023 (1.8%) | 1,384 (2.3%) |
| Total | 58,066 (100.0%) | 61,193 (100.0%) |
Families and Households in Fayette County
Median Family Size in Fayette County
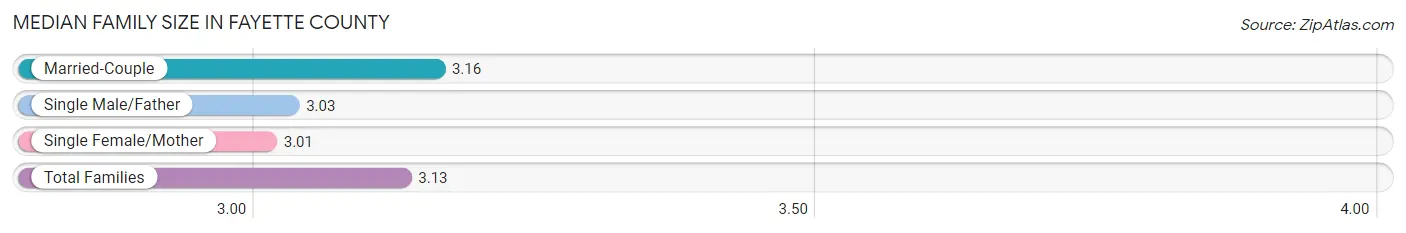
The median family size in Fayette County is 3.13 persons per family, with married-couple families (27,024 | 80.1%) accounting for the largest median family size of 3.16 persons per family. On the other hand, single female/mother families (4,731 | 14.0%) represent the smallest median family size with 3.01 persons per family.
| Family Type | # Families | Family Size |
| Married-Couple | 27,024 (80.1%) | 3.16 |
| Single Male/Father | 2,001 (5.9%) | 3.03 |
| Single Female/Mother | 4,731 (14.0%) | 3.01 |
| Total Families | 33,756 (100.0%) | 3.13 |
Median Household Size in Fayette County
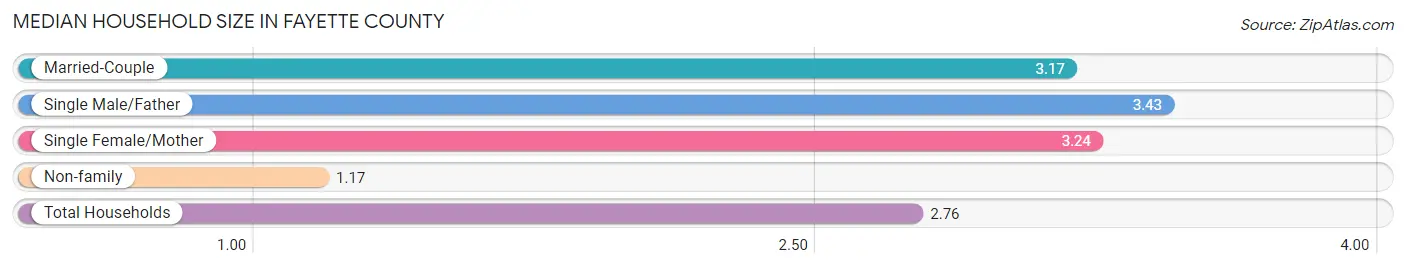
The median household size in Fayette County is 2.76 persons per household, with single male/father households (2,001 | 4.7%) accounting for the largest median household size of 3.43 persons per household. non-family households (9,132 | 21.3%) represent the smallest median household size with 1.17 persons per household.
| Household Type | # Households | Household Size |
| Married-Couple | 27,024 (63.0%) | 3.17 |
| Single Male/Father | 2,001 (4.7%) | 3.43 |
| Single Female/Mother | 4,731 (11.0%) | 3.24 |
| Non-family | 9,132 (21.3%) | 1.17 |
| Total Households | 42,888 (100.0%) | 2.76 |
Household Size by Marriage Status in Fayette County
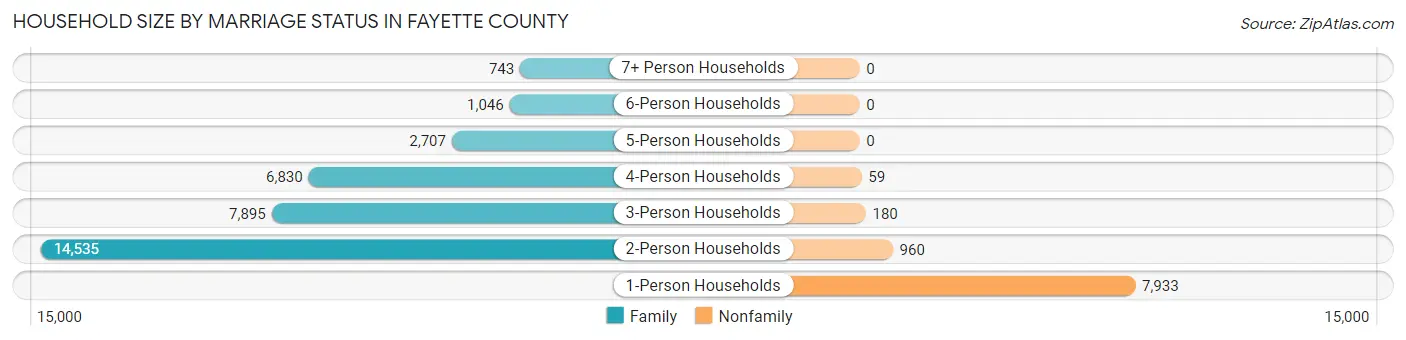
Out of a total of 42,888 households in Fayette County, 33,756 (78.7%) are family households, while 9,132 (21.3%) are nonfamily households. The most numerous type of family households are 2-person households, comprising 14,535, and the most common type of nonfamily households are 1-person households, comprising 7,933.
| Household Size | Family Households | Nonfamily Households |
| 1-Person Households | - | 7,933 (18.5%) |
| 2-Person Households | 14,535 (33.9%) | 960 (2.2%) |
| 3-Person Households | 7,895 (18.4%) | 180 (0.4%) |
| 4-Person Households | 6,830 (15.9%) | 59 (0.1%) |
| 5-Person Households | 2,707 (6.3%) | 0 (0.0%) |
| 6-Person Households | 1,046 (2.4%) | 0 (0.0%) |
| 7+ Person Households | 743 (1.7%) | 0 (0.0%) |
| Total | 33,756 (78.7%) | 9,132 (21.3%) |
Female Fertility in Fayette County
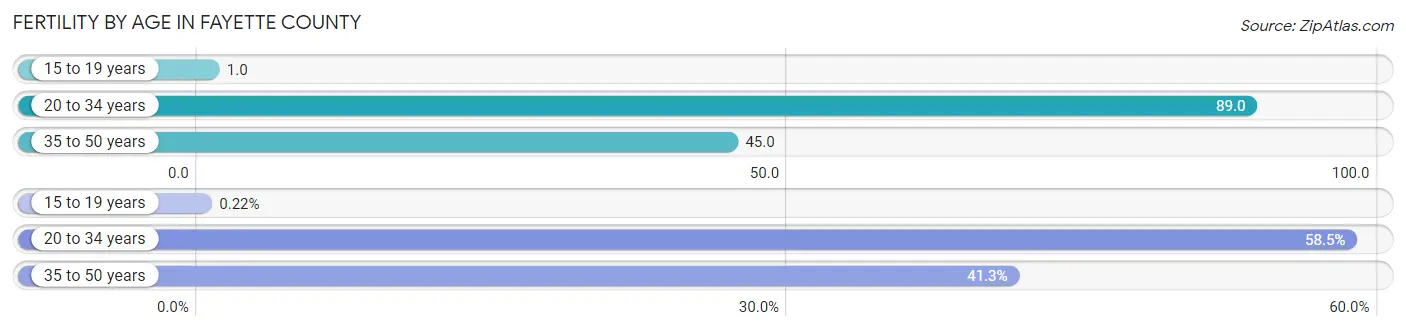
Fertility by Age in Fayette County
Average fertility rate in Fayette County is 52.0 births per 1,000 women. Women in the age bracket of 20 to 34 years have the highest fertility rate with 89.0 births per 1,000 women. Women in the age bracket of 20 to 34 years acount for 58.5% of all women with births.
| Age Bracket | Women with Births | Births / 1,000 Women |
| 15 to 19 years | 3 (0.2%) | 1.0 |
| 20 to 34 years | 796 (58.5%) | 89.0 |
| 35 to 50 years | 562 (41.3%) | 45.0 |
| Total | 1,361 (100.0%) | 52.0 |
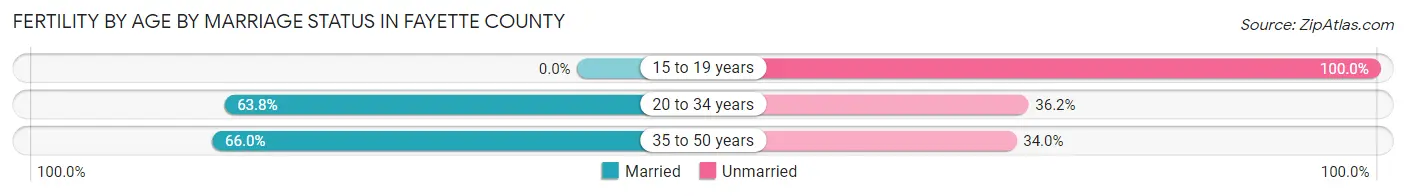
Fertility by Age by Marriage Status in Fayette County
64.6% of women with births (1,361) in Fayette County are married. The highest percentage of unmarried women with births falls into 15 to 19 years age bracket with 100.0% of them unmarried at the time of birth, while the lowest percentage of unmarried women with births belong to 35 to 50 years age bracket with 34.0% of them unmarried.
| Age Bracket | Married | Unmarried |
| 15 to 19 years | 0 (0.0%) | 3 (100.0%) |
| 20 to 34 years | 508 (63.8%) | 288 (36.2%) |
| 35 to 50 years | 371 (66.0%) | 191 (34.0%) |
| Total | 879 (64.6%) | 482 (35.4%) |
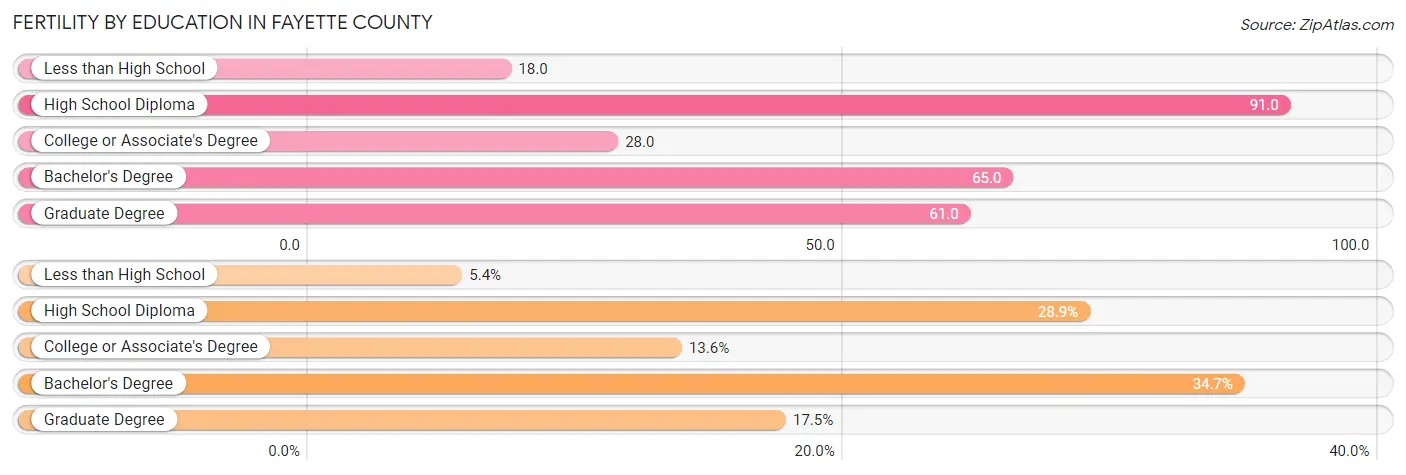
Fertility by Education in Fayette County
Average fertility rate in Fayette County is 52.0 births per 1,000 women. Women with the education attainment of high school diploma have the highest fertility rate of 91.0 births per 1,000 women, while women with the education attainment of less than high school have the lowest fertility at 18.0 births per 1,000 women. Women with the education attainment of bachelor's degree represent 34.7% of all women with births.
| Educational Attainment | Women with Births | Births / 1,000 Women |
| Less than High School | 73 (5.4%) | 18.0 |
| High School Diploma | 393 (28.9%) | 91.0 |
| College or Associate's Degree | 185 (13.6%) | 28.0 |
| Bachelor's Degree | 472 (34.7%) | 65.0 |
| Graduate Degree | 238 (17.5%) | 61.0 |
| Total | 1,361 (100.0%) | 52.0 |
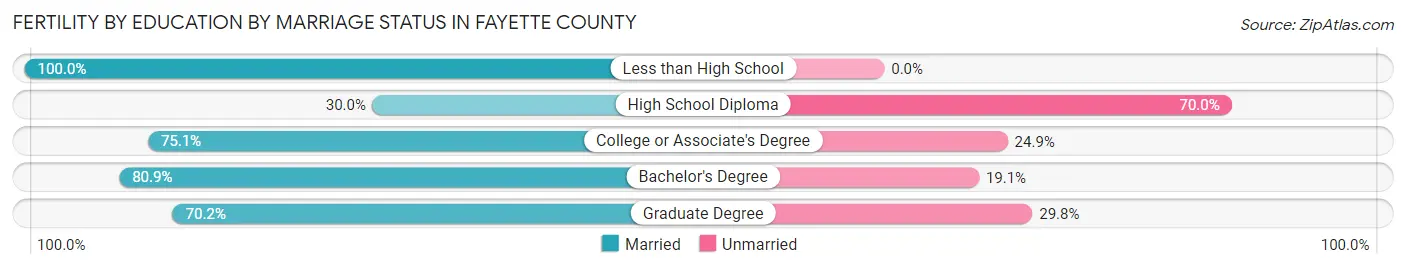
Fertility by Education by Marriage Status in Fayette County
35.4% of women with births in Fayette County are unmarried. Women with the educational attainment of less than high school are most likely to be married with 100.0% of them married at childbirth, while women with the educational attainment of high school diploma are least likely to be married with 70.0% of them unmarried at childbirth.
| Educational Attainment | Married | Unmarried |
| Less than High School | 73 (100.0%) | 0 (0.0%) |
| High School Diploma | 118 (30.0%) | 275 (70.0%) |
| College or Associate's Degree | 139 (75.1%) | 46 (24.9%) |
| Bachelor's Degree | 382 (80.9%) | 90 (19.1%) |
| Graduate Degree | 167 (70.2%) | 71 (29.8%) |
| Total | 879 (64.6%) | 482 (35.4%) |
Income in Fayette County
Income Overview in Fayette County
Per Capita Income in Fayette County is $51,004, while median incomes of families and households are $122,500 and $105,910 respectively.
| Characteristic | Number | Measure |
| Per Capita Income | 119,259 | $51,004 |
| Median Family Income | 33,756 | $122,500 |
| Mean Family Income | 33,756 | $156,139 |
| Median Household Income | 42,888 | $105,910 |
| Mean Household Income | 42,888 | $138,756 |
| Income Deficit | 33,756 | $0 |
| Wage / Income Gap (%) | 119,259 | 40.86% |
| Wage / Income Gap ($) | 119,259 | 59.14¢ per $1 |
| Gini / Inequality Index | 119,259 | 0.43 |
Earnings by Sex in Fayette County
Average Earnings in Fayette County are $52,738, $68,812 for men and $40,692 for women, a difference of 40.9%.
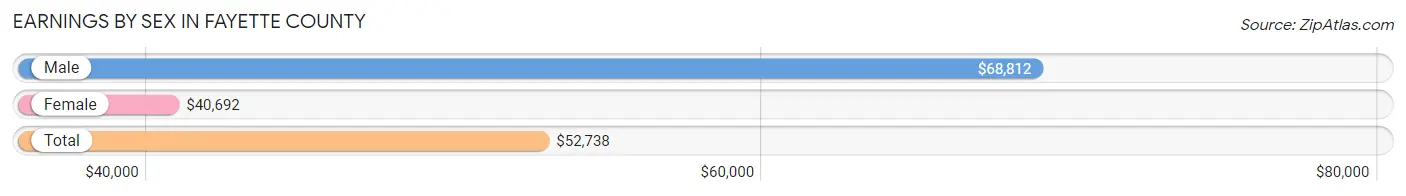
| Sex | Number | Average Earnings |
| Male | 32,110 (53.8%) | $68,812 |
| Female | 27,565 (46.2%) | $40,692 |
| Total | 59,675 (100.0%) | $52,738 |
Earnings by Sex by Income Bracket in Fayette County
The most common earnings brackets in Fayette County are $100,000+ for men (11,168 | 34.8%) and $75,000 to $99,999 for women (3,495 | 12.7%).
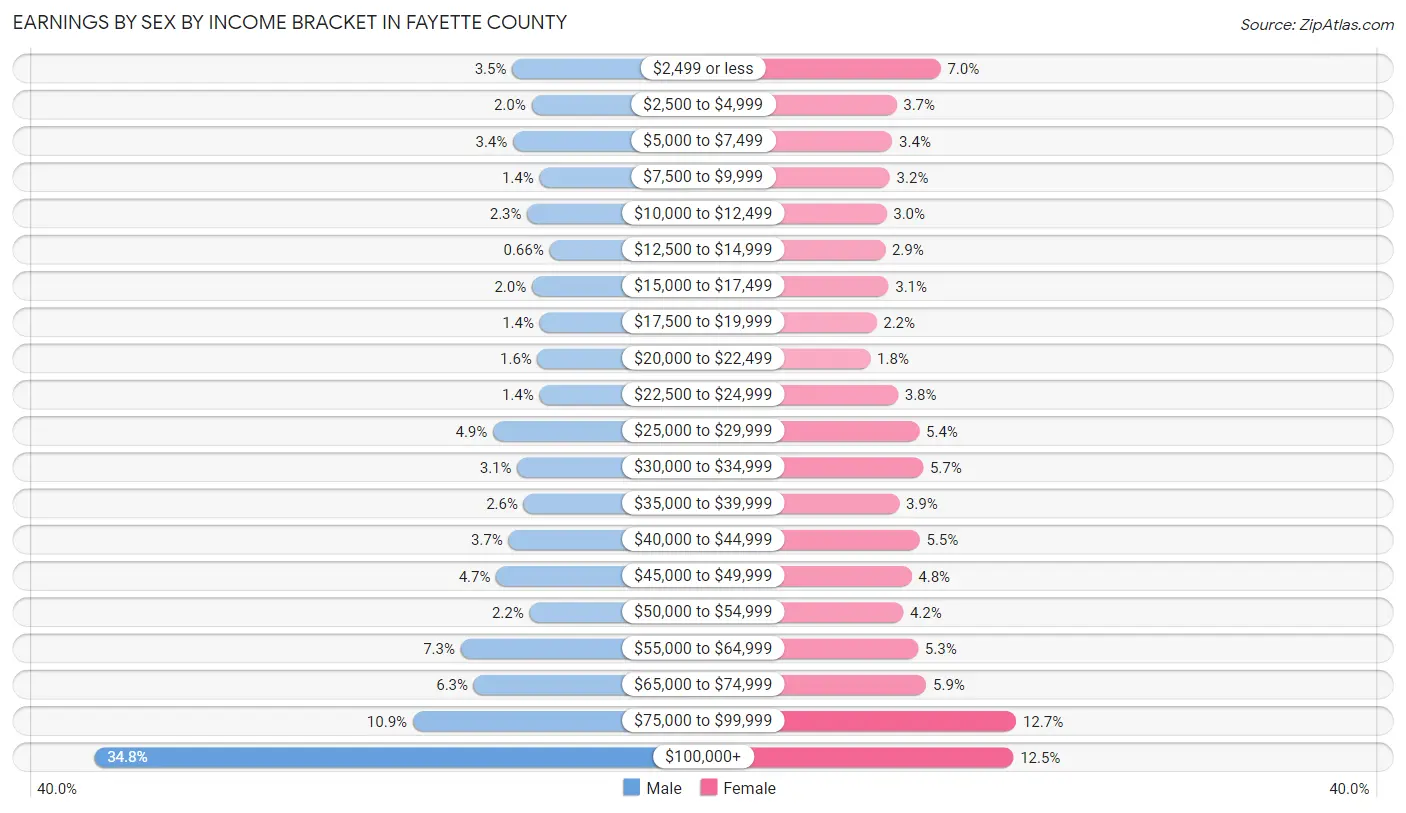
| Income | Male | Female |
| $2,499 or less | 1,109 (3.5%) | 1,934 (7.0%) |
| $2,500 to $4,999 | 645 (2.0%) | 1,022 (3.7%) |
| $5,000 to $7,499 | 1,090 (3.4%) | 936 (3.4%) |
| $7,500 to $9,999 | 453 (1.4%) | 886 (3.2%) |
| $10,000 to $12,499 | 744 (2.3%) | 815 (3.0%) |
| $12,500 to $14,999 | 212 (0.7%) | 787 (2.9%) |
| $15,000 to $17,499 | 632 (2.0%) | 856 (3.1%) |
| $17,500 to $19,999 | 447 (1.4%) | 610 (2.2%) |
| $20,000 to $22,499 | 499 (1.5%) | 483 (1.8%) |
| $22,500 to $24,999 | 453 (1.4%) | 1,053 (3.8%) |
| $25,000 to $29,999 | 1,571 (4.9%) | 1,494 (5.4%) |
| $30,000 to $34,999 | 987 (3.1%) | 1,575 (5.7%) |
| $35,000 to $39,999 | 833 (2.6%) | 1,079 (3.9%) |
| $40,000 to $44,999 | 1,198 (3.7%) | 1,501 (5.4%) |
| $45,000 to $49,999 | 1,492 (4.6%) | 1,334 (4.8%) |
| $50,000 to $54,999 | 695 (2.2%) | 1,160 (4.2%) |
| $55,000 to $64,999 | 2,347 (7.3%) | 1,469 (5.3%) |
| $65,000 to $74,999 | 2,034 (6.3%) | 1,638 (5.9%) |
| $75,000 to $99,999 | 3,501 (10.9%) | 3,495 (12.7%) |
| $100,000+ | 11,168 (34.8%) | 3,438 (12.5%) |
| Total | 32,110 (100.0%) | 27,565 (100.0%) |
Earnings by Sex by Educational Attainment in Fayette County
Average earnings in Fayette County are $80,021 for men and $46,853 for women, a difference of 41.4%. Men with an educational attainment of graduate degree enjoy the highest average annual earnings of $133,618, while those with less than high school education earn the least with $46,172. Women with an educational attainment of graduate degree earn the most with the average annual earnings of $75,967, while those with less than high school education have the smallest earnings of $19,000.
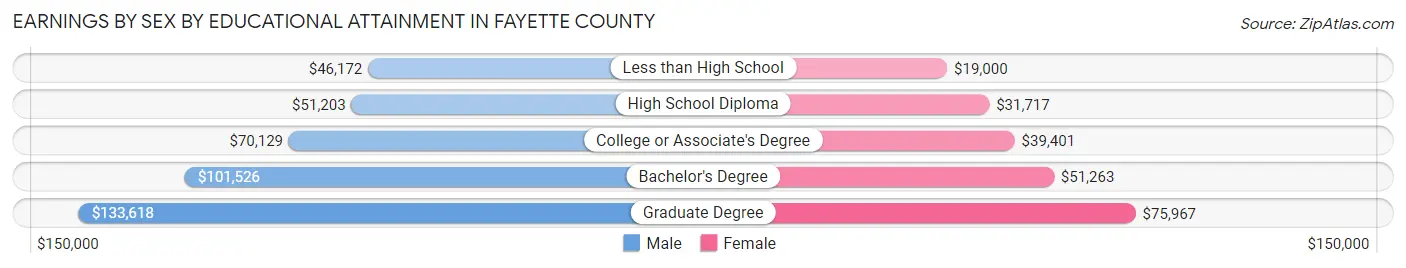
| Educational Attainment | Male Income | Female Income |
| Less than High School | $46,172 | $19,000 |
| High School Diploma | $51,203 | $31,717 |
| College or Associate's Degree | $70,129 | $39,401 |
| Bachelor's Degree | $101,526 | $51,263 |
| Graduate Degree | $133,618 | $75,967 |
| Total | $80,021 | $46,853 |
Family Income in Fayette County
Family Income Brackets in Fayette County
According to the Fayette County family income data, there are 8,068 families falling into the $200,000+ income range, which is the most common income bracket and makes up 23.9% of all families. Conversely, the $10,000 to $14,999 income bracket is the least frequent group with only 68 families (0.2%) belonging to this category.
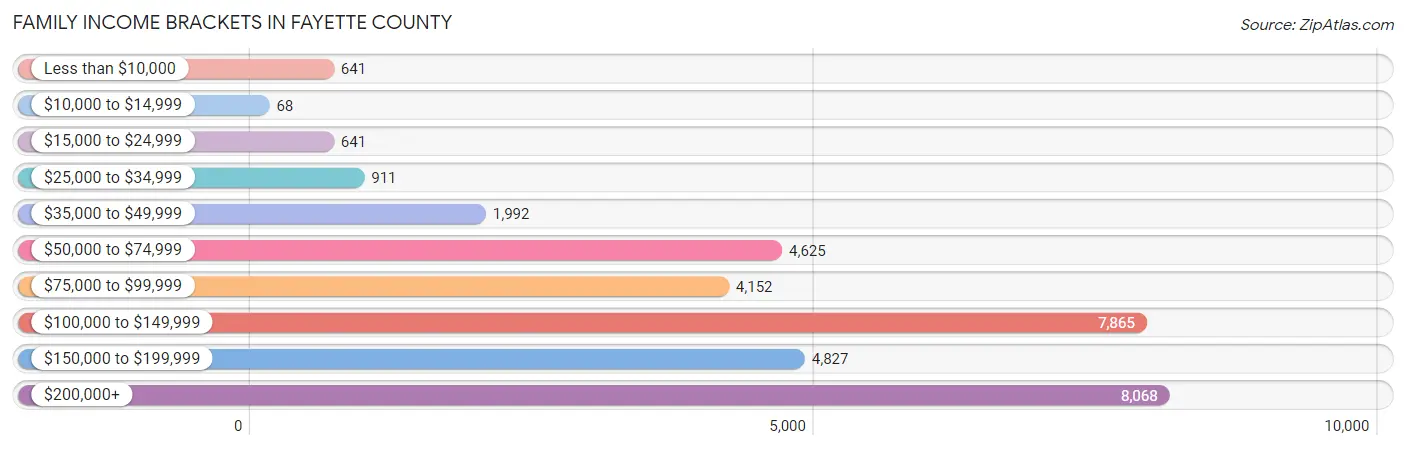
| Income Bracket | # Families | % Families |
| Less than $10,000 | 641 | 1.9% |
| $10,000 to $14,999 | 68 | 0.2% |
| $15,000 to $24,999 | 641 | 1.9% |
| $25,000 to $34,999 | 911 | 2.7% |
| $35,000 to $49,999 | 1,992 | 5.9% |
| $50,000 to $74,999 | 4,625 | 13.7% |
| $75,000 to $99,999 | 4,152 | 12.3% |
| $100,000 to $149,999 | 7,865 | 23.3% |
| $150,000 to $199,999 | 4,827 | 14.3% |
| $200,000+ | 8,068 | 23.9% |
Family Income by Famaliy Size in Fayette County
6-person families (974 | 2.9%) account for the highest median family income in Fayette County with $164,207 per family, while 2-person families (15,425 | 45.7%) have the highest median income of $52,298 per family member.
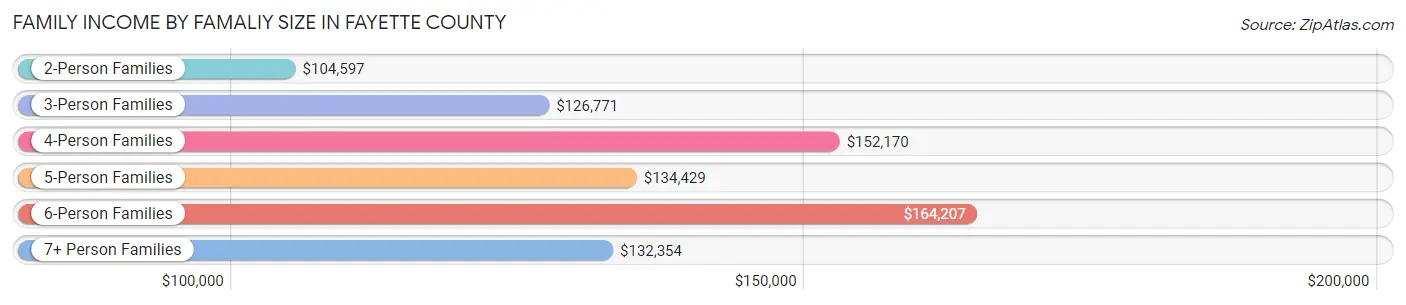
| Income Bracket | # Families | Median Income |
| 2-Person Families | 15,425 (45.7%) | $104,597 |
| 3-Person Families | 7,605 (22.5%) | $126,771 |
| 4-Person Families | 6,489 (19.2%) | $152,170 |
| 5-Person Families | 2,544 (7.5%) | $134,429 |
| 6-Person Families | 974 (2.9%) | $164,207 |
| 7+ Person Families | 719 (2.1%) | $132,354 |
| Total | 33,756 (100.0%) | $122,500 |
Family Income by Number of Earners in Fayette County
The median family income in Fayette County is $122,500, with families comprising 3+ earners (3,588) having the highest median family income of $169,050, while families with no earners (5,280) have the lowest median family income of $76,024, accounting for 10.6% and 15.6% of families, respectively.
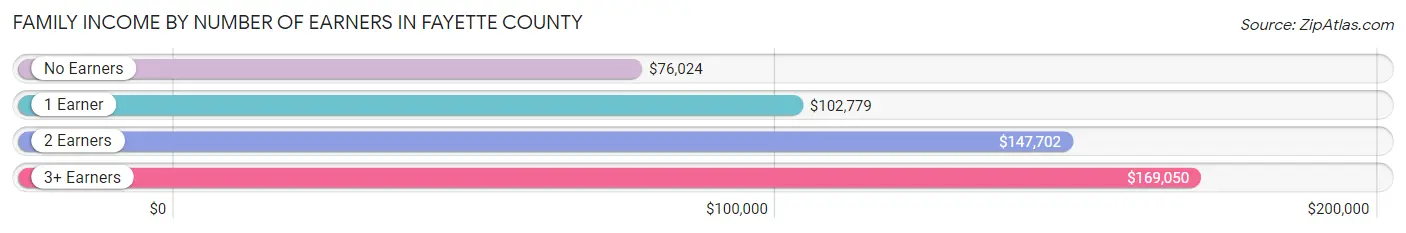
| Number of Earners | # Families | Median Income |
| No Earners | 5,280 (15.6%) | $76,024 |
| 1 Earner | 11,203 (33.2%) | $102,779 |
| 2 Earners | 13,685 (40.5%) | $147,702 |
| 3+ Earners | 3,588 (10.6%) | $169,050 |
| Total | 33,756 (100.0%) | $122,500 |
Household Income in Fayette County
Household Income Brackets in Fayette County
With 9,135 households falling in the category, the $100,000 to $149,999 income range is the most frequent in Fayette County, accounting for 21.3% of all households. In contrast, only 515 households (1.2%) fall into the $10,000 to $14,999 income bracket, making it the least populous group.
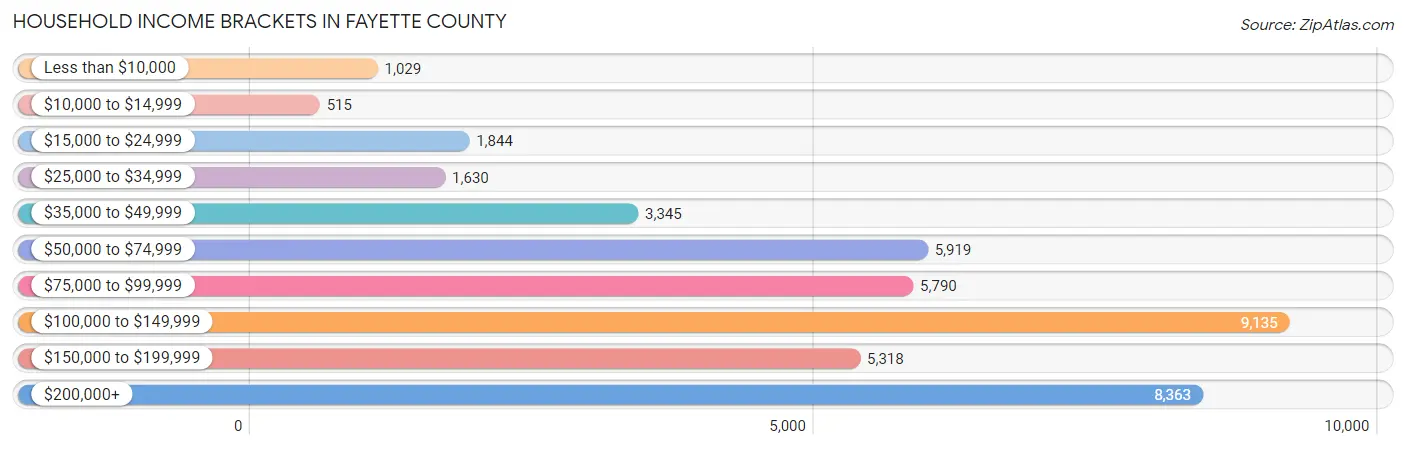
| Income Bracket | # Households | % Households |
| Less than $10,000 | 1,029 | 2.4% |
| $10,000 to $14,999 | 515 | 1.2% |
| $15,000 to $24,999 | 1,844 | 4.3% |
| $25,000 to $34,999 | 1,630 | 3.8% |
| $35,000 to $49,999 | 3,345 | 7.8% |
| $50,000 to $74,999 | 5,919 | 13.8% |
| $75,000 to $99,999 | 5,790 | 13.5% |
| $100,000 to $149,999 | 9,135 | 21.3% |
| $150,000 to $199,999 | 5,318 | 12.4% |
| $200,000+ | 8,363 | 19.5% |
Household Income by Householder Age in Fayette County
The median household income in Fayette County is $105,910, with the highest median household income of $139,210 found in the 45 to 64 years age bracket for the primary householder. A total of 18,496 households (43.1%) fall into this category. Meanwhile, the 15 to 24 years age bracket for the primary householder has the lowest median household income of $59,138, with 996 households (2.3%) in this group.
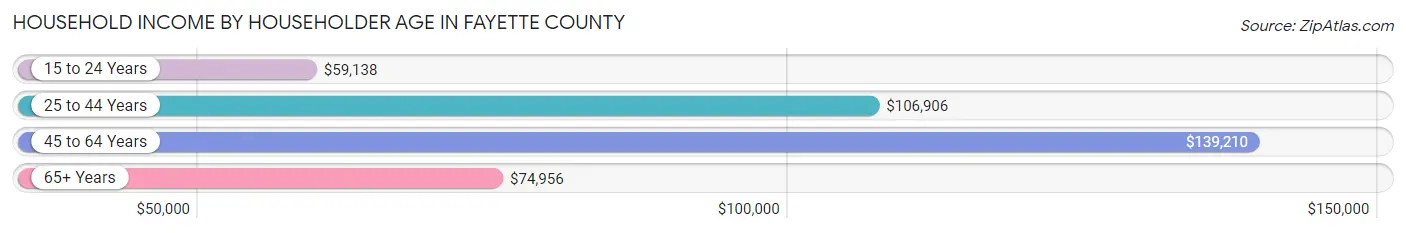
| Income Bracket | # Households | Median Income |
| 15 to 24 Years | 996 (2.3%) | $59,138 |
| 25 to 44 Years | 10,331 (24.1%) | $106,906 |
| 45 to 64 Years | 18,496 (43.1%) | $139,210 |
| 65+ Years | 13,065 (30.5%) | $74,956 |
| Total | 42,888 (100.0%) | $105,910 |
Poverty in Fayette County
Income Below Poverty by Sex and Age in Fayette County
With 4.0% poverty level for males and 6.5% for females among the residents of Fayette County, under 5 year old males and 18 to 24 year old females are the most vulnerable to poverty, with 210 males (7.8%) and 680 females (13.2%) in their respective age groups living below the poverty level.
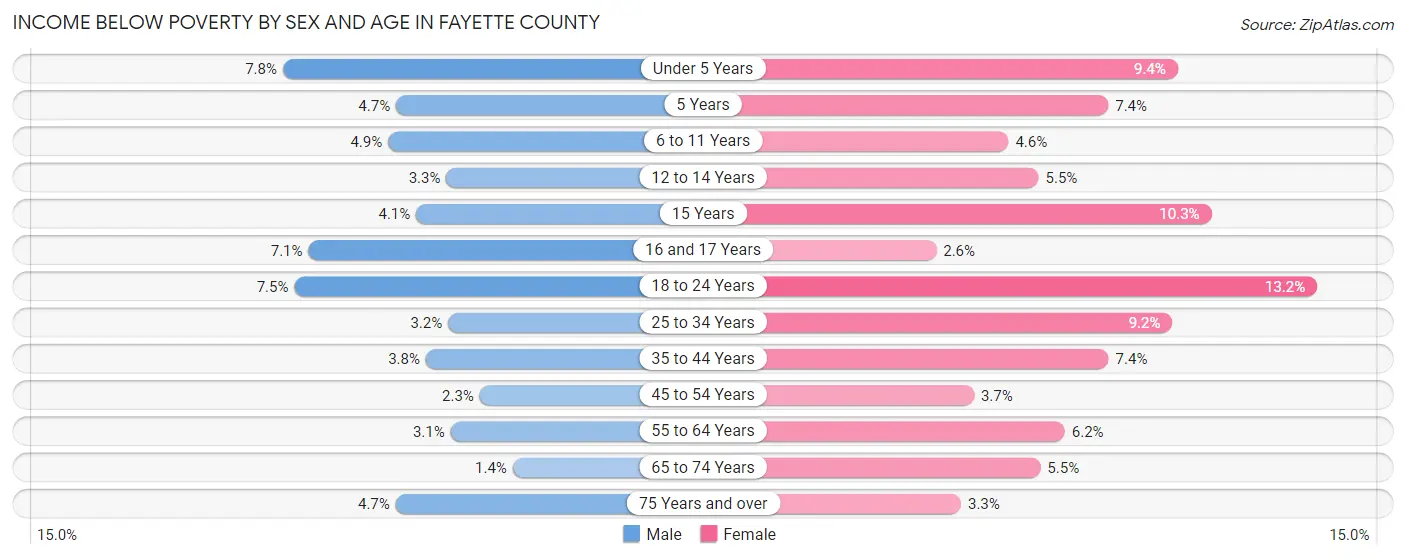
| Age Bracket | Male | Female |
| Under 5 Years | 210 (7.8%) | 230 (9.3%) |
| 5 Years | 30 (4.7%) | 33 (7.4%) |
| 6 to 11 Years | 228 (4.9%) | 201 (4.6%) |
| 12 to 14 Years | 90 (3.3%) | 151 (5.5%) |
| 15 Years | 41 (4.1%) | 126 (10.3%) |
| 16 and 17 Years | 143 (7.1%) | 48 (2.6%) |
| 18 to 24 Years | 402 (7.5%) | 680 (13.2%) |
| 25 to 34 Years | 161 (3.2%) | 491 (9.2%) |
| 35 to 44 Years | 257 (3.8%) | 537 (7.4%) |
| 45 to 54 Years | 188 (2.3%) | 317 (3.7%) |
| 55 to 64 Years | 266 (3.1%) | 559 (6.2%) |
| 65 to 74 Years | 89 (1.4%) | 406 (5.5%) |
| 75 Years and over | 178 (4.7%) | 164 (3.3%) |
| Total | 2,283 (4.0%) | 3,943 (6.5%) |
Income Above Poverty by Sex and Age in Fayette County
According to the poverty statistics in Fayette County, males aged 65 to 74 years and females aged 16 and 17 years are the age groups that are most secure financially, with 98.6% of males and 97.4% of females in these age groups living above the poverty line.
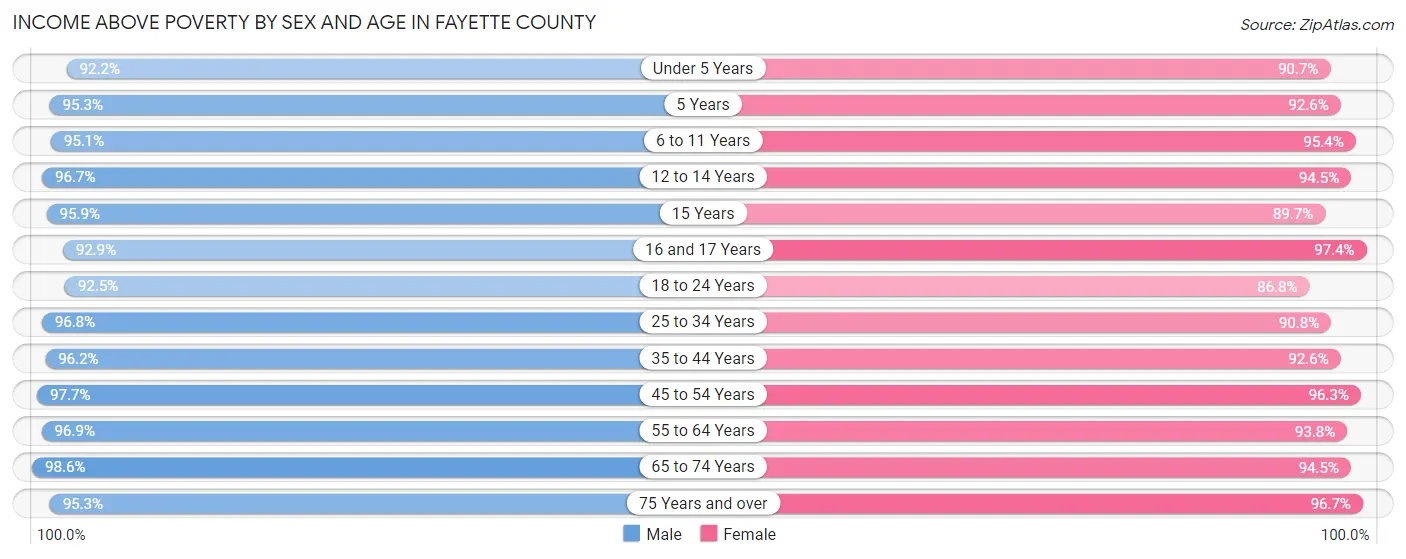
| Age Bracket | Male | Female |
| Under 5 Years | 2,480 (92.2%) | 2,231 (90.6%) |
| 5 Years | 614 (95.3%) | 412 (92.6%) |
| 6 to 11 Years | 4,447 (95.1%) | 4,135 (95.4%) |
| 12 to 14 Years | 2,669 (96.7%) | 2,605 (94.5%) |
| 15 Years | 959 (95.9%) | 1,098 (89.7%) |
| 16 and 17 Years | 1,871 (92.9%) | 1,776 (97.4%) |
| 18 to 24 Years | 4,966 (92.5%) | 4,459 (86.8%) |
| 25 to 34 Years | 4,859 (96.8%) | 4,844 (90.8%) |
| 35 to 44 Years | 6,460 (96.2%) | 6,690 (92.6%) |
| 45 to 54 Years | 7,891 (97.7%) | 8,290 (96.3%) |
| 55 to 64 Years | 8,212 (96.9%) | 8,436 (93.8%) |
| 65 to 74 Years | 6,231 (98.6%) | 6,940 (94.5%) |
| 75 Years and over | 3,636 (95.3%) | 4,783 (96.7%) |
| Total | 55,295 (96.0%) | 56,699 (93.5%) |
Income Below Poverty Among Married-Couple Families in Fayette County
The poverty statistics for married-couple families in Fayette County show that 2.1% or 555 of the total 27,024 families live below the poverty line. Families with 5 or more children have the highest poverty rate of 21.0%, comprising of 67 families. On the other hand, families with no children have the lowest poverty rate of 1.5%, which includes 239 families.
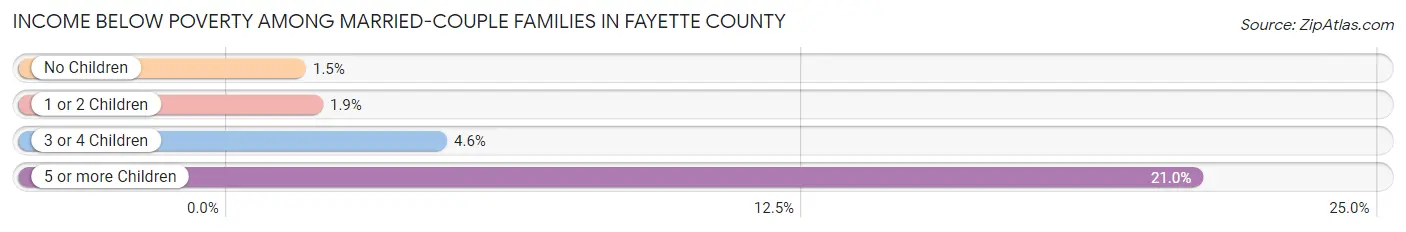
| Children | Above Poverty | Below Poverty |
| No Children | 15,879 (98.5%) | 239 (1.5%) |
| 1 or 2 Children | 8,450 (98.2%) | 159 (1.8%) |
| 3 or 4 Children | 1,888 (95.5%) | 90 (4.5%) |
| 5 or more Children | 252 (79.0%) | 67 (21.0%) |
| Total | 26,469 (98.0%) | 555 (2.1%) |
Income Below Poverty Among Single-Parent Households in Fayette County
According to the poverty data in Fayette County, 2.3% or 46 single-father households and 13.1% or 621 single-mother households are living below the poverty line. Among single-father households, those with no children have the highest poverty rate, with 41 households (4.9%) experiencing poverty. Likewise, among single-mother households, those with 1 or 2 children have the highest poverty rate, with 369 households (14.6%) falling below the poverty line.
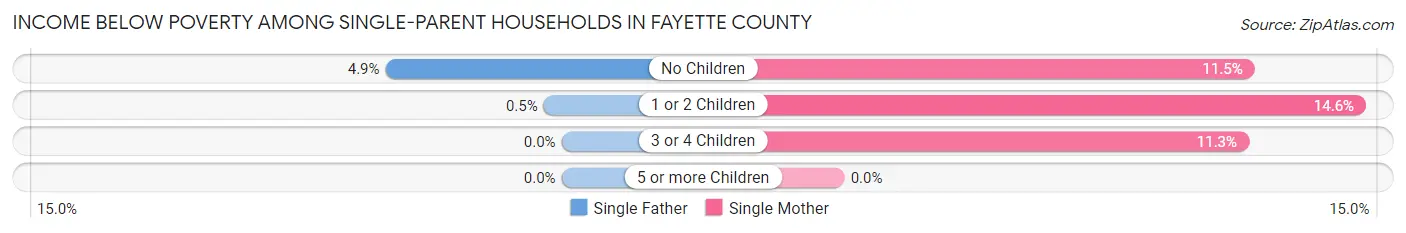
| Children | Single Father | Single Mother |
| No Children | 41 (4.9%) | 199 (11.5%) |
| 1 or 2 Children | 5 (0.5%) | 369 (14.6%) |
| 3 or 4 Children | 0 (0.0%) | 53 (11.3%) |
| 5 or more Children | 0 (0.0%) | 0 (0.0%) |
| Total | 46 (2.3%) | 621 (13.1%) |
Income Below Poverty Among Married-Couple vs Single-Parent Households in Fayette County
The poverty data for Fayette County shows that 555 of the married-couple family households (2.1%) and 667 of the single-parent households (9.9%) are living below the poverty level. Within the married-couple family households, those with 5 or more children have the highest poverty rate, with 67 households (21.0%) falling below the poverty line. Among the single-parent households, those with 1 or 2 children have the highest poverty rate, with 374 household (10.6%) living below poverty.
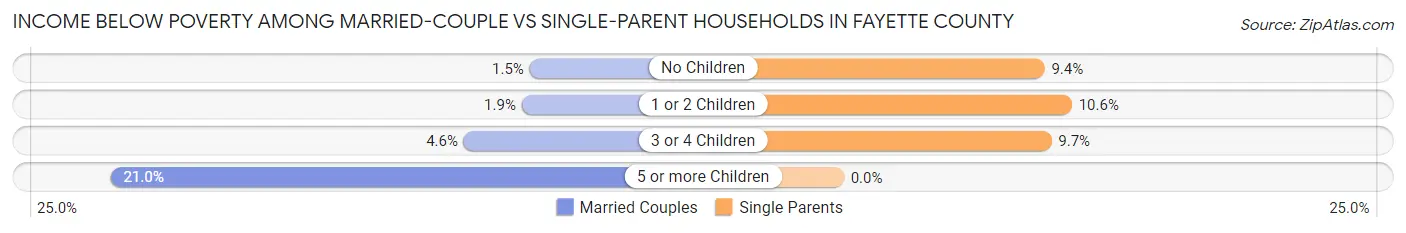
| Children | Married-Couple Families | Single-Parent Households |
| No Children | 239 (1.5%) | 240 (9.3%) |
| 1 or 2 Children | 159 (1.8%) | 374 (10.6%) |
| 3 or 4 Children | 90 (4.5%) | 53 (9.7%) |
| 5 or more Children | 67 (21.0%) | 0 (0.0%) |
| Total | 555 (2.1%) | 667 (9.9%) |
Employment Characteristics in Fayette County
Employment by Class of Employer in Fayette County
Among the 54,097 employed individuals in Fayette County, private company employees (36,377 | 67.2%), not-for-profit organizations (4,079 | 7.5%), and local government employees (3,519 | 6.5%) make up the most common classes of employment.
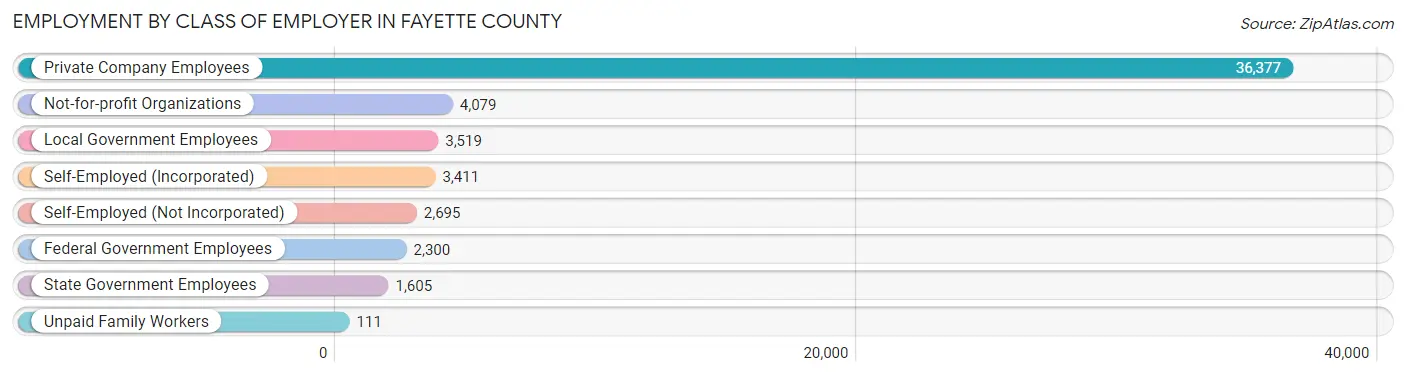
| Employer Class | # Employees | % Employees |
| Private Company Employees | 36,377 | 67.2% |
| Self-Employed (Incorporated) | 3,411 | 6.3% |
| Self-Employed (Not Incorporated) | 2,695 | 5.0% |
| Not-for-profit Organizations | 4,079 | 7.5% |
| Local Government Employees | 3,519 | 6.5% |
| State Government Employees | 1,605 | 3.0% |
| Federal Government Employees | 2,300 | 4.3% |
| Unpaid Family Workers | 111 | 0.2% |
| Total | 54,097 | 100.0% |
Employment Status by Age in Fayette County
According to the labor force statistics for Fayette County, out of the total population over 16 years of age (95,914), 59.8% or 57,357 individuals are in the labor force, with 3.9% or 2,237 of them unemployed. The age group with the highest labor force participation rate is 45 to 54 years, with 83.8% or 14,022 individuals in the labor force. Within the labor force, the 16 to 19 years age range has the highest percentage of unemployed individuals, with 17.5% or 389 of them being unemployed.
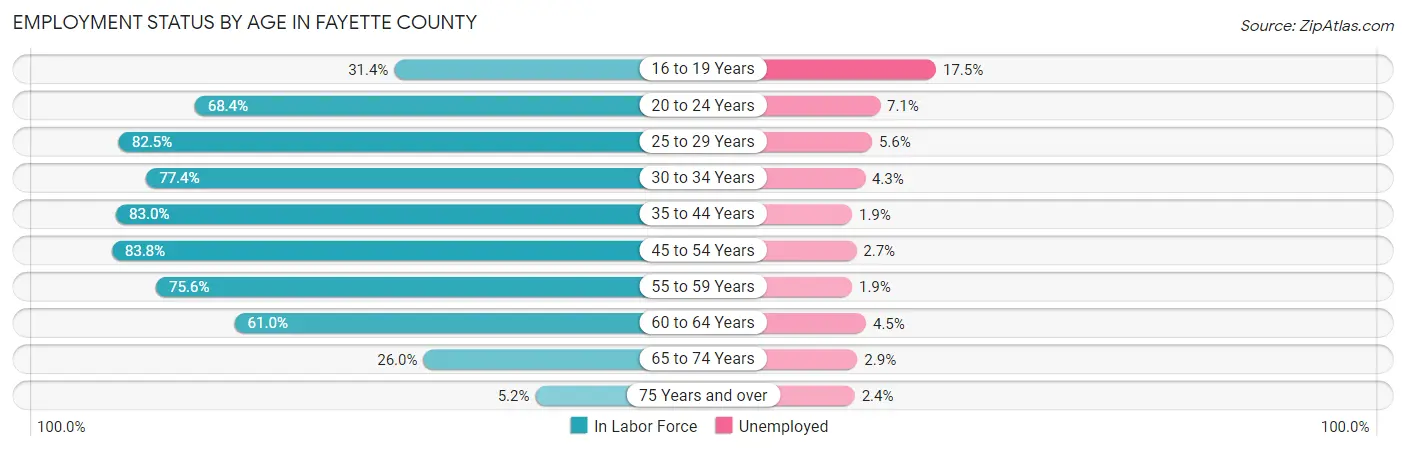
| Age Bracket | In Labor Force | Unemployed |
| 16 to 19 Years | 2,222 (31.4%) | 389 (17.5%) |
| 20 to 24 Years | 4,999 (68.4%) | 355 (7.1%) |
| 25 to 29 Years | 4,445 (82.5%) | 249 (5.6%) |
| 30 to 34 Years | 3,944 (77.4%) | 170 (4.3%) |
| 35 to 44 Years | 11,620 (83.0%) | 221 (1.9%) |
| 45 to 54 Years | 14,022 (83.8%) | 379 (2.7%) |
| 55 to 59 Years | 7,091 (75.6%) | 135 (1.9%) |
| 60 to 64 Years | 4,997 (61.0%) | 225 (4.5%) |
| 65 to 74 Years | 3,573 (26.0%) | 104 (2.9%) |
| 75 Years and over | 468 (5.2%) | 11 (2.4%) |
| Total | 57,357 (59.8%) | 2,237 (3.9%) |
Employment Status by Educational Attainment in Fayette County
According to labor force statistics for Fayette County, 78.5% of individuals (46,148) out of the total population between 25 and 64 years of age (58,787) are in the labor force, with 3.0% or 1,384 of them being unemployed. The group with the highest labor force participation rate are those with the educational attainment of bachelor's degree or higher, with 84.7% or 26,073 individuals in the labor force. Within the labor force, individuals with high school diploma education have the highest percentage of unemployment, with 4.9% or 358 of them being unemployed.
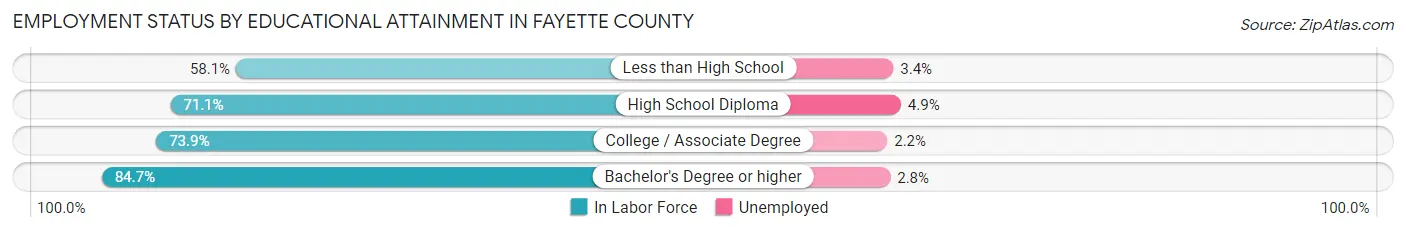
| Educational Attainment | In Labor Force | Unemployed |
| Less than High School | 1,263 (58.1%) | 74 (3.4%) |
| High School Diploma | 7,300 (71.1%) | 503 (4.9%) |
| College / Associate Degree | 11,502 (73.9%) | 342 (2.2%) |
| Bachelor's Degree or higher | 26,073 (84.7%) | 862 (2.8%) |
| Total | 46,148 (78.5%) | 1,764 (3.0%) |
Employment Occupations by Sex in Fayette County
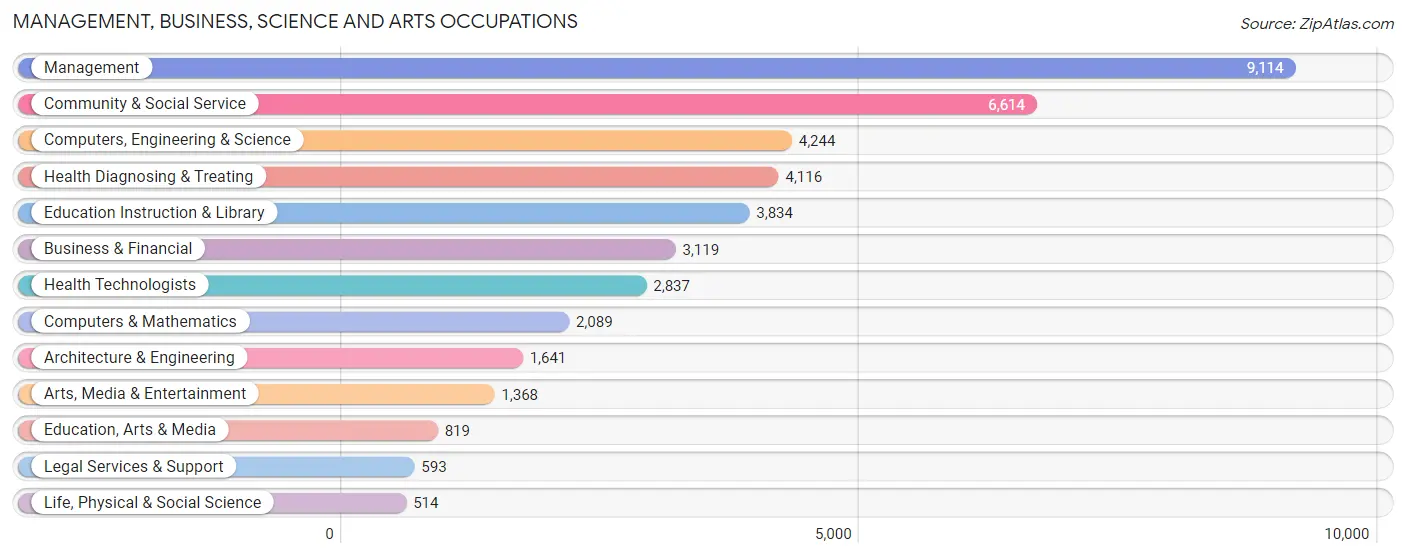
Management, Business, Science and Arts Occupations
The most common Management, Business, Science and Arts occupations in Fayette County are Management (9,114 | 16.6%), Community & Social Service (6,614 | 12.0%), Computers, Engineering & Science (4,244 | 7.7%), Health Diagnosing & Treating (4,116 | 7.5%), and Education Instruction & Library (3,834 | 7.0%).
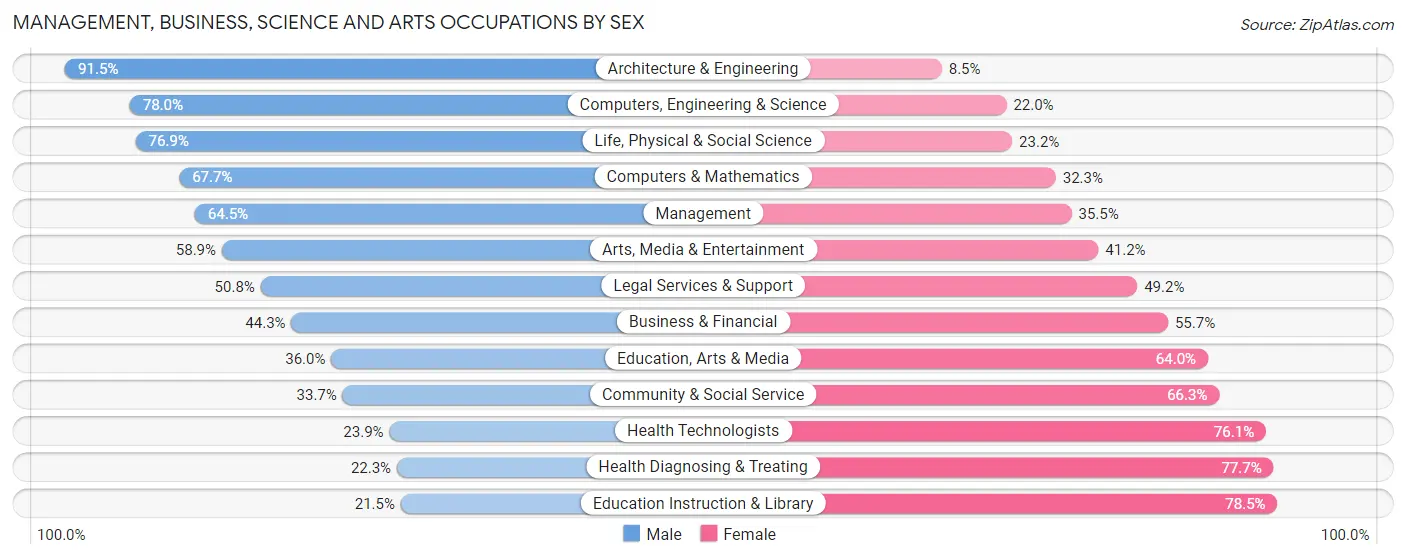
Management, Business, Science and Arts Occupations by Sex
Within the Management, Business, Science and Arts occupations in Fayette County, the most male-oriented occupations are Architecture & Engineering (91.5%), Computers, Engineering & Science (78.0%), and Life, Physical & Social Science (76.8%), while the most female-oriented occupations are Education Instruction & Library (78.5%), Health Diagnosing & Treating (77.7%), and Health Technologists (76.1%).
| Occupation | Male | Female |
| Management | 5,875 (64.5%) | 3,239 (35.5%) |
| Business & Financial | 1,383 (44.3%) | 1,736 (55.7%) |
| Computers, Engineering & Science | 3,312 (78.0%) | 932 (22.0%) |
| Computers & Mathematics | 1,415 (67.7%) | 674 (32.3%) |
| Architecture & Engineering | 1,502 (91.5%) | 139 (8.5%) |
| Life, Physical & Social Science | 395 (76.8%) | 119 (23.2%) |
| Community & Social Service | 2,226 (33.7%) | 4,388 (66.3%) |
| Education, Arts & Media | 295 (36.0%) | 524 (64.0%) |
| Legal Services & Support | 301 (50.8%) | 292 (49.2%) |
| Education Instruction & Library | 825 (21.5%) | 3,009 (78.5%) |
| Arts, Media & Entertainment | 805 (58.9%) | 563 (41.1%) |
| Health Diagnosing & Treating | 919 (22.3%) | 3,197 (77.7%) |
| Health Technologists | 678 (23.9%) | 2,159 (76.1%) |
| Total (Category) | 13,715 (50.4%) | 13,492 (49.6%) |
| Total (Overall) | 30,075 (54.7%) | 24,887 (45.3%) |
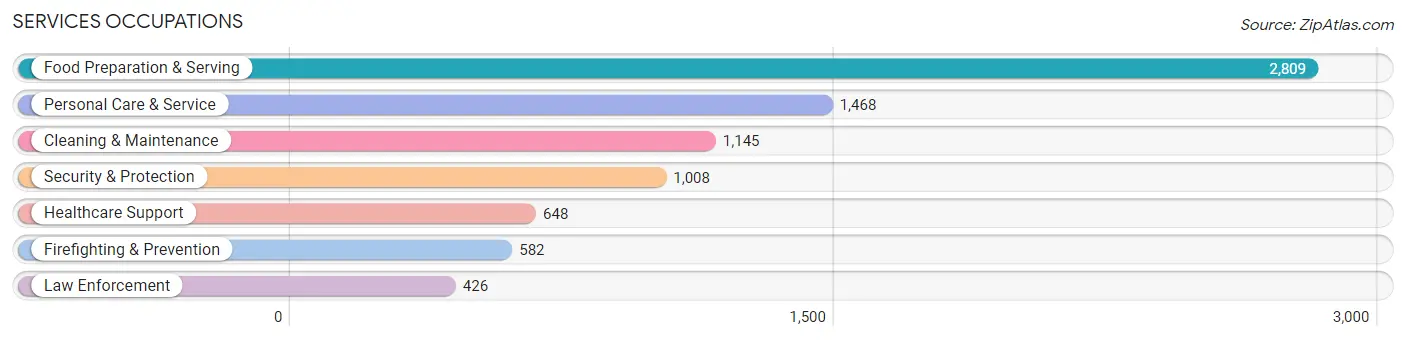
Services Occupations
The most common Services occupations in Fayette County are Food Preparation & Serving (2,809 | 5.1%), Personal Care & Service (1,468 | 2.7%), Cleaning & Maintenance (1,145 | 2.1%), Security & Protection (1,008 | 1.8%), and Healthcare Support (648 | 1.2%).
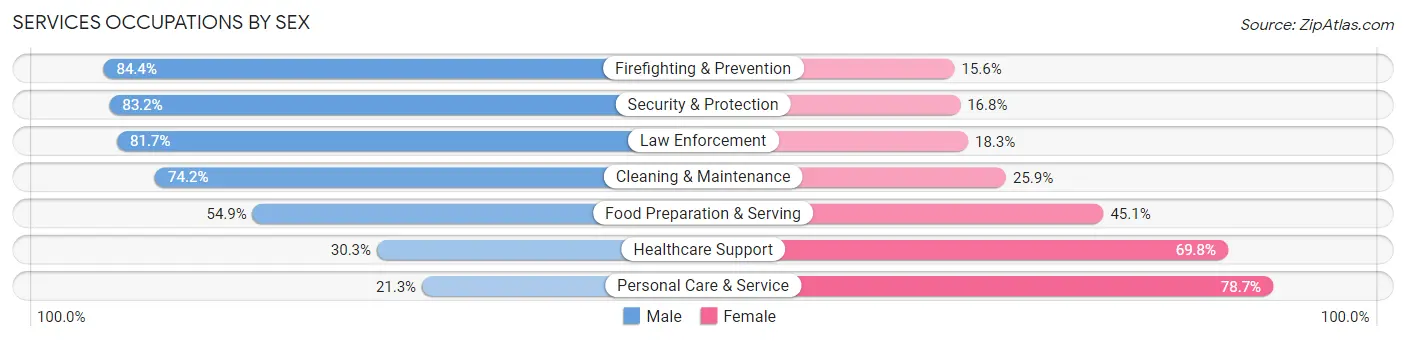
Services Occupations by Sex
Within the Services occupations in Fayette County, the most male-oriented occupations are Firefighting & Prevention (84.4%), Security & Protection (83.2%), and Law Enforcement (81.7%), while the most female-oriented occupations are Personal Care & Service (78.7%), Healthcare Support (69.8%), and Food Preparation & Serving (45.1%).
| Occupation | Male | Female |
| Healthcare Support | 196 (30.2%) | 452 (69.8%) |
| Security & Protection | 839 (83.2%) | 169 (16.8%) |
| Firefighting & Prevention | 491 (84.4%) | 91 (15.6%) |
| Law Enforcement | 348 (81.7%) | 78 (18.3%) |
| Food Preparation & Serving | 1,541 (54.9%) | 1,268 (45.1%) |
| Cleaning & Maintenance | 849 (74.2%) | 296 (25.9%) |
| Personal Care & Service | 313 (21.3%) | 1,155 (78.7%) |
| Total (Category) | 3,738 (52.8%) | 3,340 (47.2%) |
| Total (Overall) | 30,075 (54.7%) | 24,887 (45.3%) |
Sales and Office Occupations
The most common Sales and Office occupations in Fayette County are Office & Administration (5,743 | 10.4%), and Sales & Related (4,661 | 8.5%).

Sales and Office Occupations by Sex
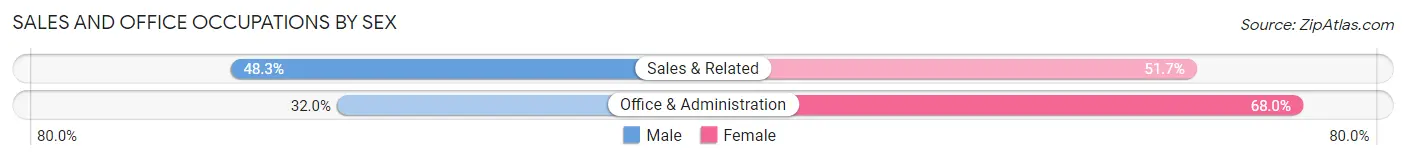
| Occupation | Male | Female |
| Sales & Related | 2,252 (48.3%) | 2,409 (51.7%) |
| Office & Administration | 1,836 (32.0%) | 3,907 (68.0%) |
| Total (Category) | 4,088 (39.3%) | 6,316 (60.7%) |
| Total (Overall) | 30,075 (54.7%) | 24,887 (45.3%) |
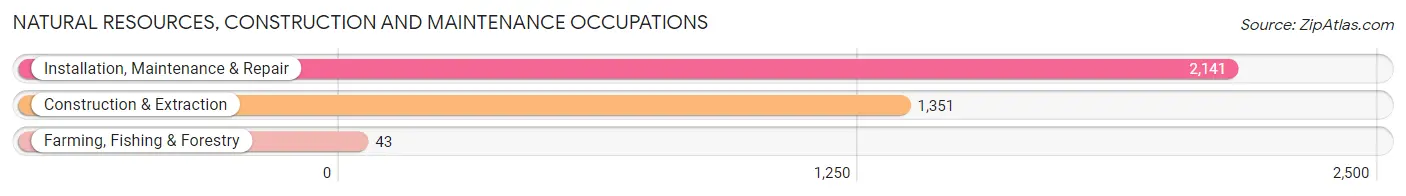
Natural Resources, Construction and Maintenance Occupations
The most common Natural Resources, Construction and Maintenance occupations in Fayette County are Installation, Maintenance & Repair (2,141 | 3.9%), Construction & Extraction (1,351 | 2.5%), and Farming, Fishing & Forestry (43 | 0.1%).
Natural Resources, Construction and Maintenance Occupations by Sex
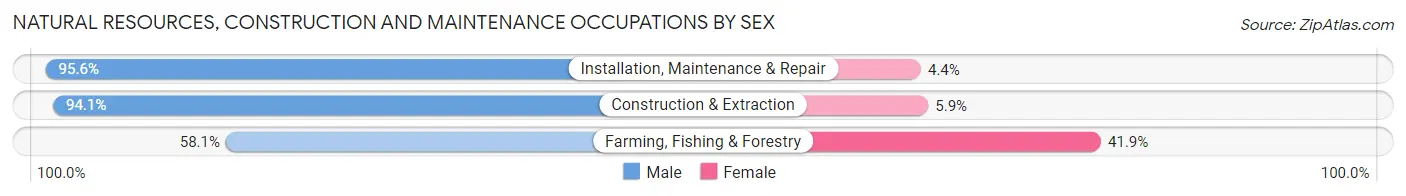
| Occupation | Male | Female |
| Farming, Fishing & Forestry | 25 (58.1%) | 18 (41.9%) |
| Construction & Extraction | 1,271 (94.1%) | 80 (5.9%) |
| Installation, Maintenance & Repair | 2,047 (95.6%) | 94 (4.4%) |
| Total (Category) | 3,343 (94.6%) | 192 (5.4%) |
| Total (Overall) | 30,075 (54.7%) | 24,887 (45.3%) |
Production, Transportation and Moving Occupations
The most common Production, Transportation and Moving occupations in Fayette County are Transportation (3,775 | 6.9%), Material Moving (1,521 | 2.8%), and Production (1,442 | 2.6%).
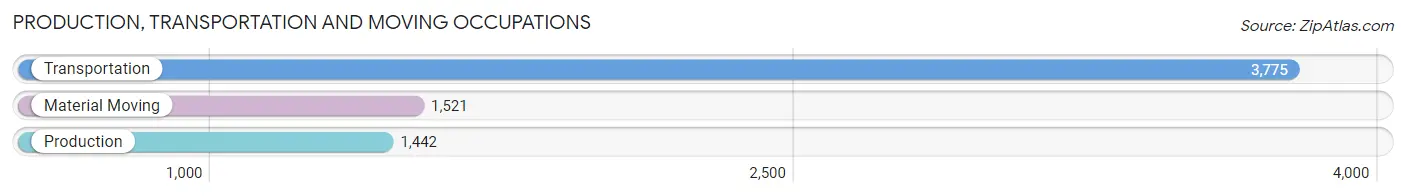
Production, Transportation and Moving Occupations by Sex
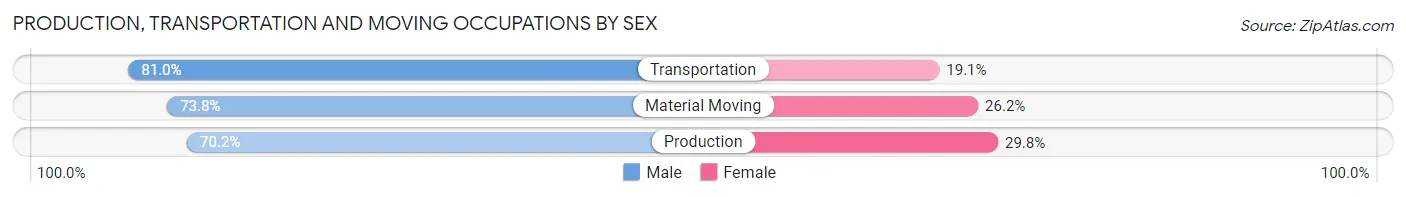
| Occupation | Male | Female |
| Production | 1,012 (70.2%) | 430 (29.8%) |
| Transportation | 3,056 (80.9%) | 719 (19.1%) |
| Material Moving | 1,123 (73.8%) | 398 (26.2%) |
| Total (Category) | 5,191 (77.0%) | 1,547 (23.0%) |
| Total (Overall) | 30,075 (54.7%) | 24,887 (45.3%) |
Employment Industries by Sex in Fayette County
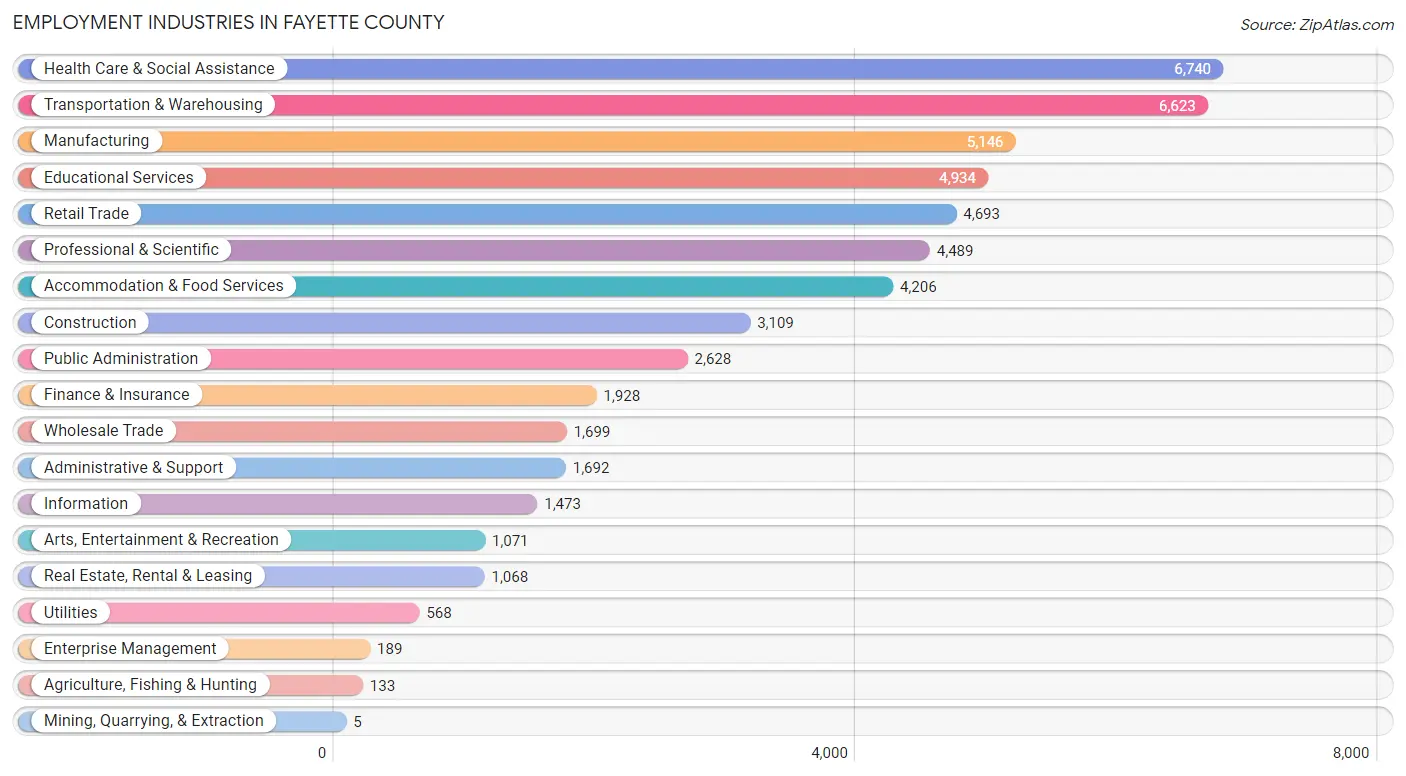
Employment Industries in Fayette County
The major employment industries in Fayette County include Health Care & Social Assistance (6,740 | 12.3%), Transportation & Warehousing (6,623 | 12.0%), Manufacturing (5,146 | 9.4%), Educational Services (4,934 | 9.0%), and Retail Trade (4,693 | 8.5%).
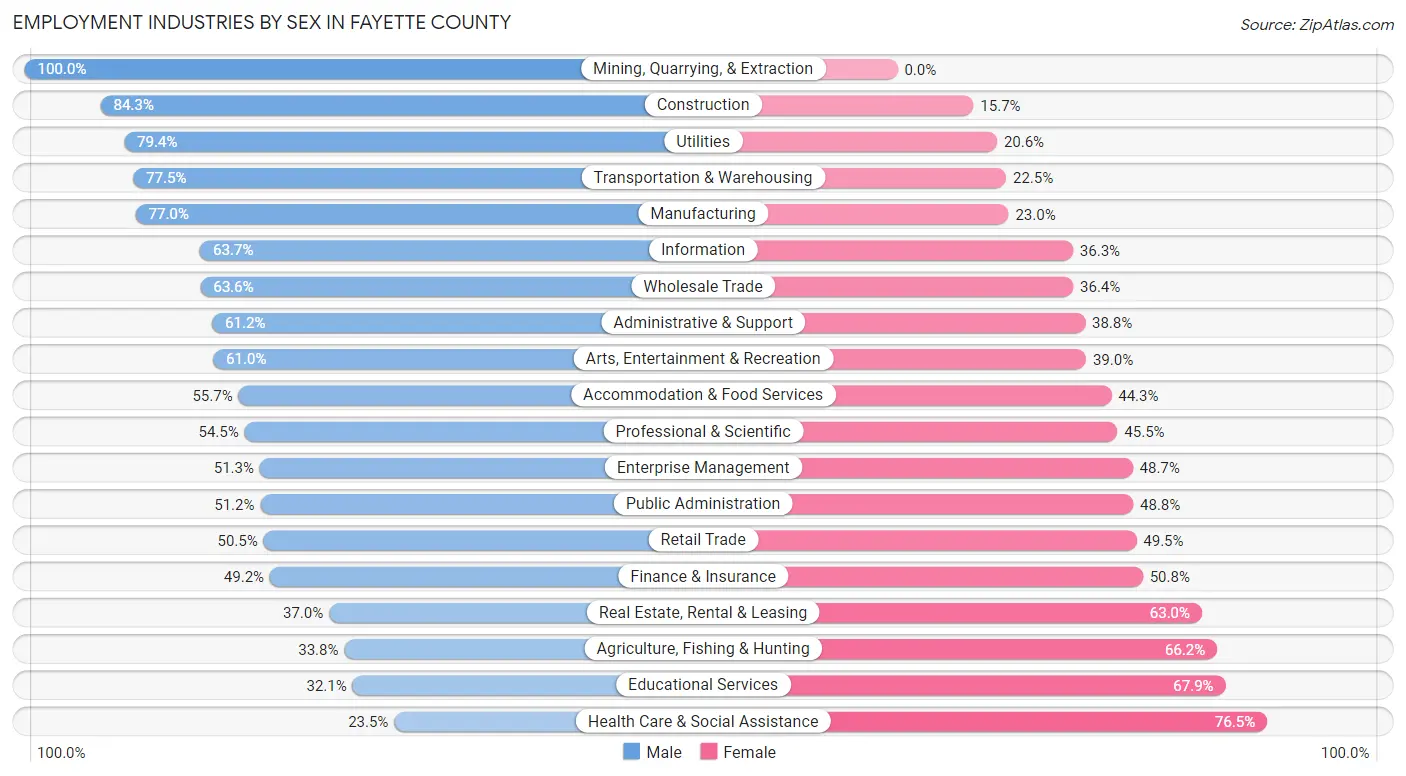
Employment Industries by Sex in Fayette County
The Fayette County industries that see more men than women are Mining, Quarrying, & Extraction (100.0%), Construction (84.3%), and Utilities (79.4%), whereas the industries that tend to have a higher number of women are Health Care & Social Assistance (76.5%), Educational Services (67.9%), and Agriculture, Fishing & Hunting (66.2%).
| Industry | Male | Female |
| Agriculture, Fishing & Hunting | 45 (33.8%) | 88 (66.2%) |
| Mining, Quarrying, & Extraction | 5 (100.0%) | 0 (0.0%) |
| Construction | 2,620 (84.3%) | 489 (15.7%) |
| Manufacturing | 3,963 (77.0%) | 1,183 (23.0%) |
| Wholesale Trade | 1,081 (63.6%) | 618 (36.4%) |
| Retail Trade | 2,372 (50.5%) | 2,321 (49.5%) |
| Transportation & Warehousing | 5,134 (77.5%) | 1,489 (22.5%) |
| Utilities | 451 (79.4%) | 117 (20.6%) |
| Information | 938 (63.7%) | 535 (36.3%) |
| Finance & Insurance | 949 (49.2%) | 979 (50.8%) |
| Real Estate, Rental & Leasing | 395 (37.0%) | 673 (63.0%) |
| Professional & Scientific | 2,445 (54.5%) | 2,044 (45.5%) |
| Enterprise Management | 97 (51.3%) | 92 (48.7%) |
| Administrative & Support | 1,035 (61.2%) | 657 (38.8%) |
| Educational Services | 1,585 (32.1%) | 3,349 (67.9%) |
| Health Care & Social Assistance | 1,584 (23.5%) | 5,156 (76.5%) |
| Arts, Entertainment & Recreation | 653 (61.0%) | 418 (39.0%) |
| Accommodation & Food Services | 2,344 (55.7%) | 1,862 (44.3%) |
| Public Administration | 1,346 (51.2%) | 1,282 (48.8%) |
| Total | 30,075 (54.7%) | 24,887 (45.3%) |
Education in Fayette County
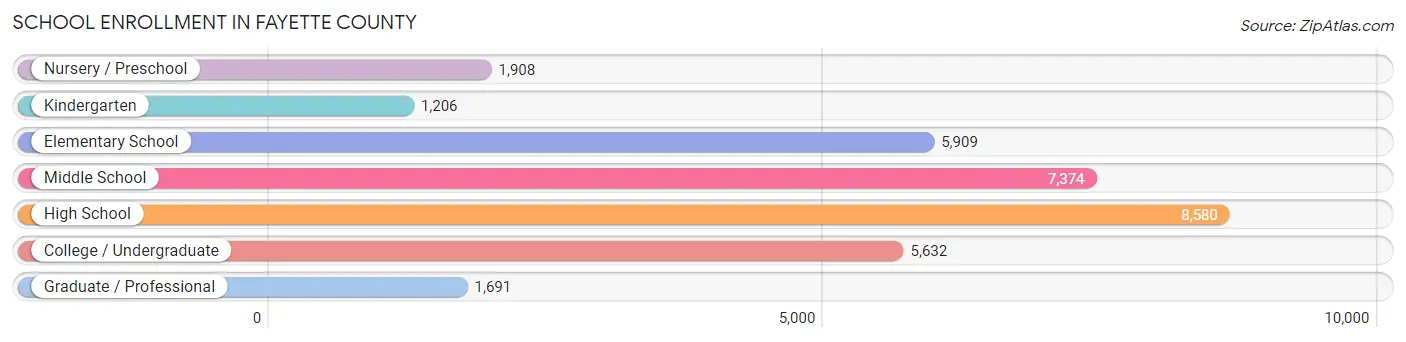
School Enrollment in Fayette County
The most common levels of schooling among the 32,300 students in Fayette County are high school (8,580 | 26.6%), middle school (7,374 | 22.8%), and elementary school (5,909 | 18.3%).
| School Level | # Students | % Students |
| Nursery / Preschool | 1,908 | 5.9% |
| Kindergarten | 1,206 | 3.7% |
| Elementary School | 5,909 | 18.3% |
| Middle School | 7,374 | 22.8% |
| High School | 8,580 | 26.6% |
| College / Undergraduate | 5,632 | 17.4% |
| Graduate / Professional | 1,691 | 5.2% |
| Total | 32,300 | 100.0% |
School Enrollment by Age by Funding Source in Fayette County
Out of a total of 32,300 students who are enrolled in schools in Fayette County, 6,040 (18.7%) attend a private institution, while the remaining 26,260 (81.3%) are enrolled in public schools. The age group of 3 to 4 year olds has the highest likelihood of being enrolled in private schools, with 1,171 (70.0% in the age bracket) enrolled. Conversely, the age group of 15 to 17 year olds has the lowest likelihood of being enrolled in a private school, with 5,346 (89.7% in the age bracket) attending a public institution.
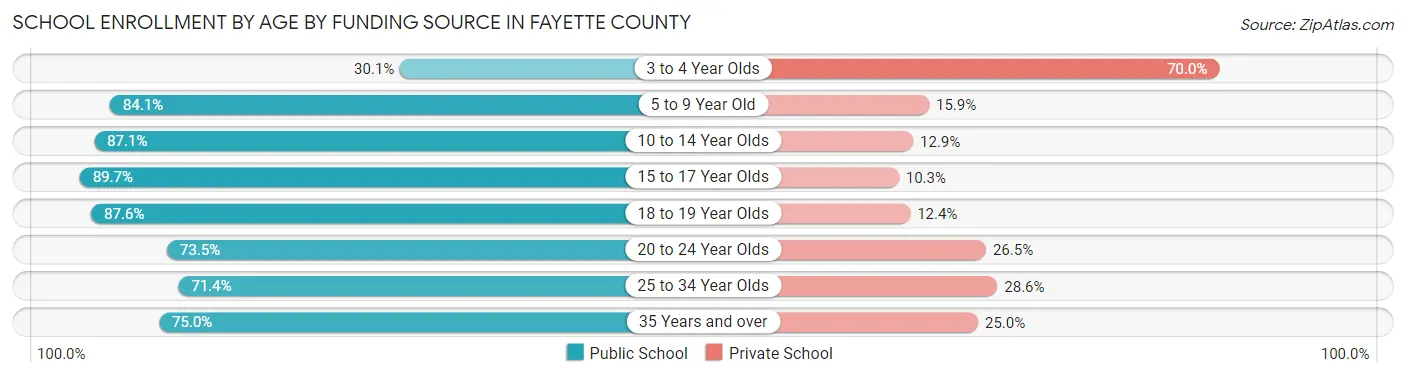
| Age Bracket | Public School | Private School |
| 3 to 4 Year Olds | 503 (30.0%) | 1,171 (70.0%) |
| 5 to 9 Year Old | 5,516 (84.1%) | 1,043 (15.9%) |
| 10 to 14 Year Olds | 7,923 (87.1%) | 1,177 (12.9%) |
| 15 to 17 Year Olds | 5,346 (89.7%) | 612 (10.3%) |
| 18 to 19 Year Olds | 2,276 (87.6%) | 322 (12.4%) |
| 20 to 24 Year Olds | 2,572 (73.5%) | 928 (26.5%) |
| 25 to 34 Year Olds | 920 (71.4%) | 369 (28.6%) |
| 35 Years and over | 1,216 (75.0%) | 406 (25.0%) |
| Total | 26,260 (81.3%) | 6,040 (18.7%) |
Educational Attainment by Field of Study in Fayette County
Business (9,533 | 23.3%), science & technology (5,014 | 12.2%), education (4,572 | 11.2%), engineering (3,772 | 9.2%), and arts & humanities (3,337 | 8.2%) are the most common fields of study among 40,922 individuals in Fayette County who have obtained a bachelor's degree or higher.
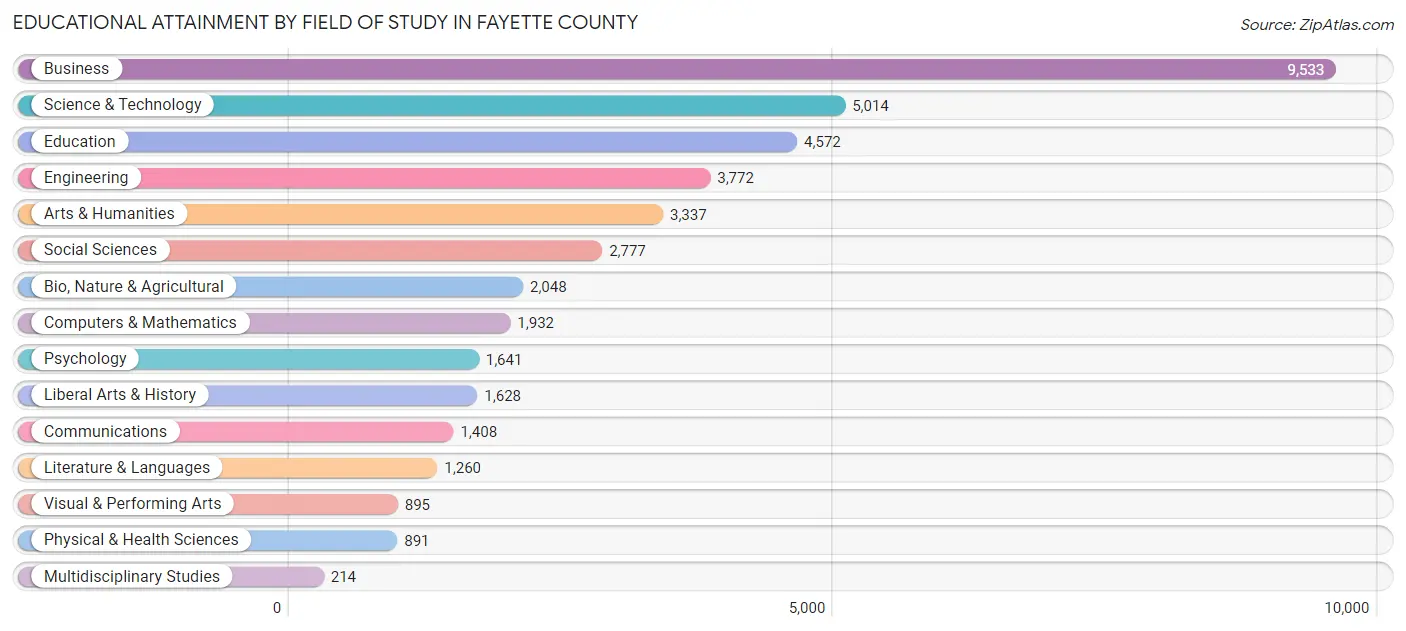
| Field of Study | # Graduates | % Graduates |
| Computers & Mathematics | 1,932 | 4.7% |
| Bio, Nature & Agricultural | 2,048 | 5.0% |
| Physical & Health Sciences | 891 | 2.2% |
| Psychology | 1,641 | 4.0% |
| Social Sciences | 2,777 | 6.8% |
| Engineering | 3,772 | 9.2% |
| Multidisciplinary Studies | 214 | 0.5% |
| Science & Technology | 5,014 | 12.2% |
| Business | 9,533 | 23.3% |
| Education | 4,572 | 11.2% |
| Literature & Languages | 1,260 | 3.1% |
| Liberal Arts & History | 1,628 | 4.0% |
| Visual & Performing Arts | 895 | 2.2% |
| Communications | 1,408 | 3.4% |
| Arts & Humanities | 3,337 | 8.2% |
| Total | 40,922 | 100.0% |
Transportation & Commute in Fayette County
Vehicle Availability by Sex in Fayette County
The most prevalent vehicle ownership categories in Fayette County are males with 2 vehicles (12,497, accounting for 41.8%) and females with 2 vehicles (9,626, making up 51.6%).
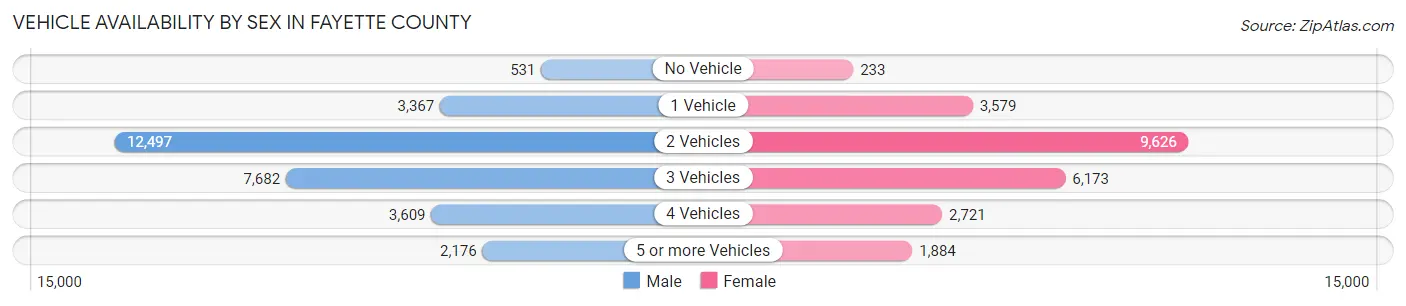
| Vehicles Available | Male | Female |
| No Vehicle | 531 (1.8%) | 233 (1.0%) |
| 1 Vehicle | 3,367 (11.3%) | 3,579 (14.8%) |
| 2 Vehicles | 12,497 (41.8%) | 9,626 (39.8%) |
| 3 Vehicles | 7,682 (25.7%) | 6,173 (25.5%) |
| 4 Vehicles | 3,609 (12.1%) | 2,721 (11.2%) |
| 5 or more Vehicles | 2,176 (7.3%) | 1,884 (7.8%) |
| Total | 29,862 (100.0%) | 24,216 (100.0%) |
Commute Time in Fayette County
The most frequently occuring commute durations in Fayette County are 30 to 34 minutes (6,880 commuters, 15.1%), 45 to 59 minutes (6,537 commuters, 14.3%), and 15 to 19 minutes (4,968 commuters, 10.9%).
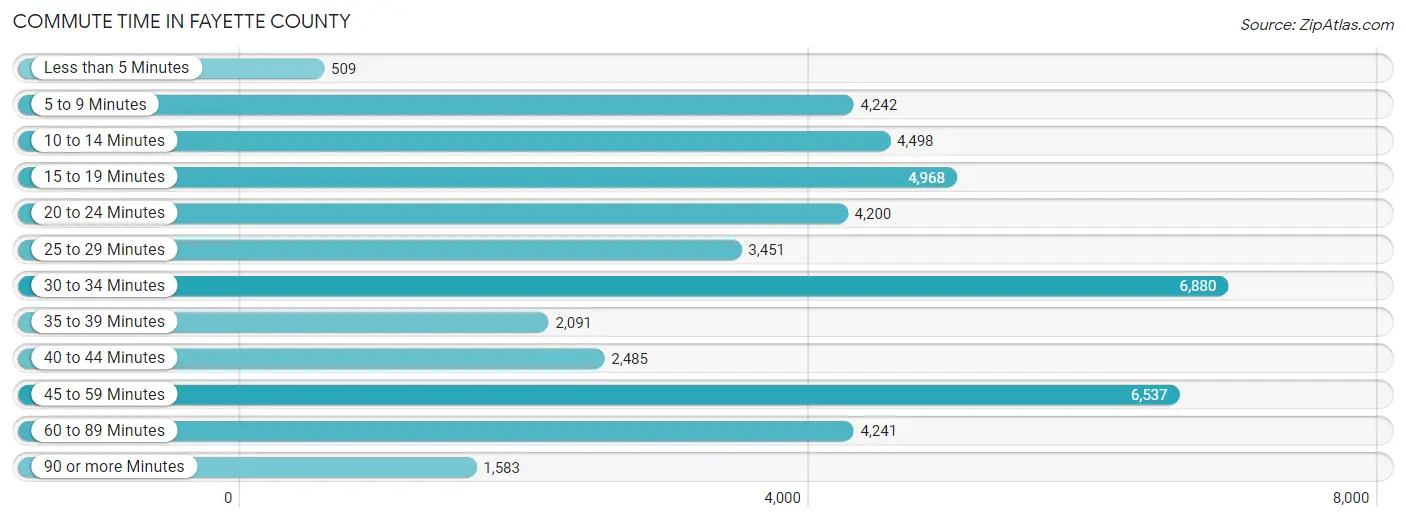
| Commute Time | # Commuters | % Commuters |
| Less than 5 Minutes | 509 | 1.1% |
| 5 to 9 Minutes | 4,242 | 9.3% |
| 10 to 14 Minutes | 4,498 | 9.9% |
| 15 to 19 Minutes | 4,968 | 10.9% |
| 20 to 24 Minutes | 4,200 | 9.2% |
| 25 to 29 Minutes | 3,451 | 7.5% |
| 30 to 34 Minutes | 6,880 | 15.1% |
| 35 to 39 Minutes | 2,091 | 4.6% |
| 40 to 44 Minutes | 2,485 | 5.4% |
| 45 to 59 Minutes | 6,537 | 14.3% |
| 60 to 89 Minutes | 4,241 | 9.3% |
| 90 or more Minutes | 1,583 | 3.5% |
Commute Time by Sex in Fayette County
The most common commute times in Fayette County are 30 to 34 minutes (4,124 commuters, 16.4%) for males and 15 to 19 minutes (2,879 commuters, 14.0%) for females.
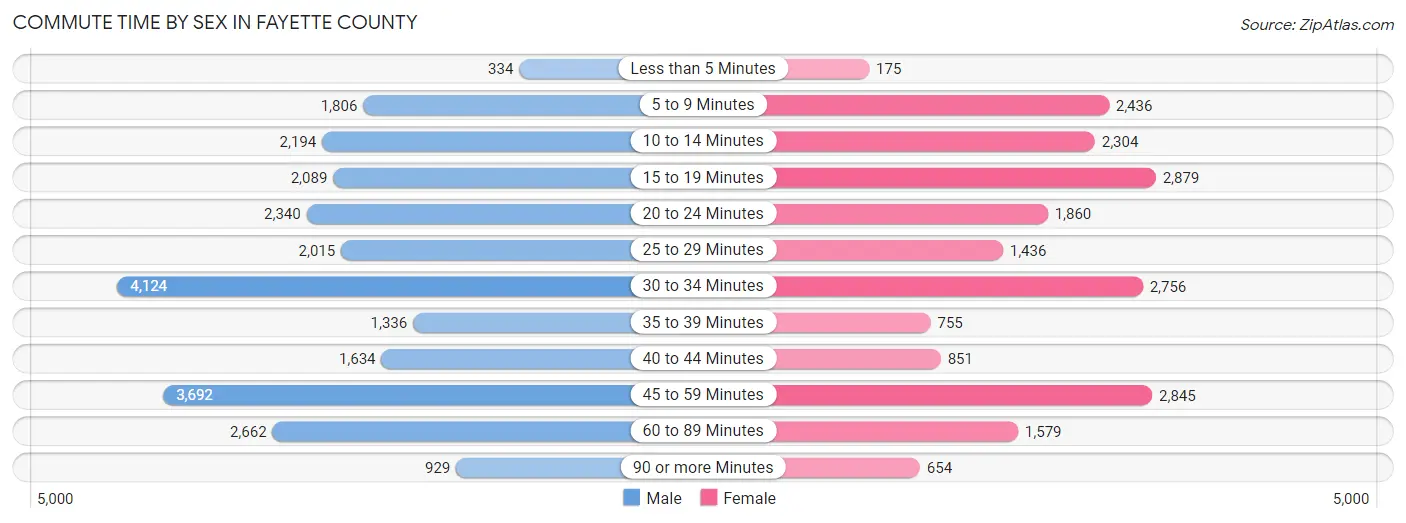
| Commute Time | Male | Female |
| Less than 5 Minutes | 334 (1.3%) | 175 (0.9%) |
| 5 to 9 Minutes | 1,806 (7.2%) | 2,436 (11.9%) |
| 10 to 14 Minutes | 2,194 (8.7%) | 2,304 (11.2%) |
| 15 to 19 Minutes | 2,089 (8.3%) | 2,879 (14.0%) |
| 20 to 24 Minutes | 2,340 (9.3%) | 1,860 (9.1%) |
| 25 to 29 Minutes | 2,015 (8.0%) | 1,436 (7.0%) |
| 30 to 34 Minutes | 4,124 (16.4%) | 2,756 (13.4%) |
| 35 to 39 Minutes | 1,336 (5.3%) | 755 (3.7%) |
| 40 to 44 Minutes | 1,634 (6.5%) | 851 (4.2%) |
| 45 to 59 Minutes | 3,692 (14.7%) | 2,845 (13.9%) |
| 60 to 89 Minutes | 2,662 (10.6%) | 1,579 (7.7%) |
| 90 or more Minutes | 929 (3.7%) | 654 (3.2%) |
Time of Departure to Work by Sex in Fayette County
The most frequent times of departure to work in Fayette County are 7:00 AM to 7:29 AM (3,441, 13.7%) for males and 7:30 AM to 7:59 AM (3,412, 16.6%) for females.
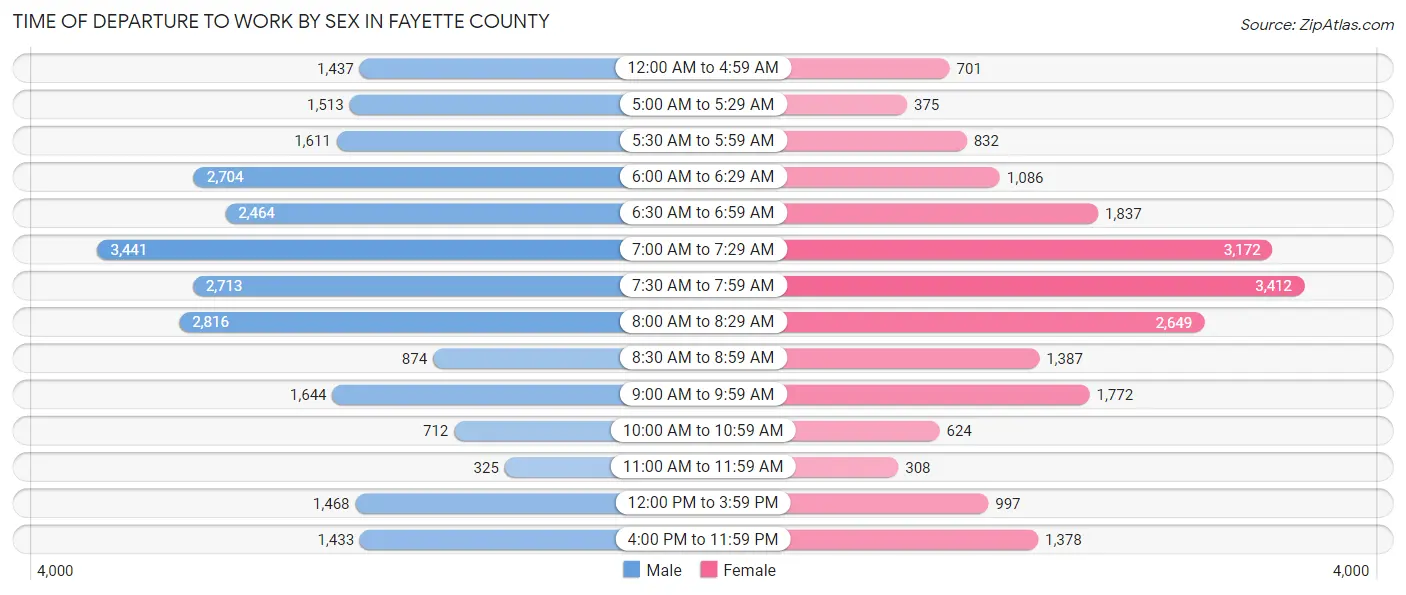
| Time of Departure | Male | Female |
| 12:00 AM to 4:59 AM | 1,437 (5.7%) | 701 (3.4%) |
| 5:00 AM to 5:29 AM | 1,513 (6.0%) | 375 (1.8%) |
| 5:30 AM to 5:59 AM | 1,611 (6.4%) | 832 (4.1%) |
| 6:00 AM to 6:29 AM | 2,704 (10.7%) | 1,086 (5.3%) |
| 6:30 AM to 6:59 AM | 2,464 (9.8%) | 1,837 (8.9%) |
| 7:00 AM to 7:29 AM | 3,441 (13.7%) | 3,172 (15.4%) |
| 7:30 AM to 7:59 AM | 2,713 (10.8%) | 3,412 (16.6%) |
| 8:00 AM to 8:29 AM | 2,816 (11.2%) | 2,649 (12.9%) |
| 8:30 AM to 8:59 AM | 874 (3.5%) | 1,387 (6.8%) |
| 9:00 AM to 9:59 AM | 1,644 (6.5%) | 1,772 (8.6%) |
| 10:00 AM to 10:59 AM | 712 (2.8%) | 624 (3.0%) |
| 11:00 AM to 11:59 AM | 325 (1.3%) | 308 (1.5%) |
| 12:00 PM to 3:59 PM | 1,468 (5.8%) | 997 (4.9%) |
| 4:00 PM to 11:59 PM | 1,433 (5.7%) | 1,378 (6.7%) |
| Total | 25,155 (100.0%) | 20,530 (100.0%) |
Housing Occupancy in Fayette County
Occupancy by Ownership in Fayette County
Of the total 42,888 dwellings in Fayette County, owner-occupied units account for 35,025 (81.7%), while renter-occupied units make up 7,863 (18.3%).
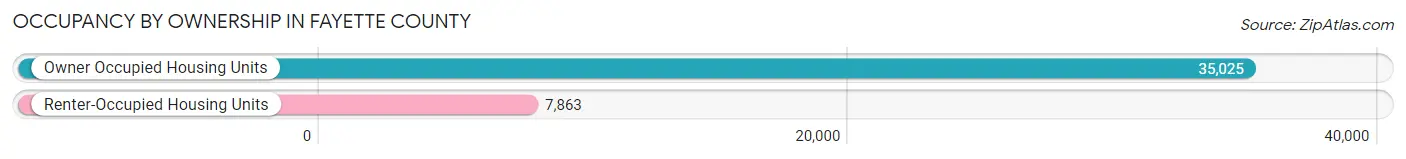
| Occupancy | # Housing Units | % Housing Units |
| Owner Occupied Housing Units | 35,025 | 81.7% |
| Renter-Occupied Housing Units | 7,863 | 18.3% |
| Total Occupied Housing Units | 42,888 | 100.0% |
Occupancy by Household Size in Fayette County
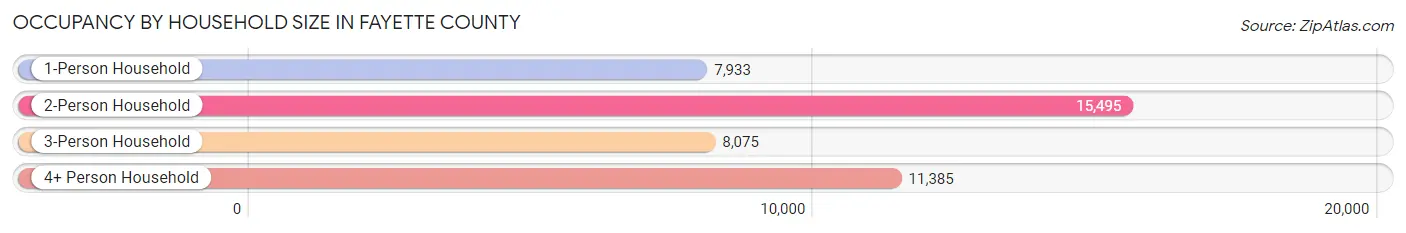
| Household Size | # Housing Units | % Housing Units |
| 1-Person Household | 7,933 | 18.5% |
| 2-Person Household | 15,495 | 36.1% |
| 3-Person Household | 8,075 | 18.8% |
| 4+ Person Household | 11,385 | 26.6% |
| Total Housing Units | 42,888 | 100.0% |
Occupancy by Ownership by Household Size in Fayette County
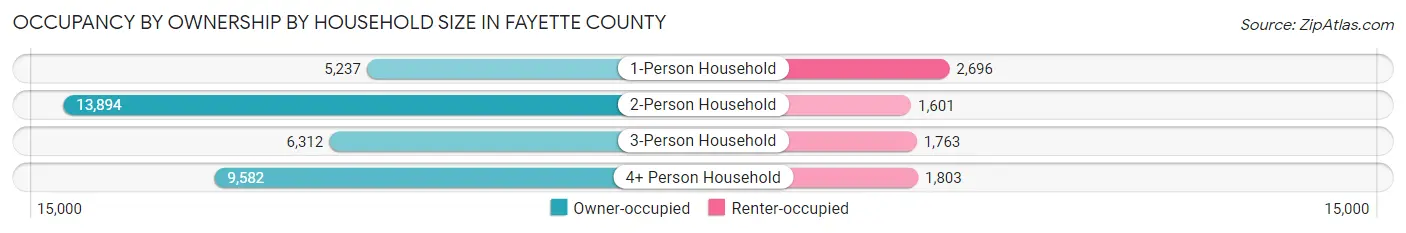
| Household Size | Owner-occupied | Renter-occupied |
| 1-Person Household | 5,237 (66.0%) | 2,696 (34.0%) |
| 2-Person Household | 13,894 (89.7%) | 1,601 (10.3%) |
| 3-Person Household | 6,312 (78.2%) | 1,763 (21.8%) |
| 4+ Person Household | 9,582 (84.2%) | 1,803 (15.8%) |
| Total Housing Units | 35,025 (81.7%) | 7,863 (18.3%) |
Occupancy by Educational Attainment in Fayette County
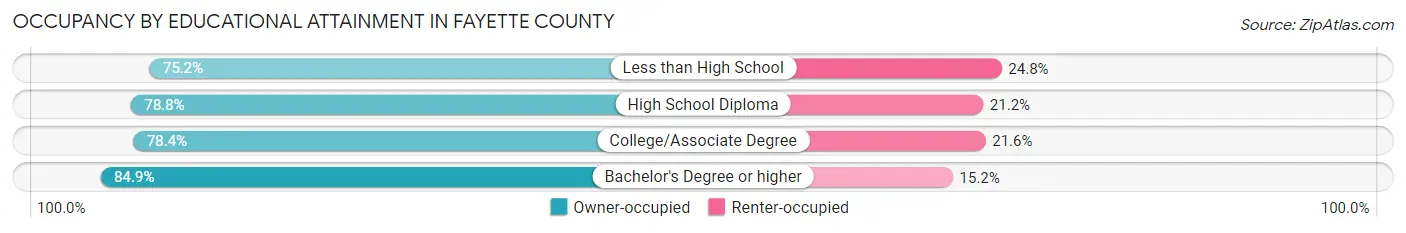
| Household Size | Owner-occupied | Renter-occupied |
| Less than High School | 1,084 (75.2%) | 358 (24.8%) |
| High School Diploma | 6,033 (78.8%) | 1,619 (21.2%) |
| College/Associate Degree | 9,240 (78.4%) | 2,552 (21.6%) |
| Bachelor's Degree or higher | 18,668 (84.9%) | 3,334 (15.1%) |
Occupancy by Age of Householder in Fayette County
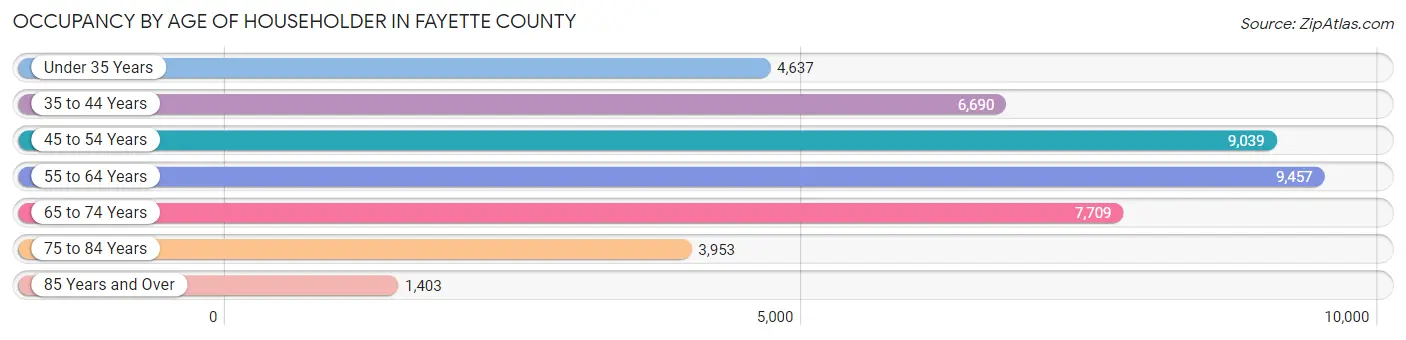
| Age Bracket | # Households | % Households |
| Under 35 Years | 4,637 | 10.8% |
| 35 to 44 Years | 6,690 | 15.6% |
| 45 to 54 Years | 9,039 | 21.1% |
| 55 to 64 Years | 9,457 | 22.1% |
| 65 to 74 Years | 7,709 | 18.0% |
| 75 to 84 Years | 3,953 | 9.2% |
| 85 Years and Over | 1,403 | 3.3% |
| Total | 42,888 | 100.0% |
Housing Finances in Fayette County
Median Income by Occupancy in Fayette County
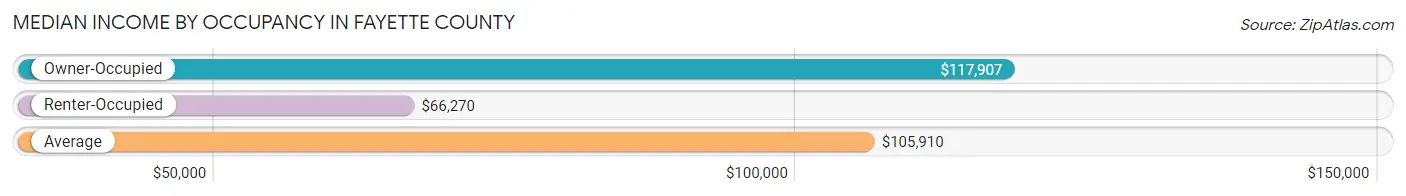
| Occupancy Type | # Households | Median Income |
| Owner-Occupied | 35,025 (81.7%) | $117,907 |
| Renter-Occupied | 7,863 (18.3%) | $66,270 |
| Average | 42,888 (100.0%) | $105,910 |
Occupancy by Householder Income Bracket in Fayette County
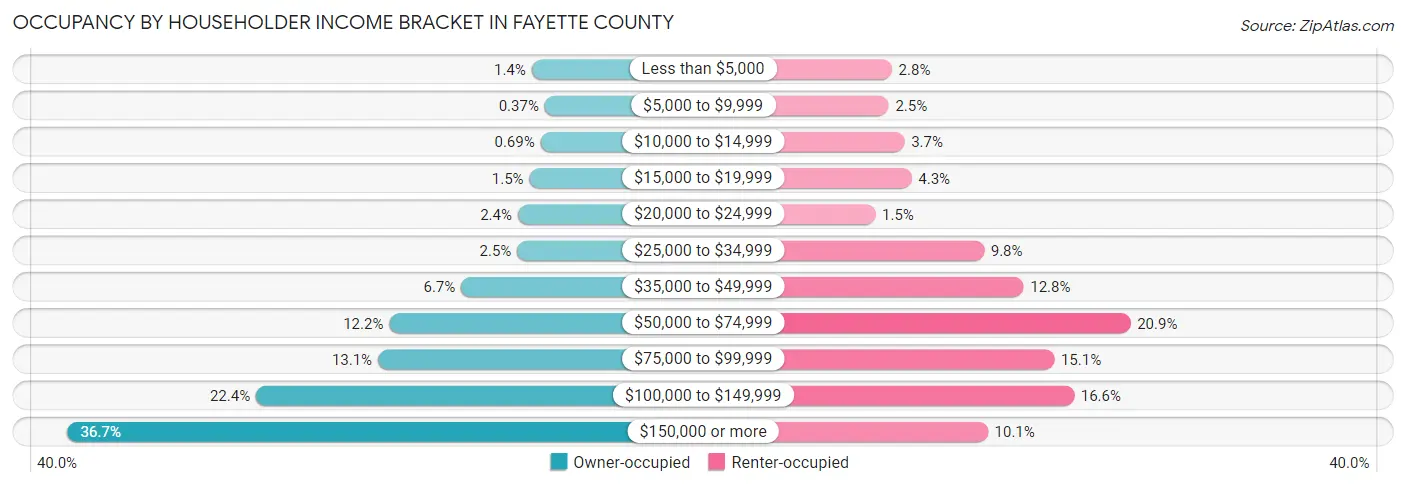
| Income Bracket | Owner-occupied | Renter-occupied |
| Less than $5,000 | 480 (1.4%) | 216 (2.8%) |
| $5,000 to $9,999 | 130 (0.4%) | 197 (2.5%) |
| $10,000 to $14,999 | 242 (0.7%) | 292 (3.7%) |
| $15,000 to $19,999 | 541 (1.5%) | 334 (4.3%) |
| $20,000 to $24,999 | 846 (2.4%) | 117 (1.5%) |
| $25,000 to $34,999 | 864 (2.5%) | 768 (9.8%) |
| $35,000 to $49,999 | 2,361 (6.7%) | 1,005 (12.8%) |
| $50,000 to $74,999 | 4,279 (12.2%) | 1,646 (20.9%) |
| $75,000 to $99,999 | 4,581 (13.1%) | 1,189 (15.1%) |
| $100,000 to $149,999 | 7,836 (22.4%) | 1,308 (16.6%) |
| $150,000 or more | 12,865 (36.7%) | 791 (10.1%) |
| Total | 35,025 (100.0%) | 7,863 (100.0%) |
Monthly Housing Cost Tiers in Fayette County
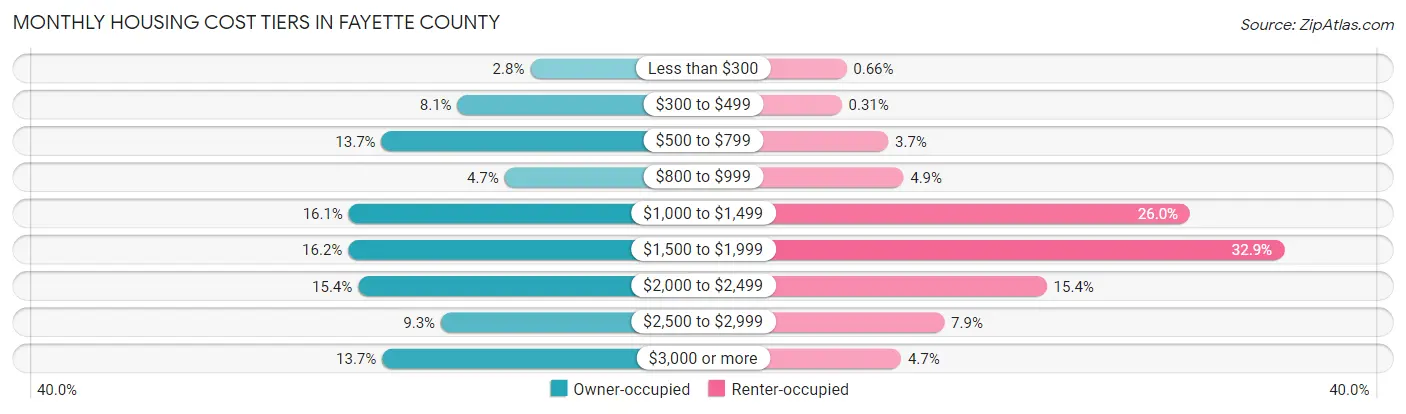
| Monthly Cost | Owner-occupied | Renter-occupied |
| Less than $300 | 966 (2.8%) | 52 (0.7%) |
| $300 to $499 | 2,843 (8.1%) | 24 (0.3%) |
| $500 to $799 | 4,805 (13.7%) | 293 (3.7%) |
| $800 to $999 | 1,628 (4.6%) | 381 (4.9%) |
| $1,000 to $1,499 | 5,650 (16.1%) | 2,041 (26.0%) |
| $1,500 to $1,999 | 5,664 (16.2%) | 2,585 (32.9%) |
| $2,000 to $2,499 | 5,409 (15.4%) | 1,212 (15.4%) |
| $2,500 to $2,999 | 3,271 (9.3%) | 618 (7.9%) |
| $3,000 or more | 4,789 (13.7%) | 368 (4.7%) |
| Total | 35,025 (100.0%) | 7,863 (100.0%) |
Physical Housing Characteristics in Fayette County
Housing Structures in Fayette County
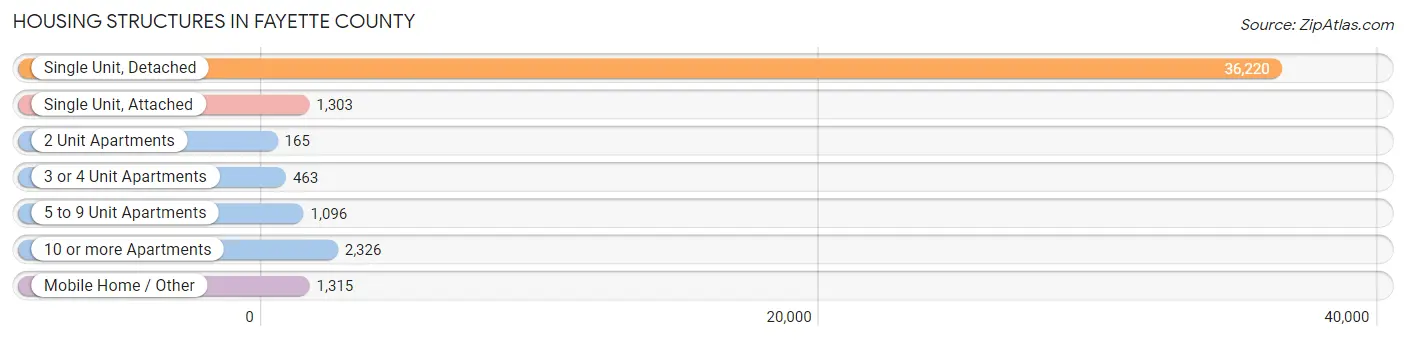
| Structure Type | # Housing Units | % Housing Units |
| Single Unit, Detached | 36,220 | 84.5% |
| Single Unit, Attached | 1,303 | 3.0% |
| 2 Unit Apartments | 165 | 0.4% |
| 3 or 4 Unit Apartments | 463 | 1.1% |
| 5 to 9 Unit Apartments | 1,096 | 2.6% |
| 10 or more Apartments | 2,326 | 5.4% |
| Mobile Home / Other | 1,315 | 3.1% |
| Total | 42,888 | 100.0% |
Housing Structures by Occupancy in Fayette County
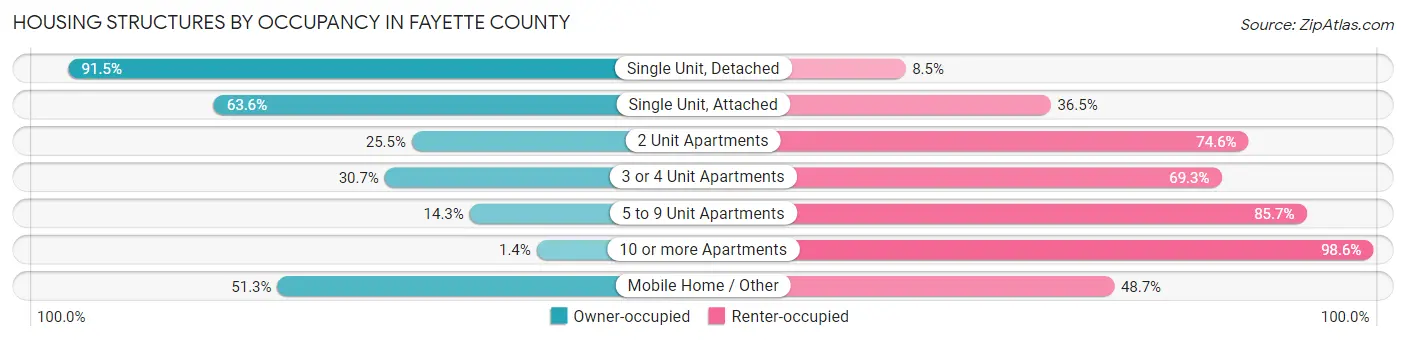
| Structure Type | Owner-occupied | Renter-occupied |
| Single Unit, Detached | 33,148 (91.5%) | 3,072 (8.5%) |
| Single Unit, Attached | 828 (63.5%) | 475 (36.4%) |
| 2 Unit Apartments | 42 (25.5%) | 123 (74.6%) |
| 3 or 4 Unit Apartments | 142 (30.7%) | 321 (69.3%) |
| 5 to 9 Unit Apartments | 157 (14.3%) | 939 (85.7%) |
| 10 or more Apartments | 33 (1.4%) | 2,293 (98.6%) |
| Mobile Home / Other | 675 (51.3%) | 640 (48.7%) |
| Total | 35,025 (81.7%) | 7,863 (18.3%) |
Housing Structures by Number of Rooms in Fayette County
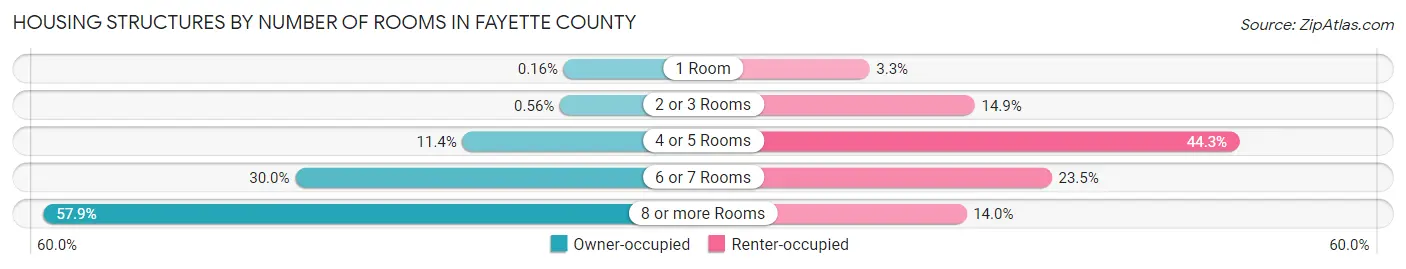
| Number of Rooms | Owner-occupied | Renter-occupied |
| 1 Room | 56 (0.2%) | 257 (3.3%) |
| 2 or 3 Rooms | 197 (0.6%) | 1,175 (14.9%) |
| 4 or 5 Rooms | 3,990 (11.4%) | 3,482 (44.3%) |
| 6 or 7 Rooms | 10,495 (30.0%) | 1,847 (23.5%) |
| 8 or more Rooms | 20,287 (57.9%) | 1,102 (14.0%) |
| Total | 35,025 (100.0%) | 7,863 (100.0%) |
Housing Structure by Heating Type in Fayette County
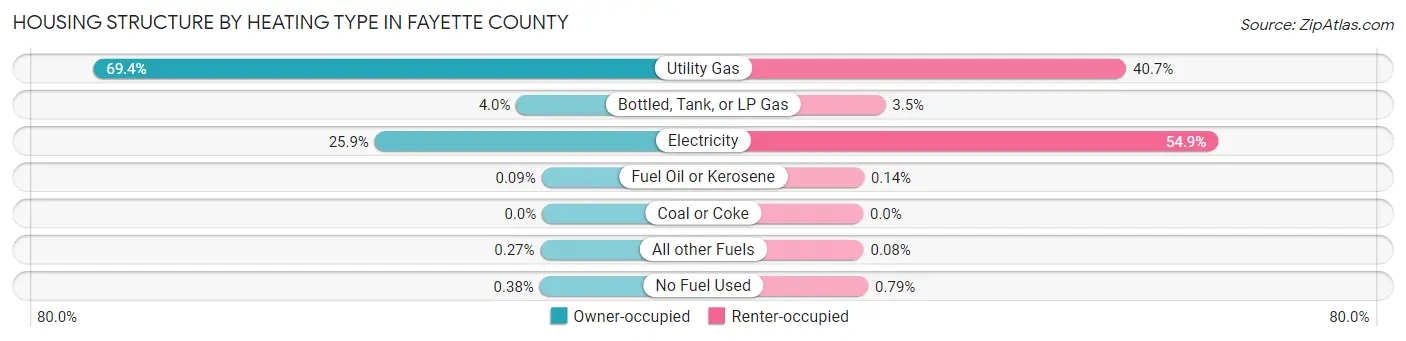
| Heating Type | Owner-occupied | Renter-occupied |
| Utility Gas | 24,302 (69.4%) | 3,198 (40.7%) |
| Bottled, Tank, or LP Gas | 1,398 (4.0%) | 271 (3.5%) |
| Electricity | 9,066 (25.9%) | 4,315 (54.9%) |
| Fuel Oil or Kerosene | 30 (0.1%) | 11 (0.1%) |
| Coal or Coke | 0 (0.0%) | 0 (0.0%) |
| All other Fuels | 95 (0.3%) | 6 (0.1%) |
| No Fuel Used | 134 (0.4%) | 62 (0.8%) |
| Total | 35,025 (100.0%) | 7,863 (100.0%) |
Household Vehicle Usage in Fayette County
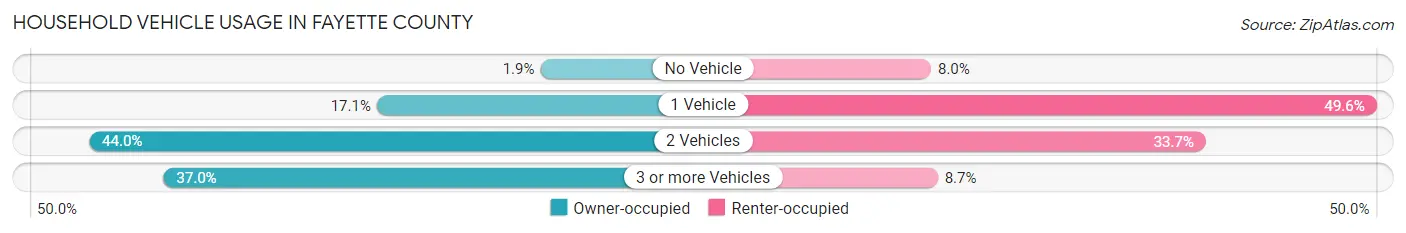
| Vehicles per Household | Owner-occupied | Renter-occupied |
| No Vehicle | 652 (1.9%) | 632 (8.0%) |
| 1 Vehicle | 5,999 (17.1%) | 3,902 (49.6%) |
| 2 Vehicles | 15,400 (44.0%) | 2,648 (33.7%) |
| 3 or more Vehicles | 12,974 (37.0%) | 681 (8.7%) |
| Total | 35,025 (100.0%) | 7,863 (100.0%) |
Real Estate & Mortgages in Fayette County
Real Estate and Mortgage Overview in Fayette County
| Characteristic | Without Mortgage | With Mortgage |
| Housing Units | 11,131 | 23,894 |
| Median Property Value | $340,900 | $380,800 |
| Median Household Income | $94,632 | $9,930 |
| Monthly Housing Costs | $592 | $4,770 |
| Real Estate Taxes | $2,260 | $299 |
Property Value by Mortgage Status in Fayette County
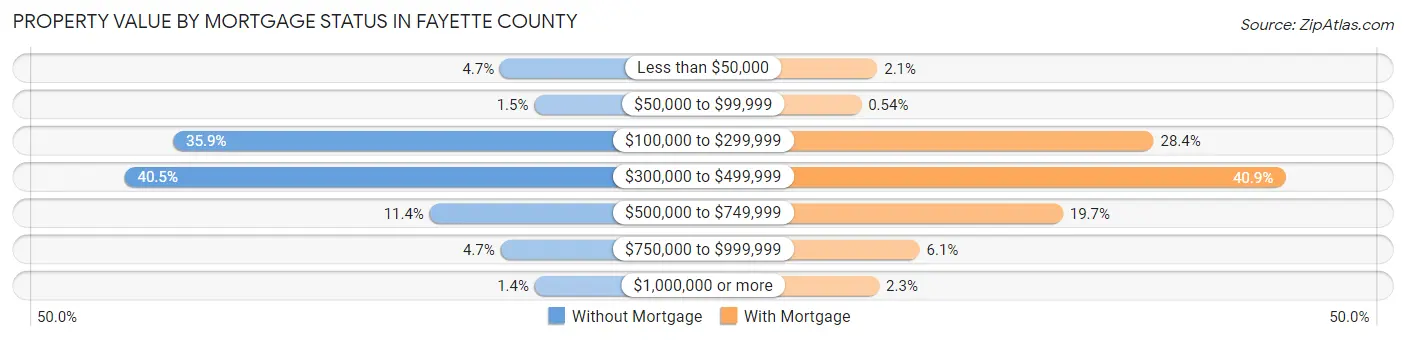
| Property Value | Without Mortgage | With Mortgage |
| Less than $50,000 | 525 (4.7%) | 495 (2.1%) |
| $50,000 to $99,999 | 162 (1.5%) | 129 (0.5%) |
| $100,000 to $299,999 | 3,990 (35.8%) | 6,781 (28.4%) |
| $300,000 to $499,999 | 4,506 (40.5%) | 9,778 (40.9%) |
| $500,000 to $749,999 | 1,271 (11.4%) | 4,716 (19.7%) |
| $750,000 to $999,999 | 520 (4.7%) | 1,457 (6.1%) |
| $1,000,000 or more | 157 (1.4%) | 538 (2.2%) |
| Total | 11,131 (100.0%) | 23,894 (100.0%) |
Household Income by Mortgage Status in Fayette County
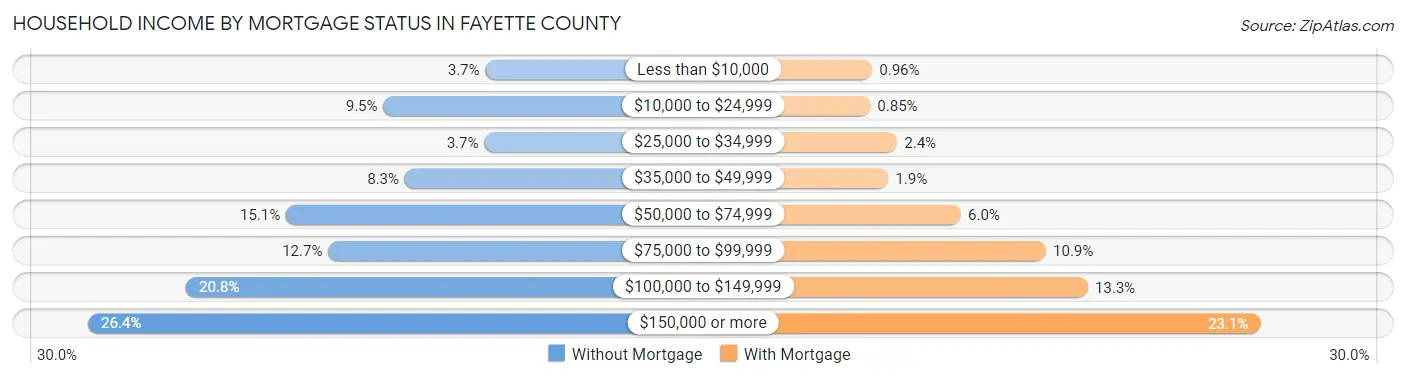
| Household Income | Without Mortgage | With Mortgage |
| Less than $10,000 | 408 (3.7%) | 229 (1.0%) |
| $10,000 to $24,999 | 1,057 (9.5%) | 202 (0.9%) |
| $25,000 to $34,999 | 415 (3.7%) | 572 (2.4%) |
| $35,000 to $49,999 | 920 (8.3%) | 449 (1.9%) |
| $50,000 to $74,999 | 1,676 (15.1%) | 1,441 (6.0%) |
| $75,000 to $99,999 | 1,408 (12.7%) | 2,603 (10.9%) |
| $100,000 to $149,999 | 2,312 (20.8%) | 3,173 (13.3%) |
| $150,000 or more | 2,935 (26.4%) | 5,524 (23.1%) |
| Total | 11,131 (100.0%) | 23,894 (100.0%) |
Property Value to Household Income Ratio in Fayette County
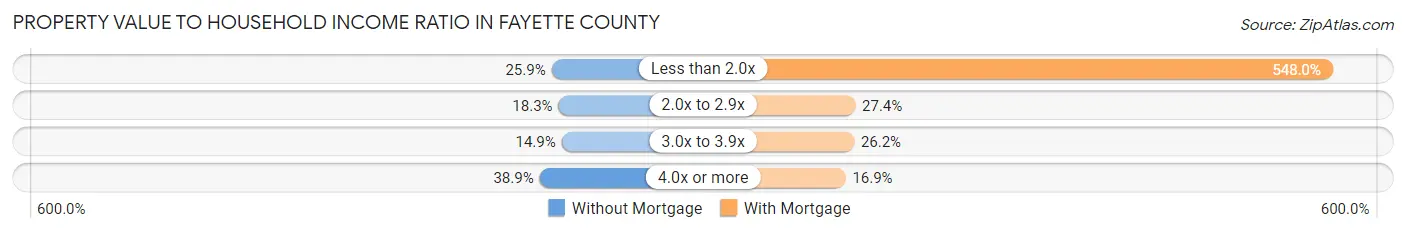
| Value-to-Income Ratio | Without Mortgage | With Mortgage |
| Less than 2.0x | 2,877 (25.9%) | 130,936 (548.0%) |
| 2.0x to 2.9x | 2,041 (18.3%) | 6,554 (27.4%) |
| 3.0x to 3.9x | 1,655 (14.9%) | 6,256 (26.2%) |
| 4.0x or more | 4,334 (38.9%) | 4,044 (16.9%) |
| Total | 11,131 (100.0%) | 23,894 (100.0%) |
Real Estate Taxes by Mortgage Status in Fayette County
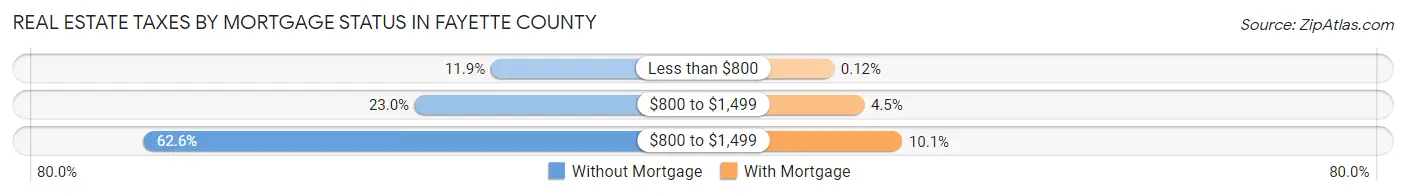
| Property Taxes | Without Mortgage | With Mortgage |
| Less than $800 | 1,319 (11.8%) | 28 (0.1%) |
| $800 to $1,499 | 2,556 (23.0%) | 1,083 (4.5%) |
| $800 to $1,499 | 6,964 (62.6%) | 2,405 (10.1%) |
| Total | 11,131 (100.0%) | 23,894 (100.0%) |
Health & Disability in Fayette County
Health Insurance Coverage by Age in Fayette County
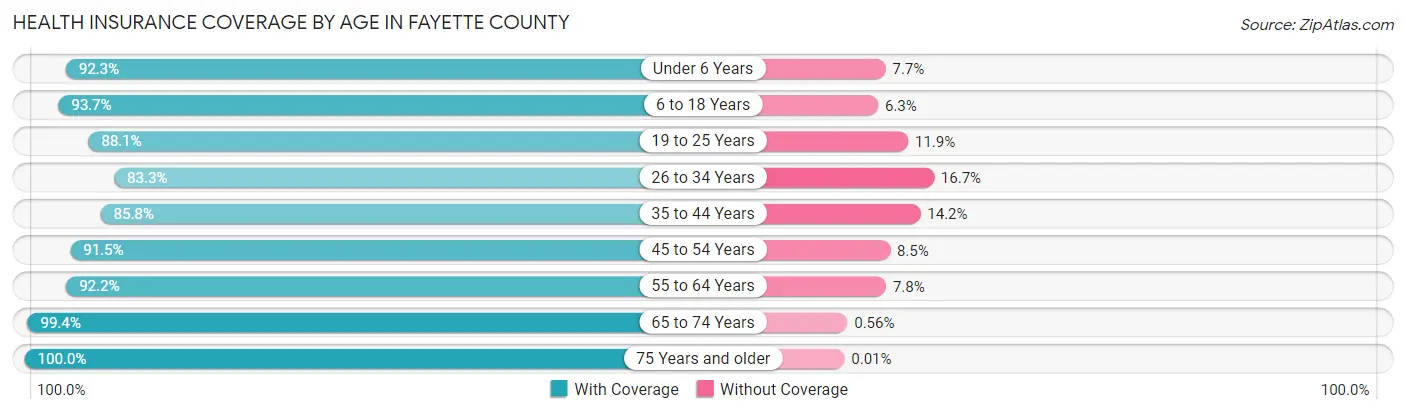
| Age Bracket | With Coverage | Without Coverage |
| Under 6 Years | 5,797 (92.3%) | 483 (7.7%) |
| 6 to 18 Years | 21,188 (93.7%) | 1,423 (6.3%) |
| 19 to 25 Years | 8,583 (88.1%) | 1,158 (11.9%) |
| 26 to 34 Years | 7,753 (83.3%) | 1,555 (16.7%) |
| 35 to 44 Years | 11,912 (85.8%) | 1,968 (14.2%) |
| 45 to 54 Years | 15,248 (91.5%) | 1,421 (8.5%) |
| 55 to 64 Years | 16,115 (92.2%) | 1,358 (7.8%) |
| 65 to 74 Years | 13,590 (99.4%) | 76 (0.6%) |
| 75 Years and older | 8,760 (100.0%) | 1 (0.0%) |
| Total | 108,946 (92.0%) | 9,443 (8.0%) |
Health Insurance Coverage by Citizenship Status in Fayette County
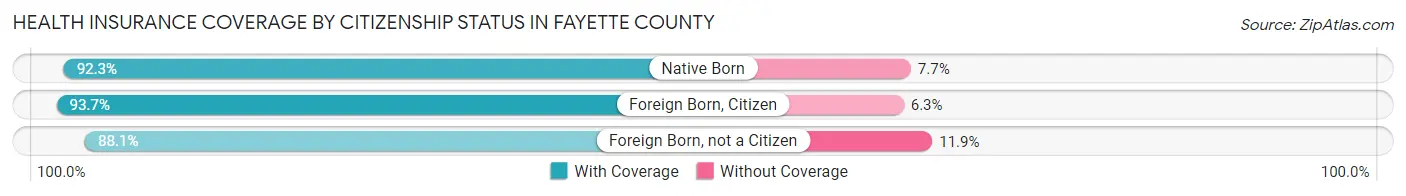
| Citizenship Status | With Coverage | Without Coverage |
| Native Born | 5,797 (92.3%) | 483 (7.7%) |
| Foreign Born, Citizen | 21,188 (93.7%) | 1,423 (6.3%) |
| Foreign Born, not a Citizen | 8,583 (88.1%) | 1,158 (11.9%) |
Health Insurance Coverage by Household Income in Fayette County
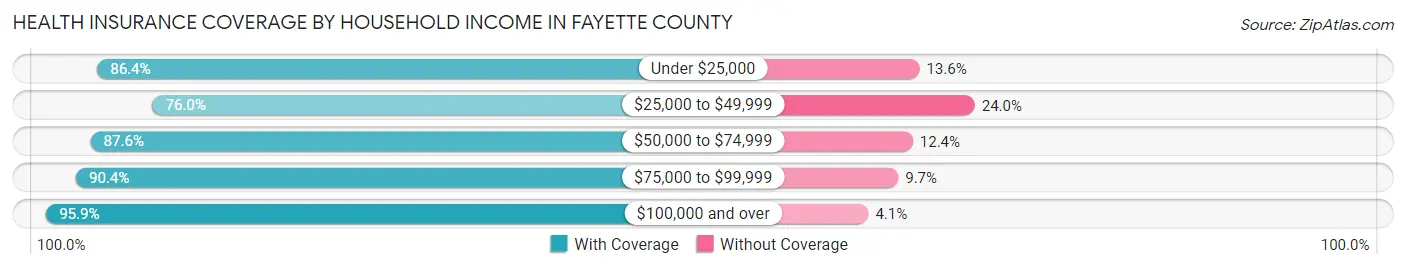
| Household Income | With Coverage | Without Coverage |
| Under $25,000 | 4,508 (86.4%) | 711 (13.6%) |
| $25,000 to $49,999 | 7,878 (76.0%) | 2,485 (24.0%) |
| $50,000 to $74,999 | 13,181 (87.6%) | 1,863 (12.4%) |
| $75,000 to $99,999 | 13,064 (90.3%) | 1,395 (9.7%) |
| $100,000 and over | 70,283 (95.9%) | 2,975 (4.1%) |
Public vs Private Health Insurance Coverage by Age in Fayette County
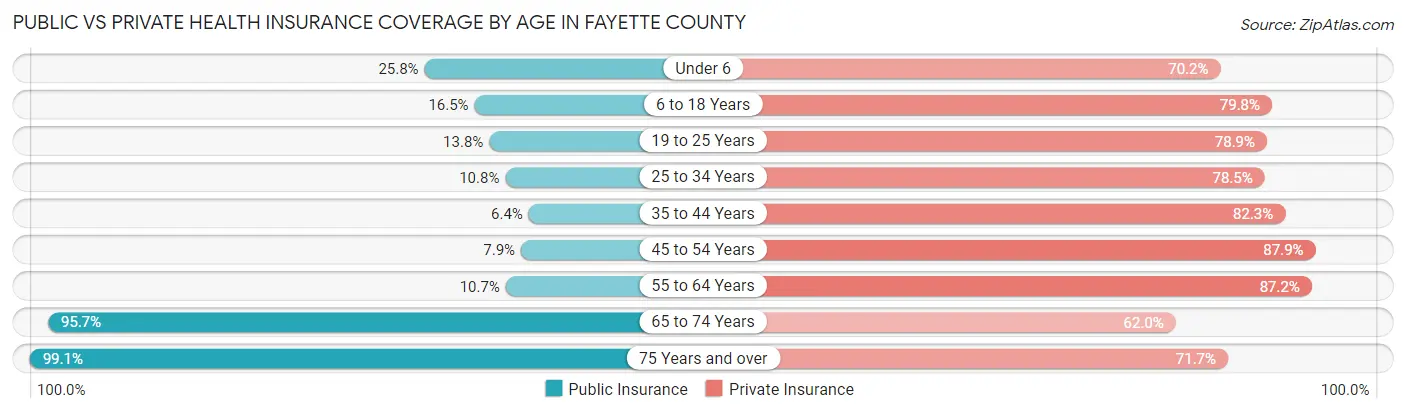
| Age Bracket | Public Insurance | Private Insurance |
| Under 6 | 1,619 (25.8%) | 4,411 (70.2%) |
| 6 to 18 Years | 3,730 (16.5%) | 18,048 (79.8%) |
| 19 to 25 Years | 1,341 (13.8%) | 7,685 (78.9%) |
| 25 to 34 Years | 1,004 (10.8%) | 7,304 (78.5%) |
| 35 to 44 Years | 893 (6.4%) | 11,420 (82.3%) |
| 45 to 54 Years | 1,313 (7.9%) | 14,652 (87.9%) |
| 55 to 64 Years | 1,870 (10.7%) | 15,239 (87.2%) |
| 65 to 74 Years | 13,075 (95.7%) | 8,468 (62.0%) |
| 75 Years and over | 8,678 (99.1%) | 6,277 (71.7%) |
| Total | 33,523 (28.3%) | 93,504 (79.0%) |
Disability Status by Sex by Age in Fayette County
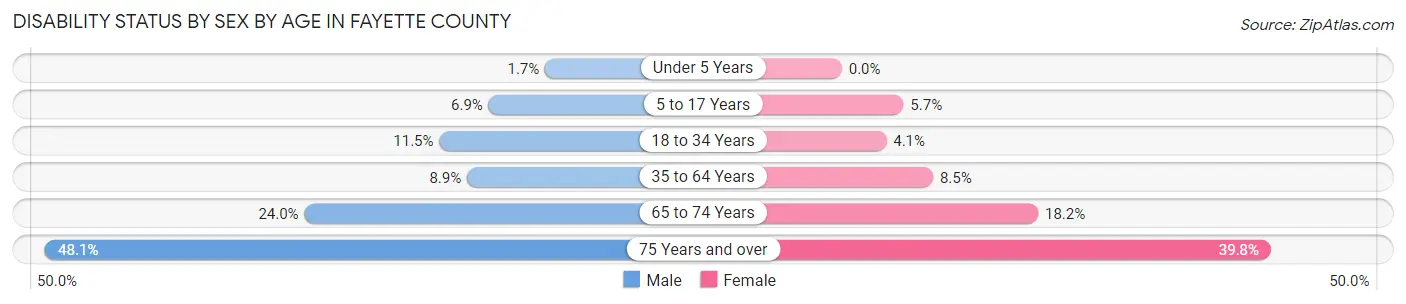
| Age Bracket | Male | Female |
| Under 5 Years | 46 (1.7%) | 0 (0.0%) |
| 5 to 17 Years | 776 (6.9%) | 617 (5.7%) |
| 18 to 34 Years | 1,184 (11.5%) | 433 (4.1%) |
| 35 to 64 Years | 2,073 (8.9%) | 2,100 (8.5%) |
| 65 to 74 Years | 1,519 (24.0%) | 1,338 (18.2%) |
| 75 Years and over | 1,834 (48.1%) | 1,970 (39.8%) |
Disability Class by Sex by Age in Fayette County
Disability Class: Hearing Difficulty
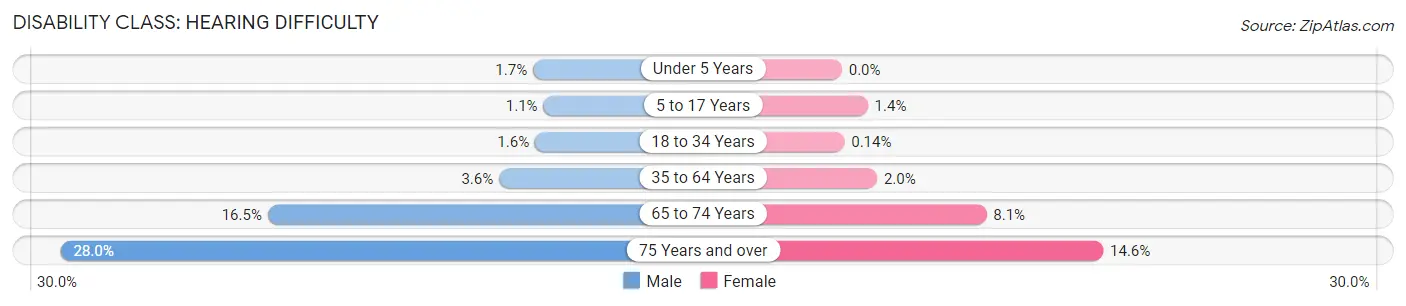
| Age Bracket | Male | Female |
| Under 5 Years | 46 (1.7%) | 0 (0.0%) |
| 5 to 17 Years | 124 (1.1%) | 155 (1.4%) |
| 18 to 34 Years | 162 (1.6%) | 15 (0.1%) |
| 35 to 64 Years | 830 (3.6%) | 487 (2.0%) |
| 65 to 74 Years | 1,040 (16.5%) | 591 (8.1%) |
| 75 Years and over | 1,068 (28.0%) | 720 (14.5%) |
Disability Class: Vision Difficulty
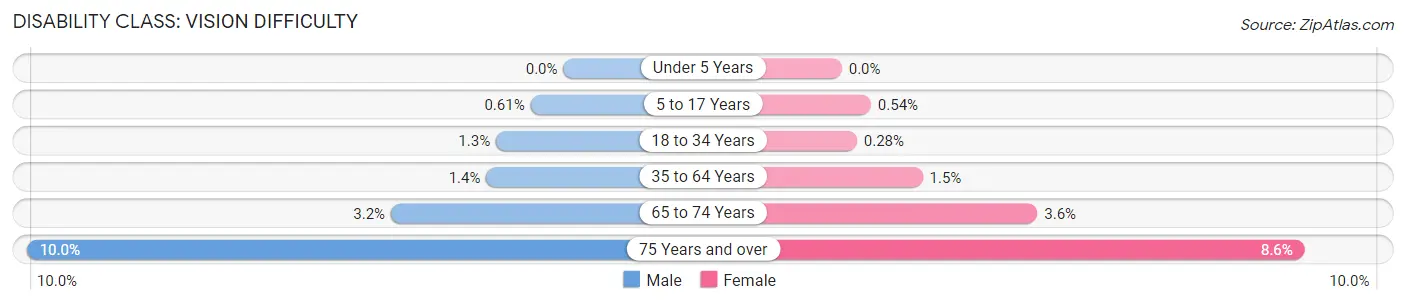
| Age Bracket | Male | Female |
| Under 5 Years | 0 (0.0%) | 0 (0.0%) |
| 5 to 17 Years | 68 (0.6%) | 58 (0.5%) |
| 18 to 34 Years | 129 (1.3%) | 29 (0.3%) |
| 35 to 64 Years | 332 (1.4%) | 372 (1.5%) |
| 65 to 74 Years | 202 (3.2%) | 267 (3.6%) |
| 75 Years and over | 380 (10.0%) | 425 (8.6%) |
Disability Class: Cognitive Difficulty
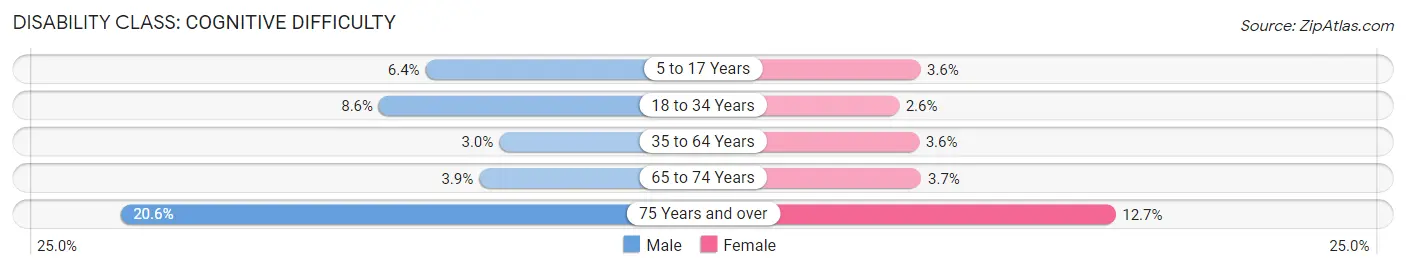
| Age Bracket | Male | Female |
| 5 to 17 Years | 717 (6.4%) | 392 (3.6%) |
| 18 to 34 Years | 880 (8.6%) | 277 (2.6%) |
| 35 to 64 Years | 692 (3.0%) | 886 (3.6%) |
| 65 to 74 Years | 247 (3.9%) | 270 (3.7%) |
| 75 Years and over | 784 (20.6%) | 628 (12.7%) |
Disability Class: Ambulatory Difficulty
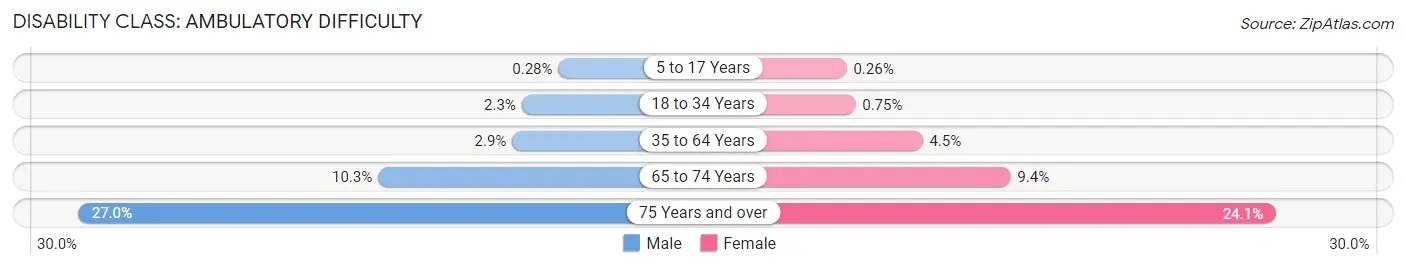
| Age Bracket | Male | Female |
| 5 to 17 Years | 31 (0.3%) | 28 (0.3%) |
| 18 to 34 Years | 239 (2.3%) | 79 (0.7%) |
| 35 to 64 Years | 660 (2.9%) | 1,115 (4.5%) |
| 65 to 74 Years | 652 (10.3%) | 690 (9.4%) |
| 75 Years and over | 1,029 (27.0%) | 1,193 (24.1%) |
Disability Class: Self-Care Difficulty
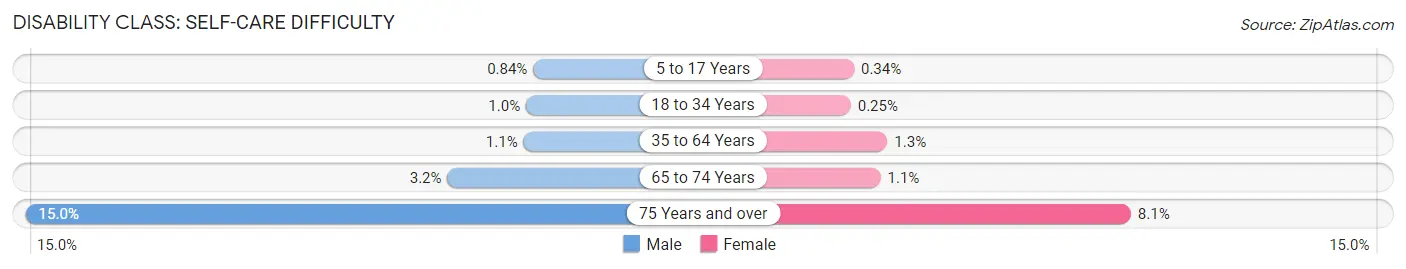
| Age Bracket | Male | Female |
| 5 to 17 Years | 94 (0.8%) | 37 (0.3%) |
| 18 to 34 Years | 107 (1.0%) | 26 (0.3%) |
| 35 to 64 Years | 258 (1.1%) | 316 (1.3%) |
| 65 to 74 Years | 204 (3.2%) | 79 (1.1%) |
| 75 Years and over | 571 (15.0%) | 398 (8.1%) |
Technology Access in Fayette County
Computing Device Access in Fayette County
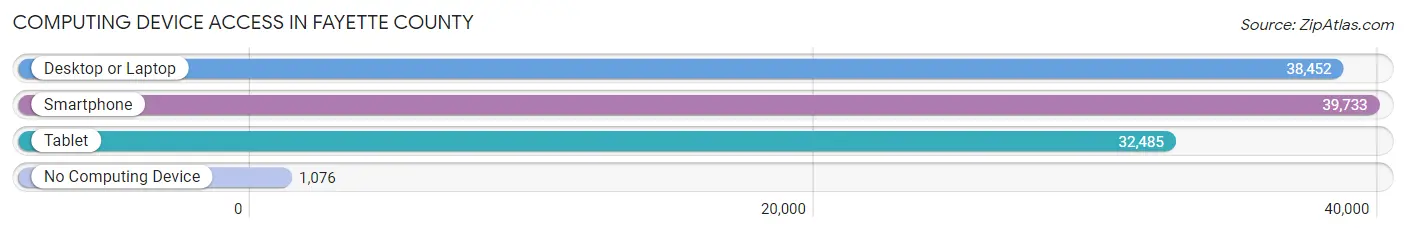
| Device Type | # Households | % Households |
| Desktop or Laptop | 38,452 | 89.7% |
| Smartphone | 39,733 | 92.6% |
| Tablet | 32,485 | 75.7% |
| No Computing Device | 1,076 | 2.5% |
| Total | 42,888 | 100.0% |
Internet Access in Fayette County
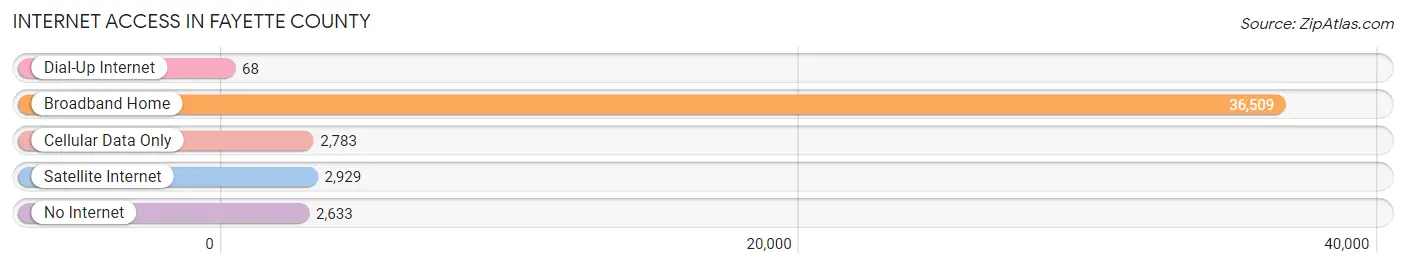
| Internet Type | # Households | % Households |
| Dial-Up Internet | 68 | 0.2% |
| Broadband Home | 36,509 | 85.1% |
| Cellular Data Only | 2,783 | 6.5% |
| Satellite Internet | 2,929 | 6.8% |
| No Internet | 2,633 | 6.1% |
| Total | 42,888 | 100.0% |
Fayette County Summary
Fayette County, Georgia is located in the south-central part of the state, approximately 25 miles south of Atlanta. It is bordered by Coweta County to the north, Spalding County to the east, Clayton County to the south, and Fulton County to the west. The county seat is Fayetteville, and the county is part of the Atlanta metropolitan area.
History
Fayette County was created in 1821 from parts of Henry, Coweta, and Fayette counties. It was named for the Marquis de Lafayette, a French military hero who fought in the American Revolutionary War. The county was originally part of the Creek Nation, and the area was home to several Native American tribes, including the Creek, Cherokee, and Choctaw.
In the early 19th century, the area was settled by European-American settlers, mostly from the Carolinas and Virginia. The county was home to several prominent families, including the Fayetteville family, who owned a large plantation in the area. The county was also home to several prominent African-American families, including the Jones and the Smiths.
During the Civil War, Fayette County was the site of several battles, including the Battle of Fayetteville in 1864. After the war, the county was home to several freedmen's colonies, including the Fayetteville Freedmen's Colony.
Geography
Fayette County covers an area of approximately 437 square miles. The county is located in the Piedmont region of Georgia, and is characterized by rolling hills and wooded areas. The county is drained by the Flint River, which flows through the county from north to south.
The county is home to several state parks, including Fayetteville State Park, which is located in the northern part of the county. The county is also home to several lakes, including Lake Peachtree, which is located in the southern part of the county.
Economy
Fayette County has a diverse economy, with a mix of manufacturing, retail, and service industries. The county is home to several large employers, including Fayetteville-based Delta Air Lines, which employs over 1,000 people in the county. Other major employers include the Fayette County Board of Education, Piedmont Fayette Hospital, and the Fayetteville-based automotive parts manufacturer, Fayette Automotive.
The county is also home to several small businesses, including restaurants, retail stores, and professional services. The county is also home to several wineries, including the Fayetteville Winery, which produces a variety of wines.
Demographics
As of the 2010 census, Fayette County had a population of 106,567. The population was 56.2% White, 33.3% African American, 0.3% Native American, 3.2% Asian, and 5.9% Hispanic or Latino. The median household income was $60,945, and the median family income was $71,845.
The county is home to several colleges and universities, including the University of Georgia, Georgia State University, and Georgia Tech. The county is also home to several public schools, including Fayette County High School, Fayetteville Elementary School, and Fayetteville Middle School.
Common Questions
What is the Total Population of Fayette County?
Total Population of Fayette County is 119,259.
What is the Total Male Population of Fayette County?
Total Male Population of Fayette County is 58,066.
What is the Total Female Population of Fayette County?
Total Female Population of Fayette County is 61,193.
What is the Ratio of Males per 100 Females in Fayette County?
There are 94.89 Males per 100 Females in Fayette County.
What is the Ratio of Females per 100 Males in Fayette County?
There are 105.39 Females per 100 Males in Fayette County.
What is the Median Population Age in Fayette County?
Median Population Age in Fayette County is 43.2 Years.
What is the Average Family Size in Fayette County
Average Family Size in Fayette County is 3.1 People.
What is the Average Household Size in Fayette County
Average Household Size in Fayette County is 2.8 People.
What is Per Capita Income in Fayette County?
Per Capita income in Fayette County is $51,004.
What is the Median Family Income in Fayette County?
Median Family Income in Fayette County is $122,500.
What is the Median Household income in Fayette County?
Median Household Income in Fayette County is $105,910.
What is Income or Wage Gap in Fayette County?
Income or Wage Gap in Fayette County is 40.9%.
Women in Fayette County earn 59.1 cents for every dollar earned by a man.
What is Inequality or Gini Index in Fayette County?
Inequality or Gini Index in Fayette County is 0.43.
How Large is the Labor Force in Fayette County?
There are 57,357 People in the Labor Forcein in Fayette County.
What is the Percentage of People in the Labor Force in Fayette County?
59.8% of People are in the Labor Force in Fayette County.
What is the Unemployment Rate in Fayette County?
Unemployment Rate in Fayette County is 3.9%.