DeKalb County, GA
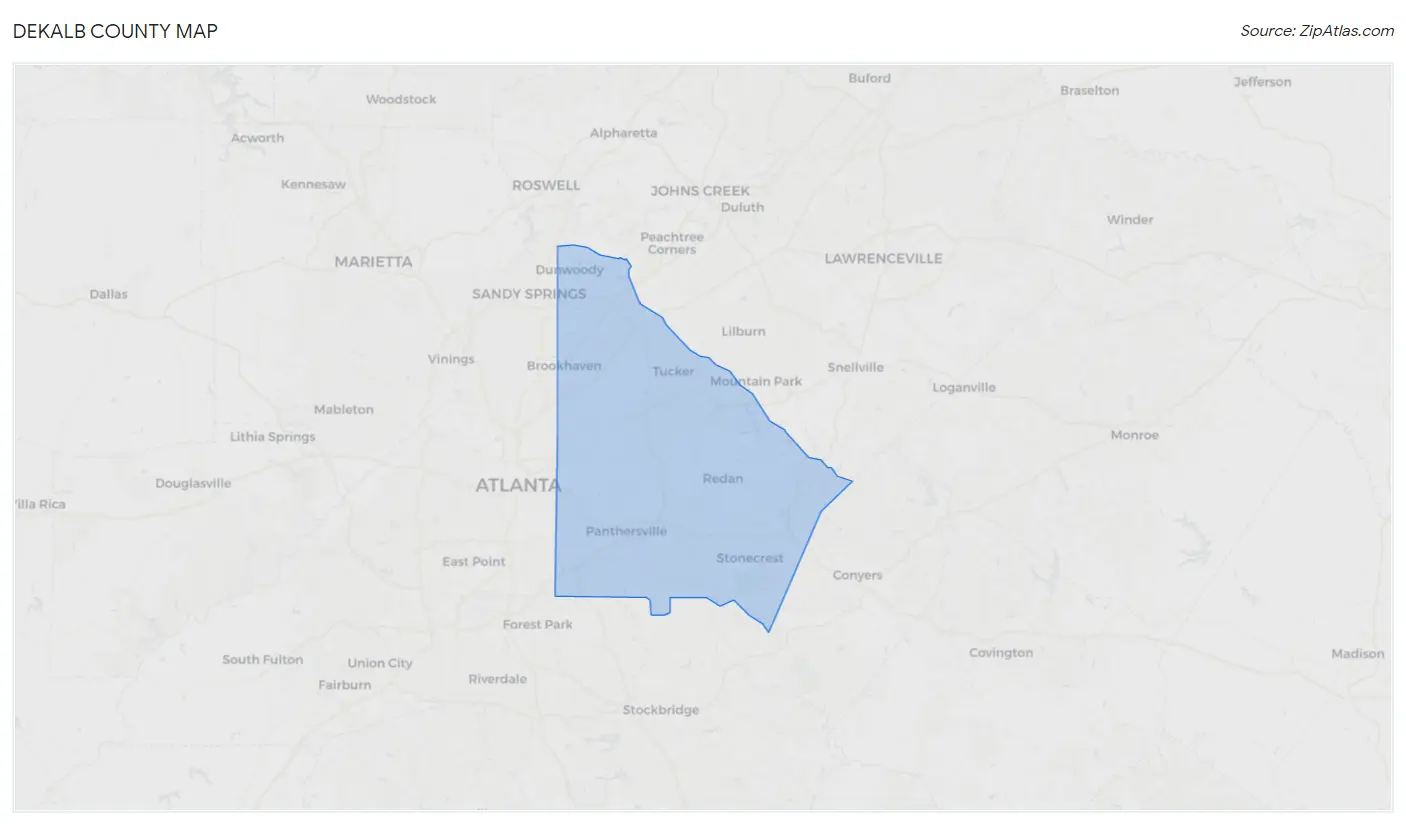
DeKalb County Map
DeKalb County Overview
761,209
TOTAL POPULATION
361,801
MALE POPULATION
399,408
FEMALE POPULATION
90.58
MALES / 100 FEMALES
110.39
FEMALES / 100 MALES
36.3
MEDIAN AGE
3.5
AVG FAMILY SIZE
2.6
AVG HOUSEHOLD SIZE
$43,958
PER CAPITA INCOME
$97,842
AVG FAMILY INCOME
$76,044
AVG HOUSEHOLD INCOME
14.9%
WAGE / INCOME GAP [ % ]
85.1¢/ $1
WAGE / INCOME GAP [ $ ]
$10,850
FAMILY INCOME DEFICIT
0.49
INEQUALITY / GINI INDEX
415,707
LABOR FORCE [ PEOPLE ]
68.6%
PERCENT IN LABOR FORCE
6.4%
UNEMPLOYMENT RATE
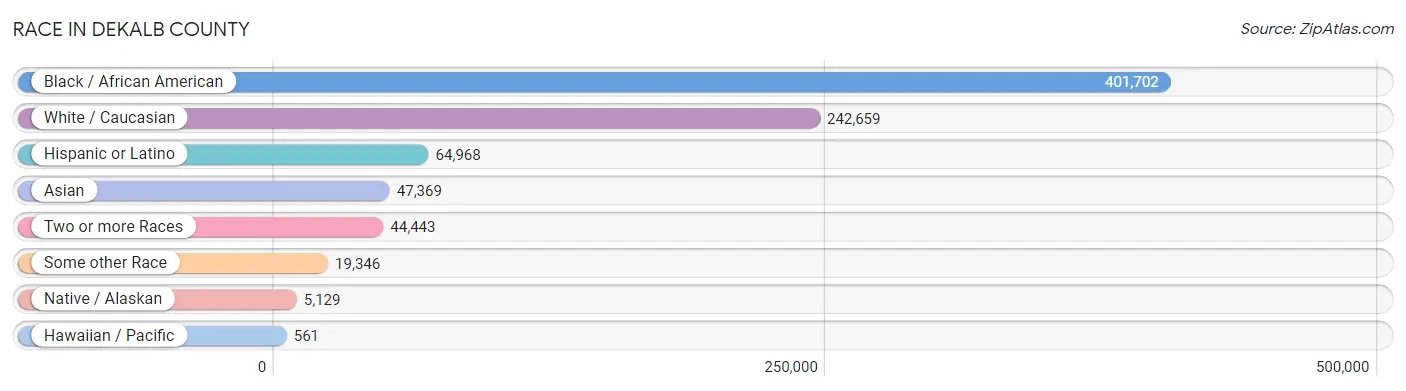
Race in DeKalb County
The most populous races in DeKalb County are Black / African American (401,702 | 52.8%), White / Caucasian (242,659 | 31.9%), and Hispanic or Latino (64,968 | 8.5%).
| Race | # Population | % Population |
| Asian | 47,369 | 6.2% |
| Black / African American | 401,702 | 52.8% |
| Hawaiian / Pacific | 561 | 0.1% |
| Hispanic or Latino | 64,968 | 8.5% |
| Native / Alaskan | 5,129 | 0.7% |
| White / Caucasian | 242,659 | 31.9% |
| Two or more Races | 44,443 | 5.8% |
| Some other Race | 19,346 | 2.5% |
| Total | 761,209 | 100.0% |
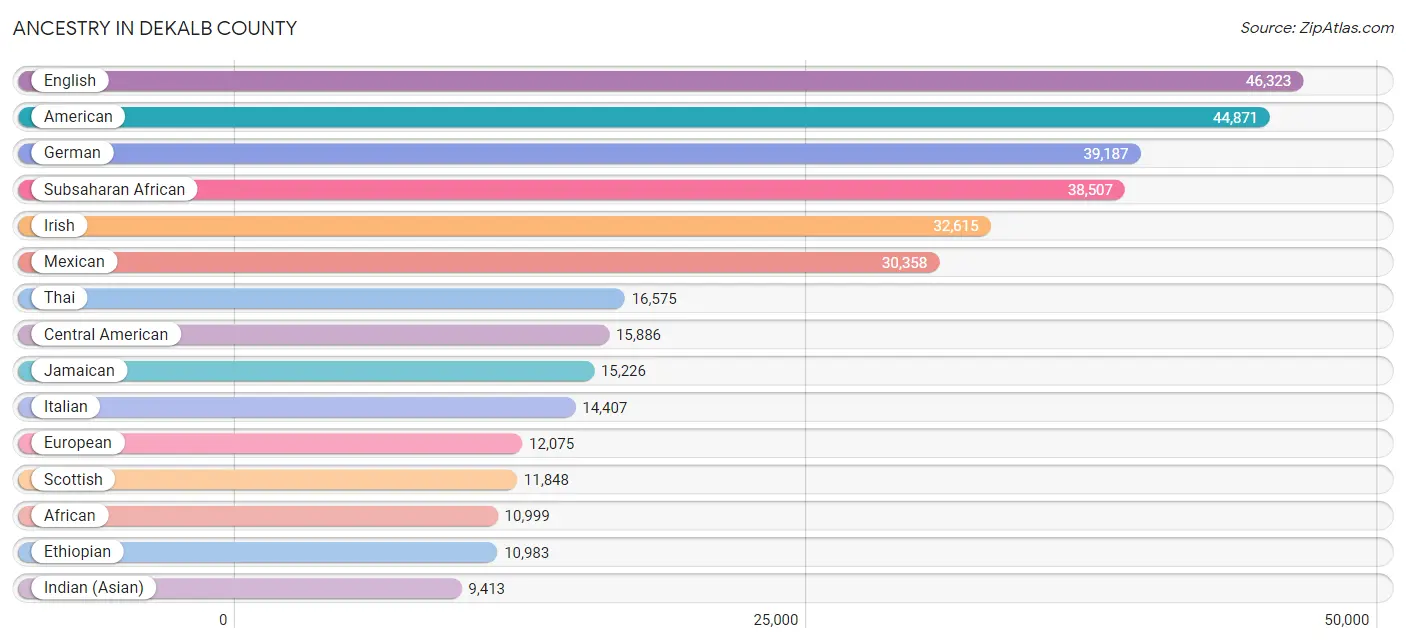
Ancestry in DeKalb County
The most populous ancestries reported in DeKalb County are English (46,323 | 6.1%), American (44,871 | 5.9%), German (39,187 | 5.1%), Subsaharan African (38,507 | 5.1%), and Irish (32,615 | 4.3%), together accounting for 26.5% of all DeKalb County residents.
| Ancestry | # Population | % Population |
| Afghan | 566 | 0.1% |
| African | 10,999 | 1.4% |
| Albanian | 68 | 0.0% |
| American | 44,871 | 5.9% |
| Apache | 616 | 0.1% |
| Arab | 4,048 | 0.5% |
| Argentinean | 595 | 0.1% |
| Armenian | 295 | 0.0% |
| Assyrian / Chaldean / Syriac | 62 | 0.0% |
| Australian | 225 | 0.0% |
| Austrian | 803 | 0.1% |
| Bahamian | 1,176 | 0.2% |
| Bangladeshi | 12 | 0.0% |
| Barbadian | 1,015 | 0.1% |
| Belgian | 212 | 0.0% |
| Belizean | 94 | 0.0% |
| Bermudan | 87 | 0.0% |
| Bhutanese | 1,980 | 0.3% |
| Blackfeet | 265 | 0.0% |
| Bolivian | 19 | 0.0% |
| Brazilian | 606 | 0.1% |
| British | 4,831 | 0.6% |
| British West Indian | 997 | 0.1% |
| Bulgarian | 150 | 0.0% |
| Burmese | 4,567 | 0.6% |
| Cajun | 240 | 0.0% |
| Canadian | 746 | 0.1% |
| Cape Verdean | 155 | 0.0% |
| Carpatho Rusyn | 17 | 0.0% |
| Celtic | 49 | 0.0% |
| Central American | 15,886 | 2.1% |
| Central American Indian | 981 | 0.1% |
| Cherokee | 2,357 | 0.3% |
| Chickasaw | 76 | 0.0% |
| Chilean | 600 | 0.1% |
| Chippewa | 47 | 0.0% |
| Choctaw | 221 | 0.0% |
| Colombian | 3,080 | 0.4% |
| Costa Rican | 186 | 0.0% |
| Creek | 327 | 0.0% |
| Croatian | 289 | 0.0% |
| Crow | 4 | 0.0% |
| Cuban | 2,985 | 0.4% |
| Czech | 1,531 | 0.2% |
| Czechoslovakian | 108 | 0.0% |
| Danish | 1,663 | 0.2% |
| Dominican | 1,366 | 0.2% |
| Dutch | 3,920 | 0.5% |
| Dutch West Indian | 41 | 0.0% |
| Eastern European | 2,745 | 0.4% |
| Ecuadorian | 337 | 0.0% |
| Egyptian | 362 | 0.1% |
| English | 46,323 | 6.1% |
| Estonian | 34 | 0.0% |
| Ethiopian | 10,983 | 1.4% |
| European | 12,075 | 1.6% |
| Fijian | 13 | 0.0% |
| Filipino | 761 | 0.1% |
| Finnish | 712 | 0.1% |
| French | 7,992 | 1.1% |
| French American Indian | 27 | 0.0% |
| French Canadian | 1,008 | 0.1% |
| German | 39,187 | 5.1% |
| German Russian | 14 | 0.0% |
| Ghanaian | 992 | 0.1% |
| Greek | 2,575 | 0.3% |
| Guamanian / Chamorro | 334 | 0.0% |
| Guatemalan | 8,395 | 1.1% |
| Guyanese | 2,370 | 0.3% |
| Haitian | 2,413 | 0.3% |
| Honduran | 3,358 | 0.4% |
| Hungarian | 1,282 | 0.2% |
| Icelander | 35 | 0.0% |
| Indian (Asian) | 9,413 | 1.2% |
| Indonesian | 3,970 | 0.5% |
| Iranian | 695 | 0.1% |
| Iraqi | 503 | 0.1% |
| Irish | 32,615 | 4.3% |
| Iroquois | 70 | 0.0% |
| Israeli | 799 | 0.1% |
| Italian | 14,407 | 1.9% |
| Jamaican | 15,226 | 2.0% |
| Japanese | 550 | 0.1% |
| Jordanian | 152 | 0.0% |
| Kenyan | 396 | 0.1% |
| Korean | 2,972 | 0.4% |
| Laotian | 299 | 0.0% |
| Latvian | 142 | 0.0% |
| Lebanese | 994 | 0.1% |
| Liberian | 969 | 0.1% |
| Lithuanian | 767 | 0.1% |
| Lumbee | 46 | 0.0% |
| Macedonian | 66 | 0.0% |
| Malaysian | 312 | 0.0% |
| Maltese | 11 | 0.0% |
| Marshallese | 20 | 0.0% |
| Mexican | 30,358 | 4.0% |
| Mexican American Indian | 3,671 | 0.5% |
| Mongolian | 193 | 0.0% |
| Moroccan | 511 | 0.1% |
| Native Hawaiian | 201 | 0.0% |
| Navajo | 28 | 0.0% |
| New Zealander | 38 | 0.0% |
| Nicaraguan | 976 | 0.1% |
| Nigerian | 5,672 | 0.7% |
| Northern European | 1,213 | 0.2% |
| Norwegian | 2,405 | 0.3% |
| Okinawan | 66 | 0.0% |
| Pakistani | 695 | 0.1% |
| Palestinian | 120 | 0.0% |
| Panamanian | 696 | 0.1% |
| Paraguayan | 67 | 0.0% |
| Pennsylvania German | 27 | 0.0% |
| Peruvian | 1,145 | 0.2% |
| Pima | 8 | 0.0% |
| Polish | 8,222 | 1.1% |
| Portuguese | 886 | 0.1% |
| Potawatomi | 7 | 0.0% |
| Pueblo | 52 | 0.0% |
| Puerto Rican | 4,233 | 0.6% |
| Romanian | 525 | 0.1% |
| Russian | 6,263 | 0.8% |
| Salvadoran | 2,262 | 0.3% |
| Samoan | 83 | 0.0% |
| Scandinavian | 1,177 | 0.2% |
| Scotch-Irish | 6,529 | 0.9% |
| Scottish | 11,848 | 1.6% |
| Seminole | 81 | 0.0% |
| Senegalese | 84 | 0.0% |
| Serbian | 216 | 0.0% |
| Shoshone | 24 | 0.0% |
| Sierra Leonean | 237 | 0.0% |
| Sioux | 616 | 0.1% |
| Slavic | 129 | 0.0% |
| Slovak | 207 | 0.0% |
| Slovene | 210 | 0.0% |
| Somali | 2,076 | 0.3% |
| South African | 153 | 0.0% |
| South American | 7,412 | 1.0% |
| South American Indian | 81 | 0.0% |
| Spaniard | 1,063 | 0.1% |
| Spanish | 366 | 0.1% |
| Spanish American | 14 | 0.0% |
| Sri Lankan | 4,216 | 0.5% |
| Subsaharan African | 38,507 | 5.1% |
| Sudanese | 761 | 0.1% |
| Swedish | 3,616 | 0.5% |
| Swiss | 1,259 | 0.2% |
| Syrian | 359 | 0.1% |
| Taiwanese | 9 | 0.0% |
| Thai | 16,575 | 2.2% |
| Tongan | 52 | 0.0% |
| Trinidadian and Tobagonian | 1,791 | 0.2% |
| Turkish | 761 | 0.1% |
| U.S. Virgin Islander | 315 | 0.0% |
| Ugandan | 1,383 | 0.2% |
| Ukrainian | 1,117 | 0.2% |
| Uruguayan | 133 | 0.0% |
| Venezuelan | 1,317 | 0.2% |
| Vietnamese | 2,347 | 0.3% |
| Welsh | 3,249 | 0.4% |
| West Indian | 2,125 | 0.3% |
| Yugoslavian | 705 | 0.1% |
| Zimbabwean | 21 | 0.0% | View All 164 Rows |
Immigrants in DeKalb County
The most numerous immigrant groups reported in DeKalb County came from Latin America (48,841 | 6.4%), Asia (37,211 | 4.9%), Africa (28,830 | 3.8%), Central America (22,610 | 3.0%), and Caribbean (18,052 | 2.4%), together accounting for 20.4% of all DeKalb County residents.

| Immigration Origin | # Population | % Population |
| Afghanistan | 599 | 0.1% |
| Africa | 28,830 | 3.8% |
| Albania | 39 | 0.0% |
| Argentina | 397 | 0.1% |
| Asia | 37,211 | 4.9% |
| Australia | 95 | 0.0% |
| Austria | 45 | 0.0% |
| Bahamas | 576 | 0.1% |
| Bangladesh | 2,217 | 0.3% |
| Barbados | 323 | 0.0% |
| Belarus | 70 | 0.0% |
| Belgium | 53 | 0.0% |
| Belize | 216 | 0.0% |
| Bolivia | 10 | 0.0% |
| Bosnia and Herzegovina | 531 | 0.1% |
| Brazil | 857 | 0.1% |
| Bulgaria | 98 | 0.0% |
| Cambodia | 190 | 0.0% |
| Cameroon | 344 | 0.1% |
| Canada | 1,419 | 0.2% |
| Caribbean | 18,052 | 2.4% |
| Central America | 22,610 | 3.0% |
| Chile | 442 | 0.1% |
| China | 5,446 | 0.7% |
| Colombia | 1,344 | 0.2% |
| Congo | 854 | 0.1% |
| Costa Rica | 140 | 0.0% |
| Croatia | 15 | 0.0% |
| Cuba | 657 | 0.1% |
| Czechoslovakia | 45 | 0.0% |
| Denmark | 62 | 0.0% |
| Dominica | 300 | 0.0% |
| Dominican Republic | 438 | 0.1% |
| Eastern Africa | 14,107 | 1.8% |
| Eastern Asia | 8,283 | 1.1% |
| Eastern Europe | 3,142 | 0.4% |
| Ecuador | 266 | 0.0% |
| Egypt | 350 | 0.1% |
| El Salvador | 1,717 | 0.2% |
| England | 882 | 0.1% |
| Eritrea | 1,379 | 0.2% |
| Ethiopia | 8,295 | 1.1% |
| Europe | 7,945 | 1.0% |
| France | 366 | 0.1% |
| Germany | 973 | 0.1% |
| Ghana | 744 | 0.1% |
| Greece | 343 | 0.1% |
| Grenada | 245 | 0.0% |
| Guatemala | 5,240 | 0.7% |
| Guyana | 2,849 | 0.4% |
| Haiti | 1,161 | 0.2% |
| Honduras | 2,216 | 0.3% |
| Hong Kong | 200 | 0.0% |
| Hungary | 45 | 0.0% |
| India | 9,591 | 1.3% |
| Indonesia | 348 | 0.1% |
| Iran | 400 | 0.1% |
| Iraq | 689 | 0.1% |
| Ireland | 159 | 0.0% |
| Israel | 337 | 0.0% |
| Italy | 366 | 0.1% |
| Jamaica | 11,521 | 1.5% |
| Japan | 805 | 0.1% |
| Jordan | 213 | 0.0% |
| Kenya | 686 | 0.1% |
| Korea | 2,032 | 0.3% |
| Kuwait | 19 | 0.0% |
| Laos | 194 | 0.0% |
| Latin America | 48,841 | 6.4% |
| Latvia | 128 | 0.0% |
| Lebanon | 109 | 0.0% |
| Liberia | 1,445 | 0.2% |
| Lithuania | 61 | 0.0% |
| Malaysia | 599 | 0.1% |
| Mexico | 12,289 | 1.6% |
| Micronesia | 142 | 0.0% |
| Middle Africa | 3,162 | 0.4% |
| Moldova | 13 | 0.0% |
| Morocco | 355 | 0.1% |
| Nepal | 1,711 | 0.2% |
| Netherlands | 117 | 0.0% |
| Nicaragua | 427 | 0.1% |
| Nigeria | 4,472 | 0.6% |
| Northern Africa | 1,094 | 0.1% |
| Northern Europe | 2,180 | 0.3% |
| Norway | 113 | 0.0% |
| Oceania | 282 | 0.0% |
| Pakistan | 1,118 | 0.2% |
| Panama | 365 | 0.1% |
| Peru | 787 | 0.1% |
| Philippines | 1,361 | 0.2% |
| Poland | 352 | 0.1% |
| Portugal | 11 | 0.0% |
| Romania | 344 | 0.1% |
| Russia | 894 | 0.1% |
| Saudi Arabia | 128 | 0.0% |
| Scotland | 93 | 0.0% |
| Senegal | 219 | 0.0% |
| Serbia | 98 | 0.0% |
| Sierra Leone | 495 | 0.1% |
| Singapore | 146 | 0.0% |
| Somalia | 1,057 | 0.1% |
| South Africa | 438 | 0.1% |
| South America | 8,179 | 1.1% |
| South Central Asia | 17,060 | 2.2% |
| South Eastern Asia | 9,285 | 1.2% |
| Southern Europe | 927 | 0.1% |
| Spain | 207 | 0.0% |
| Sri Lanka | 55 | 0.0% |
| St. Vincent and the Grenadines | 189 | 0.0% |
| Sudan | 311 | 0.0% |
| Sweden | 78 | 0.0% |
| Switzerland | 90 | 0.0% |
| Syria | 193 | 0.0% |
| Taiwan | 752 | 0.1% |
| Thailand | 655 | 0.1% |
| Trinidad and Tobago | 1,475 | 0.2% |
| Turkey | 477 | 0.1% |
| Uganda | 1,595 | 0.2% |
| Ukraine | 238 | 0.0% |
| Uruguay | 124 | 0.0% |
| Uzbekistan | 83 | 0.0% |
| Venezuela | 1,013 | 0.1% |
| Vietnam | 2,935 | 0.4% |
| West Indies | 191 | 0.0% |
| Western Africa | 9,062 | 1.2% |
| Western Asia | 2,539 | 0.3% |
| Western Europe | 1,644 | 0.2% |
| Yemen | 130 | 0.0% |
| Zaire | 1,952 | 0.3% |
| Zimbabwe | 107 | 0.0% | View All 131 Rows |
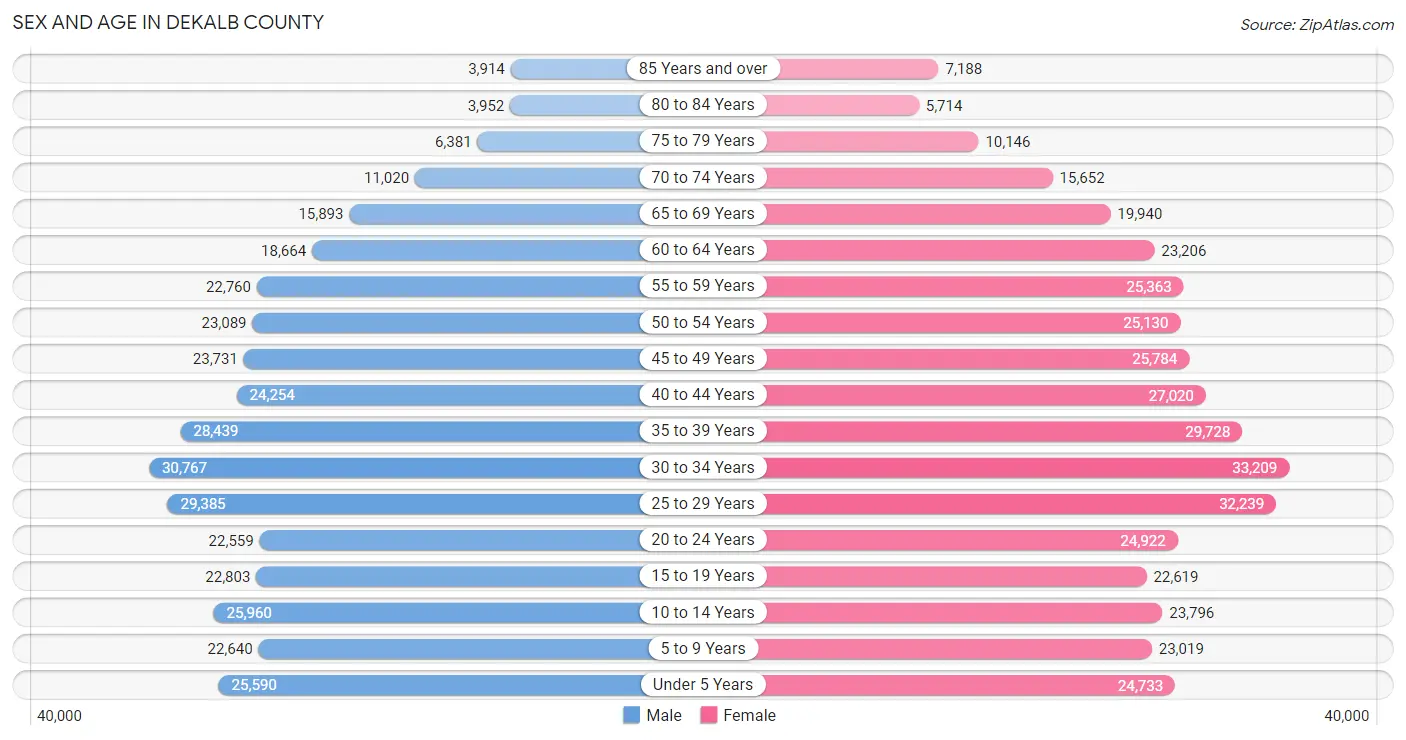
Sex and Age in DeKalb County
Sex and Age in DeKalb County
The most populous age groups in DeKalb County are 30 to 34 Years (30,767 | 8.5%) for men and 30 to 34 Years (33,209 | 8.3%) for women.
| Age Bracket | Male | Female |
| Under 5 Years | 25,590 (7.1%) | 24,733 (6.2%) |
| 5 to 9 Years | 22,640 (6.3%) | 23,019 (5.8%) |
| 10 to 14 Years | 25,960 (7.2%) | 23,796 (6.0%) |
| 15 to 19 Years | 22,803 (6.3%) | 22,619 (5.7%) |
| 20 to 24 Years | 22,559 (6.2%) | 24,922 (6.2%) |
| 25 to 29 Years | 29,385 (8.1%) | 32,239 (8.1%) |
| 30 to 34 Years | 30,767 (8.5%) | 33,209 (8.3%) |
| 35 to 39 Years | 28,439 (7.9%) | 29,728 (7.4%) |
| 40 to 44 Years | 24,254 (6.7%) | 27,020 (6.8%) |
| 45 to 49 Years | 23,731 (6.6%) | 25,784 (6.5%) |
| 50 to 54 Years | 23,089 (6.4%) | 25,130 (6.3%) |
| 55 to 59 Years | 22,760 (6.3%) | 25,363 (6.4%) |
| 60 to 64 Years | 18,664 (5.2%) | 23,206 (5.8%) |
| 65 to 69 Years | 15,893 (4.4%) | 19,940 (5.0%) |
| 70 to 74 Years | 11,020 (3.0%) | 15,652 (3.9%) |
| 75 to 79 Years | 6,381 (1.8%) | 10,146 (2.5%) |
| 80 to 84 Years | 3,952 (1.1%) | 5,714 (1.4%) |
| 85 Years and over | 3,914 (1.1%) | 7,188 (1.8%) |
| Total | 361,801 (100.0%) | 399,408 (100.0%) |
Families and Households in DeKalb County
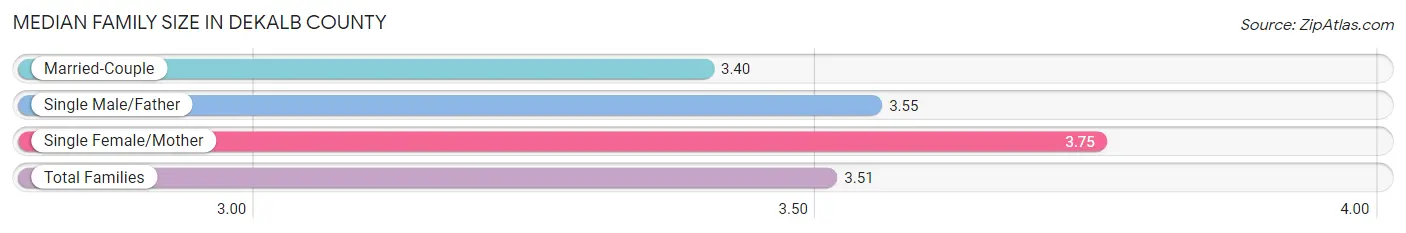
Median Family Size in DeKalb County
The median family size in DeKalb County is 3.51 persons per family, with single female/mother families (45,228 | 27.6%) accounting for the largest median family size of 3.75 persons per family. On the other hand, married-couple families (105,209 | 64.3%) represent the smallest median family size with 3.40 persons per family.
| Family Type | # Families | Family Size |
| Married-Couple | 105,209 (64.3%) | 3.40 |
| Single Male/Father | 13,267 (8.1%) | 3.55 |
| Single Female/Mother | 45,228 (27.6%) | 3.75 |
| Total Families | 163,704 (100.0%) | 3.51 |
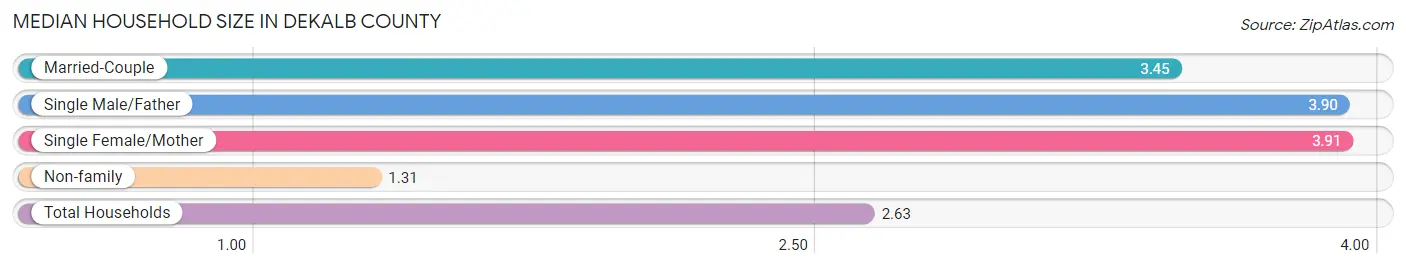
Median Household Size in DeKalb County
The median household size in DeKalb County is 2.63 persons per household, with single female/mother households (45,228 | 15.9%) accounting for the largest median household size of 3.91 persons per household. non-family households (121,026 | 42.5%) represent the smallest median household size with 1.31 persons per household.
| Household Type | # Households | Household Size |
| Married-Couple | 105,209 (36.9%) | 3.45 |
| Single Male/Father | 13,267 (4.7%) | 3.90 |
| Single Female/Mother | 45,228 (15.9%) | 3.91 |
| Non-family | 121,026 (42.5%) | 1.31 |
| Total Households | 284,730 (100.0%) | 2.63 |
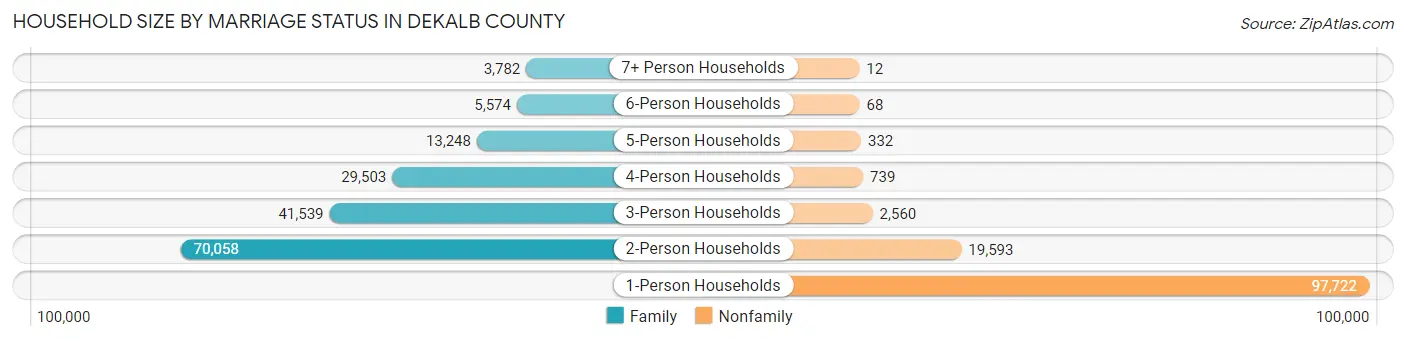
Household Size by Marriage Status in DeKalb County
Out of a total of 284,730 households in DeKalb County, 163,704 (57.5%) are family households, while 121,026 (42.5%) are nonfamily households. The most numerous type of family households are 2-person households, comprising 70,058, and the most common type of nonfamily households are 1-person households, comprising 97,722.
| Household Size | Family Households | Nonfamily Households |
| 1-Person Households | - | 97,722 (34.3%) |
| 2-Person Households | 70,058 (24.6%) | 19,593 (6.9%) |
| 3-Person Households | 41,539 (14.6%) | 2,560 (0.9%) |
| 4-Person Households | 29,503 (10.4%) | 739 (0.3%) |
| 5-Person Households | 13,248 (4.6%) | 332 (0.1%) |
| 6-Person Households | 5,574 (2.0%) | 68 (0.0%) |
| 7+ Person Households | 3,782 (1.3%) | 12 (0.0%) |
| Total | 163,704 (57.5%) | 121,026 (42.5%) |
Female Fertility in DeKalb County
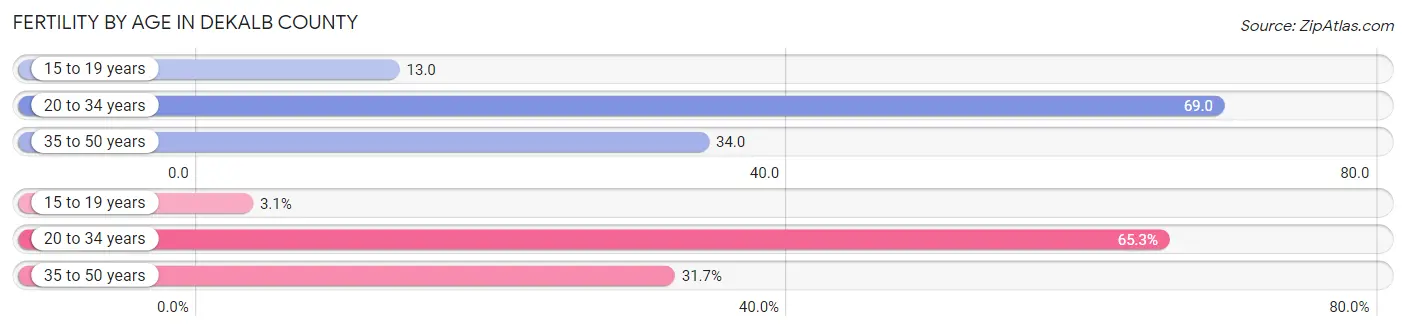
Fertility by Age in DeKalb County
Average fertility rate in DeKalb County is 48.0 births per 1,000 women. Women in the age bracket of 20 to 34 years have the highest fertility rate with 69.0 births per 1,000 women. Women in the age bracket of 20 to 34 years acount for 65.3% of all women with births.
| Age Bracket | Women with Births | Births / 1,000 Women |
| 15 to 19 years | 293 (3.0%) | 13.0 |
| 20 to 34 years | 6,268 (65.3%) | 69.0 |
| 35 to 50 years | 3,042 (31.7%) | 34.0 |
| Total | 9,603 (100.0%) | 48.0 |
Fertility by Age by Marriage Status in DeKalb County
64.7% of women with births (9,603) in DeKalb County are married. The highest percentage of unmarried women with births falls into 15 to 19 years age bracket with 75.8% of them unmarried at the time of birth, while the lowest percentage of unmarried women with births belong to 35 to 50 years age bracket with 22.2% of them unmarried.
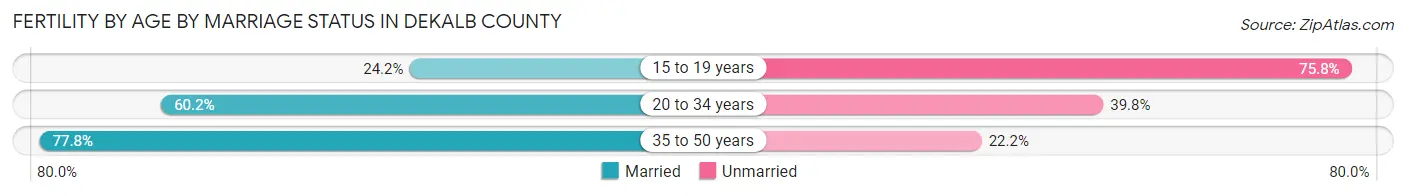
| Age Bracket | Married | Unmarried |
| 15 to 19 years | 71 (24.2%) | 222 (75.8%) |
| 20 to 34 years | 3,773 (60.2%) | 2,495 (39.8%) |
| 35 to 50 years | 2,367 (77.8%) | 675 (22.2%) |
| Total | 6,213 (64.7%) | 3,390 (35.3%) |
Fertility by Education in DeKalb County
Average fertility rate in DeKalb County is 48.0 births per 1,000 women. Women with the education attainment of graduate degree have the highest fertility rate of 69.0 births per 1,000 women, while women with the education attainment of bachelor's degree have the lowest fertility at 34.0 births per 1,000 women. Women with the education attainment of graduate degree represent 27.8% of all women with births.
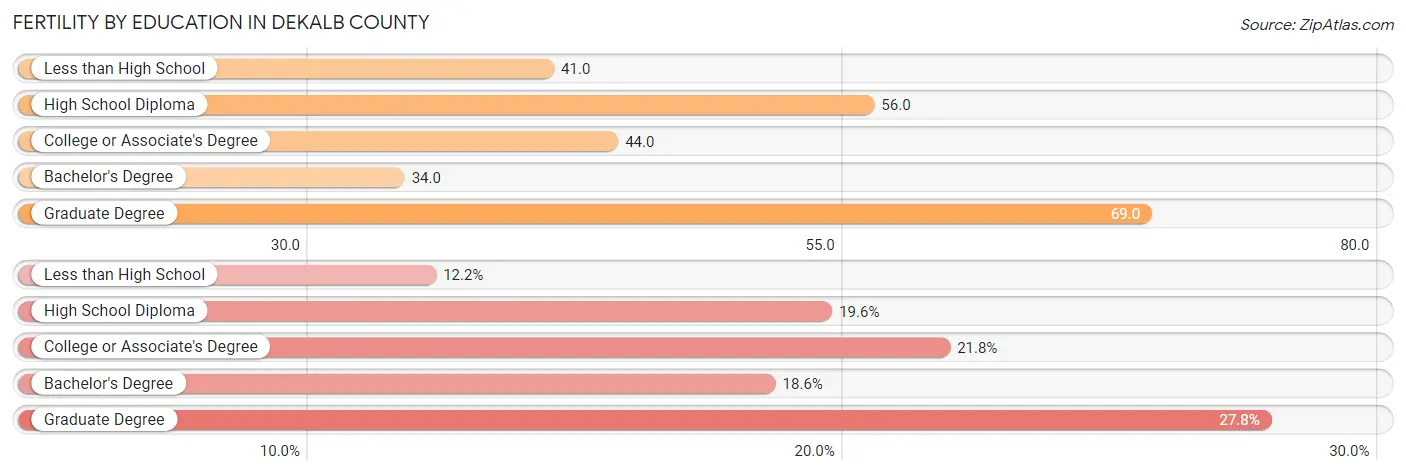
| Educational Attainment | Women with Births | Births / 1,000 Women |
| Less than High School | 1,171 (12.2%) | 41.0 |
| High School Diploma | 1,883 (19.6%) | 56.0 |
| College or Associate's Degree | 2,095 (21.8%) | 44.0 |
| Bachelor's Degree | 1,781 (18.5%) | 34.0 |
| Graduate Degree | 2,673 (27.8%) | 69.0 |
| Total | 9,603 (100.0%) | 48.0 |
Fertility by Education by Marriage Status in DeKalb County
35.3% of women with births in DeKalb County are unmarried. Women with the educational attainment of bachelor's degree are most likely to be married with 87.5% of them married at childbirth, while women with the educational attainment of high school diploma are least likely to be married with 59.5% of them unmarried at childbirth.
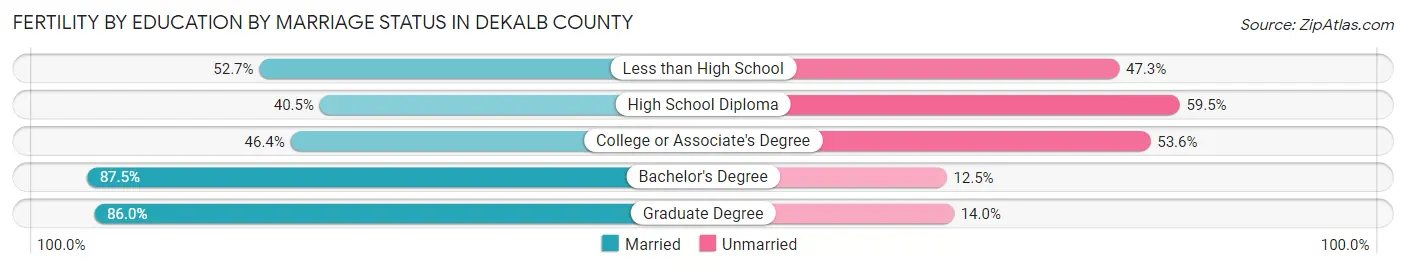
| Educational Attainment | Married | Unmarried |
| Less than High School | 617 (52.7%) | 554 (47.3%) |
| High School Diploma | 763 (40.5%) | 1,120 (59.5%) |
| College or Associate's Degree | 972 (46.4%) | 1,123 (53.6%) |
| Bachelor's Degree | 1,558 (87.5%) | 223 (12.5%) |
| Graduate Degree | 2,299 (86.0%) | 374 (14.0%) |
| Total | 6,213 (64.7%) | 3,390 (35.3%) |
Income in DeKalb County
Income Overview in DeKalb County
Per Capita Income in DeKalb County is $43,958, while median incomes of families and households are $97,842 and $76,044 respectively.
| Characteristic | Number | Measure |
| Per Capita Income | 761,209 | $43,958 |
| Median Family Income | 163,704 | $97,842 |
| Mean Family Income | 163,704 | $136,998 |
| Median Household Income | 284,730 | $76,044 |
| Mean Household Income | 284,730 | $111,453 |
| Income Deficit | 163,704 | $10,850 |
| Wage / Income Gap (%) | 761,209 | 14.94% |
| Wage / Income Gap ($) | 761,209 | 85.06¢ per $1 |
| Gini / Inequality Index | 761,209 | 0.49 |
Earnings by Sex in DeKalb County
Average Earnings in DeKalb County are $43,840, $47,140 for men and $40,095 for women, a difference of 14.9%.
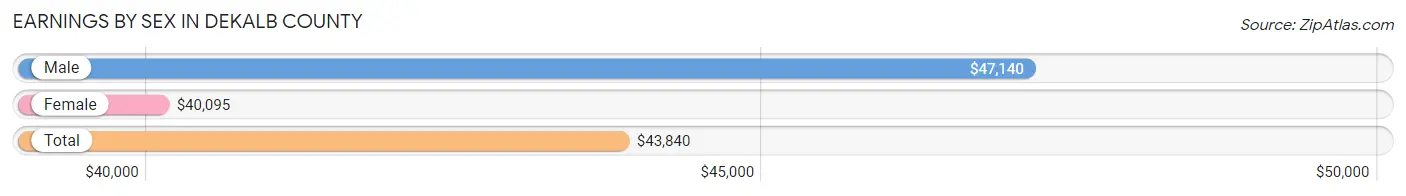
| Sex | Number | Average Earnings |
| Male | 208,798 (49.2%) | $47,140 |
| Female | 215,607 (50.8%) | $40,095 |
| Total | 424,405 (100.0%) | $43,840 |
Earnings by Sex by Income Bracket in DeKalb County
The most common earnings brackets in DeKalb County are $100,000+ for men (46,172 | 22.1%) and $100,000+ for women (30,946 | 14.3%).
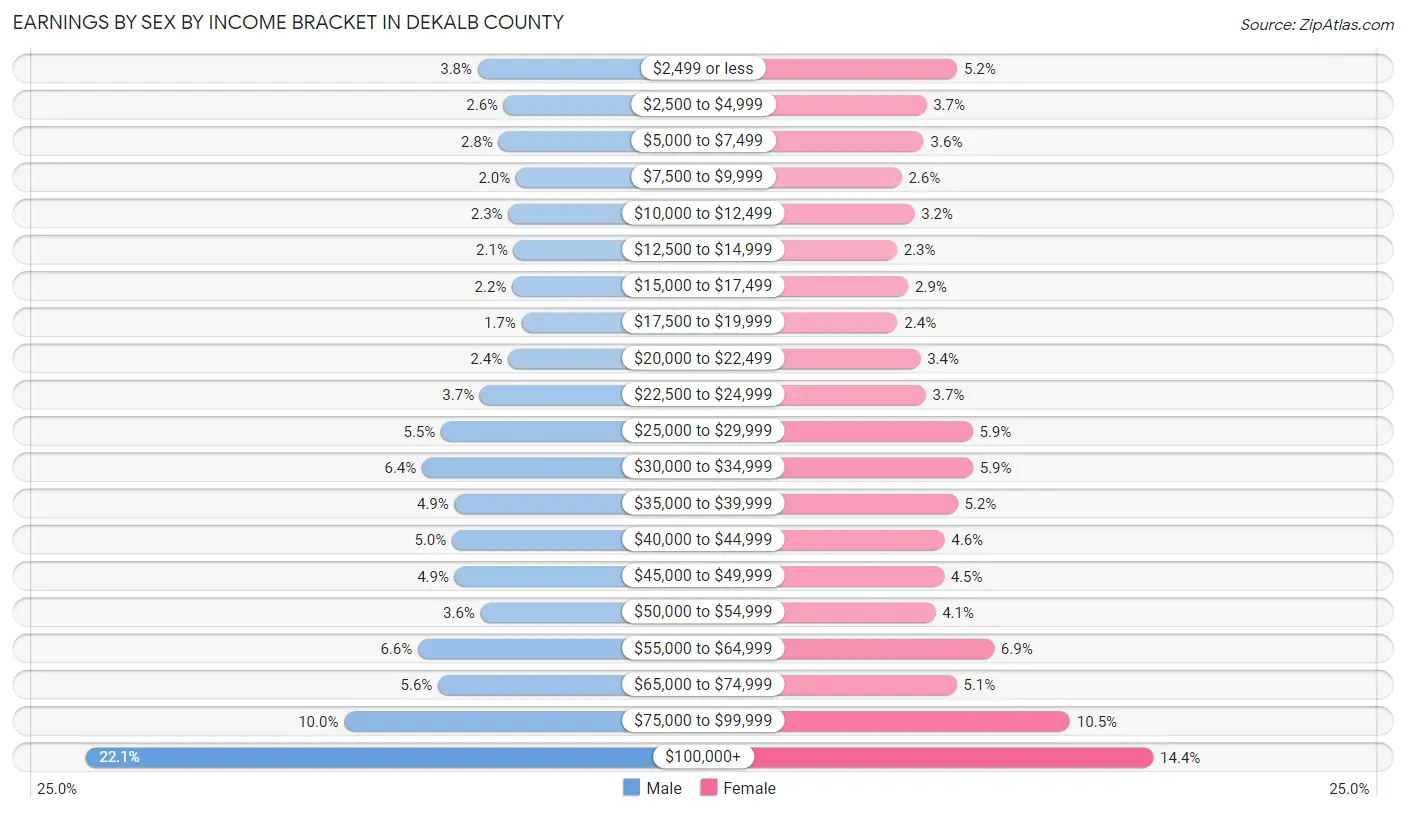
| Income | Male | Female |
| $2,499 or less | 7,871 (3.8%) | 11,132 (5.2%) |
| $2,500 to $4,999 | 5,332 (2.5%) | 8,028 (3.7%) |
| $5,000 to $7,499 | 5,853 (2.8%) | 7,755 (3.6%) |
| $7,500 to $9,999 | 4,144 (2.0%) | 5,527 (2.6%) |
| $10,000 to $12,499 | 4,886 (2.3%) | 6,815 (3.2%) |
| $12,500 to $14,999 | 4,363 (2.1%) | 5,037 (2.3%) |
| $15,000 to $17,499 | 4,518 (2.2%) | 6,186 (2.9%) |
| $17,500 to $19,999 | 3,601 (1.7%) | 5,108 (2.4%) |
| $20,000 to $22,499 | 4,929 (2.4%) | 7,427 (3.4%) |
| $22,500 to $24,999 | 7,670 (3.7%) | 7,963 (3.7%) |
| $25,000 to $29,999 | 11,461 (5.5%) | 12,701 (5.9%) |
| $30,000 to $34,999 | 13,314 (6.4%) | 12,719 (5.9%) |
| $35,000 to $39,999 | 10,138 (4.9%) | 11,188 (5.2%) |
| $40,000 to $44,999 | 10,404 (5.0%) | 9,861 (4.6%) |
| $45,000 to $49,999 | 10,123 (4.9%) | 9,791 (4.5%) |
| $50,000 to $54,999 | 7,610 (3.6%) | 8,935 (4.1%) |
| $55,000 to $64,999 | 13,711 (6.6%) | 14,856 (6.9%) |
| $65,000 to $74,999 | 11,746 (5.6%) | 11,092 (5.1%) |
| $75,000 to $99,999 | 20,952 (10.0%) | 22,540 (10.4%) |
| $100,000+ | 46,172 (22.1%) | 30,946 (14.3%) |
| Total | 208,798 (100.0%) | 215,607 (100.0%) |
Earnings by Sex by Educational Attainment in DeKalb County
Average earnings in DeKalb County are $54,069 for men and $46,045 for women, a difference of 14.8%. Men with an educational attainment of graduate degree enjoy the highest average annual earnings of $104,333, while those with less than high school education earn the least with $28,537. Women with an educational attainment of graduate degree earn the most with the average annual earnings of $78,882, while those with less than high school education have the smallest earnings of $22,895.
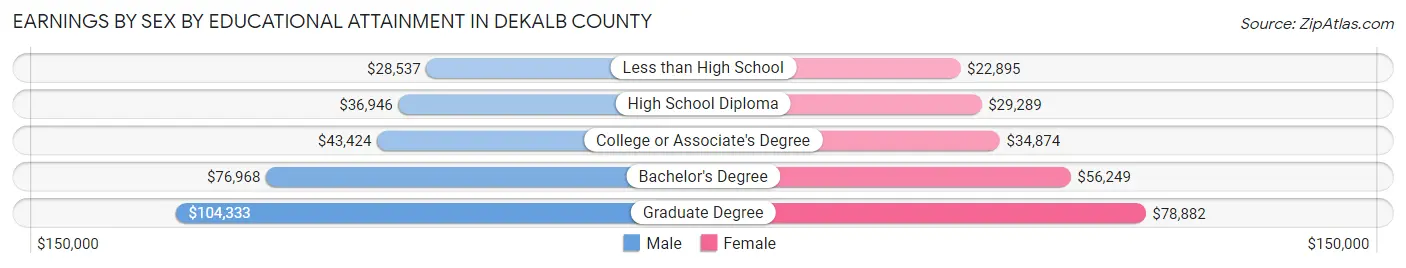
| Educational Attainment | Male Income | Female Income |
| Less than High School | $28,537 | $22,895 |
| High School Diploma | $36,946 | $29,289 |
| College or Associate's Degree | $43,424 | $34,874 |
| Bachelor's Degree | $76,968 | $56,249 |
| Graduate Degree | $104,333 | $78,882 |
| Total | $54,069 | $46,045 |
Family Income in DeKalb County
Family Income Brackets in DeKalb County
According to the DeKalb County family income data, there are 31,922 families falling into the $200,000+ income range, which is the most common income bracket and makes up 19.5% of all families. Conversely, the $10,000 to $14,999 income bracket is the least frequent group with only 2,619 families (1.6%) belonging to this category.
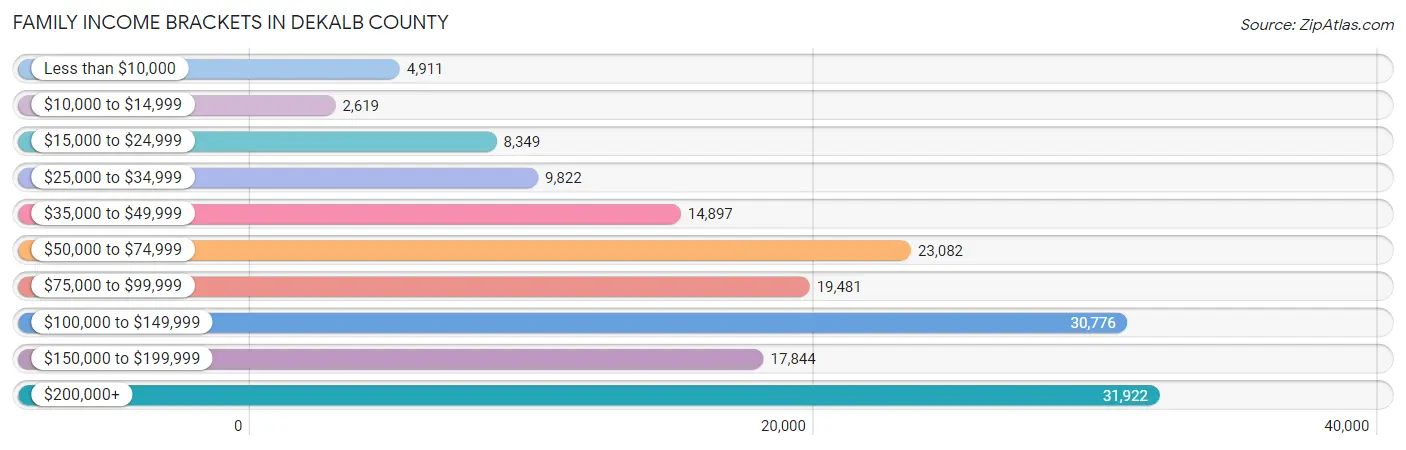
| Income Bracket | # Families | % Families |
| Less than $10,000 | 4,911 | 3.0% |
| $10,000 to $14,999 | 2,619 | 1.6% |
| $15,000 to $24,999 | 8,349 | 5.1% |
| $25,000 to $34,999 | 9,822 | 6.0% |
| $35,000 to $49,999 | 14,897 | 9.1% |
| $50,000 to $74,999 | 23,082 | 14.1% |
| $75,000 to $99,999 | 19,481 | 11.9% |
| $100,000 to $149,999 | 30,776 | 18.8% |
| $150,000 to $199,999 | 17,844 | 10.9% |
| $200,000+ | 31,922 | 19.5% |
Family Income by Famaliy Size in DeKalb County
4-person families (27,885 | 17.0%) account for the highest median family income in DeKalb County with $124,515 per family, while 2-person families (74,240 | 45.4%) have the highest median income of $44,900 per family member.
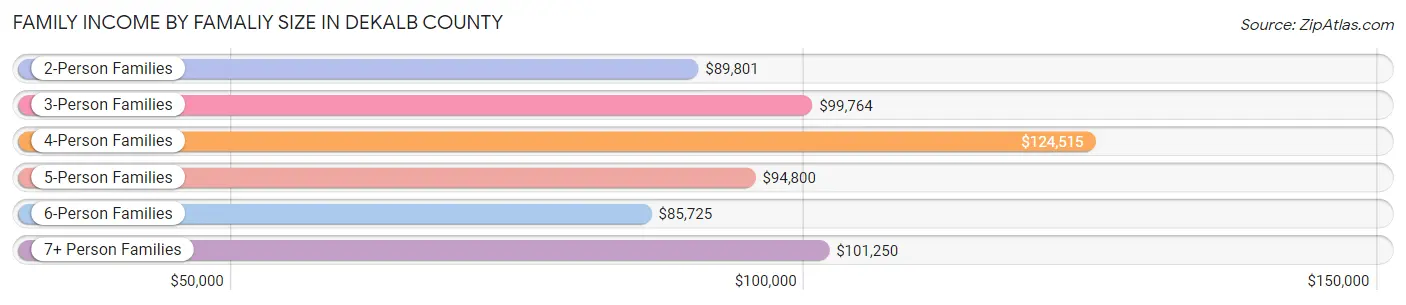
| Income Bracket | # Families | Median Income |
| 2-Person Families | 74,240 (45.4%) | $89,801 |
| 3-Person Families | 41,231 (25.2%) | $99,764 |
| 4-Person Families | 27,885 (17.0%) | $124,515 |
| 5-Person Families | 12,423 (7.6%) | $94,800 |
| 6-Person Families | 4,724 (2.9%) | $85,725 |
| 7+ Person Families | 3,201 (2.0%) | $101,250 |
| Total | 163,704 (100.0%) | $97,842 |
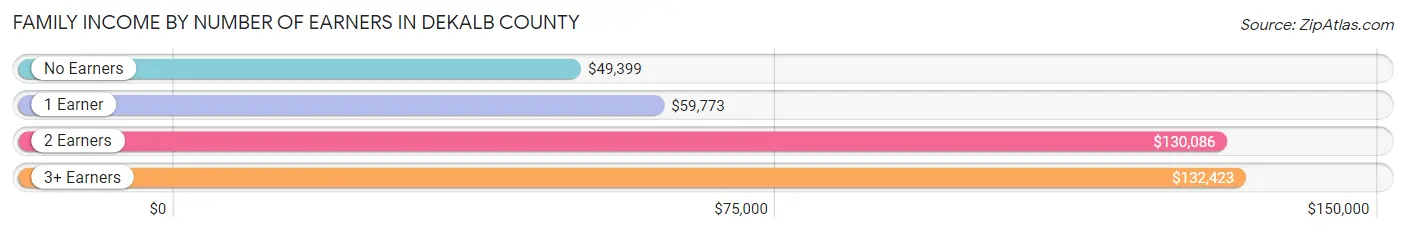
Family Income by Number of Earners in DeKalb County
The median family income in DeKalb County is $97,842, with families comprising 3+ earners (17,020) having the highest median family income of $132,423, while families with no earners (17,339) have the lowest median family income of $49,399, accounting for 10.4% and 10.6% of families, respectively.
| Number of Earners | # Families | Median Income |
| No Earners | 17,339 (10.6%) | $49,399 |
| 1 Earner | 54,035 (33.0%) | $59,773 |
| 2 Earners | 75,310 (46.0%) | $130,086 |
| 3+ Earners | 17,020 (10.4%) | $132,423 |
| Total | 163,704 (100.0%) | $97,842 |
Household Income in DeKalb County
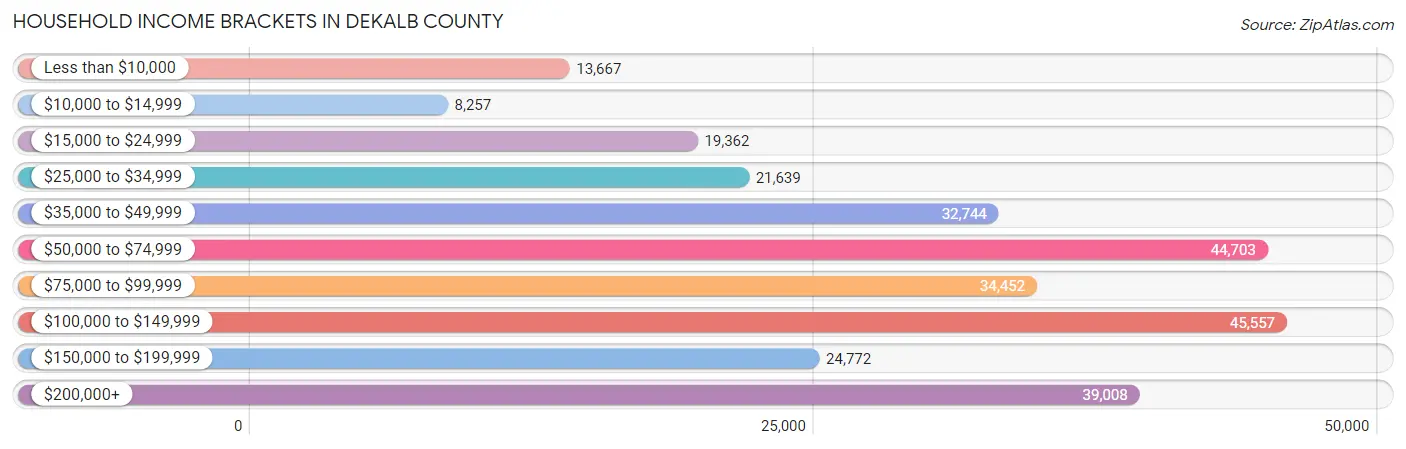
Household Income Brackets in DeKalb County
With 45,557 households falling in the category, the $100,000 to $149,999 income range is the most frequent in DeKalb County, accounting for 16.0% of all households. In contrast, only 8,257 households (2.9%) fall into the $10,000 to $14,999 income bracket, making it the least populous group.
| Income Bracket | # Households | % Households |
| Less than $10,000 | 13,667 | 4.8% |
| $10,000 to $14,999 | 8,257 | 2.9% |
| $15,000 to $24,999 | 19,362 | 6.8% |
| $25,000 to $34,999 | 21,639 | 7.6% |
| $35,000 to $49,999 | 32,744 | 11.5% |
| $50,000 to $74,999 | 44,703 | 15.7% |
| $75,000 to $99,999 | 34,452 | 12.1% |
| $100,000 to $149,999 | 45,557 | 16.0% |
| $150,000 to $199,999 | 24,772 | 8.7% |
| $200,000+ | 39,008 | 13.7% |
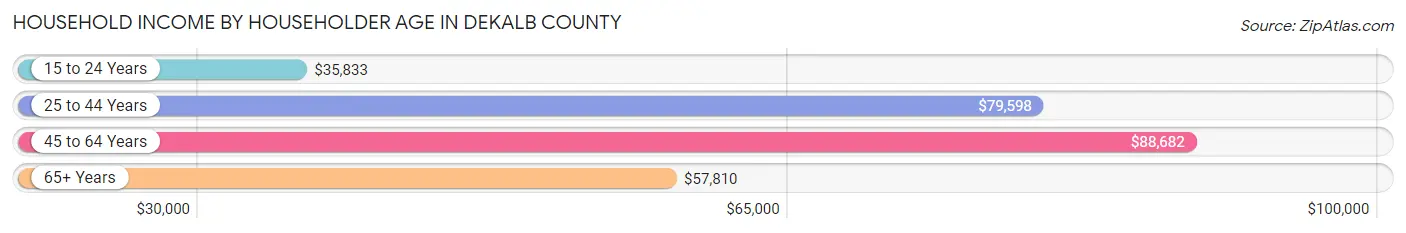
Household Income by Householder Age in DeKalb County
The median household income in DeKalb County is $76,044, with the highest median household income of $88,682 found in the 45 to 64 years age bracket for the primary householder. A total of 105,679 households (37.1%) fall into this category. Meanwhile, the 15 to 24 years age bracket for the primary householder has the lowest median household income of $35,833, with 8,978 households (3.2%) in this group.
| Income Bracket | # Households | Median Income |
| 15 to 24 Years | 8,978 (3.2%) | $35,833 |
| 25 to 44 Years | 108,311 (38.0%) | $79,598 |
| 45 to 64 Years | 105,679 (37.1%) | $88,682 |
| 65+ Years | 61,762 (21.7%) | $57,810 |
| Total | 284,730 (100.0%) | $76,044 |
Poverty in DeKalb County
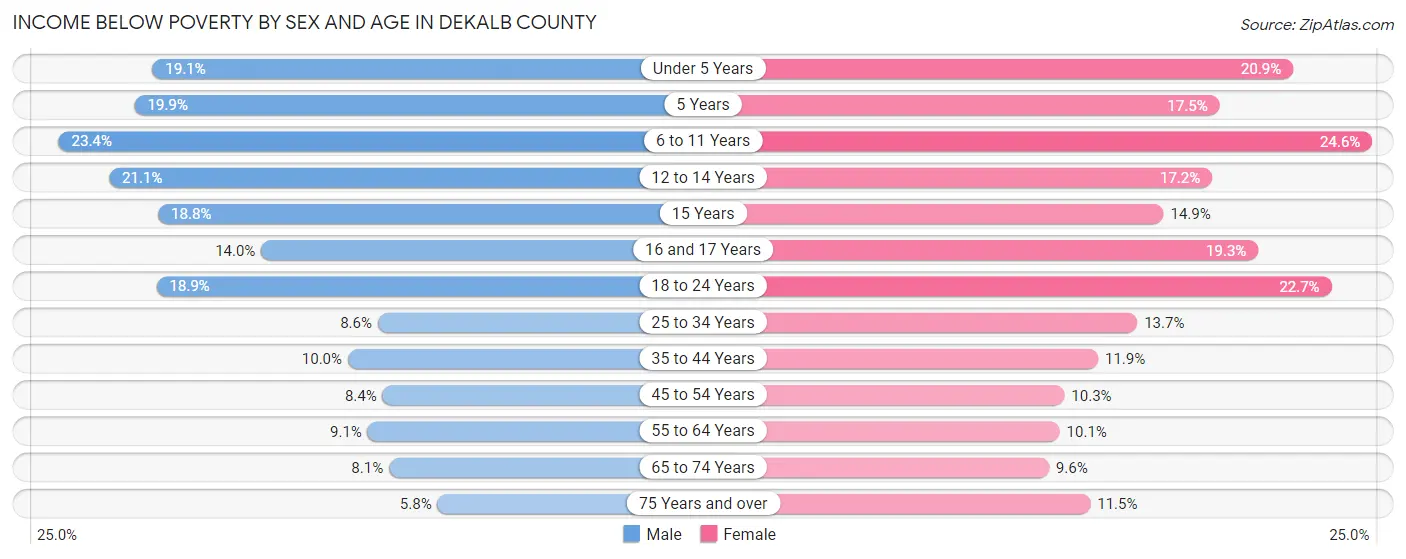
Income Below Poverty by Sex and Age in DeKalb County
With 12.4% poverty level for males and 14.3% for females among the residents of DeKalb County, 6 to 11 year old males and 6 to 11 year old females are the most vulnerable to poverty, with 6,598 males (23.4%) and 6,729 females (24.6%) in their respective age groups living below the poverty level.
| Age Bracket | Male | Female |
| Under 5 Years | 4,821 (19.1%) | 5,108 (20.9%) |
| 5 Years | 872 (19.9%) | 817 (17.5%) |
| 6 to 11 Years | 6,598 (23.4%) | 6,729 (24.6%) |
| 12 to 14 Years | 3,217 (21.1%) | 2,421 (17.2%) |
| 15 Years | 928 (18.8%) | 673 (14.9%) |
| 16 and 17 Years | 1,227 (14.0%) | 1,716 (19.3%) |
| 18 to 24 Years | 5,488 (18.9%) | 7,038 (22.7%) |
| 25 to 34 Years | 5,140 (8.6%) | 8,909 (13.7%) |
| 35 to 44 Years | 5,225 (10.0%) | 6,724 (11.9%) |
| 45 to 54 Years | 3,905 (8.4%) | 5,241 (10.3%) |
| 55 to 64 Years | 3,736 (9.1%) | 4,873 (10.1%) |
| 65 to 74 Years | 2,145 (8.1%) | 3,389 (9.6%) |
| 75 Years and over | 811 (5.8%) | 2,575 (11.5%) |
| Total | 44,113 (12.4%) | 56,213 (14.3%) |
Income Above Poverty by Sex and Age in DeKalb County
According to the poverty statistics in DeKalb County, males aged 75 years and over and females aged 65 to 74 years are the age groups that are most secure financially, with 94.2% of males and 90.4% of females in these age groups living above the poverty line.
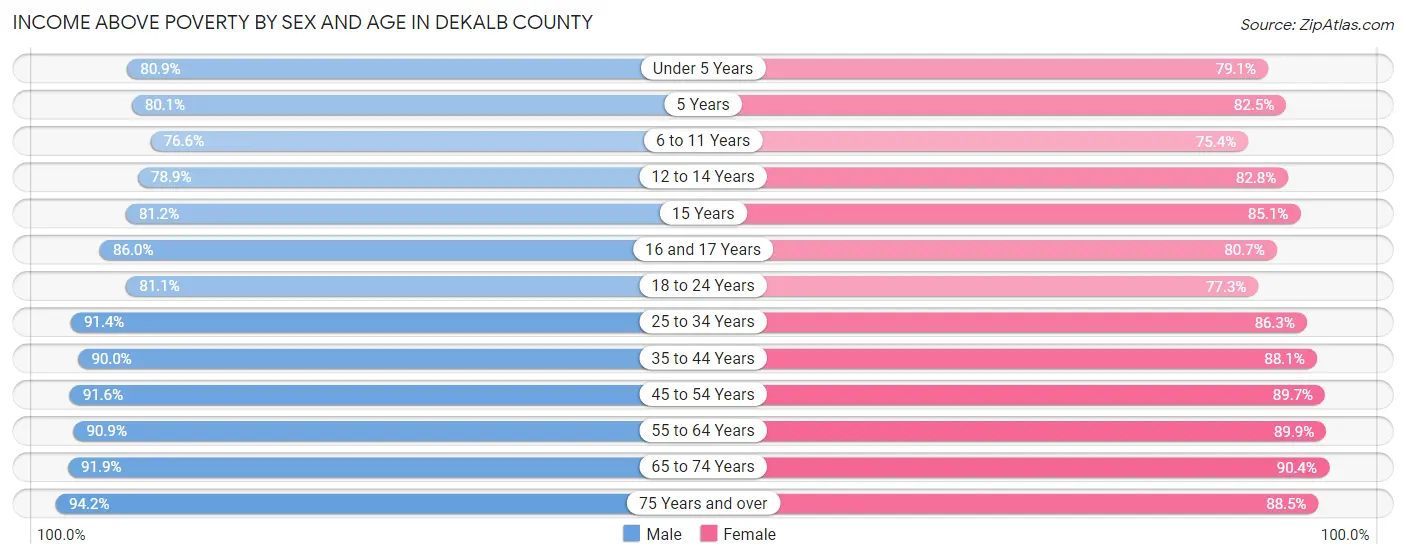
| Age Bracket | Male | Female |
| Under 5 Years | 20,463 (80.9%) | 19,285 (79.1%) |
| 5 Years | 3,509 (80.1%) | 3,844 (82.5%) |
| 6 to 11 Years | 21,575 (76.6%) | 20,619 (75.4%) |
| 12 to 14 Years | 12,044 (78.9%) | 11,667 (82.8%) |
| 15 Years | 4,007 (81.2%) | 3,835 (85.1%) |
| 16 and 17 Years | 7,522 (86.0%) | 7,166 (80.7%) |
| 18 to 24 Years | 23,574 (81.1%) | 23,945 (77.3%) |
| 25 to 34 Years | 54,528 (91.4%) | 56,059 (86.3%) |
| 35 to 44 Years | 47,007 (90.0%) | 49,834 (88.1%) |
| 45 to 54 Years | 42,650 (91.6%) | 45,480 (89.7%) |
| 55 to 64 Years | 37,400 (90.9%) | 43,335 (89.9%) |
| 65 to 74 Years | 24,378 (91.9%) | 31,861 (90.4%) |
| 75 Years and over | 13,079 (94.2%) | 19,752 (88.5%) |
| Total | 311,736 (87.6%) | 336,682 (85.7%) |
Income Below Poverty Among Married-Couple Families in DeKalb County
The poverty statistics for married-couple families in DeKalb County show that 4.5% or 4,746 of the total 105,209 families live below the poverty line. Families with 5 or more children have the highest poverty rate of 41.6%, comprising of 147 families. On the other hand, families with no children have the lowest poverty rate of 2.5%, which includes 1,444 families.
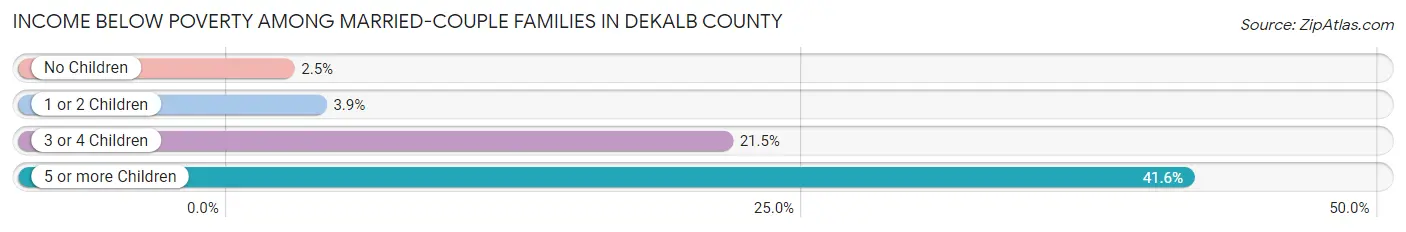
| Children | Above Poverty | Below Poverty |
| No Children | 57,509 (97.6%) | 1,444 (2.5%) |
| 1 or 2 Children | 36,597 (96.2%) | 1,467 (3.8%) |
| 3 or 4 Children | 6,151 (78.5%) | 1,688 (21.5%) |
| 5 or more Children | 206 (58.4%) | 147 (41.6%) |
| Total | 100,463 (95.5%) | 4,746 (4.5%) |
Income Below Poverty Among Single-Parent Households in DeKalb County
According to the poverty data in DeKalb County, 11.6% or 1,544 single-father households and 20.0% or 9,049 single-mother households are living below the poverty line. Among single-father households, those with 3 or 4 children have the highest poverty rate, with 236 households (32.5%) experiencing poverty. Likewise, among single-mother households, those with 5 or more children have the highest poverty rate, with 343 households (53.1%) falling below the poverty line.
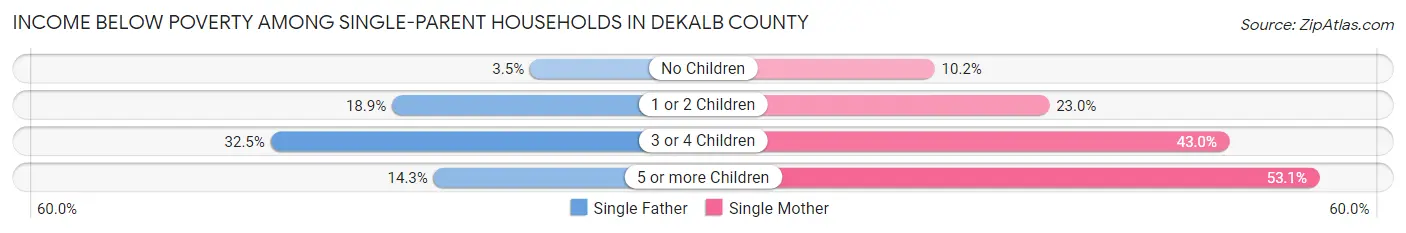
| Children | Single Father | Single Mother |
| No Children | 243 (3.5%) | 1,829 (10.2%) |
| 1 or 2 Children | 1,053 (18.9%) | 5,234 (23.0%) |
| 3 or 4 Children | 236 (32.5%) | 1,643 (43.0%) |
| 5 or more Children | 12 (14.3%) | 343 (53.1%) |
| Total | 1,544 (11.6%) | 9,049 (20.0%) |
Income Below Poverty Among Married-Couple vs Single-Parent Households in DeKalb County
The poverty data for DeKalb County shows that 4,746 of the married-couple family households (4.5%) and 10,593 of the single-parent households (18.1%) are living below the poverty level. Within the married-couple family households, those with 5 or more children have the highest poverty rate, with 147 households (41.6%) falling below the poverty line. Among the single-parent households, those with 5 or more children have the highest poverty rate, with 355 household (48.6%) living below poverty.
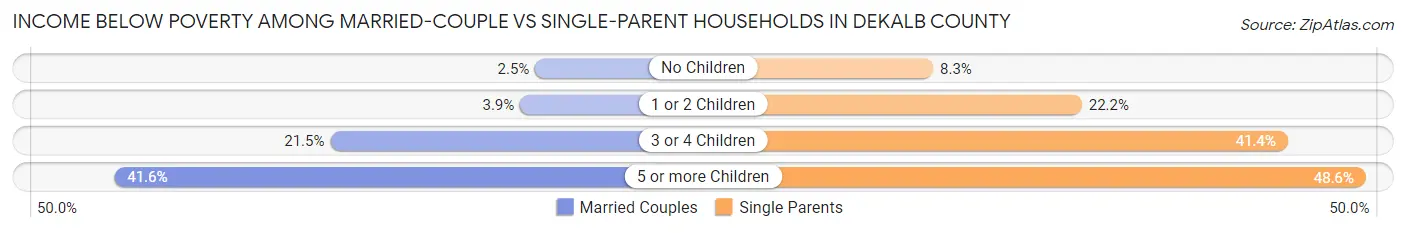
| Children | Married-Couple Families | Single-Parent Households |
| No Children | 1,444 (2.5%) | 2,072 (8.3%) |
| 1 or 2 Children | 1,467 (3.8%) | 6,287 (22.2%) |
| 3 or 4 Children | 1,688 (21.5%) | 1,879 (41.4%) |
| 5 or more Children | 147 (41.6%) | 355 (48.6%) |
| Total | 4,746 (4.5%) | 10,593 (18.1%) |
Employment Characteristics in DeKalb County
Employment by Class of Employer in DeKalb County
Among the 378,641 employed individuals in DeKalb County, private company employees (259,330 | 68.5%), not-for-profit organizations (34,577 | 9.1%), and local government employees (22,128 | 5.8%) make up the most common classes of employment.
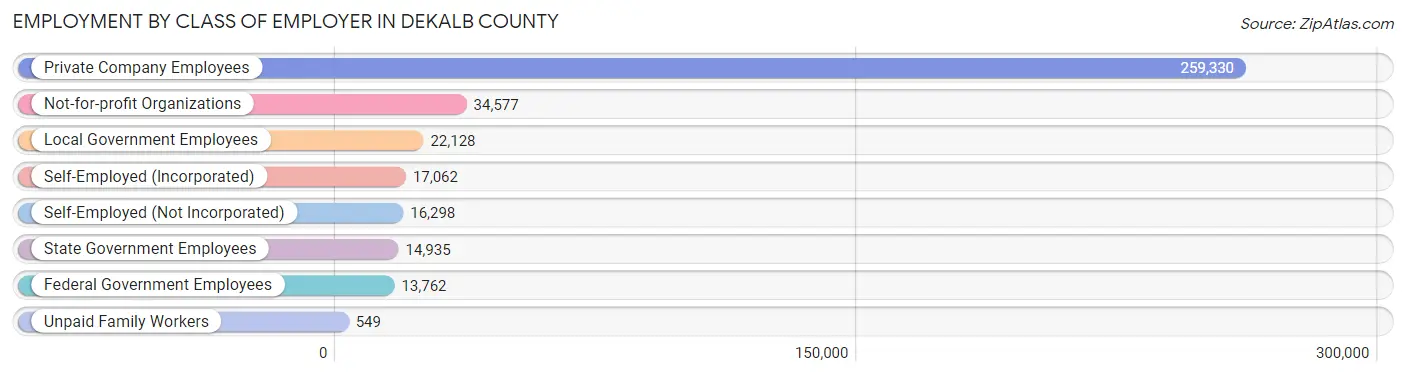
| Employer Class | # Employees | % Employees |
| Private Company Employees | 259,330 | 68.5% |
| Self-Employed (Incorporated) | 17,062 | 4.5% |
| Self-Employed (Not Incorporated) | 16,298 | 4.3% |
| Not-for-profit Organizations | 34,577 | 9.1% |
| Local Government Employees | 22,128 | 5.8% |
| State Government Employees | 14,935 | 3.9% |
| Federal Government Employees | 13,762 | 3.6% |
| Unpaid Family Workers | 549 | 0.1% |
| Total | 378,641 | 100.0% |
Employment Status by Age in DeKalb County
According to the labor force statistics for DeKalb County, out of the total population over 16 years of age (605,987), 68.6% or 415,707 individuals are in the labor force, with 6.4% or 26,605 of them unemployed. The age group with the highest labor force participation rate is 30 to 34 years, with 87.5% or 55,979 individuals in the labor force. Within the labor force, the 16 to 19 years age range has the highest percentage of unemployed individuals, with 19.7% or 2,329 of them being unemployed.
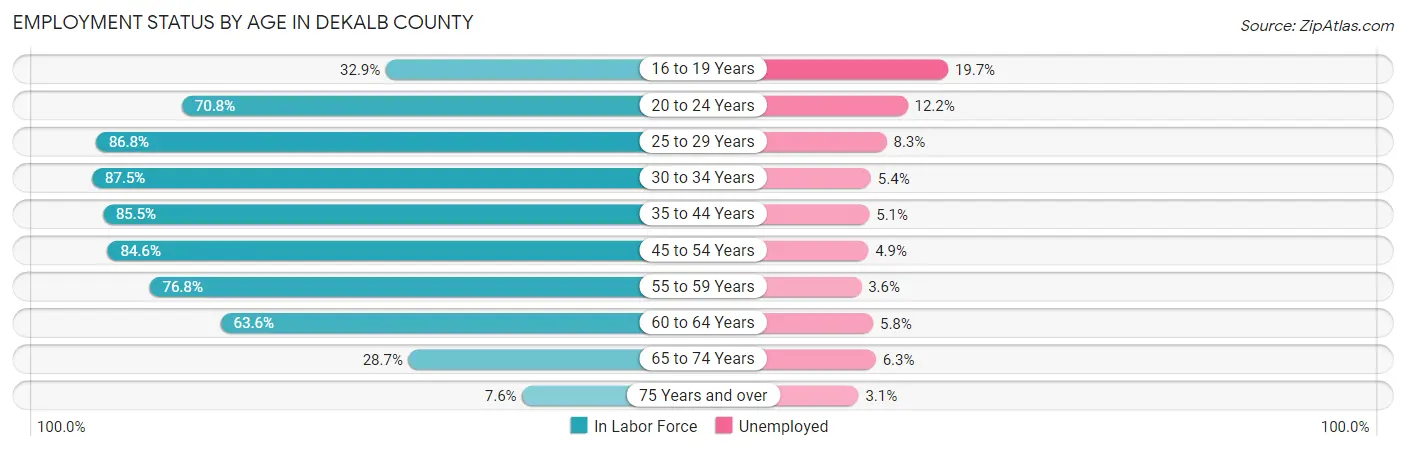
| Age Bracket | In Labor Force | Unemployed |
| 16 to 19 Years | 11,824 (32.9%) | 2,329 (19.7%) |
| 20 to 24 Years | 33,617 (70.8%) | 4,101 (12.2%) |
| 25 to 29 Years | 53,490 (86.8%) | 4,440 (8.3%) |
| 30 to 34 Years | 55,979 (87.5%) | 3,023 (5.4%) |
| 35 to 44 Years | 93,572 (85.5%) | 4,772 (5.1%) |
| 45 to 54 Years | 82,683 (84.6%) | 4,051 (4.9%) |
| 55 to 59 Years | 36,958 (76.8%) | 1,330 (3.6%) |
| 60 to 64 Years | 26,629 (63.6%) | 1,544 (5.8%) |
| 65 to 74 Years | 17,939 (28.7%) | 1,130 (6.3%) |
| 75 Years and over | 2,834 (7.6%) | 88 (3.1%) |
| Total | 415,707 (68.6%) | 26,605 (6.4%) |
Employment Status by Educational Attainment in DeKalb County
According to labor force statistics for DeKalb County, 82.6% of individuals (349,206) out of the total population between 25 and 64 years of age (422,768) are in the labor force, with 5.5% or 19,206 of them being unemployed. The group with the highest labor force participation rate are those with the educational attainment of bachelor's degree or higher, with 89.2% or 181,466 individuals in the labor force. Within the labor force, individuals with high school diploma education have the highest percentage of unemployment, with 9.0% or 5,498 of them being unemployed.
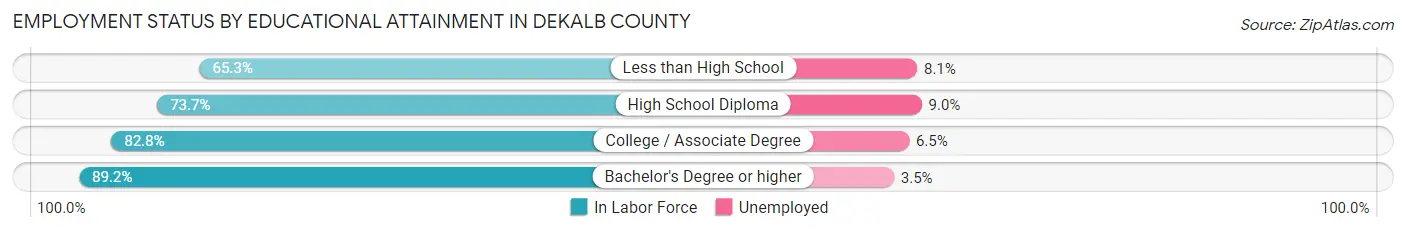
| Educational Attainment | In Labor Force | Unemployed |
| Less than High School | 23,091 (65.3%) | 2,864 (8.1%) |
| High School Diploma | 61,091 (73.7%) | 7,460 (9.0%) |
| College / Associate Degree | 83,693 (82.8%) | 6,570 (6.5%) |
| Bachelor's Degree or higher | 181,466 (89.2%) | 7,120 (3.5%) |
| Total | 349,206 (82.6%) | 23,252 (5.5%) |
Employment Occupations by Sex in DeKalb County
Management, Business, Science and Arts Occupations
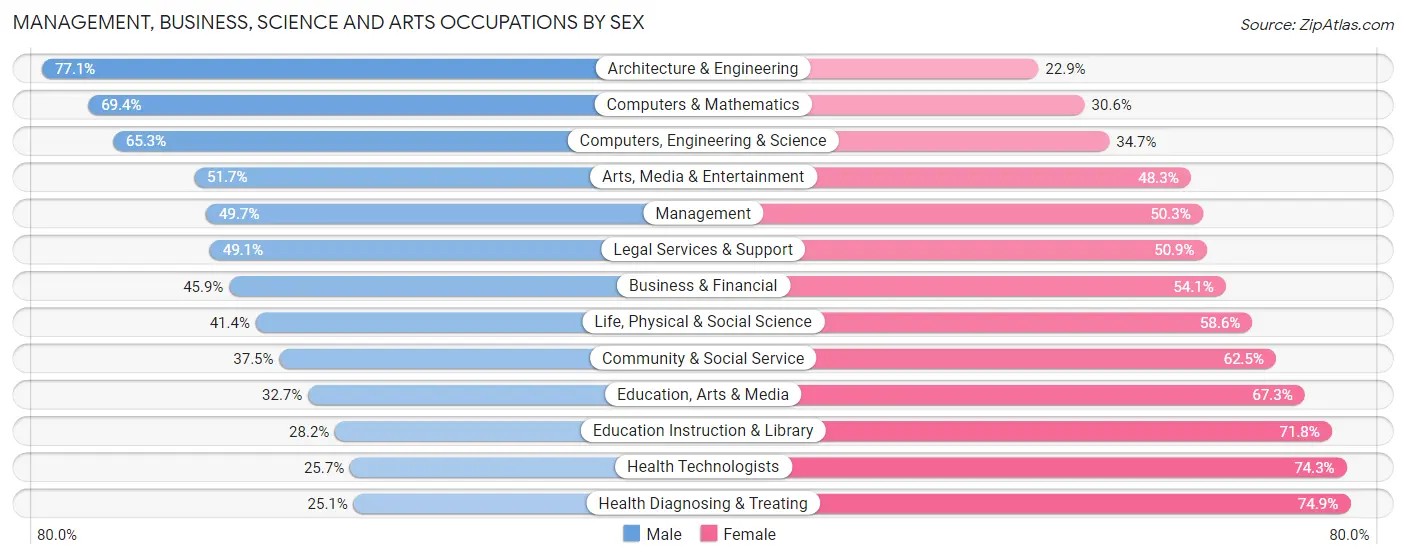
The most common Management, Business, Science and Arts occupations in DeKalb County are Community & Social Service (53,834 | 13.9%), Management (45,307 | 11.7%), Computers, Engineering & Science (33,416 | 8.6%), Business & Financial (32,786 | 8.4%), and Education Instruction & Library (25,890 | 6.7%).
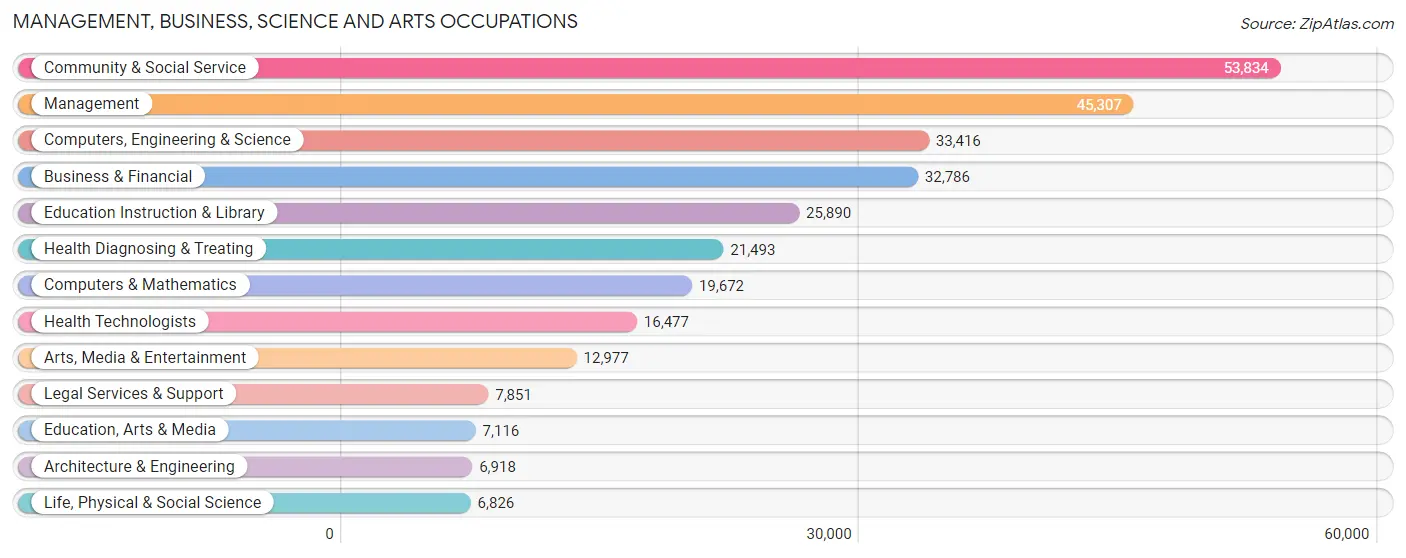
Management, Business, Science and Arts Occupations by Sex
Within the Management, Business, Science and Arts occupations in DeKalb County, the most male-oriented occupations are Architecture & Engineering (77.1%), Computers & Mathematics (69.4%), and Computers, Engineering & Science (65.3%), while the most female-oriented occupations are Health Diagnosing & Treating (74.9%), Health Technologists (74.3%), and Education Instruction & Library (71.8%).
| Occupation | Male | Female |
| Management | 22,528 (49.7%) | 22,779 (50.3%) |
| Business & Financial | 15,036 (45.9%) | 17,750 (54.1%) |
| Computers, Engineering & Science | 21,810 (65.3%) | 11,606 (34.7%) |
| Computers & Mathematics | 13,648 (69.4%) | 6,024 (30.6%) |
| Architecture & Engineering | 5,334 (77.1%) | 1,584 (22.9%) |
| Life, Physical & Social Science | 2,828 (41.4%) | 3,998 (58.6%) |
| Community & Social Service | 20,182 (37.5%) | 33,652 (62.5%) |
| Education, Arts & Media | 2,326 (32.7%) | 4,790 (67.3%) |
| Legal Services & Support | 3,854 (49.1%) | 3,997 (50.9%) |
| Education Instruction & Library | 7,292 (28.2%) | 18,598 (71.8%) |
| Arts, Media & Entertainment | 6,710 (51.7%) | 6,267 (48.3%) |
| Health Diagnosing & Treating | 5,392 (25.1%) | 16,101 (74.9%) |
| Health Technologists | 4,235 (25.7%) | 12,242 (74.3%) |
| Total (Category) | 84,948 (45.5%) | 101,888 (54.5%) |
| Total (Overall) | 191,117 (49.2%) | 197,338 (50.8%) |
Services Occupations
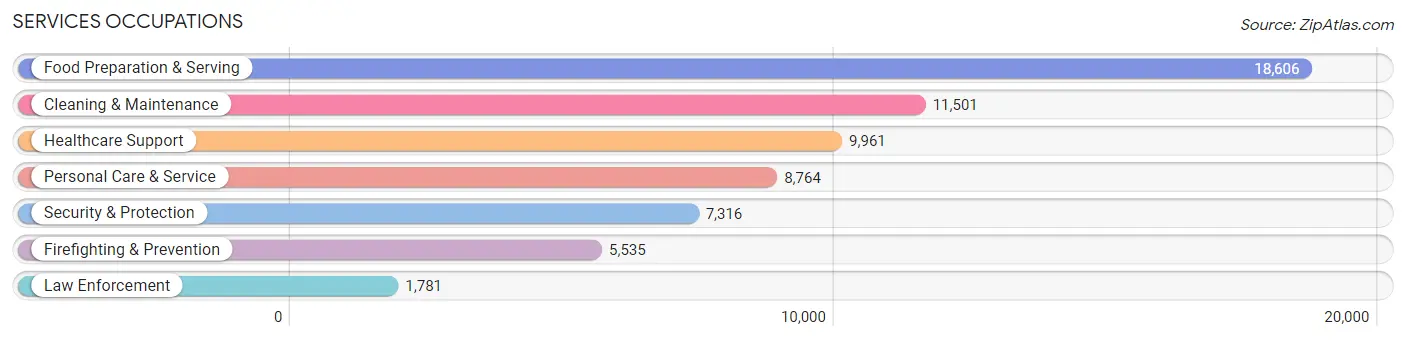
The most common Services occupations in DeKalb County are Food Preparation & Serving (18,606 | 4.8%), Cleaning & Maintenance (11,501 | 3.0%), Healthcare Support (9,961 | 2.6%), Personal Care & Service (8,764 | 2.3%), and Security & Protection (7,316 | 1.9%).
Services Occupations by Sex
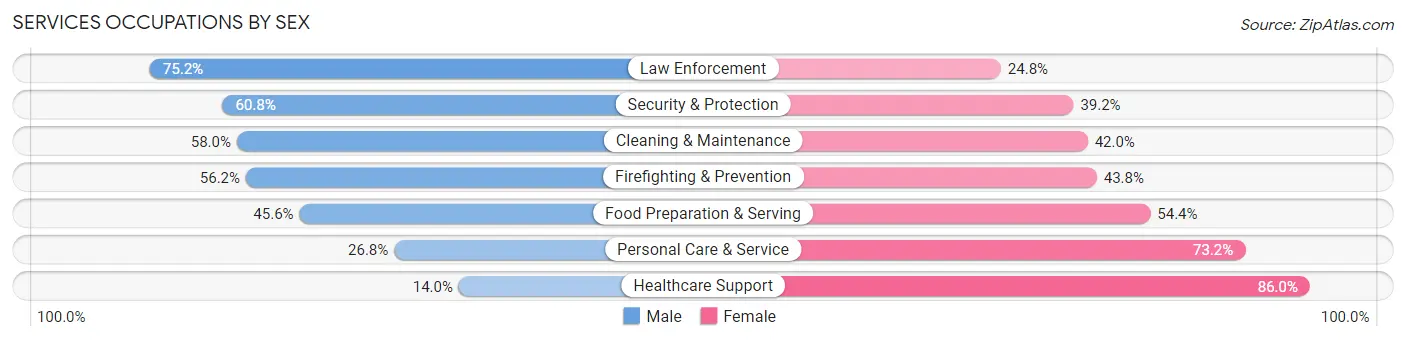
Within the Services occupations in DeKalb County, the most male-oriented occupations are Law Enforcement (75.2%), Security & Protection (60.8%), and Cleaning & Maintenance (58.0%), while the most female-oriented occupations are Healthcare Support (86.0%), Personal Care & Service (73.2%), and Food Preparation & Serving (54.4%).
| Occupation | Male | Female |
| Healthcare Support | 1,397 (14.0%) | 8,564 (86.0%) |
| Security & Protection | 4,449 (60.8%) | 2,867 (39.2%) |
| Firefighting & Prevention | 3,110 (56.2%) | 2,425 (43.8%) |
| Law Enforcement | 1,339 (75.2%) | 442 (24.8%) |
| Food Preparation & Serving | 8,480 (45.6%) | 10,126 (54.4%) |
| Cleaning & Maintenance | 6,669 (58.0%) | 4,832 (42.0%) |
| Personal Care & Service | 2,351 (26.8%) | 6,413 (73.2%) |
| Total (Category) | 23,346 (41.6%) | 32,802 (58.4%) |
| Total (Overall) | 191,117 (49.2%) | 197,338 (50.8%) |
Sales and Office Occupations
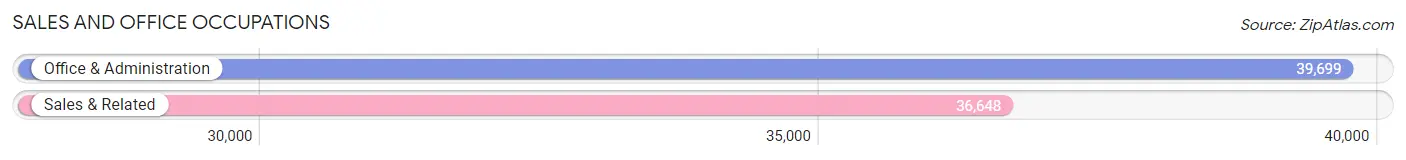
The most common Sales and Office occupations in DeKalb County are Office & Administration (39,699 | 10.2%), and Sales & Related (36,648 | 9.4%).
Sales and Office Occupations by Sex
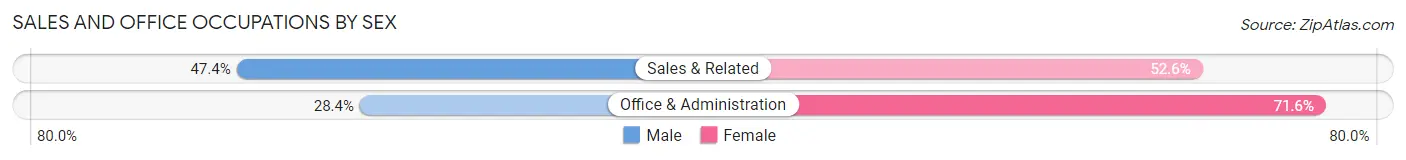
| Occupation | Male | Female |
| Sales & Related | 17,370 (47.4%) | 19,278 (52.6%) |
| Office & Administration | 11,286 (28.4%) | 28,413 (71.6%) |
| Total (Category) | 28,656 (37.5%) | 47,691 (62.5%) |
| Total (Overall) | 191,117 (49.2%) | 197,338 (50.8%) |
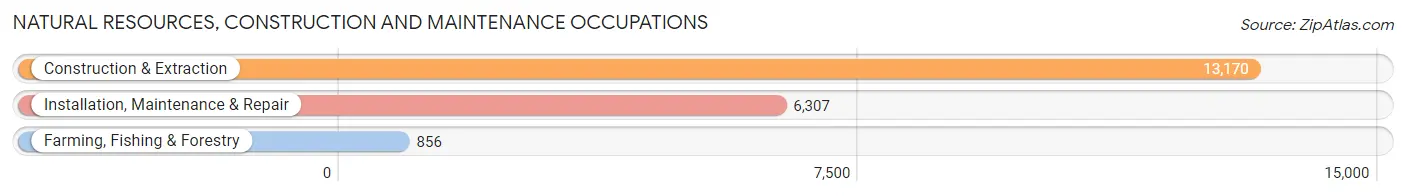
Natural Resources, Construction and Maintenance Occupations
The most common Natural Resources, Construction and Maintenance occupations in DeKalb County are Construction & Extraction (13,170 | 3.4%), Installation, Maintenance & Repair (6,307 | 1.6%), and Farming, Fishing & Forestry (856 | 0.2%).
Natural Resources, Construction and Maintenance Occupations by Sex
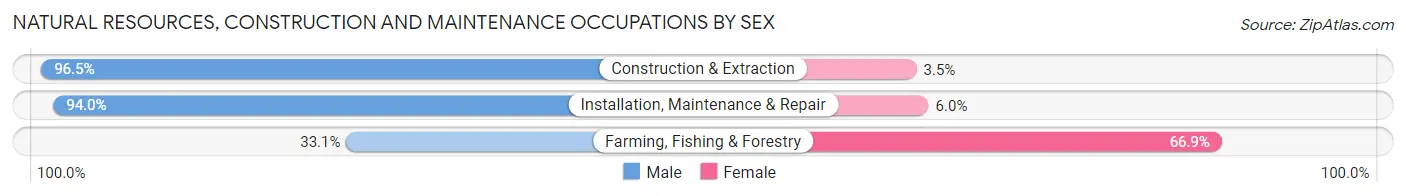
| Occupation | Male | Female |
| Farming, Fishing & Forestry | 283 (33.1%) | 573 (66.9%) |
| Construction & Extraction | 12,713 (96.5%) | 457 (3.5%) |
| Installation, Maintenance & Repair | 5,930 (94.0%) | 377 (6.0%) |
| Total (Category) | 18,926 (93.1%) | 1,407 (6.9%) |
| Total (Overall) | 191,117 (49.2%) | 197,338 (50.8%) |
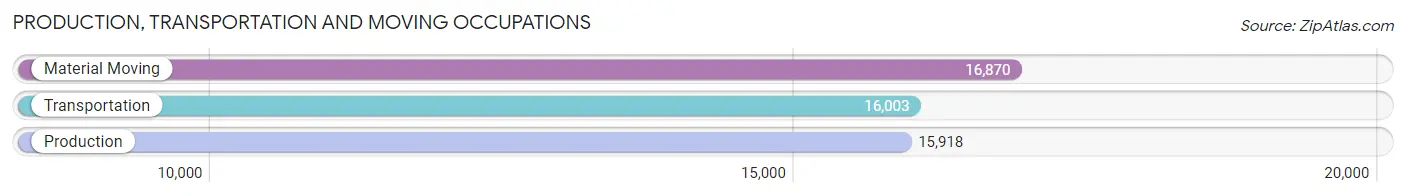
Production, Transportation and Moving Occupations
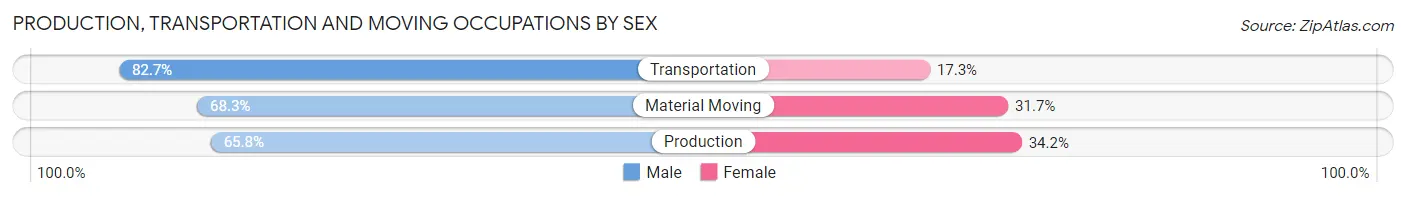
The most common Production, Transportation and Moving occupations in DeKalb County are Material Moving (16,870 | 4.3%), Transportation (16,003 | 4.1%), and Production (15,918 | 4.1%).
Production, Transportation and Moving Occupations by Sex
| Occupation | Male | Female |
| Production | 10,481 (65.8%) | 5,437 (34.2%) |
| Transportation | 13,232 (82.7%) | 2,771 (17.3%) |
| Material Moving | 11,528 (68.3%) | 5,342 (31.7%) |
| Total (Category) | 35,241 (72.2%) | 13,550 (27.8%) |
| Total (Overall) | 191,117 (49.2%) | 197,338 (50.8%) |
Employment Industries by Sex in DeKalb County
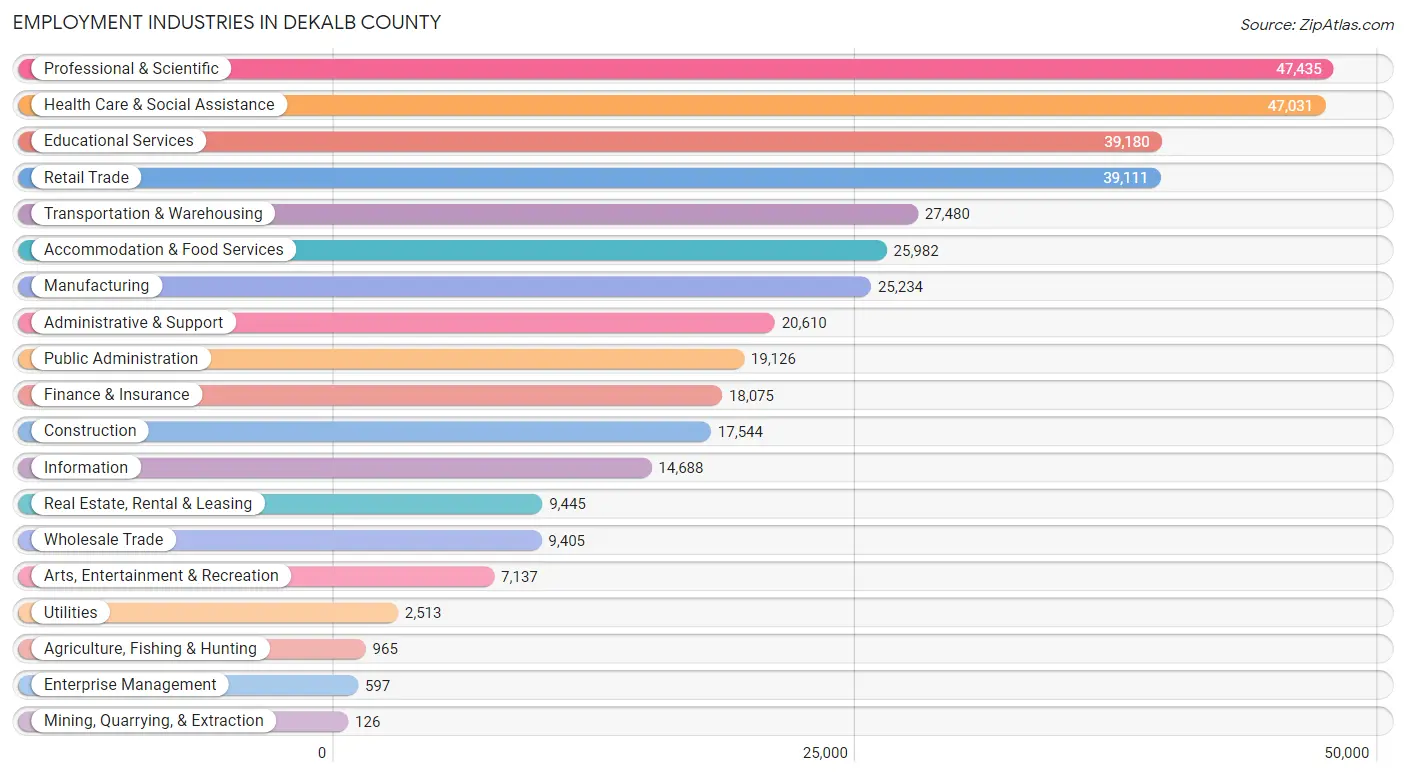
Employment Industries in DeKalb County
The major employment industries in DeKalb County include Professional & Scientific (47,435 | 12.2%), Health Care & Social Assistance (47,031 | 12.1%), Educational Services (39,180 | 10.1%), Retail Trade (39,111 | 10.1%), and Transportation & Warehousing (27,480 | 7.1%).
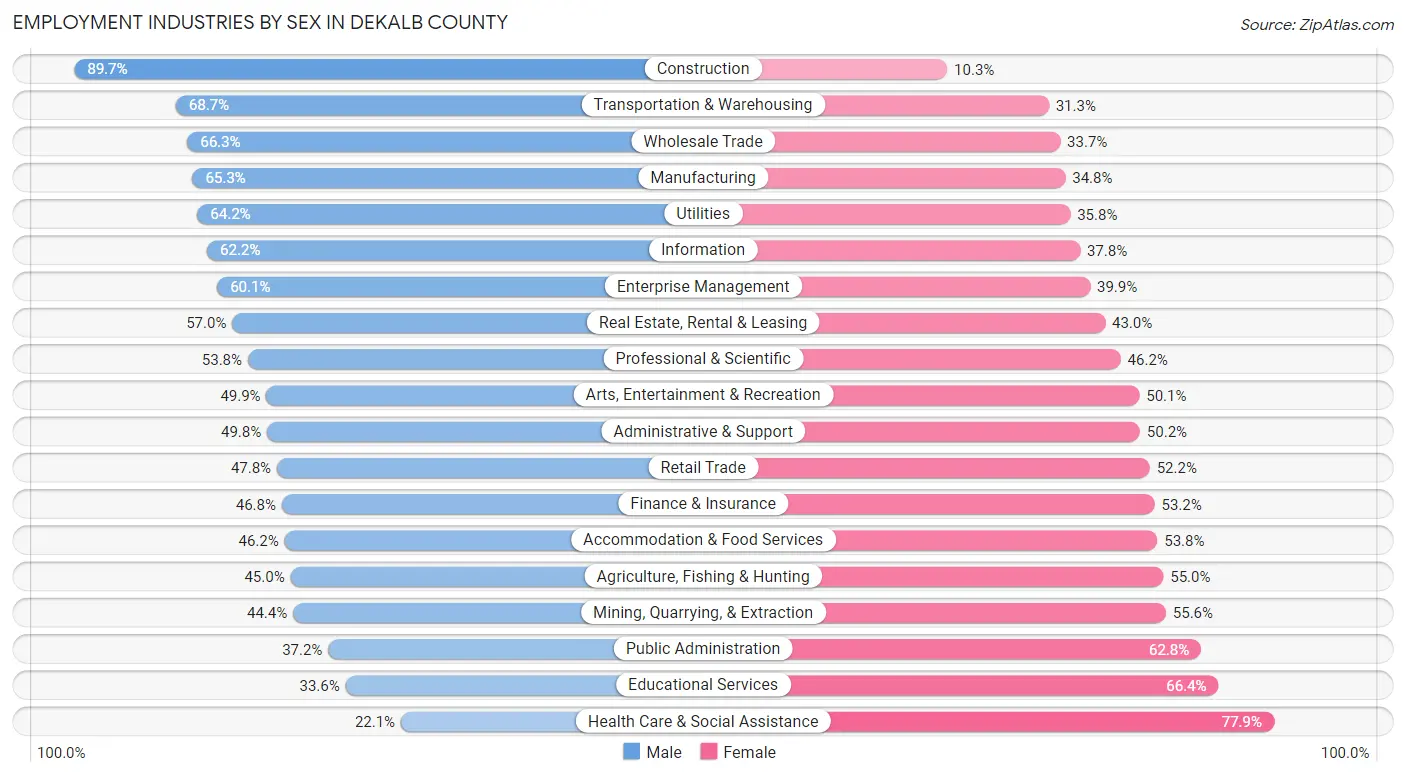
Employment Industries by Sex in DeKalb County
The DeKalb County industries that see more men than women are Construction (89.7%), Transportation & Warehousing (68.7%), and Wholesale Trade (66.3%), whereas the industries that tend to have a higher number of women are Health Care & Social Assistance (77.9%), Educational Services (66.4%), and Public Administration (62.8%).
| Industry | Male | Female |
| Agriculture, Fishing & Hunting | 434 (45.0%) | 531 (55.0%) |
| Mining, Quarrying, & Extraction | 56 (44.4%) | 70 (55.6%) |
| Construction | 15,739 (89.7%) | 1,805 (10.3%) |
| Manufacturing | 16,464 (65.2%) | 8,770 (34.7%) |
| Wholesale Trade | 6,237 (66.3%) | 3,168 (33.7%) |
| Retail Trade | 18,683 (47.8%) | 20,428 (52.2%) |
| Transportation & Warehousing | 18,872 (68.7%) | 8,608 (31.3%) |
| Utilities | 1,614 (64.2%) | 899 (35.8%) |
| Information | 9,138 (62.2%) | 5,550 (37.8%) |
| Finance & Insurance | 8,454 (46.8%) | 9,621 (53.2%) |
| Real Estate, Rental & Leasing | 5,386 (57.0%) | 4,059 (43.0%) |
| Professional & Scientific | 25,515 (53.8%) | 21,920 (46.2%) |
| Enterprise Management | 359 (60.1%) | 238 (39.9%) |
| Administrative & Support | 10,266 (49.8%) | 10,344 (50.2%) |
| Educational Services | 13,151 (33.6%) | 26,029 (66.4%) |
| Health Care & Social Assistance | 10,393 (22.1%) | 36,638 (77.9%) |
| Arts, Entertainment & Recreation | 3,564 (49.9%) | 3,573 (50.1%) |
| Accommodation & Food Services | 12,004 (46.2%) | 13,978 (53.8%) |
| Public Administration | 7,107 (37.2%) | 12,019 (62.8%) |
| Total | 191,117 (49.2%) | 197,338 (50.8%) |
Education in DeKalb County
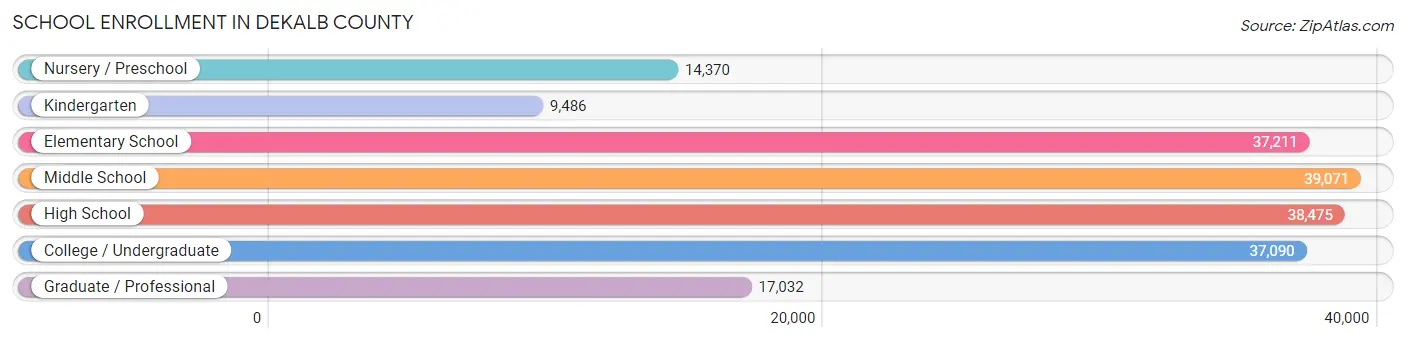
School Enrollment in DeKalb County
The most common levels of schooling among the 192,735 students in DeKalb County are middle school (39,071 | 20.3%), high school (38,475 | 20.0%), and elementary school (37,211 | 19.3%).
| School Level | # Students | % Students |
| Nursery / Preschool | 14,370 | 7.5% |
| Kindergarten | 9,486 | 4.9% |
| Elementary School | 37,211 | 19.3% |
| Middle School | 39,071 | 20.3% |
| High School | 38,475 | 20.0% |
| College / Undergraduate | 37,090 | 19.2% |
| Graduate / Professional | 17,032 | 8.8% |
| Total | 192,735 | 100.0% |
School Enrollment by Age by Funding Source in DeKalb County
Out of a total of 192,735 students who are enrolled in schools in DeKalb County, 40,282 (20.9%) attend a private institution, while the remaining 152,453 (79.1%) are enrolled in public schools. The age group of 3 to 4 year olds has the highest likelihood of being enrolled in private schools, with 5,215 (42.7% in the age bracket) enrolled. Conversely, the age group of 5 to 9 year old has the lowest likelihood of being enrolled in a private school, with 37,732 (86.9% in the age bracket) attending a public institution.
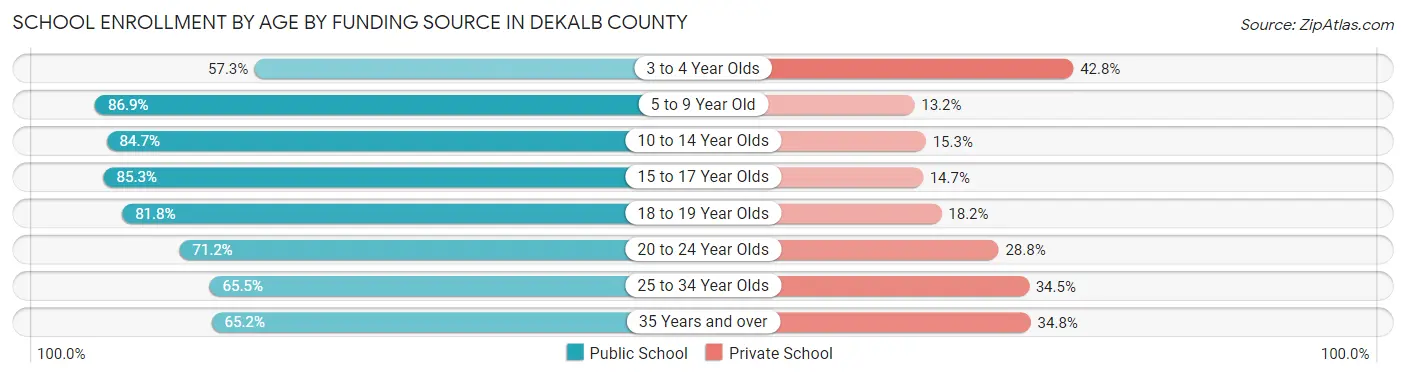
| Age Bracket | Public School | Private School |
| 3 to 4 Year Olds | 6,983 (57.3%) | 5,215 (42.7%) |
| 5 to 9 Year Old | 37,732 (86.9%) | 5,713 (13.2%) |
| 10 to 14 Year Olds | 41,533 (84.7%) | 7,497 (15.3%) |
| 15 to 17 Year Olds | 22,476 (85.3%) | 3,883 (14.7%) |
| 18 to 19 Year Olds | 10,723 (81.8%) | 2,384 (18.2%) |
| 20 to 24 Year Olds | 14,035 (71.2%) | 5,689 (28.8%) |
| 25 to 34 Year Olds | 10,844 (65.5%) | 5,703 (34.5%) |
| 35 Years and over | 8,032 (65.2%) | 4,293 (34.8%) |
| Total | 152,453 (79.1%) | 40,282 (20.9%) |
Educational Attainment by Field of Study in DeKalb County
Business (56,161 | 21.3%), social sciences (23,634 | 9.0%), science & technology (22,669 | 8.6%), education (18,541 | 7.0%), and bio, nature & agricultural (16,966 | 6.4%) are the most common fields of study among 263,472 individuals in DeKalb County who have obtained a bachelor's degree or higher.
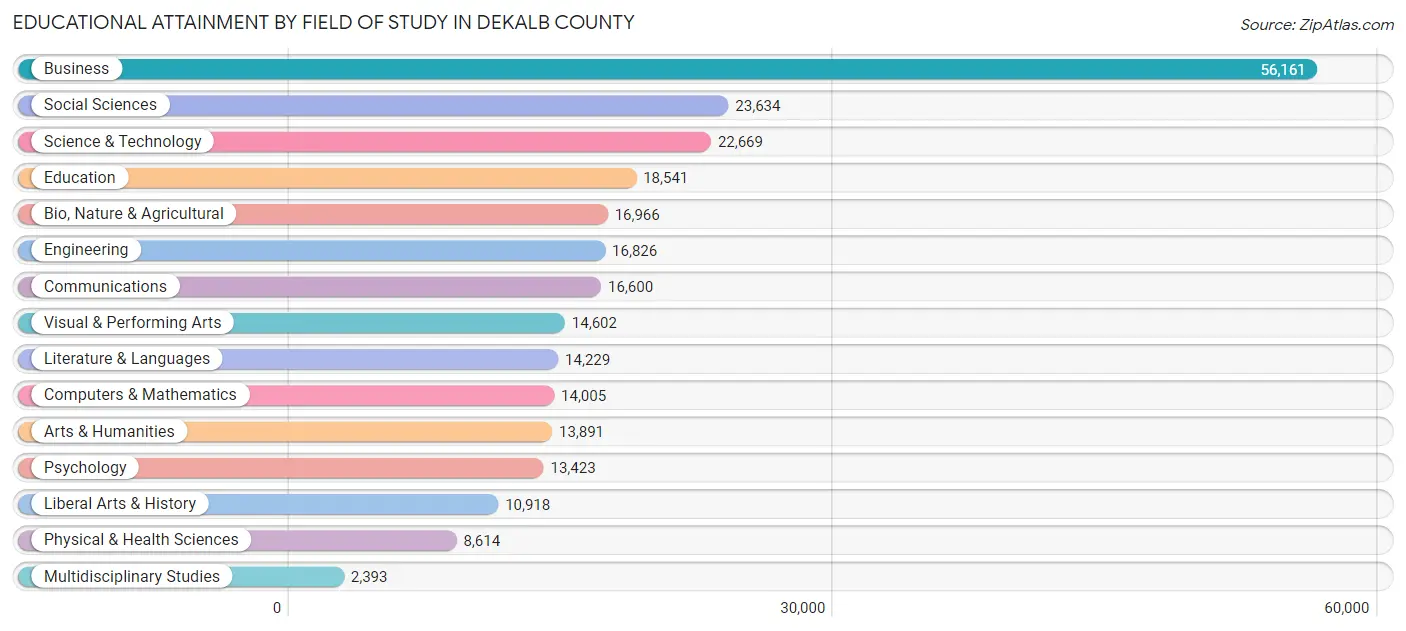
| Field of Study | # Graduates | % Graduates |
| Computers & Mathematics | 14,005 | 5.3% |
| Bio, Nature & Agricultural | 16,966 | 6.4% |
| Physical & Health Sciences | 8,614 | 3.3% |
| Psychology | 13,423 | 5.1% |
| Social Sciences | 23,634 | 9.0% |
| Engineering | 16,826 | 6.4% |
| Multidisciplinary Studies | 2,393 | 0.9% |
| Science & Technology | 22,669 | 8.6% |
| Business | 56,161 | 21.3% |
| Education | 18,541 | 7.0% |
| Literature & Languages | 14,229 | 5.4% |
| Liberal Arts & History | 10,918 | 4.1% |
| Visual & Performing Arts | 14,602 | 5.5% |
| Communications | 16,600 | 6.3% |
| Arts & Humanities | 13,891 | 5.3% |
| Total | 263,472 | 100.0% |
Transportation & Commute in DeKalb County
Vehicle Availability by Sex in DeKalb County
The most prevalent vehicle ownership categories in DeKalb County are males with 2 vehicles (81,743, accounting for 44.1%) and females with 2 vehicles (78,273, making up 42.7%).
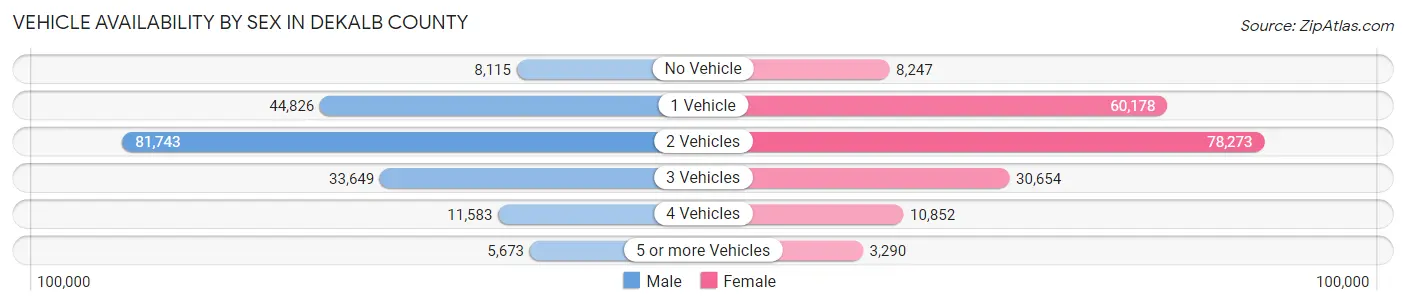
| Vehicles Available | Male | Female |
| No Vehicle | 8,115 (4.4%) | 8,247 (4.3%) |
| 1 Vehicle | 44,826 (24.1%) | 60,178 (31.4%) |
| 2 Vehicles | 81,743 (44.1%) | 78,273 (40.9%) |
| 3 Vehicles | 33,649 (18.1%) | 30,654 (16.0%) |
| 4 Vehicles | 11,583 (6.2%) | 10,852 (5.7%) |
| 5 or more Vehicles | 5,673 (3.1%) | 3,290 (1.7%) |
| Total | 185,589 (100.0%) | 191,494 (100.0%) |
Commute Time in DeKalb County
The most frequently occuring commute durations in DeKalb County are 30 to 34 minutes (58,859 commuters, 18.8%), 20 to 24 minutes (47,323 commuters, 15.1%), and 15 to 19 minutes (38,088 commuters, 12.2%).
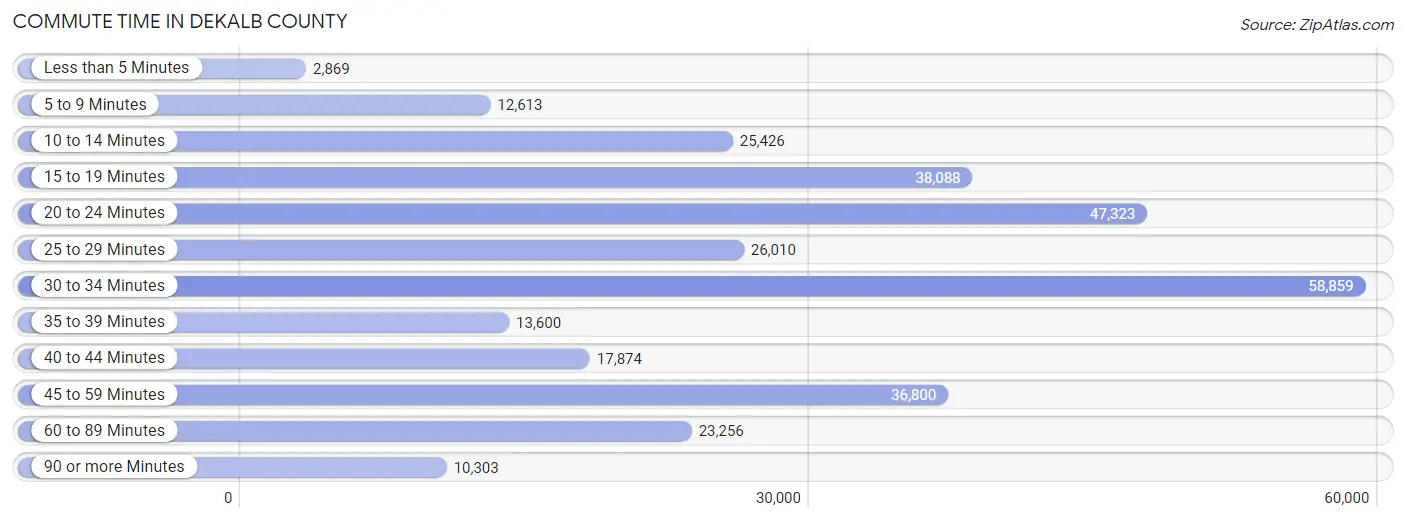
| Commute Time | # Commuters | % Commuters |
| Less than 5 Minutes | 2,869 | 0.9% |
| 5 to 9 Minutes | 12,613 | 4.0% |
| 10 to 14 Minutes | 25,426 | 8.1% |
| 15 to 19 Minutes | 38,088 | 12.2% |
| 20 to 24 Minutes | 47,323 | 15.1% |
| 25 to 29 Minutes | 26,010 | 8.3% |
| 30 to 34 Minutes | 58,859 | 18.8% |
| 35 to 39 Minutes | 13,600 | 4.3% |
| 40 to 44 Minutes | 17,874 | 5.7% |
| 45 to 59 Minutes | 36,800 | 11.8% |
| 60 to 89 Minutes | 23,256 | 7.4% |
| 90 or more Minutes | 10,303 | 3.3% |
Commute Time by Sex in DeKalb County
The most common commute times in DeKalb County are 30 to 34 minutes (29,590 commuters, 19.1%) for males and 30 to 34 minutes (29,269 commuters, 18.5%) for females.
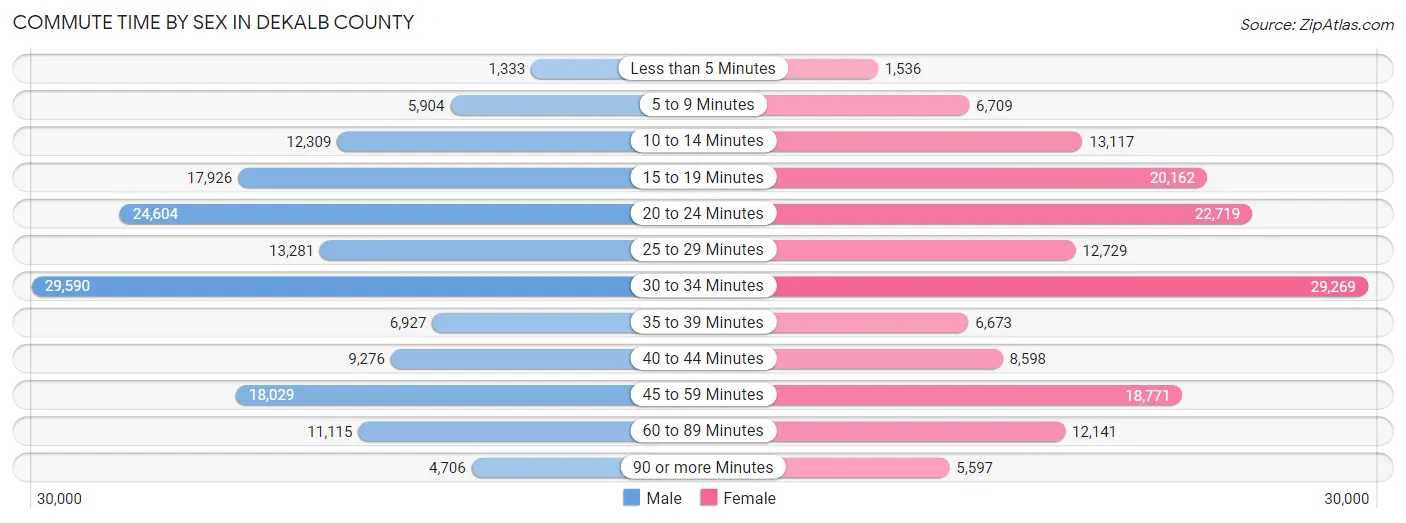
| Commute Time | Male | Female |
| Less than 5 Minutes | 1,333 (0.9%) | 1,536 (1.0%) |
| 5 to 9 Minutes | 5,904 (3.8%) | 6,709 (4.3%) |
| 10 to 14 Minutes | 12,309 (7.9%) | 13,117 (8.3%) |
| 15 to 19 Minutes | 17,926 (11.6%) | 20,162 (12.8%) |
| 20 to 24 Minutes | 24,604 (15.9%) | 22,719 (14.4%) |
| 25 to 29 Minutes | 13,281 (8.6%) | 12,729 (8.1%) |
| 30 to 34 Minutes | 29,590 (19.1%) | 29,269 (18.5%) |
| 35 to 39 Minutes | 6,927 (4.5%) | 6,673 (4.2%) |
| 40 to 44 Minutes | 9,276 (6.0%) | 8,598 (5.4%) |
| 45 to 59 Minutes | 18,029 (11.6%) | 18,771 (11.9%) |
| 60 to 89 Minutes | 11,115 (7.2%) | 12,141 (7.7%) |
| 90 or more Minutes | 4,706 (3.0%) | 5,597 (3.5%) |
Time of Departure to Work by Sex in DeKalb County
The most frequent times of departure to work in DeKalb County are 7:00 AM to 7:29 AM (21,368, 13.8%) for males and 7:00 AM to 7:29 AM (22,423, 14.2%) for females.
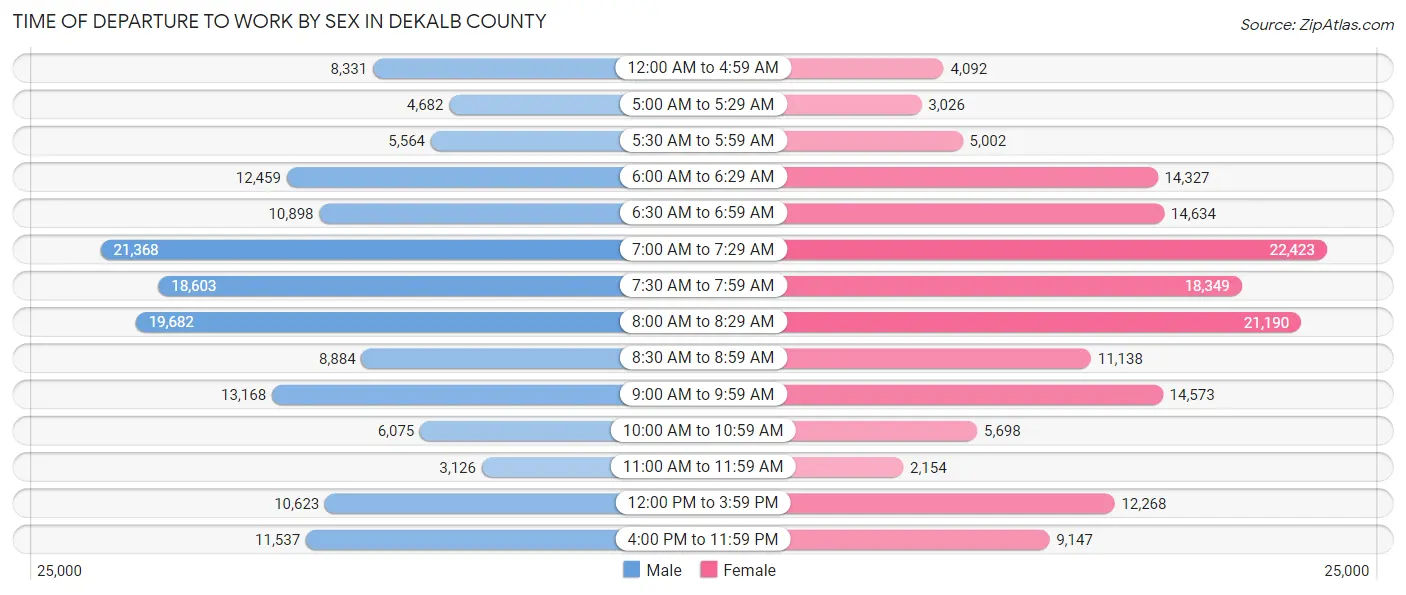
| Time of Departure | Male | Female |
| 12:00 AM to 4:59 AM | 8,331 (5.4%) | 4,092 (2.6%) |
| 5:00 AM to 5:29 AM | 4,682 (3.0%) | 3,026 (1.9%) |
| 5:30 AM to 5:59 AM | 5,564 (3.6%) | 5,002 (3.2%) |
| 6:00 AM to 6:29 AM | 12,459 (8.0%) | 14,327 (9.1%) |
| 6:30 AM to 6:59 AM | 10,898 (7.0%) | 14,634 (9.3%) |
| 7:00 AM to 7:29 AM | 21,368 (13.8%) | 22,423 (14.2%) |
| 7:30 AM to 7:59 AM | 18,603 (12.0%) | 18,349 (11.6%) |
| 8:00 AM to 8:29 AM | 19,682 (12.7%) | 21,190 (13.4%) |
| 8:30 AM to 8:59 AM | 8,884 (5.7%) | 11,138 (7.0%) |
| 9:00 AM to 9:59 AM | 13,168 (8.5%) | 14,573 (9.2%) |
| 10:00 AM to 10:59 AM | 6,075 (3.9%) | 5,698 (3.6%) |
| 11:00 AM to 11:59 AM | 3,126 (2.0%) | 2,154 (1.4%) |
| 12:00 PM to 3:59 PM | 10,623 (6.9%) | 12,268 (7.8%) |
| 4:00 PM to 11:59 PM | 11,537 (7.4%) | 9,147 (5.8%) |
| Total | 155,000 (100.0%) | 158,021 (100.0%) |
Housing Occupancy in DeKalb County
Occupancy by Ownership in DeKalb County
Of the total 284,730 dwellings in DeKalb County, owner-occupied units account for 164,725 (57.9%), while renter-occupied units make up 120,005 (42.1%).
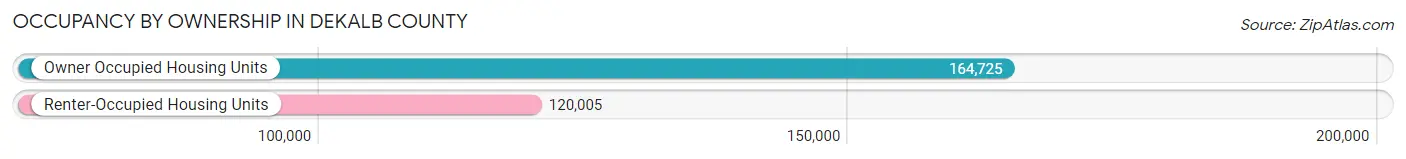
| Occupancy | # Housing Units | % Housing Units |
| Owner Occupied Housing Units | 164,725 | 57.9% |
| Renter-Occupied Housing Units | 120,005 | 42.1% |
| Total Occupied Housing Units | 284,730 | 100.0% |
Occupancy by Household Size in DeKalb County

| Household Size | # Housing Units | % Housing Units |
| 1-Person Household | 97,722 | 34.3% |
| 2-Person Household | 89,651 | 31.5% |
| 3-Person Household | 44,099 | 15.5% |
| 4+ Person Household | 53,258 | 18.7% |
| Total Housing Units | 284,730 | 100.0% |
Occupancy by Ownership by Household Size in DeKalb County
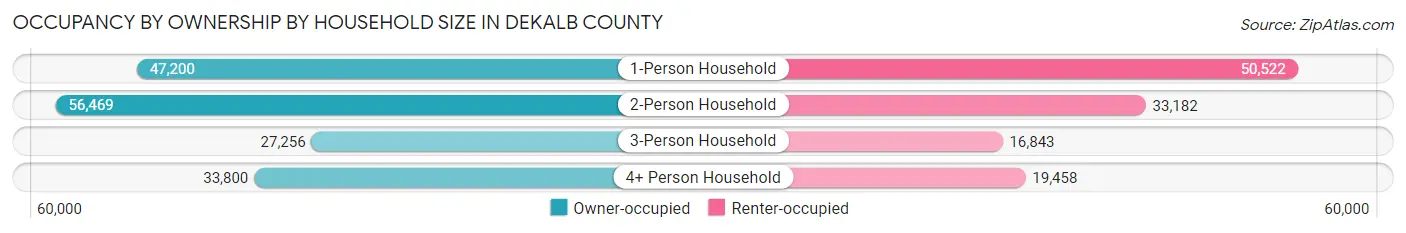
| Household Size | Owner-occupied | Renter-occupied |
| 1-Person Household | 47,200 (48.3%) | 50,522 (51.7%) |
| 2-Person Household | 56,469 (63.0%) | 33,182 (37.0%) |
| 3-Person Household | 27,256 (61.8%) | 16,843 (38.2%) |
| 4+ Person Household | 33,800 (63.5%) | 19,458 (36.5%) |
| Total Housing Units | 164,725 (57.9%) | 120,005 (42.1%) |
Occupancy by Educational Attainment in DeKalb County
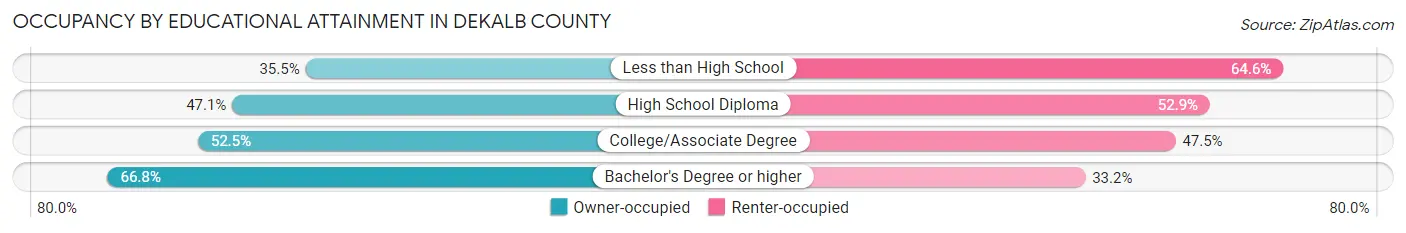
| Household Size | Owner-occupied | Renter-occupied |
| Less than High School | 7,075 (35.4%) | 12,883 (64.5%) |
| High School Diploma | 22,489 (47.1%) | 25,288 (52.9%) |
| College/Associate Degree | 36,269 (52.5%) | 32,772 (47.5%) |
| Bachelor's Degree or higher | 98,892 (66.8%) | 49,062 (33.2%) |
Occupancy by Age of Householder in DeKalb County
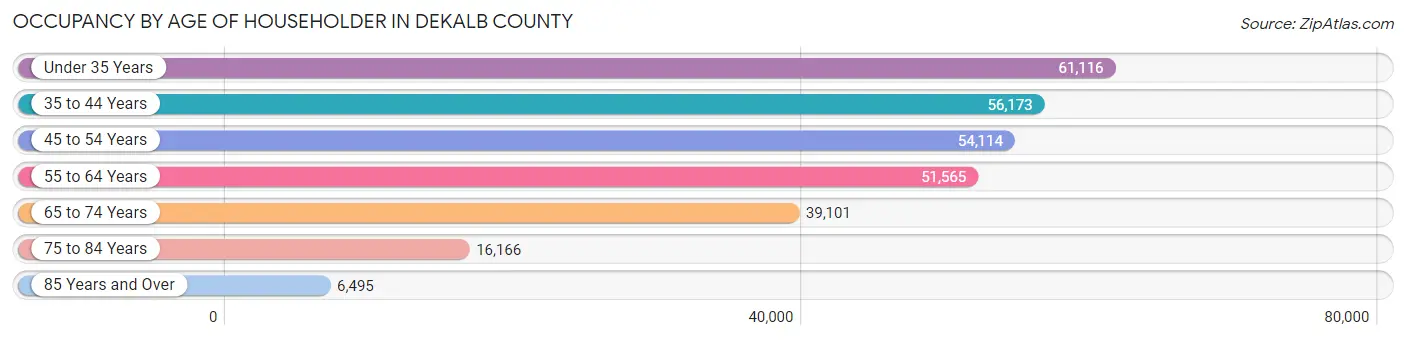
| Age Bracket | # Households | % Households |
| Under 35 Years | 61,116 | 21.5% |
| 35 to 44 Years | 56,173 | 19.7% |
| 45 to 54 Years | 54,114 | 19.0% |
| 55 to 64 Years | 51,565 | 18.1% |
| 65 to 74 Years | 39,101 | 13.7% |
| 75 to 84 Years | 16,166 | 5.7% |
| 85 Years and Over | 6,495 | 2.3% |
| Total | 284,730 | 100.0% |
Housing Finances in DeKalb County
Median Income by Occupancy in DeKalb County
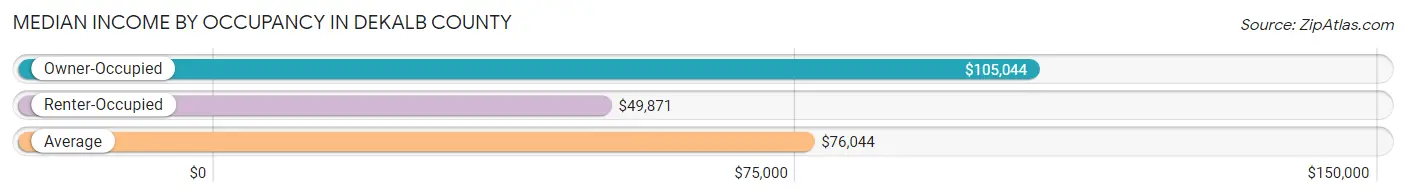
| Occupancy Type | # Households | Median Income |
| Owner-Occupied | 164,725 (57.9%) | $105,044 |
| Renter-Occupied | 120,005 (42.1%) | $49,871 |
| Average | 284,730 (100.0%) | $76,044 |
Occupancy by Householder Income Bracket in DeKalb County
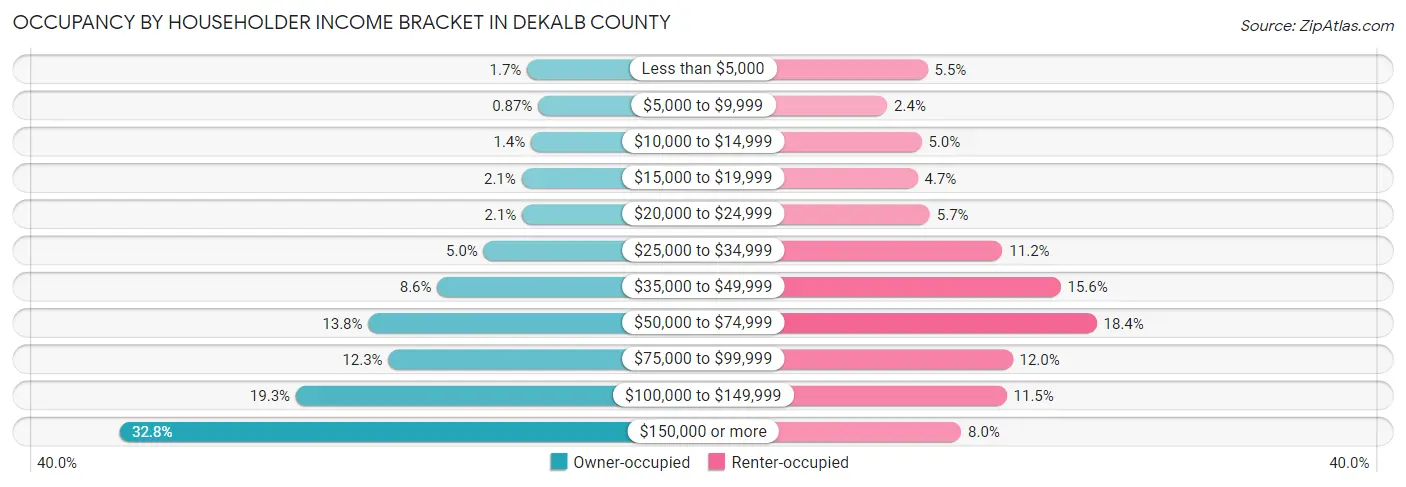
| Income Bracket | Owner-occupied | Renter-occupied |
| Less than $5,000 | 2,821 (1.7%) | 6,590 (5.5%) |
| $5,000 to $9,999 | 1,431 (0.9%) | 2,888 (2.4%) |
| $10,000 to $14,999 | 2,327 (1.4%) | 6,028 (5.0%) |
| $15,000 to $19,999 | 3,508 (2.1%) | 5,680 (4.7%) |
| $20,000 to $24,999 | 3,448 (2.1%) | 6,791 (5.7%) |
| $25,000 to $34,999 | 8,276 (5.0%) | 13,431 (11.2%) |
| $35,000 to $49,999 | 14,092 (8.6%) | 18,749 (15.6%) |
| $50,000 to $74,999 | 22,741 (13.8%) | 22,034 (18.4%) |
| $75,000 to $99,999 | 20,221 (12.3%) | 14,356 (12.0%) |
| $100,000 to $149,999 | 31,837 (19.3%) | 13,808 (11.5%) |
| $150,000 or more | 54,023 (32.8%) | 9,650 (8.0%) |
| Total | 164,725 (100.0%) | 120,005 (100.0%) |
Monthly Housing Cost Tiers in DeKalb County

| Monthly Cost | Owner-occupied | Renter-occupied |
| Less than $300 | 3,263 (2.0%) | 1,696 (1.4%) |
| $300 to $499 | 11,712 (7.1%) | 2,191 (1.8%) |
| $500 to $799 | 20,786 (12.6%) | 3,622 (3.0%) |
| $800 to $999 | 13,519 (8.2%) | 7,657 (6.4%) |
| $1,000 to $1,499 | 35,945 (21.8%) | 47,181 (39.3%) |
| $1,500 to $1,999 | 29,136 (17.7%) | 39,868 (33.2%) |
| $2,000 to $2,499 | 18,693 (11.4%) | 10,568 (8.8%) |
| $2,500 to $2,999 | 11,885 (7.2%) | 2,542 (2.1%) |
| $3,000 or more | 19,786 (12.0%) | 1,939 (1.6%) |
| Total | 164,725 (100.0%) | 120,005 (100.0%) |
Physical Housing Characteristics in DeKalb County
Housing Structures in DeKalb County
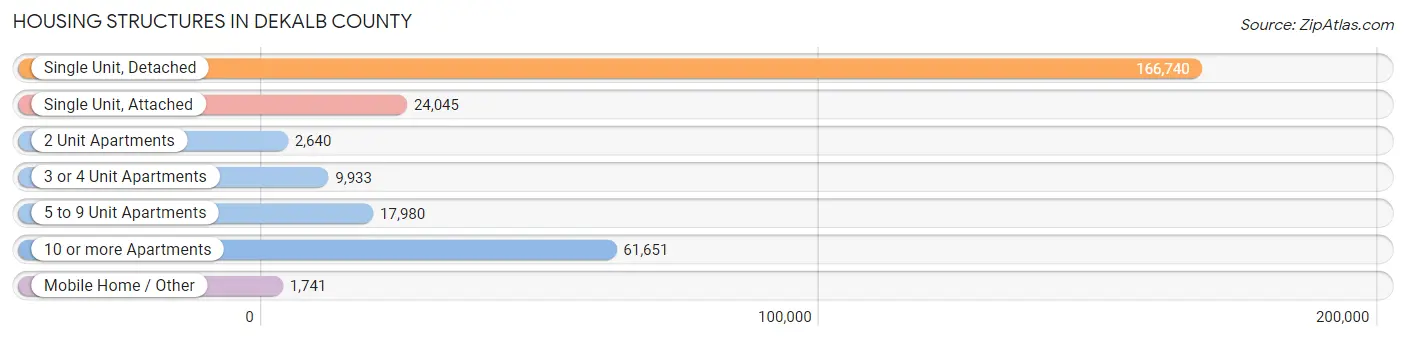
| Structure Type | # Housing Units | % Housing Units |
| Single Unit, Detached | 166,740 | 58.6% |
| Single Unit, Attached | 24,045 | 8.4% |
| 2 Unit Apartments | 2,640 | 0.9% |
| 3 or 4 Unit Apartments | 9,933 | 3.5% |
| 5 to 9 Unit Apartments | 17,980 | 6.3% |
| 10 or more Apartments | 61,651 | 21.6% |
| Mobile Home / Other | 1,741 | 0.6% |
| Total | 284,730 | 100.0% |
Housing Structures by Occupancy in DeKalb County
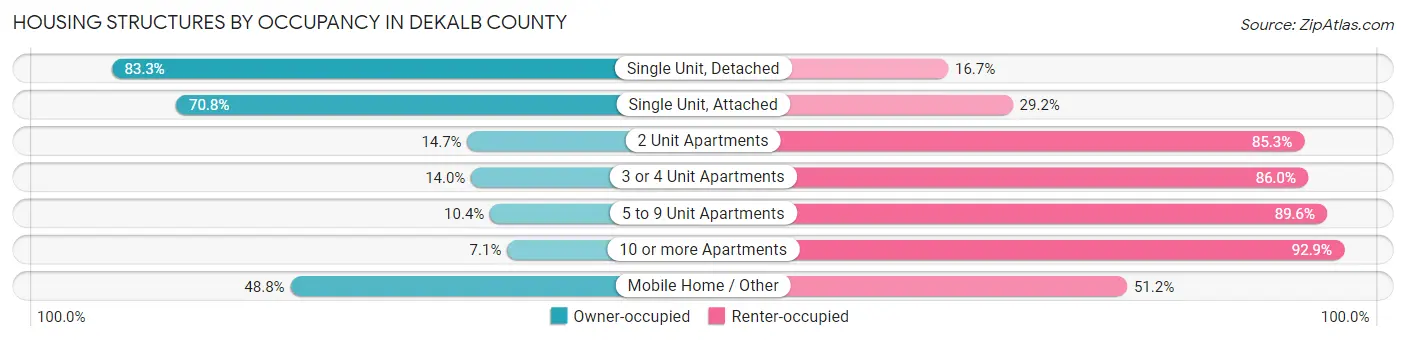
| Structure Type | Owner-occupied | Renter-occupied |
| Single Unit, Detached | 138,845 (83.3%) | 27,895 (16.7%) |
| Single Unit, Attached | 17,030 (70.8%) | 7,015 (29.2%) |
| 2 Unit Apartments | 389 (14.7%) | 2,251 (85.3%) |
| 3 or 4 Unit Apartments | 1,392 (14.0%) | 8,541 (86.0%) |
| 5 to 9 Unit Apartments | 1,863 (10.4%) | 16,117 (89.6%) |
| 10 or more Apartments | 4,356 (7.1%) | 57,295 (92.9%) |
| Mobile Home / Other | 850 (48.8%) | 891 (51.2%) |
| Total | 164,725 (57.9%) | 120,005 (42.1%) |
Housing Structures by Number of Rooms in DeKalb County
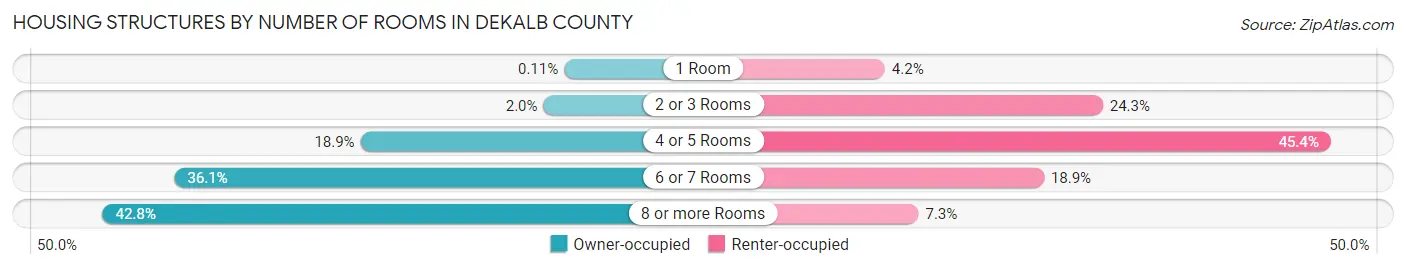
| Number of Rooms | Owner-occupied | Renter-occupied |
| 1 Room | 173 (0.1%) | 4,996 (4.2%) |
| 2 or 3 Rooms | 3,324 (2.0%) | 29,174 (24.3%) |
| 4 or 5 Rooms | 31,203 (18.9%) | 54,469 (45.4%) |
| 6 or 7 Rooms | 59,534 (36.1%) | 22,639 (18.9%) |
| 8 or more Rooms | 70,491 (42.8%) | 8,727 (7.3%) |
| Total | 164,725 (100.0%) | 120,005 (100.0%) |
Housing Structure by Heating Type in DeKalb County
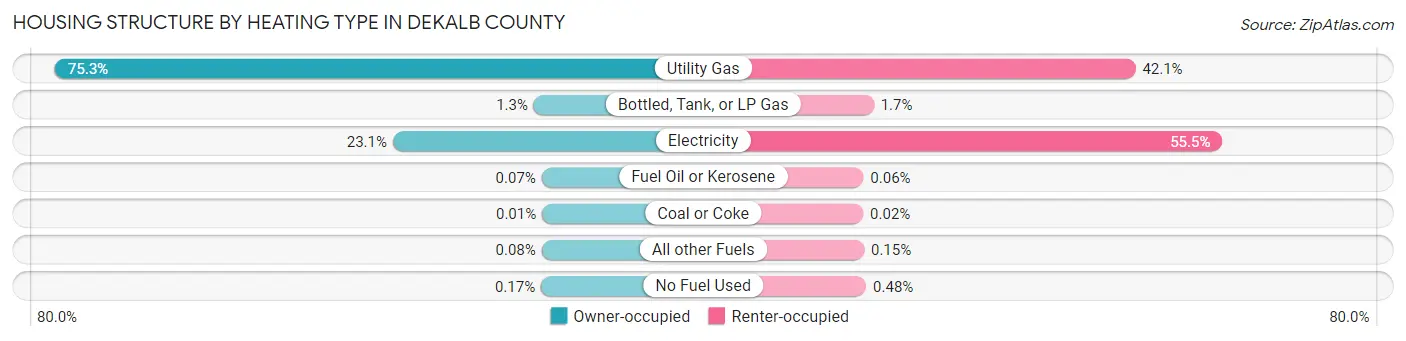
| Heating Type | Owner-occupied | Renter-occupied |
| Utility Gas | 124,048 (75.3%) | 50,534 (42.1%) |
| Bottled, Tank, or LP Gas | 2,103 (1.3%) | 1,979 (1.7%) |
| Electricity | 38,024 (23.1%) | 66,628 (55.5%) |
| Fuel Oil or Kerosene | 108 (0.1%) | 78 (0.1%) |
| Coal or Coke | 23 (0.0%) | 26 (0.0%) |
| All other Fuels | 137 (0.1%) | 180 (0.2%) |
| No Fuel Used | 282 (0.2%) | 580 (0.5%) |
| Total | 164,725 (100.0%) | 120,005 (100.0%) |
Household Vehicle Usage in DeKalb County
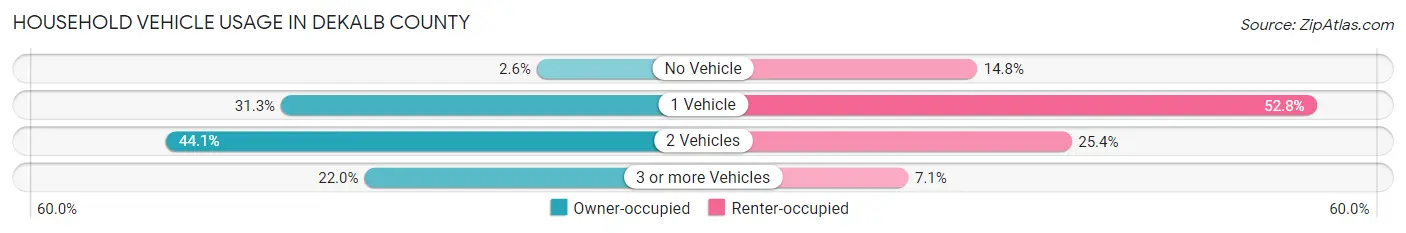
| Vehicles per Household | Owner-occupied | Renter-occupied |
| No Vehicle | 4,325 (2.6%) | 17,721 (14.8%) |
| 1 Vehicle | 51,535 (31.3%) | 63,373 (52.8%) |
| 2 Vehicles | 72,704 (44.1%) | 30,430 (25.4%) |
| 3 or more Vehicles | 36,161 (22.0%) | 8,481 (7.1%) |
| Total | 164,725 (100.0%) | 120,005 (100.0%) |
Real Estate & Mortgages in DeKalb County
Real Estate and Mortgage Overview in DeKalb County
| Characteristic | Without Mortgage | With Mortgage |
| Housing Units | 46,610 | 118,115 |
| Median Property Value | $298,800 | $302,300 |
| Median Household Income | $79,556 | $42,799 |
| Monthly Housing Costs | $645 | $19,710 |
| Real Estate Taxes | $2,425 | $2,167 |
Property Value by Mortgage Status in DeKalb County
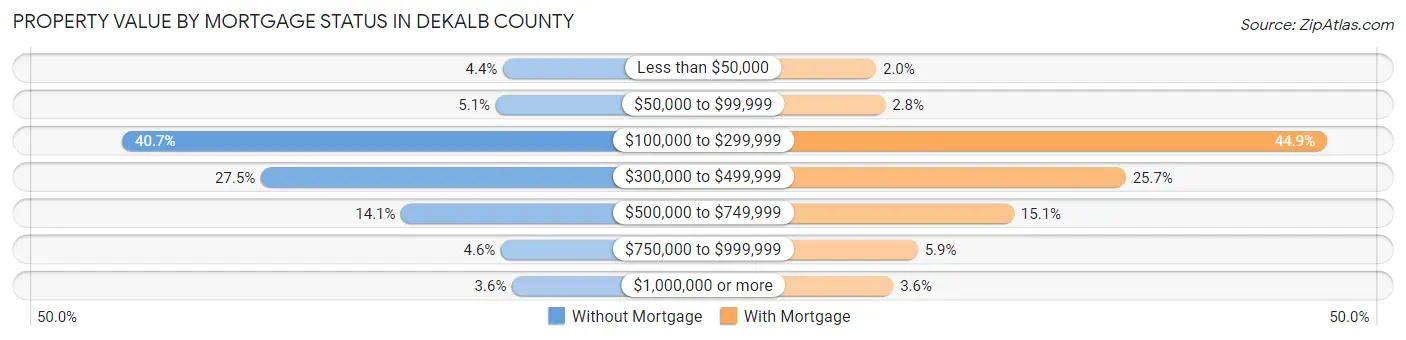
| Property Value | Without Mortgage | With Mortgage |
| Less than $50,000 | 2,059 (4.4%) | 2,299 (1.9%) |
| $50,000 to $99,999 | 2,383 (5.1%) | 3,340 (2.8%) |
| $100,000 to $299,999 | 18,975 (40.7%) | 53,035 (44.9%) |
| $300,000 to $499,999 | 12,802 (27.5%) | 30,391 (25.7%) |
| $500,000 to $749,999 | 6,583 (14.1%) | 17,816 (15.1%) |
| $750,000 to $999,999 | 2,149 (4.6%) | 6,988 (5.9%) |
| $1,000,000 or more | 1,659 (3.6%) | 4,246 (3.6%) |
| Total | 46,610 (100.0%) | 118,115 (100.0%) |
Household Income by Mortgage Status in DeKalb County
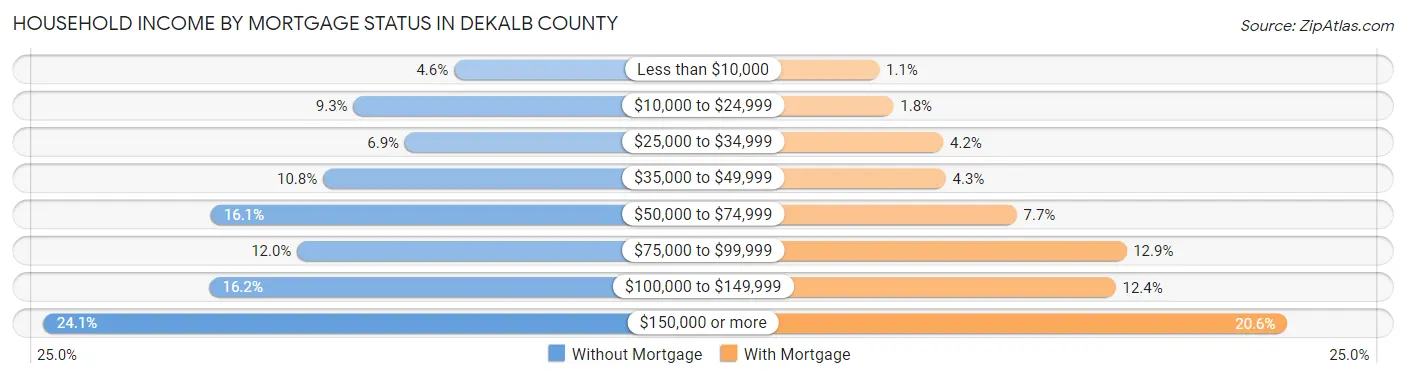
| Household Income | Without Mortgage | With Mortgage |
| Less than $10,000 | 2,122 (4.5%) | 1,326 (1.1%) |
| $10,000 to $24,999 | 4,354 (9.3%) | 2,130 (1.8%) |
| $25,000 to $34,999 | 3,211 (6.9%) | 4,929 (4.2%) |
| $35,000 to $49,999 | 5,031 (10.8%) | 5,065 (4.3%) |
| $50,000 to $74,999 | 7,518 (16.1%) | 9,061 (7.7%) |
| $75,000 to $99,999 | 5,603 (12.0%) | 15,223 (12.9%) |
| $100,000 to $149,999 | 7,547 (16.2%) | 14,618 (12.4%) |
| $150,000 or more | 11,224 (24.1%) | 24,290 (20.6%) |
| Total | 46,610 (100.0%) | 118,115 (100.0%) |
Property Value to Household Income Ratio in DeKalb County
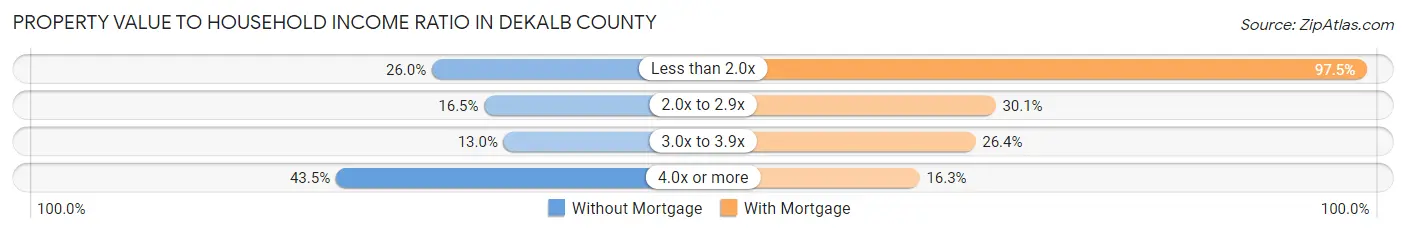
| Value-to-Income Ratio | Without Mortgage | With Mortgage |
| Less than 2.0x | 12,124 (26.0%) | 115,207 (97.5%) |
| 2.0x to 2.9x | 7,691 (16.5%) | 35,503 (30.1%) |
| 3.0x to 3.9x | 6,049 (13.0%) | 31,181 (26.4%) |
| 4.0x or more | 20,254 (43.4%) | 19,206 (16.3%) |
| Total | 46,610 (100.0%) | 118,115 (100.0%) |
Real Estate Taxes by Mortgage Status in DeKalb County
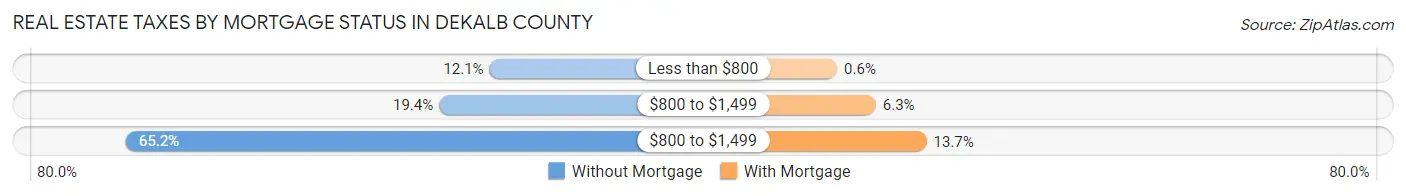
| Property Taxes | Without Mortgage | With Mortgage |
| Less than $800 | 5,630 (12.1%) | 703 (0.6%) |
| $800 to $1,499 | 9,063 (19.4%) | 7,383 (6.2%) |
| $800 to $1,499 | 30,386 (65.2%) | 16,133 (13.7%) |
| Total | 46,610 (100.0%) | 118,115 (100.0%) |
Health & Disability in DeKalb County
Health Insurance Coverage by Age in DeKalb County
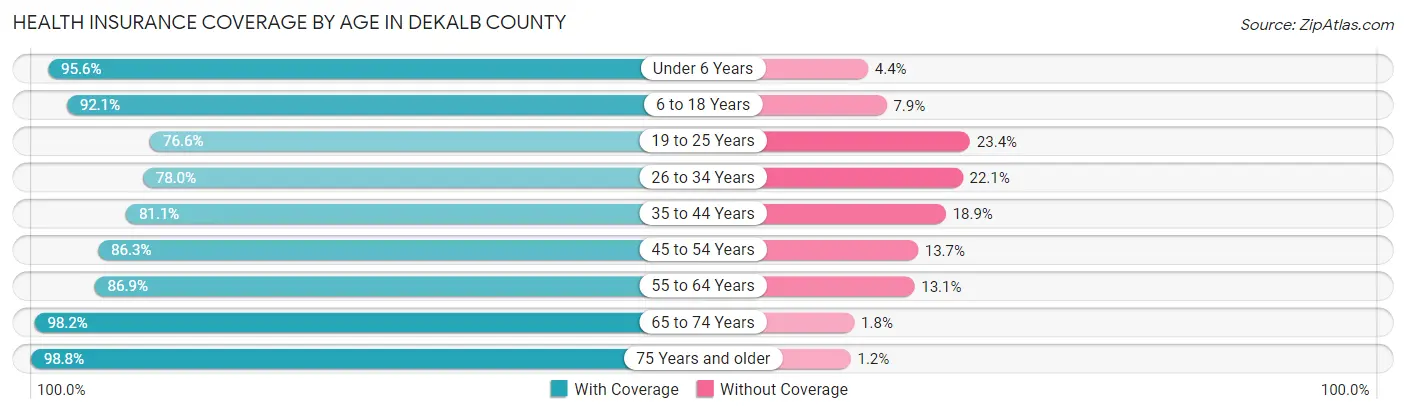
| Age Bracket | With Coverage | Without Coverage |
| Under 6 Years | 57,171 (95.6%) | 2,627 (4.4%) |
| 6 to 18 Years | 112,632 (92.1%) | 9,624 (7.9%) |
| 19 to 25 Years | 52,089 (76.6%) | 15,928 (23.4%) |
| 26 to 34 Years | 87,635 (77.9%) | 24,796 (22.1%) |
| 35 to 44 Years | 88,179 (81.1%) | 20,564 (18.9%) |
| 45 to 54 Years | 83,901 (86.3%) | 13,316 (13.7%) |
| 55 to 64 Years | 77,671 (86.9%) | 11,671 (13.1%) |
| 65 to 74 Years | 60,637 (98.2%) | 1,136 (1.8%) |
| 75 Years and older | 35,797 (98.8%) | 420 (1.2%) |
| Total | 655,712 (86.8%) | 100,082 (13.2%) |
Health Insurance Coverage by Citizenship Status in DeKalb County
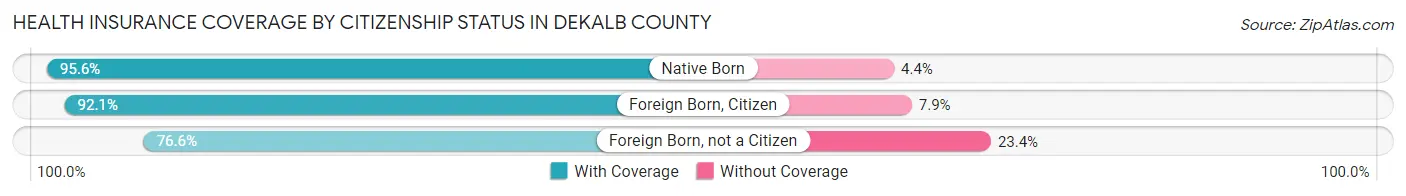
| Citizenship Status | With Coverage | Without Coverage |
| Native Born | 57,171 (95.6%) | 2,627 (4.4%) |
| Foreign Born, Citizen | 112,632 (92.1%) | 9,624 (7.9%) |
| Foreign Born, not a Citizen | 52,089 (76.6%) | 15,928 (23.4%) |
Health Insurance Coverage by Household Income in DeKalb County
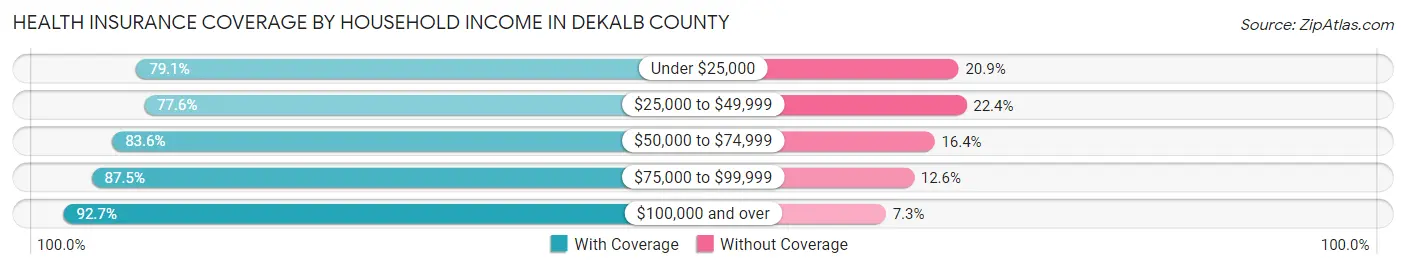
| Household Income | With Coverage | Without Coverage |
| Under $25,000 | 64,680 (79.1%) | 17,117 (20.9%) |
| $25,000 to $49,999 | 96,137 (77.6%) | 27,736 (22.4%) |
| $50,000 to $74,999 | 92,578 (83.6%) | 18,184 (16.4%) |
| $75,000 to $99,999 | 80,936 (87.5%) | 11,611 (12.6%) |
| $100,000 and over | 315,488 (92.7%) | 24,846 (7.3%) |
Public vs Private Health Insurance Coverage by Age in DeKalb County
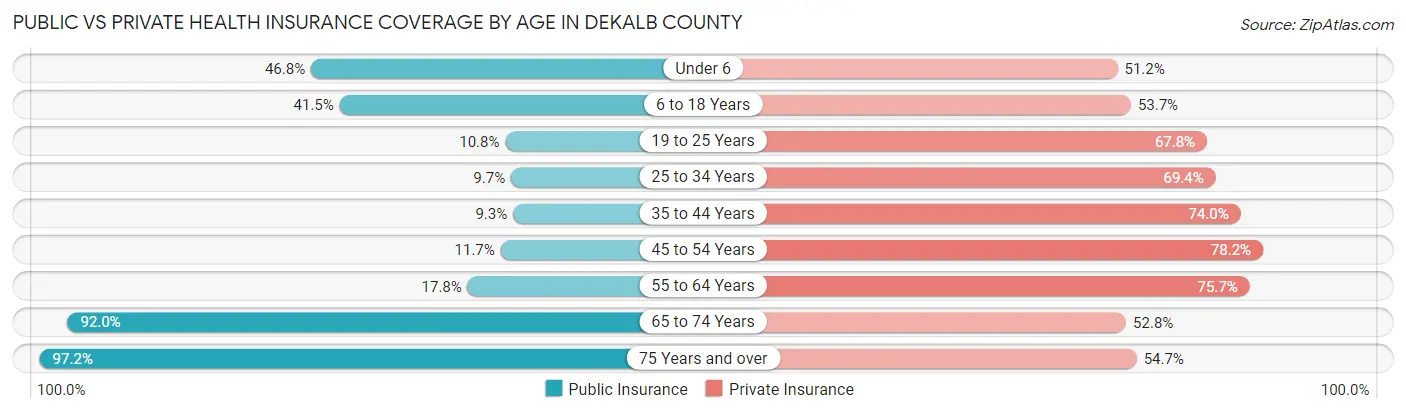
| Age Bracket | Public Insurance | Private Insurance |
| Under 6 | 28,008 (46.8%) | 30,606 (51.2%) |
| 6 to 18 Years | 50,784 (41.5%) | 65,620 (53.7%) |
| 19 to 25 Years | 7,329 (10.8%) | 46,096 (67.8%) |
| 25 to 34 Years | 10,927 (9.7%) | 77,998 (69.4%) |
| 35 to 44 Years | 10,157 (9.3%) | 80,495 (74.0%) |
| 45 to 54 Years | 11,323 (11.7%) | 75,982 (78.2%) |
| 55 to 64 Years | 15,874 (17.8%) | 67,632 (75.7%) |
| 65 to 74 Years | 56,857 (92.0%) | 32,604 (52.8%) |
| 75 Years and over | 35,204 (97.2%) | 19,824 (54.7%) |
| Total | 226,463 (30.0%) | 496,857 (65.7%) |
Disability Status by Sex by Age in DeKalb County
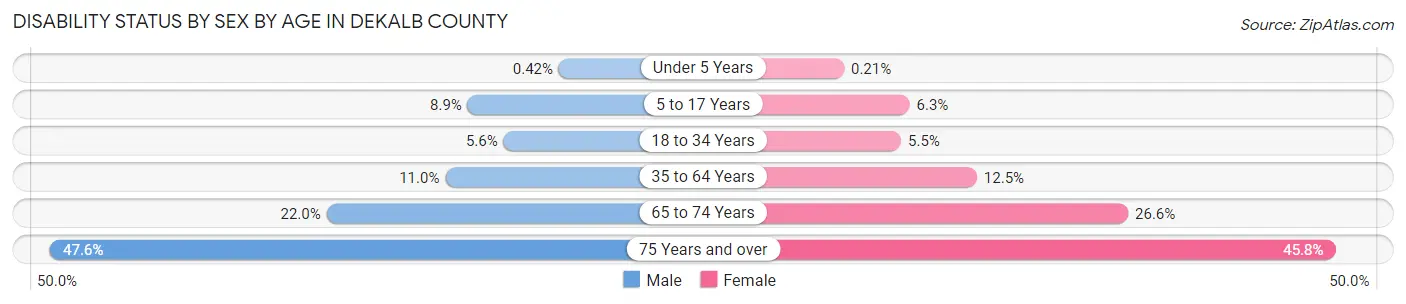
| Age Bracket | Male | Female |
| Under 5 Years | 107 (0.4%) | 52 (0.2%) |
| 5 to 17 Years | 5,530 (8.9%) | 3,787 (6.3%) |
| 18 to 34 Years | 5,039 (5.6%) | 5,439 (5.5%) |
| 35 to 64 Years | 15,324 (11.0%) | 19,497 (12.5%) |
| 65 to 74 Years | 5,830 (22.0%) | 9,367 (26.6%) |
| 75 Years and over | 6,616 (47.6%) | 10,226 (45.8%) |
Disability Class by Sex by Age in DeKalb County
Disability Class: Hearing Difficulty
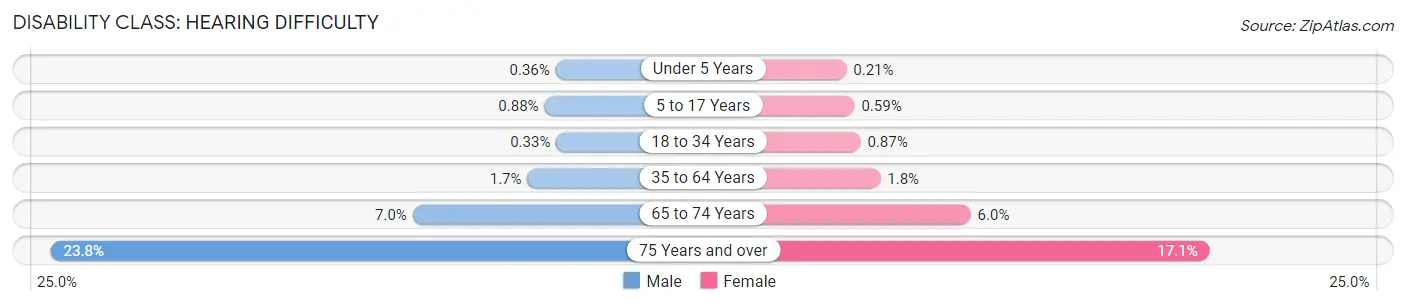
| Age Bracket | Male | Female |
| Under 5 Years | 92 (0.4%) | 52 (0.2%) |
| 5 to 17 Years | 546 (0.9%) | 353 (0.6%) |
| 18 to 34 Years | 297 (0.3%) | 863 (0.9%) |
| 35 to 64 Years | 2,332 (1.7%) | 2,777 (1.8%) |
| 65 to 74 Years | 1,854 (7.0%) | 2,108 (6.0%) |
| 75 Years and over | 3,305 (23.8%) | 3,809 (17.1%) |
Disability Class: Vision Difficulty
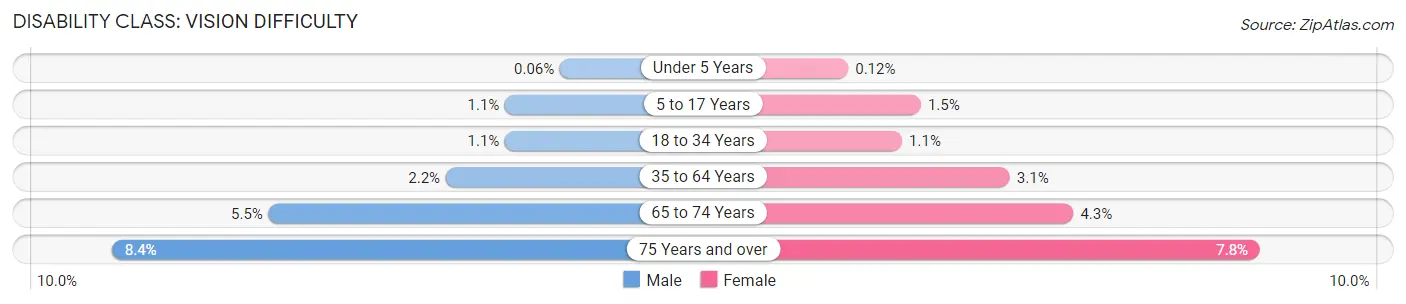
| Age Bracket | Male | Female |
| Under 5 Years | 15 (0.1%) | 29 (0.1%) |
| 5 to 17 Years | 674 (1.1%) | 888 (1.5%) |
| 18 to 34 Years | 984 (1.1%) | 1,107 (1.1%) |
| 35 to 64 Years | 3,052 (2.2%) | 4,847 (3.1%) |
| 65 to 74 Years | 1,451 (5.5%) | 1,517 (4.3%) |
| 75 Years and over | 1,164 (8.4%) | 1,732 (7.8%) |
Disability Class: Cognitive Difficulty
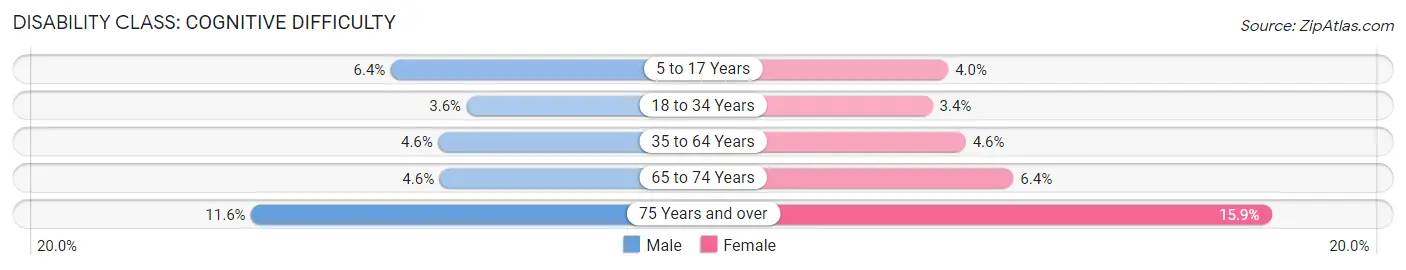
| Age Bracket | Male | Female |
| 5 to 17 Years | 3,983 (6.4%) | 2,379 (4.0%) |
| 18 to 34 Years | 3,248 (3.6%) | 3,335 (3.4%) |
| 35 to 64 Years | 6,482 (4.6%) | 7,148 (4.6%) |
| 65 to 74 Years | 1,215 (4.6%) | 2,244 (6.4%) |
| 75 Years and over | 1,609 (11.6%) | 3,558 (15.9%) |
Disability Class: Ambulatory Difficulty
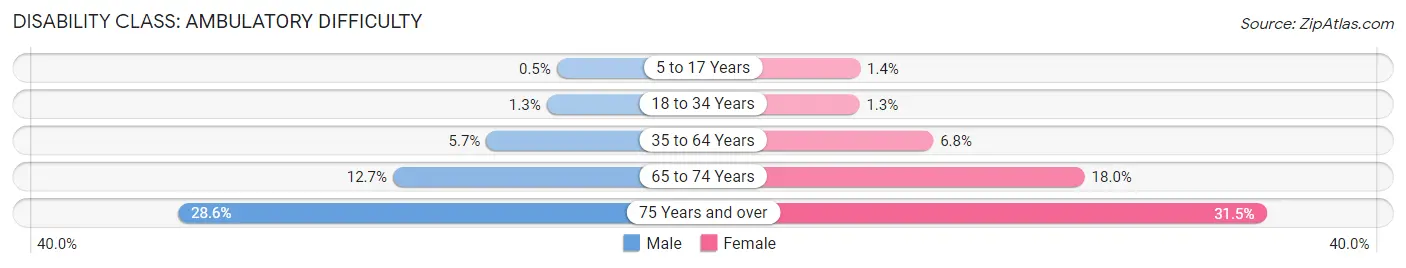
| Age Bracket | Male | Female |
| 5 to 17 Years | 311 (0.5%) | 818 (1.4%) |
| 18 to 34 Years | 1,134 (1.3%) | 1,293 (1.3%) |
| 35 to 64 Years | 8,009 (5.7%) | 10,548 (6.8%) |
| 65 to 74 Years | 3,357 (12.7%) | 6,356 (18.0%) |
| 75 Years and over | 3,972 (28.6%) | 7,035 (31.5%) |
Disability Class: Self-Care Difficulty
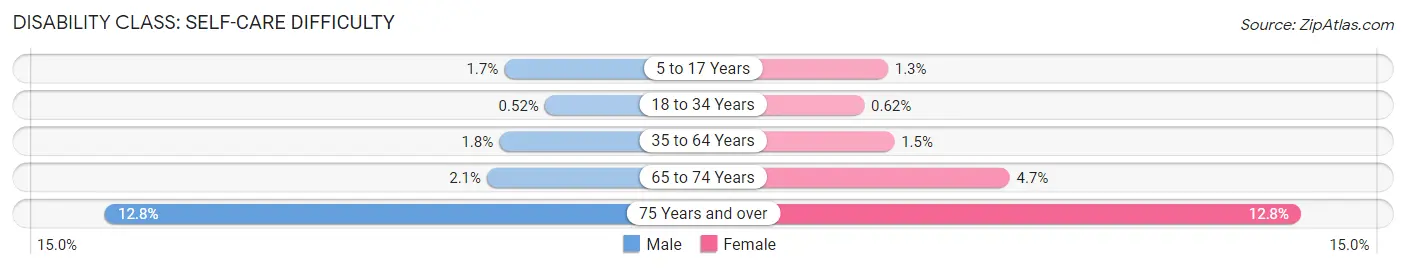
| Age Bracket | Male | Female |
| 5 to 17 Years | 1,030 (1.7%) | 769 (1.3%) |
| 18 to 34 Years | 469 (0.5%) | 613 (0.6%) |
| 35 to 64 Years | 2,497 (1.8%) | 2,269 (1.5%) |
| 65 to 74 Years | 565 (2.1%) | 1,646 (4.7%) |
| 75 Years and over | 1,773 (12.8%) | 2,853 (12.8%) |
Technology Access in DeKalb County
Computing Device Access in DeKalb County
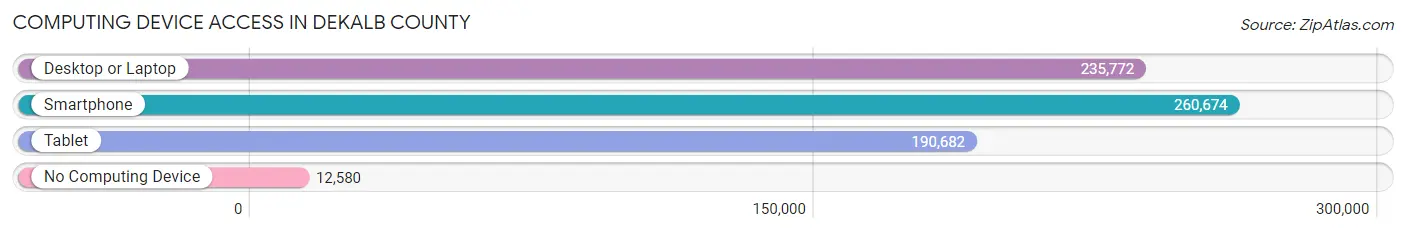
| Device Type | # Households | % Households |
| Desktop or Laptop | 235,772 | 82.8% |
| Smartphone | 260,674 | 91.5% |
| Tablet | 190,682 | 67.0% |
| No Computing Device | 12,580 | 4.4% |
| Total | 284,730 | 100.0% |
Internet Access in DeKalb County
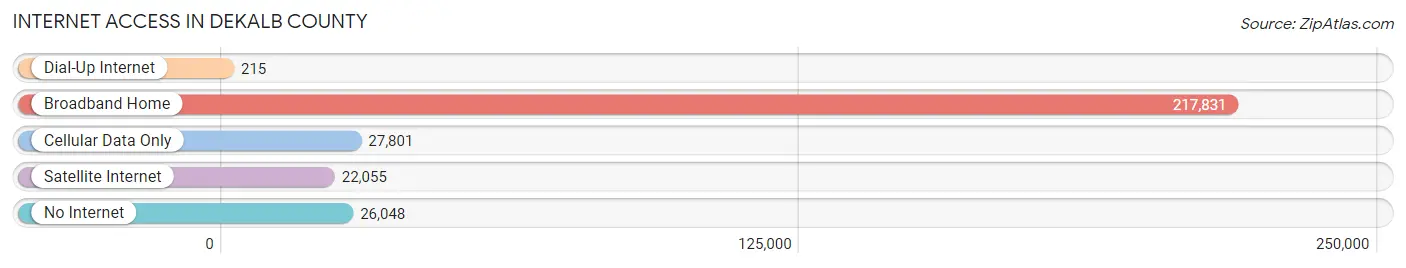
| Internet Type | # Households | % Households |
| Dial-Up Internet | 215 | 0.1% |
| Broadband Home | 217,831 | 76.5% |
| Cellular Data Only | 27,801 | 9.8% |
| Satellite Internet | 22,055 | 7.7% |
| No Internet | 26,048 | 9.1% |
| Total | 284,730 | 100.0% |
DeKalb County Summary
Dekalb County, Georgia is located in the north-central part of the state, just east of Atlanta. It is the third-most populous county in the state, with a population of 741,000 as of 2019. The county seat is Decatur, and the county is home to several cities and towns, including Avondale Estates, Brookhaven, Chamblee, Clarkston, Decatur, Doraville, Dunwoody, Lithonia, Pine Lake, Stone Mountain, and Tucker.
History
Dekalb County was created in 1822 from parts of Henry, Gwinnett, and Fayette counties. It was named after Baron Johann de Kalb, a German-born soldier who fought in the American Revolutionary War. The county was originally rural, with most of its population living in small farming communities.
In the late 19th century, the county began to experience rapid growth due to the development of the Atlanta metropolitan area. The county was home to several major industries, including the General Motors plant in Doraville, which opened in 1947 and closed in 2008.
In the 1960s, the county experienced a period of racial unrest, as the civil rights movement gained momentum. In 1968, the county was the site of the first major civil rights demonstration in the South, when Martin Luther King Jr. led a march from Decatur to Atlanta.
Geography
Dekalb County covers an area of 271 square miles, making it the second-largest county in the state. It is located in the Piedmont region of Georgia, and is bordered by Fulton, Gwinnett, Rockdale, and Henry counties. The county is home to several major rivers, including the Chattahoochee, Yellow, and South Rivers.
The county is home to several parks and recreational areas, including Stone Mountain Park, Arabia Mountain National Heritage Area, and the Chattahoochee River National Recreation Area. The county also contains several historic sites, including the Dekalb History Center, the Avondale Estates Historic District, and the Stone Mountain Confederate Memorial.
Economy
Dekalb County has a diverse economy, with major industries including healthcare, retail, manufacturing, and technology. The county is home to several major employers, including Emory University, Children’s Healthcare of Atlanta, and the Centers for Disease Control and Prevention.
The county is also home to several major shopping centers, including Northlake Mall, Perimeter Mall, and the Mall at Stonecrest. The county is also home to several major corporate headquarters, including Delta Air Lines, The Home Depot, and UPS.
Demographics
As of 2019, the population of Dekalb County was 741,000, making it the third-most populous county in the state. The population is racially and ethnically diverse, with the largest racial groups being African American (54.3%), White (30.2%), and Hispanic or Latino (7.2%).
The median household income in the county is $60,000, and the median home value is $220,000. The county has a poverty rate of 13.3%, and the unemployment rate is 4.2%.
Conclusion
Dekalb County, Georgia is a diverse and vibrant county located in the north-central part of the state. It has a rich history, and is home to several major industries, including healthcare, retail, manufacturing, and technology. The county is also home to several major employers, shopping centers, and corporate headquarters. The population is racially and ethnically diverse, and the median household income is $60,000. Dekalb County is an important part of the Atlanta metropolitan area, and is an attractive place to live and work.
Common Questions
What is the Total Population of DeKalb County?
Total Population of DeKalb County is 761,209.
What is the Total Male Population of DeKalb County?
Total Male Population of DeKalb County is 361,801.
What is the Total Female Population of DeKalb County?
Total Female Population of DeKalb County is 399,408.
What is the Ratio of Males per 100 Females in DeKalb County?
There are 90.58 Males per 100 Females in DeKalb County.
What is the Ratio of Females per 100 Males in DeKalb County?
There are 110.39 Females per 100 Males in DeKalb County.
What is the Median Population Age in DeKalb County?
Median Population Age in DeKalb County is 36.3 Years.
What is the Average Family Size in DeKalb County
Average Family Size in DeKalb County is 3.5 People.
What is the Average Household Size in DeKalb County
Average Household Size in DeKalb County is 2.6 People.
What is Per Capita Income in DeKalb County?
Per Capita income in DeKalb County is $43,958.
What is the Median Family Income in DeKalb County?
Median Family Income in DeKalb County is $97,842.
What is the Median Household income in DeKalb County?
Median Household Income in DeKalb County is $76,044.
What is Income or Wage Gap in DeKalb County?
Income or Wage Gap in DeKalb County is 14.9%.
Women in DeKalb County earn 85.1 cents for every dollar earned by a man.
What is Family Income Deficit in DeKalb County?
Family Income Deficit in DeKalb County is $10,850.
Families that are below poverty line in DeKalb County earn $10,850 less on average than the poverty threshold level.
What is Inequality or Gini Index in DeKalb County?
Inequality or Gini Index in DeKalb County is 0.49.
How Large is the Labor Force in DeKalb County?
There are 415,707 People in the Labor Forcein in DeKalb County.
What is the Percentage of People in the Labor Force in DeKalb County?
68.6% of People are in the Labor Force in DeKalb County.
What is the Unemployment Rate in DeKalb County?
Unemployment Rate in DeKalb County is 6.4%.