Hall County, GA
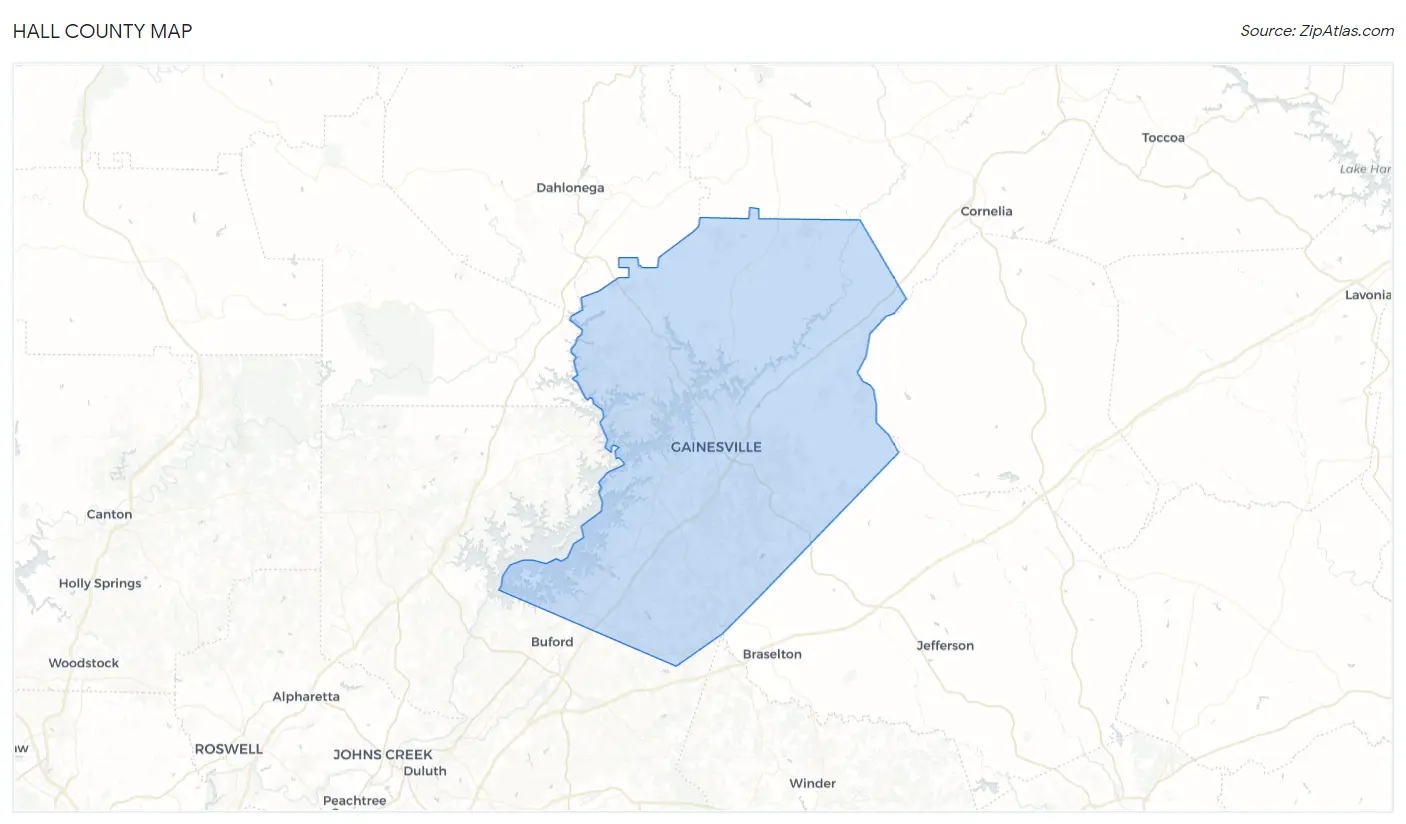
Hall County Map
Hall County Overview
204,953
TOTAL POPULATION
102,512
MALE POPULATION
102,441
FEMALE POPULATION
100.07
MALES / 100 FEMALES
99.93
FEMALES / 100 MALES
37.8
MEDIAN AGE
3.4
AVG FAMILY SIZE
2.9
AVG HOUSEHOLD SIZE
$35,624
PER CAPITA INCOME
$86,127
AVG FAMILY INCOME
$74,153
AVG HOUSEHOLD INCOME
25.3%
WAGE / INCOME GAP [ % ]
74.7¢/ $1
WAGE / INCOME GAP [ $ ]
$11,150
FAMILY INCOME DEFICIT
0.45
INEQUALITY / GINI INDEX
102,737
LABOR FORCE [ PEOPLE ]
63.9%
PERCENT IN LABOR FORCE
3.9%
UNEMPLOYMENT RATE
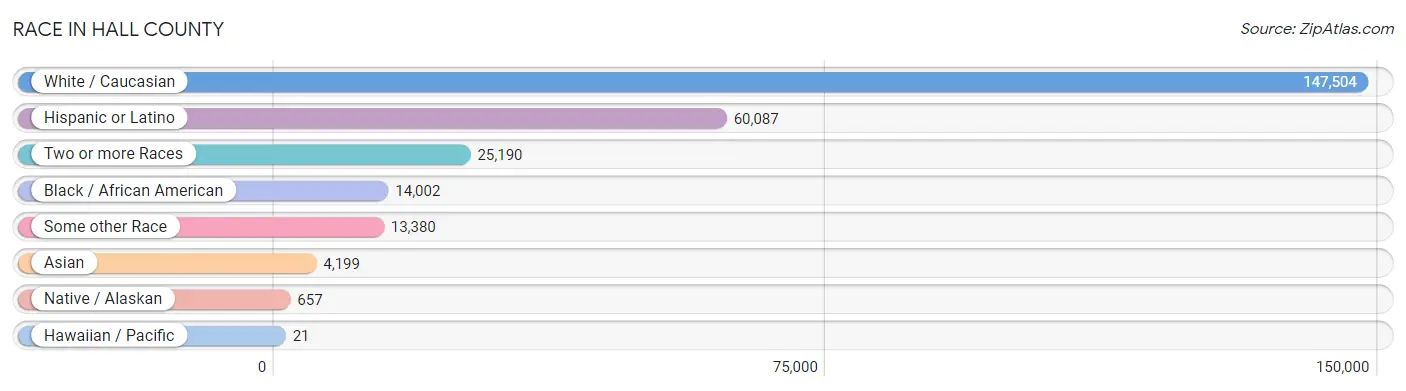
Race in Hall County
The most populous races in Hall County are White / Caucasian (147,504 | 72.0%), Hispanic or Latino (60,087 | 29.3%), and Two or more Races (25,190 | 12.3%).
| Race | # Population | % Population |
| Asian | 4,199 | 2.1% |
| Black / African American | 14,002 | 6.8% |
| Hawaiian / Pacific | 21 | 0.0% |
| Hispanic or Latino | 60,087 | 29.3% |
| Native / Alaskan | 657 | 0.3% |
| White / Caucasian | 147,504 | 72.0% |
| Two or more Races | 25,190 | 12.3% |
| Some other Race | 13,380 | 6.5% |
| Total | 204,953 | 100.0% |
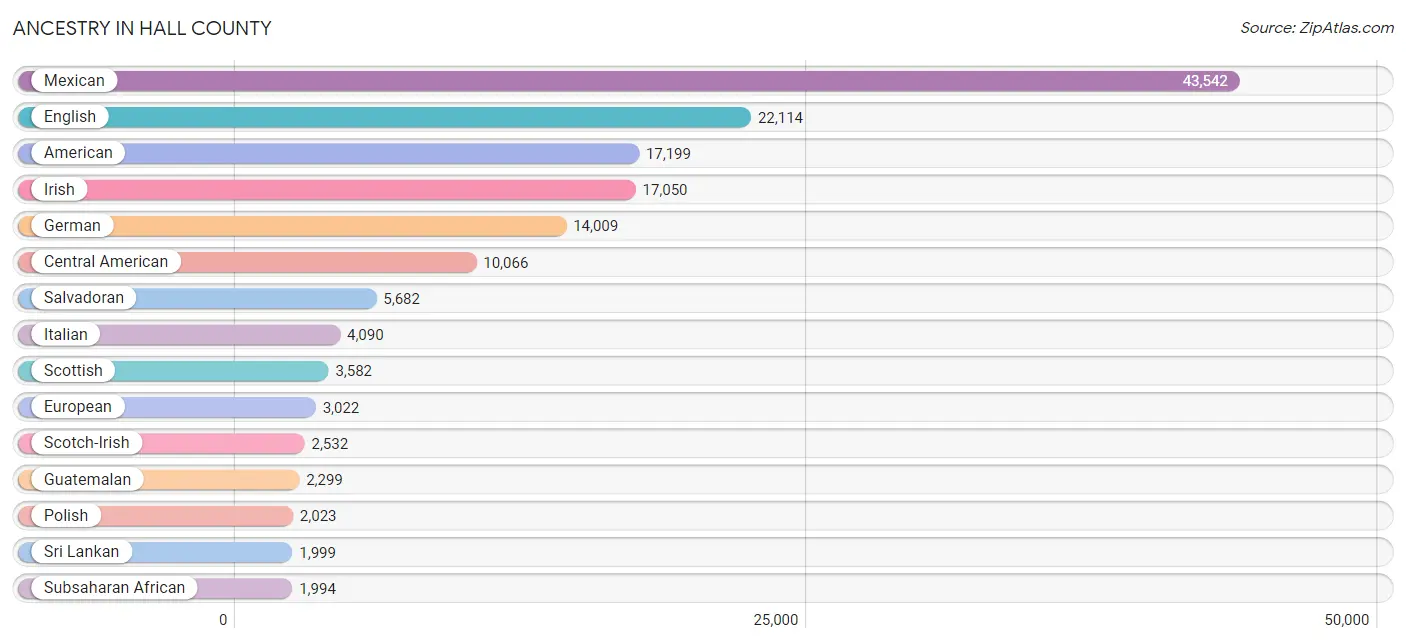
Ancestry in Hall County
The most populous ancestries reported in Hall County are Mexican (43,542 | 21.2%), English (22,114 | 10.8%), American (17,199 | 8.4%), Irish (17,050 | 8.3%), and German (14,009 | 6.8%), together accounting for 55.6% of all Hall County residents.
| Ancestry | # Population | % Population |
| African | 1,642 | 0.8% |
| Albanian | 19 | 0.0% |
| American | 17,199 | 8.4% |
| Apache | 1 | 0.0% |
| Arab | 370 | 0.2% |
| Argentinean | 20 | 0.0% |
| Armenian | 222 | 0.1% |
| Australian | 24 | 0.0% |
| Austrian | 201 | 0.1% |
| Bahamian | 35 | 0.0% |
| Belgian | 72 | 0.0% |
| Belizean | 10 | 0.0% |
| Bhutanese | 207 | 0.1% |
| Brazilian | 188 | 0.1% |
| British | 1,600 | 0.8% |
| British West Indian | 140 | 0.1% |
| Bulgarian | 32 | 0.0% |
| Burmese | 409 | 0.2% |
| Cajun | 6 | 0.0% |
| Canadian | 252 | 0.1% |
| Celtic | 43 | 0.0% |
| Central American | 10,066 | 4.9% |
| Central American Indian | 310 | 0.2% |
| Cherokee | 399 | 0.2% |
| Chilean | 38 | 0.0% |
| Chinese | 36 | 0.0% |
| Chippewa | 9 | 0.0% |
| Choctaw | 21 | 0.0% |
| Colombian | 939 | 0.5% |
| Comanche | 20 | 0.0% |
| Costa Rican | 260 | 0.1% |
| Creek | 97 | 0.1% |
| Croatian | 19 | 0.0% |
| Cuban | 1,216 | 0.6% |
| Czech | 396 | 0.2% |
| Czechoslovakian | 39 | 0.0% |
| Danish | 312 | 0.2% |
| Delaware | 7 | 0.0% |
| Dominican | 897 | 0.4% |
| Dutch | 1,124 | 0.5% |
| Eastern European | 359 | 0.2% |
| Ecuadorian | 76 | 0.0% |
| English | 22,114 | 10.8% |
| Ethiopian | 38 | 0.0% |
| European | 3,022 | 1.5% |
| Filipino | 87 | 0.0% |
| Finnish | 78 | 0.0% |
| French | 1,865 | 0.9% |
| French Canadian | 365 | 0.2% |
| German | 14,009 | 6.8% |
| Ghanaian | 105 | 0.1% |
| Greek | 308 | 0.2% |
| Guamanian / Chamorro | 7 | 0.0% |
| Guatemalan | 2,299 | 1.1% |
| Guyanese | 10 | 0.0% |
| Haitian | 109 | 0.1% |
| Honduran | 1,655 | 0.8% |
| Hungarian | 363 | 0.2% |
| Indian (Asian) | 465 | 0.2% |
| Iranian | 7 | 0.0% |
| Iraqi | 45 | 0.0% |
| Irish | 17,050 | 8.3% |
| Iroquois | 35 | 0.0% |
| Italian | 4,090 | 2.0% |
| Jamaican | 131 | 0.1% |
| Korean | 813 | 0.4% |
| Laotian | 76 | 0.0% |
| Latvian | 7 | 0.0% |
| Lebanese | 90 | 0.0% |
| Lithuanian | 58 | 0.0% |
| Lumbee | 22 | 0.0% |
| Malaysian | 13 | 0.0% |
| Mexican | 43,542 | 21.2% |
| Mexican American Indian | 178 | 0.1% |
| Moroccan | 13 | 0.0% |
| Native Hawaiian | 87 | 0.0% |
| Navajo | 14 | 0.0% |
| Nicaraguan | 120 | 0.1% |
| Nigerian | 18 | 0.0% |
| Northern European | 161 | 0.1% |
| Norwegian | 920 | 0.4% |
| Pakistani | 75 | 0.0% |
| Panamanian | 50 | 0.0% |
| Pennsylvania German | 354 | 0.2% |
| Peruvian | 214 | 0.1% |
| Polish | 2,023 | 1.0% |
| Portuguese | 165 | 0.1% |
| Puerto Rican | 1,681 | 0.8% |
| Romanian | 108 | 0.1% |
| Russian | 476 | 0.2% |
| Salvadoran | 5,682 | 2.8% |
| Samoan | 25 | 0.0% |
| Scandinavian | 227 | 0.1% |
| Scotch-Irish | 2,532 | 1.2% |
| Scottish | 3,582 | 1.8% |
| Serbian | 10 | 0.0% |
| Slavic | 48 | 0.0% |
| Slovak | 161 | 0.1% |
| Slovene | 33 | 0.0% |
| South African | 166 | 0.1% |
| South American | 1,738 | 0.9% |
| Spaniard | 132 | 0.1% |
| Spanish | 79 | 0.0% |
| Sri Lankan | 1,999 | 1.0% |
| Subsaharan African | 1,994 | 1.0% |
| Swedish | 667 | 0.3% |
| Swiss | 251 | 0.1% |
| Syrian | 109 | 0.1% |
| Thai | 736 | 0.4% |
| Tlingit-Haida | 8 | 0.0% |
| Tongan | 26 | 0.0% |
| Trinidadian and Tobagonian | 43 | 0.0% |
| Turkish | 87 | 0.0% |
| Ukrainian | 519 | 0.3% |
| Venezuelan | 451 | 0.2% |
| Vietnamese | 16 | 0.0% |
| Welsh | 680 | 0.3% |
| Yugoslavian | 333 | 0.2% | View All 118 Rows |
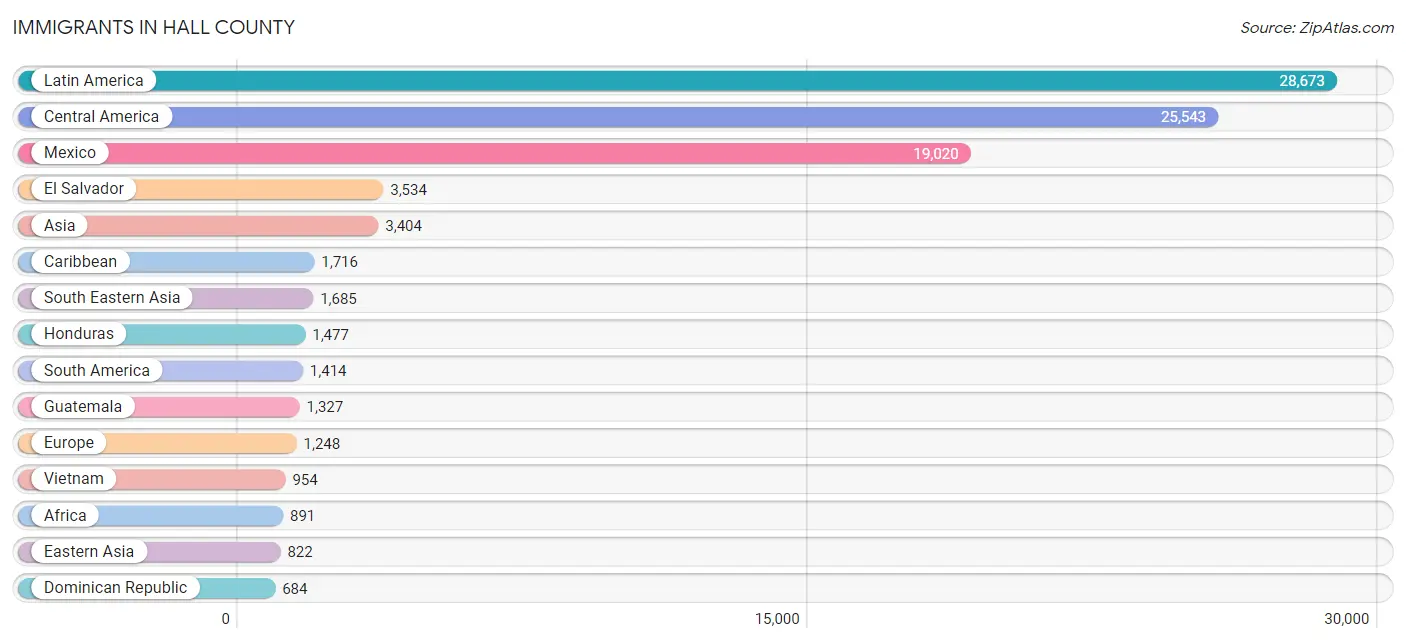
Immigrants in Hall County
The most numerous immigrant groups reported in Hall County came from Latin America (28,673 | 14.0%), Central America (25,543 | 12.5%), Mexico (19,020 | 9.3%), El Salvador (3,534 | 1.7%), and Asia (3,404 | 1.7%), together accounting for 39.1% of all Hall County residents.
| Immigration Origin | # Population | % Population |
| Africa | 891 | 0.4% |
| Albania | 19 | 0.0% |
| Argentina | 20 | 0.0% |
| Asia | 3,404 | 1.7% |
| Australia | 12 | 0.0% |
| Austria | 6 | 0.0% |
| Barbados | 17 | 0.0% |
| Belize | 8 | 0.0% |
| Bosnia and Herzegovina | 200 | 0.1% |
| Brazil | 101 | 0.1% |
| Cameroon | 383 | 0.2% |
| Canada | 330 | 0.2% |
| Caribbean | 1,716 | 0.8% |
| Central America | 25,543 | 12.5% |
| Chile | 38 | 0.0% |
| China | 381 | 0.2% |
| Colombia | 679 | 0.3% |
| Costa Rica | 56 | 0.0% |
| Cuba | 559 | 0.3% |
| Czechoslovakia | 20 | 0.0% |
| Denmark | 11 | 0.0% |
| Dominica | 63 | 0.0% |
| Dominican Republic | 684 | 0.3% |
| Eastern Africa | 38 | 0.0% |
| Eastern Asia | 822 | 0.4% |
| Eastern Europe | 546 | 0.3% |
| Ecuador | 42 | 0.0% |
| El Salvador | 3,534 | 1.7% |
| England | 118 | 0.1% |
| Ethiopia | 38 | 0.0% |
| Europe | 1,248 | 0.6% |
| France | 22 | 0.0% |
| Germany | 254 | 0.1% |
| Ghana | 82 | 0.0% |
| Guatemala | 1,327 | 0.6% |
| Haiti | 85 | 0.0% |
| Honduras | 1,477 | 0.7% |
| Hong Kong | 1 | 0.0% |
| India | 238 | 0.1% |
| Iraq | 47 | 0.0% |
| Ireland | 9 | 0.0% |
| Italy | 34 | 0.0% |
| Jamaica | 185 | 0.1% |
| Japan | 141 | 0.1% |
| Kazakhstan | 9 | 0.0% |
| Korea | 300 | 0.2% |
| Laos | 13 | 0.0% |
| Latin America | 28,673 | 14.0% |
| Liberia | 25 | 0.0% |
| Malaysia | 53 | 0.0% |
| Mexico | 19,020 | 9.3% |
| Middle Africa | 593 | 0.3% |
| Morocco | 13 | 0.0% |
| Nepal | 19 | 0.0% |
| Netherlands | 46 | 0.0% |
| Nicaragua | 81 | 0.0% |
| Nigeria | 14 | 0.0% |
| Northern Africa | 13 | 0.0% |
| Northern Europe | 282 | 0.1% |
| Oceania | 66 | 0.0% |
| Pakistan | 371 | 0.2% |
| Panama | 40 | 0.0% |
| Peru | 129 | 0.1% |
| Philippines | 638 | 0.3% |
| Poland | 59 | 0.0% |
| Portugal | 30 | 0.0% |
| Romania | 48 | 0.0% |
| Russia | 108 | 0.1% |
| Saudi Arabia | 54 | 0.0% |
| Scotland | 17 | 0.0% |
| South Africa | 77 | 0.0% |
| South America | 1,414 | 0.7% |
| South Central Asia | 637 | 0.3% |
| South Eastern Asia | 1,685 | 0.8% |
| Southern Europe | 81 | 0.0% |
| Spain | 17 | 0.0% |
| Sweden | 22 | 0.0% |
| Syria | 134 | 0.1% |
| Taiwan | 92 | 0.0% |
| Thailand | 27 | 0.0% |
| Trinidad and Tobago | 43 | 0.0% |
| Turkey | 22 | 0.0% |
| Ukraine | 92 | 0.0% |
| Venezuela | 405 | 0.2% |
| Vietnam | 954 | 0.5% |
| Western Africa | 170 | 0.1% |
| Western Asia | 260 | 0.1% |
| Western Europe | 328 | 0.2% |
| Zaire | 210 | 0.1% | View All 89 Rows |
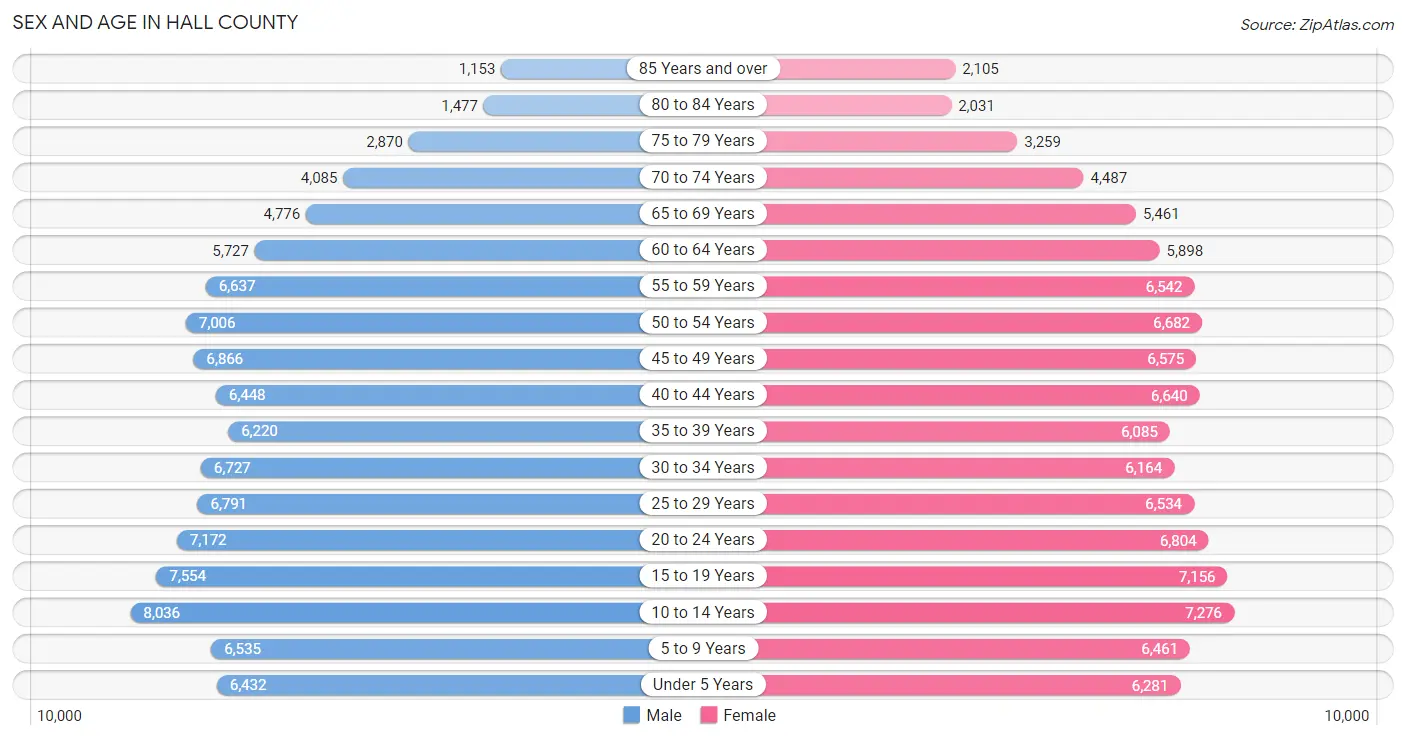
Sex and Age in Hall County
Sex and Age in Hall County
The most populous age groups in Hall County are 10 to 14 Years (8,036 | 7.8%) for men and 10 to 14 Years (7,276 | 7.1%) for women.
| Age Bracket | Male | Female |
| Under 5 Years | 6,432 (6.3%) | 6,281 (6.1%) |
| 5 to 9 Years | 6,535 (6.4%) | 6,461 (6.3%) |
| 10 to 14 Years | 8,036 (7.8%) | 7,276 (7.1%) |
| 15 to 19 Years | 7,554 (7.4%) | 7,156 (7.0%) |
| 20 to 24 Years | 7,172 (7.0%) | 6,804 (6.6%) |
| 25 to 29 Years | 6,791 (6.6%) | 6,534 (6.4%) |
| 30 to 34 Years | 6,727 (6.6%) | 6,164 (6.0%) |
| 35 to 39 Years | 6,220 (6.1%) | 6,085 (5.9%) |
| 40 to 44 Years | 6,448 (6.3%) | 6,640 (6.5%) |
| 45 to 49 Years | 6,866 (6.7%) | 6,575 (6.4%) |
| 50 to 54 Years | 7,006 (6.8%) | 6,682 (6.5%) |
| 55 to 59 Years | 6,637 (6.5%) | 6,542 (6.4%) |
| 60 to 64 Years | 5,727 (5.6%) | 5,898 (5.8%) |
| 65 to 69 Years | 4,776 (4.7%) | 5,461 (5.3%) |
| 70 to 74 Years | 4,085 (4.0%) | 4,487 (4.4%) |
| 75 to 79 Years | 2,870 (2.8%) | 3,259 (3.2%) |
| 80 to 84 Years | 1,477 (1.4%) | 2,031 (2.0%) |
| 85 Years and over | 1,153 (1.1%) | 2,105 (2.1%) |
| Total | 102,512 (100.0%) | 102,441 (100.0%) |
Families and Households in Hall County
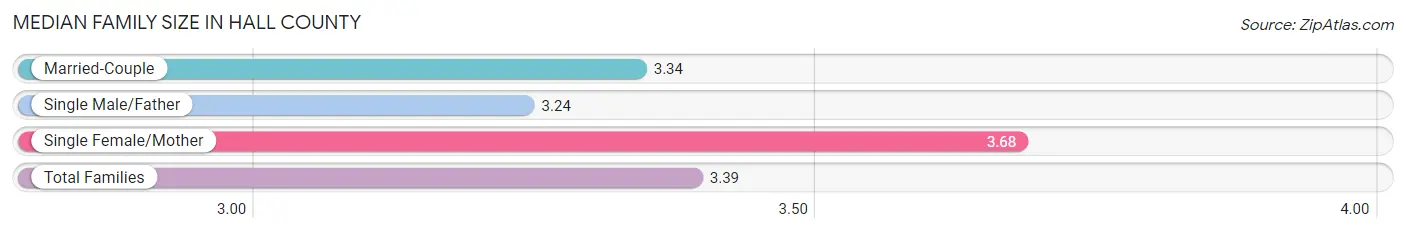
Median Family Size in Hall County
The median family size in Hall County is 3.39 persons per family, with single female/mother families (8,606 | 16.6%) accounting for the largest median family size of 3.68 persons per family. On the other hand, single male/father families (4,350 | 8.4%) represent the smallest median family size with 3.24 persons per family.
| Family Type | # Families | Family Size |
| Married-Couple | 38,783 (75.0%) | 3.34 |
| Single Male/Father | 4,350 (8.4%) | 3.24 |
| Single Female/Mother | 8,606 (16.6%) | 3.68 |
| Total Families | 51,739 (100.0%) | 3.39 |
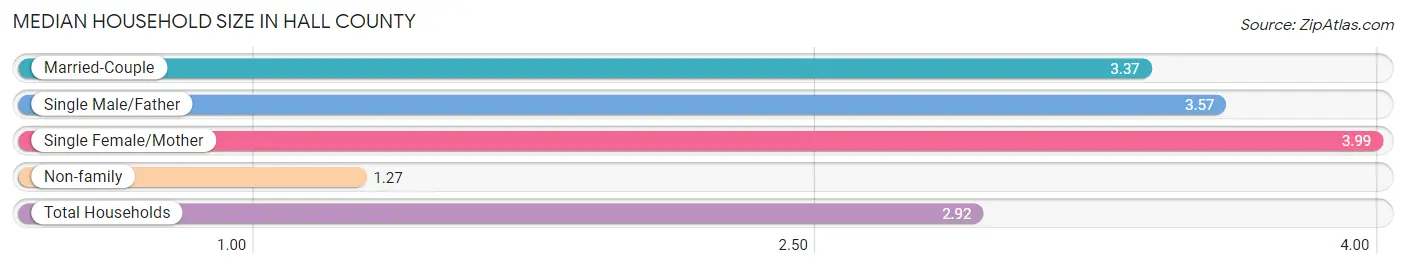
Median Household Size in Hall County
The median household size in Hall County is 2.92 persons per household, with single female/mother households (8,606 | 12.4%) accounting for the largest median household size of 3.99 persons per household. non-family households (17,648 | 25.4%) represent the smallest median household size with 1.27 persons per household.
| Household Type | # Households | Household Size |
| Married-Couple | 38,783 (55.9%) | 3.37 |
| Single Male/Father | 4,350 (6.3%) | 3.57 |
| Single Female/Mother | 8,606 (12.4%) | 3.99 |
| Non-family | 17,648 (25.4%) | 1.27 |
| Total Households | 69,387 (100.0%) | 2.92 |
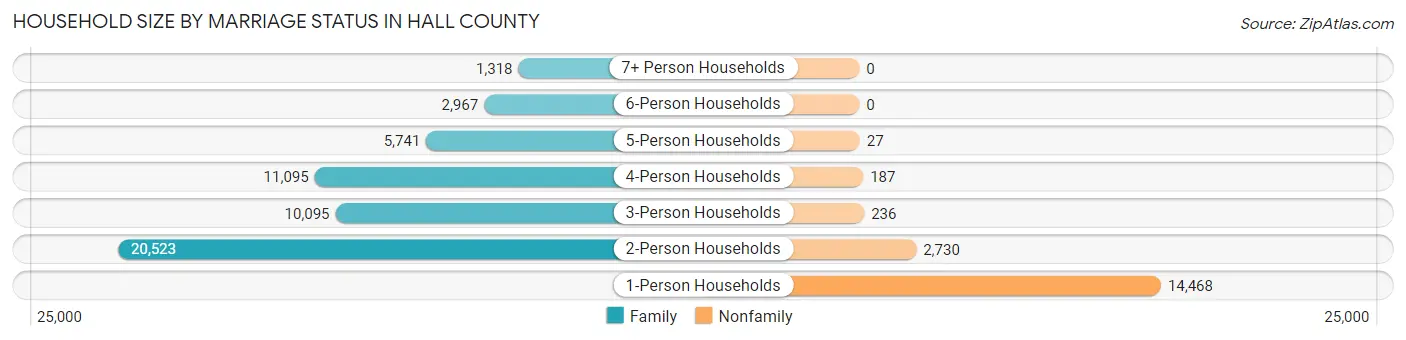
Household Size by Marriage Status in Hall County
Out of a total of 69,387 households in Hall County, 51,739 (74.6%) are family households, while 17,648 (25.4%) are nonfamily households. The most numerous type of family households are 2-person households, comprising 20,523, and the most common type of nonfamily households are 1-person households, comprising 14,468.
| Household Size | Family Households | Nonfamily Households |
| 1-Person Households | - | 14,468 (20.8%) |
| 2-Person Households | 20,523 (29.6%) | 2,730 (3.9%) |
| 3-Person Households | 10,095 (14.5%) | 236 (0.3%) |
| 4-Person Households | 11,095 (16.0%) | 187 (0.3%) |
| 5-Person Households | 5,741 (8.3%) | 27 (0.0%) |
| 6-Person Households | 2,967 (4.3%) | 0 (0.0%) |
| 7+ Person Households | 1,318 (1.9%) | 0 (0.0%) |
| Total | 51,739 (74.6%) | 17,648 (25.4%) |
Female Fertility in Hall County
Fertility by Age in Hall County
Average fertility rate in Hall County is 61.0 births per 1,000 women. Women in the age bracket of 20 to 34 years have the highest fertility rate with 103.0 births per 1,000 women. Women in the age bracket of 20 to 34 years acount for 69.3% of all women with births.
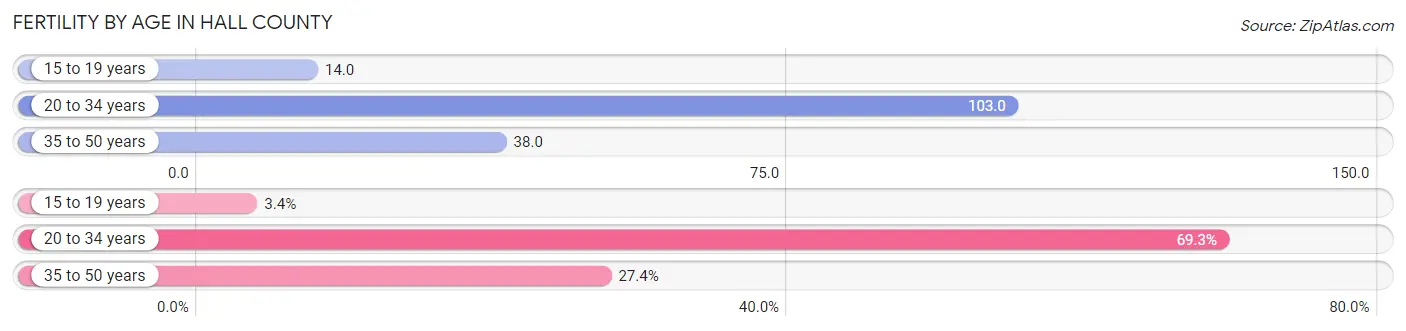
| Age Bracket | Women with Births | Births / 1,000 Women |
| 15 to 19 years | 97 (3.4%) | 14.0 |
| 20 to 34 years | 2,006 (69.3%) | 103.0 |
| 35 to 50 years | 793 (27.4%) | 38.0 |
| Total | 2,896 (100.0%) | 61.0 |
Fertility by Age by Marriage Status in Hall County
76.9% of women with births (2,896) in Hall County are married. The highest percentage of unmarried women with births falls into 15 to 19 years age bracket with 86.6% of them unmarried at the time of birth, while the lowest percentage of unmarried women with births belong to 35 to 50 years age bracket with 13.7% of them unmarried.
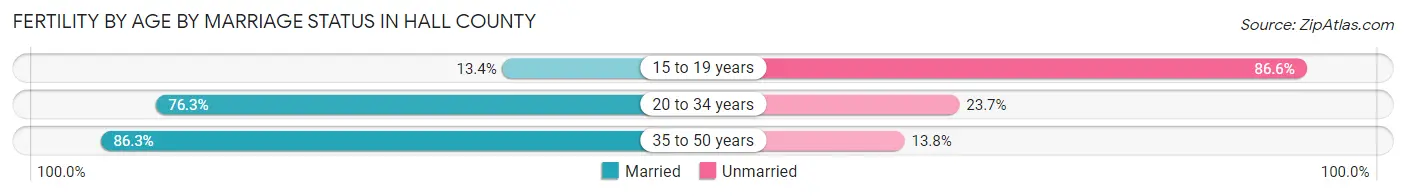
| Age Bracket | Married | Unmarried |
| 15 to 19 years | 13 (13.4%) | 84 (86.6%) |
| 20 to 34 years | 1,531 (76.3%) | 475 (23.7%) |
| 35 to 50 years | 684 (86.3%) | 109 (13.8%) |
| Total | 2,227 (76.9%) | 669 (23.1%) |
Fertility by Education in Hall County
Average fertility rate in Hall County is 61.0 births per 1,000 women. Women with the education attainment of high school diploma have the highest fertility rate of 80.0 births per 1,000 women, while women with the education attainment of less than high school have the lowest fertility at 37.0 births per 1,000 women. Women with the education attainment of high school diploma represent 34.1% of all women with births.
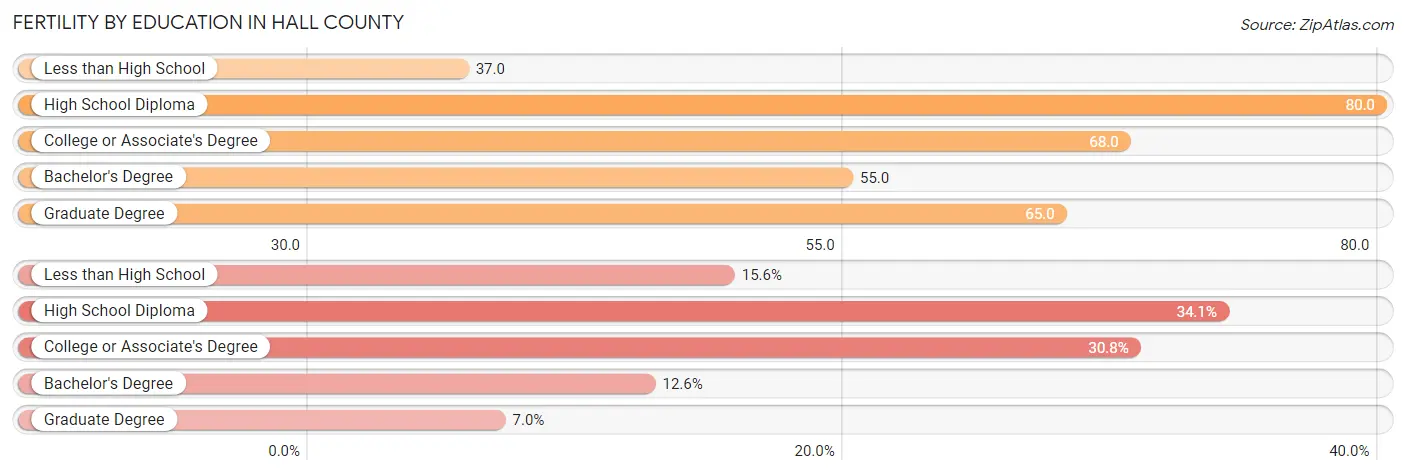
| Educational Attainment | Women with Births | Births / 1,000 Women |
| Less than High School | 451 (15.6%) | 37.0 |
| High School Diploma | 987 (34.1%) | 80.0 |
| College or Associate's Degree | 891 (30.8%) | 68.0 |
| Bachelor's Degree | 365 (12.6%) | 55.0 |
| Graduate Degree | 202 (7.0%) | 65.0 |
| Total | 2,896 (100.0%) | 61.0 |
Fertility by Education by Marriage Status in Hall County
23.1% of women with births in Hall County are unmarried. Women with the educational attainment of graduate degree are most likely to be married with 100.0% of them married at childbirth, while women with the educational attainment of less than high school are least likely to be married with 37.2% of them unmarried at childbirth.
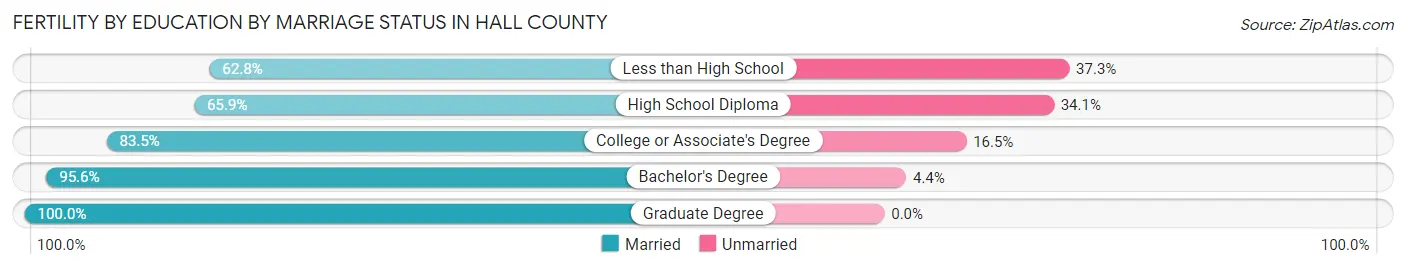
| Educational Attainment | Married | Unmarried |
| Less than High School | 283 (62.7%) | 168 (37.2%) |
| High School Diploma | 650 (65.9%) | 337 (34.1%) |
| College or Associate's Degree | 744 (83.5%) | 147 (16.5%) |
| Bachelor's Degree | 349 (95.6%) | 16 (4.4%) |
| Graduate Degree | 202 (100.0%) | 0 (0.0%) |
| Total | 2,227 (76.9%) | 669 (23.1%) |
Income in Hall County
Income Overview in Hall County
Per Capita Income in Hall County is $35,624, while median incomes of families and households are $86,127 and $74,153 respectively.
| Characteristic | Number | Measure |
| Per Capita Income | 204,953 | $35,624 |
| Median Family Income | 51,739 | $86,127 |
| Mean Family Income | 51,739 | $112,296 |
| Median Household Income | 69,387 | $74,153 |
| Mean Household Income | 69,387 | $101,102 |
| Income Deficit | 51,739 | $11,150 |
| Wage / Income Gap (%) | 204,953 | 25.28% |
| Wage / Income Gap ($) | 204,953 | 74.72¢ per $1 |
| Gini / Inequality Index | 204,953 | 0.45 |
Earnings by Sex in Hall County
Average Earnings in Hall County are $36,970, $42,116 for men and $31,467 for women, a difference of 25.3%.
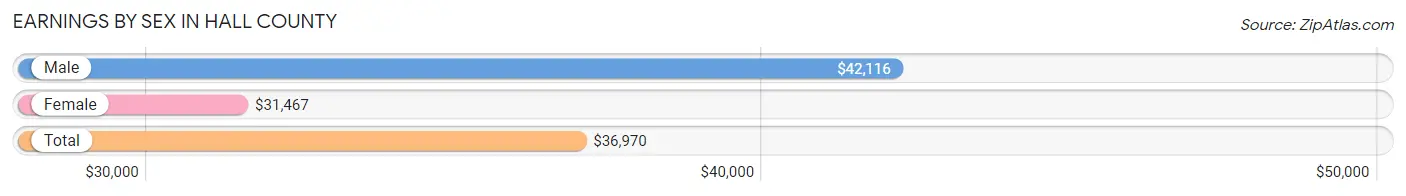
| Sex | Number | Average Earnings |
| Male | 59,137 (55.5%) | $42,116 |
| Female | 47,462 (44.5%) | $31,467 |
| Total | 106,599 (100.0%) | $36,970 |
Earnings by Sex by Income Bracket in Hall County
The most common earnings brackets in Hall County are $100,000+ for men (8,719 | 14.7%) and $25,000 to $29,999 for women (4,797 | 10.1%).
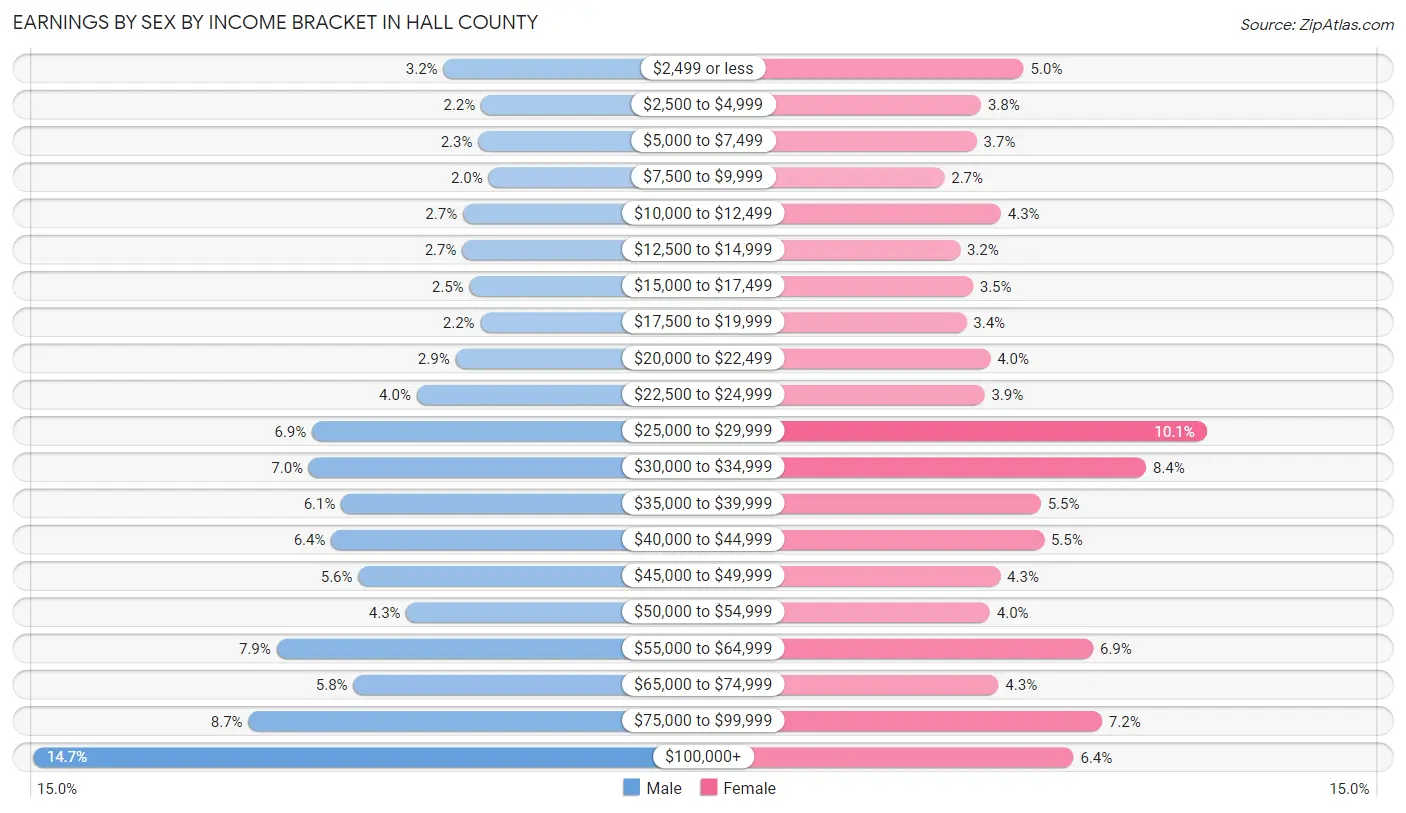
| Income | Male | Female |
| $2,499 or less | 1,911 (3.2%) | 2,361 (5.0%) |
| $2,500 to $4,999 | 1,284 (2.2%) | 1,789 (3.8%) |
| $5,000 to $7,499 | 1,328 (2.2%) | 1,732 (3.6%) |
| $7,500 to $9,999 | 1,158 (2.0%) | 1,301 (2.7%) |
| $10,000 to $12,499 | 1,583 (2.7%) | 2,055 (4.3%) |
| $12,500 to $14,999 | 1,598 (2.7%) | 1,510 (3.2%) |
| $15,000 to $17,499 | 1,479 (2.5%) | 1,680 (3.5%) |
| $17,500 to $19,999 | 1,297 (2.2%) | 1,597 (3.4%) |
| $20,000 to $22,499 | 1,712 (2.9%) | 1,912 (4.0%) |
| $22,500 to $24,999 | 2,353 (4.0%) | 1,835 (3.9%) |
| $25,000 to $29,999 | 4,092 (6.9%) | 4,797 (10.1%) |
| $30,000 to $34,999 | 4,146 (7.0%) | 3,993 (8.4%) |
| $35,000 to $39,999 | 3,610 (6.1%) | 2,585 (5.4%) |
| $40,000 to $44,999 | 3,774 (6.4%) | 2,631 (5.5%) |
| $45,000 to $49,999 | 3,323 (5.6%) | 2,045 (4.3%) |
| $50,000 to $54,999 | 2,526 (4.3%) | 1,909 (4.0%) |
| $55,000 to $64,999 | 4,686 (7.9%) | 3,282 (6.9%) |
| $65,000 to $74,999 | 3,406 (5.8%) | 2,024 (4.3%) |
| $75,000 to $99,999 | 5,152 (8.7%) | 3,402 (7.2%) |
| $100,000+ | 8,719 (14.7%) | 3,022 (6.4%) |
| Total | 59,137 (100.0%) | 47,462 (100.0%) |
Earnings by Sex by Educational Attainment in Hall County
Average earnings in Hall County are $48,258 for men and $35,692 for women, a difference of 26.0%. Men with an educational attainment of graduate degree enjoy the highest average annual earnings of $91,837, while those with less than high school education earn the least with $35,249. Women with an educational attainment of graduate degree earn the most with the average annual earnings of $68,215, while those with less than high school education have the smallest earnings of $27,530.
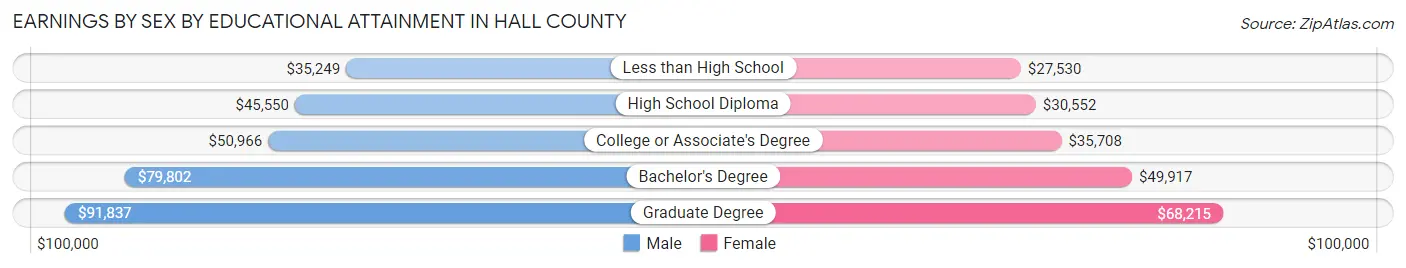
| Educational Attainment | Male Income | Female Income |
| Less than High School | $35,249 | $27,530 |
| High School Diploma | $45,550 | $30,552 |
| College or Associate's Degree | $50,966 | $35,708 |
| Bachelor's Degree | $79,802 | $49,917 |
| Graduate Degree | $91,837 | $68,215 |
| Total | $48,258 | $35,692 |
Family Income in Hall County
Family Income Brackets in Hall County
According to the Hall County family income data, there are 9,986 families falling into the $50,000 to $74,999 income range, which is the most common income bracket and makes up 19.3% of all families. Conversely, the $10,000 to $14,999 income bracket is the least frequent group with only 1,087 families (2.1%) belonging to this category.
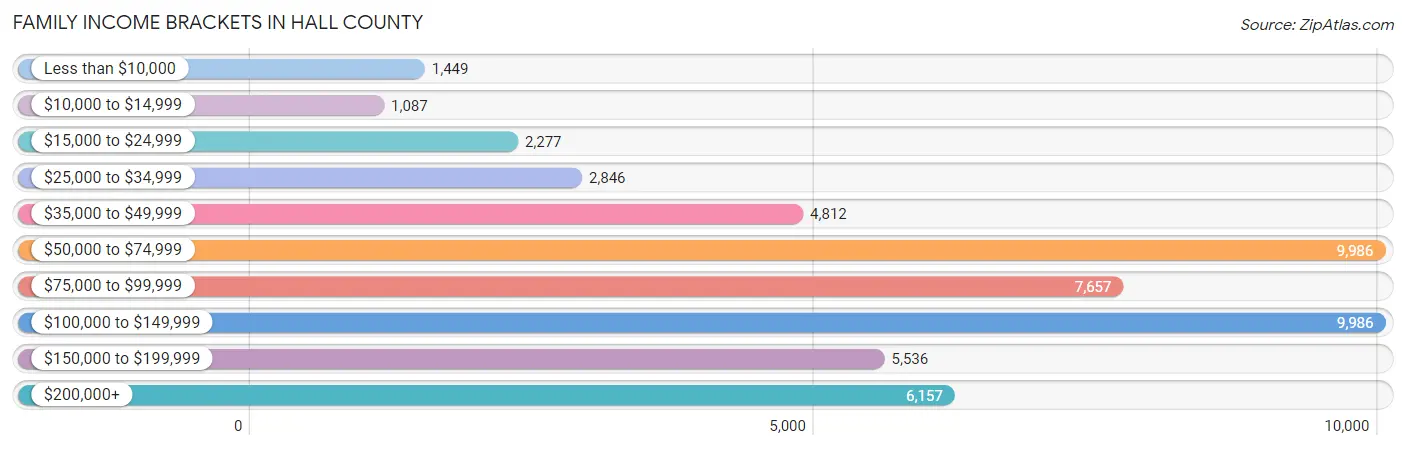
| Income Bracket | # Families | % Families |
| Less than $10,000 | 1,449 | 2.8% |
| $10,000 to $14,999 | 1,087 | 2.1% |
| $15,000 to $24,999 | 2,277 | 4.4% |
| $25,000 to $34,999 | 2,846 | 5.5% |
| $35,000 to $49,999 | 4,812 | 9.3% |
| $50,000 to $74,999 | 9,986 | 19.3% |
| $75,000 to $99,999 | 7,657 | 14.8% |
| $100,000 to $149,999 | 9,986 | 19.3% |
| $150,000 to $199,999 | 5,536 | 10.7% |
| $200,000+ | 6,157 | 11.9% |
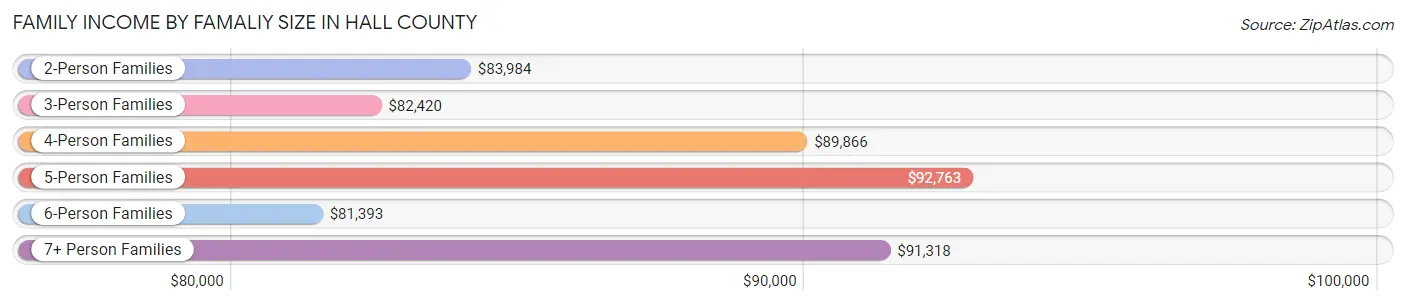
Family Income by Famaliy Size in Hall County
5-person families (5,196 | 10.0%) account for the highest median family income in Hall County with $92,763 per family, while 2-person families (21,980 | 42.5%) have the highest median income of $41,992 per family member.
| Income Bracket | # Families | Median Income |
| 2-Person Families | 21,980 (42.5%) | $83,984 |
| 3-Person Families | 10,006 (19.3%) | $82,420 |
| 4-Person Families | 10,922 (21.1%) | $89,866 |
| 5-Person Families | 5,196 (10.0%) | $92,763 |
| 6-Person Families | 2,477 (4.8%) | $81,393 |
| 7+ Person Families | 1,158 (2.2%) | $91,318 |
| Total | 51,739 (100.0%) | $86,127 |
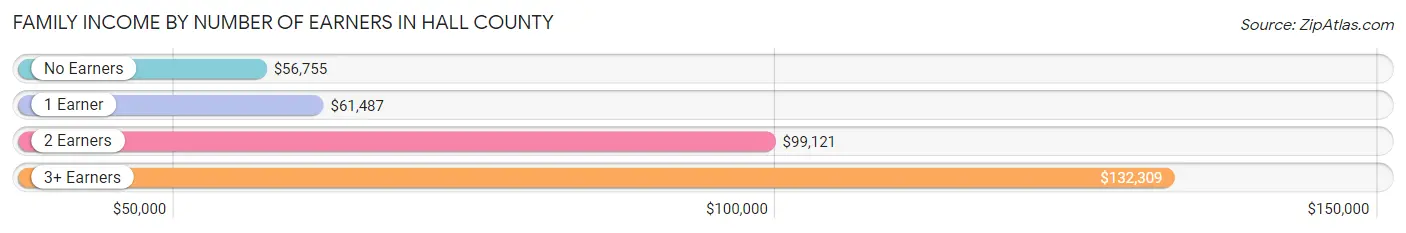
Family Income by Number of Earners in Hall County
The median family income in Hall County is $86,127, with families comprising 3+ earners (7,748) having the highest median family income of $132,309, while families with no earners (7,747) have the lowest median family income of $56,755, accounting for 15.0% and 15.0% of families, respectively.
| Number of Earners | # Families | Median Income |
| No Earners | 7,747 (15.0%) | $56,755 |
| 1 Earner | 15,204 (29.4%) | $61,487 |
| 2 Earners | 21,040 (40.7%) | $99,121 |
| 3+ Earners | 7,748 (15.0%) | $132,309 |
| Total | 51,739 (100.0%) | $86,127 |
Household Income in Hall County
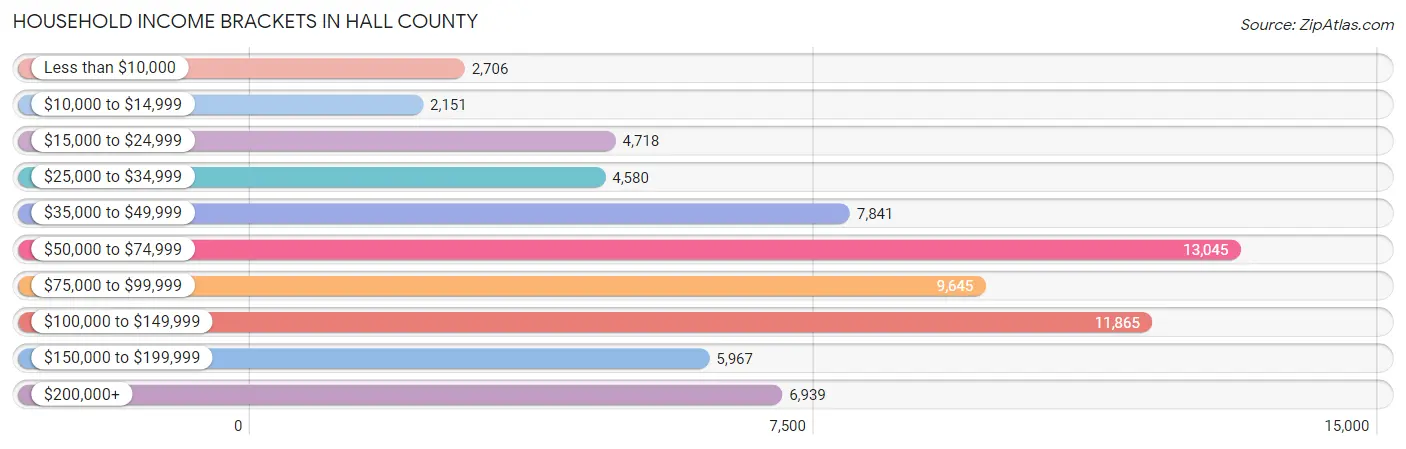
Household Income Brackets in Hall County
With 13,045 households falling in the category, the $50,000 to $74,999 income range is the most frequent in Hall County, accounting for 18.8% of all households. In contrast, only 2,151 households (3.1%) fall into the $10,000 to $14,999 income bracket, making it the least populous group.
| Income Bracket | # Households | % Households |
| Less than $10,000 | 2,706 | 3.9% |
| $10,000 to $14,999 | 2,151 | 3.1% |
| $15,000 to $24,999 | 4,718 | 6.8% |
| $25,000 to $34,999 | 4,580 | 6.6% |
| $35,000 to $49,999 | 7,841 | 11.3% |
| $50,000 to $74,999 | 13,045 | 18.8% |
| $75,000 to $99,999 | 9,645 | 13.9% |
| $100,000 to $149,999 | 11,865 | 17.1% |
| $150,000 to $199,999 | 5,967 | 8.6% |
| $200,000+ | 6,939 | 10.0% |
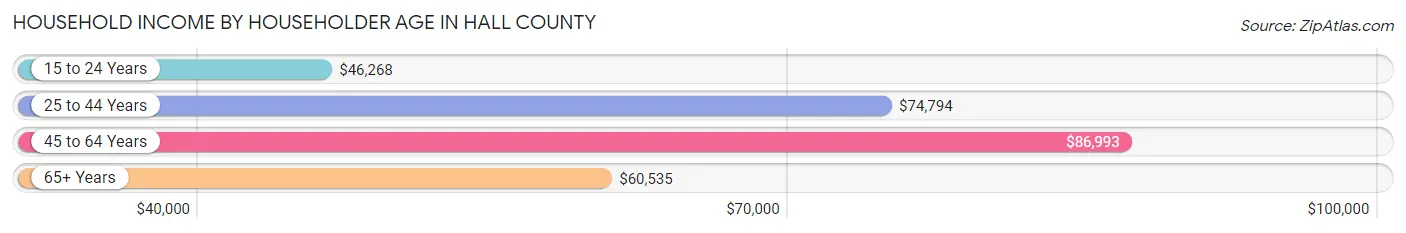
Household Income by Householder Age in Hall County
The median household income in Hall County is $74,153, with the highest median household income of $86,993 found in the 45 to 64 years age bracket for the primary householder. A total of 27,146 households (39.1%) fall into this category. Meanwhile, the 15 to 24 years age bracket for the primary householder has the lowest median household income of $46,268, with 2,432 households (3.5%) in this group.
| Income Bracket | # Households | Median Income |
| 15 to 24 Years | 2,432 (3.5%) | $46,268 |
| 25 to 44 Years | 21,768 (31.4%) | $74,794 |
| 45 to 64 Years | 27,146 (39.1%) | $86,993 |
| 65+ Years | 18,041 (26.0%) | $60,535 |
| Total | 69,387 (100.0%) | $74,153 |
Poverty in Hall County
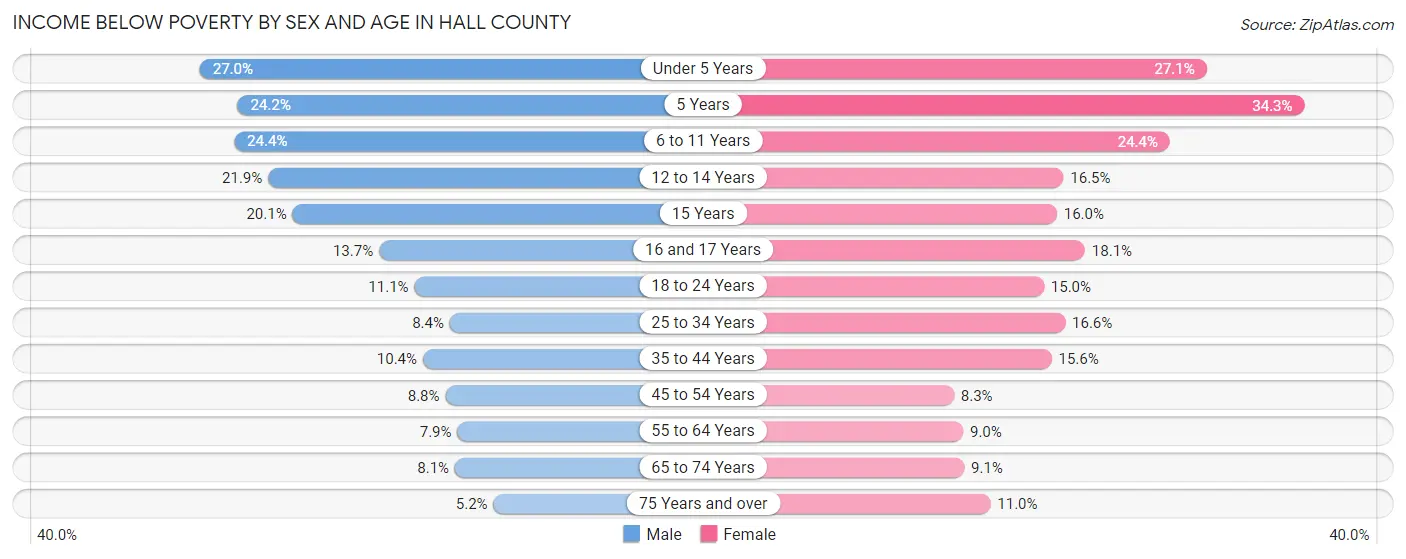
Income Below Poverty by Sex and Age in Hall County
With 12.4% poverty level for males and 14.6% for females among the residents of Hall County, under 5 year old males and 5 year old females are the most vulnerable to poverty, with 1,732 males (27.0%) and 308 females (34.3%) in their respective age groups living below the poverty level.
| Age Bracket | Male | Female |
| Under 5 Years | 1,732 (27.0%) | 1,675 (27.1%) |
| 5 Years | 368 (24.2%) | 308 (34.3%) |
| 6 to 11 Years | 2,075 (24.4%) | 2,037 (24.3%) |
| 12 to 14 Years | 938 (21.9%) | 695 (16.5%) |
| 15 Years | 363 (20.1%) | 214 (16.0%) |
| 16 and 17 Years | 407 (13.7%) | 553 (18.0%) |
| 18 to 24 Years | 1,077 (11.1%) | 1,353 (15.0%) |
| 25 to 34 Years | 1,130 (8.4%) | 2,105 (16.6%) |
| 35 to 44 Years | 1,314 (10.4%) | 1,981 (15.6%) |
| 45 to 54 Years | 1,208 (8.8%) | 1,099 (8.3%) |
| 55 to 64 Years | 969 (7.9%) | 1,117 (9.0%) |
| 65 to 74 Years | 707 (8.1%) | 896 (9.1%) |
| 75 Years and over | 281 (5.2%) | 790 (11.0%) |
| Total | 12,569 (12.4%) | 14,823 (14.6%) |
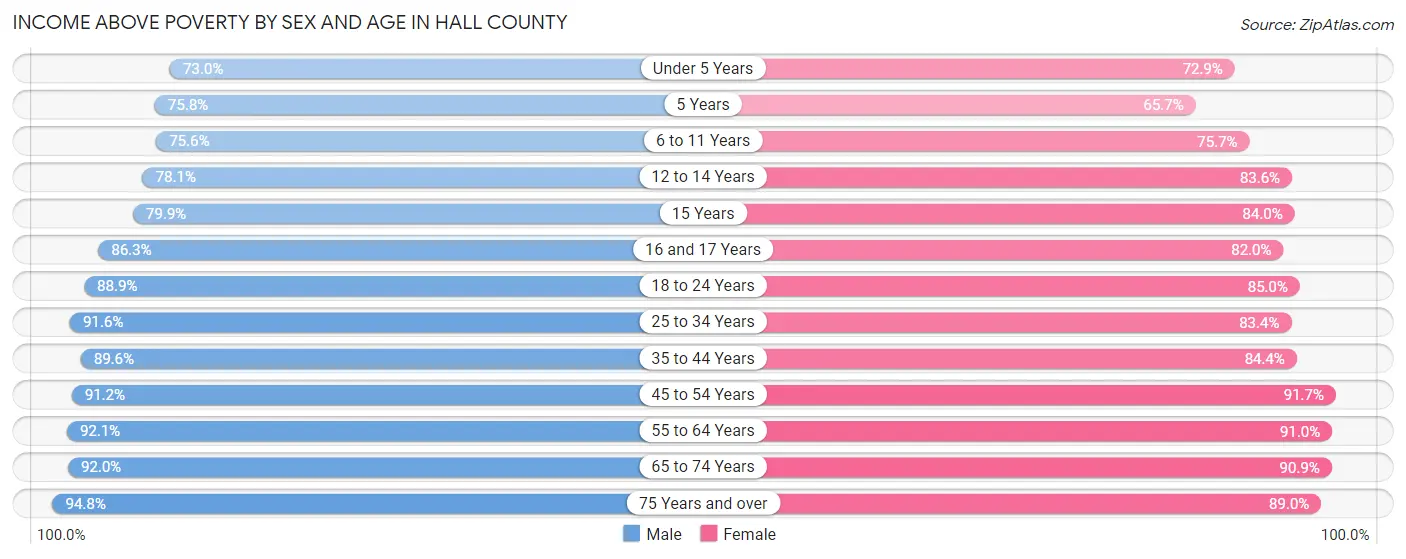
Income Above Poverty by Sex and Age in Hall County
According to the poverty statistics in Hall County, males aged 75 years and over and females aged 45 to 54 years are the age groups that are most secure financially, with 94.8% of males and 91.7% of females in these age groups living above the poverty line.
| Age Bracket | Male | Female |
| Under 5 Years | 4,685 (73.0%) | 4,510 (72.9%) |
| 5 Years | 1,153 (75.8%) | 589 (65.7%) |
| 6 to 11 Years | 6,415 (75.6%) | 6,330 (75.6%) |
| 12 to 14 Years | 3,342 (78.1%) | 3,530 (83.6%) |
| 15 Years | 1,442 (79.9%) | 1,127 (84.0%) |
| 16 and 17 Years | 2,566 (86.3%) | 2,511 (82.0%) |
| 18 to 24 Years | 8,661 (88.9%) | 7,670 (85.0%) |
| 25 to 34 Years | 12,277 (91.6%) | 10,593 (83.4%) |
| 35 to 44 Years | 11,282 (89.6%) | 10,744 (84.4%) |
| 45 to 54 Years | 12,587 (91.2%) | 12,105 (91.7%) |
| 55 to 64 Years | 11,349 (92.1%) | 11,298 (91.0%) |
| 65 to 74 Years | 8,081 (91.9%) | 8,967 (90.9%) |
| 75 Years and over | 5,135 (94.8%) | 6,370 (89.0%) |
| Total | 88,975 (87.6%) | 86,344 (85.4%) |
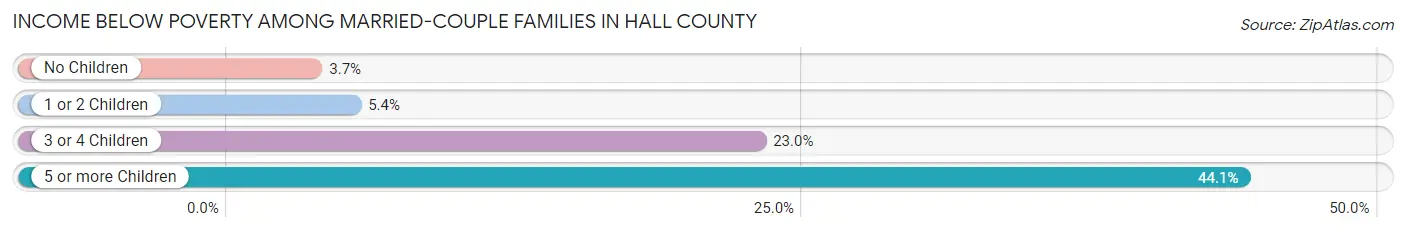
Income Below Poverty Among Married-Couple Families in Hall County
The poverty statistics for married-couple families in Hall County show that 6.3% or 2,448 of the total 38,783 families live below the poverty line. Families with 5 or more children have the highest poverty rate of 44.1%, comprising of 100 families. On the other hand, families with no children have the lowest poverty rate of 3.7%, which includes 810 families.
| Children | Above Poverty | Below Poverty |
| No Children | 21,245 (96.3%) | 810 (3.7%) |
| 1 or 2 Children | 12,105 (94.6%) | 685 (5.4%) |
| 3 or 4 Children | 2,858 (77.0%) | 853 (23.0%) |
| 5 or more Children | 127 (55.9%) | 100 (44.1%) |
| Total | 36,335 (93.7%) | 2,448 (6.3%) |
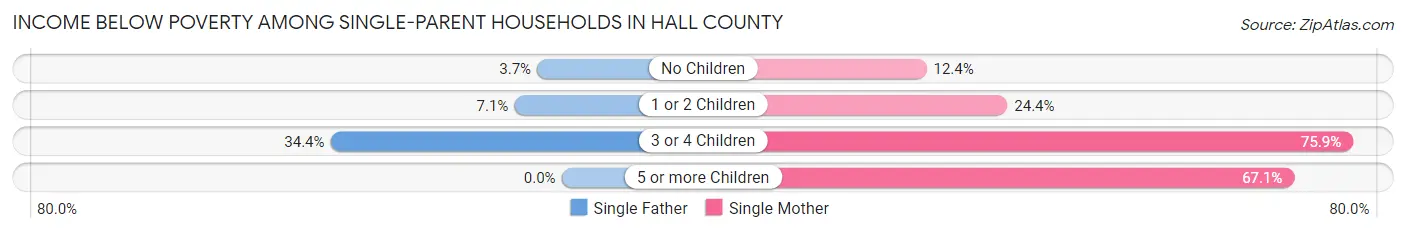
Income Below Poverty Among Single-Parent Households in Hall County
According to the poverty data in Hall County, 8.4% or 365 single-father households and 28.5% or 2,452 single-mother households are living below the poverty line. Among single-father households, those with 3 or 4 children have the highest poverty rate, with 156 households (34.4%) experiencing poverty. Likewise, among single-mother households, those with 3 or 4 children have the highest poverty rate, with 901 households (75.9%) falling below the poverty line.
| Children | Single Father | Single Mother |
| No Children | 71 (3.7%) | 392 (12.3%) |
| 1 or 2 Children | 138 (7.0%) | 965 (24.4%) |
| 3 or 4 Children | 156 (34.4%) | 901 (75.9%) |
| 5 or more Children | 0 (0.0%) | 194 (67.1%) |
| Total | 365 (8.4%) | 2,452 (28.5%) |
Income Below Poverty Among Married-Couple vs Single-Parent Households in Hall County
The poverty data for Hall County shows that 2,448 of the married-couple family households (6.3%) and 2,817 of the single-parent households (21.7%) are living below the poverty level. Within the married-couple family households, those with 5 or more children have the highest poverty rate, with 100 households (44.1%) falling below the poverty line. Among the single-parent households, those with 5 or more children have the highest poverty rate, with 194 household (67.1%) living below poverty.
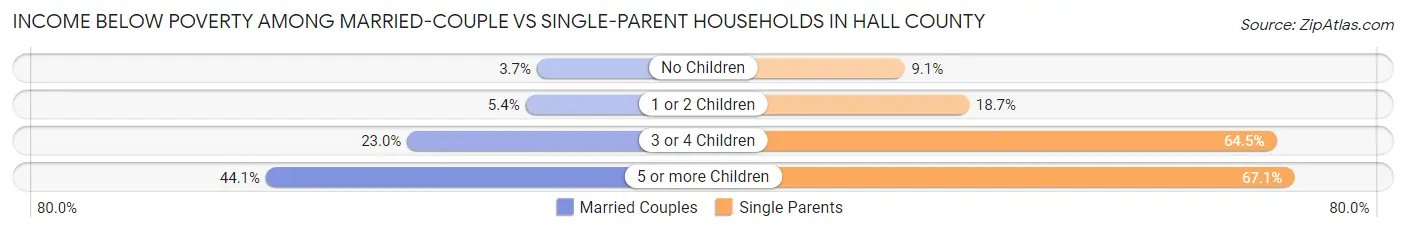
| Children | Married-Couple Families | Single-Parent Households |
| No Children | 810 (3.7%) | 463 (9.1%) |
| 1 or 2 Children | 685 (5.4%) | 1,103 (18.6%) |
| 3 or 4 Children | 853 (23.0%) | 1,057 (64.4%) |
| 5 or more Children | 100 (44.1%) | 194 (67.1%) |
| Total | 2,448 (6.3%) | 2,817 (21.7%) |
Employment Characteristics in Hall County
Employment by Class of Employer in Hall County
Among the 97,489 employed individuals in Hall County, private company employees (71,263 | 73.1%), self-employed (not incorporated) (6,316 | 6.5%), and local government employees (6,164 | 6.3%) make up the most common classes of employment.
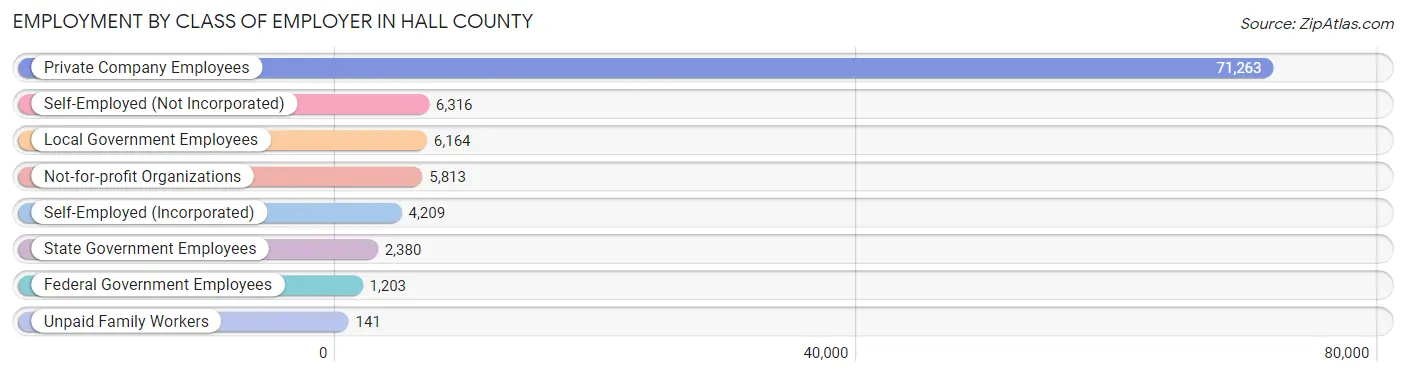
| Employer Class | # Employees | % Employees |
| Private Company Employees | 71,263 | 73.1% |
| Self-Employed (Incorporated) | 4,209 | 4.3% |
| Self-Employed (Not Incorporated) | 6,316 | 6.5% |
| Not-for-profit Organizations | 5,813 | 6.0% |
| Local Government Employees | 6,164 | 6.3% |
| State Government Employees | 2,380 | 2.4% |
| Federal Government Employees | 1,203 | 1.2% |
| Unpaid Family Workers | 141 | 0.1% |
| Total | 97,489 | 100.0% |
Employment Status by Age in Hall County
According to the labor force statistics for Hall County, out of the total population over 16 years of age (160,778), 63.9% or 102,737 individuals are in the labor force, with 3.9% or 4,007 of them unemployed. The age group with the highest labor force participation rate is 25 to 29 years, with 82.8% or 11,033 individuals in the labor force. Within the labor force, the 16 to 19 years age range has the highest percentage of unemployed individuals, with 9.7% or 503 of them being unemployed.
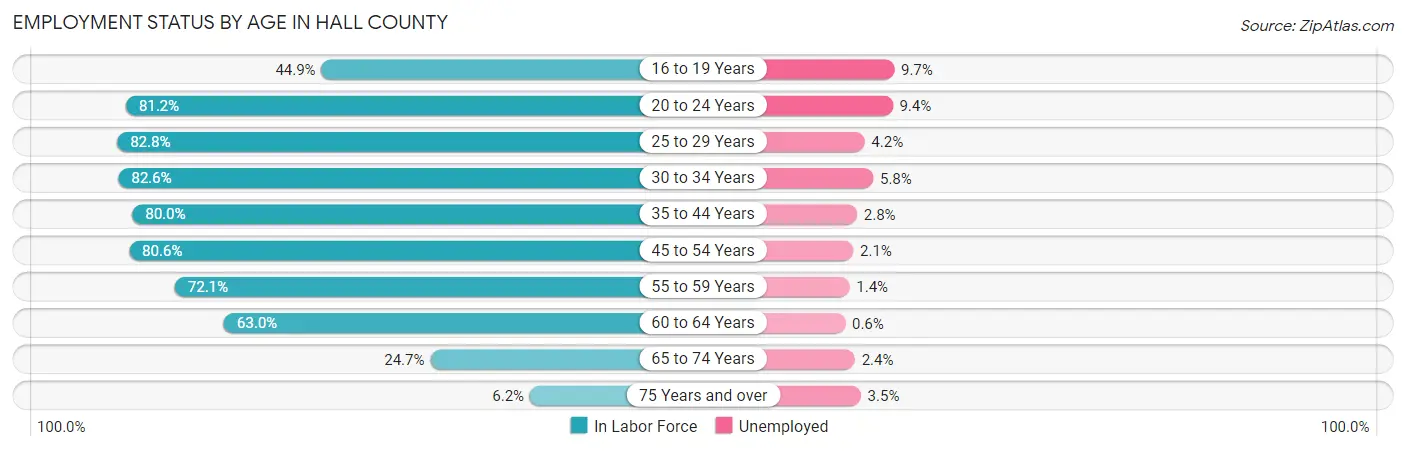
| Age Bracket | In Labor Force | Unemployed |
| 16 to 19 Years | 5,189 (44.9%) | 503 (9.7%) |
| 20 to 24 Years | 11,349 (81.2%) | 1,067 (9.4%) |
| 25 to 29 Years | 11,033 (82.8%) | 463 (4.2%) |
| 30 to 34 Years | 10,648 (82.6%) | 618 (5.8%) |
| 35 to 44 Years | 20,314 (80.0%) | 569 (2.8%) |
| 45 to 54 Years | 21,866 (80.6%) | 459 (2.1%) |
| 55 to 59 Years | 9,502 (72.1%) | 133 (1.4%) |
| 60 to 64 Years | 7,324 (63.0%) | 44 (0.6%) |
| 65 to 74 Years | 4,646 (24.7%) | 112 (2.4%) |
| 75 Years and over | 799 (6.2%) | 28 (3.5%) |
| Total | 102,737 (63.9%) | 4,007 (3.9%) |
Employment Status by Educational Attainment in Hall County
According to labor force statistics for Hall County, 77.9% of individuals (80,659) out of the total population between 25 and 64 years of age (103,542) are in the labor force, with 2.8% or 2,258 of them being unemployed. The group with the highest labor force participation rate are those with the educational attainment of bachelor's degree or higher, with 85.5% or 21,506 individuals in the labor force. Within the labor force, individuals with high school diploma education have the highest percentage of unemployment, with 3.3% or 719 of them being unemployed.
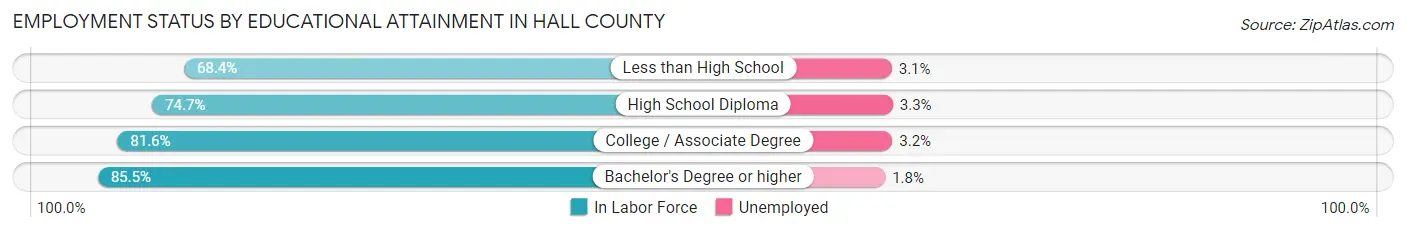
| Educational Attainment | In Labor Force | Unemployed |
| Less than High School | 14,192 (68.4%) | 643 (3.1%) |
| High School Diploma | 21,781 (74.7%) | 962 (3.3%) |
| College / Associate Degree | 23,242 (81.6%) | 911 (3.2%) |
| Bachelor's Degree or higher | 21,506 (85.5%) | 453 (1.8%) |
| Total | 80,659 (77.9%) | 2,899 (2.8%) |
Employment Occupations by Sex in Hall County
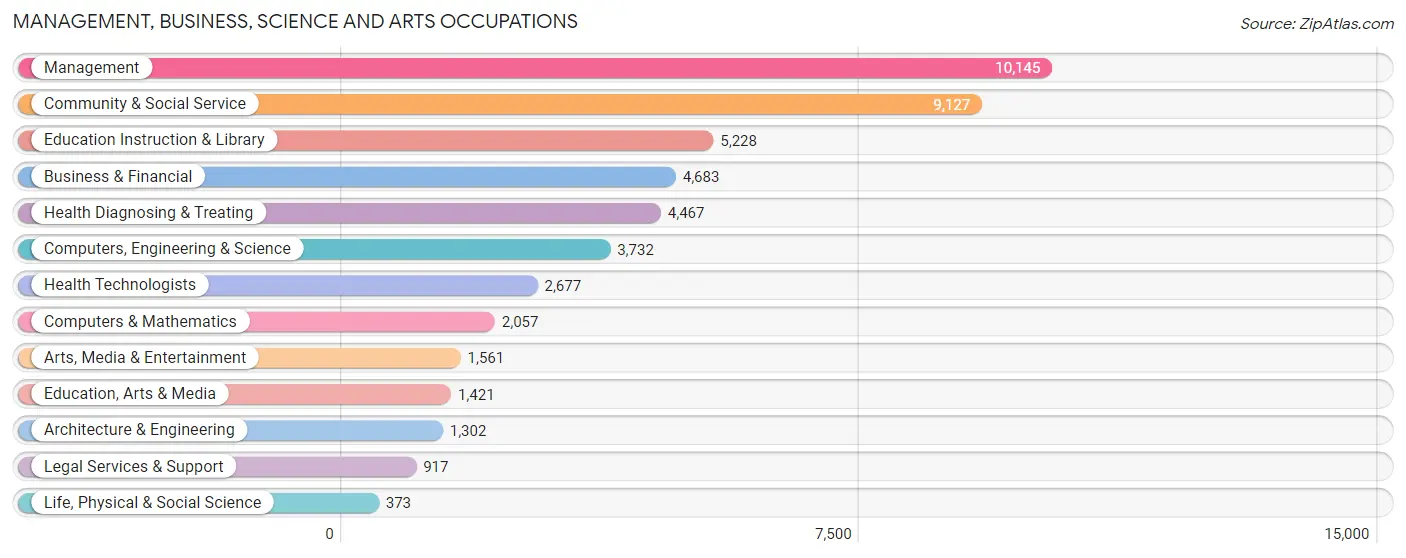
Management, Business, Science and Arts Occupations
The most common Management, Business, Science and Arts occupations in Hall County are Management (10,145 | 10.3%), Community & Social Service (9,127 | 9.3%), Education Instruction & Library (5,228 | 5.3%), Business & Financial (4,683 | 4.8%), and Health Diagnosing & Treating (4,467 | 4.5%).
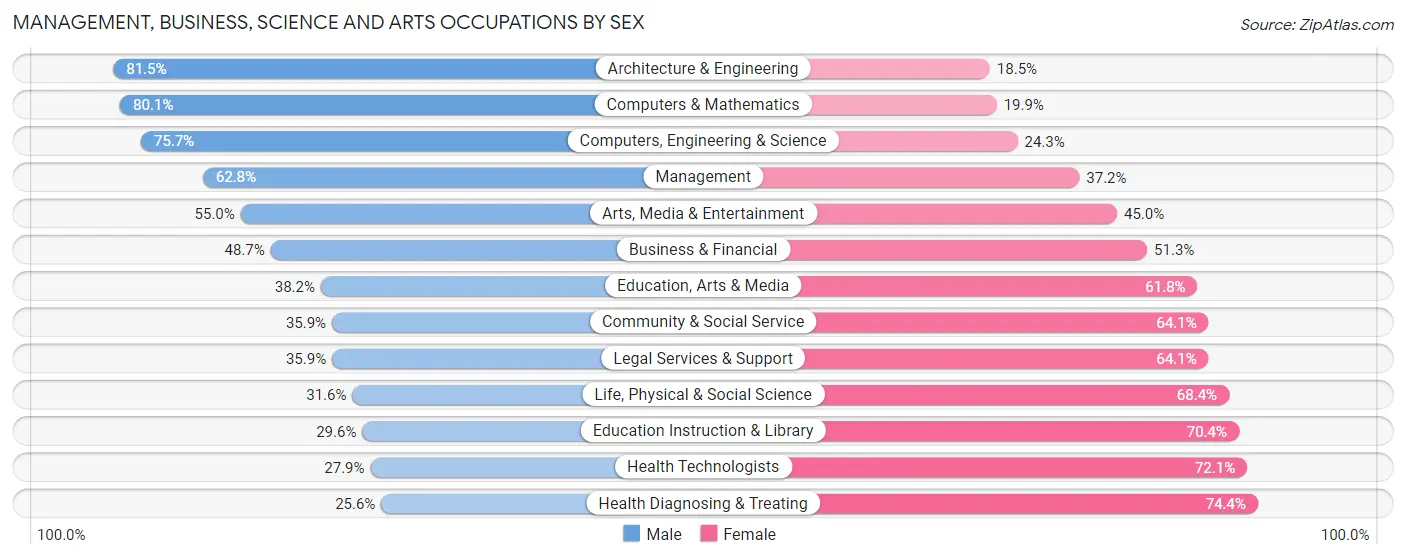
Management, Business, Science and Arts Occupations by Sex
Within the Management, Business, Science and Arts occupations in Hall County, the most male-oriented occupations are Architecture & Engineering (81.5%), Computers & Mathematics (80.1%), and Computers, Engineering & Science (75.7%), while the most female-oriented occupations are Health Diagnosing & Treating (74.4%), Health Technologists (72.1%), and Education Instruction & Library (70.4%).
| Occupation | Male | Female |
| Management | 6,374 (62.8%) | 3,771 (37.2%) |
| Business & Financial | 2,280 (48.7%) | 2,403 (51.3%) |
| Computers, Engineering & Science | 2,826 (75.7%) | 906 (24.3%) |
| Computers & Mathematics | 1,647 (80.1%) | 410 (19.9%) |
| Architecture & Engineering | 1,061 (81.5%) | 241 (18.5%) |
| Life, Physical & Social Science | 118 (31.6%) | 255 (68.4%) |
| Community & Social Service | 3,276 (35.9%) | 5,851 (64.1%) |
| Education, Arts & Media | 543 (38.2%) | 878 (61.8%) |
| Legal Services & Support | 329 (35.9%) | 588 (64.1%) |
| Education Instruction & Library | 1,546 (29.6%) | 3,682 (70.4%) |
| Arts, Media & Entertainment | 858 (55.0%) | 703 (45.0%) |
| Health Diagnosing & Treating | 1,144 (25.6%) | 3,323 (74.4%) |
| Health Technologists | 746 (27.9%) | 1,931 (72.1%) |
| Total (Category) | 15,900 (49.4%) | 16,254 (50.5%) |
| Total (Overall) | 54,954 (55.8%) | 43,608 (44.2%) |
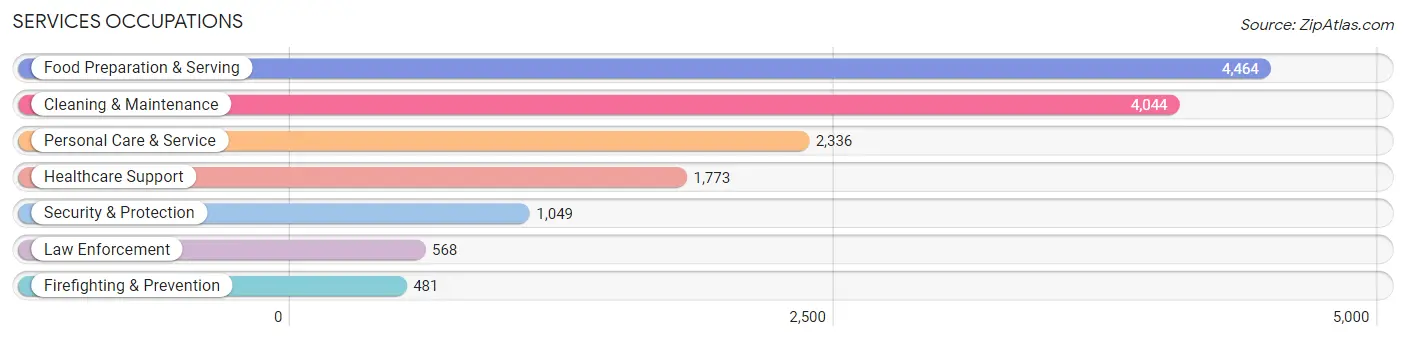
Services Occupations
The most common Services occupations in Hall County are Food Preparation & Serving (4,464 | 4.5%), Cleaning & Maintenance (4,044 | 4.1%), Personal Care & Service (2,336 | 2.4%), Healthcare Support (1,773 | 1.8%), and Security & Protection (1,049 | 1.1%).
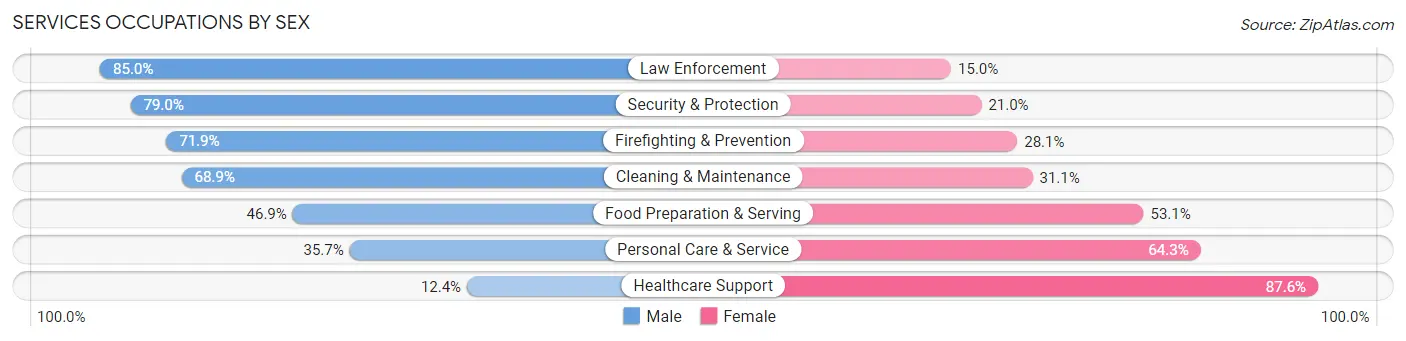
Services Occupations by Sex
Within the Services occupations in Hall County, the most male-oriented occupations are Law Enforcement (85.0%), Security & Protection (79.0%), and Firefighting & Prevention (71.9%), while the most female-oriented occupations are Healthcare Support (87.6%), Personal Care & Service (64.3%), and Food Preparation & Serving (53.1%).
| Occupation | Male | Female |
| Healthcare Support | 220 (12.4%) | 1,553 (87.6%) |
| Security & Protection | 829 (79.0%) | 220 (21.0%) |
| Firefighting & Prevention | 346 (71.9%) | 135 (28.1%) |
| Law Enforcement | 483 (85.0%) | 85 (15.0%) |
| Food Preparation & Serving | 2,095 (46.9%) | 2,369 (53.1%) |
| Cleaning & Maintenance | 2,787 (68.9%) | 1,257 (31.1%) |
| Personal Care & Service | 833 (35.7%) | 1,503 (64.3%) |
| Total (Category) | 6,764 (49.5%) | 6,902 (50.5%) |
| Total (Overall) | 54,954 (55.8%) | 43,608 (44.2%) |
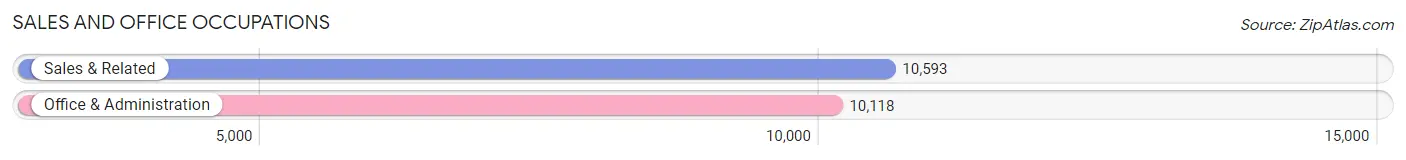
Sales and Office Occupations
The most common Sales and Office occupations in Hall County are Sales & Related (10,593 | 10.7%), and Office & Administration (10,118 | 10.3%).
Sales and Office Occupations by Sex
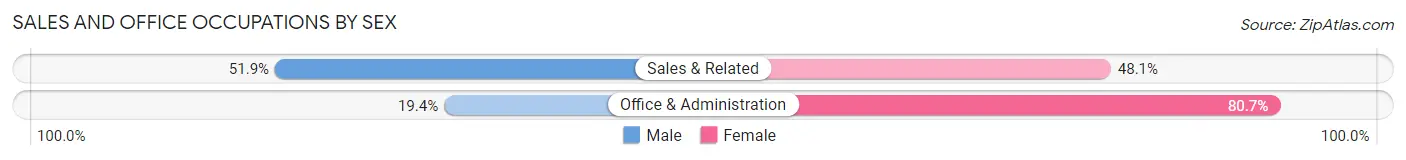
| Occupation | Male | Female |
| Sales & Related | 5,494 (51.9%) | 5,099 (48.1%) |
| Office & Administration | 1,958 (19.4%) | 8,160 (80.6%) |
| Total (Category) | 7,452 (36.0%) | 13,259 (64.0%) |
| Total (Overall) | 54,954 (55.8%) | 43,608 (44.2%) |
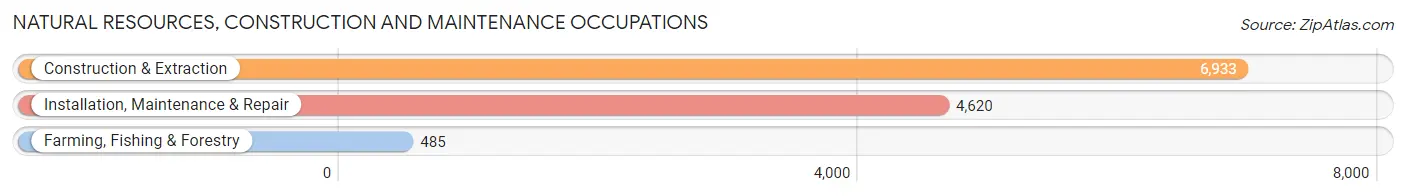
Natural Resources, Construction and Maintenance Occupations
The most common Natural Resources, Construction and Maintenance occupations in Hall County are Construction & Extraction (6,933 | 7.0%), Installation, Maintenance & Repair (4,620 | 4.7%), and Farming, Fishing & Forestry (485 | 0.5%).
Natural Resources, Construction and Maintenance Occupations by Sex
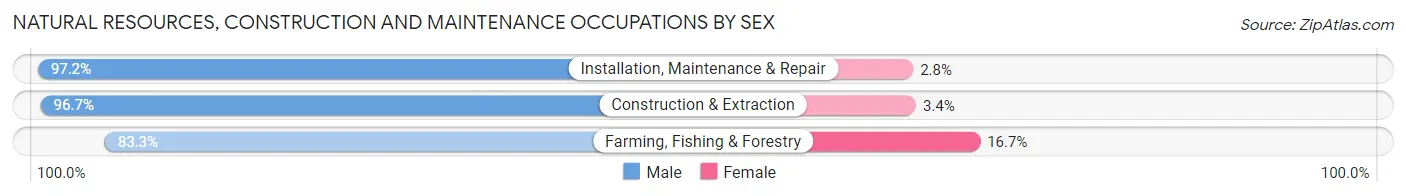
| Occupation | Male | Female |
| Farming, Fishing & Forestry | 404 (83.3%) | 81 (16.7%) |
| Construction & Extraction | 6,701 (96.7%) | 232 (3.4%) |
| Installation, Maintenance & Repair | 4,492 (97.2%) | 128 (2.8%) |
| Total (Category) | 11,597 (96.3%) | 441 (3.7%) |
| Total (Overall) | 54,954 (55.8%) | 43,608 (44.2%) |
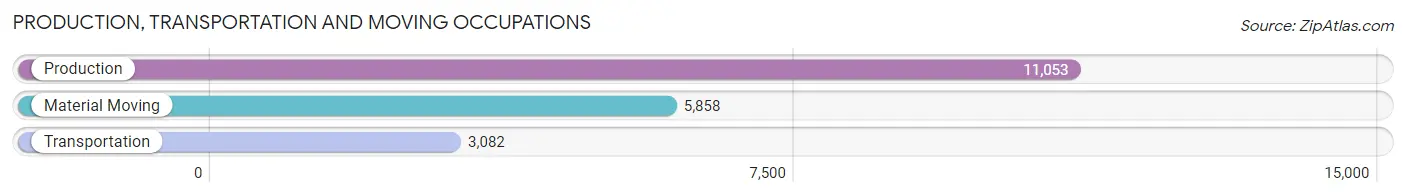
Production, Transportation and Moving Occupations
The most common Production, Transportation and Moving occupations in Hall County are Production (11,053 | 11.2%), Material Moving (5,858 | 5.9%), and Transportation (3,082 | 3.1%).
Production, Transportation and Moving Occupations by Sex
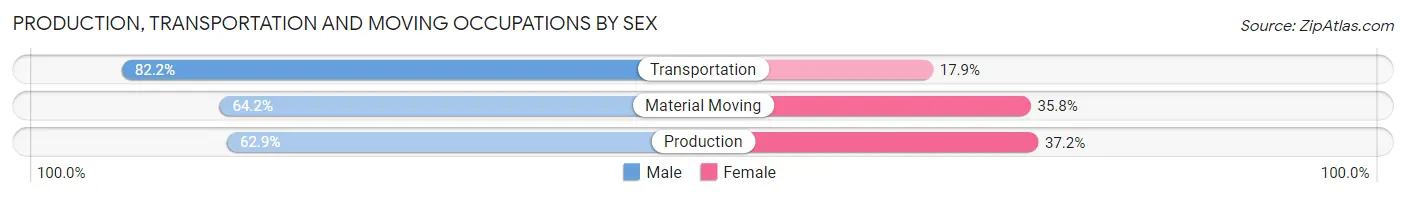
| Occupation | Male | Female |
| Production | 6,947 (62.8%) | 4,106 (37.1%) |
| Transportation | 2,532 (82.2%) | 550 (17.8%) |
| Material Moving | 3,762 (64.2%) | 2,096 (35.8%) |
| Total (Category) | 13,241 (66.2%) | 6,752 (33.8%) |
| Total (Overall) | 54,954 (55.8%) | 43,608 (44.2%) |
Employment Industries by Sex in Hall County
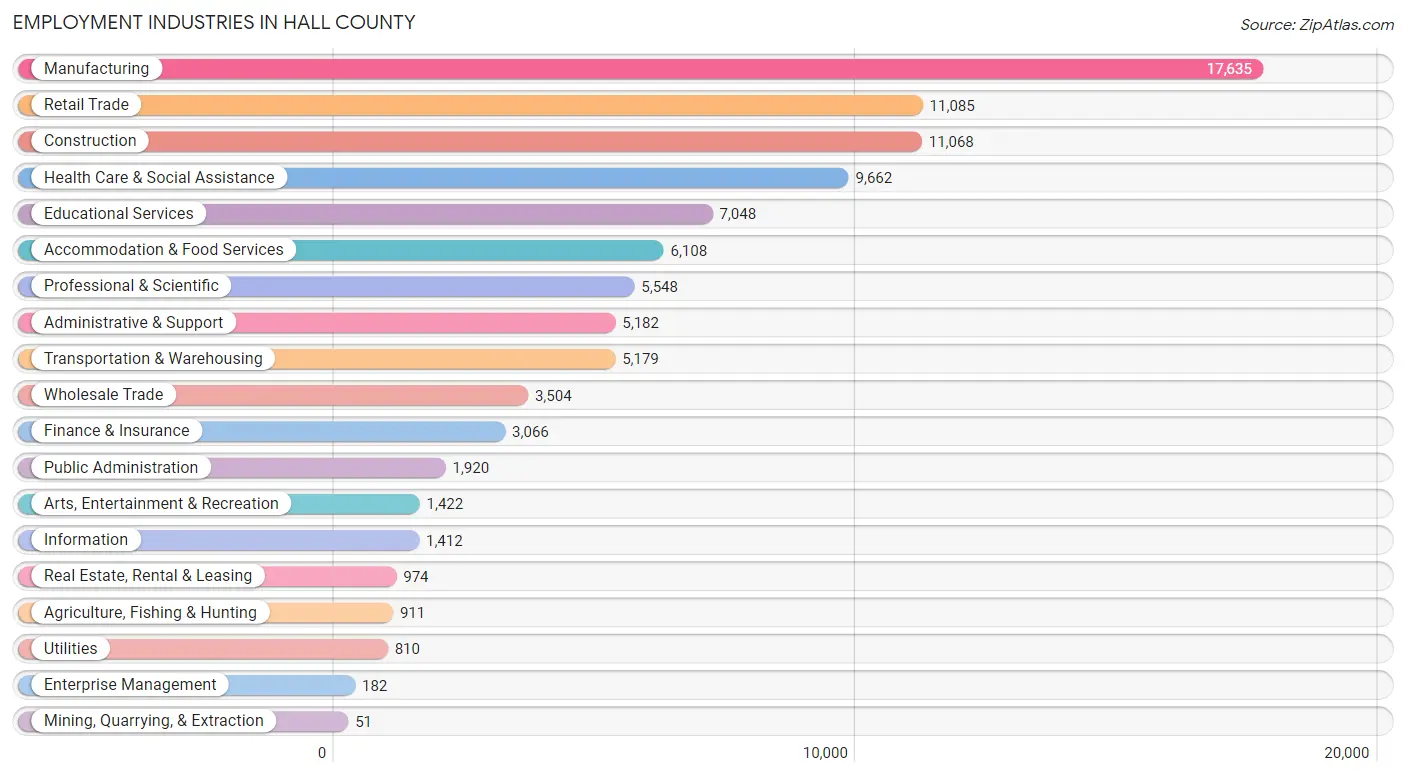
Employment Industries in Hall County
The major employment industries in Hall County include Manufacturing (17,635 | 17.9%), Retail Trade (11,085 | 11.3%), Construction (11,068 | 11.2%), Health Care & Social Assistance (9,662 | 9.8%), and Educational Services (7,048 | 7.1%).
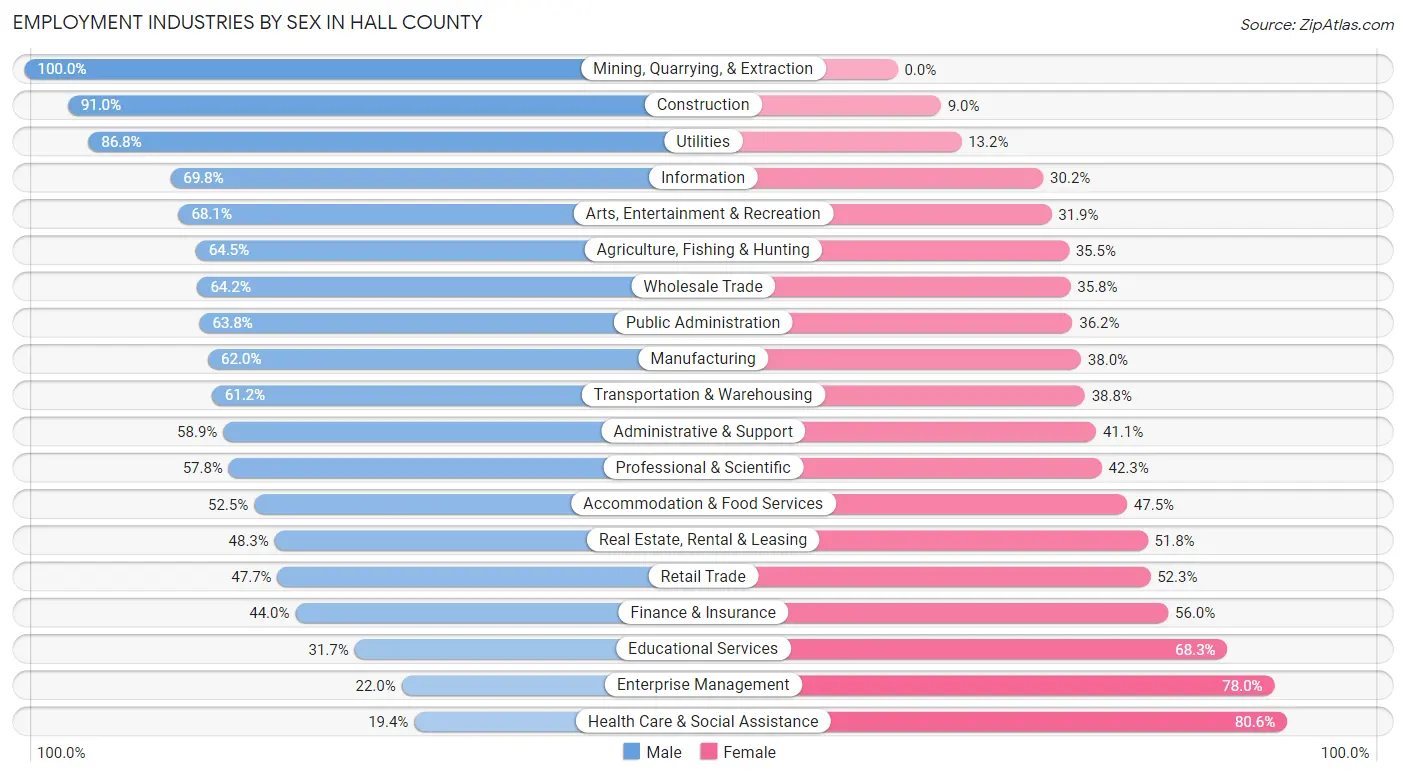
Employment Industries by Sex in Hall County
The Hall County industries that see more men than women are Mining, Quarrying, & Extraction (100.0%), Construction (91.0%), and Utilities (86.8%), whereas the industries that tend to have a higher number of women are Health Care & Social Assistance (80.6%), Enterprise Management (78.0%), and Educational Services (68.3%).
| Industry | Male | Female |
| Agriculture, Fishing & Hunting | 588 (64.5%) | 323 (35.5%) |
| Mining, Quarrying, & Extraction | 51 (100.0%) | 0 (0.0%) |
| Construction | 10,076 (91.0%) | 992 (9.0%) |
| Manufacturing | 10,938 (62.0%) | 6,697 (38.0%) |
| Wholesale Trade | 2,250 (64.2%) | 1,254 (35.8%) |
| Retail Trade | 5,284 (47.7%) | 5,801 (52.3%) |
| Transportation & Warehousing | 3,171 (61.2%) | 2,008 (38.8%) |
| Utilities | 703 (86.8%) | 107 (13.2%) |
| Information | 986 (69.8%) | 426 (30.2%) |
| Finance & Insurance | 1,348 (44.0%) | 1,718 (56.0%) |
| Real Estate, Rental & Leasing | 470 (48.2%) | 504 (51.7%) |
| Professional & Scientific | 3,204 (57.8%) | 2,344 (42.2%) |
| Enterprise Management | 40 (22.0%) | 142 (78.0%) |
| Administrative & Support | 3,052 (58.9%) | 2,130 (41.1%) |
| Educational Services | 2,235 (31.7%) | 4,813 (68.3%) |
| Health Care & Social Assistance | 1,871 (19.4%) | 7,791 (80.6%) |
| Arts, Entertainment & Recreation | 969 (68.1%) | 453 (31.9%) |
| Accommodation & Food Services | 3,207 (52.5%) | 2,901 (47.5%) |
| Public Administration | 1,225 (63.8%) | 695 (36.2%) |
| Total | 54,954 (55.8%) | 43,608 (44.2%) |
Education in Hall County
School Enrollment in Hall County
The most common levels of schooling among the 50,090 students in Hall County are middle school (12,637 | 25.2%), high school (11,443 | 22.8%), and elementary school (10,706 | 21.4%).
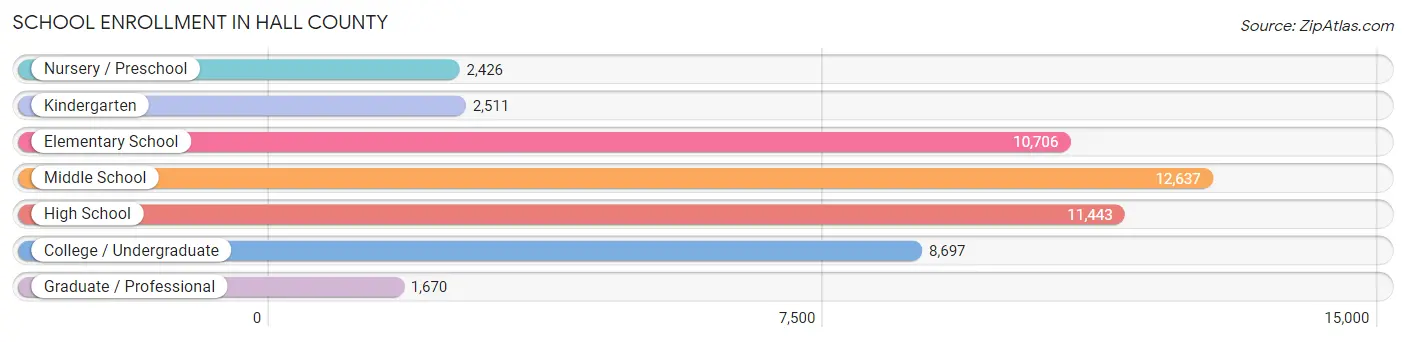
| School Level | # Students | % Students |
| Nursery / Preschool | 2,426 | 4.8% |
| Kindergarten | 2,511 | 5.0% |
| Elementary School | 10,706 | 21.4% |
| Middle School | 12,637 | 25.2% |
| High School | 11,443 | 22.8% |
| College / Undergraduate | 8,697 | 17.4% |
| Graduate / Professional | 1,670 | 3.3% |
| Total | 50,090 | 100.0% |
School Enrollment by Age by Funding Source in Hall County
Out of a total of 50,090 students who are enrolled in schools in Hall County, 6,061 (12.1%) attend a private institution, while the remaining 44,029 (87.9%) are enrolled in public schools. The age group of 3 to 4 year olds has the highest likelihood of being enrolled in private schools, with 726 (37.4% in the age bracket) enrolled. Conversely, the age group of 5 to 9 year old has the lowest likelihood of being enrolled in a private school, with 11,488 (93.1% in the age bracket) attending a public institution.
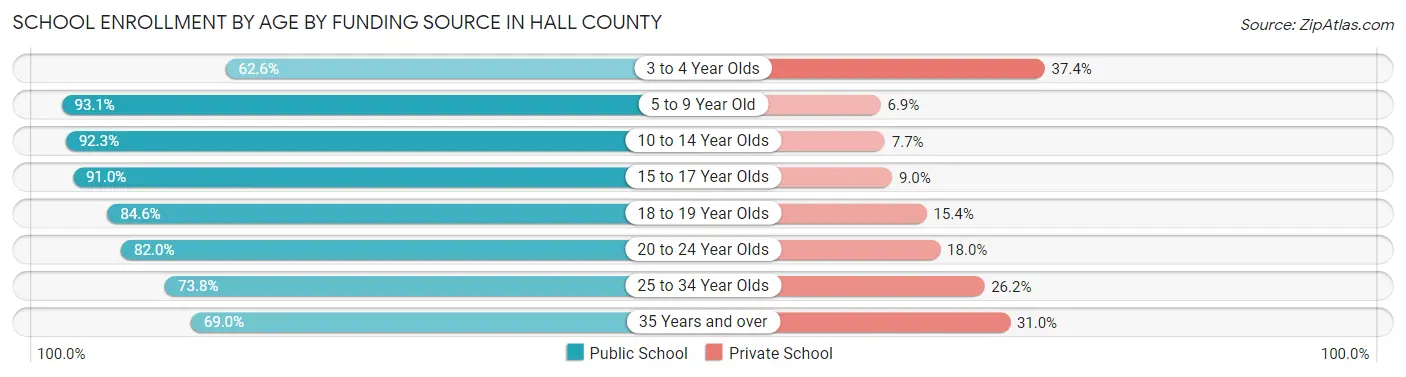
| Age Bracket | Public School | Private School |
| 3 to 4 Year Olds | 1,213 (62.6%) | 726 (37.4%) |
| 5 to 9 Year Old | 11,488 (93.1%) | 847 (6.9%) |
| 10 to 14 Year Olds | 13,847 (92.3%) | 1,150 (7.7%) |
| 15 to 17 Year Olds | 7,936 (91.0%) | 786 (9.0%) |
| 18 to 19 Year Olds | 2,675 (84.6%) | 488 (15.4%) |
| 20 to 24 Year Olds | 3,734 (82.0%) | 818 (18.0%) |
| 25 to 34 Year Olds | 1,807 (73.8%) | 641 (26.2%) |
| 35 Years and over | 1,335 (69.0%) | 599 (31.0%) |
| Total | 44,029 (87.9%) | 6,061 (12.1%) |
Educational Attainment by Field of Study in Hall County
Business (8,775 | 24.2%), education (6,473 | 17.8%), science & technology (3,633 | 10.0%), arts & humanities (2,393 | 6.6%), and social sciences (2,086 | 5.7%) are the most common fields of study among 36,320 individuals in Hall County who have obtained a bachelor's degree or higher.
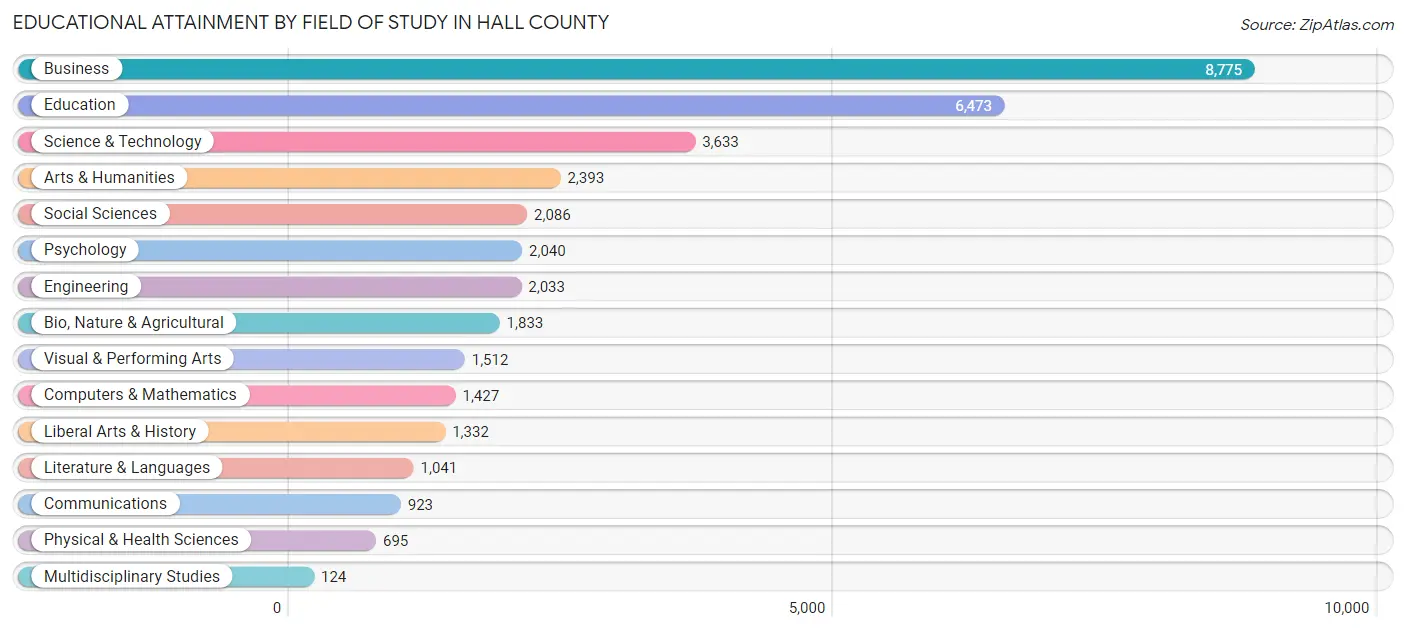
| Field of Study | # Graduates | % Graduates |
| Computers & Mathematics | 1,427 | 3.9% |
| Bio, Nature & Agricultural | 1,833 | 5.1% |
| Physical & Health Sciences | 695 | 1.9% |
| Psychology | 2,040 | 5.6% |
| Social Sciences | 2,086 | 5.7% |
| Engineering | 2,033 | 5.6% |
| Multidisciplinary Studies | 124 | 0.3% |
| Science & Technology | 3,633 | 10.0% |
| Business | 8,775 | 24.2% |
| Education | 6,473 | 17.8% |
| Literature & Languages | 1,041 | 2.9% |
| Liberal Arts & History | 1,332 | 3.7% |
| Visual & Performing Arts | 1,512 | 4.2% |
| Communications | 923 | 2.5% |
| Arts & Humanities | 2,393 | 6.6% |
| Total | 36,320 | 100.0% |
Transportation & Commute in Hall County
Vehicle Availability by Sex in Hall County
The most prevalent vehicle ownership categories in Hall County are males with 2 vehicles (19,973, accounting for 36.8%) and females with 2 vehicles (16,021, making up 46.5%).
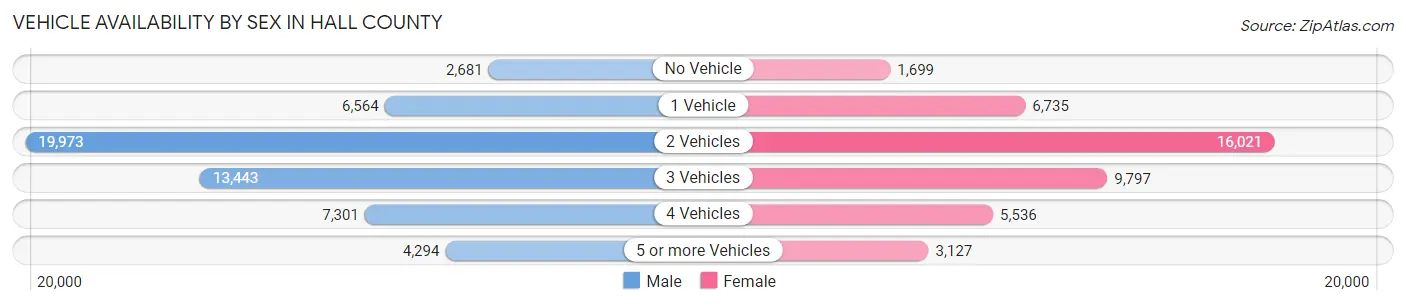
| Vehicles Available | Male | Female |
| No Vehicle | 2,681 (4.9%) | 1,699 (4.0%) |
| 1 Vehicle | 6,564 (12.1%) | 6,735 (15.7%) |
| 2 Vehicles | 19,973 (36.8%) | 16,021 (37.3%) |
| 3 Vehicles | 13,443 (24.8%) | 9,797 (22.8%) |
| 4 Vehicles | 7,301 (13.5%) | 5,536 (12.9%) |
| 5 or more Vehicles | 4,294 (7.9%) | 3,127 (7.3%) |
| Total | 54,256 (100.0%) | 42,915 (100.0%) |
Commute Time in Hall County
The most frequently occuring commute durations in Hall County are 15 to 19 minutes (14,237 commuters, 16.0%), 20 to 24 minutes (13,877 commuters, 15.6%), and 30 to 34 minutes (11,543 commuters, 13.0%).
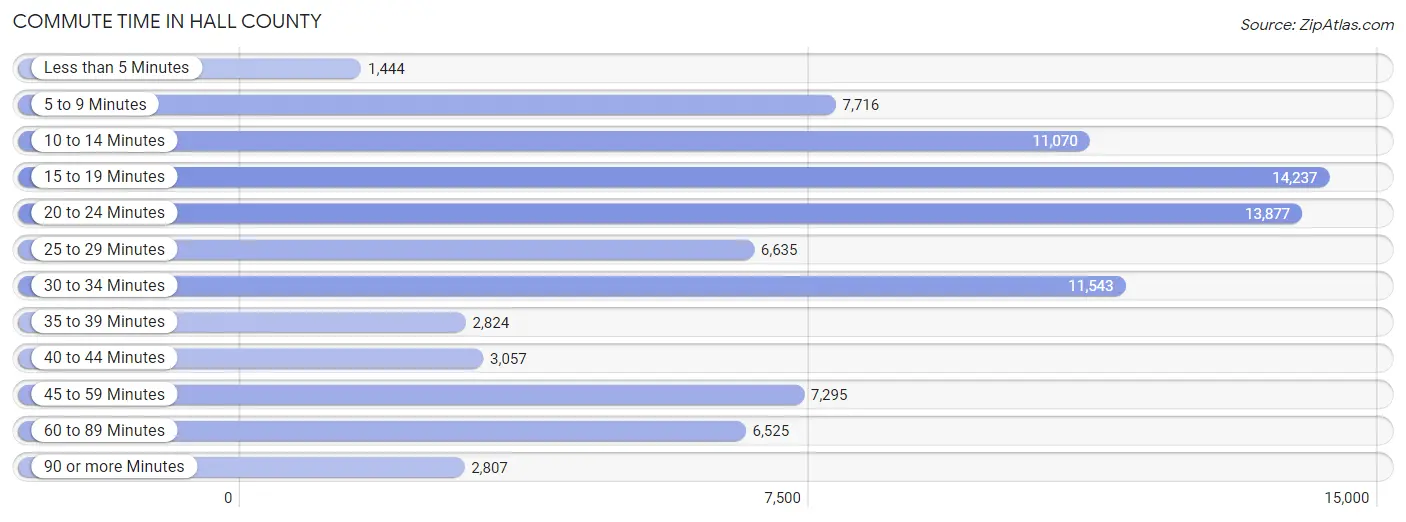
| Commute Time | # Commuters | % Commuters |
| Less than 5 Minutes | 1,444 | 1.6% |
| 5 to 9 Minutes | 7,716 | 8.7% |
| 10 to 14 Minutes | 11,070 | 12.4% |
| 15 to 19 Minutes | 14,237 | 16.0% |
| 20 to 24 Minutes | 13,877 | 15.6% |
| 25 to 29 Minutes | 6,635 | 7.4% |
| 30 to 34 Minutes | 11,543 | 13.0% |
| 35 to 39 Minutes | 2,824 | 3.2% |
| 40 to 44 Minutes | 3,057 | 3.4% |
| 45 to 59 Minutes | 7,295 | 8.2% |
| 60 to 89 Minutes | 6,525 | 7.3% |
| 90 or more Minutes | 2,807 | 3.2% |
Commute Time by Sex in Hall County
The most common commute times in Hall County are 15 to 19 minutes (8,011 commuters, 16.1%) for males and 20 to 24 minutes (7,274 commuters, 18.5%) for females.
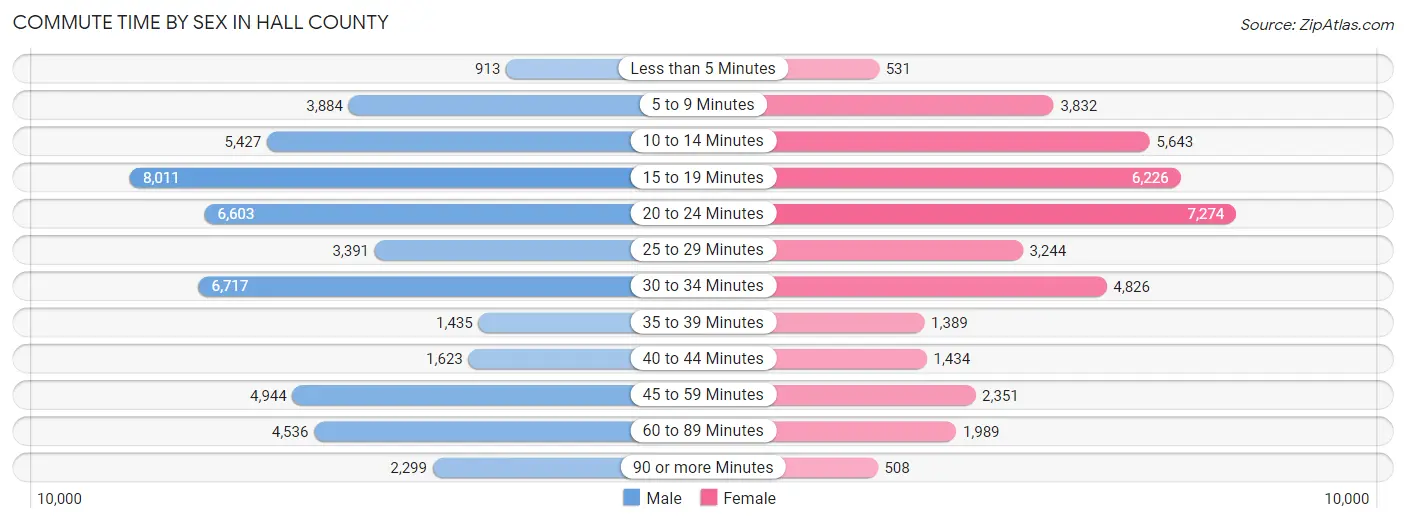
| Commute Time | Male | Female |
| Less than 5 Minutes | 913 (1.8%) | 531 (1.3%) |
| 5 to 9 Minutes | 3,884 (7.8%) | 3,832 (9.8%) |
| 10 to 14 Minutes | 5,427 (10.9%) | 5,643 (14.4%) |
| 15 to 19 Minutes | 8,011 (16.1%) | 6,226 (15.9%) |
| 20 to 24 Minutes | 6,603 (13.3%) | 7,274 (18.5%) |
| 25 to 29 Minutes | 3,391 (6.8%) | 3,244 (8.3%) |
| 30 to 34 Minutes | 6,717 (13.5%) | 4,826 (12.3%) |
| 35 to 39 Minutes | 1,435 (2.9%) | 1,389 (3.5%) |
| 40 to 44 Minutes | 1,623 (3.3%) | 1,434 (3.6%) |
| 45 to 59 Minutes | 4,944 (9.9%) | 2,351 (6.0%) |
| 60 to 89 Minutes | 4,536 (9.1%) | 1,989 (5.1%) |
| 90 or more Minutes | 2,299 (4.6%) | 508 (1.3%) |
Time of Departure to Work by Sex in Hall County
The most frequent times of departure to work in Hall County are 7:00 AM to 7:29 AM (7,437, 14.9%) for males and 7:00 AM to 7:29 AM (7,061, 18.0%) for females.
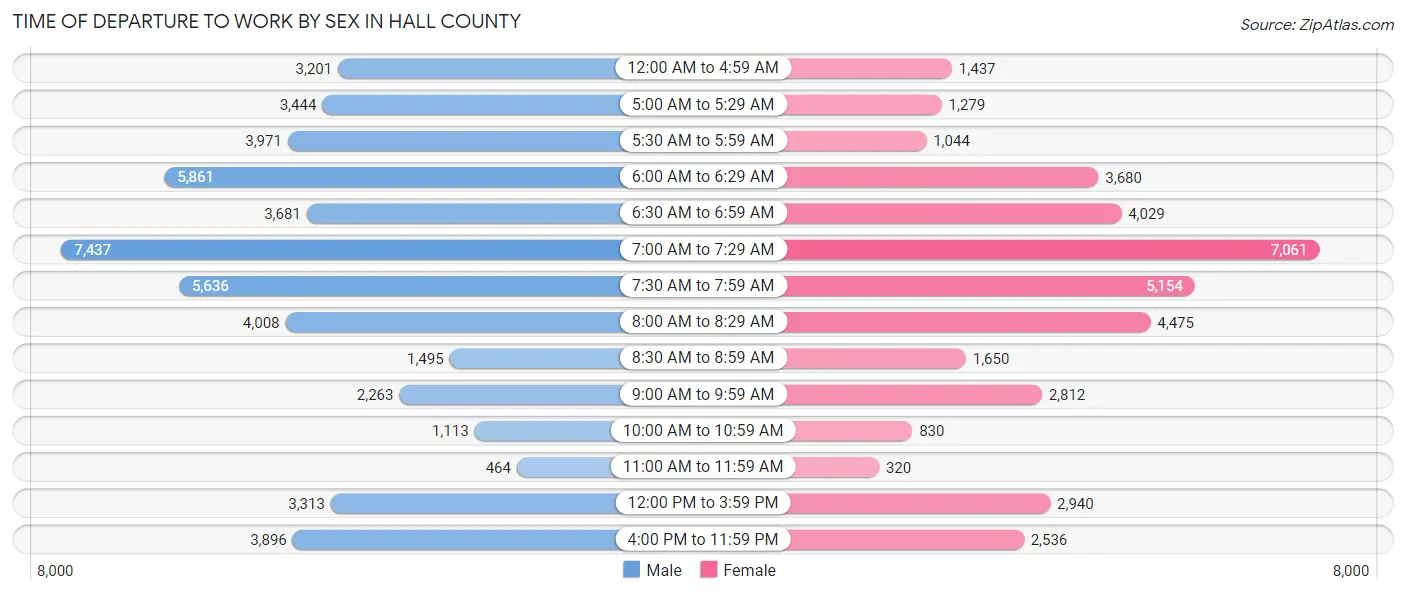
| Time of Departure | Male | Female |
| 12:00 AM to 4:59 AM | 3,201 (6.4%) | 1,437 (3.7%) |
| 5:00 AM to 5:29 AM | 3,444 (6.9%) | 1,279 (3.3%) |
| 5:30 AM to 5:59 AM | 3,971 (8.0%) | 1,044 (2.7%) |
| 6:00 AM to 6:29 AM | 5,861 (11.8%) | 3,680 (9.4%) |
| 6:30 AM to 6:59 AM | 3,681 (7.4%) | 4,029 (10.3%) |
| 7:00 AM to 7:29 AM | 7,437 (14.9%) | 7,061 (18.0%) |
| 7:30 AM to 7:59 AM | 5,636 (11.3%) | 5,154 (13.1%) |
| 8:00 AM to 8:29 AM | 4,008 (8.1%) | 4,475 (11.4%) |
| 8:30 AM to 8:59 AM | 1,495 (3.0%) | 1,650 (4.2%) |
| 9:00 AM to 9:59 AM | 2,263 (4.5%) | 2,812 (7.2%) |
| 10:00 AM to 10:59 AM | 1,113 (2.2%) | 830 (2.1%) |
| 11:00 AM to 11:59 AM | 464 (0.9%) | 320 (0.8%) |
| 12:00 PM to 3:59 PM | 3,313 (6.7%) | 2,940 (7.5%) |
| 4:00 PM to 11:59 PM | 3,896 (7.8%) | 2,536 (6.5%) |
| Total | 49,783 (100.0%) | 39,247 (100.0%) |
Housing Occupancy in Hall County
Occupancy by Ownership in Hall County
Of the total 69,387 dwellings in Hall County, owner-occupied units account for 48,570 (70.0%), while renter-occupied units make up 20,817 (30.0%).
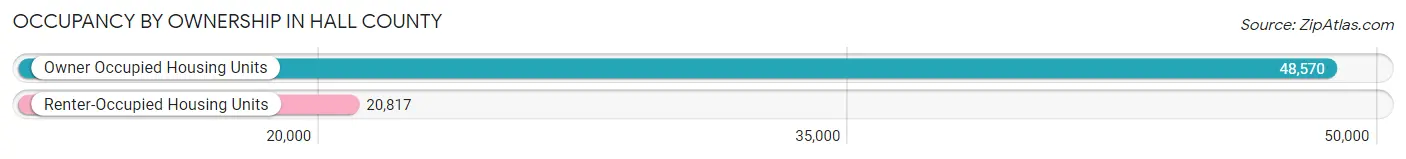
| Occupancy | # Housing Units | % Housing Units |
| Owner Occupied Housing Units | 48,570 | 70.0% |
| Renter-Occupied Housing Units | 20,817 | 30.0% |
| Total Occupied Housing Units | 69,387 | 100.0% |
Occupancy by Household Size in Hall County
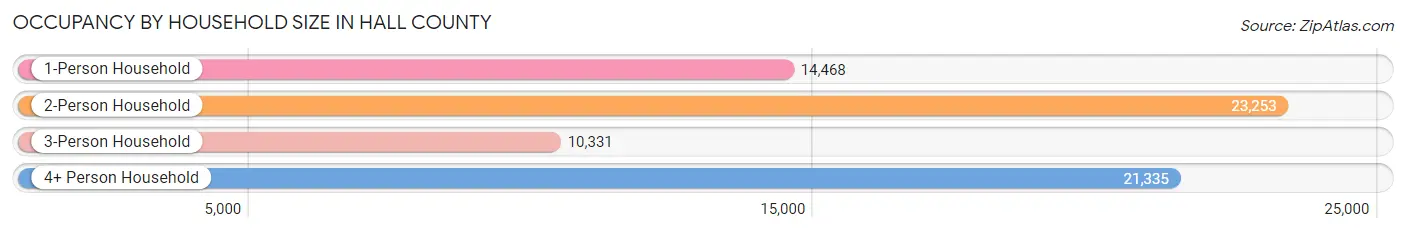
| Household Size | # Housing Units | % Housing Units |
| 1-Person Household | 14,468 | 20.8% |
| 2-Person Household | 23,253 | 33.5% |
| 3-Person Household | 10,331 | 14.9% |
| 4+ Person Household | 21,335 | 30.7% |
| Total Housing Units | 69,387 | 100.0% |
Occupancy by Ownership by Household Size in Hall County
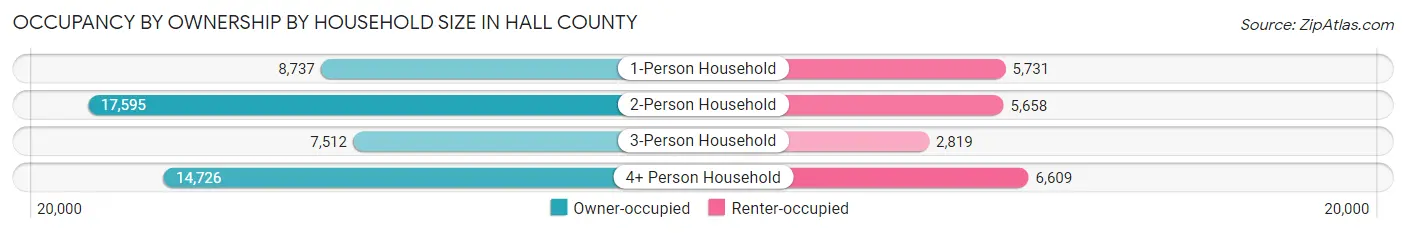
| Household Size | Owner-occupied | Renter-occupied |
| 1-Person Household | 8,737 (60.4%) | 5,731 (39.6%) |
| 2-Person Household | 17,595 (75.7%) | 5,658 (24.3%) |
| 3-Person Household | 7,512 (72.7%) | 2,819 (27.3%) |
| 4+ Person Household | 14,726 (69.0%) | 6,609 (31.0%) |
| Total Housing Units | 48,570 (70.0%) | 20,817 (30.0%) |
Occupancy by Educational Attainment in Hall County
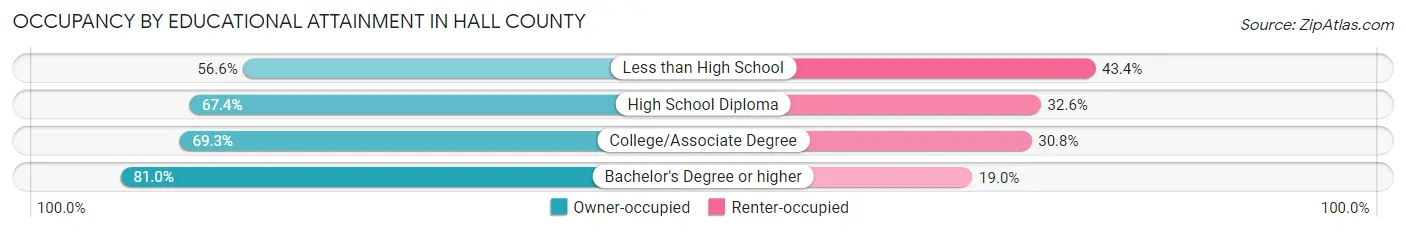
| Household Size | Owner-occupied | Renter-occupied |
| Less than High School | 6,642 (56.6%) | 5,093 (43.4%) |
| High School Diploma | 11,796 (67.4%) | 5,709 (32.6%) |
| College/Associate Degree | 14,031 (69.3%) | 6,231 (30.7%) |
| Bachelor's Degree or higher | 16,101 (81.0%) | 3,784 (19.0%) |
Occupancy by Age of Householder in Hall County
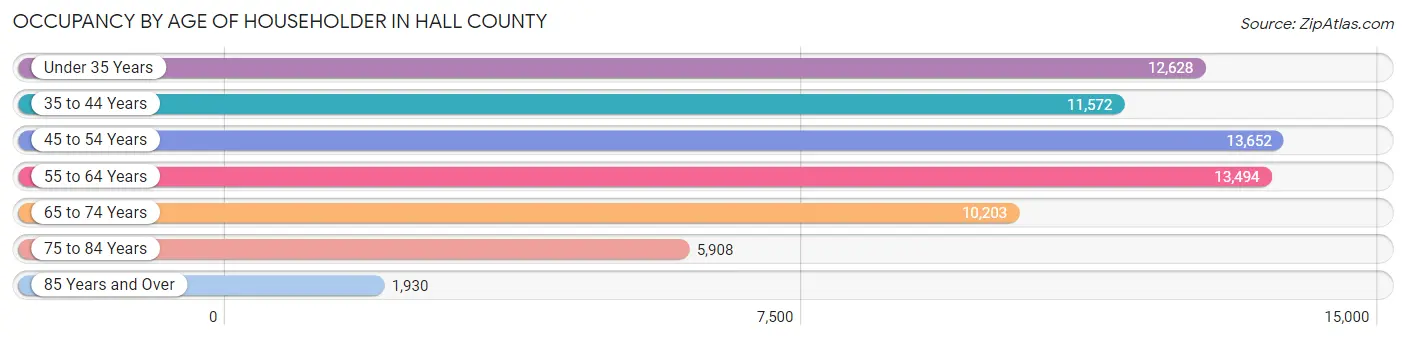
| Age Bracket | # Households | % Households |
| Under 35 Years | 12,628 | 18.2% |
| 35 to 44 Years | 11,572 | 16.7% |
| 45 to 54 Years | 13,652 | 19.7% |
| 55 to 64 Years | 13,494 | 19.5% |
| 65 to 74 Years | 10,203 | 14.7% |
| 75 to 84 Years | 5,908 | 8.5% |
| 85 Years and Over | 1,930 | 2.8% |
| Total | 69,387 | 100.0% |
Housing Finances in Hall County
Median Income by Occupancy in Hall County
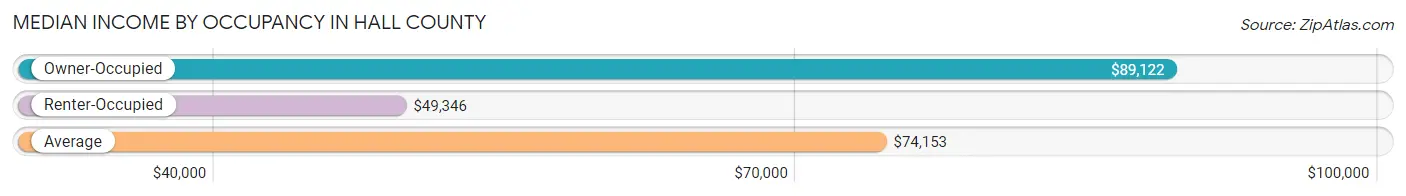
| Occupancy Type | # Households | Median Income |
| Owner-Occupied | 48,570 (70.0%) | $89,122 |
| Renter-Occupied | 20,817 (30.0%) | $49,346 |
| Average | 69,387 (100.0%) | $74,153 |
Occupancy by Householder Income Bracket in Hall County
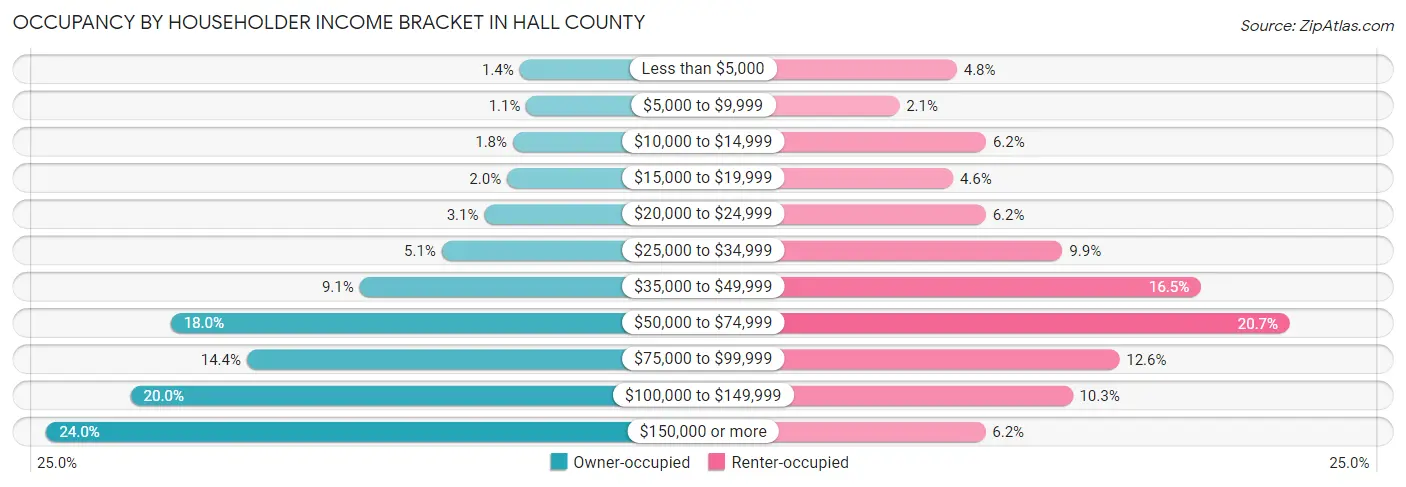
| Income Bracket | Owner-occupied | Renter-occupied |
| Less than $5,000 | 694 (1.4%) | 1,004 (4.8%) |
| $5,000 to $9,999 | 541 (1.1%) | 434 (2.1%) |
| $10,000 to $14,999 | 852 (1.8%) | 1,293 (6.2%) |
| $15,000 to $19,999 | 986 (2.0%) | 965 (4.6%) |
| $20,000 to $24,999 | 1,512 (3.1%) | 1,290 (6.2%) |
| $25,000 to $34,999 | 2,497 (5.1%) | 2,050 (9.9%) |
| $35,000 to $49,999 | 4,396 (9.0%) | 3,424 (16.5%) |
| $50,000 to $74,999 | 8,762 (18.0%) | 4,305 (20.7%) |
| $75,000 to $99,999 | 7,003 (14.4%) | 2,615 (12.6%) |
| $100,000 to $149,999 | 9,688 (20.0%) | 2,151 (10.3%) |
| $150,000 or more | 11,639 (24.0%) | 1,286 (6.2%) |
| Total | 48,570 (100.0%) | 20,817 (100.0%) |
Monthly Housing Cost Tiers in Hall County
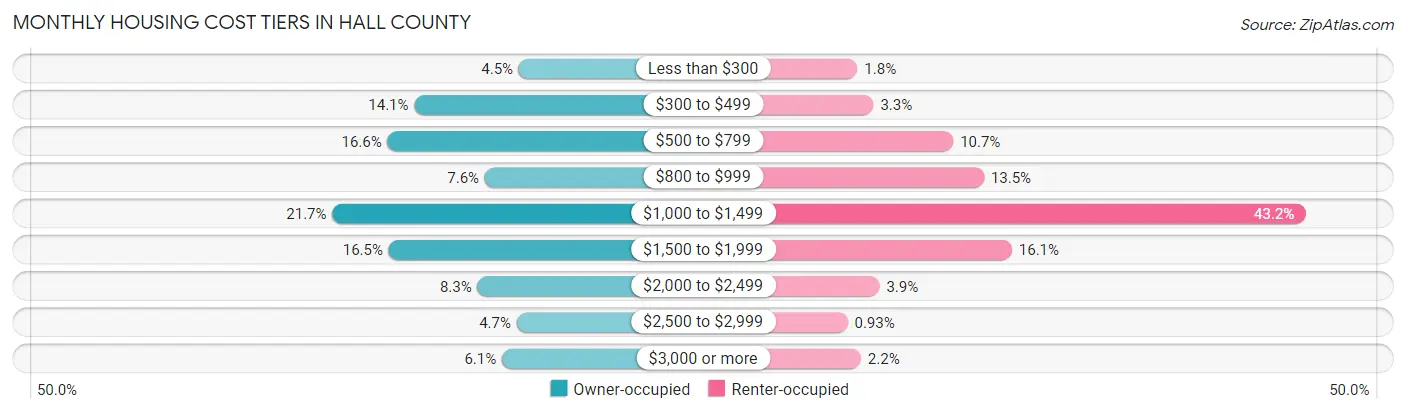
| Monthly Cost | Owner-occupied | Renter-occupied |
| Less than $300 | 2,183 (4.5%) | 384 (1.8%) |
| $300 to $499 | 6,857 (14.1%) | 691 (3.3%) |
| $500 to $799 | 8,059 (16.6%) | 2,220 (10.7%) |
| $800 to $999 | 3,700 (7.6%) | 2,809 (13.5%) |
| $1,000 to $1,499 | 10,526 (21.7%) | 8,982 (43.1%) |
| $1,500 to $1,999 | 7,998 (16.5%) | 3,344 (16.1%) |
| $2,000 to $2,499 | 4,029 (8.3%) | 806 (3.9%) |
| $2,500 to $2,999 | 2,279 (4.7%) | 194 (0.9%) |
| $3,000 or more | 2,939 (6.0%) | 450 (2.2%) |
| Total | 48,570 (100.0%) | 20,817 (100.0%) |
Physical Housing Characteristics in Hall County
Housing Structures in Hall County
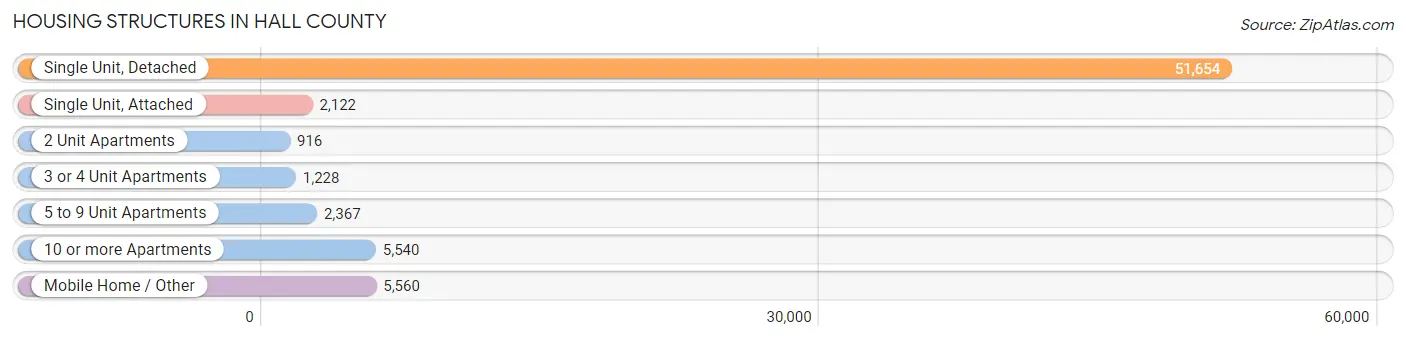
| Structure Type | # Housing Units | % Housing Units |
| Single Unit, Detached | 51,654 | 74.4% |
| Single Unit, Attached | 2,122 | 3.1% |
| 2 Unit Apartments | 916 | 1.3% |
| 3 or 4 Unit Apartments | 1,228 | 1.8% |
| 5 to 9 Unit Apartments | 2,367 | 3.4% |
| 10 or more Apartments | 5,540 | 8.0% |
| Mobile Home / Other | 5,560 | 8.0% |
| Total | 69,387 | 100.0% |
Housing Structures by Occupancy in Hall County
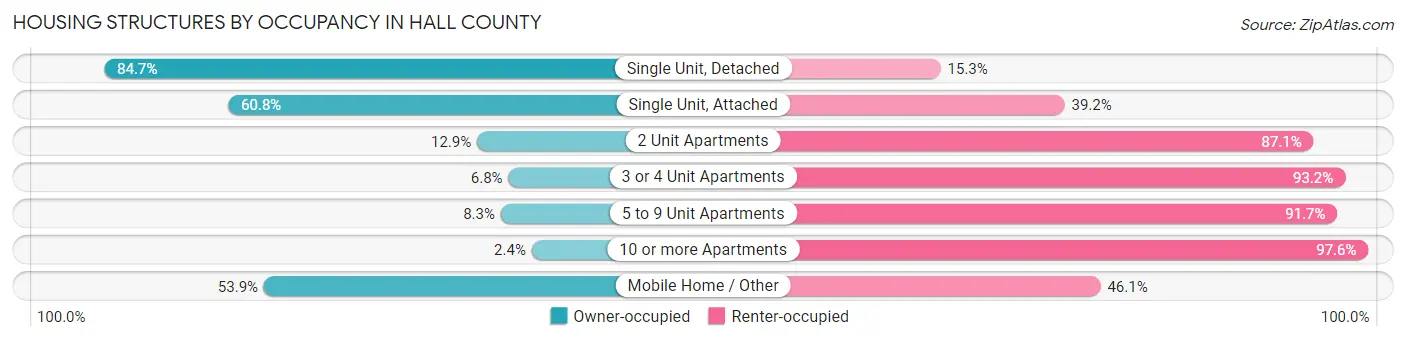
| Structure Type | Owner-occupied | Renter-occupied |
| Single Unit, Detached | 43,751 (84.7%) | 7,903 (15.3%) |
| Single Unit, Attached | 1,291 (60.8%) | 831 (39.2%) |
| 2 Unit Apartments | 118 (12.9%) | 798 (87.1%) |
| 3 or 4 Unit Apartments | 84 (6.8%) | 1,144 (93.2%) |
| 5 to 9 Unit Apartments | 197 (8.3%) | 2,170 (91.7%) |
| 10 or more Apartments | 131 (2.4%) | 5,409 (97.6%) |
| Mobile Home / Other | 2,998 (53.9%) | 2,562 (46.1%) |
| Total | 48,570 (70.0%) | 20,817 (30.0%) |
Housing Structures by Number of Rooms in Hall County
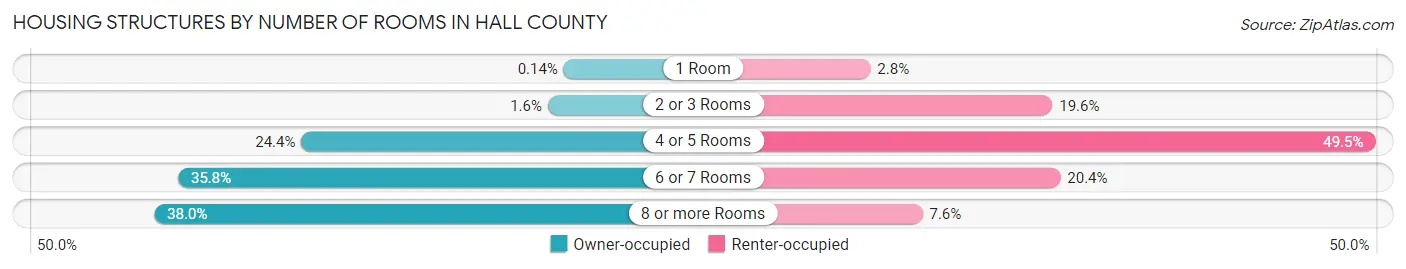
| Number of Rooms | Owner-occupied | Renter-occupied |
| 1 Room | 66 (0.1%) | 587 (2.8%) |
| 2 or 3 Rooms | 780 (1.6%) | 4,088 (19.6%) |
| 4 or 5 Rooms | 11,855 (24.4%) | 10,307 (49.5%) |
| 6 or 7 Rooms | 17,405 (35.8%) | 4,244 (20.4%) |
| 8 or more Rooms | 18,464 (38.0%) | 1,591 (7.6%) |
| Total | 48,570 (100.0%) | 20,817 (100.0%) |
Housing Structure by Heating Type in Hall County
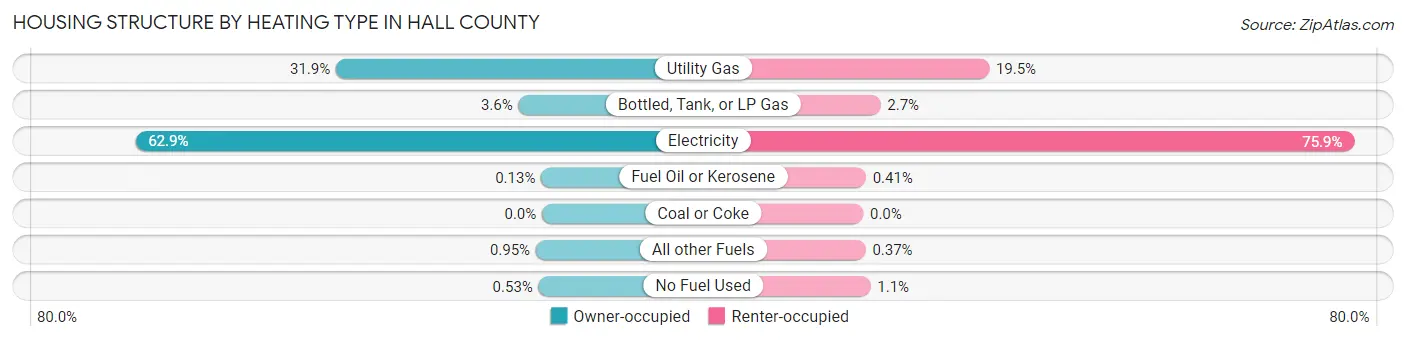
| Heating Type | Owner-occupied | Renter-occupied |
| Utility Gas | 15,470 (31.9%) | 4,052 (19.5%) |
| Bottled, Tank, or LP Gas | 1,768 (3.6%) | 557 (2.7%) |
| Electricity | 30,552 (62.9%) | 15,809 (75.9%) |
| Fuel Oil or Kerosene | 64 (0.1%) | 86 (0.4%) |
| Coal or Coke | 0 (0.0%) | 0 (0.0%) |
| All other Fuels | 461 (0.9%) | 77 (0.4%) |
| No Fuel Used | 255 (0.5%) | 236 (1.1%) |
| Total | 48,570 (100.0%) | 20,817 (100.0%) |
Household Vehicle Usage in Hall County
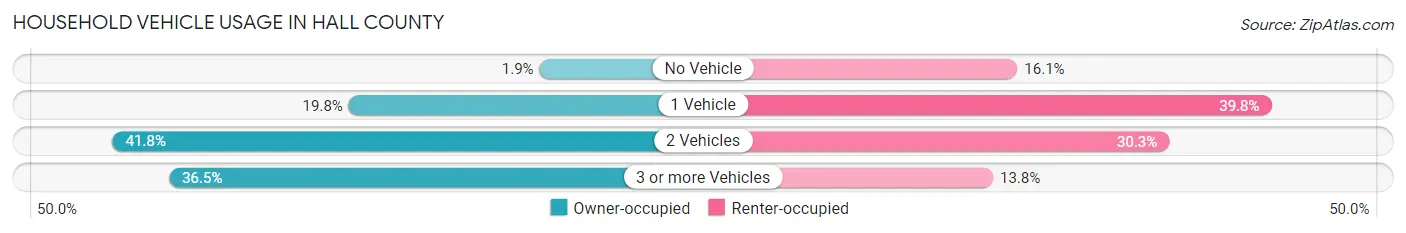
| Vehicles per Household | Owner-occupied | Renter-occupied |
| No Vehicle | 941 (1.9%) | 3,351 (16.1%) |
| 1 Vehicle | 9,595 (19.8%) | 8,286 (39.8%) |
| 2 Vehicles | 20,295 (41.8%) | 6,300 (30.3%) |
| 3 or more Vehicles | 17,739 (36.5%) | 2,880 (13.8%) |
| Total | 48,570 (100.0%) | 20,817 (100.0%) |
Real Estate & Mortgages in Hall County
Real Estate and Mortgage Overview in Hall County
| Characteristic | Without Mortgage | With Mortgage |
| Housing Units | 18,549 | 30,021 |
| Median Property Value | $259,900 | $288,800 |
| Median Household Income | $72,594 | $8,436 |
| Monthly Housing Costs | $512 | $2,882 |
| Real Estate Taxes | $1,713 | $326 |
Property Value by Mortgage Status in Hall County
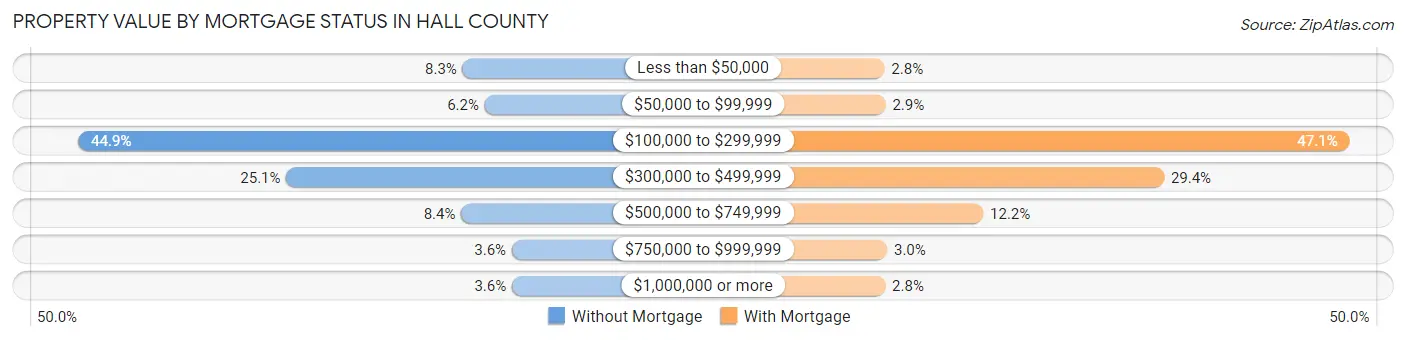
| Property Value | Without Mortgage | With Mortgage |
| Less than $50,000 | 1,535 (8.3%) | 825 (2.8%) |
| $50,000 to $99,999 | 1,145 (6.2%) | 857 (2.9%) |
| $100,000 to $299,999 | 8,330 (44.9%) | 14,126 (47.0%) |
| $300,000 to $499,999 | 4,650 (25.1%) | 8,818 (29.4%) |
| $500,000 to $749,999 | 1,560 (8.4%) | 3,648 (12.1%) |
| $750,000 to $999,999 | 665 (3.6%) | 901 (3.0%) |
| $1,000,000 or more | 664 (3.6%) | 846 (2.8%) |
| Total | 18,549 (100.0%) | 30,021 (100.0%) |
Household Income by Mortgage Status in Hall County
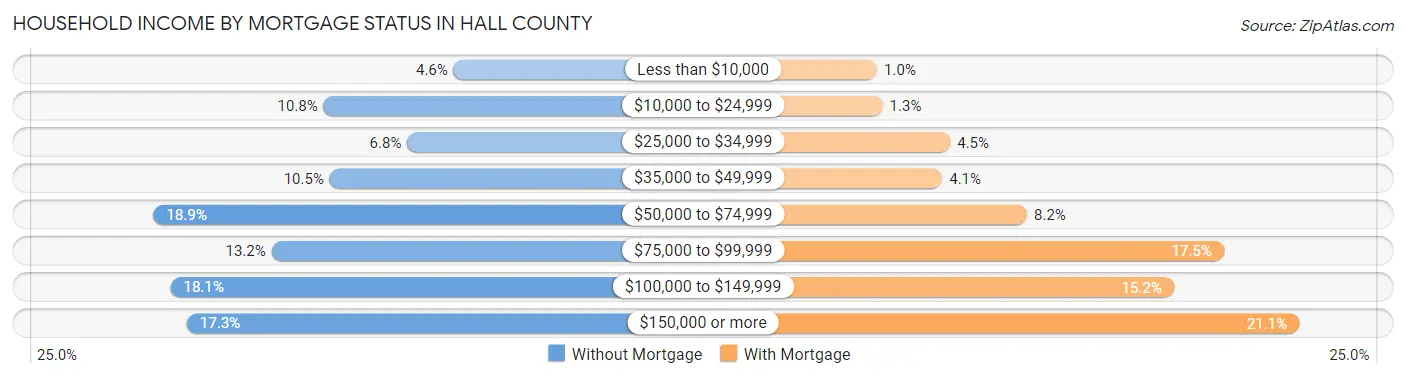
| Household Income | Without Mortgage | With Mortgage |
| Less than $10,000 | 848 (4.6%) | 309 (1.0%) |
| $10,000 to $24,999 | 1,996 (10.8%) | 387 (1.3%) |
| $25,000 to $34,999 | 1,257 (6.8%) | 1,354 (4.5%) |
| $35,000 to $49,999 | 1,943 (10.5%) | 1,240 (4.1%) |
| $50,000 to $74,999 | 3,498 (18.9%) | 2,453 (8.2%) |
| $75,000 to $99,999 | 2,456 (13.2%) | 5,264 (17.5%) |
| $100,000 to $149,999 | 3,348 (18.0%) | 4,547 (15.1%) |
| $150,000 or more | 3,203 (17.3%) | 6,340 (21.1%) |
| Total | 18,549 (100.0%) | 30,021 (100.0%) |
Property Value to Household Income Ratio in Hall County
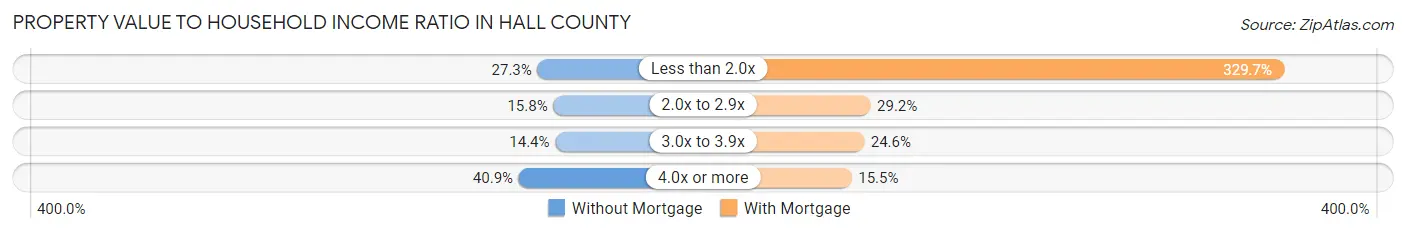
| Value-to-Income Ratio | Without Mortgage | With Mortgage |
| Less than 2.0x | 5,071 (27.3%) | 98,970 (329.7%) |
| 2.0x to 2.9x | 2,931 (15.8%) | 8,765 (29.2%) |
| 3.0x to 3.9x | 2,679 (14.4%) | 7,389 (24.6%) |
| 4.0x or more | 7,587 (40.9%) | 4,654 (15.5%) |
| Total | 18,549 (100.0%) | 30,021 (100.0%) |
Real Estate Taxes by Mortgage Status in Hall County
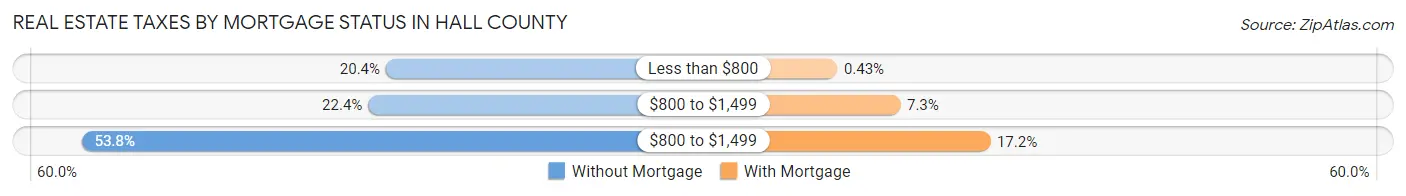
| Property Taxes | Without Mortgage | With Mortgage |
| Less than $800 | 3,786 (20.4%) | 129 (0.4%) |
| $800 to $1,499 | 4,146 (22.4%) | 2,205 (7.3%) |
| $800 to $1,499 | 9,972 (53.8%) | 5,164 (17.2%) |
| Total | 18,549 (100.0%) | 30,021 (100.0%) |
Health & Disability in Hall County
Health Insurance Coverage by Age in Hall County
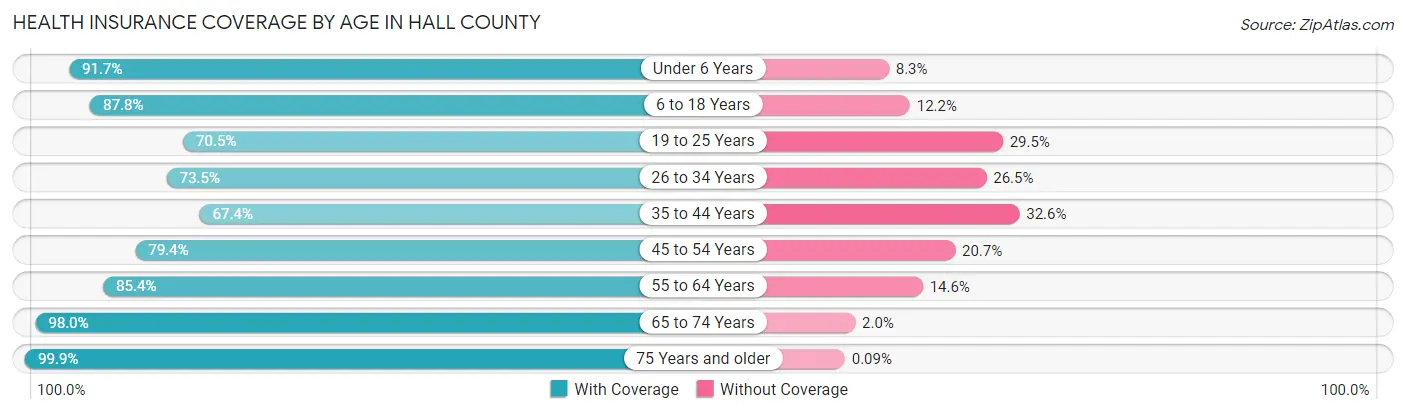
| Age Bracket | With Coverage | Without Coverage |
| Under 6 Years | 13,960 (91.7%) | 1,264 (8.3%) |
| 6 to 18 Years | 33,245 (87.8%) | 4,630 (12.2%) |
| 19 to 25 Years | 13,629 (70.5%) | 5,715 (29.5%) |
| 26 to 34 Years | 16,952 (73.5%) | 6,105 (26.5%) |
| 35 to 44 Years | 17,045 (67.4%) | 8,260 (32.6%) |
| 45 to 54 Years | 21,424 (79.3%) | 5,575 (20.6%) |
| 55 to 64 Years | 21,116 (85.4%) | 3,617 (14.6%) |
| 65 to 74 Years | 18,277 (98.0%) | 374 (2.0%) |
| 75 Years and older | 12,565 (99.9%) | 11 (0.1%) |
| Total | 168,213 (82.6%) | 35,551 (17.4%) |
Health Insurance Coverage by Citizenship Status in Hall County
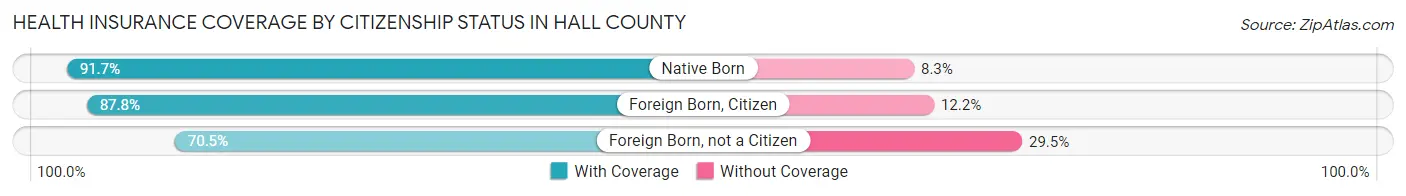
| Citizenship Status | With Coverage | Without Coverage |
| Native Born | 13,960 (91.7%) | 1,264 (8.3%) |
| Foreign Born, Citizen | 33,245 (87.8%) | 4,630 (12.2%) |
| Foreign Born, not a Citizen | 13,629 (70.5%) | 5,715 (29.5%) |
Health Insurance Coverage by Household Income in Hall County
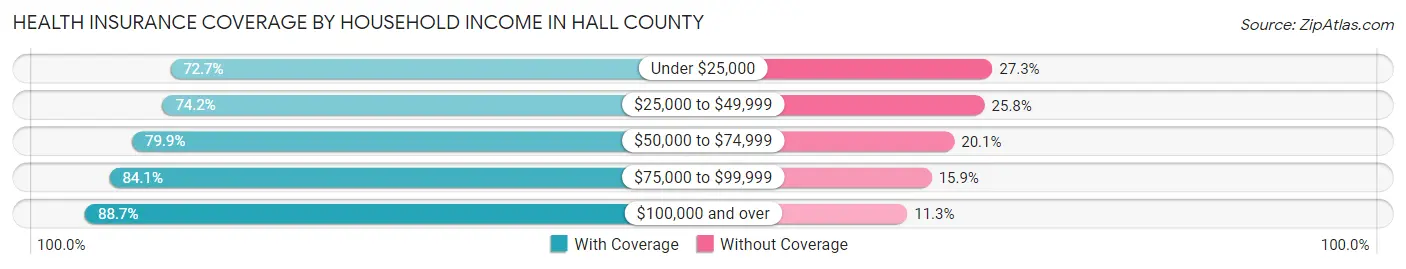
| Household Income | With Coverage | Without Coverage |
| Under $25,000 | 14,892 (72.7%) | 5,586 (27.3%) |
| $25,000 to $49,999 | 22,919 (74.2%) | 7,977 (25.8%) |
| $50,000 to $74,999 | 29,019 (79.9%) | 7,317 (20.1%) |
| $75,000 to $99,999 | 25,458 (84.1%) | 4,816 (15.9%) |
| $100,000 and over | 75,195 (88.7%) | 9,610 (11.3%) |
Public vs Private Health Insurance Coverage by Age in Hall County
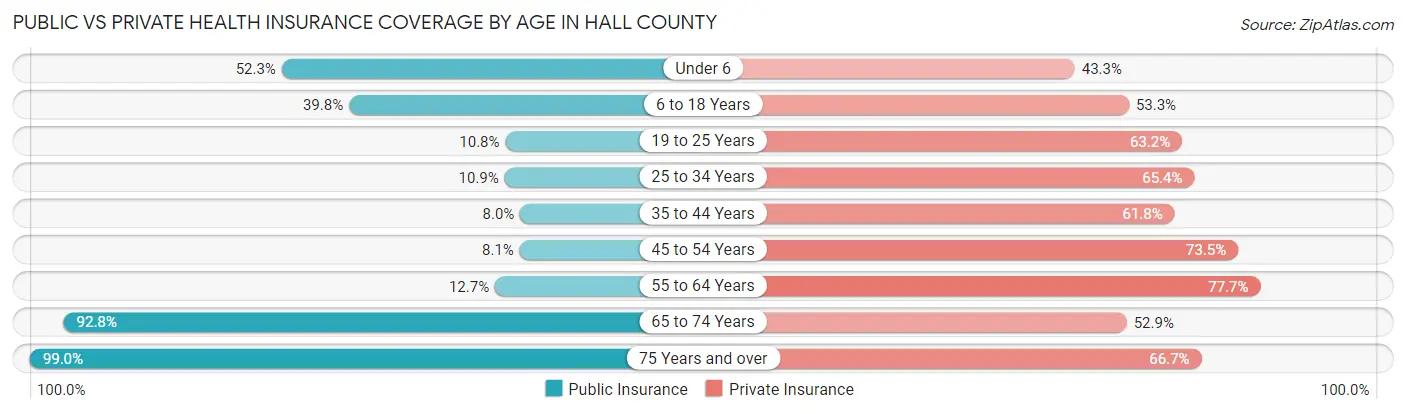
| Age Bracket | Public Insurance | Private Insurance |
| Under 6 | 7,959 (52.3%) | 6,584 (43.2%) |
| 6 to 18 Years | 15,072 (39.8%) | 20,188 (53.3%) |
| 19 to 25 Years | 2,081 (10.8%) | 12,216 (63.1%) |
| 25 to 34 Years | 2,514 (10.9%) | 15,083 (65.4%) |
| 35 to 44 Years | 2,027 (8.0%) | 15,629 (61.8%) |
| 45 to 54 Years | 2,188 (8.1%) | 19,855 (73.5%) |
| 55 to 64 Years | 3,139 (12.7%) | 19,213 (77.7%) |
| 65 to 74 Years | 17,298 (92.7%) | 9,865 (52.9%) |
| 75 Years and over | 12,453 (99.0%) | 8,393 (66.7%) |
| Total | 64,731 (31.8%) | 127,026 (62.3%) |
Disability Status by Sex by Age in Hall County
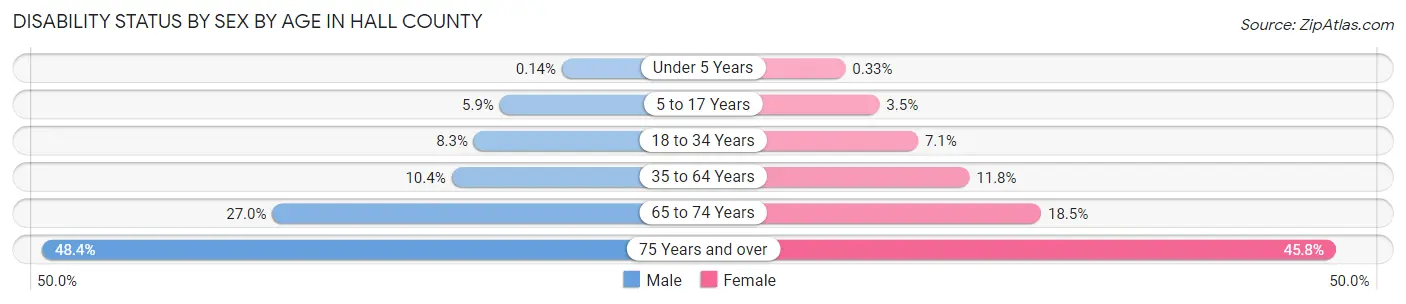
| Age Bracket | Male | Female |
| Under 5 Years | 9 (0.1%) | 21 (0.3%) |
| 5 to 17 Years | 1,144 (5.9%) | 634 (3.5%) |
| 18 to 34 Years | 1,916 (8.3%) | 1,570 (7.1%) |
| 35 to 64 Years | 4,015 (10.4%) | 4,539 (11.8%) |
| 65 to 74 Years | 2,374 (27.0%) | 1,824 (18.5%) |
| 75 Years and over | 2,620 (48.4%) | 3,282 (45.8%) |
Disability Class by Sex by Age in Hall County
Disability Class: Hearing Difficulty
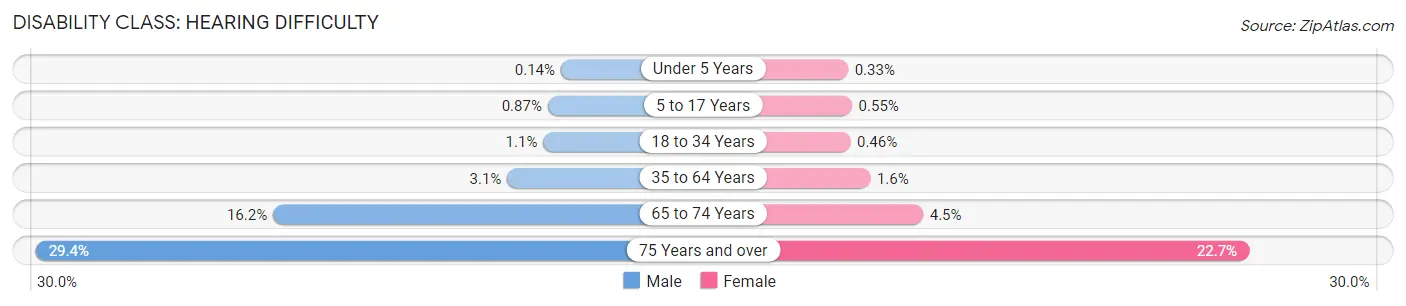
| Age Bracket | Male | Female |
| Under 5 Years | 9 (0.1%) | 21 (0.3%) |
| 5 to 17 Years | 168 (0.9%) | 100 (0.5%) |
| 18 to 34 Years | 259 (1.1%) | 102 (0.5%) |
| 35 to 64 Years | 1,212 (3.1%) | 602 (1.6%) |
| 65 to 74 Years | 1,421 (16.2%) | 445 (4.5%) |
| 75 Years and over | 1,591 (29.4%) | 1,623 (22.7%) |
Disability Class: Vision Difficulty
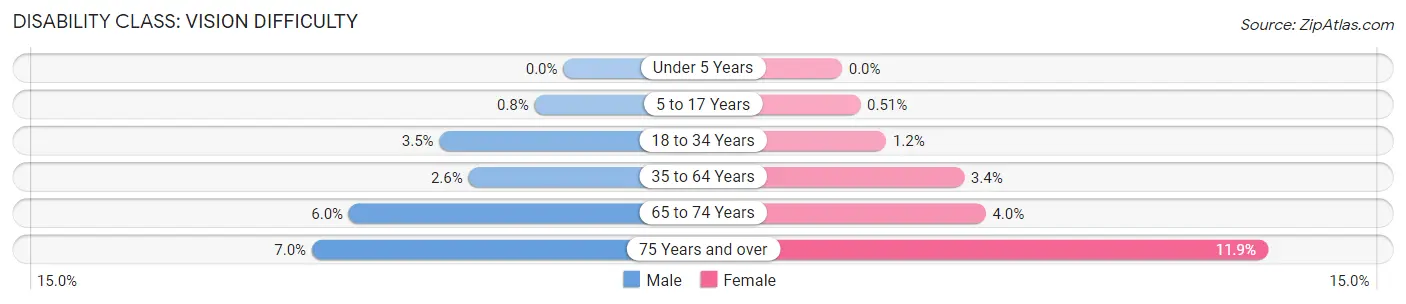
| Age Bracket | Male | Female |
| Under 5 Years | 0 (0.0%) | 0 (0.0%) |
| 5 to 17 Years | 154 (0.8%) | 92 (0.5%) |
| 18 to 34 Years | 796 (3.5%) | 273 (1.2%) |
| 35 to 64 Years | 1,023 (2.6%) | 1,302 (3.4%) |
| 65 to 74 Years | 525 (6.0%) | 395 (4.0%) |
| 75 Years and over | 379 (7.0%) | 849 (11.9%) |
Disability Class: Cognitive Difficulty
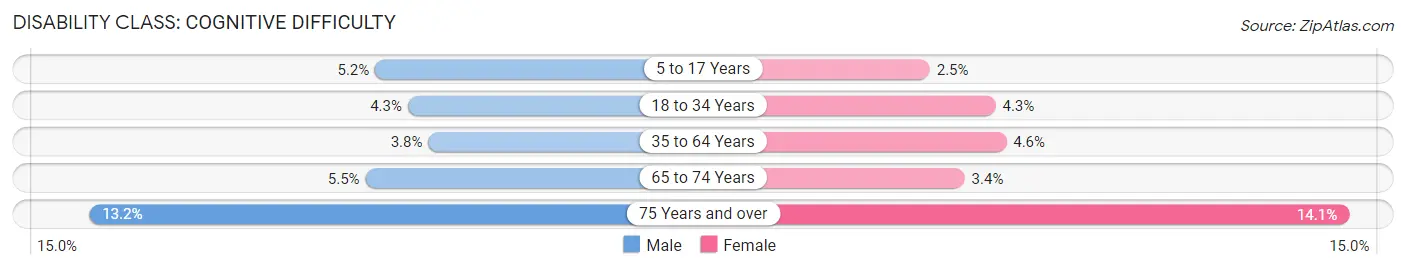
| Age Bracket | Male | Female |
| 5 to 17 Years | 1,013 (5.2%) | 444 (2.5%) |
| 18 to 34 Years | 999 (4.3%) | 950 (4.3%) |
| 35 to 64 Years | 1,456 (3.8%) | 1,757 (4.6%) |
| 65 to 74 Years | 484 (5.5%) | 337 (3.4%) |
| 75 Years and over | 715 (13.2%) | 1,011 (14.1%) |
Disability Class: Ambulatory Difficulty
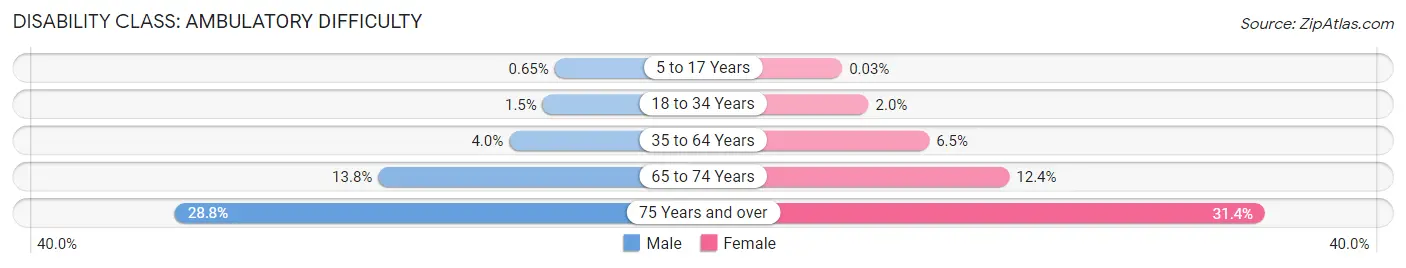
| Age Bracket | Male | Female |
| 5 to 17 Years | 125 (0.6%) | 6 (0.0%) |
| 18 to 34 Years | 355 (1.5%) | 442 (2.0%) |
| 35 to 64 Years | 1,559 (4.0%) | 2,490 (6.5%) |
| 65 to 74 Years | 1,208 (13.8%) | 1,227 (12.4%) |
| 75 Years and over | 1,562 (28.8%) | 2,249 (31.4%) |
Disability Class: Self-Care Difficulty
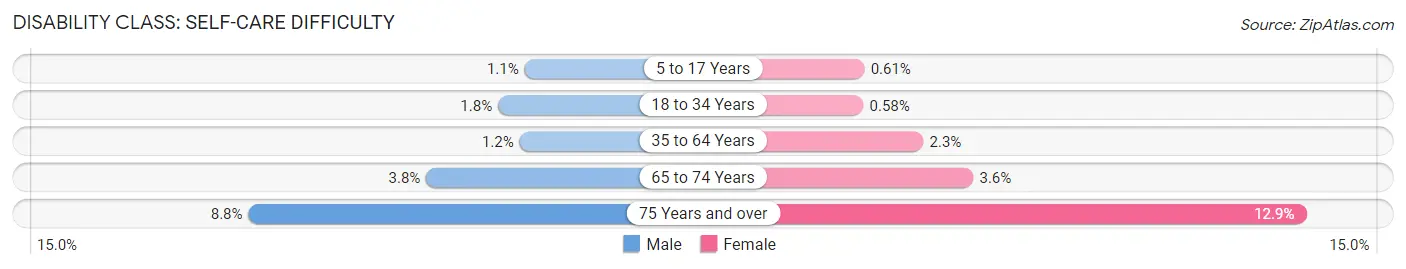
| Age Bracket | Male | Female |
| 5 to 17 Years | 209 (1.1%) | 110 (0.6%) |
| 18 to 34 Years | 419 (1.8%) | 128 (0.6%) |
| 35 to 64 Years | 472 (1.2%) | 863 (2.2%) |
| 65 to 74 Years | 336 (3.8%) | 359 (3.6%) |
| 75 Years and over | 475 (8.8%) | 926 (12.9%) |
Technology Access in Hall County
Computing Device Access in Hall County
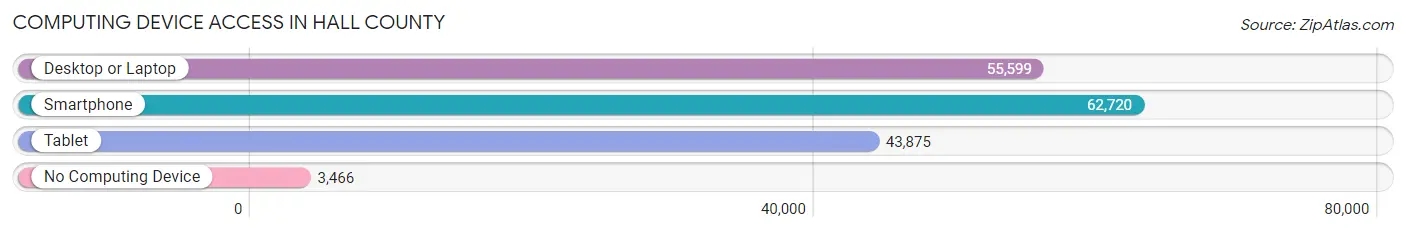
| Device Type | # Households | % Households |
| Desktop or Laptop | 55,599 | 80.1% |
| Smartphone | 62,720 | 90.4% |
| Tablet | 43,875 | 63.2% |
| No Computing Device | 3,466 | 5.0% |
| Total | 69,387 | 100.0% |
Internet Access in Hall County
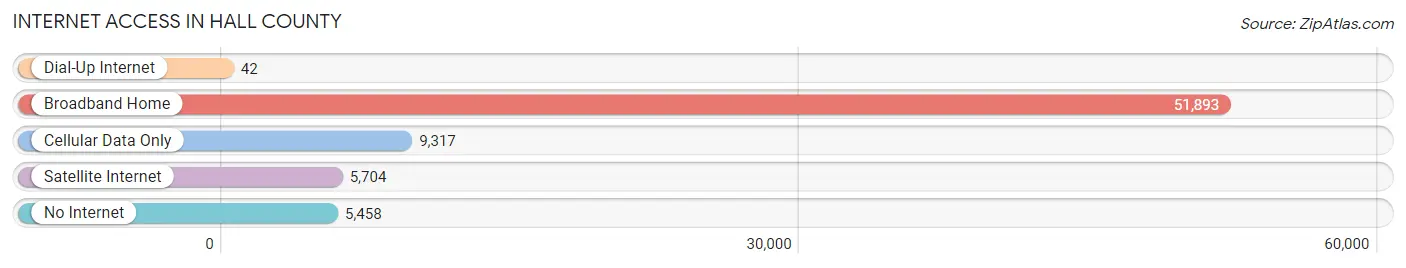
| Internet Type | # Households | % Households |
| Dial-Up Internet | 42 | 0.1% |
| Broadband Home | 51,893 | 74.8% |
| Cellular Data Only | 9,317 | 13.4% |
| Satellite Internet | 5,704 | 8.2% |
| No Internet | 5,458 | 7.9% |
| Total | 69,387 | 100.0% |
Hall County Summary
Hall County is located in the northeastern part of the state of Georgia, in the foothills of the Blue Ridge Mountains. It is bordered by Forsyth, Gwinnett, Jackson, and White counties. The county seat is Gainesville, and the largest city is Oakwood. Hall County was created in 1818 from Cherokee lands ceded in the Treaty of Cherokee Agency.
Geography
Hall County covers an area of 437 square miles, with a population of 179,684 as of the 2010 census. The county is located in the Piedmont region of Georgia, with the Blue Ridge Mountains to the north and the Chattahoochee River to the south. The county is mostly rural, with the majority of the population living in the cities of Gainesville and Oakwood. The county is home to several state parks, including Don Carter State Park, which is located on the shores of Lake Lanier.
Economy
Hall County has a diverse economy, with a mix of manufacturing, agriculture, and services. The county is home to several large employers, including the poultry processing company Fieldale Farms, the medical device manufacturer Baxter International, and the automotive parts manufacturer Koyo. The county is also home to several universities and colleges, including the University of North Georgia, Brenau University, and Lanier Technical College.
Agriculture is an important part of the county's economy, with poultry, beef cattle, and hay being the main products. The county is also home to several wineries, including the Chateau Elan Winery and the Montaluce Winery.
Demographics
As of the 2010 census, Hall County had a population of 179,684. The racial makeup of the county was 79.2% White, 14.2% African American, 0.7% Native American, 2.3% Asian, 0.1% Pacific Islander, 1.7% from other races, and 2.0% from two or more races. Hispanic or Latino of any race were 5.2% of the population.
The median income for a household in the county was $45,945, and the median income for a family was $54,817. The per capita income for the county was $24,845. About 11.2% of families and 15.2% of the population were below the poverty line, including 20.2% of those under age 18 and 9.2% of those age 65 or over.
Hall County is served by the Hall County School System, which consists of 28 elementary schools, 10 middle schools, and 8 high schools. The county is also home to several private schools, including Lakeview Academy and Riverside Military Academy.
Common Questions
What is the Total Population of Hall County?
Total Population of Hall County is 204,953.
What is the Total Male Population of Hall County?
Total Male Population of Hall County is 102,512.
What is the Total Female Population of Hall County?
Total Female Population of Hall County is 102,441.
What is the Ratio of Males per 100 Females in Hall County?
There are 100.07 Males per 100 Females in Hall County.
What is the Ratio of Females per 100 Males in Hall County?
There are 99.93 Females per 100 Males in Hall County.
What is the Median Population Age in Hall County?
Median Population Age in Hall County is 37.8 Years.
What is the Average Family Size in Hall County
Average Family Size in Hall County is 3.4 People.
What is the Average Household Size in Hall County
Average Household Size in Hall County is 2.9 People.
What is Per Capita Income in Hall County?
Per Capita income in Hall County is $35,624.
What is the Median Family Income in Hall County?
Median Family Income in Hall County is $86,127.
What is the Median Household income in Hall County?
Median Household Income in Hall County is $74,153.
What is Income or Wage Gap in Hall County?
Income or Wage Gap in Hall County is 25.3%.
Women in Hall County earn 74.7 cents for every dollar earned by a man.
What is Family Income Deficit in Hall County?
Family Income Deficit in Hall County is $11,150.
Families that are below poverty line in Hall County earn $11,150 less on average than the poverty threshold level.
What is Inequality or Gini Index in Hall County?
Inequality or Gini Index in Hall County is 0.45.
How Large is the Labor Force in Hall County?
There are 102,737 People in the Labor Forcein in Hall County.
What is the Percentage of People in the Labor Force in Hall County?
63.9% of People are in the Labor Force in Hall County.
What is the Unemployment Rate in Hall County?
Unemployment Rate in Hall County is 3.9%.