Fulton County, GA
Fulton County Map
Fulton County Overview
1,061,944
TOTAL POPULATION
518,219
MALE POPULATION
543,725
FEMALE POPULATION
95.31
MALES / 100 FEMALES
104.92
FEMALES / 100 MALES
36.1
MEDIAN AGE
3.1
AVG FAMILY SIZE
2.3
AVG HOUSEHOLD SIZE
$58,314
PER CAPITA INCOME
$115,353
AVG FAMILY INCOME
$86,267
AVG HOUSEHOLD INCOME
28.5%
WAGE / INCOME GAP [ % ]
71.5¢/ $1
WAGE / INCOME GAP [ $ ]
$11,559
FAMILY INCOME DEFICIT
0.53
INEQUALITY / GINI INDEX
594,870
LABOR FORCE [ PEOPLE ]
68.9%
PERCENT IN LABOR FORCE
5.4%
UNEMPLOYMENT RATE
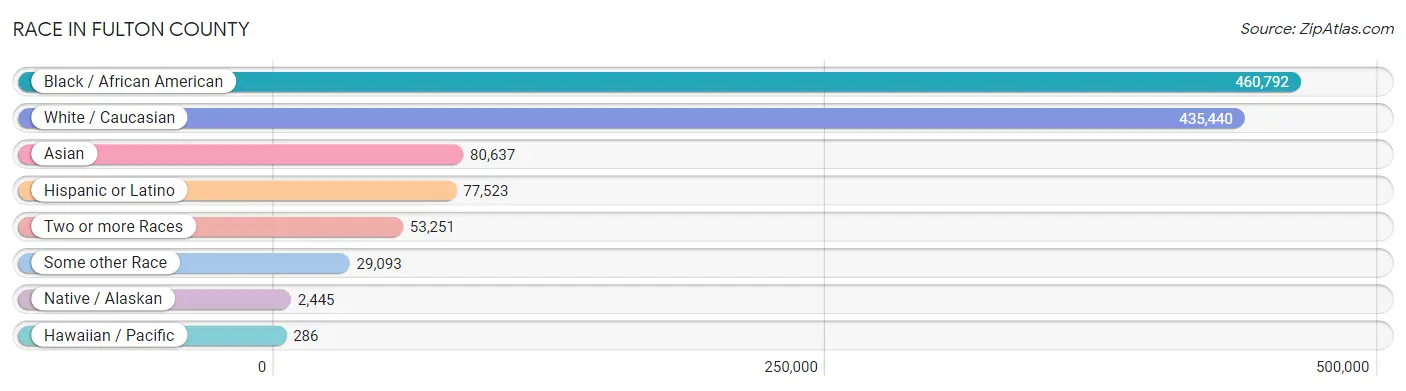
Race in Fulton County
The most populous races in Fulton County are Black / African American (460,792 | 43.4%), White / Caucasian (435,440 | 41.0%), and Asian (80,637 | 7.6%).
| Race | # Population | % Population |
| Asian | 80,637 | 7.6% |
| Black / African American | 460,792 | 43.4% |
| Hawaiian / Pacific | 286 | 0.0% |
| Hispanic or Latino | 77,523 | 7.3% |
| Native / Alaskan | 2,445 | 0.2% |
| White / Caucasian | 435,440 | 41.0% |
| Two or more Races | 53,251 | 5.0% |
| Some other Race | 29,093 | 2.7% |
| Total | 1,061,944 | 100.0% |
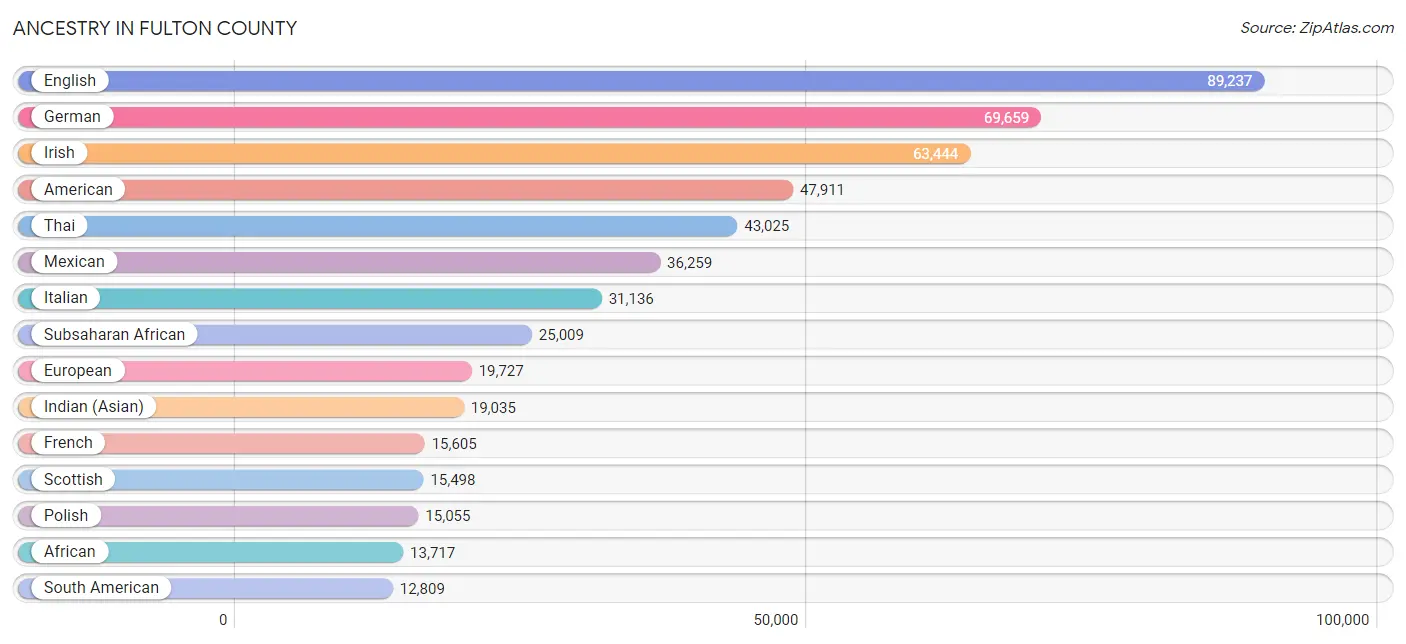
Ancestry in Fulton County
The most populous ancestries reported in Fulton County are English (89,237 | 8.4%), German (69,659 | 6.6%), Irish (63,444 | 6.0%), American (47,911 | 4.5%), and Thai (43,025 | 4.1%), together accounting for 29.5% of all Fulton County residents.
| Ancestry | # Population | % Population |
| Afghan | 84 | 0.0% |
| African | 13,717 | 1.3% |
| Alaskan Athabascan | 7 | 0.0% |
| Albanian | 90 | 0.0% |
| Alsatian | 56 | 0.0% |
| American | 47,911 | 4.5% |
| Apache | 52 | 0.0% |
| Arab | 6,816 | 0.6% |
| Argentinean | 1,083 | 0.1% |
| Armenian | 476 | 0.0% |
| Assyrian / Chaldean / Syriac | 42 | 0.0% |
| Australian | 394 | 0.0% |
| Austrian | 2,182 | 0.2% |
| Bahamian | 306 | 0.0% |
| Bangladeshi | 94 | 0.0% |
| Barbadian | 397 | 0.0% |
| Basque | 16 | 0.0% |
| Belgian | 428 | 0.0% |
| Belizean | 438 | 0.0% |
| Bermudan | 52 | 0.0% |
| Bhutanese | 3,623 | 0.3% |
| Blackfeet | 562 | 0.1% |
| Bolivian | 338 | 0.0% |
| Brazilian | 3,500 | 0.3% |
| British | 7,510 | 0.7% |
| British West Indian | 536 | 0.1% |
| Bulgarian | 463 | 0.0% |
| Burmese | 9,612 | 0.9% |
| Cajun | 180 | 0.0% |
| Cambodian | 33 | 0.0% |
| Canadian | 1,842 | 0.2% |
| Cape Verdean | 101 | 0.0% |
| Celtic | 207 | 0.0% |
| Central American | 7,957 | 0.7% |
| Central American Indian | 767 | 0.1% |
| Cherokee | 2,365 | 0.2% |
| Chickasaw | 19 | 0.0% |
| Chilean | 333 | 0.0% |
| Chippewa | 80 | 0.0% |
| Choctaw | 180 | 0.0% |
| Colombian | 4,374 | 0.4% |
| Comanche | 8 | 0.0% |
| Costa Rican | 828 | 0.1% |
| Creek | 214 | 0.0% |
| Croatian | 743 | 0.1% |
| Crow | 2 | 0.0% |
| Cuban | 3,418 | 0.3% |
| Cypriot | 31 | 0.0% |
| Czech | 1,978 | 0.2% |
| Czechoslovakian | 477 | 0.0% |
| Danish | 2,087 | 0.2% |
| Delaware | 22 | 0.0% |
| Dominican | 2,507 | 0.2% |
| Dutch | 4,689 | 0.4% |
| Dutch West Indian | 51 | 0.0% |
| Eastern European | 5,161 | 0.5% |
| Ecuadorian | 912 | 0.1% |
| Egyptian | 887 | 0.1% |
| English | 89,237 | 8.4% |
| Estonian | 33 | 0.0% |
| Ethiopian | 1,231 | 0.1% |
| European | 19,727 | 1.9% |
| Fijian | 6 | 0.0% |
| Filipino | 1,045 | 0.1% |
| Finnish | 739 | 0.1% |
| French | 15,605 | 1.5% |
| French American Indian | 37 | 0.0% |
| French Canadian | 2,433 | 0.2% |
| German | 69,659 | 6.6% |
| German Russian | 12 | 0.0% |
| Ghanaian | 1,457 | 0.1% |
| Greek | 2,975 | 0.3% |
| Guamanian / Chamorro | 134 | 0.0% |
| Guatemalan | 1,362 | 0.1% |
| Guyanese | 1,205 | 0.1% |
| Haitian | 3,545 | 0.3% |
| Honduran | 2,150 | 0.2% |
| Hungarian | 2,439 | 0.2% |
| Icelander | 54 | 0.0% |
| Indian (Asian) | 19,035 | 1.8% |
| Indonesian | 31 | 0.0% |
| Inupiat | 42 | 0.0% |
| Iranian | 3,450 | 0.3% |
| Iraqi | 695 | 0.1% |
| Irish | 63,444 | 6.0% |
| Iroquois | 50 | 0.0% |
| Israeli | 790 | 0.1% |
| Italian | 31,136 | 2.9% |
| Jamaican | 8,573 | 0.8% |
| Japanese | 304 | 0.0% |
| Jordanian | 184 | 0.0% |
| Kenyan | 415 | 0.0% |
| Korean | 6,399 | 0.6% |
| Laotian | 478 | 0.1% |
| Latvian | 634 | 0.1% |
| Lebanese | 1,634 | 0.2% |
| Liberian | 596 | 0.1% |
| Lithuanian | 2,003 | 0.2% |
| Lumbee | 158 | 0.0% |
| Luxembourger | 158 | 0.0% |
| Macedonian | 10 | 0.0% |
| Malaysian | 343 | 0.0% |
| Maltese | 134 | 0.0% |
| Marshallese | 64 | 0.0% |
| Mexican | 36,259 | 3.4% |
| Mexican American Indian | 968 | 0.1% |
| Mongolian | 133 | 0.0% |
| Moroccan | 460 | 0.0% |
| Native Hawaiian | 216 | 0.0% |
| Navajo | 63 | 0.0% |
| New Zealander | 13 | 0.0% |
| Nicaraguan | 769 | 0.1% |
| Nigerian | 4,225 | 0.4% |
| Northern European | 1,744 | 0.2% |
| Norwegian | 4,634 | 0.4% |
| Okinawan | 55 | 0.0% |
| Osage | 9 | 0.0% |
| Pakistani | 773 | 0.1% |
| Palestinian | 274 | 0.0% |
| Panamanian | 1,157 | 0.1% |
| Paraguayan | 48 | 0.0% |
| Pennsylvania German | 19 | 0.0% |
| Peruvian | 1,485 | 0.1% |
| Polish | 15,055 | 1.4% |
| Portuguese | 2,735 | 0.3% |
| Puerto Rican | 8,714 | 0.8% |
| Romanian | 1,486 | 0.1% |
| Russian | 10,714 | 1.0% |
| Salvadoran | 1,691 | 0.2% |
| Samoan | 167 | 0.0% |
| Scandinavian | 1,850 | 0.2% |
| Scotch-Irish | 11,920 | 1.1% |
| Scottish | 15,498 | 1.5% |
| Seminole | 192 | 0.0% |
| Senegalese | 361 | 0.0% |
| Serbian | 290 | 0.0% |
| Sierra Leonean | 161 | 0.0% |
| Sioux | 26 | 0.0% |
| Slavic | 114 | 0.0% |
| Slovak | 1,013 | 0.1% |
| Slovene | 227 | 0.0% |
| Somali | 65 | 0.0% |
| South African | 523 | 0.1% |
| South American | 12,809 | 1.2% |
| South American Indian | 232 | 0.0% |
| Soviet Union | 193 | 0.0% |
| Spaniard | 1,773 | 0.2% |
| Spanish | 1,566 | 0.2% |
| Spanish American | 75 | 0.0% |
| Spanish American Indian | 52 | 0.0% |
| Sri Lankan | 3,891 | 0.4% |
| Subsaharan African | 25,009 | 2.4% |
| Sudanese | 205 | 0.0% |
| Swedish | 5,359 | 0.5% |
| Swiss | 1,378 | 0.1% |
| Syrian | 912 | 0.1% |
| Thai | 43,025 | 4.1% |
| Trinidadian and Tobagonian | 2,126 | 0.2% |
| Turkish | 1,802 | 0.2% |
| U.S. Virgin Islander | 202 | 0.0% |
| Ugandan | 51 | 0.0% |
| Ukrainian | 2,376 | 0.2% |
| Uruguayan | 493 | 0.1% |
| Ute | 9 | 0.0% |
| Venezuelan | 3,653 | 0.3% |
| Vietnamese | 503 | 0.1% |
| Welsh | 4,949 | 0.5% |
| West Indian | 1,674 | 0.2% |
| Yugoslavian | 466 | 0.0% |
| Yup'ik | 4 | 0.0% |
| Zimbabwean | 210 | 0.0% | View All 171 Rows |
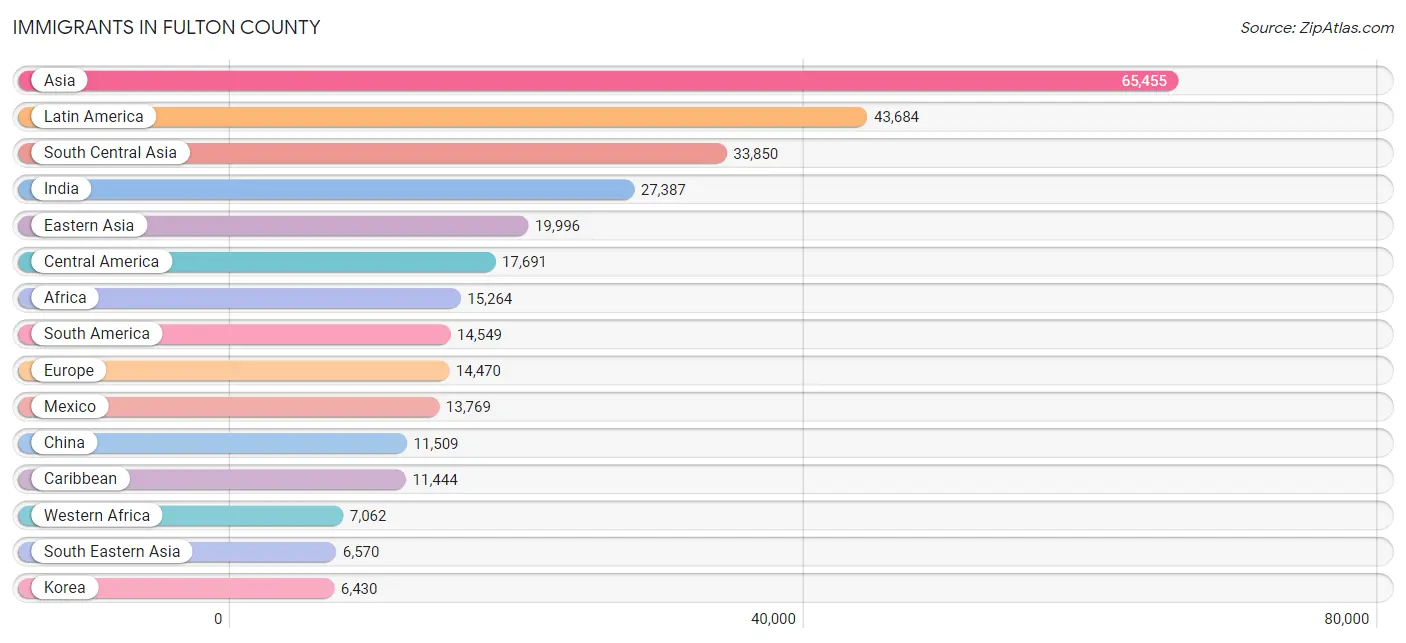
Immigrants in Fulton County
The most numerous immigrant groups reported in Fulton County came from Asia (65,455 | 6.2%), Latin America (43,684 | 4.1%), South Central Asia (33,850 | 3.2%), India (27,387 | 2.6%), and Eastern Asia (19,996 | 1.9%), together accounting for 17.9% of all Fulton County residents.
| Immigration Origin | # Population | % Population |
| Afghanistan | 78 | 0.0% |
| Africa | 15,264 | 1.4% |
| Argentina | 460 | 0.0% |
| Armenia | 34 | 0.0% |
| Asia | 65,455 | 6.2% |
| Australia | 549 | 0.1% |
| Austria | 176 | 0.0% |
| Bahamas | 380 | 0.0% |
| Bangladesh | 756 | 0.1% |
| Barbados | 314 | 0.0% |
| Belarus | 296 | 0.0% |
| Belgium | 169 | 0.0% |
| Belize | 193 | 0.0% |
| Bolivia | 285 | 0.0% |
| Bosnia and Herzegovina | 180 | 0.0% |
| Brazil | 4,809 | 0.4% |
| Bulgaria | 245 | 0.0% |
| Cambodia | 124 | 0.0% |
| Cameroon | 421 | 0.0% |
| Canada | 3,162 | 0.3% |
| Caribbean | 11,444 | 1.1% |
| Central America | 17,691 | 1.7% |
| Chile | 127 | 0.0% |
| China | 11,509 | 1.1% |
| Colombia | 2,932 | 0.3% |
| Congo | 41 | 0.0% |
| Costa Rica | 454 | 0.0% |
| Croatia | 41 | 0.0% |
| Cuba | 1,192 | 0.1% |
| Czechoslovakia | 208 | 0.0% |
| Denmark | 237 | 0.0% |
| Dominica | 293 | 0.0% |
| Dominican Republic | 600 | 0.1% |
| Eastern Africa | 3,206 | 0.3% |
| Eastern Asia | 19,996 | 1.9% |
| Eastern Europe | 5,180 | 0.5% |
| Ecuador | 551 | 0.1% |
| Egypt | 601 | 0.1% |
| El Salvador | 891 | 0.1% |
| England | 771 | 0.1% |
| Eritrea | 144 | 0.0% |
| Ethiopia | 861 | 0.1% |
| Europe | 14,470 | 1.4% |
| France | 1,188 | 0.1% |
| Germany | 2,402 | 0.2% |
| Ghana | 1,454 | 0.1% |
| Greece | 211 | 0.0% |
| Grenada | 67 | 0.0% |
| Guatemala | 910 | 0.1% |
| Guyana | 805 | 0.1% |
| Haiti | 1,675 | 0.2% |
| Honduras | 1,116 | 0.1% |
| Hong Kong | 507 | 0.1% |
| Hungary | 68 | 0.0% |
| India | 27,387 | 2.6% |
| Indonesia | 327 | 0.0% |
| Iran | 2,351 | 0.2% |
| Iraq | 810 | 0.1% |
| Ireland | 222 | 0.0% |
| Israel | 1,256 | 0.1% |
| Italy | 435 | 0.0% |
| Jamaica | 5,326 | 0.5% |
| Japan | 1,997 | 0.2% |
| Jordan | 152 | 0.0% |
| Kazakhstan | 56 | 0.0% |
| Kenya | 888 | 0.1% |
| Korea | 6,430 | 0.6% |
| Kuwait | 271 | 0.0% |
| Laos | 263 | 0.0% |
| Latin America | 43,684 | 4.1% |
| Latvia | 322 | 0.0% |
| Lebanon | 203 | 0.0% |
| Liberia | 447 | 0.0% |
| Lithuania | 119 | 0.0% |
| Malaysia | 815 | 0.1% |
| Mexico | 13,769 | 1.3% |
| Micronesia | 20 | 0.0% |
| Middle Africa | 705 | 0.1% |
| Moldova | 87 | 0.0% |
| Morocco | 428 | 0.0% |
| Nepal | 438 | 0.0% |
| Netherlands | 280 | 0.0% |
| Nicaragua | 167 | 0.0% |
| Nigeria | 2,992 | 0.3% |
| Northern Africa | 1,583 | 0.2% |
| Northern Europe | 3,641 | 0.3% |
| Oceania | 679 | 0.1% |
| Pakistan | 1,048 | 0.1% |
| Panama | 191 | 0.0% |
| Peru | 1,010 | 0.1% |
| Philippines | 2,438 | 0.2% |
| Poland | 427 | 0.0% |
| Portugal | 257 | 0.0% |
| Romania | 732 | 0.1% |
| Russia | 1,247 | 0.1% |
| Saudi Arabia | 199 | 0.0% |
| Scotland | 51 | 0.0% |
| Senegal | 599 | 0.1% |
| Serbia | 13 | 0.0% |
| Sierra Leone | 436 | 0.0% |
| Singapore | 159 | 0.0% |
| South Africa | 2,083 | 0.2% |
| South America | 14,549 | 1.4% |
| South Central Asia | 33,850 | 3.2% |
| South Eastern Asia | 6,570 | 0.6% |
| Southern Europe | 1,315 | 0.1% |
| Spain | 412 | 0.0% |
| Sri Lanka | 427 | 0.0% |
| St. Vincent and the Grenadines | 179 | 0.0% |
| Sudan | 142 | 0.0% |
| Sweden | 92 | 0.0% |
| Switzerland | 34 | 0.0% |
| Syria | 492 | 0.1% |
| Taiwan | 1,335 | 0.1% |
| Thailand | 342 | 0.0% |
| Trinidad and Tobago | 1,149 | 0.1% |
| Turkey | 1,090 | 0.1% |
| Uganda | 67 | 0.0% |
| Ukraine | 804 | 0.1% |
| Uruguay | 290 | 0.0% |
| Uzbekistan | 1,273 | 0.1% |
| Venezuela | 3,116 | 0.3% |
| Vietnam | 2,071 | 0.2% |
| West Indies | 31 | 0.0% |
| Western Africa | 7,062 | 0.7% |
| Western Asia | 5,007 | 0.5% |
| Western Europe | 4,265 | 0.4% |
| Zaire | 203 | 0.0% |
| Zimbabwe | 294 | 0.0% | View All 129 Rows |
Sex and Age in Fulton County
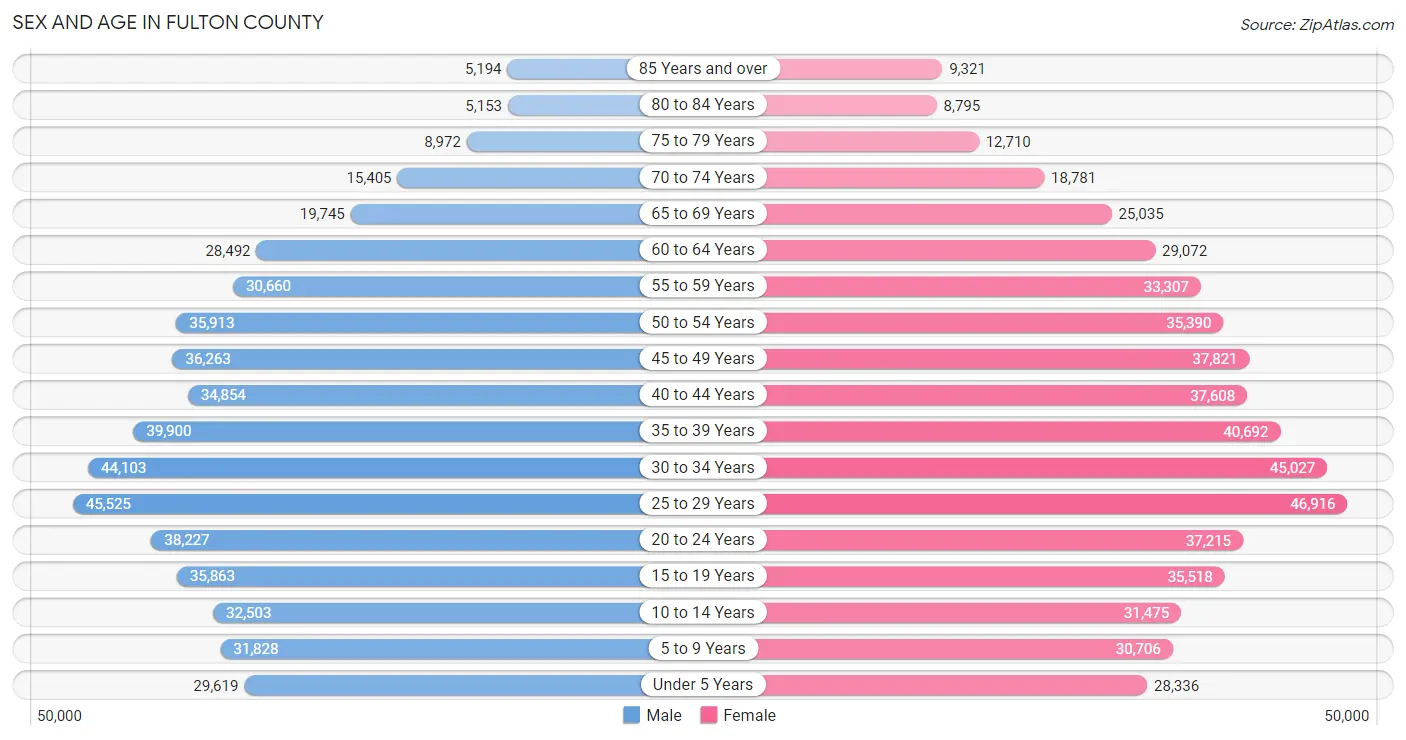
Sex and Age in Fulton County
The most populous age groups in Fulton County are 25 to 29 Years (45,525 | 8.8%) for men and 25 to 29 Years (46,916 | 8.6%) for women.
| Age Bracket | Male | Female |
| Under 5 Years | 29,619 (5.7%) | 28,336 (5.2%) |
| 5 to 9 Years | 31,828 (6.1%) | 30,706 (5.7%) |
| 10 to 14 Years | 32,503 (6.3%) | 31,475 (5.8%) |
| 15 to 19 Years | 35,863 (6.9%) | 35,518 (6.5%) |
| 20 to 24 Years | 38,227 (7.4%) | 37,215 (6.8%) |
| 25 to 29 Years | 45,525 (8.8%) | 46,916 (8.6%) |
| 30 to 34 Years | 44,103 (8.5%) | 45,027 (8.3%) |
| 35 to 39 Years | 39,900 (7.7%) | 40,692 (7.5%) |
| 40 to 44 Years | 34,854 (6.7%) | 37,608 (6.9%) |
| 45 to 49 Years | 36,263 (7.0%) | 37,821 (7.0%) |
| 50 to 54 Years | 35,913 (6.9%) | 35,390 (6.5%) |
| 55 to 59 Years | 30,660 (5.9%) | 33,307 (6.1%) |
| 60 to 64 Years | 28,492 (5.5%) | 29,072 (5.3%) |
| 65 to 69 Years | 19,745 (3.8%) | 25,035 (4.6%) |
| 70 to 74 Years | 15,405 (3.0%) | 18,781 (3.5%) |
| 75 to 79 Years | 8,972 (1.7%) | 12,710 (2.3%) |
| 80 to 84 Years | 5,153 (1.0%) | 8,795 (1.6%) |
| 85 Years and over | 5,194 (1.0%) | 9,321 (1.7%) |
| Total | 518,219 (100.0%) | 543,725 (100.0%) |
Families and Households in Fulton County
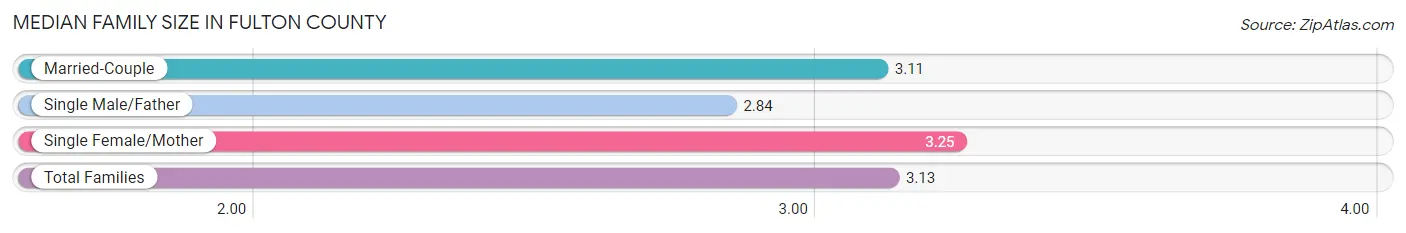
Median Family Size in Fulton County
The median family size in Fulton County is 3.13 persons per family, with single female/mother families (61,982 | 26.0%) accounting for the largest median family size of 3.25 persons per family. On the other hand, single male/father families (17,695 | 7.4%) represent the smallest median family size with 2.84 persons per family.
| Family Type | # Families | Family Size |
| Married-Couple | 159,202 (66.6%) | 3.11 |
| Single Male/Father | 17,695 (7.4%) | 2.84 |
| Single Female/Mother | 61,982 (26.0%) | 3.25 |
| Total Families | 238,879 (100.0%) | 3.13 |
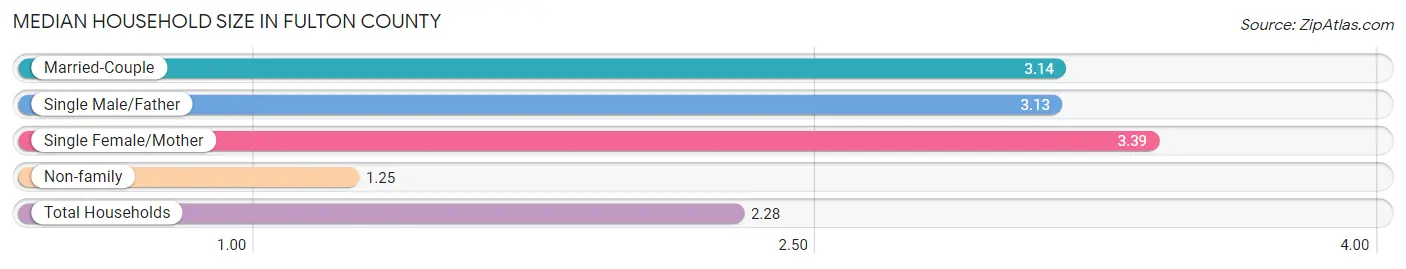
Median Household Size in Fulton County
The median household size in Fulton County is 2.28 persons per household, with single female/mother households (61,982 | 13.8%) accounting for the largest median household size of 3.39 persons per household. non-family households (211,977 | 47.0%) represent the smallest median household size with 1.25 persons per household.
| Household Type | # Households | Household Size |
| Married-Couple | 159,202 (35.3%) | 3.14 |
| Single Male/Father | 17,695 (3.9%) | 3.13 |
| Single Female/Mother | 61,982 (13.8%) | 3.39 |
| Non-family | 211,977 (47.0%) | 1.25 |
| Total Households | 450,856 (100.0%) | 2.28 |
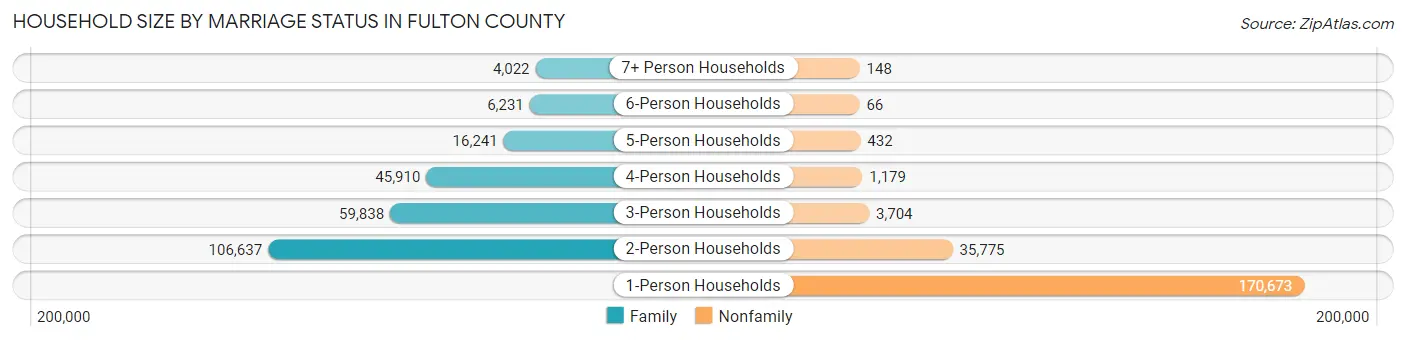
Household Size by Marriage Status in Fulton County
Out of a total of 450,856 households in Fulton County, 238,879 (53.0%) are family households, while 211,977 (47.0%) are nonfamily households. The most numerous type of family households are 2-person households, comprising 106,637, and the most common type of nonfamily households are 1-person households, comprising 170,673.
| Household Size | Family Households | Nonfamily Households |
| 1-Person Households | - | 170,673 (37.9%) |
| 2-Person Households | 106,637 (23.6%) | 35,775 (7.9%) |
| 3-Person Households | 59,838 (13.3%) | 3,704 (0.8%) |
| 4-Person Households | 45,910 (10.2%) | 1,179 (0.3%) |
| 5-Person Households | 16,241 (3.6%) | 432 (0.1%) |
| 6-Person Households | 6,231 (1.4%) | 66 (0.0%) |
| 7+ Person Households | 4,022 (0.9%) | 148 (0.0%) |
| Total | 238,879 (53.0%) | 211,977 (47.0%) |
Female Fertility in Fulton County
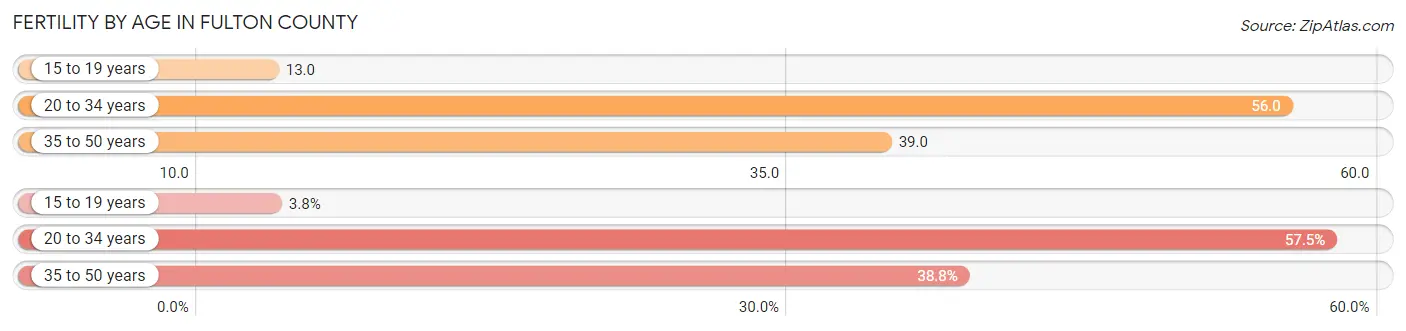
Fertility by Age in Fulton County
Average fertility rate in Fulton County is 43.0 births per 1,000 women. Women in the age bracket of 20 to 34 years have the highest fertility rate with 56.0 births per 1,000 women. Women in the age bracket of 20 to 34 years acount for 57.5% of all women with births.
| Age Bracket | Women with Births | Births / 1,000 Women |
| 15 to 19 years | 470 (3.8%) | 13.0 |
| 20 to 34 years | 7,179 (57.5%) | 56.0 |
| 35 to 50 years | 4,842 (38.8%) | 39.0 |
| Total | 12,491 (100.0%) | 43.0 |
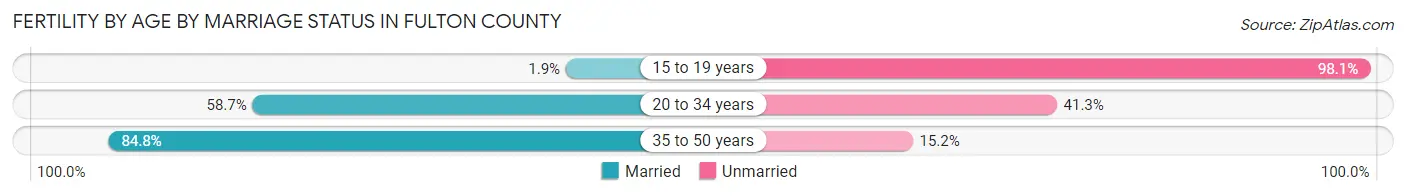
Fertility by Age by Marriage Status in Fulton County
66.7% of women with births (12,491) in Fulton County are married. The highest percentage of unmarried women with births falls into 15 to 19 years age bracket with 98.1% of them unmarried at the time of birth, while the lowest percentage of unmarried women with births belong to 35 to 50 years age bracket with 15.2% of them unmarried.
| Age Bracket | Married | Unmarried |
| 15 to 19 years | 9 (1.9%) | 461 (98.1%) |
| 20 to 34 years | 4,214 (58.7%) | 2,965 (41.3%) |
| 35 to 50 years | 4,106 (84.8%) | 736 (15.2%) |
| Total | 8,331 (66.7%) | 4,160 (33.3%) |
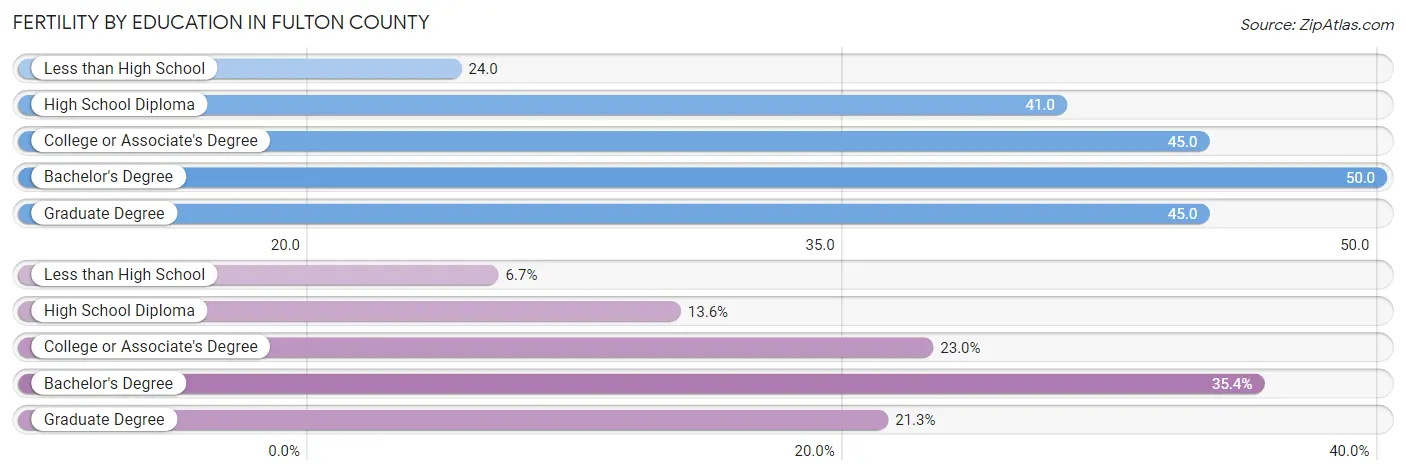
Fertility by Education in Fulton County
Average fertility rate in Fulton County is 43.0 births per 1,000 women. Women with the education attainment of bachelor's degree have the highest fertility rate of 50.0 births per 1,000 women, while women with the education attainment of less than high school have the lowest fertility at 24.0 births per 1,000 women. Women with the education attainment of bachelor's degree represent 35.4% of all women with births.
| Educational Attainment | Women with Births | Births / 1,000 Women |
| Less than High School | 839 (6.7%) | 24.0 |
| High School Diploma | 1,693 (13.6%) | 41.0 |
| College or Associate's Degree | 2,874 (23.0%) | 45.0 |
| Bachelor's Degree | 4,422 (35.4%) | 50.0 |
| Graduate Degree | 2,663 (21.3%) | 45.0 |
| Total | 12,491 (100.0%) | 43.0 |
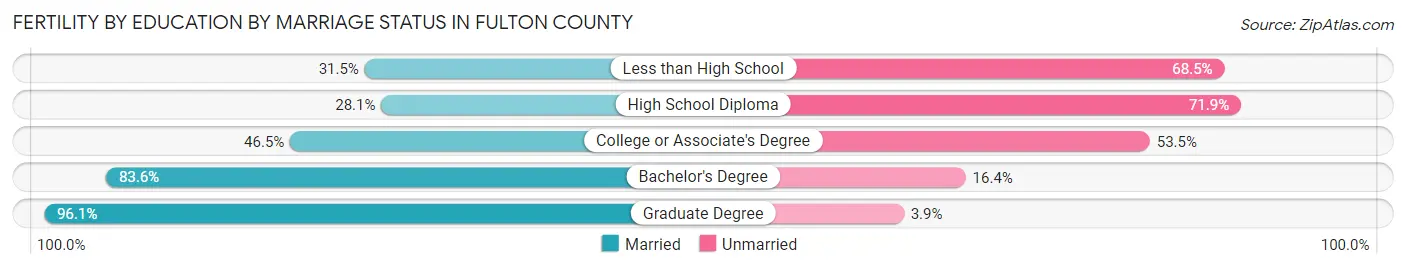
Fertility by Education by Marriage Status in Fulton County
33.3% of women with births in Fulton County are unmarried. Women with the educational attainment of graduate degree are most likely to be married with 96.1% of them married at childbirth, while women with the educational attainment of high school diploma are least likely to be married with 71.9% of them unmarried at childbirth.
| Educational Attainment | Married | Unmarried |
| Less than High School | 264 (31.5%) | 575 (68.5%) |
| High School Diploma | 476 (28.1%) | 1,217 (71.9%) |
| College or Associate's Degree | 1,336 (46.5%) | 1,538 (53.5%) |
| Bachelor's Degree | 3,697 (83.6%) | 725 (16.4%) |
| Graduate Degree | 2,559 (96.1%) | 104 (3.9%) |
| Total | 8,331 (66.7%) | 4,160 (33.3%) |
Income in Fulton County
Income Overview in Fulton County
Per Capita Income in Fulton County is $58,314, while median incomes of families and households are $115,353 and $86,267 respectively.
| Characteristic | Number | Measure |
| Per Capita Income | 1,061,944 | $58,314 |
| Median Family Income | 238,879 | $115,353 |
| Mean Family Income | 238,879 | $175,874 |
| Median Household Income | 450,856 | $86,267 |
| Mean Household Income | 450,856 | $134,949 |
| Income Deficit | 238,879 | $11,559 |
| Wage / Income Gap (%) | 1,061,944 | 28.49% |
| Wage / Income Gap ($) | 1,061,944 | 71.51¢ per $1 |
| Gini / Inequality Index | 1,061,944 | 0.53 |
Earnings by Sex in Fulton County
Average Earnings in Fulton County are $53,380, $63,293 for men and $45,262 for women, a difference of 28.5%.
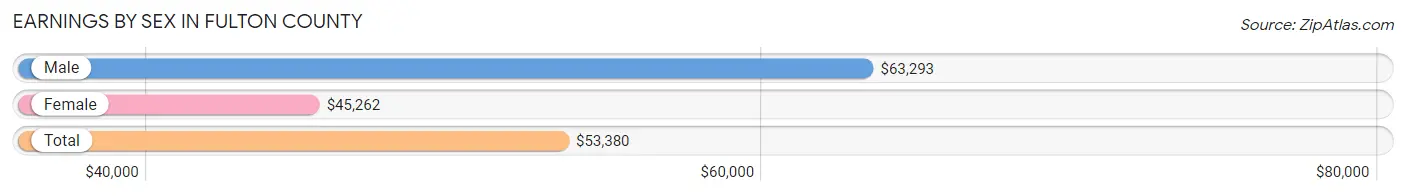
| Sex | Number | Average Earnings |
| Male | 318,156 (51.4%) | $63,293 |
| Female | 300,683 (48.6%) | $45,262 |
| Total | 618,839 (100.0%) | $53,380 |
Earnings by Sex by Income Bracket in Fulton County
The most common earnings brackets in Fulton County are $100,000+ for men (101,795 | 32.0%) and $100,000+ for women (52,820 | 17.6%).
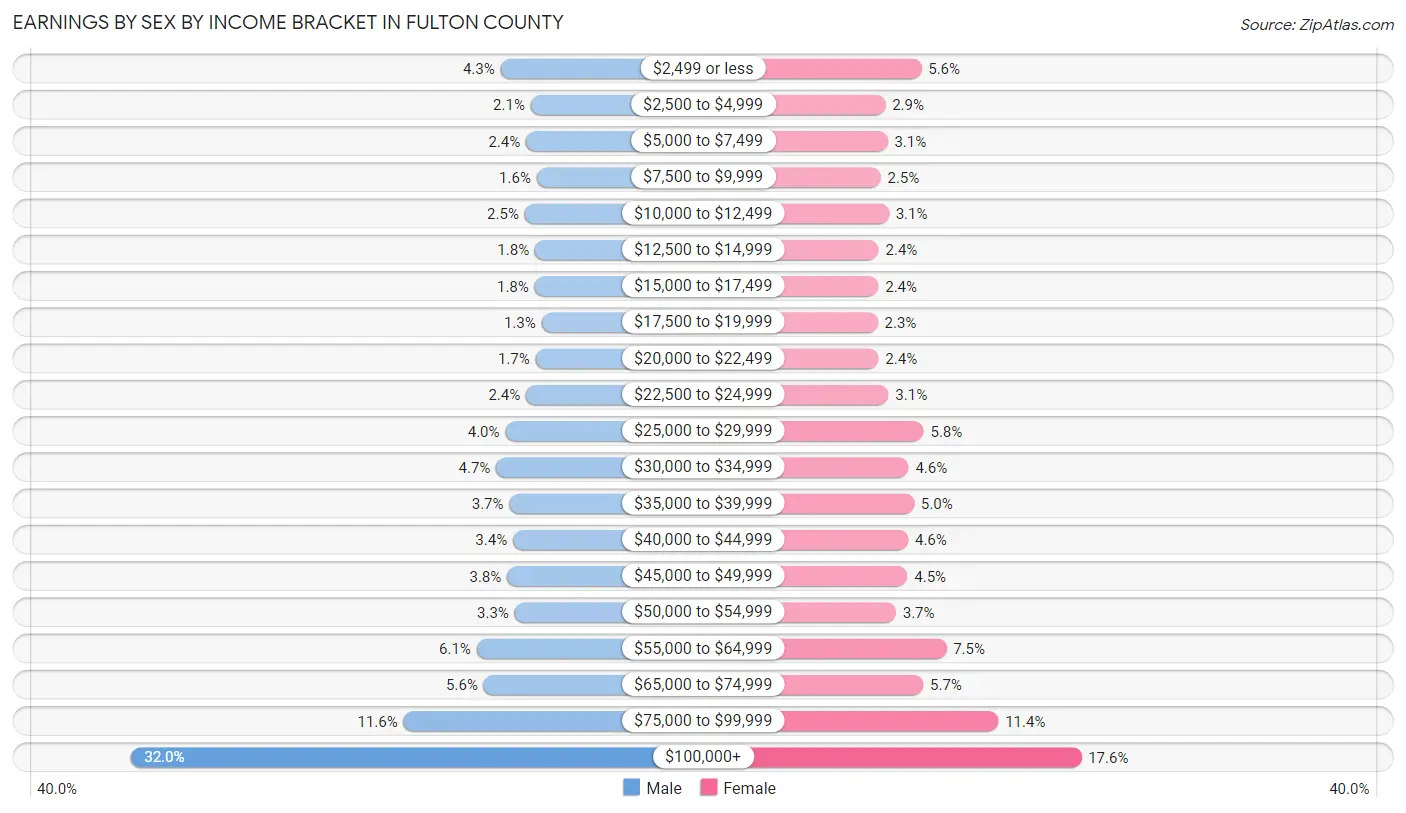
| Income | Male | Female |
| $2,499 or less | 13,774 (4.3%) | 16,785 (5.6%) |
| $2,500 to $4,999 | 6,594 (2.1%) | 8,646 (2.9%) |
| $5,000 to $7,499 | 7,685 (2.4%) | 9,171 (3.0%) |
| $7,500 to $9,999 | 5,148 (1.6%) | 7,617 (2.5%) |
| $10,000 to $12,499 | 8,010 (2.5%) | 9,456 (3.1%) |
| $12,500 to $14,999 | 5,583 (1.8%) | 7,167 (2.4%) |
| $15,000 to $17,499 | 5,679 (1.8%) | 7,092 (2.4%) |
| $17,500 to $19,999 | 4,021 (1.3%) | 6,932 (2.3%) |
| $20,000 to $22,499 | 5,445 (1.7%) | 7,131 (2.4%) |
| $22,500 to $24,999 | 7,712 (2.4%) | 9,377 (3.1%) |
| $25,000 to $29,999 | 12,621 (4.0%) | 17,287 (5.8%) |
| $30,000 to $34,999 | 14,822 (4.7%) | 13,879 (4.6%) |
| $35,000 to $39,999 | 11,687 (3.7%) | 15,122 (5.0%) |
| $40,000 to $44,999 | 10,802 (3.4%) | 13,796 (4.6%) |
| $45,000 to $49,999 | 12,216 (3.8%) | 13,661 (4.5%) |
| $50,000 to $54,999 | 10,390 (3.3%) | 11,037 (3.7%) |
| $55,000 to $64,999 | 19,462 (6.1%) | 22,394 (7.4%) |
| $65,000 to $74,999 | 17,791 (5.6%) | 17,185 (5.7%) |
| $75,000 to $99,999 | 36,919 (11.6%) | 34,128 (11.4%) |
| $100,000+ | 101,795 (32.0%) | 52,820 (17.6%) |
| Total | 318,156 (100.0%) | 300,683 (100.0%) |
Earnings by Sex by Educational Attainment in Fulton County
Average earnings in Fulton County are $73,585 for men and $52,123 for women, a difference of 29.2%. Men with an educational attainment of graduate degree enjoy the highest average annual earnings of $117,668, while those with less than high school education earn the least with $30,956. Women with an educational attainment of graduate degree earn the most with the average annual earnings of $79,323, while those with less than high school education have the smallest earnings of $23,072.
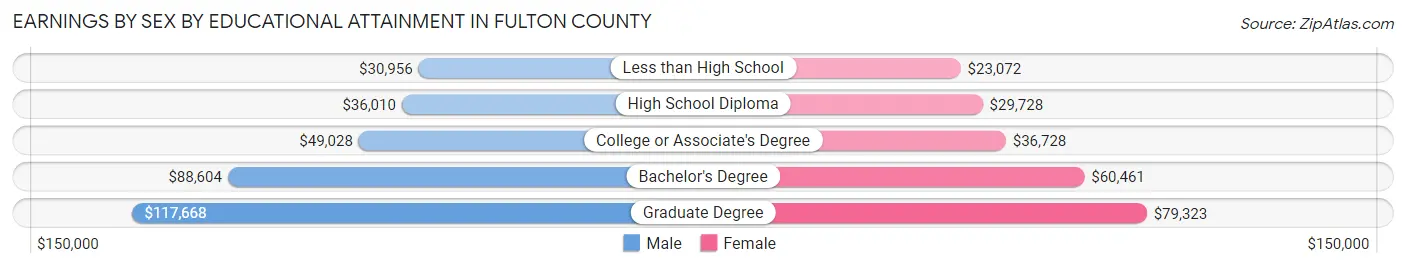
| Educational Attainment | Male Income | Female Income |
| Less than High School | $30,956 | $23,072 |
| High School Diploma | $36,010 | $29,728 |
| College or Associate's Degree | $49,028 | $36,728 |
| Bachelor's Degree | $88,604 | $60,461 |
| Graduate Degree | $117,668 | $79,323 |
| Total | $73,585 | $52,123 |
Family Income in Fulton County
Family Income Brackets in Fulton County
According to the Fulton County family income data, there are 68,081 families falling into the $200,000+ income range, which is the most common income bracket and makes up 28.5% of all families. Conversely, the $10,000 to $14,999 income bracket is the least frequent group with only 4,300 families (1.8%) belonging to this category.
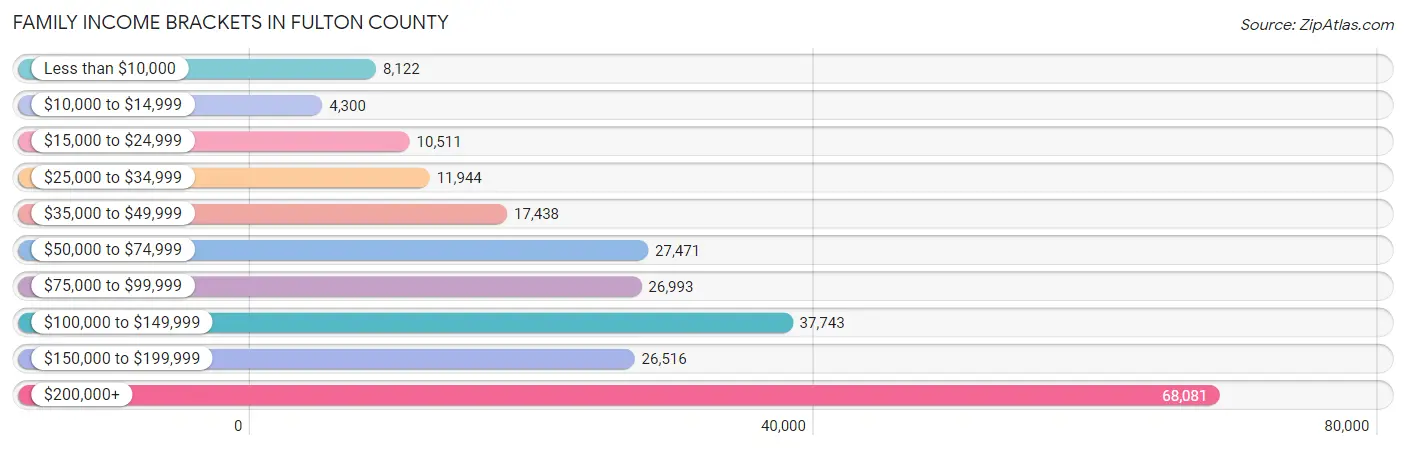
| Income Bracket | # Families | % Families |
| Less than $10,000 | 8,122 | 3.4% |
| $10,000 to $14,999 | 4,300 | 1.8% |
| $15,000 to $24,999 | 10,511 | 4.4% |
| $25,000 to $34,999 | 11,944 | 5.0% |
| $35,000 to $49,999 | 17,438 | 7.3% |
| $50,000 to $74,999 | 27,471 | 11.5% |
| $75,000 to $99,999 | 26,993 | 11.3% |
| $100,000 to $149,999 | 37,743 | 15.8% |
| $150,000 to $199,999 | 26,516 | 11.1% |
| $200,000+ | 68,081 | 28.5% |
Family Income by Famaliy Size in Fulton County
4-person families (44,694 | 18.7%) account for the highest median family income in Fulton County with $158,131 per family, while 2-person families (113,612 | 47.6%) have the highest median income of $51,224 per family member.
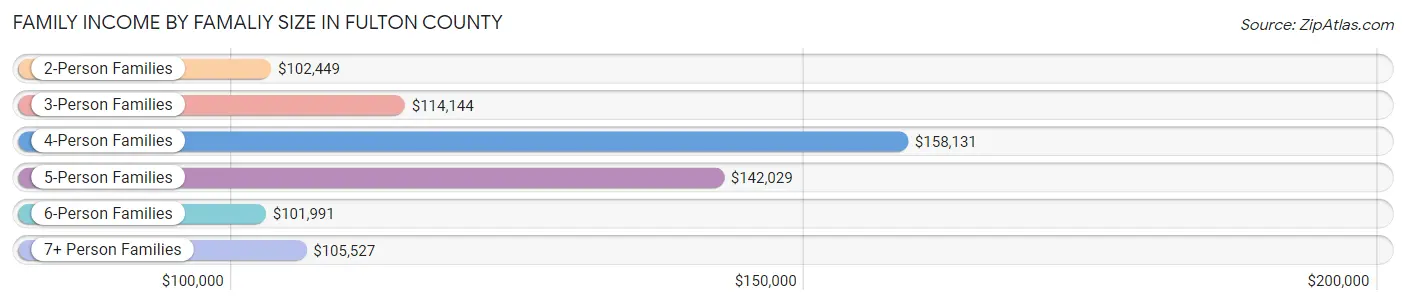
| Income Bracket | # Families | Median Income |
| 2-Person Families | 113,612 (47.6%) | $102,449 |
| 3-Person Families | 56,607 (23.7%) | $114,144 |
| 4-Person Families | 44,694 (18.7%) | $158,131 |
| 5-Person Families | 15,169 (6.4%) | $142,029 |
| 6-Person Families | 5,488 (2.3%) | $101,991 |
| 7+ Person Families | 3,309 (1.4%) | $105,527 |
| Total | 238,879 (100.0%) | $115,353 |
Family Income by Number of Earners in Fulton County
The median family income in Fulton County is $115,353, with families comprising 3+ earners (22,711) having the highest median family income of $174,170, while families with no earners (23,610) have the lowest median family income of $47,529, accounting for 9.5% and 9.9% of families, respectively.
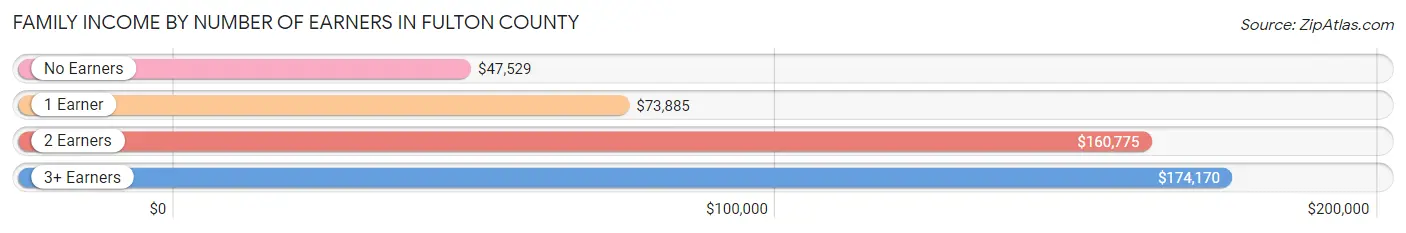
| Number of Earners | # Families | Median Income |
| No Earners | 23,610 (9.9%) | $47,529 |
| 1 Earner | 85,021 (35.6%) | $73,885 |
| 2 Earners | 107,537 (45.0%) | $160,775 |
| 3+ Earners | 22,711 (9.5%) | $174,170 |
| Total | 238,879 (100.0%) | $115,353 |
Household Income in Fulton County
Household Income Brackets in Fulton County
With 83,859 households falling in the category, the $200,000+ income range is the most frequent in Fulton County, accounting for 18.6% of all households. In contrast, only 16,682 households (3.7%) fall into the $10,000 to $14,999 income bracket, making it the least populous group.
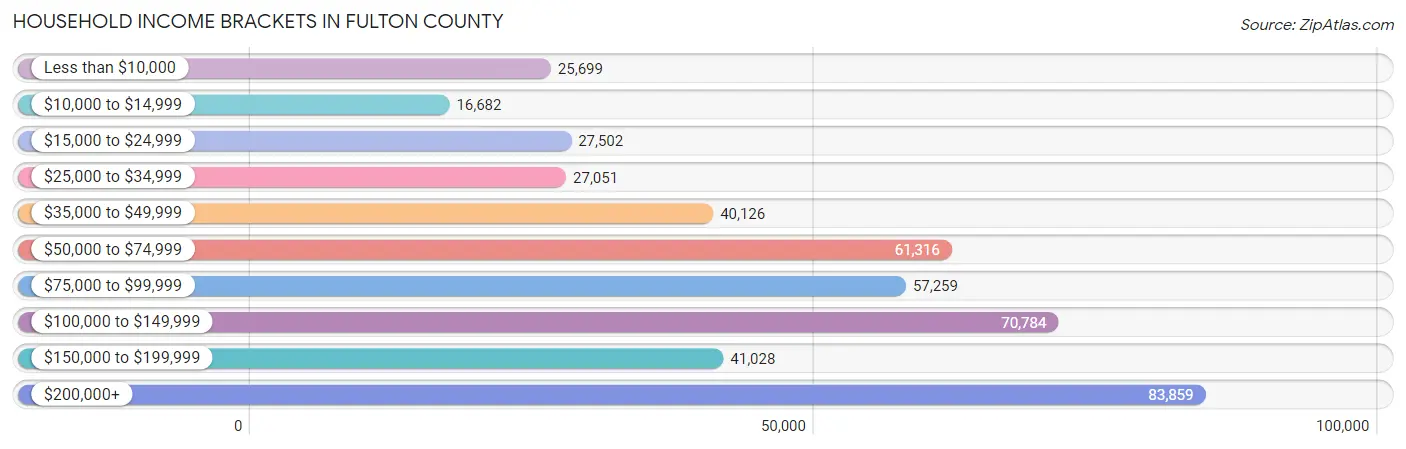
| Income Bracket | # Households | % Households |
| Less than $10,000 | 25,699 | 5.7% |
| $10,000 to $14,999 | 16,682 | 3.7% |
| $15,000 to $24,999 | 27,502 | 6.1% |
| $25,000 to $34,999 | 27,051 | 6.0% |
| $35,000 to $49,999 | 40,126 | 8.9% |
| $50,000 to $74,999 | 61,316 | 13.6% |
| $75,000 to $99,999 | 57,259 | 12.7% |
| $100,000 to $149,999 | 70,784 | 15.7% |
| $150,000 to $199,999 | 41,028 | 9.1% |
| $200,000+ | 83,859 | 18.6% |
Household Income by Householder Age in Fulton County
The median household income in Fulton County is $86,267, with the highest median household income of $104,805 found in the 45 to 64 years age bracket for the primary householder. A total of 160,959 households (35.7%) fall into this category. Meanwhile, the 15 to 24 years age bracket for the primary householder has the lowest median household income of $43,372, with 19,874 households (4.4%) in this group.
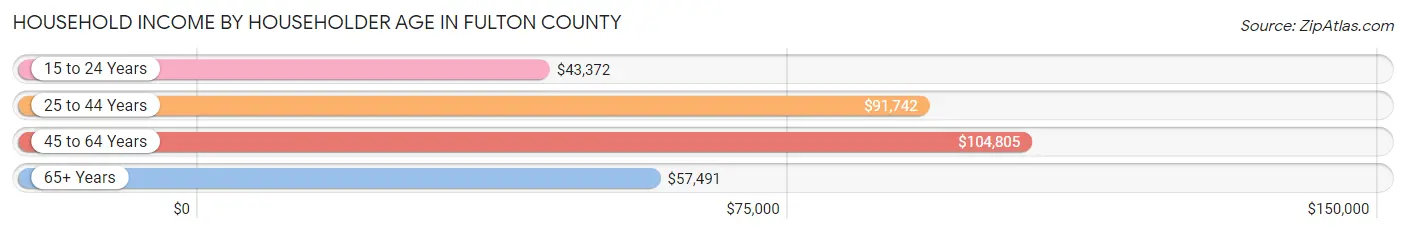
| Income Bracket | # Households | Median Income |
| 15 to 24 Years | 19,874 (4.4%) | $43,372 |
| 25 to 44 Years | 185,176 (41.1%) | $91,742 |
| 45 to 64 Years | 160,959 (35.7%) | $104,805 |
| 65+ Years | 84,847 (18.8%) | $57,491 |
| Total | 450,856 (100.0%) | $86,267 |
Poverty in Fulton County
Income Below Poverty by Sex and Age in Fulton County
With 11.3% poverty level for males and 13.6% for females among the residents of Fulton County, 18 to 24 year old males and 18 to 24 year old females are the most vulnerable to poverty, with 8,371 males (19.1%) and 9,750 females (22.3%) in their respective age groups living below the poverty level.
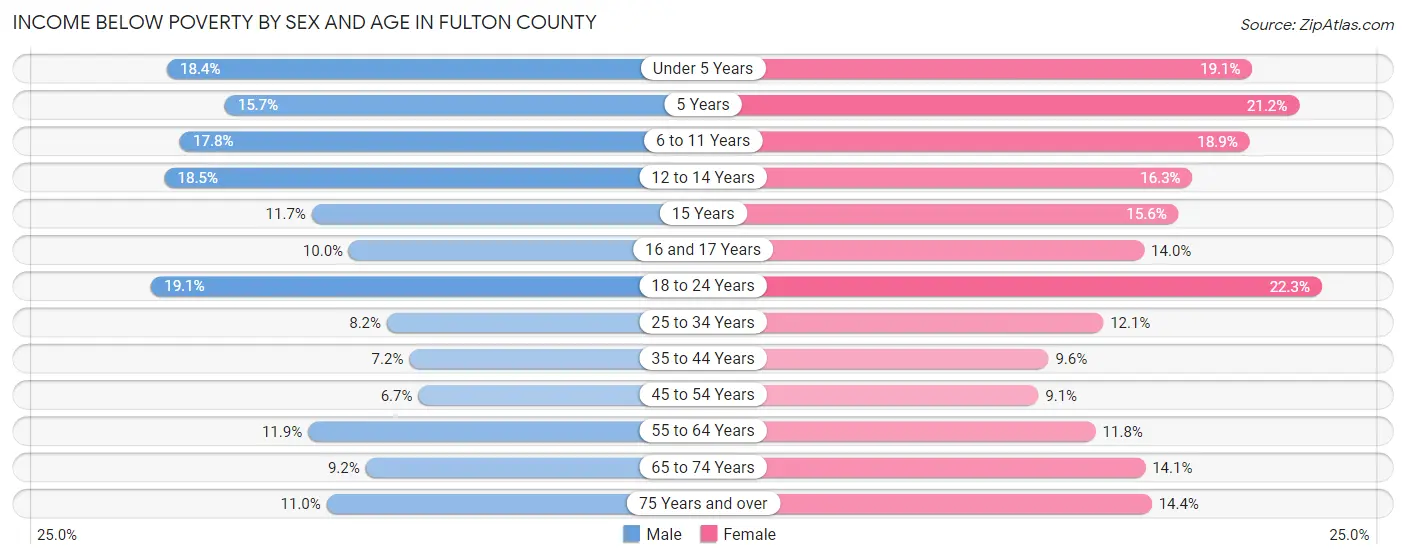
| Age Bracket | Male | Female |
| Under 5 Years | 5,402 (18.4%) | 5,354 (19.1%) |
| 5 Years | 865 (15.7%) | 1,208 (21.2%) |
| 6 to 11 Years | 6,930 (17.8%) | 6,990 (18.9%) |
| 12 to 14 Years | 3,544 (18.5%) | 3,081 (16.3%) |
| 15 Years | 883 (11.7%) | 1,017 (15.6%) |
| 16 and 17 Years | 1,232 (10.0%) | 1,848 (14.0%) |
| 18 to 24 Years | 8,371 (19.1%) | 9,750 (22.3%) |
| 25 to 34 Years | 7,225 (8.2%) | 11,131 (12.1%) |
| 35 to 44 Years | 5,219 (7.1%) | 7,504 (9.6%) |
| 45 to 54 Years | 4,778 (6.7%) | 6,660 (9.1%) |
| 55 to 64 Years | 6,916 (11.8%) | 7,313 (11.8%) |
| 65 to 74 Years | 3,147 (9.2%) | 6,097 (14.1%) |
| 75 Years and over | 2,058 (11.0%) | 4,254 (14.4%) |
| Total | 56,570 (11.3%) | 72,207 (13.6%) |
Income Above Poverty by Sex and Age in Fulton County
According to the poverty statistics in Fulton County, males aged 45 to 54 years and females aged 45 to 54 years are the age groups that are most secure financially, with 93.3% of males and 90.9% of females in these age groups living above the poverty line.
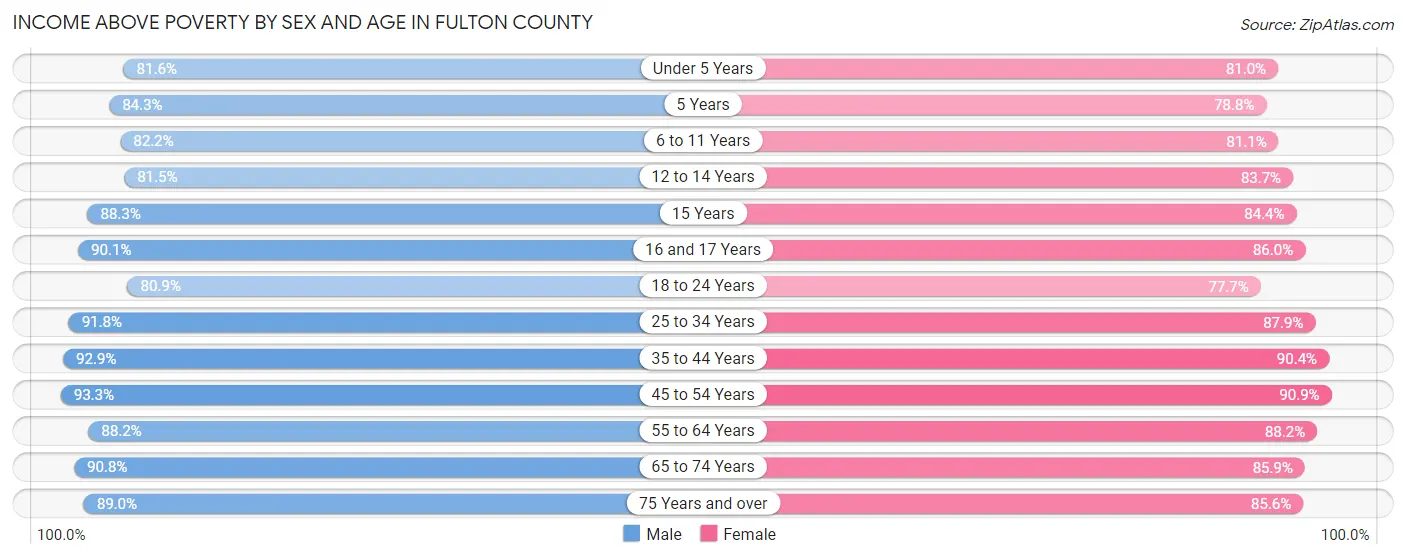
| Age Bracket | Male | Female |
| Under 5 Years | 23,969 (81.6%) | 22,750 (80.9%) |
| 5 Years | 4,641 (84.3%) | 4,486 (78.8%) |
| 6 to 11 Years | 32,053 (82.2%) | 29,962 (81.1%) |
| 12 to 14 Years | 15,614 (81.5%) | 15,855 (83.7%) |
| 15 Years | 6,678 (88.3%) | 5,489 (84.4%) |
| 16 and 17 Years | 11,155 (90.0%) | 11,320 (86.0%) |
| 18 to 24 Years | 35,401 (80.9%) | 34,035 (77.7%) |
| 25 to 34 Years | 81,023 (91.8%) | 80,660 (87.9%) |
| 35 to 44 Years | 67,748 (92.8%) | 70,767 (90.4%) |
| 45 to 54 Years | 66,233 (93.3%) | 66,400 (90.9%) |
| 55 to 64 Years | 51,423 (88.1%) | 54,779 (88.2%) |
| 65 to 74 Years | 31,140 (90.8%) | 37,201 (85.9%) |
| 75 Years and over | 16,675 (89.0%) | 25,324 (85.6%) |
| Total | 443,753 (88.7%) | 459,028 (86.4%) |
Income Below Poverty Among Married-Couple Families in Fulton County
The poverty statistics for married-couple families in Fulton County show that 3.3% or 5,247 of the total 159,202 families live below the poverty line. Families with 3 or 4 children have the highest poverty rate of 11.0%, comprising of 1,087 families. On the other hand, families with 1 or 2 children have the lowest poverty rate of 2.4%, which includes 1,414 families.
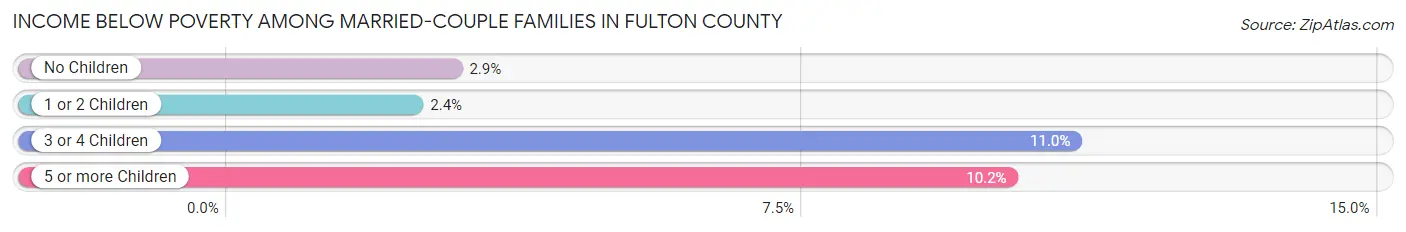
| Children | Above Poverty | Below Poverty |
| No Children | 87,195 (97.1%) | 2,634 (2.9%) |
| 1 or 2 Children | 56,997 (97.6%) | 1,414 (2.4%) |
| 3 or 4 Children | 8,776 (89.0%) | 1,087 (11.0%) |
| 5 or more Children | 987 (89.8%) | 112 (10.2%) |
| Total | 153,955 (96.7%) | 5,247 (3.3%) |
Income Below Poverty Among Single-Parent Households in Fulton County
According to the poverty data in Fulton County, 11.5% or 2,042 single-father households and 21.7% or 13,464 single-mother households are living below the poverty line. Among single-father households, those with 1 or 2 children have the highest poverty rate, with 1,207 households (15.9%) experiencing poverty. Likewise, among single-mother households, those with 3 or 4 children have the highest poverty rate, with 3,744 households (59.1%) falling below the poverty line.
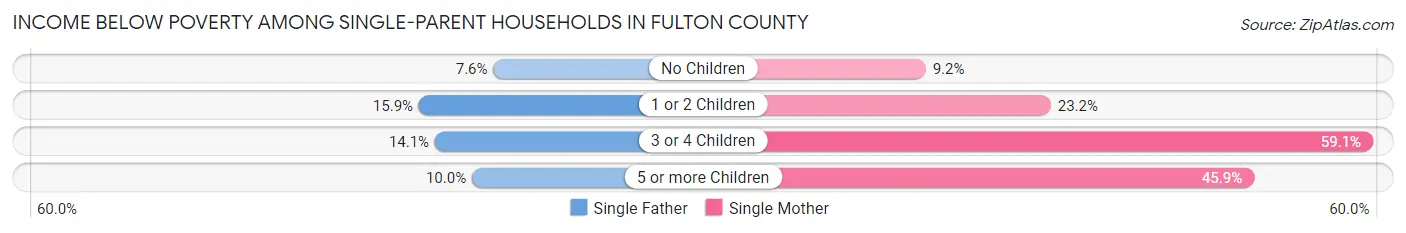
| Children | Single Father | Single Mother |
| No Children | 691 (7.6%) | 2,198 (9.2%) |
| 1 or 2 Children | 1,207 (15.9%) | 7,146 (23.2%) |
| 3 or 4 Children | 138 (14.1%) | 3,744 (59.1%) |
| 5 or more Children | 6 (10.0%) | 376 (45.9%) |
| Total | 2,042 (11.5%) | 13,464 (21.7%) |
Income Below Poverty Among Married-Couple vs Single-Parent Households in Fulton County
The poverty data for Fulton County shows that 5,247 of the married-couple family households (3.3%) and 15,506 of the single-parent households (19.5%) are living below the poverty level. Within the married-couple family households, those with 3 or 4 children have the highest poverty rate, with 1,087 households (11.0%) falling below the poverty line. Among the single-parent households, those with 3 or 4 children have the highest poverty rate, with 3,882 household (53.1%) living below poverty.
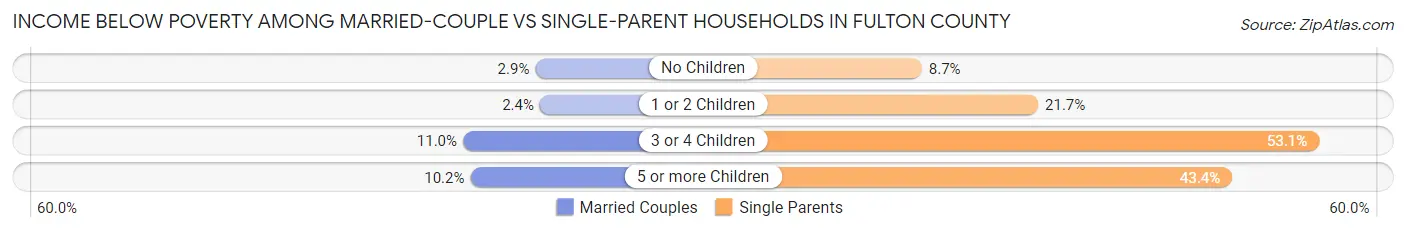
| Children | Married-Couple Families | Single-Parent Households |
| No Children | 2,634 (2.9%) | 2,889 (8.7%) |
| 1 or 2 Children | 1,414 (2.4%) | 8,353 (21.7%) |
| 3 or 4 Children | 1,087 (11.0%) | 3,882 (53.1%) |
| 5 or more Children | 112 (10.2%) | 382 (43.4%) |
| Total | 5,247 (3.3%) | 15,506 (19.5%) |
Employment Characteristics in Fulton County
Employment by Class of Employer in Fulton County
Among the 551,789 employed individuals in Fulton County, private company employees (387,437 | 70.2%), not-for-profit organizations (39,214 | 7.1%), and self-employed (incorporated) (31,660 | 5.7%) make up the most common classes of employment.
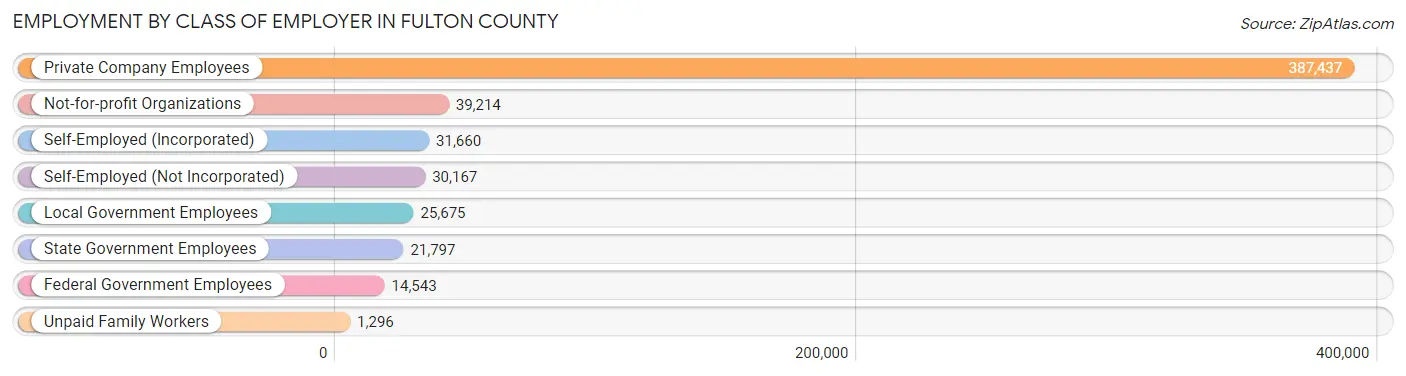
| Employer Class | # Employees | % Employees |
| Private Company Employees | 387,437 | 70.2% |
| Self-Employed (Incorporated) | 31,660 | 5.7% |
| Self-Employed (Not Incorporated) | 30,167 | 5.5% |
| Not-for-profit Organizations | 39,214 | 7.1% |
| Local Government Employees | 25,675 | 4.6% |
| State Government Employees | 21,797 | 4.0% |
| Federal Government Employees | 14,543 | 2.6% |
| Unpaid Family Workers | 1,296 | 0.2% |
| Total | 551,789 | 100.0% |
Employment Status by Age in Fulton County
According to the labor force statistics for Fulton County, out of the total population over 16 years of age (863,381), 68.9% or 594,870 individuals are in the labor force, with 5.4% or 32,123 of them unemployed. The age group with the highest labor force participation rate is 25 to 29 years, with 89.3% or 82,550 individuals in the labor force. Within the labor force, the 16 to 19 years age range has the highest percentage of unemployed individuals, with 19.5% or 3,396 of them being unemployed.
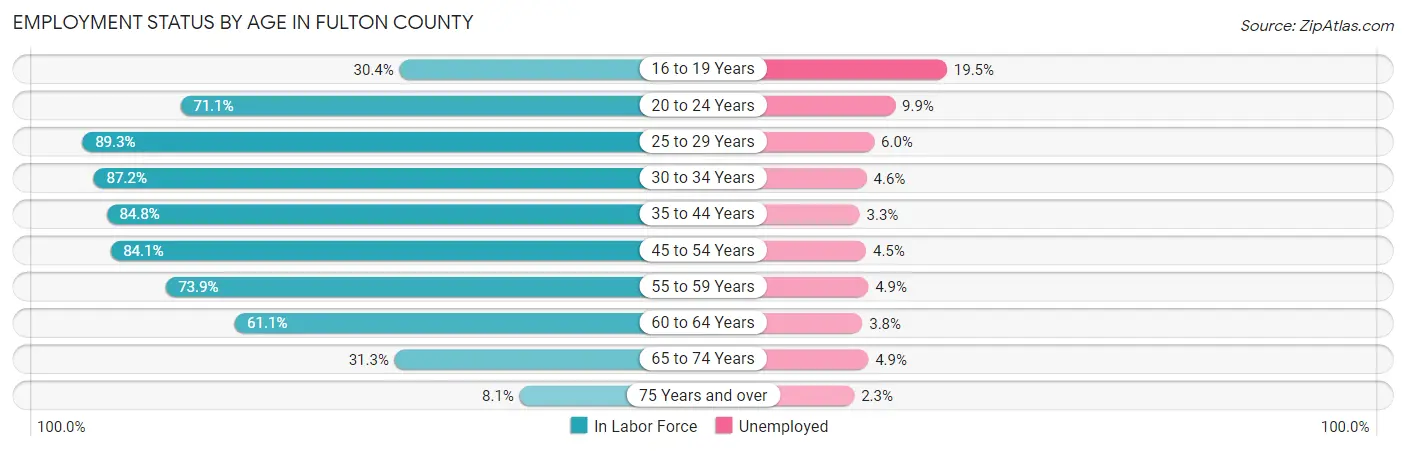
| Age Bracket | In Labor Force | Unemployed |
| 16 to 19 Years | 17,415 (30.4%) | 3,396 (19.5%) |
| 20 to 24 Years | 53,639 (71.1%) | 5,310 (9.9%) |
| 25 to 29 Years | 82,550 (89.3%) | 4,953 (6.0%) |
| 30 to 34 Years | 77,721 (87.2%) | 3,575 (4.6%) |
| 35 to 44 Years | 129,790 (84.8%) | 4,283 (3.3%) |
| 45 to 54 Years | 122,270 (84.1%) | 5,502 (4.5%) |
| 55 to 59 Years | 47,272 (73.9%) | 2,316 (4.9%) |
| 60 to 64 Years | 35,172 (61.1%) | 1,337 (3.8%) |
| 65 to 74 Years | 24,716 (31.3%) | 1,211 (4.9%) |
| 75 Years and over | 4,062 (8.1%) | 93 (2.3%) |
| Total | 594,870 (68.9%) | 32,123 (5.4%) |
Employment Status by Educational Attainment in Fulton County
According to labor force statistics for Fulton County, 82.3% of individuals (495,070) out of the total population between 25 and 64 years of age (601,543) are in the labor force, with 4.4% or 21,783 of them being unemployed. The group with the highest labor force participation rate are those with the educational attainment of bachelor's degree or higher, with 88.2% or 314,791 individuals in the labor force. Within the labor force, individuals with less than high school education have the highest percentage of unemployment, with 8.9% or 1,661 of them being unemployed.
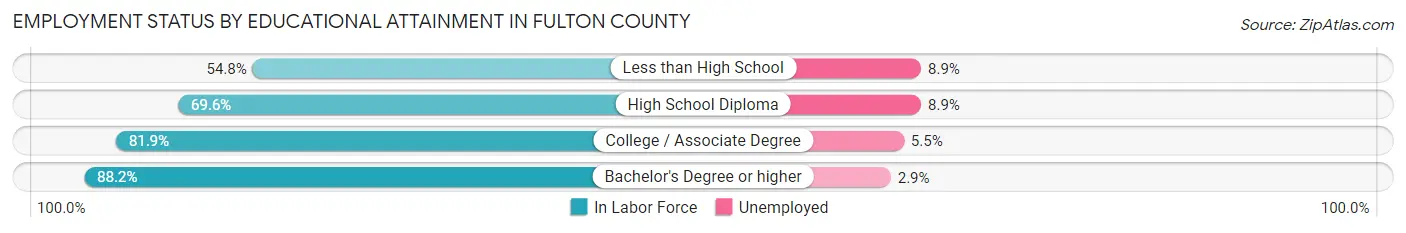
| Educational Attainment | In Labor Force | Unemployed |
| Less than High School | 18,665 (54.8%) | 3,031 (8.9%) |
| High School Diploma | 63,500 (69.6%) | 8,120 (8.9%) |
| College / Associate Degree | 97,739 (81.9%) | 6,564 (5.5%) |
| Bachelor's Degree or higher | 314,791 (88.2%) | 10,350 (2.9%) |
| Total | 495,070 (82.3%) | 26,468 (4.4%) |
Employment Occupations by Sex in Fulton County
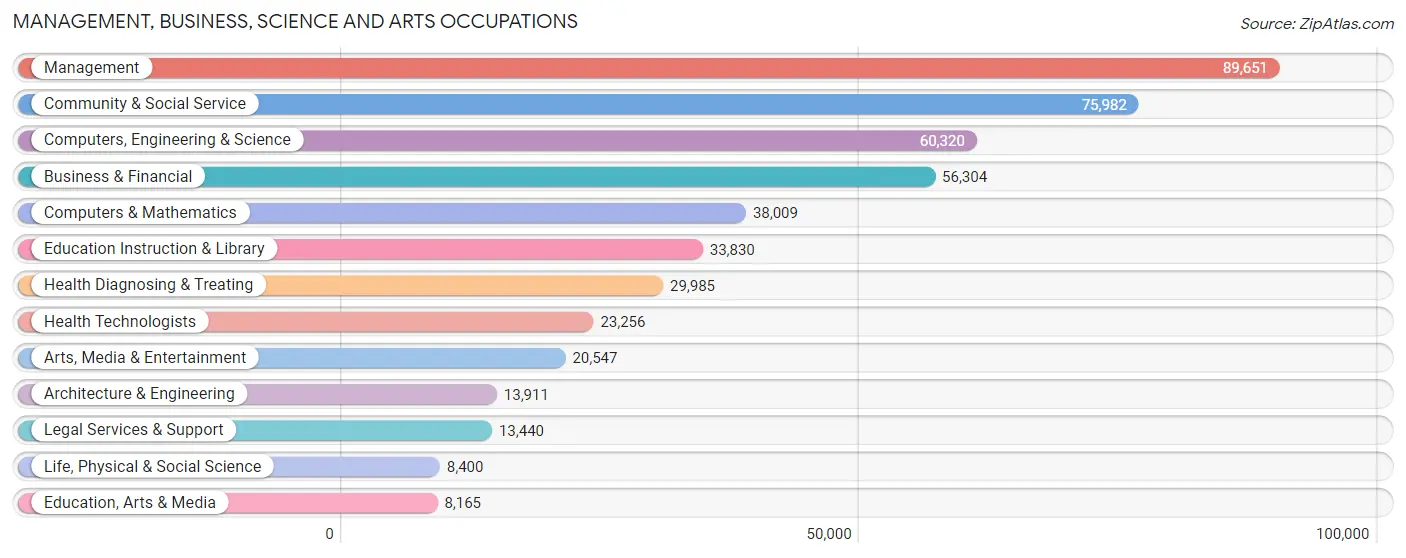
Management, Business, Science and Arts Occupations
The most common Management, Business, Science and Arts occupations in Fulton County are Management (89,651 | 16.0%), Community & Social Service (75,982 | 13.5%), Computers, Engineering & Science (60,320 | 10.7%), Business & Financial (56,304 | 10.0%), and Computers & Mathematics (38,009 | 6.8%).
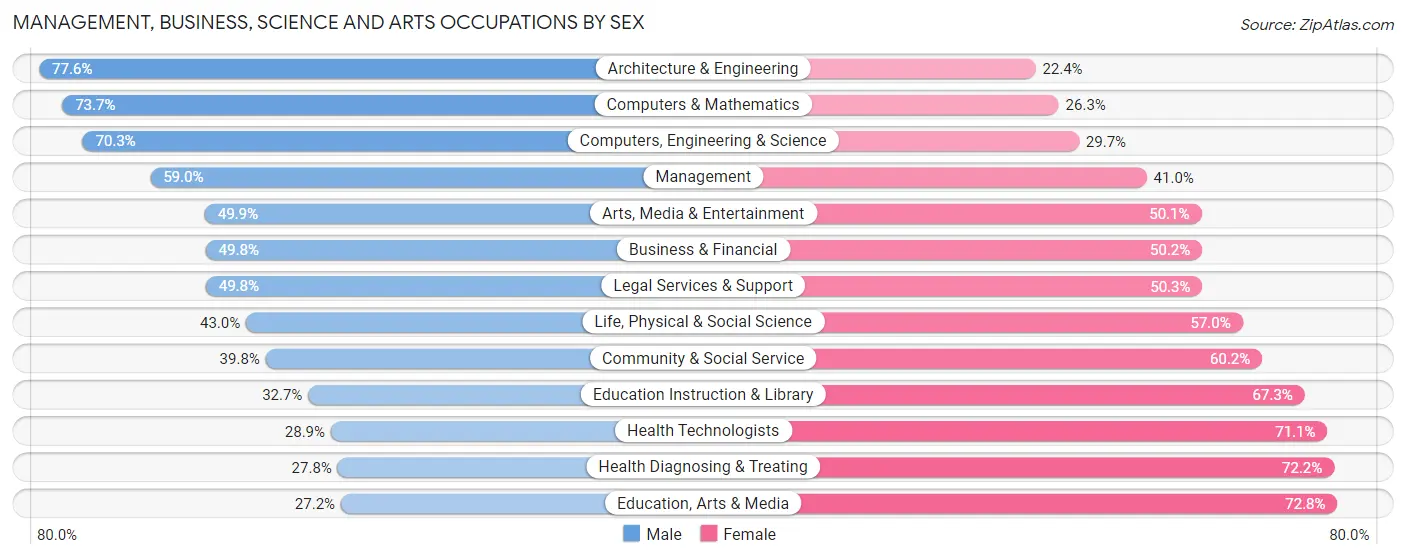
Management, Business, Science and Arts Occupations by Sex
Within the Management, Business, Science and Arts occupations in Fulton County, the most male-oriented occupations are Architecture & Engineering (77.6%), Computers & Mathematics (73.7%), and Computers, Engineering & Science (70.3%), while the most female-oriented occupations are Education, Arts & Media (72.8%), Health Diagnosing & Treating (72.2%), and Health Technologists (71.1%).
| Occupation | Male | Female |
| Management | 52,917 (59.0%) | 36,734 (41.0%) |
| Business & Financial | 28,028 (49.8%) | 28,276 (50.2%) |
| Computers, Engineering & Science | 42,430 (70.3%) | 17,890 (29.7%) |
| Computers & Mathematics | 28,022 (73.7%) | 9,987 (26.3%) |
| Architecture & Engineering | 10,793 (77.6%) | 3,118 (22.4%) |
| Life, Physical & Social Science | 3,615 (43.0%) | 4,785 (57.0%) |
| Community & Social Service | 30,220 (39.8%) | 45,762 (60.2%) |
| Education, Arts & Media | 2,222 (27.2%) | 5,943 (72.8%) |
| Legal Services & Support | 6,687 (49.7%) | 6,753 (50.2%) |
| Education Instruction & Library | 11,053 (32.7%) | 22,777 (67.3%) |
| Arts, Media & Entertainment | 10,258 (49.9%) | 10,289 (50.1%) |
| Health Diagnosing & Treating | 8,323 (27.8%) | 21,662 (72.2%) |
| Health Technologists | 6,718 (28.9%) | 16,538 (71.1%) |
| Total (Category) | 161,918 (51.9%) | 150,324 (48.1%) |
| Total (Overall) | 289,636 (51.6%) | 272,061 (48.4%) |
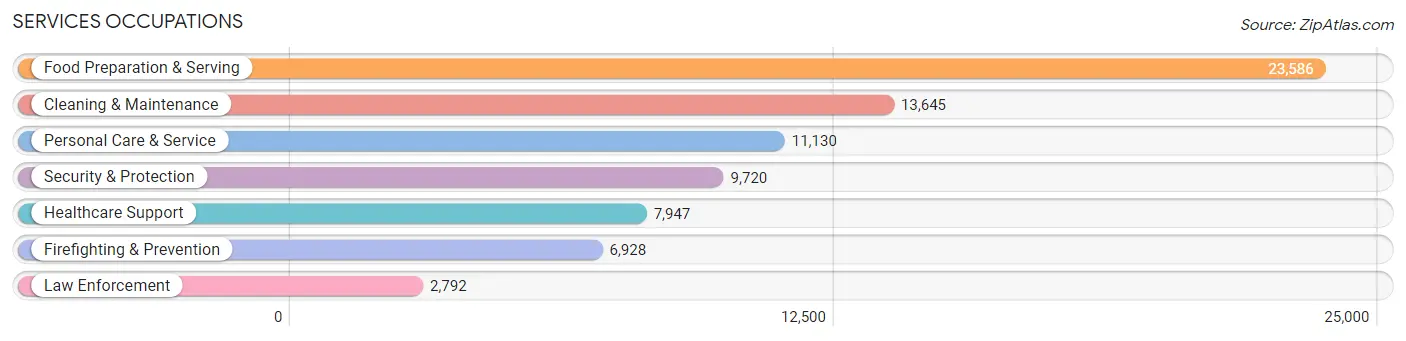
Services Occupations
The most common Services occupations in Fulton County are Food Preparation & Serving (23,586 | 4.2%), Cleaning & Maintenance (13,645 | 2.4%), Personal Care & Service (11,130 | 2.0%), Security & Protection (9,720 | 1.7%), and Healthcare Support (7,947 | 1.4%).
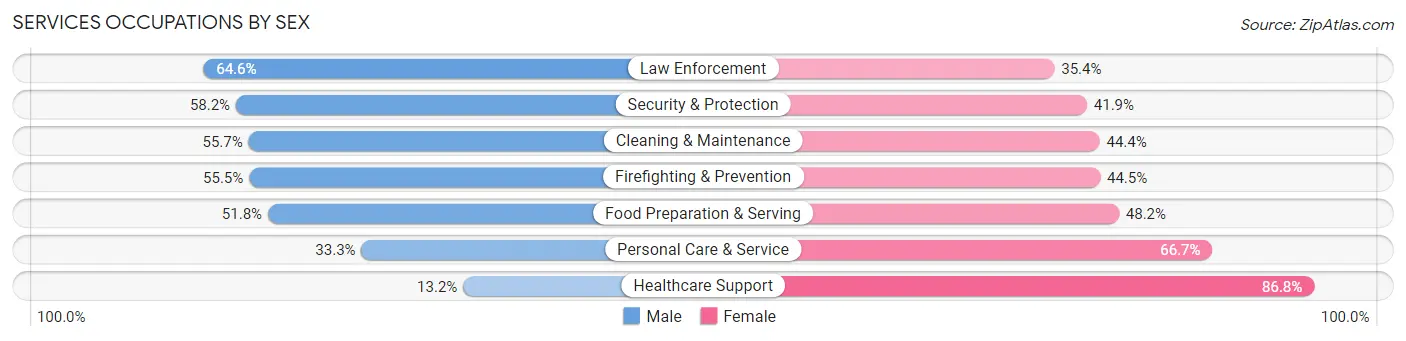
Services Occupations by Sex
Within the Services occupations in Fulton County, the most male-oriented occupations are Law Enforcement (64.6%), Security & Protection (58.2%), and Cleaning & Maintenance (55.6%), while the most female-oriented occupations are Healthcare Support (86.8%), Personal Care & Service (66.7%), and Food Preparation & Serving (48.2%).
| Occupation | Male | Female |
| Healthcare Support | 1,046 (13.2%) | 6,901 (86.8%) |
| Security & Protection | 5,652 (58.2%) | 4,068 (41.8%) |
| Firefighting & Prevention | 3,848 (55.5%) | 3,080 (44.5%) |
| Law Enforcement | 1,804 (64.6%) | 988 (35.4%) |
| Food Preparation & Serving | 12,222 (51.8%) | 11,364 (48.2%) |
| Cleaning & Maintenance | 7,593 (55.6%) | 6,052 (44.4%) |
| Personal Care & Service | 3,707 (33.3%) | 7,423 (66.7%) |
| Total (Category) | 30,220 (45.8%) | 35,808 (54.2%) |
| Total (Overall) | 289,636 (51.6%) | 272,061 (48.4%) |
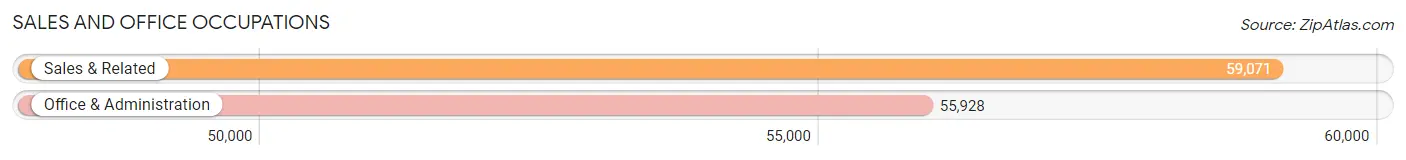
Sales and Office Occupations
The most common Sales and Office occupations in Fulton County are Sales & Related (59,071 | 10.5%), and Office & Administration (55,928 | 10.0%).
Sales and Office Occupations by Sex
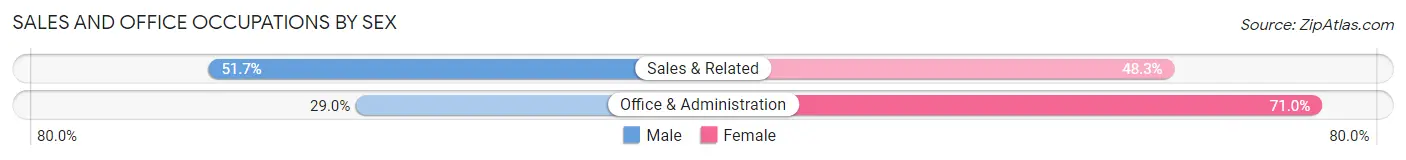
| Occupation | Male | Female |
| Sales & Related | 30,544 (51.7%) | 28,527 (48.3%) |
| Office & Administration | 16,221 (29.0%) | 39,707 (71.0%) |
| Total (Category) | 46,765 (40.7%) | 68,234 (59.3%) |
| Total (Overall) | 289,636 (51.6%) | 272,061 (48.4%) |
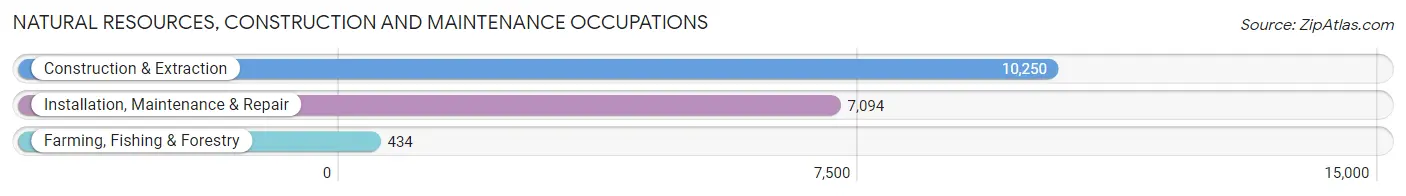
Natural Resources, Construction and Maintenance Occupations
The most common Natural Resources, Construction and Maintenance occupations in Fulton County are Construction & Extraction (10,250 | 1.8%), Installation, Maintenance & Repair (7,094 | 1.3%), and Farming, Fishing & Forestry (434 | 0.1%).
Natural Resources, Construction and Maintenance Occupations by Sex
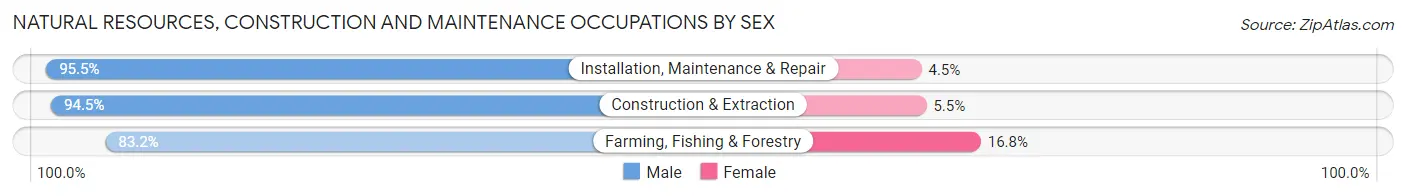
| Occupation | Male | Female |
| Farming, Fishing & Forestry | 361 (83.2%) | 73 (16.8%) |
| Construction & Extraction | 9,684 (94.5%) | 566 (5.5%) |
| Installation, Maintenance & Repair | 6,775 (95.5%) | 319 (4.5%) |
| Total (Category) | 16,820 (94.6%) | 958 (5.4%) |
| Total (Overall) | 289,636 (51.6%) | 272,061 (48.4%) |
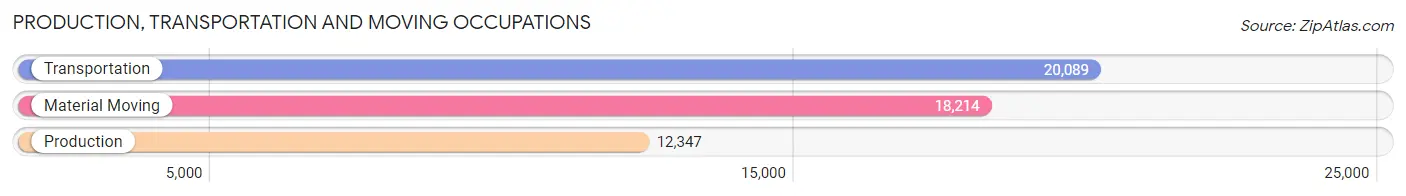
Production, Transportation and Moving Occupations
The most common Production, Transportation and Moving occupations in Fulton County are Transportation (20,089 | 3.6%), Material Moving (18,214 | 3.2%), and Production (12,347 | 2.2%).
Production, Transportation and Moving Occupations by Sex
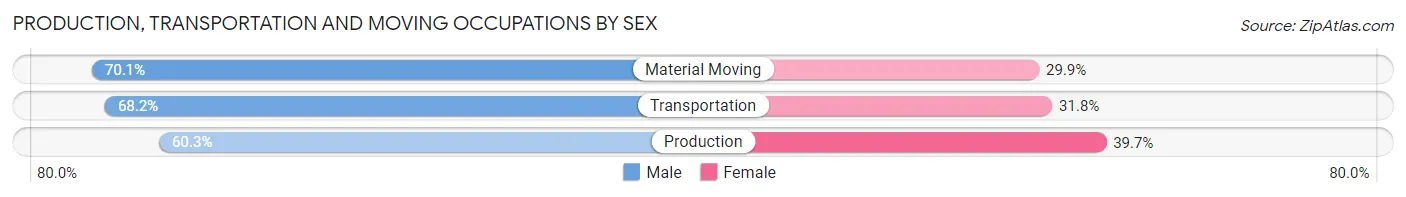
| Occupation | Male | Female |
| Production | 7,442 (60.3%) | 4,905 (39.7%) |
| Transportation | 13,700 (68.2%) | 6,389 (31.8%) |
| Material Moving | 12,771 (70.1%) | 5,443 (29.9%) |
| Total (Category) | 33,913 (67.0%) | 16,737 (33.0%) |
| Total (Overall) | 289,636 (51.6%) | 272,061 (48.4%) |
Employment Industries by Sex in Fulton County
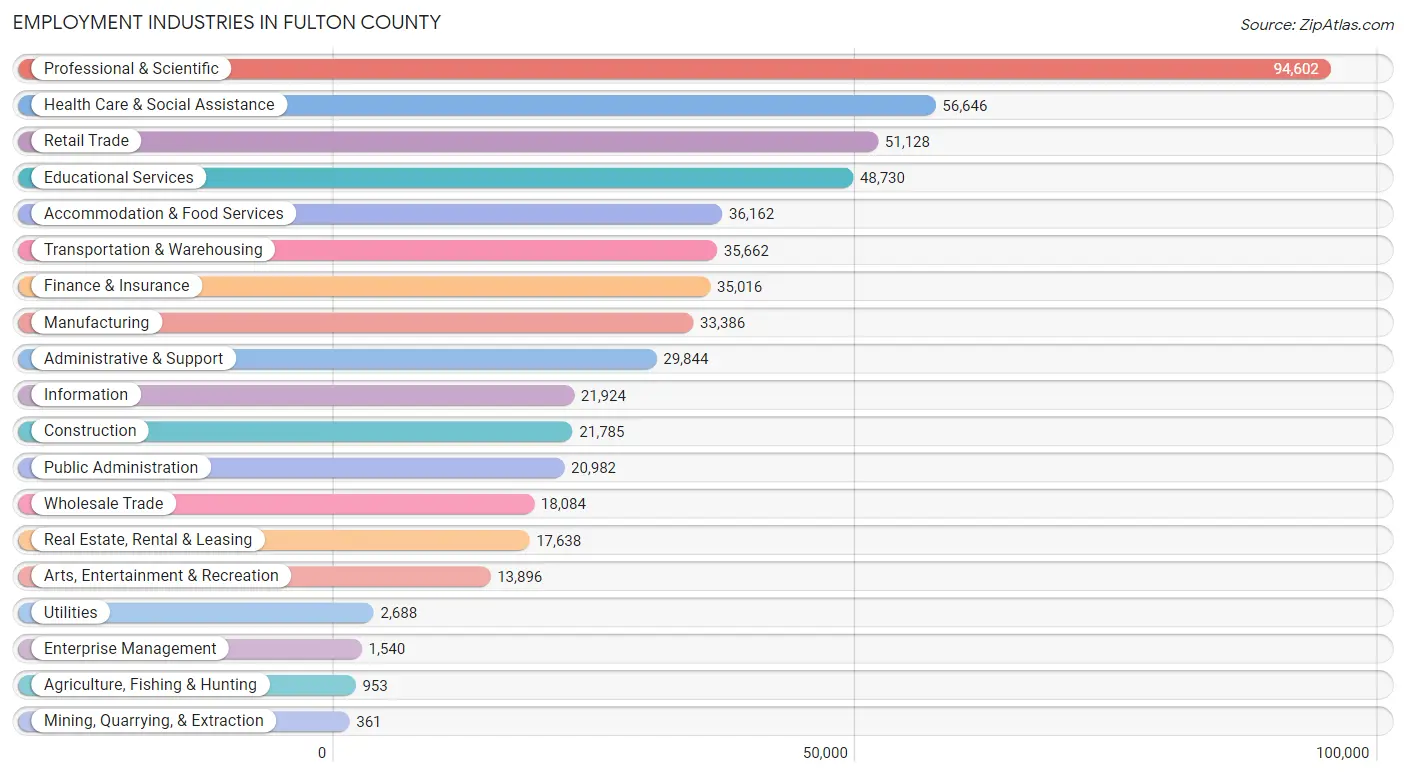
Employment Industries in Fulton County
The major employment industries in Fulton County include Professional & Scientific (94,602 | 16.8%), Health Care & Social Assistance (56,646 | 10.1%), Retail Trade (51,128 | 9.1%), Educational Services (48,730 | 8.7%), and Accommodation & Food Services (36,162 | 6.4%).
Employment Industries by Sex in Fulton County
The Fulton County industries that see more men than women are Mining, Quarrying, & Extraction (86.7%), Construction (83.7%), and Enterprise Management (72.3%), whereas the industries that tend to have a higher number of women are Health Care & Social Assistance (75.0%), Educational Services (64.6%), and Public Administration (56.0%).
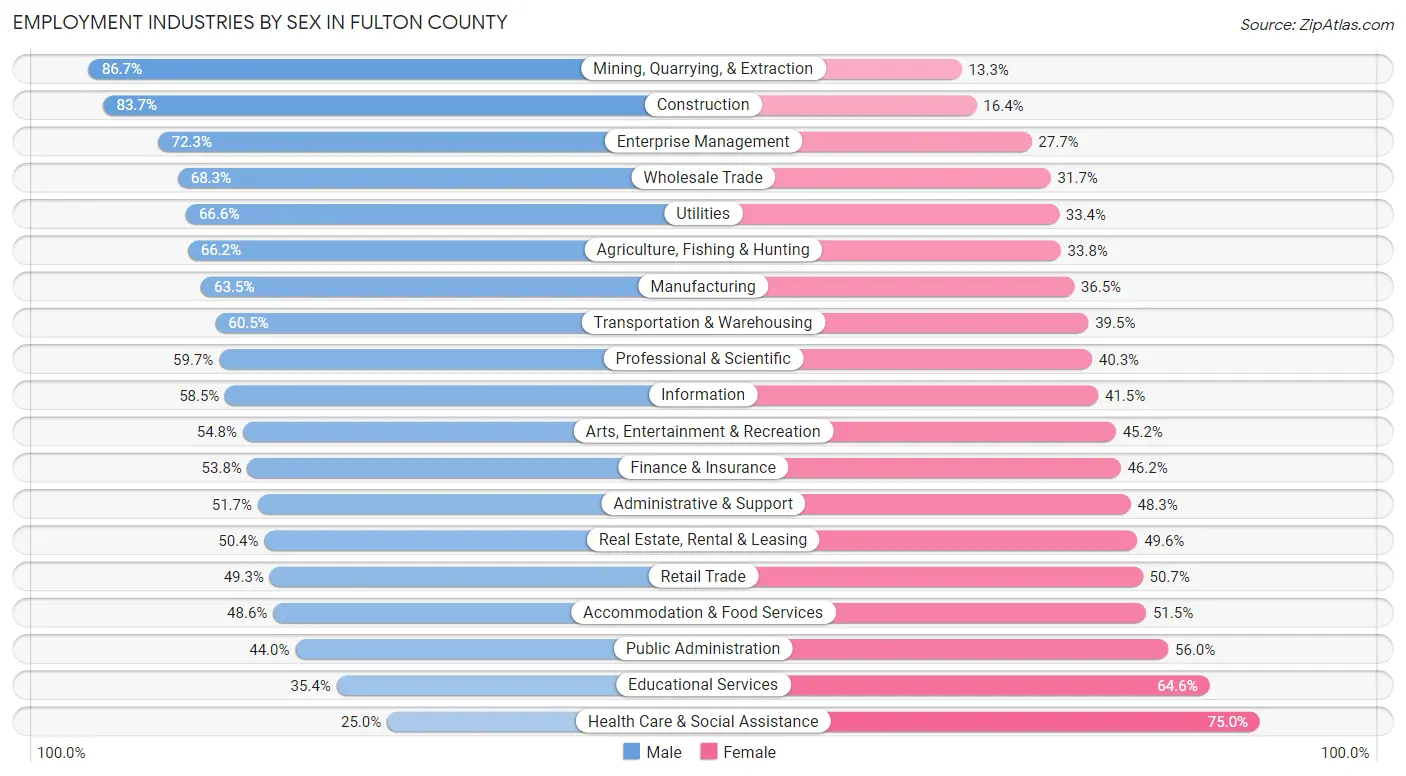
| Industry | Male | Female |
| Agriculture, Fishing & Hunting | 631 (66.2%) | 322 (33.8%) |
| Mining, Quarrying, & Extraction | 313 (86.7%) | 48 (13.3%) |
| Construction | 18,223 (83.7%) | 3,562 (16.4%) |
| Manufacturing | 21,188 (63.5%) | 12,198 (36.5%) |
| Wholesale Trade | 12,348 (68.3%) | 5,736 (31.7%) |
| Retail Trade | 25,188 (49.3%) | 25,940 (50.7%) |
| Transportation & Warehousing | 21,574 (60.5%) | 14,088 (39.5%) |
| Utilities | 1,790 (66.6%) | 898 (33.4%) |
| Information | 12,822 (58.5%) | 9,102 (41.5%) |
| Finance & Insurance | 18,850 (53.8%) | 16,166 (46.2%) |
| Real Estate, Rental & Leasing | 8,884 (50.4%) | 8,754 (49.6%) |
| Professional & Scientific | 56,513 (59.7%) | 38,089 (40.3%) |
| Enterprise Management | 1,113 (72.3%) | 427 (27.7%) |
| Administrative & Support | 15,439 (51.7%) | 14,405 (48.3%) |
| Educational Services | 17,256 (35.4%) | 31,474 (64.6%) |
| Health Care & Social Assistance | 14,150 (25.0%) | 42,496 (75.0%) |
| Arts, Entertainment & Recreation | 7,618 (54.8%) | 6,278 (45.2%) |
| Accommodation & Food Services | 17,556 (48.5%) | 18,606 (51.4%) |
| Public Administration | 9,226 (44.0%) | 11,756 (56.0%) |
| Total | 289,636 (51.6%) | 272,061 (48.4%) |
Education in Fulton County
School Enrollment in Fulton County
The most common levels of schooling among the 271,594 students in Fulton County are college / undergraduate (62,215 | 22.9%), high school (56,189 | 20.7%), and elementary school (51,185 | 18.9%).
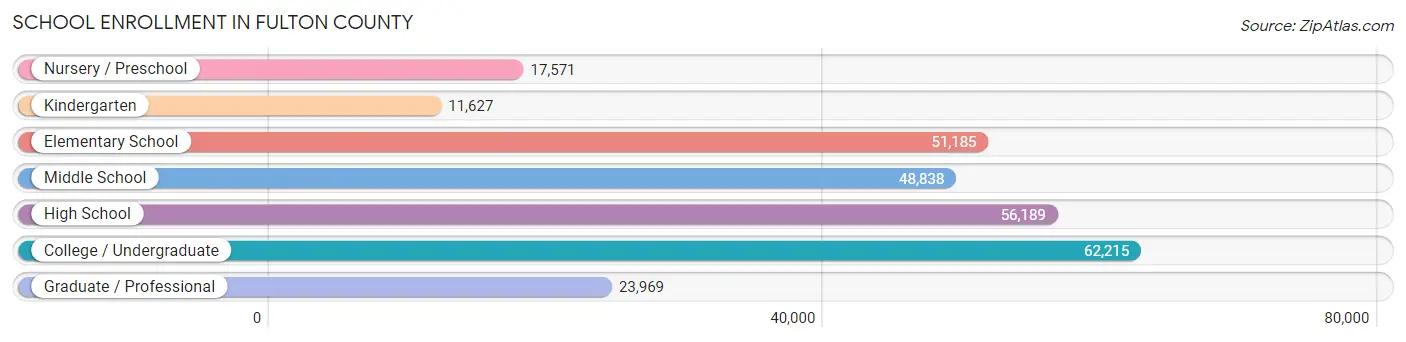
| School Level | # Students | % Students |
| Nursery / Preschool | 17,571 | 6.5% |
| Kindergarten | 11,627 | 4.3% |
| Elementary School | 51,185 | 18.9% |
| Middle School | 48,838 | 18.0% |
| High School | 56,189 | 20.7% |
| College / Undergraduate | 62,215 | 22.9% |
| Graduate / Professional | 23,969 | 8.8% |
| Total | 271,594 | 100.0% |
School Enrollment by Age by Funding Source in Fulton County
Out of a total of 271,594 students who are enrolled in schools in Fulton County, 59,751 (22.0%) attend a private institution, while the remaining 211,843 (78.0%) are enrolled in public schools. The age group of 3 to 4 year olds has the highest likelihood of being enrolled in private schools, with 6,964 (49.1% in the age bracket) enrolled. Conversely, the age group of 15 to 17 year olds has the lowest likelihood of being enrolled in a private school, with 32,096 (83.3% in the age bracket) attending a public institution.
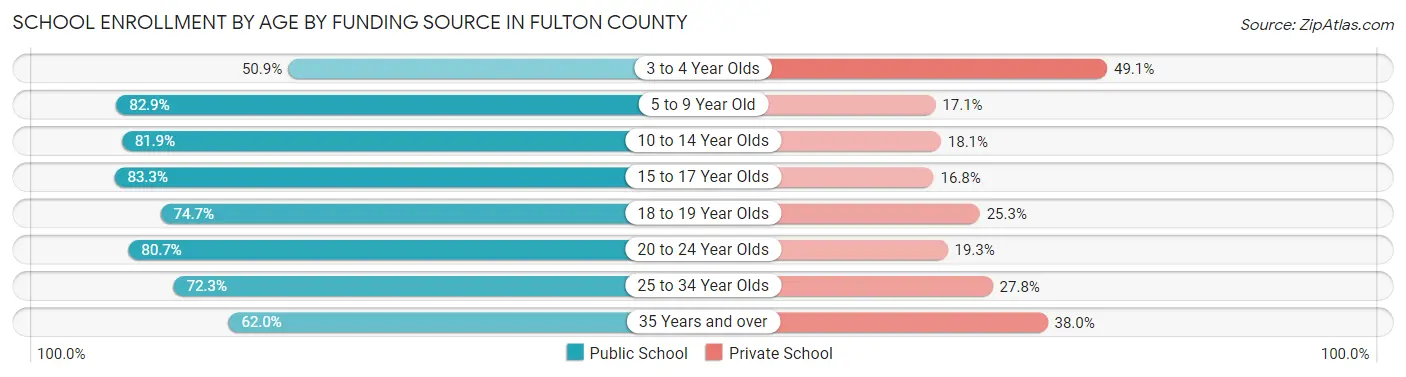
| Age Bracket | Public School | Private School |
| 3 to 4 Year Olds | 7,231 (50.9%) | 6,964 (49.1%) |
| 5 to 9 Year Old | 49,507 (82.9%) | 10,206 (17.1%) |
| 10 to 14 Year Olds | 51,063 (81.9%) | 11,284 (18.1%) |
| 15 to 17 Year Olds | 32,096 (83.3%) | 6,460 (16.8%) |
| 18 to 19 Year Olds | 19,013 (74.7%) | 6,454 (25.3%) |
| 20 to 24 Year Olds | 28,110 (80.7%) | 6,741 (19.3%) |
| 25 to 34 Year Olds | 15,145 (72.3%) | 5,817 (27.8%) |
| 35 Years and over | 9,615 (62.0%) | 5,888 (38.0%) |
| Total | 211,843 (78.0%) | 59,751 (22.0%) |
Educational Attainment by Field of Study in Fulton County
Business (113,650 | 25.3%), engineering (41,848 | 9.3%), social sciences (41,163 | 9.1%), science & technology (31,693 | 7.0%), and education (28,684 | 6.4%) are the most common fields of study among 449,800 individuals in Fulton County who have obtained a bachelor's degree or higher.
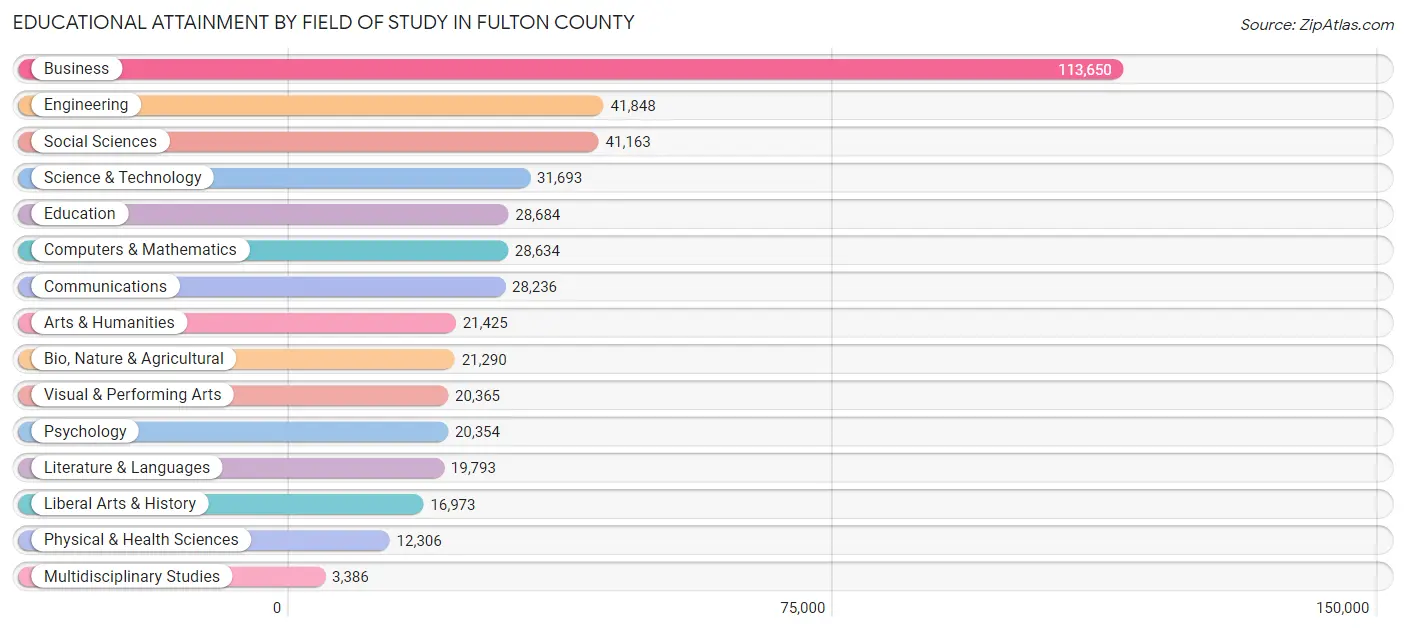
| Field of Study | # Graduates | % Graduates |
| Computers & Mathematics | 28,634 | 6.4% |
| Bio, Nature & Agricultural | 21,290 | 4.7% |
| Physical & Health Sciences | 12,306 | 2.7% |
| Psychology | 20,354 | 4.5% |
| Social Sciences | 41,163 | 9.1% |
| Engineering | 41,848 | 9.3% |
| Multidisciplinary Studies | 3,386 | 0.7% |
| Science & Technology | 31,693 | 7.0% |
| Business | 113,650 | 25.3% |
| Education | 28,684 | 6.4% |
| Literature & Languages | 19,793 | 4.4% |
| Liberal Arts & History | 16,973 | 3.8% |
| Visual & Performing Arts | 20,365 | 4.5% |
| Communications | 28,236 | 6.3% |
| Arts & Humanities | 21,425 | 4.8% |
| Total | 449,800 | 100.0% |
Transportation & Commute in Fulton County
Vehicle Availability by Sex in Fulton County
The most prevalent vehicle ownership categories in Fulton County are males with 2 vehicles (122,939, accounting for 43.3%) and females with 2 vehicles (105,733, making up 46.7%).
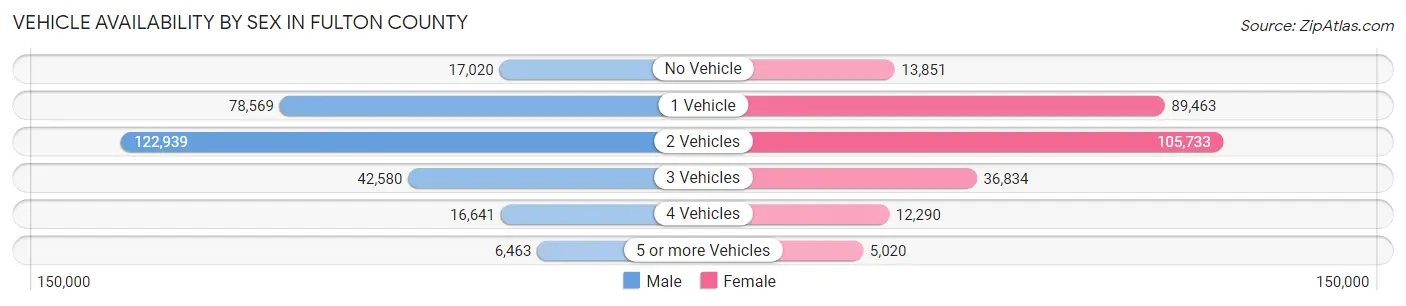
| Vehicles Available | Male | Female |
| No Vehicle | 17,020 (6.0%) | 13,851 (5.3%) |
| 1 Vehicle | 78,569 (27.6%) | 89,463 (34.0%) |
| 2 Vehicles | 122,939 (43.3%) | 105,733 (40.2%) |
| 3 Vehicles | 42,580 (15.0%) | 36,834 (14.0%) |
| 4 Vehicles | 16,641 (5.9%) | 12,290 (4.7%) |
| 5 or more Vehicles | 6,463 (2.3%) | 5,020 (1.9%) |
| Total | 284,212 (100.0%) | 263,191 (100.0%) |
Commute Time in Fulton County
The most frequently occuring commute durations in Fulton County are 20 to 24 minutes (72,593 commuters, 17.0%), 30 to 34 minutes (66,901 commuters, 15.7%), and 15 to 19 minutes (65,736 commuters, 15.4%).
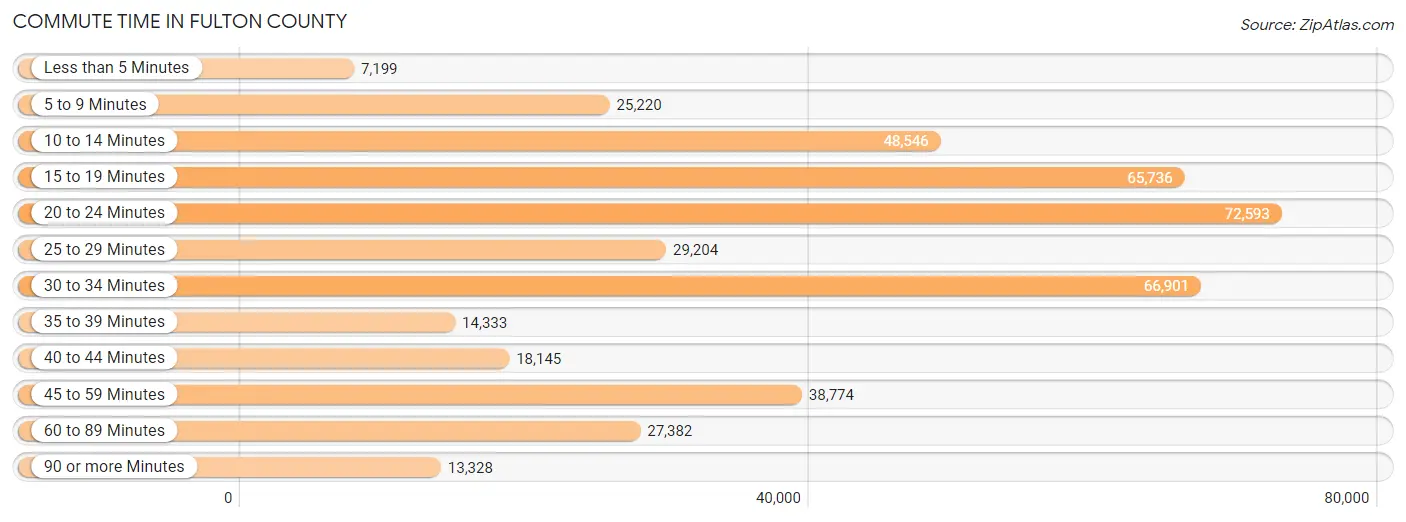
| Commute Time | # Commuters | % Commuters |
| Less than 5 Minutes | 7,199 | 1.7% |
| 5 to 9 Minutes | 25,220 | 5.9% |
| 10 to 14 Minutes | 48,546 | 11.4% |
| 15 to 19 Minutes | 65,736 | 15.4% |
| 20 to 24 Minutes | 72,593 | 17.0% |
| 25 to 29 Minutes | 29,204 | 6.8% |
| 30 to 34 Minutes | 66,901 | 15.7% |
| 35 to 39 Minutes | 14,333 | 3.4% |
| 40 to 44 Minutes | 18,145 | 4.3% |
| 45 to 59 Minutes | 38,774 | 9.1% |
| 60 to 89 Minutes | 27,382 | 6.4% |
| 90 or more Minutes | 13,328 | 3.1% |
Commute Time by Sex in Fulton County
The most common commute times in Fulton County are 20 to 24 minutes (38,576 commuters, 17.5%) for males and 20 to 24 minutes (34,017 commuters, 16.4%) for females.
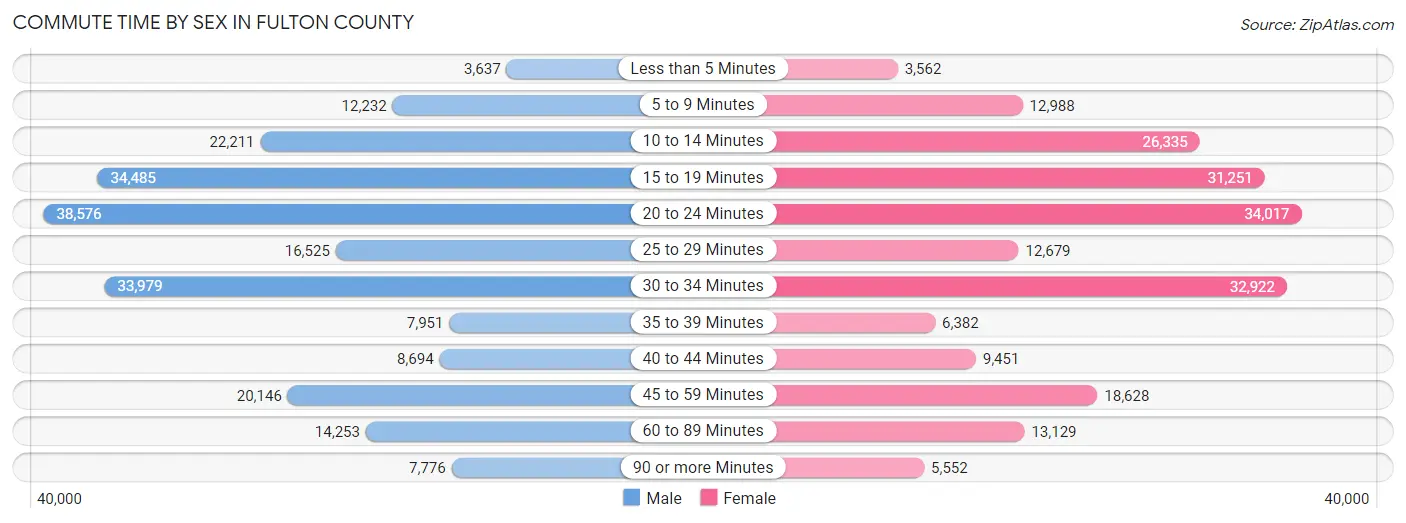
| Commute Time | Male | Female |
| Less than 5 Minutes | 3,637 (1.7%) | 3,562 (1.7%) |
| 5 to 9 Minutes | 12,232 (5.6%) | 12,988 (6.3%) |
| 10 to 14 Minutes | 22,211 (10.1%) | 26,335 (12.7%) |
| 15 to 19 Minutes | 34,485 (15.6%) | 31,251 (15.1%) |
| 20 to 24 Minutes | 38,576 (17.5%) | 34,017 (16.4%) |
| 25 to 29 Minutes | 16,525 (7.5%) | 12,679 (6.1%) |
| 30 to 34 Minutes | 33,979 (15.4%) | 32,922 (15.9%) |
| 35 to 39 Minutes | 7,951 (3.6%) | 6,382 (3.1%) |
| 40 to 44 Minutes | 8,694 (3.9%) | 9,451 (4.6%) |
| 45 to 59 Minutes | 20,146 (9.1%) | 18,628 (9.0%) |
| 60 to 89 Minutes | 14,253 (6.5%) | 13,129 (6.4%) |
| 90 or more Minutes | 7,776 (3.5%) | 5,552 (2.7%) |
Time of Departure to Work by Sex in Fulton County
The most frequent times of departure to work in Fulton County are 8:00 AM to 8:29 AM (35,192, 16.0%) for males and 8:00 AM to 8:29 AM (30,961, 15.0%) for females.
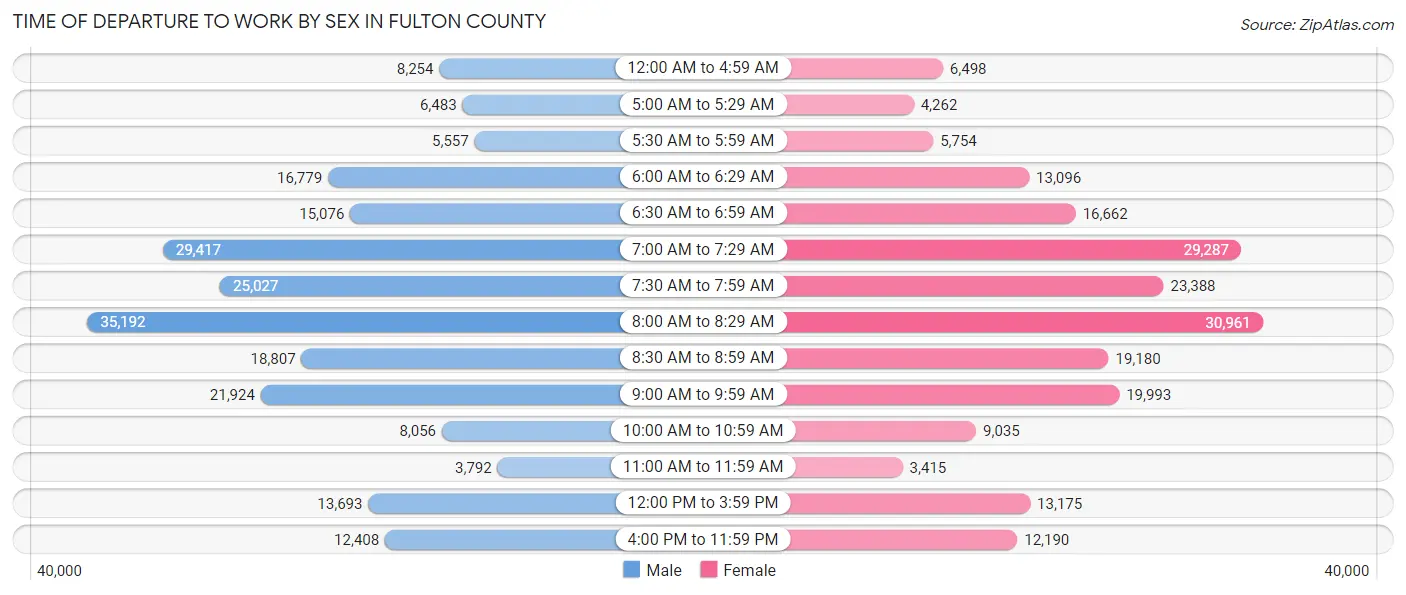
| Time of Departure | Male | Female |
| 12:00 AM to 4:59 AM | 8,254 (3.7%) | 6,498 (3.1%) |
| 5:00 AM to 5:29 AM | 6,483 (2.9%) | 4,262 (2.1%) |
| 5:30 AM to 5:59 AM | 5,557 (2.5%) | 5,754 (2.8%) |
| 6:00 AM to 6:29 AM | 16,779 (7.6%) | 13,096 (6.3%) |
| 6:30 AM to 6:59 AM | 15,076 (6.8%) | 16,662 (8.1%) |
| 7:00 AM to 7:29 AM | 29,417 (13.3%) | 29,287 (14.2%) |
| 7:30 AM to 7:59 AM | 25,027 (11.4%) | 23,388 (11.3%) |
| 8:00 AM to 8:29 AM | 35,192 (16.0%) | 30,961 (15.0%) |
| 8:30 AM to 8:59 AM | 18,807 (8.5%) | 19,180 (9.3%) |
| 9:00 AM to 9:59 AM | 21,924 (9.9%) | 19,993 (9.7%) |
| 10:00 AM to 10:59 AM | 8,056 (3.6%) | 9,035 (4.4%) |
| 11:00 AM to 11:59 AM | 3,792 (1.7%) | 3,415 (1.7%) |
| 12:00 PM to 3:59 PM | 13,693 (6.2%) | 13,175 (6.4%) |
| 4:00 PM to 11:59 PM | 12,408 (5.6%) | 12,190 (5.9%) |
| Total | 220,465 (100.0%) | 206,896 (100.0%) |
Housing Occupancy in Fulton County
Occupancy by Ownership in Fulton County
Of the total 450,856 dwellings in Fulton County, owner-occupied units account for 242,049 (53.7%), while renter-occupied units make up 208,807 (46.3%).
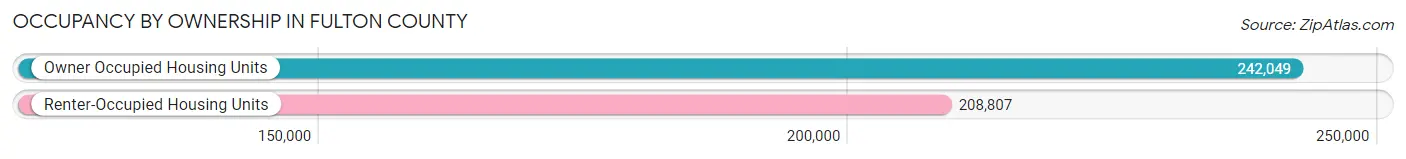
| Occupancy | # Housing Units | % Housing Units |
| Owner Occupied Housing Units | 242,049 | 53.7% |
| Renter-Occupied Housing Units | 208,807 | 46.3% |
| Total Occupied Housing Units | 450,856 | 100.0% |
Occupancy by Household Size in Fulton County
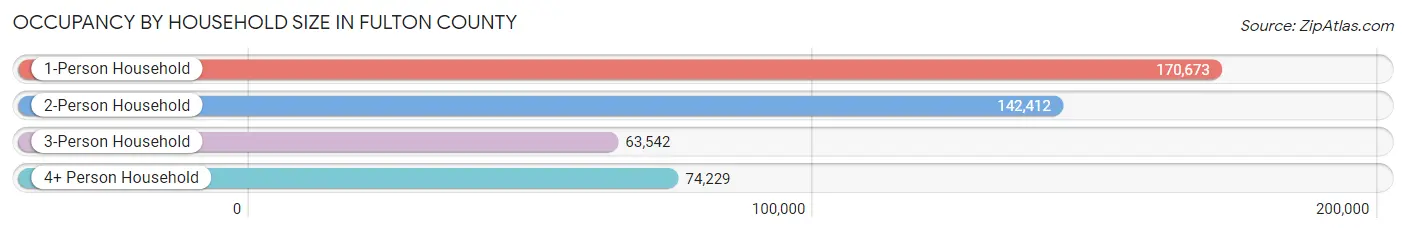
| Household Size | # Housing Units | % Housing Units |
| 1-Person Household | 170,673 | 37.9% |
| 2-Person Household | 142,412 | 31.6% |
| 3-Person Household | 63,542 | 14.1% |
| 4+ Person Household | 74,229 | 16.5% |
| Total Housing Units | 450,856 | 100.0% |
Occupancy by Ownership by Household Size in Fulton County
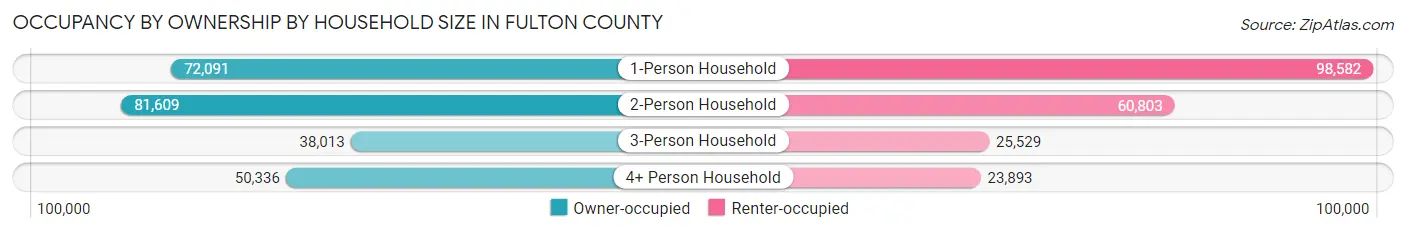
| Household Size | Owner-occupied | Renter-occupied |
| 1-Person Household | 72,091 (42.2%) | 98,582 (57.8%) |
| 2-Person Household | 81,609 (57.3%) | 60,803 (42.7%) |
| 3-Person Household | 38,013 (59.8%) | 25,529 (40.2%) |
| 4+ Person Household | 50,336 (67.8%) | 23,893 (32.2%) |
| Total Housing Units | 242,049 (53.7%) | 208,807 (46.3%) |
Occupancy by Educational Attainment in Fulton County
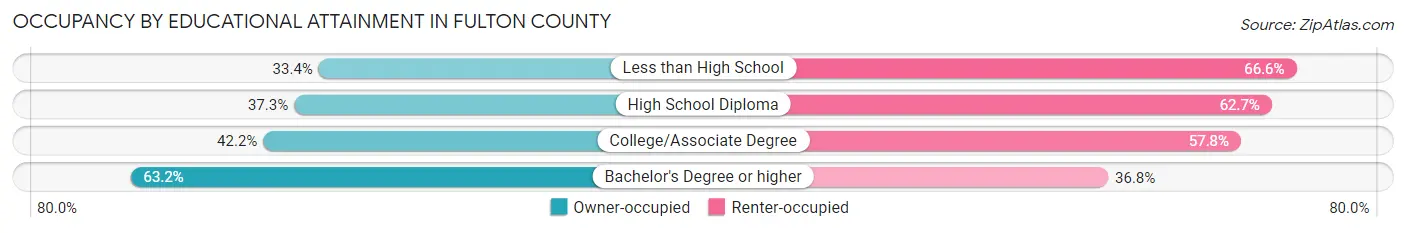
| Household Size | Owner-occupied | Renter-occupied |
| Less than High School | 7,189 (33.4%) | 14,359 (66.6%) |
| High School Diploma | 23,742 (37.3%) | 39,960 (62.7%) |
| College/Associate Degree | 40,033 (42.2%) | 54,913 (57.8%) |
| Bachelor's Degree or higher | 171,085 (63.2%) | 99,575 (36.8%) |
Occupancy by Age of Householder in Fulton County
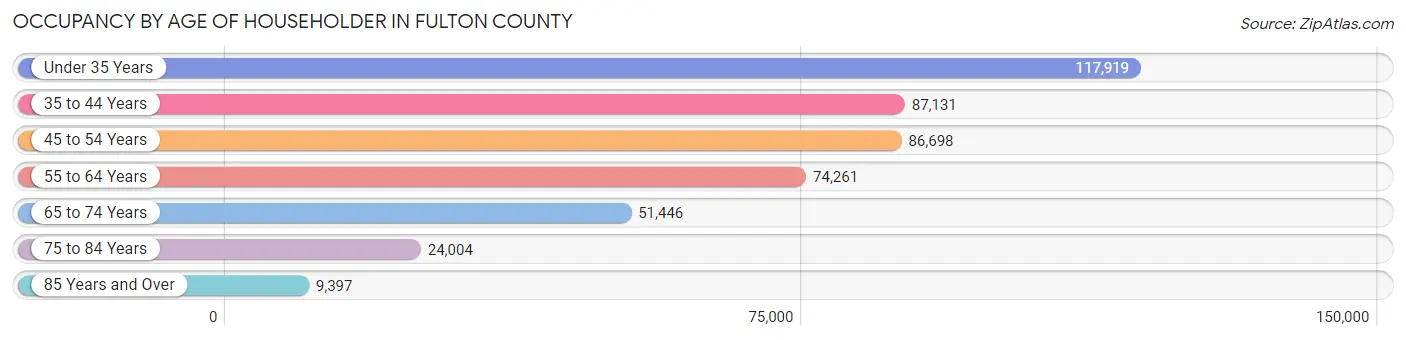
| Age Bracket | # Households | % Households |
| Under 35 Years | 117,919 | 26.2% |
| 35 to 44 Years | 87,131 | 19.3% |
| 45 to 54 Years | 86,698 | 19.2% |
| 55 to 64 Years | 74,261 | 16.5% |
| 65 to 74 Years | 51,446 | 11.4% |
| 75 to 84 Years | 24,004 | 5.3% |
| 85 Years and Over | 9,397 | 2.1% |
| Total | 450,856 | 100.0% |
Housing Finances in Fulton County
Median Income by Occupancy in Fulton County
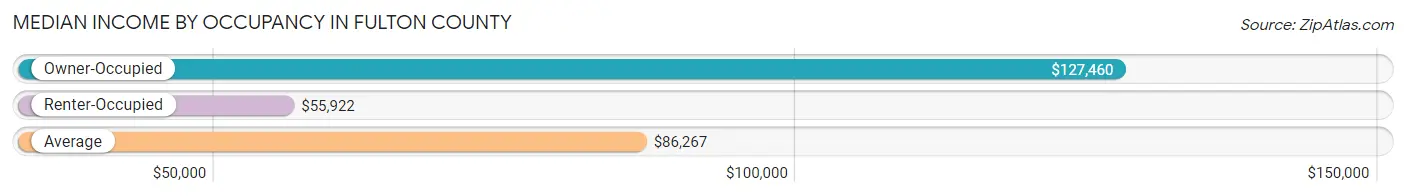
| Occupancy Type | # Households | Median Income |
| Owner-Occupied | 242,049 (53.7%) | $127,460 |
| Renter-Occupied | 208,807 (46.3%) | $55,922 |
| Average | 450,856 (100.0%) | $86,267 |
Occupancy by Householder Income Bracket in Fulton County
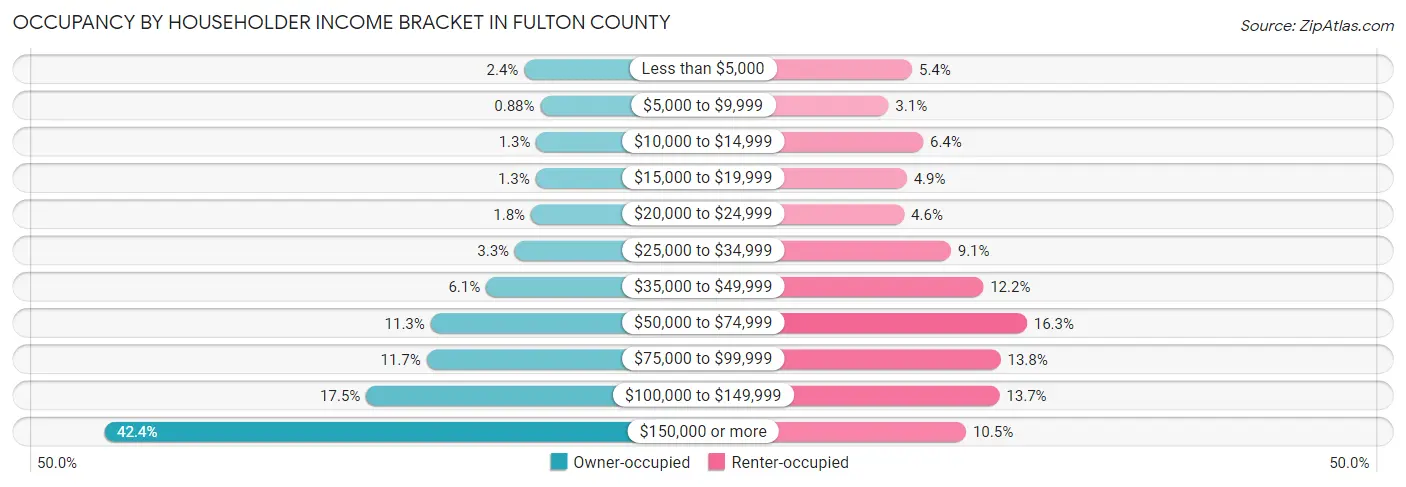
| Income Bracket | Owner-occupied | Renter-occupied |
| Less than $5,000 | 5,858 (2.4%) | 11,224 (5.4%) |
| $5,000 to $9,999 | 2,133 (0.9%) | 6,531 (3.1%) |
| $10,000 to $14,999 | 3,081 (1.3%) | 13,428 (6.4%) |
| $15,000 to $19,999 | 3,241 (1.3%) | 10,176 (4.9%) |
| $20,000 to $24,999 | 4,305 (1.8%) | 9,678 (4.6%) |
| $25,000 to $34,999 | 7,988 (3.3%) | 18,937 (9.1%) |
| $35,000 to $49,999 | 14,639 (6.0%) | 25,382 (12.2%) |
| $50,000 to $74,999 | 27,434 (11.3%) | 34,047 (16.3%) |
| $75,000 to $99,999 | 28,373 (11.7%) | 28,830 (13.8%) |
| $100,000 to $149,999 | 42,284 (17.5%) | 28,609 (13.7%) |
| $150,000 or more | 102,713 (42.4%) | 21,965 (10.5%) |
| Total | 242,049 (100.0%) | 208,807 (100.0%) |
Monthly Housing Cost Tiers in Fulton County
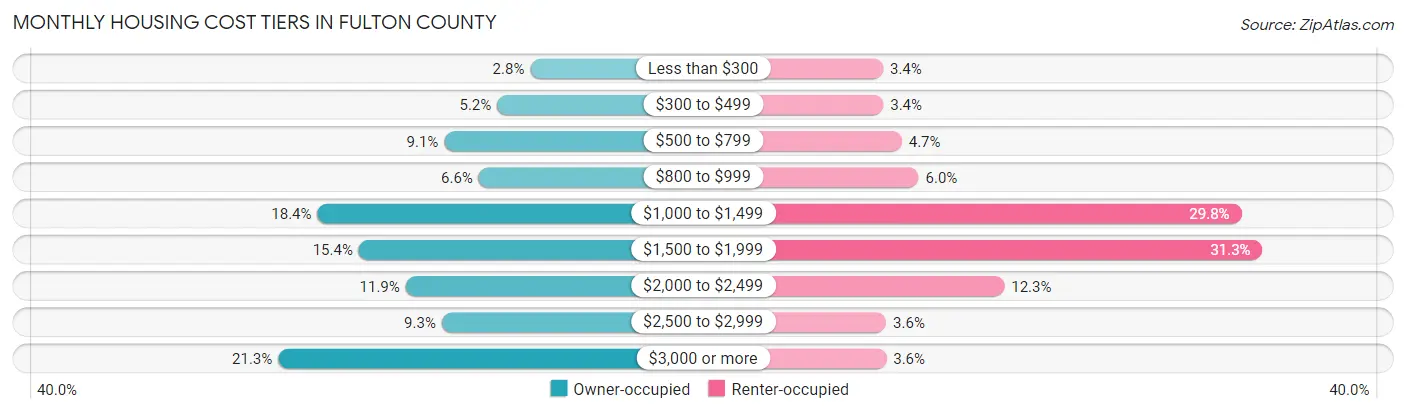
| Monthly Cost | Owner-occupied | Renter-occupied |
| Less than $300 | 6,673 (2.8%) | 7,014 (3.4%) |
| $300 to $499 | 12,594 (5.2%) | 7,056 (3.4%) |
| $500 to $799 | 22,015 (9.1%) | 9,893 (4.7%) |
| $800 to $999 | 15,883 (6.6%) | 12,487 (6.0%) |
| $1,000 to $1,499 | 44,636 (18.4%) | 62,118 (29.7%) |
| $1,500 to $1,999 | 37,260 (15.4%) | 65,364 (31.3%) |
| $2,000 to $2,499 | 28,891 (11.9%) | 25,668 (12.3%) |
| $2,500 to $2,999 | 22,473 (9.3%) | 7,506 (3.6%) |
| $3,000 or more | 51,624 (21.3%) | 7,508 (3.6%) |
| Total | 242,049 (100.0%) | 208,807 (100.0%) |
Physical Housing Characteristics in Fulton County
Housing Structures in Fulton County
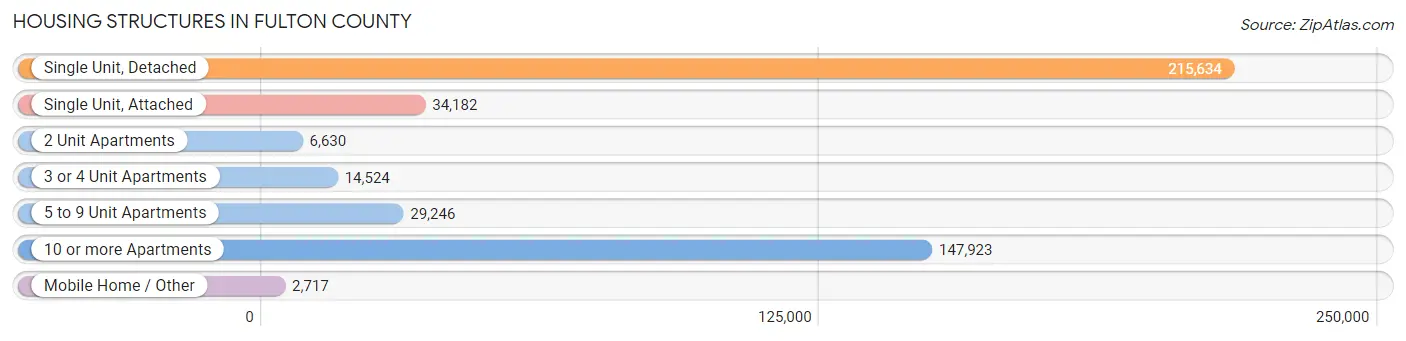
| Structure Type | # Housing Units | % Housing Units |
| Single Unit, Detached | 215,634 | 47.8% |
| Single Unit, Attached | 34,182 | 7.6% |
| 2 Unit Apartments | 6,630 | 1.5% |
| 3 or 4 Unit Apartments | 14,524 | 3.2% |
| 5 to 9 Unit Apartments | 29,246 | 6.5% |
| 10 or more Apartments | 147,923 | 32.8% |
| Mobile Home / Other | 2,717 | 0.6% |
| Total | 450,856 | 100.0% |
Housing Structures by Occupancy in Fulton County
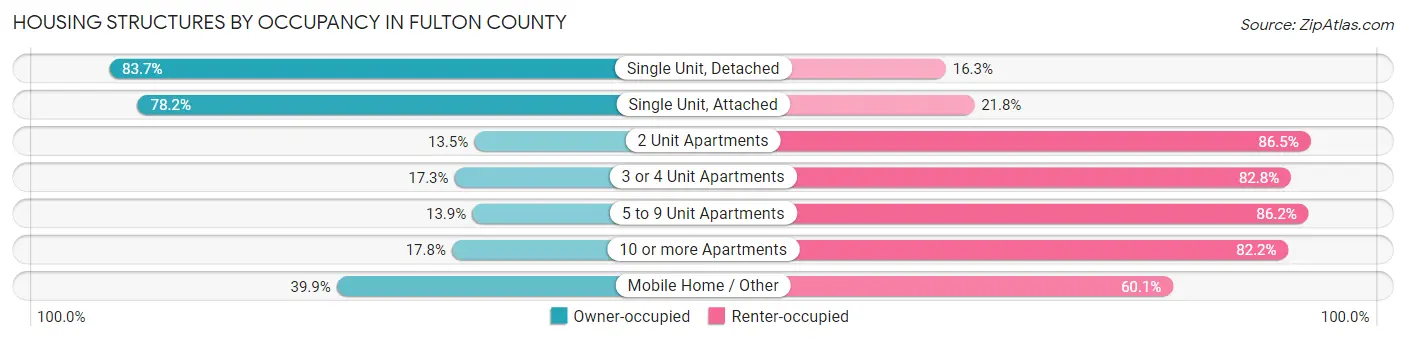
| Structure Type | Owner-occupied | Renter-occupied |
| Single Unit, Detached | 180,506 (83.7%) | 35,128 (16.3%) |
| Single Unit, Attached | 26,744 (78.2%) | 7,438 (21.8%) |
| 2 Unit Apartments | 893 (13.5%) | 5,737 (86.5%) |
| 3 or 4 Unit Apartments | 2,505 (17.2%) | 12,019 (82.8%) |
| 5 to 9 Unit Apartments | 4,052 (13.9%) | 25,194 (86.2%) |
| 10 or more Apartments | 26,264 (17.8%) | 121,659 (82.2%) |
| Mobile Home / Other | 1,085 (39.9%) | 1,632 (60.1%) |
| Total | 242,049 (53.7%) | 208,807 (46.3%) |
Housing Structures by Number of Rooms in Fulton County
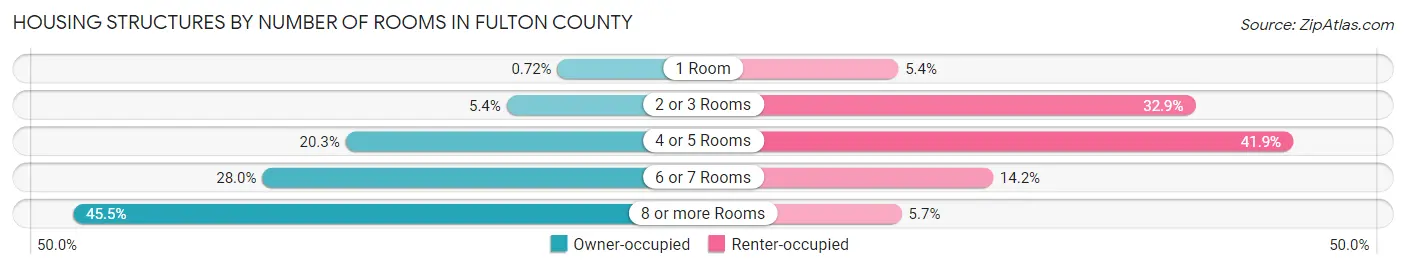
| Number of Rooms | Owner-occupied | Renter-occupied |
| 1 Room | 1,734 (0.7%) | 11,250 (5.4%) |
| 2 or 3 Rooms | 13,113 (5.4%) | 68,606 (32.9%) |
| 4 or 5 Rooms | 49,184 (20.3%) | 87,473 (41.9%) |
| 6 or 7 Rooms | 67,831 (28.0%) | 29,549 (14.1%) |
| 8 or more Rooms | 110,187 (45.5%) | 11,929 (5.7%) |
| Total | 242,049 (100.0%) | 208,807 (100.0%) |
Housing Structure by Heating Type in Fulton County
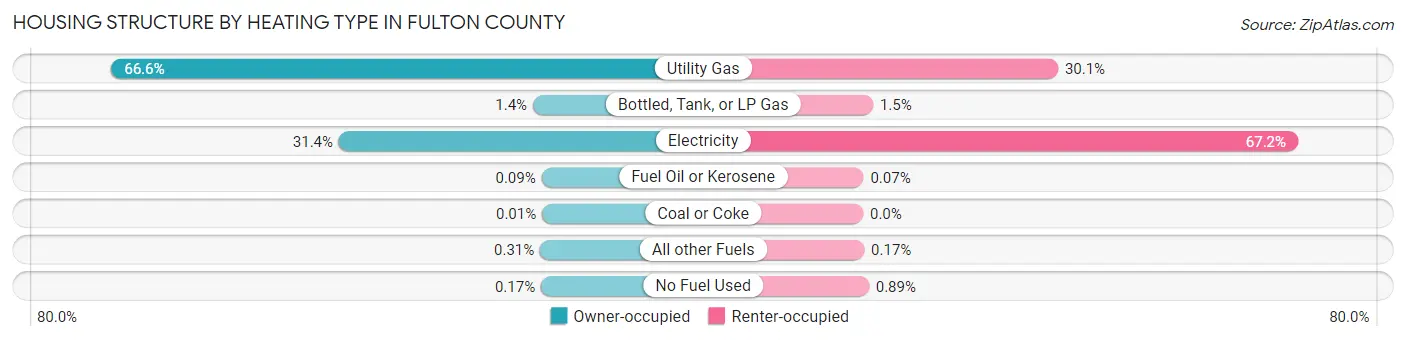
| Heating Type | Owner-occupied | Renter-occupied |
| Utility Gas | 161,190 (66.6%) | 62,921 (30.1%) |
| Bottled, Tank, or LP Gas | 3,434 (1.4%) | 3,198 (1.5%) |
| Electricity | 76,042 (31.4%) | 140,348 (67.2%) |
| Fuel Oil or Kerosene | 206 (0.1%) | 137 (0.1%) |
| Coal or Coke | 14 (0.0%) | 0 (0.0%) |
| All other Fuels | 760 (0.3%) | 355 (0.2%) |
| No Fuel Used | 403 (0.2%) | 1,848 (0.9%) |
| Total | 242,049 (100.0%) | 208,807 (100.0%) |
Household Vehicle Usage in Fulton County
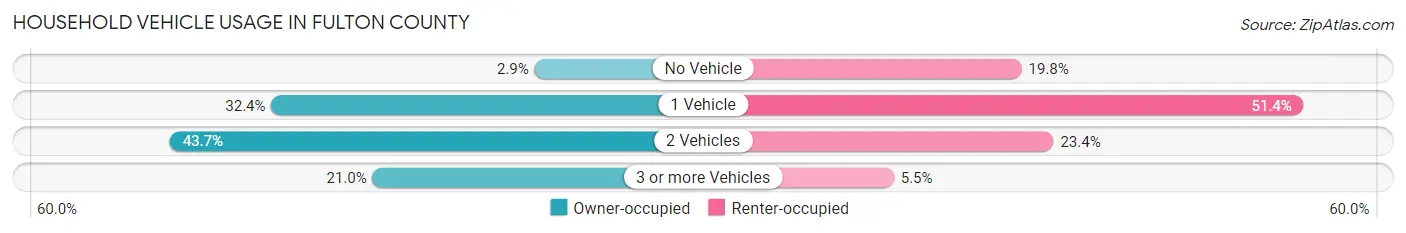
| Vehicles per Household | Owner-occupied | Renter-occupied |
| No Vehicle | 6,963 (2.9%) | 41,317 (19.8%) |
| 1 Vehicle | 78,326 (32.4%) | 107,288 (51.4%) |
| 2 Vehicles | 105,878 (43.7%) | 48,773 (23.4%) |
| 3 or more Vehicles | 50,882 (21.0%) | 11,429 (5.5%) |
| Total | 242,049 (100.0%) | 208,807 (100.0%) |
Real Estate & Mortgages in Fulton County
Real Estate and Mortgage Overview in Fulton County
| Characteristic | Without Mortgage | With Mortgage |
| Housing Units | 66,974 | 175,075 |
| Median Property Value | $375,700 | $405,800 |
| Median Household Income | $92,417 | $81,342 |
| Monthly Housing Costs | $752 | $50,050 |
| Real Estate Taxes | $3,306 | $3,281 |
Property Value by Mortgage Status in Fulton County
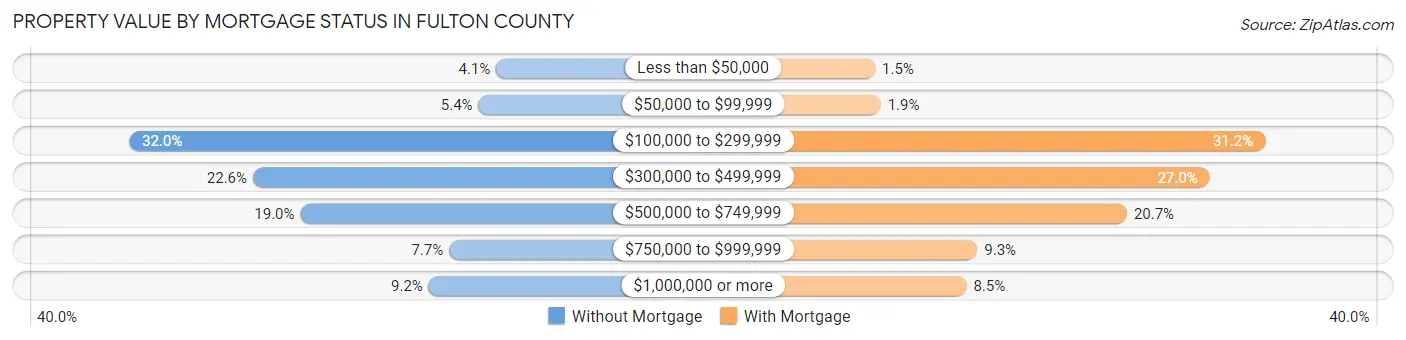
| Property Value | Without Mortgage | With Mortgage |
| Less than $50,000 | 2,728 (4.1%) | 2,606 (1.5%) |
| $50,000 to $99,999 | 3,632 (5.4%) | 3,361 (1.9%) |
| $100,000 to $299,999 | 21,456 (32.0%) | 54,623 (31.2%) |
| $300,000 to $499,999 | 15,146 (22.6%) | 47,232 (27.0%) |
| $500,000 to $749,999 | 12,716 (19.0%) | 36,209 (20.7%) |
| $750,000 to $999,999 | 5,130 (7.7%) | 16,245 (9.3%) |
| $1,000,000 or more | 6,166 (9.2%) | 14,799 (8.5%) |
| Total | 66,974 (100.0%) | 175,075 (100.0%) |
Household Income by Mortgage Status in Fulton County
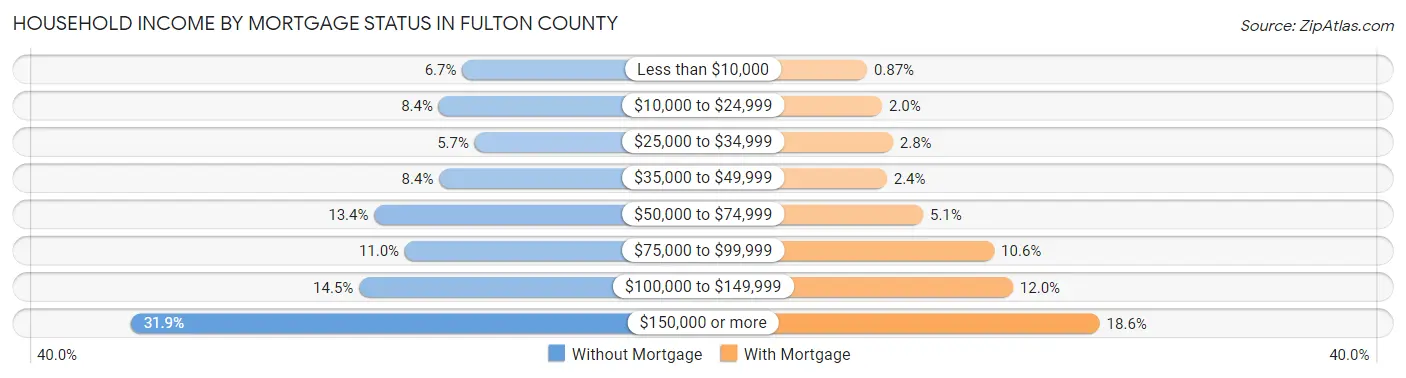
| Household Income | Without Mortgage | With Mortgage |
| Less than $10,000 | 4,456 (6.7%) | 1,526 (0.9%) |
| $10,000 to $24,999 | 5,653 (8.4%) | 3,535 (2.0%) |
| $25,000 to $34,999 | 3,817 (5.7%) | 4,974 (2.8%) |
| $35,000 to $49,999 | 5,632 (8.4%) | 4,171 (2.4%) |
| $50,000 to $74,999 | 8,948 (13.4%) | 9,007 (5.1%) |
| $75,000 to $99,999 | 7,380 (11.0%) | 18,486 (10.6%) |
| $100,000 to $149,999 | 9,717 (14.5%) | 20,993 (12.0%) |
| $150,000 or more | 21,371 (31.9%) | 32,567 (18.6%) |
| Total | 66,974 (100.0%) | 175,075 (100.0%) |
Property Value to Household Income Ratio in Fulton County
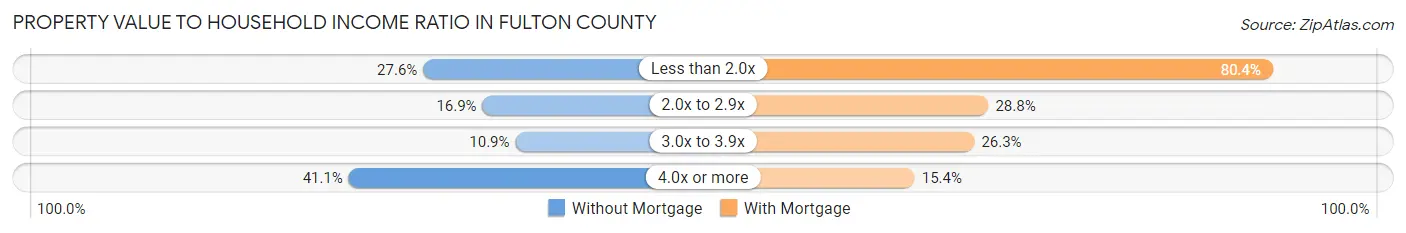
| Value-to-Income Ratio | Without Mortgage | With Mortgage |
| Less than 2.0x | 18,499 (27.6%) | 140,793 (80.4%) |
| 2.0x to 2.9x | 11,288 (16.9%) | 50,417 (28.8%) |
| 3.0x to 3.9x | 7,279 (10.9%) | 45,957 (26.3%) |
| 4.0x or more | 27,556 (41.1%) | 26,996 (15.4%) |
| Total | 66,974 (100.0%) | 175,075 (100.0%) |
Real Estate Taxes by Mortgage Status in Fulton County
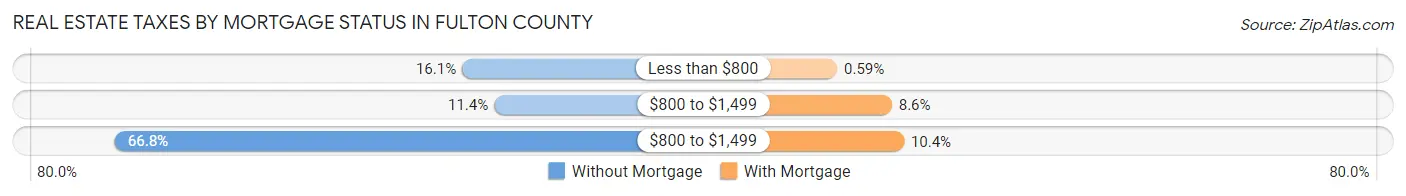
| Property Taxes | Without Mortgage | With Mortgage |
| Less than $800 | 10,776 (16.1%) | 1,037 (0.6%) |
| $800 to $1,499 | 7,633 (11.4%) | 15,018 (8.6%) |
| $800 to $1,499 | 44,740 (66.8%) | 18,141 (10.4%) |
| Total | 66,974 (100.0%) | 175,075 (100.0%) |
Health & Disability in Fulton County
Health Insurance Coverage by Age in Fulton County
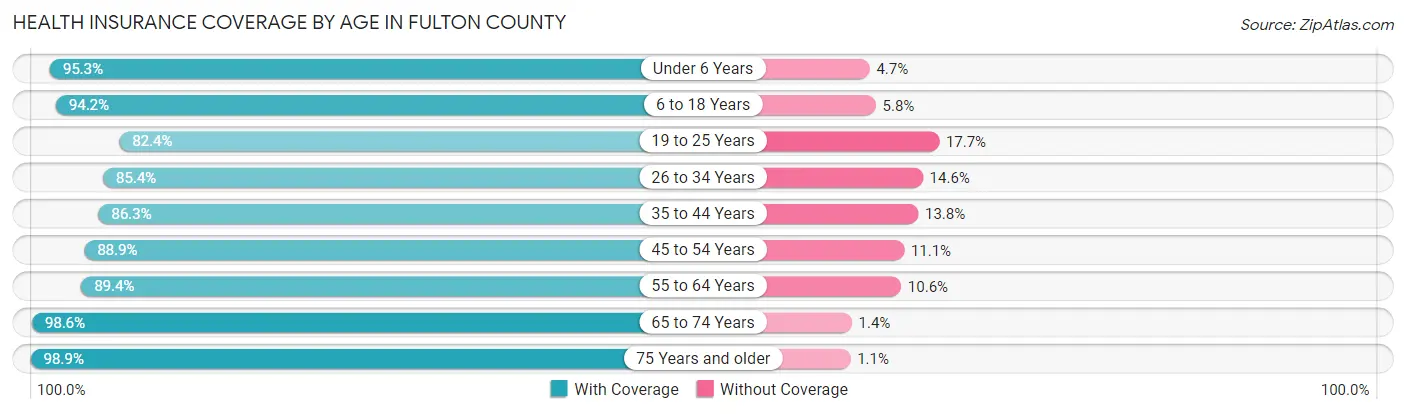
| Age Bracket | With Coverage | Without Coverage |
| Under 6 Years | 65,942 (95.3%) | 3,253 (4.7%) |
| 6 to 18 Years | 161,715 (94.2%) | 10,027 (5.8%) |
| 19 to 25 Years | 88,145 (82.4%) | 18,896 (17.6%) |
| 26 to 34 Years | 138,846 (85.4%) | 23,762 (14.6%) |
| 35 to 44 Years | 130,198 (86.3%) | 20,756 (13.8%) |
| 45 to 54 Years | 128,017 (88.9%) | 16,015 (11.1%) |
| 55 to 64 Years | 107,711 (89.4%) | 12,720 (10.6%) |
| 65 to 74 Years | 76,532 (98.6%) | 1,053 (1.4%) |
| 75 Years and older | 47,780 (98.9%) | 531 (1.1%) |
| Total | 944,886 (89.8%) | 107,013 (10.2%) |
Health Insurance Coverage by Citizenship Status in Fulton County
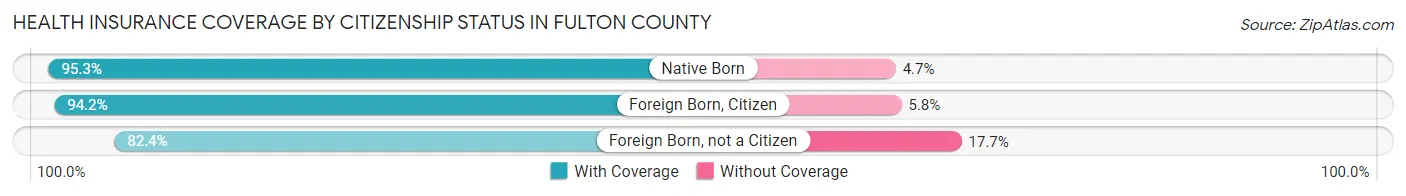
| Citizenship Status | With Coverage | Without Coverage |
| Native Born | 65,942 (95.3%) | 3,253 (4.7%) |
| Foreign Born, Citizen | 161,715 (94.2%) | 10,027 (5.8%) |
| Foreign Born, not a Citizen | 88,145 (82.4%) | 18,896 (17.6%) |
Health Insurance Coverage by Household Income in Fulton County
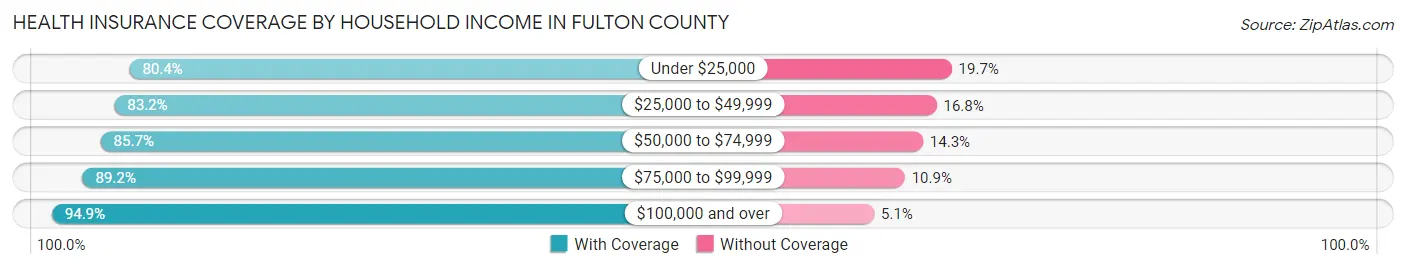
| Household Income | With Coverage | Without Coverage |
| Under $25,000 | 97,029 (80.3%) | 23,733 (19.7%) |
| $25,000 to $49,999 | 112,066 (83.2%) | 22,655 (16.8%) |
| $50,000 to $74,999 | 109,264 (85.7%) | 18,177 (14.3%) |
| $75,000 to $99,999 | 108,434 (89.1%) | 13,196 (10.8%) |
| $100,000 and over | 496,922 (94.9%) | 26,779 (5.1%) |
Public vs Private Health Insurance Coverage by Age in Fulton County
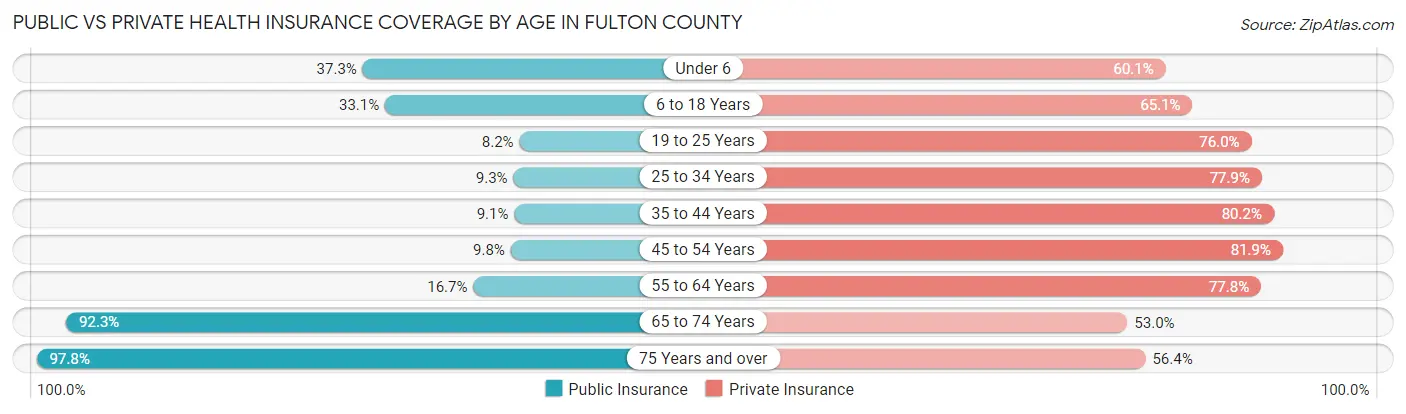
| Age Bracket | Public Insurance | Private Insurance |
| Under 6 | 25,778 (37.2%) | 41,582 (60.1%) |
| 6 to 18 Years | 56,824 (33.1%) | 111,767 (65.1%) |
| 19 to 25 Years | 8,734 (8.2%) | 81,377 (76.0%) |
| 25 to 34 Years | 15,056 (9.3%) | 126,730 (77.9%) |
| 35 to 44 Years | 13,735 (9.1%) | 121,020 (80.2%) |
| 45 to 54 Years | 14,091 (9.8%) | 117,887 (81.9%) |
| 55 to 64 Years | 20,125 (16.7%) | 93,698 (77.8%) |
| 65 to 74 Years | 71,624 (92.3%) | 41,130 (53.0%) |
| 75 Years and over | 47,243 (97.8%) | 27,235 (56.4%) |
| Total | 273,210 (26.0%) | 762,426 (72.5%) |
Disability Status by Sex by Age in Fulton County
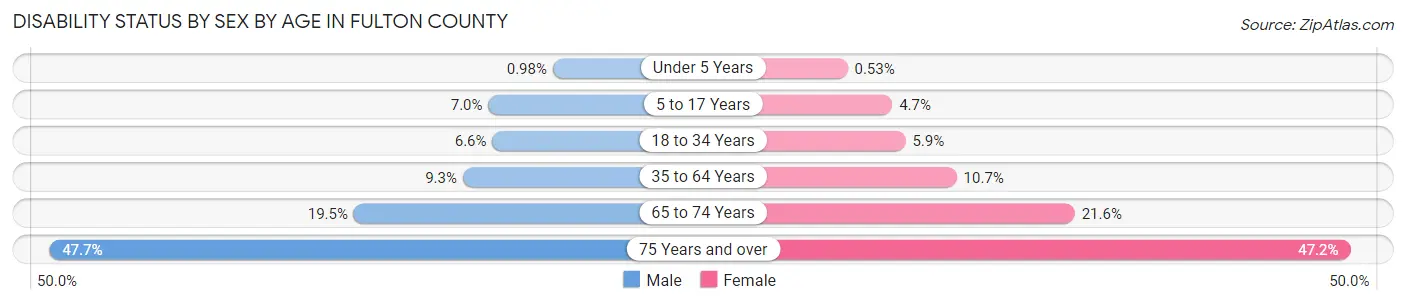
| Age Bracket | Male | Female |
| Under 5 Years | 291 (1.0%) | 151 (0.5%) |
| 5 to 17 Years | 5,867 (7.0%) | 3,832 (4.7%) |
| 18 to 34 Years | 9,350 (6.6%) | 8,550 (5.9%) |
| 35 to 64 Years | 18,862 (9.3%) | 22,749 (10.7%) |
| 65 to 74 Years | 6,669 (19.5%) | 9,363 (21.6%) |
| 75 Years and over | 8,938 (47.7%) | 13,958 (47.2%) |
Disability Class by Sex by Age in Fulton County
Disability Class: Hearing Difficulty
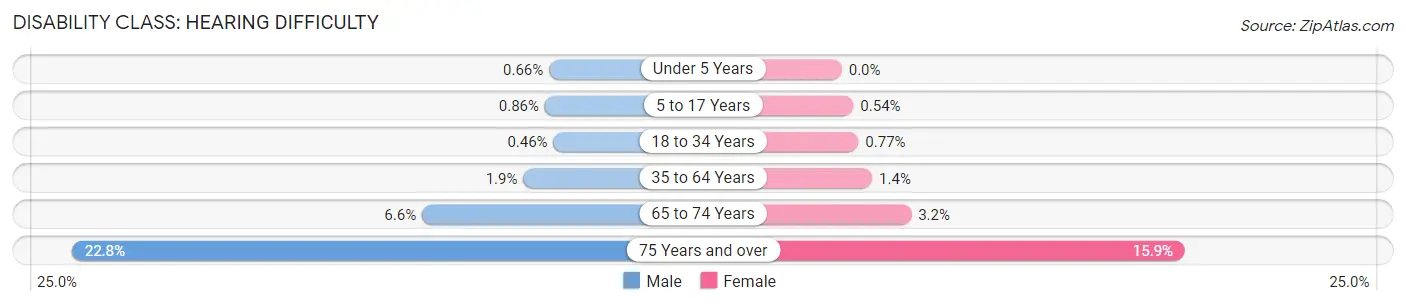
| Age Bracket | Male | Female |
| Under 5 Years | 196 (0.7%) | 0 (0.0%) |
| 5 to 17 Years | 725 (0.9%) | 441 (0.5%) |
| 18 to 34 Years | 657 (0.5%) | 1,113 (0.8%) |
| 35 to 64 Years | 3,760 (1.9%) | 3,001 (1.4%) |
| 65 to 74 Years | 2,250 (6.6%) | 1,396 (3.2%) |
| 75 Years and over | 4,273 (22.8%) | 4,708 (15.9%) |
Disability Class: Vision Difficulty
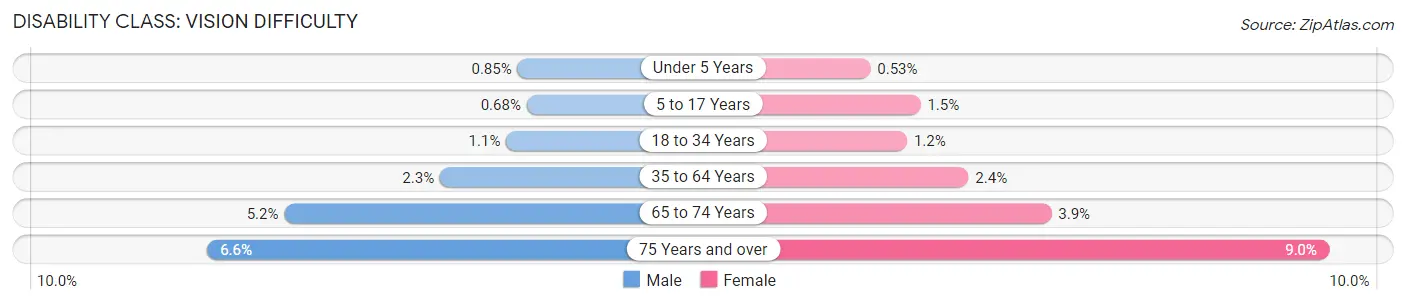
| Age Bracket | Male | Female |
| Under 5 Years | 251 (0.9%) | 151 (0.5%) |
| 5 to 17 Years | 577 (0.7%) | 1,193 (1.5%) |
| 18 to 34 Years | 1,497 (1.1%) | 1,756 (1.2%) |
| 35 to 64 Years | 4,636 (2.3%) | 5,021 (2.4%) |
| 65 to 74 Years | 1,777 (5.2%) | 1,684 (3.9%) |
| 75 Years and over | 1,239 (6.6%) | 2,673 (9.0%) |
Disability Class: Cognitive Difficulty
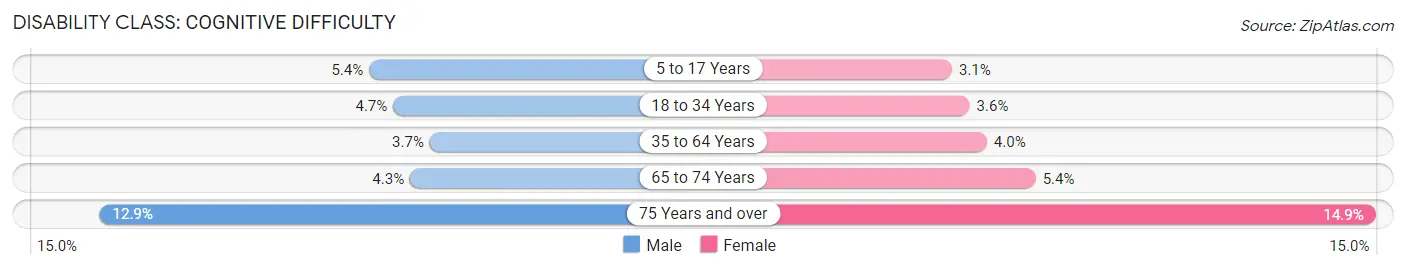
| Age Bracket | Male | Female |
| 5 to 17 Years | 4,559 (5.4%) | 2,512 (3.1%) |
| 18 to 34 Years | 6,718 (4.7%) | 5,148 (3.6%) |
| 35 to 64 Years | 7,523 (3.7%) | 8,618 (4.0%) |
| 65 to 74 Years | 1,465 (4.3%) | 2,336 (5.4%) |
| 75 Years and over | 2,419 (12.9%) | 4,395 (14.9%) |
Disability Class: Ambulatory Difficulty
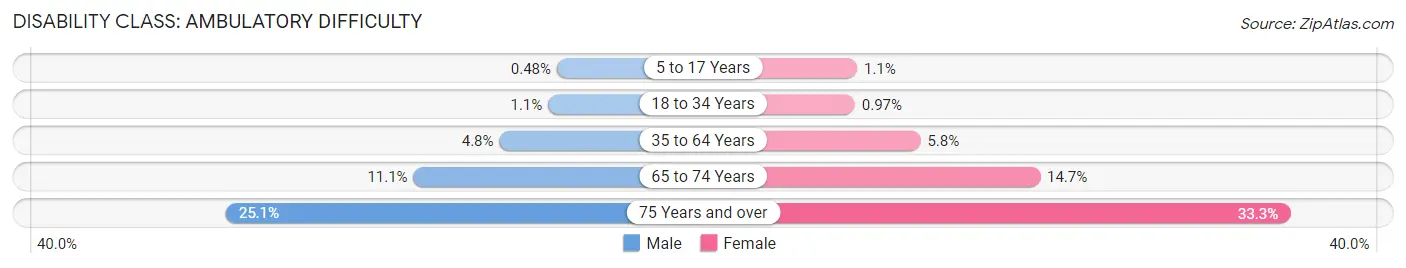
| Age Bracket | Male | Female |
| 5 to 17 Years | 406 (0.5%) | 927 (1.1%) |
| 18 to 34 Years | 1,602 (1.1%) | 1,409 (1.0%) |
| 35 to 64 Years | 9,597 (4.8%) | 12,456 (5.8%) |
| 65 to 74 Years | 3,816 (11.1%) | 6,372 (14.7%) |
| 75 Years and over | 4,695 (25.1%) | 9,843 (33.3%) |
Disability Class: Self-Care Difficulty
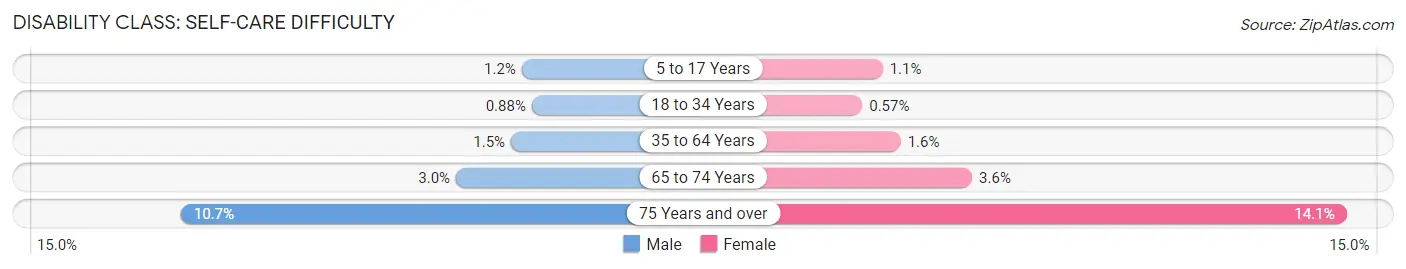
| Age Bracket | Male | Female |
| 5 to 17 Years | 981 (1.2%) | 931 (1.1%) |
| 18 to 34 Years | 1,241 (0.9%) | 826 (0.6%) |
| 35 to 64 Years | 2,946 (1.5%) | 3,506 (1.6%) |
| 65 to 74 Years | 1,024 (3.0%) | 1,571 (3.6%) |
| 75 Years and over | 1,996 (10.6%) | 4,157 (14.1%) |
Technology Access in Fulton County
Computing Device Access in Fulton County
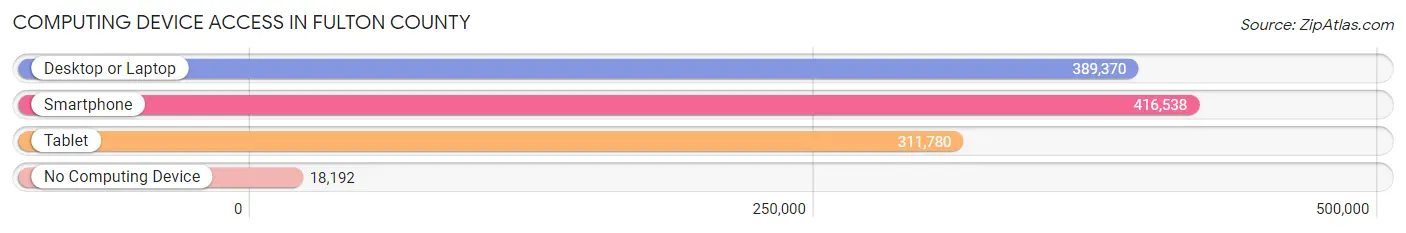
| Device Type | # Households | % Households |
| Desktop or Laptop | 389,370 | 86.4% |
| Smartphone | 416,538 | 92.4% |
| Tablet | 311,780 | 69.2% |
| No Computing Device | 18,192 | 4.0% |
| Total | 450,856 | 100.0% |
Internet Access in Fulton County
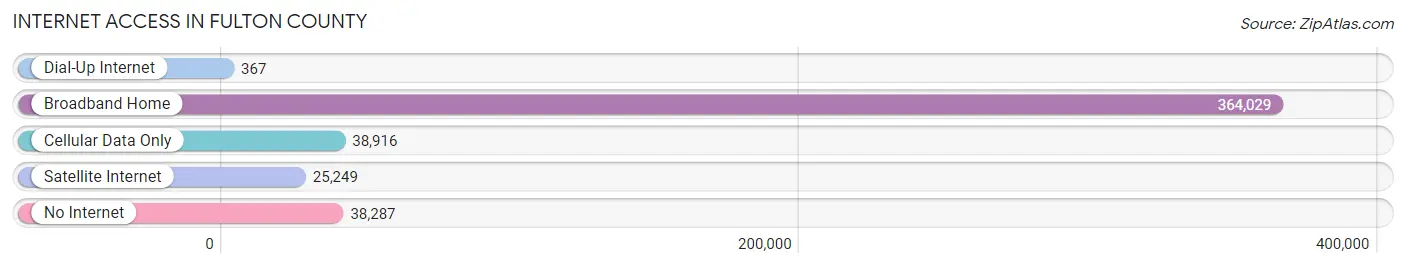
| Internet Type | # Households | % Households |
| Dial-Up Internet | 367 | 0.1% |
| Broadband Home | 364,029 | 80.7% |
| Cellular Data Only | 38,916 | 8.6% |
| Satellite Internet | 25,249 | 5.6% |
| No Internet | 38,287 | 8.5% |
| Total | 450,856 | 100.0% |
Fulton County Summary
Fulton County, Georgia is located in the north-central part of the state and is the most populous county in the state. It is bordered by Cobb County to the northwest, DeKalb County to the east, Clayton County to the south, and Forsyth and Cherokee counties to the north. The county seat is Atlanta, the state capital and largest city in Georgia.
History
Fulton County was created in 1853 from the western half of DeKalb County. It was named after Robert Fulton, the inventor of the steamboat. The county was originally divided into four townships: Milton, Sandy Springs, Chattahoochee, and Alpharetta. In 1932, Milton and Chattahoochee townships were merged to form Milton Township. In the 1950s, the county was reorganized into five districts: North Fulton, South Fulton, East Point, College Park, and Roswell.
In the 1960s, the county was the site of the civil rights movement, with many protests and demonstrations taking place in Atlanta. In 1971, the county was the first in the state to adopt a county-wide zoning ordinance.
Geography
Fulton County covers an area of 534 square miles and is located in the Piedmont region of Georgia. The county is mostly flat, with the exception of the Chattahoochee River, which runs through the northern part of the county. The county is home to several parks, including Chattahoochee River National Recreation Area, Chattahoochee Bend State Park, and Sweetwater Creek State Park.
The county is divided into two parts by the Chattahoochee River. The northern part of the county is known as North Fulton, while the southern part is known as South Fulton. The county is home to several cities, including Atlanta, Alpharetta, Roswell, Sandy Springs, East Point, College Park, and Milton.
Economy
Fulton County is home to a diverse economy, with a variety of industries and businesses. The county is home to several Fortune 500 companies, including The Home Depot, Delta Air Lines, and UPS. The county is also home to several universities, including Georgia Institute of Technology, Emory University, and Georgia State University.
The county is home to several major tourist attractions, including the Georgia Aquarium, the World of Coca-Cola, and the Atlanta Zoo. The county is also home to several professional sports teams, including the Atlanta Braves, the Atlanta Falcons, and the Atlanta Hawks.
Demographics
As of the 2010 census, Fulton County had a population of 920,581. The racial makeup of the county was 54.3% White, 33.2% Black or African American, 4.2% Asian, 0.3% Native American, 0.1% Pacific Islander, 6.2% from other races, and 1.9% from two or more races. Hispanic or Latino of any race were 11.3% of the population.
The median income for a household in the county was $50,895, and the median income for a family was $60,857. The per capita income for the county was $30,890. About 11.3% of families and 14.7% of the population were below the poverty line, including 20.2% of those under age 18 and 9.2% of those age 65 or over.
Common Questions
What is the Total Population of Fulton County?
Total Population of Fulton County is 1,061,944.
What is the Total Male Population of Fulton County?
Total Male Population of Fulton County is 518,219.
What is the Total Female Population of Fulton County?
Total Female Population of Fulton County is 543,725.
What is the Ratio of Males per 100 Females in Fulton County?
There are 95.31 Males per 100 Females in Fulton County.
What is the Ratio of Females per 100 Males in Fulton County?
There are 104.92 Females per 100 Males in Fulton County.
What is the Median Population Age in Fulton County?
Median Population Age in Fulton County is 36.1 Years.
What is the Average Family Size in Fulton County
Average Family Size in Fulton County is 3.1 People.
What is the Average Household Size in Fulton County
Average Household Size in Fulton County is 2.3 People.
What is Per Capita Income in Fulton County?
Per Capita income in Fulton County is $58,314.
What is the Median Family Income in Fulton County?
Median Family Income in Fulton County is $115,353.
What is the Median Household income in Fulton County?
Median Household Income in Fulton County is $86,267.
What is Income or Wage Gap in Fulton County?
Income or Wage Gap in Fulton County is 28.5%.
Women in Fulton County earn 71.5 cents for every dollar earned by a man.
What is Family Income Deficit in Fulton County?
Family Income Deficit in Fulton County is $11,559.
Families that are below poverty line in Fulton County earn $11,559 less on average than the poverty threshold level.
What is Inequality or Gini Index in Fulton County?
Inequality or Gini Index in Fulton County is 0.53.
How Large is the Labor Force in Fulton County?
There are 594,870 People in the Labor Forcein in Fulton County.
What is the Percentage of People in the Labor Force in Fulton County?
68.9% of People are in the Labor Force in Fulton County.
What is the Unemployment Rate in Fulton County?
Unemployment Rate in Fulton County is 5.4%.