Cities with the Highest Percentage of Immigrants from Liberia in the United States
RELATED REPORTS & OPTIONS
Liberia
United States
Compare Cities
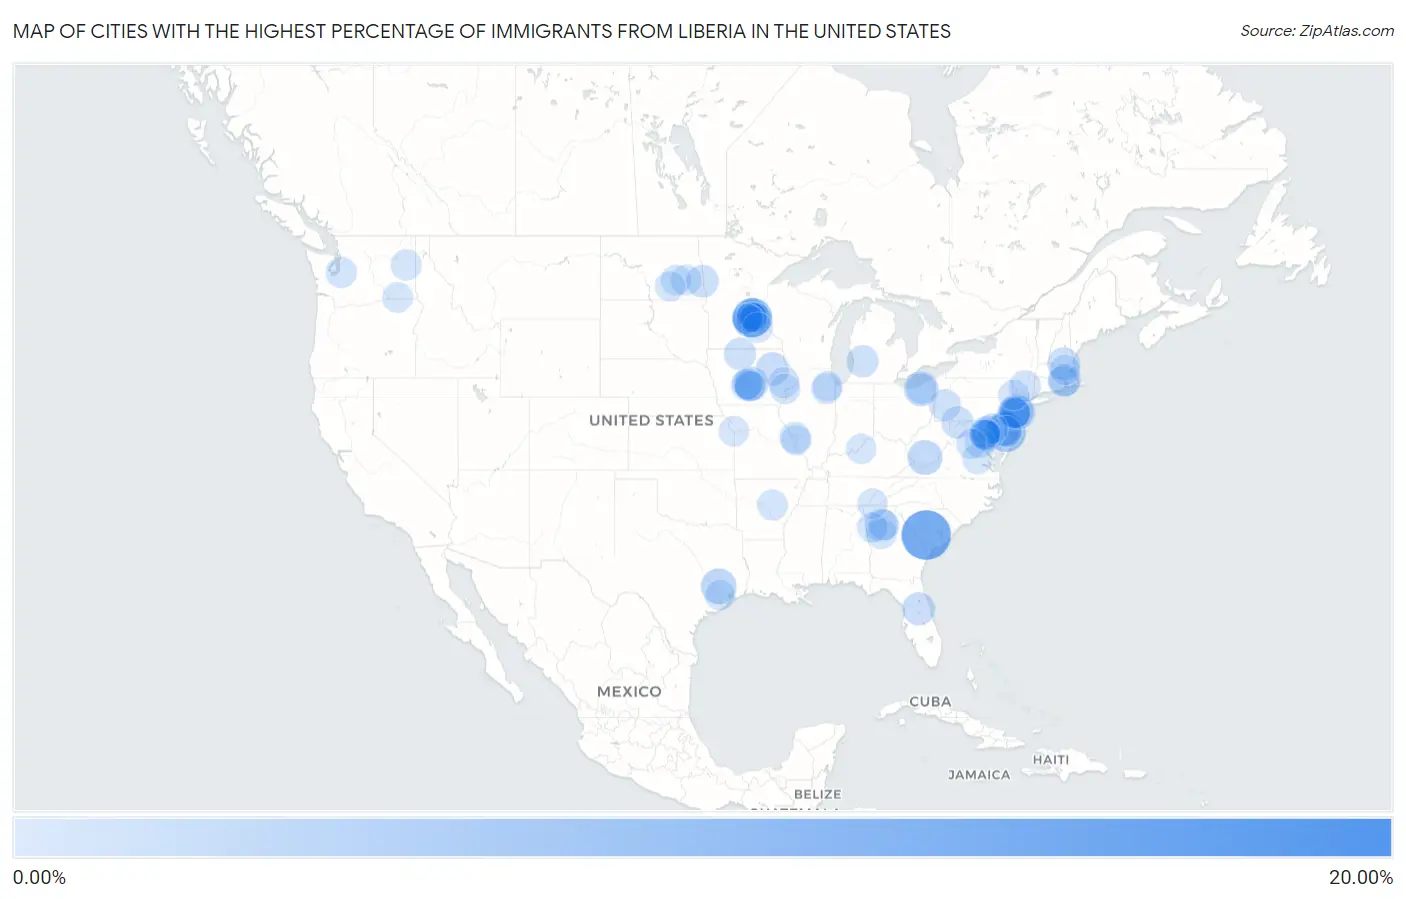
Map of Cities with the Highest Percentage of Immigrants from Liberia in the United States
0.00%
20.00%
Cities with the Highest Percentage of Immigrants from Liberia in the United States
| City | Liberia | vs State | vs National | |
| 1. | Colwyn Borough | 15.34% | 0.099%(+15.2)#-1 | 0.030%(+15.3)#0 |
| 2. | Denmark | 11.15% | 0.0094%(+11.1)#-1 | 0.030%(+11.1)#1 |
| 3. | Darby Borough | 8.07% | 0.099%(+7.97)#0 | 0.030%(+8.04)#2 |
| 4. | Woodbourne | 7.48% | 0.023%(+7.46)#-1 | 0.030%(+7.45)#3 |
| 5. | Brooklyn Center | 5.35% | 0.24%(+5.11)#-1 | 0.030%(+5.32)#4 |
| 6. | Rising Sun Lebanon | 5.34% | 0.14%(+5.21)#-1 | 0.030%(+5.32)#5 |
| 7. | Brooklyn Park | 5.14% | 0.24%(+4.90)#36 | 0.030%(+5.11)#1,897 |
| 8. | New Hope | 4.76% | 0.24%(+4.52)#37 | 0.030%(+4.73)#1,898 |
| 9. | South Coatesville Borough | 4.28% | 0.099%(+4.18)#1 | 0.030%(+4.25)#1,899 |
| 10. | Lansdowne Borough | 4.10% | 0.099%(+4.00)#2 | 0.030%(+4.07)#1,900 |
| 11. | Millbourne Borough | 3.86% | 0.099%(+3.76)#3 | 0.030%(+3.83)#1,901 |
| 12. | Magnolia | 3.36% | 0.020%(+3.34)#-1 | 0.030%(+3.33)#1,902 |
| 13. | Sharon Hill Borough | 3.33% | 0.099%(+3.23)#4 | 0.030%(+3.30)#1,903 |
| 14. | Cheswold | 3.29% | 0.14%(+3.16)#0 | 0.030%(+3.26)#1,904 |
| 15. | Sophia | 2.95% | 0.0050%(+2.94)#-1 | 0.030%(+2.92)#1,905 |
| 16. | Orange | 2.91% | 0.022%(+2.89)#-1 | 0.030%(+2.88)#1,906 |
| 17. | Bargaintown | 2.83% | 0.092%(+2.74)#-1 | 0.030%(+2.80)#1,907 |
| 18. | Clayton | 2.74% | 0.14%(+2.60)#1 | 0.030%(+2.71)#1,908 |
| 19. | Burlington | 2.73% | 0.092%(+2.63)#0 | 0.030%(+2.70)#1,909 |
| 20. | Yeadon Borough | 2.67% | 0.099%(+2.57)#5 | 0.030%(+2.64)#1,910 |
| 21. | Bondurant | 2.53% | 0.092%(+2.44)#-1 | 0.030%(+2.50)#1,911 |
| 22. | Trainer Borough | 2.44% | 0.099%(+2.34)#6 | 0.030%(+2.41)#1,912 |
| 23. | Trenton | 2.40% | 0.092%(+2.31)#70 | 0.030%(+2.37)#1,932 |
| 24. | Champlin | 2.37% | 0.24%(+2.13)#38 | 0.030%(+2.34)#1,933 |
| 25. | Groveville | 2.13% | 0.092%(+2.04)#71 | 0.030%(+2.10)#1,934 |
| 26. | Independence | 2.11% | 0.092%(+2.02)#0 | 0.030%(+2.08)#1,935 |
| 27. | Eustis | 1.94% | 0.0090%(+1.93)#-1 | 0.030%(+1.91)#1,936 |
| 28. | Hudson | 1.86% | 0.034%(+1.82)#3 | 0.030%(+1.83)#1,937 |
| 29. | Chamblee | 1.82% | 0.041%(+1.78)#43 | 0.030%(+1.79)#1,938 |
| 30. | Fargo | 1.73% | 0.40%(+1.33)#27 | 0.030%(+1.70)#2,048 |
| 31. | Clifton Heights Borough | 1.70% | 0.099%(+1.60)#7 | 0.030%(+1.67)#2,049 |
| 32. | Pawtucket | 1.64% | 0.36%(+1.28)#-1 | 0.030%(+1.61)#2,050 |
| 33. | Bancroft | 1.61% | 0.092%(+1.52)#1 | 0.030%(+1.58)#2,051 |
| 34. | Midlothian | 1.60% | 0.097%(+1.50)#-1 | 0.030%(+1.57)#2,052 |
| 35. | Freemansburg Borough | 1.57% | 0.099%(+1.47)#8 | 0.030%(+1.54)#2,053 |
| 36. | Feasterville | 1.57% | 0.099%(+1.47)#9 | 0.030%(+1.54)#2,054 |
| 37. | Morton Borough | 1.56% | 0.099%(+1.46)#10 | 0.030%(+1.53)#2,055 |
| 38. | Collingdale Borough | 1.55% | 0.099%(+1.45)#11 | 0.030%(+1.52)#2,056 |
| 39. | Kentwood | 1.43% | 0.017%(+1.42)#32 | 0.030%(+1.40)#2,057 |
| 40. | Arnold | 1.40% | 0.099%(+1.30)#12 | 0.030%(+1.37)#2,058 |
| 41. | Walden | 1.38% | 0.023%(+1.36)#0 | 0.030%(+1.35)#2,059 |
| 42. | Little Canada | 1.29% | 0.24%(+1.05)#39 | 0.030%(+1.26)#2,060 |
| 43. | Crystal | 1.25% | 0.24%(+1.01)#40 | 0.030%(+1.22)#2,061 |
| 44. | Penndel Borough | 1.20% | 0.099%(+1.10)#13 | 0.030%(+1.17)#2,062 |
| 45. | Edmonston | 1.20% | 0.097%(+1.10)#0 | 0.030%(+1.17)#2,063 |
| 46. | Providence | 1.19% | 0.36%(+0.838)#0 | 0.030%(+1.16)#2,064 |
| 47. | Center Point | 1.16% | 0.0066%(+1.16)#-1 | 0.030%(+1.13)#2,065 |
| 48. | Hazelwood | 1.15% | 0.015%(+1.13)#-1 | 0.030%(+1.12)#2,066 |
| 49. | Altoona | 1.05% | 0.092%(+0.957)#2 | 0.030%(+1.02)#2,067 |
| 50. | Algona | 1.04% | 0.015%(+1.03)#-1 | 0.030%(+1.01)#2,068 |
| 51. | Kettering | 1.03% | 0.097%(+0.934)#1 | 0.030%(+1.00)#2,069 |
| 52. | Andover | 1.03% | 0.24%(+0.789)#41 | 0.030%(+1.000)#2,070 |
| 53. | Maple Grove | 1.01% | 0.24%(+0.772)#42 | 0.030%(+0.983)#2,071 |
| 54. | Fairless Hills | 1.01% | 0.099%(+0.911)#14 | 0.030%(+0.980)#2,072 |
| 55. | Prospect Park Borough | 1.00% | 0.099%(+0.899)#15 | 0.030%(+0.969)#2,073 |
| 56. | Ward | 0.99% | 0.0042%(+0.988)#-1 | 0.030%(+0.962)#2,074 |
| 57. | Croydon | 0.98% | 0.099%(+0.885)#16 | 0.030%(+0.955)#2,075 |
| 58. | Fairchild Afb | 0.97% | 0.015%(+0.959)#0 | 0.030%(+0.944)#2,076 |
| 59. | Fairland | 0.97% | 0.097%(+0.869)#34 | 0.030%(+0.936)#2,077 |
| 60. | Clive | 0.94% | 0.092%(+0.844)#3 | 0.030%(+0.907)#2,078 |
| 61. | Dover | 0.93% | 0.14%(+0.795)#2 | 0.030%(+0.904)#2,079 |
| 62. | North Laurel | 0.91% | 0.097%(+0.809)#39 | 0.030%(+0.875)#2,080 |
| 63. | Glenn Dale | 0.90% | 0.097%(+0.802)#40 | 0.030%(+0.869)#2,081 |
| 64. | Tipton | 0.89% | 0.092%(+0.802)#4 | 0.030%(+0.865)#2,082 |
| 65. | Charleroi Borough | 0.88% | 0.099%(+0.777)#30 | 0.030%(+0.847)#2,083 |
| 66. | Valley City | 0.85% | 0.40%(+0.456)#28 | 0.030%(+0.824)#2,084 |
| 67. | Triangle | 0.85% | 0.026%(+0.819)#-1 | 0.030%(+0.815)#2,085 |
| 68. | Glen Allen | 0.84% | 0.026%(+0.818)#0 | 0.030%(+0.814)#2,086 |
| 69. | Hampton | 0.82% | 0.041%(+0.784)#44 | 0.030%(+0.795)#2,087 |
| 70. | Essex | 0.82% | 0.097%(+0.726)#41 | 0.030%(+0.793)#2,088 |
| 71. | Lilburn | 0.81% | 0.041%(+0.767)#45 | 0.030%(+0.778)#2,089 |
| 72. | Jamestown | 0.80% | 0.40%(+0.403)#29 | 0.030%(+0.772)#2,090 |
| 73. | Osseo | 0.80% | 0.24%(+0.557)#43 | 0.030%(+0.768)#2,091 |
| 74. | Bristol Borough | 0.79% | 0.099%(+0.692)#31 | 0.030%(+0.761)#2,092 |
| 75. | Walla Walla | 0.77% | 0.015%(+0.759)#74 | 0.030%(+0.744)#2,093 |
| 76. | Calverton | 0.77% | 0.097%(+0.673)#42 | 0.030%(+0.740)#2,094 |
| 77. | Pine Ridge | 0.77% | 0.099%(+0.669)#32 | 0.030%(+0.738)#2,095 |
| 78. | Johnston | 0.76% | 0.092%(+0.670)#5 | 0.030%(+0.733)#2,096 |
| 79. | Long Lake | 0.76% | 0.24%(+0.519)#44 | 0.030%(+0.730)#2,097 |
| 80. | Elwood | 0.73% | 0.0048%(+0.730)#-1 | 0.030%(+0.705)#2,098 |
| 81. | Takoma Park | 0.72% | 0.097%(+0.627)#43 | 0.030%(+0.694)#2,099 |
| 82. | South Cleveland | 0.72% | 0.011%(+0.712)#-1 | 0.030%(+0.694)#2,100 |
| 83. | West Buechel | 0.72% | 0.017%(+0.706)#-1 | 0.030%(+0.693)#2,101 |
| 84. | Hopkins | 0.72% | 0.24%(+0.479)#45 | 0.030%(+0.690)#2,102 |
| 85. | Muscatine | 0.72% | 0.092%(+0.626)#6 | 0.030%(+0.688)#2,103 |
| 86. | Pleasant Hill | 0.72% | 0.092%(+0.625)#7 | 0.030%(+0.688)#2,104 |
| 87. | Culpeper | 0.72% | 0.026%(+0.691)#38 | 0.030%(+0.687)#2,105 |
| 88. | Highland Hills | 0.72% | 0.022%(+0.693)#0 | 0.030%(+0.686)#2,106 |
| 89. | Four Corners | 0.70% | 0.020%(+0.684)#0 | 0.030%(+0.674)#2,107 |
| 90. | Coon Rapids | 0.69% | 0.24%(+0.447)#46 | 0.030%(+0.658)#2,108 |
| 91. | Pasadena Park | 0.68% | 0.015%(+0.669)#0 | 0.030%(+0.654)#2,109 |
| 92. | New Brighton | 0.68% | 0.24%(+0.442)#47 | 0.030%(+0.653)#2,110 |
| 93. | Hampton | 0.68% | 0.24%(+0.436)#48 | 0.030%(+0.647)#2,111 |
| 94. | Maple Plain | 0.67% | 0.24%(+0.434)#49 | 0.030%(+0.644)#2,112 |
| 95. | East Lansdowne Borough | 0.67% | 0.099%(+0.567)#33 | 0.030%(+0.636)#2,113 |
| 96. | Fairmont | 0.66% | 0.0048%(+0.650)#0 | 0.030%(+0.625)#2,114 |
| 97. | West Concord | 0.65% | 0.040%(+0.611)#-1 | 0.030%(+0.621)#2,115 |
| 98. | Riverside | 0.65% | 0.015%(+0.632)#1 | 0.030%(+0.618)#2,116 |
| 99. | Gackle | 0.65% | 0.40%(+0.249)#30 | 0.030%(+0.618)#2,117 |
| 100. | Villa Rica | 0.64% | 0.041%(+0.599)#46 | 0.030%(+0.610)#2,118 |
Common Questions
What are the Top 10 Cities with the Highest Percentage of Immigrants from Liberia in the United States?
Top 10 Cities with the Highest Percentage of Immigrants from Liberia in the United States are:
What city has the Highest Percentage of Immigrants from Liberia in the United States?
Denmark has the Highest Percentage of Immigrants from Liberia in the United States with 11.15%.
What is the Percentage of Immigrants from Liberia in the United States?
Percentage of Immigrants from Liberia in the United States is 0.030%.