Clarke County, GA
Clarke County Map
Clarke County Overview
128,864
TOTAL POPULATION
61,390
MALE POPULATION
67,474
FEMALE POPULATION
90.98
MALES / 100 FEMALES
109.91
FEMALES / 100 MALES
28.9
MEDIAN AGE
2.9
AVG FAMILY SIZE
2.2
AVG HOUSEHOLD SIZE
$30,138
PER CAPITA INCOME
$75,254
AVG FAMILY INCOME
$48,692
AVG HOUSEHOLD INCOME
20.5%
WAGE / INCOME GAP [ % ]
79.5¢/ $1
WAGE / INCOME GAP [ $ ]
$10,350
FAMILY INCOME DEFICIT
0.51
INEQUALITY / GINI INDEX
67,265
LABOR FORCE [ PEOPLE ]
61.6%
PERCENT IN LABOR FORCE
5.3%
UNEMPLOYMENT RATE
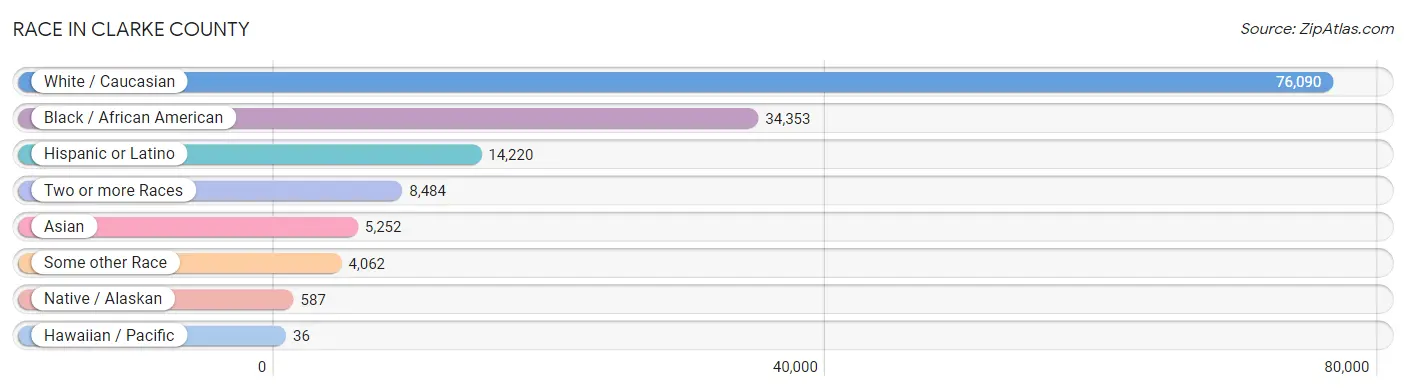
Race in Clarke County
The most populous races in Clarke County are White / Caucasian (76,090 | 59.1%), Black / African American (34,353 | 26.7%), and Hispanic or Latino (14,220 | 11.0%).
| Race | # Population | % Population |
| Asian | 5,252 | 4.1% |
| Black / African American | 34,353 | 26.7% |
| Hawaiian / Pacific | 36 | 0.0% |
| Hispanic or Latino | 14,220 | 11.0% |
| Native / Alaskan | 587 | 0.5% |
| White / Caucasian | 76,090 | 59.1% |
| Two or more Races | 8,484 | 6.6% |
| Some other Race | 4,062 | 3.2% |
| Total | 128,864 | 100.0% |
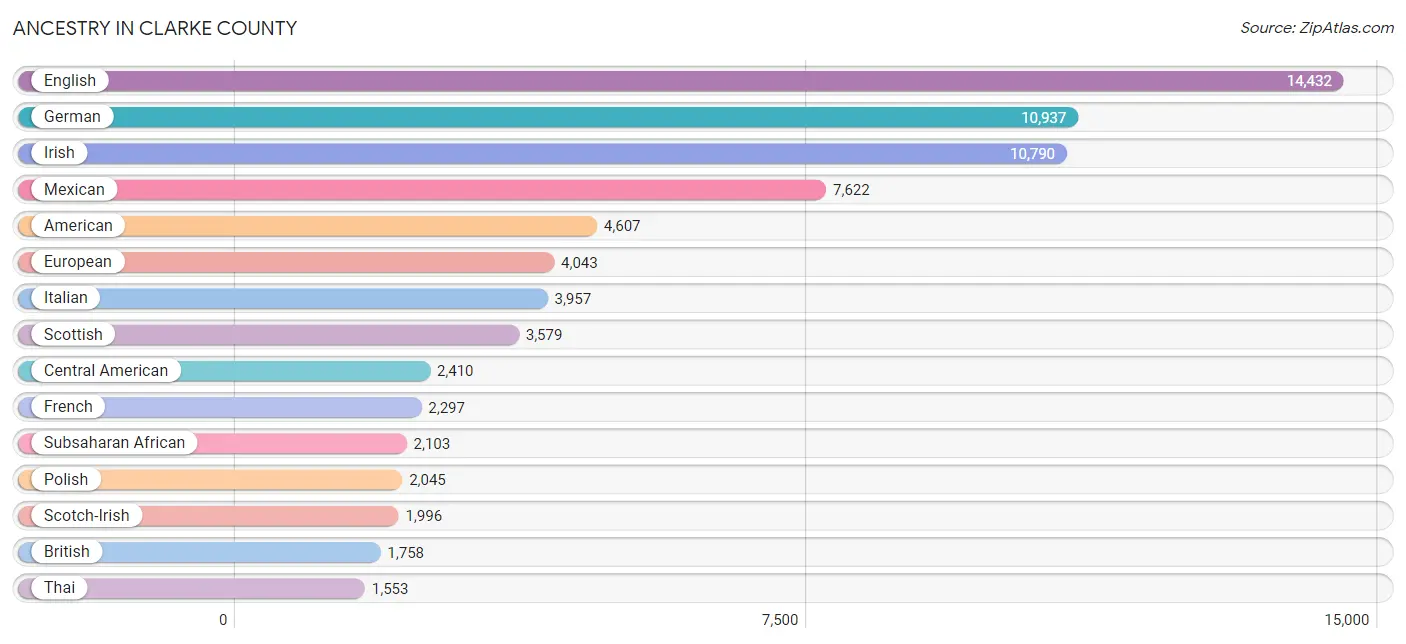
Ancestry in Clarke County
The most populous ancestries reported in Clarke County are English (14,432 | 11.2%), German (10,937 | 8.5%), Irish (10,790 | 8.4%), Mexican (7,622 | 5.9%), and American (4,607 | 3.6%), together accounting for 37.6% of all Clarke County residents.
| Ancestry | # Population | % Population |
| African | 1,035 | 0.8% |
| Aleut | 7 | 0.0% |
| Alsatian | 13 | 0.0% |
| American | 4,607 | 3.6% |
| Apache | 8 | 0.0% |
| Arab | 666 | 0.5% |
| Argentinean | 240 | 0.2% |
| Armenian | 48 | 0.0% |
| Australian | 10 | 0.0% |
| Austrian | 180 | 0.1% |
| Bangladeshi | 104 | 0.1% |
| Basque | 13 | 0.0% |
| Belgian | 98 | 0.1% |
| Bhutanese | 161 | 0.1% |
| Blackfeet | 45 | 0.0% |
| Bolivian | 24 | 0.0% |
| Brazilian | 106 | 0.1% |
| British | 1,758 | 1.4% |
| Bulgarian | 61 | 0.1% |
| Burmese | 1,141 | 0.9% |
| Cajun | 77 | 0.1% |
| Canadian | 270 | 0.2% |
| Carpatho Rusyn | 6 | 0.0% |
| Celtic | 71 | 0.1% |
| Central American | 2,410 | 1.9% |
| Central American Indian | 212 | 0.2% |
| Cherokee | 817 | 0.6% |
| Chickasaw | 21 | 0.0% |
| Chilean | 14 | 0.0% |
| Chippewa | 1 | 0.0% |
| Colombian | 641 | 0.5% |
| Costa Rican | 12 | 0.0% |
| Creek | 20 | 0.0% |
| Croatian | 35 | 0.0% |
| Cuban | 920 | 0.7% |
| Czech | 343 | 0.3% |
| Czechoslovakian | 58 | 0.1% |
| Danish | 217 | 0.2% |
| Dominican | 410 | 0.3% |
| Dutch | 1,158 | 0.9% |
| Dutch West Indian | 90 | 0.1% |
| Eastern European | 282 | 0.2% |
| Ecuadorian | 41 | 0.0% |
| Egyptian | 237 | 0.2% |
| English | 14,432 | 11.2% |
| Ethiopian | 22 | 0.0% |
| European | 4,043 | 3.1% |
| Filipino | 16 | 0.0% |
| Finnish | 35 | 0.0% |
| French | 2,297 | 1.8% |
| French Canadian | 293 | 0.2% |
| German | 10,937 | 8.5% |
| Ghanaian | 107 | 0.1% |
| Greek | 398 | 0.3% |
| Guatemalan | 360 | 0.3% |
| Haitian | 114 | 0.1% |
| Honduran | 511 | 0.4% |
| Hungarian | 311 | 0.2% |
| Indian (Asian) | 1,408 | 1.1% |
| Indonesian | 296 | 0.2% |
| Iranian | 130 | 0.1% |
| Irish | 10,790 | 8.4% |
| Iroquois | 83 | 0.1% |
| Israeli | 125 | 0.1% |
| Italian | 3,957 | 3.1% |
| Jamaican | 236 | 0.2% |
| Japanese | 13 | 0.0% |
| Jordanian | 13 | 0.0% |
| Kenyan | 298 | 0.2% |
| Korean | 760 | 0.6% |
| Laotian | 18 | 0.0% |
| Latvian | 94 | 0.1% |
| Lebanese | 294 | 0.2% |
| Liberian | 26 | 0.0% |
| Lithuanian | 149 | 0.1% |
| Luxembourger | 5 | 0.0% |
| Macedonian | 31 | 0.0% |
| Malaysian | 101 | 0.1% |
| Maltese | 18 | 0.0% |
| Mexican | 7,622 | 5.9% |
| Mexican American Indian | 1 | 0.0% |
| Mongolian | 28 | 0.0% |
| Native Hawaiian | 39 | 0.0% |
| Navajo | 10 | 0.0% |
| New Zealander | 15 | 0.0% |
| Nigerian | 330 | 0.3% |
| Northern European | 311 | 0.2% |
| Norwegian | 568 | 0.4% |
| Ottawa | 28 | 0.0% |
| Pakistani | 138 | 0.1% |
| Palestinian | 18 | 0.0% |
| Panamanian | 57 | 0.0% |
| Pennsylvania German | 19 | 0.0% |
| Peruvian | 341 | 0.3% |
| Pima | 4 | 0.0% |
| Polish | 2,045 | 1.6% |
| Portuguese | 181 | 0.1% |
| Potawatomi | 124 | 0.1% |
| Puerto Rican | 497 | 0.4% |
| Romanian | 39 | 0.0% |
| Russian | 830 | 0.6% |
| Salvadoran | 1,470 | 1.1% |
| Samoan | 9 | 0.0% |
| Scandinavian | 476 | 0.4% |
| Scotch-Irish | 1,996 | 1.5% |
| Scottish | 3,579 | 2.8% |
| Seminole | 109 | 0.1% |
| Senegalese | 7 | 0.0% |
| Serbian | 16 | 0.0% |
| Sierra Leonean | 30 | 0.0% |
| Sioux | 16 | 0.0% |
| Slavic | 62 | 0.1% |
| Slovak | 49 | 0.0% |
| South African | 19 | 0.0% |
| South American | 1,515 | 1.2% |
| South American Indian | 8 | 0.0% |
| Spaniard | 180 | 0.1% |
| Spanish | 157 | 0.1% |
| Spanish American | 43 | 0.0% |
| Sri Lankan | 401 | 0.3% |
| Subsaharan African | 2,103 | 1.6% |
| Sudanese | 23 | 0.0% |
| Swedish | 789 | 0.6% |
| Swiss | 166 | 0.1% |
| Thai | 1,553 | 1.2% |
| Trinidadian and Tobagonian | 9 | 0.0% |
| Tsimshian | 26 | 0.0% |
| Turkish | 171 | 0.1% |
| Ukrainian | 141 | 0.1% |
| Uruguayan | 13 | 0.0% |
| Venezuelan | 201 | 0.2% |
| Welsh | 882 | 0.7% |
| West Indian | 83 | 0.1% |
| Zimbabwean | 86 | 0.1% | View All 134 Rows |
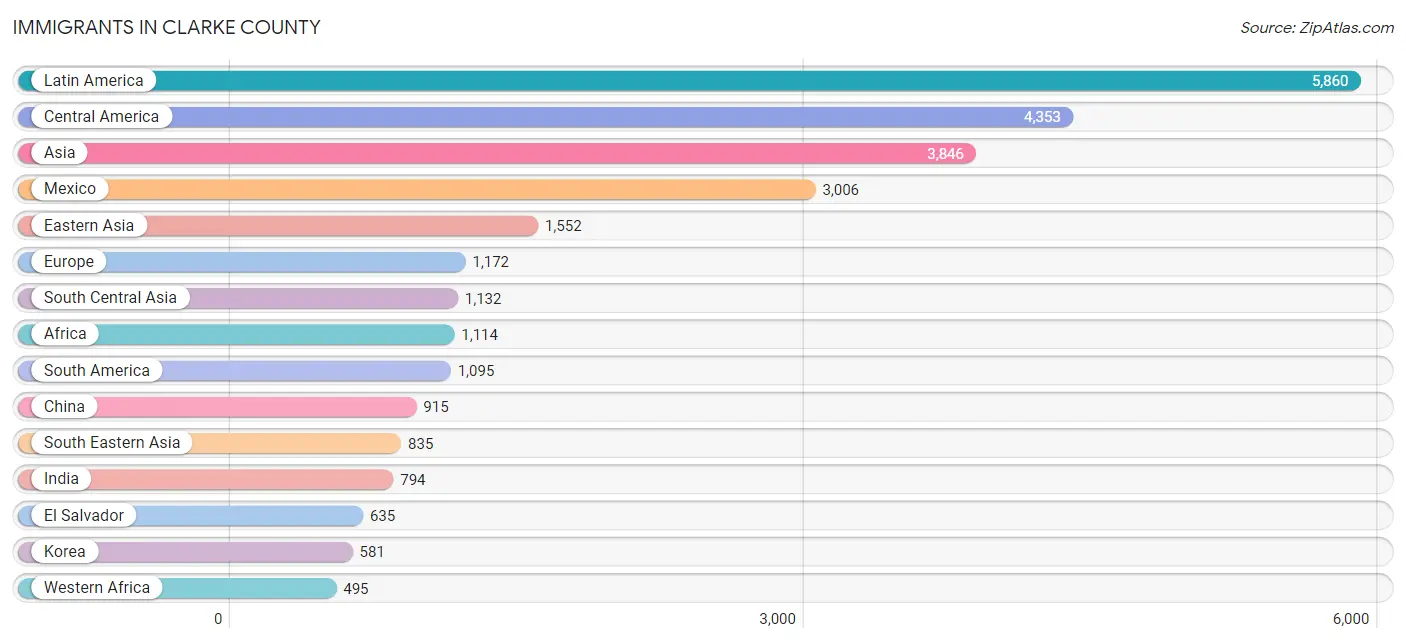
Immigrants in Clarke County
The most numerous immigrant groups reported in Clarke County came from Latin America (5,860 | 4.5%), Central America (4,353 | 3.4%), Asia (3,846 | 3.0%), Mexico (3,006 | 2.3%), and Eastern Asia (1,552 | 1.2%), together accounting for 14.4% of all Clarke County residents.
| Immigration Origin | # Population | % Population |
| Africa | 1,114 | 0.9% |
| Argentina | 118 | 0.1% |
| Asia | 3,846 | 3.0% |
| Australia | 10 | 0.0% |
| Austria | 19 | 0.0% |
| Bangladesh | 60 | 0.1% |
| Belgium | 2 | 0.0% |
| Bolivia | 8 | 0.0% |
| Brazil | 128 | 0.1% |
| Bulgaria | 38 | 0.0% |
| Cambodia | 13 | 0.0% |
| Canada | 295 | 0.2% |
| Caribbean | 412 | 0.3% |
| Central America | 4,353 | 3.4% |
| Chile | 14 | 0.0% |
| China | 915 | 0.7% |
| Colombia | 337 | 0.3% |
| Costa Rica | 12 | 0.0% |
| Cuba | 26 | 0.0% |
| Czechoslovakia | 20 | 0.0% |
| Dominica | 92 | 0.1% |
| Dominican Republic | 90 | 0.1% |
| Eastern Africa | 324 | 0.3% |
| Eastern Asia | 1,552 | 1.2% |
| Eastern Europe | 249 | 0.2% |
| Ecuador | 21 | 0.0% |
| Egypt | 117 | 0.1% |
| El Salvador | 635 | 0.5% |
| England | 207 | 0.2% |
| Ethiopia | 33 | 0.0% |
| Europe | 1,172 | 0.9% |
| France | 136 | 0.1% |
| Germany | 161 | 0.1% |
| Ghana | 40 | 0.0% |
| Guatemala | 222 | 0.2% |
| Haiti | 93 | 0.1% |
| Honduras | 430 | 0.3% |
| Hong Kong | 33 | 0.0% |
| India | 794 | 0.6% |
| Iran | 95 | 0.1% |
| Ireland | 38 | 0.0% |
| Israel | 117 | 0.1% |
| Italy | 57 | 0.0% |
| Jamaica | 90 | 0.1% |
| Japan | 56 | 0.0% |
| Jordan | 13 | 0.0% |
| Kazakhstan | 28 | 0.0% |
| Kenya | 204 | 0.2% |
| Korea | 581 | 0.4% |
| Laos | 26 | 0.0% |
| Latin America | 5,860 | 4.5% |
| Latvia | 15 | 0.0% |
| Lebanon | 59 | 0.1% |
| Liberia | 37 | 0.0% |
| Malaysia | 28 | 0.0% |
| Mexico | 3,006 | 2.3% |
| Nepal | 6 | 0.0% |
| Netherlands | 29 | 0.0% |
| Nigeria | 265 | 0.2% |
| Northern Africa | 233 | 0.2% |
| Northern Europe | 452 | 0.4% |
| Norway | 15 | 0.0% |
| Oceania | 10 | 0.0% |
| Pakistan | 84 | 0.1% |
| Panama | 48 | 0.0% |
| Peru | 278 | 0.2% |
| Philippines | 372 | 0.3% |
| Poland | 56 | 0.0% |
| Portugal | 9 | 0.0% |
| Romania | 15 | 0.0% |
| Russia | 43 | 0.0% |
| Sierra Leone | 30 | 0.0% |
| Singapore | 23 | 0.0% |
| South Africa | 62 | 0.1% |
| South America | 1,095 | 0.9% |
| South Central Asia | 1,132 | 0.9% |
| South Eastern Asia | 835 | 0.6% |
| Southern Europe | 124 | 0.1% |
| Spain | 58 | 0.1% |
| Sri Lanka | 26 | 0.0% |
| Sudan | 116 | 0.1% |
| Taiwan | 22 | 0.0% |
| Thailand | 65 | 0.1% |
| Trinidad and Tobago | 21 | 0.0% |
| Turkey | 126 | 0.1% |
| Ukraine | 21 | 0.0% |
| Uruguay | 13 | 0.0% |
| Venezuela | 178 | 0.1% |
| Vietnam | 72 | 0.1% |
| Western Africa | 495 | 0.4% |
| Western Asia | 315 | 0.2% |
| Western Europe | 347 | 0.3% |
| Zimbabwe | 86 | 0.1% | View All 93 Rows |
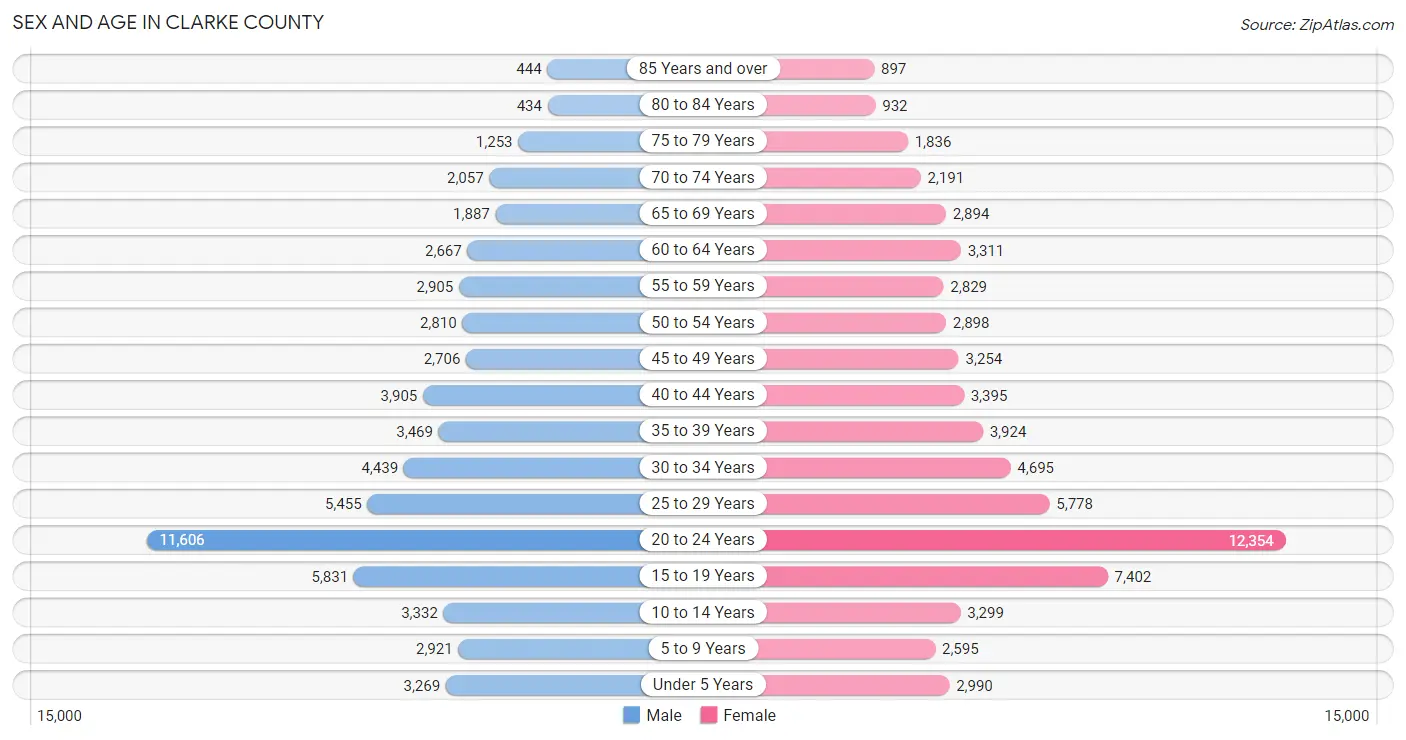
Sex and Age in Clarke County
Sex and Age in Clarke County
The most populous age groups in Clarke County are 20 to 24 Years (11,606 | 18.9%) for men and 20 to 24 Years (12,354 | 18.3%) for women.
| Age Bracket | Male | Female |
| Under 5 Years | 3,269 (5.3%) | 2,990 (4.4%) |
| 5 to 9 Years | 2,921 (4.8%) | 2,595 (3.8%) |
| 10 to 14 Years | 3,332 (5.4%) | 3,299 (4.9%) |
| 15 to 19 Years | 5,831 (9.5%) | 7,402 (11.0%) |
| 20 to 24 Years | 11,606 (18.9%) | 12,354 (18.3%) |
| 25 to 29 Years | 5,455 (8.9%) | 5,778 (8.6%) |
| 30 to 34 Years | 4,439 (7.2%) | 4,695 (7.0%) |
| 35 to 39 Years | 3,469 (5.7%) | 3,924 (5.8%) |
| 40 to 44 Years | 3,905 (6.4%) | 3,395 (5.0%) |
| 45 to 49 Years | 2,706 (4.4%) | 3,254 (4.8%) |
| 50 to 54 Years | 2,810 (4.6%) | 2,898 (4.3%) |
| 55 to 59 Years | 2,905 (4.7%) | 2,829 (4.2%) |
| 60 to 64 Years | 2,667 (4.3%) | 3,311 (4.9%) |
| 65 to 69 Years | 1,887 (3.1%) | 2,894 (4.3%) |
| 70 to 74 Years | 2,057 (3.4%) | 2,191 (3.3%) |
| 75 to 79 Years | 1,253 (2.0%) | 1,836 (2.7%) |
| 80 to 84 Years | 434 (0.7%) | 932 (1.4%) |
| 85 Years and over | 444 (0.7%) | 897 (1.3%) |
| Total | 61,390 (100.0%) | 67,474 (100.0%) |
Families and Households in Clarke County
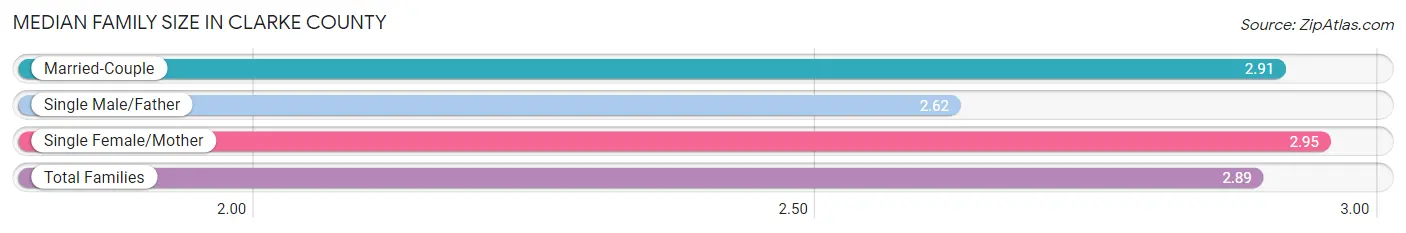
Median Family Size in Clarke County
The median family size in Clarke County is 2.89 persons per family, with single female/mother families (6,477 | 26.0%) accounting for the largest median family size of 2.95 persons per family. On the other hand, single male/father families (2,291 | 9.2%) represent the smallest median family size with 2.62 persons per family.
| Family Type | # Families | Family Size |
| Married-Couple | 16,187 (64.9%) | 2.91 |
| Single Male/Father | 2,291 (9.2%) | 2.62 |
| Single Female/Mother | 6,477 (26.0%) | 2.95 |
| Total Families | 24,955 (100.0%) | 2.89 |
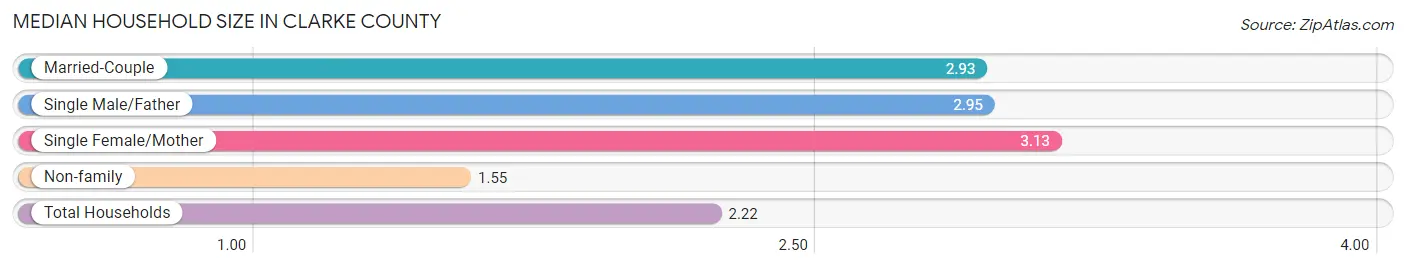
Median Household Size in Clarke County
The median household size in Clarke County is 2.22 persons per household, with single female/mother households (6,477 | 12.1%) accounting for the largest median household size of 3.13 persons per household. non-family households (28,381 | 53.2%) represent the smallest median household size with 1.55 persons per household.
| Household Type | # Households | Household Size |
| Married-Couple | 16,187 (30.3%) | 2.93 |
| Single Male/Father | 2,291 (4.3%) | 2.95 |
| Single Female/Mother | 6,477 (12.1%) | 3.13 |
| Non-family | 28,381 (53.2%) | 1.55 |
| Total Households | 53,336 (100.0%) | 2.22 |
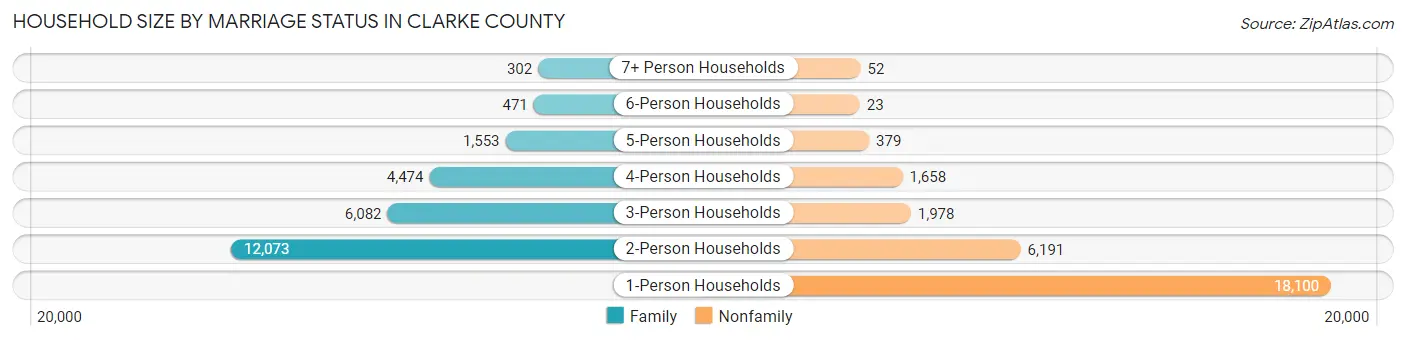
Household Size by Marriage Status in Clarke County
Out of a total of 53,336 households in Clarke County, 24,955 (46.8%) are family households, while 28,381 (53.2%) are nonfamily households. The most numerous type of family households are 2-person households, comprising 12,073, and the most common type of nonfamily households are 1-person households, comprising 18,100.
| Household Size | Family Households | Nonfamily Households |
| 1-Person Households | - | 18,100 (33.9%) |
| 2-Person Households | 12,073 (22.6%) | 6,191 (11.6%) |
| 3-Person Households | 6,082 (11.4%) | 1,978 (3.7%) |
| 4-Person Households | 4,474 (8.4%) | 1,658 (3.1%) |
| 5-Person Households | 1,553 (2.9%) | 379 (0.7%) |
| 6-Person Households | 471 (0.9%) | 23 (0.0%) |
| 7+ Person Households | 302 (0.6%) | 52 (0.1%) |
| Total | 24,955 (46.8%) | 28,381 (53.2%) |
Female Fertility in Clarke County
Fertility by Age in Clarke County
Average fertility rate in Clarke County is 29.0 births per 1,000 women. Women in the age bracket of 20 to 34 years have the highest fertility rate with 36.0 births per 1,000 women. Women in the age bracket of 20 to 34 years acount for 69.6% of all women with births.
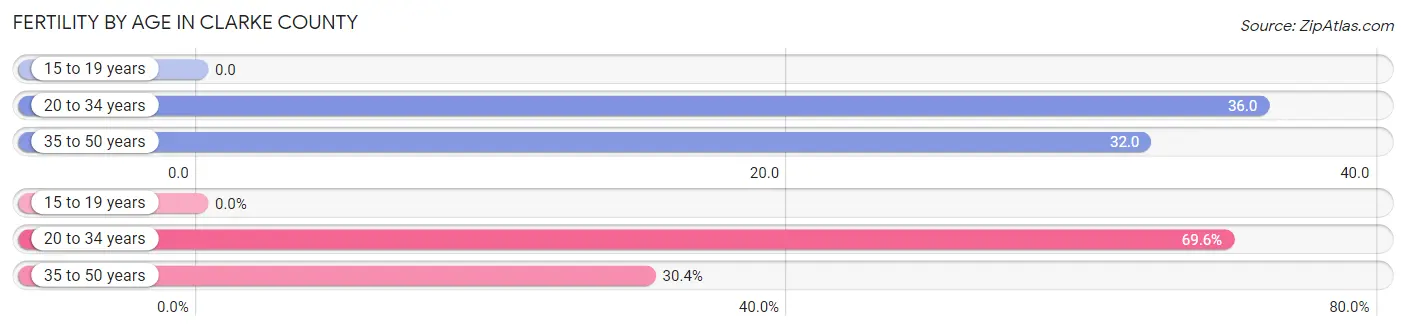
| Age Bracket | Women with Births | Births / 1,000 Women |
| 15 to 19 years | 0 (0.0%) | 0.0 |
| 20 to 34 years | 832 (69.6%) | 36.0 |
| 35 to 50 years | 363 (30.4%) | 32.0 |
| Total | 1,195 (100.0%) | 29.0 |
Fertility by Age by Marriage Status in Clarke County
67.1% of women with births (1,195) in Clarke County are married. The highest percentage of unmarried women with births falls into 20 to 34 years age bracket with 43.8% of them unmarried at the time of birth, while the lowest percentage of unmarried women with births belong to 35 to 50 years age bracket with 8.0% of them unmarried.
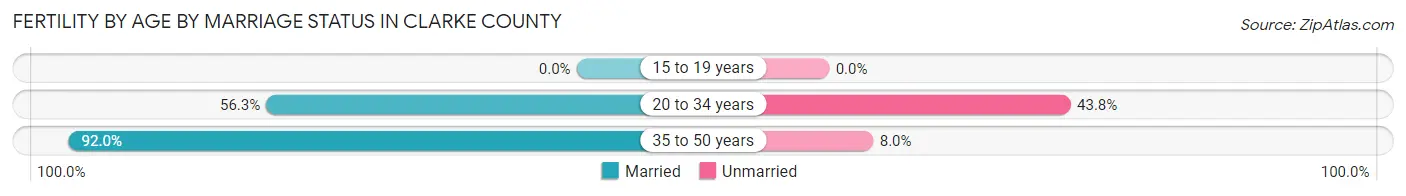
| Age Bracket | Married | Unmarried |
| 15 to 19 years | 0 (0.0%) | 0 (0.0%) |
| 20 to 34 years | 468 (56.2%) | 364 (43.8%) |
| 35 to 50 years | 334 (92.0%) | 29 (8.0%) |
| Total | 802 (67.1%) | 393 (32.9%) |
Fertility by Education in Clarke County
Average fertility rate in Clarke County is 29.0 births per 1,000 women. Women with the education attainment of high school diploma have the highest fertility rate of 57.0 births per 1,000 women, while women with the education attainment of college or associate's degree have the lowest fertility at 8.0 births per 1,000 women. Women with the education attainment of high school diploma represent 29.9% of all women with births.
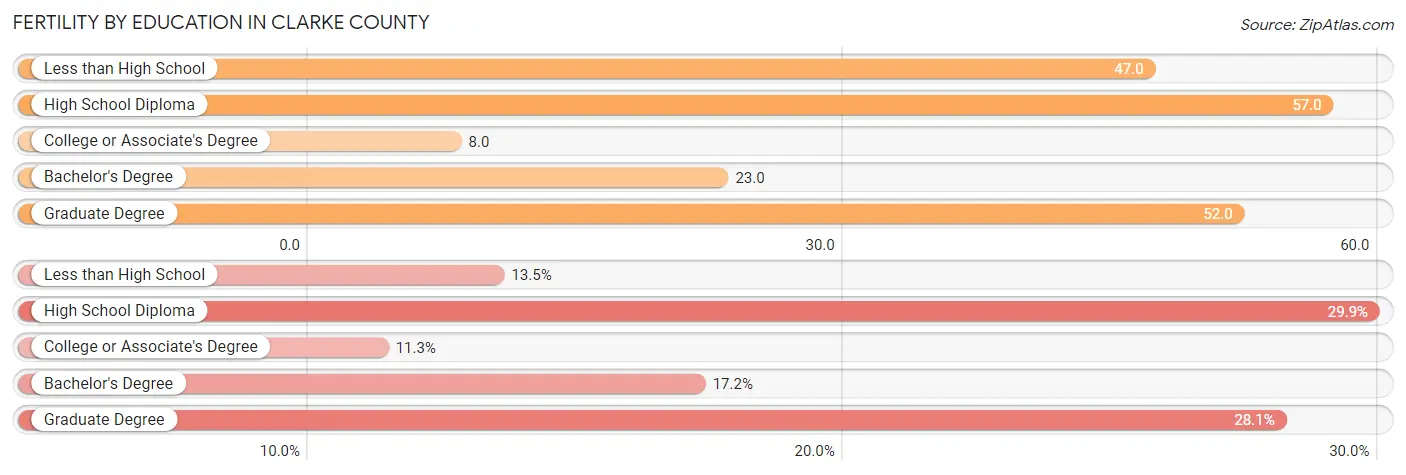
| Educational Attainment | Women with Births | Births / 1,000 Women |
| Less than High School | 161 (13.5%) | 47.0 |
| High School Diploma | 357 (29.9%) | 57.0 |
| College or Associate's Degree | 135 (11.3%) | 8.0 |
| Bachelor's Degree | 206 (17.2%) | 23.0 |
| Graduate Degree | 336 (28.1%) | 52.0 |
| Total | 1,195 (100.0%) | 29.0 |
Fertility by Education by Marriage Status in Clarke County
32.9% of women with births in Clarke County are unmarried. Women with the educational attainment of bachelor's degree are most likely to be married with 100.0% of them married at childbirth, while women with the educational attainment of less than high school are least likely to be married with 68.9% of them unmarried at childbirth.
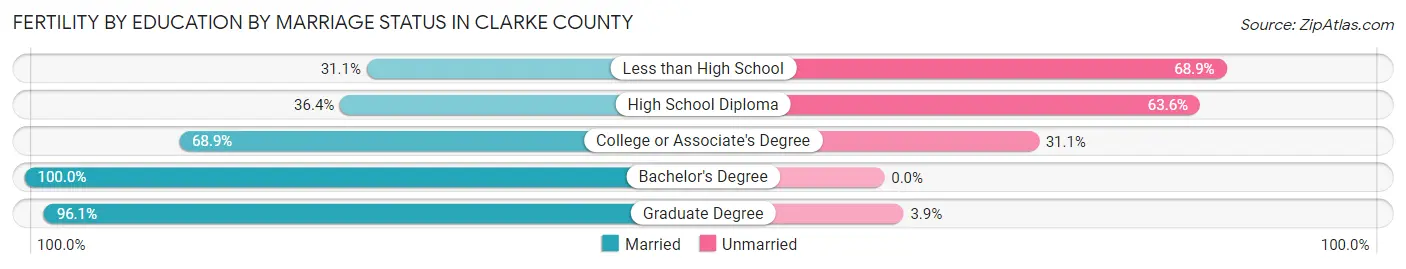
| Educational Attainment | Married | Unmarried |
| Less than High School | 50 (31.1%) | 111 (68.9%) |
| High School Diploma | 130 (36.4%) | 227 (63.6%) |
| College or Associate's Degree | 93 (68.9%) | 42 (31.1%) |
| Bachelor's Degree | 206 (100.0%) | 0 (0.0%) |
| Graduate Degree | 323 (96.1%) | 13 (3.9%) |
| Total | 802 (67.1%) | 393 (32.9%) |
Income in Clarke County
Income Overview in Clarke County
Per Capita Income in Clarke County is $30,138, while median incomes of families and households are $75,254 and $48,692 respectively.
| Characteristic | Number | Measure |
| Per Capita Income | 128,864 | $30,138 |
| Median Family Income | 24,955 | $75,254 |
| Mean Family Income | 24,955 | $102,776 |
| Median Household Income | 53,336 | $48,692 |
| Mean Household Income | 53,336 | $72,456 |
| Income Deficit | 24,955 | $10,350 |
| Wage / Income Gap (%) | 128,864 | 20.54% |
| Wage / Income Gap ($) | 128,864 | 79.46¢ per $1 |
| Gini / Inequality Index | 128,864 | 0.51 |
Earnings by Sex in Clarke County
Average Earnings in Clarke County are $26,708, $29,499 for men and $23,441 for women, a difference of 20.5%.
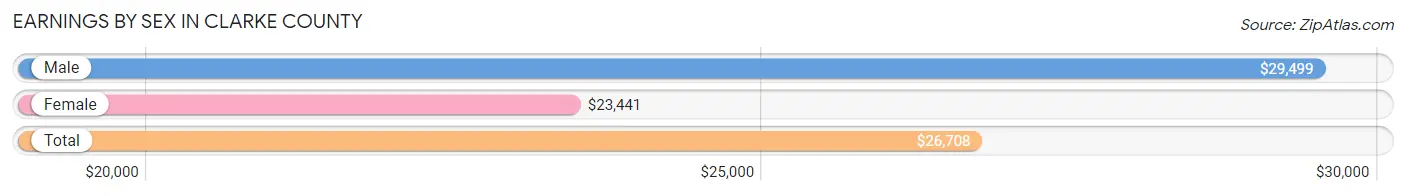
| Sex | Number | Average Earnings |
| Male | 38,101 (49.6%) | $29,499 |
| Female | 38,736 (50.4%) | $23,441 |
| Total | 76,837 (100.0%) | $26,708 |
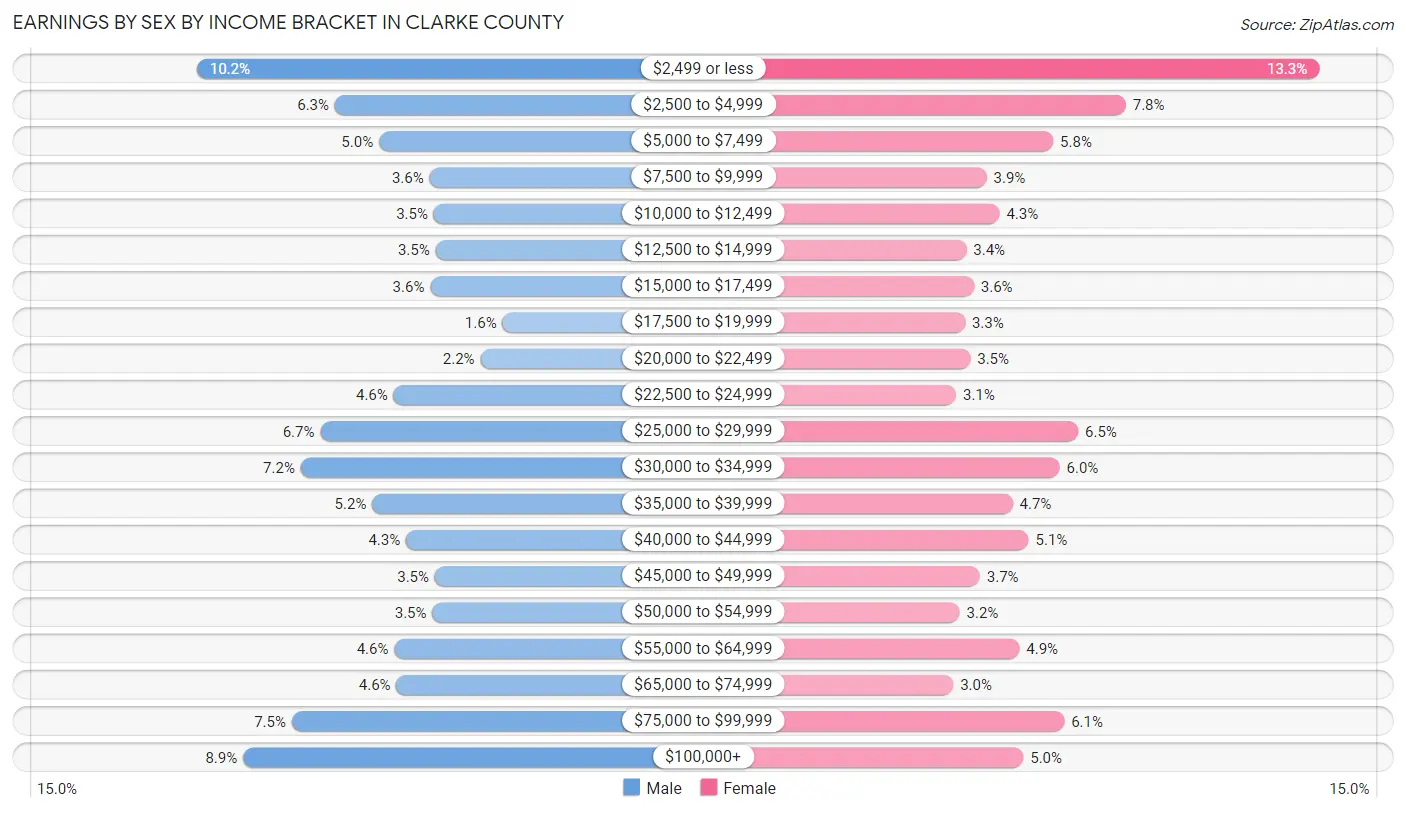
Earnings by Sex by Income Bracket in Clarke County
The most common earnings brackets in Clarke County are $2,499 or less for men (3,871 | 10.2%) and $2,499 or less for women (5,139 | 13.3%).
| Income | Male | Female |
| $2,499 or less | 3,871 (10.2%) | 5,139 (13.3%) |
| $2,500 to $4,999 | 2,394 (6.3%) | 3,036 (7.8%) |
| $5,000 to $7,499 | 1,919 (5.0%) | 2,246 (5.8%) |
| $7,500 to $9,999 | 1,381 (3.6%) | 1,523 (3.9%) |
| $10,000 to $12,499 | 1,335 (3.5%) | 1,663 (4.3%) |
| $12,500 to $14,999 | 1,313 (3.5%) | 1,300 (3.4%) |
| $15,000 to $17,499 | 1,372 (3.6%) | 1,384 (3.6%) |
| $17,500 to $19,999 | 600 (1.6%) | 1,285 (3.3%) |
| $20,000 to $22,499 | 836 (2.2%) | 1,345 (3.5%) |
| $22,500 to $24,999 | 1,763 (4.6%) | 1,188 (3.1%) |
| $25,000 to $29,999 | 2,550 (6.7%) | 2,519 (6.5%) |
| $30,000 to $34,999 | 2,759 (7.2%) | 2,315 (6.0%) |
| $35,000 to $39,999 | 1,992 (5.2%) | 1,806 (4.7%) |
| $40,000 to $44,999 | 1,629 (4.3%) | 1,981 (5.1%) |
| $45,000 to $49,999 | 1,322 (3.5%) | 1,450 (3.7%) |
| $50,000 to $54,999 | 1,349 (3.5%) | 1,228 (3.2%) |
| $55,000 to $64,999 | 1,755 (4.6%) | 1,879 (4.9%) |
| $65,000 to $74,999 | 1,732 (4.5%) | 1,160 (3.0%) |
| $75,000 to $99,999 | 2,852 (7.5%) | 2,367 (6.1%) |
| $100,000+ | 3,377 (8.9%) | 1,922 (5.0%) |
| Total | 38,101 (100.0%) | 38,736 (100.0%) |
Earnings by Sex by Educational Attainment in Clarke County
Average earnings in Clarke County are $41,566 for men and $36,218 for women, a difference of 12.9%. Men with an educational attainment of graduate degree enjoy the highest average annual earnings of $65,680, while those with less than high school education earn the least with $30,715. Women with an educational attainment of graduate degree earn the most with the average annual earnings of $55,546, while those with college or associate's degree education have the smallest earnings of $25,635.
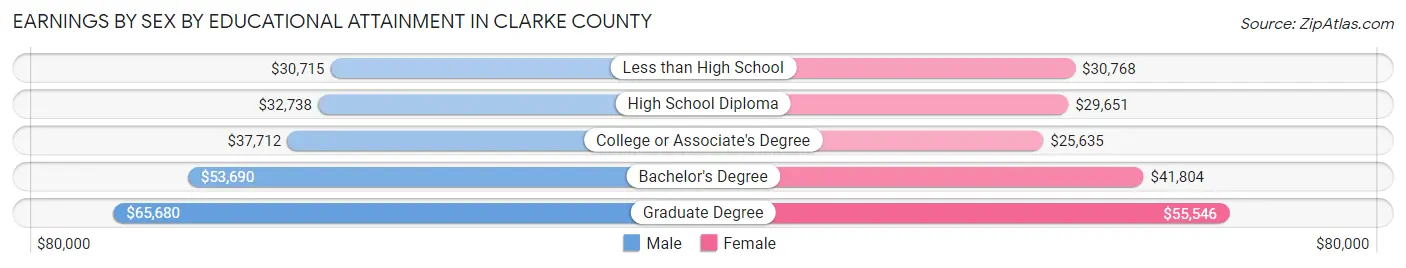
| Educational Attainment | Male Income | Female Income |
| Less than High School | $30,715 | $30,768 |
| High School Diploma | $32,738 | $29,651 |
| College or Associate's Degree | $37,712 | $25,635 |
| Bachelor's Degree | $53,690 | $41,804 |
| Graduate Degree | $65,680 | $55,546 |
| Total | $41,566 | $36,218 |
Family Income in Clarke County
Family Income Brackets in Clarke County
According to the Clarke County family income data, there are 4,467 families falling into the $100,000 to $149,999 income range, which is the most common income bracket and makes up 17.9% of all families. Conversely, the $10,000 to $14,999 income bracket is the least frequent group with only 749 families (3.0%) belonging to this category.
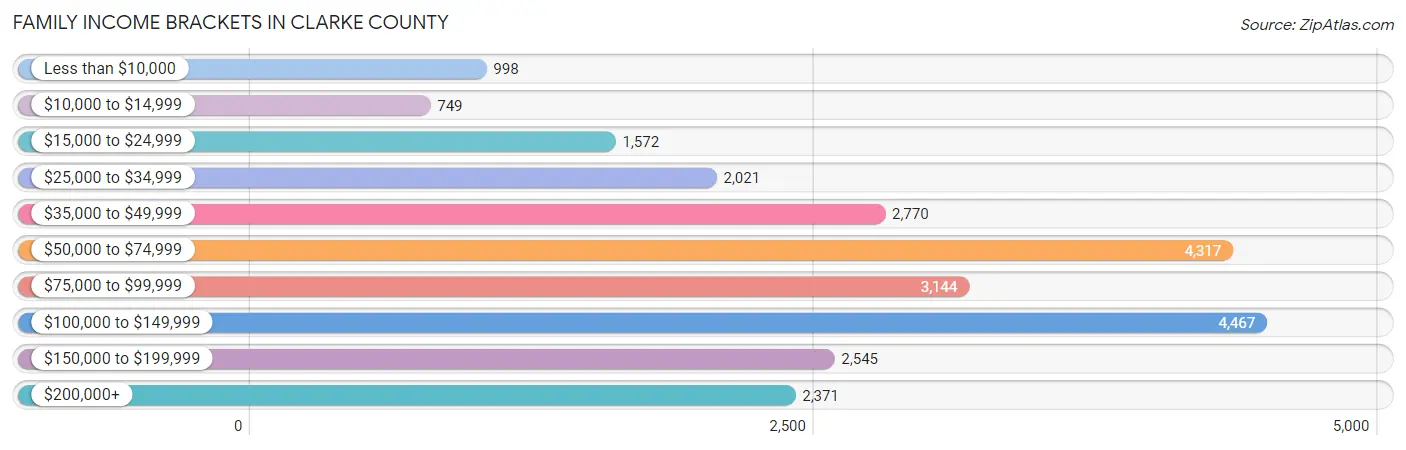
| Income Bracket | # Families | % Families |
| Less than $10,000 | 998 | 4.0% |
| $10,000 to $14,999 | 749 | 3.0% |
| $15,000 to $24,999 | 1,572 | 6.3% |
| $25,000 to $34,999 | 2,021 | 8.1% |
| $35,000 to $49,999 | 2,770 | 11.1% |
| $50,000 to $74,999 | 4,317 | 17.3% |
| $75,000 to $99,999 | 3,144 | 12.6% |
| $100,000 to $149,999 | 4,467 | 17.9% |
| $150,000 to $199,999 | 2,545 | 10.2% |
| $200,000+ | 2,371 | 9.5% |
Family Income by Famaliy Size in Clarke County
6-person families (465 | 1.9%) account for the highest median family income in Clarke County with $134,089 per family, while 2-person families (13,028 | 52.2%) have the highest median income of $39,278 per family member.
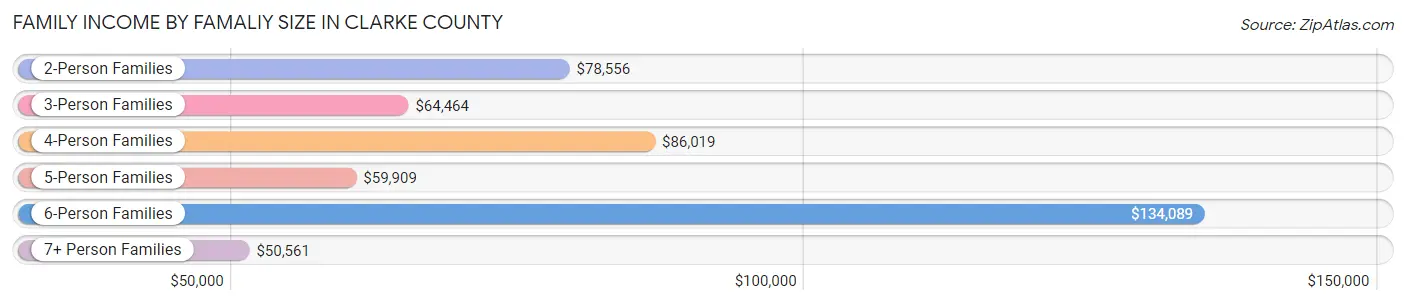
| Income Bracket | # Families | Median Income |
| 2-Person Families | 13,028 (52.2%) | $78,556 |
| 3-Person Families | 6,076 (24.3%) | $64,464 |
| 4-Person Families | 3,722 (14.9%) | $86,019 |
| 5-Person Families | 1,424 (5.7%) | $59,909 |
| 6-Person Families | 465 (1.9%) | $134,089 |
| 7+ Person Families | 240 (1.0%) | $50,561 |
| Total | 24,955 (100.0%) | $75,254 |
Family Income by Number of Earners in Clarke County
The median family income in Clarke County is $75,254, with families comprising 3+ earners (1,702) having the highest median family income of $114,079, while families with 1 earner (8,872) have the lowest median family income of $51,455, accounting for 6.8% and 35.5% of families, respectively.
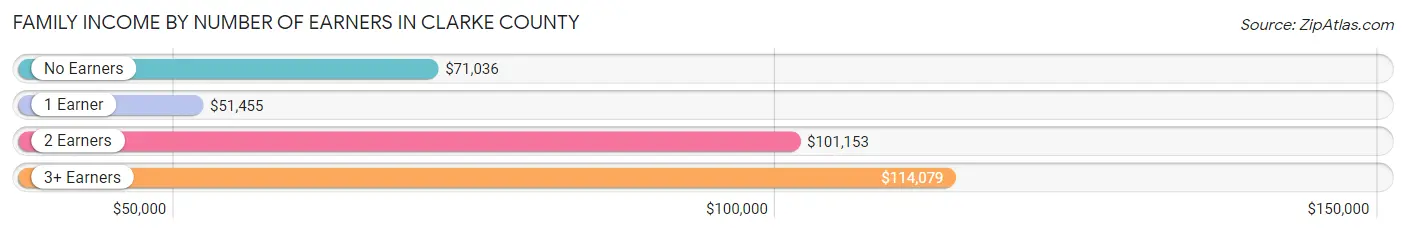
| Number of Earners | # Families | Median Income |
| No Earners | 2,994 (12.0%) | $71,036 |
| 1 Earner | 8,872 (35.5%) | $51,455 |
| 2 Earners | 11,387 (45.6%) | $101,153 |
| 3+ Earners | 1,702 (6.8%) | $114,079 |
| Total | 24,955 (100.0%) | $75,254 |
Household Income in Clarke County
Household Income Brackets in Clarke County
With 8,587 households falling in the category, the $50,000 to $74,999 income range is the most frequent in Clarke County, accounting for 16.1% of all households. In contrast, only 2,720 households (5.1%) fall into the $200,000+ income bracket, making it the least populous group.
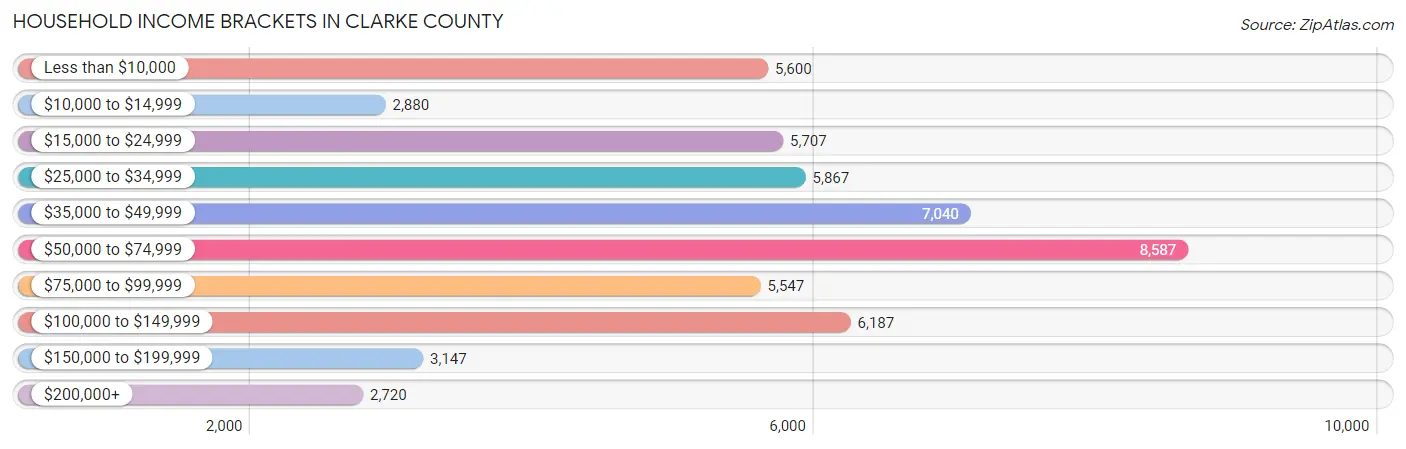
| Income Bracket | # Households | % Households |
| Less than $10,000 | 5,600 | 10.5% |
| $10,000 to $14,999 | 2,880 | 5.4% |
| $15,000 to $24,999 | 5,707 | 10.7% |
| $25,000 to $34,999 | 5,867 | 11.0% |
| $35,000 to $49,999 | 7,040 | 13.2% |
| $50,000 to $74,999 | 8,587 | 16.1% |
| $75,000 to $99,999 | 5,547 | 10.4% |
| $100,000 to $149,999 | 6,187 | 11.6% |
| $150,000 to $199,999 | 3,147 | 5.9% |
| $200,000+ | 2,720 | 5.1% |
Household Income by Householder Age in Clarke County
The median household income in Clarke County is $48,692, with the highest median household income of $67,622 found in the 45 to 64 years age bracket for the primary householder. A total of 14,470 households (27.1%) fall into this category. Meanwhile, the 15 to 24 years age bracket for the primary householder has the lowest median household income of $20,779, with 9,708 households (18.2%) in this group.
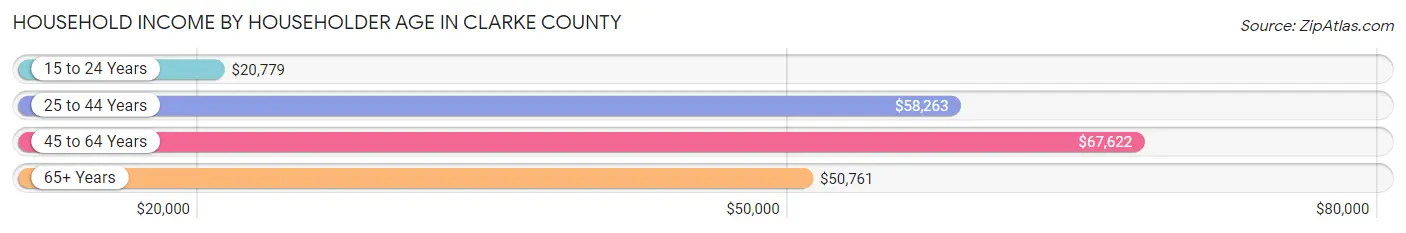
| Income Bracket | # Households | Median Income |
| 15 to 24 Years | 9,708 (18.2%) | $20,779 |
| 25 to 44 Years | 19,499 (36.6%) | $58,263 |
| 45 to 64 Years | 14,470 (27.1%) | $67,622 |
| 65+ Years | 9,659 (18.1%) | $50,761 |
| Total | 53,336 (100.0%) | $48,692 |
Poverty in Clarke County
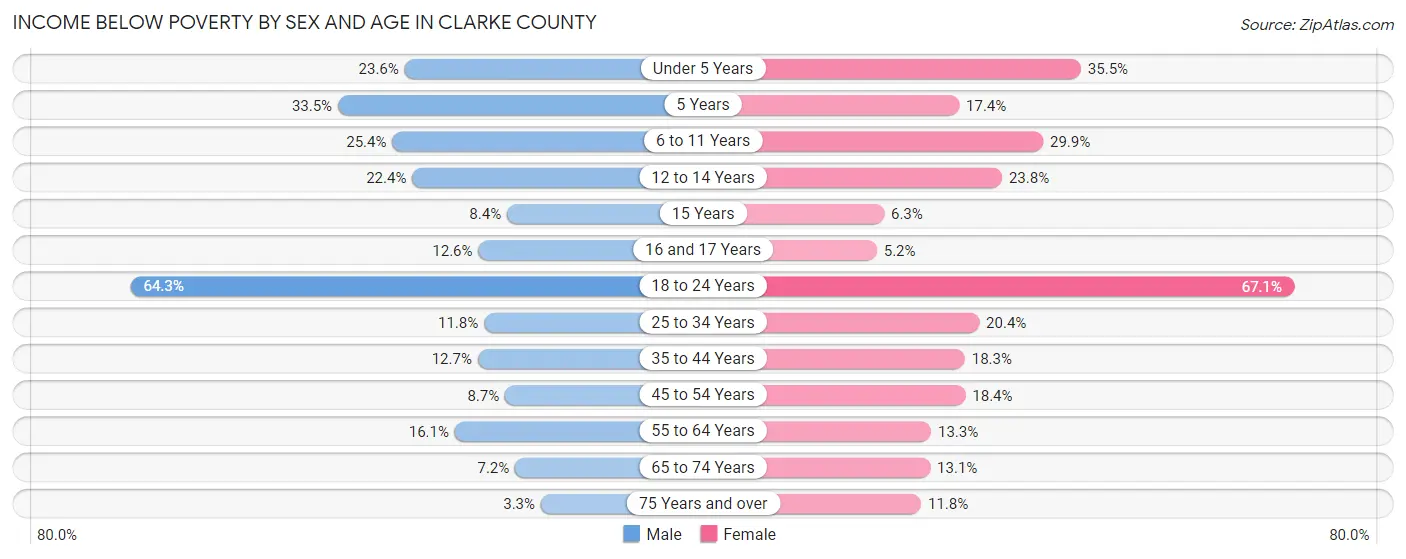
Income Below Poverty by Sex and Age in Clarke County
With 24.5% poverty level for males and 28.5% for females among the residents of Clarke County, 18 to 24 year old males and 18 to 24 year old females are the most vulnerable to poverty, with 7,665 males (64.3%) and 8,360 females (67.1%) in their respective age groups living below the poverty level.
| Age Bracket | Male | Female |
| Under 5 Years | 757 (23.6%) | 1,059 (35.5%) |
| 5 Years | 159 (33.5%) | 89 (17.4%) |
| 6 to 11 Years | 1,037 (25.4%) | 1,039 (29.9%) |
| 12 to 14 Years | 370 (22.4%) | 453 (23.8%) |
| 15 Years | 40 (8.4%) | 49 (6.3%) |
| 16 and 17 Years | 137 (12.6%) | 53 (5.2%) |
| 18 to 24 Years | 7,665 (64.3%) | 8,360 (67.1%) |
| 25 to 34 Years | 1,146 (11.8%) | 2,126 (20.4%) |
| 35 to 44 Years | 934 (12.7%) | 1,334 (18.3%) |
| 45 to 54 Years | 476 (8.7%) | 1,129 (18.3%) |
| 55 to 64 Years | 893 (16.1%) | 809 (13.3%) |
| 65 to 74 Years | 279 (7.2%) | 659 (13.1%) |
| 75 Years and over | 67 (3.3%) | 409 (11.8%) |
| Total | 13,960 (24.5%) | 17,568 (28.5%) |
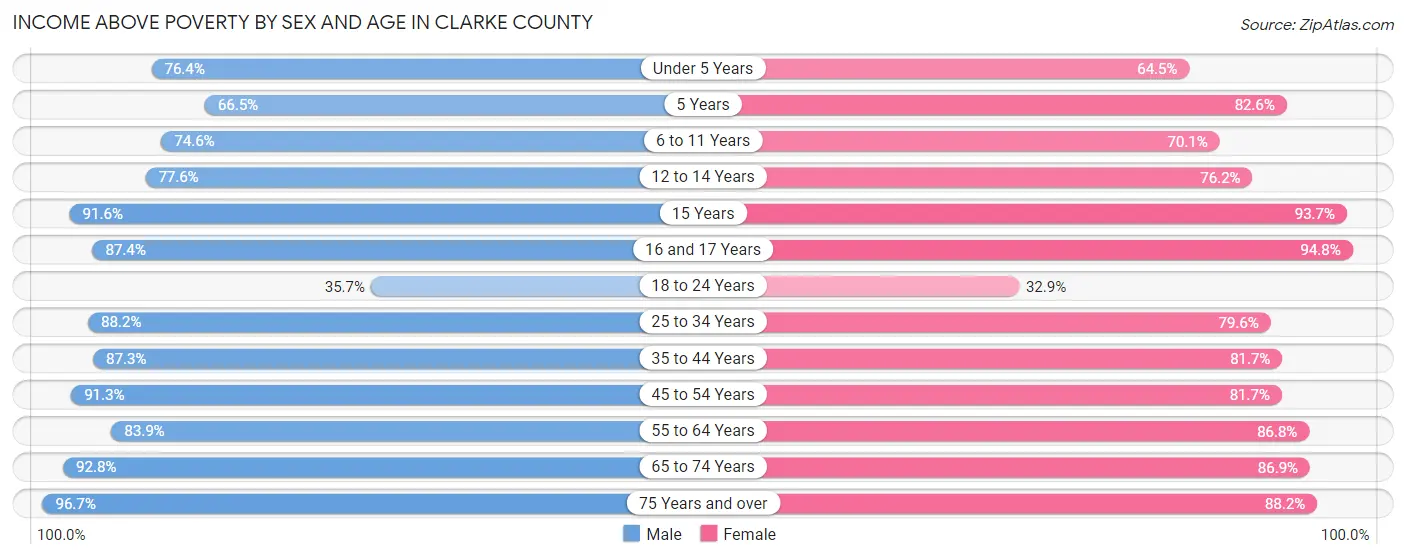
Income Above Poverty by Sex and Age in Clarke County
According to the poverty statistics in Clarke County, males aged 75 years and over and females aged 16 and 17 years are the age groups that are most secure financially, with 96.7% of males and 94.8% of females in these age groups living above the poverty line.
| Age Bracket | Male | Female |
| Under 5 Years | 2,455 (76.4%) | 1,923 (64.5%) |
| 5 Years | 316 (66.5%) | 422 (82.6%) |
| 6 to 11 Years | 3,045 (74.6%) | 2,438 (70.1%) |
| 12 to 14 Years | 1,279 (77.6%) | 1,451 (76.2%) |
| 15 Years | 438 (91.6%) | 733 (93.7%) |
| 16 and 17 Years | 949 (87.4%) | 967 (94.8%) |
| 18 to 24 Years | 4,263 (35.7%) | 4,097 (32.9%) |
| 25 to 34 Years | 8,583 (88.2%) | 8,296 (79.6%) |
| 35 to 44 Years | 6,413 (87.3%) | 5,972 (81.7%) |
| 45 to 54 Years | 5,019 (91.3%) | 5,023 (81.7%) |
| 55 to 64 Years | 4,647 (83.9%) | 5,296 (86.8%) |
| 65 to 74 Years | 3,618 (92.8%) | 4,362 (86.9%) |
| 75 Years and over | 1,937 (96.7%) | 3,067 (88.2%) |
| Total | 42,962 (75.5%) | 44,047 (71.5%) |
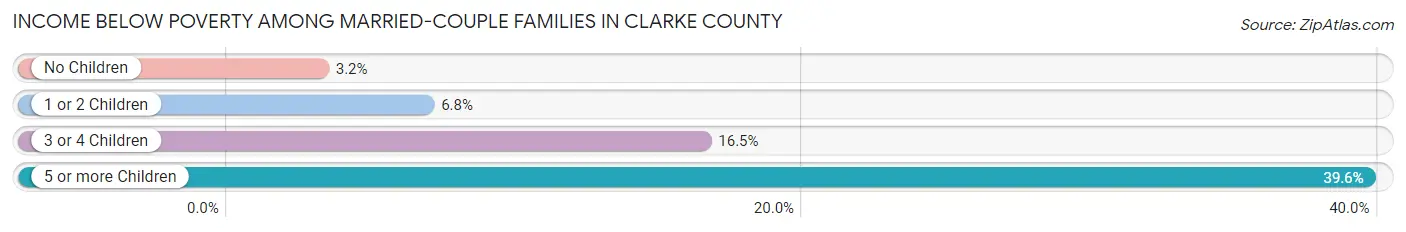
Income Below Poverty Among Married-Couple Families in Clarke County
The poverty statistics for married-couple families in Clarke County show that 5.1% or 826 of the total 16,187 families live below the poverty line. Families with 5 or more children have the highest poverty rate of 39.6%, comprising of 40 families. On the other hand, families with no children have the lowest poverty rate of 3.2%, which includes 329 families.
| Children | Above Poverty | Below Poverty |
| No Children | 10,096 (96.8%) | 329 (3.2%) |
| 1 or 2 Children | 4,596 (93.2%) | 337 (6.8%) |
| 3 or 4 Children | 608 (83.5%) | 120 (16.5%) |
| 5 or more Children | 61 (60.4%) | 40 (39.6%) |
| Total | 15,361 (94.9%) | 826 (5.1%) |
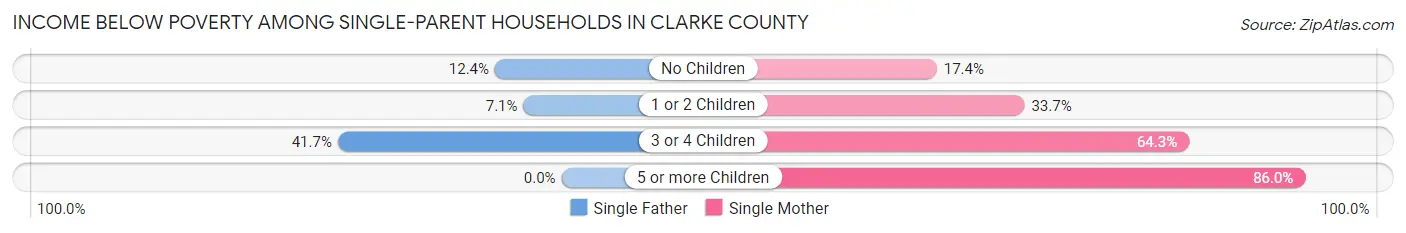
Income Below Poverty Among Single-Parent Households in Clarke County
According to the poverty data in Clarke County, 13.7% or 313 single-father households and 31.9% or 2,063 single-mother households are living below the poverty line. Among single-father households, those with 3 or 4 children have the highest poverty rate, with 110 households (41.7%) experiencing poverty. Likewise, among single-mother households, those with 5 or more children have the highest poverty rate, with 49 households (86.0%) falling below the poverty line.
| Children | Single Father | Single Mother |
| No Children | 138 (12.4%) | 425 (17.3%) |
| 1 or 2 Children | 65 (7.1%) | 1,061 (33.7%) |
| 3 or 4 Children | 110 (41.7%) | 528 (64.3%) |
| 5 or more Children | 0 (0.0%) | 49 (86.0%) |
| Total | 313 (13.7%) | 2,063 (31.9%) |
Income Below Poverty Among Married-Couple vs Single-Parent Households in Clarke County
The poverty data for Clarke County shows that 826 of the married-couple family households (5.1%) and 2,376 of the single-parent households (27.1%) are living below the poverty level. Within the married-couple family households, those with 5 or more children have the highest poverty rate, with 40 households (39.6%) falling below the poverty line. Among the single-parent households, those with 5 or more children have the highest poverty rate, with 49 household (86.0%) living below poverty.
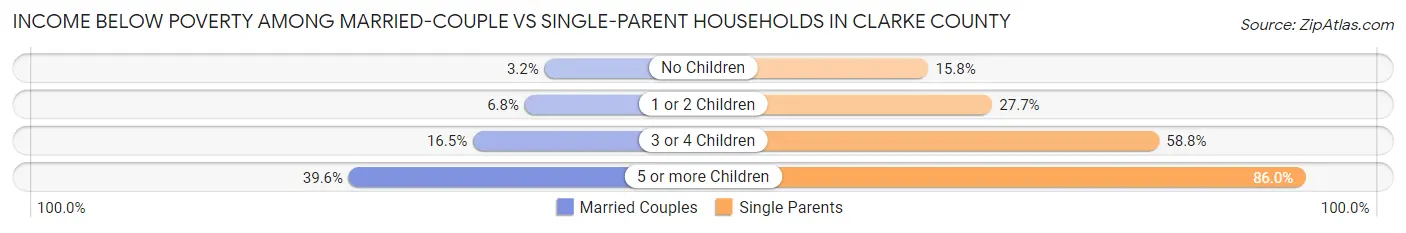
| Children | Married-Couple Families | Single-Parent Households |
| No Children | 329 (3.2%) | 563 (15.8%) |
| 1 or 2 Children | 337 (6.8%) | 1,126 (27.7%) |
| 3 or 4 Children | 120 (16.5%) | 638 (58.8%) |
| 5 or more Children | 40 (39.6%) | 49 (86.0%) |
| Total | 826 (5.1%) | 2,376 (27.1%) |
Employment Characteristics in Clarke County
Employment by Class of Employer in Clarke County
Among the 62,244 employed individuals in Clarke County, private company employees (36,905 | 59.3%), state government employees (11,313 | 18.2%), and local government employees (3,896 | 6.3%) make up the most common classes of employment.
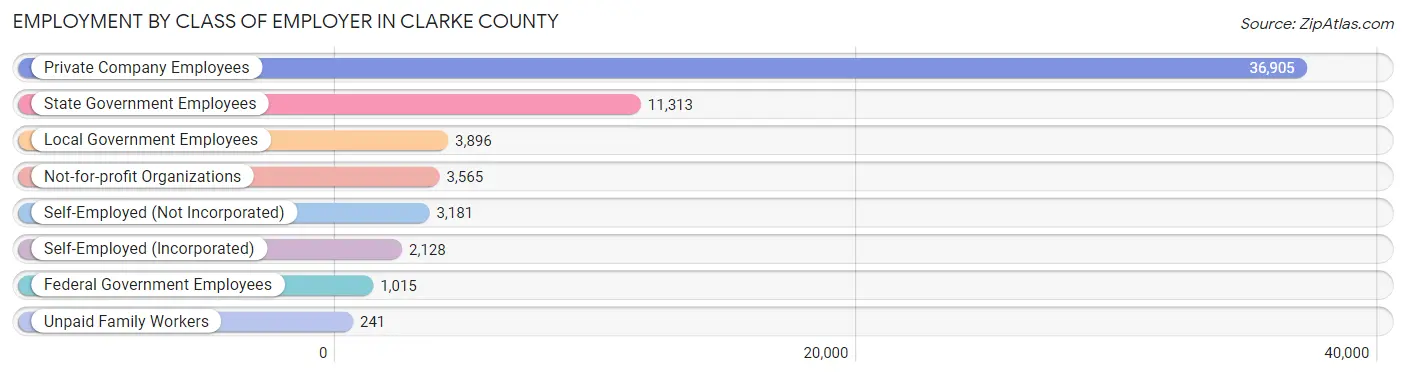
| Employer Class | # Employees | % Employees |
| Private Company Employees | 36,905 | 59.3% |
| Self-Employed (Incorporated) | 2,128 | 3.4% |
| Self-Employed (Not Incorporated) | 3,181 | 5.1% |
| Not-for-profit Organizations | 3,565 | 5.7% |
| Local Government Employees | 3,896 | 6.3% |
| State Government Employees | 11,313 | 18.2% |
| Federal Government Employees | 1,015 | 1.6% |
| Unpaid Family Workers | 241 | 0.4% |
| Total | 62,244 | 100.0% |
Employment Status by Age in Clarke County
According to the labor force statistics for Clarke County, out of the total population over 16 years of age (109,197), 61.6% or 67,265 individuals are in the labor force, with 5.3% or 3,565 of them unemployed. The age group with the highest labor force participation rate is 30 to 34 years, with 87.4% or 7,983 individuals in the labor force. Within the labor force, the 16 to 19 years age range has the highest percentage of unemployed individuals, with 21.1% or 775 of them being unemployed.
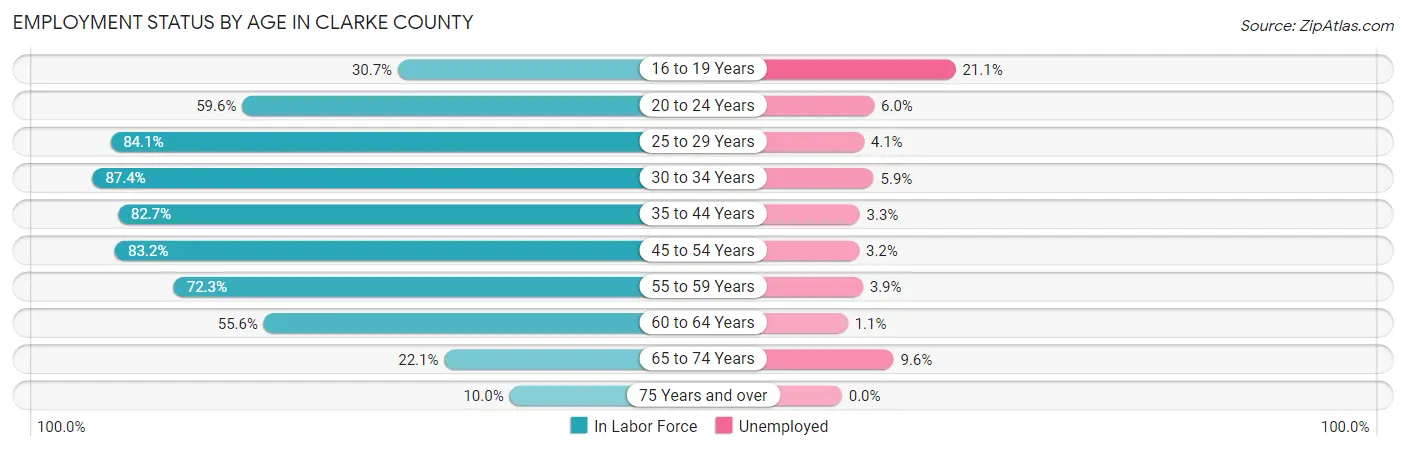
| Age Bracket | In Labor Force | Unemployed |
| 16 to 19 Years | 3,675 (30.7%) | 775 (21.1%) |
| 20 to 24 Years | 14,280 (59.6%) | 857 (6.0%) |
| 25 to 29 Years | 9,447 (84.1%) | 387 (4.1%) |
| 30 to 34 Years | 7,983 (87.4%) | 471 (5.9%) |
| 35 to 44 Years | 12,151 (82.7%) | 401 (3.3%) |
| 45 to 54 Years | 9,708 (83.2%) | 311 (3.2%) |
| 55 to 59 Years | 4,146 (72.3%) | 162 (3.9%) |
| 60 to 64 Years | 3,324 (55.6%) | 37 (1.1%) |
| 65 to 74 Years | 1,995 (22.1%) | 192 (9.6%) |
| 75 Years and over | 580 (10.0%) | 0 (0.0%) |
| Total | 67,265 (61.6%) | 3,565 (5.3%) |
Employment Status by Educational Attainment in Clarke County
According to labor force statistics for Clarke County, 80.0% of individuals (46,752) out of the total population between 25 and 64 years of age (58,440) are in the labor force, with 3.8% or 1,777 of them being unemployed. The group with the highest labor force participation rate are those with the educational attainment of bachelor's degree or higher, with 87.2% or 24,808 individuals in the labor force. Within the labor force, individuals with less than high school education have the highest percentage of unemployment, with 13.1% or 402 of them being unemployed.
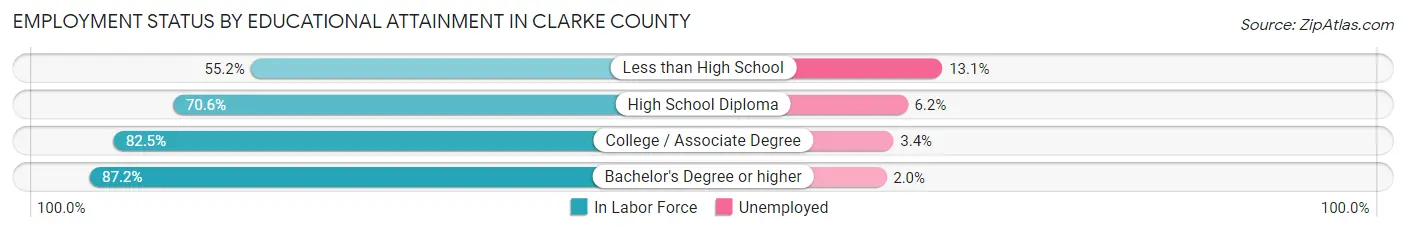
| Educational Attainment | In Labor Force | Unemployed |
| Less than High School | 3,072 (55.2%) | 729 (13.1%) |
| High School Diploma | 7,582 (70.6%) | 666 (6.2%) |
| College / Associate Degree | 11,289 (82.5%) | 465 (3.4%) |
| Bachelor's Degree or higher | 24,808 (87.2%) | 569 (2.0%) |
| Total | 46,752 (80.0%) | 2,221 (3.8%) |
Employment Occupations by Sex in Clarke County
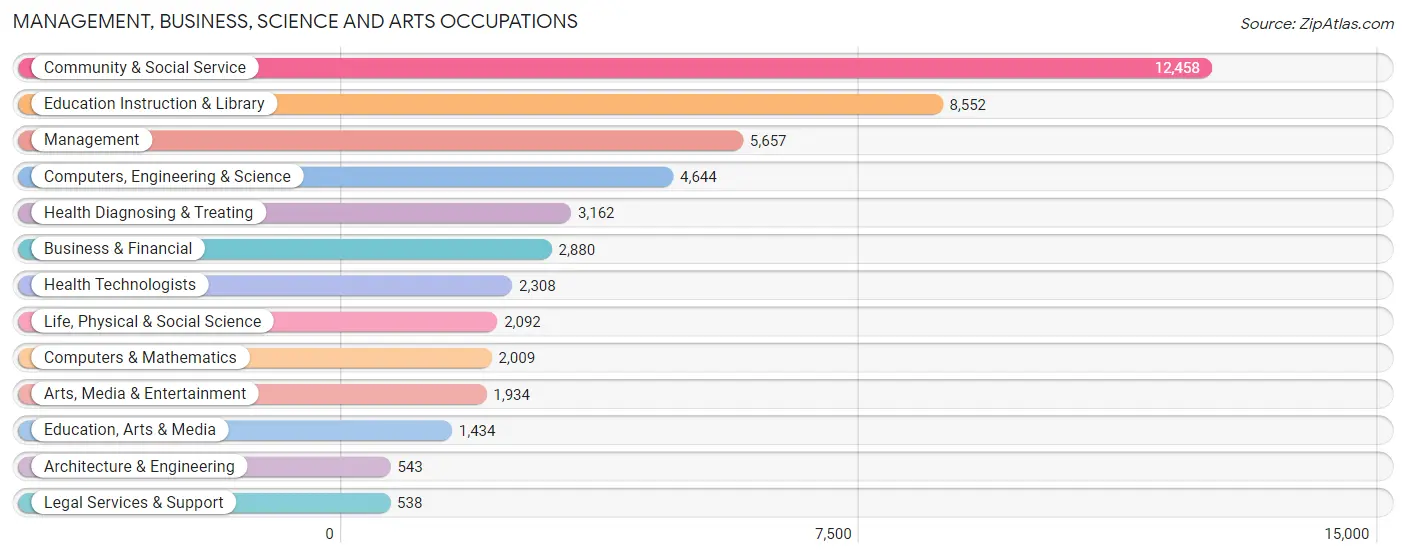
Management, Business, Science and Arts Occupations
The most common Management, Business, Science and Arts occupations in Clarke County are Community & Social Service (12,458 | 19.6%), Education Instruction & Library (8,552 | 13.5%), Management (5,657 | 8.9%), Computers, Engineering & Science (4,644 | 7.3%), and Health Diagnosing & Treating (3,162 | 5.0%).
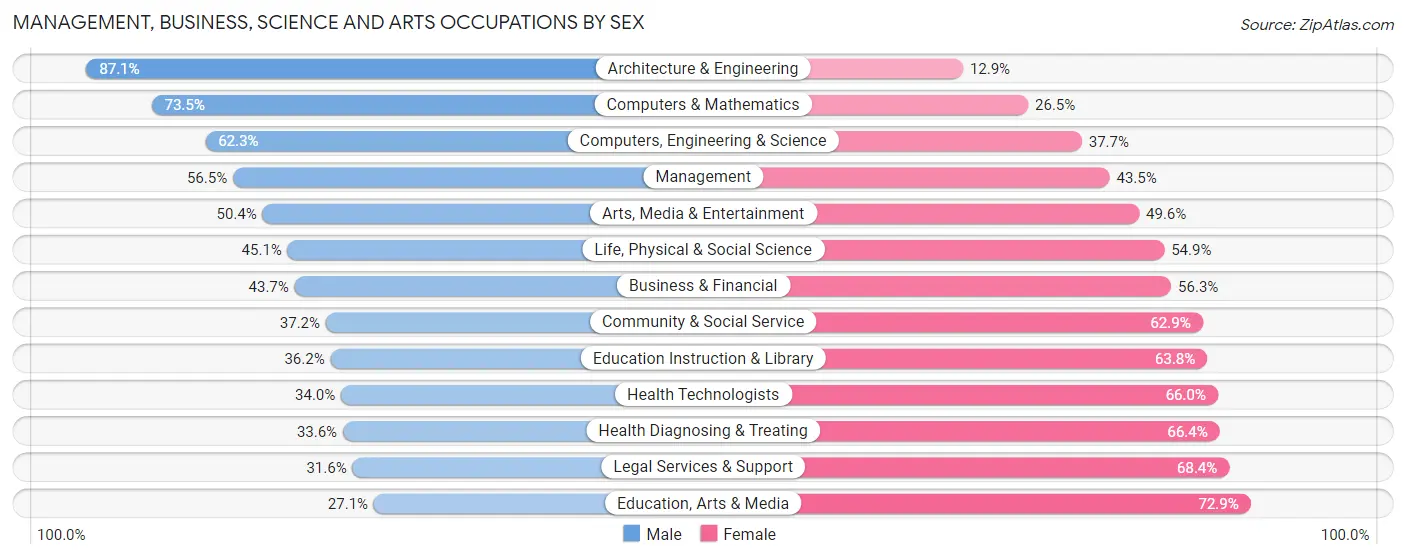
Management, Business, Science and Arts Occupations by Sex
Within the Management, Business, Science and Arts occupations in Clarke County, the most male-oriented occupations are Architecture & Engineering (87.1%), Computers & Mathematics (73.5%), and Computers, Engineering & Science (62.3%), while the most female-oriented occupations are Education, Arts & Media (72.9%), Legal Services & Support (68.4%), and Health Diagnosing & Treating (66.4%).
| Occupation | Male | Female |
| Management | 3,198 (56.5%) | 2,459 (43.5%) |
| Business & Financial | 1,258 (43.7%) | 1,622 (56.3%) |
| Computers, Engineering & Science | 2,894 (62.3%) | 1,750 (37.7%) |
| Computers & Mathematics | 1,477 (73.5%) | 532 (26.5%) |
| Architecture & Engineering | 473 (87.1%) | 70 (12.9%) |
| Life, Physical & Social Science | 944 (45.1%) | 1,148 (54.9%) |
| Community & Social Service | 4,628 (37.1%) | 7,830 (62.8%) |
| Education, Arts & Media | 389 (27.1%) | 1,045 (72.9%) |
| Legal Services & Support | 170 (31.6%) | 368 (68.4%) |
| Education Instruction & Library | 3,095 (36.2%) | 5,457 (63.8%) |
| Arts, Media & Entertainment | 974 (50.4%) | 960 (49.6%) |
| Health Diagnosing & Treating | 1,062 (33.6%) | 2,100 (66.4%) |
| Health Technologists | 784 (34.0%) | 1,524 (66.0%) |
| Total (Category) | 13,040 (45.3%) | 15,761 (54.7%) |
| Total (Overall) | 31,392 (49.5%) | 32,066 (50.5%) |
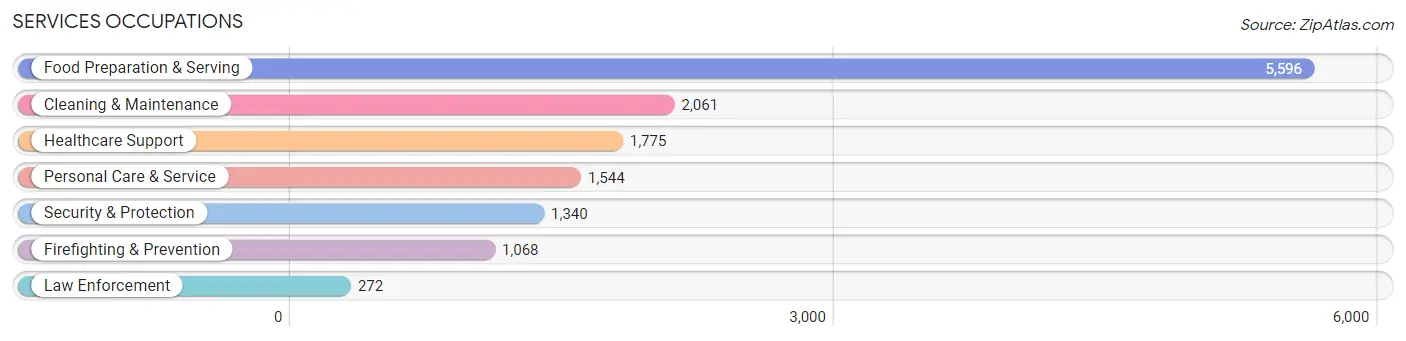
Services Occupations
The most common Services occupations in Clarke County are Food Preparation & Serving (5,596 | 8.8%), Cleaning & Maintenance (2,061 | 3.3%), Healthcare Support (1,775 | 2.8%), Personal Care & Service (1,544 | 2.4%), and Security & Protection (1,340 | 2.1%).
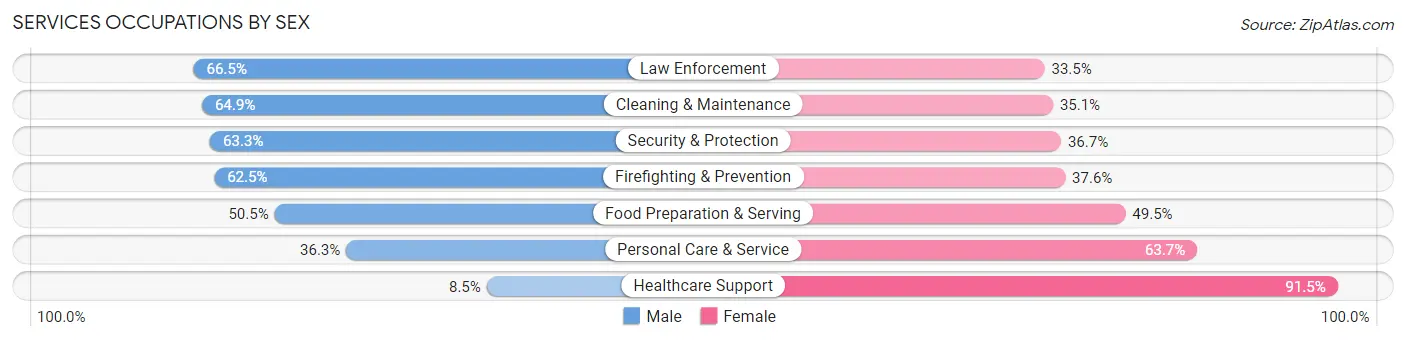
Services Occupations by Sex
Within the Services occupations in Clarke County, the most male-oriented occupations are Law Enforcement (66.5%), Cleaning & Maintenance (64.9%), and Security & Protection (63.3%), while the most female-oriented occupations are Healthcare Support (91.5%), Personal Care & Service (63.7%), and Food Preparation & Serving (49.5%).
| Occupation | Male | Female |
| Healthcare Support | 151 (8.5%) | 1,624 (91.5%) |
| Security & Protection | 848 (63.3%) | 492 (36.7%) |
| Firefighting & Prevention | 667 (62.5%) | 401 (37.6%) |
| Law Enforcement | 181 (66.5%) | 91 (33.5%) |
| Food Preparation & Serving | 2,827 (50.5%) | 2,769 (49.5%) |
| Cleaning & Maintenance | 1,337 (64.9%) | 724 (35.1%) |
| Personal Care & Service | 561 (36.3%) | 983 (63.7%) |
| Total (Category) | 5,724 (46.5%) | 6,592 (53.5%) |
| Total (Overall) | 31,392 (49.5%) | 32,066 (50.5%) |
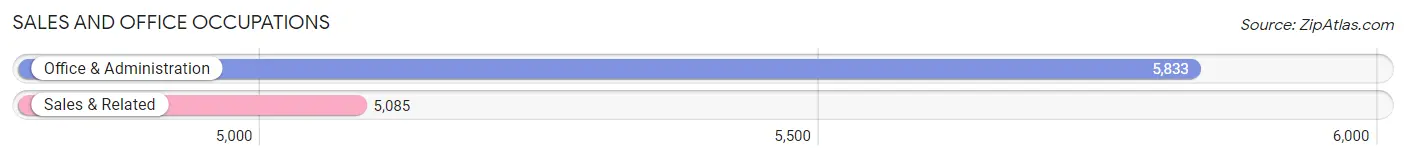
Sales and Office Occupations
The most common Sales and Office occupations in Clarke County are Office & Administration (5,833 | 9.2%), and Sales & Related (5,085 | 8.0%).
Sales and Office Occupations by Sex
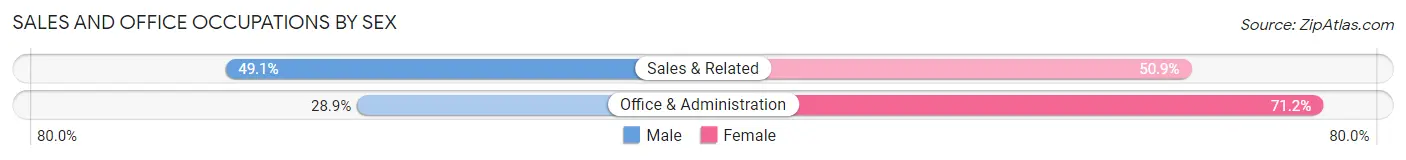
| Occupation | Male | Female |
| Sales & Related | 2,498 (49.1%) | 2,587 (50.9%) |
| Office & Administration | 1,683 (28.8%) | 4,150 (71.2%) |
| Total (Category) | 4,181 (38.3%) | 6,737 (61.7%) |
| Total (Overall) | 31,392 (49.5%) | 32,066 (50.5%) |
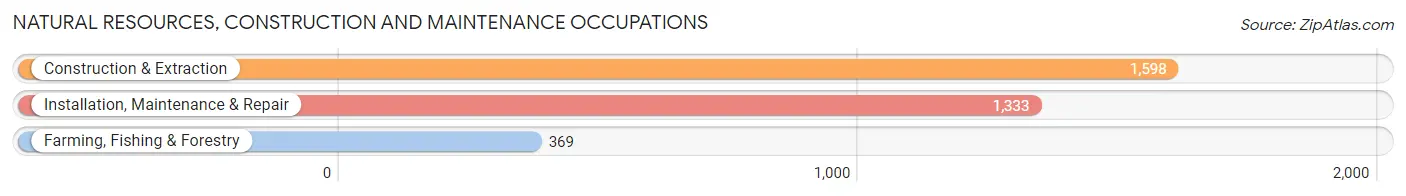
Natural Resources, Construction and Maintenance Occupations
The most common Natural Resources, Construction and Maintenance occupations in Clarke County are Construction & Extraction (1,598 | 2.5%), Installation, Maintenance & Repair (1,333 | 2.1%), and Farming, Fishing & Forestry (369 | 0.6%).
Natural Resources, Construction and Maintenance Occupations by Sex
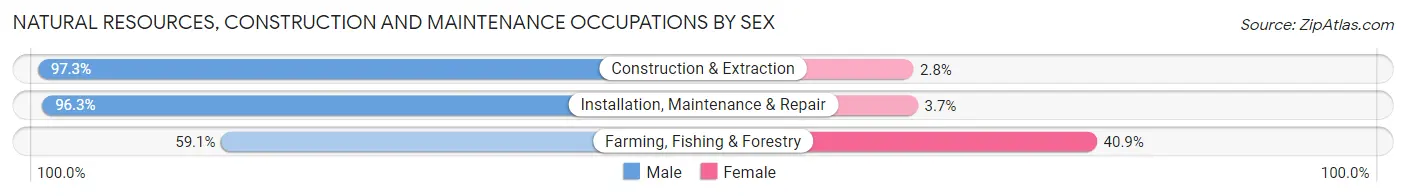
| Occupation | Male | Female |
| Farming, Fishing & Forestry | 218 (59.1%) | 151 (40.9%) |
| Construction & Extraction | 1,554 (97.3%) | 44 (2.8%) |
| Installation, Maintenance & Repair | 1,284 (96.3%) | 49 (3.7%) |
| Total (Category) | 3,056 (92.6%) | 244 (7.4%) |
| Total (Overall) | 31,392 (49.5%) | 32,066 (50.5%) |
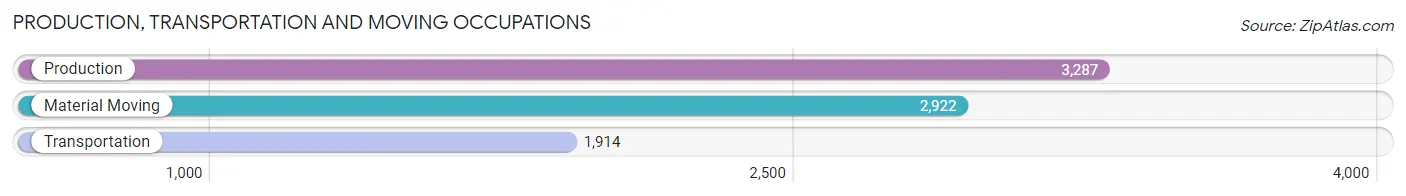
Production, Transportation and Moving Occupations
The most common Production, Transportation and Moving occupations in Clarke County are Production (3,287 | 5.2%), Material Moving (2,922 | 4.6%), and Transportation (1,914 | 3.0%).
Production, Transportation and Moving Occupations by Sex
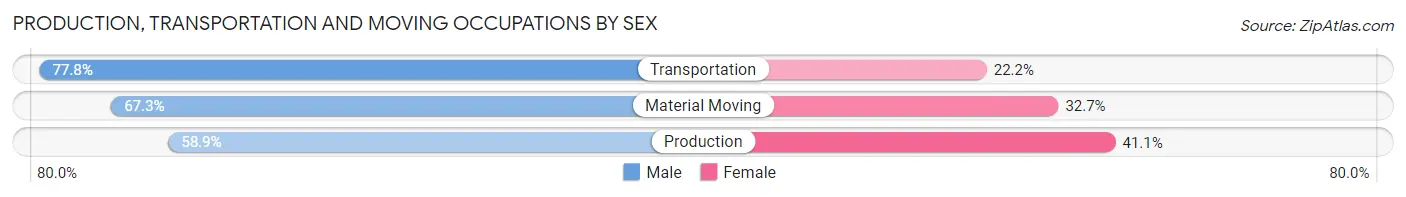
| Occupation | Male | Female |
| Production | 1,936 (58.9%) | 1,351 (41.1%) |
| Transportation | 1,489 (77.8%) | 425 (22.2%) |
| Material Moving | 1,966 (67.3%) | 956 (32.7%) |
| Total (Category) | 5,391 (66.4%) | 2,732 (33.6%) |
| Total (Overall) | 31,392 (49.5%) | 32,066 (50.5%) |
Employment Industries by Sex in Clarke County
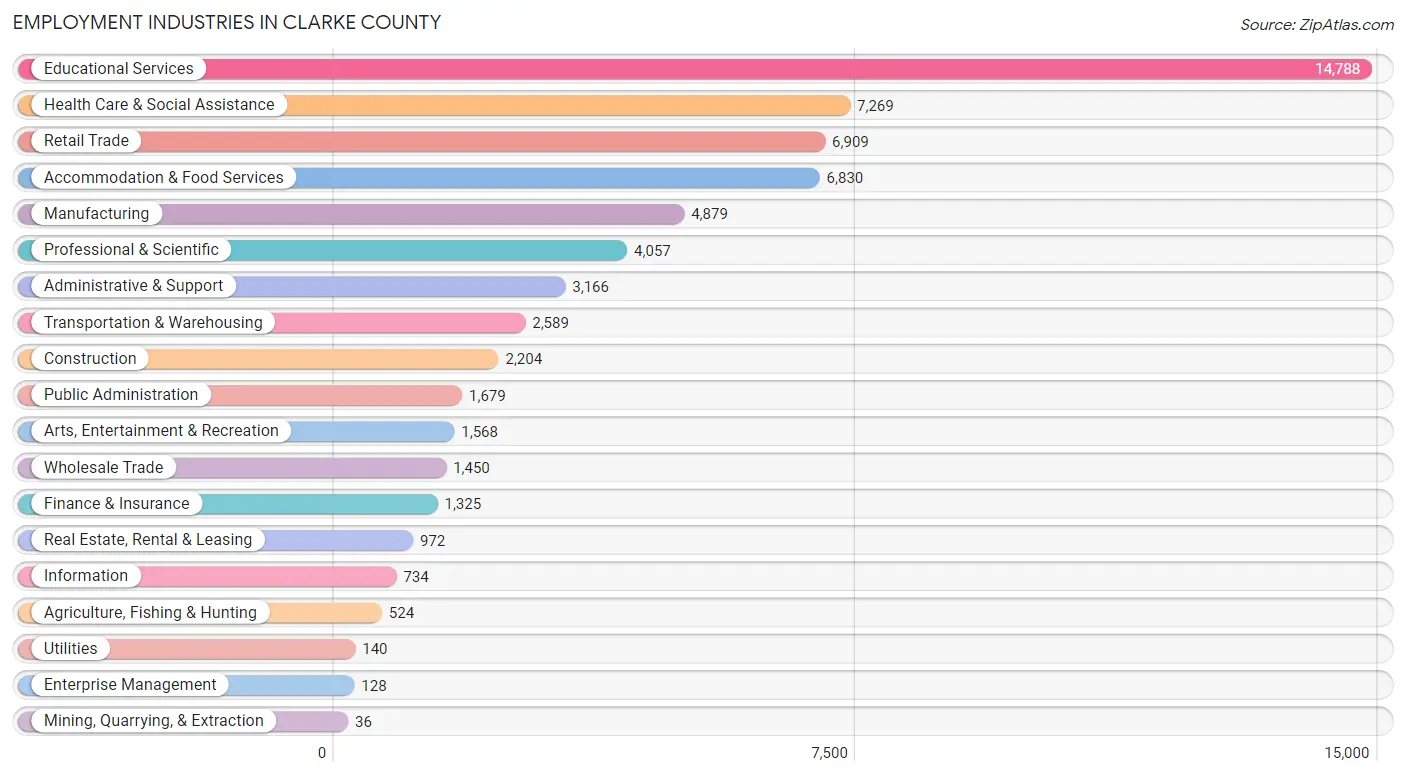
Employment Industries in Clarke County
The major employment industries in Clarke County include Educational Services (14,788 | 23.3%), Health Care & Social Assistance (7,269 | 11.5%), Retail Trade (6,909 | 10.9%), Accommodation & Food Services (6,830 | 10.8%), and Manufacturing (4,879 | 7.7%).
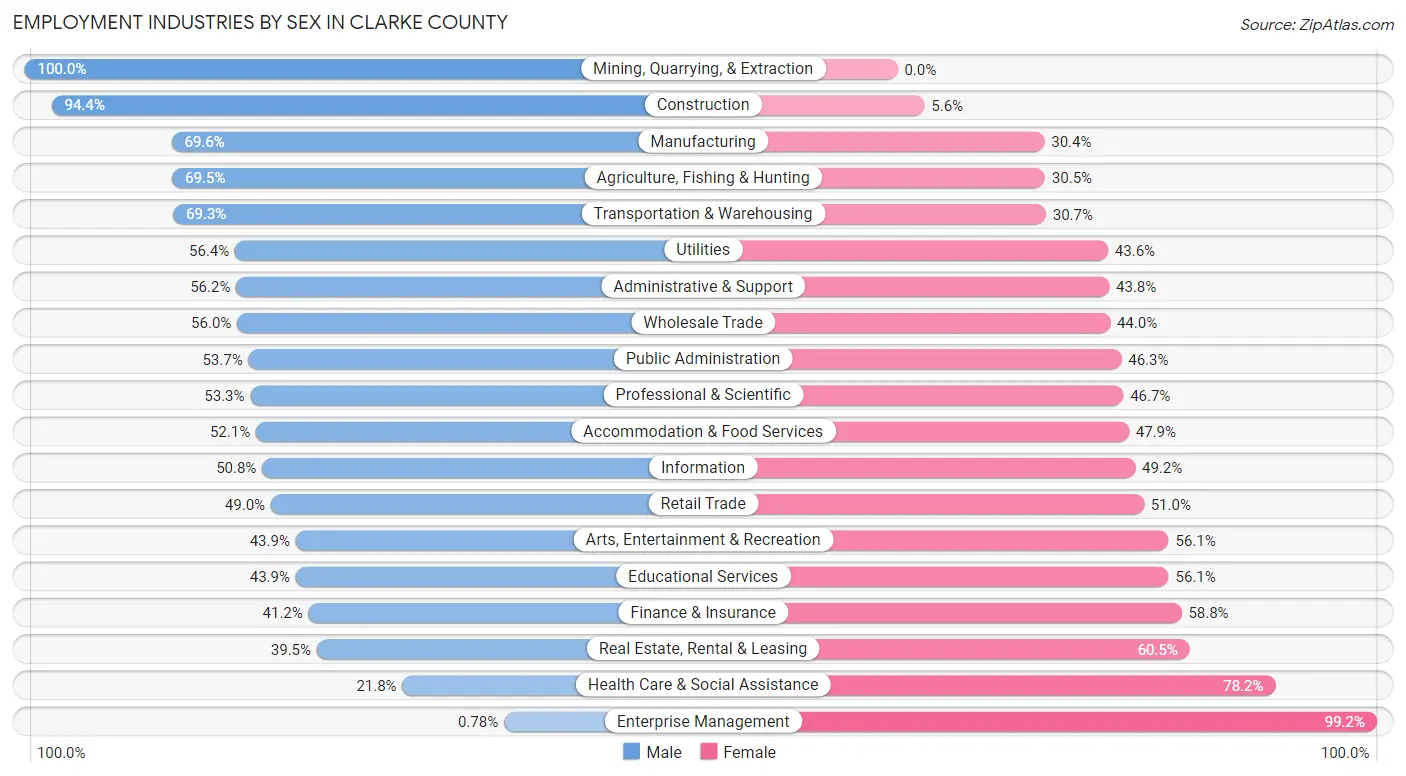
Employment Industries by Sex in Clarke County
The Clarke County industries that see more men than women are Mining, Quarrying, & Extraction (100.0%), Construction (94.4%), and Manufacturing (69.6%), whereas the industries that tend to have a higher number of women are Enterprise Management (99.2%), Health Care & Social Assistance (78.2%), and Real Estate, Rental & Leasing (60.5%).
| Industry | Male | Female |
| Agriculture, Fishing & Hunting | 364 (69.5%) | 160 (30.5%) |
| Mining, Quarrying, & Extraction | 36 (100.0%) | 0 (0.0%) |
| Construction | 2,081 (94.4%) | 123 (5.6%) |
| Manufacturing | 3,396 (69.6%) | 1,483 (30.4%) |
| Wholesale Trade | 812 (56.0%) | 638 (44.0%) |
| Retail Trade | 3,387 (49.0%) | 3,522 (51.0%) |
| Transportation & Warehousing | 1,794 (69.3%) | 795 (30.7%) |
| Utilities | 79 (56.4%) | 61 (43.6%) |
| Information | 373 (50.8%) | 361 (49.2%) |
| Finance & Insurance | 546 (41.2%) | 779 (58.8%) |
| Real Estate, Rental & Leasing | 384 (39.5%) | 588 (60.5%) |
| Professional & Scientific | 2,161 (53.3%) | 1,896 (46.7%) |
| Enterprise Management | 1 (0.8%) | 127 (99.2%) |
| Administrative & Support | 1,779 (56.2%) | 1,387 (43.8%) |
| Educational Services | 6,487 (43.9%) | 8,301 (56.1%) |
| Health Care & Social Assistance | 1,584 (21.8%) | 5,685 (78.2%) |
| Arts, Entertainment & Recreation | 688 (43.9%) | 880 (56.1%) |
| Accommodation & Food Services | 3,559 (52.1%) | 3,271 (47.9%) |
| Public Administration | 901 (53.7%) | 778 (46.3%) |
| Total | 31,392 (49.5%) | 32,066 (50.5%) |
Education in Clarke County
School Enrollment in Clarke County
The most common levels of schooling among the 51,064 students in Clarke County are college / undergraduate (27,049 | 53.0%), graduate / professional (7,184 | 14.1%), and elementary school (5,171 | 10.1%).
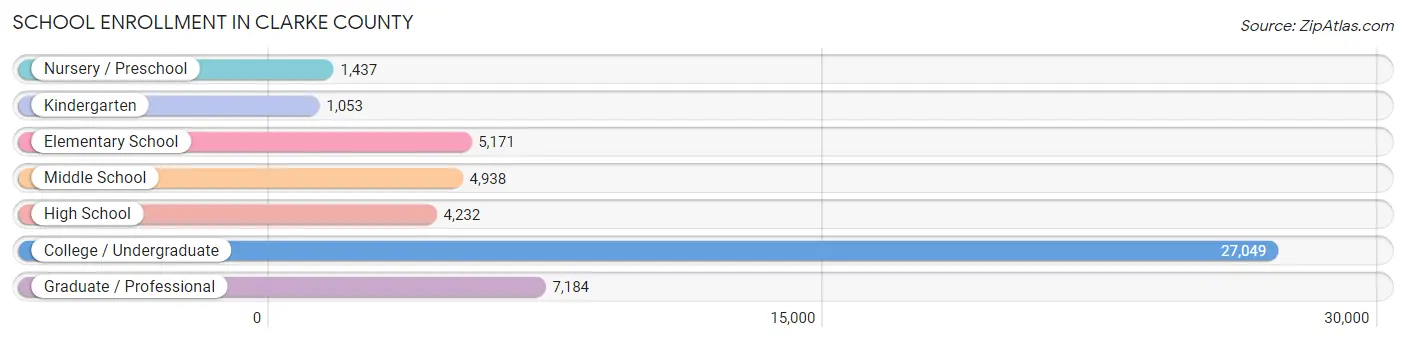
| School Level | # Students | % Students |
| Nursery / Preschool | 1,437 | 2.8% |
| Kindergarten | 1,053 | 2.1% |
| Elementary School | 5,171 | 10.1% |
| Middle School | 4,938 | 9.7% |
| High School | 4,232 | 8.3% |
| College / Undergraduate | 27,049 | 53.0% |
| Graduate / Professional | 7,184 | 14.1% |
| Total | 51,064 | 100.0% |
School Enrollment by Age by Funding Source in Clarke County
Out of a total of 51,064 students who are enrolled in schools in Clarke County, 3,983 (7.8%) attend a private institution, while the remaining 47,081 (92.2%) are enrolled in public schools. The age group of 3 to 4 year olds has the highest likelihood of being enrolled in private schools, with 497 (37.5% in the age bracket) enrolled. Conversely, the age group of 18 to 19 year olds has the lowest likelihood of being enrolled in a private school, with 9,009 (96.9% in the age bracket) attending a public institution.
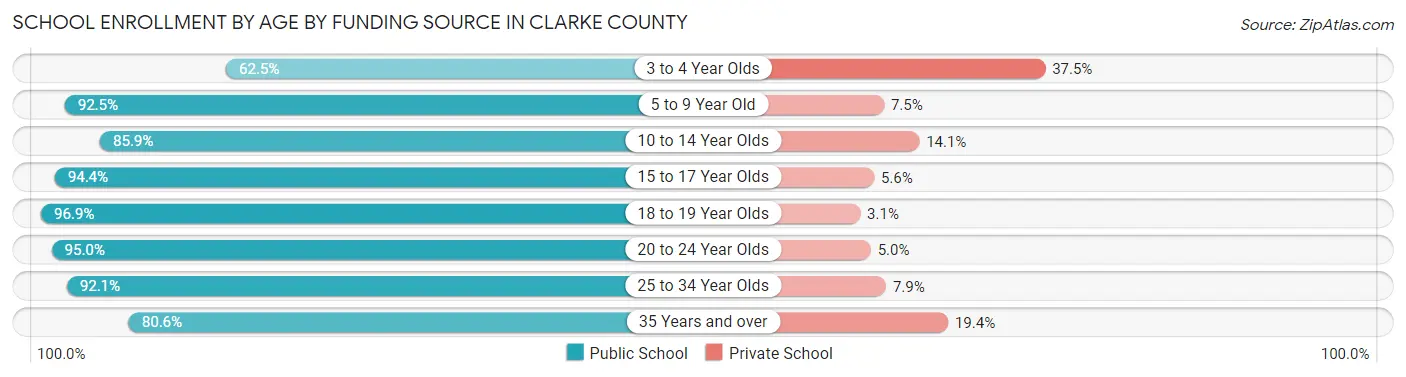
| Age Bracket | Public School | Private School |
| 3 to 4 Year Olds | 827 (62.5%) | 497 (37.5%) |
| 5 to 9 Year Old | 4,788 (92.5%) | 388 (7.5%) |
| 10 to 14 Year Olds | 5,698 (85.9%) | 933 (14.1%) |
| 15 to 17 Year Olds | 3,046 (94.4%) | 182 (5.6%) |
| 18 to 19 Year Olds | 9,009 (96.9%) | 285 (3.1%) |
| 20 to 24 Year Olds | 17,588 (95.0%) | 934 (5.0%) |
| 25 to 34 Year Olds | 4,663 (92.1%) | 399 (7.9%) |
| 35 Years and over | 1,472 (80.6%) | 355 (19.4%) |
| Total | 47,081 (92.2%) | 3,983 (7.8%) |
Educational Attainment by Field of Study in Clarke County
Business (4,528 | 11.9%), bio, nature & agricultural (4,490 | 11.8%), education (3,961 | 10.4%), social sciences (3,538 | 9.3%), and literature & languages (3,284 | 8.7%) are the most common fields of study among 37,909 individuals in Clarke County who have obtained a bachelor's degree or higher.
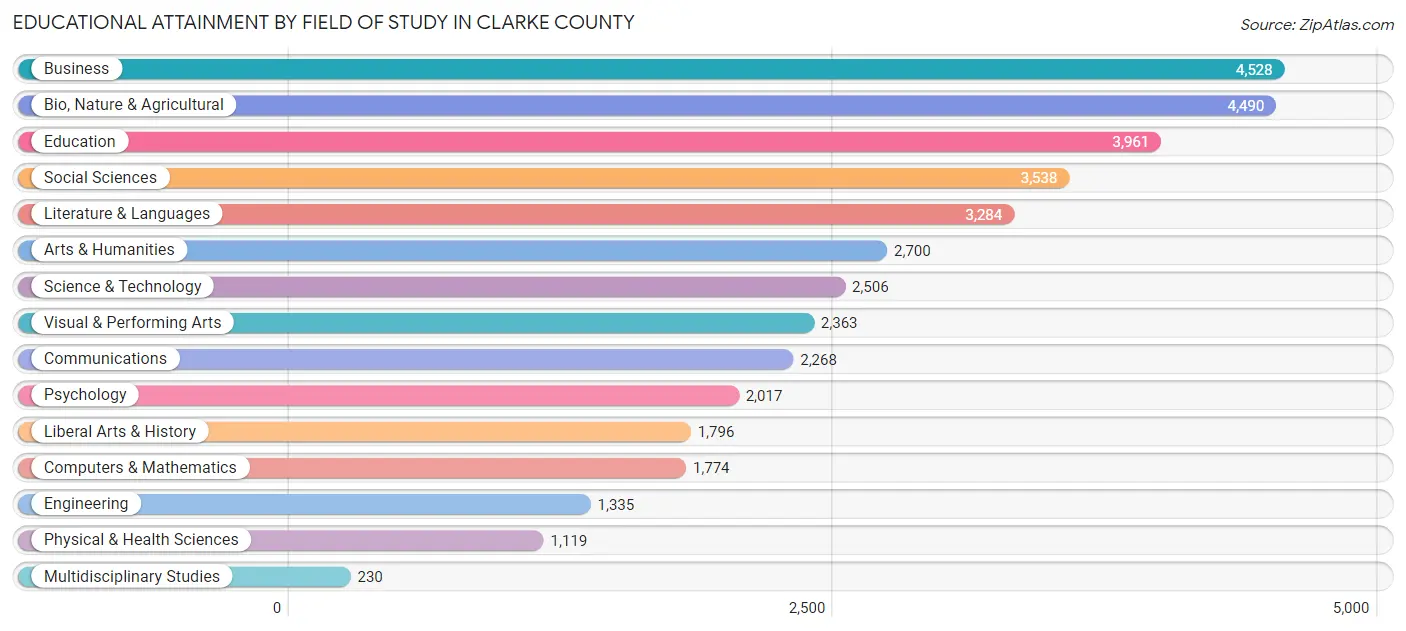
| Field of Study | # Graduates | % Graduates |
| Computers & Mathematics | 1,774 | 4.7% |
| Bio, Nature & Agricultural | 4,490 | 11.8% |
| Physical & Health Sciences | 1,119 | 2.9% |
| Psychology | 2,017 | 5.3% |
| Social Sciences | 3,538 | 9.3% |
| Engineering | 1,335 | 3.5% |
| Multidisciplinary Studies | 230 | 0.6% |
| Science & Technology | 2,506 | 6.6% |
| Business | 4,528 | 11.9% |
| Education | 3,961 | 10.4% |
| Literature & Languages | 3,284 | 8.7% |
| Liberal Arts & History | 1,796 | 4.7% |
| Visual & Performing Arts | 2,363 | 6.2% |
| Communications | 2,268 | 6.0% |
| Arts & Humanities | 2,700 | 7.1% |
| Total | 37,909 | 100.0% |
Transportation & Commute in Clarke County
Vehicle Availability by Sex in Clarke County
The most prevalent vehicle ownership categories in Clarke County are males with 2 vehicles (12,817, accounting for 42.9%) and females with 2 vehicles (12,676, making up 42.6%).
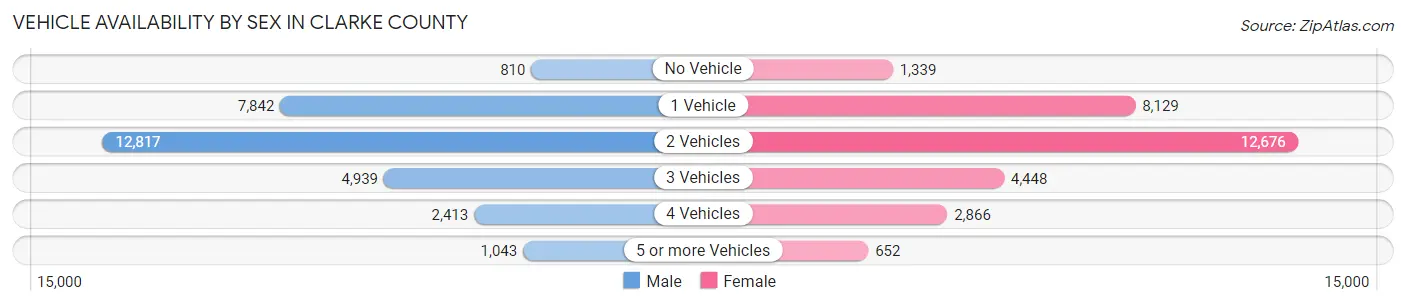
| Vehicles Available | Male | Female |
| No Vehicle | 810 (2.7%) | 1,339 (4.4%) |
| 1 Vehicle | 7,842 (26.3%) | 8,129 (27.0%) |
| 2 Vehicles | 12,817 (42.9%) | 12,676 (42.1%) |
| 3 Vehicles | 4,939 (16.5%) | 4,448 (14.8%) |
| 4 Vehicles | 2,413 (8.1%) | 2,866 (9.5%) |
| 5 or more Vehicles | 1,043 (3.5%) | 652 (2.2%) |
| Total | 29,864 (100.0%) | 30,110 (100.0%) |
Commute Time in Clarke County
The most frequently occuring commute durations in Clarke County are 15 to 19 minutes (12,693 commuters, 22.8%), 10 to 14 minutes (11,868 commuters, 21.4%), and 5 to 9 minutes (7,904 commuters, 14.2%).
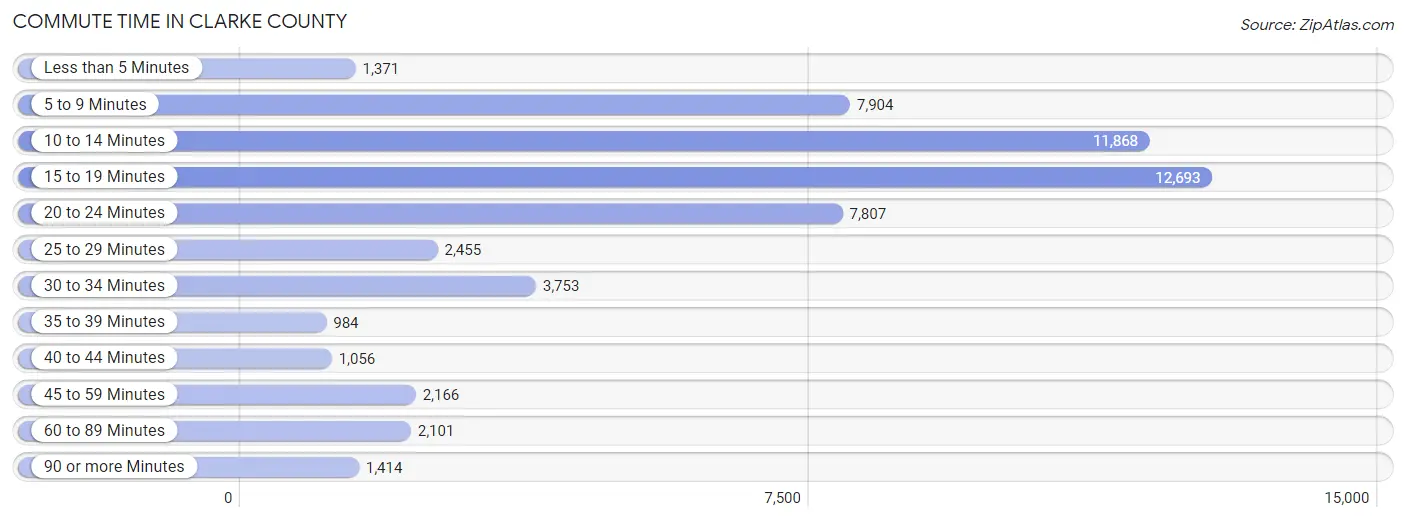
| Commute Time | # Commuters | % Commuters |
| Less than 5 Minutes | 1,371 | 2.5% |
| 5 to 9 Minutes | 7,904 | 14.2% |
| 10 to 14 Minutes | 11,868 | 21.4% |
| 15 to 19 Minutes | 12,693 | 22.8% |
| 20 to 24 Minutes | 7,807 | 14.1% |
| 25 to 29 Minutes | 2,455 | 4.4% |
| 30 to 34 Minutes | 3,753 | 6.8% |
| 35 to 39 Minutes | 984 | 1.8% |
| 40 to 44 Minutes | 1,056 | 1.9% |
| 45 to 59 Minutes | 2,166 | 3.9% |
| 60 to 89 Minutes | 2,101 | 3.8% |
| 90 or more Minutes | 1,414 | 2.5% |
Commute Time by Sex in Clarke County
The most common commute times in Clarke County are 15 to 19 minutes (6,305 commuters, 22.4%) for males and 15 to 19 minutes (6,388 commuters, 23.3%) for females.
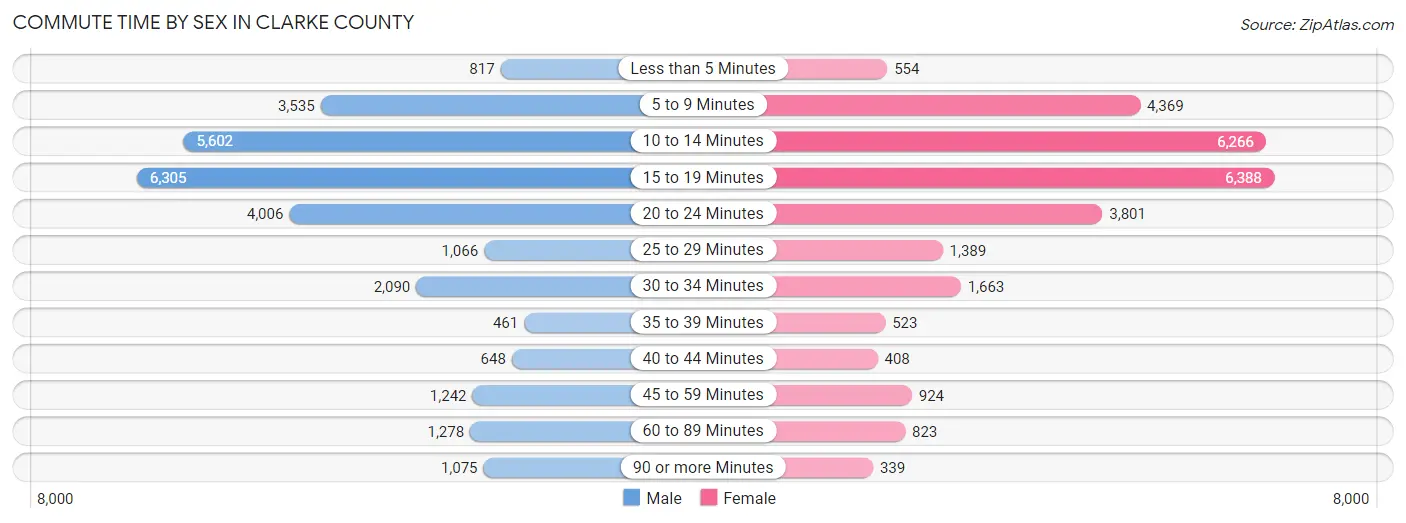
| Commute Time | Male | Female |
| Less than 5 Minutes | 817 (2.9%) | 554 (2.0%) |
| 5 to 9 Minutes | 3,535 (12.6%) | 4,369 (15.9%) |
| 10 to 14 Minutes | 5,602 (19.9%) | 6,266 (22.8%) |
| 15 to 19 Minutes | 6,305 (22.4%) | 6,388 (23.3%) |
| 20 to 24 Minutes | 4,006 (14.2%) | 3,801 (13.9%) |
| 25 to 29 Minutes | 1,066 (3.8%) | 1,389 (5.1%) |
| 30 to 34 Minutes | 2,090 (7.4%) | 1,663 (6.1%) |
| 35 to 39 Minutes | 461 (1.6%) | 523 (1.9%) |
| 40 to 44 Minutes | 648 (2.3%) | 408 (1.5%) |
| 45 to 59 Minutes | 1,242 (4.4%) | 924 (3.4%) |
| 60 to 89 Minutes | 1,278 (4.5%) | 823 (3.0%) |
| 90 or more Minutes | 1,075 (3.8%) | 339 (1.2%) |
Time of Departure to Work by Sex in Clarke County
The most frequent times of departure to work in Clarke County are 7:30 AM to 7:59 AM (3,991, 14.2%) for males and 7:30 AM to 7:59 AM (3,814, 13.9%) for females.
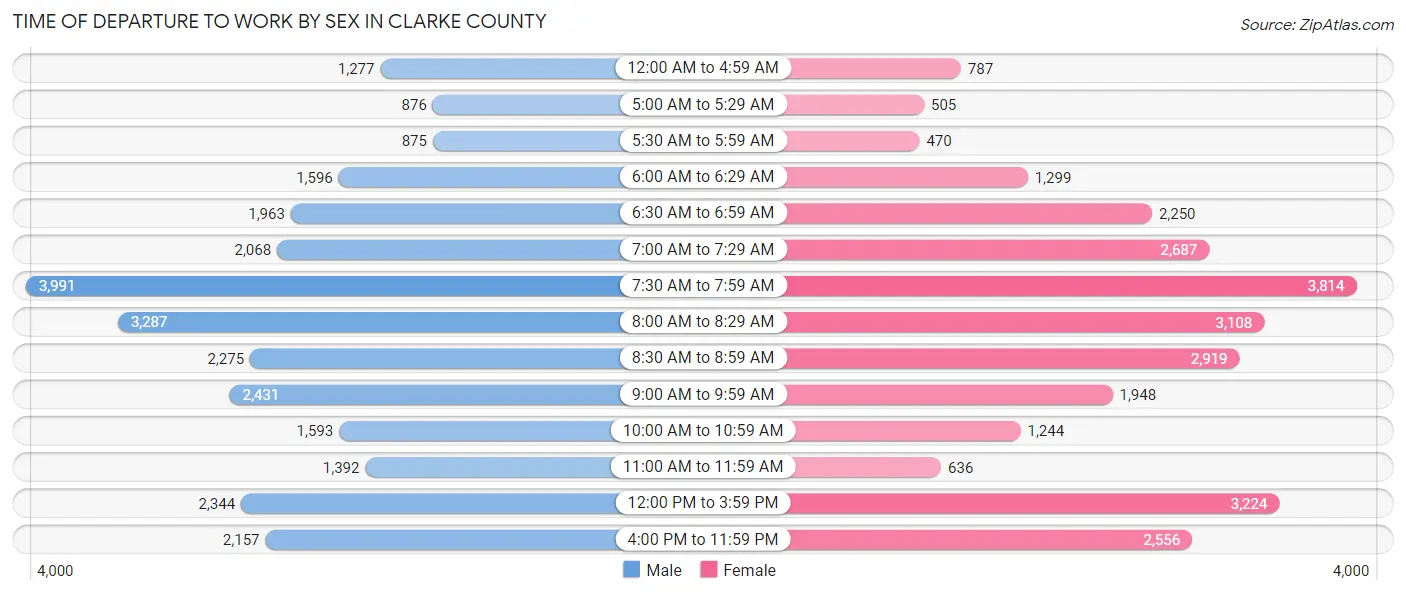
| Time of Departure | Male | Female |
| 12:00 AM to 4:59 AM | 1,277 (4.5%) | 787 (2.9%) |
| 5:00 AM to 5:29 AM | 876 (3.1%) | 505 (1.8%) |
| 5:30 AM to 5:59 AM | 875 (3.1%) | 470 (1.7%) |
| 6:00 AM to 6:29 AM | 1,596 (5.7%) | 1,299 (4.7%) |
| 6:30 AM to 6:59 AM | 1,963 (7.0%) | 2,250 (8.2%) |
| 7:00 AM to 7:29 AM | 2,068 (7.3%) | 2,687 (9.8%) |
| 7:30 AM to 7:59 AM | 3,991 (14.2%) | 3,814 (13.9%) |
| 8:00 AM to 8:29 AM | 3,287 (11.7%) | 3,108 (11.3%) |
| 8:30 AM to 8:59 AM | 2,275 (8.1%) | 2,919 (10.6%) |
| 9:00 AM to 9:59 AM | 2,431 (8.6%) | 1,948 (7.1%) |
| 10:00 AM to 10:59 AM | 1,593 (5.7%) | 1,244 (4.5%) |
| 11:00 AM to 11:59 AM | 1,392 (5.0%) | 636 (2.3%) |
| 12:00 PM to 3:59 PM | 2,344 (8.3%) | 3,224 (11.7%) |
| 4:00 PM to 11:59 PM | 2,157 (7.7%) | 2,556 (9.3%) |
| Total | 28,125 (100.0%) | 27,447 (100.0%) |
Housing Occupancy in Clarke County
Occupancy by Ownership in Clarke County
Of the total 53,336 dwellings in Clarke County, owner-occupied units account for 21,980 (41.2%), while renter-occupied units make up 31,356 (58.8%).
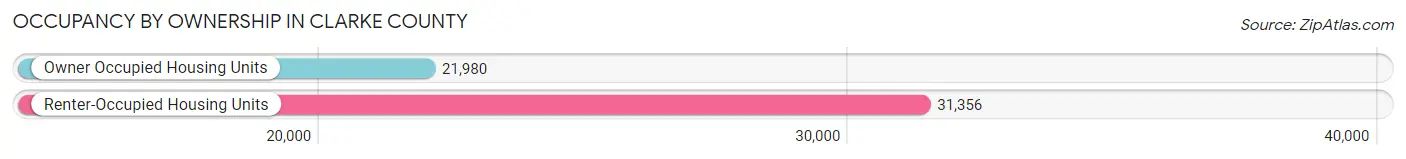
| Occupancy | # Housing Units | % Housing Units |
| Owner Occupied Housing Units | 21,980 | 41.2% |
| Renter-Occupied Housing Units | 31,356 | 58.8% |
| Total Occupied Housing Units | 53,336 | 100.0% |
Occupancy by Household Size in Clarke County
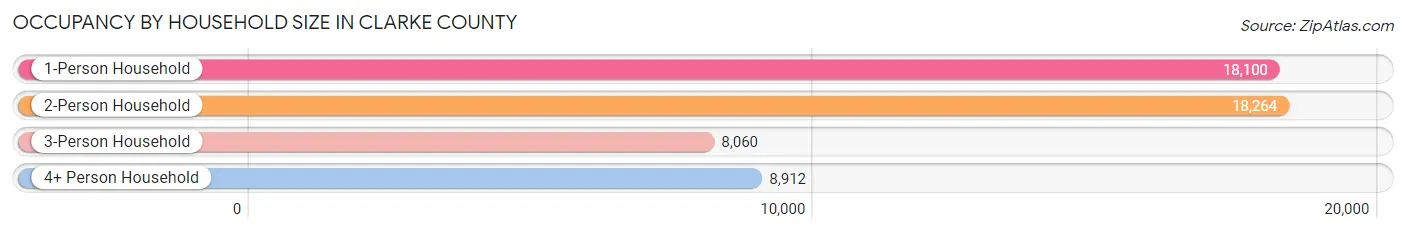
| Household Size | # Housing Units | % Housing Units |
| 1-Person Household | 18,100 | 33.9% |
| 2-Person Household | 18,264 | 34.2% |
| 3-Person Household | 8,060 | 15.1% |
| 4+ Person Household | 8,912 | 16.7% |
| Total Housing Units | 53,336 | 100.0% |
Occupancy by Ownership by Household Size in Clarke County
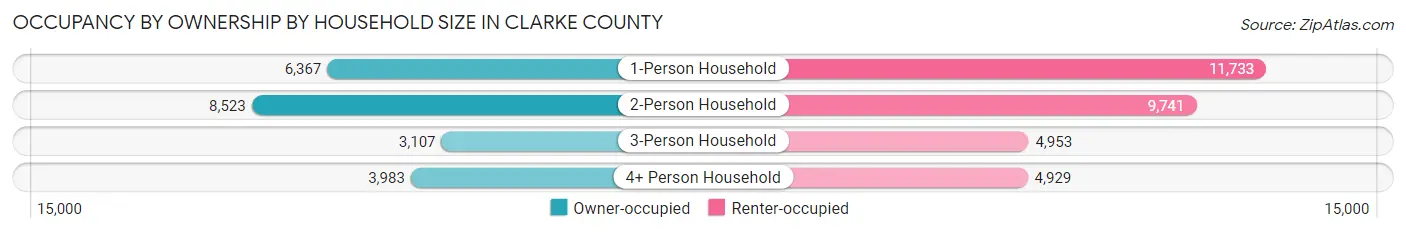
| Household Size | Owner-occupied | Renter-occupied |
| 1-Person Household | 6,367 (35.2%) | 11,733 (64.8%) |
| 2-Person Household | 8,523 (46.7%) | 9,741 (53.3%) |
| 3-Person Household | 3,107 (38.6%) | 4,953 (61.5%) |
| 4+ Person Household | 3,983 (44.7%) | 4,929 (55.3%) |
| Total Housing Units | 21,980 (41.2%) | 31,356 (58.8%) |
Occupancy by Educational Attainment in Clarke County
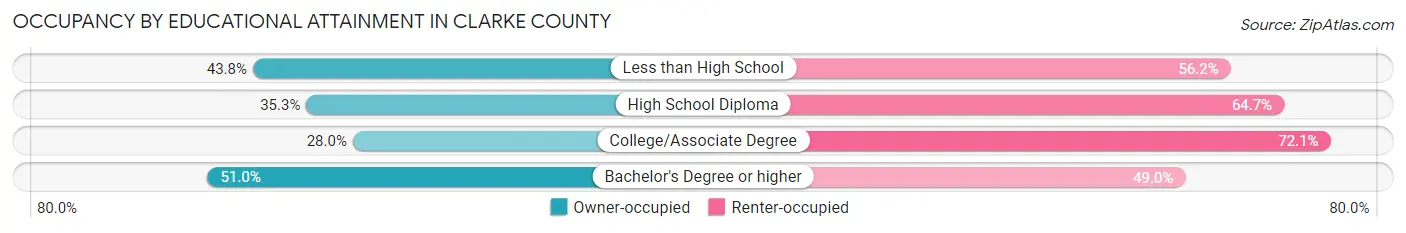
| Household Size | Owner-occupied | Renter-occupied |
| Less than High School | 1,673 (43.8%) | 2,146 (56.2%) |
| High School Diploma | 3,144 (35.3%) | 5,756 (64.7%) |
| College/Associate Degree | 4,304 (28.0%) | 11,096 (72.1%) |
| Bachelor's Degree or higher | 12,859 (51.0%) | 12,358 (49.0%) |
Occupancy by Age of Householder in Clarke County
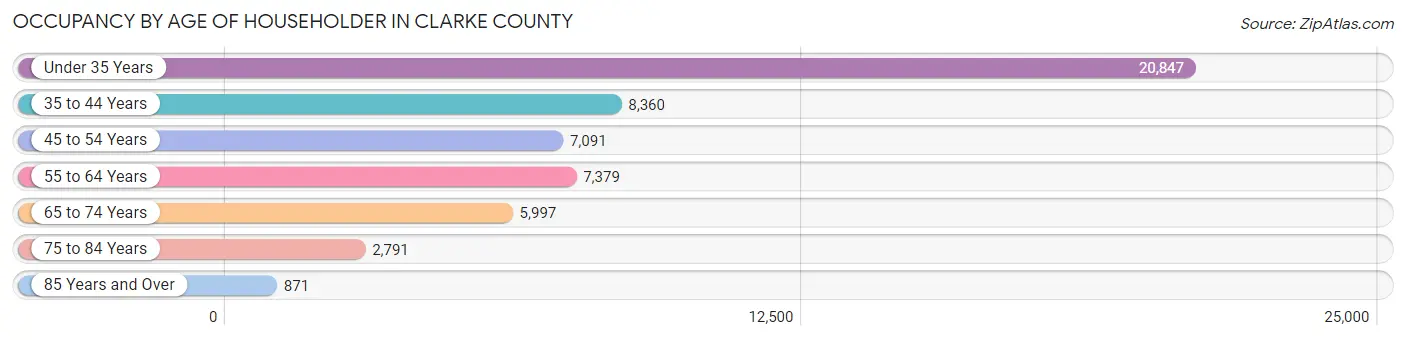
| Age Bracket | # Households | % Households |
| Under 35 Years | 20,847 | 39.1% |
| 35 to 44 Years | 8,360 | 15.7% |
| 45 to 54 Years | 7,091 | 13.3% |
| 55 to 64 Years | 7,379 | 13.8% |
| 65 to 74 Years | 5,997 | 11.2% |
| 75 to 84 Years | 2,791 | 5.2% |
| 85 Years and Over | 871 | 1.6% |
| Total | 53,336 | 100.0% |
Housing Finances in Clarke County
Median Income by Occupancy in Clarke County
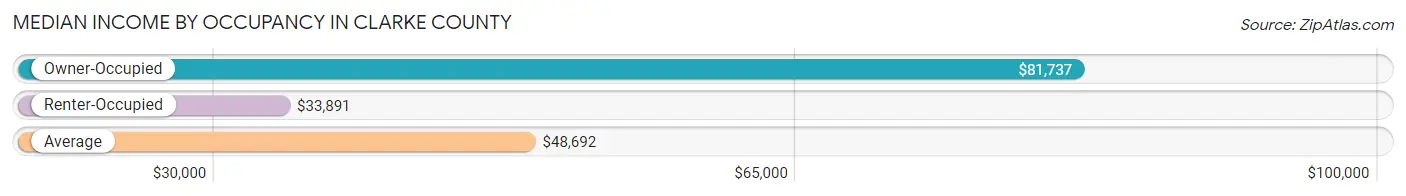
| Occupancy Type | # Households | Median Income |
| Owner-Occupied | 21,980 (41.2%) | $81,737 |
| Renter-Occupied | 31,356 (58.8%) | $33,891 |
| Average | 53,336 (100.0%) | $48,692 |
Occupancy by Householder Income Bracket in Clarke County
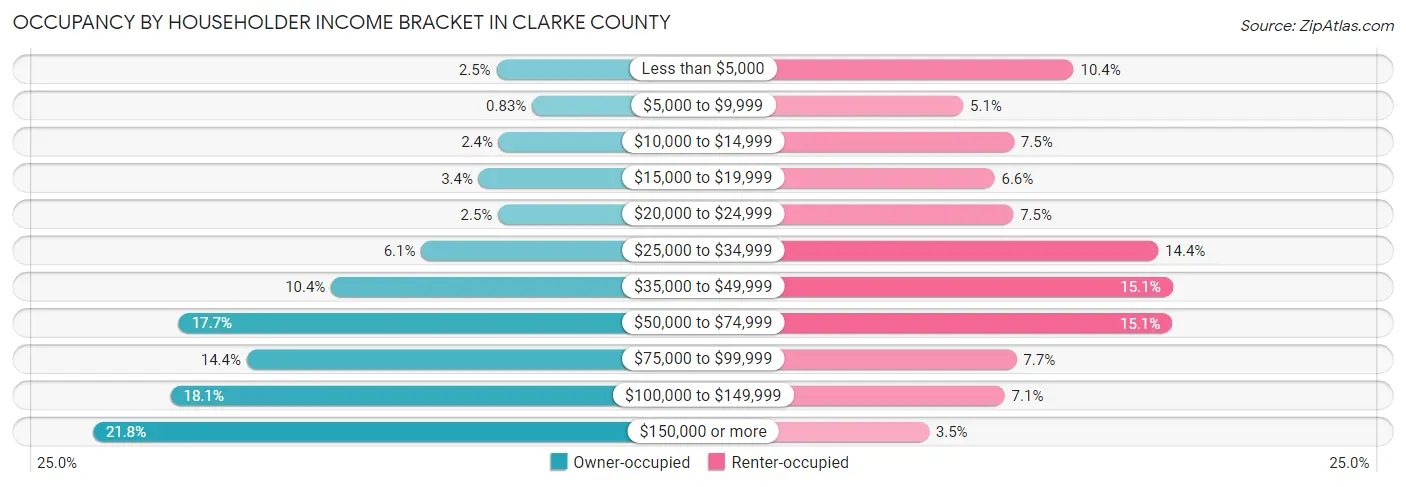
| Income Bracket | Owner-occupied | Renter-occupied |
| Less than $5,000 | 556 (2.5%) | 3,256 (10.4%) |
| $5,000 to $9,999 | 183 (0.8%) | 1,605 (5.1%) |
| $10,000 to $14,999 | 533 (2.4%) | 2,365 (7.5%) |
| $15,000 to $19,999 | 740 (3.4%) | 2,076 (6.6%) |
| $20,000 to $24,999 | 539 (2.5%) | 2,355 (7.5%) |
| $25,000 to $34,999 | 1,344 (6.1%) | 4,519 (14.4%) |
| $35,000 to $49,999 | 2,285 (10.4%) | 4,732 (15.1%) |
| $50,000 to $74,999 | 3,882 (17.7%) | 4,726 (15.1%) |
| $75,000 to $99,999 | 3,169 (14.4%) | 2,402 (7.7%) |
| $100,000 to $149,999 | 3,968 (18.0%) | 2,226 (7.1%) |
| $150,000 or more | 4,781 (21.7%) | 1,094 (3.5%) |
| Total | 21,980 (100.0%) | 31,356 (100.0%) |
Monthly Housing Cost Tiers in Clarke County
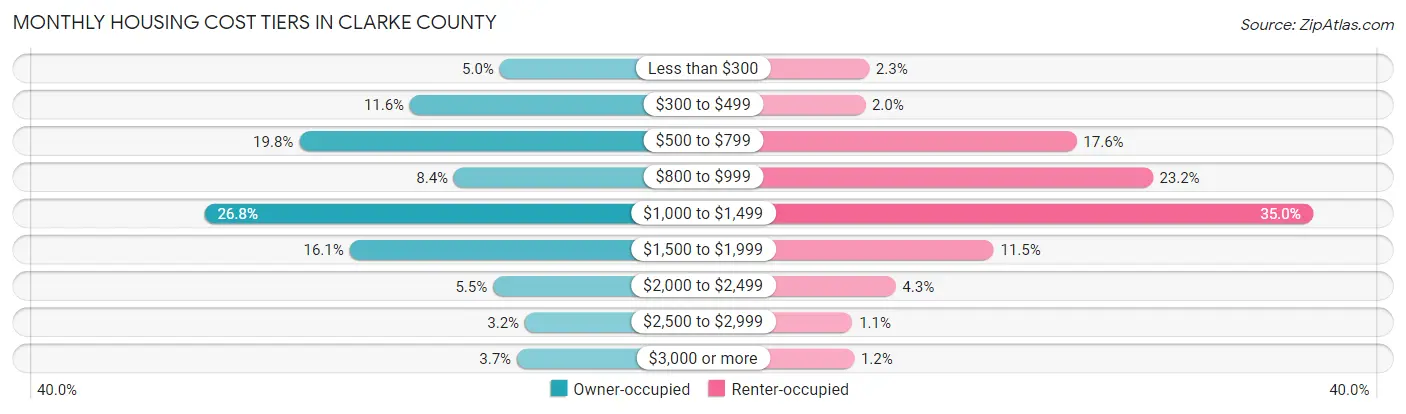
| Monthly Cost | Owner-occupied | Renter-occupied |
| Less than $300 | 1,101 (5.0%) | 726 (2.3%) |
| $300 to $499 | 2,553 (11.6%) | 637 (2.0%) |
| $500 to $799 | 4,347 (19.8%) | 5,520 (17.6%) |
| $800 to $999 | 1,842 (8.4%) | 7,275 (23.2%) |
| $1,000 to $1,499 | 5,880 (26.8%) | 10,970 (35.0%) |
| $1,500 to $1,999 | 3,533 (16.1%) | 3,606 (11.5%) |
| $2,000 to $2,499 | 1,209 (5.5%) | 1,338 (4.3%) |
| $2,500 to $2,999 | 692 (3.2%) | 341 (1.1%) |
| $3,000 or more | 823 (3.7%) | 382 (1.2%) |
| Total | 21,980 (100.0%) | 31,356 (100.0%) |
Physical Housing Characteristics in Clarke County
Housing Structures in Clarke County
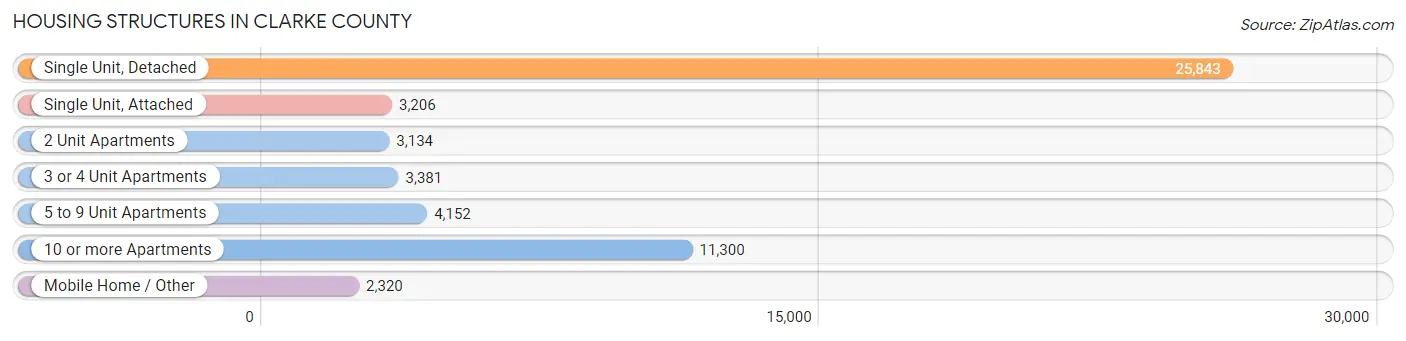
| Structure Type | # Housing Units | % Housing Units |
| Single Unit, Detached | 25,843 | 48.4% |
| Single Unit, Attached | 3,206 | 6.0% |
| 2 Unit Apartments | 3,134 | 5.9% |
| 3 or 4 Unit Apartments | 3,381 | 6.3% |
| 5 to 9 Unit Apartments | 4,152 | 7.8% |
| 10 or more Apartments | 11,300 | 21.2% |
| Mobile Home / Other | 2,320 | 4.3% |
| Total | 53,336 | 100.0% |
Housing Structures by Occupancy in Clarke County
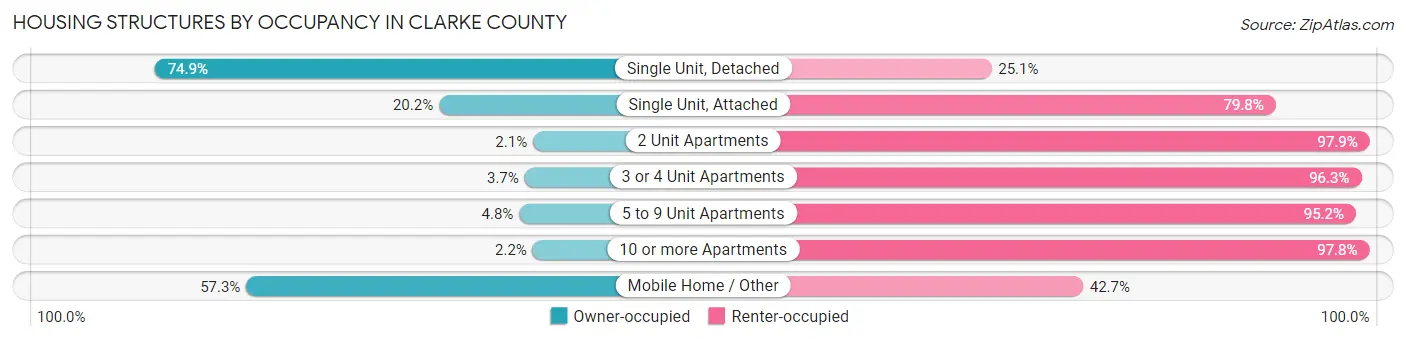
| Structure Type | Owner-occupied | Renter-occupied |
| Single Unit, Detached | 19,366 (74.9%) | 6,477 (25.1%) |
| Single Unit, Attached | 648 (20.2%) | 2,558 (79.8%) |
| 2 Unit Apartments | 66 (2.1%) | 3,068 (97.9%) |
| 3 or 4 Unit Apartments | 126 (3.7%) | 3,255 (96.3%) |
| 5 to 9 Unit Apartments | 198 (4.8%) | 3,954 (95.2%) |
| 10 or more Apartments | 246 (2.2%) | 11,054 (97.8%) |
| Mobile Home / Other | 1,330 (57.3%) | 990 (42.7%) |
| Total | 21,980 (41.2%) | 31,356 (58.8%) |
Housing Structures by Number of Rooms in Clarke County
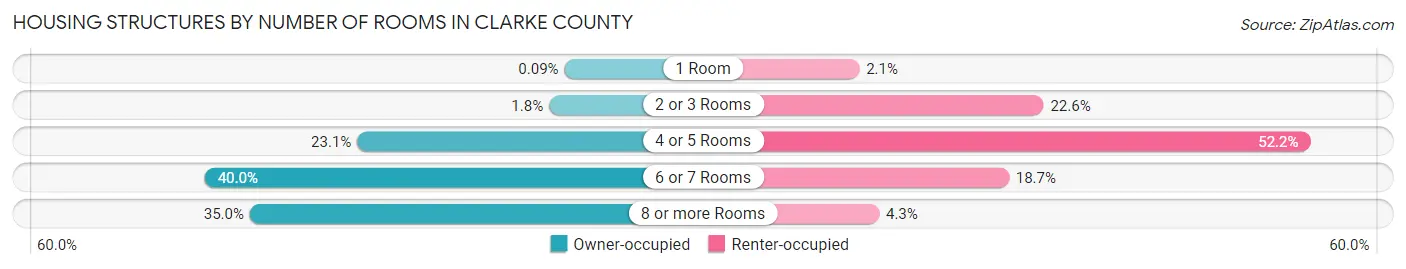
| Number of Rooms | Owner-occupied | Renter-occupied |
| 1 Room | 19 (0.1%) | 670 (2.1%) |
| 2 or 3 Rooms | 396 (1.8%) | 7,083 (22.6%) |
| 4 or 5 Rooms | 5,075 (23.1%) | 16,368 (52.2%) |
| 6 or 7 Rooms | 8,794 (40.0%) | 5,875 (18.7%) |
| 8 or more Rooms | 7,696 (35.0%) | 1,360 (4.3%) |
| Total | 21,980 (100.0%) | 31,356 (100.0%) |
Housing Structure by Heating Type in Clarke County
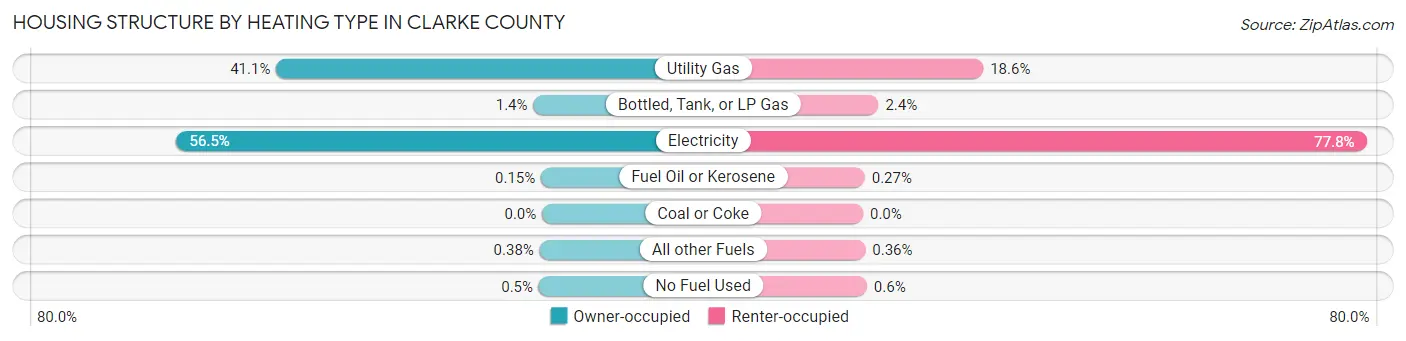
| Heating Type | Owner-occupied | Renter-occupied |
| Utility Gas | 9,034 (41.1%) | 5,827 (18.6%) |
| Bottled, Tank, or LP Gas | 297 (1.3%) | 747 (2.4%) |
| Electricity | 12,425 (56.5%) | 24,397 (77.8%) |
| Fuel Oil or Kerosene | 32 (0.2%) | 84 (0.3%) |
| Coal or Coke | 0 (0.0%) | 0 (0.0%) |
| All other Fuels | 83 (0.4%) | 114 (0.4%) |
| No Fuel Used | 109 (0.5%) | 187 (0.6%) |
| Total | 21,980 (100.0%) | 31,356 (100.0%) |
Household Vehicle Usage in Clarke County
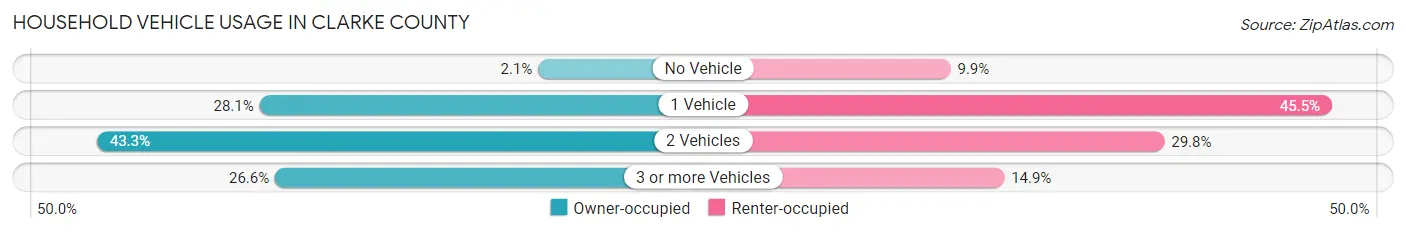
| Vehicles per Household | Owner-occupied | Renter-occupied |
| No Vehicle | 452 (2.1%) | 3,093 (9.9%) |
| 1 Vehicle | 6,169 (28.1%) | 14,254 (45.5%) |
| 2 Vehicles | 9,508 (43.3%) | 9,346 (29.8%) |
| 3 or more Vehicles | 5,851 (26.6%) | 4,663 (14.9%) |
| Total | 21,980 (100.0%) | 31,356 (100.0%) |
Real Estate & Mortgages in Clarke County
Real Estate and Mortgage Overview in Clarke County
| Characteristic | Without Mortgage | With Mortgage |
| Housing Units | 8,698 | 13,282 |
| Median Property Value | $235,000 | $245,700 |
| Median Household Income | $65,885 | $3,267 |
| Monthly Housing Costs | $555 | $816 |
| Real Estate Taxes | $2,341 | $480 |
Property Value by Mortgage Status in Clarke County

| Property Value | Without Mortgage | With Mortgage |
| Less than $50,000 | 903 (10.4%) | 179 (1.3%) |
| $50,000 to $99,999 | 787 (9.0%) | 244 (1.8%) |
| $100,000 to $299,999 | 4,061 (46.7%) | 8,060 (60.7%) |
| $300,000 to $499,999 | 2,079 (23.9%) | 3,324 (25.0%) |
| $500,000 to $749,999 | 558 (6.4%) | 968 (7.3%) |
| $750,000 to $999,999 | 172 (2.0%) | 324 (2.4%) |
| $1,000,000 or more | 138 (1.6%) | 183 (1.4%) |
| Total | 8,698 (100.0%) | 13,282 (100.0%) |
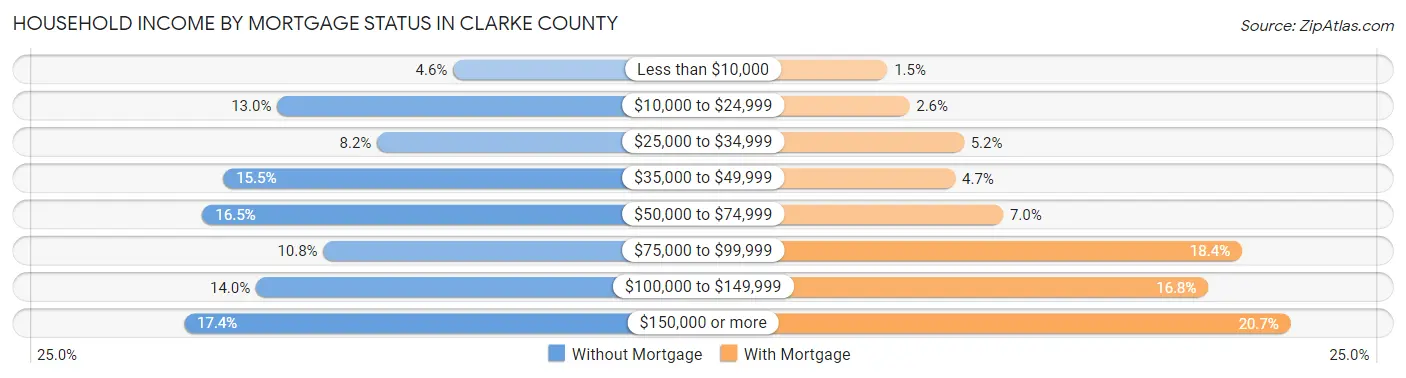
Household Income by Mortgage Status in Clarke County
| Household Income | Without Mortgage | With Mortgage |
| Less than $10,000 | 399 (4.6%) | 200 (1.5%) |
| $10,000 to $24,999 | 1,128 (13.0%) | 340 (2.6%) |
| $25,000 to $34,999 | 714 (8.2%) | 684 (5.1%) |
| $35,000 to $49,999 | 1,352 (15.5%) | 630 (4.7%) |
| $50,000 to $74,999 | 1,438 (16.5%) | 933 (7.0%) |
| $75,000 to $99,999 | 937 (10.8%) | 2,444 (18.4%) |
| $100,000 to $149,999 | 1,216 (14.0%) | 2,232 (16.8%) |
| $150,000 or more | 1,514 (17.4%) | 2,752 (20.7%) |
| Total | 8,698 (100.0%) | 13,282 (100.0%) |
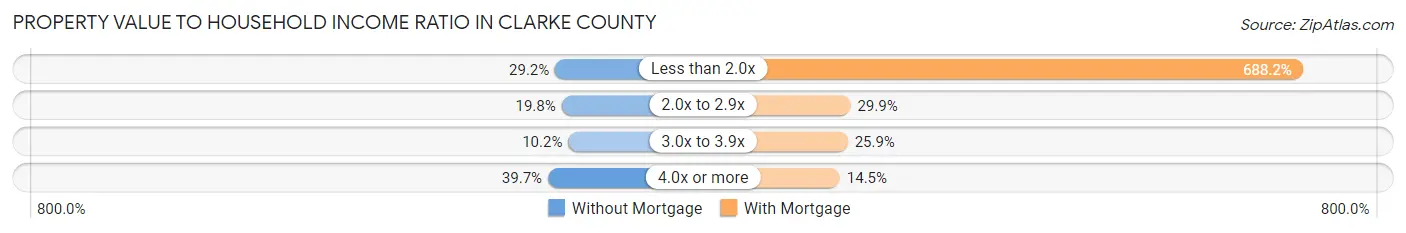
Property Value to Household Income Ratio in Clarke County
| Value-to-Income Ratio | Without Mortgage | With Mortgage |
| Less than 2.0x | 2,542 (29.2%) | 91,411 (688.2%) |
| 2.0x to 2.9x | 1,723 (19.8%) | 3,970 (29.9%) |
| 3.0x to 3.9x | 884 (10.2%) | 3,433 (25.9%) |
| 4.0x or more | 3,455 (39.7%) | 1,920 (14.5%) |
| Total | 8,698 (100.0%) | 13,282 (100.0%) |
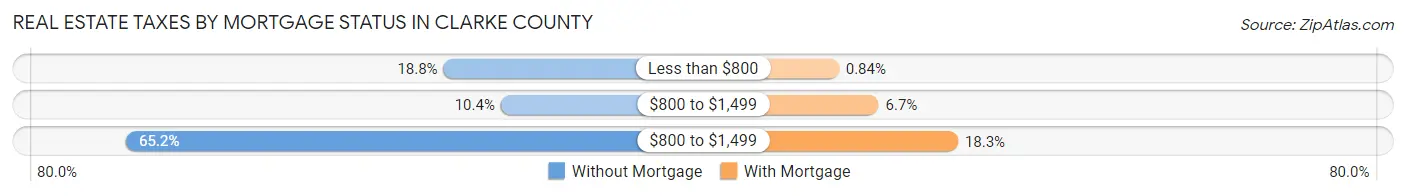
Real Estate Taxes by Mortgage Status in Clarke County
| Property Taxes | Without Mortgage | With Mortgage |
| Less than $800 | 1,635 (18.8%) | 111 (0.8%) |
| $800 to $1,499 | 907 (10.4%) | 884 (6.7%) |
| $800 to $1,499 | 5,669 (65.2%) | 2,424 (18.2%) |
| Total | 8,698 (100.0%) | 13,282 (100.0%) |
Health & Disability in Clarke County
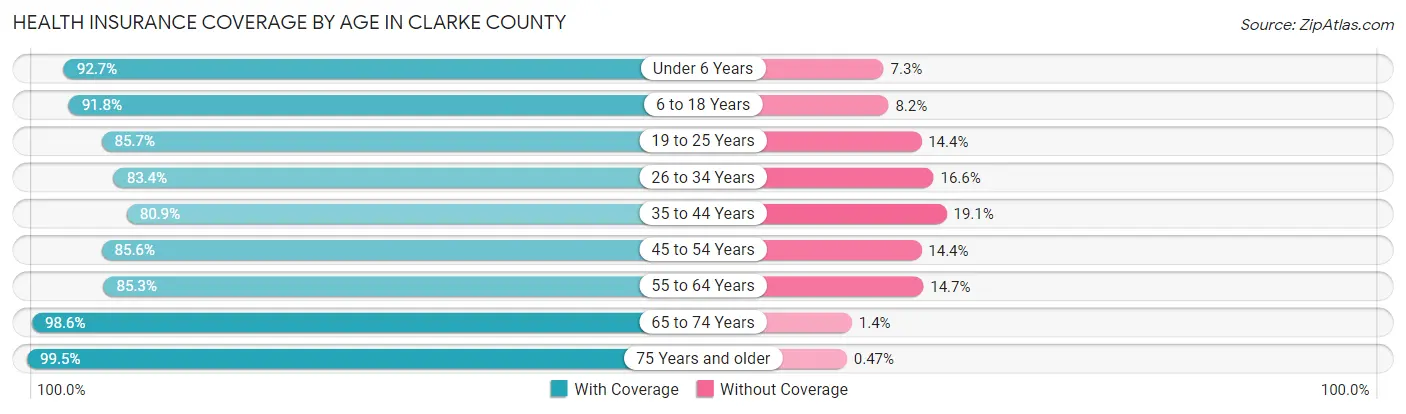
Health Insurance Coverage by Age in Clarke County
| Age Bracket | With Coverage | Without Coverage |
| Under 6 Years | 6,714 (92.7%) | 531 (7.3%) |
| 6 to 18 Years | 17,557 (91.8%) | 1,577 (8.2%) |
| 19 to 25 Years | 27,097 (85.7%) | 4,541 (14.3%) |
| 26 to 34 Years | 14,702 (83.4%) | 2,935 (16.6%) |
| 35 to 44 Years | 11,830 (80.9%) | 2,788 (19.1%) |
| 45 to 54 Years | 9,939 (85.6%) | 1,668 (14.4%) |
| 55 to 64 Years | 9,930 (85.3%) | 1,715 (14.7%) |
| 65 to 74 Years | 8,792 (98.6%) | 126 (1.4%) |
| 75 Years and older | 5,454 (99.5%) | 26 (0.5%) |
| Total | 112,015 (87.6%) | 15,907 (12.4%) |
Health Insurance Coverage by Citizenship Status in Clarke County
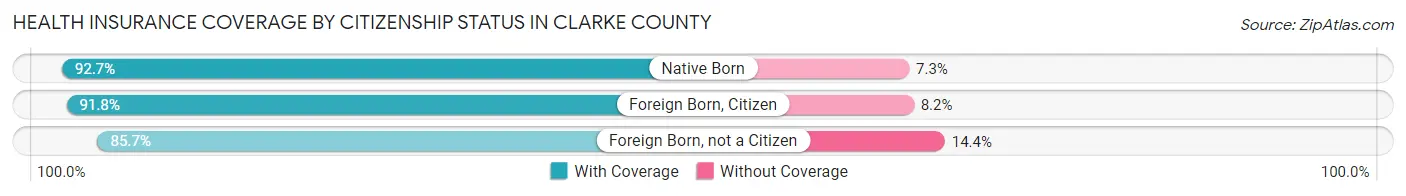
| Citizenship Status | With Coverage | Without Coverage |
| Native Born | 6,714 (92.7%) | 531 (7.3%) |
| Foreign Born, Citizen | 17,557 (91.8%) | 1,577 (8.2%) |
| Foreign Born, not a Citizen | 27,097 (85.7%) | 4,541 (14.3%) |
Health Insurance Coverage by Household Income in Clarke County
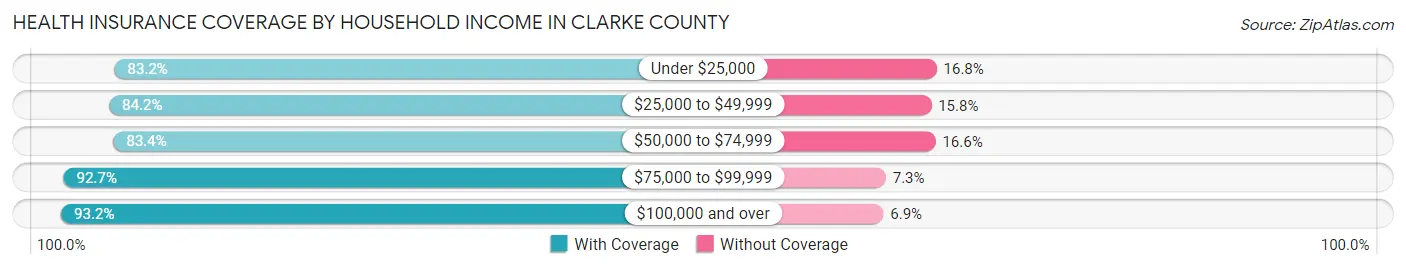
| Household Income | With Coverage | Without Coverage |
| Under $25,000 | 22,811 (83.2%) | 4,615 (16.8%) |
| $25,000 to $49,999 | 21,827 (84.2%) | 4,103 (15.8%) |
| $50,000 to $74,999 | 16,256 (83.4%) | 3,240 (16.6%) |
| $75,000 to $99,999 | 11,976 (92.7%) | 944 (7.3%) |
| $100,000 and over | 30,060 (93.1%) | 2,211 (6.9%) |
Public vs Private Health Insurance Coverage by Age in Clarke County
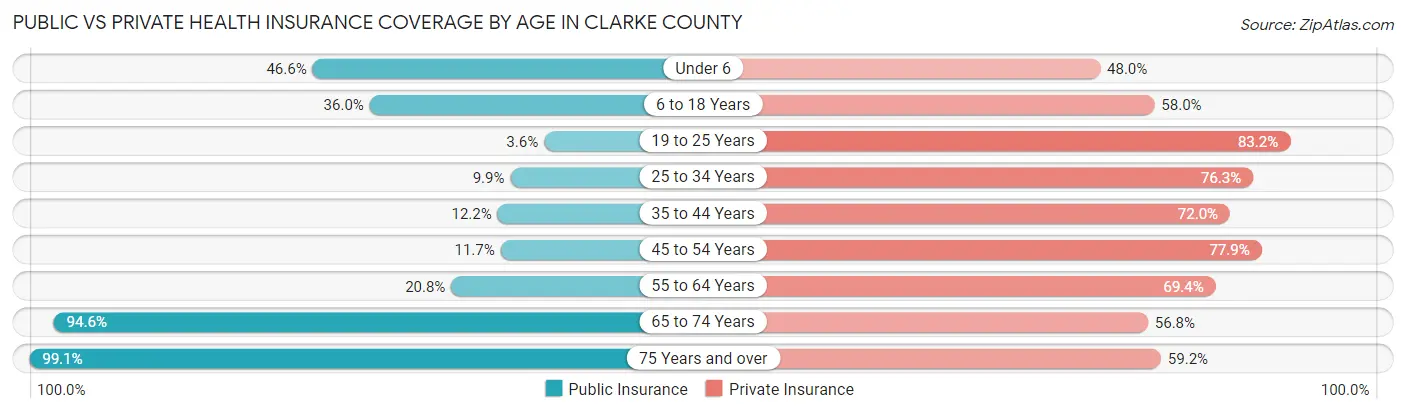
| Age Bracket | Public Insurance | Private Insurance |
| Under 6 | 3,373 (46.6%) | 3,474 (47.9%) |
| 6 to 18 Years | 6,878 (35.9%) | 11,104 (58.0%) |
| 19 to 25 Years | 1,135 (3.6%) | 26,315 (83.2%) |
| 25 to 34 Years | 1,738 (9.9%) | 13,463 (76.3%) |
| 35 to 44 Years | 1,786 (12.2%) | 10,529 (72.0%) |
| 45 to 54 Years | 1,353 (11.7%) | 9,043 (77.9%) |
| 55 to 64 Years | 2,424 (20.8%) | 8,077 (69.4%) |
| 65 to 74 Years | 8,436 (94.6%) | 5,066 (56.8%) |
| 75 Years and over | 5,432 (99.1%) | 3,246 (59.2%) |
| Total | 32,555 (25.5%) | 90,317 (70.6%) |
Disability Status by Sex by Age in Clarke County
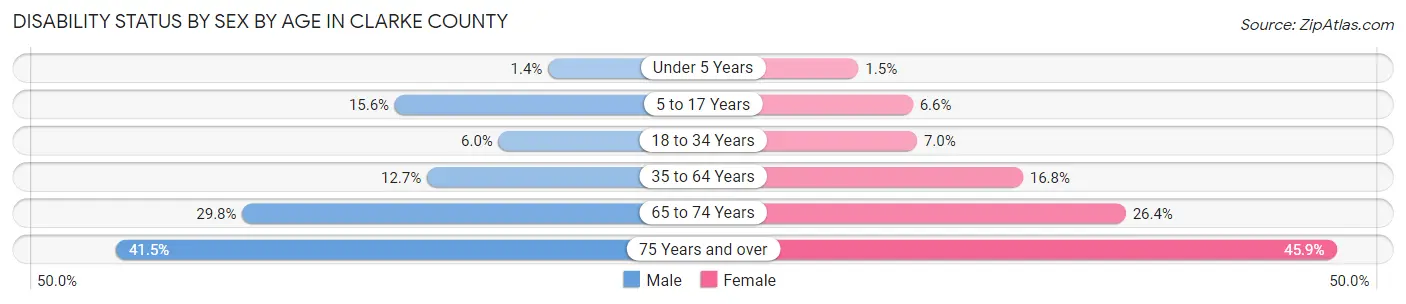
| Age Bracket | Male | Female |
| Under 5 Years | 46 (1.4%) | 46 (1.5%) |
| 5 to 17 Years | 1,222 (15.6%) | 506 (6.6%) |
| 18 to 34 Years | 1,535 (6.0%) | 1,978 (7.0%) |
| 35 to 64 Years | 2,318 (12.7%) | 3,283 (16.8%) |
| 65 to 74 Years | 1,161 (29.8%) | 1,323 (26.4%) |
| 75 Years and over | 832 (41.5%) | 1,595 (45.9%) |
Disability Class by Sex by Age in Clarke County
Disability Class: Hearing Difficulty
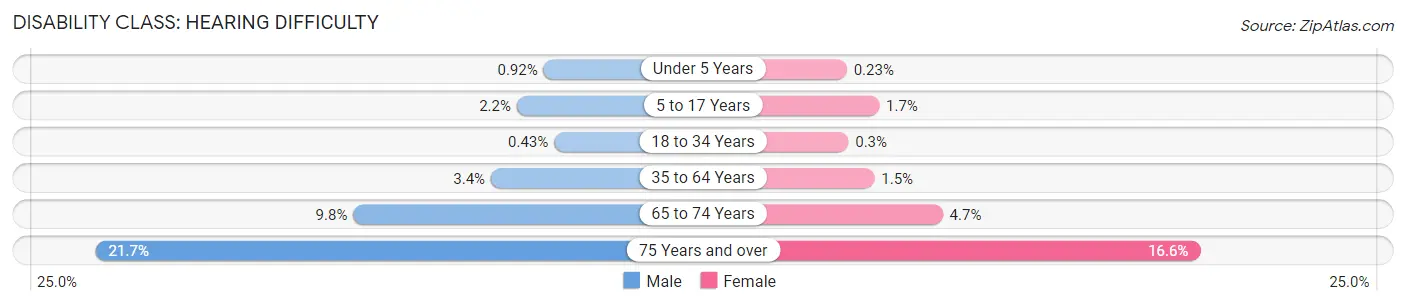
| Age Bracket | Male | Female |
| Under 5 Years | 30 (0.9%) | 7 (0.2%) |
| 5 to 17 Years | 169 (2.2%) | 133 (1.7%) |
| 18 to 34 Years | 110 (0.4%) | 85 (0.3%) |
| 35 to 64 Years | 615 (3.4%) | 296 (1.5%) |
| 65 to 74 Years | 380 (9.8%) | 235 (4.7%) |
| 75 Years and over | 435 (21.7%) | 578 (16.6%) |
Disability Class: Vision Difficulty
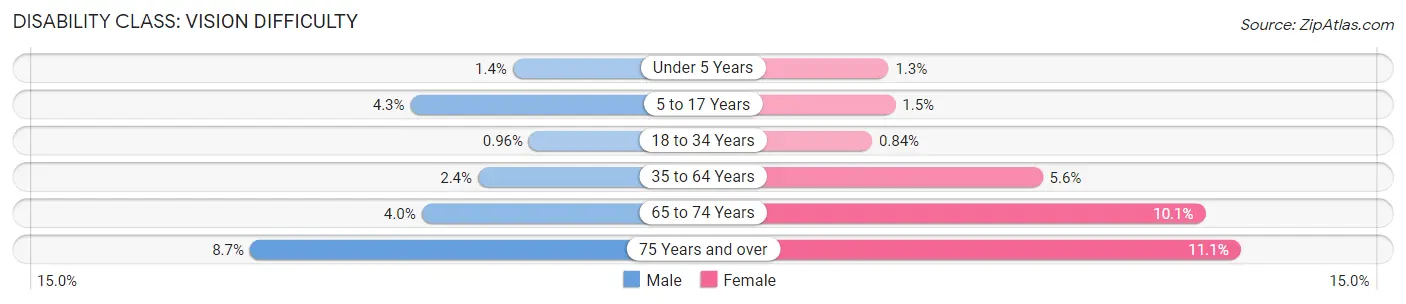
| Age Bracket | Male | Female |
| Under 5 Years | 46 (1.4%) | 39 (1.3%) |
| 5 to 17 Years | 333 (4.3%) | 115 (1.5%) |
| 18 to 34 Years | 246 (1.0%) | 239 (0.8%) |
| 35 to 64 Years | 436 (2.4%) | 1,092 (5.6%) |
| 65 to 74 Years | 154 (4.0%) | 508 (10.1%) |
| 75 Years and over | 175 (8.7%) | 386 (11.1%) |
Disability Class: Cognitive Difficulty
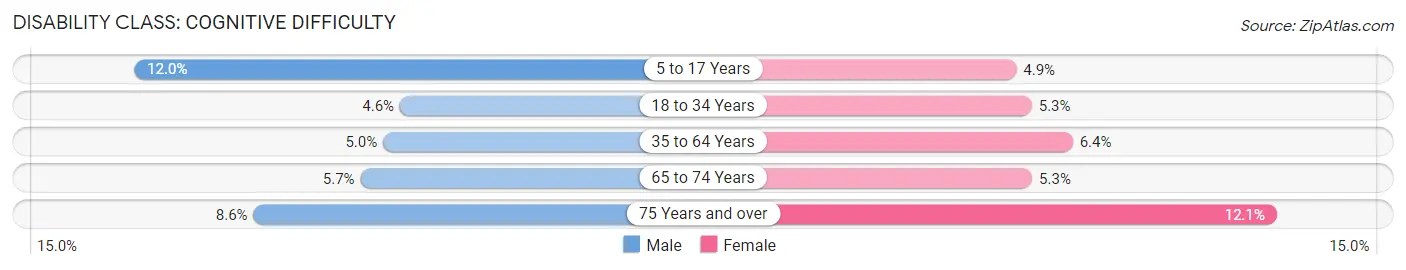
| Age Bracket | Male | Female |
| 5 to 17 Years | 934 (11.9%) | 374 (4.9%) |
| 18 to 34 Years | 1,163 (4.5%) | 1,499 (5.3%) |
| 35 to 64 Years | 920 (5.0%) | 1,256 (6.4%) |
| 65 to 74 Years | 220 (5.7%) | 266 (5.3%) |
| 75 Years and over | 173 (8.6%) | 421 (12.1%) |
Disability Class: Ambulatory Difficulty
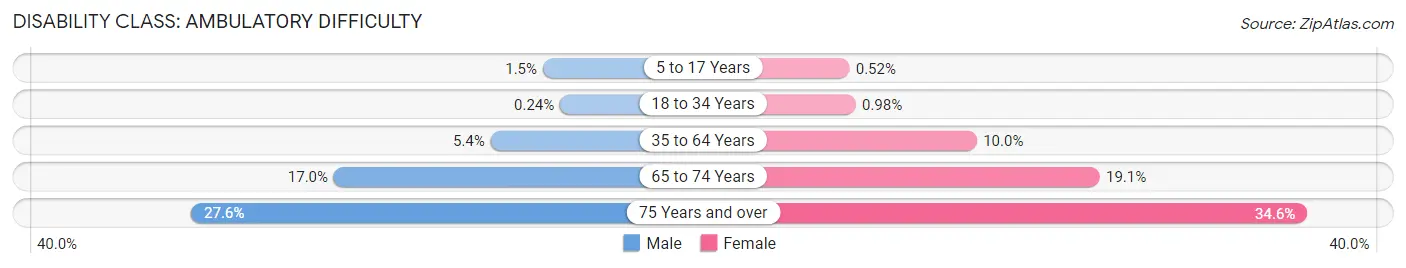
| Age Bracket | Male | Female |
| 5 to 17 Years | 119 (1.5%) | 40 (0.5%) |
| 18 to 34 Years | 61 (0.2%) | 278 (1.0%) |
| 35 to 64 Years | 989 (5.4%) | 1,951 (10.0%) |
| 65 to 74 Years | 664 (17.0%) | 959 (19.1%) |
| 75 Years and over | 554 (27.6%) | 1,201 (34.5%) |
Disability Class: Self-Care Difficulty
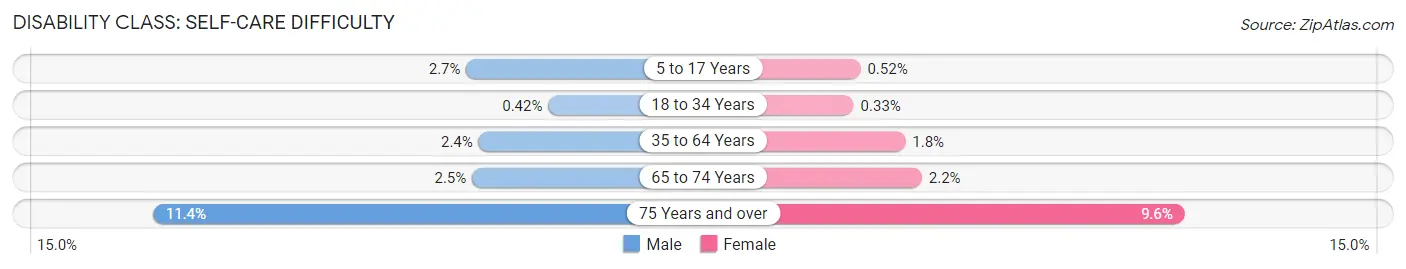
| Age Bracket | Male | Female |
| 5 to 17 Years | 211 (2.7%) | 40 (0.5%) |
| 18 to 34 Years | 107 (0.4%) | 93 (0.3%) |
| 35 to 64 Years | 433 (2.4%) | 345 (1.8%) |
| 65 to 74 Years | 99 (2.5%) | 112 (2.2%) |
| 75 Years and over | 229 (11.4%) | 332 (9.6%) |
Technology Access in Clarke County
Computing Device Access in Clarke County
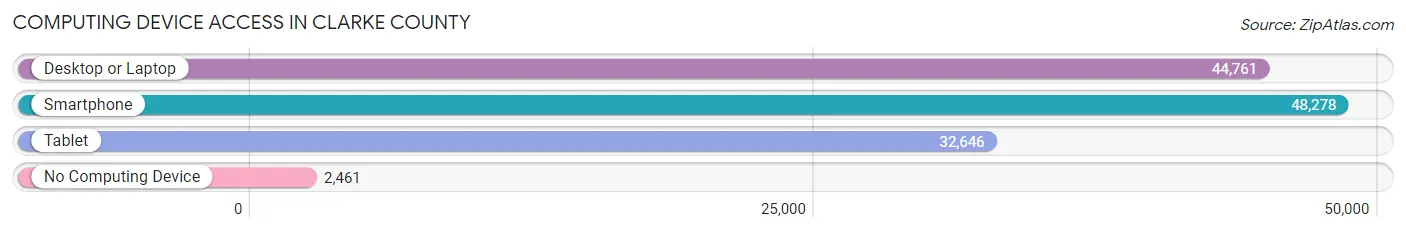
| Device Type | # Households | % Households |
| Desktop or Laptop | 44,761 | 83.9% |
| Smartphone | 48,278 | 90.5% |
| Tablet | 32,646 | 61.2% |
| No Computing Device | 2,461 | 4.6% |
| Total | 53,336 | 100.0% |
Internet Access in Clarke County
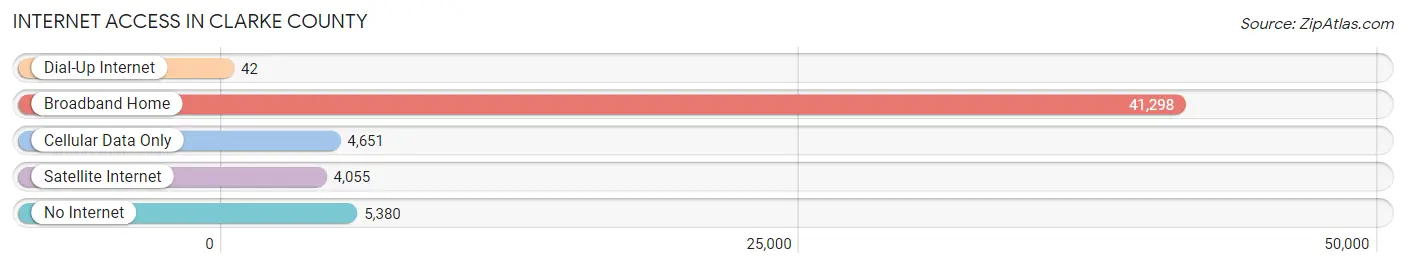
| Internet Type | # Households | % Households |
| Dial-Up Internet | 42 | 0.1% |
| Broadband Home | 41,298 | 77.4% |
| Cellular Data Only | 4,651 | 8.7% |
| Satellite Internet | 4,055 | 7.6% |
| No Internet | 5,380 | 10.1% |
| Total | 53,336 | 100.0% |
Clarke County Summary
Clarke County, Georgia is located in the northeastern part of the state, just east of Athens. It is part of the Athens-Clarke County Metropolitan Statistical Area, which includes all of Clarke County and the city of Athens. The county was created in 1801 and named for Revolutionary War hero Elijah Clarke. It covers an area of 162 square miles and has a population of approximately 125,000 people.
Geography
Clarke County is located in the Piedmont region of Georgia, which is characterized by rolling hills and valleys. The county is bordered by Oconee County to the east, Madison County to the north, Oglethorpe County to the west, and Barrow County to the south. The county is home to several rivers, including the Oconee, Middle Oconee, and North Oconee. The county also contains several lakes, including Lake Oconee, Lake Sinclair, and Lake Jackson.
The county is home to several state parks, including Sandy Creek Park, Watson Mill Bridge State Park, and Hard Labor Creek State Park. The county also contains several historic sites, including the Athens-Clarke County Courthouse, the University of Georgia, and the State Botanical Garden of Georgia.
Economy
The economy of Clarke County is largely based on the University of Georgia, which is the largest employer in the county. Other major employers include St. Mary's Health Care System, Athens Regional Medical Center, and the Clarke County School District. The county is also home to several manufacturing companies, including Carrier Corporation, Caterpillar, and John Deere.
The county is home to several shopping centers, including Georgia Square Mall, Beechwood Shopping Center, and the Georgia Square Shopping Center. The county also contains several restaurants, bars, and entertainment venues.
Demographics
As of the 2010 census, the population of Clarke County was 116,714. The racial makeup of the county was 68.2% White, 25.3% African American, 0.3% Native American, 3.2% Asian, 0.1% Pacific Islander, and 2.9% from other races. Hispanic or Latino of any race were 6.2% of the population.
The median income for a household in the county was $41,945, and the median income for a family was $51,914. The per capita income for the county was $22,945. About 13.2% of families and 17.7% of the population were below the poverty line, including 25.2% of those under age 18 and 8.7% of those age 65 or over.
Education
Clarke County is served by the Clarke County School District, which operates twenty-one elementary schools, seven middle schools, and four high schools. The county is also home to the University of Georgia, which is the state's flagship university. The university offers a wide range of undergraduate and graduate degree programs.
Conclusion
Clarke County, Georgia is a vibrant and diverse county located in the northeastern part of the state. The county is home to several rivers, lakes, and state parks, as well as the University of Georgia. The economy of the county is largely based on the university, as well as several manufacturing companies and shopping centers. The population of the county is diverse, with a median income of $41,945 and a poverty rate of 13.2%. The county is served by the Clarke County School District, as well as the University of Georgia.
Common Questions
What is the Total Population of Clarke County?
Total Population of Clarke County is 128,864.
What is the Total Male Population of Clarke County?
Total Male Population of Clarke County is 61,390.
What is the Total Female Population of Clarke County?
Total Female Population of Clarke County is 67,474.
What is the Ratio of Males per 100 Females in Clarke County?
There are 90.98 Males per 100 Females in Clarke County.
What is the Ratio of Females per 100 Males in Clarke County?
There are 109.91 Females per 100 Males in Clarke County.
What is the Median Population Age in Clarke County?
Median Population Age in Clarke County is 28.9 Years.
What is the Average Family Size in Clarke County
Average Family Size in Clarke County is 2.9 People.
What is the Average Household Size in Clarke County
Average Household Size in Clarke County is 2.2 People.
What is Per Capita Income in Clarke County?
Per Capita income in Clarke County is $30,138.
What is the Median Family Income in Clarke County?
Median Family Income in Clarke County is $75,254.
What is the Median Household income in Clarke County?
Median Household Income in Clarke County is $48,692.
What is Income or Wage Gap in Clarke County?
Income or Wage Gap in Clarke County is 20.5%.
Women in Clarke County earn 79.5 cents for every dollar earned by a man.
What is Family Income Deficit in Clarke County?
Family Income Deficit in Clarke County is $10,350.
Families that are below poverty line in Clarke County earn $10,350 less on average than the poverty threshold level.
What is Inequality or Gini Index in Clarke County?
Inequality or Gini Index in Clarke County is 0.51.
How Large is the Labor Force in Clarke County?
There are 67,265 People in the Labor Forcein in Clarke County.
What is the Percentage of People in the Labor Force in Clarke County?
61.6% of People are in the Labor Force in Clarke County.
What is the Unemployment Rate in Clarke County?
Unemployment Rate in Clarke County is 5.3%.