Cobb County, GA
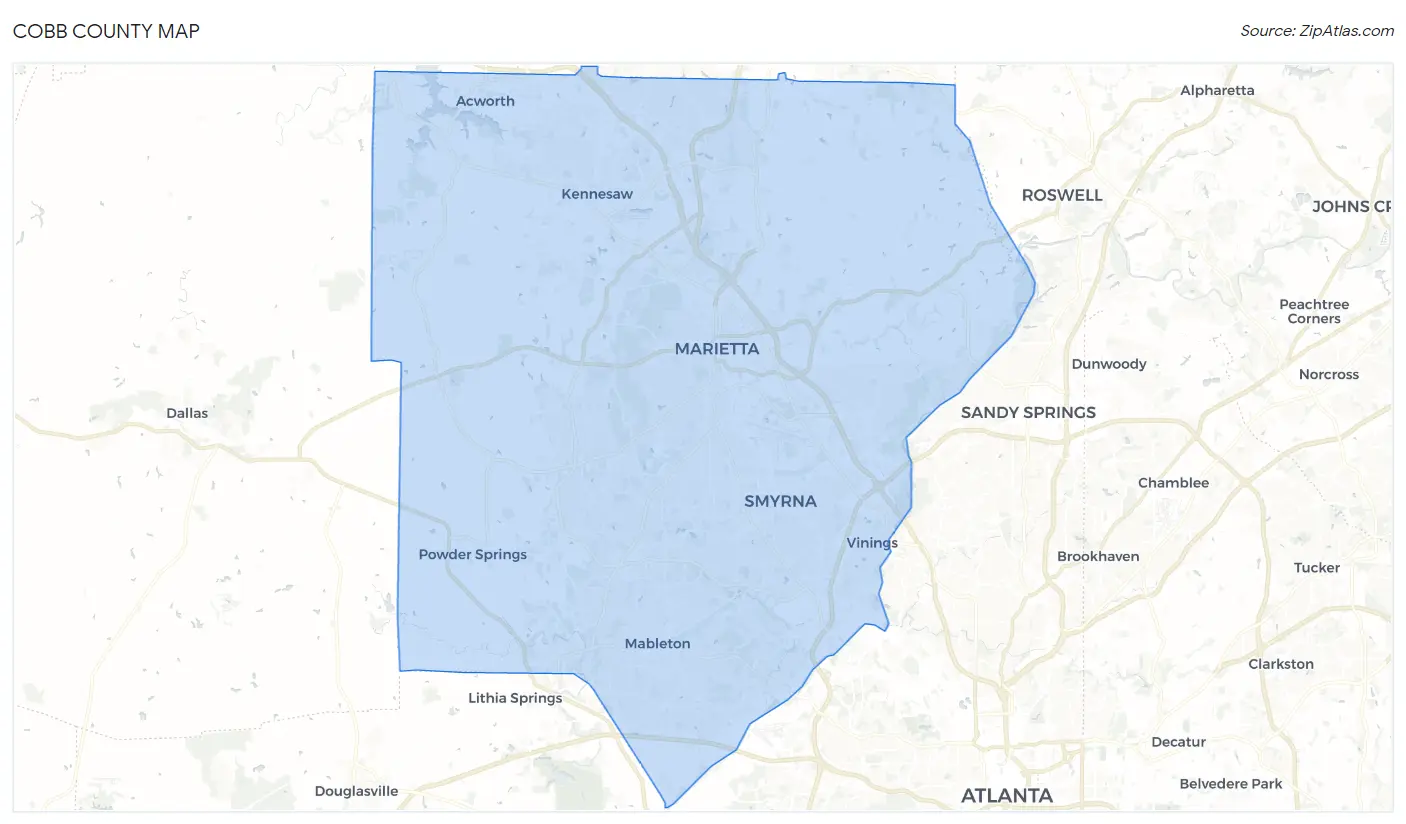
Cobb County Map
Cobb County Overview
765,813
TOTAL POPULATION
373,782
MALE POPULATION
392,031
FEMALE POPULATION
95.35
MALES / 100 FEMALES
104.88
FEMALES / 100 MALES
37.2
MEDIAN AGE
3.1
AVG FAMILY SIZE
2.6
AVG HOUSEHOLD SIZE
$48,510
PER CAPITA INCOME
$114,362
AVG FAMILY INCOME
$94,244
AVG HOUSEHOLD INCOME
22.3%
WAGE / INCOME GAP [ % ]
77.7¢/ $1
WAGE / INCOME GAP [ $ ]
$10,676
FAMILY INCOME DEFICIT
0.44
INEQUALITY / GINI INDEX
430,547
LABOR FORCE [ PEOPLE ]
70.3%
PERCENT IN LABOR FORCE
4.6%
UNEMPLOYMENT RATE
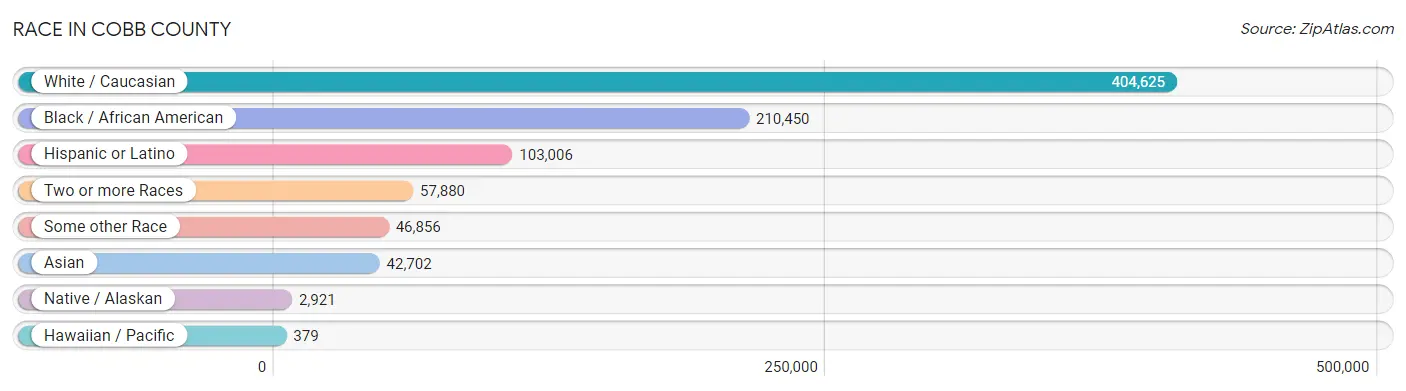
Race in Cobb County
The most populous races in Cobb County are White / Caucasian (404,625 | 52.8%), Black / African American (210,450 | 27.5%), and Hispanic or Latino (103,006 | 13.5%).
| Race | # Population | % Population |
| Asian | 42,702 | 5.6% |
| Black / African American | 210,450 | 27.5% |
| Hawaiian / Pacific | 379 | 0.1% |
| Hispanic or Latino | 103,006 | 13.5% |
| Native / Alaskan | 2,921 | 0.4% |
| White / Caucasian | 404,625 | 52.8% |
| Two or more Races | 57,880 | 7.6% |
| Some other Race | 46,856 | 6.1% |
| Total | 765,813 | 100.0% |
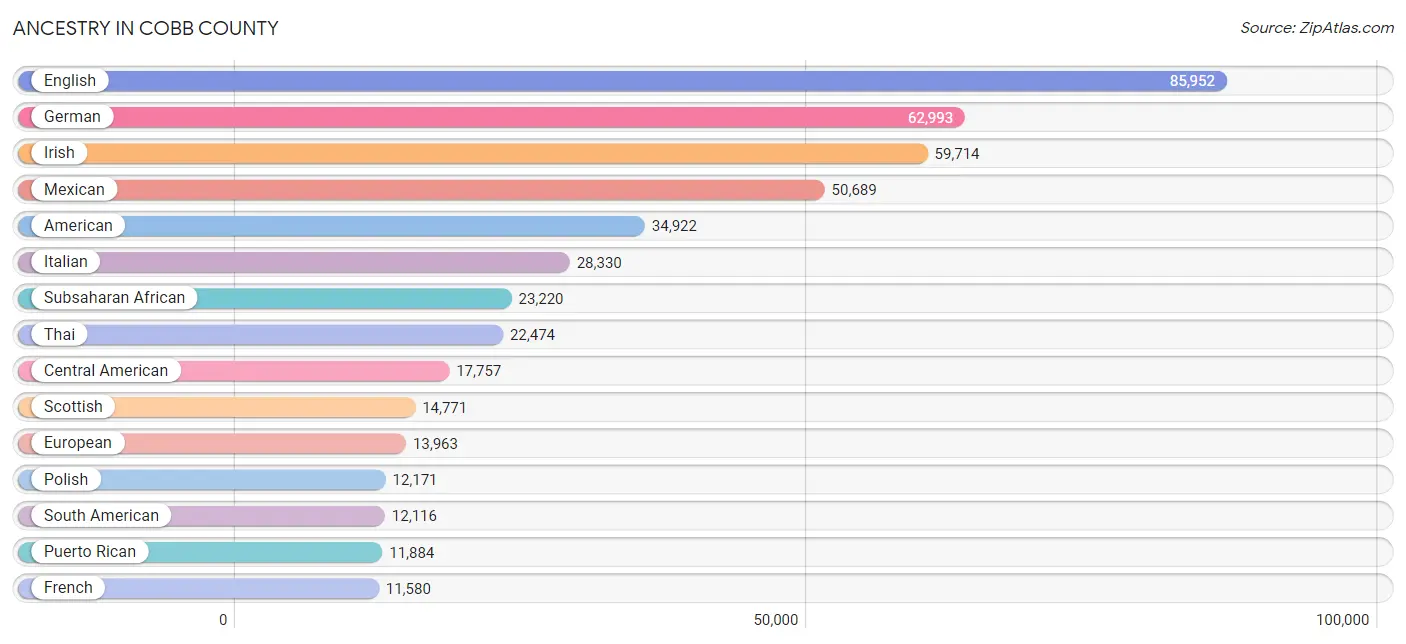
Ancestry in Cobb County
The most populous ancestries reported in Cobb County are English (85,952 | 11.2%), German (62,993 | 8.2%), Irish (59,714 | 7.8%), Mexican (50,689 | 6.6%), and American (34,922 | 4.6%), together accounting for 38.4% of all Cobb County residents.
| Ancestry | # Population | % Population |
| African | 8,995 | 1.2% |
| Alaska Native | 113 | 0.0% |
| Alaskan Athabascan | 8 | 0.0% |
| Albanian | 280 | 0.0% |
| American | 34,922 | 4.6% |
| Apache | 35 | 0.0% |
| Arab | 4,331 | 0.6% |
| Argentinean | 801 | 0.1% |
| Armenian | 506 | 0.1% |
| Australian | 351 | 0.1% |
| Austrian | 997 | 0.1% |
| Bahamian | 591 | 0.1% |
| Barbadian | 147 | 0.0% |
| Basque | 50 | 0.0% |
| Belgian | 465 | 0.1% |
| Belizean | 165 | 0.0% |
| Bermudan | 34 | 0.0% |
| Bhutanese | 1,964 | 0.3% |
| Blackfeet | 303 | 0.0% |
| Bolivian | 246 | 0.0% |
| Brazilian | 6,906 | 0.9% |
| British | 5,795 | 0.8% |
| British West Indian | 1,100 | 0.1% |
| Bulgarian | 461 | 0.1% |
| Burmese | 4,828 | 0.6% |
| Cajun | 74 | 0.0% |
| Cambodian | 5 | 0.0% |
| Canadian | 1,385 | 0.2% |
| Cape Verdean | 542 | 0.1% |
| Celtic | 91 | 0.0% |
| Central American | 17,757 | 2.3% |
| Central American Indian | 1,686 | 0.2% |
| Cherokee | 2,303 | 0.3% |
| Cheyenne | 19 | 0.0% |
| Chickasaw | 2 | 0.0% |
| Chilean | 520 | 0.1% |
| Chippewa | 26 | 0.0% |
| Choctaw | 146 | 0.0% |
| Colombian | 3,727 | 0.5% |
| Costa Rican | 495 | 0.1% |
| Creek | 93 | 0.0% |
| Croatian | 574 | 0.1% |
| Crow | 32 | 0.0% |
| Cuban | 3,842 | 0.5% |
| Czech | 1,527 | 0.2% |
| Czechoslovakian | 499 | 0.1% |
| Danish | 1,487 | 0.2% |
| Delaware | 45 | 0.0% |
| Dominican | 1,914 | 0.3% |
| Dutch | 4,662 | 0.6% |
| Eastern European | 2,628 | 0.3% |
| Ecuadorian | 498 | 0.1% |
| Egyptian | 739 | 0.1% |
| English | 85,952 | 11.2% |
| Estonian | 7 | 0.0% |
| Ethiopian | 1,698 | 0.2% |
| European | 13,963 | 1.8% |
| Fijian | 18 | 0.0% |
| Filipino | 523 | 0.1% |
| Finnish | 835 | 0.1% |
| French | 11,580 | 1.5% |
| French American Indian | 22 | 0.0% |
| French Canadian | 1,735 | 0.2% |
| German | 62,993 | 8.2% |
| German Russian | 26 | 0.0% |
| Ghanaian | 966 | 0.1% |
| Greek | 2,423 | 0.3% |
| Guamanian / Chamorro | 99 | 0.0% |
| Guatemalan | 5,309 | 0.7% |
| Guyanese | 618 | 0.1% |
| Haitian | 6,009 | 0.8% |
| Honduran | 3,881 | 0.5% |
| Hungarian | 1,804 | 0.2% |
| Icelander | 208 | 0.0% |
| Indian (Asian) | 6,407 | 0.8% |
| Indonesian | 65 | 0.0% |
| Inupiat | 31 | 0.0% |
| Iranian | 2,191 | 0.3% |
| Iraqi | 113 | 0.0% |
| Irish | 59,714 | 7.8% |
| Iroquois | 57 | 0.0% |
| Israeli | 330 | 0.0% |
| Italian | 28,330 | 3.7% |
| Jamaican | 6,303 | 0.8% |
| Japanese | 713 | 0.1% |
| Jordanian | 18 | 0.0% |
| Kenyan | 850 | 0.1% |
| Korean | 4,179 | 0.5% |
| Laotian | 269 | 0.0% |
| Latvian | 168 | 0.0% |
| Lebanese | 1,184 | 0.2% |
| Liberian | 184 | 0.0% |
| Lithuanian | 1,295 | 0.2% |
| Lumbee | 52 | 0.0% |
| Luxembourger | 22 | 0.0% |
| Macedonian | 43 | 0.0% |
| Malaysian | 516 | 0.1% |
| Maltese | 27 | 0.0% |
| Mexican | 50,689 | 6.6% |
| Mexican American Indian | 848 | 0.1% |
| Mongolian | 123 | 0.0% |
| Moroccan | 309 | 0.0% |
| Native Hawaiian | 503 | 0.1% |
| Navajo | 35 | 0.0% |
| New Zealander | 5 | 0.0% |
| Nicaraguan | 1,053 | 0.1% |
| Nigerian | 5,995 | 0.8% |
| Northern European | 1,079 | 0.1% |
| Norwegian | 3,335 | 0.4% |
| Okinawan | 46 | 0.0% |
| Pakistani | 682 | 0.1% |
| Palestinian | 1,002 | 0.1% |
| Panamanian | 664 | 0.1% |
| Paraguayan | 116 | 0.0% |
| Pennsylvania German | 114 | 0.0% |
| Peruvian | 1,469 | 0.2% |
| Polish | 12,171 | 1.6% |
| Portuguese | 2,971 | 0.4% |
| Potawatomi | 8 | 0.0% |
| Pueblo | 46 | 0.0% |
| Puerto Rican | 11,884 | 1.5% |
| Romanian | 618 | 0.1% |
| Russian | 4,673 | 0.6% |
| Salvadoran | 6,355 | 0.8% |
| Samoan | 20 | 0.0% |
| Scandinavian | 1,513 | 0.2% |
| Scotch-Irish | 8,504 | 1.1% |
| Scottish | 14,771 | 1.9% |
| Seminole | 118 | 0.0% |
| Senegalese | 55 | 0.0% |
| Serbian | 330 | 0.0% |
| Sierra Leonean | 238 | 0.0% |
| Sioux | 93 | 0.0% |
| Slavic | 205 | 0.0% |
| Slovak | 868 | 0.1% |
| Slovene | 115 | 0.0% |
| Somali | 24 | 0.0% |
| South African | 629 | 0.1% |
| South American | 12,116 | 1.6% |
| South American Indian | 46 | 0.0% |
| Spaniard | 1,143 | 0.2% |
| Spanish | 1,067 | 0.1% |
| Spanish American | 60 | 0.0% |
| Sri Lankan | 4,704 | 0.6% |
| Subsaharan African | 23,220 | 3.0% |
| Sudanese | 19 | 0.0% |
| Swedish | 4,590 | 0.6% |
| Swiss | 1,646 | 0.2% |
| Syrian | 212 | 0.0% |
| Thai | 22,474 | 2.9% |
| Tongan | 19 | 0.0% |
| Trinidadian and Tobagonian | 917 | 0.1% |
| Turkish | 450 | 0.1% |
| U.S. Virgin Islander | 27 | 0.0% |
| Ugandan | 48 | 0.0% |
| Ukrainian | 1,445 | 0.2% |
| Uruguayan | 229 | 0.0% |
| Venezuelan | 4,000 | 0.5% |
| Vietnamese | 260 | 0.0% |
| Welsh | 3,961 | 0.5% |
| West Indian | 1,970 | 0.3% |
| Yaqui | 13 | 0.0% |
| Yugoslavian | 162 | 0.0% |
| Zimbabwean | 93 | 0.0% | View All 164 Rows |
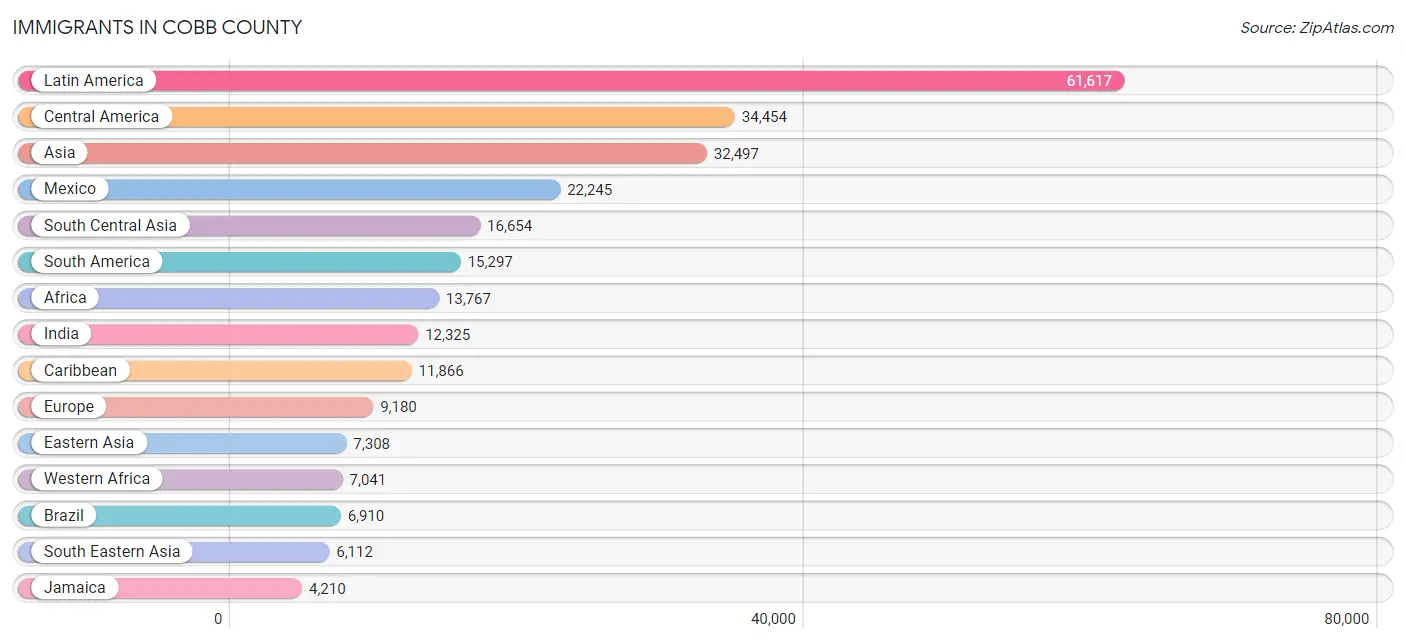
Immigrants in Cobb County
The most numerous immigrant groups reported in Cobb County came from Latin America (61,617 | 8.1%), Central America (34,454 | 4.5%), Asia (32,497 | 4.2%), Mexico (22,245 | 2.9%), and South Central Asia (16,654 | 2.2%), together accounting for 21.9% of all Cobb County residents.
| Immigration Origin | # Population | % Population |
| Afghanistan | 261 | 0.0% |
| Africa | 13,767 | 1.8% |
| Albania | 135 | 0.0% |
| Argentina | 478 | 0.1% |
| Armenia | 18 | 0.0% |
| Asia | 32,497 | 4.2% |
| Australia | 110 | 0.0% |
| Austria | 90 | 0.0% |
| Bahamas | 576 | 0.1% |
| Bangladesh | 245 | 0.0% |
| Barbados | 115 | 0.0% |
| Belarus | 31 | 0.0% |
| Belgium | 147 | 0.0% |
| Belize | 38 | 0.0% |
| Bolivia | 163 | 0.0% |
| Bosnia and Herzegovina | 166 | 0.0% |
| Brazil | 6,910 | 0.9% |
| Bulgaria | 455 | 0.1% |
| Cambodia | 153 | 0.0% |
| Cameroon | 915 | 0.1% |
| Canada | 2,211 | 0.3% |
| Caribbean | 11,866 | 1.5% |
| Central America | 34,454 | 4.5% |
| Chile | 260 | 0.0% |
| China | 4,175 | 0.5% |
| Colombia | 1,884 | 0.3% |
| Congo | 72 | 0.0% |
| Costa Rica | 285 | 0.0% |
| Croatia | 195 | 0.0% |
| Cuba | 1,171 | 0.2% |
| Czechoslovakia | 299 | 0.0% |
| Denmark | 73 | 0.0% |
| Dominica | 130 | 0.0% |
| Dominican Republic | 542 | 0.1% |
| Eastern Africa | 3,976 | 0.5% |
| Eastern Asia | 7,308 | 0.9% |
| Eastern Europe | 3,613 | 0.5% |
| Ecuador | 452 | 0.1% |
| Egypt | 320 | 0.0% |
| El Salvador | 3,699 | 0.5% |
| England | 780 | 0.1% |
| Eritrea | 698 | 0.1% |
| Ethiopia | 709 | 0.1% |
| Europe | 9,180 | 1.2% |
| France | 465 | 0.1% |
| Germany | 1,335 | 0.2% |
| Ghana | 1,131 | 0.2% |
| Greece | 45 | 0.0% |
| Grenada | 30 | 0.0% |
| Guatemala | 3,934 | 0.5% |
| Guyana | 751 | 0.1% |
| Haiti | 3,528 | 0.5% |
| Honduras | 3,292 | 0.4% |
| Hong Kong | 213 | 0.0% |
| Hungary | 60 | 0.0% |
| India | 12,325 | 1.6% |
| Indonesia | 103 | 0.0% |
| Iran | 1,494 | 0.2% |
| Iraq | 90 | 0.0% |
| Ireland | 170 | 0.0% |
| Israel | 325 | 0.0% |
| Italy | 295 | 0.0% |
| Jamaica | 4,210 | 0.5% |
| Japan | 570 | 0.1% |
| Jordan | 234 | 0.0% |
| Kazakhstan | 45 | 0.0% |
| Kenya | 1,555 | 0.2% |
| Korea | 2,558 | 0.3% |
| Kuwait | 246 | 0.0% |
| Laos | 301 | 0.0% |
| Latin America | 61,617 | 8.1% |
| Latvia | 71 | 0.0% |
| Lebanon | 380 | 0.1% |
| Liberia | 228 | 0.0% |
| Lithuania | 85 | 0.0% |
| Malaysia | 150 | 0.0% |
| Mexico | 22,245 | 2.9% |
| Micronesia | 2 | 0.0% |
| Middle Africa | 1,060 | 0.1% |
| Moldova | 205 | 0.0% |
| Morocco | 168 | 0.0% |
| Nepal | 334 | 0.0% |
| Netherlands | 193 | 0.0% |
| Nicaragua | 637 | 0.1% |
| Nigeria | 4,082 | 0.5% |
| North Macedonia | 35 | 0.0% |
| Northern Africa | 695 | 0.1% |
| Northern Europe | 2,614 | 0.3% |
| Norway | 29 | 0.0% |
| Oceania | 159 | 0.0% |
| Pakistan | 1,744 | 0.2% |
| Panama | 324 | 0.0% |
| Peru | 1,216 | 0.2% |
| Philippines | 1,721 | 0.2% |
| Poland | 370 | 0.1% |
| Portugal | 93 | 0.0% |
| Romania | 109 | 0.0% |
| Russia | 648 | 0.1% |
| Saudi Arabia | 126 | 0.0% |
| Scotland | 111 | 0.0% |
| Senegal | 97 | 0.0% |
| Serbia | 100 | 0.0% |
| Sierra Leone | 122 | 0.0% |
| Singapore | 85 | 0.0% |
| South Africa | 726 | 0.1% |
| South America | 15,297 | 2.0% |
| South Central Asia | 16,654 | 2.2% |
| South Eastern Asia | 6,112 | 0.8% |
| Southern Europe | 666 | 0.1% |
| Spain | 217 | 0.0% |
| Sri Lanka | 133 | 0.0% |
| St. Vincent and the Grenadines | 51 | 0.0% |
| Sudan | 9 | 0.0% |
| Sweden | 129 | 0.0% |
| Switzerland | 47 | 0.0% |
| Syria | 86 | 0.0% |
| Taiwan | 772 | 0.1% |
| Thailand | 493 | 0.1% |
| Trinidad and Tobago | 951 | 0.1% |
| Turkey | 448 | 0.1% |
| Uganda | 235 | 0.0% |
| Ukraine | 440 | 0.1% |
| Uruguay | 230 | 0.0% |
| Uzbekistan | 73 | 0.0% |
| Venezuela | 2,891 | 0.4% |
| Vietnam | 3,035 | 0.4% |
| Western Africa | 7,041 | 0.9% |
| Western Asia | 2,281 | 0.3% |
| Western Europe | 2,277 | 0.3% |
| Zaire | 28 | 0.0% |
| Zimbabwe | 168 | 0.0% | View All 131 Rows |
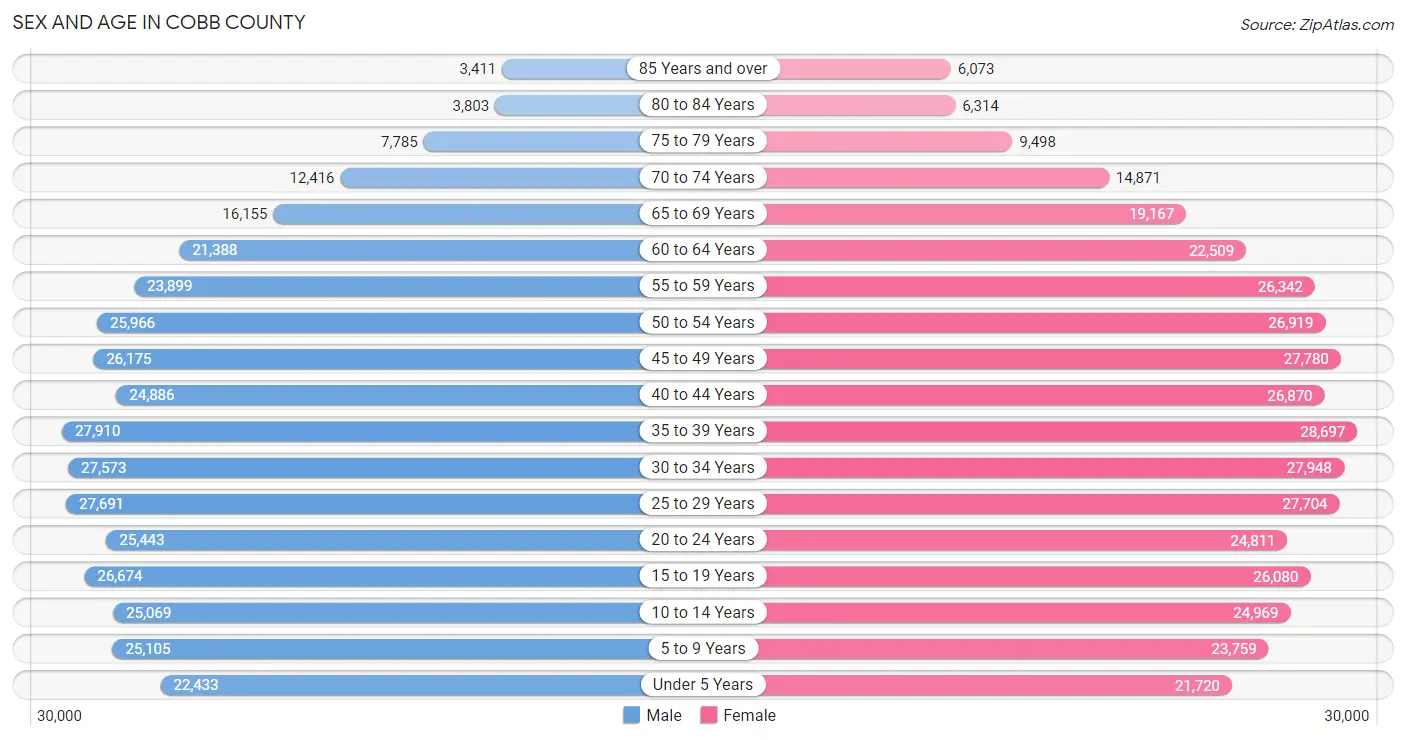
Sex and Age in Cobb County
Sex and Age in Cobb County
The most populous age groups in Cobb County are 35 to 39 Years (27,910 | 7.5%) for men and 35 to 39 Years (28,697 | 7.3%) for women.
| Age Bracket | Male | Female |
| Under 5 Years | 22,433 (6.0%) | 21,720 (5.5%) |
| 5 to 9 Years | 25,105 (6.7%) | 23,759 (6.1%) |
| 10 to 14 Years | 25,069 (6.7%) | 24,969 (6.4%) |
| 15 to 19 Years | 26,674 (7.1%) | 26,080 (6.7%) |
| 20 to 24 Years | 25,443 (6.8%) | 24,811 (6.3%) |
| 25 to 29 Years | 27,691 (7.4%) | 27,704 (7.1%) |
| 30 to 34 Years | 27,573 (7.4%) | 27,948 (7.1%) |
| 35 to 39 Years | 27,910 (7.5%) | 28,697 (7.3%) |
| 40 to 44 Years | 24,886 (6.7%) | 26,870 (6.9%) |
| 45 to 49 Years | 26,175 (7.0%) | 27,780 (7.1%) |
| 50 to 54 Years | 25,966 (7.0%) | 26,919 (6.9%) |
| 55 to 59 Years | 23,899 (6.4%) | 26,342 (6.7%) |
| 60 to 64 Years | 21,388 (5.7%) | 22,509 (5.7%) |
| 65 to 69 Years | 16,155 (4.3%) | 19,167 (4.9%) |
| 70 to 74 Years | 12,416 (3.3%) | 14,871 (3.8%) |
| 75 to 79 Years | 7,785 (2.1%) | 9,498 (2.4%) |
| 80 to 84 Years | 3,803 (1.0%) | 6,314 (1.6%) |
| 85 Years and over | 3,411 (0.9%) | 6,073 (1.5%) |
| Total | 373,782 (100.0%) | 392,031 (100.0%) |
Families and Households in Cobb County
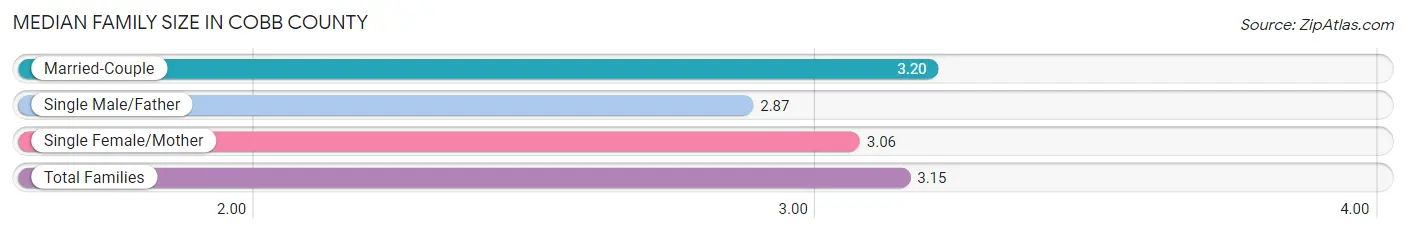
Median Family Size in Cobb County
The median family size in Cobb County is 3.15 persons per family, with married-couple families (145,088 | 74.6%) accounting for the largest median family size of 3.2 persons per family. On the other hand, single male/father families (12,713 | 6.5%) represent the smallest median family size with 2.87 persons per family.
| Family Type | # Families | Family Size |
| Married-Couple | 145,088 (74.6%) | 3.20 |
| Single Male/Father | 12,713 (6.5%) | 2.87 |
| Single Female/Mother | 36,703 (18.9%) | 3.06 |
| Total Families | 194,504 (100.0%) | 3.15 |
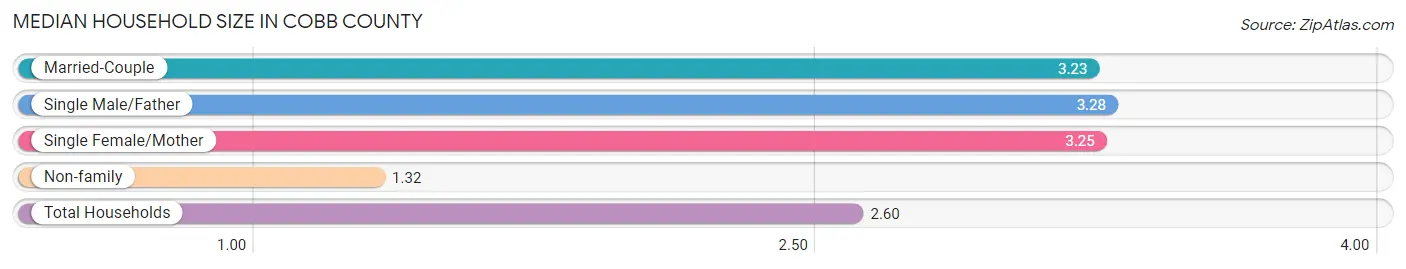
Median Household Size in Cobb County
The median household size in Cobb County is 2.60 persons per household, with single male/father households (12,713 | 4.4%) accounting for the largest median household size of 3.28 persons per household. non-family households (96,667 | 33.2%) represent the smallest median household size with 1.32 persons per household.
| Household Type | # Households | Household Size |
| Married-Couple | 145,088 (49.8%) | 3.23 |
| Single Male/Father | 12,713 (4.4%) | 3.28 |
| Single Female/Mother | 36,703 (12.6%) | 3.25 |
| Non-family | 96,667 (33.2%) | 1.32 |
| Total Households | 291,171 (100.0%) | 2.60 |
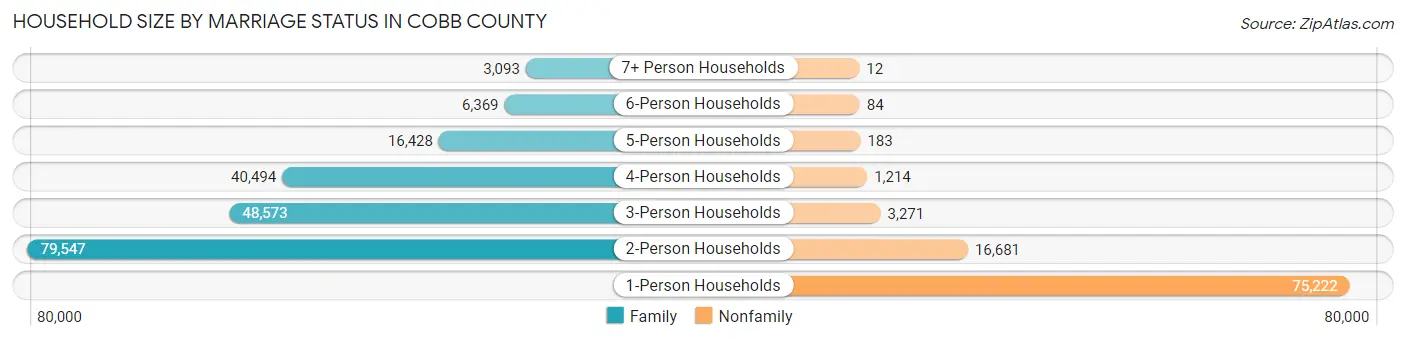
Household Size by Marriage Status in Cobb County
Out of a total of 291,171 households in Cobb County, 194,504 (66.8%) are family households, while 96,667 (33.2%) are nonfamily households. The most numerous type of family households are 2-person households, comprising 79,547, and the most common type of nonfamily households are 1-person households, comprising 75,222.
| Household Size | Family Households | Nonfamily Households |
| 1-Person Households | - | 75,222 (25.8%) |
| 2-Person Households | 79,547 (27.3%) | 16,681 (5.7%) |
| 3-Person Households | 48,573 (16.7%) | 3,271 (1.1%) |
| 4-Person Households | 40,494 (13.9%) | 1,214 (0.4%) |
| 5-Person Households | 16,428 (5.6%) | 183 (0.1%) |
| 6-Person Households | 6,369 (2.2%) | 84 (0.0%) |
| 7+ Person Households | 3,093 (1.1%) | 12 (0.0%) |
| Total | 194,504 (66.8%) | 96,667 (33.2%) |
Female Fertility in Cobb County
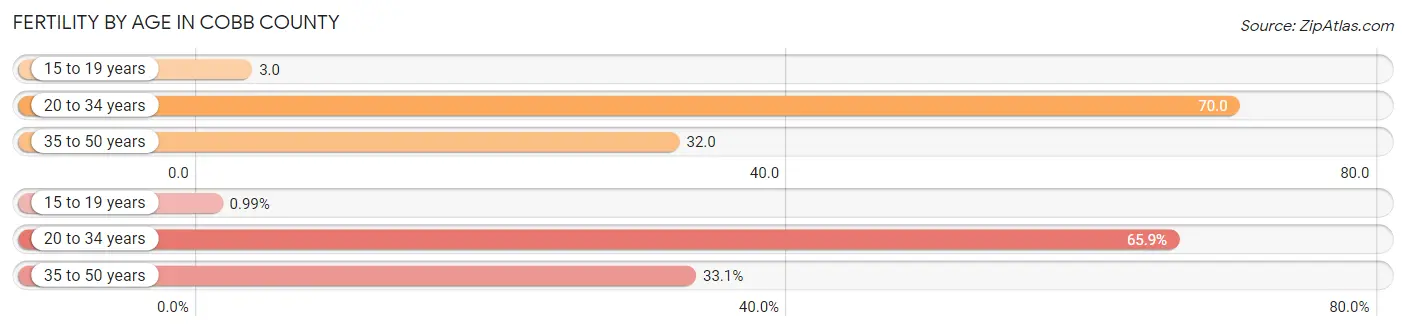
Fertility by Age in Cobb County
Average fertility rate in Cobb County is 44.0 births per 1,000 women. Women in the age bracket of 20 to 34 years have the highest fertility rate with 70.0 births per 1,000 women. Women in the age bracket of 20 to 34 years acount for 65.9% of all women with births.
| Age Bracket | Women with Births | Births / 1,000 Women |
| 15 to 19 years | 85 (1.0%) | 3.0 |
| 20 to 34 years | 5,670 (65.9%) | 70.0 |
| 35 to 50 years | 2,850 (33.1%) | 32.0 |
| Total | 8,605 (100.0%) | 44.0 |
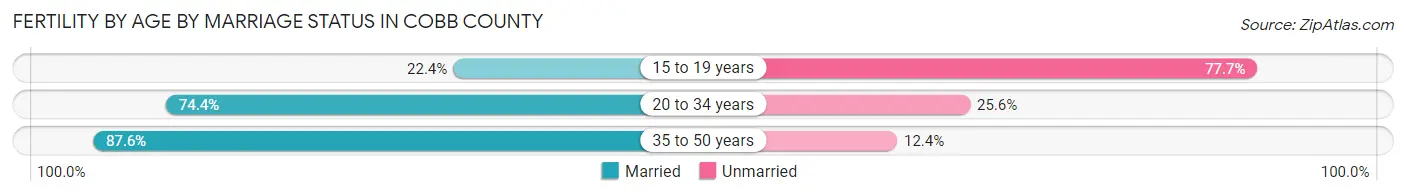
Fertility by Age by Marriage Status in Cobb County
78.3% of women with births (8,605) in Cobb County are married. The highest percentage of unmarried women with births falls into 15 to 19 years age bracket with 77.6% of them unmarried at the time of birth, while the lowest percentage of unmarried women with births belong to 35 to 50 years age bracket with 12.4% of them unmarried.
| Age Bracket | Married | Unmarried |
| 15 to 19 years | 19 (22.4%) | 66 (77.6%) |
| 20 to 34 years | 4,218 (74.4%) | 1,452 (25.6%) |
| 35 to 50 years | 2,497 (87.6%) | 353 (12.4%) |
| Total | 6,738 (78.3%) | 1,867 (21.7%) |
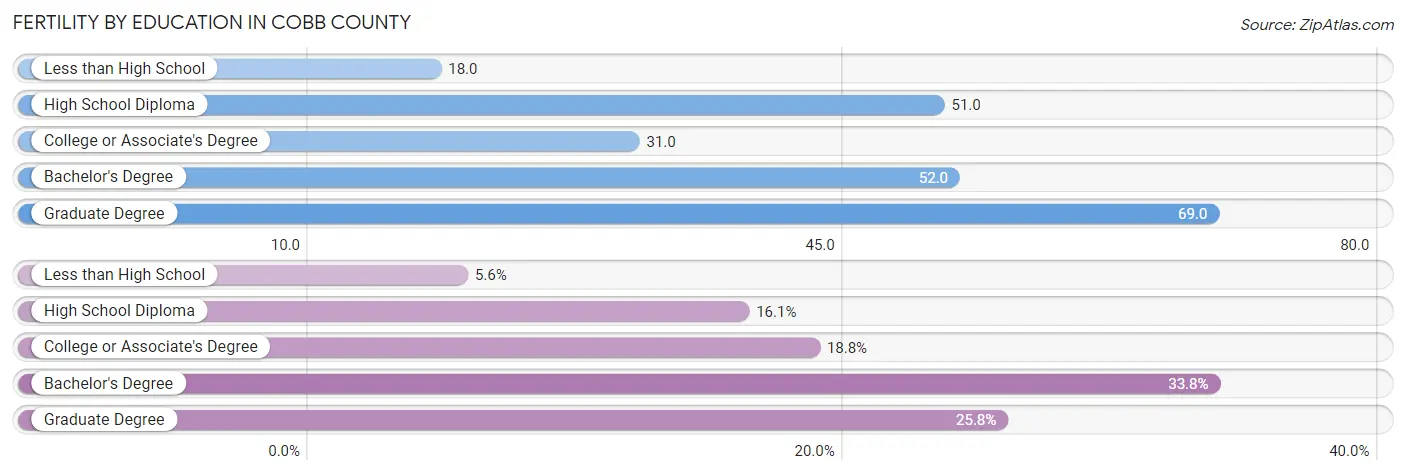
Fertility by Education in Cobb County
Average fertility rate in Cobb County is 44.0 births per 1,000 women. Women with the education attainment of graduate degree have the highest fertility rate of 69.0 births per 1,000 women, while women with the education attainment of less than high school have the lowest fertility at 18.0 births per 1,000 women. Women with the education attainment of bachelor's degree represent 33.8% of all women with births.
| Educational Attainment | Women with Births | Births / 1,000 Women |
| Less than High School | 479 (5.6%) | 18.0 |
| High School Diploma | 1,386 (16.1%) | 51.0 |
| College or Associate's Degree | 1,614 (18.8%) | 31.0 |
| Bachelor's Degree | 2,905 (33.8%) | 52.0 |
| Graduate Degree | 2,221 (25.8%) | 69.0 |
| Total | 8,605 (100.0%) | 44.0 |
Fertility by Education by Marriage Status in Cobb County
21.7% of women with births in Cobb County are unmarried. Women with the educational attainment of graduate degree are most likely to be married with 93.3% of them married at childbirth, while women with the educational attainment of less than high school are least likely to be married with 58.3% of them unmarried at childbirth.
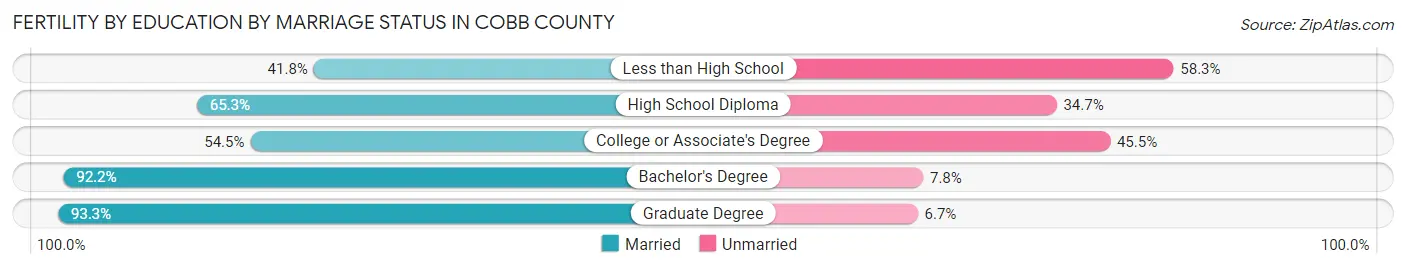
| Educational Attainment | Married | Unmarried |
| Less than High School | 200 (41.7%) | 279 (58.3%) |
| High School Diploma | 905 (65.3%) | 481 (34.7%) |
| College or Associate's Degree | 880 (54.5%) | 734 (45.5%) |
| Bachelor's Degree | 2,678 (92.2%) | 227 (7.8%) |
| Graduate Degree | 2,072 (93.3%) | 149 (6.7%) |
| Total | 6,738 (78.3%) | 1,867 (21.7%) |
Income in Cobb County
Income Overview in Cobb County
Per Capita Income in Cobb County is $48,510, while median incomes of families and households are $114,362 and $94,244 respectively.
| Characteristic | Number | Measure |
| Per Capita Income | 765,813 | $48,510 |
| Median Family Income | 194,504 | $114,362 |
| Mean Family Income | 194,504 | $147,058 |
| Median Household Income | 291,171 | $94,244 |
| Mean Household Income | 291,171 | $126,092 |
| Income Deficit | 194,504 | $10,676 |
| Wage / Income Gap (%) | 765,813 | 22.27% |
| Wage / Income Gap ($) | 765,813 | 77.73¢ per $1 |
| Gini / Inequality Index | 765,813 | 0.44 |
Earnings by Sex in Cobb County
Average Earnings in Cobb County are $49,038, $55,897 for men and $43,450 for women, a difference of 22.3%.
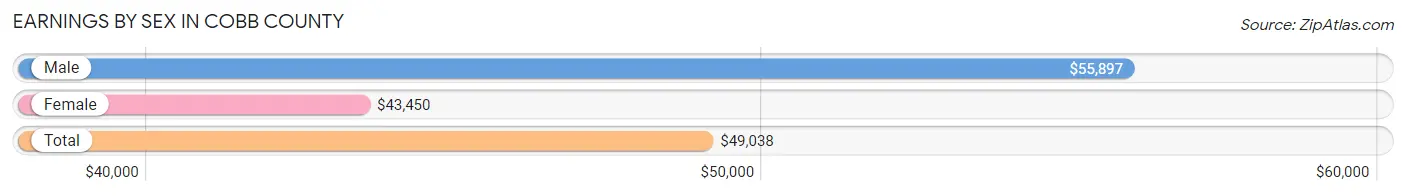
| Sex | Number | Average Earnings |
| Male | 232,218 (52.2%) | $55,897 |
| Female | 212,937 (47.8%) | $43,450 |
| Total | 445,155 (100.0%) | $49,038 |
Earnings by Sex by Income Bracket in Cobb County
The most common earnings brackets in Cobb County are $100,000+ for men (62,195 | 26.8%) and $100,000+ for women (30,824 | 14.5%).
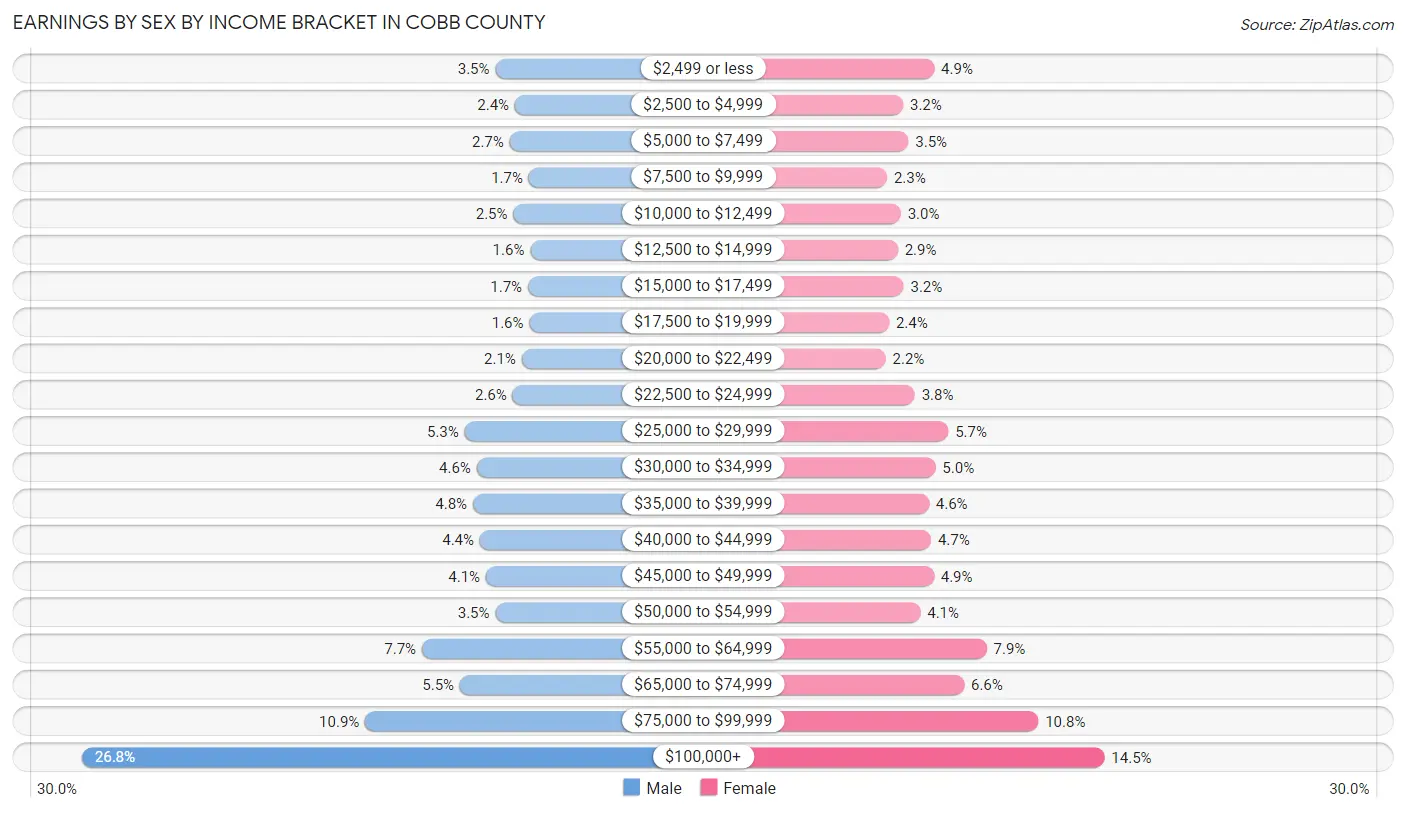
| Income | Male | Female |
| $2,499 or less | 8,232 (3.5%) | 10,459 (4.9%) |
| $2,500 to $4,999 | 5,673 (2.4%) | 6,729 (3.2%) |
| $5,000 to $7,499 | 6,354 (2.7%) | 7,372 (3.5%) |
| $7,500 to $9,999 | 3,861 (1.7%) | 4,818 (2.3%) |
| $10,000 to $12,499 | 5,876 (2.5%) | 6,458 (3.0%) |
| $12,500 to $14,999 | 3,670 (1.6%) | 6,093 (2.9%) |
| $15,000 to $17,499 | 3,966 (1.7%) | 6,791 (3.2%) |
| $17,500 to $19,999 | 3,793 (1.6%) | 5,049 (2.4%) |
| $20,000 to $22,499 | 4,793 (2.1%) | 4,650 (2.2%) |
| $22,500 to $24,999 | 5,975 (2.6%) | 8,128 (3.8%) |
| $25,000 to $29,999 | 12,237 (5.3%) | 12,145 (5.7%) |
| $30,000 to $34,999 | 10,656 (4.6%) | 10,611 (5.0%) |
| $35,000 to $39,999 | 11,155 (4.8%) | 9,818 (4.6%) |
| $40,000 to $44,999 | 10,231 (4.4%) | 10,080 (4.7%) |
| $45,000 to $49,999 | 9,455 (4.1%) | 10,413 (4.9%) |
| $50,000 to $54,999 | 8,210 (3.5%) | 8,794 (4.1%) |
| $55,000 to $64,999 | 17,821 (7.7%) | 16,746 (7.9%) |
| $65,000 to $74,999 | 12,837 (5.5%) | 14,043 (6.6%) |
| $75,000 to $99,999 | 25,228 (10.9%) | 22,916 (10.8%) |
| $100,000+ | 62,195 (26.8%) | 30,824 (14.5%) |
| Total | 232,218 (100.0%) | 212,937 (100.0%) |
Earnings by Sex by Educational Attainment in Cobb County
Average earnings in Cobb County are $64,349 for men and $49,769 for women, a difference of 22.7%. Men with an educational attainment of graduate degree enjoy the highest average annual earnings of $114,496, while those with less than high school education earn the least with $34,288. Women with an educational attainment of graduate degree earn the most with the average annual earnings of $75,909, while those with less than high school education have the smallest earnings of $25,152.
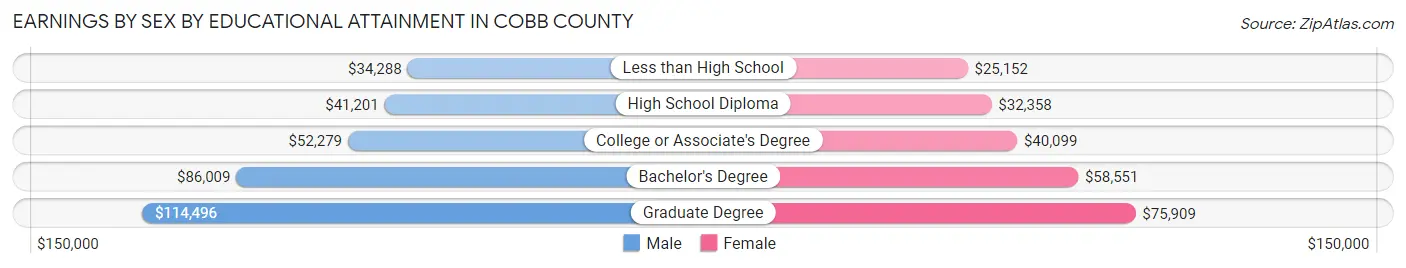
| Educational Attainment | Male Income | Female Income |
| Less than High School | $34,288 | $25,152 |
| High School Diploma | $41,201 | $32,358 |
| College or Associate's Degree | $52,279 | $40,099 |
| Bachelor's Degree | $86,009 | $58,551 |
| Graduate Degree | $114,496 | $75,909 |
| Total | $64,349 | $49,769 |
Family Income in Cobb County
Family Income Brackets in Cobb County
According to the Cobb County family income data, there are 42,791 families falling into the $200,000+ income range, which is the most common income bracket and makes up 22.0% of all families. Conversely, the $10,000 to $14,999 income bracket is the least frequent group with only 1,751 families (0.9%) belonging to this category.
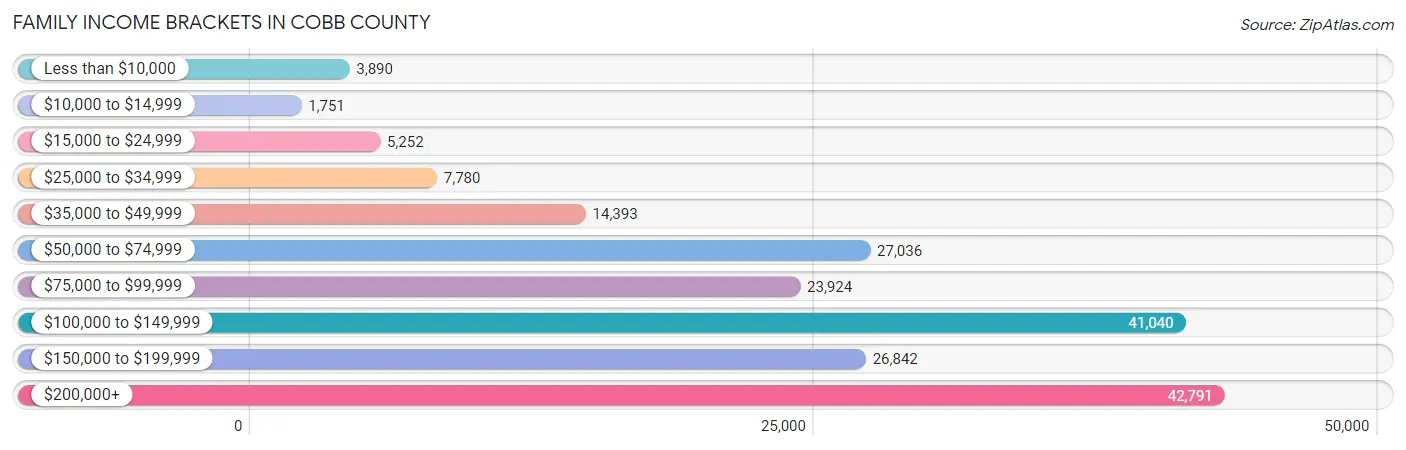
| Income Bracket | # Families | % Families |
| Less than $10,000 | 3,890 | 2.0% |
| $10,000 to $14,999 | 1,751 | 0.9% |
| $15,000 to $24,999 | 5,252 | 2.7% |
| $25,000 to $34,999 | 7,780 | 4.0% |
| $35,000 to $49,999 | 14,393 | 7.4% |
| $50,000 to $74,999 | 27,036 | 13.9% |
| $75,000 to $99,999 | 23,924 | 12.3% |
| $100,000 to $149,999 | 41,040 | 21.1% |
| $150,000 to $199,999 | 26,842 | 13.8% |
| $200,000+ | 42,791 | 22.0% |
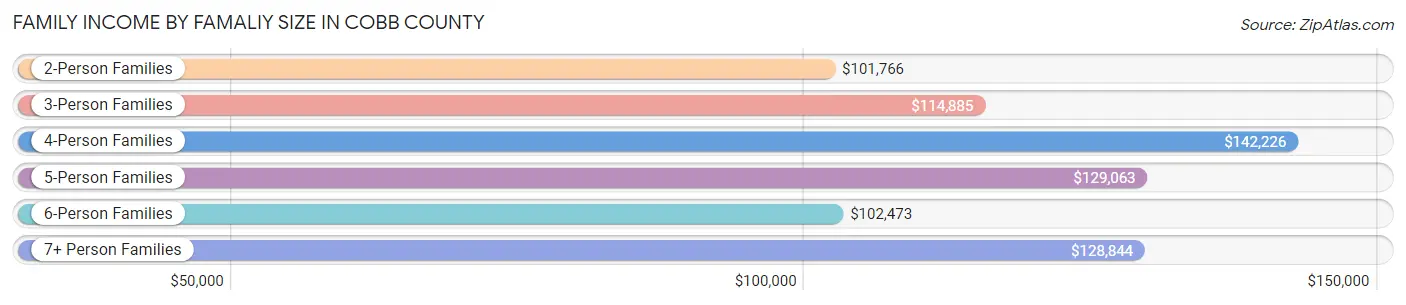
Family Income by Famaliy Size in Cobb County
4-person families (37,810 | 19.4%) account for the highest median family income in Cobb County with $142,226 per family, while 2-person families (85,080 | 43.7%) have the highest median income of $50,883 per family member.
| Income Bracket | # Families | Median Income |
| 2-Person Families | 85,080 (43.7%) | $101,766 |
| 3-Person Families | 48,036 (24.7%) | $114,885 |
| 4-Person Families | 37,810 (19.4%) | $142,226 |
| 5-Person Families | 15,452 (7.9%) | $129,063 |
| 6-Person Families | 5,422 (2.8%) | $102,473 |
| 7+ Person Families | 2,704 (1.4%) | $128,844 |
| Total | 194,504 (100.0%) | $114,362 |
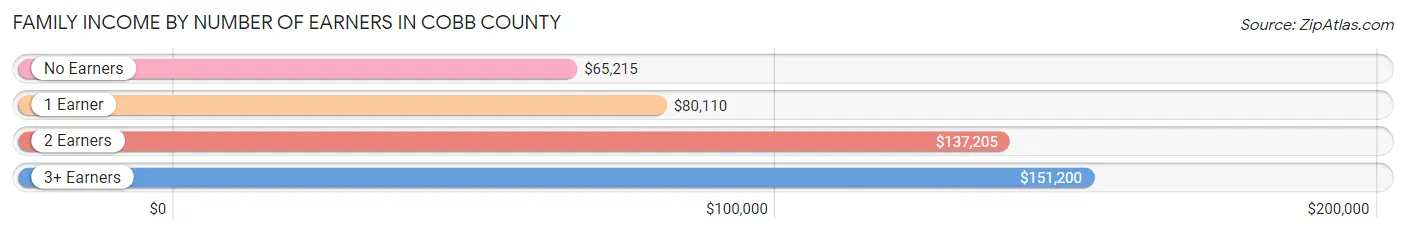
Family Income by Number of Earners in Cobb County
The median family income in Cobb County is $114,362, with families comprising 3+ earners (24,733) having the highest median family income of $151,200, while families with no earners (18,802) have the lowest median family income of $65,215, accounting for 12.7% and 9.7% of families, respectively.
| Number of Earners | # Families | Median Income |
| No Earners | 18,802 (9.7%) | $65,215 |
| 1 Earner | 58,214 (29.9%) | $80,110 |
| 2 Earners | 92,755 (47.7%) | $137,205 |
| 3+ Earners | 24,733 (12.7%) | $151,200 |
| Total | 194,504 (100.0%) | $114,362 |
Household Income in Cobb County
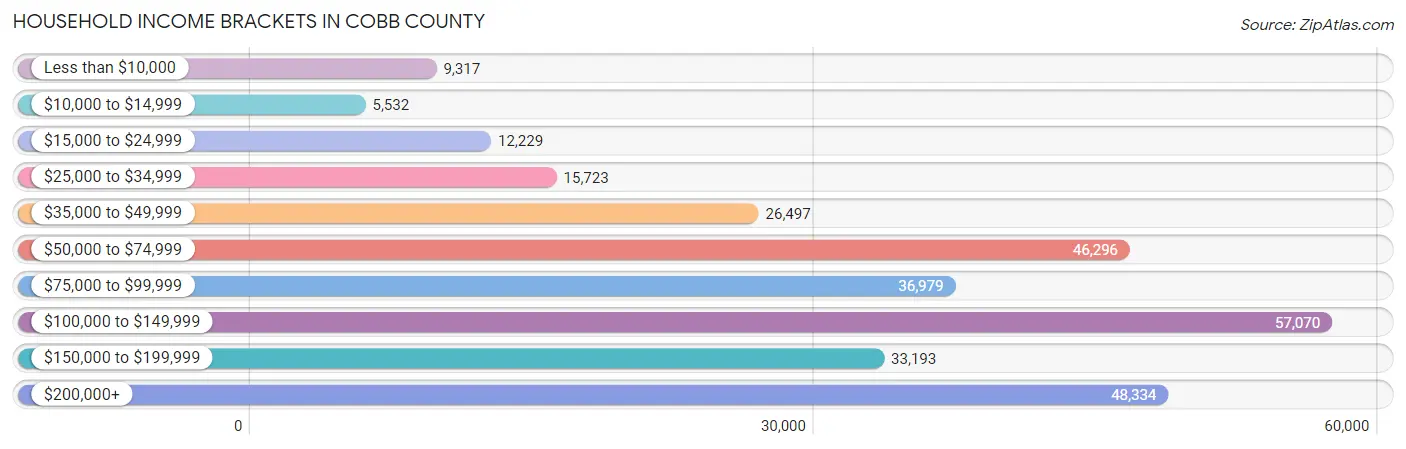
Household Income Brackets in Cobb County
With 57,070 households falling in the category, the $100,000 to $149,999 income range is the most frequent in Cobb County, accounting for 19.6% of all households. In contrast, only 5,532 households (1.9%) fall into the $10,000 to $14,999 income bracket, making it the least populous group.
| Income Bracket | # Households | % Households |
| Less than $10,000 | 9,317 | 3.2% |
| $10,000 to $14,999 | 5,532 | 1.9% |
| $15,000 to $24,999 | 12,229 | 4.2% |
| $25,000 to $34,999 | 15,723 | 5.4% |
| $35,000 to $49,999 | 26,497 | 9.1% |
| $50,000 to $74,999 | 46,296 | 15.9% |
| $75,000 to $99,999 | 36,979 | 12.7% |
| $100,000 to $149,999 | 57,070 | 19.6% |
| $150,000 to $199,999 | 33,193 | 11.4% |
| $200,000+ | 48,334 | 16.6% |
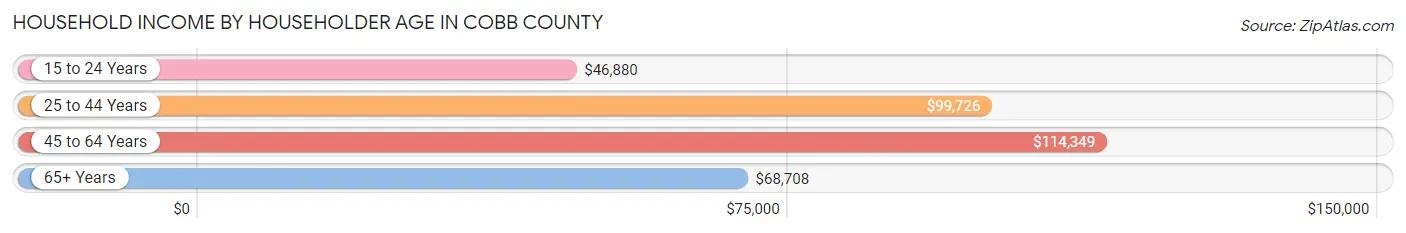
Household Income by Householder Age in Cobb County
The median household income in Cobb County is $94,244, with the highest median household income of $114,349 found in the 45 to 64 years age bracket for the primary householder. A total of 113,901 households (39.1%) fall into this category. Meanwhile, the 15 to 24 years age bracket for the primary householder has the lowest median household income of $46,880, with 11,621 households (4.0%) in this group.
| Income Bracket | # Households | Median Income |
| 15 to 24 Years | 11,621 (4.0%) | $46,880 |
| 25 to 44 Years | 106,837 (36.7%) | $99,726 |
| 45 to 64 Years | 113,901 (39.1%) | $114,349 |
| 65+ Years | 58,812 (20.2%) | $68,708 |
| Total | 291,171 (100.0%) | $94,244 |
Poverty in Cobb County
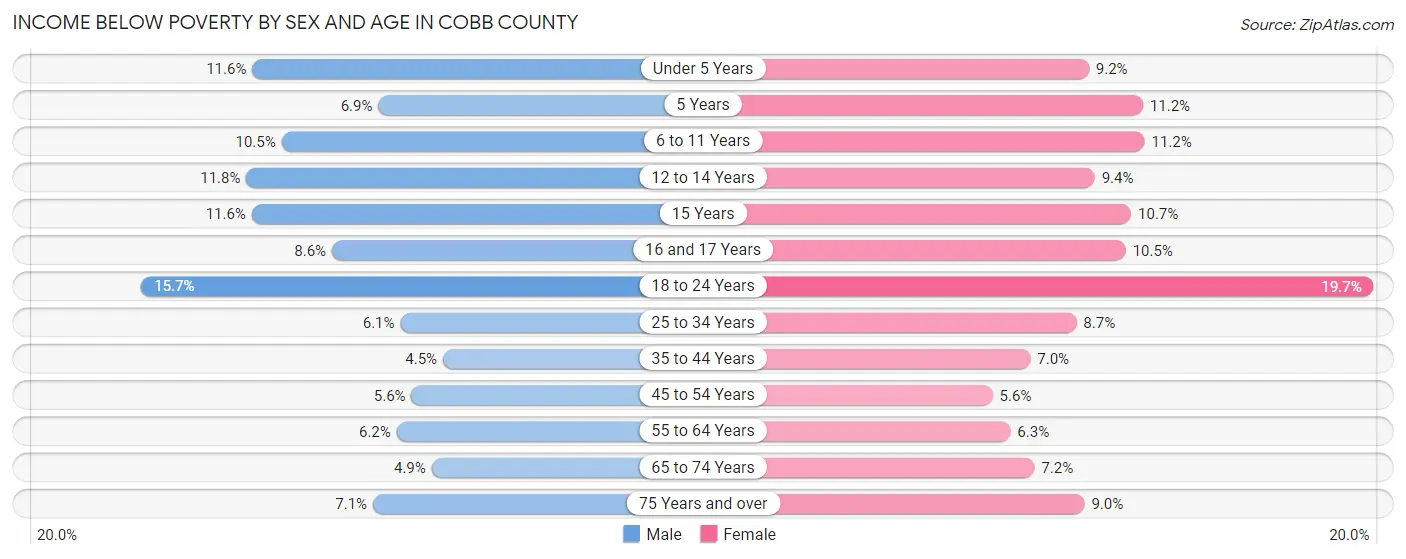
Income Below Poverty by Sex and Age in Cobb County
With 7.7% poverty level for males and 8.9% for females among the residents of Cobb County, 18 to 24 year old males and 18 to 24 year old females are the most vulnerable to poverty, with 5,191 males (15.7%) and 6,387 females (19.7%) in their respective age groups living below the poverty level.
| Age Bracket | Male | Female |
| Under 5 Years | 2,535 (11.6%) | 1,974 (9.2%) |
| 5 Years | 351 (6.9%) | 557 (11.2%) |
| 6 to 11 Years | 3,056 (10.5%) | 3,088 (11.2%) |
| 12 to 14 Years | 1,772 (11.8%) | 1,481 (9.4%) |
| 15 Years | 611 (11.6%) | 537 (10.7%) |
| 16 and 17 Years | 927 (8.6%) | 1,144 (10.5%) |
| 18 to 24 Years | 5,191 (15.7%) | 6,387 (19.7%) |
| 25 to 34 Years | 3,302 (6.0%) | 4,830 (8.7%) |
| 35 to 44 Years | 2,340 (4.5%) | 3,883 (7.0%) |
| 45 to 54 Years | 2,930 (5.6%) | 3,064 (5.6%) |
| 55 to 64 Years | 2,787 (6.2%) | 3,052 (6.3%) |
| 65 to 74 Years | 1,390 (4.9%) | 2,414 (7.1%) |
| 75 Years and over | 1,037 (7.1%) | 1,896 (9.0%) |
| Total | 28,229 (7.7%) | 34,307 (8.9%) |
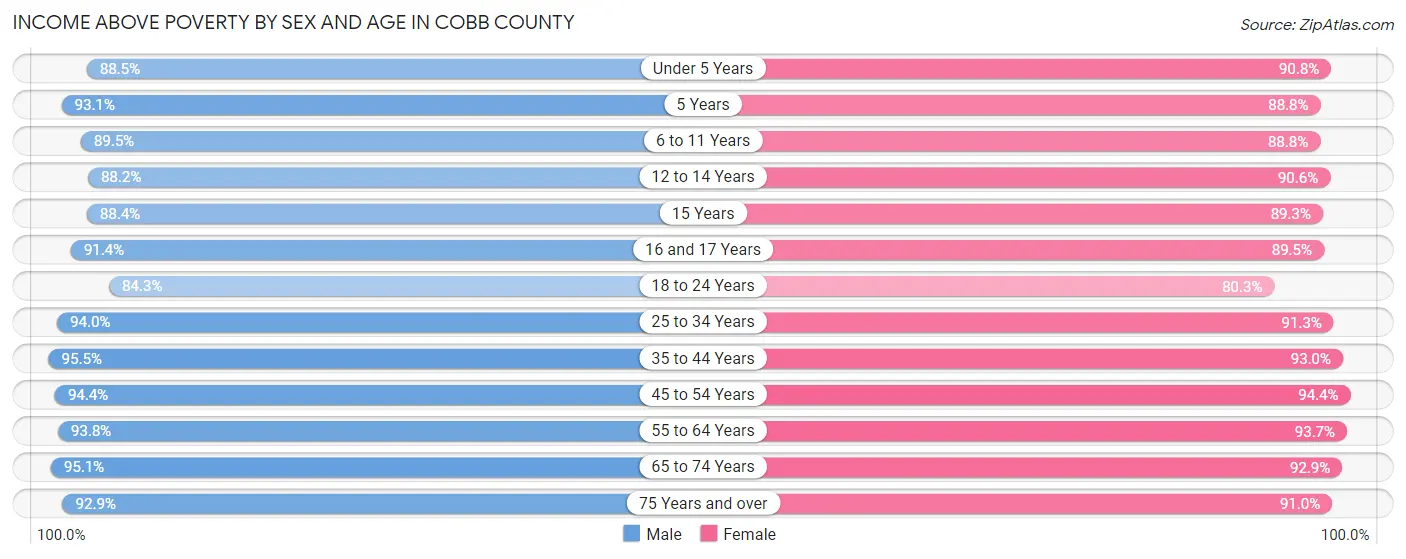
Income Above Poverty by Sex and Age in Cobb County
According to the poverty statistics in Cobb County, males aged 35 to 44 years and females aged 45 to 54 years are the age groups that are most secure financially, with 95.5% of males and 94.4% of females in these age groups living above the poverty line.
| Age Bracket | Male | Female |
| Under 5 Years | 19,404 (88.4%) | 19,541 (90.8%) |
| 5 Years | 4,756 (93.1%) | 4,423 (88.8%) |
| 6 to 11 Years | 26,150 (89.5%) | 24,391 (88.8%) |
| 12 to 14 Years | 13,288 (88.2%) | 14,285 (90.6%) |
| 15 Years | 4,669 (88.4%) | 4,461 (89.3%) |
| 16 and 17 Years | 9,868 (91.4%) | 9,715 (89.5%) |
| 18 to 24 Years | 27,936 (84.3%) | 25,961 (80.3%) |
| 25 to 34 Years | 51,308 (94.0%) | 50,636 (91.3%) |
| 35 to 44 Years | 50,059 (95.5%) | 51,618 (93.0%) |
| 45 to 54 Years | 48,988 (94.4%) | 51,605 (94.4%) |
| 55 to 64 Years | 42,265 (93.8%) | 45,699 (93.7%) |
| 65 to 74 Years | 27,014 (95.1%) | 31,349 (92.8%) |
| 75 Years and over | 13,640 (92.9%) | 19,151 (91.0%) |
| Total | 339,345 (92.3%) | 352,835 (91.1%) |
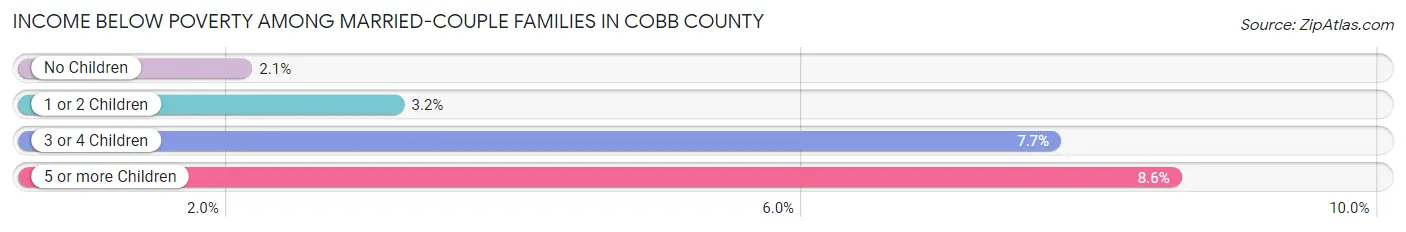
Income Below Poverty Among Married-Couple Families in Cobb County
The poverty statistics for married-couple families in Cobb County show that 2.9% or 4,256 of the total 145,088 families live below the poverty line. Families with 5 or more children have the highest poverty rate of 8.6%, comprising of 63 families. On the other hand, families with no children have the lowest poverty rate of 2.1%, which includes 1,681 families.
| Children | Above Poverty | Below Poverty |
| No Children | 78,231 (97.9%) | 1,681 (2.1%) |
| 1 or 2 Children | 52,304 (96.8%) | 1,706 (3.2%) |
| 3 or 4 Children | 9,625 (92.3%) | 806 (7.7%) |
| 5 or more Children | 672 (91.4%) | 63 (8.6%) |
| Total | 140,832 (97.1%) | 4,256 (2.9%) |
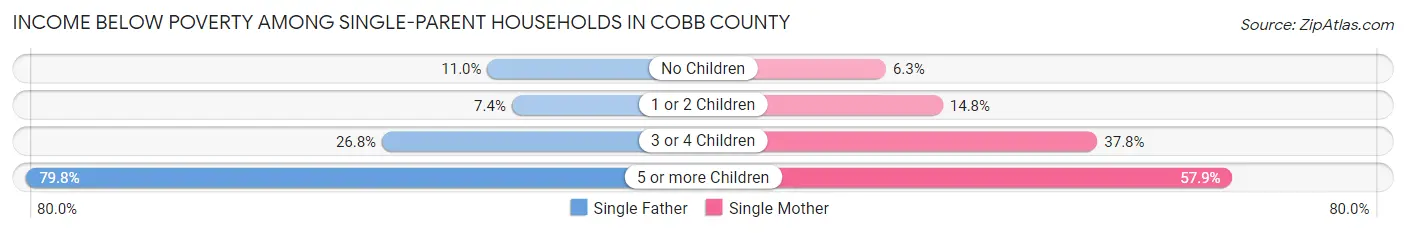
Income Below Poverty Among Single-Parent Households in Cobb County
According to the poverty data in Cobb County, 10.9% or 1,382 single-father households and 13.4% or 4,905 single-mother households are living below the poverty line. Among single-father households, those with 5 or more children have the highest poverty rate, with 63 households (79.7%) experiencing poverty. Likewise, among single-mother households, those with 5 or more children have the highest poverty rate, with 106 households (57.9%) falling below the poverty line.
| Children | Single Father | Single Mother |
| No Children | 662 (11.0%) | 958 (6.3%) |
| 1 or 2 Children | 428 (7.4%) | 2,707 (14.8%) |
| 3 or 4 Children | 229 (26.8%) | 1,134 (37.8%) |
| 5 or more Children | 63 (79.7%) | 106 (57.9%) |
| Total | 1,382 (10.9%) | 4,905 (13.4%) |
Income Below Poverty Among Married-Couple vs Single-Parent Households in Cobb County
The poverty data for Cobb County shows that 4,256 of the married-couple family households (2.9%) and 6,287 of the single-parent households (12.7%) are living below the poverty level. Within the married-couple family households, those with 5 or more children have the highest poverty rate, with 63 households (8.6%) falling below the poverty line. Among the single-parent households, those with 5 or more children have the highest poverty rate, with 169 household (64.5%) living below poverty.
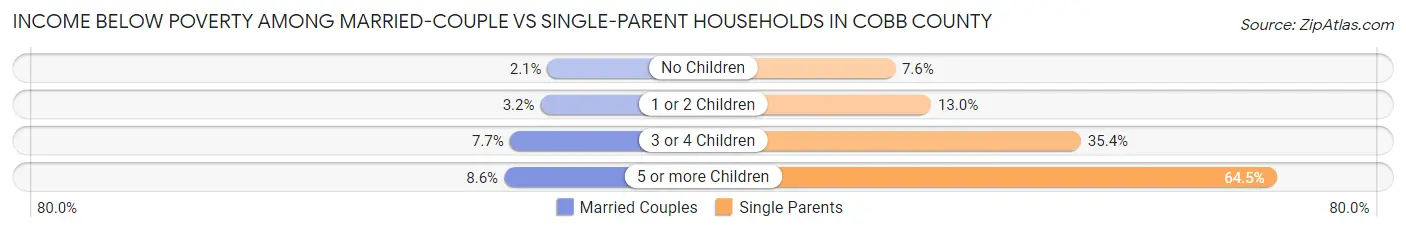
| Children | Married-Couple Families | Single-Parent Households |
| No Children | 1,681 (2.1%) | 1,620 (7.6%) |
| 1 or 2 Children | 1,706 (3.2%) | 3,135 (13.0%) |
| 3 or 4 Children | 806 (7.7%) | 1,363 (35.3%) |
| 5 or more Children | 63 (8.6%) | 169 (64.5%) |
| Total | 4,256 (2.9%) | 6,287 (12.7%) |
Employment Characteristics in Cobb County
Employment by Class of Employer in Cobb County
Among the 401,114 employed individuals in Cobb County, private company employees (288,836 | 72.0%), not-for-profit organizations (28,244 | 7.0%), and self-employed (not incorporated) (22,172 | 5.5%) make up the most common classes of employment.
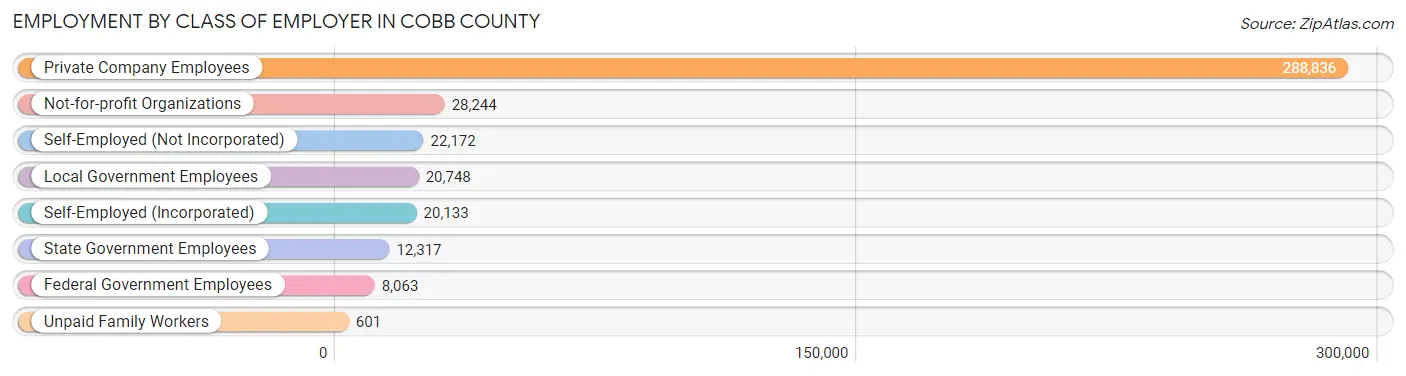
| Employer Class | # Employees | % Employees |
| Private Company Employees | 288,836 | 72.0% |
| Self-Employed (Incorporated) | 20,133 | 5.0% |
| Self-Employed (Not Incorporated) | 22,172 | 5.5% |
| Not-for-profit Organizations | 28,244 | 7.0% |
| Local Government Employees | 20,748 | 5.2% |
| State Government Employees | 12,317 | 3.1% |
| Federal Government Employees | 8,063 | 2.0% |
| Unpaid Family Workers | 601 | 0.2% |
| Total | 401,114 | 100.0% |
Employment Status by Age in Cobb County
According to the labor force statistics for Cobb County, out of the total population over 16 years of age (612,443), 70.3% or 430,547 individuals are in the labor force, with 4.6% or 19,805 of them unemployed. The age group with the highest labor force participation rate is 30 to 34 years, with 87.6% or 48,636 individuals in the labor force. Within the labor force, the 16 to 19 years age range has the highest percentage of unemployed individuals, with 11.5% or 1,908 of them being unemployed.
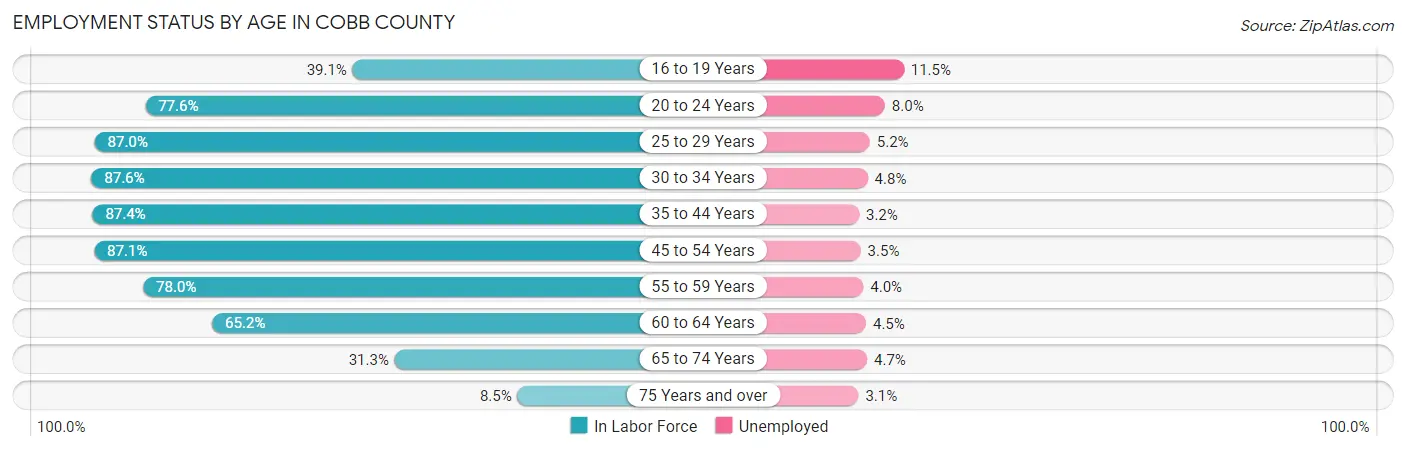
| Age Bracket | In Labor Force | Unemployed |
| 16 to 19 Years | 16,594 (39.1%) | 1,908 (11.5%) |
| 20 to 24 Years | 38,997 (77.6%) | 3,120 (8.0%) |
| 25 to 29 Years | 48,194 (87.0%) | 2,506 (5.2%) |
| 30 to 34 Years | 48,636 (87.6%) | 2,335 (4.8%) |
| 35 to 44 Years | 94,709 (87.4%) | 3,031 (3.2%) |
| 45 to 54 Years | 93,058 (87.1%) | 3,257 (3.5%) |
| 55 to 59 Years | 39,188 (78.0%) | 1,568 (4.0%) |
| 60 to 64 Years | 28,621 (65.2%) | 1,288 (4.5%) |
| 65 to 74 Years | 19,597 (31.3%) | 921 (4.7%) |
| 75 Years and over | 3,135 (8.5%) | 97 (3.1%) |
| Total | 430,547 (70.3%) | 19,805 (4.6%) |
Employment Status by Educational Attainment in Cobb County
According to labor force statistics for Cobb County, 83.8% of individuals (352,175) out of the total population between 25 and 64 years of age (420,257) are in the labor force, with 3.9% or 13,735 of them being unemployed. The group with the highest labor force participation rate are those with the educational attainment of bachelor's degree or higher, with 87.8% or 191,001 individuals in the labor force. Within the labor force, individuals with college / associate degree education have the highest percentage of unemployment, with 4.8% or 4,244 of them being unemployed.
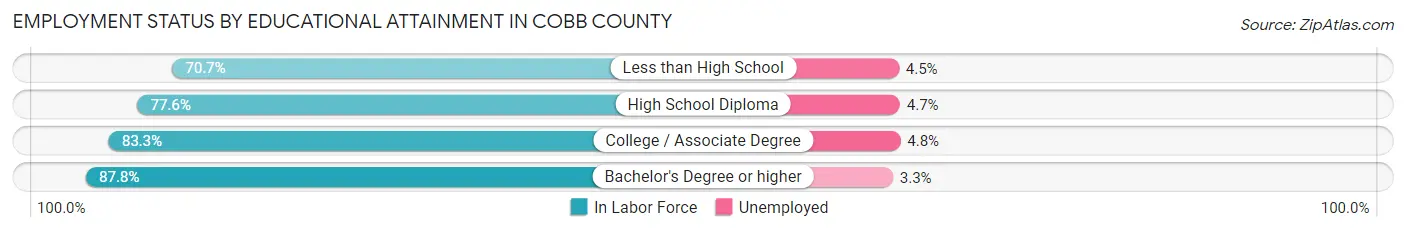
| Educational Attainment | In Labor Force | Unemployed |
| Less than High School | 20,037 (70.7%) | 1,275 (4.5%) |
| High School Diploma | 52,946 (77.6%) | 3,207 (4.7%) |
| College / Associate Degree | 88,419 (83.3%) | 5,095 (4.8%) |
| Bachelor's Degree or higher | 191,001 (87.8%) | 7,179 (3.3%) |
| Total | 352,175 (83.8%) | 16,390 (3.9%) |
Employment Occupations by Sex in Cobb County
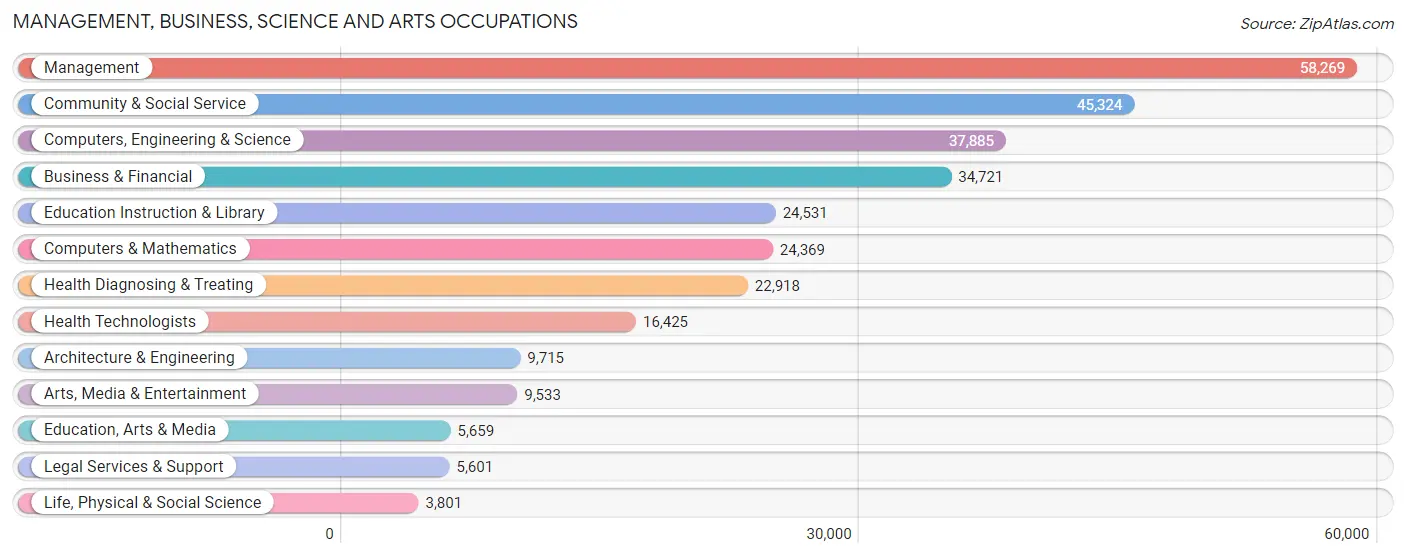
Management, Business, Science and Arts Occupations
The most common Management, Business, Science and Arts occupations in Cobb County are Management (58,269 | 14.2%), Community & Social Service (45,324 | 11.1%), Computers, Engineering & Science (37,885 | 9.2%), Business & Financial (34,721 | 8.5%), and Education Instruction & Library (24,531 | 6.0%).
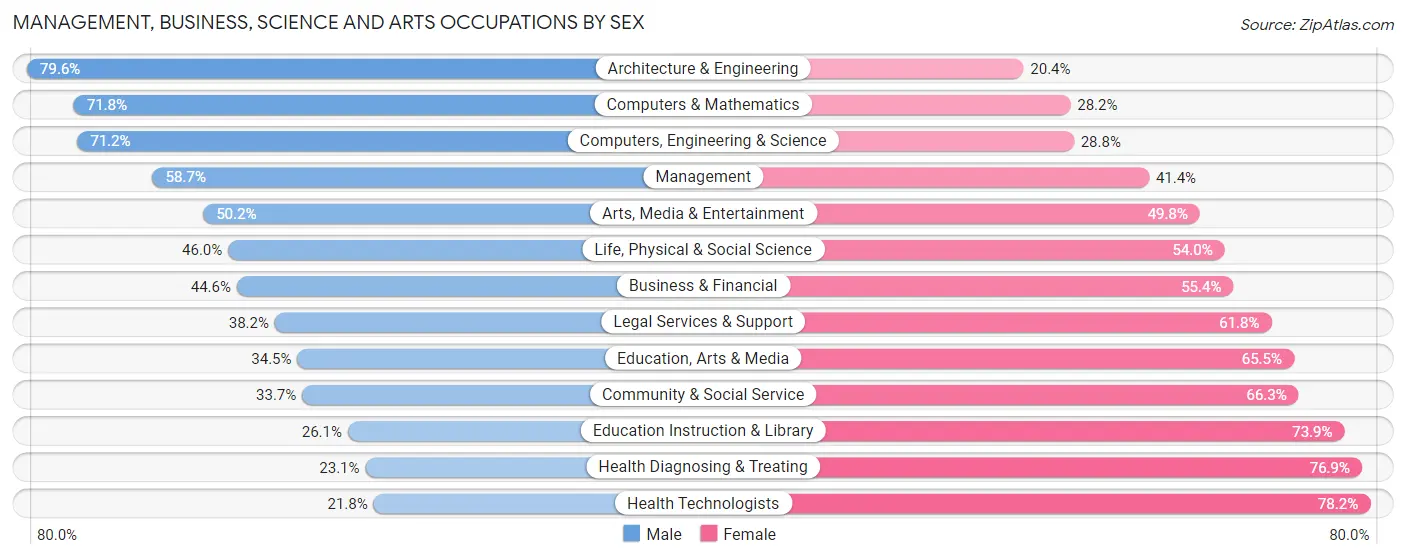
Management, Business, Science and Arts Occupations by Sex
Within the Management, Business, Science and Arts occupations in Cobb County, the most male-oriented occupations are Architecture & Engineering (79.6%), Computers & Mathematics (71.8%), and Computers, Engineering & Science (71.2%), while the most female-oriented occupations are Health Technologists (78.2%), Health Diagnosing & Treating (76.9%), and Education Instruction & Library (73.9%).
| Occupation | Male | Female |
| Management | 34,177 (58.7%) | 24,092 (41.3%) |
| Business & Financial | 15,483 (44.6%) | 19,238 (55.4%) |
| Computers, Engineering & Science | 26,976 (71.2%) | 10,909 (28.8%) |
| Computers & Mathematics | 17,492 (71.8%) | 6,877 (28.2%) |
| Architecture & Engineering | 7,734 (79.6%) | 1,981 (20.4%) |
| Life, Physical & Social Science | 1,750 (46.0%) | 2,051 (54.0%) |
| Community & Social Service | 15,271 (33.7%) | 30,053 (66.3%) |
| Education, Arts & Media | 1,951 (34.5%) | 3,708 (65.5%) |
| Legal Services & Support | 2,142 (38.2%) | 3,459 (61.8%) |
| Education Instruction & Library | 6,394 (26.1%) | 18,137 (73.9%) |
| Arts, Media & Entertainment | 4,784 (50.2%) | 4,749 (49.8%) |
| Health Diagnosing & Treating | 5,301 (23.1%) | 17,617 (76.9%) |
| Health Technologists | 3,575 (21.8%) | 12,850 (78.2%) |
| Total (Category) | 97,208 (48.8%) | 101,909 (51.2%) |
| Total (Overall) | 214,689 (52.4%) | 194,943 (47.6%) |
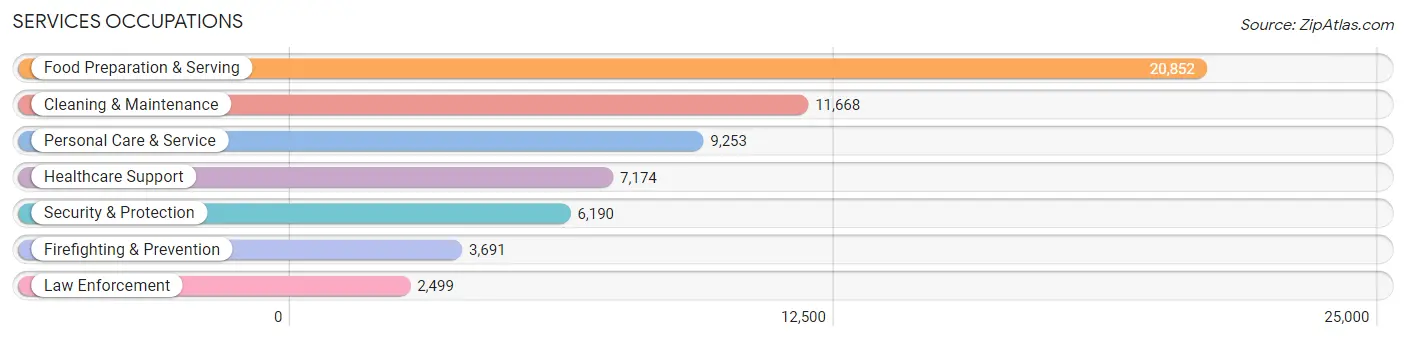
Services Occupations
The most common Services occupations in Cobb County are Food Preparation & Serving (20,852 | 5.1%), Cleaning & Maintenance (11,668 | 2.9%), Personal Care & Service (9,253 | 2.3%), Healthcare Support (7,174 | 1.8%), and Security & Protection (6,190 | 1.5%).
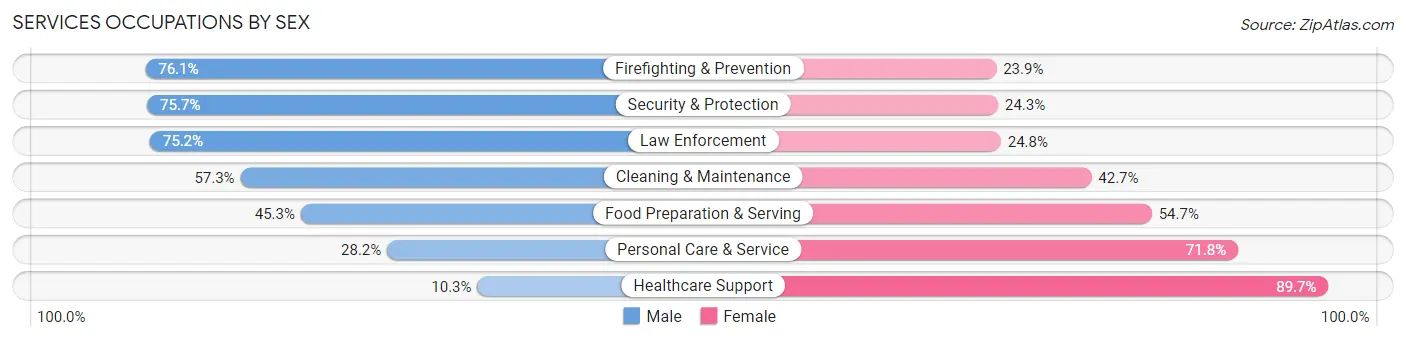
Services Occupations by Sex
Within the Services occupations in Cobb County, the most male-oriented occupations are Firefighting & Prevention (76.1%), Security & Protection (75.7%), and Law Enforcement (75.2%), while the most female-oriented occupations are Healthcare Support (89.7%), Personal Care & Service (71.8%), and Food Preparation & Serving (54.7%).
| Occupation | Male | Female |
| Healthcare Support | 742 (10.3%) | 6,432 (89.7%) |
| Security & Protection | 4,688 (75.7%) | 1,502 (24.3%) |
| Firefighting & Prevention | 2,809 (76.1%) | 882 (23.9%) |
| Law Enforcement | 1,879 (75.2%) | 620 (24.8%) |
| Food Preparation & Serving | 9,449 (45.3%) | 11,403 (54.7%) |
| Cleaning & Maintenance | 6,681 (57.3%) | 4,987 (42.7%) |
| Personal Care & Service | 2,611 (28.2%) | 6,642 (71.8%) |
| Total (Category) | 24,171 (43.8%) | 30,966 (56.2%) |
| Total (Overall) | 214,689 (52.4%) | 194,943 (47.6%) |
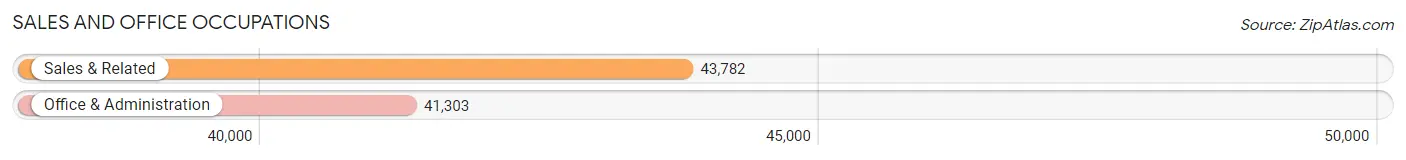
Sales and Office Occupations
The most common Sales and Office occupations in Cobb County are Sales & Related (43,782 | 10.7%), and Office & Administration (41,303 | 10.1%).
Sales and Office Occupations by Sex
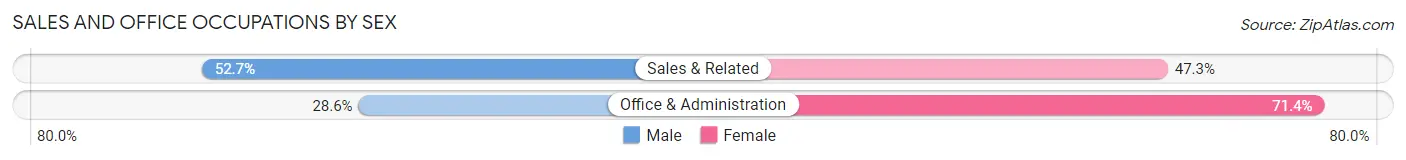
| Occupation | Male | Female |
| Sales & Related | 23,086 (52.7%) | 20,696 (47.3%) |
| Office & Administration | 11,828 (28.6%) | 29,475 (71.4%) |
| Total (Category) | 34,914 (41.0%) | 50,171 (59.0%) |
| Total (Overall) | 214,689 (52.4%) | 194,943 (47.6%) |
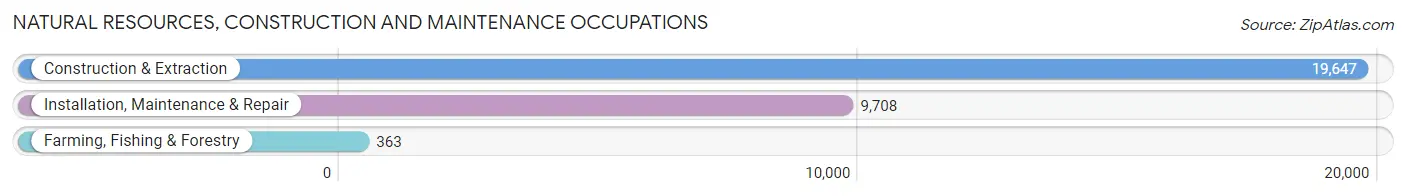
Natural Resources, Construction and Maintenance Occupations
The most common Natural Resources, Construction and Maintenance occupations in Cobb County are Construction & Extraction (19,647 | 4.8%), Installation, Maintenance & Repair (9,708 | 2.4%), and Farming, Fishing & Forestry (363 | 0.1%).
Natural Resources, Construction and Maintenance Occupations by Sex
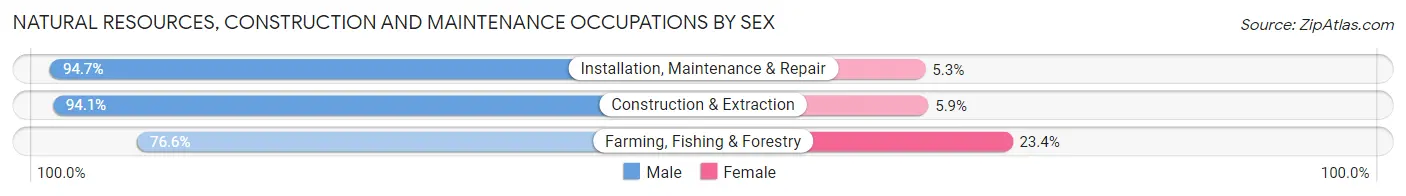
| Occupation | Male | Female |
| Farming, Fishing & Forestry | 278 (76.6%) | 85 (23.4%) |
| Construction & Extraction | 18,488 (94.1%) | 1,159 (5.9%) |
| Installation, Maintenance & Repair | 9,193 (94.7%) | 515 (5.3%) |
| Total (Category) | 27,959 (94.1%) | 1,759 (5.9%) |
| Total (Overall) | 214,689 (52.4%) | 194,943 (47.6%) |
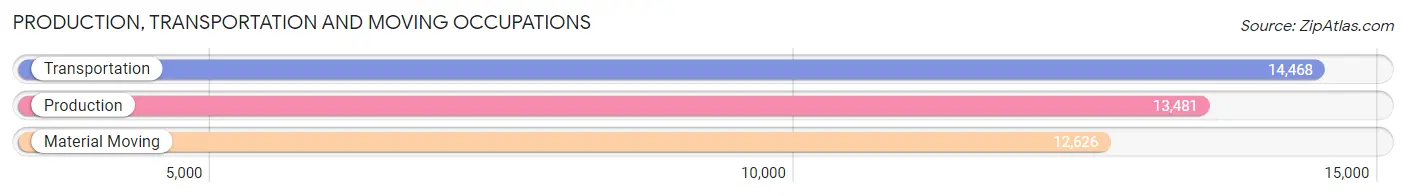
Production, Transportation and Moving Occupations
The most common Production, Transportation and Moving occupations in Cobb County are Transportation (14,468 | 3.5%), Production (13,481 | 3.3%), and Material Moving (12,626 | 3.1%).
Production, Transportation and Moving Occupations by Sex
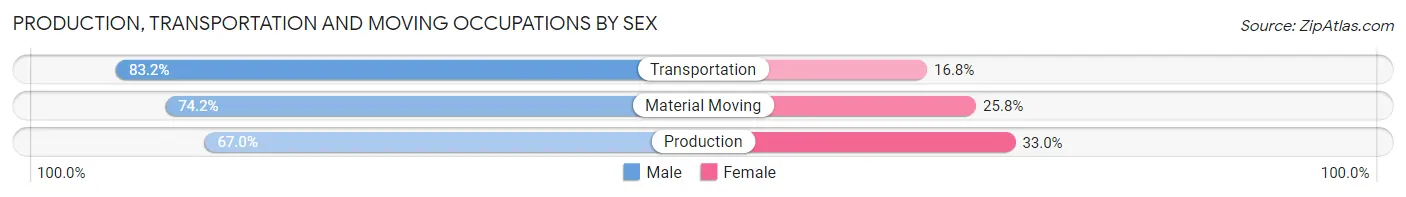
| Occupation | Male | Female |
| Production | 9,031 (67.0%) | 4,450 (33.0%) |
| Transportation | 12,037 (83.2%) | 2,431 (16.8%) |
| Material Moving | 9,369 (74.2%) | 3,257 (25.8%) |
| Total (Category) | 30,437 (75.0%) | 10,138 (25.0%) |
| Total (Overall) | 214,689 (52.4%) | 194,943 (47.6%) |
Employment Industries by Sex in Cobb County
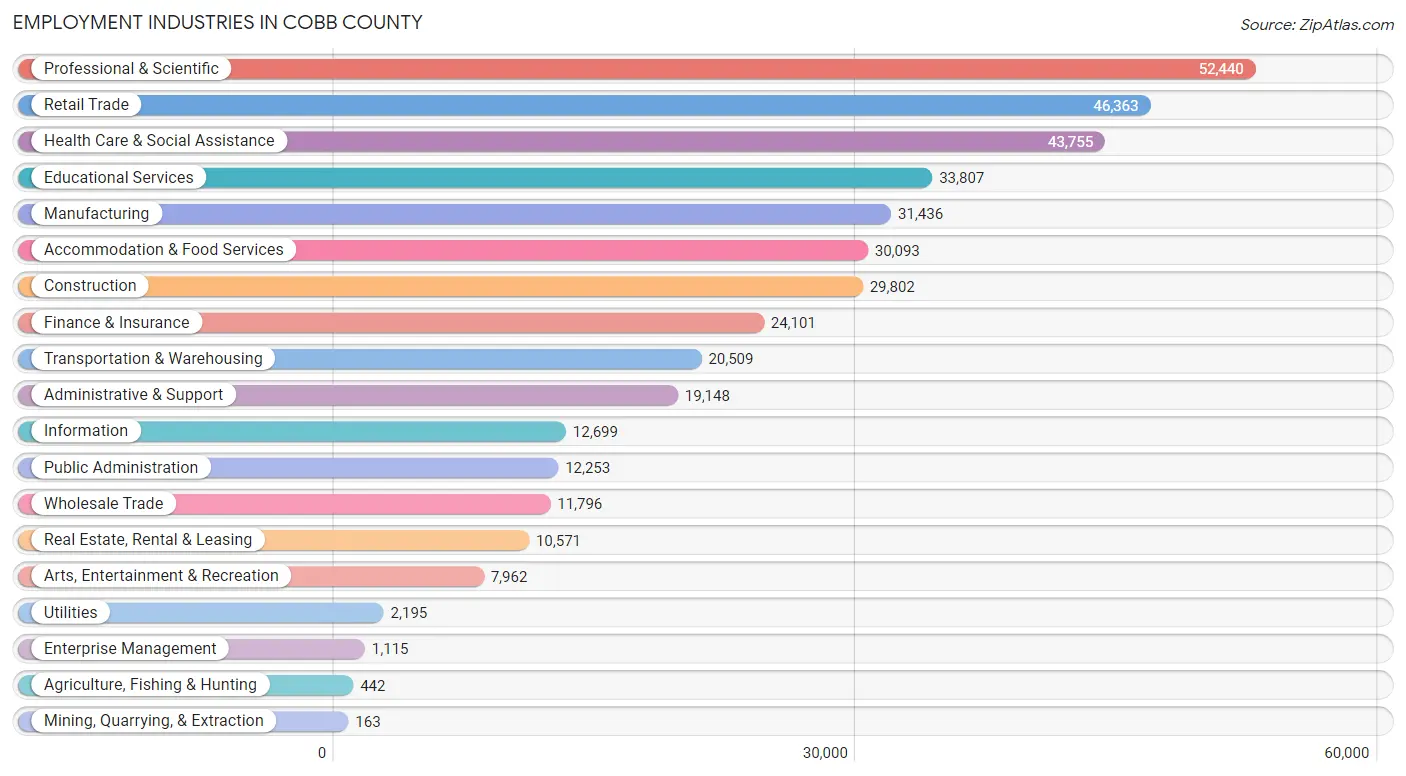
Employment Industries in Cobb County
The major employment industries in Cobb County include Professional & Scientific (52,440 | 12.8%), Retail Trade (46,363 | 11.3%), Health Care & Social Assistance (43,755 | 10.7%), Educational Services (33,807 | 8.3%), and Manufacturing (31,436 | 7.7%).
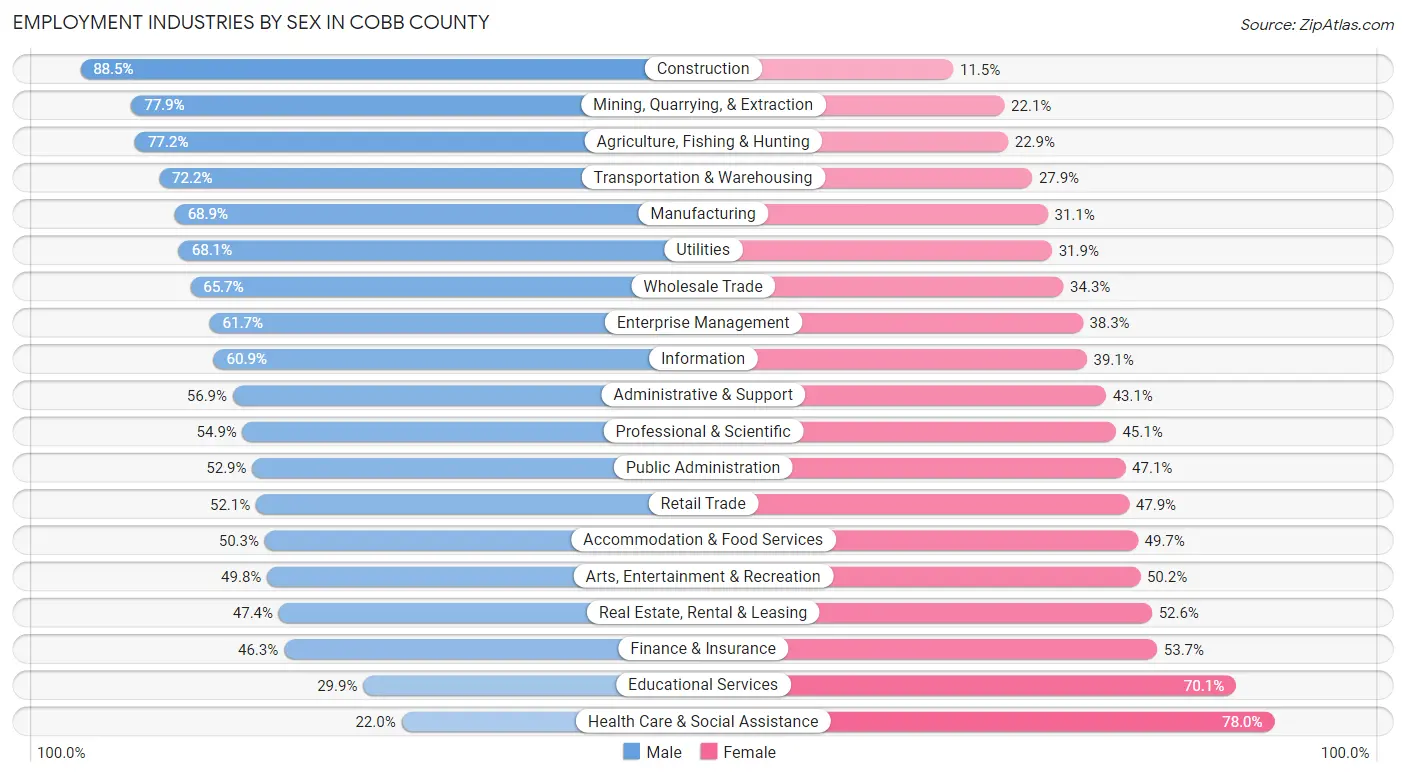
Employment Industries by Sex in Cobb County
The Cobb County industries that see more men than women are Construction (88.5%), Mining, Quarrying, & Extraction (77.9%), and Agriculture, Fishing & Hunting (77.1%), whereas the industries that tend to have a higher number of women are Health Care & Social Assistance (78.0%), Educational Services (70.1%), and Finance & Insurance (53.7%).
| Industry | Male | Female |
| Agriculture, Fishing & Hunting | 341 (77.1%) | 101 (22.9%) |
| Mining, Quarrying, & Extraction | 127 (77.9%) | 36 (22.1%) |
| Construction | 26,371 (88.5%) | 3,431 (11.5%) |
| Manufacturing | 21,666 (68.9%) | 9,770 (31.1%) |
| Wholesale Trade | 7,749 (65.7%) | 4,047 (34.3%) |
| Retail Trade | 24,150 (52.1%) | 22,213 (47.9%) |
| Transportation & Warehousing | 14,797 (72.2%) | 5,712 (27.9%) |
| Utilities | 1,494 (68.1%) | 701 (31.9%) |
| Information | 7,729 (60.9%) | 4,970 (39.1%) |
| Finance & Insurance | 11,158 (46.3%) | 12,943 (53.7%) |
| Real Estate, Rental & Leasing | 5,007 (47.4%) | 5,564 (52.6%) |
| Professional & Scientific | 28,768 (54.9%) | 23,672 (45.1%) |
| Enterprise Management | 688 (61.7%) | 427 (38.3%) |
| Administrative & Support | 10,893 (56.9%) | 8,255 (43.1%) |
| Educational Services | 10,111 (29.9%) | 23,696 (70.1%) |
| Health Care & Social Assistance | 9,622 (22.0%) | 34,133 (78.0%) |
| Arts, Entertainment & Recreation | 3,964 (49.8%) | 3,998 (50.2%) |
| Accommodation & Food Services | 15,130 (50.3%) | 14,963 (49.7%) |
| Public Administration | 6,477 (52.9%) | 5,776 (47.1%) |
| Total | 214,689 (52.4%) | 194,943 (47.6%) |
Education in Cobb County
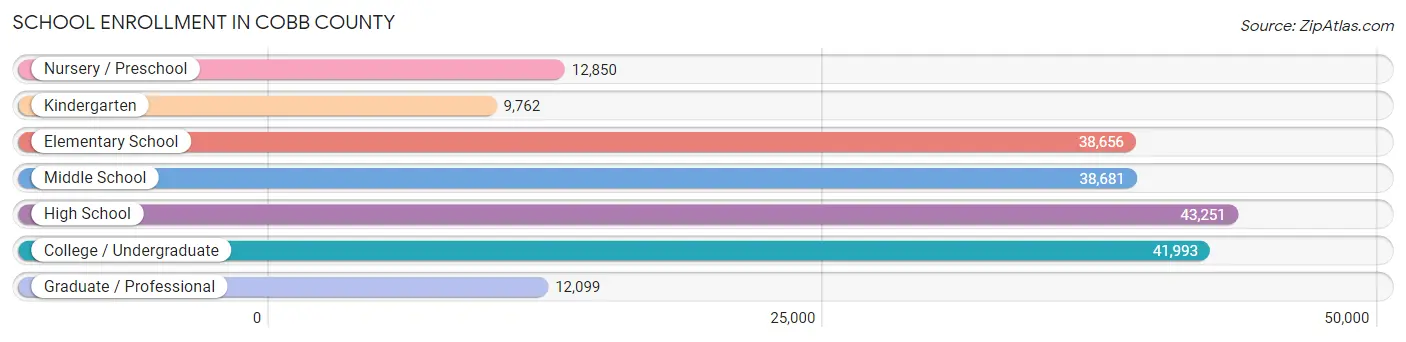
School Enrollment in Cobb County
The most common levels of schooling among the 197,292 students in Cobb County are high school (43,251 | 21.9%), college / undergraduate (41,993 | 21.3%), and middle school (38,681 | 19.6%).
| School Level | # Students | % Students |
| Nursery / Preschool | 12,850 | 6.5% |
| Kindergarten | 9,762 | 5.0% |
| Elementary School | 38,656 | 19.6% |
| Middle School | 38,681 | 19.6% |
| High School | 43,251 | 21.9% |
| College / Undergraduate | 41,993 | 21.3% |
| Graduate / Professional | 12,099 | 6.1% |
| Total | 197,292 | 100.0% |
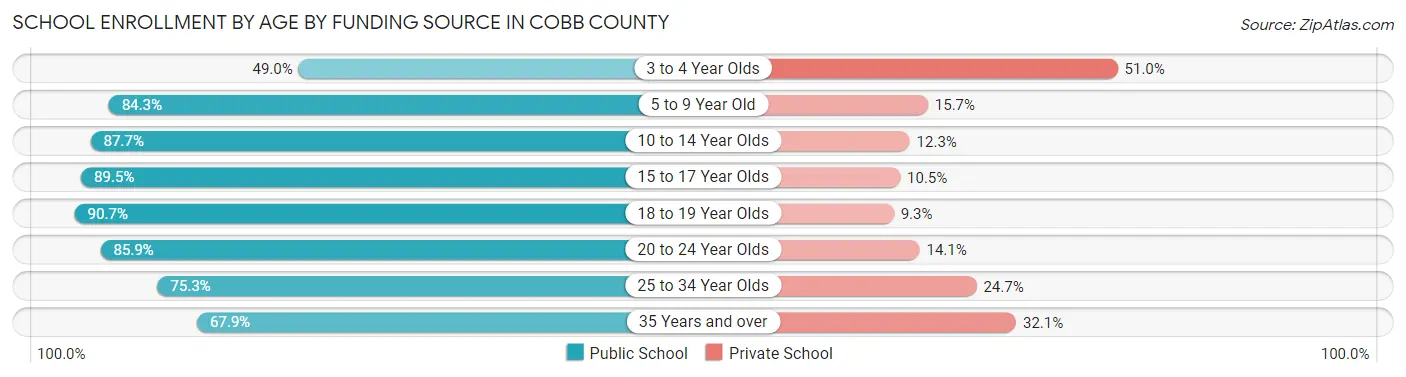
School Enrollment by Age by Funding Source in Cobb County
Out of a total of 197,292 students who are enrolled in schools in Cobb County, 32,750 (16.6%) attend a private institution, while the remaining 164,542 (83.4%) are enrolled in public schools. The age group of 3 to 4 year olds has the highest likelihood of being enrolled in private schools, with 5,019 (51.0% in the age bracket) enrolled. Conversely, the age group of 18 to 19 year olds has the lowest likelihood of being enrolled in a private school, with 14,825 (90.7% in the age bracket) attending a public institution.
| Age Bracket | Public School | Private School |
| 3 to 4 Year Olds | 4,818 (49.0%) | 5,019 (51.0%) |
| 5 to 9 Year Old | 39,165 (84.3%) | 7,282 (15.7%) |
| 10 to 14 Year Olds | 43,122 (87.7%) | 6,042 (12.3%) |
| 15 to 17 Year Olds | 28,024 (89.5%) | 3,290 (10.5%) |
| 18 to 19 Year Olds | 14,825 (90.7%) | 1,524 (9.3%) |
| 20 to 24 Year Olds | 17,889 (85.9%) | 2,944 (14.1%) |
| 25 to 34 Year Olds | 9,292 (75.3%) | 3,055 (24.7%) |
| 35 Years and over | 7,469 (67.9%) | 3,532 (32.1%) |
| Total | 164,542 (83.4%) | 32,750 (16.6%) |
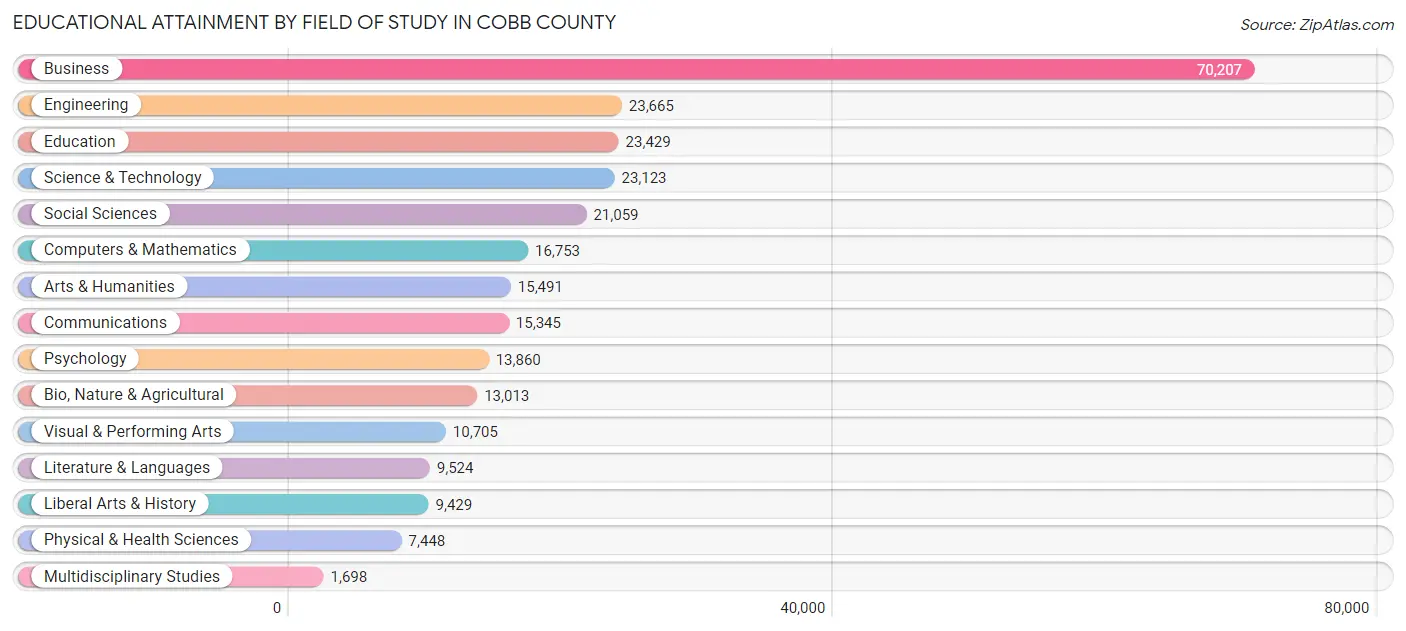
Educational Attainment by Field of Study in Cobb County
Business (70,207 | 25.6%), engineering (23,665 | 8.6%), education (23,429 | 8.5%), science & technology (23,123 | 8.4%), and social sciences (21,059 | 7.7%) are the most common fields of study among 274,749 individuals in Cobb County who have obtained a bachelor's degree or higher.
| Field of Study | # Graduates | % Graduates |
| Computers & Mathematics | 16,753 | 6.1% |
| Bio, Nature & Agricultural | 13,013 | 4.7% |
| Physical & Health Sciences | 7,448 | 2.7% |
| Psychology | 13,860 | 5.0% |
| Social Sciences | 21,059 | 7.7% |
| Engineering | 23,665 | 8.6% |
| Multidisciplinary Studies | 1,698 | 0.6% |
| Science & Technology | 23,123 | 8.4% |
| Business | 70,207 | 25.6% |
| Education | 23,429 | 8.5% |
| Literature & Languages | 9,524 | 3.5% |
| Liberal Arts & History | 9,429 | 3.4% |
| Visual & Performing Arts | 10,705 | 3.9% |
| Communications | 15,345 | 5.6% |
| Arts & Humanities | 15,491 | 5.6% |
| Total | 274,749 | 100.0% |
Transportation & Commute in Cobb County
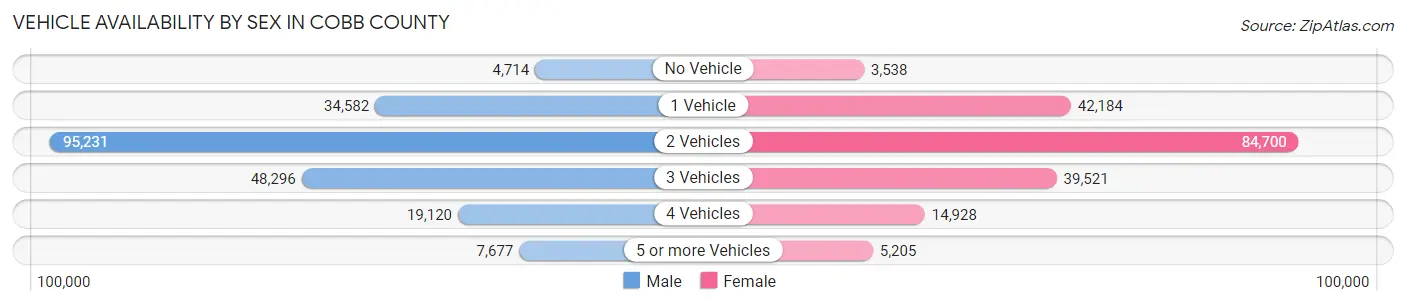
Vehicle Availability by Sex in Cobb County
The most prevalent vehicle ownership categories in Cobb County are males with 2 vehicles (95,231, accounting for 45.4%) and females with 2 vehicles (84,700, making up 50.1%).
| Vehicles Available | Male | Female |
| No Vehicle | 4,714 (2.2%) | 3,538 (1.9%) |
| 1 Vehicle | 34,582 (16.5%) | 42,184 (22.2%) |
| 2 Vehicles | 95,231 (45.4%) | 84,700 (44.6%) |
| 3 Vehicles | 48,296 (23.0%) | 39,521 (20.8%) |
| 4 Vehicles | 19,120 (9.1%) | 14,928 (7.9%) |
| 5 or more Vehicles | 7,677 (3.7%) | 5,205 (2.7%) |
| Total | 209,620 (100.0%) | 190,076 (100.0%) |
Commute Time in Cobb County
The most frequently occuring commute durations in Cobb County are 30 to 34 minutes (58,562 commuters, 17.9%), 20 to 24 minutes (44,022 commuters, 13.5%), and 15 to 19 minutes (41,687 commuters, 12.8%).
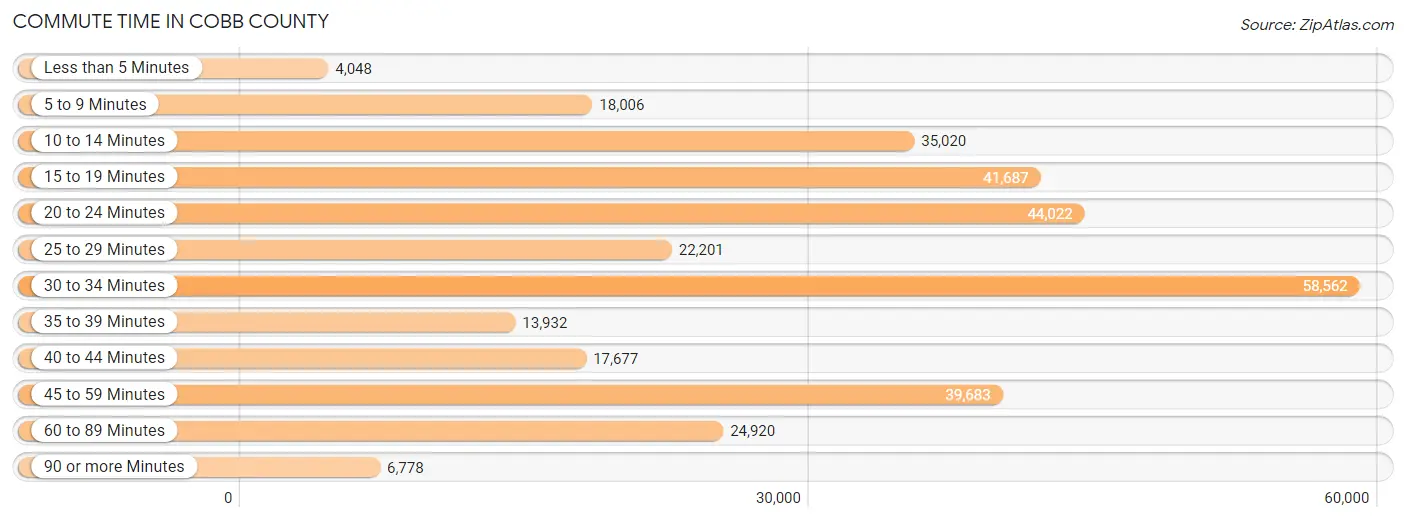
| Commute Time | # Commuters | % Commuters |
| Less than 5 Minutes | 4,048 | 1.2% |
| 5 to 9 Minutes | 18,006 | 5.5% |
| 10 to 14 Minutes | 35,020 | 10.7% |
| 15 to 19 Minutes | 41,687 | 12.8% |
| 20 to 24 Minutes | 44,022 | 13.5% |
| 25 to 29 Minutes | 22,201 | 6.8% |
| 30 to 34 Minutes | 58,562 | 17.9% |
| 35 to 39 Minutes | 13,932 | 4.3% |
| 40 to 44 Minutes | 17,677 | 5.4% |
| 45 to 59 Minutes | 39,683 | 12.1% |
| 60 to 89 Minutes | 24,920 | 7.6% |
| 90 or more Minutes | 6,778 | 2.1% |
Commute Time by Sex in Cobb County
The most common commute times in Cobb County are 30 to 34 minutes (33,406 commuters, 19.3%) for males and 30 to 34 minutes (25,156 commuters, 16.4%) for females.
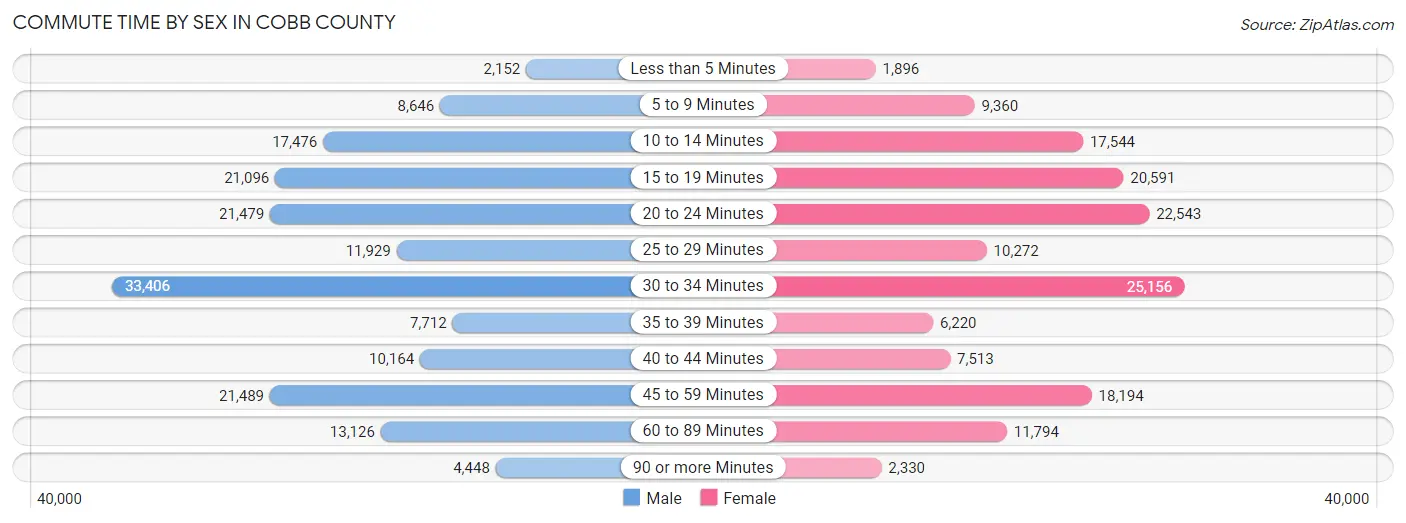
| Commute Time | Male | Female |
| Less than 5 Minutes | 2,152 (1.2%) | 1,896 (1.2%) |
| 5 to 9 Minutes | 8,646 (5.0%) | 9,360 (6.1%) |
| 10 to 14 Minutes | 17,476 (10.1%) | 17,544 (11.4%) |
| 15 to 19 Minutes | 21,096 (12.2%) | 20,591 (13.4%) |
| 20 to 24 Minutes | 21,479 (12.4%) | 22,543 (14.7%) |
| 25 to 29 Minutes | 11,929 (6.9%) | 10,272 (6.7%) |
| 30 to 34 Minutes | 33,406 (19.3%) | 25,156 (16.4%) |
| 35 to 39 Minutes | 7,712 (4.4%) | 6,220 (4.1%) |
| 40 to 44 Minutes | 10,164 (5.9%) | 7,513 (4.9%) |
| 45 to 59 Minutes | 21,489 (12.4%) | 18,194 (11.9%) |
| 60 to 89 Minutes | 13,126 (7.6%) | 11,794 (7.7%) |
| 90 or more Minutes | 4,448 (2.6%) | 2,330 (1.5%) |
Time of Departure to Work by Sex in Cobb County
The most frequent times of departure to work in Cobb County are 7:00 AM to 7:29 AM (25,801, 14.9%) for males and 7:00 AM to 7:29 AM (23,876, 15.6%) for females.
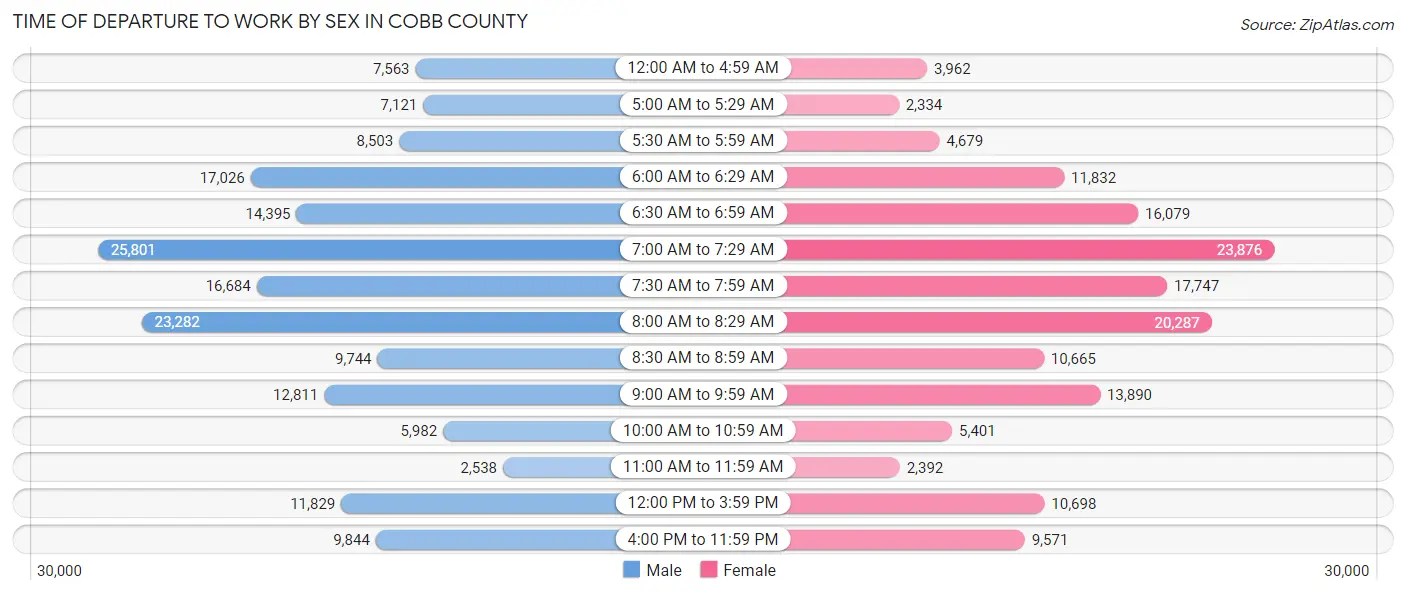
| Time of Departure | Male | Female |
| 12:00 AM to 4:59 AM | 7,563 (4.4%) | 3,962 (2.6%) |
| 5:00 AM to 5:29 AM | 7,121 (4.1%) | 2,334 (1.5%) |
| 5:30 AM to 5:59 AM | 8,503 (4.9%) | 4,679 (3.0%) |
| 6:00 AM to 6:29 AM | 17,026 (9.8%) | 11,832 (7.7%) |
| 6:30 AM to 6:59 AM | 14,395 (8.3%) | 16,079 (10.5%) |
| 7:00 AM to 7:29 AM | 25,801 (14.9%) | 23,876 (15.6%) |
| 7:30 AM to 7:59 AM | 16,684 (9.6%) | 17,747 (11.6%) |
| 8:00 AM to 8:29 AM | 23,282 (13.5%) | 20,287 (13.2%) |
| 8:30 AM to 8:59 AM | 9,744 (5.6%) | 10,665 (7.0%) |
| 9:00 AM to 9:59 AM | 12,811 (7.4%) | 13,890 (9.0%) |
| 10:00 AM to 10:59 AM | 5,982 (3.5%) | 5,401 (3.5%) |
| 11:00 AM to 11:59 AM | 2,538 (1.5%) | 2,392 (1.6%) |
| 12:00 PM to 3:59 PM | 11,829 (6.8%) | 10,698 (7.0%) |
| 4:00 PM to 11:59 PM | 9,844 (5.7%) | 9,571 (6.2%) |
| Total | 173,123 (100.0%) | 153,413 (100.0%) |
Housing Occupancy in Cobb County
Occupancy by Ownership in Cobb County
Of the total 291,171 dwellings in Cobb County, owner-occupied units account for 193,617 (66.5%), while renter-occupied units make up 97,554 (33.5%).
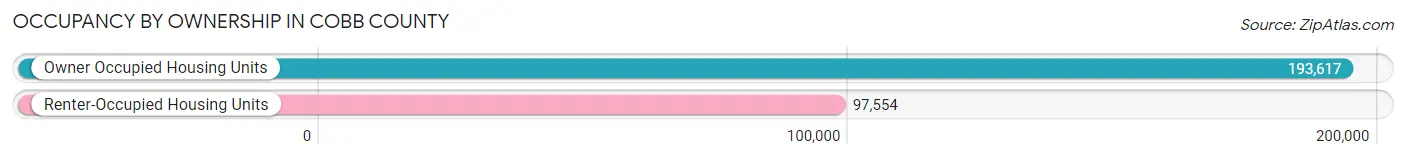
| Occupancy | # Housing Units | % Housing Units |
| Owner Occupied Housing Units | 193,617 | 66.5% |
| Renter-Occupied Housing Units | 97,554 | 33.5% |
| Total Occupied Housing Units | 291,171 | 100.0% |
Occupancy by Household Size in Cobb County
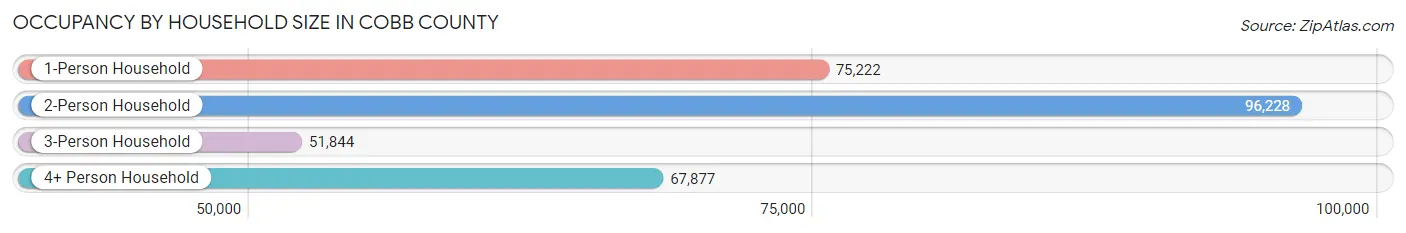
| Household Size | # Housing Units | % Housing Units |
| 1-Person Household | 75,222 | 25.8% |
| 2-Person Household | 96,228 | 33.1% |
| 3-Person Household | 51,844 | 17.8% |
| 4+ Person Household | 67,877 | 23.3% |
| Total Housing Units | 291,171 | 100.0% |
Occupancy by Ownership by Household Size in Cobb County
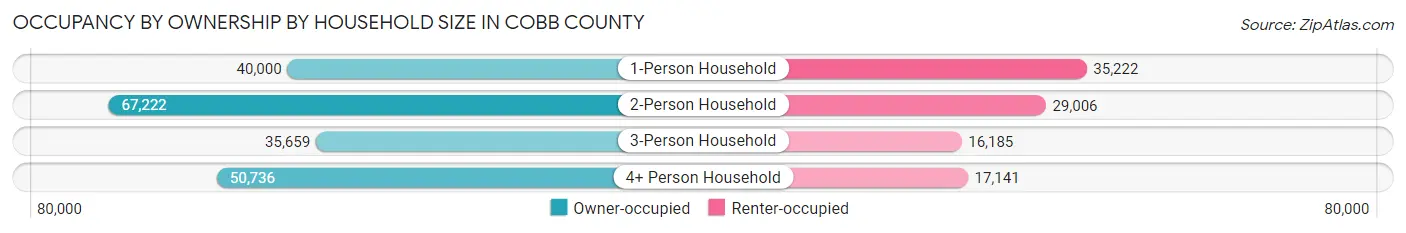
| Household Size | Owner-occupied | Renter-occupied |
| 1-Person Household | 40,000 (53.2%) | 35,222 (46.8%) |
| 2-Person Household | 67,222 (69.9%) | 29,006 (30.1%) |
| 3-Person Household | 35,659 (68.8%) | 16,185 (31.2%) |
| 4+ Person Household | 50,736 (74.8%) | 17,141 (25.3%) |
| Total Housing Units | 193,617 (66.5%) | 97,554 (33.5%) |
Occupancy by Educational Attainment in Cobb County
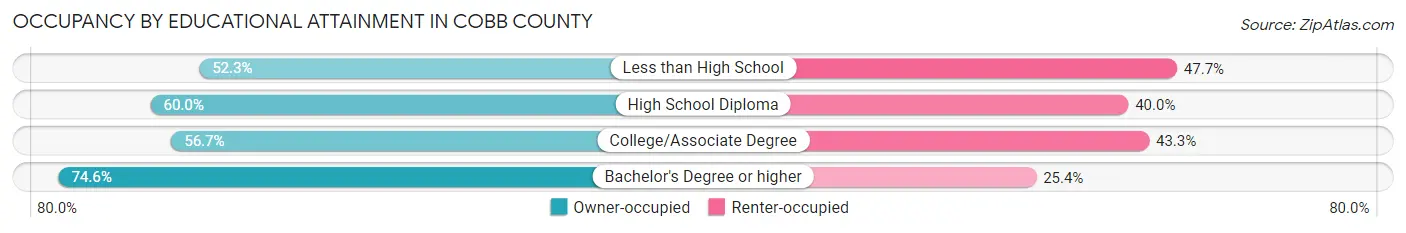
| Household Size | Owner-occupied | Renter-occupied |
| Less than High School | 7,921 (52.3%) | 7,225 (47.7%) |
| High School Diploma | 25,394 (60.0%) | 16,916 (40.0%) |
| College/Associate Degree | 44,655 (56.7%) | 34,074 (43.3%) |
| Bachelor's Degree or higher | 115,647 (74.6%) | 39,339 (25.4%) |
Occupancy by Age of Householder in Cobb County
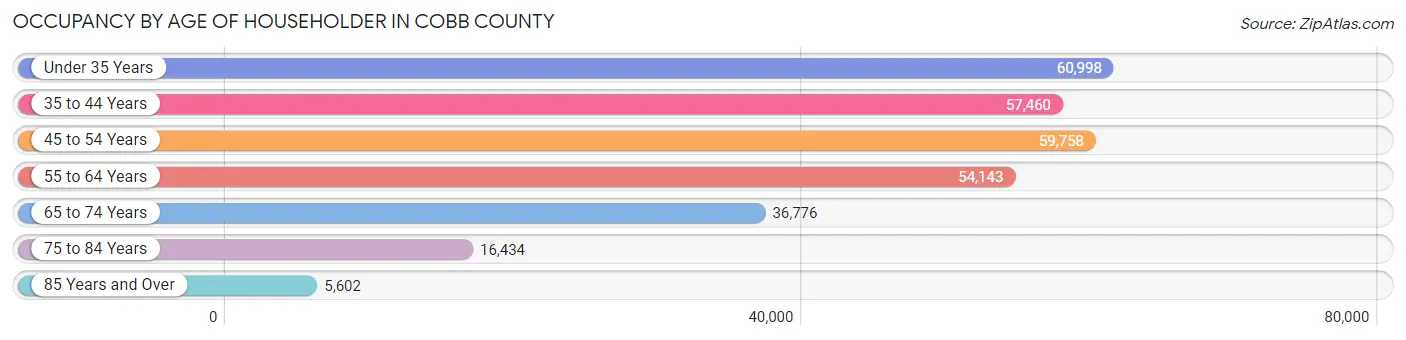
| Age Bracket | # Households | % Households |
| Under 35 Years | 60,998 | 20.9% |
| 35 to 44 Years | 57,460 | 19.7% |
| 45 to 54 Years | 59,758 | 20.5% |
| 55 to 64 Years | 54,143 | 18.6% |
| 65 to 74 Years | 36,776 | 12.6% |
| 75 to 84 Years | 16,434 | 5.6% |
| 85 Years and Over | 5,602 | 1.9% |
| Total | 291,171 | 100.0% |
Housing Finances in Cobb County
Median Income by Occupancy in Cobb County
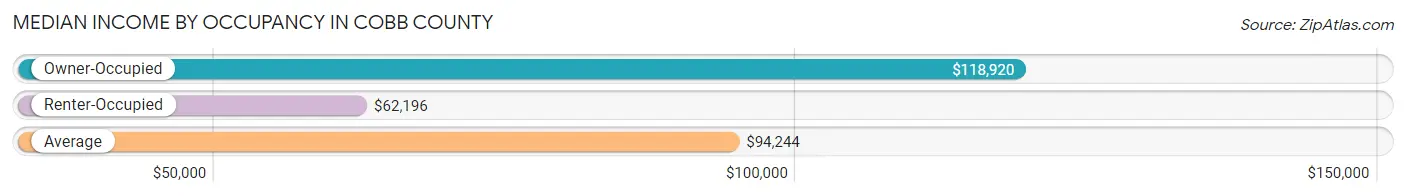
| Occupancy Type | # Households | Median Income |
| Owner-Occupied | 193,617 (66.5%) | $118,920 |
| Renter-Occupied | 97,554 (33.5%) | $62,196 |
| Average | 291,171 (100.0%) | $94,244 |
Occupancy by Householder Income Bracket in Cobb County
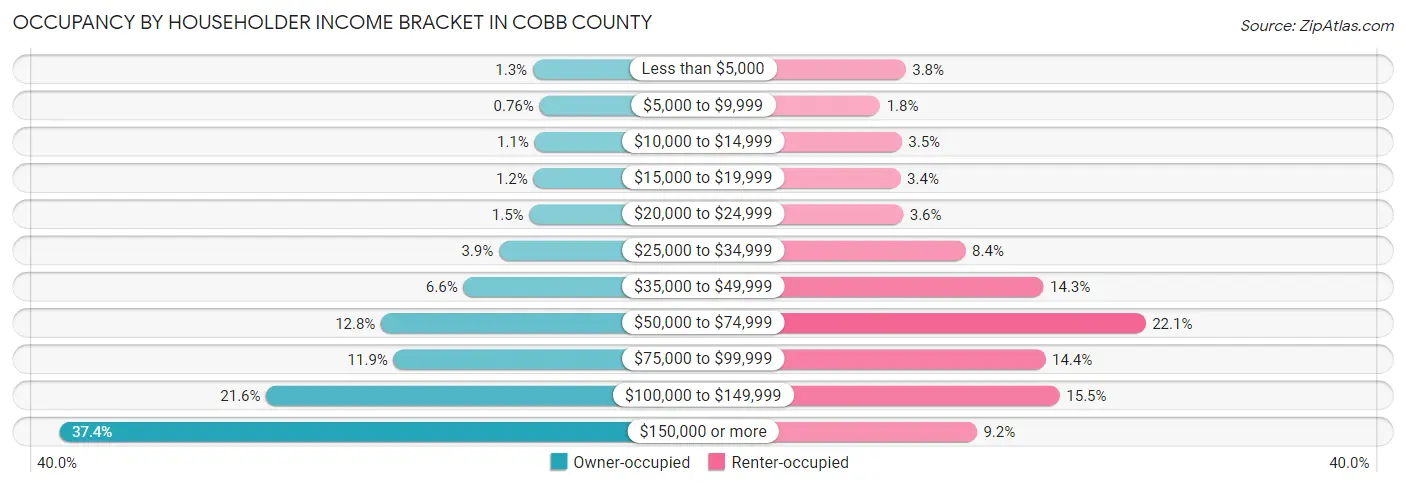
| Income Bracket | Owner-occupied | Renter-occupied |
| Less than $5,000 | 2,452 (1.3%) | 3,696 (3.8%) |
| $5,000 to $9,999 | 1,468 (0.8%) | 1,795 (1.8%) |
| $10,000 to $14,999 | 2,198 (1.1%) | 3,404 (3.5%) |
| $15,000 to $19,999 | 2,360 (1.2%) | 3,320 (3.4%) |
| $20,000 to $24,999 | 2,974 (1.5%) | 3,510 (3.6%) |
| $25,000 to $34,999 | 7,454 (3.8%) | 8,146 (8.4%) |
| $35,000 to $49,999 | 12,700 (6.6%) | 13,938 (14.3%) |
| $50,000 to $74,999 | 24,834 (12.8%) | 21,531 (22.1%) |
| $75,000 to $99,999 | 23,008 (11.9%) | 14,082 (14.4%) |
| $100,000 to $149,999 | 41,786 (21.6%) | 15,147 (15.5%) |
| $150,000 or more | 72,383 (37.4%) | 8,985 (9.2%) |
| Total | 193,617 (100.0%) | 97,554 (100.0%) |
Monthly Housing Cost Tiers in Cobb County
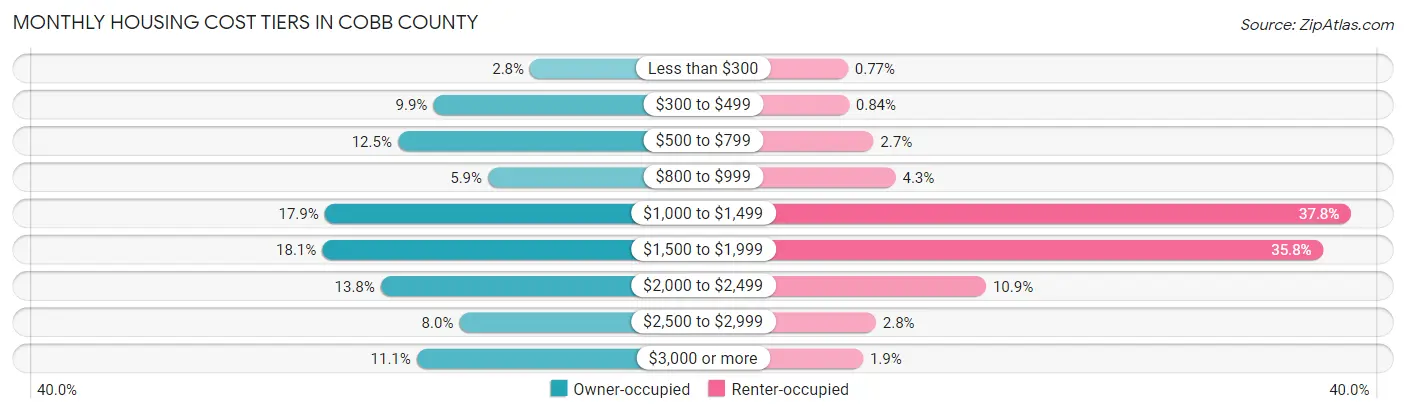
| Monthly Cost | Owner-occupied | Renter-occupied |
| Less than $300 | 5,400 (2.8%) | 753 (0.8%) |
| $300 to $499 | 19,189 (9.9%) | 819 (0.8%) |
| $500 to $799 | 24,249 (12.5%) | 2,588 (2.6%) |
| $800 to $999 | 11,392 (5.9%) | 4,178 (4.3%) |
| $1,000 to $1,499 | 34,671 (17.9%) | 36,906 (37.8%) |
| $1,500 to $1,999 | 35,017 (18.1%) | 34,916 (35.8%) |
| $2,000 to $2,499 | 26,679 (13.8%) | 10,674 (10.9%) |
| $2,500 to $2,999 | 15,469 (8.0%) | 2,763 (2.8%) |
| $3,000 or more | 21,551 (11.1%) | 1,830 (1.9%) |
| Total | 193,617 (100.0%) | 97,554 (100.0%) |
Physical Housing Characteristics in Cobb County
Housing Structures in Cobb County
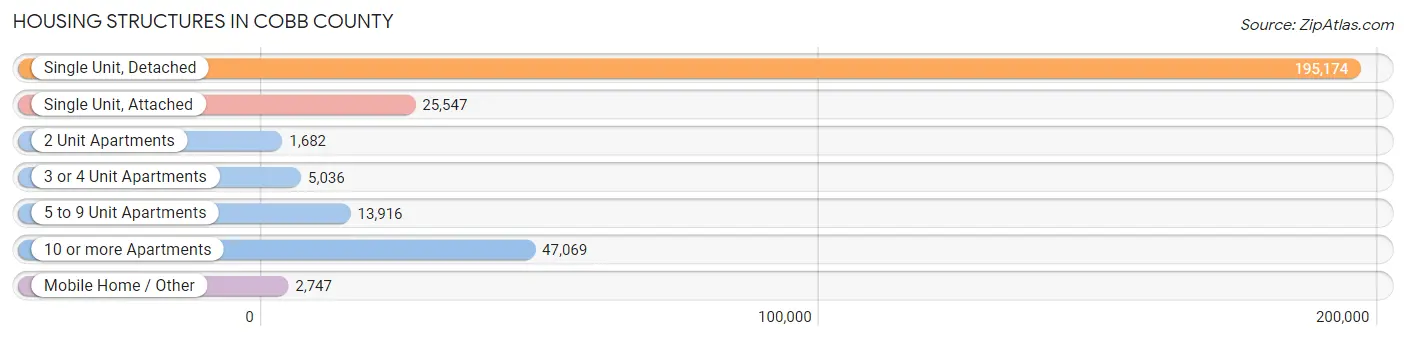
| Structure Type | # Housing Units | % Housing Units |
| Single Unit, Detached | 195,174 | 67.0% |
| Single Unit, Attached | 25,547 | 8.8% |
| 2 Unit Apartments | 1,682 | 0.6% |
| 3 or 4 Unit Apartments | 5,036 | 1.7% |
| 5 to 9 Unit Apartments | 13,916 | 4.8% |
| 10 or more Apartments | 47,069 | 16.2% |
| Mobile Home / Other | 2,747 | 0.9% |
| Total | 291,171 | 100.0% |
Housing Structures by Occupancy in Cobb County
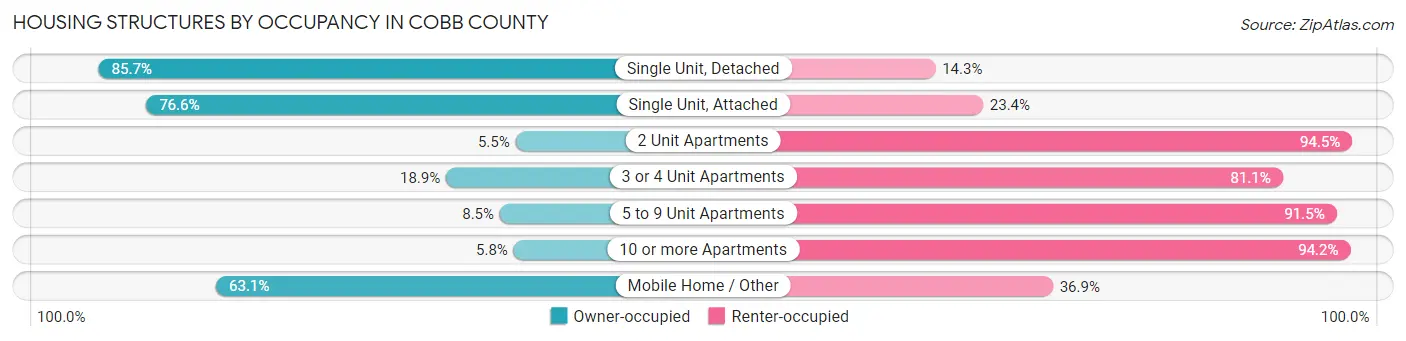
| Structure Type | Owner-occupied | Renter-occupied |
| Single Unit, Detached | 167,348 (85.7%) | 27,826 (14.3%) |
| Single Unit, Attached | 19,562 (76.6%) | 5,985 (23.4%) |
| 2 Unit Apartments | 92 (5.5%) | 1,590 (94.5%) |
| 3 or 4 Unit Apartments | 950 (18.9%) | 4,086 (81.1%) |
| 5 to 9 Unit Apartments | 1,181 (8.5%) | 12,735 (91.5%) |
| 10 or more Apartments | 2,750 (5.8%) | 44,319 (94.2%) |
| Mobile Home / Other | 1,734 (63.1%) | 1,013 (36.9%) |
| Total | 193,617 (66.5%) | 97,554 (33.5%) |
Housing Structures by Number of Rooms in Cobb County
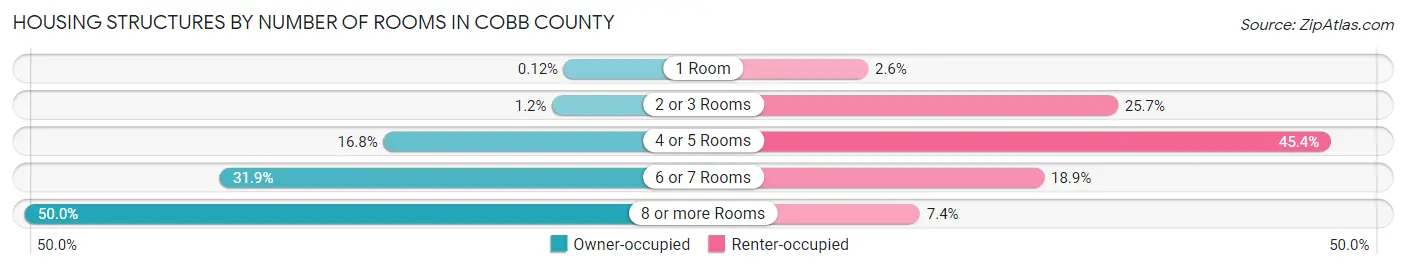
| Number of Rooms | Owner-occupied | Renter-occupied |
| 1 Room | 223 (0.1%) | 2,541 (2.6%) |
| 2 or 3 Rooms | 2,298 (1.2%) | 25,073 (25.7%) |
| 4 or 5 Rooms | 32,530 (16.8%) | 44,308 (45.4%) |
| 6 or 7 Rooms | 61,808 (31.9%) | 18,419 (18.9%) |
| 8 or more Rooms | 96,758 (50.0%) | 7,213 (7.4%) |
| Total | 193,617 (100.0%) | 97,554 (100.0%) |
Housing Structure by Heating Type in Cobb County
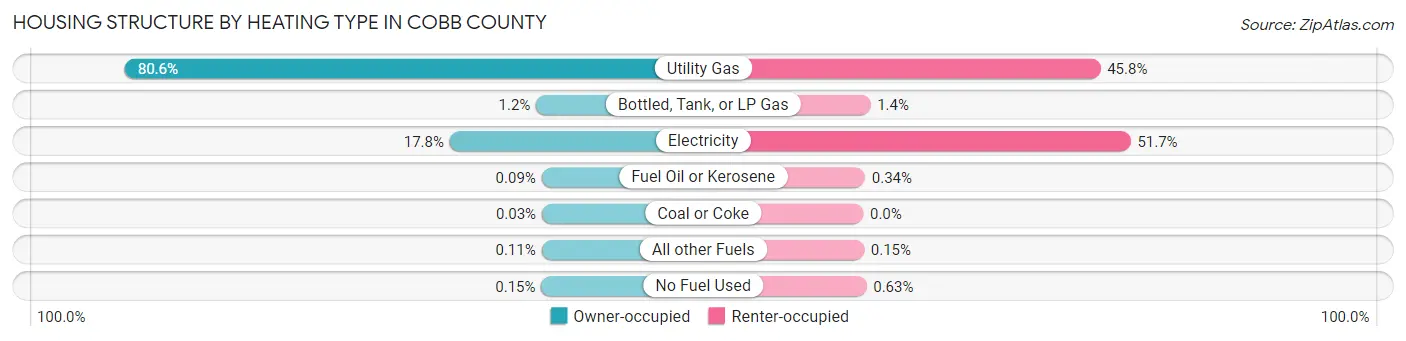
| Heating Type | Owner-occupied | Renter-occupied |
| Utility Gas | 156,119 (80.6%) | 44,710 (45.8%) |
| Bottled, Tank, or LP Gas | 2,226 (1.1%) | 1,343 (1.4%) |
| Electricity | 34,535 (17.8%) | 50,408 (51.7%) |
| Fuel Oil or Kerosene | 165 (0.1%) | 333 (0.3%) |
| Coal or Coke | 53 (0.0%) | 0 (0.0%) |
| All other Fuels | 222 (0.1%) | 149 (0.2%) |
| No Fuel Used | 297 (0.2%) | 611 (0.6%) |
| Total | 193,617 (100.0%) | 97,554 (100.0%) |
Household Vehicle Usage in Cobb County
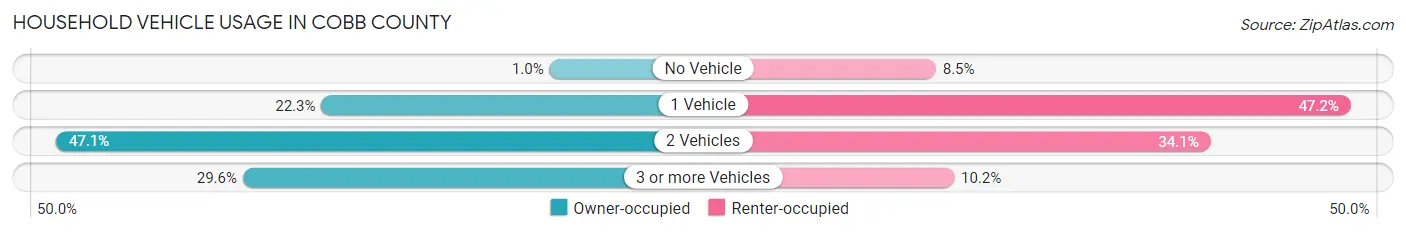
| Vehicles per Household | Owner-occupied | Renter-occupied |
| No Vehicle | 1,938 (1.0%) | 8,276 (8.5%) |
| 1 Vehicle | 43,179 (22.3%) | 46,053 (47.2%) |
| 2 Vehicles | 91,128 (47.1%) | 33,281 (34.1%) |
| 3 or more Vehicles | 57,372 (29.6%) | 9,944 (10.2%) |
| Total | 193,617 (100.0%) | 97,554 (100.0%) |
Real Estate & Mortgages in Cobb County
Real Estate and Mortgage Overview in Cobb County
| Characteristic | Without Mortgage | With Mortgage |
| Housing Units | 54,855 | 138,762 |
| Median Property Value | $320,500 | $354,600 |
| Median Household Income | $89,854 | $57,887 |
| Monthly Housing Costs | $536 | $21,395 |
| Real Estate Taxes | $1,523 | $1,963 |
Property Value by Mortgage Status in Cobb County
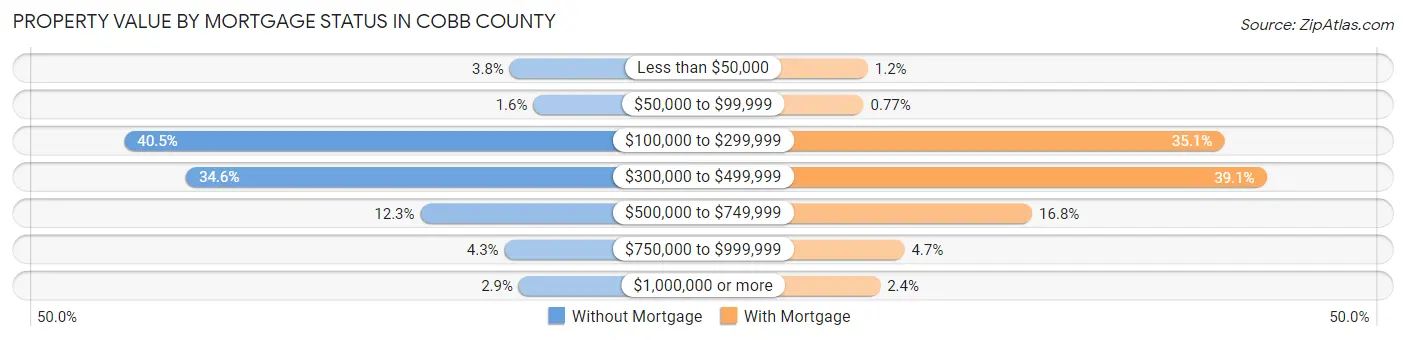
| Property Value | Without Mortgage | With Mortgage |
| Less than $50,000 | 2,085 (3.8%) | 1,624 (1.2%) |
| $50,000 to $99,999 | 852 (1.5%) | 1,071 (0.8%) |
| $100,000 to $299,999 | 22,210 (40.5%) | 48,700 (35.1%) |
| $300,000 to $499,999 | 18,993 (34.6%) | 54,298 (39.1%) |
| $500,000 to $749,999 | 6,751 (12.3%) | 23,343 (16.8%) |
| $750,000 to $999,999 | 2,359 (4.3%) | 6,465 (4.7%) |
| $1,000,000 or more | 1,605 (2.9%) | 3,261 (2.4%) |
| Total | 54,855 (100.0%) | 138,762 (100.0%) |
Household Income by Mortgage Status in Cobb County
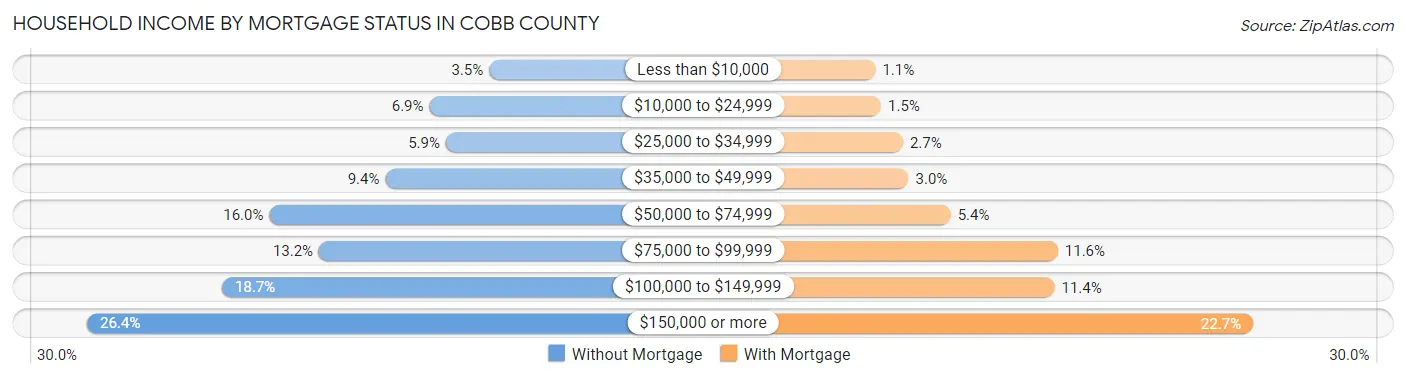
| Household Income | Without Mortgage | With Mortgage |
| Less than $10,000 | 1,898 (3.5%) | 1,578 (1.1%) |
| $10,000 to $24,999 | 3,768 (6.9%) | 2,022 (1.5%) |
| $25,000 to $34,999 | 3,255 (5.9%) | 3,764 (2.7%) |
| $35,000 to $49,999 | 5,149 (9.4%) | 4,199 (3.0%) |
| $50,000 to $74,999 | 8,789 (16.0%) | 7,551 (5.4%) |
| $75,000 to $99,999 | 7,230 (13.2%) | 16,045 (11.6%) |
| $100,000 to $149,999 | 10,270 (18.7%) | 15,778 (11.4%) |
| $150,000 or more | 14,496 (26.4%) | 31,516 (22.7%) |
| Total | 54,855 (100.0%) | 138,762 (100.0%) |
Property Value to Household Income Ratio in Cobb County
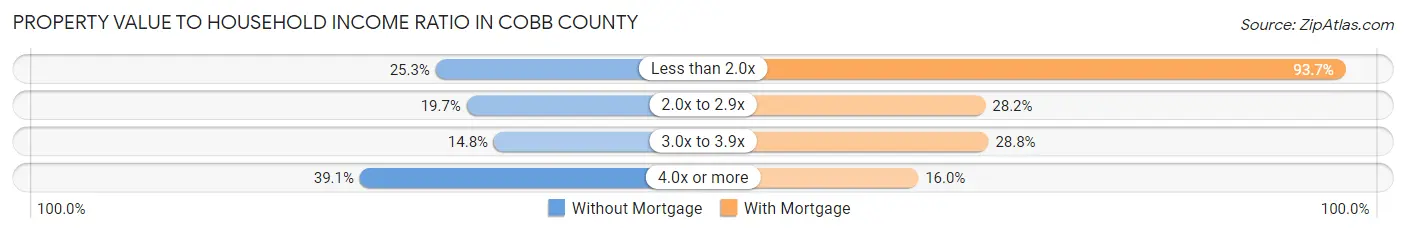
| Value-to-Income Ratio | Without Mortgage | With Mortgage |
| Less than 2.0x | 13,901 (25.3%) | 129,970 (93.7%) |
| 2.0x to 2.9x | 10,810 (19.7%) | 39,178 (28.2%) |
| 3.0x to 3.9x | 8,100 (14.8%) | 39,944 (28.8%) |
| 4.0x or more | 21,458 (39.1%) | 22,243 (16.0%) |
| Total | 54,855 (100.0%) | 138,762 (100.0%) |
Real Estate Taxes by Mortgage Status in Cobb County
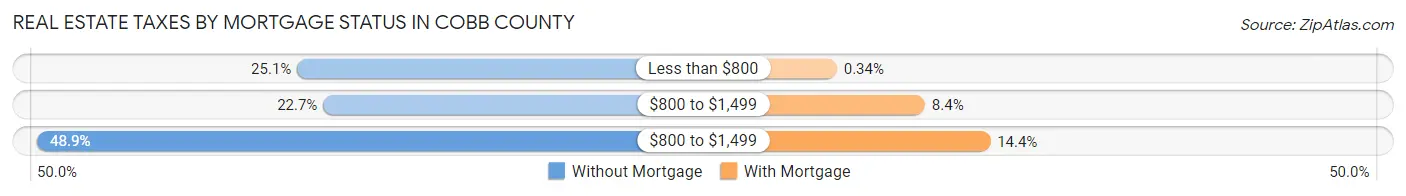
| Property Taxes | Without Mortgage | With Mortgage |
| Less than $800 | 13,775 (25.1%) | 465 (0.3%) |
| $800 to $1,499 | 12,470 (22.7%) | 11,640 (8.4%) |
| $800 to $1,499 | 26,799 (48.8%) | 19,906 (14.3%) |
| Total | 54,855 (100.0%) | 138,762 (100.0%) |
Health & Disability in Cobb County
Health Insurance Coverage by Age in Cobb County
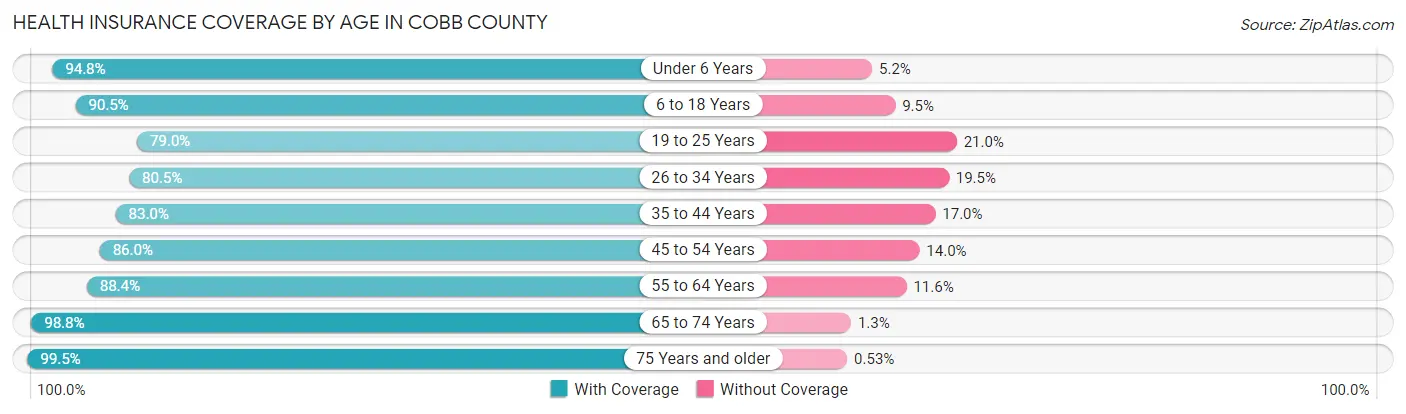
| Age Bracket | With Coverage | Without Coverage |
| Under 6 Years | 51,513 (94.8%) | 2,814 (5.2%) |
| 6 to 18 Years | 119,007 (90.5%) | 12,481 (9.5%) |
| 19 to 25 Years | 54,747 (79.0%) | 14,519 (21.0%) |
| 26 to 34 Years | 80,370 (80.5%) | 19,444 (19.5%) |
| 35 to 44 Years | 89,279 (83.0%) | 18,254 (17.0%) |
| 45 to 54 Years | 91,640 (86.0%) | 14,933 (14.0%) |
| 55 to 64 Years | 82,899 (88.4%) | 10,881 (11.6%) |
| 65 to 74 Years | 61,392 (98.8%) | 775 (1.3%) |
| 75 Years and older | 35,533 (99.5%) | 191 (0.5%) |
| Total | 666,380 (87.6%) | 94,292 (12.4%) |
Health Insurance Coverage by Citizenship Status in Cobb County
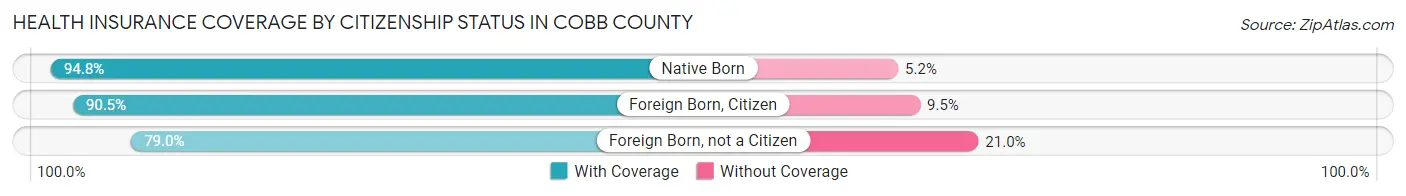
| Citizenship Status | With Coverage | Without Coverage |
| Native Born | 51,513 (94.8%) | 2,814 (5.2%) |
| Foreign Born, Citizen | 119,007 (90.5%) | 12,481 (9.5%) |
| Foreign Born, not a Citizen | 54,747 (79.0%) | 14,519 (21.0%) |
Health Insurance Coverage by Household Income in Cobb County
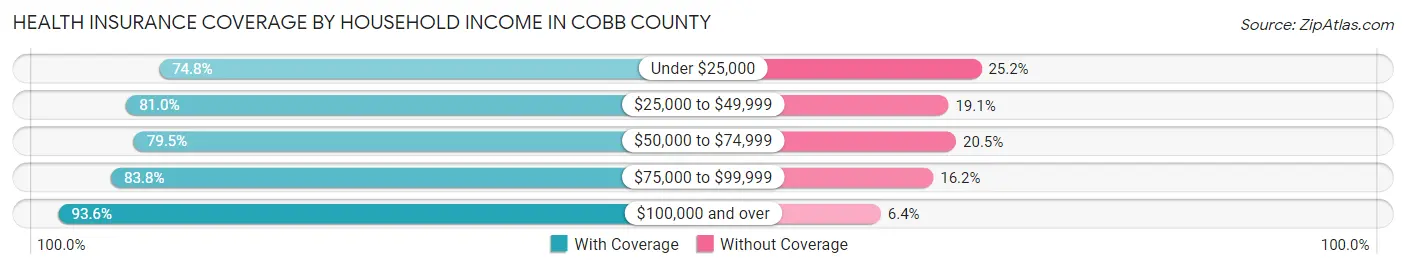
| Household Income | With Coverage | Without Coverage |
| Under $25,000 | 36,397 (74.8%) | 12,281 (25.2%) |
| $25,000 to $49,999 | 72,893 (80.9%) | 17,152 (19.1%) |
| $50,000 to $74,999 | 87,992 (79.5%) | 22,666 (20.5%) |
| $75,000 to $99,999 | 79,170 (83.8%) | 15,305 (16.2%) |
| $100,000 and over | 384,939 (93.6%) | 26,221 (6.4%) |
Public vs Private Health Insurance Coverage by Age in Cobb County
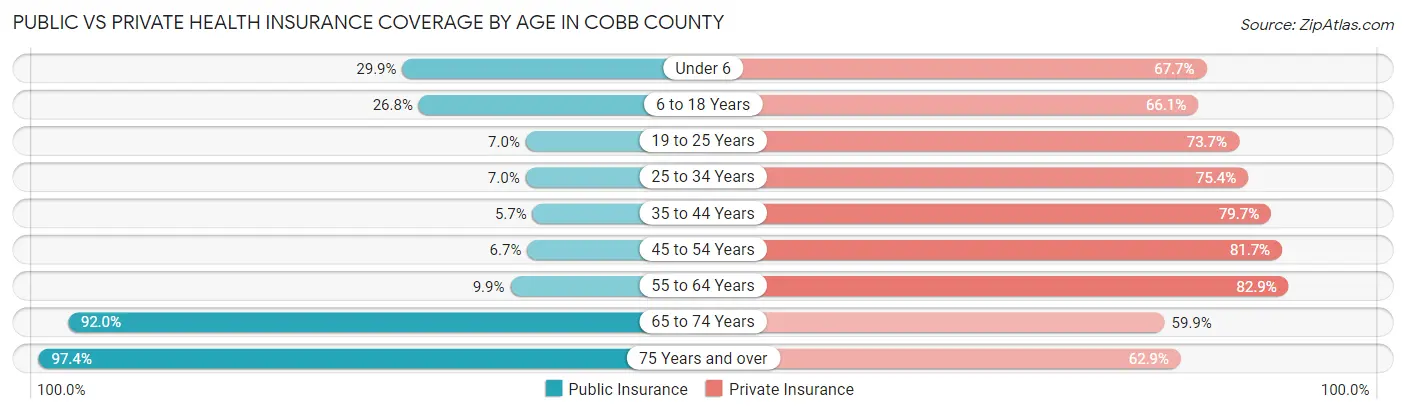
| Age Bracket | Public Insurance | Private Insurance |
| Under 6 | 16,235 (29.9%) | 36,753 (67.6%) |
| 6 to 18 Years | 35,294 (26.8%) | 86,936 (66.1%) |
| 19 to 25 Years | 4,837 (7.0%) | 51,045 (73.7%) |
| 25 to 34 Years | 7,020 (7.0%) | 75,273 (75.4%) |
| 35 to 44 Years | 6,154 (5.7%) | 85,665 (79.7%) |
| 45 to 54 Years | 7,145 (6.7%) | 87,058 (81.7%) |
| 55 to 64 Years | 9,237 (9.9%) | 77,771 (82.9%) |
| 65 to 74 Years | 57,178 (92.0%) | 37,249 (59.9%) |
| 75 Years and over | 34,798 (97.4%) | 22,481 (62.9%) |
| Total | 177,898 (23.4%) | 560,231 (73.7%) |
Disability Status by Sex by Age in Cobb County
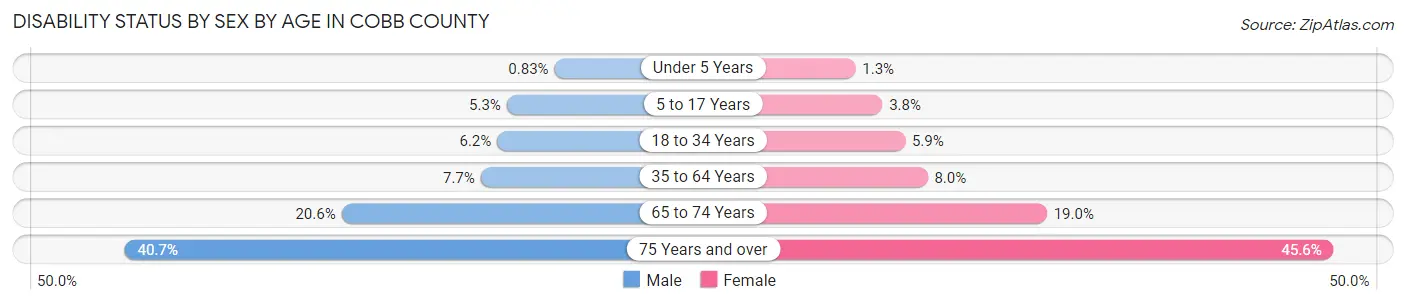
| Age Bracket | Male | Female |
| Under 5 Years | 187 (0.8%) | 273 (1.3%) |
| 5 to 17 Years | 3,486 (5.3%) | 2,428 (3.7%) |
| 18 to 34 Years | 5,518 (6.1%) | 5,282 (5.9%) |
| 35 to 64 Years | 11,445 (7.7%) | 12,631 (8.0%) |
| 65 to 74 Years | 5,849 (20.6%) | 6,421 (19.0%) |
| 75 Years and over | 5,976 (40.7%) | 9,605 (45.6%) |
Disability Class by Sex by Age in Cobb County
Disability Class: Hearing Difficulty
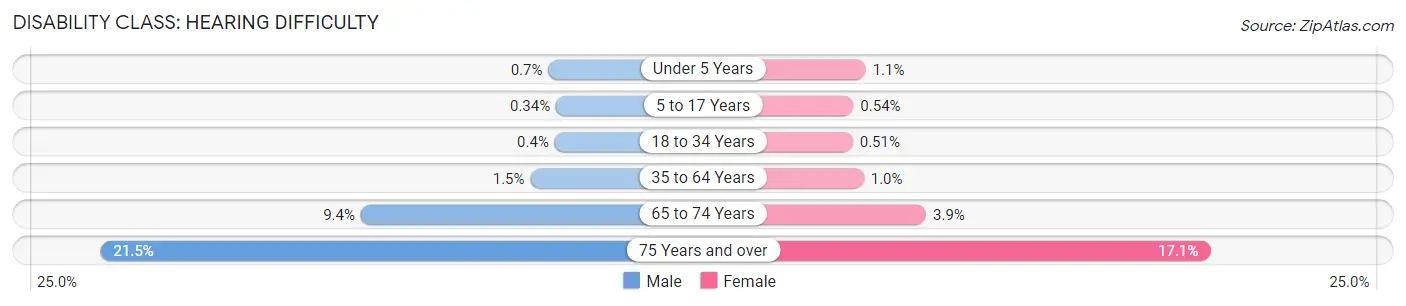
| Age Bracket | Male | Female |
| Under 5 Years | 157 (0.7%) | 242 (1.1%) |
| 5 to 17 Years | 226 (0.3%) | 347 (0.5%) |
| 18 to 34 Years | 357 (0.4%) | 462 (0.5%) |
| 35 to 64 Years | 2,285 (1.5%) | 1,618 (1.0%) |
| 65 to 74 Years | 2,669 (9.4%) | 1,320 (3.9%) |
| 75 Years and over | 3,153 (21.5%) | 3,597 (17.1%) |
Disability Class: Vision Difficulty
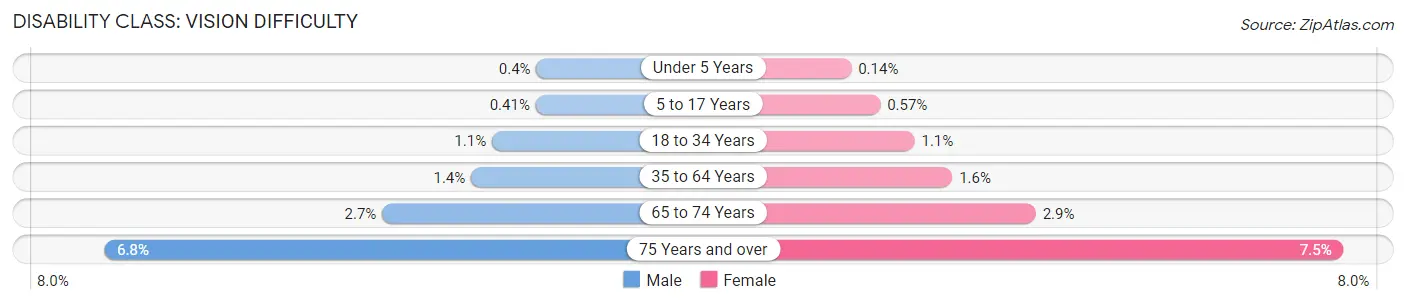
| Age Bracket | Male | Female |
| Under 5 Years | 90 (0.4%) | 31 (0.1%) |
| 5 to 17 Years | 274 (0.4%) | 367 (0.6%) |
| 18 to 34 Years | 950 (1.1%) | 971 (1.1%) |
| 35 to 64 Years | 2,048 (1.4%) | 2,611 (1.6%) |
| 65 to 74 Years | 763 (2.7%) | 973 (2.9%) |
| 75 Years and over | 1,001 (6.8%) | 1,569 (7.4%) |
Disability Class: Cognitive Difficulty
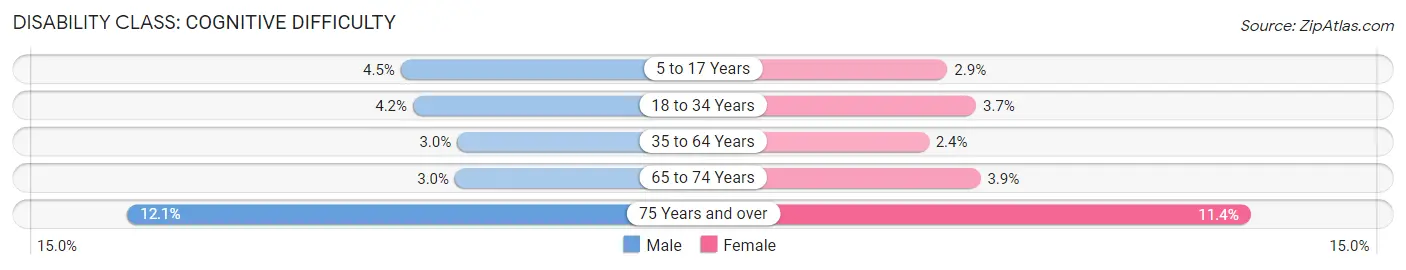
| Age Bracket | Male | Female |
| 5 to 17 Years | 2,999 (4.5%) | 1,899 (2.9%) |
| 18 to 34 Years | 3,758 (4.2%) | 3,371 (3.7%) |
| 35 to 64 Years | 4,419 (3.0%) | 3,847 (2.4%) |
| 65 to 74 Years | 858 (3.0%) | 1,302 (3.9%) |
| 75 Years and over | 1,782 (12.1%) | 2,396 (11.4%) |
Disability Class: Ambulatory Difficulty
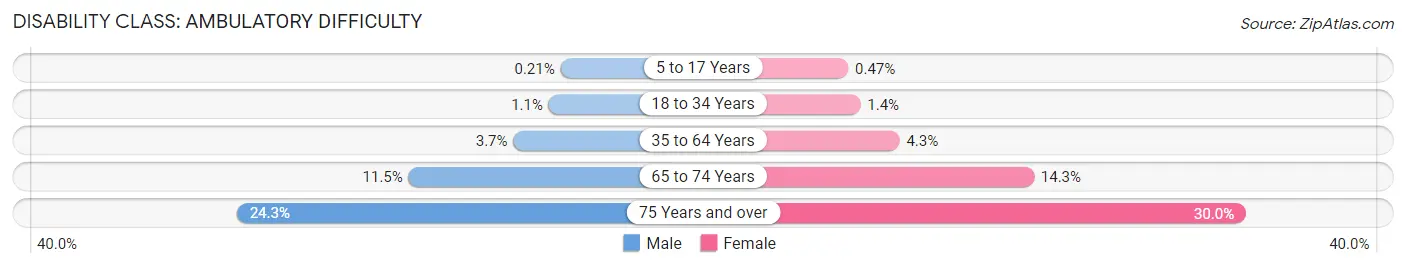
| Age Bracket | Male | Female |
| 5 to 17 Years | 140 (0.2%) | 302 (0.5%) |
| 18 to 34 Years | 967 (1.1%) | 1,241 (1.4%) |
| 35 to 64 Years | 5,536 (3.7%) | 6,801 (4.3%) |
| 65 to 74 Years | 3,264 (11.5%) | 4,815 (14.3%) |
| 75 Years and over | 3,559 (24.2%) | 6,317 (30.0%) |
Disability Class: Self-Care Difficulty
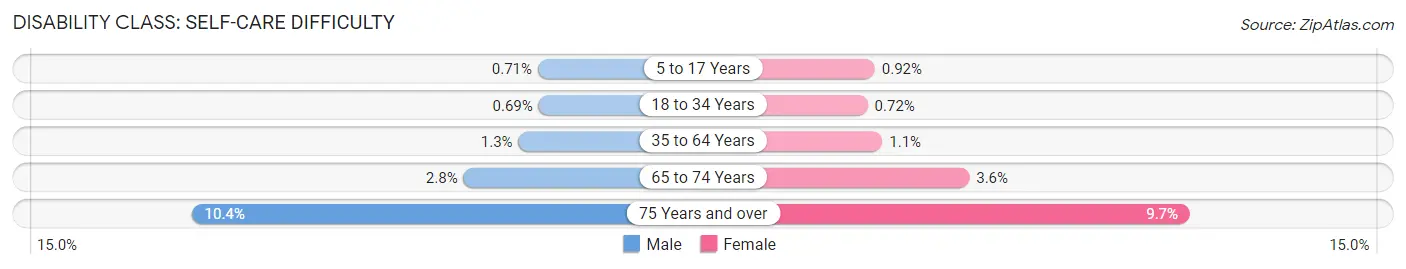
| Age Bracket | Male | Female |
| 5 to 17 Years | 471 (0.7%) | 598 (0.9%) |
| 18 to 34 Years | 623 (0.7%) | 650 (0.7%) |
| 35 to 64 Years | 1,861 (1.3%) | 1,798 (1.1%) |
| 65 to 74 Years | 790 (2.8%) | 1,200 (3.5%) |
| 75 Years and over | 1,519 (10.3%) | 2,039 (9.7%) |
Technology Access in Cobb County
Computing Device Access in Cobb County
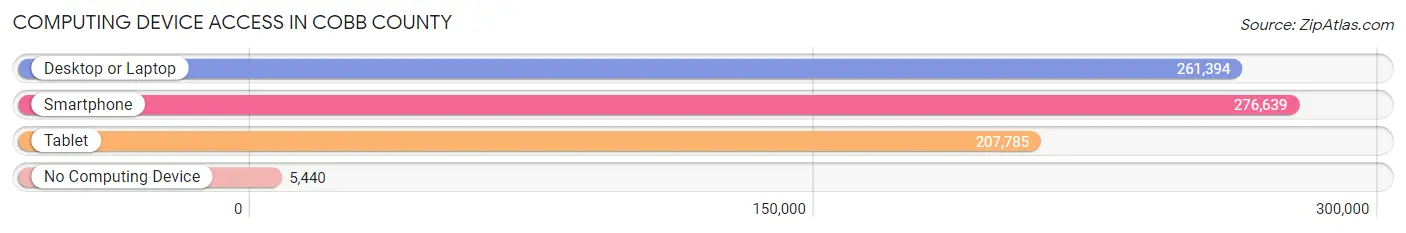
| Device Type | # Households | % Households |
| Desktop or Laptop | 261,394 | 89.8% |
| Smartphone | 276,639 | 95.0% |
| Tablet | 207,785 | 71.4% |
| No Computing Device | 5,440 | 1.9% |
| Total | 291,171 | 100.0% |
Internet Access in Cobb County
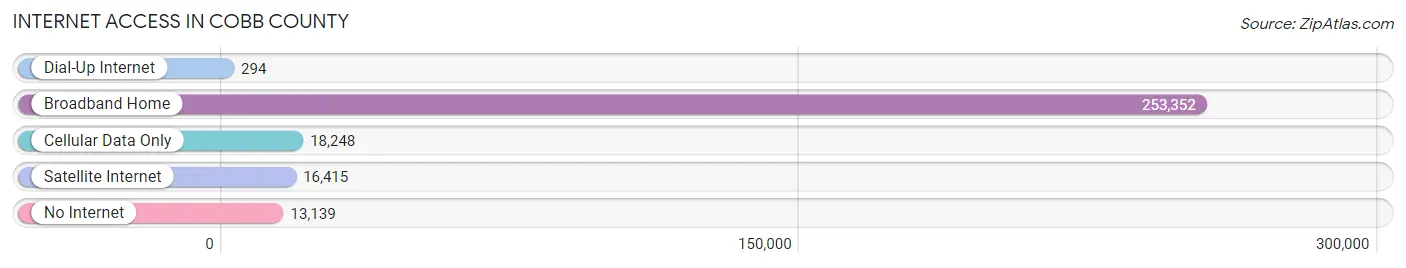
| Internet Type | # Households | % Households |
| Dial-Up Internet | 294 | 0.1% |
| Broadband Home | 253,352 | 87.0% |
| Cellular Data Only | 18,248 | 6.3% |
| Satellite Internet | 16,415 | 5.6% |
| No Internet | 13,139 | 4.5% |
| Total | 291,171 | 100.0% |
Cobb County Summary
Cobb County, Georgia is located in the northwestern part of the state, just outside of Atlanta. It is bordered by Fulton County to the east, Cherokee County to the north, Paulding County to the west, and Douglas County to the south. The county seat is Marietta, and the county is named after Thomas Willis Cobb, a former United States Representative and Senator from Georgia.
History
Cobb County was created in 1832 from the Cherokee Nation lands. The county was named after Thomas Willis Cobb, a former United States Representative and Senator from Georgia. The county was originally part of the Cherokee Nation, but was ceded to the United States in the Treaty of New Echota in 1835. The county was then divided into two parts, with the western portion becoming Paulding County in 1832.
The county was home to many Native American tribes, including the Creek, Cherokee, and Shawnee. The county was also home to many early settlers, including the families of John Ross, James and William Cobb, and the families of John and William Frey.
In the early 1800s, the county was home to many small farms and plantations. The county was also home to several small towns, including Marietta, Acworth, and Powder Springs.
Geography
Cobb County is located in the northwestern part of the state, just outside of Atlanta. It is bordered by Fulton County to the east, Cherokee County to the north, Paulding County to the west, and Douglas County to the south. The county covers an area of 344 square miles, with a population of 741,334 as of the 2020 census.
The county is mostly made up of rolling hills and valleys, with the Chattahoochee River running through the center of the county. The county is home to several state parks, including Kennesaw Mountain National Battlefield Park, Sweetwater Creek State Park, and Red Top Mountain State Park.
Economy
Cobb County is home to a diverse economy, with a variety of industries and businesses. The county is home to several large corporations, including Lockheed Martin, Home Depot, and Coca-Cola. The county is also home to several smaller businesses, including restaurants, retail stores, and professional services.
The county is home to several major shopping centers, including Cumberland Mall, Town Center at Cobb, and The Avenue West Cobb. The county is also home to several major employers, including WellStar Health System, Cobb County School District, and Dobbins Air Reserve Base.
Demographics
As of the 2020 census, the population of Cobb County was 741,334, with a population density of 2,093 people per square mile. The median household income was $68,945, and the median age was 36.
The racial makeup of the county was 68.3% White, 19.2% Black or African American, 6.2% Asian, 0.4% Native American, 0.1% Pacific Islander, 3.2% from other races, and 2.7% from two or more races. The Hispanic or Latino population was 8.7%.
Conclusion
Cobb County, Georgia is a diverse county located in the northwestern part of the state, just outside of Atlanta. The county is home to a variety of industries and businesses, and is home to several major employers. The county is also home to a diverse population, with a median age of 36 and a median household income of $68,945.
Common Questions
What is the Total Population of Cobb County?
Total Population of Cobb County is 765,813.
What is the Total Male Population of Cobb County?
Total Male Population of Cobb County is 373,782.
What is the Total Female Population of Cobb County?
Total Female Population of Cobb County is 392,031.
What is the Ratio of Males per 100 Females in Cobb County?
There are 95.35 Males per 100 Females in Cobb County.
What is the Ratio of Females per 100 Males in Cobb County?
There are 104.88 Females per 100 Males in Cobb County.
What is the Median Population Age in Cobb County?
Median Population Age in Cobb County is 37.2 Years.
What is the Average Family Size in Cobb County
Average Family Size in Cobb County is 3.1 People.
What is the Average Household Size in Cobb County
Average Household Size in Cobb County is 2.6 People.
What is Per Capita Income in Cobb County?
Per Capita income in Cobb County is $48,510.
What is the Median Family Income in Cobb County?
Median Family Income in Cobb County is $114,362.
What is the Median Household income in Cobb County?
Median Household Income in Cobb County is $94,244.
What is Income or Wage Gap in Cobb County?
Income or Wage Gap in Cobb County is 22.3%.
Women in Cobb County earn 77.7 cents for every dollar earned by a man.
What is Family Income Deficit in Cobb County?
Family Income Deficit in Cobb County is $10,676.
Families that are below poverty line in Cobb County earn $10,676 less on average than the poverty threshold level.
What is Inequality or Gini Index in Cobb County?
Inequality or Gini Index in Cobb County is 0.44.
How Large is the Labor Force in Cobb County?
There are 430,547 People in the Labor Forcein in Cobb County.
What is the Percentage of People in the Labor Force in Cobb County?
70.3% of People are in the Labor Force in Cobb County.
What is the Unemployment Rate in Cobb County?
Unemployment Rate in Cobb County is 4.6%.