Paulding County, GA
Paulding County Map
Paulding County Overview
169,898
TOTAL POPULATION
83,341
MALE POPULATION
86,557
FEMALE POPULATION
96.28
MALES / 100 FEMALES
103.86
FEMALES / 100 MALES
36.6
MEDIAN AGE
3.4
AVG FAMILY SIZE
3.0
AVG HOUSEHOLD SIZE
$35,242
PER CAPITA INCOME
$98,072
AVG FAMILY INCOME
$89,237
AVG HOUSEHOLD INCOME
26.5%
WAGE / INCOME GAP [ % ]
73.5¢/ $1
WAGE / INCOME GAP [ $ ]
$11,288
FAMILY INCOME DEFICIT
0.35
INEQUALITY / GINI INDEX
88,026
LABOR FORCE [ PEOPLE ]
66.7%
PERCENT IN LABOR FORCE
4.1%
UNEMPLOYMENT RATE
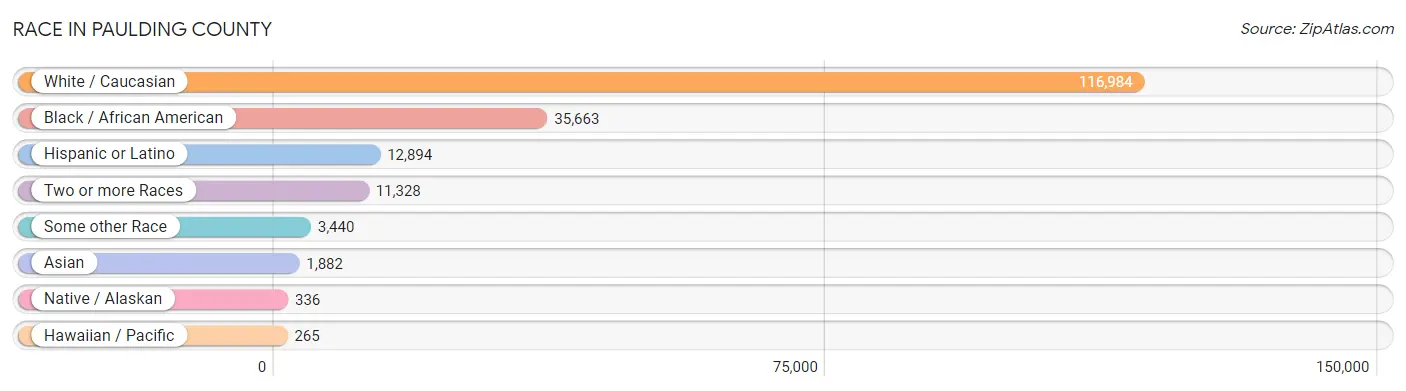
Race in Paulding County
The most populous races in Paulding County are White / Caucasian (116,984 | 68.9%), Black / African American (35,663 | 21.0%), and Hispanic or Latino (12,894 | 7.6%).
| Race | # Population | % Population |
| Asian | 1,882 | 1.1% |
| Black / African American | 35,663 | 21.0% |
| Hawaiian / Pacific | 265 | 0.2% |
| Hispanic or Latino | 12,894 | 7.6% |
| Native / Alaskan | 336 | 0.2% |
| White / Caucasian | 116,984 | 68.9% |
| Two or more Races | 11,328 | 6.7% |
| Some other Race | 3,440 | 2.0% |
| Total | 169,898 | 100.0% |
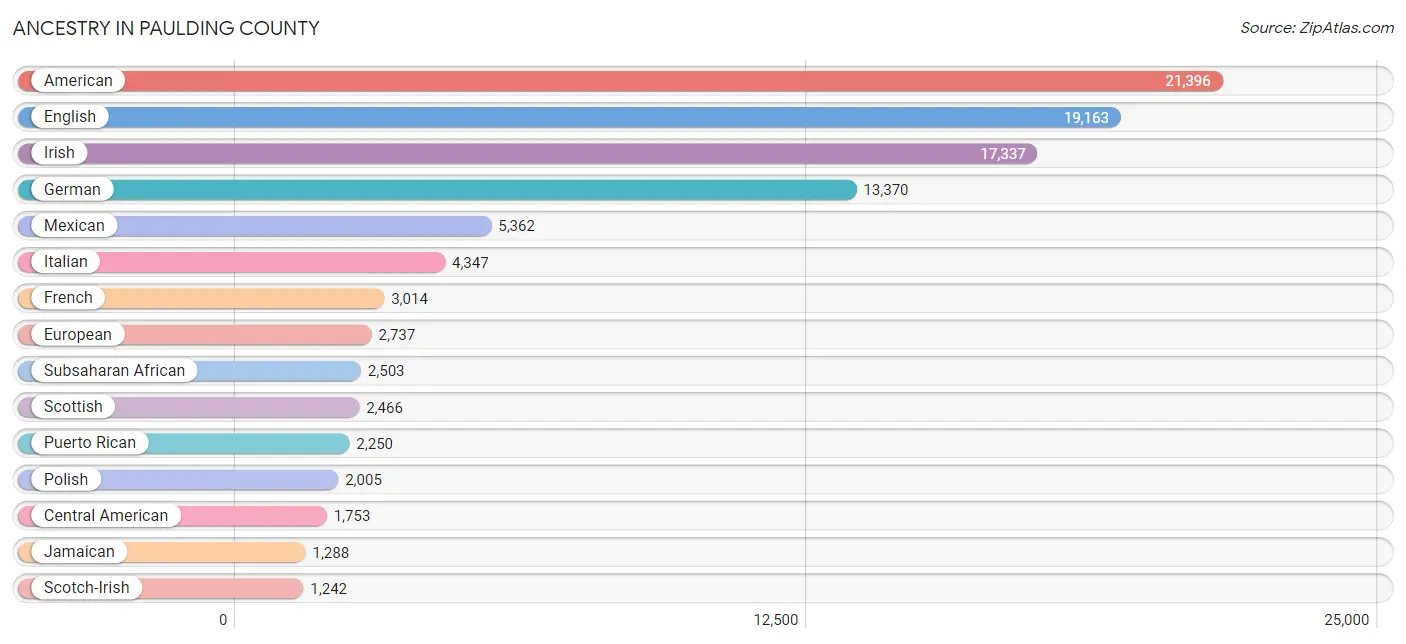
Ancestry in Paulding County
The most populous ancestries reported in Paulding County are American (21,396 | 12.6%), English (19,163 | 11.3%), Irish (17,337 | 10.2%), German (13,370 | 7.9%), and Mexican (5,362 | 3.2%), together accounting for 45.1% of all Paulding County residents.
| Ancestry | # Population | % Population |
| African | 1,187 | 0.7% |
| Albanian | 60 | 0.0% |
| American | 21,396 | 12.6% |
| Apache | 11 | 0.0% |
| Arab | 91 | 0.1% |
| Armenian | 30 | 0.0% |
| Austrian | 26 | 0.0% |
| Bahamian | 474 | 0.3% |
| Barbadian | 19 | 0.0% |
| Basque | 35 | 0.0% |
| Bermudan | 11 | 0.0% |
| Bhutanese | 249 | 0.2% |
| Blackfeet | 13 | 0.0% |
| Brazilian | 32 | 0.0% |
| British | 966 | 0.6% |
| Burmese | 136 | 0.1% |
| Cajun | 13 | 0.0% |
| Canadian | 215 | 0.1% |
| Celtic | 26 | 0.0% |
| Central American | 1,753 | 1.0% |
| Central American Indian | 222 | 0.1% |
| Cherokee | 462 | 0.3% |
| Chilean | 30 | 0.0% |
| Chinese | 31 | 0.0% |
| Chippewa | 11 | 0.0% |
| Choctaw | 229 | 0.1% |
| Colombian | 279 | 0.2% |
| Costa Rican | 302 | 0.2% |
| Creek | 24 | 0.0% |
| Croatian | 32 | 0.0% |
| Crow | 8 | 0.0% |
| Cuban | 1,113 | 0.7% |
| Czech | 206 | 0.1% |
| Czechoslovakian | 59 | 0.0% |
| Danish | 122 | 0.1% |
| Dominican | 529 | 0.3% |
| Dutch | 1,238 | 0.7% |
| Dutch West Indian | 11 | 0.0% |
| Eastern European | 70 | 0.0% |
| English | 19,163 | 11.3% |
| European | 2,737 | 1.6% |
| Finnish | 120 | 0.1% |
| French | 3,014 | 1.8% |
| French Canadian | 260 | 0.2% |
| German | 13,370 | 7.9% |
| Ghanaian | 63 | 0.0% |
| Greek | 695 | 0.4% |
| Guatemalan | 211 | 0.1% |
| Guyanese | 519 | 0.3% |
| Haitian | 1,049 | 0.6% |
| Honduran | 447 | 0.3% |
| Hungarian | 157 | 0.1% |
| Indian (Asian) | 359 | 0.2% |
| Inupiat | 27 | 0.0% |
| Iranian | 99 | 0.1% |
| Irish | 17,337 | 10.2% |
| Italian | 4,347 | 2.6% |
| Jamaican | 1,288 | 0.8% |
| Japanese | 99 | 0.1% |
| Kenyan | 320 | 0.2% |
| Korean | 838 | 0.5% |
| Laotian | 49 | 0.0% |
| Lebanese | 46 | 0.0% |
| Liberian | 85 | 0.1% |
| Lithuanian | 50 | 0.0% |
| Lumbee | 1 | 0.0% |
| Mexican | 5,362 | 3.2% |
| Mexican American Indian | 360 | 0.2% |
| Native Hawaiian | 79 | 0.1% |
| Navajo | 7 | 0.0% |
| New Zealander | 106 | 0.1% |
| Nicaraguan | 164 | 0.1% |
| Nigerian | 651 | 0.4% |
| Northern European | 43 | 0.0% |
| Norwegian | 812 | 0.5% |
| Pakistani | 32 | 0.0% |
| Palestinian | 10 | 0.0% |
| Panamanian | 14 | 0.0% |
| Pennsylvania German | 19 | 0.0% |
| Peruvian | 299 | 0.2% |
| Polish | 2,005 | 1.2% |
| Portuguese | 344 | 0.2% |
| Puerto Rican | 2,250 | 1.3% |
| Romanian | 91 | 0.1% |
| Russian | 62 | 0.0% |
| Salvadoran | 615 | 0.4% |
| Scandinavian | 211 | 0.1% |
| Scotch-Irish | 1,242 | 0.7% |
| Scottish | 2,466 | 1.5% |
| Sioux | 19 | 0.0% |
| Slovak | 117 | 0.1% |
| Slovene | 42 | 0.0% |
| South African | 36 | 0.0% |
| South American | 770 | 0.4% |
| Spaniard | 342 | 0.2% |
| Spanish | 283 | 0.2% |
| Sri Lankan | 229 | 0.1% |
| Subsaharan African | 2,503 | 1.5% |
| Swedish | 406 | 0.2% |
| Swiss | 55 | 0.0% |
| Thai | 699 | 0.4% |
| Trinidadian and Tobagonian | 147 | 0.1% |
| Turkish | 213 | 0.1% |
| U.S. Virgin Islander | 16 | 0.0% |
| Ukrainian | 190 | 0.1% |
| Uruguayan | 62 | 0.0% |
| Venezuelan | 100 | 0.1% |
| Welsh | 1,226 | 0.7% |
| West Indian | 134 | 0.1% |
| Yugoslavian | 278 | 0.2% | View All 110 Rows |
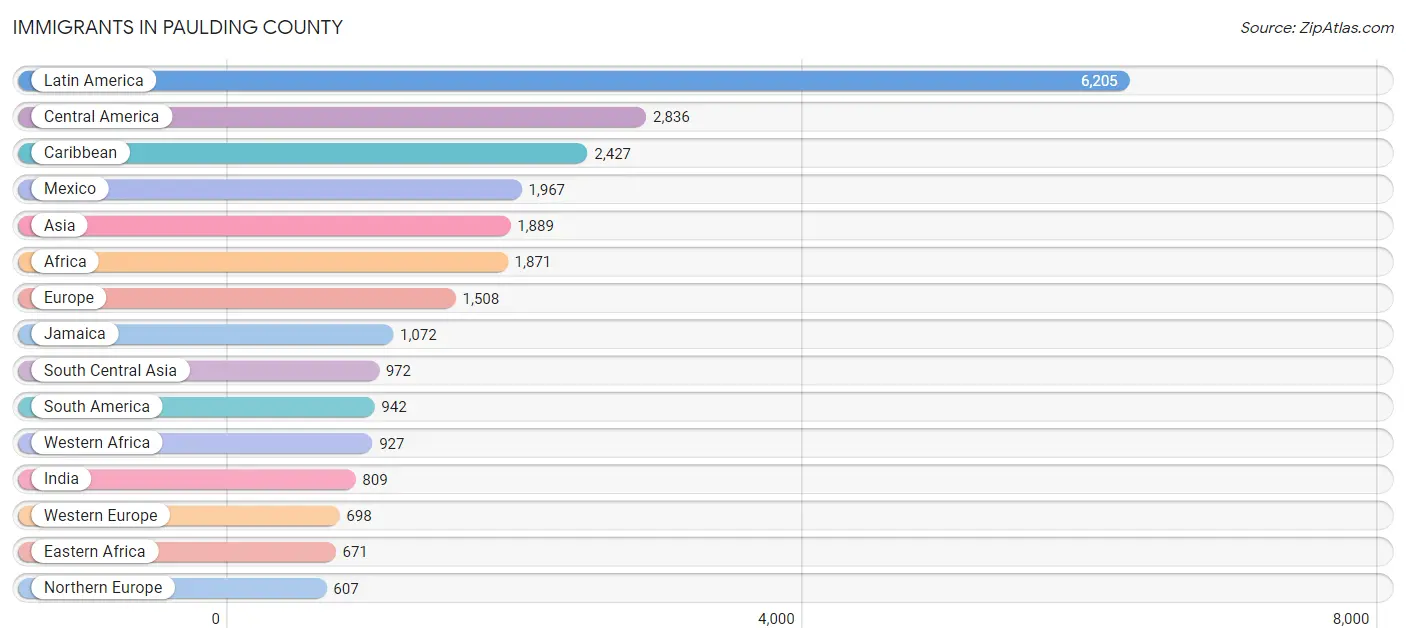
Immigrants in Paulding County
The most numerous immigrant groups reported in Paulding County came from Latin America (6,205 | 3.6%), Central America (2,836 | 1.7%), Caribbean (2,427 | 1.4%), Mexico (1,967 | 1.2%), and Asia (1,889 | 1.1%), together accounting for 9.0% of all Paulding County residents.
| Immigration Origin | # Population | % Population |
| Afghanistan | 2 | 0.0% |
| Africa | 1,871 | 1.1% |
| Asia | 1,889 | 1.1% |
| Australia | 21 | 0.0% |
| Bahamas | 178 | 0.1% |
| Barbados | 32 | 0.0% |
| Brazil | 87 | 0.1% |
| Cambodia | 19 | 0.0% |
| Cameroon | 61 | 0.0% |
| Canada | 301 | 0.2% |
| Caribbean | 2,427 | 1.4% |
| Central America | 2,836 | 1.7% |
| Chile | 28 | 0.0% |
| China | 301 | 0.2% |
| Colombia | 149 | 0.1% |
| Costa Rica | 75 | 0.0% |
| Cuba | 373 | 0.2% |
| Dominican Republic | 222 | 0.1% |
| Eastern Africa | 671 | 0.4% |
| Eastern Asia | 417 | 0.3% |
| Eastern Europe | 125 | 0.1% |
| El Salvador | 314 | 0.2% |
| England | 170 | 0.1% |
| Europe | 1,508 | 0.9% |
| France | 94 | 0.1% |
| Germany | 604 | 0.4% |
| Ghana | 175 | 0.1% |
| Greece | 14 | 0.0% |
| Guatemala | 38 | 0.0% |
| Guyana | 264 | 0.2% |
| Haiti | 345 | 0.2% |
| Honduras | 322 | 0.2% |
| Hungary | 53 | 0.0% |
| India | 809 | 0.5% |
| Indonesia | 49 | 0.0% |
| Ireland | 115 | 0.1% |
| Israel | 34 | 0.0% |
| Italy | 40 | 0.0% |
| Jamaica | 1,072 | 0.6% |
| Japan | 94 | 0.1% |
| Jordan | 4 | 0.0% |
| Kenya | 547 | 0.3% |
| Korea | 22 | 0.0% |
| Latin America | 6,205 | 3.6% |
| Liberia | 131 | 0.1% |
| Mexico | 1,967 | 1.2% |
| Micronesia | 159 | 0.1% |
| Middle Africa | 61 | 0.0% |
| Moldova | 72 | 0.0% |
| Nicaragua | 120 | 0.1% |
| Nigeria | 581 | 0.3% |
| Northern Europe | 607 | 0.4% |
| Oceania | 216 | 0.1% |
| Pakistan | 161 | 0.1% |
| Peru | 237 | 0.1% |
| Philippines | 357 | 0.2% |
| South Africa | 212 | 0.1% |
| South America | 942 | 0.5% |
| South Central Asia | 972 | 0.6% |
| South Eastern Asia | 462 | 0.3% |
| Southern Europe | 78 | 0.1% |
| Spain | 24 | 0.0% |
| Taiwan | 39 | 0.0% |
| Trinidad and Tobago | 103 | 0.1% |
| Uganda | 36 | 0.0% |
| Uruguay | 82 | 0.1% |
| Venezuela | 95 | 0.1% |
| Vietnam | 37 | 0.0% |
| Western Africa | 927 | 0.5% |
| Western Asia | 38 | 0.0% |
| Western Europe | 698 | 0.4% | View All 71 Rows |
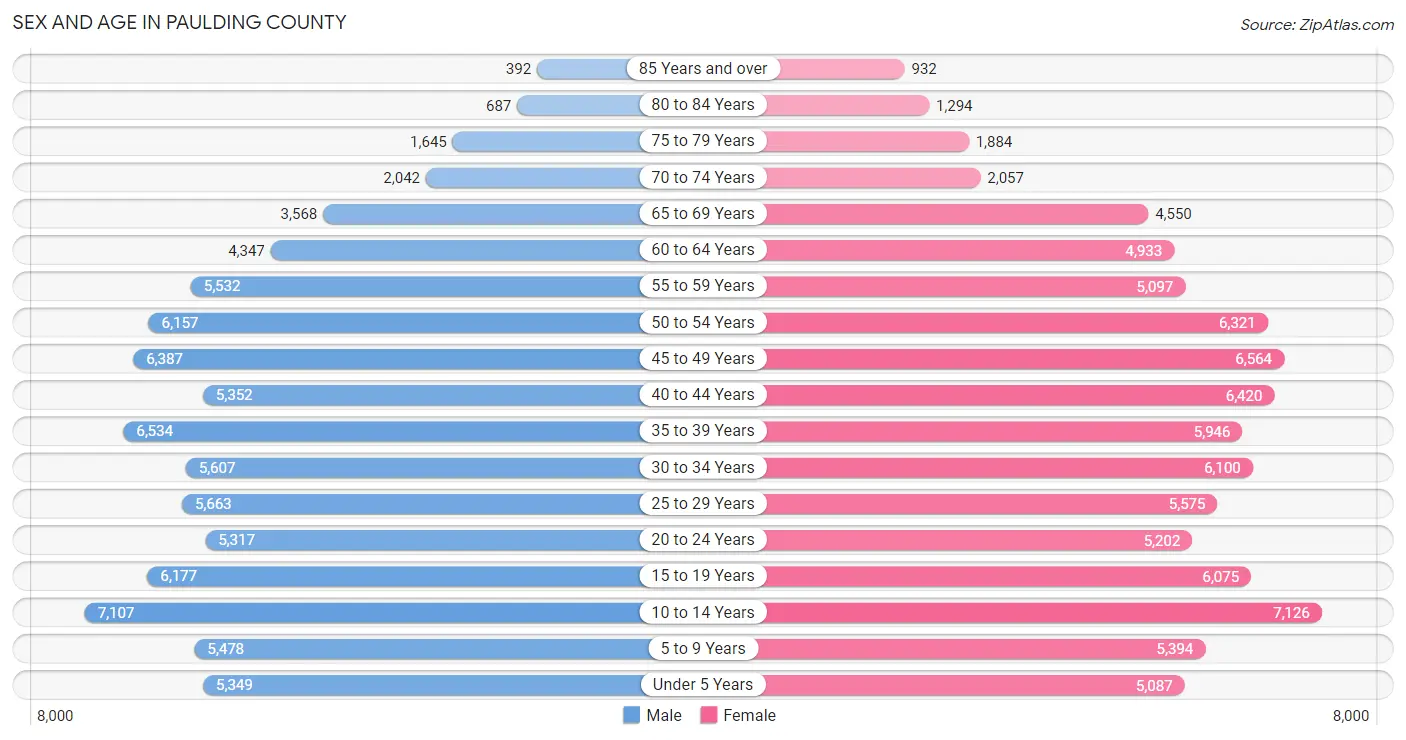
Sex and Age in Paulding County
Sex and Age in Paulding County
The most populous age groups in Paulding County are 10 to 14 Years (7,107 | 8.5%) for men and 10 to 14 Years (7,126 | 8.2%) for women.
| Age Bracket | Male | Female |
| Under 5 Years | 5,349 (6.4%) | 5,087 (5.9%) |
| 5 to 9 Years | 5,478 (6.6%) | 5,394 (6.2%) |
| 10 to 14 Years | 7,107 (8.5%) | 7,126 (8.2%) |
| 15 to 19 Years | 6,177 (7.4%) | 6,075 (7.0%) |
| 20 to 24 Years | 5,317 (6.4%) | 5,202 (6.0%) |
| 25 to 29 Years | 5,663 (6.8%) | 5,575 (6.4%) |
| 30 to 34 Years | 5,607 (6.7%) | 6,100 (7.0%) |
| 35 to 39 Years | 6,534 (7.8%) | 5,946 (6.9%) |
| 40 to 44 Years | 5,352 (6.4%) | 6,420 (7.4%) |
| 45 to 49 Years | 6,387 (7.7%) | 6,564 (7.6%) |
| 50 to 54 Years | 6,157 (7.4%) | 6,321 (7.3%) |
| 55 to 59 Years | 5,532 (6.6%) | 5,097 (5.9%) |
| 60 to 64 Years | 4,347 (5.2%) | 4,933 (5.7%) |
| 65 to 69 Years | 3,568 (4.3%) | 4,550 (5.3%) |
| 70 to 74 Years | 2,042 (2.5%) | 2,057 (2.4%) |
| 75 to 79 Years | 1,645 (2.0%) | 1,884 (2.2%) |
| 80 to 84 Years | 687 (0.8%) | 1,294 (1.5%) |
| 85 Years and over | 392 (0.5%) | 932 (1.1%) |
| Total | 83,341 (100.0%) | 86,557 (100.0%) |
Families and Households in Paulding County
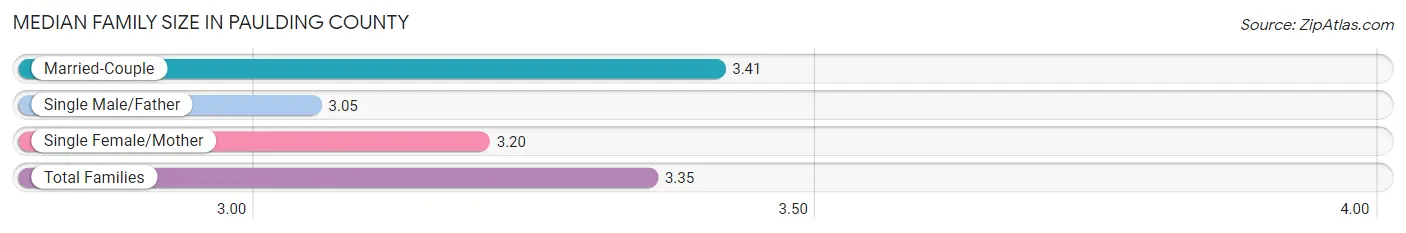
Median Family Size in Paulding County
The median family size in Paulding County is 3.35 persons per family, with married-couple families (35,095 | 78.7%) accounting for the largest median family size of 3.41 persons per family. On the other hand, single male/father families (2,501 | 5.6%) represent the smallest median family size with 3.05 persons per family.
| Family Type | # Families | Family Size |
| Married-Couple | 35,095 (78.7%) | 3.41 |
| Single Male/Father | 2,501 (5.6%) | 3.05 |
| Single Female/Mother | 7,005 (15.7%) | 3.20 |
| Total Families | 44,601 (100.0%) | 3.35 |
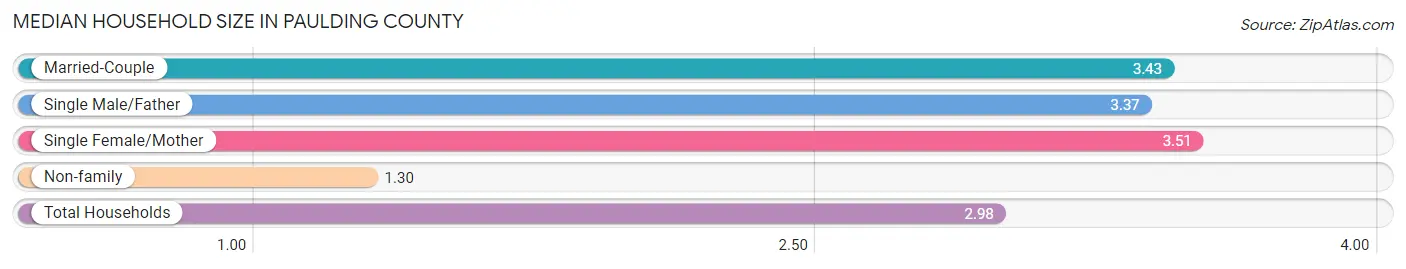
Median Household Size in Paulding County
The median household size in Paulding County is 2.98 persons per household, with single female/mother households (7,005 | 12.3%) accounting for the largest median household size of 3.51 persons per household. non-family households (12,114 | 21.4%) represent the smallest median household size with 1.30 persons per household.
| Household Type | # Households | Household Size |
| Married-Couple | 35,095 (61.9%) | 3.43 |
| Single Male/Father | 2,501 (4.4%) | 3.37 |
| Single Female/Mother | 7,005 (12.3%) | 3.51 |
| Non-family | 12,114 (21.4%) | 1.30 |
| Total Households | 56,715 (100.0%) | 2.98 |
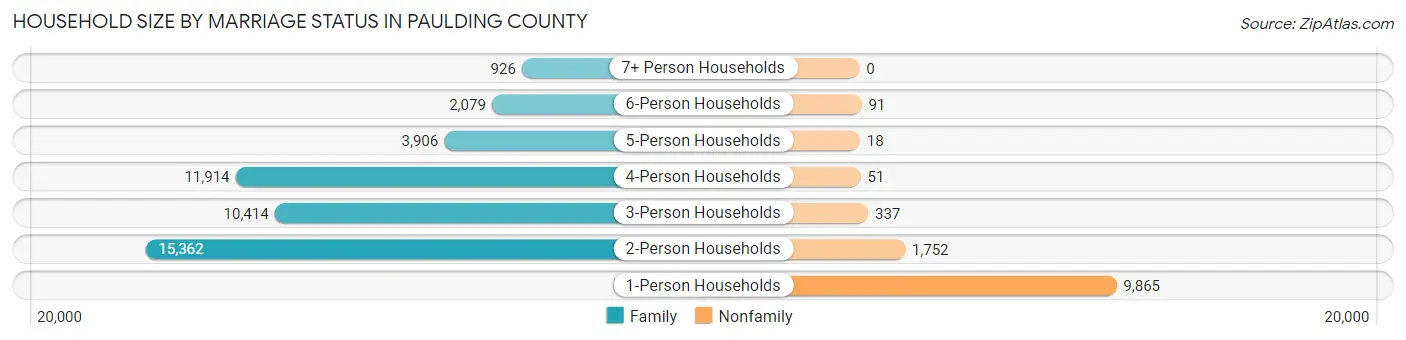
Household Size by Marriage Status in Paulding County
Out of a total of 56,715 households in Paulding County, 44,601 (78.6%) are family households, while 12,114 (21.4%) are nonfamily households. The most numerous type of family households are 2-person households, comprising 15,362, and the most common type of nonfamily households are 1-person households, comprising 9,865.
| Household Size | Family Households | Nonfamily Households |
| 1-Person Households | - | 9,865 (17.4%) |
| 2-Person Households | 15,362 (27.1%) | 1,752 (3.1%) |
| 3-Person Households | 10,414 (18.4%) | 337 (0.6%) |
| 4-Person Households | 11,914 (21.0%) | 51 (0.1%) |
| 5-Person Households | 3,906 (6.9%) | 18 (0.0%) |
| 6-Person Households | 2,079 (3.7%) | 91 (0.2%) |
| 7+ Person Households | 926 (1.6%) | 0 (0.0%) |
| Total | 44,601 (78.6%) | 12,114 (21.4%) |
Female Fertility in Paulding County
Fertility by Age in Paulding County
Average fertility rate in Paulding County is 57.0 births per 1,000 women. Women in the age bracket of 20 to 34 years have the highest fertility rate with 103.0 births per 1,000 women. Women in the age bracket of 20 to 34 years acount for 71.1% of all women with births.

| Age Bracket | Women with Births | Births / 1,000 Women |
| 15 to 19 years | 201 (8.2%) | 33.0 |
| 20 to 34 years | 1,734 (71.1%) | 103.0 |
| 35 to 50 years | 504 (20.7%) | 25.0 |
| Total | 2,439 (100.0%) | 57.0 |
Fertility by Age by Marriage Status in Paulding County
75.7% of women with births (2,439) in Paulding County are married. The highest percentage of unmarried women with births falls into 15 to 19 years age bracket with 100.0% of them unmarried at the time of birth, while the lowest percentage of unmarried women with births belong to 35 to 50 years age bracket with 13.5% of them unmarried.
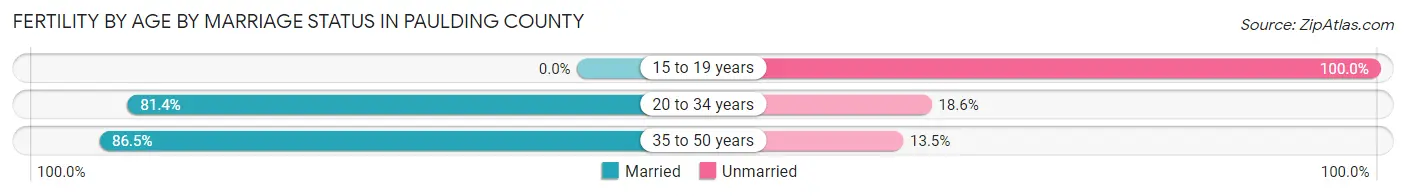
| Age Bracket | Married | Unmarried |
| 15 to 19 years | 0 (0.0%) | 201 (100.0%) |
| 20 to 34 years | 1,411 (81.4%) | 323 (18.6%) |
| 35 to 50 years | 436 (86.5%) | 68 (13.5%) |
| Total | 1,846 (75.7%) | 593 (24.3%) |
Fertility by Education in Paulding County
Average fertility rate in Paulding County is 57.0 births per 1,000 women. Women with the education attainment of high school diploma have the highest fertility rate of 82.0 births per 1,000 women, while women with the education attainment of less than high school have the lowest fertility at 4.0 births per 1,000 women. Women with the education attainment of high school diploma represent 37.3% of all women with births.
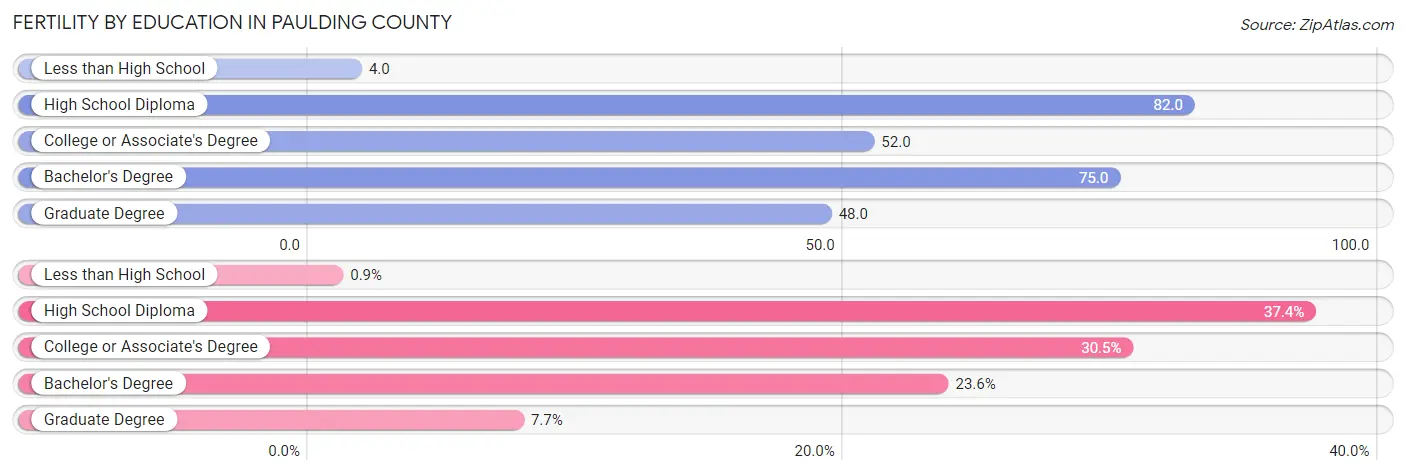
| Educational Attainment | Women with Births | Births / 1,000 Women |
| Less than High School | 22 (0.9%) | 4.0 |
| High School Diploma | 911 (37.3%) | 82.0 |
| College or Associate's Degree | 744 (30.5%) | 52.0 |
| Bachelor's Degree | 575 (23.6%) | 75.0 |
| Graduate Degree | 187 (7.7%) | 48.0 |
| Total | 2,439 (100.0%) | 57.0 |
Fertility by Education by Marriage Status in Paulding County
24.3% of women with births in Paulding County are unmarried. Women with the educational attainment of less than high school are most likely to be married with 100.0% of them married at childbirth, while women with the educational attainment of high school diploma are least likely to be married with 46.1% of them unmarried at childbirth.
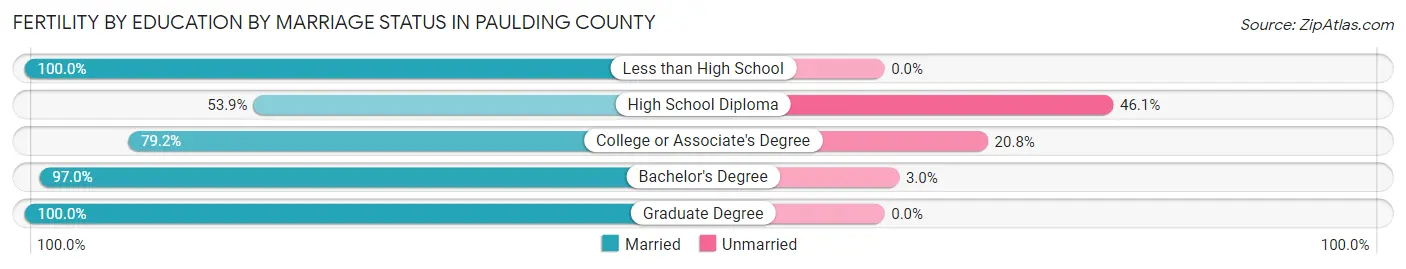
| Educational Attainment | Married | Unmarried |
| Less than High School | 22 (100.0%) | 0 (0.0%) |
| High School Diploma | 491 (53.9%) | 420 (46.1%) |
| College or Associate's Degree | 589 (79.2%) | 155 (20.8%) |
| Bachelor's Degree | 558 (97.0%) | 17 (3.0%) |
| Graduate Degree | 187 (100.0%) | 0 (0.0%) |
| Total | 1,846 (75.7%) | 593 (24.3%) |
Income in Paulding County
Income Overview in Paulding County
Per Capita Income in Paulding County is $35,242, while median incomes of families and households are $98,072 and $89,237 respectively.
| Characteristic | Number | Measure |
| Per Capita Income | 169,898 | $35,242 |
| Median Family Income | 44,601 | $98,072 |
| Mean Family Income | 44,601 | $109,844 |
| Median Household Income | 56,715 | $89,237 |
| Mean Household Income | 56,715 | $102,401 |
| Income Deficit | 44,601 | $11,288 |
| Wage / Income Gap (%) | 169,898 | 26.46% |
| Wage / Income Gap ($) | 169,898 | 73.54¢ per $1 |
| Gini / Inequality Index | 169,898 | 0.35 |
Earnings by Sex in Paulding County
Average Earnings in Paulding County are $46,091, $53,333 for men and $39,222 for women, a difference of 26.5%.
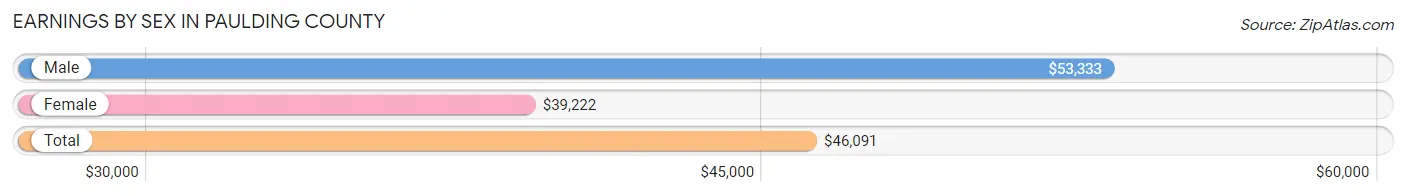
| Sex | Number | Average Earnings |
| Male | 48,381 (53.0%) | $53,333 |
| Female | 42,901 (47.0%) | $39,222 |
| Total | 91,282 (100.0%) | $46,091 |
Earnings by Sex by Income Bracket in Paulding County
The most common earnings brackets in Paulding County are $100,000+ for men (8,867 | 18.3%) and $75,000 to $99,999 for women (4,471 | 10.4%).
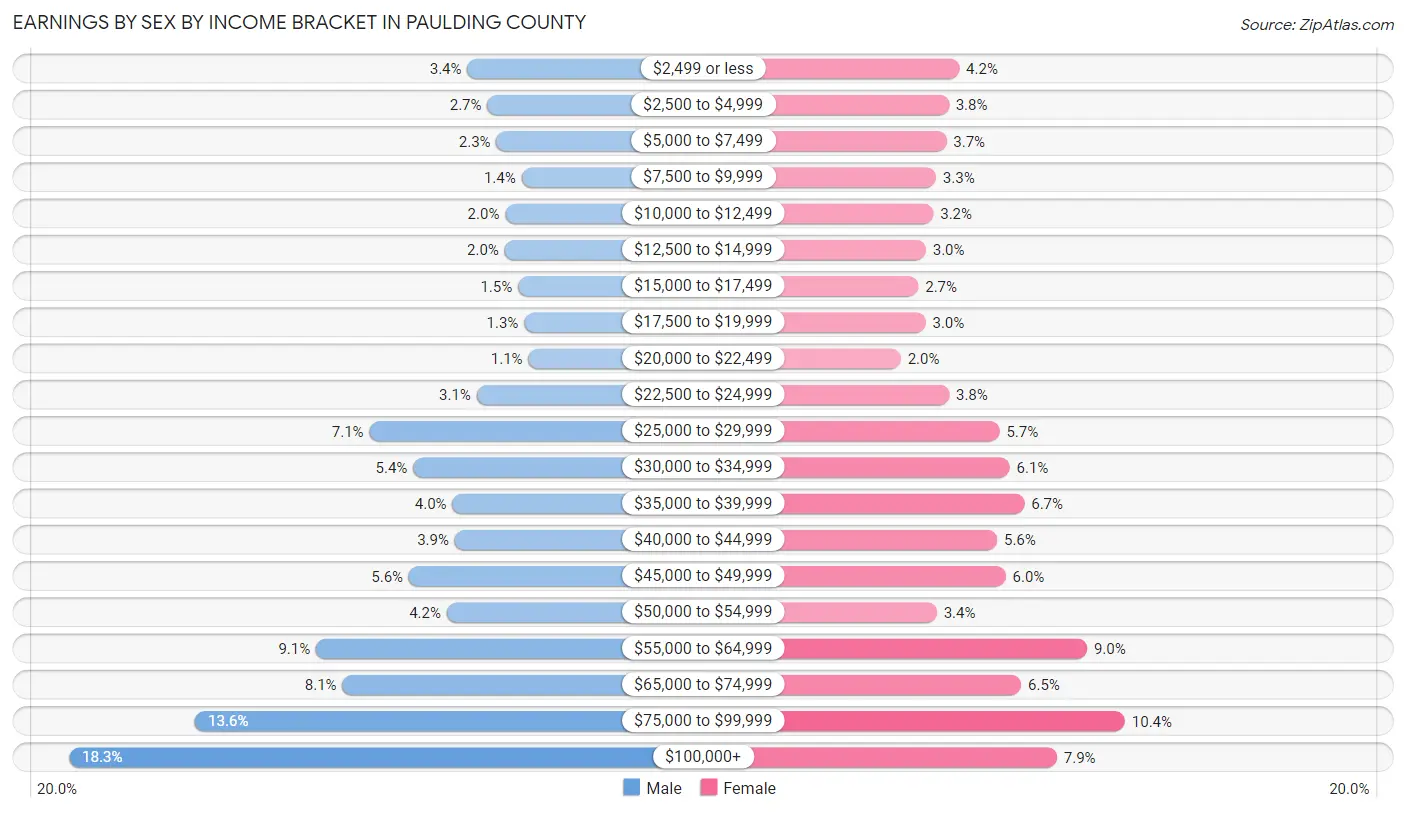
| Income | Male | Female |
| $2,499 or less | 1,650 (3.4%) | 1,805 (4.2%) |
| $2,500 to $4,999 | 1,285 (2.7%) | 1,637 (3.8%) |
| $5,000 to $7,499 | 1,123 (2.3%) | 1,599 (3.7%) |
| $7,500 to $9,999 | 670 (1.4%) | 1,431 (3.3%) |
| $10,000 to $12,499 | 963 (2.0%) | 1,392 (3.2%) |
| $12,500 to $14,999 | 973 (2.0%) | 1,268 (3.0%) |
| $15,000 to $17,499 | 729 (1.5%) | 1,148 (2.7%) |
| $17,500 to $19,999 | 620 (1.3%) | 1,266 (2.9%) |
| $20,000 to $22,499 | 540 (1.1%) | 865 (2.0%) |
| $22,500 to $24,999 | 1,482 (3.1%) | 1,641 (3.8%) |
| $25,000 to $29,999 | 3,426 (7.1%) | 2,455 (5.7%) |
| $30,000 to $34,999 | 2,630 (5.4%) | 2,618 (6.1%) |
| $35,000 to $39,999 | 1,920 (4.0%) | 2,854 (6.7%) |
| $40,000 to $44,999 | 1,876 (3.9%) | 2,416 (5.6%) |
| $45,000 to $49,999 | 2,711 (5.6%) | 2,553 (5.9%) |
| $50,000 to $54,999 | 2,022 (4.2%) | 1,445 (3.4%) |
| $55,000 to $64,999 | 4,392 (9.1%) | 3,859 (9.0%) |
| $65,000 to $74,999 | 3,916 (8.1%) | 2,800 (6.5%) |
| $75,000 to $99,999 | 6,586 (13.6%) | 4,471 (10.4%) |
| $100,000+ | 8,867 (18.3%) | 3,378 (7.9%) |
| Total | 48,381 (100.0%) | 42,901 (100.0%) |
Earnings by Sex by Educational Attainment in Paulding County
Average earnings in Paulding County are $59,318 for men and $44,577 for women, a difference of 24.8%. Men with an educational attainment of graduate degree enjoy the highest average annual earnings of $87,128, while those with less than high school education earn the least with $43,167. Women with an educational attainment of graduate degree earn the most with the average annual earnings of $70,711, while those with less than high school education have the smallest earnings of $23,839.
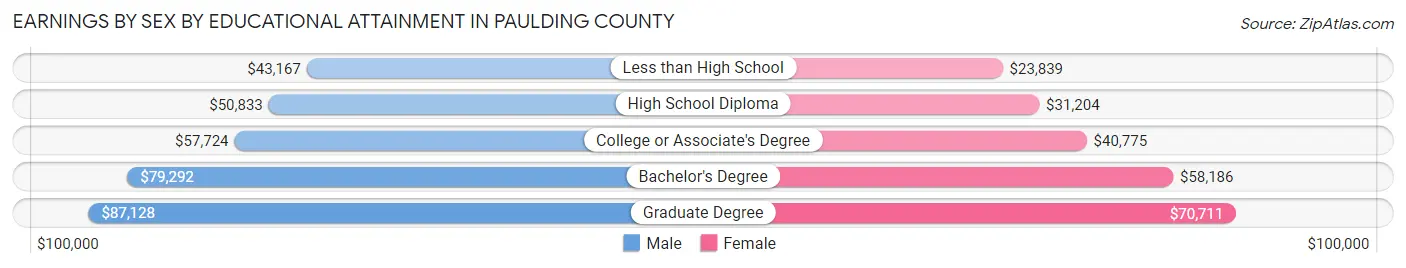
| Educational Attainment | Male Income | Female Income |
| Less than High School | $43,167 | $23,839 |
| High School Diploma | $50,833 | $31,204 |
| College or Associate's Degree | $57,724 | $40,775 |
| Bachelor's Degree | $79,292 | $58,186 |
| Graduate Degree | $87,128 | $70,711 |
| Total | $59,318 | $44,577 |
Family Income in Paulding County
Family Income Brackets in Paulding County
According to the Paulding County family income data, there are 11,998 families falling into the $100,000 to $149,999 income range, which is the most common income bracket and makes up 26.9% of all families. Conversely, the $10,000 to $14,999 income bracket is the least frequent group with only 268 families (0.6%) belonging to this category.
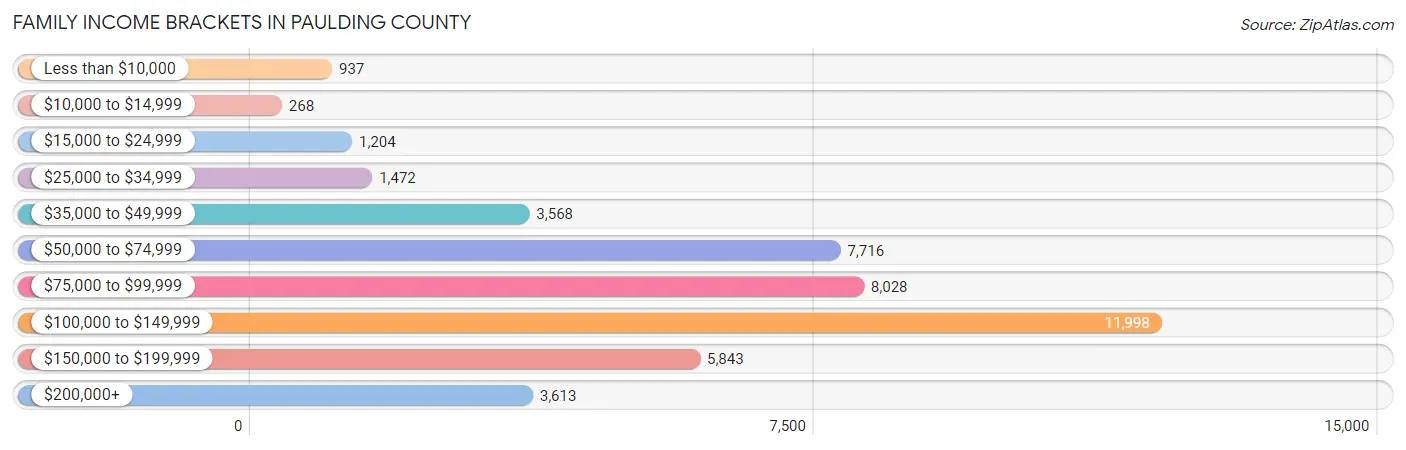
| Income Bracket | # Families | % Families |
| Less than $10,000 | 937 | 2.1% |
| $10,000 to $14,999 | 268 | 0.6% |
| $15,000 to $24,999 | 1,204 | 2.7% |
| $25,000 to $34,999 | 1,472 | 3.3% |
| $35,000 to $49,999 | 3,568 | 8.0% |
| $50,000 to $74,999 | 7,716 | 17.3% |
| $75,000 to $99,999 | 8,028 | 18.0% |
| $100,000 to $149,999 | 11,998 | 26.9% |
| $150,000 to $199,999 | 5,843 | 13.1% |
| $200,000+ | 3,613 | 8.1% |
Family Income by Famaliy Size in Paulding County
5-person families (3,675 | 8.2%) account for the highest median family income in Paulding County with $133,201 per family, while 2-person families (16,576 | 37.2%) have the highest median income of $41,715 per family member.
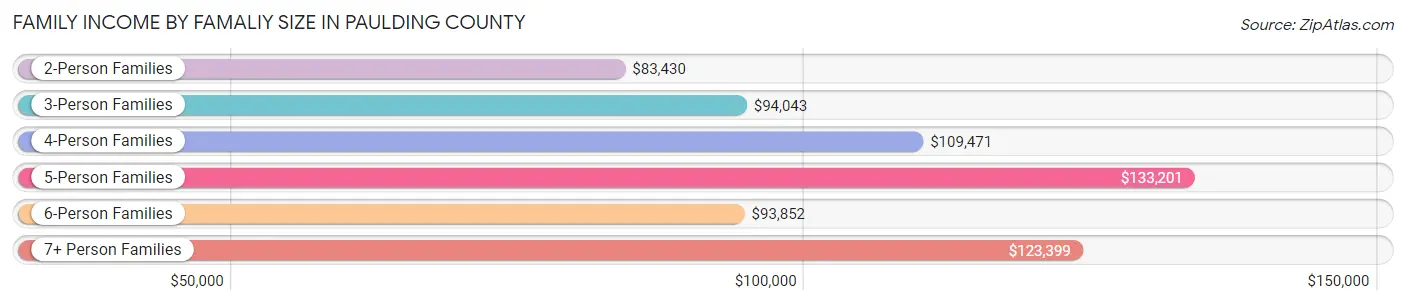
| Income Bracket | # Families | Median Income |
| 2-Person Families | 16,576 (37.2%) | $83,430 |
| 3-Person Families | 10,273 (23.0%) | $94,043 |
| 4-Person Families | 11,290 (25.3%) | $109,471 |
| 5-Person Families | 3,675 (8.2%) | $133,201 |
| 6-Person Families | 2,086 (4.7%) | $93,852 |
| 7+ Person Families | 701 (1.6%) | $123,399 |
| Total | 44,601 (100.0%) | $98,072 |
Family Income by Number of Earners in Paulding County
The median family income in Paulding County is $98,072, with families comprising 3+ earners (6,710) having the highest median family income of $141,895, while families with no earners (4,595) have the lowest median family income of $47,929, accounting for 15.0% and 10.3% of families, respectively.
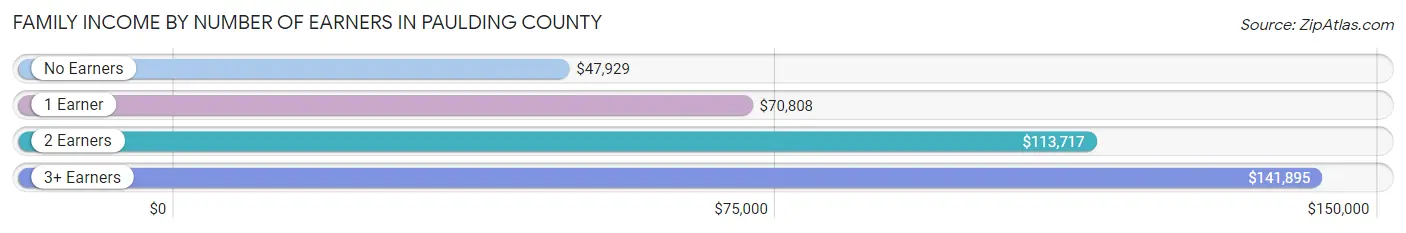
| Number of Earners | # Families | Median Income |
| No Earners | 4,595 (10.3%) | $47,929 |
| 1 Earner | 13,648 (30.6%) | $70,808 |
| 2 Earners | 19,648 (44.1%) | $113,717 |
| 3+ Earners | 6,710 (15.0%) | $141,895 |
| Total | 44,601 (100.0%) | $98,072 |
Household Income in Paulding County
Household Income Brackets in Paulding County
With 13,668 households falling in the category, the $100,000 to $149,999 income range is the most frequent in Paulding County, accounting for 24.1% of all households. In contrast, only 510 households (0.9%) fall into the $10,000 to $14,999 income bracket, making it the least populous group.
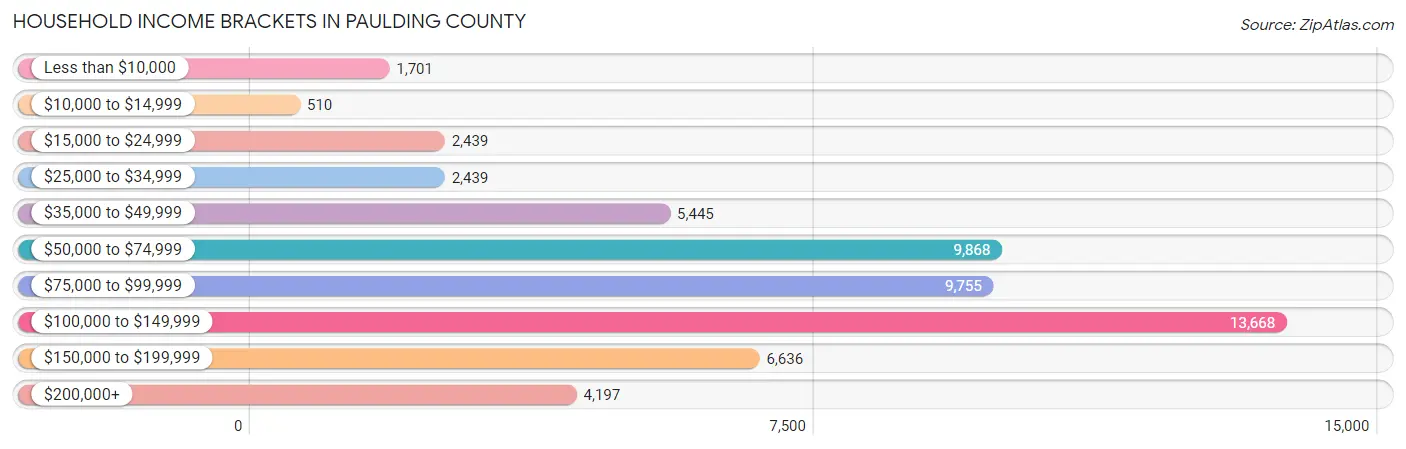
| Income Bracket | # Households | % Households |
| Less than $10,000 | 1,701 | 3.0% |
| $10,000 to $14,999 | 510 | 0.9% |
| $15,000 to $24,999 | 2,439 | 4.3% |
| $25,000 to $34,999 | 2,439 | 4.3% |
| $35,000 to $49,999 | 5,445 | 9.6% |
| $50,000 to $74,999 | 9,868 | 17.4% |
| $75,000 to $99,999 | 9,755 | 17.2% |
| $100,000 to $149,999 | 13,668 | 24.1% |
| $150,000 to $199,999 | 6,636 | 11.7% |
| $200,000+ | 4,197 | 7.4% |
Household Income by Householder Age in Paulding County
The median household income in Paulding County is $89,237, with the highest median household income of $102,007 found in the 45 to 64 years age bracket for the primary householder. A total of 25,060 households (44.2%) fall into this category. Meanwhile, the 65+ years age bracket for the primary householder has the lowest median household income of $56,370, with 10,542 households (18.6%) in this group.
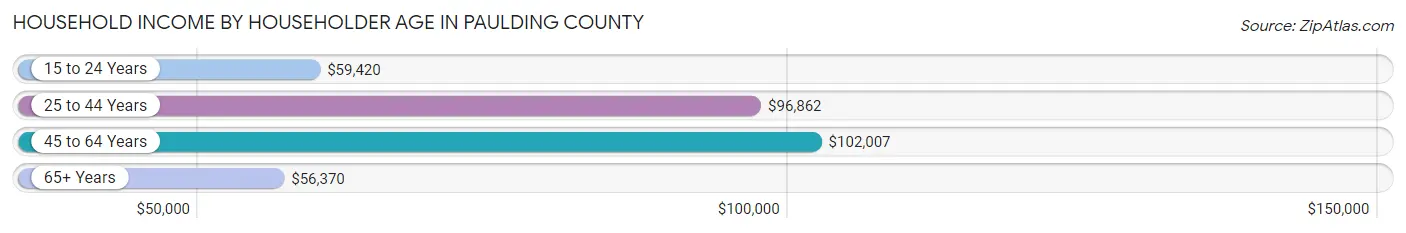
| Income Bracket | # Households | Median Income |
| 15 to 24 Years | 1,166 (2.1%) | $59,420 |
| 25 to 44 Years | 19,947 (35.2%) | $96,862 |
| 45 to 64 Years | 25,060 (44.2%) | $102,007 |
| 65+ Years | 10,542 (18.6%) | $56,370 |
| Total | 56,715 (100.0%) | $89,237 |
Poverty in Paulding County
Income Below Poverty by Sex and Age in Paulding County
With 6.2% poverty level for males and 7.2% for females among the residents of Paulding County, 5 year old males and 16 and 17 year old females are the most vulnerable to poverty, with 147 males (14.0%) and 426 females (16.4%) in their respective age groups living below the poverty level.
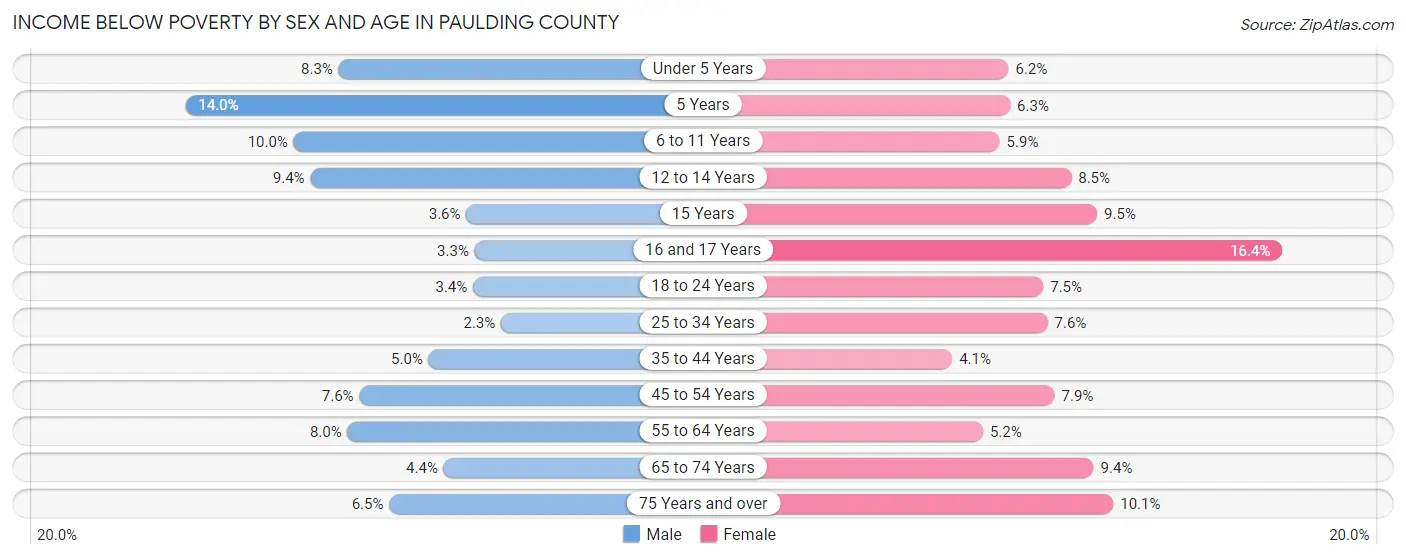
| Age Bracket | Male | Female |
| Under 5 Years | 446 (8.3%) | 311 (6.2%) |
| 5 Years | 147 (14.0%) | 59 (6.2%) |
| 6 to 11 Years | 668 (10.0%) | 433 (5.9%) |
| 12 to 14 Years | 450 (9.4%) | 347 (8.5%) |
| 15 Years | 35 (3.6%) | 134 (9.5%) |
| 16 and 17 Years | 101 (3.3%) | 426 (16.4%) |
| 18 to 24 Years | 246 (3.4%) | 542 (7.5%) |
| 25 to 34 Years | 256 (2.3%) | 891 (7.6%) |
| 35 to 44 Years | 591 (5.0%) | 507 (4.1%) |
| 45 to 54 Years | 947 (7.6%) | 1,018 (7.9%) |
| 55 to 64 Years | 788 (8.0%) | 524 (5.2%) |
| 65 to 74 Years | 249 (4.4%) | 615 (9.3%) |
| 75 Years and over | 174 (6.5%) | 404 (10.1%) |
| Total | 5,098 (6.2%) | 6,211 (7.2%) |
Income Above Poverty by Sex and Age in Paulding County
According to the poverty statistics in Paulding County, males aged 25 to 34 years and females aged 35 to 44 years are the age groups that are most secure financially, with 97.7% of males and 95.9% of females in these age groups living above the poverty line.
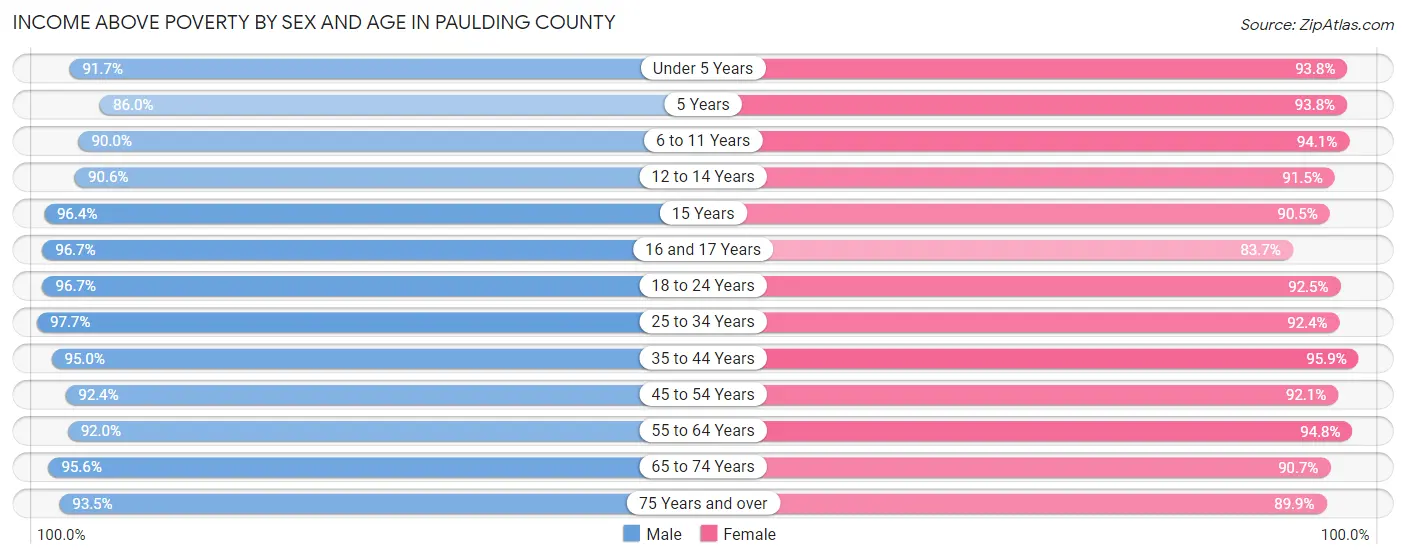
| Age Bracket | Male | Female |
| Under 5 Years | 4,899 (91.7%) | 4,710 (93.8%) |
| 5 Years | 901 (86.0%) | 885 (93.8%) |
| 6 to 11 Years | 6,007 (90.0%) | 6,962 (94.1%) |
| 12 to 14 Years | 4,341 (90.6%) | 3,724 (91.5%) |
| 15 Years | 936 (96.4%) | 1,279 (90.5%) |
| 16 and 17 Years | 2,970 (96.7%) | 2,180 (83.7%) |
| 18 to 24 Years | 7,090 (96.7%) | 6,702 (92.5%) |
| 25 to 34 Years | 10,816 (97.7%) | 10,764 (92.4%) |
| 35 to 44 Years | 11,230 (95.0%) | 11,845 (95.9%) |
| 45 to 54 Years | 11,560 (92.4%) | 11,867 (92.1%) |
| 55 to 64 Years | 9,049 (92.0%) | 9,473 (94.8%) |
| 65 to 74 Years | 5,355 (95.6%) | 5,965 (90.6%) |
| 75 Years and over | 2,518 (93.5%) | 3,605 (89.9%) |
| Total | 77,672 (93.8%) | 79,961 (92.8%) |
Income Below Poverty Among Married-Couple Families in Paulding County
The poverty statistics for married-couple families in Paulding County show that 3.5% or 1,216 of the total 35,095 families live below the poverty line. Families with 3 or 4 children have the highest poverty rate of 9.0%, comprising of 266 families. On the other hand, families with 5 or more children have the lowest poverty rate of 0.0%, which includes 0 families.
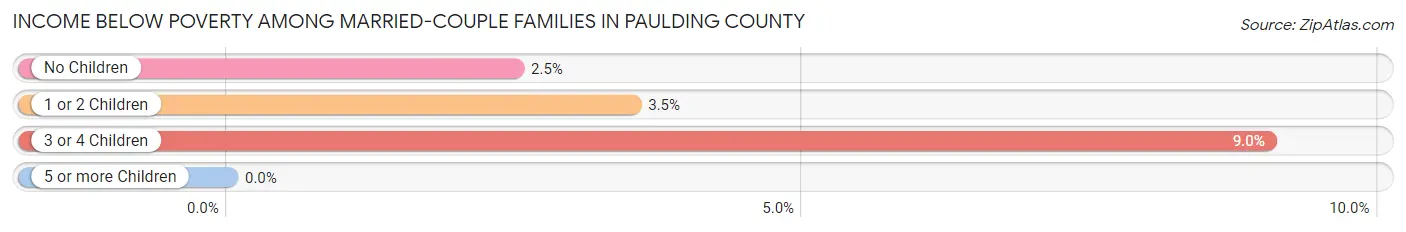
| Children | Above Poverty | Below Poverty |
| No Children | 16,571 (97.5%) | 424 (2.5%) |
| 1 or 2 Children | 14,440 (96.5%) | 526 (3.5%) |
| 3 or 4 Children | 2,677 (91.0%) | 266 (9.0%) |
| 5 or more Children | 191 (100.0%) | 0 (0.0%) |
| Total | 33,879 (96.5%) | 1,216 (3.5%) |
Income Below Poverty Among Single-Parent Households in Paulding County
According to the poverty data in Paulding County, 4.0% or 99 single-father households and 13.9% or 976 single-mother households are living below the poverty line. Among single-father households, those with 3 or 4 children have the highest poverty rate, with 36 households (54.5%) experiencing poverty. Likewise, among single-mother households, those with 5 or more children have the highest poverty rate, with 56 households (100.0%) falling below the poverty line.
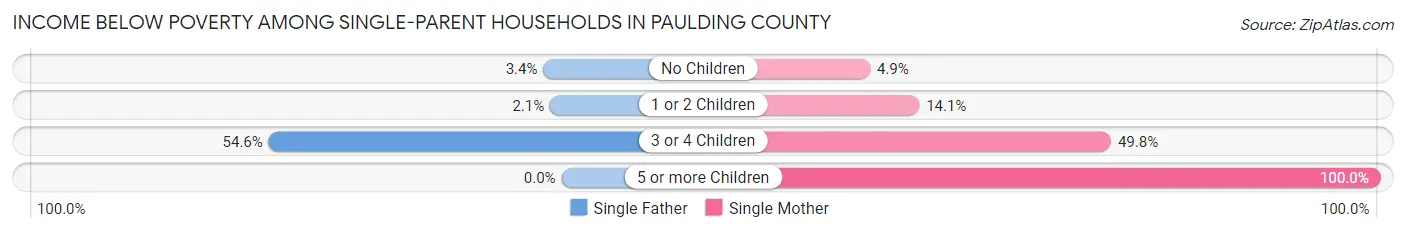
| Children | Single Father | Single Mother |
| No Children | 30 (3.4%) | 120 (4.9%) |
| 1 or 2 Children | 33 (2.1%) | 567 (14.1%) |
| 3 or 4 Children | 36 (54.5%) | 233 (49.8%) |
| 5 or more Children | 0 (0.0%) | 56 (100.0%) |
| Total | 99 (4.0%) | 976 (13.9%) |
Income Below Poverty Among Married-Couple vs Single-Parent Households in Paulding County
The poverty data for Paulding County shows that 1,216 of the married-couple family households (3.5%) and 1,075 of the single-parent households (11.3%) are living below the poverty level. Within the married-couple family households, those with 3 or 4 children have the highest poverty rate, with 266 households (9.0%) falling below the poverty line. Among the single-parent households, those with 5 or more children have the highest poverty rate, with 56 household (100.0%) living below poverty.
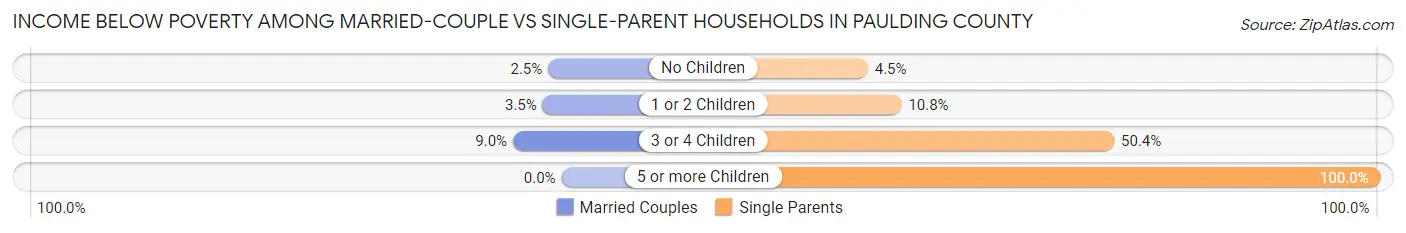
| Children | Married-Couple Families | Single-Parent Households |
| No Children | 424 (2.5%) | 150 (4.5%) |
| 1 or 2 Children | 526 (3.5%) | 600 (10.8%) |
| 3 or 4 Children | 266 (9.0%) | 269 (50.4%) |
| 5 or more Children | 0 (0.0%) | 56 (100.0%) |
| Total | 1,216 (3.5%) | 1,075 (11.3%) |
Employment Characteristics in Paulding County
Employment by Class of Employer in Paulding County
Among the 82,606 employed individuals in Paulding County, private company employees (58,618 | 71.0%), local government employees (7,246 | 8.8%), and not-for-profit organizations (5,410 | 6.6%) make up the most common classes of employment.
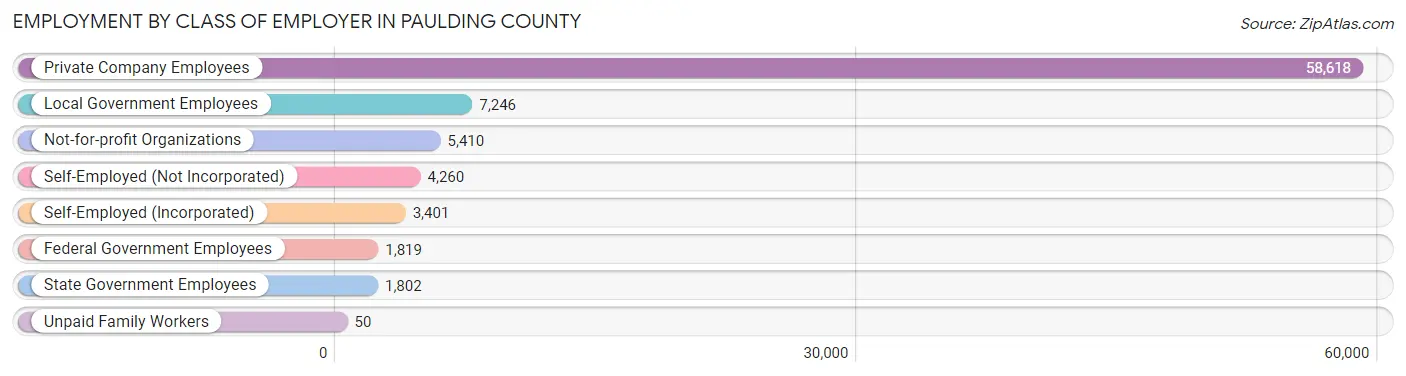
| Employer Class | # Employees | % Employees |
| Private Company Employees | 58,618 | 71.0% |
| Self-Employed (Incorporated) | 3,401 | 4.1% |
| Self-Employed (Not Incorporated) | 4,260 | 5.2% |
| Not-for-profit Organizations | 5,410 | 6.6% |
| Local Government Employees | 7,246 | 8.8% |
| State Government Employees | 1,802 | 2.2% |
| Federal Government Employees | 1,819 | 2.2% |
| Unpaid Family Workers | 50 | 0.1% |
| Total | 82,606 | 100.0% |
Employment Status by Age in Paulding County
According to the labor force statistics for Paulding County, out of the total population over 16 years of age (131,973), 66.7% or 88,026 individuals are in the labor force, with 4.1% or 3,609 of them unemployed. The age group with the highest labor force participation rate is 35 to 44 years, with 84.3% or 20,444 individuals in the labor force. Within the labor force, the 16 to 19 years age range has the highest percentage of unemployed individuals, with 13.0% or 436 of them being unemployed.
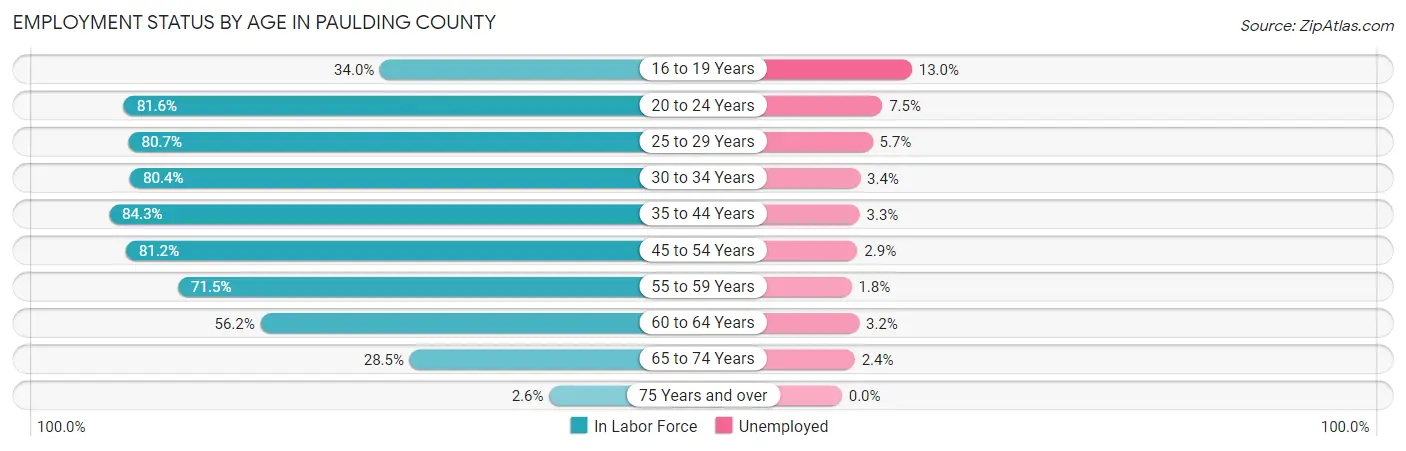
| Age Bracket | In Labor Force | Unemployed |
| 16 to 19 Years | 3,355 (34.0%) | 436 (13.0%) |
| 20 to 24 Years | 8,584 (81.6%) | 644 (7.5%) |
| 25 to 29 Years | 9,069 (80.7%) | 517 (5.7%) |
| 30 to 34 Years | 9,412 (80.4%) | 320 (3.4%) |
| 35 to 44 Years | 20,444 (84.3%) | 675 (3.3%) |
| 45 to 54 Years | 20,648 (81.2%) | 599 (2.9%) |
| 55 to 59 Years | 7,600 (71.5%) | 137 (1.8%) |
| 60 to 64 Years | 5,215 (56.2%) | 167 (3.2%) |
| 65 to 74 Years | 3,482 (28.5%) | 84 (2.4%) |
| 75 Years and over | 178 (2.6%) | 0 (0.0%) |
| Total | 88,026 (66.7%) | 3,609 (4.1%) |
Employment Status by Educational Attainment in Paulding County
According to labor force statistics for Paulding County, 78.3% of individuals (72,455) out of the total population between 25 and 64 years of age (92,535) are in the labor force, with 3.4% or 2,463 of them being unemployed. The group with the highest labor force participation rate are those with the educational attainment of bachelor's degree or higher, with 87.6% or 22,692 individuals in the labor force. Within the labor force, individuals with less than high school education have the highest percentage of unemployment, with 8.3% or 366 of them being unemployed.
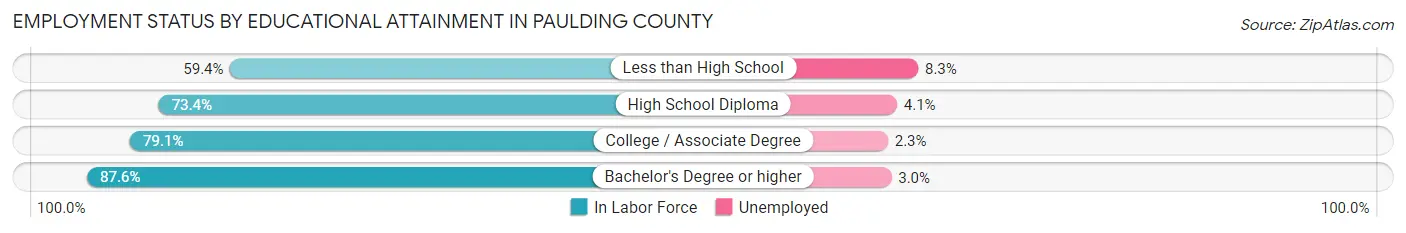
| Educational Attainment | In Labor Force | Unemployed |
| Less than High School | 4,404 (59.4%) | 615 (8.3%) |
| High School Diploma | 19,634 (73.4%) | 1,097 (4.1%) |
| College / Associate Degree | 25,682 (79.1%) | 747 (2.3%) |
| Bachelor's Degree or higher | 22,692 (87.6%) | 777 (3.0%) |
| Total | 72,455 (78.3%) | 3,146 (3.4%) |
Employment Occupations by Sex in Paulding County
Management, Business, Science and Arts Occupations
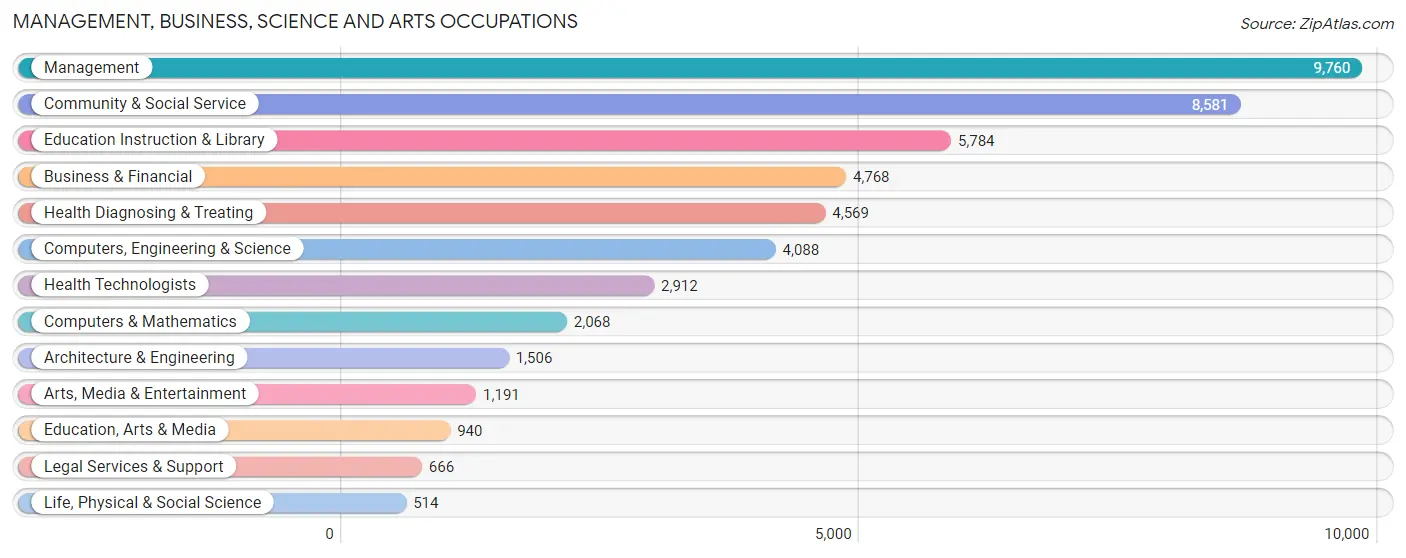
The most common Management, Business, Science and Arts occupations in Paulding County are Management (9,760 | 11.6%), Community & Social Service (8,581 | 10.2%), Education Instruction & Library (5,784 | 6.9%), Business & Financial (4,768 | 5.7%), and Health Diagnosing & Treating (4,569 | 5.4%).
Management, Business, Science and Arts Occupations by Sex
Within the Management, Business, Science and Arts occupations in Paulding County, the most male-oriented occupations are Architecture & Engineering (84.1%), Computers, Engineering & Science (79.6%), and Computers & Mathematics (79.0%), while the most female-oriented occupations are Legal Services & Support (100.0%), Health Technologists (91.4%), and Health Diagnosing & Treating (89.6%).
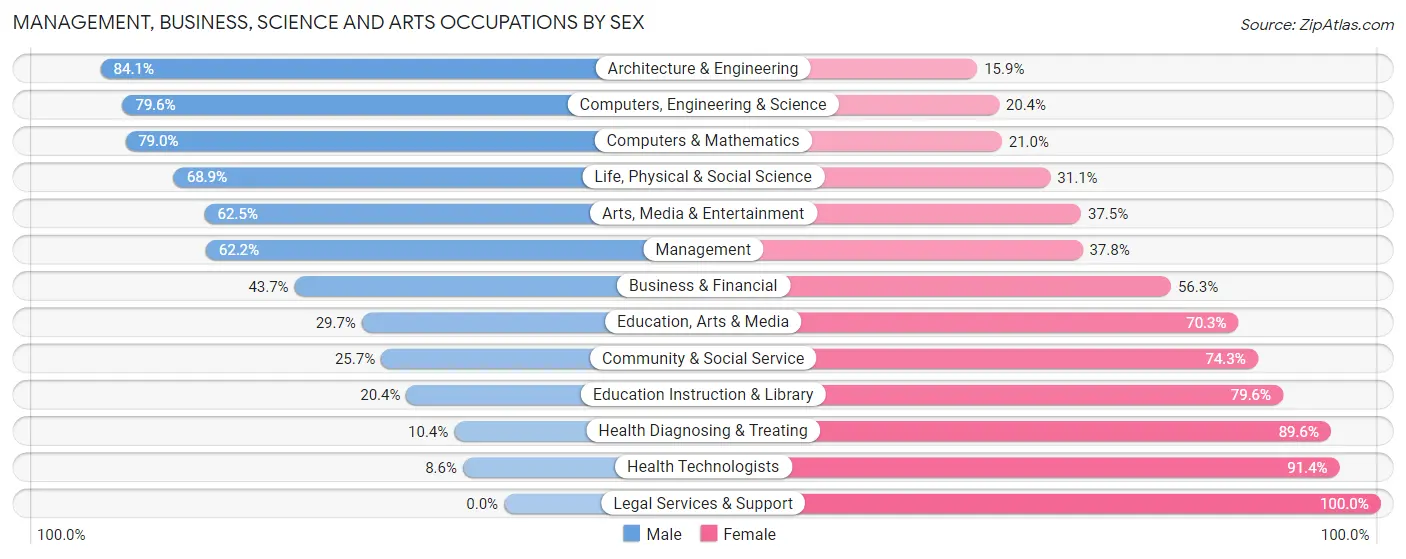
| Occupation | Male | Female |
| Management | 6,069 (62.2%) | 3,691 (37.8%) |
| Business & Financial | 2,084 (43.7%) | 2,684 (56.3%) |
| Computers, Engineering & Science | 3,255 (79.6%) | 833 (20.4%) |
| Computers & Mathematics | 1,634 (79.0%) | 434 (21.0%) |
| Architecture & Engineering | 1,267 (84.1%) | 239 (15.9%) |
| Life, Physical & Social Science | 354 (68.9%) | 160 (31.1%) |
| Community & Social Service | 2,202 (25.7%) | 6,379 (74.3%) |
| Education, Arts & Media | 279 (29.7%) | 661 (70.3%) |
| Legal Services & Support | 0 (0.0%) | 666 (100.0%) |
| Education Instruction & Library | 1,179 (20.4%) | 4,605 (79.6%) |
| Arts, Media & Entertainment | 744 (62.5%) | 447 (37.5%) |
| Health Diagnosing & Treating | 475 (10.4%) | 4,094 (89.6%) |
| Health Technologists | 250 (8.6%) | 2,662 (91.4%) |
| Total (Category) | 14,085 (44.3%) | 17,681 (55.7%) |
| Total (Overall) | 44,451 (52.8%) | 39,671 (47.2%) |
Services Occupations
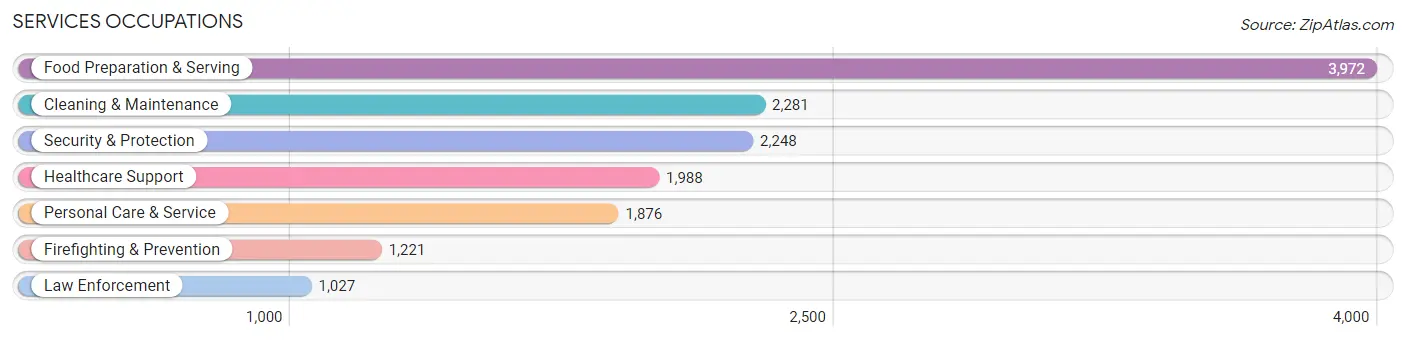
The most common Services occupations in Paulding County are Food Preparation & Serving (3,972 | 4.7%), Cleaning & Maintenance (2,281 | 2.7%), Security & Protection (2,248 | 2.7%), Healthcare Support (1,988 | 2.4%), and Personal Care & Service (1,876 | 2.2%).
Services Occupations by Sex
Within the Services occupations in Paulding County, the most male-oriented occupations are Law Enforcement (89.4%), Security & Protection (82.2%), and Cleaning & Maintenance (81.3%), while the most female-oriented occupations are Personal Care & Service (83.2%), Healthcare Support (80.6%), and Food Preparation & Serving (53.1%).
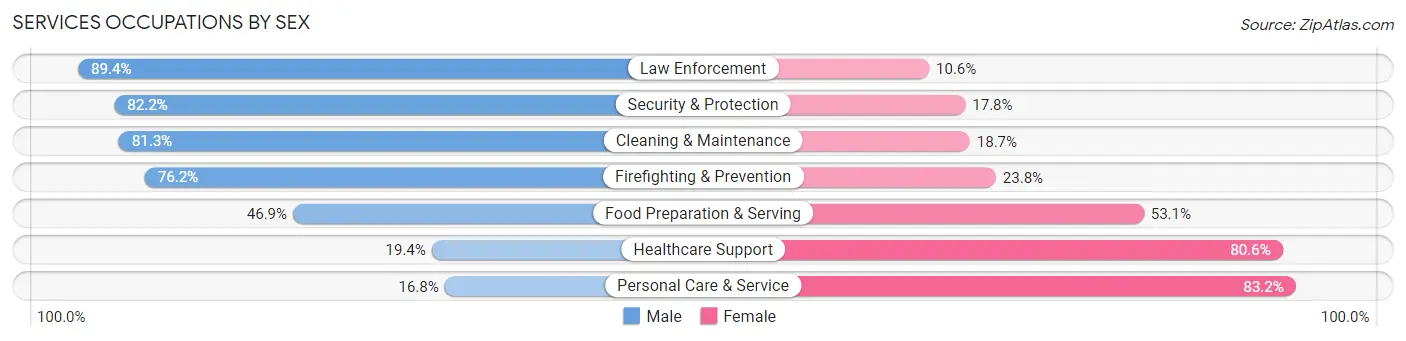
| Occupation | Male | Female |
| Healthcare Support | 386 (19.4%) | 1,602 (80.6%) |
| Security & Protection | 1,848 (82.2%) | 400 (17.8%) |
| Firefighting & Prevention | 930 (76.2%) | 291 (23.8%) |
| Law Enforcement | 918 (89.4%) | 109 (10.6%) |
| Food Preparation & Serving | 1,862 (46.9%) | 2,110 (53.1%) |
| Cleaning & Maintenance | 1,855 (81.3%) | 426 (18.7%) |
| Personal Care & Service | 316 (16.8%) | 1,560 (83.2%) |
| Total (Category) | 6,267 (50.7%) | 6,098 (49.3%) |
| Total (Overall) | 44,451 (52.8%) | 39,671 (47.2%) |
Sales and Office Occupations
The most common Sales and Office occupations in Paulding County are Office & Administration (10,698 | 12.7%), and Sales & Related (9,013 | 10.7%).

Sales and Office Occupations by Sex
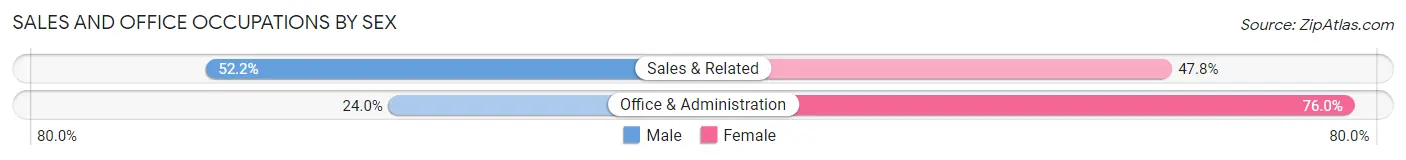
| Occupation | Male | Female |
| Sales & Related | 4,705 (52.2%) | 4,308 (47.8%) |
| Office & Administration | 2,566 (24.0%) | 8,132 (76.0%) |
| Total (Category) | 7,271 (36.9%) | 12,440 (63.1%) |
| Total (Overall) | 44,451 (52.8%) | 39,671 (47.2%) |
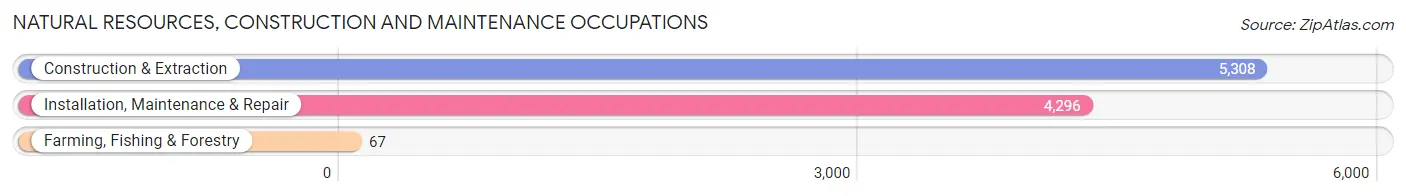
Natural Resources, Construction and Maintenance Occupations
The most common Natural Resources, Construction and Maintenance occupations in Paulding County are Construction & Extraction (5,308 | 6.3%), Installation, Maintenance & Repair (4,296 | 5.1%), and Farming, Fishing & Forestry (67 | 0.1%).
Natural Resources, Construction and Maintenance Occupations by Sex
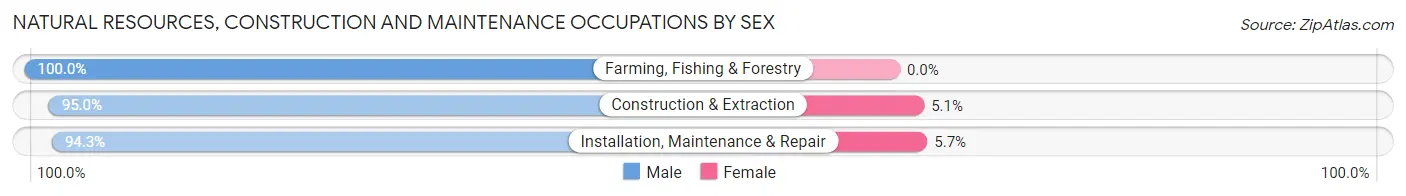
| Occupation | Male | Female |
| Farming, Fishing & Forestry | 67 (100.0%) | 0 (0.0%) |
| Construction & Extraction | 5,040 (95.0%) | 268 (5.1%) |
| Installation, Maintenance & Repair | 4,051 (94.3%) | 245 (5.7%) |
| Total (Category) | 9,158 (94.7%) | 513 (5.3%) |
| Total (Overall) | 44,451 (52.8%) | 39,671 (47.2%) |
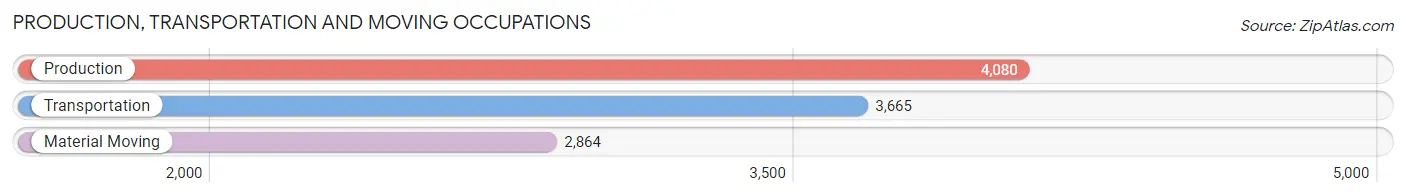
Production, Transportation and Moving Occupations
The most common Production, Transportation and Moving occupations in Paulding County are Production (4,080 | 4.9%), Transportation (3,665 | 4.4%), and Material Moving (2,864 | 3.4%).
Production, Transportation and Moving Occupations by Sex
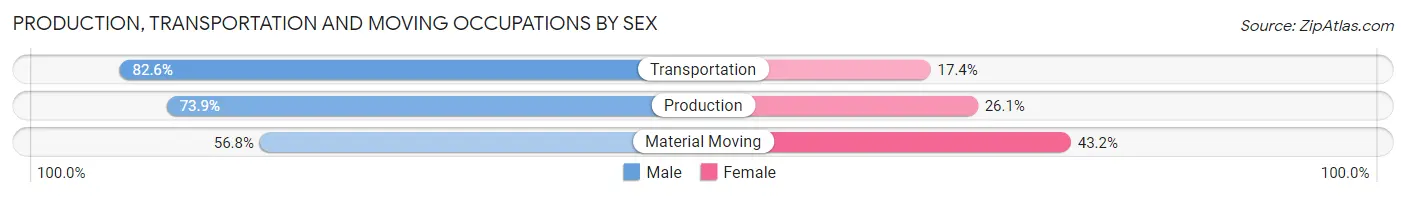
| Occupation | Male | Female |
| Production | 3,016 (73.9%) | 1,064 (26.1%) |
| Transportation | 3,026 (82.6%) | 639 (17.4%) |
| Material Moving | 1,628 (56.8%) | 1,236 (43.2%) |
| Total (Category) | 7,670 (72.3%) | 2,939 (27.7%) |
| Total (Overall) | 44,451 (52.8%) | 39,671 (47.2%) |
Employment Industries by Sex in Paulding County
Employment Industries in Paulding County
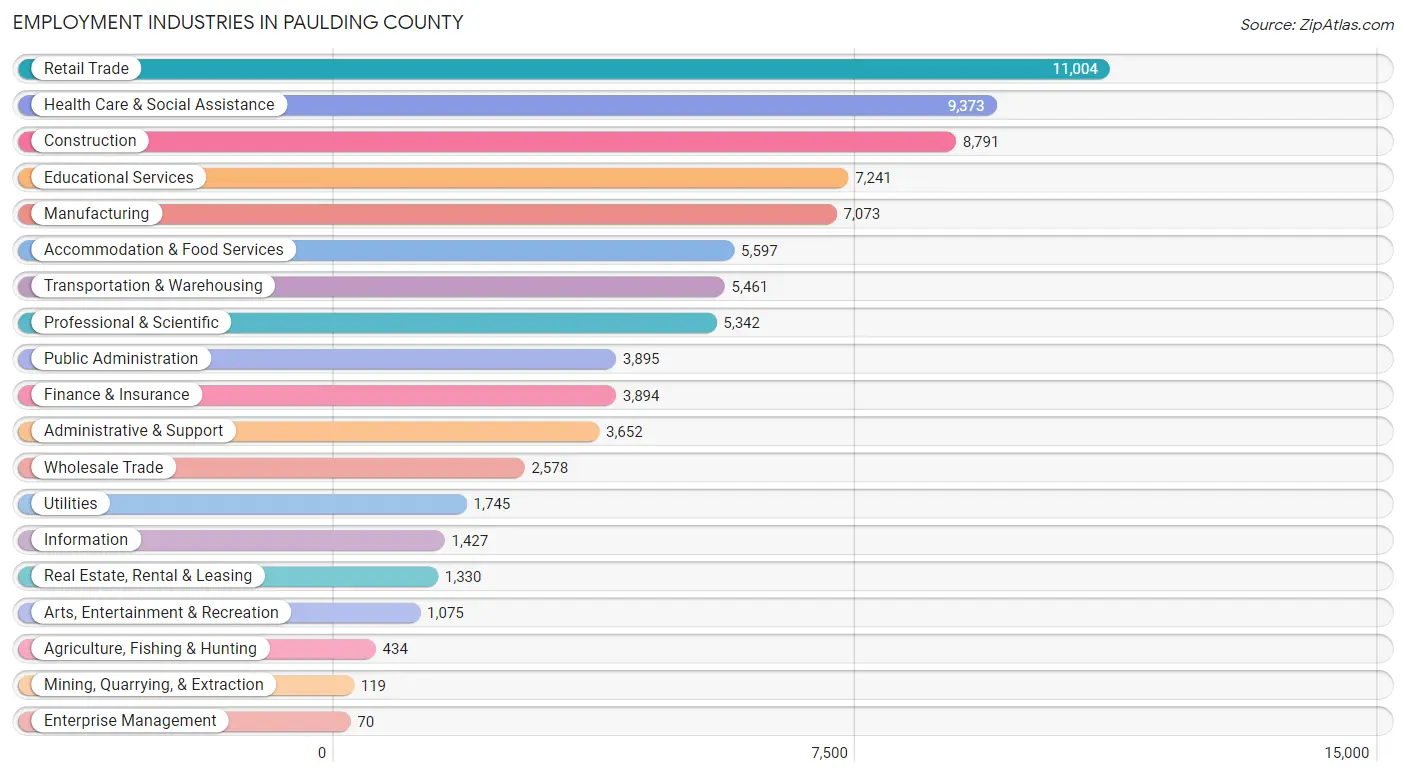
The major employment industries in Paulding County include Retail Trade (11,004 | 13.1%), Health Care & Social Assistance (9,373 | 11.1%), Construction (8,791 | 10.4%), Educational Services (7,241 | 8.6%), and Manufacturing (7,073 | 8.4%).
Employment Industries by Sex in Paulding County
The Paulding County industries that see more men than women are Mining, Quarrying, & Extraction (100.0%), Construction (86.0%), and Utilities (83.4%), whereas the industries that tend to have a higher number of women are Health Care & Social Assistance (84.7%), Educational Services (75.7%), and Finance & Insurance (69.7%).
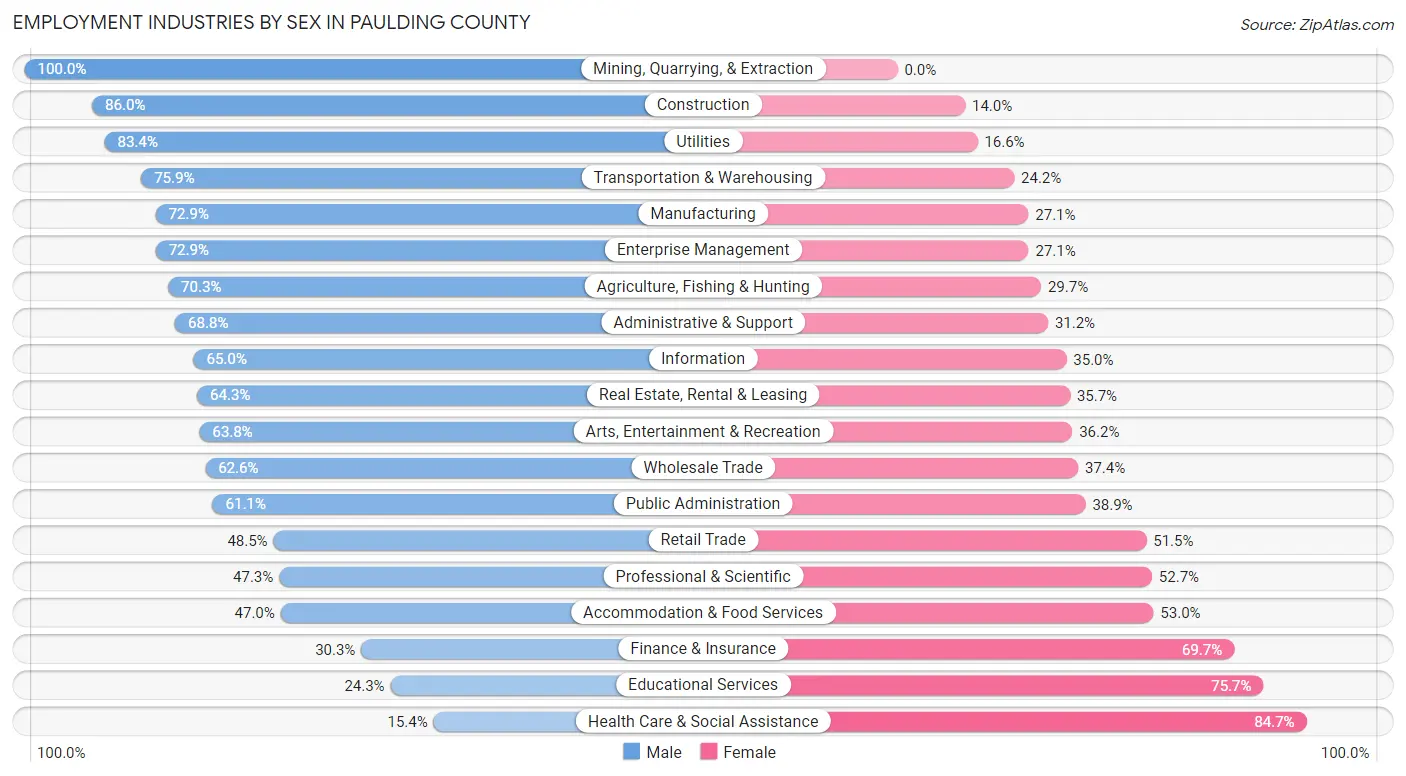
| Industry | Male | Female |
| Agriculture, Fishing & Hunting | 305 (70.3%) | 129 (29.7%) |
| Mining, Quarrying, & Extraction | 119 (100.0%) | 0 (0.0%) |
| Construction | 7,561 (86.0%) | 1,230 (14.0%) |
| Manufacturing | 5,156 (72.9%) | 1,917 (27.1%) |
| Wholesale Trade | 1,614 (62.6%) | 964 (37.4%) |
| Retail Trade | 5,336 (48.5%) | 5,668 (51.5%) |
| Transportation & Warehousing | 4,142 (75.8%) | 1,319 (24.1%) |
| Utilities | 1,456 (83.4%) | 289 (16.6%) |
| Information | 928 (65.0%) | 499 (35.0%) |
| Finance & Insurance | 1,181 (30.3%) | 2,713 (69.7%) |
| Real Estate, Rental & Leasing | 855 (64.3%) | 475 (35.7%) |
| Professional & Scientific | 2,528 (47.3%) | 2,814 (52.7%) |
| Enterprise Management | 51 (72.9%) | 19 (27.1%) |
| Administrative & Support | 2,514 (68.8%) | 1,138 (31.2%) |
| Educational Services | 1,758 (24.3%) | 5,483 (75.7%) |
| Health Care & Social Assistance | 1,439 (15.3%) | 7,934 (84.7%) |
| Arts, Entertainment & Recreation | 686 (63.8%) | 389 (36.2%) |
| Accommodation & Food Services | 2,631 (47.0%) | 2,966 (53.0%) |
| Public Administration | 2,379 (61.1%) | 1,516 (38.9%) |
| Total | 44,451 (52.8%) | 39,671 (47.2%) |
Education in Paulding County
School Enrollment in Paulding County
The most common levels of schooling among the 45,803 students in Paulding County are middle school (11,479 | 25.1%), high school (10,618 | 23.2%), and elementary school (8,962 | 19.6%).
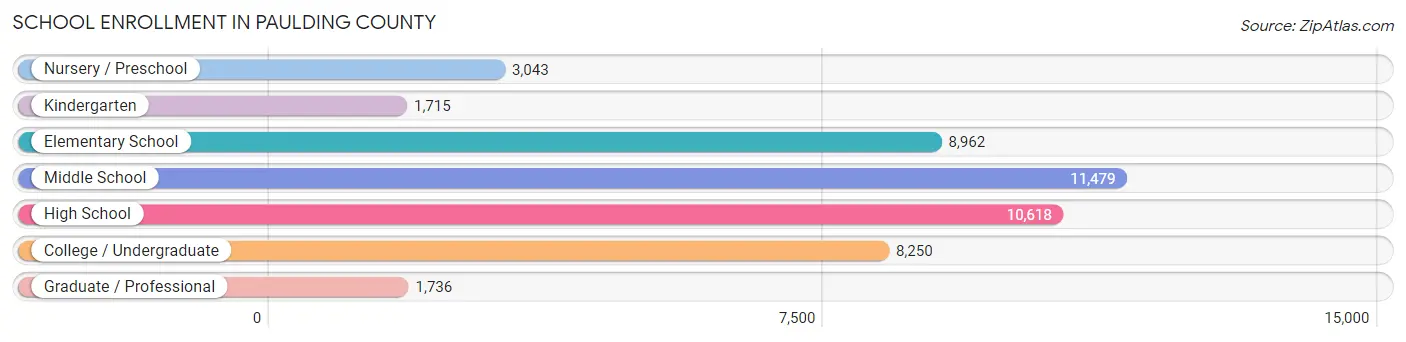
| School Level | # Students | % Students |
| Nursery / Preschool | 3,043 | 6.6% |
| Kindergarten | 1,715 | 3.7% |
| Elementary School | 8,962 | 19.6% |
| Middle School | 11,479 | 25.1% |
| High School | 10,618 | 23.2% |
| College / Undergraduate | 8,250 | 18.0% |
| Graduate / Professional | 1,736 | 3.8% |
| Total | 45,803 | 100.0% |
School Enrollment by Age by Funding Source in Paulding County
Out of a total of 45,803 students who are enrolled in schools in Paulding County, 6,046 (13.2%) attend a private institution, while the remaining 39,757 (86.8%) are enrolled in public schools. The age group of 3 to 4 year olds has the highest likelihood of being enrolled in private schools, with 847 (37.6% in the age bracket) enrolled. Conversely, the age group of 10 to 14 year olds has the lowest likelihood of being enrolled in a private school, with 12,902 (91.7% in the age bracket) attending a public institution.
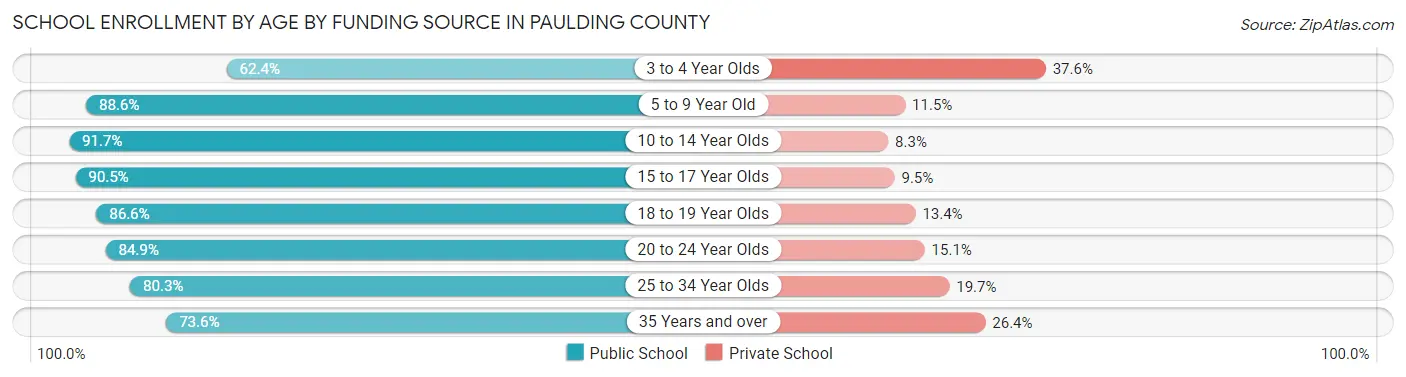
| Age Bracket | Public School | Private School |
| 3 to 4 Year Olds | 1,403 (62.4%) | 847 (37.6%) |
| 5 to 9 Year Old | 9,098 (88.5%) | 1,176 (11.5%) |
| 10 to 14 Year Olds | 12,902 (91.7%) | 1,166 (8.3%) |
| 15 to 17 Year Olds | 7,104 (90.5%) | 743 (9.5%) |
| 18 to 19 Year Olds | 2,177 (86.6%) | 336 (13.4%) |
| 20 to 24 Year Olds | 3,085 (84.9%) | 548 (15.1%) |
| 25 to 34 Year Olds | 1,915 (80.3%) | 469 (19.7%) |
| 35 Years and over | 2,086 (73.6%) | 748 (26.4%) |
| Total | 39,757 (86.8%) | 6,046 (13.2%) |
Educational Attainment by Field of Study in Paulding County
Business (6,548 | 21.1%), education (5,656 | 18.2%), science & technology (4,483 | 14.4%), arts & humanities (2,192 | 7.0%), and engineering (2,183 | 7.0%) are the most common fields of study among 31,081 individuals in Paulding County who have obtained a bachelor's degree or higher.
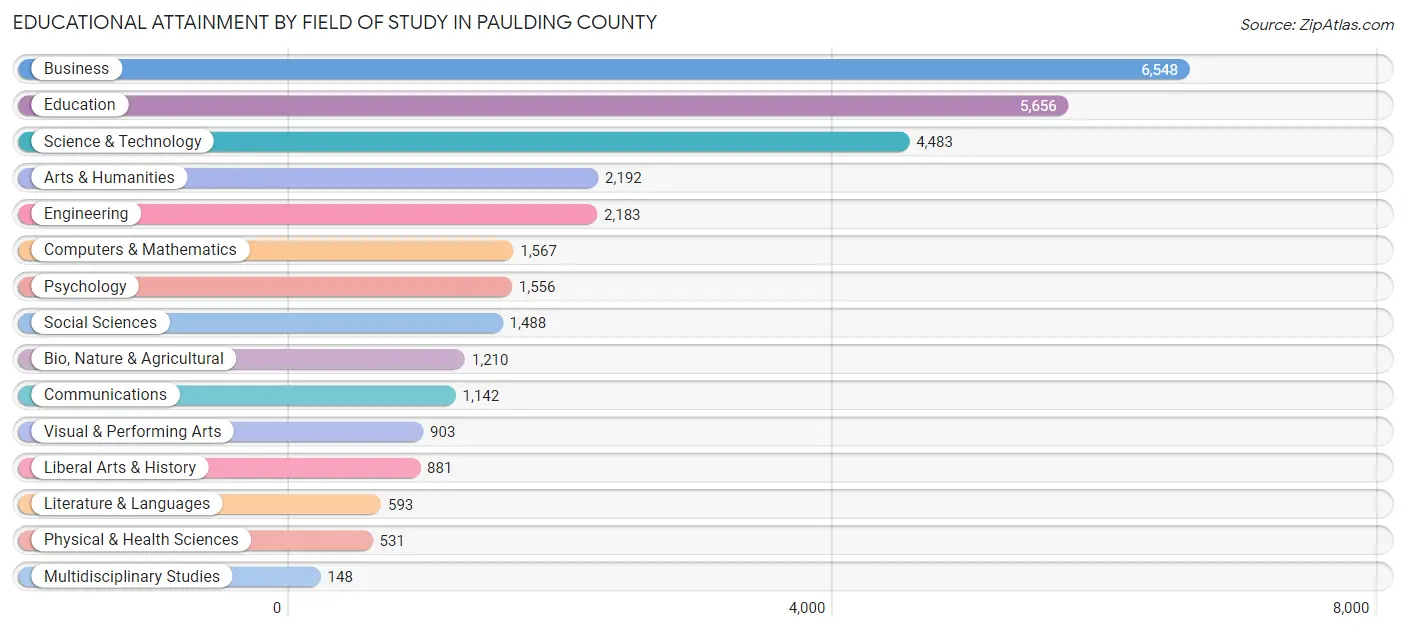
| Field of Study | # Graduates | % Graduates |
| Computers & Mathematics | 1,567 | 5.0% |
| Bio, Nature & Agricultural | 1,210 | 3.9% |
| Physical & Health Sciences | 531 | 1.7% |
| Psychology | 1,556 | 5.0% |
| Social Sciences | 1,488 | 4.8% |
| Engineering | 2,183 | 7.0% |
| Multidisciplinary Studies | 148 | 0.5% |
| Science & Technology | 4,483 | 14.4% |
| Business | 6,548 | 21.1% |
| Education | 5,656 | 18.2% |
| Literature & Languages | 593 | 1.9% |
| Liberal Arts & History | 881 | 2.8% |
| Visual & Performing Arts | 903 | 2.9% |
| Communications | 1,142 | 3.7% |
| Arts & Humanities | 2,192 | 7.0% |
| Total | 31,081 | 100.0% |
Transportation & Commute in Paulding County
Vehicle Availability by Sex in Paulding County
The most prevalent vehicle ownership categories in Paulding County are males with 2 vehicles (18,985, accounting for 43.1%) and females with 2 vehicles (16,169, making up 49.2%).
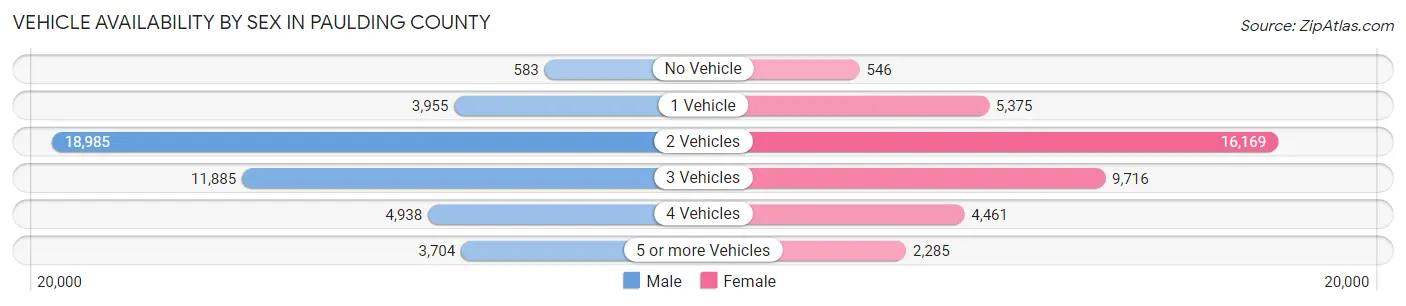
| Vehicles Available | Male | Female |
| No Vehicle | 583 (1.3%) | 546 (1.4%) |
| 1 Vehicle | 3,955 (9.0%) | 5,375 (13.9%) |
| 2 Vehicles | 18,985 (43.1%) | 16,169 (41.9%) |
| 3 Vehicles | 11,885 (27.0%) | 9,716 (25.2%) |
| 4 Vehicles | 4,938 (11.2%) | 4,461 (11.6%) |
| 5 or more Vehicles | 3,704 (8.4%) | 2,285 (5.9%) |
| Total | 44,050 (100.0%) | 38,552 (100.0%) |
Commute Time in Paulding County
The most frequently occuring commute durations in Paulding County are 45 to 59 minutes (12,913 commuters, 17.8%), 60 to 89 minutes (11,324 commuters, 15.6%), and 30 to 34 minutes (10,380 commuters, 14.3%).
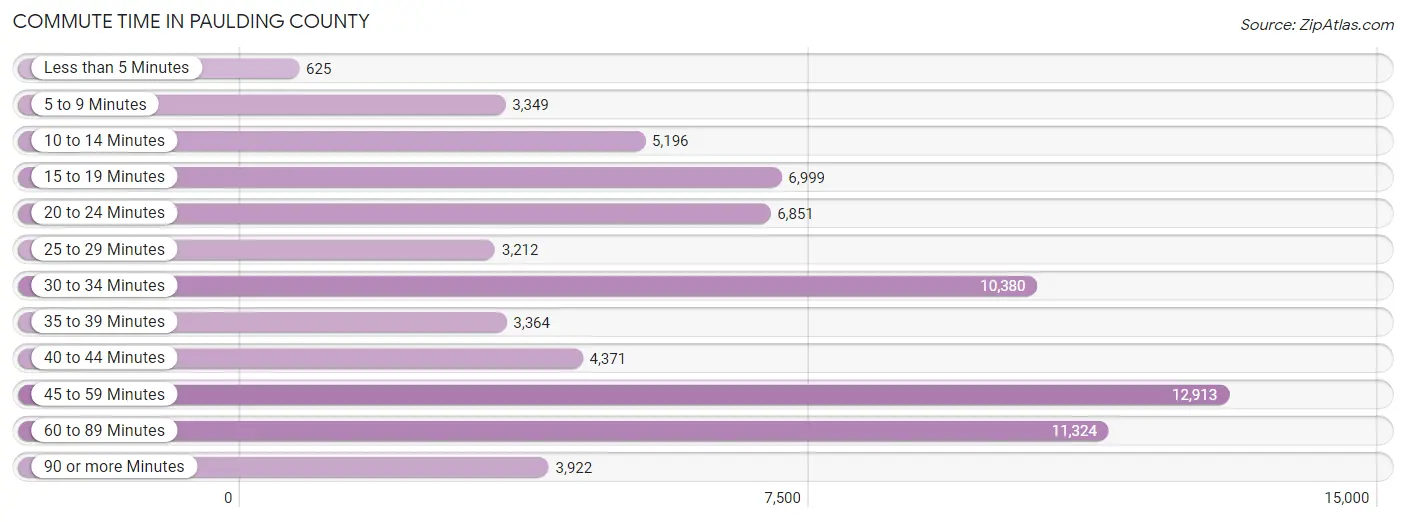
| Commute Time | # Commuters | % Commuters |
| Less than 5 Minutes | 625 | 0.9% |
| 5 to 9 Minutes | 3,349 | 4.6% |
| 10 to 14 Minutes | 5,196 | 7.2% |
| 15 to 19 Minutes | 6,999 | 9.7% |
| 20 to 24 Minutes | 6,851 | 9.5% |
| 25 to 29 Minutes | 3,212 | 4.4% |
| 30 to 34 Minutes | 10,380 | 14.3% |
| 35 to 39 Minutes | 3,364 | 4.6% |
| 40 to 44 Minutes | 4,371 | 6.0% |
| 45 to 59 Minutes | 12,913 | 17.8% |
| 60 to 89 Minutes | 11,324 | 15.6% |
| 90 or more Minutes | 3,922 | 5.4% |
Commute Time by Sex in Paulding County
The most common commute times in Paulding County are 45 to 59 minutes (7,292 commuters, 18.4%) for males and 45 to 59 minutes (5,621 commuters, 17.1%) for females.
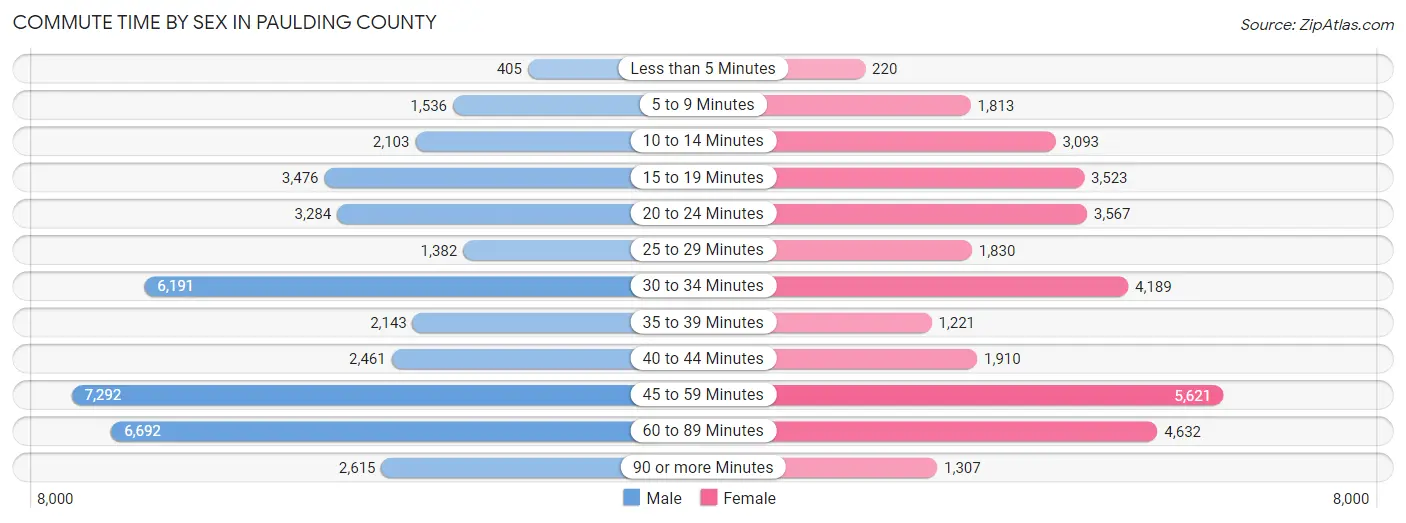
| Commute Time | Male | Female |
| Less than 5 Minutes | 405 (1.0%) | 220 (0.7%) |
| 5 to 9 Minutes | 1,536 (3.9%) | 1,813 (5.5%) |
| 10 to 14 Minutes | 2,103 (5.3%) | 3,093 (9.4%) |
| 15 to 19 Minutes | 3,476 (8.8%) | 3,523 (10.7%) |
| 20 to 24 Minutes | 3,284 (8.3%) | 3,567 (10.8%) |
| 25 to 29 Minutes | 1,382 (3.5%) | 1,830 (5.6%) |
| 30 to 34 Minutes | 6,191 (15.6%) | 4,189 (12.7%) |
| 35 to 39 Minutes | 2,143 (5.4%) | 1,221 (3.7%) |
| 40 to 44 Minutes | 2,461 (6.2%) | 1,910 (5.8%) |
| 45 to 59 Minutes | 7,292 (18.4%) | 5,621 (17.1%) |
| 60 to 89 Minutes | 6,692 (16.9%) | 4,632 (14.1%) |
| 90 or more Minutes | 2,615 (6.6%) | 1,307 (4.0%) |
Time of Departure to Work by Sex in Paulding County
The most frequent times of departure to work in Paulding County are 7:00 AM to 7:29 AM (6,469, 16.3%) for males and 7:00 AM to 7:29 AM (4,939, 15.0%) for females.
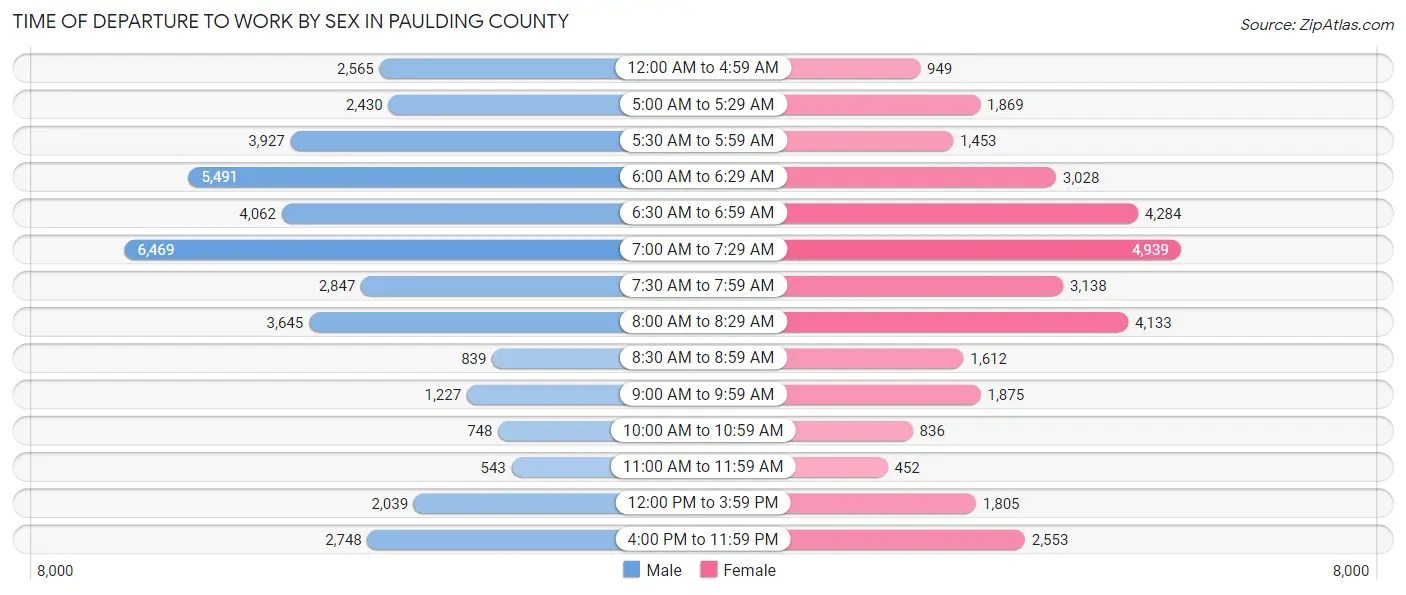
| Time of Departure | Male | Female |
| 12:00 AM to 4:59 AM | 2,565 (6.5%) | 949 (2.9%) |
| 5:00 AM to 5:29 AM | 2,430 (6.1%) | 1,869 (5.7%) |
| 5:30 AM to 5:59 AM | 3,927 (9.9%) | 1,453 (4.4%) |
| 6:00 AM to 6:29 AM | 5,491 (13.9%) | 3,028 (9.2%) |
| 6:30 AM to 6:59 AM | 4,062 (10.3%) | 4,284 (13.0%) |
| 7:00 AM to 7:29 AM | 6,469 (16.3%) | 4,939 (15.0%) |
| 7:30 AM to 7:59 AM | 2,847 (7.2%) | 3,138 (9.5%) |
| 8:00 AM to 8:29 AM | 3,645 (9.2%) | 4,133 (12.6%) |
| 8:30 AM to 8:59 AM | 839 (2.1%) | 1,612 (4.9%) |
| 9:00 AM to 9:59 AM | 1,227 (3.1%) | 1,875 (5.7%) |
| 10:00 AM to 10:59 AM | 748 (1.9%) | 836 (2.5%) |
| 11:00 AM to 11:59 AM | 543 (1.4%) | 452 (1.4%) |
| 12:00 PM to 3:59 PM | 2,039 (5.1%) | 1,805 (5.5%) |
| 4:00 PM to 11:59 PM | 2,748 (6.9%) | 2,553 (7.7%) |
| Total | 39,580 (100.0%) | 32,926 (100.0%) |
Housing Occupancy in Paulding County
Occupancy by Ownership in Paulding County
Of the total 56,715 dwellings in Paulding County, owner-occupied units account for 45,544 (80.3%), while renter-occupied units make up 11,171 (19.7%).
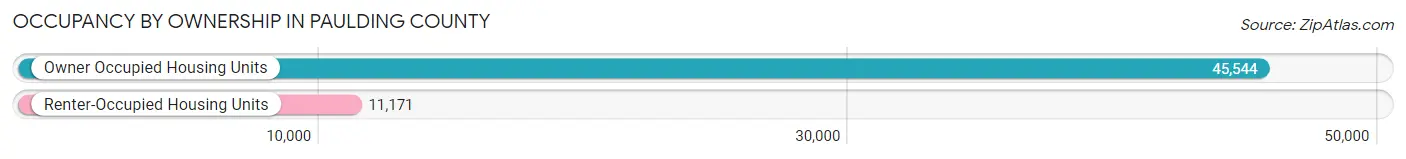
| Occupancy | # Housing Units | % Housing Units |
| Owner Occupied Housing Units | 45,544 | 80.3% |
| Renter-Occupied Housing Units | 11,171 | 19.7% |
| Total Occupied Housing Units | 56,715 | 100.0% |
Occupancy by Household Size in Paulding County
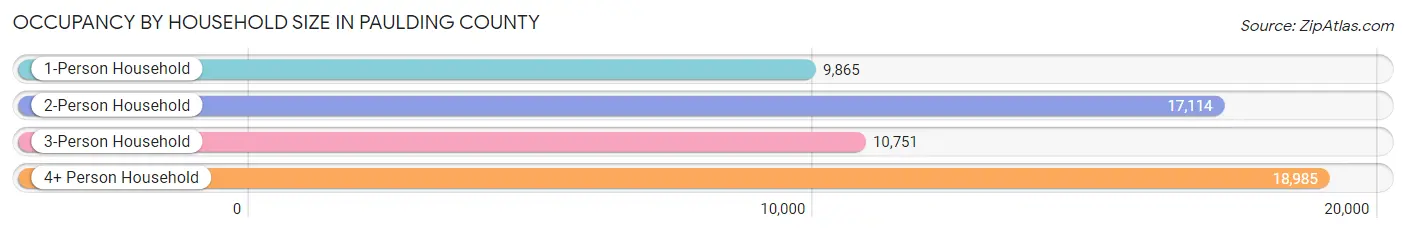
| Household Size | # Housing Units | % Housing Units |
| 1-Person Household | 9,865 | 17.4% |
| 2-Person Household | 17,114 | 30.2% |
| 3-Person Household | 10,751 | 19.0% |
| 4+ Person Household | 18,985 | 33.5% |
| Total Housing Units | 56,715 | 100.0% |
Occupancy by Ownership by Household Size in Paulding County
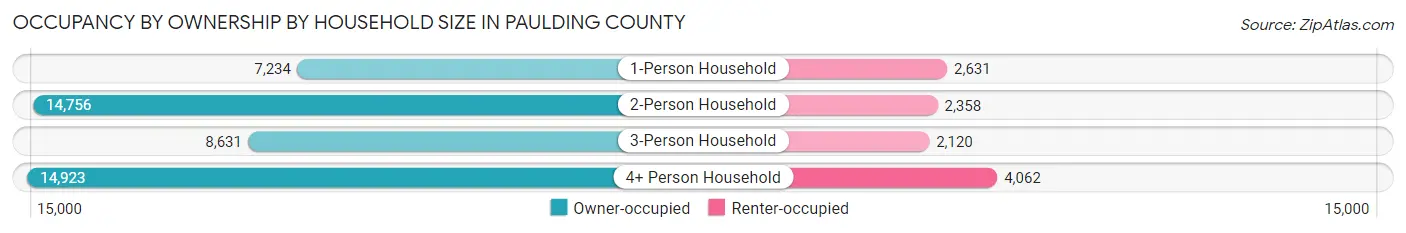
| Household Size | Owner-occupied | Renter-occupied |
| 1-Person Household | 7,234 (73.3%) | 2,631 (26.7%) |
| 2-Person Household | 14,756 (86.2%) | 2,358 (13.8%) |
| 3-Person Household | 8,631 (80.3%) | 2,120 (19.7%) |
| 4+ Person Household | 14,923 (78.6%) | 4,062 (21.4%) |
| Total Housing Units | 45,544 (80.3%) | 11,171 (19.7%) |
Occupancy by Educational Attainment in Paulding County
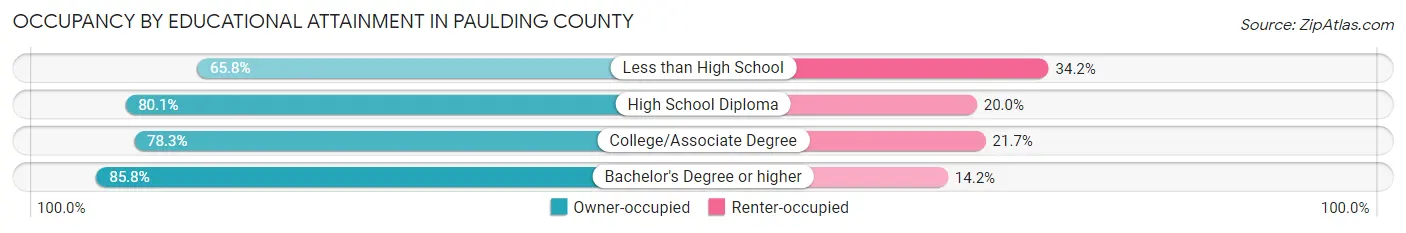
| Household Size | Owner-occupied | Renter-occupied |
| Less than High School | 2,396 (65.8%) | 1,245 (34.2%) |
| High School Diploma | 12,559 (80.0%) | 3,129 (20.0%) |
| College/Associate Degree | 15,484 (78.3%) | 4,293 (21.7%) |
| Bachelor's Degree or higher | 15,105 (85.8%) | 2,504 (14.2%) |
Occupancy by Age of Householder in Paulding County
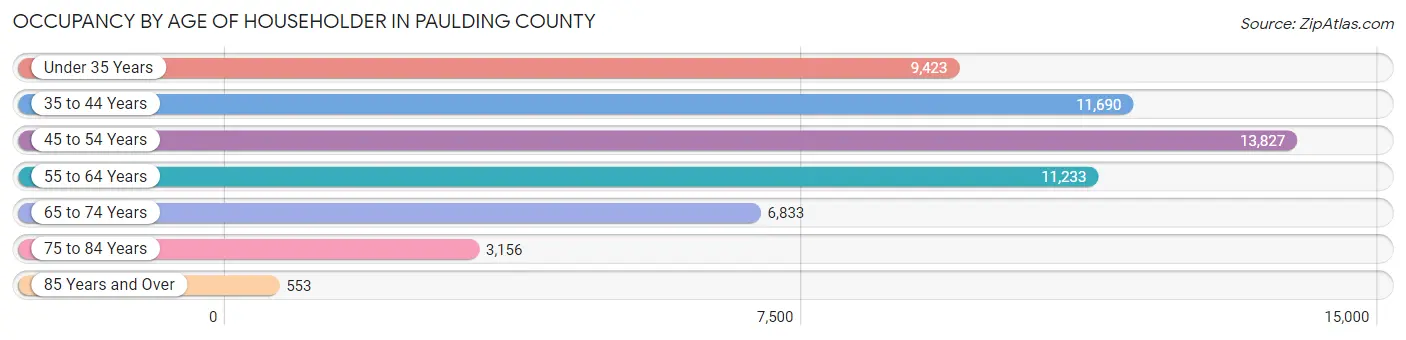
| Age Bracket | # Households | % Households |
| Under 35 Years | 9,423 | 16.6% |
| 35 to 44 Years | 11,690 | 20.6% |
| 45 to 54 Years | 13,827 | 24.4% |
| 55 to 64 Years | 11,233 | 19.8% |
| 65 to 74 Years | 6,833 | 12.0% |
| 75 to 84 Years | 3,156 | 5.6% |
| 85 Years and Over | 553 | 1.0% |
| Total | 56,715 | 100.0% |
Housing Finances in Paulding County
Median Income by Occupancy in Paulding County
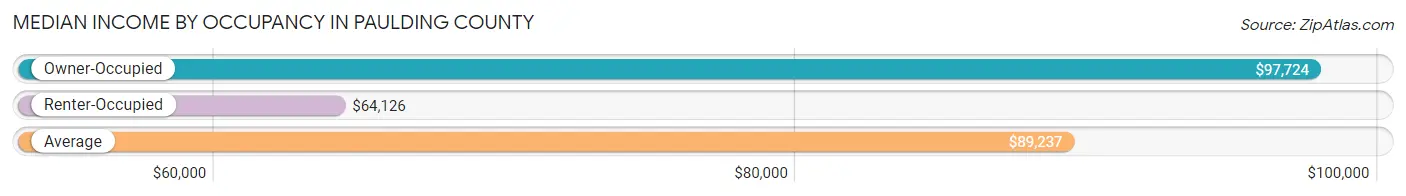
| Occupancy Type | # Households | Median Income |
| Owner-Occupied | 45,544 (80.3%) | $97,724 |
| Renter-Occupied | 11,171 (19.7%) | $64,126 |
| Average | 56,715 (100.0%) | $89,237 |
Occupancy by Householder Income Bracket in Paulding County
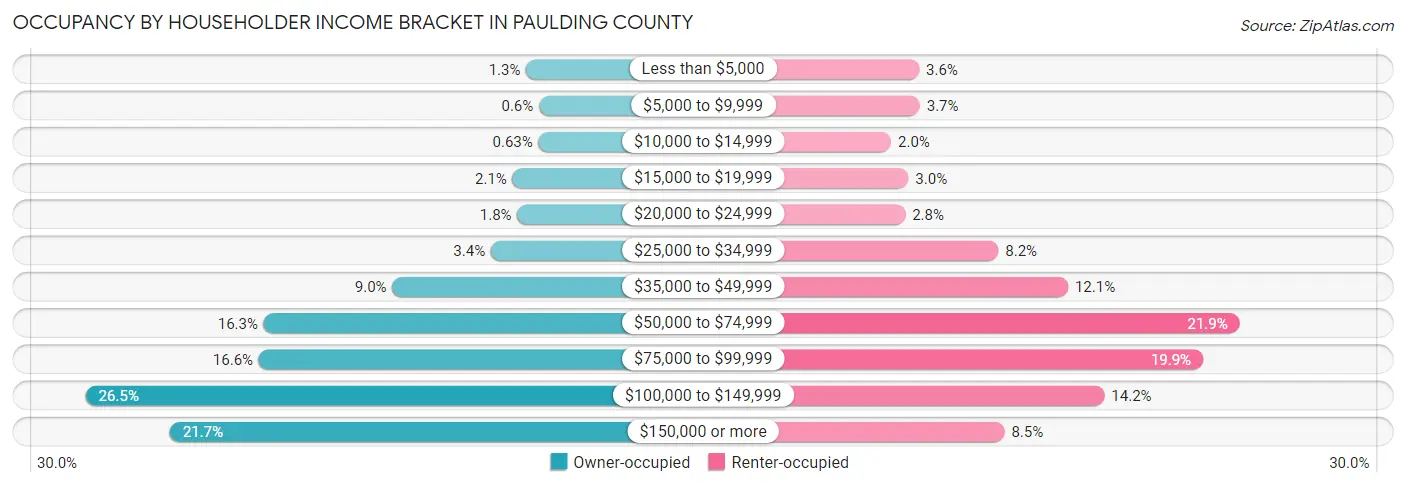
| Income Bracket | Owner-occupied | Renter-occupied |
| Less than $5,000 | 604 (1.3%) | 405 (3.6%) |
| $5,000 to $9,999 | 271 (0.6%) | 410 (3.7%) |
| $10,000 to $14,999 | 289 (0.6%) | 227 (2.0%) |
| $15,000 to $19,999 | 961 (2.1%) | 337 (3.0%) |
| $20,000 to $24,999 | 839 (1.8%) | 317 (2.8%) |
| $25,000 to $34,999 | 1,527 (3.4%) | 912 (8.2%) |
| $35,000 to $49,999 | 4,090 (9.0%) | 1,356 (12.1%) |
| $50,000 to $74,999 | 7,436 (16.3%) | 2,451 (21.9%) |
| $75,000 to $99,999 | 7,566 (16.6%) | 2,217 (19.9%) |
| $100,000 to $149,999 | 12,080 (26.5%) | 1,588 (14.2%) |
| $150,000 or more | 9,881 (21.7%) | 951 (8.5%) |
| Total | 45,544 (100.0%) | 11,171 (100.0%) |
Monthly Housing Cost Tiers in Paulding County
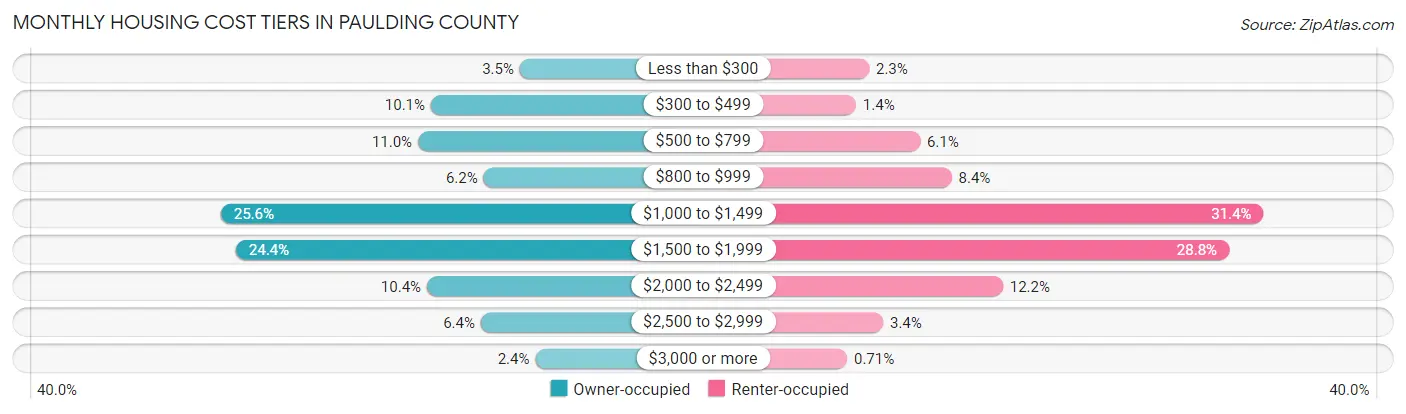
| Monthly Cost | Owner-occupied | Renter-occupied |
| Less than $300 | 1,608 (3.5%) | 260 (2.3%) |
| $300 to $499 | 4,592 (10.1%) | 152 (1.4%) |
| $500 to $799 | 5,022 (11.0%) | 679 (6.1%) |
| $800 to $999 | 2,824 (6.2%) | 940 (8.4%) |
| $1,000 to $1,499 | 11,636 (25.6%) | 3,504 (31.4%) |
| $1,500 to $1,999 | 11,131 (24.4%) | 3,221 (28.8%) |
| $2,000 to $2,499 | 4,725 (10.4%) | 1,361 (12.2%) |
| $2,500 to $2,999 | 2,916 (6.4%) | 375 (3.4%) |
| $3,000 or more | 1,090 (2.4%) | 79 (0.7%) |
| Total | 45,544 (100.0%) | 11,171 (100.0%) |
Physical Housing Characteristics in Paulding County
Housing Structures in Paulding County
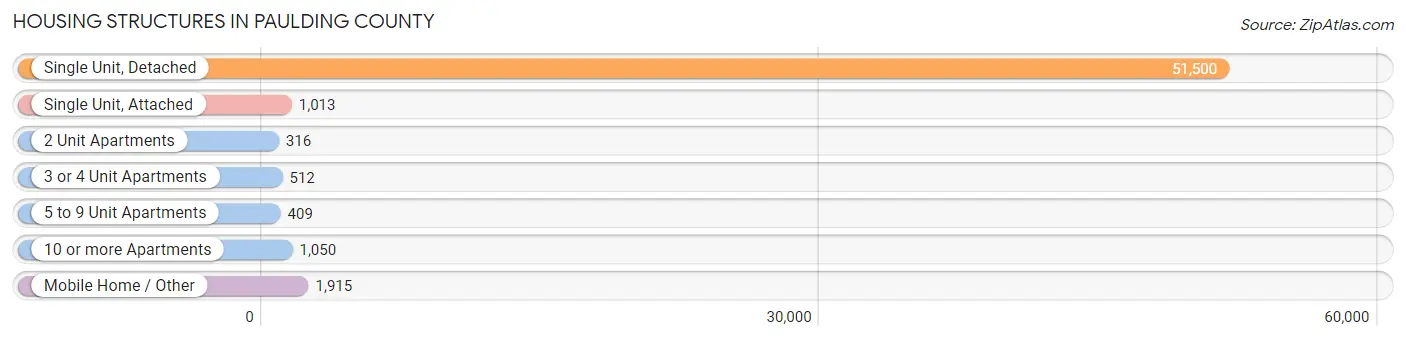
| Structure Type | # Housing Units | % Housing Units |
| Single Unit, Detached | 51,500 | 90.8% |
| Single Unit, Attached | 1,013 | 1.8% |
| 2 Unit Apartments | 316 | 0.6% |
| 3 or 4 Unit Apartments | 512 | 0.9% |
| 5 to 9 Unit Apartments | 409 | 0.7% |
| 10 or more Apartments | 1,050 | 1.8% |
| Mobile Home / Other | 1,915 | 3.4% |
| Total | 56,715 | 100.0% |
Housing Structures by Occupancy in Paulding County
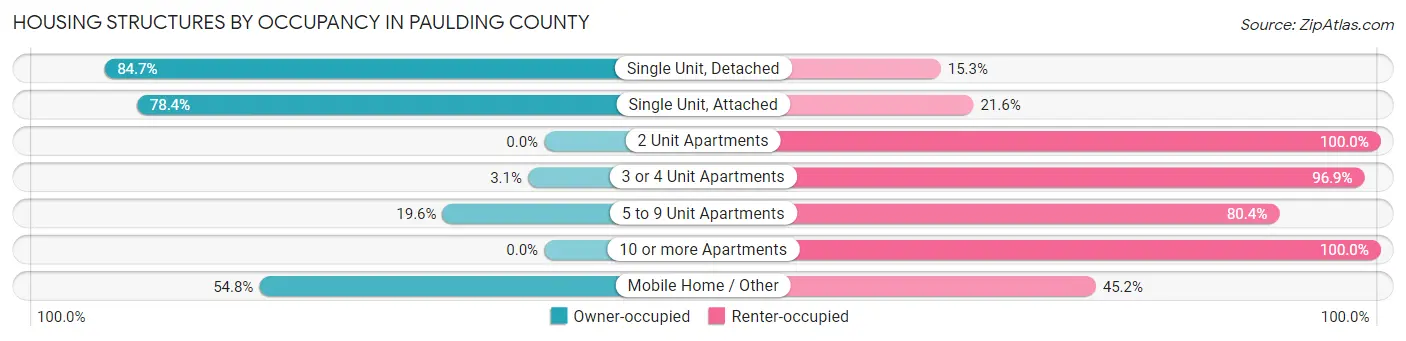
| Structure Type | Owner-occupied | Renter-occupied |
| Single Unit, Detached | 43,604 (84.7%) | 7,896 (15.3%) |
| Single Unit, Attached | 794 (78.4%) | 219 (21.6%) |
| 2 Unit Apartments | 0 (0.0%) | 316 (100.0%) |
| 3 or 4 Unit Apartments | 16 (3.1%) | 496 (96.9%) |
| 5 to 9 Unit Apartments | 80 (19.6%) | 329 (80.4%) |
| 10 or more Apartments | 0 (0.0%) | 1,050 (100.0%) |
| Mobile Home / Other | 1,050 (54.8%) | 865 (45.2%) |
| Total | 45,544 (80.3%) | 11,171 (19.7%) |
Housing Structures by Number of Rooms in Paulding County
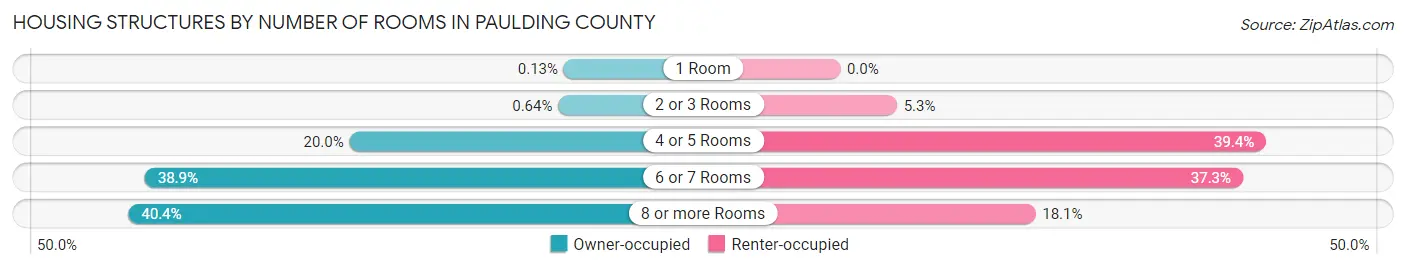
| Number of Rooms | Owner-occupied | Renter-occupied |
| 1 Room | 59 (0.1%) | 0 (0.0%) |
| 2 or 3 Rooms | 291 (0.6%) | 587 (5.2%) |
| 4 or 5 Rooms | 9,087 (20.0%) | 4,403 (39.4%) |
| 6 or 7 Rooms | 17,707 (38.9%) | 4,162 (37.3%) |
| 8 or more Rooms | 18,400 (40.4%) | 2,019 (18.1%) |
| Total | 45,544 (100.0%) | 11,171 (100.0%) |
Housing Structure by Heating Type in Paulding County
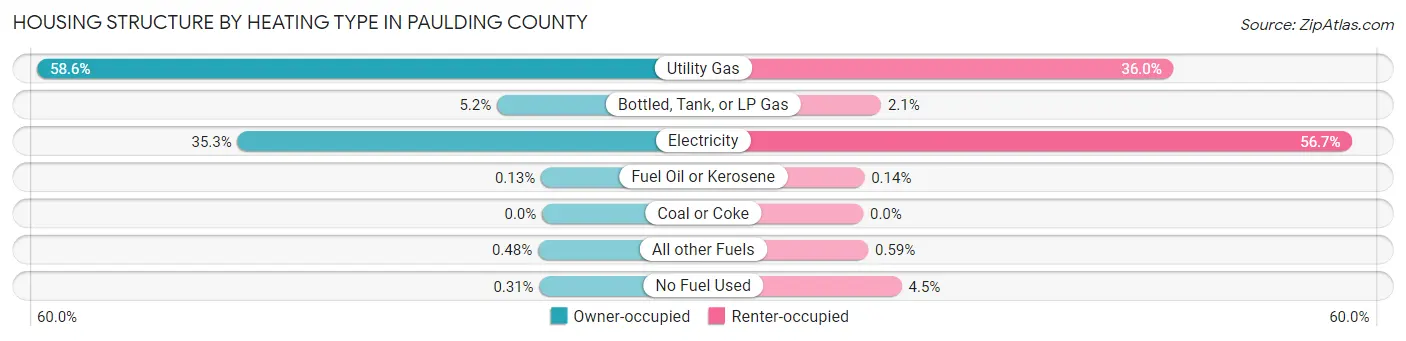
| Heating Type | Owner-occupied | Renter-occupied |
| Utility Gas | 26,665 (58.6%) | 4,022 (36.0%) |
| Bottled, Tank, or LP Gas | 2,378 (5.2%) | 232 (2.1%) |
| Electricity | 16,080 (35.3%) | 6,336 (56.7%) |
| Fuel Oil or Kerosene | 60 (0.1%) | 16 (0.1%) |
| Coal or Coke | 0 (0.0%) | 0 (0.0%) |
| All other Fuels | 220 (0.5%) | 66 (0.6%) |
| No Fuel Used | 141 (0.3%) | 499 (4.5%) |
| Total | 45,544 (100.0%) | 11,171 (100.0%) |
Household Vehicle Usage in Paulding County
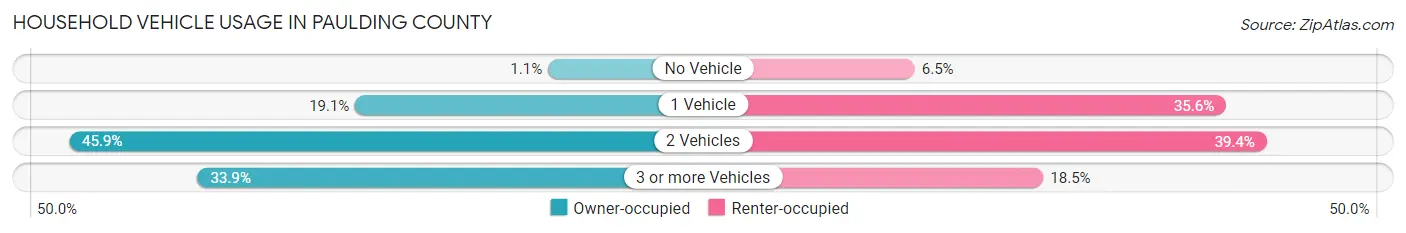
| Vehicles per Household | Owner-occupied | Renter-occupied |
| No Vehicle | 521 (1.1%) | 729 (6.5%) |
| 1 Vehicle | 8,718 (19.1%) | 3,974 (35.6%) |
| 2 Vehicles | 20,884 (45.9%) | 4,398 (39.4%) |
| 3 or more Vehicles | 15,421 (33.9%) | 2,070 (18.5%) |
| Total | 45,544 (100.0%) | 11,171 (100.0%) |
Real Estate & Mortgages in Paulding County
Real Estate and Mortgage Overview in Paulding County
| Characteristic | Without Mortgage | With Mortgage |
| Housing Units | 10,963 | 34,581 |
| Median Property Value | $221,800 | $260,200 |
| Median Household Income | $66,149 | $8,587 |
| Monthly Housing Costs | $476 | $1,090 |
| Real Estate Taxes | $1,710 | $697 |
Property Value by Mortgage Status in Paulding County
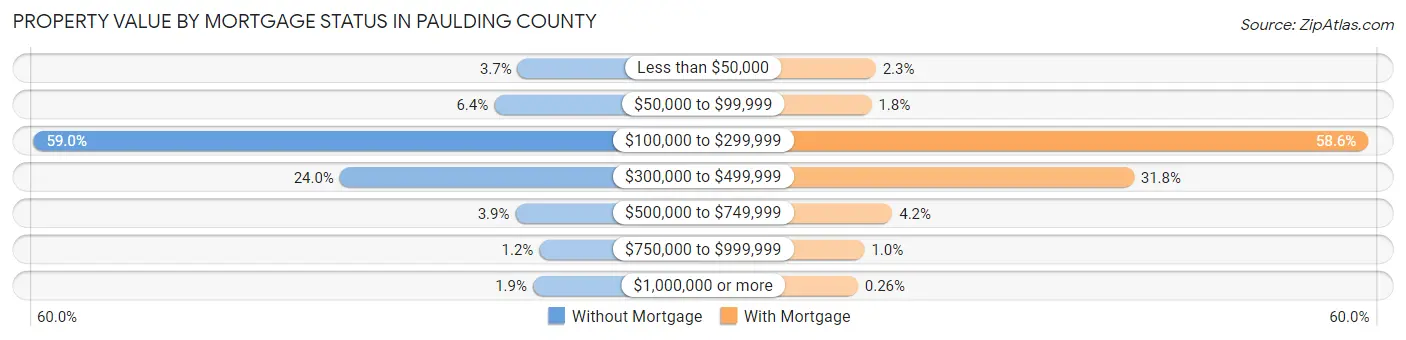
| Property Value | Without Mortgage | With Mortgage |
| Less than $50,000 | 401 (3.7%) | 800 (2.3%) |
| $50,000 to $99,999 | 696 (6.4%) | 630 (1.8%) |
| $100,000 to $299,999 | 6,466 (59.0%) | 20,258 (58.6%) |
| $300,000 to $499,999 | 2,630 (24.0%) | 10,996 (31.8%) |
| $500,000 to $749,999 | 430 (3.9%) | 1,454 (4.2%) |
| $750,000 to $999,999 | 130 (1.2%) | 353 (1.0%) |
| $1,000,000 or more | 210 (1.9%) | 90 (0.3%) |
| Total | 10,963 (100.0%) | 34,581 (100.0%) |
Household Income by Mortgage Status in Paulding County
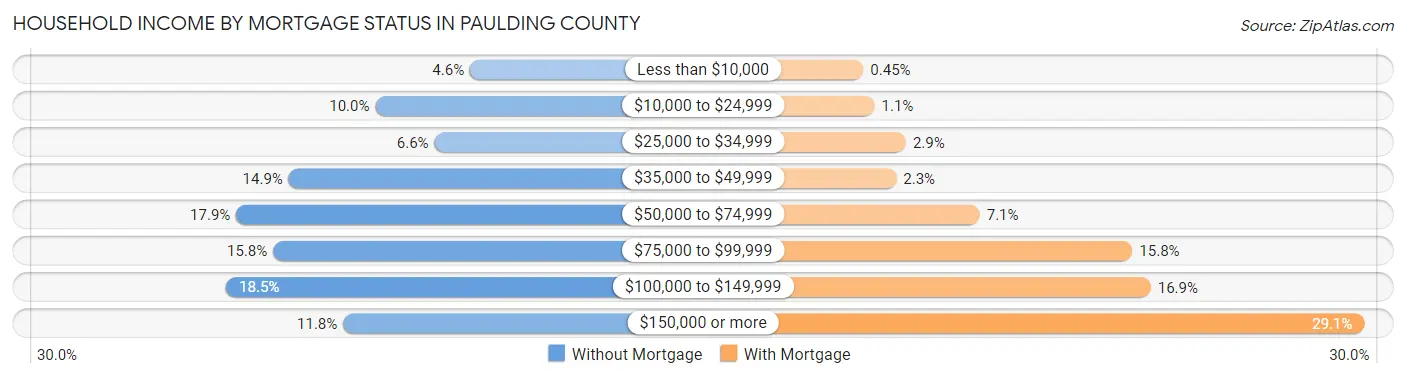
| Household Income | Without Mortgage | With Mortgage |
| Less than $10,000 | 499 (4.5%) | 154 (0.4%) |
| $10,000 to $24,999 | 1,092 (10.0%) | 376 (1.1%) |
| $25,000 to $34,999 | 721 (6.6%) | 997 (2.9%) |
| $35,000 to $49,999 | 1,635 (14.9%) | 806 (2.3%) |
| $50,000 to $74,999 | 1,964 (17.9%) | 2,455 (7.1%) |
| $75,000 to $99,999 | 1,732 (15.8%) | 5,472 (15.8%) |
| $100,000 to $149,999 | 2,026 (18.5%) | 5,834 (16.9%) |
| $150,000 or more | 1,294 (11.8%) | 10,054 (29.1%) |
| Total | 10,963 (100.0%) | 34,581 (100.0%) |
Property Value to Household Income Ratio in Paulding County
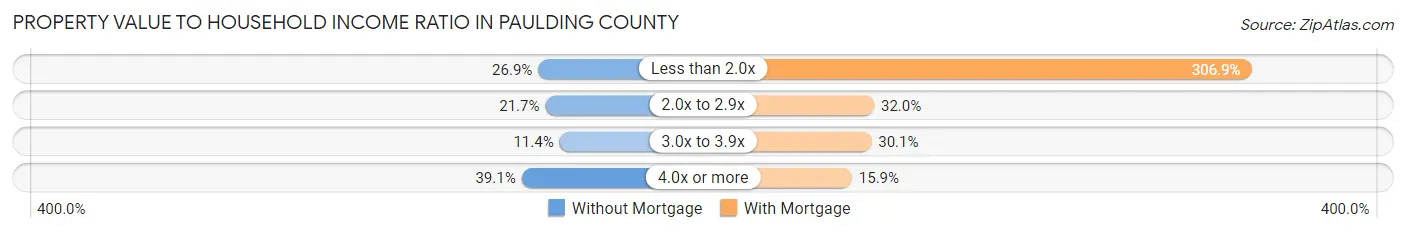
| Value-to-Income Ratio | Without Mortgage | With Mortgage |
| Less than 2.0x | 2,952 (26.9%) | 106,123 (306.9%) |
| 2.0x to 2.9x | 2,381 (21.7%) | 11,081 (32.0%) |
| 3.0x to 3.9x | 1,253 (11.4%) | 10,398 (30.1%) |
| 4.0x or more | 4,282 (39.1%) | 5,507 (15.9%) |
| Total | 10,963 (100.0%) | 34,581 (100.0%) |
Real Estate Taxes by Mortgage Status in Paulding County
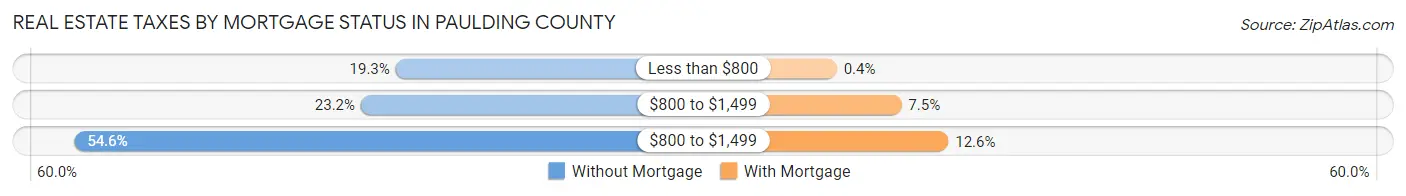
| Property Taxes | Without Mortgage | With Mortgage |
| Less than $800 | 2,120 (19.3%) | 139 (0.4%) |
| $800 to $1,499 | 2,538 (23.2%) | 2,589 (7.5%) |
| $800 to $1,499 | 5,980 (54.5%) | 4,366 (12.6%) |
| Total | 10,963 (100.0%) | 34,581 (100.0%) |
Health & Disability in Paulding County
Health Insurance Coverage by Age in Paulding County
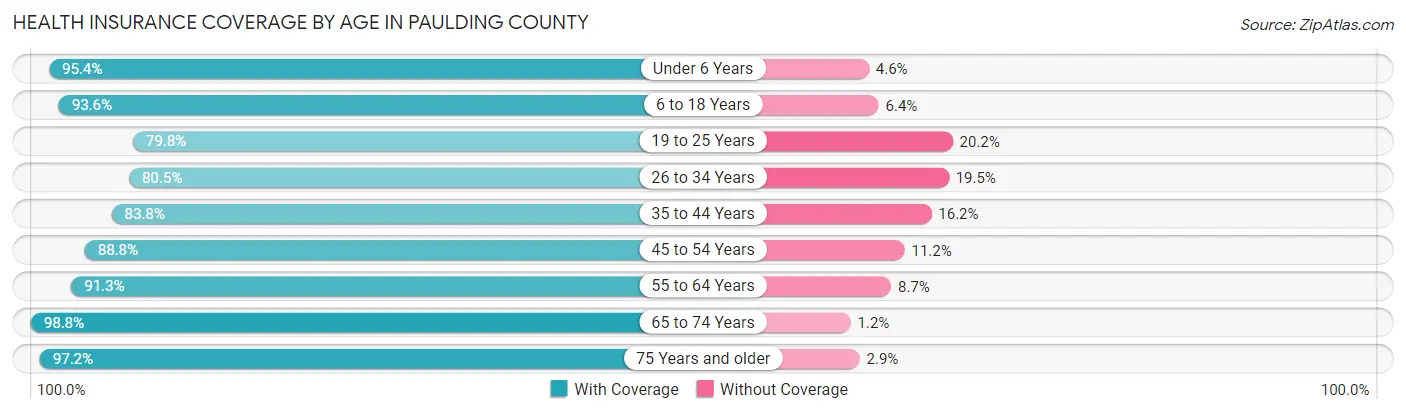
| Age Bracket | With Coverage | Without Coverage |
| Under 6 Years | 11,859 (95.4%) | 569 (4.6%) |
| 6 to 18 Years | 31,430 (93.6%) | 2,147 (6.4%) |
| 19 to 25 Years | 11,679 (79.8%) | 2,957 (20.2%) |
| 26 to 34 Years | 16,168 (80.5%) | 3,910 (19.5%) |
| 35 to 44 Years | 20,199 (83.8%) | 3,914 (16.2%) |
| 45 to 54 Years | 22,540 (88.8%) | 2,852 (11.2%) |
| 55 to 64 Years | 18,061 (91.3%) | 1,725 (8.7%) |
| 65 to 74 Years | 12,040 (98.8%) | 144 (1.2%) |
| 75 Years and older | 6,510 (97.2%) | 191 (2.9%) |
| Total | 150,486 (89.1%) | 18,409 (10.9%) |
Health Insurance Coverage by Citizenship Status in Paulding County
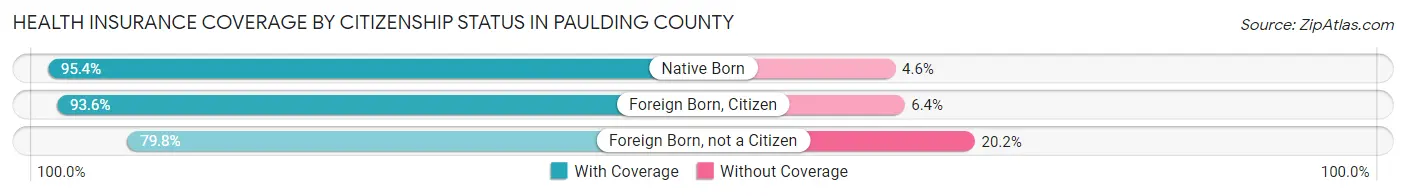
| Citizenship Status | With Coverage | Without Coverage |
| Native Born | 11,859 (95.4%) | 569 (4.6%) |
| Foreign Born, Citizen | 31,430 (93.6%) | 2,147 (6.4%) |
| Foreign Born, not a Citizen | 11,679 (79.8%) | 2,957 (20.2%) |
Health Insurance Coverage by Household Income in Paulding County
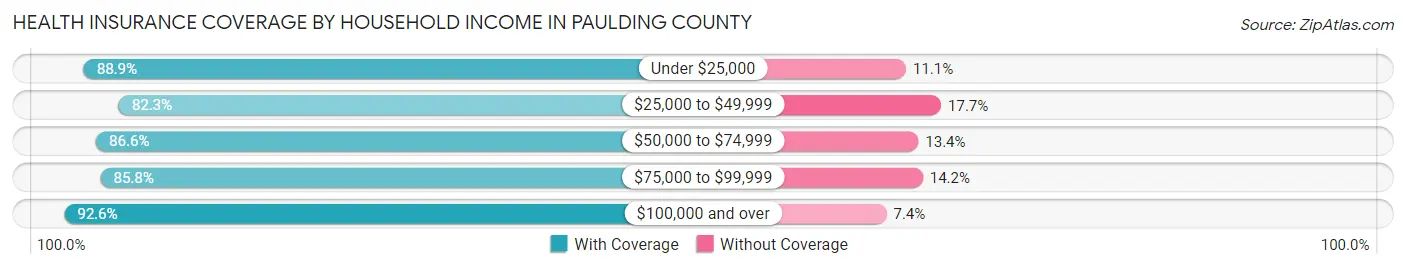
| Household Income | With Coverage | Without Coverage |
| Under $25,000 | 7,912 (88.9%) | 988 (11.1%) |
| $25,000 to $49,999 | 15,025 (82.3%) | 3,224 (17.7%) |
| $50,000 to $74,999 | 23,139 (86.6%) | 3,584 (13.4%) |
| $75,000 to $99,999 | 26,009 (85.8%) | 4,317 (14.2%) |
| $100,000 and over | 78,377 (92.6%) | 6,296 (7.4%) |
Public vs Private Health Insurance Coverage by Age in Paulding County
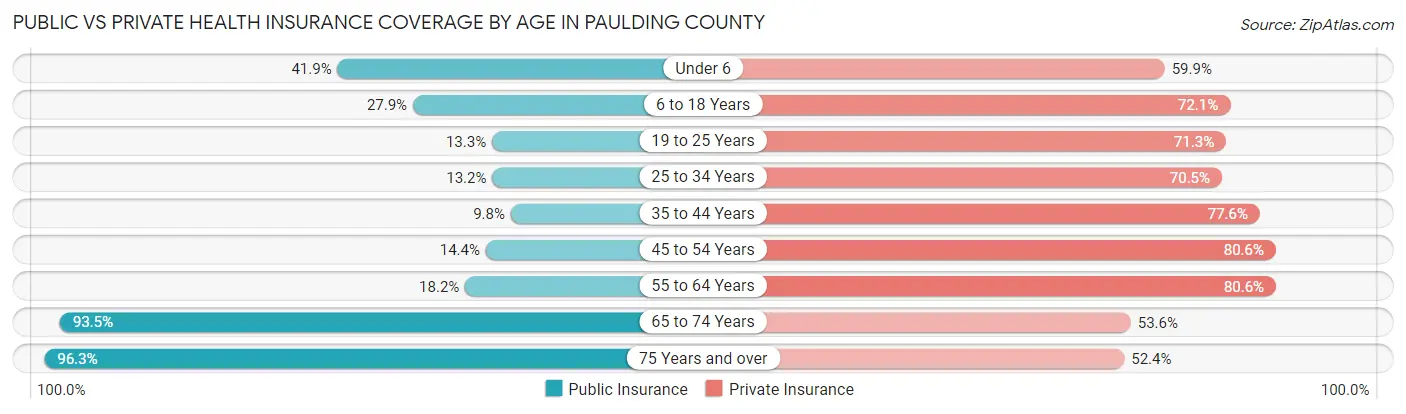
| Age Bracket | Public Insurance | Private Insurance |
| Under 6 | 5,210 (41.9%) | 7,449 (59.9%) |
| 6 to 18 Years | 9,376 (27.9%) | 24,195 (72.1%) |
| 19 to 25 Years | 1,940 (13.3%) | 10,438 (71.3%) |
| 25 to 34 Years | 2,649 (13.2%) | 14,163 (70.5%) |
| 35 to 44 Years | 2,350 (9.8%) | 18,708 (77.6%) |
| 45 to 54 Years | 3,656 (14.4%) | 20,452 (80.5%) |
| 55 to 64 Years | 3,606 (18.2%) | 15,944 (80.6%) |
| 65 to 74 Years | 11,387 (93.5%) | 6,536 (53.6%) |
| 75 Years and over | 6,456 (96.3%) | 3,514 (52.4%) |
| Total | 46,630 (27.6%) | 121,399 (71.9%) |
Disability Status by Sex by Age in Paulding County
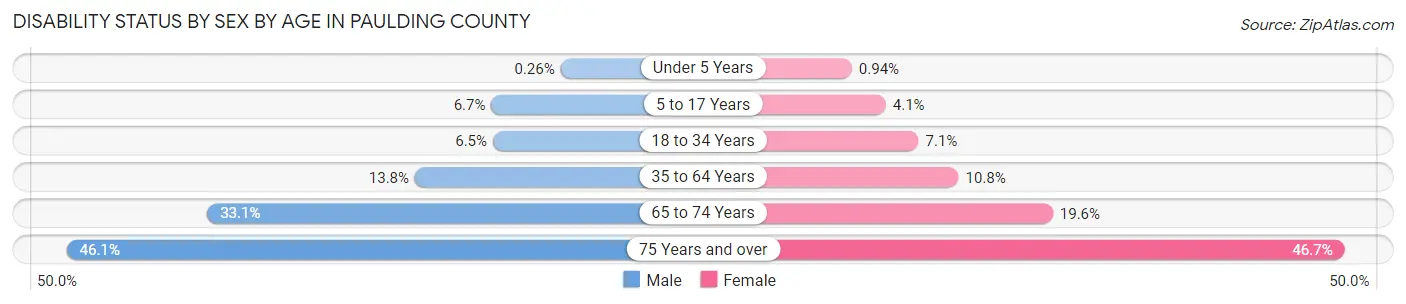
| Age Bracket | Male | Female |
| Under 5 Years | 14 (0.3%) | 48 (0.9%) |
| 5 to 17 Years | 1,113 (6.7%) | 676 (4.1%) |
| 18 to 34 Years | 1,196 (6.5%) | 1,343 (7.1%) |
| 35 to 64 Years | 4,692 (13.8%) | 3,818 (10.8%) |
| 65 to 74 Years | 1,852 (33.1%) | 1,289 (19.6%) |
| 75 Years and over | 1,241 (46.1%) | 1,870 (46.7%) |
Disability Class by Sex by Age in Paulding County
Disability Class: Hearing Difficulty
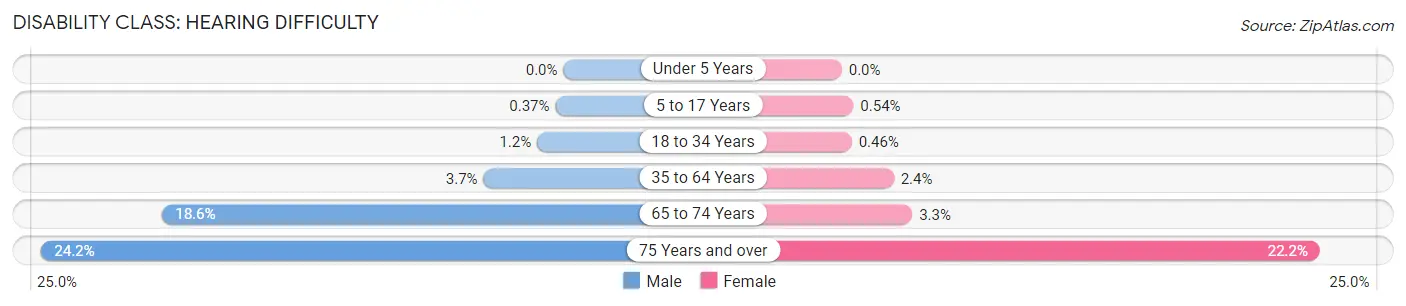
| Age Bracket | Male | Female |
| Under 5 Years | 0 (0.0%) | 0 (0.0%) |
| 5 to 17 Years | 62 (0.4%) | 89 (0.5%) |
| 18 to 34 Years | 223 (1.2%) | 86 (0.5%) |
| 35 to 64 Years | 1,264 (3.7%) | 849 (2.4%) |
| 65 to 74 Years | 1,043 (18.6%) | 215 (3.3%) |
| 75 Years and over | 652 (24.2%) | 889 (22.2%) |
Disability Class: Vision Difficulty
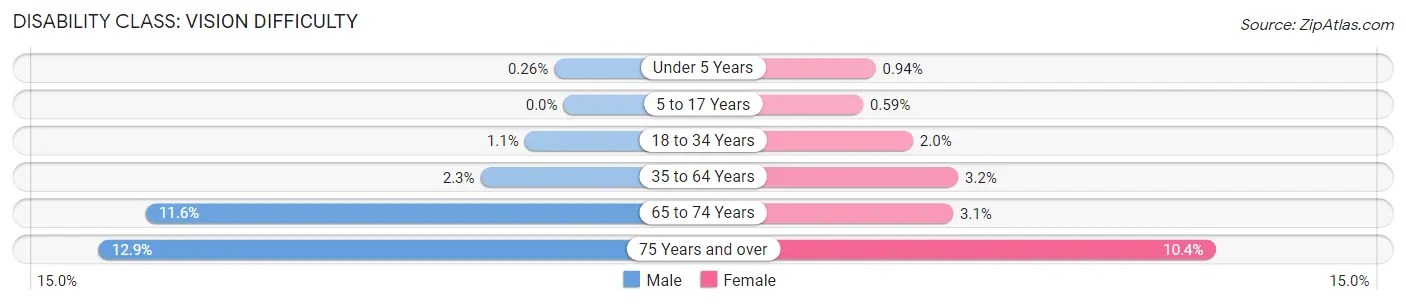
| Age Bracket | Male | Female |
| Under 5 Years | 14 (0.3%) | 48 (0.9%) |
| 5 to 17 Years | 0 (0.0%) | 98 (0.6%) |
| 18 to 34 Years | 198 (1.1%) | 373 (2.0%) |
| 35 to 64 Years | 788 (2.3%) | 1,141 (3.2%) |
| 65 to 74 Years | 651 (11.6%) | 204 (3.1%) |
| 75 Years and over | 348 (12.9%) | 417 (10.4%) |
Disability Class: Cognitive Difficulty
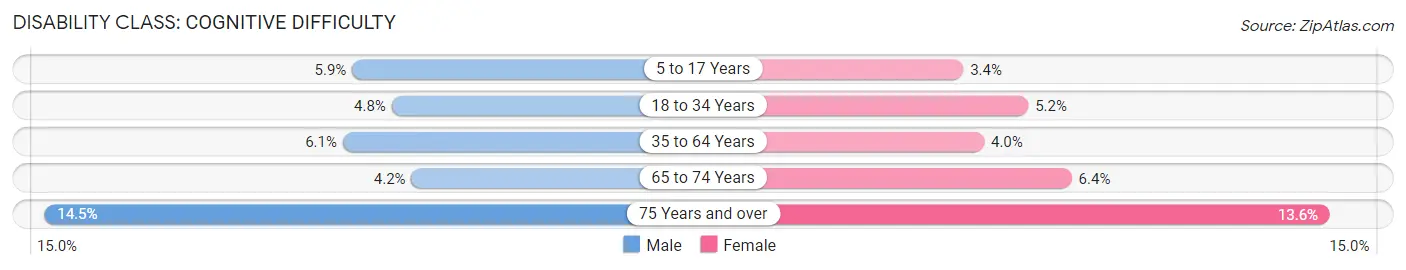
| Age Bracket | Male | Female |
| 5 to 17 Years | 978 (5.9%) | 559 (3.4%) |
| 18 to 34 Years | 873 (4.8%) | 978 (5.2%) |
| 35 to 64 Years | 2,090 (6.1%) | 1,397 (4.0%) |
| 65 to 74 Years | 237 (4.2%) | 421 (6.4%) |
| 75 Years and over | 389 (14.4%) | 545 (13.6%) |
Disability Class: Ambulatory Difficulty
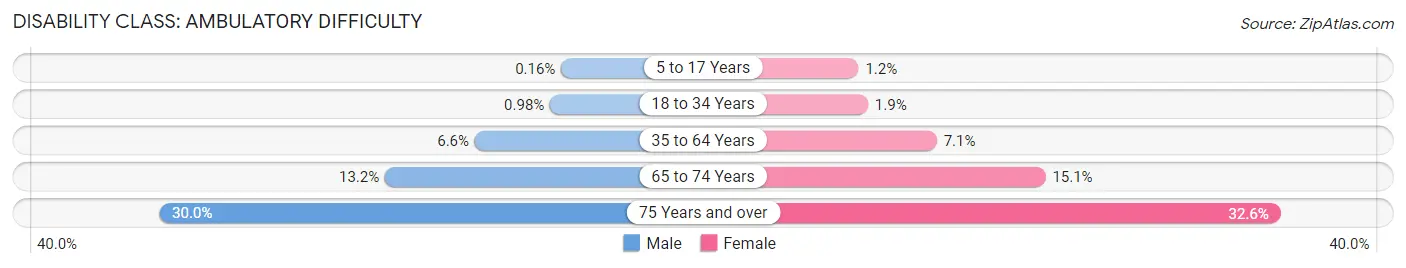
| Age Bracket | Male | Female |
| 5 to 17 Years | 27 (0.2%) | 205 (1.2%) |
| 18 to 34 Years | 180 (1.0%) | 365 (1.9%) |
| 35 to 64 Years | 2,238 (6.6%) | 2,484 (7.0%) |
| 65 to 74 Years | 742 (13.2%) | 995 (15.1%) |
| 75 Years and over | 808 (30.0%) | 1,306 (32.6%) |
Disability Class: Self-Care Difficulty
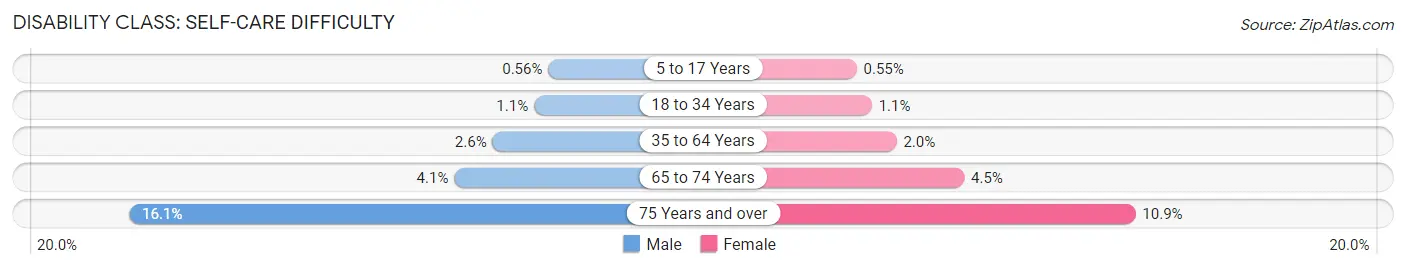
| Age Bracket | Male | Female |
| 5 to 17 Years | 93 (0.6%) | 91 (0.5%) |
| 18 to 34 Years | 200 (1.1%) | 209 (1.1%) |
| 35 to 64 Years | 895 (2.6%) | 714 (2.0%) |
| 65 to 74 Years | 227 (4.1%) | 299 (4.5%) |
| 75 Years and over | 434 (16.1%) | 437 (10.9%) |
Technology Access in Paulding County
Computing Device Access in Paulding County
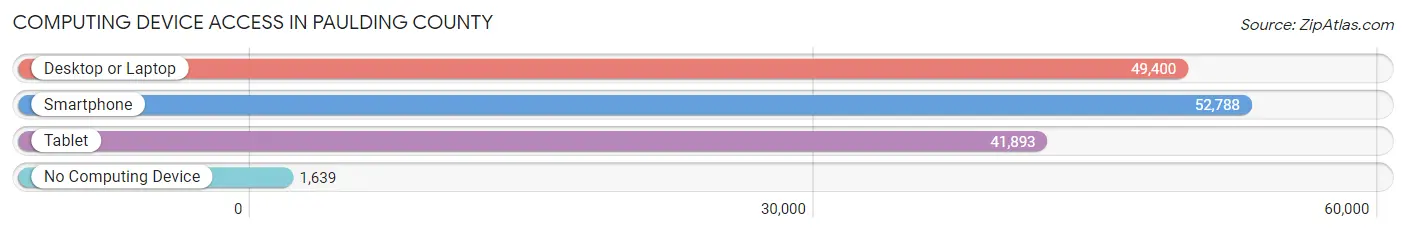
| Device Type | # Households | % Households |
| Desktop or Laptop | 49,400 | 87.1% |
| Smartphone | 52,788 | 93.1% |
| Tablet | 41,893 | 73.9% |
| No Computing Device | 1,639 | 2.9% |
| Total | 56,715 | 100.0% |
Internet Access in Paulding County
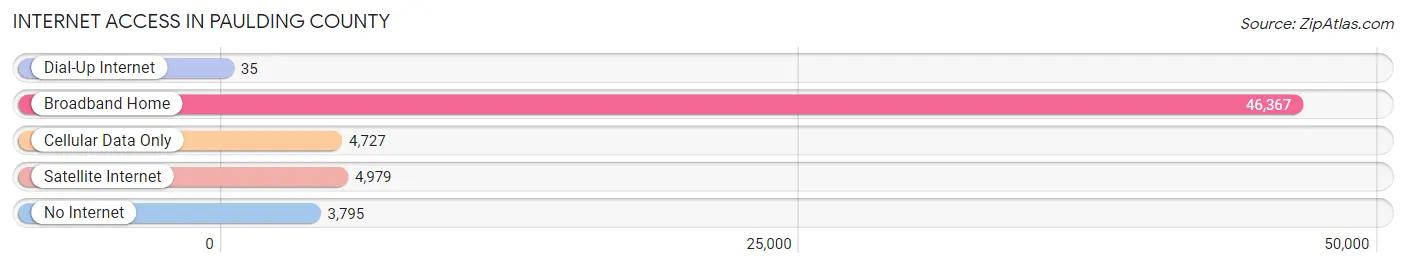
| Internet Type | # Households | % Households |
| Dial-Up Internet | 35 | 0.1% |
| Broadband Home | 46,367 | 81.8% |
| Cellular Data Only | 4,727 | 8.3% |
| Satellite Internet | 4,979 | 8.8% |
| No Internet | 3,795 | 6.7% |
| Total | 56,715 | 100.0% |
Paulding County Summary
Paulding County, Georgia is located in the northwestern corner of the state, and is part of the Atlanta metropolitan area. It is bordered by Cobb County to the east, Bartow County to the south, and Polk County to the west. The county seat is Dallas, and the county is named after Revolutionary War hero John Paulding.
History
Paulding County was created in 1832 from parts of Cherokee, Cobb, and Carroll counties. It was named after Revolutionary War hero John Paulding, who was one of the captors of British spy Major John Andre. The county was originally part of the Cherokee Nation, and the area was home to several Cherokee villages. The county was home to several Civil War battles, including the Battle of Dallas and the Battle of New Hope Church.
Geography
Paulding County covers an area of 437 square miles, and is located in the foothills of the Appalachian Mountains. The county is mostly rural, with rolling hills and forests. The Etowah River runs through the county, and there are several lakes, including Allatoona Lake, Lake Acworth, and Lake Allatoona.
Economy
The economy of Paulding County is largely based on agriculture and manufacturing. The county is home to several large poultry farms, and is also a major producer of corn, soybeans, and cotton. The county is also home to several manufacturing companies, including carpet and flooring manufacturer Shaw Industries, and automotive parts manufacturer Tenneco.
Demographics
As of the 2010 census, Paulding County had a population of 142,324. The population is mostly white (83.3%), with African Americans making up 11.2% of the population, and Hispanics making up 4.3%. The median household income is $60,945, and the median home value is $164,400.
Education
Paulding County is served by the Paulding County School District, which includes 24 elementary schools, 8 middle schools, and 6 high schools. The county is also home to several private schools, including the Paulding County Academy and the Paulding County Christian Academy. The county is also home to several higher education institutions, including Chattahoochee Technical College and the University of West Georgia.
Conclusion
Paulding County, Georgia is a rural county located in the northwestern corner of the state. It is home to several large poultry farms and manufacturing companies, and is part of the Atlanta metropolitan area. The population is mostly white, with African Americans and Hispanics making up a significant portion of the population. The county is served by the Paulding County School District, and is home to several higher education institutions.
Common Questions
What is the Total Population of Paulding County?
Total Population of Paulding County is 169,898.
What is the Total Male Population of Paulding County?
Total Male Population of Paulding County is 83,341.
What is the Total Female Population of Paulding County?
Total Female Population of Paulding County is 86,557.
What is the Ratio of Males per 100 Females in Paulding County?
There are 96.28 Males per 100 Females in Paulding County.
What is the Ratio of Females per 100 Males in Paulding County?
There are 103.86 Females per 100 Males in Paulding County.
What is the Median Population Age in Paulding County?
Median Population Age in Paulding County is 36.6 Years.
What is the Average Family Size in Paulding County
Average Family Size in Paulding County is 3.4 People.
What is the Average Household Size in Paulding County
Average Household Size in Paulding County is 3.0 People.
What is Per Capita Income in Paulding County?
Per Capita income in Paulding County is $35,242.
What is the Median Family Income in Paulding County?
Median Family Income in Paulding County is $98,072.
What is the Median Household income in Paulding County?
Median Household Income in Paulding County is $89,237.
What is Income or Wage Gap in Paulding County?
Income or Wage Gap in Paulding County is 26.5%.
Women in Paulding County earn 73.5 cents for every dollar earned by a man.
What is Family Income Deficit in Paulding County?
Family Income Deficit in Paulding County is $11,288.
Families that are below poverty line in Paulding County earn $11,288 less on average than the poverty threshold level.
What is Inequality or Gini Index in Paulding County?
Inequality or Gini Index in Paulding County is 0.35.
How Large is the Labor Force in Paulding County?
There are 88,026 People in the Labor Forcein in Paulding County.
What is the Percentage of People in the Labor Force in Paulding County?
66.7% of People are in the Labor Force in Paulding County.
What is the Unemployment Rate in Paulding County?
Unemployment Rate in Paulding County is 4.1%.