Columbia County, GA
Columbia County Map
Columbia County Overview
156,921
TOTAL POPULATION
76,942
MALE POPULATION
79,979
FEMALE POPULATION
96.20
MALES / 100 FEMALES
103.95
FEMALES / 100 MALES
37.4
MEDIAN AGE
3.7
AVG FAMILY SIZE
3.1
AVG HOUSEHOLD SIZE
$40,677
PER CAPITA INCOME
$106,774
AVG FAMILY INCOME
$92,571
AVG HOUSEHOLD INCOME
36.8%
WAGE / INCOME GAP [ % ]
63.2¢/ $1
WAGE / INCOME GAP [ $ ]
$12,524
FAMILY INCOME DEFICIT
0.41
INEQUALITY / GINI INDEX
79,970
LABOR FORCE [ PEOPLE ]
65.3%
PERCENT IN LABOR FORCE
5.1%
UNEMPLOYMENT RATE
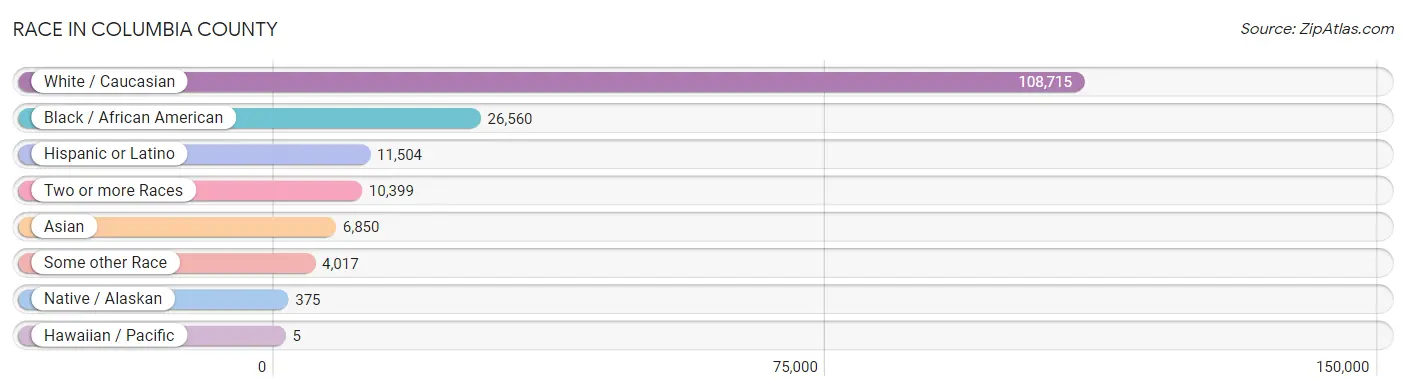
Race in Columbia County
The most populous races in Columbia County are White / Caucasian (108,715 | 69.3%), Black / African American (26,560 | 16.9%), and Hispanic or Latino (11,504 | 7.3%).
| Race | # Population | % Population |
| Asian | 6,850 | 4.4% |
| Black / African American | 26,560 | 16.9% |
| Hawaiian / Pacific | 5 | 0.0% |
| Hispanic or Latino | 11,504 | 7.3% |
| Native / Alaskan | 375 | 0.2% |
| White / Caucasian | 108,715 | 69.3% |
| Two or more Races | 10,399 | 6.6% |
| Some other Race | 4,017 | 2.6% |
| Total | 156,921 | 100.0% |
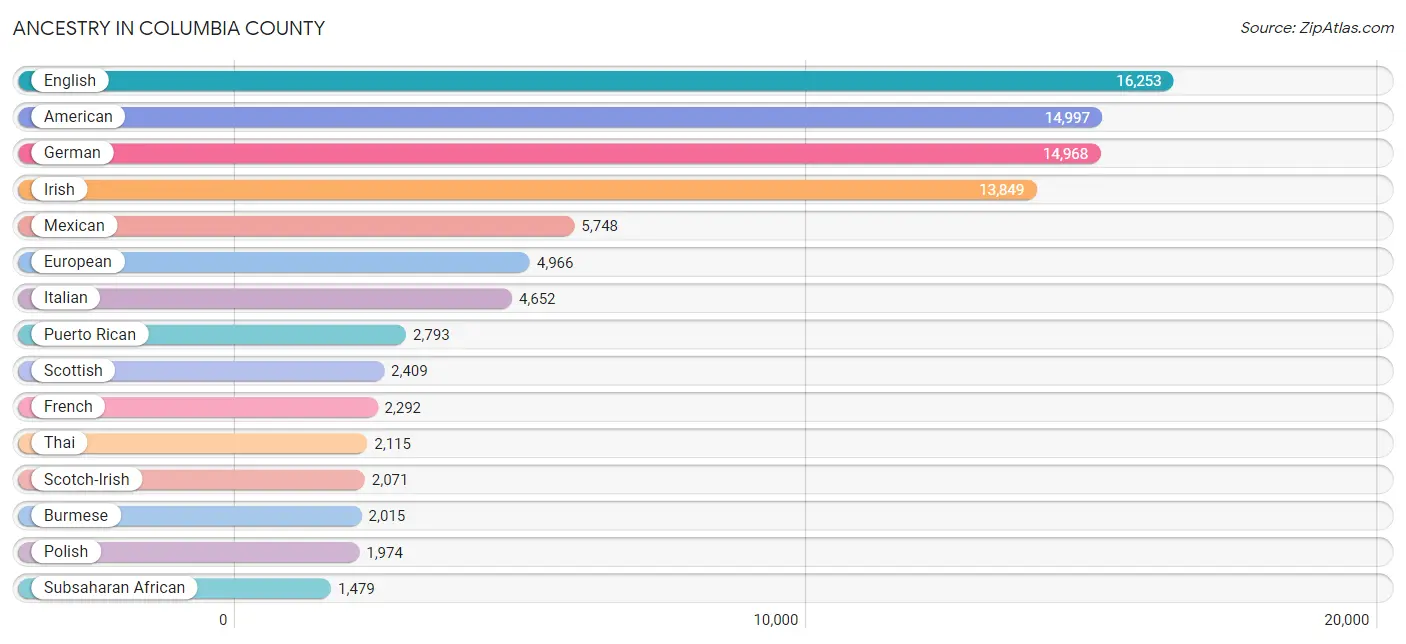
Ancestry in Columbia County
The most populous ancestries reported in Columbia County are English (16,253 | 10.4%), American (14,997 | 9.6%), German (14,968 | 9.5%), Irish (13,849 | 8.8%), and Mexican (5,748 | 3.7%), together accounting for 41.9% of all Columbia County residents.
| Ancestry | # Population | % Population |
| Afghan | 229 | 0.2% |
| African | 889 | 0.6% |
| Alaska Native | 12 | 0.0% |
| Albanian | 16 | 0.0% |
| American | 14,997 | 9.6% |
| Apache | 40 | 0.0% |
| Arab | 861 | 0.5% |
| Argentinean | 191 | 0.1% |
| Armenian | 47 | 0.0% |
| Austrian | 183 | 0.1% |
| Bahamian | 42 | 0.0% |
| Barbadian | 15 | 0.0% |
| Belgian | 70 | 0.0% |
| Belizean | 16 | 0.0% |
| Bhutanese | 789 | 0.5% |
| Brazilian | 19 | 0.0% |
| British | 1,314 | 0.8% |
| British West Indian | 30 | 0.0% |
| Burmese | 2,015 | 1.3% |
| Cajun | 14 | 0.0% |
| Canadian | 525 | 0.3% |
| Celtic | 13 | 0.0% |
| Central American | 909 | 0.6% |
| Central American Indian | 281 | 0.2% |
| Cherokee | 598 | 0.4% |
| Chinese | 18 | 0.0% |
| Chippewa | 90 | 0.1% |
| Choctaw | 63 | 0.0% |
| Colombian | 381 | 0.2% |
| Costa Rican | 92 | 0.1% |
| Creek | 87 | 0.1% |
| Croatian | 69 | 0.0% |
| Cuban | 331 | 0.2% |
| Czech | 382 | 0.2% |
| Czechoslovakian | 47 | 0.0% |
| Danish | 301 | 0.2% |
| Dominican | 499 | 0.3% |
| Dutch | 1,235 | 0.8% |
| Eastern European | 104 | 0.1% |
| Ecuadorian | 105 | 0.1% |
| Egyptian | 388 | 0.3% |
| English | 16,253 | 10.4% |
| European | 4,966 | 3.2% |
| Filipino | 64 | 0.0% |
| Finnish | 55 | 0.0% |
| French | 2,292 | 1.5% |
| French Canadian | 170 | 0.1% |
| German | 14,968 | 9.5% |
| Ghanaian | 56 | 0.0% |
| Greek | 248 | 0.2% |
| Guamanian / Chamorro | 58 | 0.0% |
| Guatemalan | 47 | 0.0% |
| Guyanese | 99 | 0.1% |
| Haitian | 413 | 0.3% |
| Honduran | 241 | 0.2% |
| Hungarian | 391 | 0.3% |
| Indian (Asian) | 827 | 0.5% |
| Iranian | 106 | 0.1% |
| Iraqi | 21 | 0.0% |
| Irish | 13,849 | 8.8% |
| Israeli | 39 | 0.0% |
| Italian | 4,652 | 3.0% |
| Jamaican | 199 | 0.1% |
| Japanese | 47 | 0.0% |
| Kenyan | 127 | 0.1% |
| Korean | 1,461 | 0.9% |
| Lebanese | 123 | 0.1% |
| Liberian | 26 | 0.0% |
| Lithuanian | 45 | 0.0% |
| Macedonian | 7 | 0.0% |
| Mexican | 5,748 | 3.7% |
| Mexican American Indian | 48 | 0.0% |
| Moroccan | 249 | 0.2% |
| Native Hawaiian | 226 | 0.1% |
| Navajo | 82 | 0.1% |
| Nicaraguan | 103 | 0.1% |
| Nigerian | 22 | 0.0% |
| Northern European | 72 | 0.1% |
| Norwegian | 839 | 0.5% |
| Pakistani | 99 | 0.1% |
| Palestinian | 47 | 0.0% |
| Panamanian | 283 | 0.2% |
| Pennsylvania German | 19 | 0.0% |
| Peruvian | 29 | 0.0% |
| Polish | 1,974 | 1.3% |
| Portuguese | 386 | 0.3% |
| Puerto Rican | 2,793 | 1.8% |
| Romanian | 340 | 0.2% |
| Russian | 422 | 0.3% |
| Salvadoran | 143 | 0.1% |
| Samoan | 117 | 0.1% |
| Scandinavian | 315 | 0.2% |
| Scotch-Irish | 2,071 | 1.3% |
| Scottish | 2,409 | 1.5% |
| Serbian | 10 | 0.0% |
| Sioux | 43 | 0.0% |
| Slavic | 64 | 0.0% |
| Slovak | 116 | 0.1% |
| Slovene | 53 | 0.0% |
| South African | 23 | 0.0% |
| South American | 815 | 0.5% |
| South American Indian | 26 | 0.0% |
| Spaniard | 121 | 0.1% |
| Spanish | 161 | 0.1% |
| Sri Lankan | 1,440 | 0.9% |
| Subsaharan African | 1,479 | 0.9% |
| Sudanese | 281 | 0.2% |
| Swedish | 477 | 0.3% |
| Swiss | 409 | 0.3% |
| Syrian | 20 | 0.0% |
| Thai | 2,115 | 1.3% |
| Trinidadian and Tobagonian | 142 | 0.1% |
| Turkish | 9 | 0.0% |
| Ugandan | 37 | 0.0% |
| Ukrainian | 287 | 0.2% |
| Venezuelan | 88 | 0.1% |
| Vietnamese | 92 | 0.1% |
| Welsh | 1,328 | 0.9% |
| West Indian | 14 | 0.0% |
| Yaqui | 20 | 0.0% |
| Yugoslavian | 7 | 0.0% | View All 121 Rows |
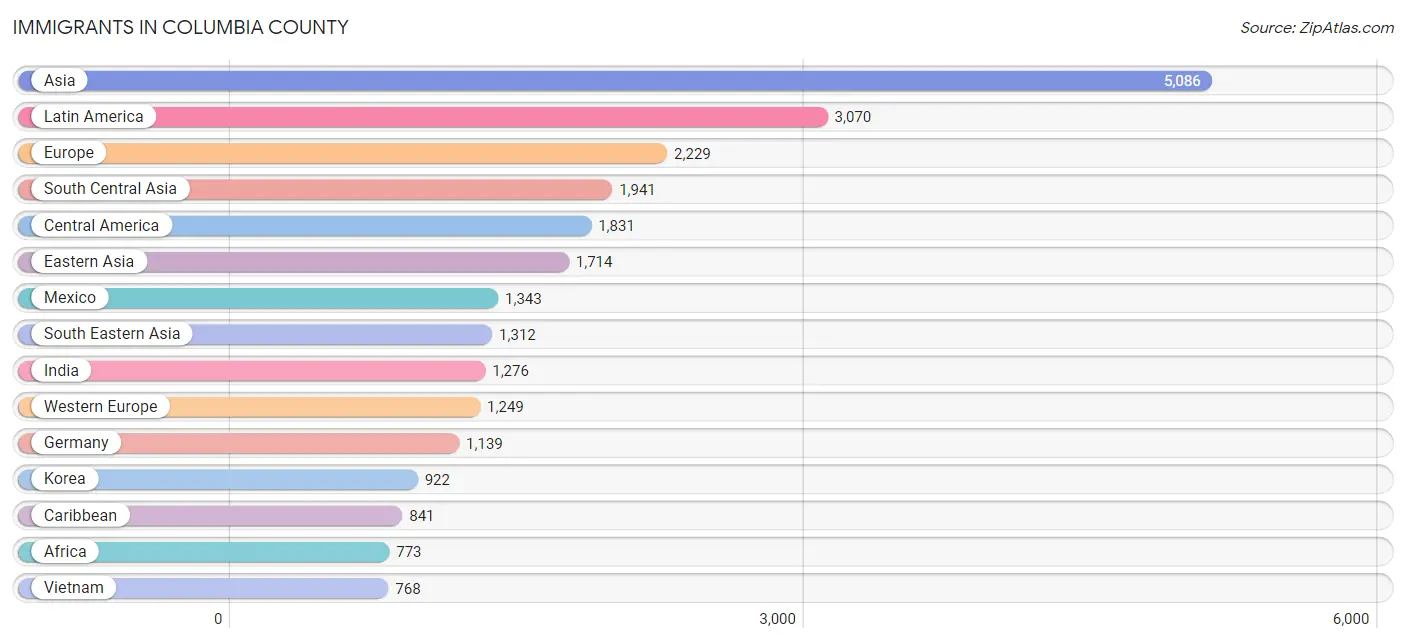
Immigrants in Columbia County
The most numerous immigrant groups reported in Columbia County came from Asia (5,086 | 3.2%), Latin America (3,070 | 2.0%), Europe (2,229 | 1.4%), South Central Asia (1,941 | 1.2%), and Central America (1,831 | 1.2%), together accounting for 9.0% of all Columbia County residents.
| Immigration Origin | # Population | % Population |
| Afghanistan | 130 | 0.1% |
| Africa | 773 | 0.5% |
| Argentina | 20 | 0.0% |
| Asia | 5,086 | 3.2% |
| Australia | 15 | 0.0% |
| Austria | 31 | 0.0% |
| Bangladesh | 148 | 0.1% |
| Barbados | 15 | 0.0% |
| Bosnia and Herzegovina | 10 | 0.0% |
| Brazil | 9 | 0.0% |
| Cambodia | 22 | 0.0% |
| Cameroon | 41 | 0.0% |
| Canada | 266 | 0.2% |
| Caribbean | 841 | 0.5% |
| Central America | 1,831 | 1.2% |
| China | 571 | 0.4% |
| Colombia | 161 | 0.1% |
| Costa Rica | 62 | 0.0% |
| Cuba | 170 | 0.1% |
| Eastern Africa | 107 | 0.1% |
| Eastern Asia | 1,714 | 1.1% |
| Eastern Europe | 604 | 0.4% |
| Ecuador | 81 | 0.1% |
| Egypt | 239 | 0.2% |
| El Salvador | 21 | 0.0% |
| England | 284 | 0.2% |
| Europe | 2,229 | 1.4% |
| France | 52 | 0.0% |
| Germany | 1,139 | 0.7% |
| Ghana | 103 | 0.1% |
| Guatemala | 29 | 0.0% |
| Guyana | 30 | 0.0% |
| Haiti | 339 | 0.2% |
| Honduras | 238 | 0.2% |
| Hong Kong | 4 | 0.0% |
| India | 1,276 | 0.8% |
| Iran | 92 | 0.1% |
| Iraq | 48 | 0.0% |
| Israel | 19 | 0.0% |
| Italy | 33 | 0.0% |
| Jamaica | 170 | 0.1% |
| Japan | 221 | 0.1% |
| Jordan | 13 | 0.0% |
| Kenya | 93 | 0.1% |
| Korea | 922 | 0.6% |
| Latin America | 3,070 | 2.0% |
| Mexico | 1,343 | 0.9% |
| Middle Africa | 97 | 0.1% |
| Moldova | 112 | 0.1% |
| Netherlands | 16 | 0.0% |
| Nicaragua | 85 | 0.1% |
| Nigeria | 9 | 0.0% |
| Northern Africa | 422 | 0.3% |
| Northern Europe | 343 | 0.2% |
| Norway | 25 | 0.0% |
| Oceania | 15 | 0.0% |
| Pakistan | 261 | 0.2% |
| Panama | 53 | 0.0% |
| Peru | 25 | 0.0% |
| Philippines | 500 | 0.3% |
| Poland | 103 | 0.1% |
| Romania | 71 | 0.1% |
| Russia | 145 | 0.1% |
| Saudi Arabia | 9 | 0.0% |
| Scotland | 27 | 0.0% |
| South Africa | 35 | 0.0% |
| South America | 398 | 0.3% |
| South Central Asia | 1,941 | 1.2% |
| South Eastern Asia | 1,312 | 0.8% |
| Southern Europe | 33 | 0.0% |
| Sri Lanka | 34 | 0.0% |
| Sudan | 136 | 0.1% |
| Sweden | 7 | 0.0% |
| Switzerland | 11 | 0.0% |
| Syria | 11 | 0.0% |
| Taiwan | 169 | 0.1% |
| Thailand | 22 | 0.0% |
| Trinidad and Tobago | 54 | 0.0% |
| Uganda | 14 | 0.0% |
| Ukraine | 130 | 0.1% |
| Uruguay | 20 | 0.0% |
| Venezuela | 31 | 0.0% |
| Vietnam | 768 | 0.5% |
| West Indies | 29 | 0.0% |
| Western Africa | 112 | 0.1% |
| Western Asia | 100 | 0.1% |
| Western Europe | 1,249 | 0.8% |
| Zaire | 56 | 0.0% | View All 88 Rows |
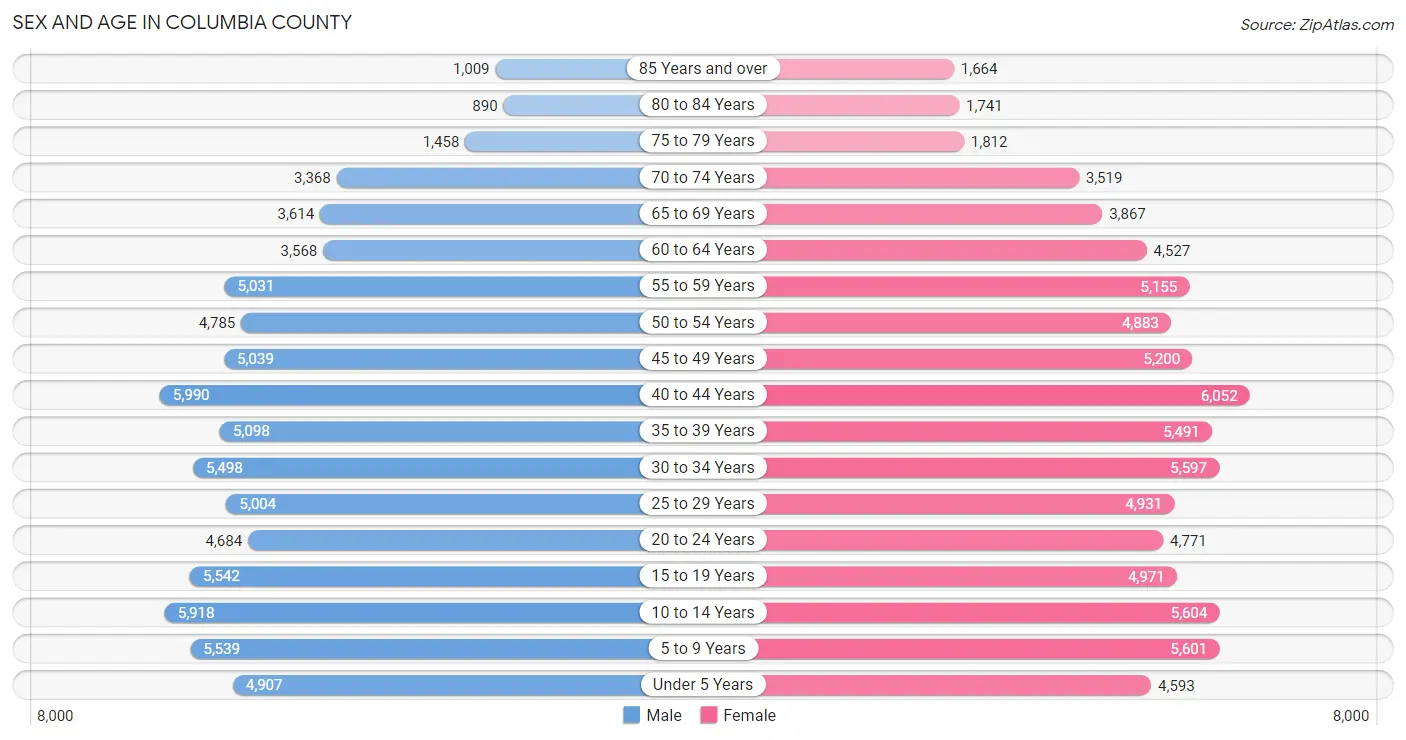
Sex and Age in Columbia County
Sex and Age in Columbia County
The most populous age groups in Columbia County are 40 to 44 Years (5,990 | 7.8%) for men and 40 to 44 Years (6,052 | 7.6%) for women.
| Age Bracket | Male | Female |
| Under 5 Years | 4,907 (6.4%) | 4,593 (5.7%) |
| 5 to 9 Years | 5,539 (7.2%) | 5,601 (7.0%) |
| 10 to 14 Years | 5,918 (7.7%) | 5,604 (7.0%) |
| 15 to 19 Years | 5,542 (7.2%) | 4,971 (6.2%) |
| 20 to 24 Years | 4,684 (6.1%) | 4,771 (6.0%) |
| 25 to 29 Years | 5,004 (6.5%) | 4,931 (6.2%) |
| 30 to 34 Years | 5,498 (7.1%) | 5,597 (7.0%) |
| 35 to 39 Years | 5,098 (6.6%) | 5,491 (6.9%) |
| 40 to 44 Years | 5,990 (7.8%) | 6,052 (7.6%) |
| 45 to 49 Years | 5,039 (6.6%) | 5,200 (6.5%) |
| 50 to 54 Years | 4,785 (6.2%) | 4,883 (6.1%) |
| 55 to 59 Years | 5,031 (6.5%) | 5,155 (6.5%) |
| 60 to 64 Years | 3,568 (4.6%) | 4,527 (5.7%) |
| 65 to 69 Years | 3,614 (4.7%) | 3,867 (4.8%) |
| 70 to 74 Years | 3,368 (4.4%) | 3,519 (4.4%) |
| 75 to 79 Years | 1,458 (1.9%) | 1,812 (2.3%) |
| 80 to 84 Years | 890 (1.2%) | 1,741 (2.2%) |
| 85 Years and over | 1,009 (1.3%) | 1,664 (2.1%) |
| Total | 76,942 (100.0%) | 79,979 (100.0%) |
Families and Households in Columbia County
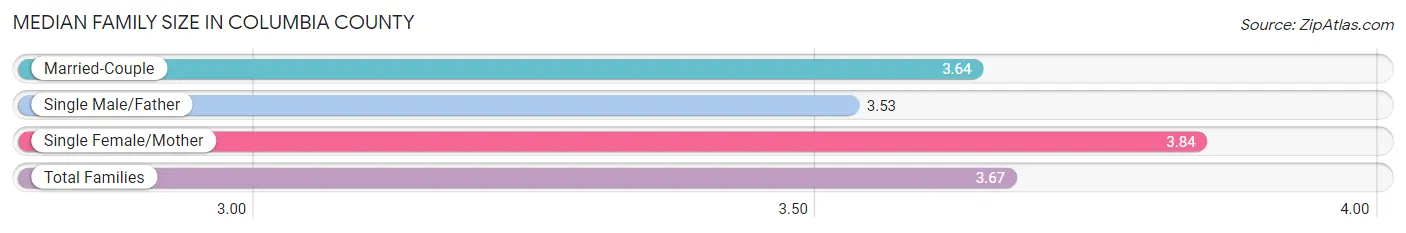
Median Family Size in Columbia County
The median family size in Columbia County is 3.67 persons per family, with single female/mother families (6,168 | 16.5%) accounting for the largest median family size of 3.84 persons per family. On the other hand, single male/father families (1,642 | 4.4%) represent the smallest median family size with 3.53 persons per family.
| Family Type | # Families | Family Size |
| Married-Couple | 29,544 (79.1%) | 3.64 |
| Single Male/Father | 1,642 (4.4%) | 3.53 |
| Single Female/Mother | 6,168 (16.5%) | 3.84 |
| Total Families | 37,354 (100.0%) | 3.67 |
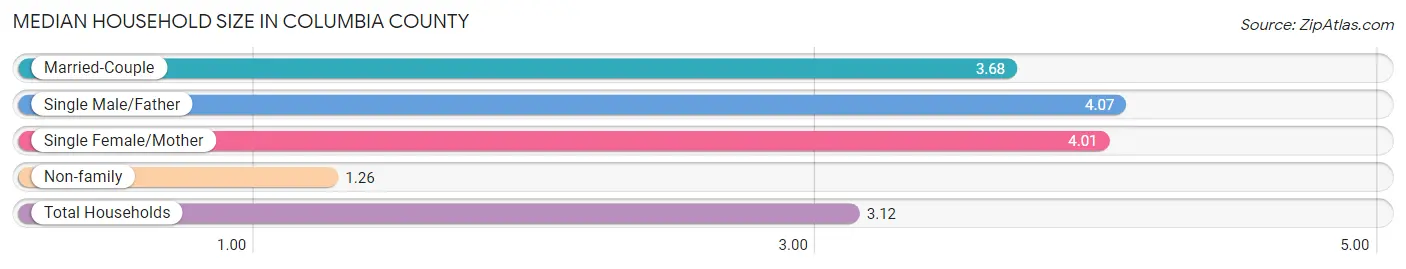
Median Household Size in Columbia County
The median household size in Columbia County is 3.12 persons per household, with single male/father households (1,642 | 3.3%) accounting for the largest median household size of 4.07 persons per household. non-family households (12,702 | 25.4%) represent the smallest median household size with 1.26 persons per household.
| Household Type | # Households | Household Size |
| Married-Couple | 29,544 (59.0%) | 3.68 |
| Single Male/Father | 1,642 (3.3%) | 4.07 |
| Single Female/Mother | 6,168 (12.3%) | 4.01 |
| Non-family | 12,702 (25.4%) | 1.26 |
| Total Households | 50,056 (100.0%) | 3.12 |
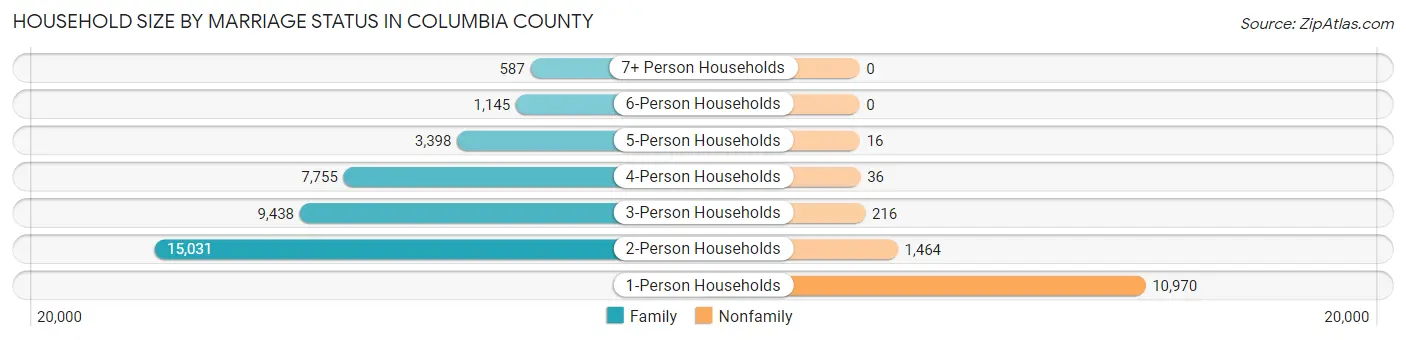
Household Size by Marriage Status in Columbia County
Out of a total of 50,056 households in Columbia County, 37,354 (74.6%) are family households, while 12,702 (25.4%) are nonfamily households. The most numerous type of family households are 2-person households, comprising 15,031, and the most common type of nonfamily households are 1-person households, comprising 10,970.
| Household Size | Family Households | Nonfamily Households |
| 1-Person Households | - | 10,970 (21.9%) |
| 2-Person Households | 15,031 (30.0%) | 1,464 (2.9%) |
| 3-Person Households | 9,438 (18.9%) | 216 (0.4%) |
| 4-Person Households | 7,755 (15.5%) | 36 (0.1%) |
| 5-Person Households | 3,398 (6.8%) | 16 (0.0%) |
| 6-Person Households | 1,145 (2.3%) | 0 (0.0%) |
| 7+ Person Households | 587 (1.2%) | 0 (0.0%) |
| Total | 37,354 (74.6%) | 12,702 (25.4%) |
Female Fertility in Columbia County
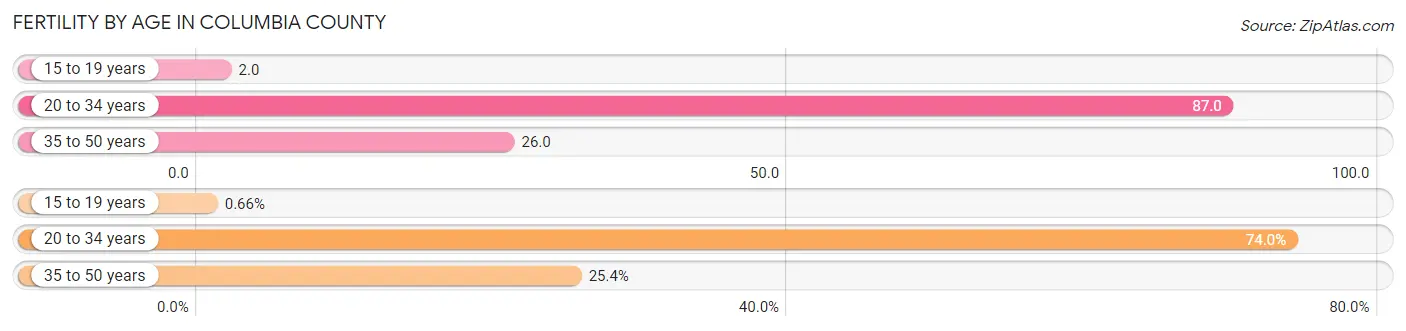
Fertility by Age in Columbia County
Average fertility rate in Columbia County is 47.0 births per 1,000 women. Women in the age bracket of 20 to 34 years have the highest fertility rate with 87.0 births per 1,000 women. Women in the age bracket of 20 to 34 years acount for 74.0% of all women with births.
| Age Bracket | Women with Births | Births / 1,000 Women |
| 15 to 19 years | 12 (0.7%) | 2.0 |
| 20 to 34 years | 1,336 (74.0%) | 87.0 |
| 35 to 50 years | 458 (25.4%) | 26.0 |
| Total | 1,806 (100.0%) | 47.0 |
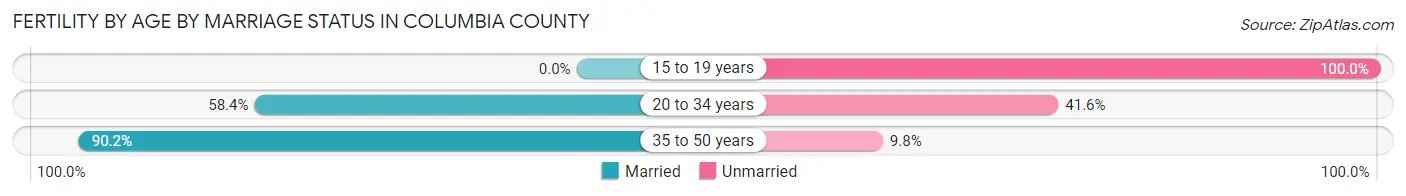
Fertility by Age by Marriage Status in Columbia County
66.1% of women with births (1,806) in Columbia County are married. The highest percentage of unmarried women with births falls into 15 to 19 years age bracket with 100.0% of them unmarried at the time of birth, while the lowest percentage of unmarried women with births belong to 35 to 50 years age bracket with 9.8% of them unmarried.
| Age Bracket | Married | Unmarried |
| 15 to 19 years | 0 (0.0%) | 12 (100.0%) |
| 20 to 34 years | 780 (58.4%) | 556 (41.6%) |
| 35 to 50 years | 413 (90.2%) | 45 (9.8%) |
| Total | 1,194 (66.1%) | 612 (33.9%) |
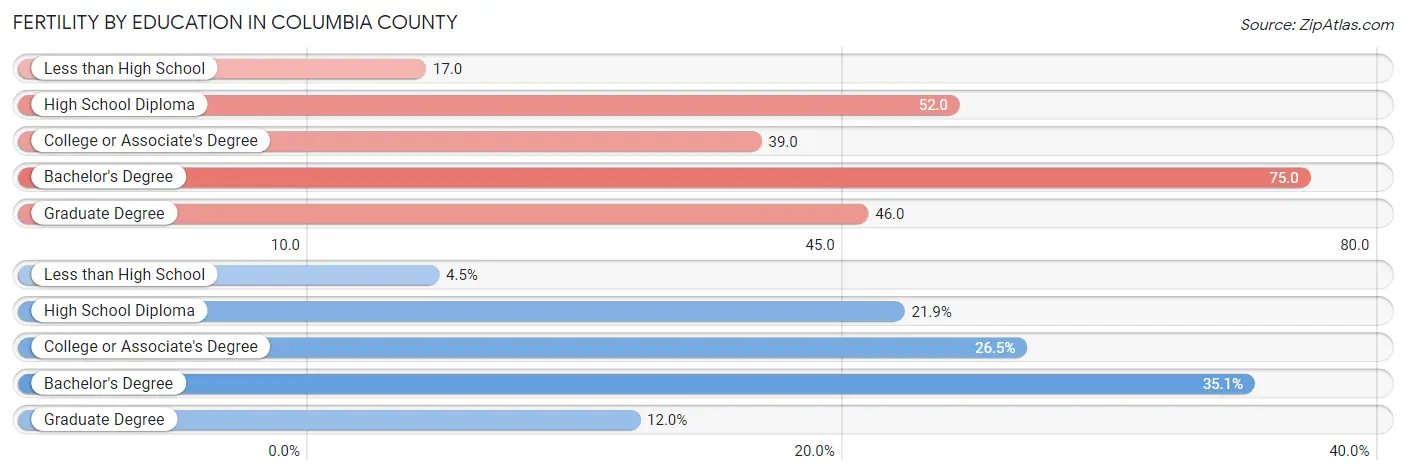
Fertility by Education in Columbia County
Average fertility rate in Columbia County is 47.0 births per 1,000 women. Women with the education attainment of bachelor's degree have the highest fertility rate of 75.0 births per 1,000 women, while women with the education attainment of less than high school have the lowest fertility at 17.0 births per 1,000 women. Women with the education attainment of bachelor's degree represent 35.0% of all women with births.
| Educational Attainment | Women with Births | Births / 1,000 Women |
| Less than High School | 81 (4.5%) | 17.0 |
| High School Diploma | 396 (21.9%) | 52.0 |
| College or Associate's Degree | 479 (26.5%) | 39.0 |
| Bachelor's Degree | 633 (35.0%) | 75.0 |
| Graduate Degree | 217 (12.0%) | 46.0 |
| Total | 1,806 (100.0%) | 47.0 |
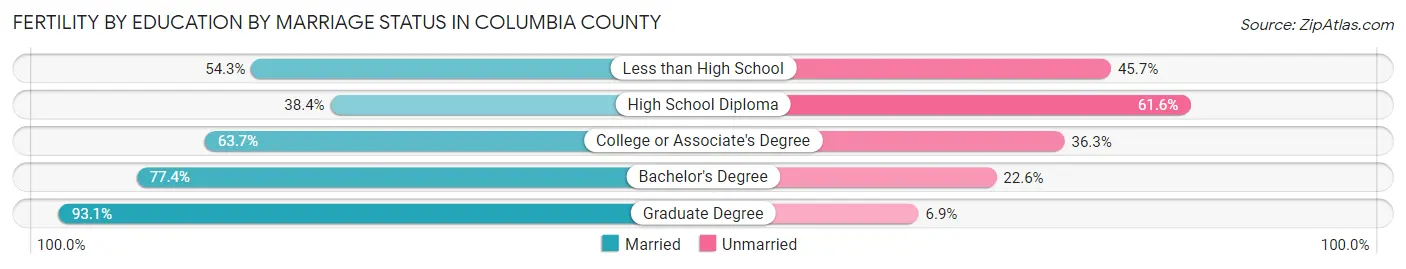
Fertility by Education by Marriage Status in Columbia County
33.9% of women with births in Columbia County are unmarried. Women with the educational attainment of graduate degree are most likely to be married with 93.1% of them married at childbirth, while women with the educational attainment of high school diploma are least likely to be married with 61.6% of them unmarried at childbirth.
| Educational Attainment | Married | Unmarried |
| Less than High School | 44 (54.3%) | 37 (45.7%) |
| High School Diploma | 152 (38.4%) | 244 (61.6%) |
| College or Associate's Degree | 305 (63.7%) | 174 (36.3%) |
| Bachelor's Degree | 490 (77.4%) | 143 (22.6%) |
| Graduate Degree | 202 (93.1%) | 15 (6.9%) |
| Total | 1,194 (66.1%) | 612 (33.9%) |
Income in Columbia County
Income Overview in Columbia County
Per Capita Income in Columbia County is $40,677, while median incomes of families and households are $106,774 and $92,571 respectively.
| Characteristic | Number | Measure |
| Per Capita Income | 156,921 | $40,677 |
| Median Family Income | 37,354 | $106,774 |
| Mean Family Income | 37,354 | $127,751 |
| Median Household Income | 50,056 | $92,571 |
| Mean Household Income | 50,056 | $114,331 |
| Income Deficit | 37,354 | $12,524 |
| Wage / Income Gap (%) | 156,921 | 36.76% |
| Wage / Income Gap ($) | 156,921 | 63.24¢ per $1 |
| Gini / Inequality Index | 156,921 | 0.41 |
Earnings by Sex in Columbia County
Average Earnings in Columbia County are $47,223, $57,347 for men and $36,265 for women, a difference of 36.8%.
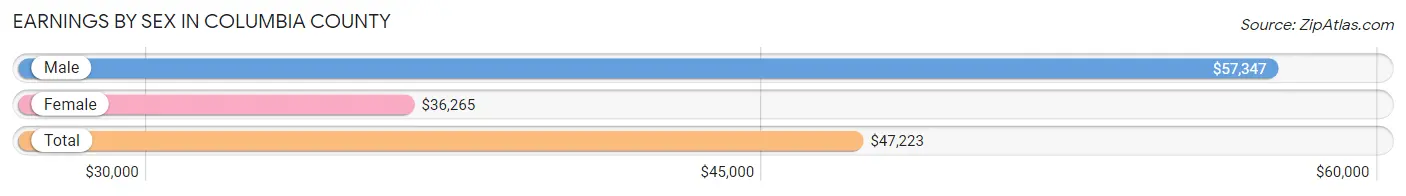
| Sex | Number | Average Earnings |
| Male | 43,462 (52.8%) | $57,347 |
| Female | 38,915 (47.2%) | $36,265 |
| Total | 82,377 (100.0%) | $47,223 |
Earnings by Sex by Income Bracket in Columbia County
The most common earnings brackets in Columbia County are $100,000+ for men (10,590 | 24.4%) and $75,000 to $99,999 for women (4,252 | 10.9%).
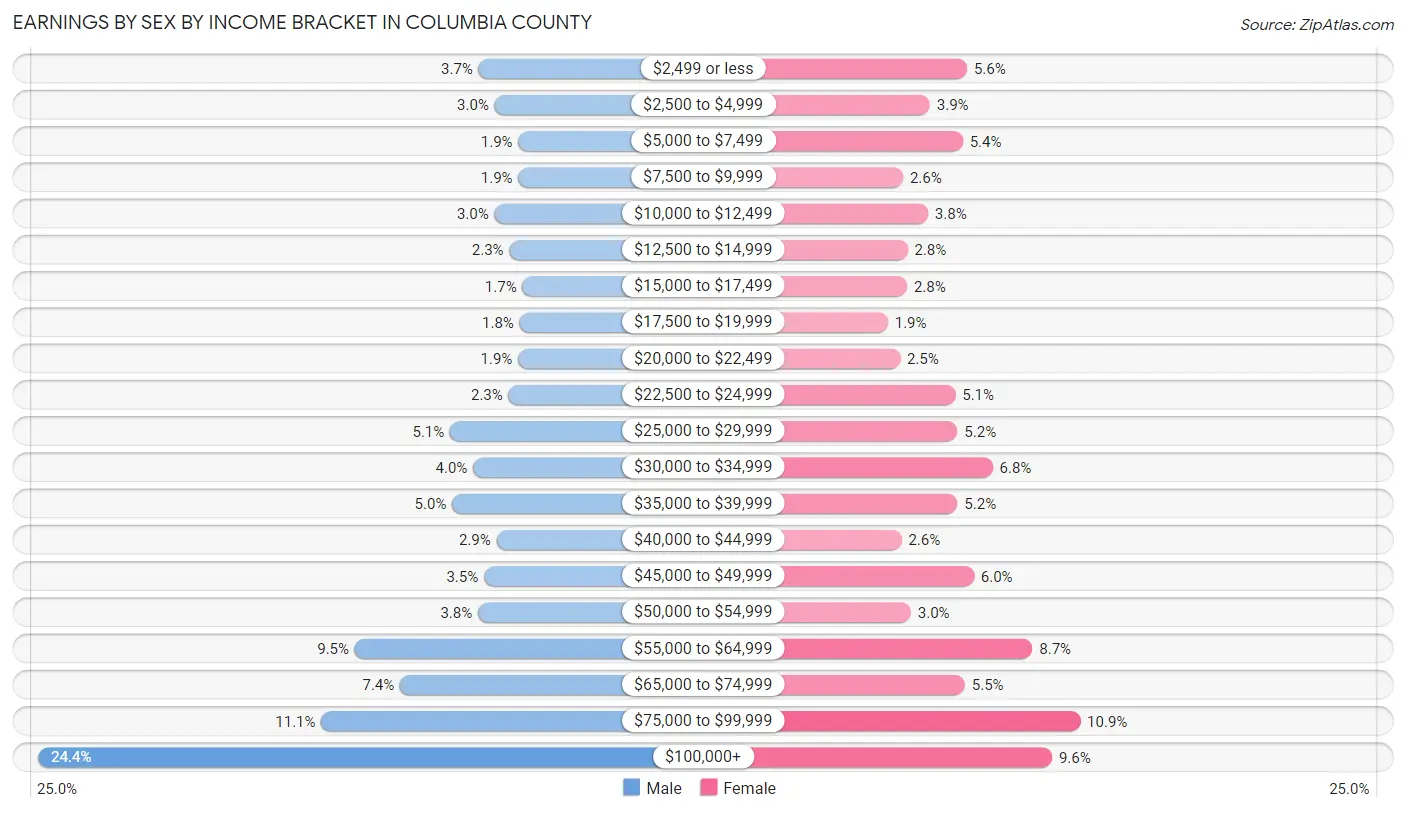
| Income | Male | Female |
| $2,499 or less | 1,623 (3.7%) | 2,192 (5.6%) |
| $2,500 to $4,999 | 1,297 (3.0%) | 1,515 (3.9%) |
| $5,000 to $7,499 | 814 (1.9%) | 2,112 (5.4%) |
| $7,500 to $9,999 | 812 (1.9%) | 1,025 (2.6%) |
| $10,000 to $12,499 | 1,300 (3.0%) | 1,480 (3.8%) |
| $12,500 to $14,999 | 997 (2.3%) | 1,104 (2.8%) |
| $15,000 to $17,499 | 731 (1.7%) | 1,098 (2.8%) |
| $17,500 to $19,999 | 788 (1.8%) | 749 (1.9%) |
| $20,000 to $22,499 | 817 (1.9%) | 969 (2.5%) |
| $22,500 to $24,999 | 1,013 (2.3%) | 1,975 (5.1%) |
| $25,000 to $29,999 | 2,203 (5.1%) | 2,015 (5.2%) |
| $30,000 to $34,999 | 1,734 (4.0%) | 2,659 (6.8%) |
| $35,000 to $39,999 | 2,160 (5.0%) | 2,015 (5.2%) |
| $40,000 to $44,999 | 1,254 (2.9%) | 998 (2.6%) |
| $45,000 to $49,999 | 1,513 (3.5%) | 2,315 (5.9%) |
| $50,000 to $54,999 | 1,633 (3.8%) | 1,166 (3.0%) |
| $55,000 to $64,999 | 4,140 (9.5%) | 3,382 (8.7%) |
| $65,000 to $74,999 | 3,219 (7.4%) | 2,153 (5.5%) |
| $75,000 to $99,999 | 4,824 (11.1%) | 4,252 (10.9%) |
| $100,000+ | 10,590 (24.4%) | 3,741 (9.6%) |
| Total | 43,462 (100.0%) | 38,915 (100.0%) |
Earnings by Sex by Educational Attainment in Columbia County
Average earnings in Columbia County are $63,067 for men and $45,398 for women, a difference of 28.0%. Men with an educational attainment of graduate degree enjoy the highest average annual earnings of $104,534, while those with less than high school education earn the least with $33,167. Women with an educational attainment of graduate degree earn the most with the average annual earnings of $70,909, while those with college or associate's degree education have the smallest earnings of $31,840.
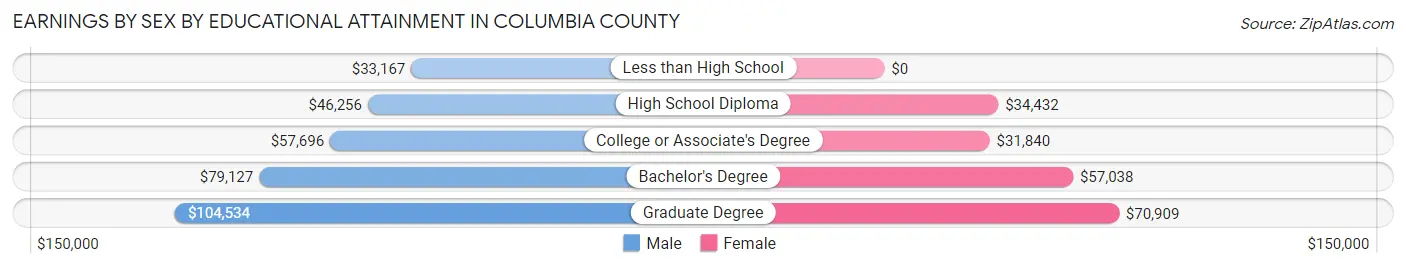
| Educational Attainment | Male Income | Female Income |
| Less than High School | $33,167 | $0 |
| High School Diploma | $46,256 | $34,432 |
| College or Associate's Degree | $57,696 | $31,840 |
| Bachelor's Degree | $79,127 | $57,038 |
| Graduate Degree | $104,534 | $70,909 |
| Total | $63,067 | $45,398 |
Family Income in Columbia County
Family Income Brackets in Columbia County
According to the Columbia County family income data, there are 9,002 families falling into the $100,000 to $149,999 income range, which is the most common income bracket and makes up 24.1% of all families. Conversely, the $10,000 to $14,999 income bracket is the least frequent group with only 374 families (1.0%) belonging to this category.
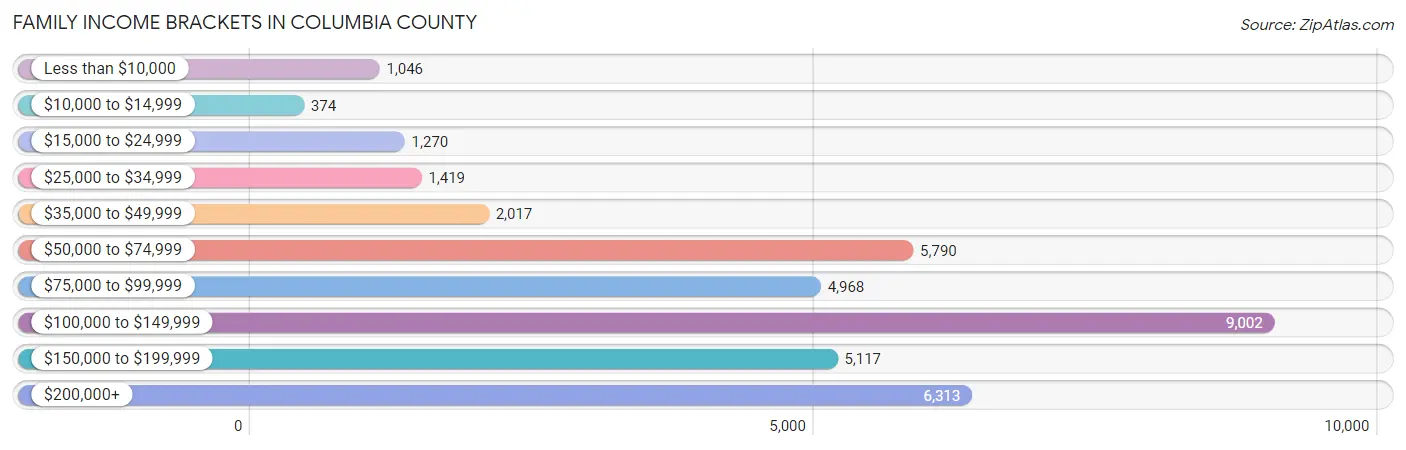
| Income Bracket | # Families | % Families |
| Less than $10,000 | 1,046 | 2.8% |
| $10,000 to $14,999 | 374 | 1.0% |
| $15,000 to $24,999 | 1,270 | 3.4% |
| $25,000 to $34,999 | 1,419 | 3.8% |
| $35,000 to $49,999 | 2,017 | 5.4% |
| $50,000 to $74,999 | 5,790 | 15.5% |
| $75,000 to $99,999 | 4,968 | 13.3% |
| $100,000 to $149,999 | 9,002 | 24.1% |
| $150,000 to $199,999 | 5,117 | 13.7% |
| $200,000+ | 6,313 | 16.9% |
Family Income by Famaliy Size in Columbia County
4-person families (7,757 | 20.8%) account for the highest median family income in Columbia County with $129,706 per family, while 2-person families (15,830 | 42.4%) have the highest median income of $48,451 per family member.
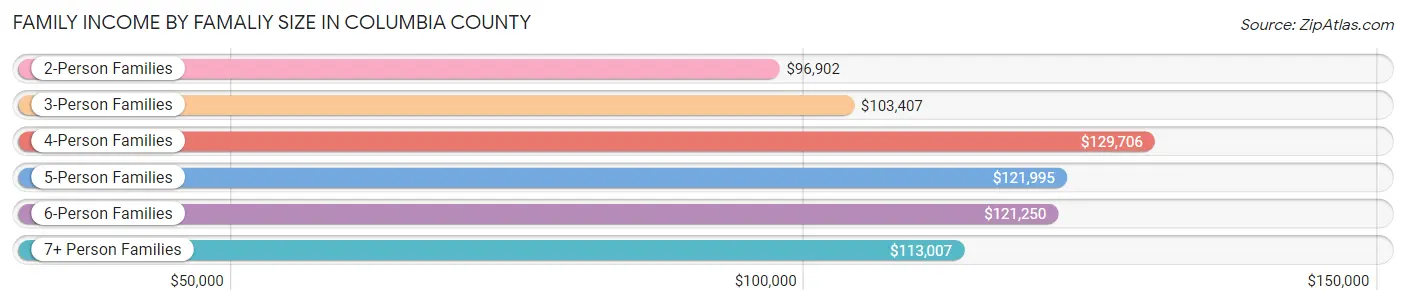
| Income Bracket | # Families | Median Income |
| 2-Person Families | 15,830 (42.4%) | $96,902 |
| 3-Person Families | 9,041 (24.2%) | $103,407 |
| 4-Person Families | 7,757 (20.8%) | $129,706 |
| 5-Person Families | 3,057 (8.2%) | $121,995 |
| 6-Person Families | 1,156 (3.1%) | $121,250 |
| 7+ Person Families | 513 (1.4%) | $113,007 |
| Total | 37,354 (100.0%) | $106,774 |
Family Income by Number of Earners in Columbia County
The median family income in Columbia County is $106,774, with families comprising 3+ earners (4,462) having the highest median family income of $177,877, while families with no earners (5,359) have the lowest median family income of $58,304, accounting for 11.9% and 14.3% of families, respectively.
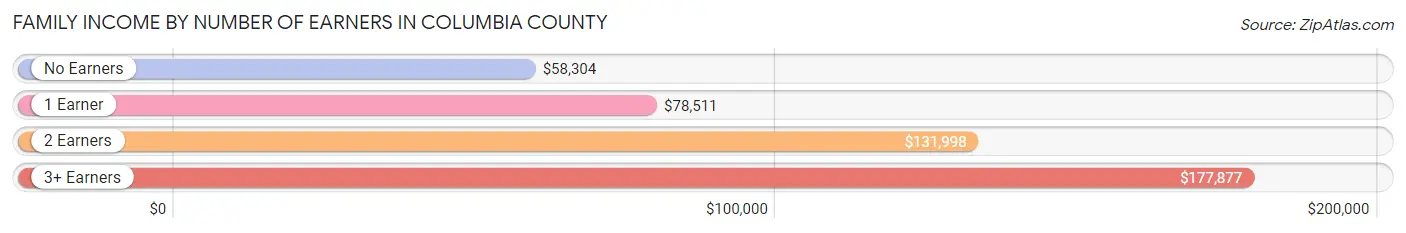
| Number of Earners | # Families | Median Income |
| No Earners | 5,359 (14.3%) | $58,304 |
| 1 Earner | 11,956 (32.0%) | $78,511 |
| 2 Earners | 15,577 (41.7%) | $131,998 |
| 3+ Earners | 4,462 (11.9%) | $177,877 |
| Total | 37,354 (100.0%) | $106,774 |
Household Income in Columbia County
Household Income Brackets in Columbia County
With 10,362 households falling in the category, the $100,000 to $149,999 income range is the most frequent in Columbia County, accounting for 20.7% of all households. In contrast, only 901 households (1.8%) fall into the $10,000 to $14,999 income bracket, making it the least populous group.
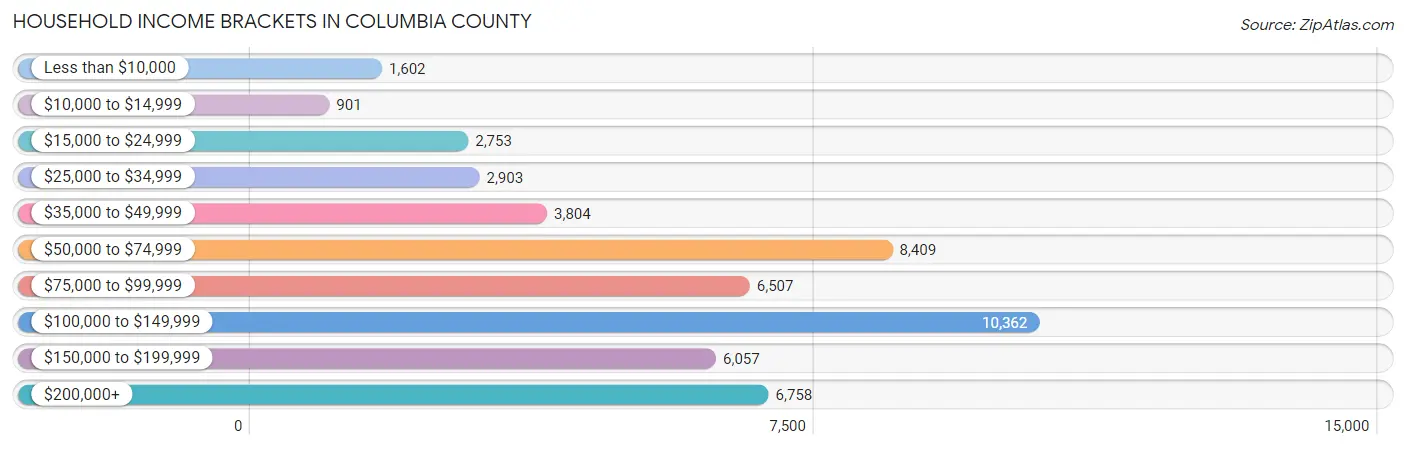
| Income Bracket | # Households | % Households |
| Less than $10,000 | 1,602 | 3.2% |
| $10,000 to $14,999 | 901 | 1.8% |
| $15,000 to $24,999 | 2,753 | 5.5% |
| $25,000 to $34,999 | 2,903 | 5.8% |
| $35,000 to $49,999 | 3,804 | 7.6% |
| $50,000 to $74,999 | 8,409 | 16.8% |
| $75,000 to $99,999 | 6,507 | 13.0% |
| $100,000 to $149,999 | 10,362 | 20.7% |
| $150,000 to $199,999 | 6,057 | 12.1% |
| $200,000+ | 6,758 | 13.5% |
Household Income by Householder Age in Columbia County
The median household income in Columbia County is $92,571, with the highest median household income of $126,065 found in the 45 to 64 years age bracket for the primary householder. A total of 17,835 households (35.6%) fall into this category. Meanwhile, the 65+ years age bracket for the primary householder has the lowest median household income of $62,203, with 12,996 households (26.0%) in this group.
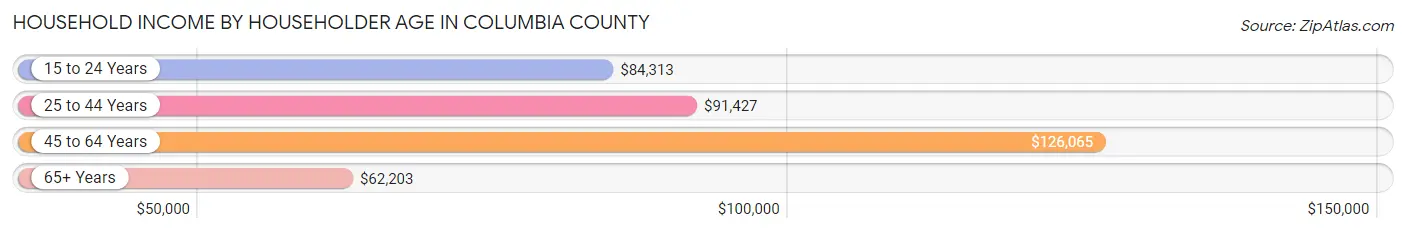
| Income Bracket | # Households | Median Income |
| 15 to 24 Years | 617 (1.2%) | $84,313 |
| 25 to 44 Years | 18,608 (37.2%) | $91,427 |
| 45 to 64 Years | 17,835 (35.6%) | $126,065 |
| 65+ Years | 12,996 (26.0%) | $62,203 |
| Total | 50,056 (100.0%) | $92,571 |
Poverty in Columbia County
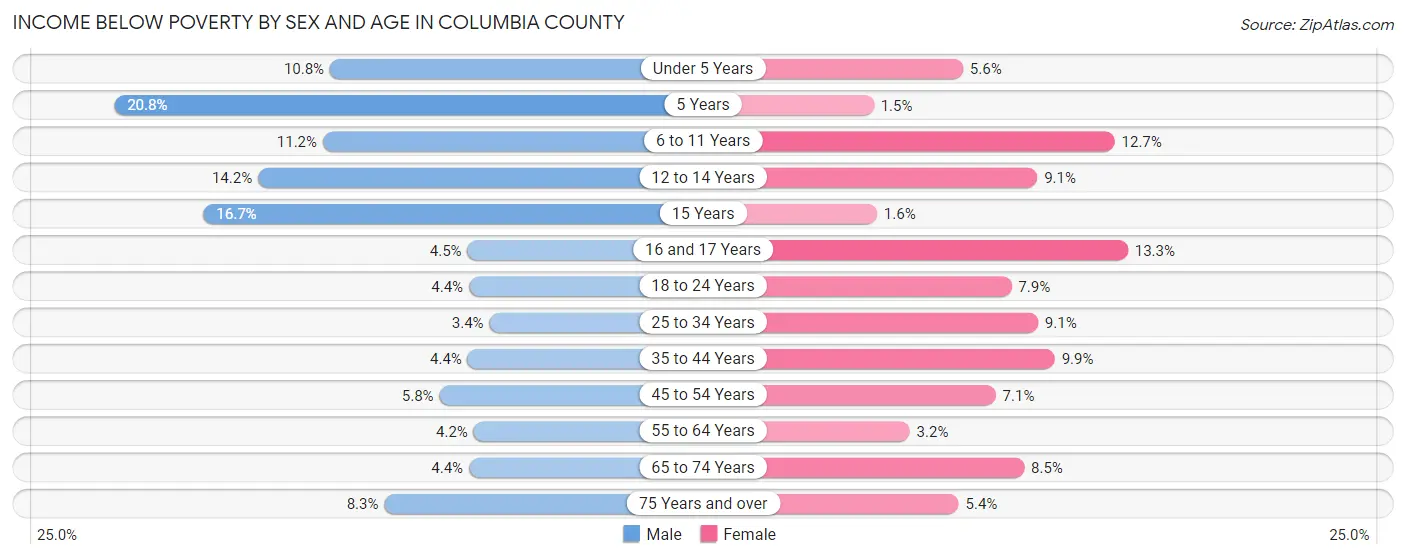
Income Below Poverty by Sex and Age in Columbia County
With 6.5% poverty level for males and 7.9% for females among the residents of Columbia County, 5 year old males and 16 and 17 year old females are the most vulnerable to poverty, with 298 males (20.8%) and 309 females (13.3%) in their respective age groups living below the poverty level.
| Age Bracket | Male | Female |
| Under 5 Years | 526 (10.8%) | 257 (5.6%) |
| 5 Years | 298 (20.8%) | 15 (1.5%) |
| 6 to 11 Years | 715 (11.2%) | 864 (12.7%) |
| 12 to 14 Years | 506 (14.2%) | 294 (9.1%) |
| 15 Years | 178 (16.7%) | 20 (1.6%) |
| 16 and 17 Years | 110 (4.4%) | 309 (13.3%) |
| 18 to 24 Years | 292 (4.4%) | 487 (7.9%) |
| 25 to 34 Years | 359 (3.4%) | 958 (9.1%) |
| 35 to 44 Years | 491 (4.4%) | 1,140 (9.9%) |
| 45 to 54 Years | 564 (5.8%) | 717 (7.1%) |
| 55 to 64 Years | 358 (4.2%) | 305 (3.2%) |
| 65 to 74 Years | 305 (4.4%) | 623 (8.5%) |
| 75 Years and over | 271 (8.3%) | 272 (5.4%) |
| Total | 4,973 (6.5%) | 6,261 (7.9%) |
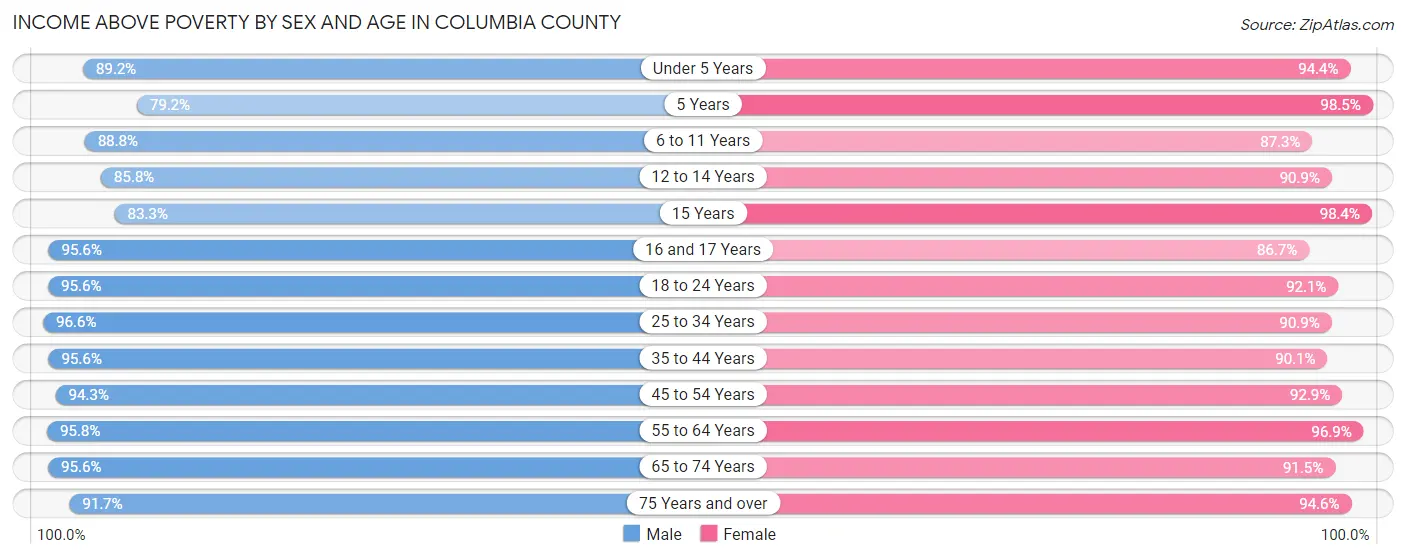
Income Above Poverty by Sex and Age in Columbia County
According to the poverty statistics in Columbia County, males aged 25 to 34 years and females aged 5 years are the age groups that are most secure financially, with 96.6% of males and 98.5% of females in these age groups living above the poverty line.
| Age Bracket | Male | Female |
| Under 5 Years | 4,330 (89.2%) | 4,320 (94.4%) |
| 5 Years | 1,132 (79.2%) | 998 (98.5%) |
| 6 to 11 Years | 5,691 (88.8%) | 5,962 (87.3%) |
| 12 to 14 Years | 3,064 (85.8%) | 2,947 (90.9%) |
| 15 Years | 888 (83.3%) | 1,208 (98.4%) |
| 16 and 17 Years | 2,361 (95.6%) | 2,019 (86.7%) |
| 18 to 24 Years | 6,373 (95.6%) | 5,699 (92.1%) |
| 25 to 34 Years | 10,095 (96.6%) | 9,570 (90.9%) |
| 35 to 44 Years | 10,573 (95.6%) | 10,403 (90.1%) |
| 45 to 54 Years | 9,238 (94.3%) | 9,322 (92.9%) |
| 55 to 64 Years | 8,241 (95.8%) | 9,377 (96.9%) |
| 65 to 74 Years | 6,660 (95.6%) | 6,742 (91.5%) |
| 75 Years and over | 2,992 (91.7%) | 4,742 (94.6%) |
| Total | 71,638 (93.5%) | 73,309 (92.1%) |
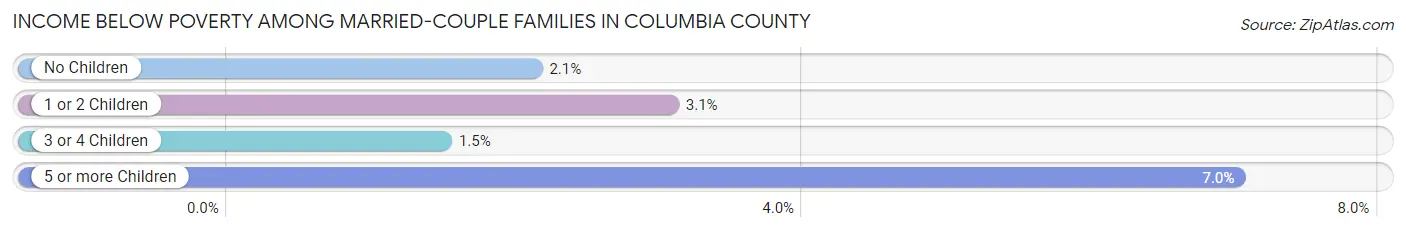
Income Below Poverty Among Married-Couple Families in Columbia County
The poverty statistics for married-couple families in Columbia County show that 2.4% or 722 of the total 29,544 families live below the poverty line. Families with 5 or more children have the highest poverty rate of 7.0%, comprising of 20 families. On the other hand, families with 3 or 4 children have the lowest poverty rate of 1.5%, which includes 41 families.
| Children | Above Poverty | Below Poverty |
| No Children | 15,775 (97.9%) | 342 (2.1%) |
| 1 or 2 Children | 10,066 (96.9%) | 319 (3.1%) |
| 3 or 4 Children | 2,716 (98.5%) | 41 (1.5%) |
| 5 or more Children | 265 (93.0%) | 20 (7.0%) |
| Total | 28,822 (97.6%) | 722 (2.4%) |
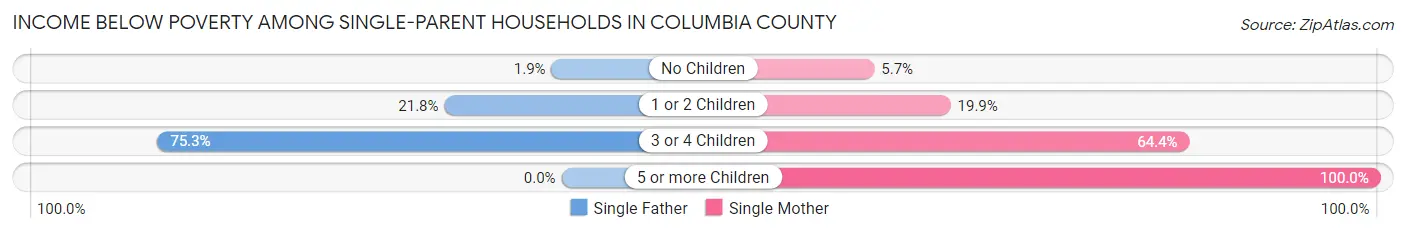
Income Below Poverty Among Single-Parent Households in Columbia County
According to the poverty data in Columbia County, 24.8% or 408 single-father households and 18.2% or 1,123 single-mother households are living below the poverty line. Among single-father households, those with 3 or 4 children have the highest poverty rate, with 207 households (75.3%) experiencing poverty. Likewise, among single-mother households, those with 5 or more children have the highest poverty rate, with 4 households (100.0%) falling below the poverty line.
| Children | Single Father | Single Mother |
| No Children | 9 (1.9%) | 112 (5.7%) |
| 1 or 2 Children | 192 (21.8%) | 761 (19.9%) |
| 3 or 4 Children | 207 (75.3%) | 246 (64.4%) |
| 5 or more Children | 0 (0.0%) | 4 (100.0%) |
| Total | 408 (24.8%) | 1,123 (18.2%) |
Income Below Poverty Among Married-Couple vs Single-Parent Households in Columbia County
The poverty data for Columbia County shows that 722 of the married-couple family households (2.4%) and 1,531 of the single-parent households (19.6%) are living below the poverty level. Within the married-couple family households, those with 5 or more children have the highest poverty rate, with 20 households (7.0%) falling below the poverty line. Among the single-parent households, those with 3 or 4 children have the highest poverty rate, with 453 household (69.0%) living below poverty.
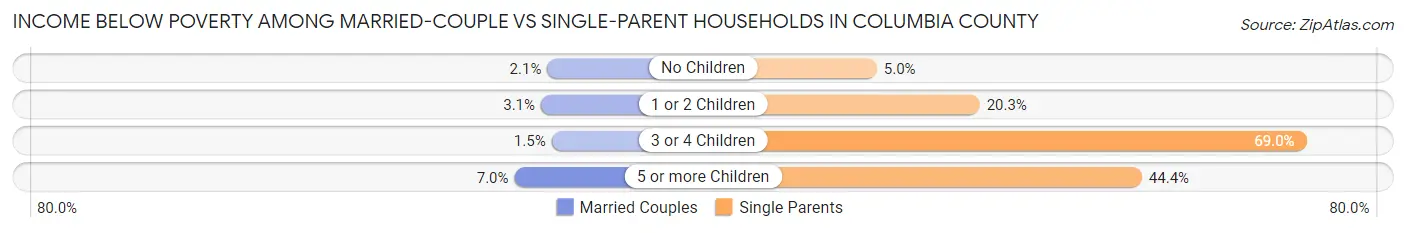
| Children | Married-Couple Families | Single-Parent Households |
| No Children | 342 (2.1%) | 121 (5.0%) |
| 1 or 2 Children | 319 (3.1%) | 953 (20.3%) |
| 3 or 4 Children | 41 (1.5%) | 453 (69.0%) |
| 5 or more Children | 20 (7.0%) | 4 (44.4%) |
| Total | 722 (2.4%) | 1,531 (19.6%) |
Employment Characteristics in Columbia County
Employment by Class of Employer in Columbia County
Among the 75,125 employed individuals in Columbia County, private company employees (46,894 | 62.4%), federal government employees (9,281 | 12.3%), and local government employees (5,721 | 7.6%) make up the most common classes of employment.
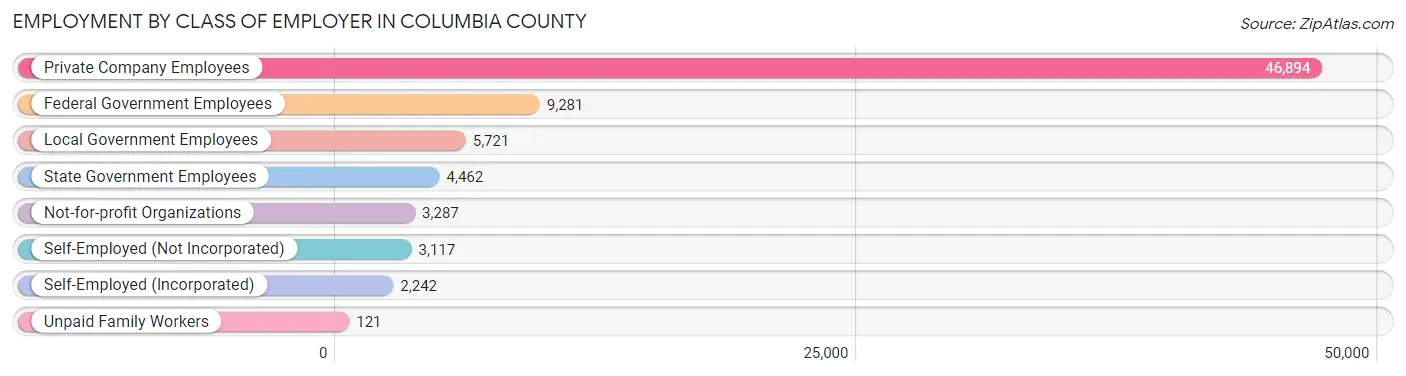
| Employer Class | # Employees | % Employees |
| Private Company Employees | 46,894 | 62.4% |
| Self-Employed (Incorporated) | 2,242 | 3.0% |
| Self-Employed (Not Incorporated) | 3,117 | 4.2% |
| Not-for-profit Organizations | 3,287 | 4.4% |
| Local Government Employees | 5,721 | 7.6% |
| State Government Employees | 4,462 | 5.9% |
| Federal Government Employees | 9,281 | 12.3% |
| Unpaid Family Workers | 121 | 0.2% |
| Total | 75,125 | 100.0% |
Employment Status by Age in Columbia County
According to the labor force statistics for Columbia County, out of the total population over 16 years of age (122,465), 65.3% or 79,970 individuals are in the labor force, with 5.1% or 4,078 of them unemployed. The age group with the highest labor force participation rate is 25 to 29 years, with 86.9% or 8,634 individuals in the labor force. Within the labor force, the 16 to 19 years age range has the highest percentage of unemployed individuals, with 10.2% or 318 of them being unemployed.
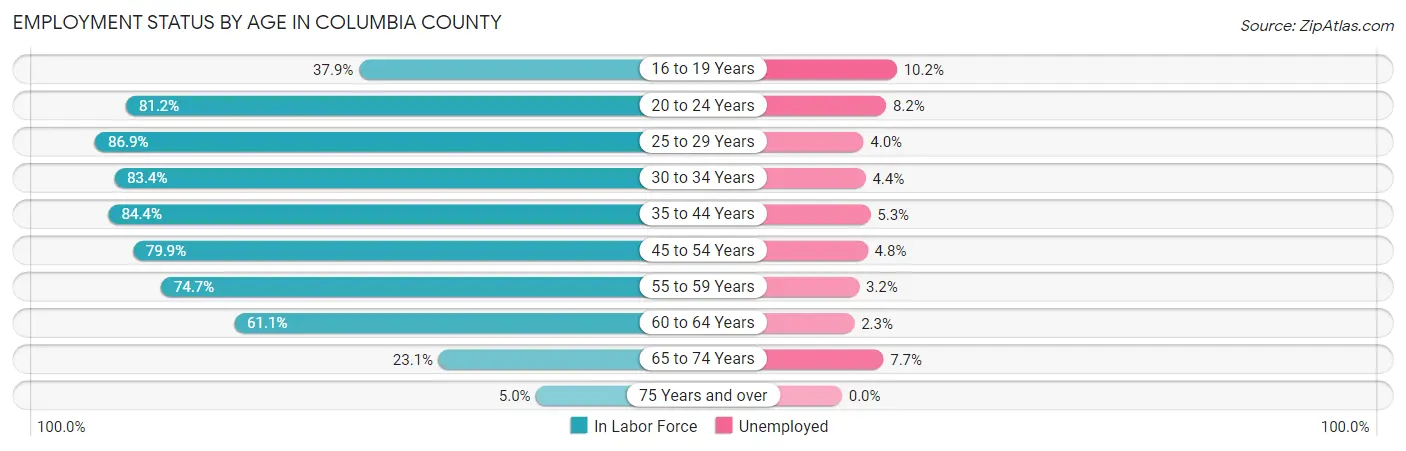
| Age Bracket | In Labor Force | Unemployed |
| 16 to 19 Years | 3,115 (37.9%) | 318 (10.2%) |
| 20 to 24 Years | 7,677 (81.2%) | 630 (8.2%) |
| 25 to 29 Years | 8,634 (86.9%) | 345 (4.0%) |
| 30 to 34 Years | 9,253 (83.4%) | 407 (4.4%) |
| 35 to 44 Years | 19,101 (84.4%) | 1,012 (5.3%) |
| 45 to 54 Years | 15,906 (79.9%) | 763 (4.8%) |
| 55 to 59 Years | 7,609 (74.7%) | 243 (3.2%) |
| 60 to 64 Years | 4,946 (61.1%) | 114 (2.3%) |
| 65 to 74 Years | 3,319 (23.1%) | 256 (7.7%) |
| 75 Years and over | 429 (5.0%) | 0 (0.0%) |
| Total | 79,970 (65.3%) | 4,078 (5.1%) |
Employment Status by Educational Attainment in Columbia County
According to labor force statistics for Columbia County, 80.0% of individuals (65,479) out of the total population between 25 and 64 years of age (81,849) are in the labor force, with 4.4% or 2,881 of them being unemployed. The group with the highest labor force participation rate are those with the educational attainment of bachelor's degree or higher, with 87.9% or 28,161 individuals in the labor force. Within the labor force, individuals with less than high school education have the highest percentage of unemployment, with 11.5% or 369 of them being unemployed.
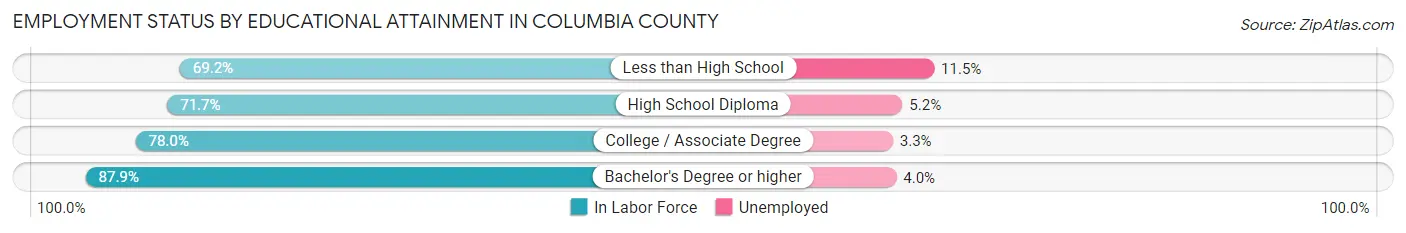
| Educational Attainment | In Labor Force | Unemployed |
| Less than High School | 3,212 (69.2%) | 534 (11.5%) |
| High School Diploma | 12,899 (71.7%) | 935 (5.2%) |
| College / Associate Degree | 21,200 (78.0%) | 897 (3.3%) |
| Bachelor's Degree or higher | 28,161 (87.9%) | 1,282 (4.0%) |
| Total | 65,479 (80.0%) | 3,601 (4.4%) |
Employment Occupations by Sex in Columbia County
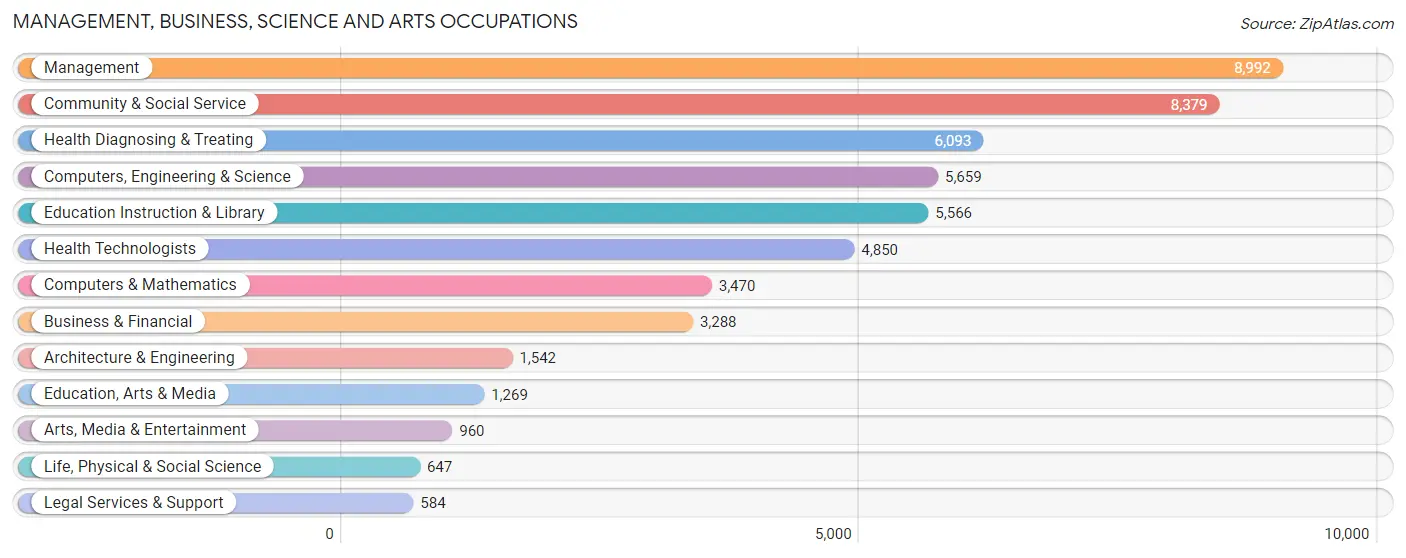
Management, Business, Science and Arts Occupations
The most common Management, Business, Science and Arts occupations in Columbia County are Management (8,992 | 12.3%), Community & Social Service (8,379 | 11.5%), Health Diagnosing & Treating (6,093 | 8.3%), Computers, Engineering & Science (5,659 | 7.7%), and Education Instruction & Library (5,566 | 7.6%).
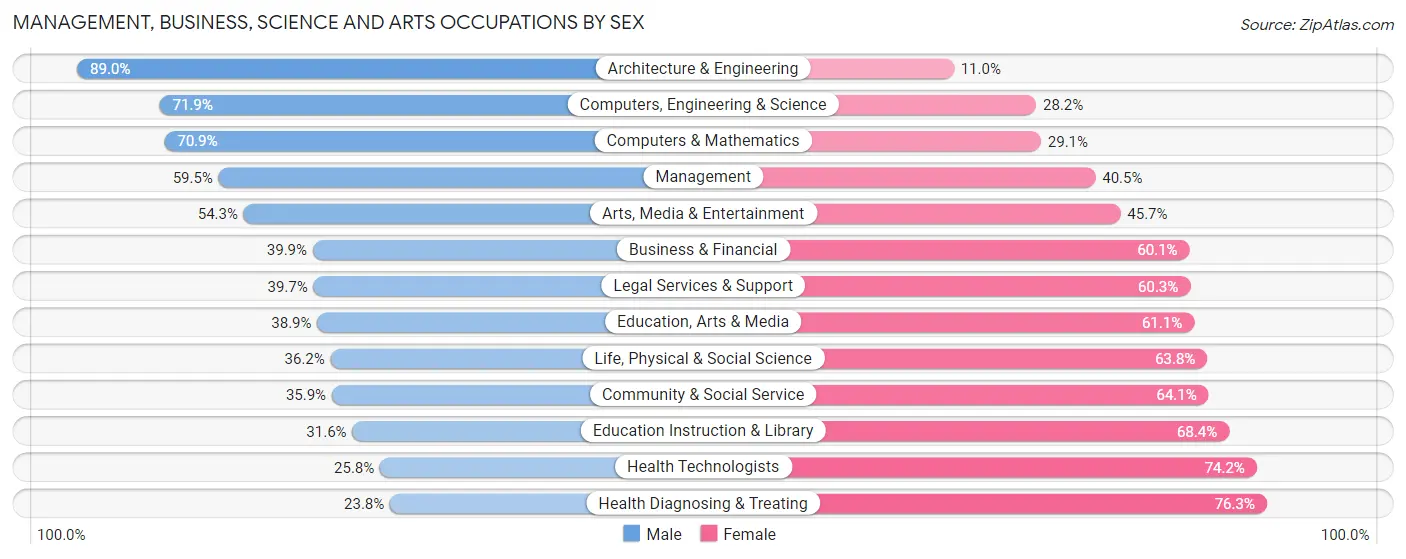
Management, Business, Science and Arts Occupations by Sex
Within the Management, Business, Science and Arts occupations in Columbia County, the most male-oriented occupations are Architecture & Engineering (89.0%), Computers, Engineering & Science (71.9%), and Computers & Mathematics (70.9%), while the most female-oriented occupations are Health Diagnosing & Treating (76.2%), Health Technologists (74.2%), and Education Instruction & Library (68.4%).
| Occupation | Male | Female |
| Management | 5,351 (59.5%) | 3,641 (40.5%) |
| Business & Financial | 1,311 (39.9%) | 1,977 (60.1%) |
| Computers, Engineering & Science | 4,066 (71.9%) | 1,593 (28.1%) |
| Computers & Mathematics | 2,459 (70.9%) | 1,011 (29.1%) |
| Architecture & Engineering | 1,373 (89.0%) | 169 (11.0%) |
| Life, Physical & Social Science | 234 (36.2%) | 413 (63.8%) |
| Community & Social Service | 3,007 (35.9%) | 5,372 (64.1%) |
| Education, Arts & Media | 494 (38.9%) | 775 (61.1%) |
| Legal Services & Support | 232 (39.7%) | 352 (60.3%) |
| Education Instruction & Library | 1,760 (31.6%) | 3,806 (68.4%) |
| Arts, Media & Entertainment | 521 (54.3%) | 439 (45.7%) |
| Health Diagnosing & Treating | 1,447 (23.7%) | 4,646 (76.2%) |
| Health Technologists | 1,253 (25.8%) | 3,597 (74.2%) |
| Total (Category) | 15,182 (46.8%) | 17,229 (53.2%) |
| Total (Overall) | 37,817 (51.7%) | 35,304 (48.3%) |
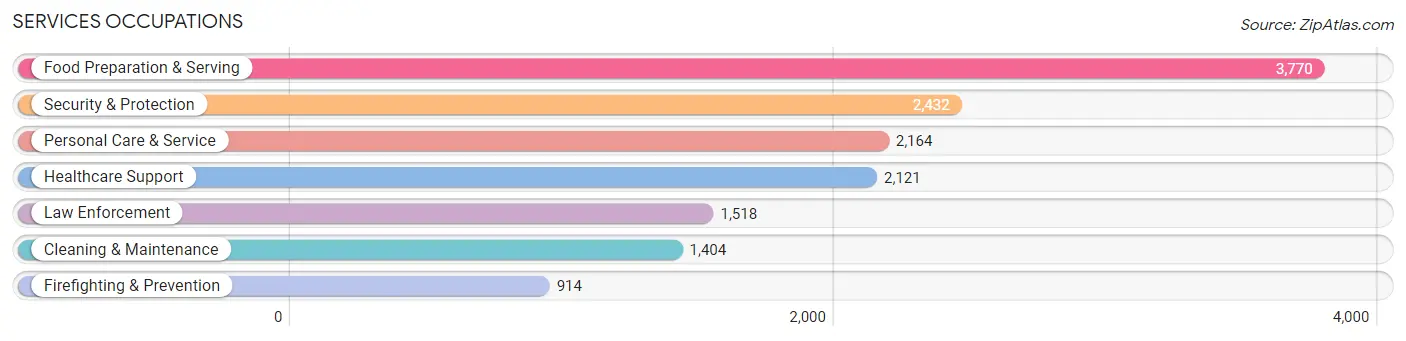
Services Occupations
The most common Services occupations in Columbia County are Food Preparation & Serving (3,770 | 5.2%), Security & Protection (2,432 | 3.3%), Personal Care & Service (2,164 | 3.0%), Healthcare Support (2,121 | 2.9%), and Law Enforcement (1,518 | 2.1%).
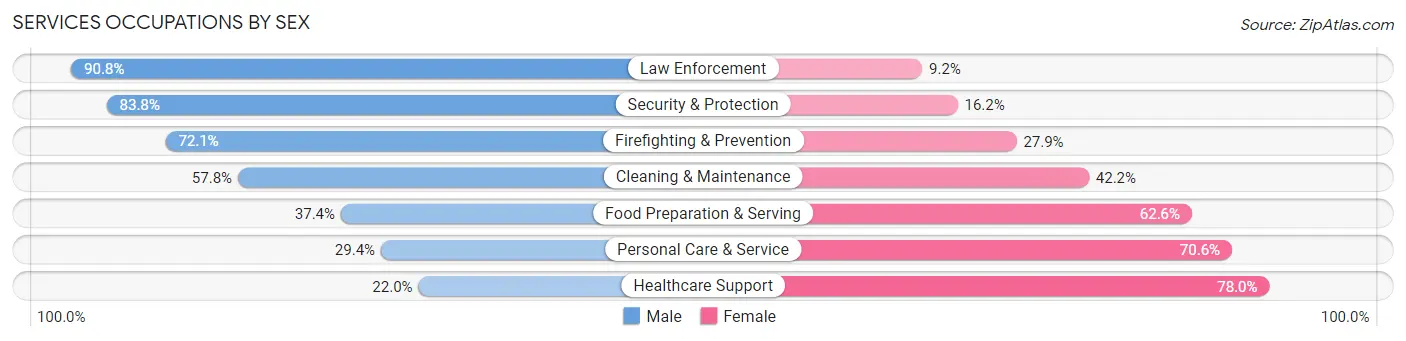
Services Occupations by Sex
Within the Services occupations in Columbia County, the most male-oriented occupations are Law Enforcement (90.8%), Security & Protection (83.8%), and Firefighting & Prevention (72.1%), while the most female-oriented occupations are Healthcare Support (78.0%), Personal Care & Service (70.6%), and Food Preparation & Serving (62.6%).
| Occupation | Male | Female |
| Healthcare Support | 467 (22.0%) | 1,654 (78.0%) |
| Security & Protection | 2,037 (83.8%) | 395 (16.2%) |
| Firefighting & Prevention | 659 (72.1%) | 255 (27.9%) |
| Law Enforcement | 1,378 (90.8%) | 140 (9.2%) |
| Food Preparation & Serving | 1,409 (37.4%) | 2,361 (62.6%) |
| Cleaning & Maintenance | 811 (57.8%) | 593 (42.2%) |
| Personal Care & Service | 637 (29.4%) | 1,527 (70.6%) |
| Total (Category) | 5,361 (45.1%) | 6,530 (54.9%) |
| Total (Overall) | 37,817 (51.7%) | 35,304 (48.3%) |
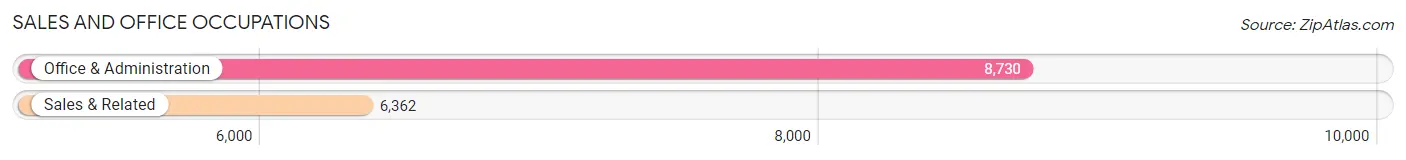
Sales and Office Occupations
The most common Sales and Office occupations in Columbia County are Office & Administration (8,730 | 11.9%), and Sales & Related (6,362 | 8.7%).
Sales and Office Occupations by Sex
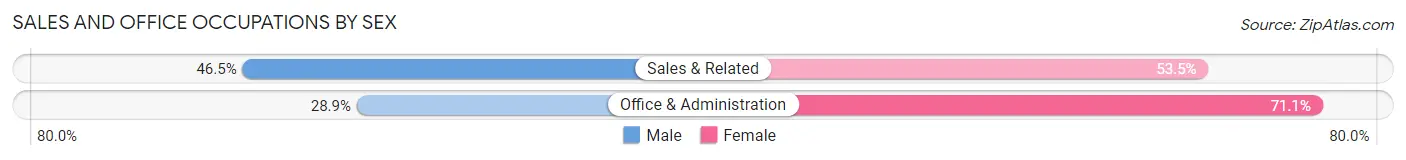
| Occupation | Male | Female |
| Sales & Related | 2,957 (46.5%) | 3,405 (53.5%) |
| Office & Administration | 2,523 (28.9%) | 6,207 (71.1%) |
| Total (Category) | 5,480 (36.3%) | 9,612 (63.7%) |
| Total (Overall) | 37,817 (51.7%) | 35,304 (48.3%) |
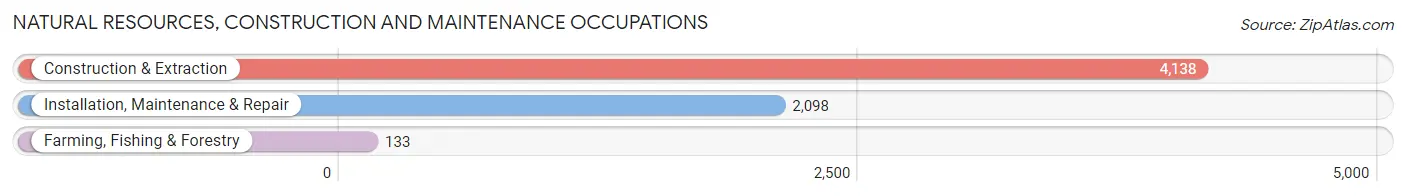
Natural Resources, Construction and Maintenance Occupations
The most common Natural Resources, Construction and Maintenance occupations in Columbia County are Construction & Extraction (4,138 | 5.7%), Installation, Maintenance & Repair (2,098 | 2.9%), and Farming, Fishing & Forestry (133 | 0.2%).
Natural Resources, Construction and Maintenance Occupations by Sex
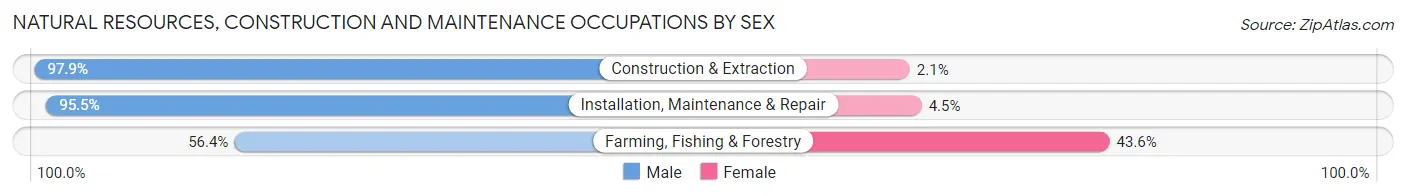
| Occupation | Male | Female |
| Farming, Fishing & Forestry | 75 (56.4%) | 58 (43.6%) |
| Construction & Extraction | 4,052 (97.9%) | 86 (2.1%) |
| Installation, Maintenance & Repair | 2,003 (95.5%) | 95 (4.5%) |
| Total (Category) | 6,130 (96.3%) | 239 (3.7%) |
| Total (Overall) | 37,817 (51.7%) | 35,304 (48.3%) |
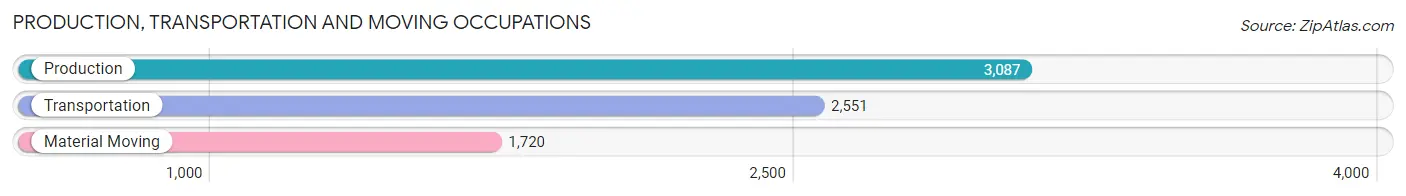
Production, Transportation and Moving Occupations
The most common Production, Transportation and Moving occupations in Columbia County are Production (3,087 | 4.2%), Transportation (2,551 | 3.5%), and Material Moving (1,720 | 2.4%).
Production, Transportation and Moving Occupations by Sex
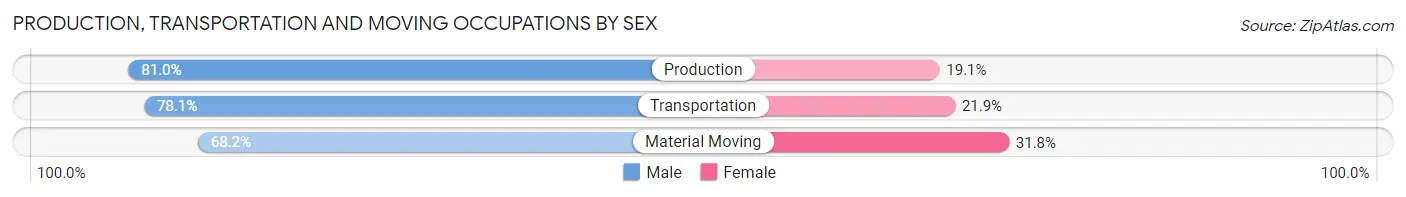
| Occupation | Male | Female |
| Production | 2,499 (80.9%) | 588 (19.1%) |
| Transportation | 1,992 (78.1%) | 559 (21.9%) |
| Material Moving | 1,173 (68.2%) | 547 (31.8%) |
| Total (Category) | 5,664 (77.0%) | 1,694 (23.0%) |
| Total (Overall) | 37,817 (51.7%) | 35,304 (48.3%) |
Employment Industries by Sex in Columbia County
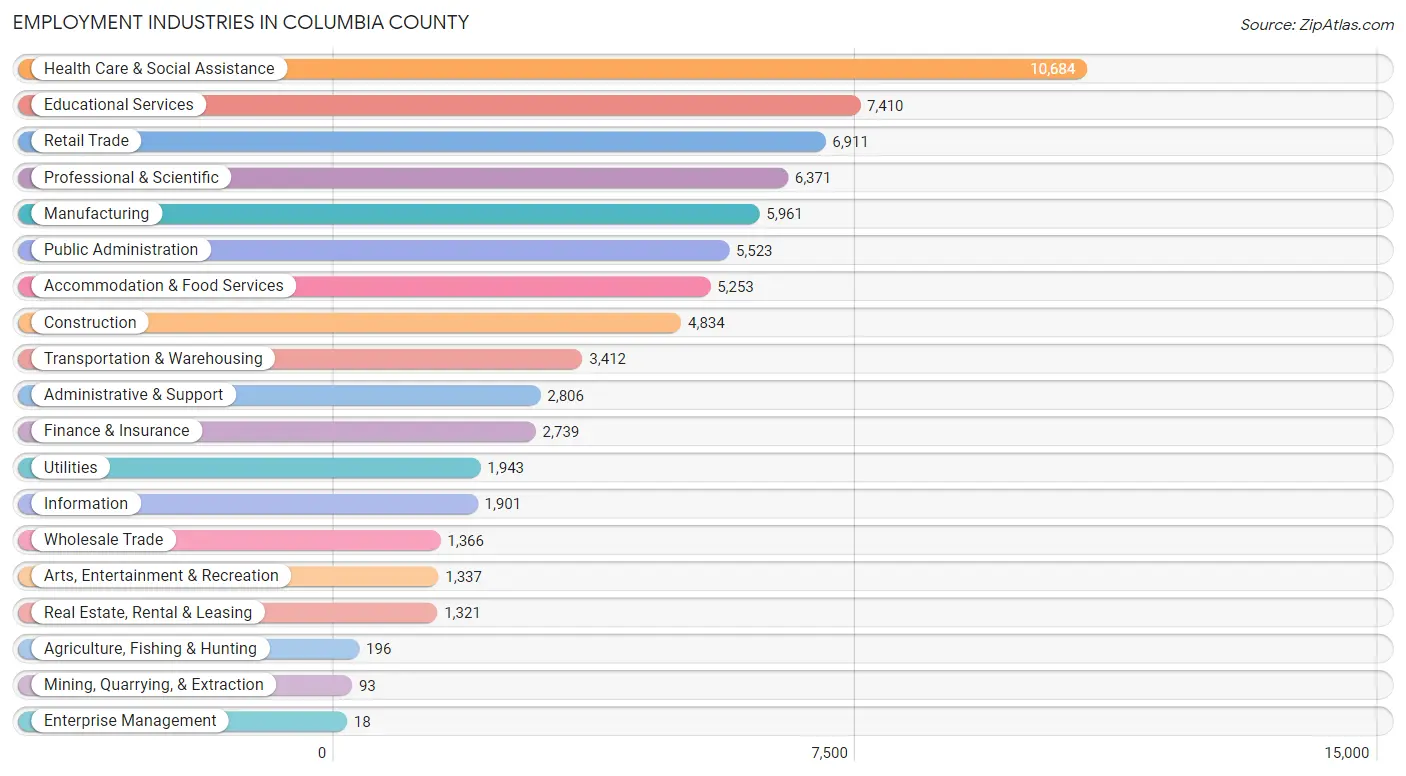
Employment Industries in Columbia County
The major employment industries in Columbia County include Health Care & Social Assistance (10,684 | 14.6%), Educational Services (7,410 | 10.1%), Retail Trade (6,911 | 9.5%), Professional & Scientific (6,371 | 8.7%), and Manufacturing (5,961 | 8.2%).
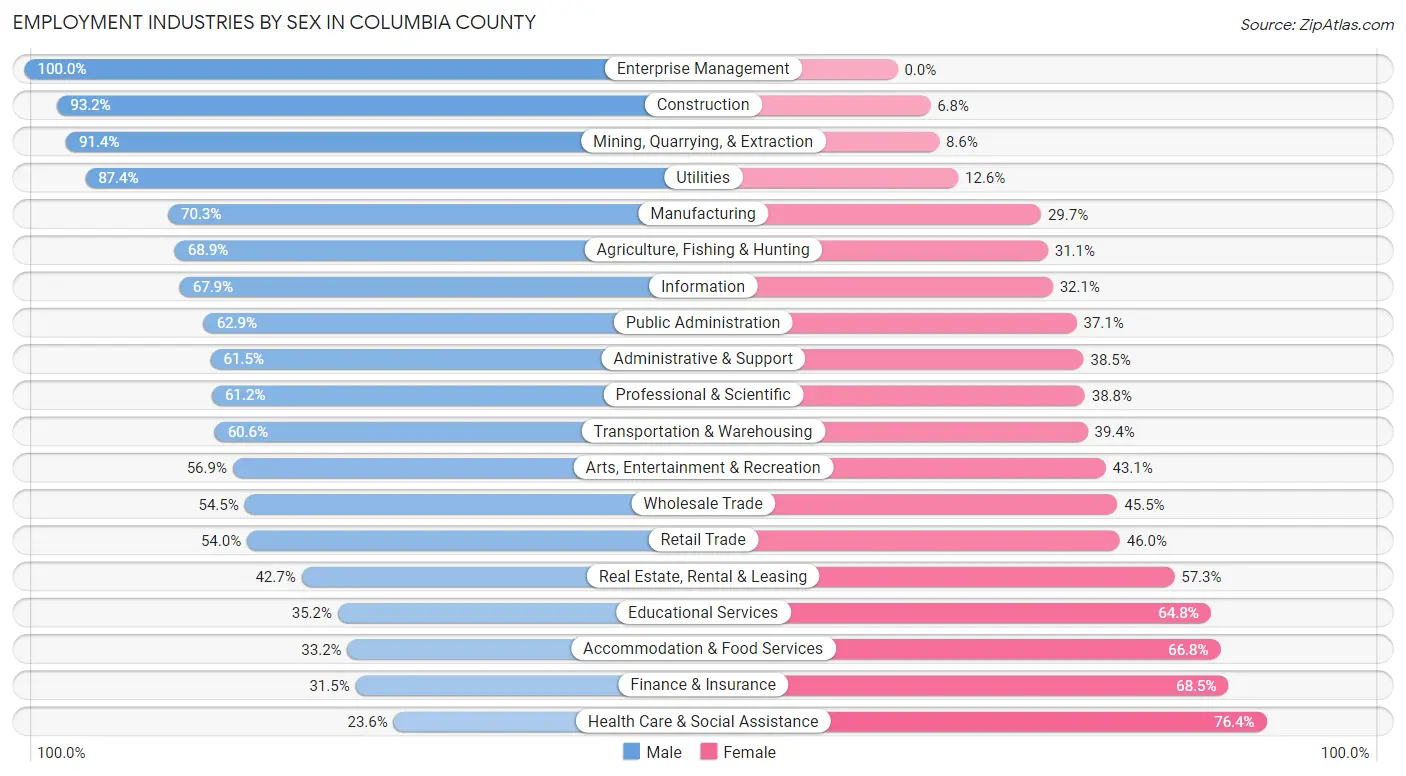
Employment Industries by Sex in Columbia County
The Columbia County industries that see more men than women are Enterprise Management (100.0%), Construction (93.2%), and Mining, Quarrying, & Extraction (91.4%), whereas the industries that tend to have a higher number of women are Health Care & Social Assistance (76.4%), Finance & Insurance (68.5%), and Accommodation & Food Services (66.8%).
| Industry | Male | Female |
| Agriculture, Fishing & Hunting | 135 (68.9%) | 61 (31.1%) |
| Mining, Quarrying, & Extraction | 85 (91.4%) | 8 (8.6%) |
| Construction | 4,506 (93.2%) | 328 (6.8%) |
| Manufacturing | 4,190 (70.3%) | 1,771 (29.7%) |
| Wholesale Trade | 744 (54.5%) | 622 (45.5%) |
| Retail Trade | 3,730 (54.0%) | 3,181 (46.0%) |
| Transportation & Warehousing | 2,069 (60.6%) | 1,343 (39.4%) |
| Utilities | 1,699 (87.4%) | 244 (12.6%) |
| Information | 1,290 (67.9%) | 611 (32.1%) |
| Finance & Insurance | 863 (31.5%) | 1,876 (68.5%) |
| Real Estate, Rental & Leasing | 564 (42.7%) | 757 (57.3%) |
| Professional & Scientific | 3,900 (61.2%) | 2,471 (38.8%) |
| Enterprise Management | 18 (100.0%) | 0 (0.0%) |
| Administrative & Support | 1,725 (61.5%) | 1,081 (38.5%) |
| Educational Services | 2,606 (35.2%) | 4,804 (64.8%) |
| Health Care & Social Assistance | 2,525 (23.6%) | 8,159 (76.4%) |
| Arts, Entertainment & Recreation | 761 (56.9%) | 576 (43.1%) |
| Accommodation & Food Services | 1,743 (33.2%) | 3,510 (66.8%) |
| Public Administration | 3,475 (62.9%) | 2,048 (37.1%) |
| Total | 37,817 (51.7%) | 35,304 (48.3%) |
Education in Columbia County
School Enrollment in Columbia County
The most common levels of schooling among the 42,762 students in Columbia County are high school (9,354 | 21.9%), middle school (9,190 | 21.5%), and elementary school (8,703 | 20.3%).
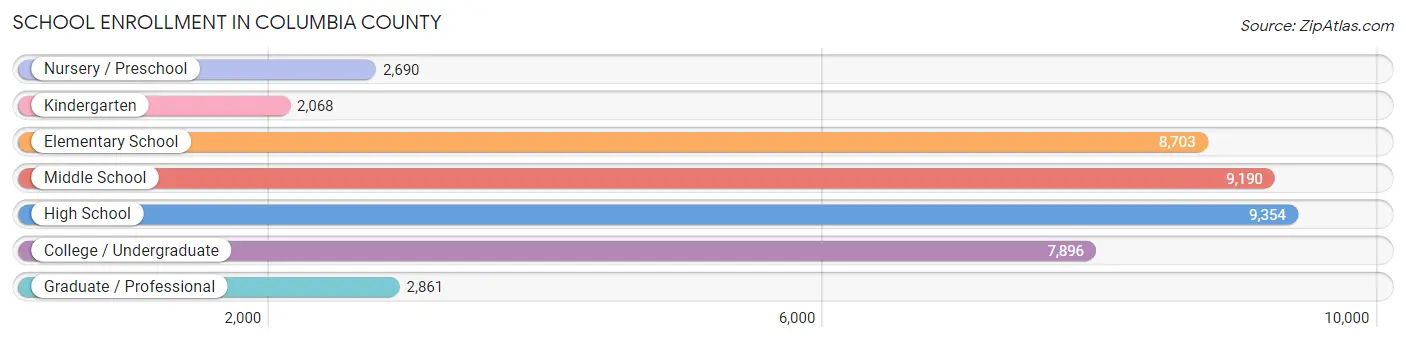
| School Level | # Students | % Students |
| Nursery / Preschool | 2,690 | 6.3% |
| Kindergarten | 2,068 | 4.8% |
| Elementary School | 8,703 | 20.3% |
| Middle School | 9,190 | 21.5% |
| High School | 9,354 | 21.9% |
| College / Undergraduate | 7,896 | 18.5% |
| Graduate / Professional | 2,861 | 6.7% |
| Total | 42,762 | 100.0% |
School Enrollment by Age by Funding Source in Columbia County
Out of a total of 42,762 students who are enrolled in schools in Columbia County, 7,056 (16.5%) attend a private institution, while the remaining 35,706 (83.5%) are enrolled in public schools. The age group of 3 to 4 year olds has the highest likelihood of being enrolled in private schools, with 1,005 (48.6% in the age bracket) enrolled. Conversely, the age group of 18 to 19 year olds has the lowest likelihood of being enrolled in a private school, with 2,416 (94.1% in the age bracket) attending a public institution.
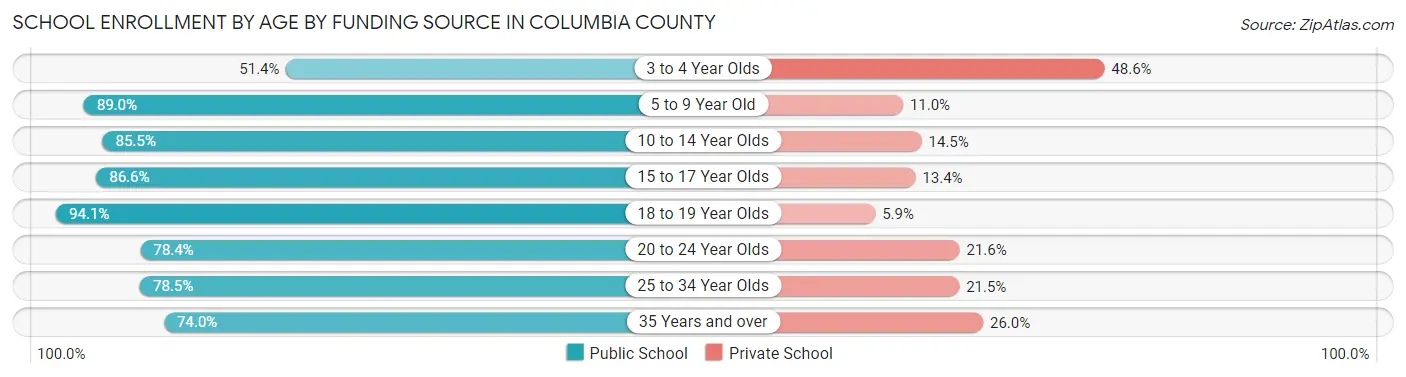
| Age Bracket | Public School | Private School |
| 3 to 4 Year Olds | 1,064 (51.4%) | 1,005 (48.6%) |
| 5 to 9 Year Old | 9,291 (89.0%) | 1,153 (11.0%) |
| 10 to 14 Year Olds | 9,742 (85.5%) | 1,655 (14.5%) |
| 15 to 17 Year Olds | 5,882 (86.6%) | 907 (13.4%) |
| 18 to 19 Year Olds | 2,416 (94.1%) | 151 (5.9%) |
| 20 to 24 Year Olds | 3,093 (78.4%) | 851 (21.6%) |
| 25 to 34 Year Olds | 1,878 (78.5%) | 515 (21.5%) |
| 35 Years and over | 2,339 (74.0%) | 820 (26.0%) |
| Total | 35,706 (83.5%) | 7,056 (16.5%) |
Educational Attainment by Field of Study in Columbia County
Business (7,779 | 18.5%), science & technology (5,364 | 12.8%), education (4,935 | 11.7%), bio, nature & agricultural (3,471 | 8.3%), and engineering (3,160 | 7.5%) are the most common fields of study among 42,004 individuals in Columbia County who have obtained a bachelor's degree or higher.
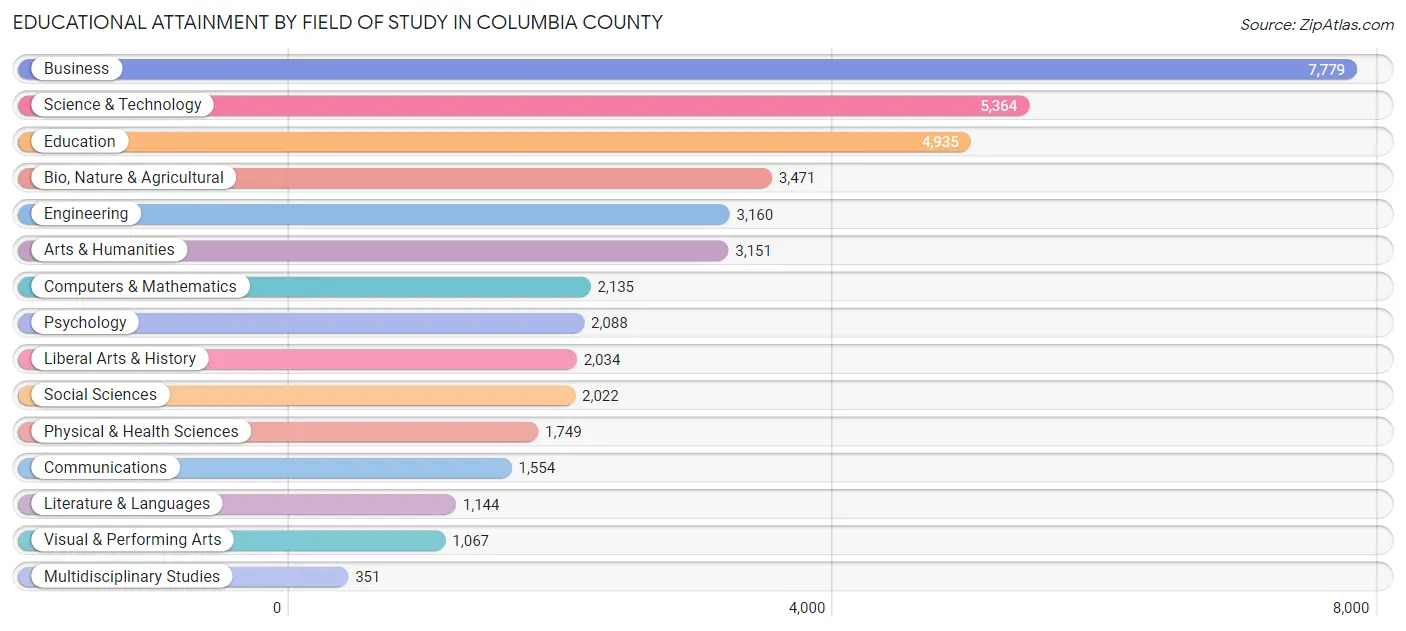
| Field of Study | # Graduates | % Graduates |
| Computers & Mathematics | 2,135 | 5.1% |
| Bio, Nature & Agricultural | 3,471 | 8.3% |
| Physical & Health Sciences | 1,749 | 4.2% |
| Psychology | 2,088 | 5.0% |
| Social Sciences | 2,022 | 4.8% |
| Engineering | 3,160 | 7.5% |
| Multidisciplinary Studies | 351 | 0.8% |
| Science & Technology | 5,364 | 12.8% |
| Business | 7,779 | 18.5% |
| Education | 4,935 | 11.7% |
| Literature & Languages | 1,144 | 2.7% |
| Liberal Arts & History | 2,034 | 4.8% |
| Visual & Performing Arts | 1,067 | 2.5% |
| Communications | 1,554 | 3.7% |
| Arts & Humanities | 3,151 | 7.5% |
| Total | 42,004 | 100.0% |
Transportation & Commute in Columbia County
Vehicle Availability by Sex in Columbia County
The most prevalent vehicle ownership categories in Columbia County are males with 2 vehicles (16,887, accounting for 42.4%) and females with 2 vehicles (13,630, making up 47.9%).
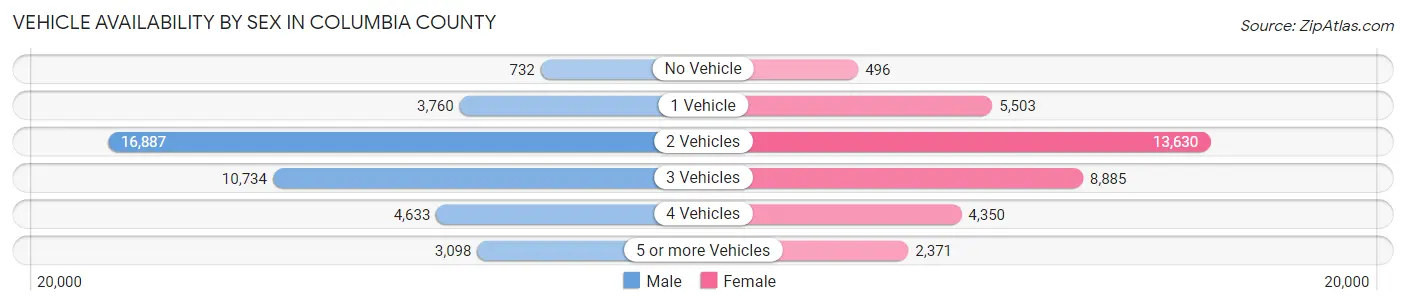
| Vehicles Available | Male | Female |
| No Vehicle | 732 (1.8%) | 496 (1.4%) |
| 1 Vehicle | 3,760 (9.4%) | 5,503 (15.6%) |
| 2 Vehicles | 16,887 (42.4%) | 13,630 (38.7%) |
| 3 Vehicles | 10,734 (26.9%) | 8,885 (25.2%) |
| 4 Vehicles | 4,633 (11.6%) | 4,350 (12.3%) |
| 5 or more Vehicles | 3,098 (7.8%) | 2,371 (6.7%) |
| Total | 39,844 (100.0%) | 35,235 (100.0%) |
Commute Time in Columbia County
The most frequently occuring commute durations in Columbia County are 20 to 24 minutes (12,884 commuters, 18.6%), 30 to 34 minutes (11,836 commuters, 17.1%), and 15 to 19 minutes (11,592 commuters, 16.7%).
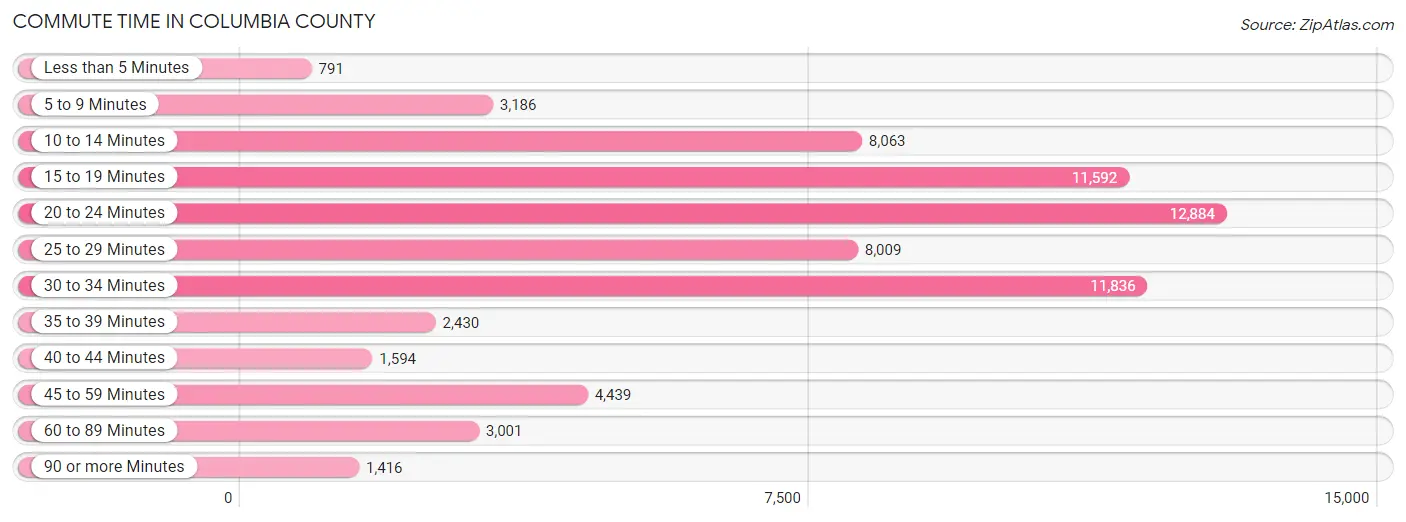
| Commute Time | # Commuters | % Commuters |
| Less than 5 Minutes | 791 | 1.1% |
| 5 to 9 Minutes | 3,186 | 4.6% |
| 10 to 14 Minutes | 8,063 | 11.6% |
| 15 to 19 Minutes | 11,592 | 16.7% |
| 20 to 24 Minutes | 12,884 | 18.6% |
| 25 to 29 Minutes | 8,009 | 11.6% |
| 30 to 34 Minutes | 11,836 | 17.1% |
| 35 to 39 Minutes | 2,430 | 3.5% |
| 40 to 44 Minutes | 1,594 | 2.3% |
| 45 to 59 Minutes | 4,439 | 6.4% |
| 60 to 89 Minutes | 3,001 | 4.3% |
| 90 or more Minutes | 1,416 | 2.1% |
Commute Time by Sex in Columbia County
The most common commute times in Columbia County are 20 to 24 minutes (6,627 commuters, 17.7%) for males and 20 to 24 minutes (6,257 commuters, 19.6%) for females.
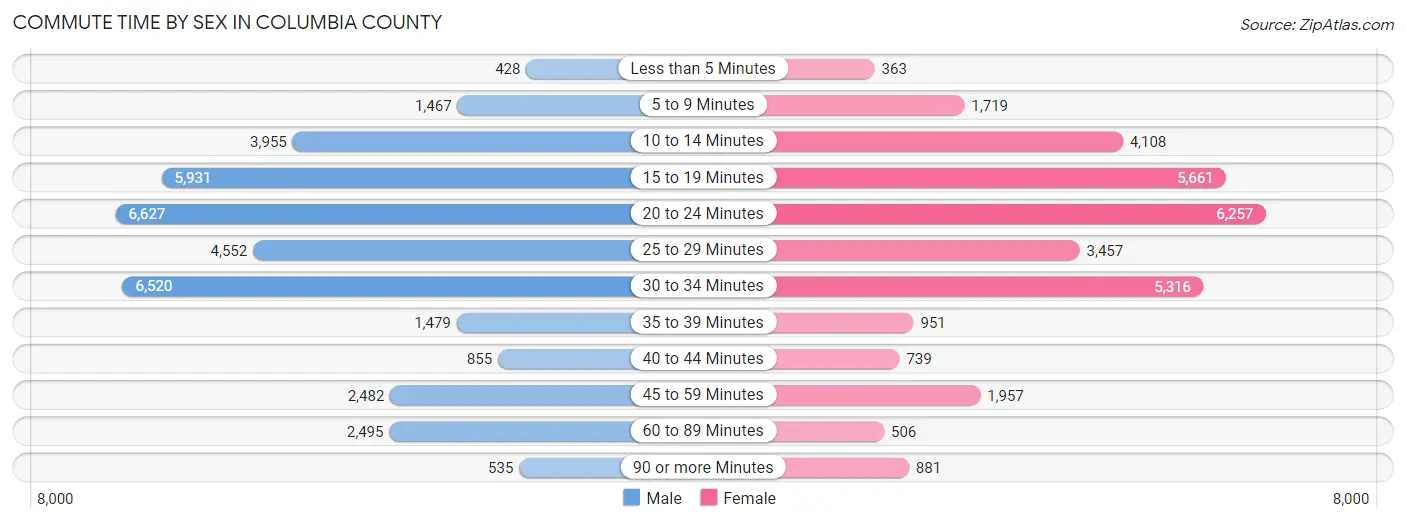
| Commute Time | Male | Female |
| Less than 5 Minutes | 428 (1.1%) | 363 (1.1%) |
| 5 to 9 Minutes | 1,467 (3.9%) | 1,719 (5.4%) |
| 10 to 14 Minutes | 3,955 (10.6%) | 4,108 (12.9%) |
| 15 to 19 Minutes | 5,931 (15.9%) | 5,661 (17.7%) |
| 20 to 24 Minutes | 6,627 (17.7%) | 6,257 (19.6%) |
| 25 to 29 Minutes | 4,552 (12.2%) | 3,457 (10.8%) |
| 30 to 34 Minutes | 6,520 (17.5%) | 5,316 (16.7%) |
| 35 to 39 Minutes | 1,479 (4.0%) | 951 (3.0%) |
| 40 to 44 Minutes | 855 (2.3%) | 739 (2.3%) |
| 45 to 59 Minutes | 2,482 (6.7%) | 1,957 (6.1%) |
| 60 to 89 Minutes | 2,495 (6.7%) | 506 (1.6%) |
| 90 or more Minutes | 535 (1.4%) | 881 (2.8%) |
Time of Departure to Work by Sex in Columbia County
The most frequent times of departure to work in Columbia County are 7:00 AM to 7:29 AM (5,850, 15.7%) for males and 7:00 AM to 7:29 AM (5,787, 18.1%) for females.
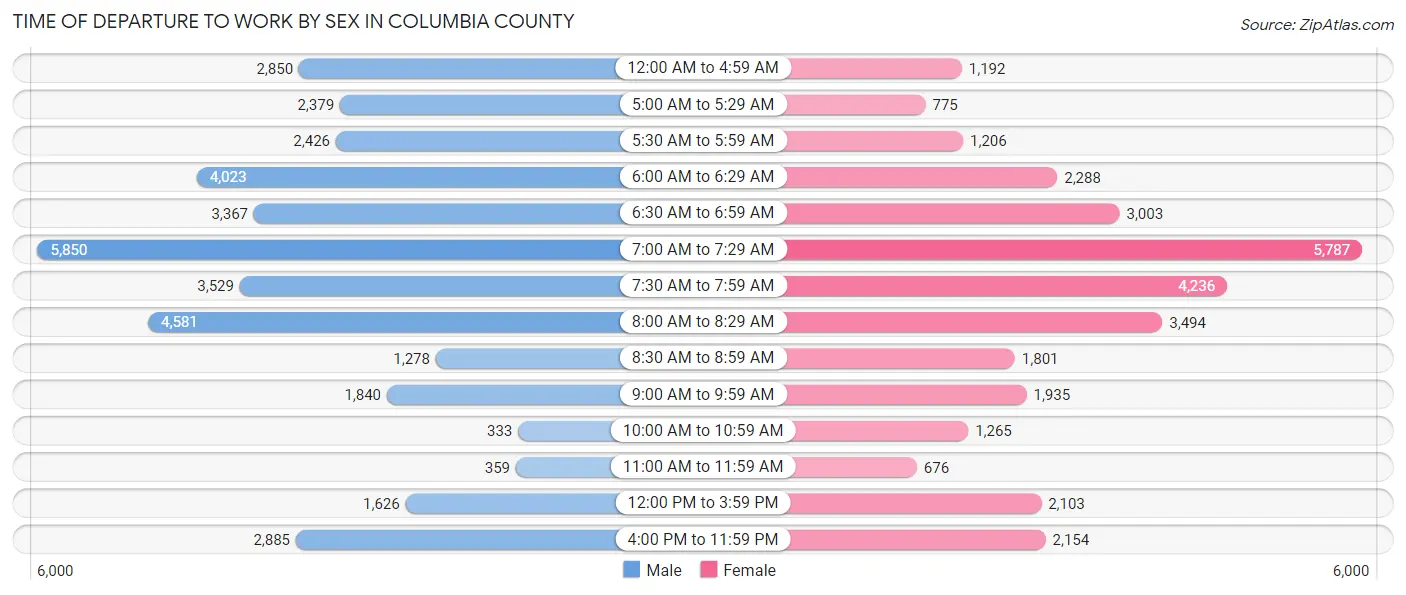
| Time of Departure | Male | Female |
| 12:00 AM to 4:59 AM | 2,850 (7.6%) | 1,192 (3.7%) |
| 5:00 AM to 5:29 AM | 2,379 (6.4%) | 775 (2.4%) |
| 5:30 AM to 5:59 AM | 2,426 (6.5%) | 1,206 (3.8%) |
| 6:00 AM to 6:29 AM | 4,023 (10.8%) | 2,288 (7.2%) |
| 6:30 AM to 6:59 AM | 3,367 (9.0%) | 3,003 (9.4%) |
| 7:00 AM to 7:29 AM | 5,850 (15.7%) | 5,787 (18.1%) |
| 7:30 AM to 7:59 AM | 3,529 (9.5%) | 4,236 (13.3%) |
| 8:00 AM to 8:29 AM | 4,581 (12.3%) | 3,494 (11.0%) |
| 8:30 AM to 8:59 AM | 1,278 (3.4%) | 1,801 (5.6%) |
| 9:00 AM to 9:59 AM | 1,840 (4.9%) | 1,935 (6.1%) |
| 10:00 AM to 10:59 AM | 333 (0.9%) | 1,265 (4.0%) |
| 11:00 AM to 11:59 AM | 359 (1.0%) | 676 (2.1%) |
| 12:00 PM to 3:59 PM | 1,626 (4.4%) | 2,103 (6.6%) |
| 4:00 PM to 11:59 PM | 2,885 (7.7%) | 2,154 (6.8%) |
| Total | 37,326 (100.0%) | 31,915 (100.0%) |
Housing Occupancy in Columbia County
Occupancy by Ownership in Columbia County
Of the total 50,056 dwellings in Columbia County, owner-occupied units account for 39,501 (78.9%), while renter-occupied units make up 10,555 (21.1%).
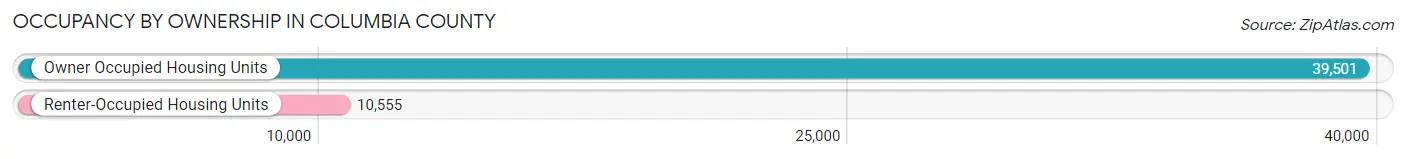
| Occupancy | # Housing Units | % Housing Units |
| Owner Occupied Housing Units | 39,501 | 78.9% |
| Renter-Occupied Housing Units | 10,555 | 21.1% |
| Total Occupied Housing Units | 50,056 | 100.0% |
Occupancy by Household Size in Columbia County
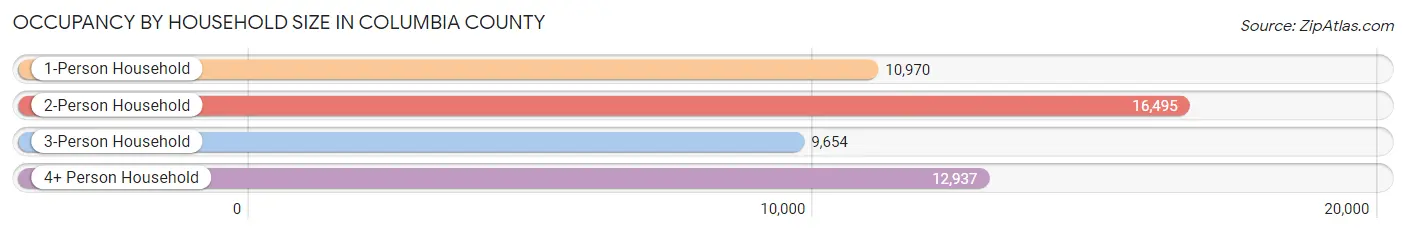
| Household Size | # Housing Units | % Housing Units |
| 1-Person Household | 10,970 | 21.9% |
| 2-Person Household | 16,495 | 33.0% |
| 3-Person Household | 9,654 | 19.3% |
| 4+ Person Household | 12,937 | 25.9% |
| Total Housing Units | 50,056 | 100.0% |
Occupancy by Ownership by Household Size in Columbia County
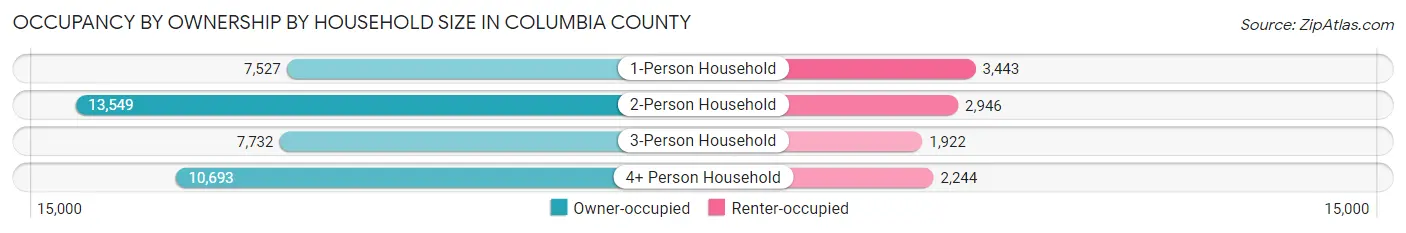
| Household Size | Owner-occupied | Renter-occupied |
| 1-Person Household | 7,527 (68.6%) | 3,443 (31.4%) |
| 2-Person Household | 13,549 (82.1%) | 2,946 (17.9%) |
| 3-Person Household | 7,732 (80.1%) | 1,922 (19.9%) |
| 4+ Person Household | 10,693 (82.7%) | 2,244 (17.3%) |
| Total Housing Units | 39,501 (78.9%) | 10,555 (21.1%) |
Occupancy by Educational Attainment in Columbia County
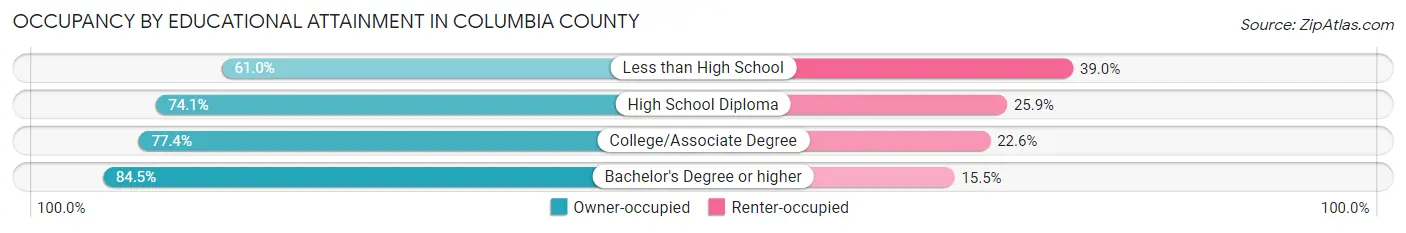
| Household Size | Owner-occupied | Renter-occupied |
| Less than High School | 1,506 (61.0%) | 964 (39.0%) |
| High School Diploma | 7,506 (74.1%) | 2,627 (25.9%) |
| College/Associate Degree | 12,548 (77.4%) | 3,667 (22.6%) |
| Bachelor's Degree or higher | 17,941 (84.5%) | 3,297 (15.5%) |
Occupancy by Age of Householder in Columbia County
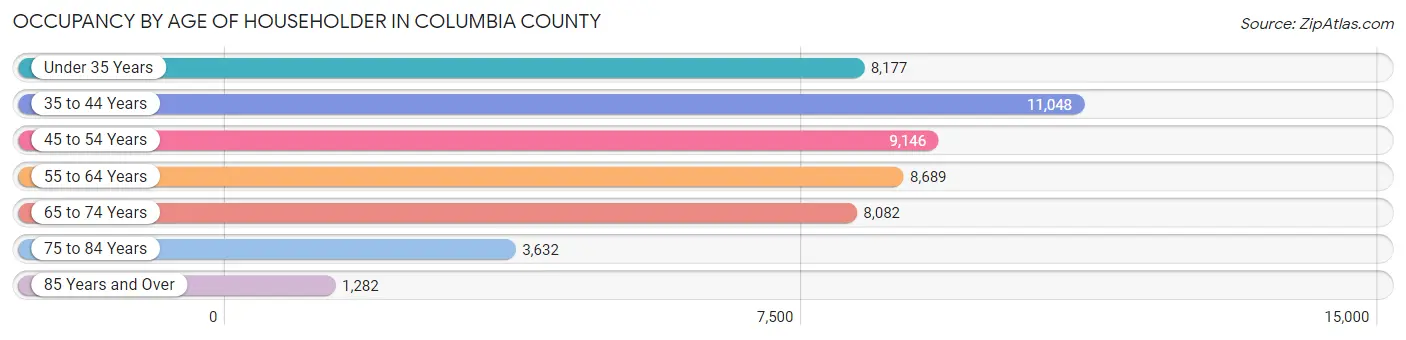
| Age Bracket | # Households | % Households |
| Under 35 Years | 8,177 | 16.3% |
| 35 to 44 Years | 11,048 | 22.1% |
| 45 to 54 Years | 9,146 | 18.3% |
| 55 to 64 Years | 8,689 | 17.4% |
| 65 to 74 Years | 8,082 | 16.2% |
| 75 to 84 Years | 3,632 | 7.3% |
| 85 Years and Over | 1,282 | 2.6% |
| Total | 50,056 | 100.0% |
Housing Finances in Columbia County
Median Income by Occupancy in Columbia County
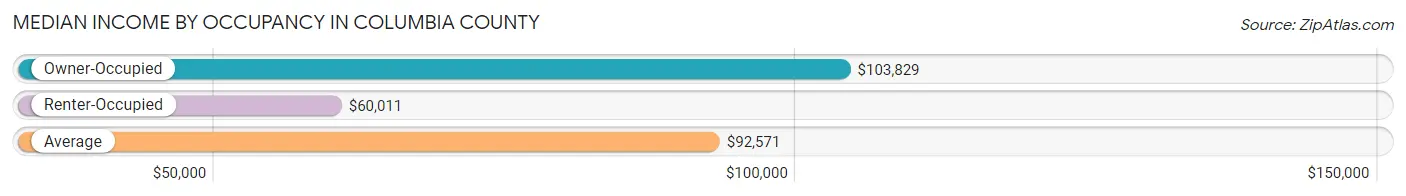
| Occupancy Type | # Households | Median Income |
| Owner-Occupied | 39,501 (78.9%) | $103,829 |
| Renter-Occupied | 10,555 (21.1%) | $60,011 |
| Average | 50,056 (100.0%) | $92,571 |
Occupancy by Householder Income Bracket in Columbia County
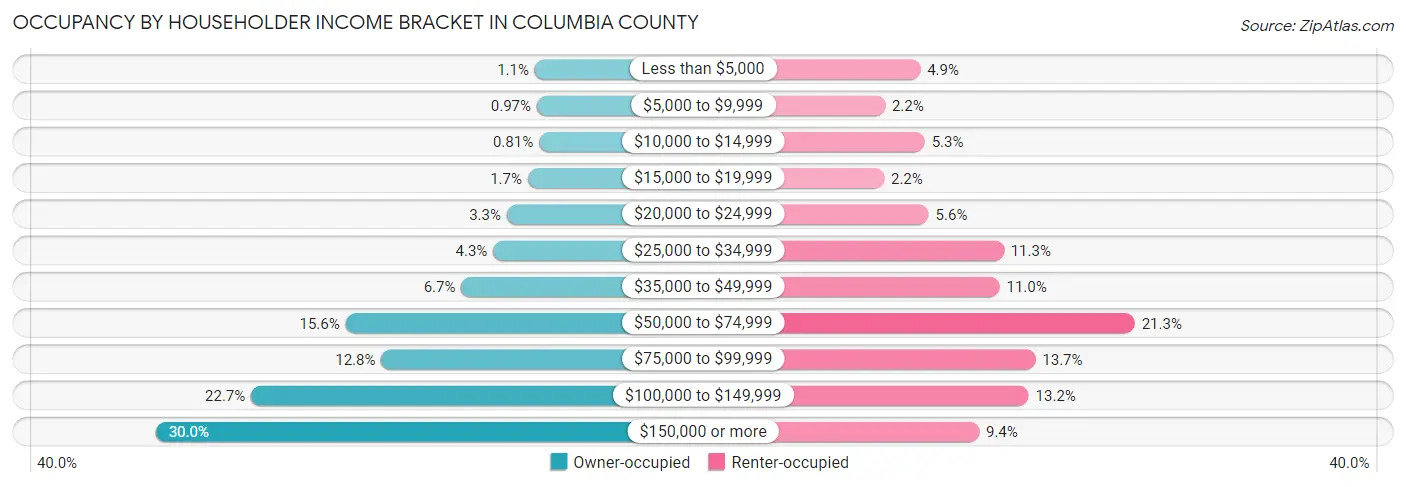
| Income Bracket | Owner-occupied | Renter-occupied |
| Less than $5,000 | 448 (1.1%) | 520 (4.9%) |
| $5,000 to $9,999 | 385 (1.0%) | 236 (2.2%) |
| $10,000 to $14,999 | 321 (0.8%) | 556 (5.3%) |
| $15,000 to $19,999 | 657 (1.7%) | 229 (2.2%) |
| $20,000 to $24,999 | 1,289 (3.3%) | 588 (5.6%) |
| $25,000 to $34,999 | 1,697 (4.3%) | 1,192 (11.3%) |
| $35,000 to $49,999 | 2,659 (6.7%) | 1,158 (11.0%) |
| $50,000 to $74,999 | 6,143 (15.5%) | 2,245 (21.3%) |
| $75,000 to $99,999 | 5,063 (12.8%) | 1,446 (13.7%) |
| $100,000 to $149,999 | 8,984 (22.7%) | 1,392 (13.2%) |
| $150,000 or more | 11,855 (30.0%) | 993 (9.4%) |
| Total | 39,501 (100.0%) | 10,555 (100.0%) |
Monthly Housing Cost Tiers in Columbia County
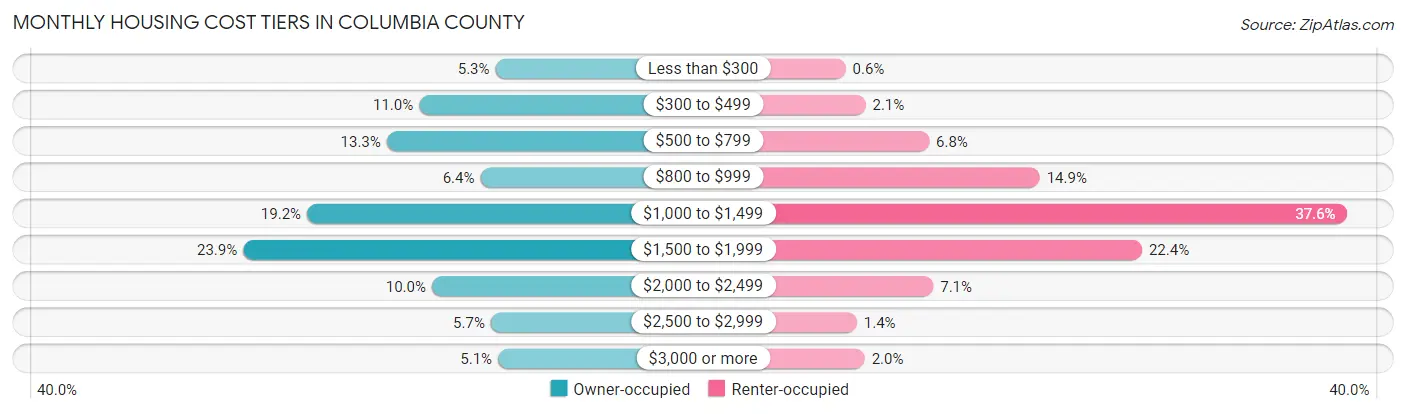
| Monthly Cost | Owner-occupied | Renter-occupied |
| Less than $300 | 2,104 (5.3%) | 63 (0.6%) |
| $300 to $499 | 4,325 (11.0%) | 218 (2.1%) |
| $500 to $799 | 5,271 (13.3%) | 712 (6.8%) |
| $800 to $999 | 2,544 (6.4%) | 1,573 (14.9%) |
| $1,000 to $1,499 | 7,587 (19.2%) | 3,964 (37.6%) |
| $1,500 to $1,999 | 9,443 (23.9%) | 2,368 (22.4%) |
| $2,000 to $2,499 | 3,954 (10.0%) | 745 (7.1%) |
| $2,500 to $2,999 | 2,241 (5.7%) | 151 (1.4%) |
| $3,000 or more | 2,032 (5.1%) | 212 (2.0%) |
| Total | 39,501 (100.0%) | 10,555 (100.0%) |
Physical Housing Characteristics in Columbia County
Housing Structures in Columbia County
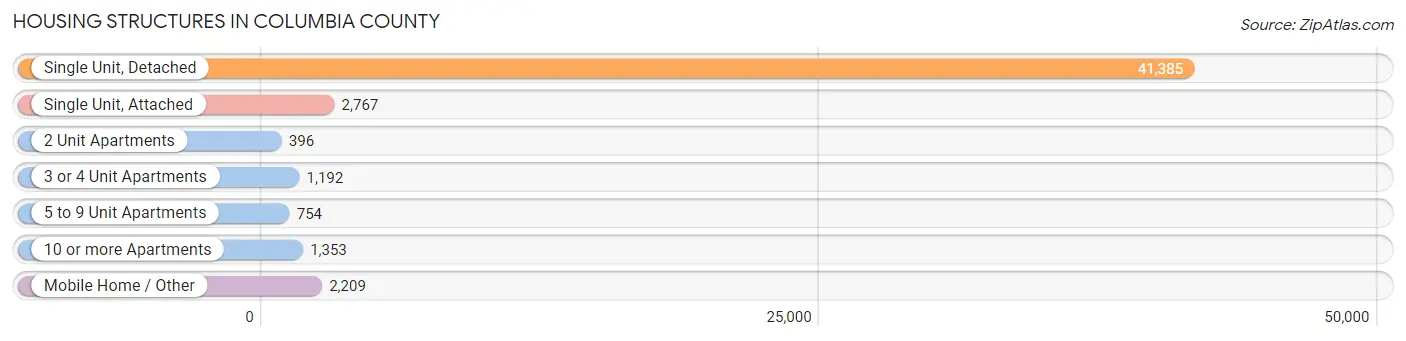
| Structure Type | # Housing Units | % Housing Units |
| Single Unit, Detached | 41,385 | 82.7% |
| Single Unit, Attached | 2,767 | 5.5% |
| 2 Unit Apartments | 396 | 0.8% |
| 3 or 4 Unit Apartments | 1,192 | 2.4% |
| 5 to 9 Unit Apartments | 754 | 1.5% |
| 10 or more Apartments | 1,353 | 2.7% |
| Mobile Home / Other | 2,209 | 4.4% |
| Total | 50,056 | 100.0% |
Housing Structures by Occupancy in Columbia County
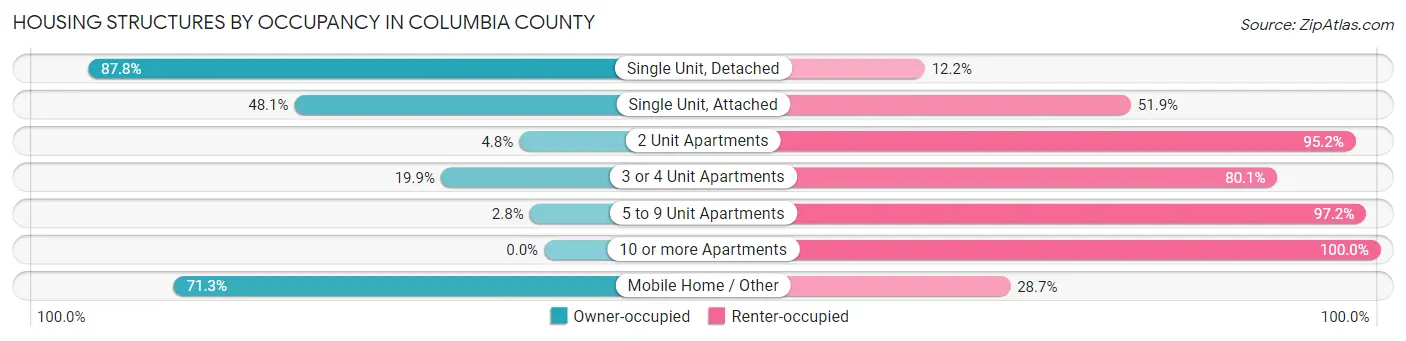
| Structure Type | Owner-occupied | Renter-occupied |
| Single Unit, Detached | 36,319 (87.8%) | 5,066 (12.2%) |
| Single Unit, Attached | 1,330 (48.1%) | 1,437 (51.9%) |
| 2 Unit Apartments | 19 (4.8%) | 377 (95.2%) |
| 3 or 4 Unit Apartments | 237 (19.9%) | 955 (80.1%) |
| 5 to 9 Unit Apartments | 21 (2.8%) | 733 (97.2%) |
| 10 or more Apartments | 0 (0.0%) | 1,353 (100.0%) |
| Mobile Home / Other | 1,575 (71.3%) | 634 (28.7%) |
| Total | 39,501 (78.9%) | 10,555 (21.1%) |
Housing Structures by Number of Rooms in Columbia County
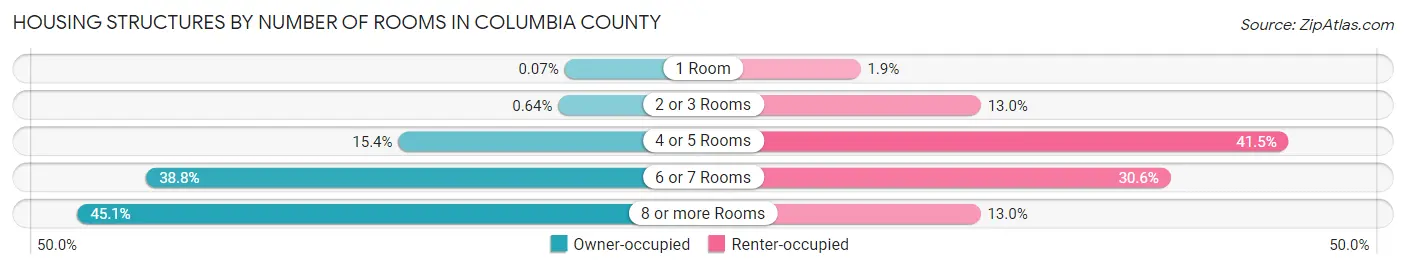
| Number of Rooms | Owner-occupied | Renter-occupied |
| 1 Room | 28 (0.1%) | 201 (1.9%) |
| 2 or 3 Rooms | 253 (0.6%) | 1,374 (13.0%) |
| 4 or 5 Rooms | 6,095 (15.4%) | 4,379 (41.5%) |
| 6 or 7 Rooms | 15,307 (38.8%) | 3,229 (30.6%) |
| 8 or more Rooms | 17,818 (45.1%) | 1,372 (13.0%) |
| Total | 39,501 (100.0%) | 10,555 (100.0%) |
Housing Structure by Heating Type in Columbia County
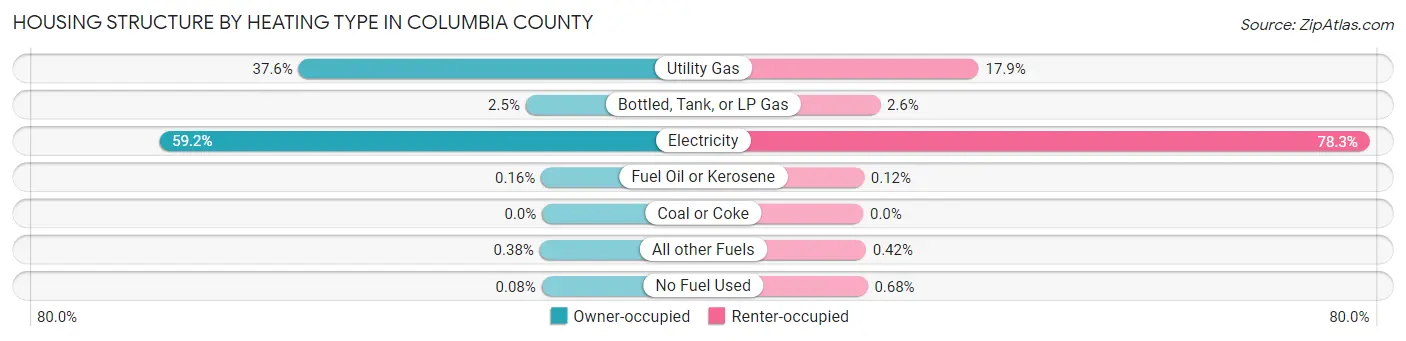
| Heating Type | Owner-occupied | Renter-occupied |
| Utility Gas | 14,870 (37.6%) | 1,885 (17.9%) |
| Bottled, Tank, or LP Gas | 1,000 (2.5%) | 275 (2.6%) |
| Electricity | 23,388 (59.2%) | 8,266 (78.3%) |
| Fuel Oil or Kerosene | 62 (0.2%) | 13 (0.1%) |
| Coal or Coke | 0 (0.0%) | 0 (0.0%) |
| All other Fuels | 149 (0.4%) | 44 (0.4%) |
| No Fuel Used | 32 (0.1%) | 72 (0.7%) |
| Total | 39,501 (100.0%) | 10,555 (100.0%) |
Household Vehicle Usage in Columbia County
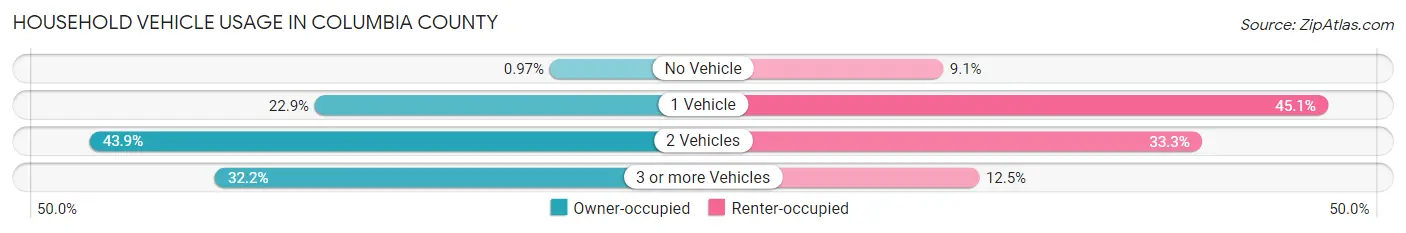
| Vehicles per Household | Owner-occupied | Renter-occupied |
| No Vehicle | 383 (1.0%) | 965 (9.1%) |
| 1 Vehicle | 9,047 (22.9%) | 4,756 (45.1%) |
| 2 Vehicles | 17,343 (43.9%) | 3,514 (33.3%) |
| 3 or more Vehicles | 12,728 (32.2%) | 1,320 (12.5%) |
| Total | 39,501 (100.0%) | 10,555 (100.0%) |
Real Estate & Mortgages in Columbia County
Real Estate and Mortgage Overview in Columbia County
| Characteristic | Without Mortgage | With Mortgage |
| Housing Units | 12,738 | 26,763 |
| Median Property Value | $229,400 | $273,100 |
| Median Household Income | $74,443 | $9,070 |
| Monthly Housing Costs | $508 | $2,032 |
| Real Estate Taxes | $1,642 | $746 |
Property Value by Mortgage Status in Columbia County
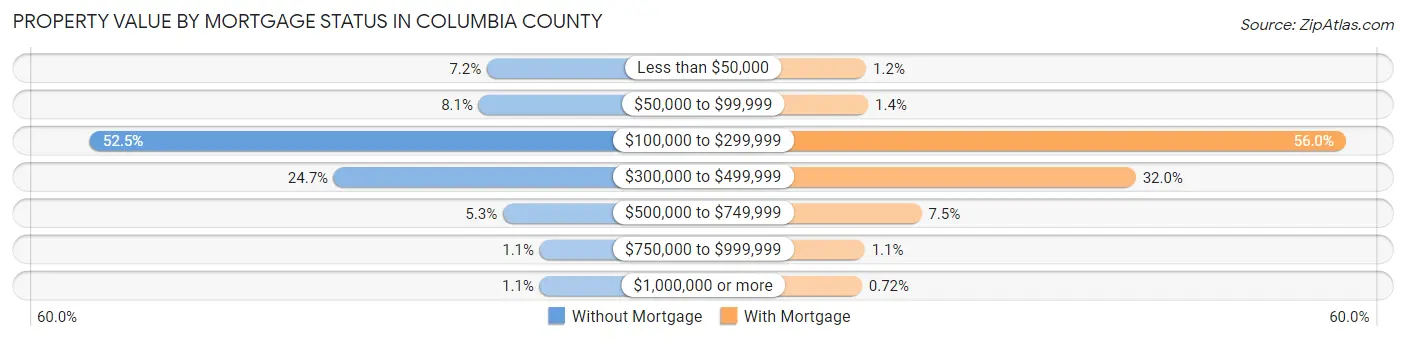
| Property Value | Without Mortgage | With Mortgage |
| Less than $50,000 | 911 (7.1%) | 325 (1.2%) |
| $50,000 to $99,999 | 1,031 (8.1%) | 386 (1.4%) |
| $100,000 to $299,999 | 6,691 (52.5%) | 14,994 (56.0%) |
| $300,000 to $499,999 | 3,140 (24.6%) | 8,569 (32.0%) |
| $500,000 to $749,999 | 679 (5.3%) | 2,015 (7.5%) |
| $750,000 to $999,999 | 142 (1.1%) | 280 (1.1%) |
| $1,000,000 or more | 144 (1.1%) | 194 (0.7%) |
| Total | 12,738 (100.0%) | 26,763 (100.0%) |
Household Income by Mortgage Status in Columbia County
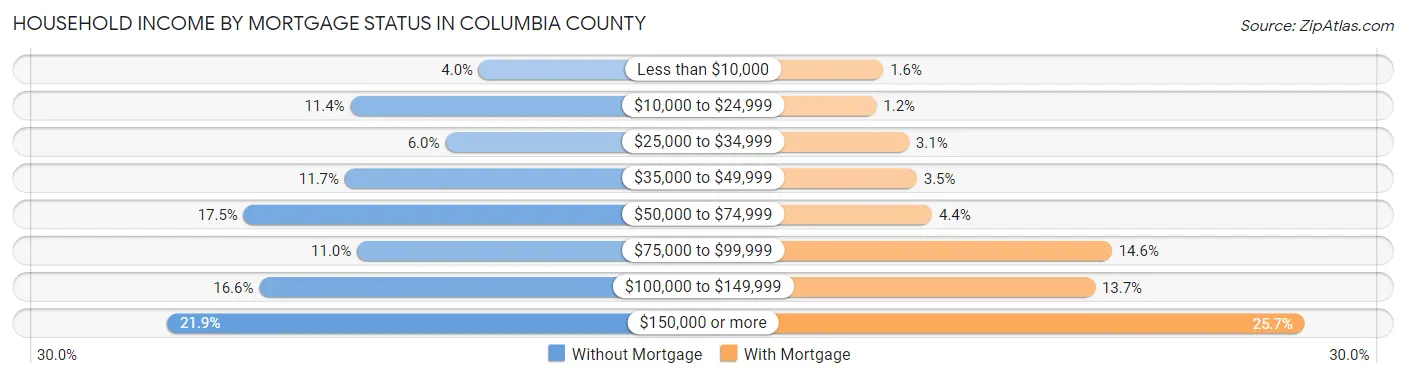
| Household Income | Without Mortgage | With Mortgage |
| Less than $10,000 | 514 (4.0%) | 423 (1.6%) |
| $10,000 to $24,999 | 1,450 (11.4%) | 319 (1.2%) |
| $25,000 to $34,999 | 759 (6.0%) | 817 (3.0%) |
| $35,000 to $49,999 | 1,490 (11.7%) | 938 (3.5%) |
| $50,000 to $74,999 | 2,226 (17.5%) | 1,169 (4.4%) |
| $75,000 to $99,999 | 1,401 (11.0%) | 3,917 (14.6%) |
| $100,000 to $149,999 | 2,113 (16.6%) | 3,662 (13.7%) |
| $150,000 or more | 2,785 (21.9%) | 6,871 (25.7%) |
| Total | 12,738 (100.0%) | 26,763 (100.0%) |
Property Value to Household Income Ratio in Columbia County
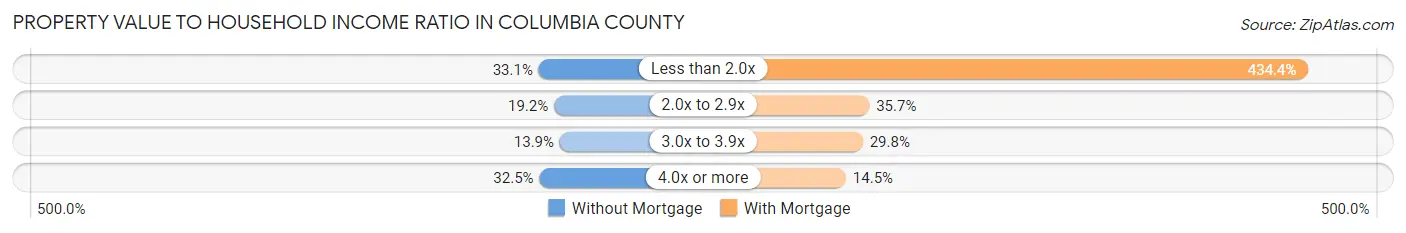
| Value-to-Income Ratio | Without Mortgage | With Mortgage |
| Less than 2.0x | 4,220 (33.1%) | 116,256 (434.4%) |
| 2.0x to 2.9x | 2,448 (19.2%) | 9,553 (35.7%) |
| 3.0x to 3.9x | 1,774 (13.9%) | 7,972 (29.8%) |
| 4.0x or more | 4,144 (32.5%) | 3,888 (14.5%) |
| Total | 12,738 (100.0%) | 26,763 (100.0%) |
Real Estate Taxes by Mortgage Status in Columbia County
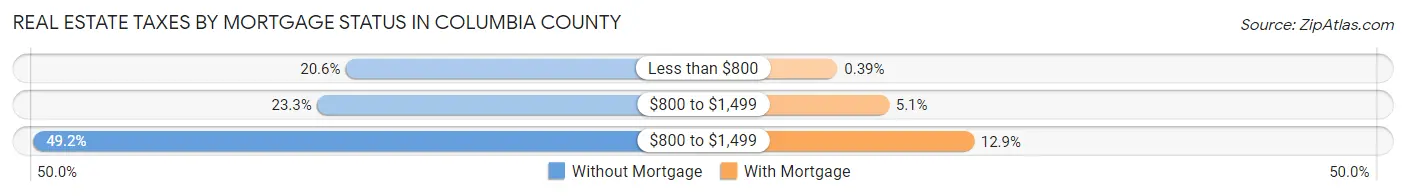
| Property Taxes | Without Mortgage | With Mortgage |
| Less than $800 | 2,627 (20.6%) | 105 (0.4%) |
| $800 to $1,499 | 2,962 (23.3%) | 1,363 (5.1%) |
| $800 to $1,499 | 6,269 (49.2%) | 3,439 (12.9%) |
| Total | 12,738 (100.0%) | 26,763 (100.0%) |
Health & Disability in Columbia County
Health Insurance Coverage by Age in Columbia County
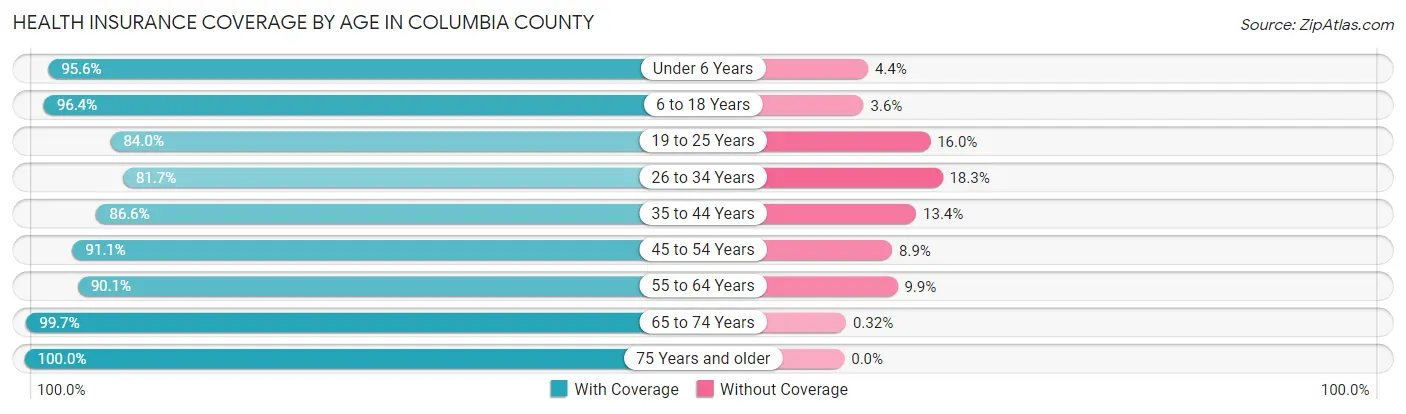
| Age Bracket | With Coverage | Without Coverage |
| Under 6 Years | 11,416 (95.6%) | 527 (4.4%) |
| 6 to 18 Years | 28,235 (96.4%) | 1,053 (3.6%) |
| 19 to 25 Years | 10,419 (84.0%) | 1,987 (16.0%) |
| 26 to 34 Years | 14,807 (81.7%) | 3,319 (18.3%) |
| 35 to 44 Years | 18,337 (86.6%) | 2,834 (13.4%) |
| 45 to 54 Years | 17,899 (91.1%) | 1,750 (8.9%) |
| 55 to 64 Years | 16,470 (90.1%) | 1,811 (9.9%) |
| 65 to 74 Years | 14,284 (99.7%) | 46 (0.3%) |
| 75 Years and older | 8,277 (100.0%) | 0 (0.0%) |
| Total | 140,144 (91.3%) | 13,327 (8.7%) |
Health Insurance Coverage by Citizenship Status in Columbia County
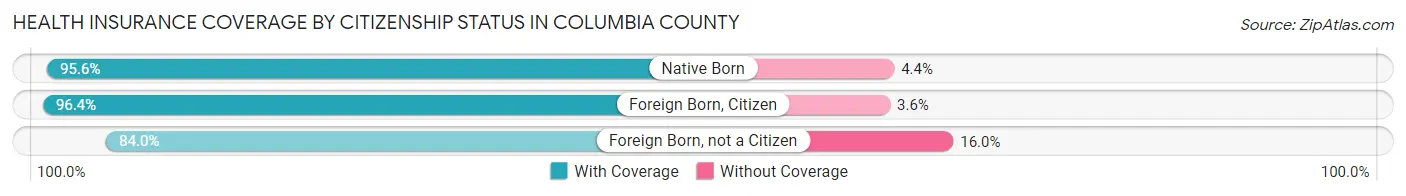
| Citizenship Status | With Coverage | Without Coverage |
| Native Born | 11,416 (95.6%) | 527 (4.4%) |
| Foreign Born, Citizen | 28,235 (96.4%) | 1,053 (3.6%) |
| Foreign Born, not a Citizen | 10,419 (84.0%) | 1,987 (16.0%) |
Health Insurance Coverage by Household Income in Columbia County
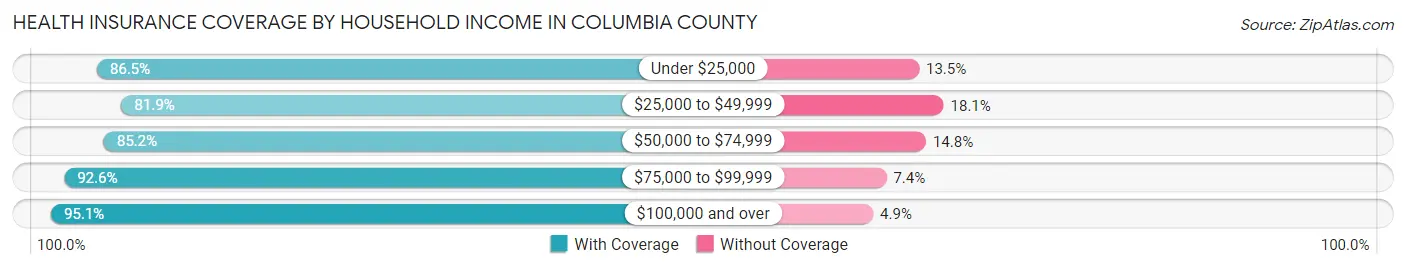
| Household Income | With Coverage | Without Coverage |
| Under $25,000 | 9,827 (86.5%) | 1,539 (13.5%) |
| $25,000 to $49,999 | 12,256 (81.9%) | 2,716 (18.1%) |
| $50,000 to $74,999 | 19,490 (85.2%) | 3,396 (14.8%) |
| $75,000 to $99,999 | 17,611 (92.6%) | 1,413 (7.4%) |
| $100,000 and over | 80,868 (95.1%) | 4,202 (4.9%) |
Public vs Private Health Insurance Coverage by Age in Columbia County
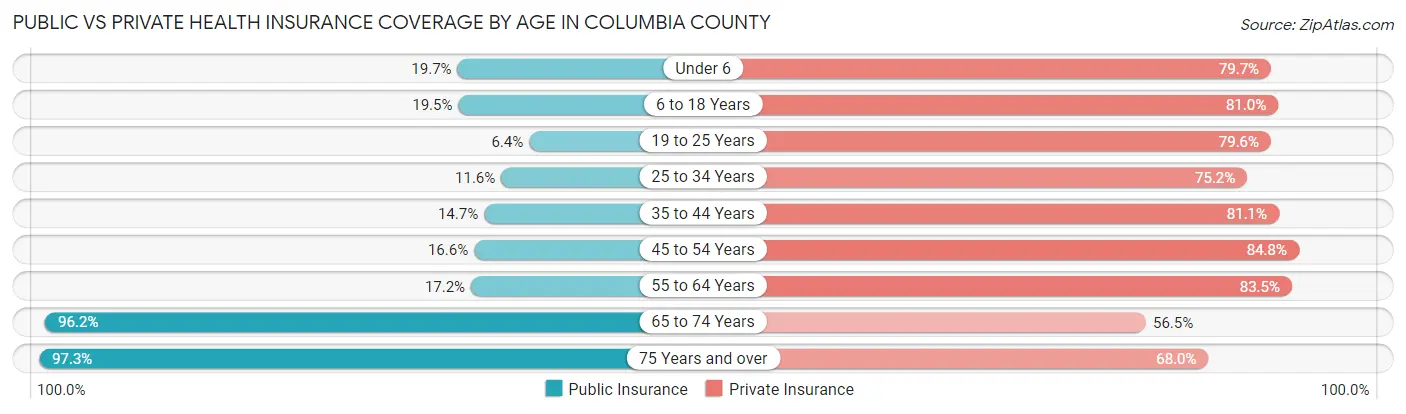
| Age Bracket | Public Insurance | Private Insurance |
| Under 6 | 2,348 (19.7%) | 9,513 (79.6%) |
| 6 to 18 Years | 5,712 (19.5%) | 23,712 (81.0%) |
| 19 to 25 Years | 790 (6.4%) | 9,879 (79.6%) |
| 25 to 34 Years | 2,094 (11.6%) | 13,637 (75.2%) |
| 35 to 44 Years | 3,119 (14.7%) | 17,173 (81.1%) |
| 45 to 54 Years | 3,260 (16.6%) | 16,666 (84.8%) |
| 55 to 64 Years | 3,135 (17.2%) | 15,268 (83.5%) |
| 65 to 74 Years | 13,784 (96.2%) | 8,094 (56.5%) |
| 75 Years and over | 8,056 (97.3%) | 5,631 (68.0%) |
| Total | 42,298 (27.6%) | 119,573 (77.9%) |
Disability Status by Sex by Age in Columbia County
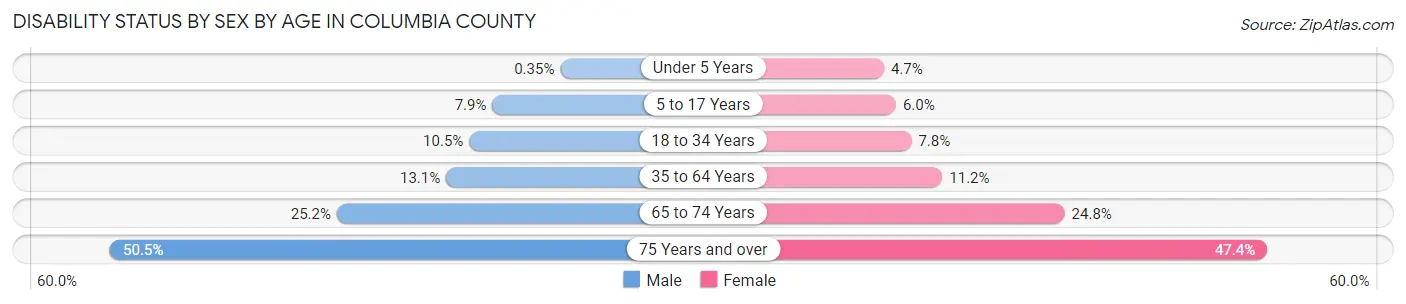
| Age Bracket | Male | Female |
| Under 5 Years | 17 (0.4%) | 216 (4.7%) |
| 5 to 17 Years | 1,186 (7.9%) | 890 (6.0%) |
| 18 to 34 Years | 1,695 (10.5%) | 1,270 (7.8%) |
| 35 to 64 Years | 3,662 (13.1%) | 3,479 (11.2%) |
| 65 to 74 Years | 1,757 (25.2%) | 1,828 (24.8%) |
| 75 Years and over | 1,647 (50.5%) | 2,374 (47.3%) |
Disability Class by Sex by Age in Columbia County
Disability Class: Hearing Difficulty
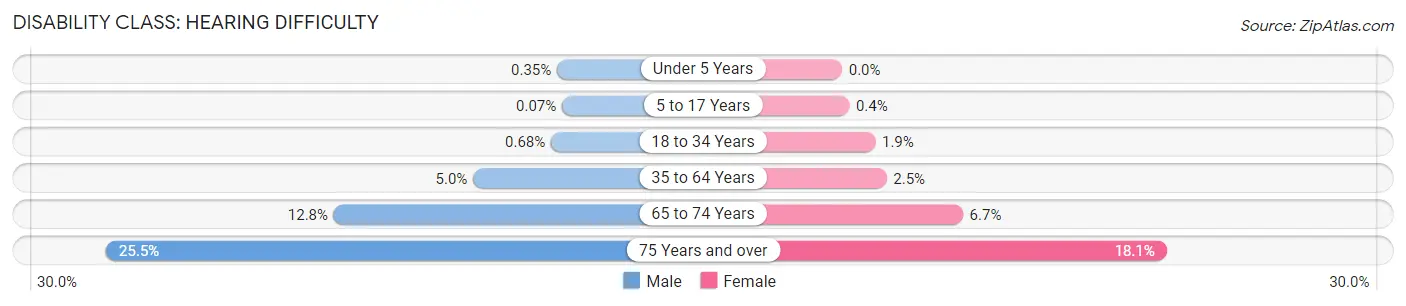
| Age Bracket | Male | Female |
| Under 5 Years | 17 (0.4%) | 0 (0.0%) |
| 5 to 17 Years | 11 (0.1%) | 59 (0.4%) |
| 18 to 34 Years | 110 (0.7%) | 302 (1.8%) |
| 35 to 64 Years | 1,409 (5.0%) | 770 (2.5%) |
| 65 to 74 Years | 890 (12.8%) | 496 (6.7%) |
| 75 Years and over | 831 (25.5%) | 907 (18.1%) |
Disability Class: Vision Difficulty
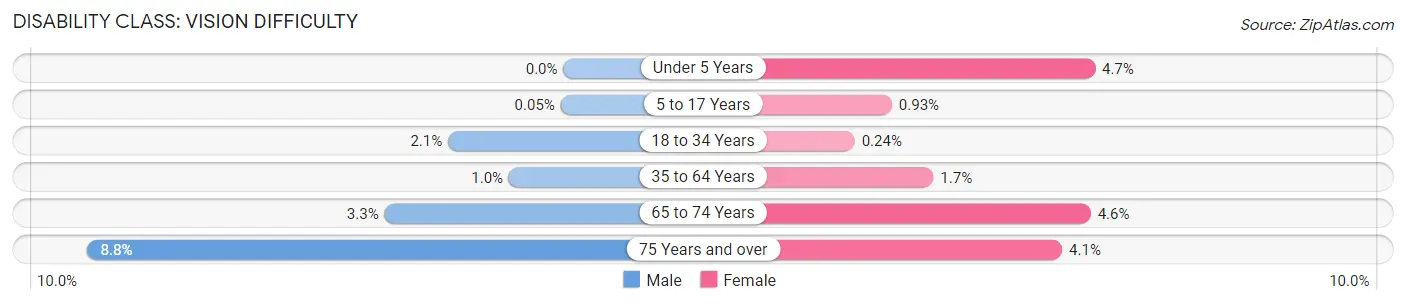
| Age Bracket | Male | Female |
| Under 5 Years | 0 (0.0%) | 216 (4.7%) |
| 5 to 17 Years | 7 (0.1%) | 137 (0.9%) |
| 18 to 34 Years | 345 (2.1%) | 40 (0.2%) |
| 35 to 64 Years | 282 (1.0%) | 528 (1.7%) |
| 65 to 74 Years | 231 (3.3%) | 340 (4.6%) |
| 75 Years and over | 288 (8.8%) | 205 (4.1%) |
Disability Class: Cognitive Difficulty
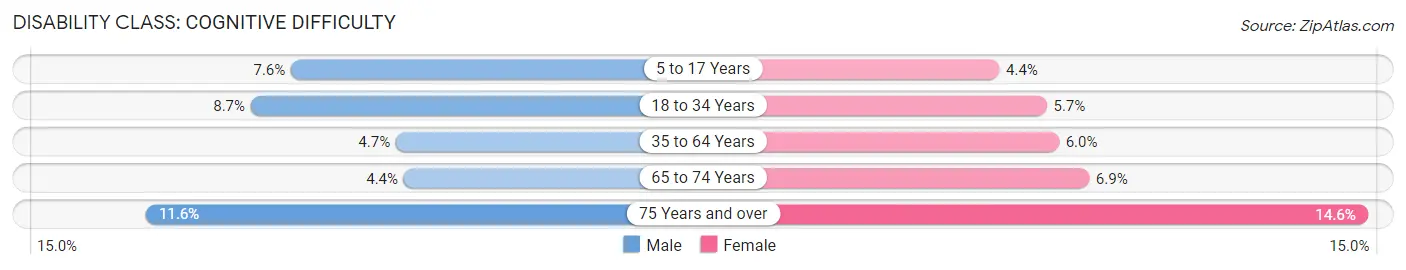
| Age Bracket | Male | Female |
| 5 to 17 Years | 1,136 (7.6%) | 646 (4.4%) |
| 18 to 34 Years | 1,406 (8.7%) | 932 (5.7%) |
| 35 to 64 Years | 1,306 (4.7%) | 1,876 (6.0%) |
| 65 to 74 Years | 309 (4.4%) | 507 (6.9%) |
| 75 Years and over | 379 (11.6%) | 734 (14.6%) |
Disability Class: Ambulatory Difficulty
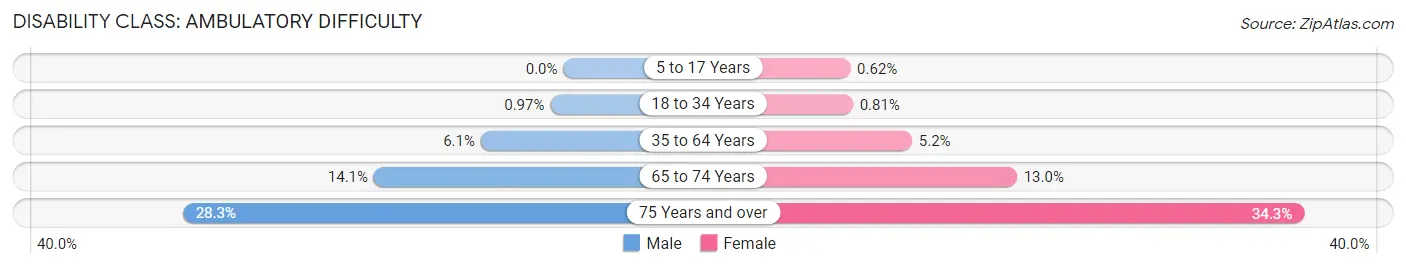
| Age Bracket | Male | Female |
| 5 to 17 Years | 0 (0.0%) | 91 (0.6%) |
| 18 to 34 Years | 157 (1.0%) | 132 (0.8%) |
| 35 to 64 Years | 1,720 (6.1%) | 1,614 (5.2%) |
| 65 to 74 Years | 980 (14.1%) | 957 (13.0%) |
| 75 Years and over | 922 (28.3%) | 1,721 (34.3%) |
Disability Class: Self-Care Difficulty
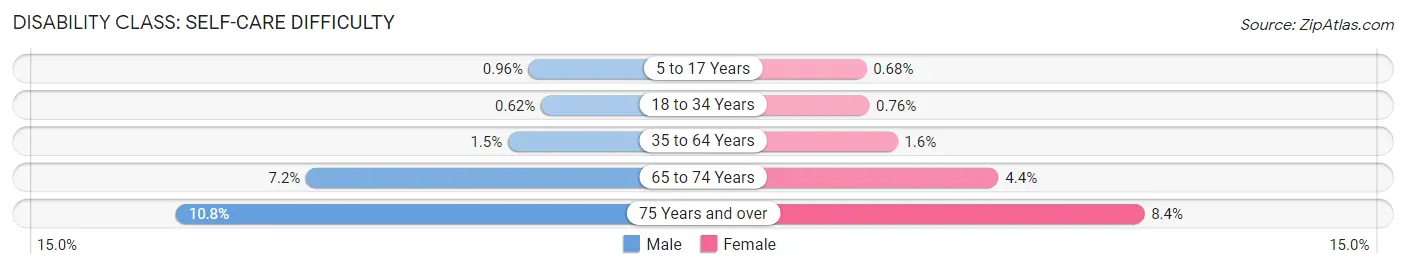
| Age Bracket | Male | Female |
| 5 to 17 Years | 144 (1.0%) | 100 (0.7%) |
| 18 to 34 Years | 100 (0.6%) | 125 (0.8%) |
| 35 to 64 Years | 431 (1.5%) | 482 (1.5%) |
| 65 to 74 Years | 499 (7.2%) | 321 (4.4%) |
| 75 Years and over | 352 (10.8%) | 422 (8.4%) |
Technology Access in Columbia County
Computing Device Access in Columbia County
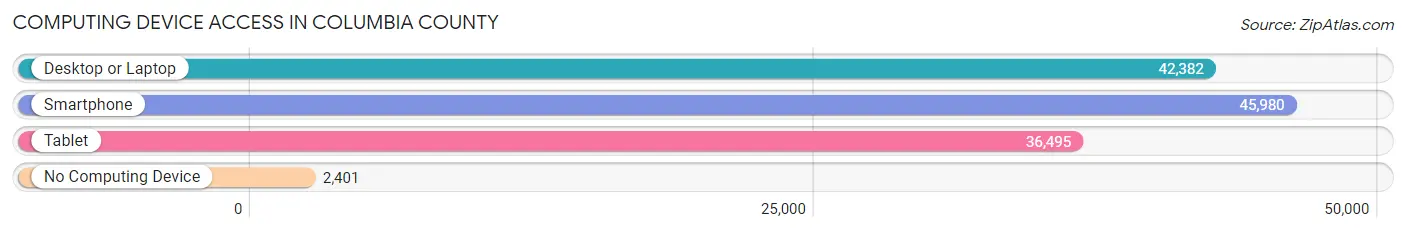
| Device Type | # Households | % Households |
| Desktop or Laptop | 42,382 | 84.7% |
| Smartphone | 45,980 | 91.9% |
| Tablet | 36,495 | 72.9% |
| No Computing Device | 2,401 | 4.8% |
| Total | 50,056 | 100.0% |
Internet Access in Columbia County
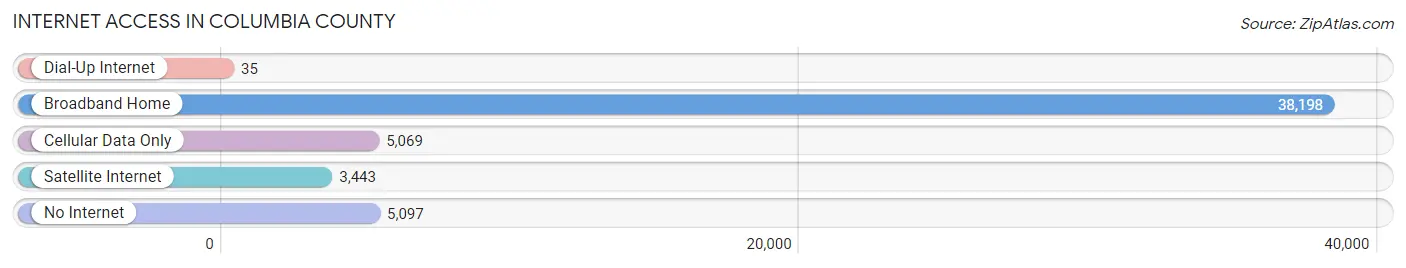
| Internet Type | # Households | % Households |
| Dial-Up Internet | 35 | 0.1% |
| Broadband Home | 38,198 | 76.3% |
| Cellular Data Only | 5,069 | 10.1% |
| Satellite Internet | 3,443 | 6.9% |
| No Internet | 5,097 | 10.2% |
| Total | 50,056 | 100.0% |
Columbia County Summary
Columbia County is located in the east-central part of the state of Georgia, in the United States. It is part of the Augusta-Richmond County Metropolitan Statistical Area. The county seat is Appling. As of the 2010 census, the population was 124,035, making it the fifth-most populous county in Georgia.
History
Columbia County was created in 1790 from Richmond County. It was named for Christopher Columbus, the explorer. The county was originally part of the Creek Nation, and the area was home to many Native American tribes. In the early 19th century, the area was settled by European Americans, mostly from the Upper South.
Geography
Columbia County is located in east-central Georgia, about 30 miles southwest of Augusta. It is bordered by Richmond County to the north, McDuffie County to the east, Lincoln County to the south, and Warren County to the west. The county has a total area of 437 square miles, of which 433 square miles is land and 4.2 square miles is water.
The county is located in the Piedmont region of Georgia, and is characterized by rolling hills and pine forests. The Savannah River forms the northern border of the county, and the Little River forms the eastern border. The county is home to several state parks, including Elijah Clark State Park and Mistletoe State Park.
Economy
Columbia County is a largely rural county, with a diverse economy. The county is home to several large employers, including John Deere, Kimberly-Clark, and Procter & Gamble. The county is also home to several military installations, including Fort Gordon and the U.S. Army Signal Corps.
The county's largest industry is manufacturing, which accounts for about 25% of the county's total employment. Other major industries include retail trade, health care, and construction. The county's unemployment rate was 4.2% in 2019, lower than the state average of 4.7%.
Demographics
As of the 2010 census, there were 124,035 people, 45,945 households, and 33,945 families living in the county. The population density was 286.3 people per square mile. The racial makeup of the county was 77.2% White, 16.3% African American, 0.5% Native American, 2.2% Asian, 0.1% Pacific Islander, 1.7% from other races, and 2.1% from two or more races. Hispanic or Latino of any race were 5.2% of the population.
The median income for a household in the county was $60,945, and the median income for a family was $71,845. The per capita income for the county was $27,945. About 8.2% of families and 10.3% of the population were below the poverty line, including 14.2% of those under age 18 and 8.2% of those age 65 or over.
Common Questions
What is the Total Population of Columbia County?
Total Population of Columbia County is 156,921.
What is the Total Male Population of Columbia County?
Total Male Population of Columbia County is 76,942.
What is the Total Female Population of Columbia County?
Total Female Population of Columbia County is 79,979.
What is the Ratio of Males per 100 Females in Columbia County?
There are 96.20 Males per 100 Females in Columbia County.
What is the Ratio of Females per 100 Males in Columbia County?
There are 103.95 Females per 100 Males in Columbia County.
What is the Median Population Age in Columbia County?
Median Population Age in Columbia County is 37.4 Years.
What is the Average Family Size in Columbia County
Average Family Size in Columbia County is 3.7 People.
What is the Average Household Size in Columbia County
Average Household Size in Columbia County is 3.1 People.
What is Per Capita Income in Columbia County?
Per Capita income in Columbia County is $40,677.
What is the Median Family Income in Columbia County?
Median Family Income in Columbia County is $106,774.
What is the Median Household income in Columbia County?
Median Household Income in Columbia County is $92,571.
What is Income or Wage Gap in Columbia County?
Income or Wage Gap in Columbia County is 36.8%.
Women in Columbia County earn 63.2 cents for every dollar earned by a man.
What is Family Income Deficit in Columbia County?
Family Income Deficit in Columbia County is $12,524.
Families that are below poverty line in Columbia County earn $12,524 less on average than the poverty threshold level.
What is Inequality or Gini Index in Columbia County?
Inequality or Gini Index in Columbia County is 0.41.
How Large is the Labor Force in Columbia County?
There are 79,970 People in the Labor Forcein in Columbia County.
What is the Percentage of People in the Labor Force in Columbia County?
65.3% of People are in the Labor Force in Columbia County.
What is the Unemployment Rate in Columbia County?
Unemployment Rate in Columbia County is 5.1%.